UNITED STATES
SECURITIES AND EXCHANGE COMMISSION
Washington, D.C. 20549
FORM 10-K
(Mark One)
|
| |
[ü] | ANNUAL REPORT PURSUANT TO SECTION 13 OR 15(d) OF THE SECURITIES EXCHANGE ACT OF 1934 For the fiscal year ended December 31, 20132014 |
or
|
| |
| [ ] | TRANSITION REPORT PURSUANT TO SECTION 13 OR 15(d) OF THE SECURITIES EXCHANGE ACT OF 1934 |
For the transition period from to
Commission file number:
1-6523
Exact name of registrant as specified in its charter:
Bank of America Corporation
State or other jurisdiction of incorporation or organization:
Delaware
IRS Employer Identification No.:
56-0906609
Address of principal executive offices:
Bank of America Corporate Center
100 N. Tryon Street
Charlotte, North Carolina 28255
Registrant’s telephone number, including area code:
(704) 386-5681
Securities registered pursuant to section 12(b) of the Act:
|
| | | | |
| | Title of each class | | Name of each exchange on which registered | |
| | Common Stock, par value $0.01 per share | | New York Stock Exchange | |
| | | | London Stock Exchange | |
| | | | Tokyo Stock Exchange | |
| | Warrants to purchase Common Stock (expiring October 28, 2018) | | New York Stock Exchange | |
| | Warrants to purchase Common Stock (expiring January 16, 2019) | | New York Stock Exchange | |
| | Depositary Shares, each representing a 1/1,000th interest in a share of 6.204% Non-Cumulative Preferred Stock, Series D | | New York Stock Exchange | |
| | Depositary Shares, each representing a 1/1,000th interest in a share of Floating Rate Non-Cumulative Preferred Stock, Series E | | New York Stock Exchange | |
| | Depositary Shares, each representing a 1/1,000th interest in a share of 6.625% Non-Cumulative Preferred Stock, Series I | | New York Stock Exchange | |
| Depositary Shares, each representing a 1/1,000th interest in a share of 6.625% Non-Cumulative Preferred Stock, Series W | | New York Stock Exchange | |
| Depositary Shares, each representing a 1/1,000th interest in a share of 6.500% Non-Cumulative Preferred Stock, Series Y | | New York Stock Exchange | |
| | 7.25% Non-Cumulative Perpetual Convertible Preferred Stock, Series L | | New York Stock Exchange | |
|
| | | | |
| Title of each class | | Name of each exchange on which registered | |
| | Depositary Shares, each representing a 1/1,200th interest in a share of Bank of America Corporation Floating Rate Non-Cumulative Preferred Stock, Series 1 | | New York Stock Exchange | |
| | Depositary Shares, each representing a 1/1,200th interest in a share of Bank of America Corporation Floating Rate Non-Cumulative Preferred Stock, Series 2 | | New York Stock Exchange | |
|
| | | | |
| Title of each class | | Name of each exchange on which registered | |
| | Depositary Shares, each representing a 1/1,200th interest in a share of Bank of America Corporation 6.375% Non-Cumulative Preferred Stock, Series 3 | | New York Stock Exchange | |
| | Depositary Shares, each representing a 1/1,200th interest in a share of Bank of America Corporation Floating Rate Non-Cumulative Preferred Stock, Series 4 | | New York Stock Exchange | |
| | Depositary Shares, each representing a 1/1,200th interest in a share of Bank of America Corporation Floating Rate Non-Cumulative Preferred Stock, Series 5 | | New York Stock Exchange | |
| | 6.75% Trust Preferred Securities of Countrywide Capital IV (and the guarantees related thereto) | | New York Stock Exchange | |
| | 7.00% Capital Securities of Countrywide Capital V (and the guarantees related thereto) | | New York Stock Exchange | |
| | 6% Capital Securities of BAC Capital Trust VIII (and the guarantee related thereto) | | New York Stock Exchange | |
| | Floating Rate Preferred Hybrid Income Term Securities of BAC Capital Trust XIII (and the guarantee related thereto) | | New York Stock Exchange | |
| | 5.63% Fixed to Floating Rate Preferred Hybrid Income Term Securities of BAC Capital Trust XIV (and the guarantee related thereto) | | New York Stock Exchange | |
| | MBNA Capital B Floating Rate Capital Securities, Series B (and the guarantee related thereto) | | New York Stock Exchange | |
| | Trust Preferred Securities of Merrill Lynch Capital Trust I (and the guarantee of the Registrant with respect thereto) | | New York Stock Exchange | |
| | Trust Preferred Securities of Merrill Lynch Capital Trust II (and the guarantee of the Registrant with respect thereto) | | New York Stock Exchange | |
| | Trust Preferred Securities of Merrill Lynch Capital Trust III (and the guarantee of the Registrant with respect thereto) | | New York Stock Exchange | |
| | Market Index Target-Term Securities®Linked to7% Trust Originated Preferred Securities of Merrill Lynch Preferred Capital Trust III and 7% Partnership Preferred Securities of Merrill Lynch Preferred Funding III, L.P. (and the Dow Jones Industrial AverageSM due December 2, 2014
guarantee of the Registrant with respect thereto) | | NYSE Arca, Inc.New York Stock Exchange | |
| | Market Index Target-Term Securities®Linked to7.12% Trust Originated Preferred Securities of Merrill Lynch Preferred Capital Trust IV and 7.12% Partnership Preferred Securities of Merrill Lynch Preferred Funding IV, L.P. (and the S&P 500® Index, due April 25, 2014guarantee of the Registrant
with respect thereto) | | NYSE Arca, Inc.New York Stock Exchange | |
| | Market Index Target-Term Securities®Linked to7.28% Trust Originated Preferred Securities of Merrill Lynch Preferred Capital Trust V and 7.28% Partnership Preferred Securities of Merrill Lynch Preferred Funding V, L.P. (and the S&P 500® Index, due March 28, 2014guarantee of the Registrant
with respect thereto) | | NYSE Arca, Inc. | |
| Market Index Target-Term Securities®Linked to the S&P 500® Index, due February 28, 2014
| | NYSE Arca, Inc. | |
| Market Index Target-Term Securities®Linked to the Dow Jones Industrial AverageSM, due January 30, 2015
| | NYSE Arca, Inc.New York Stock Exchange | |
| | Market Index Target-Term Securities® Linked to the S&P 500® Index, due February 27, 2015 | | NYSE Arca, Inc. | |
| | Market Index Target-Term Securities® Linked to the Dow Jones Industrial AverageSM, due March 27, 2015 | | NYSE Arca, Inc. | |
| | Market Index Target-Term Securities® Linked to the Dow Jones Industrial AverageSM, due April 24, 2015 | | NYSE Arca, Inc. | |
| | Market Index Target-Term Securities® Linked to the Dow Jones Industrial AverageSM, due May 29, 2015 | | NYSE Arca, Inc. | |
| | Market Index Target-Term Securities® Linked to the Dow Jones Industrial AverageSM, due June 26, 2015 | | NYSE Arca, Inc. | |
| | Market Index Target-Term Securities® Linked to the S&P 500® Index, due July 31, 2015 | | NYSE Arca, Inc. | |
Securities registered pursuant to Section 12(g) of the Act: None
Indicate by check mark if the registrant is a well-known seasoned issuer, as defined in Rule 405 of the Securities Act. Yes No ü No
Indicate by check mark if the registrant is not required to file reports pursuant to Section 13 or Section 15(d) of the Act. Yes No ü
Indicate by check mark whether the registrant: (1) has filed all reports required to be filed by Section 13 or 15(d) of the Securities Exchange Act of 1934 during the preceding 12 months (or for such shorter period that the registrant was required to file such reports), and (2) has been subject to such filing requirements for the past 90 days. Yes ü No
Indicate by check mark whether the registrant has submitted electronically and posted on its corporate Web site, if any, every Interactive Data File required to be submitted and posted pursuant to Rule 405 of Regulation S-T (§ 232.405 of this chapter) during the preceding 12 months (or for such shorter period that the registrant was required to submit and post such files). Yes ü No
Indicate by check mark if disclosure of delinquent filers pursuant to Item 405 of Regulation S-K is not contained herein, and will not be contained, to the best of registrant’s knowledge, in definitive proxy or information statements incorporated by reference in Part III of this Form 10-K or any amendment to this Form 10-K. ü
Indicate by check mark whether the registrant is a large accelerated filer, an accelerated filer, a non-accelerated filer, or a smaller reporting company. See the definitions of “large accelerated filer,” “accelerated filer” and “smaller reporting company” in Rule 12b-2 of the Exchange Act. (Check one):
|
| | | | | | |
Large accelerated filerü | | Accelerated filer | | Non-accelerated filer | | Smaller reporting company |
| | | | | (do not check if a smaller reporting company) | | |
Indicate by check mark whether the registrant is a shell company (as defined in Rule 12b-2 of the Act). Yes No ü
The aggregate market value of the registrant’s common stock (“Common Stock”) held on June 30, 20132014 by non-affiliates was approximately $138,156,239,714161,628,224,532 (based on the June 30, 20132014 closing price of Common Stock of $12.8615.37 per share as reported on the New York Stock Exchange). As of February 24, 20142015, there were 10,568,135,28710,519,566,829 shares of Common Stock outstanding.
Documents incorporated by reference: Portions of the definitive proxy statement relating to the registrant’s annual meeting of stockholders scheduled to be held on May 7, 20146, 2015 are incorporated by reference in this Form 10-K in response to Items 10, 11, 12, 13 and 14 of Part III.
Table of Contents
Bank of America Corporation and Subsidiaries
|
| | |
| | 1Bank of America 201312014 | | |
Part I
Bank of America Corporation and Subsidiaries
Item 1. Business
General
Bank of America Corporation (together, with its consolidated subsidiaries, Bank of America, we or us) is a Delaware corporation, a bank holding company (BHC) and a financial holding company. When used in this report, “the Corporation” may refer to Bank of America Corporation individually, Bank of America Corporation and its subsidiaries, or certain of Bank of America Corporation’s subsidiaries or affiliates. On October 1, 2013, we completed the merger of our Merrill Lynch & Co., Inc. (Merrill Lynch) subsidiary into Bank of America Corporation. This merger had no effect on the Merrill Lynch name or brand and is not expected to have any effect on customers or clients. As part of our efforts to streamline the Corporation’s organizational structure and reduce complexity and costs, the Corporation has reduced and intends to continue to reduce the number of its corporate subsidiaries, including through intercompany mergers.
Bank of America is one of the world’s largest financial institutions, serving individual consumers, small- and middle-market businesses, institutional investors, large corporations and governments with a full range of banking, investing, asset management and other financial and risk management products and services. Our principal executive offices are located in the Bank of America Corporate Center, 100 North Tryon Street, Charlotte, North Carolina 28255.
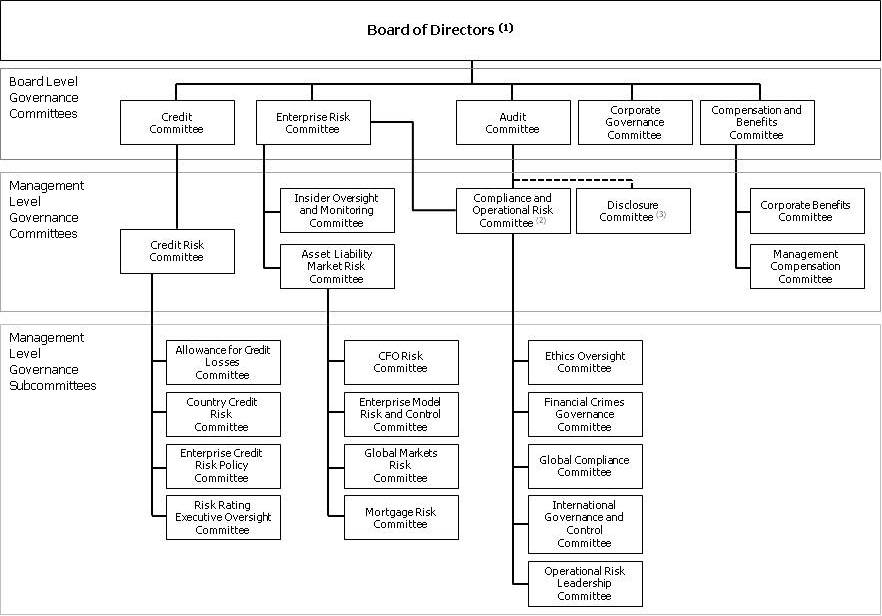
Bank of America’s website is www.bankofamerica.com. Our Annual Reports on Form 10-K, Quarterly Reports on Form 10-Q, Current Reports on Form 8-K and amendments to those reports filed or furnished pursuant to Section 13(a) or 15(d) of the Securities Exchange Act of 1934 (Exchange Act) are available on our website at http://investor.bankofamerica.com under the heading Financial Information SEC Filings as soon as reasonably practicable after we electronically file such reports with, or furnish them to, the U.S. Securities and Exchange Commission (SEC). In addition, we make available on http://investor.bankofamerica.com under the heading Corporate Governance: (i) our Code of Conduct (including our insider trading policy); (ii) our Corporate Governance Guidelines (accessible by clicking on the Governance Highlights link); and (iii) the charter of each active committee of our Board of Directors (the Board) (accessible by clicking on the committee names under the Committee Composition link), and we also intend to disclose any amendments to our Code of Conduct, or waivers of our Code of Conduct on behalf of our Chief Executive Officer, Chief Financial Officer or Chief Accounting Officer, on our website. All of these corporate governance materials are also available free of charge in print to stockholders who request them in writing to: Bank of America Corporation, Attention: Office of the Corporate Secretary, Hearst Tower, 214 North Tryon Street, NC1-027-20-05, Charlotte, North Carolina 28202.28255.
Segments
Through our banking and various nonbankingnonbank subsidiaries throughout the U.S. and in international markets, we provide a diversified range of banking and nonbankingnonbank financial services and products through five business segments: Consumer & Business Banking (CBB), Consumer Real Estate Services (CRES), Global Wealth & Investment Management (GWIM), Global Banking and
Global Markets, with the remaining operations recorded in All Other. Effective January 1, 2015, to align the segments with how we manage the businesses in 2015, the Corporation changed its basis of segment presentation as follows: the Home Loans subsegment within CRES was moved to CBB, and Legacy Assets
& Servicing became a separate segment. Also, a portion of the Business Banking business, based on the size of the client relationship, was moved from CBB to Global Banking. Prior periods will be restated in our quarterly 2015 filings with the SEC under Section 13(a) or 15(d) of the Exchange Act, to conform to the new segment alignment. Additional information related to our business segments and the products and services they provide is included in the information set forth on pages 3534 through 5149 of Item 7. Management’s Discussion and Analysis of Financial Condition and Results of Operations (MD&A), and Note 24 – Business Segment Information to the Consolidated Financial Statements in Item 8. Financial Statements and Supplementary Data (Consolidated Financial Statements).
Competition
We operate in a highly competitive environment. Our competitors include banks, thrifts, credit unions, investment banking firms, investment advisory firms, brokerage firms, investment companies, insurance companies, mortgage banking companies, credit card issuers, mutual fund companies, and e-commerce and other internet-based companies. We compete with some of these competitors globally and with others on a regional or product basis.
Competition is based on a number of factors including, among others, customer service, quality and range of products and services offered, price, reputation, interest rates on loans and deposits, lending limits, and customer convenience. Our ability to continue to compete effectively also depends in large part on our ability to attract new employees and retain and motivate our existing employees, while managing compensation and other costs.
Employees
As of December 31, 20132014, we had approximately 242,000224,000 full-time equivalent employees. None of our domestic employees are subject to a collective bargaining agreement. Management considers our employee relations to be good.
Government Supervision and Regulation
The following discussion describes, among other things, elements of an extensive regulatory framework applicable to BHCs, financial holding companies, banks and broker/dealers,broker-dealers, including specific information about Bank of America. U.S. federal regulation of banks, BHCs and financial holding companies is intended primarily for the protection of depositors and the Deposit Insurance Fund (DIF) rather than for the protection of stockholders and creditors. For more information about recent regulatory programs, initiatives and legislation that impact us, see Regulatory Matters in the MD&A on page 59.
General
We are subject to an extensive regulatory framework applicable to BHCs, financial holding companies and banks.banks and other financial services entities.
As a registered financial holding company and BHC, the Corporation is subject to the supervision of, and regular inspection by, the Board of Governors of the Federal Reserve System (Federal Reserve). Our U.S. banking subsidiaries (the Banks) organized as national banking associations are subject to regulation, supervision and examination by the Office of the Comptroller of the Currency (OCC), the Federal Deposit Insurance Corporation
|
| | |
| | 2Bank of America 201320142
| | |
the Currency (OCC), the Federal Deposit Insurance Corporation (FDIC) and the Federal Reserve. The Consumer Financial Protection Bureau (CFPB) regulates consumer financial products and services.
U.S. financial holding companies, and the companies under their control, are permitted to engage in activities considered “financial in nature” as defined by the Gramm-Leach-Bliley Act and related Federal Reserve interpretations. Unless otherwise limited by the Federal Reserve, a financial holding company may engage directly or indirectly in activities considered financial in nature provided the financial holding company gives the Federal Reserve after-the-fact notice of the new activities. The Gramm-Leach-Bliley Act also permits national banks to engage in activities considered financial in nature through a financial subsidiary, subject to certain conditions and limitations and with the approval of the OCC. If the Federal Reserve finds that any of our Banks is not “well-capitalized” or “well-managed,” we would be required to enter into an agreement with the Federal Reserve to comply with all applicable capital and management requirements, which may contain additional limitations or conditions relating to our activities.
The Riegle-Neal Interstate Banking and Branching Efficiency Act of 1994 permits BHCsa BHC to acquire banks located in states other than theirits home state without regard to state law, subject to certain conditions, including the condition that the BHC, after and as a result of the acquisition, controls no more than 10 percent of the total amount of deposits of insured depository institutions in the U.S. and no more than 30 percent or such lesser or greater amount set by state law of such deposits in that state. The Dodd-Frank Wall Street Reform and Consumer Protection Act (Financial Reform Act) restricts acquisitions by financial companies if, as a result of the acquisition, the total liabilities of the financial company would exceed 10 percent of the total liabilities of all financial companies. At December 31, 20132014, we held approximately 11 percent of the total amount of deposits of insured depository institutions in the U.S. The 2010 Dodd-Frank Wall Street Reform and Consumer Protection Act (Financial Reform Act) restricts acquisitions by a financial institution if, as a result of the acquisition, the total liabilities of the financial institution would exceed 10 percent of the total liabilities of all financial institutions in the U.S. At December 31, 2014, our liabilities did not exceed 10 percent of the total liabilities of all financial institutions in the U.S.
We are also subject to various other laws and regulations, as well as supervision and examination by other regulatory agencies, all of which directly or indirectly affect our operations and management and our ability to make distributions to stockholders. Our U.S. broker/dealerbroker-dealer subsidiaries are subject to regulation by and supervision of the SEC, the New York Stock Exchange and the Financial Industry Regulatory Authority; our commodities businesses in the U.S. are subject to regulation by and supervision of the U.S. Commodity Futures Trading Commission (CFTC); our U.S. derivatives activity is generally subject to regulation and supervision of the CFTC and National Futures Association or the SEC, and in the case of the Banks, certain banking regulators; and our
insurance activities are subject to licensing and regulation by state insurance regulatory agencies.
Our non-U.S. businesses are also subject to extensive regulation by various non-U.S. regulators, including governments, securities exchanges, central banks and other regulatory bodies, in the jurisdictions in which those businesses operate. Prior to April 1, 2013,For example, our financial services operations in the U.K. wereare subject to regulation by and supervision of the Financial Services Authority (FSA). Beginning on April 1, 2013, our financial services operations in the U.K. became subject to regulation by and supervision of the Financial Policy Committee (FPC) and the Prudential Regulatory Authority (PRA) for prudential matters, and the Financial Conduct Authority (FCA) for the conduct of business matters.
Financial Reform Act
The Financial Reform Act enacted sweeping financial regulatory reform across the financial services industry, including significant changes regarding capital adequacy and capital planning, stress testing, resolution planning, derivatives activities, prohibitions on proprietary trading and restrictions on debit interchange fees. As a result of the July 2010 Financial Reform Act, several significant regulatory developments occurred in 2013, and additional regulatory developments may occur in 2014 and beyond. The Financial Reform Act has impactedwe have altered and will continue to impact our earnings through reduced fees, higheralter the way in which we conduct certain businesses. Our costs and new operating restrictions. Forrevenues could continue to be negatively impacted as additional final rules of the Financial Reform Act are adopted.
Resolution Planning
As a BHC with greater than $50 billion of assets, the Corporation is required by the Federal Reserve and the FDIC to annually submit a plan for a rapid and orderly resolution in the event of material financial distress or failure.
A resolution plan is intended to be a detailed roadmap for the orderly resolution of a BHC and material entities pursuant to the U.S. Bankruptcy Code and other applicable resolution regimes under one or more hypothetical scenarios assuming no extraordinary government assistance.
If both the Federal Reserve and the FDIC determine that our plan is not credible and the deficiencies are not cured in a timely manner, the Federal Reserve and the FDIC may jointly impose on us more stringent capital, leverage or liquidity requirements or restrictions on our growth, activities or operations. A description of our plan is available on the Federal Reserve and FDIC websites.
Similarly, in the U.K., the PRA has issued rules requiring the submission of significant developments, see Regulatory Matters –information about certain U.K.-incorporated subsidiaries and other financial institutions, as well as branches of non-U.K. banks located in the U.K. (including information on intra-group dependencies, legal entity separation and barriers to resolution) to allow the PRA to develop resolution plans. As a result of the PRA review, we could be required to take certain actions over the next several years which could impose operating costs and potentially result in the restructuring of certain business and subsidiaries.
The Volcker Rule
The Volcker Rule prohibits insured depository institutions and companies affiliated with insured depository institutions (collectively, banking entities) from engaging in short-term proprietary trading of certain securities, derivatives, commodity futures and options for their own account. The Volcker Rule also imposes limits on banking entities’ investments in, and other relationships with, hedge funds and private equity funds, although the Federal Reserve extended the conformance period for certain existing covered investments and relationships to July 2016 (with indications that the conformance period may be further extended to July 2017). The Volcker Rule provides exemptions for certain activities, including market-making, underwriting, hedging, trading in government obligations, insurance company activities, and organizing and offering hedge funds and private equity funds. The Volcker Rule also clarifies that certain activities are not prohibited, including acting as agent, broker or custodian. A banking entity with significant trading operations, such as the Corporation, is required to establish a detailed compliance program to comply with the restrictions of the Volcker Rule. We exited our stand-alone proprietary trading business in 2011 and continue to wind down our Global Principal Investments operations.
Derivatives
Our derivatives operations are subject to extensive regulation both in the U.S. and internationally. In the U.S., the Financial Reform Act broadens the scope of derivative instruments subject to regulation by requiring clearing and exchange trading of certain derivatives; imposing new capital, margin, reporting, registration and business conduct requirements for certain market participants; and imposing position limits on certain over-the-counter (OTC) derivatives. Additionally, in Europe, the MD&A on page 59.European Commission and European Securities and Markets Authority (ESMA) have been granted authority to adopt and implement the European Market Infrastructure Regulation (EMIR), which regulates OTC derivatives, central counterparties and the trade repositories, and imposes requirements for certain market participants with respect to derivatives reporting, OTC derivatives clearing, business conduct and collateral. The adoption of many of these U.S. and European Union (EU) regulations is ongoing and their ultimate impact remains uncertain.
Capital, Liquidity and Operational Requirements
As a financial services holding company, we and our bankingbank subsidiaries are subject to the risk-based capital guidelines issued by the Federal Reserve and other U.S. banking regulators, including the FDIC and the OCC. These capital rules are complex and are evolving as U.S. and international regulatory authorities propose and enact enhanced capital rules in response to the financial crisis and pursuant to legislation, including the Financial Reform Act.liquidity rules. The Corporation seeks to manage its capital position to maintain sufficient capital to meet these regulatory guidelines and to support our business activities. These evolving capital and liquidity rules are likely to influence our regulatory capital and liquidity planning processes, and require additional capital and liquidity, and may impose additional operational and compliance costs on the Corporation. In addition, the Federal Reserve and the OCC have adopted guidelines that
establish minimum standards for the design, implementation and board oversight of BHC’s and national banks’ risk governance frameworks.
For a discussion ofmore information on regulatory capital rules, capital composition and pending or proposed regulatory capital changes, see Capital Management – Regulatory Capital in the MD&A on page 65,59, and Note 16 – Regulatory Requirements and Restrictionsto the Consolidated Financial Statements,, which are incorporated by reference in this Item 1.
Distributions
We are subject to various regulatory policies and requirements relating to capital actions, including payment of dividends and common stock repurchases, as well as requirementsrepurchases. Many of our subsidiaries, including our bank and broker-dealer subsidiaries, are subject to maintain capital abovelaws that restrict dividend payments, or authorize regulatory minimums. The appropriatebodies to block or reduce the flow of funds from those subsidiaries to the parent company or other subsidiaries. Additionally, the applicable federal regulatory authority is authorized to determine, under certain circumstances relating to the financial condition of a bank or BHC, that the payment of dividends would be an unsafe or unsound practice and to prohibit payment thereof. For instance, we are requiredFederal Reserve regulations require major U.S. BHCs to submit to the Federal Reserve a capital plan as part of an annual Comprehensive Capital Analysis and Review (CCAR). Supervisory reviewThe purpose of the CCAR has a stated purpose of assessingis to assess the capital planning process of major U.S. BHCs,the BHC, including any planned capital actions, (e.g.,such as payment of dividends on common stock and common stock repurchases).repurchases.
In addition, ourOur ability to pay dividends is also affected by the various minimum capital requirements and the capital and non-capital standards established under the Federal Deposit Insurance Corporation Improvement Act of 1991 (FDICIA). The right of the Corporation, our stockholders and our creditors to participate in any distribution of the assets or earnings of our subsidiaries is further subject to the prior claims of creditors of the respective subsidiaries.
For more information regarding the requirements relating to the payment of dividends, including the minimum capital requirements, see Note 13 – Shareholders’ Equity and Note 16 – Regulatory Requirements and Restrictions to the Consolidated Financial Statements.
Insolvency and the Orderly Liquidation Authority
Under the Federal Deposit Insurance Act, the FDIC may be appointed receiver of an insured depository institution if it is insolvent or in certain other circumstances. In addition, under the Financial Reform Act, when a systemically important financial institution such as the Corporation is in default or danger of default, the FDIC may be appointed receiver in order to conduct an orderly liquidation of such institution. In the event of such appointment, the FDIC could invoke the orderly liquidation authority, instead of the U.S. Bankruptcy Code, if the Secretary of the Treasury makes certain financial distress and systemic risk determinations. The orderly liquidation authority is modeled in part on the Federal Deposit Insurance Act, but also adopts certain concepts from the U.S. Bankruptcy Code.
In 2013, the FDIC issued a notice describing its preferred “single point of entry” strategy for resolving systemically important financial institutions. Under this approach, the FDIC could replace a distressed BHC with a bridge holding company, which could continue operations and result in an orderly resolution of the underlying bank, but whose equity is held solely for the benefit of creditors of the original BHC. Furthermore, the Federal Reserve Board has indicated that it will be proposing regulations regarding the minimum levels of long-term debt required for BHCs to ensure there is adequate loss absorbing capacity in the event of a resolution. The orderly liquidation authority contains certain differences from the U.S. Bankruptcy Code. For example, in certain circumstances, the FDIC could permit payment of obligations it determines to be systemically significant (e.g., short-term creditors or operating creditors) in lieu of paying other obligations (e.g., long-term creditors) without the need to obtain creditors’ consent or prior court review. The insolvency and resolution process could also lead to a large reduction or total elimination of the value of a BHC’s outstanding equity, as well as impairment or elimination of certain debt.
Deposit Insurance
Deposits placed at U.S. domiciled banks (U.S. banks) are insured by the FDIC, subject to limits and conditions of applicable law and the FDIC’s regulations. Pursuant to the Financial Reform Act, FDIC insurance coverage limits were permanently increased to $250,000 per customer. All insured depository institutions are required to pay assessments to the FDIC in order to fund the Deposit Insurance Fund (DIF).
The FDIC is required to maintain at least a designated minimum ratio of the DIF to insured deposits in the U.S. The Financial Reform Act requires the FDIC to assess insured depository institutions to achieve a DIF ratio of at least 1.35 percent by September 30, 2020. The FDIC has adopted new regulations that establish a long-term target DIF ratio of greater than two percent. The DIF ratio is currently below the required targets and the FDIC has adopted a restoration plan that may result in increased deposit insurance assessments. Deposit insurance assessment rates are subject to change by the FDIC and will be impacted by the overall economy and the stability of the banking industry as a whole. For more information regarding deposit insurance, see Item 1A. Risk Factors – Regulatory, Compliance and Legal Risk on page 12.
Source of Strength
According to the Financial Reform Act and Federal Reserve policy, BHCs are expected to act as a source of financial strength to each subsidiary bank and to commit resources to support each such subsidiary. Similarly, under the cross-guarantee provisions of FDICIA, in the event of a loss suffered or anticipated by the FDIC, either as a result of default of a banking subsidiary or related to
FDIC assistance provided to such a subsidiary in danger of default, the affiliate banks of such a subsidiary may be assessed for the FDIC’s loss, subject to certain exceptions. For more information about our calculation of regulatory capital and capital composition, and proposed capital rules, see Capital Management – Regulatory Capital in the MD&A on page 65, and Note 16 – Regulatory Requirements and Restrictionsto the Consolidated Financial Statements.
Deposit InsuranceConsumer Regulations
Deposits placed at U.S. domiciled banks (U.S. banks) are insured by the FDIC, subject to limits and conditions of applicable law and the FDIC’s regulations. Pursuant to the Financial Reform Act, FDIC insurance coverage limits were permanently increased to
$250,000 per customer. All insured depository institutions are required to pay assessments to the FDIC in order to fund the DIF.
The FDIC is required to maintain at least a designated minimum ratio of the DIF to insured deposits in the U.S. The Financial Reform Act requires the FDIC to assess insured depository institutions to achieve a DIF ratio of at least 1.35 percent by September 30, 2020. The FDIC has adopted new regulations that establish a long-term target DIF ratio of greater than two percent. The DIF ratio is currently below the required targets and the FDIC has adopted a restoration plan that may result in substantially higher deposit insurance assessments for all depository institutions over the coming years. Deposit insurance assessment ratesOur consumer businesses are subject to changeextensive regulation and oversight by federal and state regulators. Certain federal consumer finance laws to which we are subject, including, but not limited to, the Equal Credit Opportunity Act, the Home Mortgage Disclosure Act, the Electronic Fund Transfer Act, the Fair Credit Reporting Act, the Real Estate Settlement Procedures Act (RESPA), the Truth in Lending Act (TILA) and Truth in Savings Act, are enforced by the FDIC and will be impactedCFPB. Other federal consumer finance laws, such as the Servicemembers Civil Relief Act, are enforced by the overall economy and the stabilityOfficer of the banking industry as a whole. For more information regarding deposit insurance, see Item 1A. Risk Factors – Regulatory and Legal Risk on page 13 and Regulatory Matters – Financial Reform Act inComptroller of the MD&A on page 59.Currency.
Transactions with Affiliates
ThePursuant to Section 23A and 23B of the Federal Reserve Act, as implemented by the Federal Reserve’s Regulation W, the Banks are subject to restrictions under federal law that limit certain types of transactions between the Banks and their non-banknonbank affiliates. In general, U.S. Banksbanks are subject to quantitative and qualitative limits on extensions of credit, purchases of assets and certain other transactions involving Bank of America and its non-banknonbank affiliates. TransactionsAdditionally, transactions between U.S. Banksbanks and their non-banknonbank affiliates are required to be on arm’s length terms. For more information regarding transactionsterms and must be consistent with affiliates, see Regulatory Matters – Derivatives in the MD&A on page 60.standards of safety and soundness.
Privacy and Information Security
We are subject to many U.S. federal, state and international laws and regulations governing requirements for maintaining policies and procedures to protect the non-public confidential information of our customers. The Gramm-Leach-Bliley Act requires the Banks to periodically disclose Bank of America’s privacy policies and practices relating to sharing such information and enables retail customers to opt out of our ability to share information with unaffiliated third parties under certain circumstances. Other laws and regulations, at both the federal and state level, impact our ability to share certain information with affiliates and non-affiliates for marketing and/or non-marketing purposes, or to contact customers with marketing offers. The Gramm-Leach-Bliley Act also requires the Banks to implement a comprehensive information security program that includes administrative, technical, and physical safeguards to ensure the security and confidentiality of customer records and information. These security and privacy policies and procedures for the protection of personal and confidential information are in effect across all businesses and geographic locations.
|
| | |
45 Bank of America 20132014
| | |
Item 1A. Risk Factors
In the course of conducting our business operations, we are exposed to a variety of risks, some of which are inherent in the financial services industry and others of which are more specific to our own businesses. The discussion below addresses the most significant factors, of which we are currently aware, that could affect our businesses, results of operations and financial condition. Additional factors that could affect our businesses, results of operations and financial condition are discussed in Forward-looking Statements in the MD&A on page 23.22. However, other factors not discussed below or elsewhere in this Annual Report on Form 10-K could also adversely affect our businesses, results of operations and financial condition. Therefore, the risk factors below should not be considered a complete list of potential risks that we may face.
Any risk factor described in this Annual Report on Form 10-K or in any of our other SECSecurities and Exchange Commission (SEC) filings could by itself, or together with other factors, materially adversely affect our liquidity, cash flows, competitive position, business, reputation, results of operations, capital position or financial condition, including by materially increasing our expenses or decreasing our revenues, which could result in material losses.
General Economic and Market Conditions Risk
Our businesses and results of operations may be adversely affected by the U.S. and international financial markets, U.S. and non-U.S. fiscal and monetary policy, and economic conditions generally.
Our businesses and results of operations are affected by the financial markets and general economic conditions in the U.S. and abroad, including factors such as the level and volatility of short-term and long-term interest rates, inflation, home prices, unemployment and under-employment levels, bankruptcies, household income, consumer spending, fluctuations in both debt and equity capital markets and currencies, liquidity of the global financial markets, the availability and cost of capital and credit, investor sentiment and confidence in the financial markets, the sustainability of economic growth in the U.S., Europe, China and Japan, and economic, market, political and social conditions in several larger emerging market countries. The deterioration of any of these conditions could adversely affect our consumer and commercial businesses, our securities and securitiesderivatives portfolios, our level of charge-offs and provision for credit losses, the carrying value of our deferred tax assets, our capital levels and liquidity, and our results of operations.
ContinuedDespite improving labor markets in the past year and recent sharp declines in energy costs, an elevated unemployment,level of under-employment and household debt, the prolonged low interest rate environment and rising interest rates,a strengthening U.S. Dollar, along with a continued stresssluggish recovery in the consumer real estate market and certain commercial real estate markets in the U.S., pose challenges for domestic economic performance and the financial services industry. The sustained high unemployment rateelevated level of under-employment and the lengthy duration of unemploymentmodest wage growth have directly impaired consumer finances and pose risks to the financial services industry.
Continued uncertainty in a number of housing markets and still elevated levels of distressed and delinquent mortgages remain risks to the housing market. The current environment of heightened scrutiny of financial institutions has resulted in increased public awareness of and sensitivity to banking fees and practices. Mortgage and housing market-related risks may be accentuated by attempts to forestall foreclosure proceedings, as well as state
and federal investigations into foreclosure practices by mortgage
servicers. Each of these factors may adversely affect our fees and costs.
The recent sharp drop in oil prices, while likely a net positive for the U.S. economy, may also add distress to select regional markets that are energy industry-dependent and may negatively impact certain commercial and consumer loan portfolios.
Our businesses and results of operations are also affected by domestic and international fiscal and monetary policy. The actions of the Federal Reserve in the U.S. and central banks internationally regulate the supply of money and credit in the global financial system. Their policies affect our cost of funds for lending, investing and capital raising activities and the return we earn on those loans and investments, both of which affect our net interest margin. The actions of the Federal Reserve in the U.S. and central banks internationally also can affect the value of financial instruments and other assets, such as debt securities and mortgage servicing rights (MSRs), and its policies also can affect our borrowers, potentially increasing the risk that they may fail to repay their loans. Our businesses and earnings are also affected by the fiscal or other policies that are adopted by the U.S. government, various U.S. regulatory authorities, and non-U.S. governments and regulatory authorities. Changes in domestic and international fiscal and monetary policies are beyond our control and difficult to predict but could have an adverse impact on our capital requirements and the costs of running our business.
For more information about economic conditions and challenges discussed above, see Executive Summary – 20132014 Economic and Business Environment in the MD&A on page 2423.
Liquidity Risk
Liquidity Risk is the Potential Inability to Meet Our Contractual and Contingent Financial Obligations, On- or Off-balance Sheet, as they Become Due.
Adverse changes to our credit ratings from the major credit rating agencies could significantly limit our access to funding or the capital markets, increase our borrowing costs, or trigger additional collateral or funding requirements.
Our borrowing costs and ability to raise funds are directly impacted by our credit ratings. In addition, credit ratings may be important to customers or counterparties when we compete in certain markets and when we seek to engage in certain transactions, including OTC derivatives. Credit ratings and outlooks are opinions expressed by rating agencies on our creditworthiness and that of our obligations or securities, including long-term debt, short-term borrowings, preferred stock and other securities, including asset securitizations. Our credit ratings are subject to ongoing review by the rating agencies, which consider a number of factors, including our own financial strength, performance, prospects and operations as well as factors not under our control.
Currently, the Corporation’s long-term/short-term senior debt ratings and outlooks expressed by the rating agencies are as follows: Baa2/P-2 (Stable) by Moody’s Investors Service, Inc. (Moody’s); A-/A-2 (Negative) by Standard & Poor’s Ratings Services (S&P); and A/F1 (Negative) by Fitch Ratings (Fitch). The rating agencies could make adjustments to our credit ratings at any time, including as a result of a determination to no longer incorporate an uplift for U.S. government support. There can be no assurance that downgrades will not occur.
A reduction in certain of our credit ratings could negatively affect our liquidity, access to credit markets, the related cost of funds, our businesses and certain trading revenues, particularly in those businesses where counterparty creditworthiness is critical. If the short-term credit ratings of our parent company, bank or broker-dealer subsidiaries were downgraded by one or more levels, we may suffer the potential loss of access to short-term funding sources such as repo financing, and/or increased cost of funds.
In addition, under the terms of certain OTC derivative contracts and other trading agreements, in the event of a downgrade of our credit ratings or certain subsidiaries’ credit ratings, counterparties to those agreements may require us or certain subsidiaries to provide additional collateral, terminate these contracts or agreements, or provide other remedies. At December 31, 2014, if the rating agencies had downgraded their long-term senior debt ratings for us or certain subsidiaries by one incremental notch, the amount of additional collateral contractually required by derivative contracts and other trading agreements would have been approximately $1.4 billion, including $1.1 billion for Bank of America, N.A. (BANA). If the rating agencies had downgraded their long-term senior debt ratings for these entities by an additional incremental notch, approximately $2.8 billion in additional incremental collateral, including $1.9 billion for BANA would have been required.
Also, if the rating agencies had downgraded their long-term senior debt ratings for us or certain subsidiaries by one incremental notch, the derivative liability that would be subject to unilateral termination by counterparties as of December 31, 2014 was $1.8 billion against which $1.5 billion of collateral has been posted. If the rating agencies had downgraded their long-term senior debt ratings for us and certain subsidiaries by a second incremental notch, the derivative liability that would be subject to unilateral termination by counterparties as of December 31, 2014 was an incremental $3.9 billion, against which $3.0 billion of collateral has been posted.
While certain potential impacts are contractual and quantifiable, the full consequences of a credit ratings downgrade to a financial institution are inherently uncertain, as they depend upon numerous dynamic, complex and inter-related factors and assumptions, including whether any downgrade of a firm’s long-term credit ratings precipitates downgrades to its short-term credit ratings, and assumptions about the potential behaviors of various customers, investors and counterparties.
For more information about our credit ratings and their potential effects to our liquidity, see Liquidity Risk – Credit Ratings in the MD&A on page 68 and Note 2 – Derivativesto the Consolidated Financial Statements.
If we are unable to access the capital markets, continue to maintain deposits, or our borrowing costs increase, our liquidity and competitive position will be negatively affected.
Liquidity is essential to our businesses. We fund our assets primarily with globally sourced deposits in our bank entities, as well as secured and unsecured liabilities transacted in the capital markets. We rely on certain secured funding sources, such as repo markets, which are typically short-term and credit-sensitive in
nature. We also engage in asset securitization transactions, including with the government-sponsored enterprises (GSEs), to fund consumer lending activities. Our liquidity could be adversely affected by any inability to access the capital markets; illiquidity or volatility in the capital markets; unforeseen outflows of cash, including customer deposits, funding for commitments and contingencies; increased liquidity requirements on our banking and nonbank subsidiaries imposed by their home countries; or negative perceptions about our short- or long-term business prospects, including downgrades of our credit ratings. Several of these factors may arise due to circumstances beyond our control, such as a general market disruption, negative views about the financial services industry generally, changes in the regulatory environment, actions by credit rating agencies or an operational problem that affects third parties or us.
Our cost of obtaining funding is directly related to prevailing market interest rates and to our credit spreads. Credit spreads are the amount in excess of the interest rate of U.S. Treasury securities, or other benchmark securities, of a similar maturity that we need to pay to our funding providers. Increases in interest rates and our credit spreads can increase the cost of our funding. Changes in our credit spreads are market-driven and may be influenced by market perceptions of our creditworthiness. Changes to interest rates and our credit spreads occur continuously and may be unpredictable and highly volatile.
For more information about our liquidity position and other liquidity matters, including credit ratings and outlooks and the policies and procedures we use to manage our liquidity risks, see Liquidity Risk in the MD&A on page 65.
Bank of America Corporation is a holding company and we depend upon our subsidiaries for liquidity, including our ability to pay dividends to shareholders. Applicable laws and regulations, including capital and liquidity requirements, may restrict our ability to transfer funds from our subsidiaries to Bank of America Corporation or other subsidiaries.
Bank of America Corporation, as the parent company, is a separate and distinct legal entity from our banking and nonbank subsidiaries. We evaluate and manage liquidity on a legal entity basis. Legal entity liquidity is an important consideration as there are legal and other limitations on our ability to utilize liquidity from one legal entity to satisfy the liquidity requirements of another, including the parent company. For instance, the parent company depends on dividends, distributions and other payments from our banking and nonbank subsidiaries to fund dividend payments on our common stock and preferred stock and to fund all payments on our other obligations, including debt obligations. Many of our subsidiaries, including our bank and broker-dealer subsidiaries, are subject to laws that restrict dividend payments, or authorize regulatory bodies to block or reduce the flow of funds from those subsidiaries to the parent company or other subsidiaries. In addition, our bank and broker-dealer subsidiaries are subject to restrictions on their ability to lend or transact with affiliates and to minimum regulatory capital and liquidity requirements, as well as restrictions on their ability to use funds deposited with them in bank or brokerage accounts to fund their businesses.
Additional restrictions on related party transactions, increased capital and liquidity requirements and additional limitations on the use of funds on deposit in bank or brokerage accounts, as well as lower earnings, can reduce the amount of funds available to meet the obligations of the parent company and even require the parent company to provide additional funding to such subsidiaries. Also, additional liquidity may be required at each subsidiary entity. Regulatory action of that kind could impede access to funds we need to make payments on our obligations or dividend payments. In addition, our right to participate in a distribution of assets upon a subsidiary’s liquidation or reorganization is subject to the prior claims of the subsidiary’s creditors. For more information regarding our ability to pay dividends, see Capital Management in the MD&A on page 59 and Note 13 – Shareholders’ Equity to the Consolidated Financial Statements.
Credit Risk
Credit Risk is the Risk of Loss Arising from the Inability or Failure of a Borrower or Counterparty to Meet its Obligations.
Economic or market disruptions, insufficient credit loss reserves or concentration of credit risk may result in an increase in the provision for credit losses, which could have an adverse effect on our financial condition and results of operations.
A number of our products expose us to credit risk, including loans, letters of credit, derivatives, trading account assets and assets held-for-sale. The financial condition of our consumer and commercial borrowers and counterparties could adversely affect our earnings.
Global and U.S. economic conditions may impact our credit portfolios. To the extent economic or market disruptions occur, such disruptions would likely increase the risk that borrowers or counterparties would default or become delinquent on their obligations to us. Increases in delinquencies and default rates could adversely affect our consumer credit card, home equity, residential mortgage and purchased credit-impaired (PCI) portfolios through increased charge-offs and provision for credit losses. Additionally, increased credit risk could also adversely affect our commercial loan portfolios with weakened customer and collateral positions.
We estimate and establish an allowance for credit losses for losses inherent in our lending activities (including unfunded lending commitments), excluding those measured at fair value, through a charge to earnings. The amount of allowance is determined based on our evaluation of the potential credit losses included within our loan portfolios. The process for determining the amount of the allowance requires difficult and complex judgments, including forecasts of economic conditions and how borrowers will react to those conditions. The ability of our borrowers or counterparties to repay their obligations will likely be impacted by changes in economic conditions, which in turn could impact the accuracy of our forecasts. There is also the chance that we will fail to accurately identify the appropriate economic indicators or that we will fail to accurately estimate their impacts.
We may suffer unexpected losses if the models and assumptions we use to establish reserves and make judgments in extending credit to our borrowers or counterparties become less predictive of future events. Although we believe that our allowance for credit losses was in compliance with applicable accounting standards at December 31, 2014, there is no guarantee that it
will be sufficient to address future credit losses, particularly if economic conditions deteriorate. In such an event, we may increase the size of our allowance, which reduces our earnings.
In the ordinary course of our business, we also may be subject to a concentration of credit risk in a particular industry, country, counterparty, borrower or issuer. A deterioration in the financial condition or prospects of a particular industry or a failure or downgrade of, or default by, any particular entity or group of entities could negatively affect our businesses and the processes by which we set limits and monitor the level of our credit exposure to individual entities, industries and countries may not function as we have anticipated. While our activities expose us to many different industries and counterparties, we routinely execute a high volume of transactions with counterparties in the financial services industry, including brokers-dealers, commercial banks, investment banks, insurers, mutual and hedge funds, and other institutional clients. This has resulted in significant credit concentration with respect to this industry. Financial services institutions and other counterparties are inter-related because of trading, funding, clearing or other relationships. As a result, defaults by, or even rumors or questions about the financial stability of one or more financial services institutions, or the financial services industry generally, could lead to market-wide liquidity disruptions, losses and defaults. Many of these transactions expose us to credit risk in the event of default of a counterparty. In addition, our credit risk may be heightened by market risk when the collateral held by us cannot be realized or is liquidated at prices not sufficient to recover the full amount of the loan or derivatives exposure due to us.
In the ordinary course of business, we also enter into transactions with sovereign nations, U.S. states and U.S. municipalities. Unfavorable economic or political conditions, disruptions to capital markets, currency fluctuations, changes in energy prices, social instability and changes in government policies could impact the operating budgets or credit ratings of sovereign nations, U.S. states and U.S. municipalities and expose us to credit risk.
We also have a concentration of credit risk with respect to our consumer real estate, consumer credit card and commercial real estate portfolios, which represent a large percentage of our overall credit portfolio. Economic downturns have adversely affected these portfolios. Continued economic weakness or deterioration in real estate values or household incomes could result in higher credit losses.
For more information about our credit risk and credit risk management policies and procedures, see Credit Risk Management in the MD&A on page 70 and Note 1 – Summary of Significant Accounting Principlesto the Consolidated Financial Statements.
Our derivatives businesses may expose us to unexpected risks and potential losses.
We are party to a large number of derivatives transactions, including credit derivatives. Our derivatives businesses may expose us to unexpected market, credit and operational risks that could cause us to suffer unexpected losses. Severe declines in asset values, unanticipated credit events or unforeseen circumstances that may cause previously uncorrelated factors to become correlated (and vice versa) may create losses resulting from risks not appropriately taken into account in the development, structuring or pricing of a derivative instrument. The terms of certain of our OTC derivative contracts and other trading agreements provide that upon the occurrence of certain specified events, such as a change in our credit ratings, we may be required
to provide additional collateral or to provide other remedies, or our counterparties may have the right to terminate or otherwise diminish our rights under these contracts or agreements.
Many derivative instruments are individually negotiated and non-standardized, which can make exiting, transferring or settling some positions difficult. Many derivatives require that we deliver to the counterparty the underlying security, loan or other obligation in order to receive payment. In a number of cases, we do not hold, and may not be able to obtain, the underlying security, loan or other obligation.
In the event of a downgrade of the Corporation’s credit ratings, certain derivative and other counterparties may request we substitute BANA (which has generally had equal or higher credit ratings than the Corporation’s) as counterparty for certain derivative contracts and other trading agreements. The Corporation’s ability to substitute or make changes to these agreements to meet counterparties’ requests may be subject to certain limitations, including counterparty willingness, regulatory limitations on naming BANA as the new counterparty and the type or amount of collateral required. It is possible that such limitations on our ability to substitute or make changes to these agreements, including naming BANA as the new counterparty, could adversely affect our results of operations.
Derivatives contracts, including new and more complex derivatives products, and other transactions entered into with third parties are not always confirmed by the counterparties or settled on a timely basis. While a transaction remains unconfirmed, or during any delay in settlement, we are subject to heightened credit, market and operational risk and, in the event of default, may find it more difficult to enforce the contract. In addition, disputes may arise with counterparties, including government entities, about the terms, enforceability and/or suitability of the underlying contracts. These factors could negatively impact our ability to effectively manage our risk exposures from these products and subject us to increased credit and operating costs and reputational risk. For more information on our derivatives exposure, see Note 2 – Derivativesto the Consolidated Financial Statements.
Market Risk
Market Risk is the Risk that Market Conditions May Adversely Impact the Value of Assets or Liabilities or Otherwise Negatively Impact Earnings. Market Risk is Inherent in the Financial Instruments Associated with our Operations, Including Loans, Deposits, Securities, Short-term Borrowings, Long-term Debt, Trading Account Assets and Liabilities, and Derivatives.
Increased market volatility and adverse changes in other financial or capital market conditions may increase our market risk.
Our liquidity, cash flows, competitive position, business, results of operations and financial condition are affected by market risk factors such as changes in interest and currency exchange rates, equity and futures prices, the implied volatility of interest rates, credit spreads and other economic and business factors. These market risks may adversely affect, among other things, (i) the value of our on- and off-balance sheet securities, trading assets, other financial instruments, and MSRs, (ii) the cost of debt capital and our access to credit markets, (iii) the value of assets under management (AUM), (iv) fee income relating to AUM, (v) customer
allocation of capital among investment alternatives, (vi) the volume of client activity in our trading operations, (vii) investment banking fees, and (viii) the general profitability and risk level of the transactions in which we engage. For example, the value of certain of our assets is sensitive to changes in market interest rates. If the Federal Reserve, or central banks internationally, change or signal a change in monetary policy, market interest rates could be affected, which could adversely impact the value of such assets. In addition, the existence of a prolonged low interest rate environment could negatively impact our cash flows, financial condition or results of operations, including future revenue and earnings growth.
We use various models and strategies to assess and control our market risk exposures but those are subject to inherent limitations. Our models, which rely on historical trends and assumptions, may not be sufficiently predictive of future results due to limited historical patterns, extreme or unanticipated market movements and illiquidity, especially during severe market downturns or stress events. The models that we use to assess and control our market risk exposures also reflect assumptions about the degree of correlation among prices of various asset classes or other market indicators. In addition, market conditions in recent years have involved unprecedented dislocations and highlight the limitations inherent in using historical data to manage risk.
In times of market stress or other unforeseen circumstances, such as the market conditions experienced in 2008 and 2009, previously uncorrelated indicators may become correlated, or previously correlated indicators may move in different directions. These types of market movements have at times limited the effectiveness of our hedging strategies and have caused us to incur significant losses, and they may do so in the future. These changes in correlation can be exacerbated where other market participants are using risk or trading models with assumptions or algorithms that are similar to ours. In these and other cases, it may be difficult to reduce our risk positions due to the activity of other market participants or widespread market dislocations, including circumstances where asset values are declining significantly or no market exists for certain assets. To the extent that we own securities that do not have an established liquid trading market or are otherwise subject to restrictions on sale or hedging, we may not be able to reduce our positions and therefore reduce our risk associated with such positions. In addition, challenging market conditions may also adversely affect our investment banking fees.
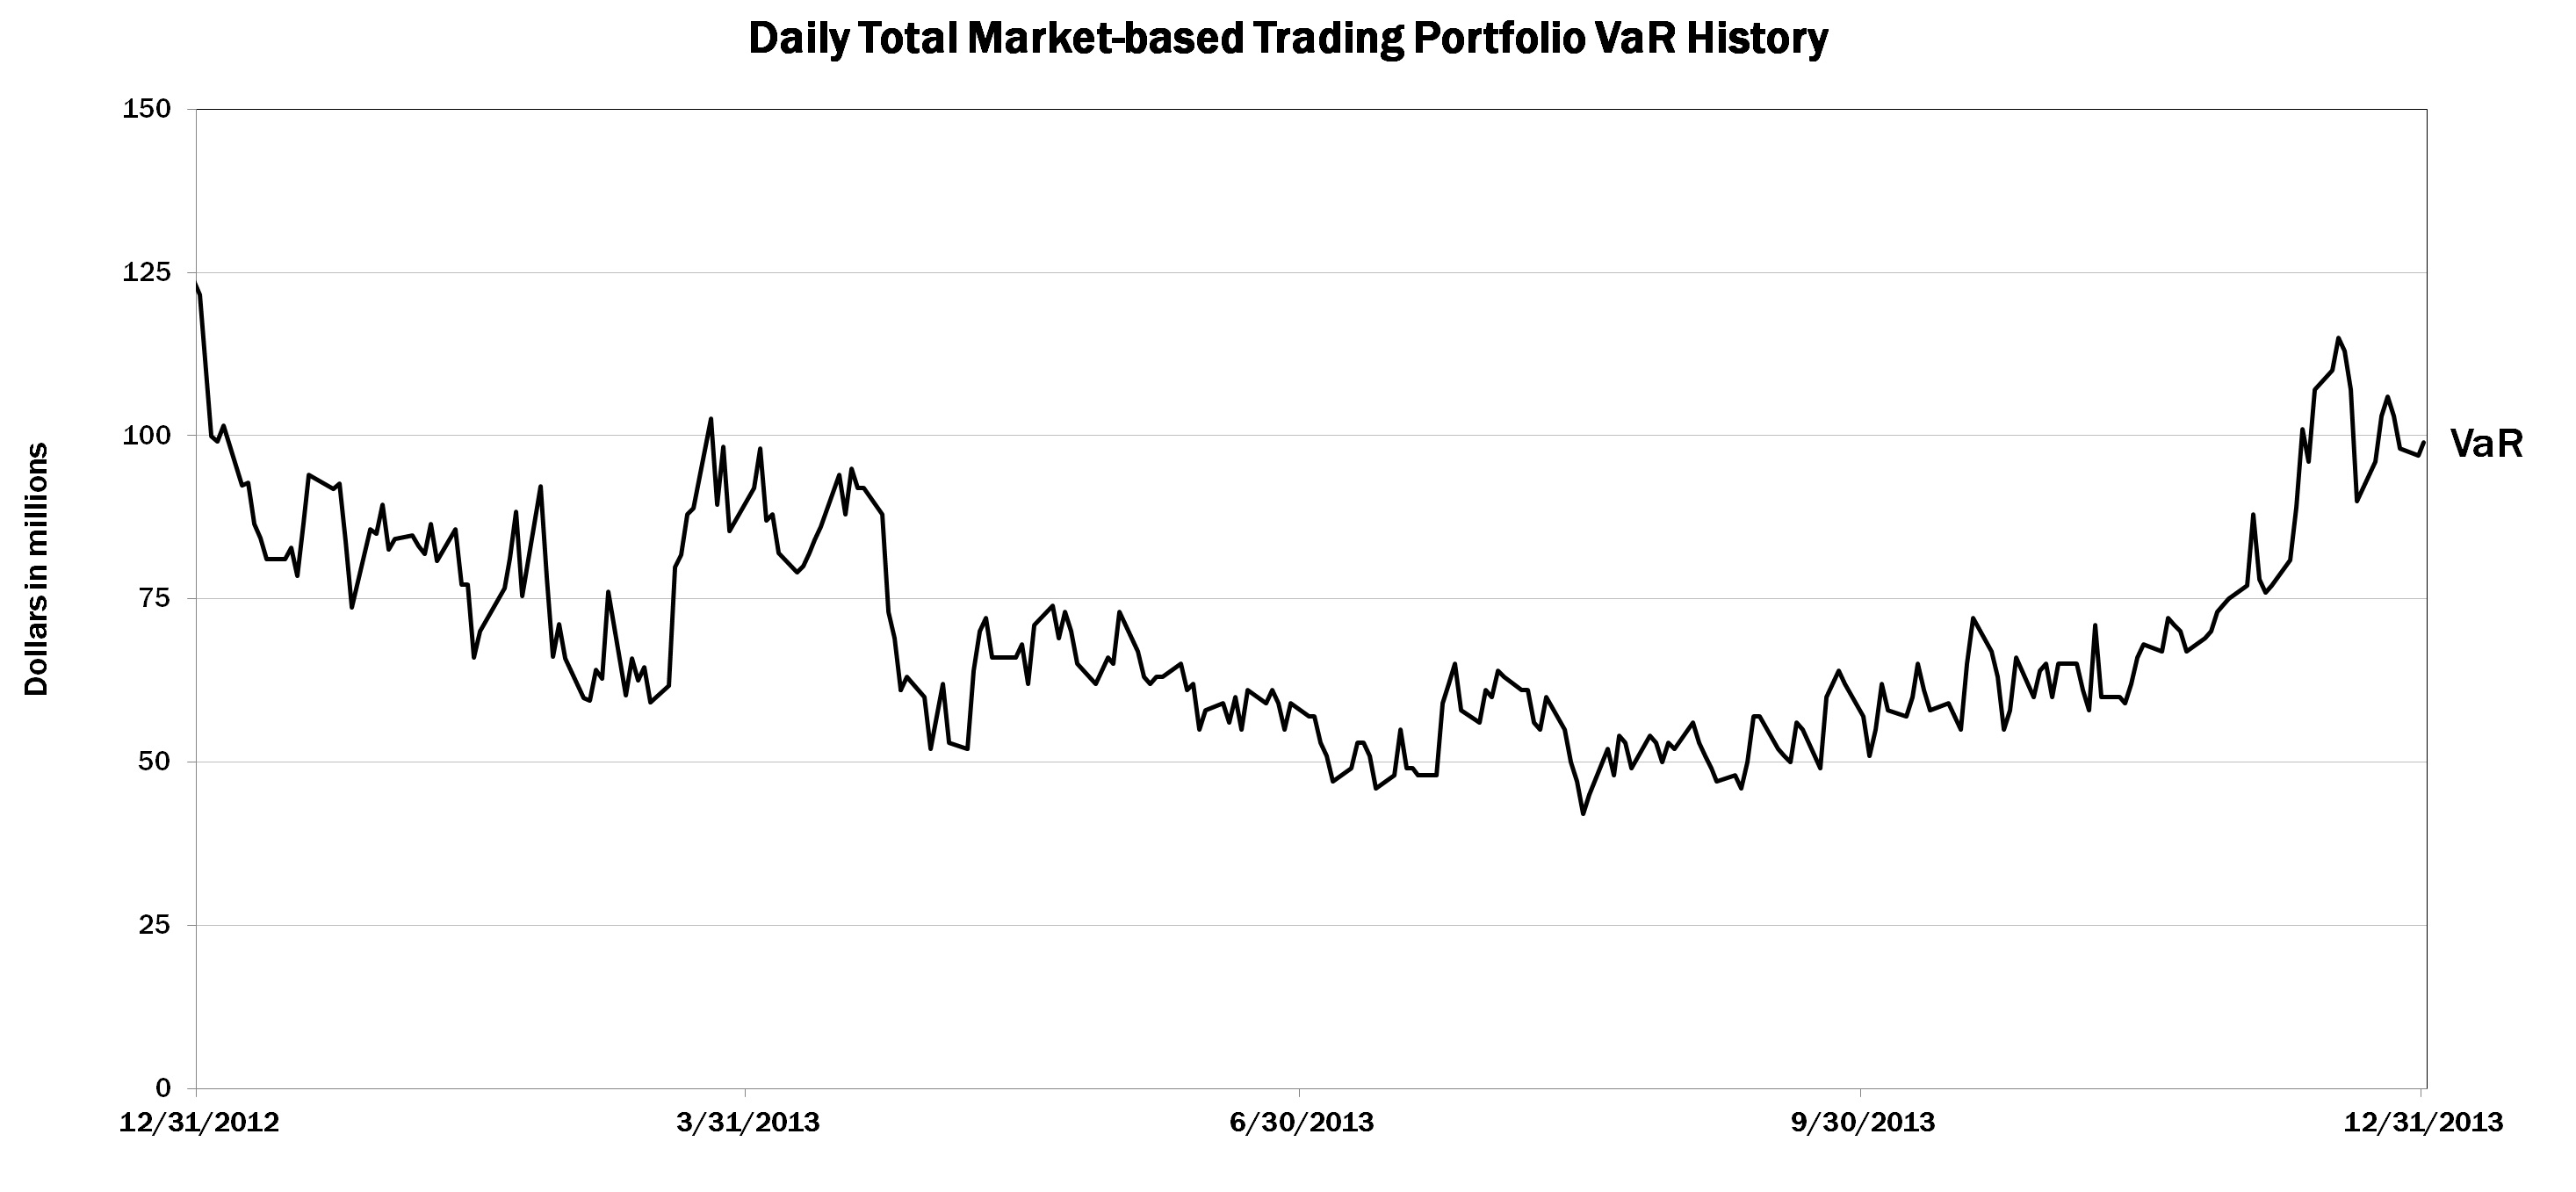
For more information about market risk and our market risk management policies and procedures, see Market Risk Management in the MD&A on page 99.
A downgrade in the U.S. government’s sovereign credit rating, or in the credit ratings of instruments issued, insured or guaranteed by related institutions, agencies or instrumentalities, could result in risks to the Corporation and its credit ratings and general economic conditions that we are not able to predict.
On June 6, 2014, S&P affirmed its AA+ long-term and A-1+ short-term sovereign credit rating on the U.S. government with a stable outlook. On March 21, 2014, Fitch affirmed its AAA long-term and F1+ short-term sovereign credit rating on the U.S. government with a stable outlook. This resolved the rating watch negative that was placed on the ratings on October 15, 2013. On July 18, 2013, Moody’s revised its outlook on the U.S. government to stable from negative and affirmed its Aaa long-term sovereign credit rating on the U.S. government.
The ratings and perceived creditworthiness of instruments issued, insured or guaranteed by institutions, agencies or instrumentalities directly linked to the U.S. government could also be correspondingly affected by any downgrade. Instruments of this nature are often held as trading, investment or excess liquidity positions on the balance sheets of financial institutions, including the Corporation, and are widely used as collateral by financial institutions to raise cash in the secured financing markets. A downgrade of the sovereign credit ratings of the U.S. government and perceived creditworthiness of U.S. government-related obligations could impact our ability to obtain funding that is collateralized by affected instruments, as well as affecting the pricing of that funding when it is available. A downgrade may also adversely affect the market value of such instruments.
We cannot predict if, when or how any changes to the credit ratings or perceived creditworthiness of these organizations will affect economic conditions. The credit rating agencies’ ratings for the Corporation or its subsidiaries could be directly or indirectly impacted by a downgrade of the U.S. government’s sovereign rating because credit ratings of large systemically important financial institutions issued by S&P and Fitch, including those of the Corporation or its subsidiaries, currently include a degree of uplift due to rating agencies’ assumptions concerning potential government support. In addition, the Corporation presently delivers a portion of the residential mortgage loans it originates into GSEs, agencies or instrumentalities (or instruments insured or guaranteed thereby). We cannot predict if, when or how any changes to the credit ratings of these organizations will affect their ability to finance residential mortgage loans.
A downgrade of the sovereign credit ratings of the U.S. government or the credit ratings of related institutions, agencies or instrumentalities would exacerbate the other risks to which the Corporation is subject and any related adverse effects on our business, financial condition and results of operations.
Our businesses may be affected by uncertainty about the financial stability and growth rates of non-U.S. jurisdictions, the risk that those jurisdictions may face difficulties servicing their sovereign debt, and related stresses on financial markets, currencies and trade.
Risks and ongoing concerns about the financial stability of several non-U.S. jurisdictions could impact our operations and have a detrimental impact on the global economic recovery. For instance, sovereign and non-sovereign debt levels remain elevated. Market and economic disruptions have affected, and may continue to affect, consumer confidence levels and spending, corporate investment and job creation, bankruptcy rates, levels of incurrence and default on consumer debt and corporate debt, economic growth rates and asset values, among other factors.
A number of non-U.S. jurisdictions in which we do business have been negatively impacted by slowing growth rates or recessionary conditions, market volatility and/or political unrest. Additionally, there can be no assurance that market stabilization in Europe, which has recently experienced a renewed slowdown and increased volatility, is sustainable, nor can there be any assurance that future assistance packages, if required, will be available or, even if provided, will be sufficient to stabilize the affected countries and markets in Europe or elsewhere. To the extent European economic recovery uncertainty continues to negatively impact consumer and business confidence and credit factors, or should the EU enter a deep recession, both the U.S. economy and our business and results of operations could be adversely affected.
Global economic and political uncertainty, regulatory initiatives and reform have impacted, and will likely continue to impact, non-U.S. credit and trading portfolios. There can be no assurance our risk mitigation efforts in this respect will be sufficient or successful.
For more information on our exposures in the top 20 non-U.S. countries, see Non-U.S. Portfolio in the MD&A on page 93.
We may incur losses if the values of certain assets decline, including due to changes in interest rates and prepayment speeds.
We have a large portfolio of financial instruments, including, among others, certain loans and loan commitments, loans held-for-sale, securities financing agreements, asset-backed secured financings, long-term deposits, long-term debt, trading account assets and liabilities, derivative assets and liabilities, available-for-sale (AFS) debt and equity securities, other debt securities, certain MSRs and certain other assets and liabilities that we measure at fair value. We determine the fair values of these instruments based on the fair value hierarchy under applicable accounting guidance. The fair values of these financial instruments include adjustments for market liquidity, credit quality, funding impact on certain derivatives and other transaction-specific factors, where appropriate.
Gains or losses on these instruments can have a direct impact on our results of operations, including higher or lower mortgage banking income and earnings, unless we have effectively hedged our exposures. For example, decreases in interest rates and increases in mortgage prepayment speeds, which are influenced by interest rates and other factors such as reductions in mortgage insurance premiums and origination costs, could adversely impact the value of our MSR asset, cause a significant acceleration of purchase premium amortization on our mortgage portfolio, because a decline in long-term interest rates shortens the expected lives of the securities, and adversely affect our net interest margin. Conversely, increases in interest rates may result in a decrease in residential mortgage loan originations. In addition, increases in interest rates may adversely impact the fair value of debt securities and, accordingly, for debt securities classified as AFS, may adversely affect accumulated other comprehensive income and, thus, capital levels.
Fair values may be impacted by declining values of the underlying assets or the prices at which observable market transactions occur and the continued availability of these transactions. The financial strength of counterparties, with whom we have economically hedged some of our exposure to these assets, also will affect the fair value of these assets. Sudden declines and volatility in the prices of assets may curtail or eliminate the trading activity for these assets, which may make it difficult to sell, hedge or value such assets. The inability to sell or effectively hedge assets reduces our ability to limit losses in such positions and the difficulty in valuing assets may increase our risk-weighted assets, which requires us to maintain additional capital and increases our funding costs.
Asset values also directly impact revenues in our asset management businesses. We receive asset-based management fees based on the value of our clients’ portfolios or investments in funds managed by us and, in some cases, we also receive performance fees based on increases in the value of such investments. Declines in asset values can reduce the value of our clients’ portfolios or fund assets, which in turn can result in lower fees earned for managing such assets.
For more information about fair value measurements, see Note 20 – Fair Value Measurementsto the Consolidated Financial Statements. For more information about our asset management businesses, see GWIM in the MD&A on page 42. For more information about interest rate risk management, see Interest Rate Risk Management for Non-trading Activities in the MD&A on page 105.
Changes in the method of determining the London Interbank Offered Rate (LIBOR) or other reference rates may adversely impact the value of debt securities and other financial instruments we hold or issue that are linked to LIBOR or other reference rates in ways that are difficult to predict and could adversely impact our financial condition or results of operations.
In recent years, concerns have been raised about the accuracy of the calculation of LIBOR. Aspects of the method for determining how LIBOR is formulated and its use in the market have changed and may continue to change. Effective February 1, 2014, the transfer of LIBOR administration to the ICE Benchmark Administration, Ltd. was completed following authorization by the U.K. Financial Conduct Authority. On July 22, 2014, the Financial Stability Board published its report recommending reforms to the administration of major benchmarks, including LIBOR. Changes to LIBOR administration include, but are not limited to, the introduction of statutory regulation of LIBOR by U.K. regulatory authorities; reducing the currencies for which LIBOR is calculated to five; reducing the tenors for which LIBOR is calculated to seven; delay in the publication of individual banks’ LIBOR submissions for three months from submission; and requiring banks to provide LIBOR submissions based on an effective methodology on the basis of relevant criteria and information, including observable market transactions where possible. Each such change and any future changes could impact the availability and volatility of LIBOR. Similar changes have occurred or may occur with respect to other reference rates. Accordingly, it is not currently possible to determine whether, or to what extent, any such changes would impact the value of any debt securities we hold or issue that are linked to LIBOR or other reference rates, or any loans, derivatives and other financial obligations or extensions of credit we hold or are due to us, or for which we are an obligor, that are linked to LIBOR or other reference rates, or whether, or to what extent, such changes would impact our financial condition or results of operations.
MortgageLiquidity Risk
Liquidity Risk is the Potential Inability to Meet Our Contractual and Housing Market-Related RiskContingent Financial Obligations, On- or Off-balance Sheet, as they Become Due.
Adverse changes to our credit ratings from the major credit rating agencies could significantly limit our access to funding or the capital markets, increase our borrowing costs, or trigger additional collateral or funding requirements.
Our mortgage loan repurchaseborrowing costs and ability to raise funds are directly impacted by our credit ratings. In addition, credit ratings may be important to customers or counterparties when we compete in certain markets and when we seek to engage in certain transactions, including OTC derivatives. Credit ratings and outlooks are opinions expressed by rating agencies on our creditworthiness and that of our obligations or claims from third parties could result in additional losses.
Wesecurities, including long-term debt, short-term borrowings, preferred stock and our legacy companies have sold significant amounts of residential mortgage loans. In connection with these sales, we or certain of our subsidiaries or legacy companies make or have made various representations and warranties, breaches ofother securities, including asset securitizations. Our credit ratings are subject to ongoing review by the rating agencies, which may result inconsider a requirement that we repurchase the mortgage loans, or otherwise make whole or provide other remedies to counterparties. As of December 31, 2013, we had approximately $19.7 billion of unresolved repurchase claims and an additional approximately $1.2 billion of repurchase demands that we do not consider to be valid repurchase claims. These repurchase claims and demands relate primarily to private-label securitizations and monoline-insured securitizations. Private-label securitization unresolved repurchase claims have increased in recent periods, and we expect such claims to continue to increase. In addition to repurchase claims, we receive notices from mortgage insurance companies of claim denials, cancellations or coverage rescission (collectively, MI rescission notices) and the number of such notices has remained elevated.factors, including our own financial strength, performance, prospects and operations as well as factors not under our control.
We have recordedCurrently, the Corporation’s long-term/short-term senior debt ratings and outlooks expressed by the rating agencies are as follows: Baa2/P-2 (Stable) by Moody’s Investors Service, Inc. (Moody’s); A-/A-2 (Negative) by Standard & Poor’s Ratings Services (S&P); and A/F1 (Negative) by Fitch Ratings (Fitch). The rating agencies could make adjustments to our credit ratings at any time, including as a liabilityresult of $13.3 billion for obligations under representations and warranties exposures (which includes exposures related to MI rescission notices). We have also established an estimated range of possible loss of up to $4 billion over our recorded liability. Although we have not recorded any representations and warranties liability for certain potential private-label securitization and whole-loan exposures where we have littlea determination to no claim experience, these exposures are included in the estimated range of possible loss. Reserves and estimated range of possible losslonger incorporate an uplift for certain potential monoline representations and warranties exposures are considered in our litigation reserve and estimated range of possible loss. Our recorded liability and estimated range of possible loss for representations and warranties exposures are based on currently available information and are necessarily dependent on, andU.S. government support. There can be no assurance that downgrades will not occur.
|
| | |
| | | Bank of America 20132014 56 |
limitedA reduction in certain of our credit ratings could negatively affect our liquidity, access to credit markets, the related cost of funds, our businesses and certain trading revenues, particularly in those businesses where counterparty creditworthiness is critical. If the short-term credit ratings of our parent company, bank or broker-dealer subsidiaries were downgraded by a numberone or more levels, we may suffer the potential loss of factors, including our historical claimsaccess to short-term funding sources such as repo financing, and/or increased cost of funds.
In addition, under the terms of certain OTC derivative contracts and settlement experiences as well as significant judgment and a number of assumptions that are subject to change. As a result, our liability and estimated range of possible loss related to our representations and warranties exposures may materially changeother trading agreements, in the future. If future representations and warranties losses occur in excessevent of a downgrade of our recorded liability, such losses could have an adverse effect on our cash flows, financial condition and results of operations.
The liabilitycredit ratings or certain subsidiaries’ credit ratings, counterparties to those agreements may require us or certain subsidiaries to provide additional collateral, terminate these contracts or agreements, or provide other remedies. At December 31, 2014, if the rating agencies had downgraded their long-term senior debt ratings for obligations under representations and warranties exposures and the corresponding estimated range of possible loss do not consider any losses related to litigation matters, including residential mortgage-backed securities (RMBS) litigationus or litigation broughtcertain subsidiaries by monoline insurers nor do they include any separate foreclosure costs and related costs, assessments and compensatory fees or any other possible losses related to potential claims for breaches of performance of servicing obligations (except as such losses are included as potential costs of the BNY Mellon Settlement (defined below)), potential securities law or fraud claims or potential indemnity or other claims against us, including claims related to loans insured by the Federal Housing Administration (FHA). We are not able to reasonably estimateone incremental notch, the amount of additional collateral contractually required by derivative contracts and other trading agreements would have been approximately $1.4 billion, including $1.1 billion for Bank of America, N.A. (BANA). If the rating agencies had downgraded their long-term senior debt ratings for these entities by an additional incremental notch, approximately $2.8 billion in additional incremental collateral, including $1.9 billion for BANA would have been required.
Also, if the rating agencies had downgraded their long-term senior debt ratings for us or certain subsidiaries by one incremental notch, the derivative liability that would be subject to unilateral termination by counterparties as of December 31, 2014 was $1.8 billion against which $1.5 billion of collateral has been posted. If the rating agencies had downgraded their long-term senior debt ratings for us and certain subsidiaries by a second incremental notch, the derivative liability that would be subject to unilateral termination by counterparties as of December 31, 2014 was an incremental $3.9 billion, against which $3.0 billion of collateral has been posted.
While certain potential impacts are contractual and quantifiable, the full consequences of a credit ratings downgrade to a financial institution are inherently uncertain, as they depend upon numerous dynamic, complex and inter-related factors and assumptions, including whether any possible loss with respectdowngrade of a firm’s long-term credit ratings precipitates downgrades to any such servicing, securities law, fraud or other claims against us, except toits short-term credit ratings, and assumptions about the extent reflected in existing accruals or the estimated rangepotential behaviors of possible loss for litigationvarious customers, investors and regulatory matters disclosed in Note 12 – Commitments and Contingencies to the Consolidated Financial Statements; however, such loss could have an adverse effect on our cash flows, financial condition and results of operations.counterparties.
For more information about our representationscredit ratings and warranties exposure, including the range of possible loss,their potential effects to our liquidity, see Off-Balance Sheet Arrangements and Contractual ObligationsLiquidity Risk – Representations and WarrantiesCredit Ratings in the MD&A on page 52, Consumer Portfolio Credit Risk Management in the MD&A on page 7768 and Note 72 – Representations and Warranties Obligations and Corporate Guarantees to the Consolidated Financial Statements.
Our representations and warranties losses could be substantially different from existing accruals and the existing estimated range of possible loss for representations and warranties liability if court approval of the BNY Mellon Settlement is not obtained or if it is otherwise abandoned.
The Bank of New York Mellon settlement (BNY Mellon Settlement) remains subject to final court approval and certain other conditions. It is not currently possible to predict the ultimate outcome of the court approval process, which can include appeals and could take a substantial period of time. The court approval hearing began in the New York Supreme Court, New York County, on June 3, 2013 and concluded on November 21, 2013. On January 31, 2014, the court issued a decision, order and judgment approving the BNY Mellon Settlement. The court overruled the objections to the settlement, holding that the Trustee, BNY Mellon, acted in good faith, within its discretion and within the bounds of reasonableness in determining that the settlement agreement was in the best interests of the covered trusts. The court declined to approve the Trustee’s conduct only with respect to the Trustee’s consideration of a potential claim that a loan must be repurchased if the servicer modifies its terms. On February 4, 2014, one of the objectors filed a motion to stay entry of judgment and to hold additional proceedings in the trial court on issues it alleged had not been litigated or decided by the court in its January 31, 2014 decision, order and judgment. On February 18, 2014, the same objector also filed a motion for reargument of the trial court’s
January 31, 2014 decision. The court held a hearing on the motion to stay on February 19, 2014, and rejected the application for stay and for further proceedings in the trial court. The court also ruled it would not hold oral argument on the objector’s motion for reargument before April 2014. On February 21, 2014, final judgment was entered and the Trustee filed a notice of appeal regarding the court’s ruling on loan modification claims in the settlement. The court’s January 31, 2014 decision, order and judgment remain subject to appeal and the motion to reargue, and it is not possible to predict the timetable for appeals or when the court approval process will be completed.
If final court approval is not obtained with respect to the BNY Mellon Settlement, or if the Corporation and legacy Countrywide determine to withdraw from the BNY Mellon Settlement agreement in accordance with its terms, the Corporation’s future representations and warranties losses could be substantially different from existing accruals, together with our estimated range of possible loss for all representations and warranties exposures of up to $4 billion over existing accruals at December 31, 2013. Developments with respect to one or more of the assumptions underlying the estimated range of possible loss for representations and warranties (including the timing and ultimate outcome of the court approval process relating to the BNY Mellon Settlement) could result in changes in our non-government-sponsored enterprise (GSE) reserve and/or our estimated range of possible loss.
For more information regarding the BNY Mellon Settlement, see Note 7 – Representations and Warranties Obligations and Corporate GuaranteesDerivatives to the Consolidated Financial Statements.
If we are unable to access the capital markets, continue to maintain deposits, or our borrowing costs increase, our liquidity and competitive position will be negatively affected.
Liquidity is essential to our businesses. We fund our assets primarily with globally sourced deposits in our bank entities, as well as secured and unsecured liabilities transacted in the capital markets. We rely on certain secured funding sources, such as repo markets, which are typically short-term and credit-sensitive in
nature. We also engage in asset securitization transactions, including with the government-sponsored enterprises (GSEs), to fund consumer lending activities. Our liquidity could be adversely affected by any inability to access the capital markets; illiquidity or volatility in the capital markets; unforeseen outflows of cash, including customer deposits, funding for commitments and contingencies; increased liquidity requirements on our banking and nonbank subsidiaries imposed by their home countries; or negative perceptions about our short- or long-term business prospects, including downgrades of our credit ratings. Several of these factors may arise due to circumstances beyond our control, such as a general market disruption, negative views about the financial services industry generally, changes in the regulatory environment, actions by credit rating agencies or an operational problem that affects third parties or us.
Our cost of obtaining funding is directly related to prevailing market interest rates and to our credit spreads. Credit spreads are the amount in excess of the interest rate of U.S. housingTreasury securities, or other benchmark securities, of a similar maturity that we need to pay to our funding providers. Increases in interest rates and our credit spreads can increase the cost of our funding. Changes in our credit spreads are market-driven and may be influenced by market weakens,perceptions of our creditworthiness. Changes to interest rates and our credit spreads occur continuously and may be unpredictable and highly volatile.
For more information about our liquidity position and other liquidity matters, including credit ratings and outlooks and the policies and procedures we use to manage our liquidity risks, see Liquidity Risk in the MD&A on page 65.
Bank of America Corporation is a holding company and we depend upon our subsidiaries for liquidity, including our ability to pay dividends to shareholders. Applicable laws and regulations, including capital and liquidity requirements, may restrict our ability to transfer funds from our subsidiaries to Bank of America Corporation or home prices decline,other subsidiaries.
Bank of America Corporation, as the parent company, is a separate and distinct legal entity from our consumer loan portfolios,banking and nonbank subsidiaries. We evaluate and manage liquidity on a legal entity basis. Legal entity liquidity is an important consideration as there are legal and other limitations on our ability to utilize liquidity from one legal entity to satisfy the liquidity requirements of another, including the parent company. For instance, the parent company depends on dividends, distributions and other payments from our banking and nonbank subsidiaries to fund dividend payments on our common stock and preferred stock and to fund all payments on our other obligations, including debt obligations. Many of our subsidiaries, including our bank and broker-dealer subsidiaries, are subject to laws that restrict dividend payments, or authorize regulatory bodies to block or reduce the flow of funds from those subsidiaries to the parent company or other subsidiaries. In addition, our bank and broker-dealer subsidiaries are subject to restrictions on their ability to lend or transact with affiliates and to minimum regulatory capital and liquidity requirements, as well as restrictions on their ability to use funds deposited with them in bank or brokerage accounts to fund their businesses.
Additional restrictions on related party transactions, increased capital and liquidity requirements and additional limitations on the use of funds on deposit in bank or brokerage accounts, as well as lower earnings, can reduce the amount of funds available to meet the obligations of the parent company and even require the parent company to provide additional funding to such subsidiaries. Also, additional liquidity may be required at each subsidiary entity. Regulatory action of that kind could impede access to funds we need to make payments on our obligations or dividend payments. In addition, our right to participate in a distribution of assets upon a subsidiary’s liquidation or reorganization is subject to the prior claims of the subsidiary’s creditors. For more information regarding our ability to pay dividends, see Capital Management in the MD&A on page 59 and Note 13 – Shareholders’ Equity to the Consolidated Financial Statements.
Credit Risk
Credit Risk is the Risk of Loss Arising from the Inability or Failure of a Borrower or Counterparty to Meet its Obligations.
Economic or market disruptions, insufficient credit quality,loss reserves or concentration of credit risk may result in an increase in the provision for credit losses, representations and warranties exposures, and earnings may be adversely affected.
Although U.S. home prices continued to improve during 2013, the declines in prior years have negatively impacted the demand for many of our products and the credit performance of our consumer mortgage portfolios. Additionally, our mortgage loan production volume is generally influenced by the rate of growth in residential mortgage debt outstanding and the size of the residential mortgage market.
Conditions in the U.S. housing market in prior years have also resulted in significant write-downs of asset values in several asset classes, notably mortgage-backed securities (MBS), and increased exposure to monolines. If the U.S. housing market were to weaken, the value of real estate could decline, which could negatively affect our exposure to representations and warranties. While there were continued indications in 2013 that the U.S. economy is stabilizing, the performance of our overall consumer portfolios may not significantly improve in the near future. A protracted continuation or worsening of difficult housing market conditions may exacerbate the adverse effects outlined above and could have an adverse effect on our financial condition and results of operations.
In addition,A number of our products expose us to credit risk, including loans, letters of credit, derivatives, trading account assets and assets held-for-sale. The financial condition of our consumer and commercial borrowers and counterparties could adversely affect our earnings.
Global and U.S. economic conditions may impact our credit portfolios. To the extent economic or market disruptions occur, such disruptions would likely increase the risk that borrowers or counterparties would default or become delinquent on their obligations to us. Increases in delinquencies and default rates could adversely affect our consumer credit card, home equity, portfolio, which makes up approximately 27 percentresidential mortgage and purchased credit-impaired (PCI) portfolios through increased charge-offs and provision for credit losses. Additionally, increased credit risk could also adversely affect our commercial loan portfolios with weakened customer and collateral positions.
We estimate and establish an allowance for credit losses for losses inherent in our lending activities (including unfunded lending commitments), excluding those measured at fair value, through a charge to earnings. The amount of allowance is determined based on our evaluation of the potential credit losses included within our loan portfolios. The process for determining the amount of the allowance requires difficult and complex judgments, including forecasts of economic conditions and how borrowers will react to those conditions. The ability of our total home loans portfolio, contains a significant percentageborrowers or counterparties to repay their obligations will likely be impacted by changes in economic conditions, which in turn could impact the accuracy of loansour forecasts. There is also the chance that we will fail to accurately identify the appropriate economic indicators or that we will fail to accurately estimate their impacts.
We may suffer unexpected losses if the models and assumptions we use to establish reserves and make judgments in second-lienextending credit to our borrowers or more junior-lien positions, and such loans have elevated risk characteristics. Our home equity portfolio had an outstanding balancecounterparties become less predictive of $93.7 billion as of December 31, 2013, including $80.3 billion of home equity lines offuture events. Although we believe that our allowance for credit (HELOC), $12.0 billion of home equity loans and $1.4 billion of reverse mortgages. Of the total home equity portfoliolosses was in compliance with applicable accounting standards at December 31, 2013, $23.0 billion, or 25 percent, were in first-lien positions (26 percent excluding the
2014, there is no guarantee that it
purchased credit-impaired (PCI) home equity portfolio) and $70.7 billion, or 75 percent (74 percent excludingwill be sufficient to address future credit losses, particularly if economic conditions deteriorate. In such an event, we may increase the PCI home equity portfolio) were in second-lien or more junior-lien positions. The HELOCs that have enteredsize of our allowance, which reduces our earnings.
In the amortization period have experiencedordinary course of our business, we also may be subject to a higher percentage of early stage delinquencies and nonperforming status when compared to the home equity lineconcentration of credit portfoliorisk in a particular industry, country, counterparty, borrower or issuer. A deterioration in the financial condition or prospects of a particular industry or a failure or downgrade of, or default by, any particular entity or group of entities could negatively affect our businesses and the processes by which we set limits and monitor the level of our credit exposure to individual entities, industries and countries may not function as a whole. Loans inwe have anticipated. While our home equity line of credit portfolio generally have an initial draw period of 10 yearsactivities expose us to many different industries and more than 85 percent of these loans will not enter their amortization period until 2015 or later. As a result, delinquencies and defaults may increase in future periods.
Continued mortgage foreclosure delays and investigations into our residential mortgage foreclosure practices may increase our costs. In addition, mortgage foreclosure proceedings have been slow in certain states due tocounterparties, we routinely execute a high volume of pending proceedings, which may causetransactions with counterparties in the financial services industry, including brokers-dealers, commercial banks, investment banks, insurers, mutual and hedge funds, and other institutional clients. This has resulted in significant credit concentration with respect to this industry. Financial services institutions and other counterparties are inter-related because of trading, funding, clearing or other relationships. As a result, defaults by, or even rumors or questions about the financial stability of one or more financial services institutions, or the financial services industry generally, could lead to market-wide liquidity disruptions, losses and defaults. Many of these transactions expose us to credit risk in the event of default of a counterparty. In addition, our credit risk may be heightened by market risk when the collateral held by us cannot be realized or is liquidated at prices not sufficient to recover the full amount of the loan or derivatives exposure due to us.
In the ordinary course of business, we also enter into transactions with sovereign nations, U.S. states and U.S. municipalities. Unfavorable economic or political conditions, disruptions to capital markets, currency fluctuations, changes in energy prices, social instability and changes in government policies could impact the operating budgets or credit ratings of sovereign nations, U.S. states and U.S. municipalities and expose us to credit risk.
We also have a concentration of credit risk with respect to our consumer real estate, consumer credit card and commercial real estate portfolios, which represent a large percentage of our overall credit portfolio. Economic downturns have adversely affected these portfolios. Continued economic weakness or deterioration in real estate values or household incomes could result in higher credit losses.
Foreclosure sales in states where foreclosure requires a court order (judicial states) have been much slower than in those states where foreclosure does not require a court order (non-judicial states). There continues to be a backlog of foreclosure inventory in judicial states as the process of obtaining a court order can significantly increase the time required to complete a foreclosure. Excluding fully-insured portfolios, approximately 30 percent of our residential mortgage loan portfolio, including 37 percent of nonperforming residential mortgage loans, and 36 percent of our home equity portfolio, including 44 percent of nonperforming home equity loans, were in judicial states as of December 31, 2013.
The implementation of changes in procedures and controls, including loss mitigation procedures related to our ability to recover on FHA insurance-related claims, and governmental, regulatory and judicial actions, may result in continuing delays in foreclosure proceedings and foreclosure sales and create obstacles to the collection of certain fees and expenses, in both judicial and non-judicial foreclosures, which could cause us to have higher credit losses.
Although we expect total servicing costs will decline if the number of delinquencies continue to decline, we expect that mortgage-related assessments and waiver costs, including compensatory fees and similar costs, and other costs associated with foreclosures will remain elevated as additional loans are delayed in the foreclosure process. These elevated costs, along with elevated default servicing costs and legal expense, may result in elevated noninterest expense in future periods. Contributing to the elevated default servicing costs are required process changes, including those required under the consent orders with federal bank regulators and new requirements from the Consumer Financial Protection Bureau. Delays in foreclosure sales may result in additional costs associated with the maintenance of properties or possible home price declines, result in a greater number of nonperforming loans and increased servicing advances and may adversely impact the collectability of such advances and the value of our MSR asset, MBS and real estate owned properties. With respect to GSE MBS, the valuation of certain MBS could be negatively affected under certain scenarios due to changes in the
timing of cash flows. With respect to non-GSE MBS, under certain scenarios, the timing and amount of cash flows could be negatively affected.
For more information regardingabout our foreclosure sales,credit risk and credit risk management policies and procedures, see Off-Balance Sheet Arrangements and Contractual Obligations – Servicing, Foreclosure and Other Mortgage MattersCredit Risk Management in the MD&A on page 5770 and Note 1 – Summary of Significant Accounting Principlesto the Consolidated Financial Statements.
Continued investigations intoOur derivatives businesses may expose us to unexpected risks and heightened scrutiny regarding our mortgage-related activities could result in additional costs and damage to our reputation.
In 2012, we entered into the National Mortgage Settlement with the U.S. Department of Justice, various federal regulatory agencies and 49 state Attorneys General, the U.S. Department of Housing and Urban Development (HUD), the Federal Reserve and the OCC, which resolved a significant amount of HUD claims and federal and state investigations into certain origination, servicing and foreclosure practices. However, the National Mortgage Settlement did not cover claims arising out of securitization (including representations made to investors with respect to MBS), criminal claims, private claims by borrowers, claims by certain states for injunctive relief or actual economic damages to borrowers related to Mortgage Electronic Registration Systems, Inc. (MERS), and claims by the GSEs (including repurchase demands), among other items.potential losses.
We continueare party to be subjecta large number of derivatives transactions, including credit derivatives. Our derivatives businesses may expose us to additional borrowerunexpected market, credit and non-borrower litigation and governmental and regulatory scrutiny relatedoperational risks that could cause us to suffer unexpected losses. Severe declines in asset values, unanticipated credit events or unforeseen circumstances that may cause previously uncorrelated factors to become correlated (and vice versa) may create losses resulting from risks not appropriately taken into account in the development, structuring or pricing of a derivative instrument. The terms of certain of our past and current origination, servicing, transfer of servicing and servicing rights, and foreclosure activities, including those claims not covered by the National Mortgage Settlement. This scrutiny may extend beyond our pending foreclosure matters to issues arising out of alleged irregularities with respect to previously completed foreclosure activities. We are also subject to inquiries, investigations, actions and claims from regulators, trustees, investorsOTC derivative contracts and other third parties relating to other mortgage-related activitiestrading agreements provide that upon the occurrence of certain specified events, such as the purchase, sale, pooling, and origination and securitization of loans, as well as structuring, marketing, underwriting and issuance of MBS and other securities, including claims relating to the adequacy and accuracy of disclosuresa change in offering documents and representations and warranties made in connection with whole-loan sales or securitizations, including claims for contractual indemnification. The ongoing environment of heightened scrutinyour credit ratings, we may subject us to governmental or regulatory inquiries, investigations, actions, penalties and fines, including by the U.S. Department of Justice, state Attorneys General and other members of the RMBS Working Group of the Financial Fraud Enforcement Task Force, or by other regulators or government agencies that could adversely affect our reputation and result in costs to us in excess of current reserves and management’s estimate of the aggregate range of possible loss for litigation matters.
For more information regarding the National Mortgage Settlement, see Off-Balance Sheet Arrangements and Contractual Obligations – Servicing, Foreclosure and Other Mortgage Matters in the MD&A on page 57.be required
|
| | |
| | | Bank of America 20132014 78 |
Failure to satisfyprovide additional collateral or to provide other remedies, or our obligationscounterparties may have the right to terminate or otherwise diminish our rights under these contracts or agreements.
Many derivative instruments are individually negotiated and non-standardized, which can make exiting, transferring or settling some positions difficult. Many derivatives require that we deliver to the counterparty the underlying security, loan or other obligation in order to receive payment. In a number of cases, we do not hold, and may not be able to obtain, the underlying security, loan or other obligation.
In the event of a downgrade of the Corporation’s credit ratings, certain derivative and other counterparties may request we substitute BANA (which has generally had equal or higher credit ratings than the Corporation’s) as servicercounterparty for certain derivative contracts and other trading agreements. The Corporation’s ability to substitute or make changes to these agreements to meet counterparties’ requests may be subject to certain limitations, including counterparty willingness, regulatory limitations on naming BANA as the new counterparty and the type or amount of collateral required. It is possible that such limitations on our ability to substitute or make changes to these agreements, including naming BANA as the new counterparty, could adversely affect our results of operations.
Derivatives contracts, including new and more complex derivatives products, and other transactions entered into with third parties are not always confirmed by the counterparties or settled on a timely basis. While a transaction remains unconfirmed, or during any delay in settlement, we are subject to heightened credit, market and operational risk and, in the residential mortgage securitization process,event of default, may find it more difficult to enforce the contract. In addition, disputes may arise with counterparties, including residential mortgage foreclosure obligations, alonggovernment entities, about the terms, enforceability and/or suitability of the underlying contracts. These factors could negatively impact our ability to effectively manage our risk exposures from these products and subject us to increased credit and operating costs and reputational risk. For more information on our derivatives exposure, see Note 2 – Derivativesto the Consolidated Financial Statements.
Market Risk
Market Risk is the Risk that Market Conditions May Adversely Impact the Value of Assets or Liabilities or Otherwise Negatively Impact Earnings. Market Risk is Inherent in the Financial Instruments Associated with our Operations, Including Loans, Deposits, Securities, Short-term Borrowings, Long-term Debt, Trading Account Assets and Liabilities, and Derivatives.
Increased market volatility and adverse changes in other losses we could incurfinancial or capital market conditions may increase our market risk.
Our liquidity, cash flows, competitive position, business, results of operations and financial condition are affected by market risk factors such as changes in interest and currency exchange rates, equity and futures prices, the implied volatility of interest rates, credit spreads and other economic and business factors. These market risks may adversely affect, among other things, (i) the value of our on- and off-balance sheet securities, trading assets, other financial instruments, and MSRs, (ii) the cost of debt capital and our access to credit markets, (iii) the value of assets under management (AUM), (iv) fee income relating to AUM, (v) customer
allocation of capital among investment alternatives, (vi) the volume of client activity in our capacity as servicer,trading operations, (vii) investment banking fees, and (viii) the general profitability and risk level of the transactions in which we engage. For example, the value of certain of our assets is sensitive to changes in market interest rates. If the Federal Reserve, or central banks internationally, change or signal a change in monetary policy, market interest rates could cause losses.be affected, which could adversely impact the value of such assets. In addition, the existence of a prolonged low interest rate environment could negatively impact our cash flows, financial condition or results of operations, including future revenue and earnings growth.
We use various models and strategies to assess and control our market risk exposures but those are subject to inherent limitations. Our models, which rely on historical trends and assumptions, may not be sufficiently predictive of future results due to limited historical patterns, extreme or unanticipated market movements and illiquidity, especially during severe market downturns or stress events. The models that we use to assess and control our market risk exposures also reflect assumptions about the degree of correlation among prices of various asset classes or other market indicators. In addition, market conditions in recent years have involved unprecedented dislocations and highlight the limitations inherent in using historical data to manage risk.
In times of market stress or other unforeseen circumstances, such as the market conditions experienced in 2008 and 2009, previously uncorrelated indicators may become correlated, or previously correlated indicators may move in different directions. These types of market movements have at times limited the effectiveness of our hedging strategies and have caused us to incur significant losses, and they may do so in the future. These changes in correlation can be exacerbated where other market participants are using risk or trading models with assumptions or algorithms that are similar to ours. In these and other cases, it may be difficult to reduce our risk positions due to the activity of other market participants or widespread market dislocations, including circumstances where asset values are declining significantly or no market exists for certain assets. To the extent that we own securities that do not have an established liquid trading market or are otherwise subject to restrictions on sale or hedging, we may not be able to reduce our positions and therefore reduce our risk associated with such positions. In addition, challenging market conditions may also adversely affect our investment banking fees.
For more information about market risk and our legacy companies have securitizedmarket risk management policies and procedures, see Market Risk Management in the MD&A on page 99.
A downgrade in the U.S. government’s sovereign credit rating, or in the credit ratings of instruments issued, insured or guaranteed by related institutions, agencies or instrumentalities, could result in risks to the Corporation and its credit ratings and general economic conditions that we are not able to predict.
On June 6, 2014, S&P affirmed its AA+ long-term and A-1+ short-term sovereign credit rating on the U.S. government with a significantstable outlook. On March 21, 2014, Fitch affirmed its AAA long-term and F1+ short-term sovereign credit rating on the U.S. government with a stable outlook. This resolved the rating watch negative that was placed on the ratings on October 15, 2013. On July 18, 2013, Moody’s revised its outlook on the U.S. government to stable from negative and affirmed its Aaa long-term sovereign credit rating on the U.S. government.
The ratings and perceived creditworthiness of instruments issued, insured or guaranteed by institutions, agencies or instrumentalities directly linked to the U.S. government could also be correspondingly affected by any downgrade. Instruments of this nature are often held as trading, investment or excess liquidity positions on the balance sheets of financial institutions, including the Corporation, and are widely used as collateral by financial institutions to raise cash in the secured financing markets. A downgrade of the sovereign credit ratings of the U.S. government and perceived creditworthiness of U.S. government-related obligations could impact our ability to obtain funding that is collateralized by affected instruments, as well as affecting the pricing of that funding when it is available. A downgrade may also adversely affect the market value of such instruments.
We cannot predict if, when or how any changes to the credit ratings or perceived creditworthiness of these organizations will affect economic conditions. The credit rating agencies’ ratings for the Corporation or its subsidiaries could be directly or indirectly impacted by a downgrade of the U.S. government’s sovereign rating because credit ratings of large systemically important financial institutions issued by S&P and Fitch, including those of the Corporation or its subsidiaries, currently include a degree of uplift due to rating agencies’ assumptions concerning potential government support. In addition, the Corporation presently delivers a portion of the residential mortgage loans that we originatedit originates into GSEs, agencies or acquired.instrumentalities (or instruments insured or guaranteed thereby). We service a large portioncannot predict if, when or how any changes to the credit ratings of these organizations will affect their ability to finance residential mortgage loans.
A downgrade of the loans we have securitizedsovereign credit ratings of the U.S. government or the credit ratings of related institutions, agencies or instrumentalities would exacerbate the other risks to which the Corporation is subject and also service loans on behalf of third-party securitization vehicles and other investors. At December 31, 2013, we serviced approximately 6.1 million loans with an aggregate unpaid principal balance of $810 billion, including loans owned by us and by others. Of the 3.6 million loans serviced for others, approximately 65 percent and 35 percent are held in GSE and non-GSE securitization vehicles, respectively. In addition to identifying specific servicing criteria, pooling and servicing arrangements in a securitization or whole-loan sale typically impose standards of care on the servicer that may include the obligation to adhere to the accepted servicing practices of prudent mortgage lenders and/or to exercise the degree of care and skill that the servicer employs when servicing loans for its own account. Servicing agreements with the government-sponsored entities, Fannie Mae (FNMA) and Freddie Mac (FHLMC) (collectively, the GSEs), generally provide the GSEs with broader rights relative to the servicer than are found in servicing agreements with private investors.
With regard to alleged irregularities in foreclosure process-related activities referred to above, we may incur costs or losses if we elect or are required to re-execute or re-file documents or take other action in connection with pending or completed foreclosures. We may also incur costs or losses if the validity of a foreclosure action is challenged by a borrower, or overturned by a court because of errors or deficiencies in the foreclosure process. These costs and liabilities may not be reimbursable to us. We may also incur costs or losses relating to delays or alleged deficiencies in processing documents necessary to comply with state law governing foreclosures. We may be subject to deductions by insurers for MI or guarantee benefits relating to delays or alleged deficiencies.
If we commit a material breach of our obligations as servicer or master servicer, we may be subject to termination if the breach is not cured within a specified period of time following notice, which can generally be given by the securitization trustee or a specified percentage of security holders, causing us to lose servicing income. In addition, we may have liability for any failure by us, as a servicer or master servicer, for any act or omissionrelated adverse effects on our part that involves willful misfeasance, bad faith, gross negligence or reckless disregard of our duties. If any of these actions were to occur, it may harm our reputation, increase our servicing costs or adversely impact ourbusiness, financial condition and results of operations.
Mortgage notes, assignments orOur businesses may be affected by uncertainty about the financial stability and growth rates of non-U.S. jurisdictions, the risk that those jurisdictions may face difficulties servicing their sovereign debt, and related stresses on financial markets, currencies and trade.
Risks and ongoing concerns about the financial stability of several non-U.S. jurisdictions could impact our operations and have a detrimental impact on the global economic recovery. For instance, sovereign and non-sovereign debt levels remain elevated. Market and economic disruptions have affected, and may continue to affect, consumer confidence levels and spending, corporate investment and job creation, bankruptcy rates, levels of incurrence and default on consumer debt and corporate debt, economic growth rates and asset values, among other documents are often required to be maintained and are often necessary to enforce mortgage loans. We currently use the MERS system for approximately halffactors.
A number of the residential mortgage loans thatnon-U.S. jurisdictions in which we have originated and remain in our servicing portfolio, including loans thatdo business have been soldnegatively impacted by slowing growth rates or recessionary conditions, market volatility and/or political unrest. Additionally, there can be no assurance that market stabilization in Europe, which has recently experienced a renewed slowdown and increased volatility, is sustainable, nor can there be any assurance that future assistance packages, if required, will be available or, even if provided, will be sufficient to investorsstabilize the affected countries and markets in Europe or securitization trusts. Additionally, certain localelsewhere. To the extent European economic recovery uncertainty continues to negatively impact consumer and state governments have commenced legal actions against us, MERSbusiness confidence and other MERS members, questioningcredit factors, or should the validityEU enter a deep recession, both the U.S. economy and our business and results of the MERS model. Other challenges have also been made to the process for transferring mortgage loans to securitization trusts, asserting that having a mortgagee of record that is different than the holder of the mortgage noteoperations could “break the chain of title” and cloud the ownership of the loan. If certainbe adversely affected.
required documents are missing or defective, or if the use of MERS is found notGlobal economic and political uncertainty, regulatory initiatives and reform have impacted, and will likely continue to impact, non-U.S. credit and trading portfolios. There can be valid, we could be obligated to cure certain defects or in some circumstances be subject to additional costs and expenses. Our use of MERS as nominee for the mortgage may also create reputational risks for us.
In addition to the adverse impact these factors could directly have on us, we may also face negative reputational costs from these servicing risks, which could reduceno assurance our future business opportunitiesrisk mitigation efforts in this arearespect will be sufficient or cause that business to be on less favorable terms to us.successful.
For additionalmore information on our exposures in the top 20 non-U.S. countries, see Off-Balance Sheet Arrangements and Contractual ObligationsNon-U.S. Portfolio in the MD&A on page 5293.
We may incur losses if the values of certain assets decline, including due to changes in interest rates and prepayment speeds.
We have a large portfolio of financial instruments, including, among others, certain loans and loan commitments, loans held-for-sale, securities financing agreements, asset-backed secured financings, long-term deposits, long-term debt, trading account assets and liabilities, derivative assets and liabilities, available-for-sale (AFS) debt and equity securities, other debt securities, certain MSRs and certain other assets and liabilities that we measure at fair value. We determine the fair values of these instruments based on the fair value hierarchy under applicable accounting guidance. The fair values of these financial instruments include adjustments for market liquidity, credit quality, funding impact on certain derivatives and other transaction-specific factors, where appropriate.
Gains or losses on these instruments can have a direct impact on our results of operations, including higher or lower mortgage banking income and earnings, unless we have effectively hedged our exposures. For example, decreases in interest rates and increases in mortgage prepayment speeds, which are influenced by interest rates and other factors such as reductions in mortgage insurance premiums and origination costs, could adversely impact the value of our MSR asset, cause a significant acceleration of purchase premium amortization on our mortgage portfolio, because a decline in long-term interest rates shortens the expected lives of the securities, and adversely affect our net interest margin. Conversely, increases in interest rates may result in a decrease in residential mortgage loan originations. In addition, increases in interest rates may adversely impact the fair value of debt securities and, accordingly, for debt securities classified as AFS, may adversely affect accumulated other comprehensive income and, thus, capital levels.
Fair values may be impacted by declining values of the underlying assets or the prices at which observable market transactions occur and the continued availability of these transactions. The financial strength of counterparties, with whom we have economically hedged some of our exposure to these assets, also will affect the fair value of these assets. Sudden declines and volatility in the prices of assets may curtail or eliminate the trading activity for these assets, which may make it difficult to sell, hedge or value such assets. The inability to sell or effectively hedge assets reduces our ability to limit losses in such positions and the difficulty in valuing assets may increase our risk-weighted assets, which requires us to maintain additional capital and increases our funding costs.
Asset values also directly impact revenues in our asset management businesses. We receive asset-based management fees based on the value of our clients’ portfolios or investments in funds managed by us and, in some cases, we also receive performance fees based on increases in the value of such investments. Declines in asset values can reduce the value of our clients’ portfolios or fund assets, which in turn can result in lower fees earned for managing such assets.
For more information about fair value measurements, see Note 20 – Fair Value Measurementsto the Consolidated Financial Statements. For more information about our asset management businesses, see GWIM in the MD&A on page 42. For more information about interest rate risk management, see Interest Rate Risk Management for Non-trading Activities in the MD&A on page 105.
Changes in the method of determining the London Interbank Offered Rate (LIBOR) or other reference rates may adversely impact the value of debt securities and other financial instruments we hold or issue that are linked to LIBOR or other reference rates in ways that are difficult to predict and could adversely impact our financial condition or results of operations.
In recent years, concerns have been raised about the accuracy of the calculation of LIBOR. Aspects of the method for determining how LIBOR is formulated and its use in the market have changed and may continue to change. Effective February 1, 2014, the transfer of LIBOR administration to the ICE Benchmark Administration, Ltd. was completed following authorization by the U.K. Financial Conduct Authority. On July 22, 2014, the Financial Stability Board published its report recommending reforms to the administration of major benchmarks, including LIBOR. Changes to LIBOR administration include, but are not limited to, the introduction of statutory regulation of LIBOR by U.K. regulatory authorities; reducing the currencies for which LIBOR is calculated to five; reducing the tenors for which LIBOR is calculated to seven; delay in the publication of individual banks’ LIBOR submissions for three months from submission; and requiring banks to provide LIBOR submissions based on an effective methodology on the basis of relevant criteria and information, including observable market transactions where possible. Each such change and any future changes could impact the availability and volatility of LIBOR. Similar changes have occurred or may occur with respect to other reference rates. Accordingly, it is not currently possible to determine whether, or to what extent, any such changes would impact the value of any debt securities we hold or issue that are linked to LIBOR or other reference rates, or any loans, derivatives and other financial obligations or extensions of credit we hold or are due to us, or for which we are an obligor, that are linked to LIBOR or other reference rates, or whether, or to what extent, such changes would impact our financial condition or results of operations.
Liquidity Risk
Liquidity Risk is the Potential Inability to Meet Our Contractual and Contingent Financial Obligations, On- or Off-balance Sheet, as they Become Due.
Adverse changes to our credit ratings from the major credit rating agencies could significantly limit our access to funding or the capital markets, increase our borrowing costs, or trigger additional collateral or funding requirements.
Our borrowing costs and ability to raise funds are directly impacted by our credit ratings. In addition, credit ratings may be important to customers or counterparties when we compete in certain markets and when we seek to engage in certain transactions, including over-the-counter (OTC)OTC derivatives. Credit ratings and outlooks are opinions expressed by rating agencies on our creditworthiness and that of our obligations or securities, including long-term debt, short-term borrowings, preferred stock and other securities, including asset securitizations. Our credit ratings are subject to ongoing review by the rating agencies, which consider a number of factors, including our own financial strength, performance, prospects and operations as well as factors not under our control.
Currently, the Corporation’s long-term/short-term senior debt ratings and outlooks expressed by the rating agencies are as follows: Baa2/P-2 (Stable) by Moody’s Investors Service, Inc. (Moody’s); A-/A-2 (Negative) by Standard & Poor’s Ratings Services (S&P); and A/F1 (Stable)(Negative) by Fitch Ratings (Fitch). The rating agencies could make adjustments to our credit ratings at any time.time, including as a result of a determination to no longer incorporate an uplift for U.S. government support. There can be no assurance that downgrades will not occur.
A reduction in certain of our credit ratings could negatively affect our liquidity, access to credit markets, the related cost of funds, our businesses and certain trading revenues, particularly in those businesses where counterparty creditworthiness is critical. If the short-term credit ratings of our parent company, bank or broker/dealerbroker-dealer subsidiaries were downgraded by one or more levels, we may suffer the potential loss of access to short-term funding sources such as repo financing, and/or increased cost of funds.
In addition, under the terms of certain OTC derivative contracts and other trading agreements, in the event of a downgrade of our credit ratings or certain subsidiaries’ credit ratings, counterparties to those agreements may require us or certain subsidiaries to provide additional collateral, terminate these contracts or agreements, or provide other remedies. At December 31, 2013,2014, if the rating agencies had downgraded their long-term senior debt ratings for us or certain subsidiaries by one incremental notch, the amount of additional collateral contractually required by
derivative contracts and other trading agreements would have been approximately $1.3$1.4 billion, including $881 million$1.1 billion for Bank of America, N.A. (BANA). If the rating agencies had downgraded their long-term senior debt ratings for these entities by an additional incremental notch, approximately $4.1$2.8 billion in additional incremental collateral, including $3.0$1.9 billion for BANA would have been required.
Also, if the rating agencies had downgraded their long-term senior debt ratings for us or certain subsidiaries by one incremental notch, the derivative liability that would be subject to unilateral termination by counterparties as of December 31, 20132014 was $927 million$1.8 billion against which $733 million$1.5 billion of collateral has been posted. If the rating agencies had downgraded their long-term senior debt ratings for us and certain subsidiaries by a second incremental notch, the derivative liability that would be subject to unilateral termination by counterparties as of December 31, 20132014 was an incremental $1.9$3.9 billion, against which $1.5$3.0 billion of collateral has been posted.
While certain potential impacts are contractual and quantifiable, the full consequences of a credit ratings downgrade to a financial institution are inherently uncertain, as they depend upon numerous dynamic, complex and inter-related factors and assumptions, including whether any downgrade of a firm’s long-term credit ratings precipitates downgrades to its short-term credit ratings, and assumptions about the potential behaviors of various customers, investors and counterparties.
For more information about our credit ratings and their potential effects to our liquidity, see Liquidity Risk – Credit Ratings in the MD&A on page 7568 and Note 2 – Derivatives to the Consolidated Financial Statements.
If we are unable to access the capital markets, continue to maintain deposits, or our borrowing costs increase, our liquidity and competitive position will be negatively affected.
Liquidity is essential to our businesses. We fund our assets primarily with globally sourced deposits in our bank entities, as well as secured and unsecured liabilities transacted in the capital markets. We rely on certain secured funding sources, such as repo markets, which are typically short-term and credit-sensitive in
nature. We also engage in asset securitization transactions, including with the GSEs,government-sponsored enterprises (GSEs), to fund consumer lending activities. Our liquidity could be adversely affected by any inability to access the capital markets; illiquidity or volatility in the capital markets; unforeseen outflows of cash, including customer deposits, funding for commitments and contingencies, including Variable Rate Demand Notes;contingencies; increased liquidity requirements on our banking and nonbankingnonbank subsidiaries imposed by their home countries; or negative perceptions about our short- or long-term business prospects, including downgrades of our credit ratings. Several of these factors may arise due to circumstances beyond our control, such as a general market disruption, negative views about the financial services industry generally, changes in the regulatory environment, actions by credit rating agencies or an operational problem that affects third parties or us.
Our cost of obtaining funding is directly related to prevailing market interest rates and to our credit spreads. Credit spreads are the amount in excess of the interest rate of U.S. Treasury securities, or other benchmark securities, of a similar maturity that we need to pay to our funding providers. Increases in interest rates and our credit spreads can increase the cost of our funding. Changes in our credit spreads are market-driven and may be influenced by market perceptions of our creditworthiness. Changes to interest rates and our credit spreads occur continuously and may be unpredictable and highly volatile.
For more information about our liquidity position and other liquidity matters, including credit ratings and outlooks and the policies and procedures we use to manage our liquidity risks, see Capital Management and Liquidity Risk in the MD&A on pagespage 65 and 71.
Bank of America Corporation is a holding company and we depend upon our subsidiaries for liquidity, including our ability to pay dividends to stockholders.shareholders. Applicable laws and regulations, including capital and liquidity requirements, may restrict our ability to transfer funds from our subsidiaries to Bank of America Corporation or other subsidiaries.
Bank of America Corporation, as the parent company, is a separate and distinct legal entity from our banking and nonbankingnonbank subsidiaries. We evaluate and manage liquidity on a legal entity basis. Legal entity liquidity is an important consideration as there are legal and other limitations on our ability to utilize liquidity from one legal entity to satisfy the liquidity requirements of another, including the parent company. For instance, the parent company depends on dividends, distributions and other payments from our banking and nonbankingnonbank subsidiaries to fund dividend payments on our common stock and preferred stock and to fund all payments on our other obligations, including debt obligations. Many of our subsidiaries, including our bank and broker/dealerbroker-dealer subsidiaries, are subject to laws that restrict dividend payments, or authorize regulatory bodies to block or reduce the flow of funds from those subsidiaries to the parent company or other subsidiaries. In addition, our bank and broker/dealerbroker-dealer subsidiaries are subject to restrictions on their ability to lend or transact with affiliates and to minimum regulatory capital and liquidity requirements, as well as restrictions on their ability to use funds deposited with them in bank or brokerage accounts to fund their businesses.
Additional restrictions on related party transactions, increased capital and liquidity requirements and additional limitations on the use of funds on deposit in bank or brokerage accounts, as well as lower earnings, can reduce the amount of funds available to meet the obligations of the parent company and even require the parent company to provide additional funding to such subsidiaries. Also, additional liquidity may be required at each subsidiary entity. Regulatory action of that kind could impede access to funds we need to make payments on our obligations or dividend payments. In addition, our right to participate in a distribution of assets upon a subsidiary’s liquidation or reorganization is subject to the prior claims of the subsidiary’s creditors. For more information regarding our ability to pay dividends, see Capital Management in the MD&A on page 59 and Note 13 – Shareholders’ Equity and Note 16 – Regulatory Requirements and Restrictionsto the Consolidated Financial Statements.Statements.
Credit Risk
Credit Risk is the Risk of Loss Arising from the Inability or Failure of a Borrower Obligor or Counterparty Default when a Borrower, Obligor or Counterparty does notto Meet its Obligations.
Economic or market disruptions, insufficient credit loss reserves or concentration of credit risk may necessitateresult in an increase in the provision for credit losses, which could have an adverse effect on our financial condition and results of operations.
When we loan money, commit to loan money or enter into a letter of credit or other contract with a counterparty, we incur credit risk, or the risk of losses if our borrowers do not repay their loans or our counterparties fail to perform according to the terms of their agreements. A number of our products expose us to credit risk, including loans, leases and lending commitments,letters of credit, derivatives, trading account assets and assets held-for-sale. As one of the nation’s largest lenders, the credit qualityThe financial condition of our consumer and commercial portfolios has a significant impact onborrowers and counterparties could adversely affect our earnings.
Global and U.S. economic conditions may impact our credit portfolios. To the extent economic or market disruptions occur, such disruptions would likely increase our credit exposure to customers, obligors or other counterparties due to the increased risk that they mayborrowers or counterparties would default or become delinquent on their obligations to us. These potential increasesIncreases in delinquencies and default rates could adversely affect our consumer credit card, home equity, consumer real estateresidential mortgage and PCIpurchased credit-impaired (PCI) portfolios through increased charge-offs and provision for credit losses. Additionally, increased credit risk could also adversely affect our commercial loan portfolios.portfolios with weakened customer and collateral positions.
We estimate and establish an allowance for credit losses for losses inherent in our lending activities (including unfunded lending commitments), excluding those measured at fair value, through a charge to earnings. The amount of allowance is determined based on our evaluation of the potential credit losses included within our loan portfolio.portfolios. The process for determining the amount of the allowance which is critical to our financial condition and results of operations, requires difficult subjective and complex judgments, including forecasts of economic conditions and how borrowers will react to those conditions. Our ability to assess future economic conditions or the creditworthiness of our customers, obligors or other counterparties is imperfect. The ability of our borrowers or counterparties to repay their loansobligations will likely be impacted by changes in economic conditions, which in turn could impact the accuracy of our forecasts.
As with any such assessments, there There is also the chance that we will fail to accurately identify the proper factorsappropriate economic indicators or that we will fail to accurately estimate the impacts of factors that we identify.their impacts.
We may suffer unexpected losses if the models and assumptions we use to establish reserves and make judgments in extending credit to our borrowers and otheror counterparties become less predictive of future events. Although we believe that our allowance for credit losses was in compliance with applicable accounting standards at December 31, 2013,2014, there is no guarantee that it
will be sufficient to address future credit losses, particularly if economic conditions deteriorate. In such an event, we might need tomay increase the size of our allowance, which reduces our earnings.
In the ordinary course of our business, we also may be subject to a concentration of credit risk in a particular industry, country, counterparty, borrower or issuer. A deterioration in the financial
condition or prospects of a particular industry or a failure or downgrade of, or default by, any particular entity or group of entities could negatively affect our businesses and the processes by which we set limits and monitor the level of our credit exposure to individual entities, industries and countries may not function as we have anticipated. While our activities expose us to many different industries and counterparties, we routinely execute a high volume of transactions with counterparties in the financial services industry, including brokers/dealers,brokers-dealers, commercial banks, investment banks, insurers, mutual and hedge funds, and other institutional clients and funds.clients. This has resulted in significant credit concentration with respect to this industry. Financial services institutions and other counterparties are inter-related because of trading, funding, clearing or other relationships. As a result, defaults by, or even rumors or questions about the financial stability of one or more financial services institutions, or the financial services industry generally, have ledcould lead to market-wide liquidity problemsdisruptions, losses and could lead to significant future liquidity problems, including losses or defaults by us or by other institutions.defaults. Many of these transactions expose us to credit risk in the event of default of a counterparty or client.counterparty. In addition, our credit risk may be impactedheightened by market risk when the collateral held by us cannot be realized or is liquidated at prices not sufficient to recover the full amount of the loan or derivatives exposure due to us.
In the ordinary course of business, we also enter into transactions with sovereign nations, U.S. states and U.S. municipalities. Unfavorable economic or political conditions, disruptions to capital markets, currency fluctuations, changes in energy prices, social instability and changes in government policies could impact the operating budgets or credit ratings of sovereign nations, U.S. states and U.S. municipalities and expose us to credit risk.
We also have a concentration of credit risk with respect to our consumer real estate, consumer credit card and commercial real estate portfolios, which represent a large percentage of our overall credit portfolio. The economic downturn hasEconomic downturns have adversely affected these portfolios and further exposed us to this concentration of risk.portfolios. Continued economic weakness or deterioration in real estate values or household incomes could result in higher credit losses.
For more information about our credit risk and credit risk management policies and procedures, see Credit Risk Management in the MD&A on page 7670 and Note 1 – Summary of Significant Accounting Principles to the Consolidated Financial Statements.
Our derivatives businesses may expose us to unexpected risks and potential losses.
We are party to a large number of derivatives transactions, including credit derivatives. Our derivatives businesses may expose us to unexpected market, credit and operational risks that could cause us to suffer unexpected losses. Severe declines in asset values, unanticipated credit events or unforeseen circumstances that may cause previously uncorrelated factors to become correlated (and vice versa) may create losses resulting from risks not appropriately taken into account in the development, structuring or pricing of a derivative instrument. The terms of certain of our OTC derivative contracts and other trading agreements provide that upon the occurrence of certain specified events, such as a change in our credit ratings, we may be required
to provide additional collateral or to provide other remedies, or our counterparties may have the right to terminate or otherwise diminish our rights under these contracts or agreements.
Many derivative instruments are individually negotiated and non-standardized, which can make exiting, transferring or settling some positions difficult. Many derivatives require that we deliver to the counterparty the underlying security, loan or other obligation in order to receive payment. In a number of cases, we do not hold, and may not be able to obtain, the underlying security, loan or other obligation.
In the event of a downgrade of the Corporation’s credit ratings, certain derivative and other counterparties may request we substitute BANA (which has generally had equal or higher credit ratings than the Corporation’s) as counterparty for certain derivative contracts and other trading agreements. OurThe Corporation’s ability to substitute or make changes to these agreements to meet counterparties’ requests may be subject to certain limitations, including counterparty willingness, regulatory limitations on naming BANA as the new counterparty and the type or amount of collateral required. It is possible that such limitations on our ability to substitute or make changes to these agreements, including naming BANA as the new counterparty, could adversely affect our results of operations.
Derivatives contracts, including new and more complex derivatives products, and other transactions entered into with third parties are not always confirmed by the counterparties or settled on a timely basis. While a transaction remains unconfirmed, or during any delay in settlement, we are subject to heightened credit, market and operational risk and, in the event of default, may find it more difficult to enforce the contract. In addition, disputes may arise with counterparties, including government entities, about the terms, enforceability and/or suitability of the underlying contracts. These factors could negatively impact our ability to effectively manage our risk exposures from these products and subject us to increased credit and operating costs and reputational risk.
For more information on our derivatives exposure, see Note 2 – Derivatives to the Consolidated Financial Statements.
Market Risk
Market Risk is the Risk that ValuesMarket Conditions May Adversely Impact the Value of Assets andor Liabilities or Revenues will be Adversely Affected by Changes in Market Conditions Such as Market Volatility.Otherwise Negatively Impact Earnings. Market Risk is Inherent in the Financial Instruments Associated with our Operations, Including Loans, Deposits, Securities, Short-term Borrowings, Long-term Debt, Trading Account Assets and Liabilities, and Derivatives.
Increased market volatility and adverse changes in other financial or capital market conditions may increase our market risk.
Our liquidity, cash flows, competitive position, business, results of operations and financial condition are affected by market risk factors such as changes in interest and currency exchange rates, equity and futures prices, the implied volatility of interest rates, credit spreads and other economic and business factors. These market risks may adversely affect, among other things, (i) the value of our on- and off-balance sheet securities, trading assets, other financial instruments, and MSRs, (ii) the cost of debt capital and our access to credit markets, (iii) the value of assets under management (AUM), (iv) fee income relating to AUM, (v) customer
allocation of capital among investment alternatives, (vi) the volume of client activity in our trading operations, (vii) investment banking fees, and (viii) the general profitability and risk level of the transactions in which we engage. For example, the value of certain
of our assets is sensitive to changes in market interest rates. If the Federal Reserve, changes or signalscentral banks internationally, change or signal a change in the timing or pace of tapering of its current mortgage securities repurchase program,monetary policy, market interest rates could be affected, which could adversely impact the value of such assets. In addition, the existence of a prolonged low interest rate environment could negatively impact our cash flows, financial condition or results of operations, including future revenue and earnings growth.
We use various models and strategies to assess and control our market risk exposures but those are subject to inherent limitations. Our models, which rely on historical trends and assumptions, may not be sufficiently predictive of future results due to limited historical patterns, extreme or unanticipated market movements and illiquidity, especially during severe market downturns or stress events. The models that we use to assess and control our market risk exposures also reflect assumptions about the degree of correlation among prices of various asset classes or other market indicators. In addition, market conditions in recent years have involved unprecedented dislocations and highlight the limitations inherent in using historical data to manage risk.
In times of market stress or other unforeseen circumstances, such as the market conditions experienced in 2008 and 2009, previously uncorrelated indicators may become correlated, or previously correlated indicators may move in different directions. These types of market movements have at times limited the effectiveness of our hedging strategies and have caused us to incur significant losses, and they may do so in the future. These changes in correlation can be exacerbated where other market participants are using risk or trading models with assumptions or algorithms that are similar to ours. In these and other cases, it may be difficult to reduce our risk positions due to the activity of other market participants or widespread market dislocations, including circumstances where asset values are declining significantly or no market exists for certain assets. To the extent that we own securities that do not have an established liquid trading market or are otherwise subject to restrictions on sale or hedging, we may not be able to reduce our positions and therefore reduce our risk associated with such positions. In addition, challenging market conditions may also adversely affect our investment banking fees.
For more information about market risk and our market risk management policies and procedures, see Market Risk Management in the MD&A on page 10899.
A downgrade in the U.S. government’s sovereign credit rating, or in the credit ratings of instruments issued, insured or guaranteed by related institutions, agencies or instrumentalities, could result in risks to the Corporation and its credit ratings and general economic conditions that we are not able to predict.
On October 15, 2013,June 6, 2014, S&P affirmed its AA+ long-term and A-1+ short-term sovereign credit rating on the U.S. government with a stable outlook. On March 21, 2014, Fitch placedaffirmed its AAA long-term and F1+ short-term sovereign credit rating on the U.S. government onwith a stable outlook. This resolved the rating watch negative.negative that was placed on the ratings on October 15, 2013. On July 18, 2013, Moody’s revised its outlook on the U.S. government to stable from negative and affirmed its AAAAaa long-term sovereign credit rating on the U.S. government. On June 10, 2013, S&P affirmed its AA+ long-term and A-1+ short-term sovereign credit rating on the U.S. government, and revised the outlook on the long-term credit rating to stable from negative. All three rating agencies have indicated that they will continue to assess fiscal projections and consolidation measures, as well as the medium-term economic outlook for the U.S.
The ratings and perceived creditworthiness of instruments issued, insured or guaranteed by institutions, agencies or instrumentalities directly linked to the U.S. government could also be correspondingly affected by any downgrade. Instruments of this nature are often held as trading, investment or excess liquidity
positions on the balance sheets of financial institutions, including the Corporation, and are widely used as collateral by financial institutions to raise cash in the secured financing markets. A downgrade of the sovereign credit ratings of the U.S. government and perceived creditworthiness of U.S. government-related obligations could impact our ability to obtain funding that is collateralized by affected instruments, as well as affecting the pricing of that funding when it is available. A downgrade may also adversely affect the market value of such instruments.
We cannot predict if, when or how any changes to the credit ratings or perceived creditworthiness of these organizations will affect economic conditions. The credit rating agencies’ ratings for the Corporation or its subsidiaries could be directly or indirectly impacted by a downgrade of the U.S. government’s sovereign rating because certain credit ratings of large systemically important financial institutions issued by S&P and Fitch, including those of the Corporation or its subsidiaries, currently include a degree of uplift due to rating agencies’ assumptions concerning potential government support. In addition, the Corporation presently delivers a material portion of the residential mortgage loans it originates into GSEs, agencies or instrumentalities (or instruments insured or guaranteed thereby). We cannot predict if, when or how any changes to the credit ratings of these organizations will affect their ability to finance residential mortgage loans.
A downgrade of the sovereign credit ratings of the U.S. government or the credit ratings of related institutions, agencies or instrumentalities would exacerbate the other risks to which the Corporation is subject and any related adverse effects on our business, financial condition and results of operations.
Our businesses may be affected by uncertainty about the financial stability and growth rates of non-U.S. jurisdictions, the risk that those jurisdictions may face difficulties servicing their sovereign debt, and related stresses on financial markets, currencies and trade.
Risks and ongoing concerns about the financial stability of several non-U.S. jurisdictions could impact our operations and have a detrimental impact on the global economic recovery. For instance, sovereign and non-sovereign debt levels remain elevated. Market and economic disruptions have affected, and may continue to affect, consumer confidence levels and spending, corporate investment and job creation, bankruptcy rates, levels of incurrence and default on consumer debt and corporate debt, economic growth rates and asset values, among other factors.
A number of non-U.S. jurisdictions in which we do business have been negatively impacted by slowing growth rates or recessionary conditions, market volatility and/or political unrest. Additionally, there can be no assurance that the recent market stabilization in Europe, including reduced costs of funding for certain governmentswhich has recently experienced a renewed slowdown and financial institutions,increased volatility, is sustainable, nor can there be any assurance that future assistance packages, if required, will be available or, even if provided, will be sufficient to stabilize the affected countries and markets in Europe or elsewhere. To the extent European economic recovery uncertainty continues to negatively impact consumer and business confidence and credit factors, or should the EU enter a deep recession, both the U.S. economy and our business and results of operations could be adversely affected.
The Corporation has substantial U.K. net deferred tax assets, which consist primarily of net operating losses (NOLs) that are expected to be realized by certain subsidiaries over an extended number of years. Management concluded that no valuation allowance was necessary with respect to such net deferred tax
assets. Management’s conclusion is supported by recent financial results and forecasts, the reorganization of certain business activities and the indefinite period to carry forward NOLs. However, significant changes to those expectations, such as would be caused by a substantial and prolonged worsening of the condition of Europe’s capital markets, could lead management to reassess its U.K. valuation allowance conclusions.
Global economic and political uncertainty, regulatory initiatives and reform have impacted, and will likely continue to impact, non-U.S. credit and trading portfolios. There can be no assurance our risk mitigation efforts in this respect will be sufficient or successful. Our total sovereign and non-sovereign exposure to Greece, Italy, Ireland, Portugal and Spain was $17.1 billion at December 31, 2013 compared to $14.5 billion at December 31, 2012. Our total net sovereign and non-sovereign exposure to these countries was $10.4 billion at December 31, 2013 compared to $9.5 billion at December 31, 2012, after taking into account net credit default protection. At December 31, 2013 and 2012, the fair value of hedges and credit default protection was $6.8 billion and $5.1 billion. Losses could still result because our credit protection contracts only pay out under certain scenarios. For example, it is possible that a voluntary restructuring will not constitute a credit event under the terms of a credit default swap (CDS), and consequently may not trigger a payment under the relevant CDS contract.
For more information on our direct sovereign and non-sovereign exposures in the top 20 non-U.S. countries, and Europe, see Non-U.S. Portfolio in the MD&A on page 10093.
We may incur losses if the values of certain assets decline, including due to changes in interest rates and prepayment speeds.
We have a large portfolio of financial instruments, including, among others, certain loans and loan commitments, loans held-for-sale, securities financing agreements, asset-backed secured financings, long-term deposits, long-term debt, trading account assets and liabilities, derivativesderivative assets and liabilities, available-for-sale (AFS) debt and equity securities, other debt securities, carried at fair value, certain MSRs and certain other assets and liabilities that we measure at fair value. We determine the fair values of these instruments based on the fair value hierarchy under applicable accounting guidance. The fair values of these financial instruments include adjustments for market liquidity, credit quality, funding impact on certain derivatives and other transaction-specific factors, where appropriate.
Gains or losses on these instruments can have a direct impact on our results of operations, including higher or lower mortgage banking income and earnings, unless we have effectively hedged our exposures. For example, decreases in interest rates and increases in mortgage prepayment speeds, which are influenced by interest rates amongand other things,factors such as reductions in mortgage insurance premiums and origination costs, could adversely impact the value of our MSR asset, cause a significant acceleration of purchase premium amortization on our mortgage portfolio, because a decline in long-term interest rates shortens the expected lives of the securities, and adversely affect our net interest margin. Conversely, increases in interest rates may result in a decrease in residential mortgage loan originations. In addition, increases in interest rates may adversely impact the fair value of debt securities and, accordingly, for debt securities classified as AFS, may adversely affect accumulated other comprehensive income (OCI) and, thus, capital levels.
Fair values may be impacted by declining values of the underlying assets or the prices at which observable market transactions occur and the continued availability of these transactions. The financial strength of counterparties, with whom we have economically hedged some of our exposure to these
assets, also will affect the fair value of these assets. Sudden declines and volatility in the prices of assets may curtail or eliminate the trading activity for these assets, which may make it difficult to sell, hedge or value such assets. The inability to sell or effectively hedge assets reduces our ability to limit losses in such positions and the difficulty in valuing assets may increase our risk-weighted assets, which requires us to maintain additional capital and increases our funding costs.
Asset values also directly impact revenues in our asset management businesses. We receive asset-based management fees based on the value of our clients’ portfolios or investments in funds managed by us and, in some cases, we also receive performance fees based on increases in the value of such investments. Declines in asset values can reduce the value of our clients’ portfolios or fund assets, which in turn can result in lower fees earned for managing such assets.
For more information about fair value measurements, see Note 20 – Fair Value Measurements to the Consolidated Financial Statements. For more information about our asset management businesses, see Business Segment Operations – Global Wealth & Investment ManagementGWIM in the MD&A on page 4442. For more information about interest rate risk management, see Interest Rate Risk Management for NontradingNon-trading Activities in the MD&A on page 113105.
Changes in the method of determining the London Interbank Offered Rate (LIBOR) or other reference rates may adversely impact the value of debt securities and other financial instruments we hold or issue that are linked to LIBOR or other reference rates in ways that are difficult to predict and could adversely impact our financial condition or results of operations.
In recent years, concerns have been raised about the accuracy of the calculation of LIBOR. Aspects of the method for determining how LIBOR is formulated and its use in the market have changed and may continue to change,change. Effective February 1, 2014, the transfer of LIBOR administration to the ICE Benchmark Administration, Ltd. was completed following authorization by the U.K. Financial Conduct Authority. On July 22, 2014, the Financial Stability Board published its report recommending reforms to the administration of major benchmarks, including LIBOR. Changes to LIBOR administration include, but are not limited to, requiring thatthe introduction of statutory regulation of LIBOR submissions be kept confidential, replacing the administrator of LIBOR,by U.K. regulatory authorities; reducing the currencies andfor which LIBOR is calculated to five; reducing the tenors for which LIBOR is calculated to seven; delay in the publication of individual banks’ LIBOR submissions for three months from submission; and requiring banks to provide LIBOR submissions based on actual transaction data or otherwise changingan effective methodology on the structurebasis of LIBOR, each of whichrelevant criteria and information, including observable market transactions where possible. Each such change and any future changes could impact the availability and volatility of LIBOR. For example, the British Bankers’ Association (BBA) reduced the tenors for which LIBOR is calculated and published. In addition, the BBA has announced the administration of LIBOR will transfer from the BBA to the ICE Benchmark Administration Limited. Similar changes have occurred or may occur with respect to other reference rates. Accordingly, it is not currently possible to determine whether, or to what extent, any such changes would impact the value of any debt securities we hold or issue that are linked to LIBOR or other reference rates, or any loans, derivatives and other financial obligations or extensions of credit we hold or are due to us, or for which we are an obligor, that are linked to LIBOR or other reference rates, or whether, or to what extent, such changes would impact our financial condition or results of operations.
Mortgage and Housing Market-Related Risk
Our mortgage loan repurchase obligations or claims from third parties could result in additional losses.
We and our legacy companies have sold significant amounts of residential mortgage loans. In connection with these sales, we or certain of our subsidiaries or legacy companies make or have made various representations and warranties, breaches of which may result in a requirement that we repurchase the mortgage loans, or otherwise make whole or provide other remedies to counterparties (collectively, repurchases). At December 31, 2014, we had approximately $22.4 billion of unresolved repurchase claims, net of duplicate claims. These repurchase claims relate primarily to private-label securitizations and include claims in the amount of $4.7 billion, net of duplicate claims, where we believe the statute of limitations has expired under current law. Private-label securitization unresolved repurchase claims have increased in recent periods, and such claims may continue to increase. In
addition to unresolved repurchase claims, we have received notifications pertaining to loans for which we have not received a repurchase request from sponsors of third-party securitizations with whom the Corporation engaged in whole-loan transactions and for which we may owe indemnity obligations. We also from time to time receive correspondence purporting to raise representations and warranties breach issues from entities that do not have contractual standing or ability to bring such claims. We believe such communications to be procedurally and/or substantially invalid, and generally do not respond to such correspondence. In addition to repurchase claims, we receive notices from mortgage insurance companies of claim denials, cancellations or coverage rescission (collectively, MI rescission notices). Although they declined during 2014, the number of open MI rescission notices remains elevated.
We have recorded a liability of $12.1 billion for obligations under representations and warranties exposures (which includes exposures related to MI rescission notices). We have also established an estimated range of possible loss of up to $4 billion over our recorded liability. The liability for representations and warranties exposures and the corresponding estimated range of possible loss do not consider losses related to servicing (except as such losses are included as potential costs of the BNY Mellon Settlement), including foreclosure and related costs, fraud, indemnity, or claims (including for residential mortgage-backed securities (RMBS)) related to securities law or monoline litigations. Losses with respect to one or more of these matters could be material to the Corporation’s results of operations or cash flows for any particular reporting period.
Our recorded liability and estimated range of possible loss for representations and warranties exposures are based on currently available information and are necessarily dependent on, and limited by, a number of factors, including our historical claims and settlement experiences as well as significant judgment and a number of assumptions that are subject to change. As a result, our liability and estimated range of possible loss related to our representations and warranties exposures may materially change in the future. Additionally, if final court approval of the settlement with the Bank of New York Mellon, as trustee (BNY Mellon Settlement) is not obtained, or if the Corporation and legacy Countrywide Financial Corporation determine to withdraw from the BNY Mellon Settlement agreement in accordance with its terms, the Corporation’s future representations and warranties losses could be substantially different from existing accruals and the existing estimated range of possible loss. If future representations and warranties losses occur in excess of our recorded liability and estimated range of possible loss, such losses could have an adverse effect on our cash flows, financial condition and results of operations.
For more information about our representations and warranties exposure, including the estimated range of possible loss, see Off-Balance Sheet Arrangements and Contractual Obligations – Representations and Warranties in the MD&A on page 50, Consumer Portfolio Credit Risk Management in the MD&A on page 70 and Note 7 – Representations and Warranties Obligations and Corporate Guarantees to the Consolidated Financial Statements.
For more information regarding the BNY Mellon Settlement, see Note 7 – Representations and Warranties Obligations and Corporate Guaranteesto the Consolidated Financial Statements.
Failure to satisfy our obligations as servicer for residential mortgage securitizations, along with other losses we could incur in our capacity as servicer, and continued foreclosure delays and/or investigations into our residential mortgage foreclosure practices could cause losses.
We and our legacy companies have securitized a significant portion of the residential mortgage loans that we originated or acquired. We service a large portion of the loans we have securitized and also service loans on behalf of third-party securitization vehicles and other investors. At December 31, 2014, we serviced approximately 5.3 million loans with an aggregate unpaid principal balance of $693 billion, including loans owned by us and by others. Of the 3.2 million loans serviced for others, approximately 67 percent are held in GSE securitization vehicles and 33 percent are held in non-GSE securitization vehicles or by other investors. If we commit a material breach of our obligations as servicer or master servicer, we may be subject to termination if the breach is not cured within a specified period of time following notice, which could cause us to lose servicing income. In addition, for loans held in non-GSE securitization vehicles, we may have liability for any failure by us, as a servicer or master servicer, for any act or omission on our part that involves willful misfeasance, bad faith, gross negligence or reckless disregard of our duties. If any such breach were found to have occurred, it may harm our reputation, increase our servicing costs or adversely impact our results of operations. Additionally, with respect to foreclosures, we may incur costs or losses due to irregularities in the underlying documentation, or if the validity of a foreclosure action is challenged by a borrower or overturned by a court because of errors or deficiencies in the foreclosure process. We may also incur costs or losses relating to delays or alleged deficiencies in processing documents necessary to comply with state law governing foreclosures.
We are subject to certain legal and contractual requirements for how we hold, transfer, use or enforce promissory notes, security instruments and other documents for residential mortgage loans that we service. In recent years, challenges have been raised to whether we have adhered to these requirements, and whether, as a result in some instances, the loans can be enforced as local law otherwise would permit. Additionally, we currently use the Mortgage Electronic Registration Systems, Inc. (MERS) system for approximately half of the residential mortgage loans that remain in our servicing portfolio. Individual borrowers and certain local governments have contended that the use of MERS is improper or otherwise adversely affects the security interest. If documentation requirements were not met, or if the use of MERS or the MERS system is found not valid or effective, we could be obligated to, or choose to, take remedial actions and may be subject to additional costs or losses.
For additional information, Off-Balance Sheet Arrangements and Contractual Obligations in the MD&A on page 50.
If the U.S. housing market weakens, or home prices decline, our consumer loan portfolios, credit quality, credit losses, representations and warranties exposures, and earnings may be adversely affected.
Although U.S. home prices continued to improve during 2014, the declines in prior years have negatively impacted the demand for many of our products. Additionally, our mortgage loan production volume is generally influenced by the rate of growth in residential mortgage debt outstanding and the size of the residential mortgage market.
Conditions in the U.S. housing market in prior years have also resulted in significant write-downs of asset values in several asset classes, notably mortgage-backed securities, and increased exposure to monolines. If the U.S. housing market were to weaken, the value of real estate could decline, which could negatively affect our exposure to representations and warranties. While there were continued indications in 2014 that the U.S. economy is improving, the performance of our overall consumer portfolios may not significantly improve in the near future. A protracted continuation or worsening of difficult housing market conditions may exacerbate the adverse effects outlined above and could have an adverse effect on our financial condition and results of operations.
In addition, our home equity portfolio, which makes up approximately 28 percent of our total home loans portfolio, contains a significant percentage of loans in second-lien or more junior-lien positions, and such loans have elevated risk characteristics. Our home equity portfolio had an outstanding balance of $85.7 billion as of December 31, 2014, including $74.2 billion of home equity lines of credit (HELOC), $9.8 billion of home equity loans and $1.7 billion of reverse mortgages. Of the total home equity portfolio at December 31, 2014, $20.6 billion, or 24 percent, were in first-lien positions (26 percent excluding the PCI home equity portfolio) and $65.1 billion, or 76 percent (74 percent excluding the PCI home equity portfolio) were in second-lien or more junior-lien positions. The HELOCs that have entered the amortization period have experienced a higher percentage of early stage delinquencies and nonperforming status when compared to the HELOC portfolio as a whole. Loans in our HELOC portfolio generally have an initial draw period of 10 years and more than 75 percent of these loans will not enter their amortization period until 2016 or later. As a result, delinquencies and defaults may increase in future periods. For additional information, see Off-Balance Sheet Arrangements and Contractual Obligations in the MD&A on page 50 and Consumer Portfolio Credit Risk Management on page 70.
Regulatory, Compliance and Legal Risk
Bank regulatoryU.S. federal banking agencies may require us to hold higher levels of regulatory capital, increase our regulatory capital ratios or increase liquidity, which could result in the need to issue additional securities that qualify as regulatory capital or to take other actions, such as to sell company assets.
We are subject to the Federal Reserve’s risk-based capital guidelines.rules. These guidelinesrules establish regulatory capital requirements for banking institutions to meet minimum requirements as well as to qualify as a “well-capitalized” institution. If any of our subsidiary insured depository institutions fail to maintain its status as “well-capitalized” under the applicable regulatory capital rules, the Federal Reserve will require us to agree to bring the insured depository institution or institutions back to “well-capitalized” status. For the duration of such an agreement, the Federal Reserve may impose restrictions on our activities. If we were to fail to enter into such an agreement, or fail to comply with the terms of such agreement, the Federal Reserve may impose more severe restrictions on our activities, including requiring us to cease and desist activities permitted under the Bank Holding Company Act of 1956.
The current regulatory environment is fluid, with requirements frequently being introduced and amended. It is possible that increases in regulatory capital requirements, changes in how regulatory capital is calculated or increases to liquidity
requirements maycould cause the loss of our “well-capitalized” status unless weus to increase our capital levels by issuing additional common stock, thus diluting our existing shareholders, or by taking other actions, such as selling company assets.assets, in order to maintain our “well-capitalized” status.
In JulyOctober 2013, the Federal Reserve, the Federal Deposit Insurance Corporation (FDIC) and the Office of the Comptroller of the Currency (OCC) (the Agencies, or U.S. banking regulators approvedregulators) published the final Basel 3 Regulatory Capital Rulesregulatory capital rules (Basel 3). Basel 3 materially changes how our Tier 1 common, Tier 1 and Total capital are calculated.calculations and formally establishes a Common equity tier 1 capital ratio, notably phasing out trust preferred securities. Additionally, Basel 3 introduces new minimum capital ratios and buffer requirements and a supplementary leverage ratio (SLR), changes the composition of regulatory capital, revises the adequately capitalized minimum requirementrequirements under the Prompt Corrective Action (PCA) framework, expands and modifies the risk-sensitive calculation of risk-weighted assetsrisk weighted-assets for credit and market risk (the Advanced approaches) and introduces a Standardized approach for the calculation of risk-weighted assets, which serves as a minimum. Changes to the composition of regulatory capital under Basel 3, as compared to the Basel 1 – 2013 Rules, are subject to a transition period. The new minimum capital ratio requirements and related buffers will be phased in from January 1, 2014 through January 1, 2019. When presented on a fully phased-in basis, capital, risk-weighted assets and the capital ratios assume all regulatory capital adjustments and deductions are fully recognized. The Advanced approaches require approval by the Agencies of our internal analytical models used to calculate risk-weighted assets. As an advanced approaches bank, under Basel 3, we are required to complete a qualification period (parallel run) to demonstrate compliance with the final Basel 3 rules to the satisfaction of U.S. banking regulators. Our estimates under the Basel 3 Advanced approaches may be refined over time as a result of further rulemaking or clarification by U.S. banking regulators or as our understanding and interpretation of the rules evolve. We are currently working with the U.S. banking regulators to obtain approval of certain internal analytical models including the wholesale (e.g., commercial) and other credit models in order to exit parallel run. The U.S. banking regulators have indicated that they will require modifications to these models which would likely result in a material increase in our risk-weighted assets resulting in a decrease in our capital ratios.
In April 2014, the Agencies adopted a final rule to strengthen the SLR standards for the largest U.S. banking organizations by requiring such institutions to maintain a leverage buffer greater than 2.0 percentage points above the minimum SLR requirement of 3.0 percent, for a total of greater than 5.0 percent, to avoid restrictions on capital distributions and variable compensation payments. Banking subsidiaries of such organizations are required to maintain at least a six percent SLR to be considered “well capitalized” under the PCA framework. In addition, in September 2014, the Agencies adopted a final rule modifying the definition of the denominator of the SLR in a manner consistent with changes adopted by the Basel Committee on Banking Supervision (Basel Committee) to better capture on- and off-balance sheet exposures, including credit derivatives, repo-style transactions, and lines of credit.
In September 2014, the Agencies issued a final Liquidity Coverage Ratio (LCR) rule. This rule creates a standardized minimum liquidity requirement for the largest U.S. financial institutions. The rule will require an institution to hold high quality liquid assets (HQLA), such as central bank reserves and
government debt that can be converted easily and quickly into cash, in an amount equal to or greater than prescribed net cash outflows during a 30-day stress period. In October 2014, the Basel Committee issued its final standard for the Net Stable Funding Ratio (NSFR) regulation. The NSFR requires banks to maintain a stable funding profile in relation to their on- and off-balance sheet activities. Although the timing is uncertain, the Agencies are expected to propose and enact regulations to implementsimilar regulation for the NSFR in the near future.
In November 2014, the Financial Stability Board, in consultation with the Basel Committee, issued for public consultation a proposal for a common international standard on total loss-absorbing capacity (TLAC) for global systemically important financial institution (SIFI)banks (GSIBs). Although the timing is uncertain, the Agencies are expected to propose TLAC regulation in the near future.
In December 2014, a U.S. banking regulator proposed a regulation that would implement GSIB surcharge requirements for the largest U.S. BHCs. The proposed rule would require such organizations to calculate a GSIB capital buffer. The SIFI buffer that is the higher of the GSIB’s capital buffer proposed by the Basel Committee in 2012 and a modified capital buffer with a short-term wholesale funding component. As proposed, the Federal Reserve estimates that the GSIB surcharge requirements, which currently ranges from 1.0 percent to 4.5 percent, would require us to hold TierCommon equity tier 1 common capital in addition toexcess of regulatory minimums.
The U.S. banking regulators are also expected to adopt regulatory liquidity requirements, including a liquidity coverage ratio (LCR)minimums and a net stable funding ratio (NSFR), which are intended to ensure that firms hold sufficient liquid assets over different time horizons to fund operations if other funding sources are unavailable. In October 2013, the U.S. banking regulators issued a noticecapital conservation buffer. Consequences of proposed rulemaking, which, if adopted, would implement the LCR beginning on January 1, 2015 and be fully phased in by January 1, 2017. Additionally, although the timing is uncertain, the U.S. banking regulatorsfalling below this level are expected to proposeinclude limitations on capital distributions and enact rules regarding the NSFR. For additional information, see Liquidity Risk – Basel 3 Liquidity Standards on page 73.variable compensation payments.
Compliance with the regulatory capital and liquidity requirements may impact our ability to return capital to shareholders and may impact our operations by requiring us to liquidate assets, increase borrowings, issue additional equity or other securities, cease or alter certain operations, or hold highly liquid assets, which may adversely affect our results of operations.
For moreadditional information, about the proposals and regulatory changes described above, see Capital Management and Liquidity Risk – Regulatory Capital in the MD&ABasel 3 Liquidity Standards on page 65.pages 59 and 67.
We are subject to extensive government legislation and regulations, both domestically and internationally, which impact our operating costs and could require us to make changes to our operations, which could result in an adverse impact on our results of operations. Additionally, these regulations, and certain consent orders and settlements we have entered into, have increased and will continue to increase our compliance and operational costs.
We are subject to extensive laws and regulations promulgated by U.S. state, U.S. federal and non-U.S. laws in the jurisdictions in which we operate. In response to the financial crisis, the U.S. adopted the Financial Reform Act, which has resulted in significant rulemaking and proposed rulemaking by the U.S. Department of the Treasury, the Federal Reserve, the OCC, the CFPB, FSOC, the FDIC, the SEC and CFTC. A number of the provisions of the Financial Reform Act, including those described below, may have an impact on our operations.
Consumer Businesses. Our consumer businesses are subject to extensive regulation and oversight by the OCC, the CFPB, the FDIC and other federal and state regulators. The CFPB has promulgated several proposed and final rules that have affected and will continue to affect our consumer businesses, including, but not limited to, establishing enhanced underwriting standards and new mortgage loan servicing standards. The CFPB has also proposed rules addressing items such as remittance transfer services, appraisal requirements and loan originator compensation requirements, and debt collection practices. The Corporation is devoting substantial compliance, legal and operational business resources to facilitate compliance with these rules by their respective effective dates; however, it is possible that the final and proposed rules could have an adverse impact on our results of operations.
Debit Interchange. On July 31, 2013, the U.S. District Court for the District of Columbia issued a ruling regarding the Federal Reserve’s rules implementing a limit on debit interchange fees mandated by the Durbin Amendment of the Financial Reform Act. The ruling requires the Federal Reserve to reconsider the current $0.21 per transaction cap on debit card interchange fees. The Federal Reserve is appealing the ruling and final resolution is expected in the first half of 2014. If the Federal Reserve, upon final resolution, implements a lower per transaction cap, it may have an adverse impact on our debit card interchange fee revenue.
Derivatives. The Financial Reform Act includes measures to broaden the scope of derivative instruments subject to regulation by requiring clearing and exchange trading of certain derivatives; imposing new capital, margin, reporting, registration and business conduct requirements for certain market participants; and imposing position limits on certain OTC derivatives. Compliance with these rules could have an adverse impact on our results of operations.
FDIC. The FDIC has broad discretionary authority to increase assessments on large and highly complex institutions on a case by case basis. Any future increases in required deposit insurance premiums or other bank industry fees could have an adverse impact on our financial condition and results of operations.
Orderly Liquidation. The Financial Reform Act established an orderly liquidation process in the event of the failure of a large systemically important financial institution. Specifically, when a systemically important financial institution such as the Corporation is in default or danger of default, the FDIC may be appointed receiver under the orderly liquidation authority instead of the U.S. Bankruptcy Code. In certain circumstances under the orderly liquidation authority, the FDIC could permit payment of obligations it determines to be systemically significant (e.g., short-term creditors or operating creditors) in lieu of paying other obligations (e.g., long-term senior and subordinated creditors, among others) without the need to obtain creditors’ consent or prior court review. The insolvency and resolution process could also lead to a large reduction in or total elimination of the value of a BHC’s outstanding equity. Additionally, under the orderly liquidation authority, amounts owed to the U.S. government generally receive a statutory payment priority.
Resolution Planning. Under the Financial Reform Act, all BHCs with assets of $50 billion or more are required to develop and submit resolution plans annually to the FDIC and the Federal Reserve, who will review such plans to determine whether they are credible. If the FDIC and the Federal Reserve determine that our plan is not credible and we fail to cure the deficiencies in a timely manner, the FDIC and the Federal Reserve may jointly impose more stringent capital, leverage or liquidity requirements or restrictions on growth, activities or operations of the Corporation. We could be required to take certain actions that could impose operating costs and could potentially result in the divestiture or restructuring of certain businesses and subsidiaries.
Volcker Rule. On December 10, 2013, the Federal Reserve, OCC, FDIC, SEC and CFTC issued final regulations under the Financial Reform Act implementing limitations on proprietary trading as well as the sponsorship of, or investment in, hedge funds and private equity funds (the Volcker Rule) and set a conformance period that will expire on July 21, 2015. Subject to certain exceptions, the Volcker Rule prohibits us from engaging in short-term proprietary trading of certain securities, derivatives, commodity futures and options for our own account, as well as imposes limits on our investments in, and other relationships with, hedge funds and private equity funds.
We are still in the process of evaluating the full impact of the Volcker Rule on our current trading activities and our ownership interests in and transactions with hedge funds, private equity funds, commodity pools and other subsidiary operations. The Volcker Rule will likely increase our operational and compliance costs, reduce our trading revenues, and adversely affect our results of operations.
CCAR. On October 12, 2012, the Federal Reserve issued final rules requiring covered entities to undergo annual stress tests conducted by the Federal Reserve, the CCAR, and to conduct their own “company-run” stress tests twice a year. As part of the CCAR process, we must submit our capital plan, including any potential requests for capital actions, to the Federal Reserve on an annual basis. Our ability to return capital to shareholders, through dividends, share repurchases or otherwise, is subject to the Federal Reserve’s not objecting to our capital plan.
In addition, non-U.S. regulators, such as the PRAU.K. financial regulators and the European Parliament and Commission, have adopted or have proposed laws and regulations regarding financial institutions located in their jurisdictions.
The ultimate impact of these laws and regulations remains uncertain. For example, we are required to annually submit a resolution plan to the FDIC and the Federal Reserve. If the FDIC and Federal Reserve jointly determine that our resolution plan is not credible and we fail to cure the deficiencies in a timely manner, they could impose more stringent capital, leverage or liquidity requirements or restrictions on growth, activities or operations of the United Kingdom, the PRA has issued proposed rules regarding resolution planning for our U.K.-based entitiesCorporation, and we could be required to take certain actions that could require us to take certainimpose operating costs and could potentially result in
|
| | |
1413 Bank of America 20132014
| | |
actions over the next several years that could impose operating costs on us and could potentially result in thedivestiture or restructuring of certain of our businesses and subsidiaries. In addition, we are subjectAugust 2014, the Federal Reserve and the FDIC completed their reviews of the resolution plans submitted in 2013 by 11 large, complex banking organizations, including Bank of America, and issued letters to the European Market Infrastructure Regulation (EMIR), which regulates OTC derivatives, central counterparties and trade repositories, and imposes requirements for certain market participants with respect to derivatives reporting, clearing, business conduct and collateral. Adapting to and implementing EMIR requirements could impose operating costs. The ultimate impacteach of these lawsbanking organizations. Separately, in August 2014, the Federal Reserve and regulations remains uncertain.the FDIC issued a joint press release stating that the Board of Directors of the FDIC had determined that the plans submitted by each of the 11 banks were not credible and do not facilitate an orderly resolution under the U.S. Bankruptcy Code. However, the Federal Reserve did not join the FDIC in its determination that the submitted plans were not credible. Many rules are still being finalized, and upon finalization could require additional regulatory guidance and interpretation. Additionally, laws proposed by different jurisdictions could create competing or conflicting requirements.
We are also subject to other significant regulations, such as OFAC, FCPA, and U.S. and international anti-money laundering regulations. Laws proposed by different jurisdictions could create competing or conflicting requirements. We could become subject to regulatory requirements beyond those currently proposed, adopted or contemplated. Additionally, weWe are currently subject to the terms of settlements and consent orders that we have entered into with government agencies, such as the 2011 OCC Consent Order and the National Mortgage settlement.Settlement, and may become subject to additional settlements or orders in the future.
While we believe that we have adopted appropriate risk management and compliance programs, compliance risks will continue to exist, particularly as we adapt to new rules and regulations. Our regulators have assumed an increasingly active oversight, inspection and investigatory role over our operations and the financial services industry generally. In addition, legal and regulatory proceedings and other contingencies will arise from time to time that may result in fines, penalties, equitable relief and changes to our business practices. As a result, we are and will continue to be subject to heightened compliance and operating costs that could adversely affect our results of operations.
For more information about the regulatory initiatives discussed above, see Regulatory Matters in the MD&A on page 59.
Changes in the structure of the GSEs and the relationship among the GSEs, the government and the private markets, or the conversion of the current conservatorship of the GSEs into receivership, could result in significant changes to our business operations and may adversely impact our business.
We haveDuring 2013 and 2014, we sold over $2.0 trillionapproximately $65 billion of loans to the GSEs. Each GSE is currently in a conservatorship, with its primary regulator, the Federal Housing Finance Agency, acting as conservator. We cannot predict if, when or how the conservatorships will end, or any associated changes to the GSEs’ business structure that could result. We also cannot predict whether the conservatorships will end in receivership. There are several proposed approaches to reform the GSEs that, if enacted, could change the structure of the GSEs and the relationship among the GSEs, the government and the private markets, including the trading markets for agency conforming mortgage loans and markets for mortgage-related securities in which we participate. We cannot predict the prospects for the enactment, timing or content of legislative or rulemaking proposals regarding the future status of the GSEs. Accordingly, there continues to be uncertainty regarding the future of the GSEs, including whether they will continue to exist in their current form.
We are subject to significant financial and reputational risks from potential liability arising from lawsuits, regulatory orand government action.
We face significant legal risks in our business, and the volume of claims and amount of damages, penalties and fines claimed in
litigation, and regulatory and government proceedings against us and other financial institutions remain high and are increasing. For example, we are currently involved in MBS litigation including purported class action suits, actions brought by individual MBS purchasers, actions brought by the Federal Housing Finance Agency (FHFA) as conservator for the GSEs and governmental actions.high. Increased litigation and investigation costs, substantial legal liability or significant regulatory or government action against us could have adverse effects on our financial condition and results of operations or cause significant reputational harm to us, which in turn could adversely impact our business prospects. We continue to experience increased litigation and other disputes, including claims for contractual indemnification, with counterparties regarding relative rights and responsibilities. Consumers, clients and other counterparties have grown more litigious. Our experience with certain regulatory authorities suggests an increasing supervisory focus on enforcement, including in connection with alleged violations of law and customer harm. Additionally, the ongoing environment of heightened scrutiny may subject us to governmental or regulatory inquiries, investigations, actions, penalties and fines, including by the U.S. Department of Justice, state Attorneys General and other members of the RMBS Working Group of the Financial Fraud Enforcement Task Force, or by other regulators or government agencies that could adversely affect our reputation and result in costs to us in excess of current reserves and management’s estimate of the aggregate range of possible loss for litigation matters. Recent actions by regulators and government agencies indicate that they may, on an industry basis, increasingly pursue claims under the Financial Institutionsinstitutions Reform, Recovery, and Enforcement Actact of 1989 (FIRREA) and the False Claims Act (FCA). For example, the Civil Division of the U.S. Attorney’s office for the Eastern District of New York is conducting an investigation concerning our compliance with the requirements of the Federal Housing Administration’s Direct Endorsement Program.Act. FIRREA contemplates civil monetary penalties as high as $1.1 million per violation or, if permitted by the court, based on pecuniary gain derived or pecuniary loss suffered as a result of the violation. Treble damages are potentially available for FCAFalse Claims Act claims. The ongoing environment of additional regulation, increased regulatory compliance burdens, and enhanced regulatory enforcement, combined with ongoing uncertainty related to the continuing evolution of the regulatory environment, has resulted in operational and compliance costs and may limit our ability to continue providing certain products and services.
For a further discussion ofmore information on litigation risks, see Note 12 – Commitments and Contingencies to the Consolidated Financial Statements.
We may be adversely affected by changes in U.S. and non-U.S. tax and other laws and regulations.
The U.S. Congress and the Administration have indicated an interest in reforming the U.S. corporate income tax code. Possible approaches include lowering the 35 percent corporate tax rate, modifying the taxation of income earned outside the U.S. and limiting or eliminating various other deductions, tax credits and/or other tax preferences. Also, the Governor ofit is possible that New York has issued a proposalCity will enact corporate tax reform that may conform to reform the New York state corporate income tax.state’s tax reform enacted during 2014. It is not possible at this time to quantify either the one-time impacts from the remeasurement of deferred tax assets and liabilities that might result upon tax reform enactment or the ongoing impacts reform proposals might have on income tax expense.
In addition, income from certain non-U.S. subsidiaries has not been subject to U.S. income tax as a result of long-standing deferral provisions applicable to income that is derived in the active conduct of a banking and financing business abroad. These deferral provisions have expired for taxable years beginning on or after January 1, 2014.2015. However, the U.S. Congress has extended these provisions several times, most recently in January 2013,December 2014, when it reinstated the provisions retroactively to apply to 2012 taxable years.January 2014. Congress this year may similarly consider reinstating these provisions to apply to 2014the 2015 taxable years.year. Absent an extension, active financing income earned by certain non-U.S. subsidiaries will generally be subject to a tax provision that considers
incremental U.S. income tax. The impact of the expiration of these provisions would depend upon the amount, composition and geographic mix of our future earnings.
The Corporation has $7.7 billion of U.K. net deferred tax assets which consist primarily of net operating losses (NOLs) that are expected to be realized by certain subsidiaries over an extended number of years. Pretax income for these subsidiaries for 2014, 2013 and 2012 on a cumulative basis totaled $1.7 billion, excluding the impact of debit valuation adjustments (DVA) and the adoption impact of a funding valuation adjustment (FVA). In December 2014, the U.K. Treasury announced that its 2015 Finance Bill, to be introduced soon, will include a proposal that, if enacted, would limit the amount of a bank’s taxable profits that can be reduced by the bank’s existing NOLs to 50 percent of such profits. This proposal would significantly increase the number of years over which our U.K. NOLs, which may be carried forward indefinitely, could be utilized, effectively accelerating U.K. tax that would otherwise have been paid further out in the future. The acceleration of tax and deferral of NOL utilization would not impact our results of operations, but would result in a slower improvement in the amount of our DTAs disallowed for Basel 3 regulatory capital. We are unable to predict whether this proposal will be enacted or, if enacted, what the final provisions will be. Adverse developments with respect to tax laws or to other material factors, such as a prolonged worsening of Europe’s capital markets, could lead management to reassess and/or change its current conclusion that no valuation allowance is necessary with respect to our U.K. net deferred tax assets.
Other countries have also proposed and adopted certain regulatory changes targeted at financial institutions or that otherwise affect us. The EU has adopted increased capital requirements and the U.K. has (i) increased liquidity requirements for local financial institutions, including regulated U.K. subsidiaries of non-U.K. BHCs and other financial institutions as well as branches of non-U.K. banks located in the U.K.; (ii) adopted a Bank Levy, which will applyapplies to the aggregate balance sheet of branches and subsidiaries of non-U.K. banks and banking groups operating in the U.K.; and (iii) proposed the creation and production of recovery and resolution plans by U.K.-regulated entities.
Risk of the Competitive Environment in which We Operate
We face significant and increasing competition in the financial services industry.
We operate in a highly competitive environment. Over time, there has been substantial consolidation among companies in the financial services industry, and this trend accelerated in recent years.industry. This trend has also hastened the globalization of the securities and financial services markets. We will continue to experience intensified competition as consolidation in and globalization of the financial services industry may result in larger, better-capitalized and more geographically diverse companies that are capable of offering a wider array of financial products and services at more competitive prices. To the extent we expand into new business areas and new geographic regions, we may face competitors with more experience and more established relationships with clients, regulators and industry participants in the relevant market, which could adversely affect our ability to compete. In addition, technological advances and the growth of e-commerce have made it possible for non-depository institutions to offer products and services that traditionally were banking products, and for financial institutions to compete with
technology companies in providing electronic and internet-based financial solutions. Increased competition may negatively affect our earnings by creating pressure to lower prices on our products and services and/or reducing market share.
Damage to our reputation could harm our businesses, including our competitive position and business prospects.
Our ability to attract and retain customers, clients, investors and employees is impacted by our reputation. We continue to face increased public and regulatory scrutiny resulting from the financial crisis and economic downturn as well as alleged irregularities in servicing, foreclosure, consumer collections, mortgage loan modifications and other practices, compensation practices, our
acquisitions of Countrywide and Merrill Lynch & Co., Inc. and the suitability or reasonableness of recommending particular trading or investment strategies.
Harm to our reputation can also arise from other sources, including employee misconduct, unethical behavior, litigation or regulatory outcomes, failing to deliver minimum or required standards of service and quality, compliance failures, unintended disclosure of confidential information, and the activities of our clients, customers and counterparties, including vendors. Actions by the financial services industry generally or by certain members or individuals in the industry also can adversely affect our reputation.
We are subject to complex and evolving laws and regulations regarding privacy, data protections and other matters. Principles concerning the appropriate scope of consumer and commercial privacy vary considerably in different jurisdictions, and regulatory and public expectations regarding the definition and scope of consumer and commercial privacy may remain fluid in the future. It is possible that these laws may be interpreted and applied by various jurisdictions in a manner inconsistent with our current or future practices, or that is inconsistent with one another. We face regulatory, reputational and operational risks if personal, confidential or proprietary information of customers or clients in our possession is mishandled or misused.
Additionally, the ongoing environment of heightened scrutiny may subject us to governmental or regulatory inquiries, investigations, actions, penalties and fines, including by the RMBS Working Group of the Financial Fraud Enforcement Task Force, or by other regulators or government agencies that could adversely affect our reputation and result in costs to us in excess of current reserves and management’s estimate of the aggregate range of possible loss for litigation matters.
We could suffer reputational harm if we fail to properly identify and manage potential conflicts of interest. Management of potential conflicts of interests has become increasingly complex as we expand our business activities through more numerous transactions, obligations and interests with and among our clients. The failure to adequately address, or the perceived failure to adequately address, conflicts of interest could affect the willingness of clients to deal with us, or give rise to litigation or enforcement actions, which could adversely affect our businesses.
Our actual or perceived failure to address these and other issues gives rise to reputational risk that could cause harm to us and our business prospects, including failure to properly address operational risks. Failure to appropriately address any of these issues could also give rise to additional regulatory restrictions, legal risks and reputational harm, which could, among other consequences, increase the size and number of litigation claims and damages asserted or subject us to enforcement actions, fines and penalties and cause us to incur related costs and expenses.
Our ability to attract and retain qualified employees is critical to the success of our business and failure to do so could hurt our business prospects and competitive position.
Our performance is heavily dependent on the talents and efforts of highly skilled individuals. Competition for qualified personnel within the financial services industry and from businesses outside the financial services industry has been, and is expected to continue to be, intense. Our competitors include non-U.S.-basednon-U.S. based institutions and institutions subject to different compensation and
hiring regulations than those imposed on U.S. institutions and financial institutions. The difficulty we face in competing for key personnel is exacerbated in emerging markets, where we are often
competing for qualified employees with entities that may have a significantly greater presence or more extensive experience in the region.
In order to attract and retain qualified personnel, we must provide market-level compensation. As a large financial and banking institution, we may be subject to limitations on compensation practices (which may or may not affect our competitors) by the Federal Reserve, the FDIC or other regulators around the world. AnyFor instance, recent EU rules limit and subject to clawback certain forms of variable compensation for senior employees. Current and potential future limitations on executive compensation imposed by legislation or regulation could adversely affect our ability to attract and maintain qualified employees. Furthermore, a substantial portion of our annual incentive compensation paid to our senior employees has in recent years taken the form of long-term equity awards. Therefore, the ultimate value of this compensation depends on the price of our common stock when the awards vest. If we are unable to continue to attract and retain qualified individuals, our business prospects and competitive position could be adversely affected.
In addition, if we fail to retain the wealth advisors that we employ in GWIMGlobal Wealth & Investment Management, particularly those with significant client relationships, such failure could result in a loss of clients or the withdrawal of significant client assets.
We may not be able to achieve expected cost savings from cost-saving initiatives or in accordance with currently anticipated time frames.
We are currently engaged in numerous efforts to achieve certain cost savings, including, among other things, Project New BAC. We currently expect our planned New BAC cost savings of $2 billion per quarter to be fully realized by mid-2015 and for our Legacy Assets and Servicing costs, excluding litigation costs, to decrease to approximately $1.1 billion per quarter by the fourth quarter of 2014. However, we may be unable to fully realize the cost savings and other anticipated benefits from our cost saving initiatives or in accordance with currently anticipated timeframes. In addition, our litigation expense may vary from period to period and may cause our noninterest expense to increase for any particular period even if we otherwise achieve the cost savings mentioned above.
Our inability to adapt our products and services to evolving industry standards and consumer preferences could harm our business.
Our business model is based on a diversified mix of business that provides a broad range of financial products and services, delivered through multiple distribution channels. Our success depends on our ability to adapt our products and services to evolving industry standards. There is increasing pressure by competitors to provide products and services at lower prices. This can reduce our net interest margin and revenues from our fee-based products and services. In addition, the widespread adoption
of new technologies, including internet services and payment systems, could require us to incur substantial expenditures to modify or adapt our existing products and services. We might not be successful in developing or introducing new products and services, responding or adapting to changes in consumer spending and saving habits, achieving market acceptance of our products and services, or sufficiently developing and maintaining loyal customers.
We may not be able to achieve expected cost savings from cost-saving initiatives or in accordance with currently anticipated time frames.
We are currently engaged in efforts to achieve cost savings. For example, we currently expect our Legacy Assets and Servicing costs, excluding litigation costs, to decrease to approximately $800 million per quarter by the end of 2015. We may be unable to fully realize the cost savings and other anticipated benefits from our cost saving initiatives or in accordance with currently anticipated timeframes. In addition, our litigation expense may vary from period to period and may cause our noninterest expense to increase for any particular period even if we otherwise achieve cost savings as the result of our cost savings initiatives or otherwise.
Risks Related to Risk Management
Our risk management framework may not be effective in mitigating risk and reducing the potential for losses.
Our risk management framework is designed to minimize risk and loss to us. We seek to identify, measure, monitor, report and control our exposure to the types of risk to which we are subject, including strategic, credit, market, liquidity, compliance, operational and reputational risks, among others. While we employ a broad and diversified set of risk monitoring and mitigation techniques, including hedging strategies and techniques that seek to balance our ability to profit from trading positions with our exposure to potential losses, those techniques are inherently limited because they cannot anticipate the existence or future development of currently unanticipated or unknown risks. The Volcker Rule may impact our ability to engage in certain hedging strategies. Recent economic conditions, heightened legislative and regulatory scrutiny of the financial services industry and increases in the overall complexity of our operations, among other developments, have resulted in a heightened level of risk for us. Accordingly, we could suffer losses as a result of our failure to properly anticipate and manage these risks.
For more information about our risk management policies and procedures, see Managing Risk in the MD&A on page 6155.
A failure in or breach of our operational or security systems or infrastructure, or those of third parties, with which we do business, including as a result of cyber attacks, could disrupt our businesses, result in the disclosure or misuseand adversely impact our results of confidential or proprietary information, damage our reputation, increase our costsoperations, cash flows, liquidity and financial condition, as well as cause losses.reputational harm.
Our businesses are highly dependent on our ability to process, record and monitor, on a continuous basis, a large number of transactions, many of which are highly complex, across numerous and diverse markets in many currencies. The potential for operational risk exposure exists throughout our organization and as a result of our interactions with third parties, and is not limited to operationsour operational functions. Operational risk exposures can impactOur operational and security systems, infrastructure, including our resultscomputer systems, data management, and internal processes, as well as those of operations, such as losses resulting from unauthorized trades bythird parties, are integral to our performance. In addition, we rely on our employees and their impact may extend beyond financial losses.
Integral to our performance is the continued efficacy of our internal processes, systems, relationships with third parties and the vast array of employees and key executives in our day-to-day and ongoing operations. With regardoperations, who may, as a result of human error or malfeasance or failure or breach of third-party systems or infrastructure, expose us to the physical infrastructure and systems that support our operations, werisk. We have taken measures to implement backup systems and other safeguards to support our operations, but our ability to conduct business may be adversely affected by any significant disruptions to us or to third parties with whom we interact. In addition, our ability to implement backup systems and widespread disruptionother safeguards with respect to third-party systems is more limited than with respect to our infrastructure orown systems. Our financial, accounting, data processing, backup or other operating or security systems and facilitiesinfrastructure may fail to operate properly or become disabled or damaged as a result of a number of factors including events that are wholly or partially beyond our control andwhich could adversely affect our ability to process these transactions or provide these services. There could be sudden increases in customer transaction volume; electrical, telecommunications or telecommunicationsother major physical infrastructure outages; natural disasters such as earthquakes, tornadoes, hurricanes and hurricanes;floods; disease pandemics; and events arising from local or larger scale political or social matters, including terrorist acts; and cyber attacks.acts. We continuously update these systems to support our operations and growth. This updating entails significant costs and creates risks associated with implementing new systems and integrating them with existing ones. Operational risk exposures could adversely impact our results of operations, cash flows, liquidity and financial condition, as well as cause reputational harm.
A cyber attack, information or security breach, or a technology failure of ours or of a third party could adversely affect our ability to conduct our business, manage our exposure to risk or expand our businesses, result in the disclosure or misuse of confidential or proprietary information, increase our costs to maintain and update our operational and security systems and infrastructure, and adversely impact our results of operations, cash flows, liquidity and financial condition, as well as cause reputational harm.
Our businesses are highly dependent on the security and efficacy of our infrastructure, computer and data management systems, as well as those of third parties with whom we interact. Cyber security risks for large financial institutions like us have significantly increased in recent years in part because of the proliferation of new technologies, the use of the Internet and telecommunications technologies to conduct financial transactions, and the increased sophistication and activities of organized crime, hackers, terrorists and other external parties, including foreign state actors. Our operationsbusinesses rely on the secure processing, transmission, storage and storageretrieval of confidential, proprietary and other information in our computer and data management systems and networks. Our banking, brokerage, investment advisorynetworks, and capital markets businessesin the computer and data management systems and networks of third parties. We rely on our digital technologies, computer, database and email systems, software, and networks to conduct theirour operations. In addition, to access our network, products and services, our customers and other third parties may use personal smartphones, PCs and othermobile devices or computing devices, tablet PCs and other mobile devices that are beyondoutside of our control systems. Our technologies, systems, networksnetwork environment. We, our customers, regulators and our customers’ devicesother third parties have been subject to, and are likely to continue to be the target of, cyber attacks, including computer viruses, malicious or destructive code, phishing attacks, denial of service or information or other security breaches, that could result in the unauthorized release, gathering, monitoring, misuse, loss or destruction of confidential, proprietary and other information of the Corporation, our employees, or our customers or of third parties, or otherwise materially disrupt our or our customers’ or other third parties’ network access or business operations. For example, our websitesin recent years, we have been subject to a series ofmalicious activity, including distributed denial of service attacks. Additionally, several large retailers have disclosed substantial cyber security incidents.breaches affecting debit and credit card accounts of their customers, some of whom were our cardholders. Although these incidents have not, to date, had a material impact on Bank of America, nor have they resulted in unauthorized access to our or our customers’ confidential, proprietary or other information, because of our prominence,us, we believe that such incidents may continue.will continue, and we are unable to predict the severity of such future attacks on us. Our counterparties, regulators, customers and clients, and other third parties with whom we or our customers and clients interact are exposed to similar incidents, and incidents affecting those third parties could impact us.
Although to date we have not experienced any material losses or other material consequences relating to technology failure, cyber attacks or other information or other security breaches, there can be no assurance that we will not suffer such losses or other consequences in the future. Our risk and exposure to these matters remains
heightened because of, among other things, the evolving nature of these threats, our prominent size and scale, and our role in the financial services industry and the broader economy, our plans to continue to implement our internet banking and mobile banking channel strategies and develop additional remote connectivity solutions to serve our customers when and how they want to be served, our continuous transmission of sensitive information to, and storage of such information by, third
parties, including our vendors and regulators, our expanded geographic footprint and international presence, the outsourcing of some of our business operations, the continued uncertain global economic environment, threats of cyberterrorism,cyber terrorism, external extremist parties, including foreign state actors, in some circumstances as a means to promote political ends, and system and customer account updates and conversions. As a result, cybersecuritycyber security and the continued development and enhancement of our controls, processes and practices designed to protect our systems, computers, software, data and networks from attack, damage or unauthorized access remain a priority for us. As cyber threats continue to evolve, we may be required to expend significant additional resources to continue to modify or enhance our protective measures or to investigate and remediate any information security vulnerabilities.vulnerabilities or incidents.
In addition, weWe also face the risk ofindirect technology, cyber security and operational failure, termination or capacity constraints of any ofrisks relating to the third parties with whichwhom we do business or thatupon whom we rely to facilitate or enable our business activities, includingactivities. In addition to customers and clients, the third parties with whom we interact and upon whom we rely include financial counterparties; financial intermediaries such as clearing agents, exchanges and clearing houseshouses; vendors; regulators; providers of critical infrastructure such as internet access and electrical power, and retailers for whom we process transactions. Each of these third parties faces the risk of cyber attack, information breach or loss, or technology failure. Any such cyber attack, information breach or loss, or technology failure of a third party could, among other things, adversely affect our ability to effect transactions, service our clients, manage our exposure to risk or expand our businesses. As a result of financial entities and technology systems becoming more interdependent and complex, a cyber incident, information breach or loss, or technology failure that significantly degrades, deletes or compromises the systems or data of one or more financial entities could have a material impact on counterparties or other financial intermediaries we use to facilitate our securities transactions. Inmarket participants, including the Corporation. For example, in recent years, there has been significant consolidation among clearing agents, exchanges and clearing houses and increased interconnectivity of multiple financial institutions with central agents, exchanges and clearing houses. This consolidation and interconnectivity increases the risk of operational failure, on both individual and industry-wide bases, as disparate complex systems need to be integrated, often on an accelerated basis. Any such cyber attack, information breach or loss, failure, termination or constraint could, among other things, adversely affect our ability to effect transactions, service our clients, manage our exposure to risk or expand our businesses, and could have an adverse impact on our liquidity, financial condition and results of operations.businesses.
Disruptions or failures in the physical infrastructure or operating systems that support our businesses and customers, or cyber attacks or security breachesAny of the networks, systems or devices that our customers use to access our products and servicesmatters discussed above could result in theour loss of customers and business opportunities, significant business disruption to the Corporation’sour operations and business, misappropriation or destruction of the Corporation’sour confidential information and/or that of itsour customers, or damage to the Corporation’sour customers’ and/or third parties’ computers or systems, and/or those of its customers and/or counterparties, and could result in violationsa violation of applicable privacy laws and other laws, litigation exposure, regulatory fines, penalties or intervention, loss of confidence in the Corporation’sour security measures, reputational damage, reimbursement or other compensatory costs, and additional compliance costs.
For more information on operational risks In addition, any of the matters described above could adversely impact our results of operations, cash flows, liquidity and our operational risk management, see Operational Risk Management in the MD&A on page 116.financial condition.
|
| | |
1817 Bank of America 20132014
| | |
Risk of Being an International Business
We are subject to numerous political, economic, market, reputational, operational, legal, regulatory and other risks in the non-U.S. jurisdictions in which we operate.
We do business throughout the world, including in developing regions of the world commonly known as emerging markets. Our businesses and revenues derived from non-U.S. jurisdictions are subject to risk of loss from currency fluctuations, social or judicial instability, changes in governmental policies or policies of central banks, expropriation, nationalization and/or confiscation of assets, price controls, capital controls, exchange controls, other restrictive actions, unfavorable political and diplomatic developments, oil price fluctuation and changes in legislation. These risks are especially acuteelevated in emerging markets. A number of non-U.S. jurisdictions in which we do business have been negatively impacted by slowing growth rates or recessionary conditions, market volatility and/or political unrest. Several emerging market economies are particularly vulnerable to the impact of rising interest rates, inflationary pressures, weaker oil and other commodity prices, large external deficits, and political uncertainty. While some of these jurisdictions are showing signs of stabilization or recovery, others, such as Russia and Greece, continue to experience increasing levels of stress and volatility. In addition, the potential risk of default on sovereign debt in some non-U.S. jurisdictions could expose us to substantial losses. Risks in one country can limit our opportunities for portfolio growth and negatively affect our operations in another country or countries, including our operations in the U.S. As a result, any such unfavorable conditions or developments could have an adverse impact on our company.
Our non-U.S. businesses are also subject to extensive regulation by various regulators, including governments, securities exchanges, central banks and other regulatory bodies, in the jurisdictions in which those businesses operate. In many countries, the laws and regulations applicable to the financial services and securities industries are uncertain and evolving, and it may be difficult for us to determine the exact requirements of local laws in every market or manage our relationships with multiple regulators in various jurisdictions. Our potential inability to remain in compliance with local laws in a particular market and manage our relationships with regulators could have an adverse effect not only on our businesses in that market but also on our reputation generally.
We also invest or trade in the securities of corporations and governments located in non-U.S. jurisdictions, including emerging markets. Revenues from the trading of non-U.S. securities may be subject to negative fluctuations as a result of the above factors. Furthermore, the impact of these fluctuations could be magnified, because non-U.S. trading markets, particularly in emerging market countries, are generally smaller, less liquid and more volatile than U.S. trading markets.
In addition to non-U.S. legislation, our international operations are also subject to U.S. legal requirements. For example, our
international operations are subject to U.S. laws on foreign corrupt practices, the Office of Foreign Assets Control, and anti-money laundering regulations.
We are subject to geopolitical risks, including acts or threats of terrorism, and actions taken by the U.S. or other governments in response thereto and/or military conflicts, which could adversely affect business and economic conditions abroad as well as in the U.S.
For more information on our non-U.S. credit and trading portfolios, see Non-U.S. Portfolio in the MD&A on page 100.93.
Risk from Accounting Changes
Changes in accounting standards or inaccurate estimates or assumptions in applying accounting policies could adversely affect us.
Our accounting policies and methods are fundamental to how we record and report our financial condition and results of operations. Some of these policies require use of estimates and assumptions that may affect the reported value of our assets or liabilities and results of operations and are critical because they require management to make difficult, subjective and complex judgments about matters that are inherently uncertain. If those assumptions, estimates or judgments were incorrectly made, we could be required to correct and restate prior periodprior-period financial statements. Accounting standard-setters and those who interpret the accounting standards (such as the Financial Accounting Standards Board (FASB), the SEC, banking regulators and our independent registered public accounting firm) may also amend or even reverse their previous interpretations or positions on how various standards should be applied. These changes may be difficult to predict and could impact how we prepare and report our financial statements. In some cases, we could be required to apply a new or revised standard retroactively, resulting in the Corporation needing to revise and republish prior periodprior-period financial statements.
The FASB issued on December 20,in 2012 a proposed standard on accounting for credit losses. The standard would replace multiple existing impairment models, including replacing an “incurred loss” model for loans with an “expected loss” model. The FASB announced it will establish thehas not yet established a proposed effective date when it issues the final standard. We cannot predict whether or whenbut a final standard willis expected to be issued when it will be effective or what its final provisions will be.in the second half of 2015. The final standard may materially reduce retained earnings in the period of adoption.
For more information on some of our critical accounting policies and standards and recent accounting changes, see Complex Accounting Estimates in the MD&A on page 117109 and Note 1 – Summary of Significant Accounting Principles to the Consolidated Financial Statements.
Item 1B. Unresolved Staff Comments
None
|
| | |
| | | Bank of America 20132014 1918 |
Item 2. Properties
As of December 31, 20132014, our principal offices and other materially important properties consisted of the following:
|
| | | | | | | | | | |
| | | | | | | | | | | |
| Facility Name | | Location | | General Character of the Physical Property | | Primary Business Segment | | Property Status | | Property Square Feet (1) |
| Bank of America Corporate Center | | Charlotte, NC | | 60 Story Building | | Principal Executive Offices | | Owned | | 1,200,392 |
| Bank of America Tower at One Bryant Park | | New York, NY | | 5455 Story Building | | GWIM, Global Banking and Global Markets | | Leased (2) | | 1,798,373 |
Bank of America Merrill Lynch Financial Centre
| | London, UK | | 4 Building Campus | | GWIM, Global Bankingand
Global Markets | | Leased | | 563,944568,032 |
Nihonbashi 1-Chome BuildingCheung Kong Center | | Tokyo, JapanHong Kong | | 2462 Story Building | | Global Banking and Global Markets | | Leased | | 186,901149,790 |
| |
(1) | For leased properties, property square feet represents the square footage occupied by the Corporation. |
| |
(2) | The Corporation has a 49.9 percent joint venture interest in this property. |
We own or lease approximately 100.290.5 million square feet in 23,29722,530 facility and ATM locations globally, including approximately 93.384.3 million square feet in the U.S. (all 50 U.S. states and the District of Columbia, the U.S. Virgin Islands and Puerto Rico) and approximately 6.96.2 million square feet in more than 4035 countries.
We believe our owned and leased properties are adequate for our business needs and are well maintained. We continue to evaluate our owned and leased real estate and may determine from time to time that certain of our premises and facilities, or ownership structures, are no longer necessary for our operations. In connection therewith, we are evaluating the sale or sale/leaseback of certain properties and we may incur costs in connection with any such transactions.
Item 3. Legal Proceedings
See Litigation and Regulatory Matters in Note 12 – Commitments and Contingencies to the Consolidated Financial Statements, which is incorporated herein by reference.
Item 4. Mine Safety Disclosures
None
|
| | |
2019 Bank of America 20132014
| | |
Part II
Bank of America Corporation and Subsidiaries
Item 5. Market for Registrant’s Common Equity, Related Stockholder Matters and Issuer Purchases of Equity Securities
The principal market on which our common stock is traded is the New York Stock Exchange. Our common stock is also listed on the London Stock Exchange, and certain shares are listed on the Tokyo Stock Exchange. As of February 24, 2015, there were 203,715 registered shareholders of common stock. The table below sets forth the high and low closing sales prices of the common stock on the New York Stock Exchange for the periods indicated:indicated during 2013 and 2014, as well as the dividends we paid on a quarterly basis:
|
| | | | | | | | | | |
| | | | | | | |
| | | Quarter | | High | | Low |
| 2012 | | first | | $ | 9.93 |
| | $ | 5.80 |
|
| | | second | | 9.68 |
| | 6.83 |
|
| | | third | | 9.55 |
| | 7.04 |
|
| | | fourth | | 11.61 |
| | 8.93 |
|
| 2013 | | first | | 12.78 |
| | 11.03 |
|
| | | second | | 13.83 |
| | 11.44 |
|
| | | third | | 14.95 |
| | 12.83 |
|
| | | fourth | | 15.88 |
| | 13.69 |
|
As of February 24, 2014, there were 215,755 registered shareholders of common stock. During 2012 and 2013, we paid dividends on the common stock on a quarterly basis.
The table below sets forth dividends paid per share of our common stock for the periods indicated:
| | | | | | |
| | Quarter | Dividend | |
| 2012 | first | $ | 0.01 |
| |
| | second | 0.01 |
| | | | | | | | |
| | third | 0.01 |
| | | | | | |
| | fourth | 0.01 |
| Quarter | | High | | Low | | Dividend |
| 2013 | first | 0.01 |
| first | | $ | 12.78 |
| | $ | 11.03 |
| | $ | 0.01 |
|
| | second | 0.01 |
| second | | 13.83 |
| | 11.44 |
| | 0.01 |
|
| | third | 0.01 |
| third | | 14.95 |
| | 12.83 |
| | 0.01 |
|
| | fourth | 0.01 |
| fourth | | 15.88 |
| | 13.69 |
| | 0.01 |
|
| 2014 | | first | | 17.92 |
| | 16.10 |
| | 0.01 |
|
| | | second | | 17.34 |
| | 14.51 |
| | 0.01 |
|
| | | third | | 17.18 |
| | 14.98 |
| | 0.05 |
|
| | | fourth | | 18.13 |
| | 15.76 |
| | 0.05 |
|
For more information regarding our ability to pay dividends, see Note 13 – Shareholders’ Equity and Note 16 – Regulatory Requirements and Restrictionsto the Consolidated Financial Statements,, which are incorporated herein by reference.
For information on our equity compensation plans, see Note 18 – Stock-based Compensation Plansto the Consolidated Financial Statements and Item 12 on page 285270 of this report, which are incorporated herein by reference.
The table below presents share repurchase activity for the three months ended December 31, 2013.2014. We did not have any unregistered sales of our equity securities in 2013.2014.
|
| | | | | | | | | | | | | |
| | | | | | | | |
| (Dollars in millions, except per share information; shares in thousands) | Common Shares Repurchased (1) | | Weighted-Average Per Share Price | | Shares Purchased as
Part of Publicly
Announced Programs | | Remaining Buyback Authority Amounts (2) |
| October 1 - 31, 2013 | 23,734 |
| | $ | 14.39 |
| | 23,403 |
| | $ | 2,794 |
|
| November 1 - 30, 2013 | 57,961 |
| | 14.55 |
| | 57,894 |
| | 1,951 |
|
| December 1 - 31, 2013 | 10,840 |
| | 15.88 |
| | 10,800 |
| | 1,780 |
|
| Three months ended December 31, 2013 | 92,535 |
| | 14.67 |
| | |
| | |
|
|
| | | | | | | | | | | | | |
| | | | | | | | |
| (Dollars in millions, except per share information; shares in thousands) | Common Shares Repurchased (1) | | Weighted-Average Per Share Price | | Shares Purchased as
Part of Publicly
Announced Programs | | Remaining Buyback Authority Amounts (2) |
| October 1 - 31, 2014 | 339 |
| | $ | 17.29 |
| | — |
| | $ | 3,767 |
|
| November 1 - 30, 2014 | 73 |
| | 17.15 |
| | — |
| | 3,767 |
|
| December 1 - 31, 2014 | 32 |
| | 16.97 |
| | — |
| | 3,767 |
|
| Three months ended December 31, 2014 | 444 |
| | 17.24 |
| | |
| | |
|
| |
(1) | Includes shares of the Corporation’s common stock acquired by the Corporation in connection with satisfaction of tax withholding obligations on vested restricted stock or restricted stock units and certain forfeitures and terminations of employment-related awards under equity incentive plans. |
| |
(2) | On March 14, 2013,26, 2014, the Corporation announced that the Federal Reserve had informed the Corporation that it completed its 2014 Comprehensive Capital Analysis and Review and did not object to the Corporation’s 2014 capital plan, which included a request to repurchase up to $4.0 billion of common stock over four quarters beginning in the second quarter of 2014. On March 26, 2014, the Corporation’s Board of Directors authorized the repurchase of up to $5.0$4.0 billion of the Corporation’s common stock through open market purchases or privately negotiated transactions, including Rule 10b5-1 plans, over four quarters beginning with the second quarter of 2013. For additional information, see Capital Management – Regulatory Capital2014. On April 28, 2014, the Corporation announced the suspension of the repurchase authorization previously announced on page 65 and Note 13 – Shareholders’ EquityMarch 26, 2014. On May 27, 2014, the Corporation submitted a revised 2014 capital plan to the Consolidated Financial StatementsFederal Reserve that included no additional repurchases of common stock through the end of the first quarter of 2015 (excluding approximately $233 million of repurchases prior to April 27, 2014). On August 6, 2014, the Federal Reserve notified the Corporation that it did not object to the revised 2014 capital plan. Amounts shown in the column reflect remaining buyback authority under the March 26, 2014 authorization; however, the Corporation will not repurchase any shares of common stock pursuant to such authorization without prior approval by the Federal Reserve. |
Item 6. Selected Financial Data
See Table 7 in the MD&A on page 3130 and Statistical Table XII of the Statistical Tables in the MD&A on page 138,129, which are incorporated herein by reference.
|
| | |
| | | Bank of America 20132014 2120 |
|
| | | | |
Item 7. Bank of America Corporation and Subsidiaries Management’s Discussion and Analysis of Financial Condition and Results of OperationsOperation |
|
|
| | |
2221 Bank of America 20132014
| | |
Management’s Discussion and Analysis of Financial Condition and Results of Operations
The Annual Report on Form 10-K,This report, the documents that it incorporates by reference and the documents into which it may be incorporated by reference may contain, and from time to time Bank of America Corporation (collectively with its subsidiaries, the Corporation) and its management may make certain statements that constitute forward-looking statements within the meaning of the Private Securities Litigation Reform Act of 1995. These statements can be identified by the fact that they do not relate strictly to historical or current facts. Forward-looking statements often use words such as “anticipates,” “targets,” “expects,” “anticipates,” “believes,“hopes,” “estimates,” “targets,” “intends,” “plans,” “goal”“goal,” “believes,” “continue” and other similar expressions or future or conditional verbs such as “will,” “may,” “might,” “should,” “would” and “could.” The forward-looking statements made represent the Corporation’s current expectations, plans or forecasts of the Corporation regarding the Corporation’sits future results and revenues, and future business and economic conditions more generally, and other future matters. These statements are not guarantees of future results or performance and involve certain known and unknown risks, uncertainties and assumptions that are difficult to predict and are often beyond the Corporation’sCorporation’s control. Actual outcomes and results may differ materially from those expressed in, or implied by, any of these forward-looking statements.
You should not place undue reliance on any forward-looking statement and should consider the following uncertainties and risks, as well as the risks and uncertainties more fully discussed elsewhere in this report, including under Item 1A. Risk Factors of this reportAnnual Report on Form 10-K and in any of the Corporation’s subsequent Securities and Exchange Commission filings:filings for further information about factors that could affect such forward-looking statements: the Corporation’sCorporation’s ability to resolve representations and warranties repurchase claims made by monolines and private-label and other investors, including as a result of any adverse court rulings, and the chance that the Corporation could face related servicing, securities, fraud, indemnity or other claims from one or more of the government-sponsored enterprises,counterparties, including monolines or private-label and other investors; the possibility that final court approval of negotiated settlements is not obtained;obtained, including the possibility that the court decision with respect to the BNY Mellon Settlement is appealed and overturned on appeal in whole or in part; the possibility that future representations and warranties losses may occur in excess of the Corporation’sCorporation’s recorded liability and estimated range of possible loss for its representations and warranties exposures; the possibility that the Corporation may not collect mortgage insurance claims; potential claims, damages, penalties, fines and reputational damage resulting from pending or future litigation and regulatory proceedings, including the possibility that amounts may be in excess of the Corporation’s recorded liability and estimated range of possible losses for litigation exposures; the possibility that the
European Commission will impose remedial measures in relation to its investigation of the Corporation’s competitive practices; the possible impactoutcome of a future FASB standard on accounting for credit losses;LIBOR, other reference rate and foreign exchange inquiries and investigations; uncertainties about the financial stability and growth rates of non-U.S. jurisdictions, the risk that those jurisdictions may face difficulties servicing their sovereign debt, and related stresses on financial markets, currencies and trade, and the Corporation’sCorporation’s exposures to such risks, including direct, indirect and operational; uncertainties related to the timing and pace of Federal Reserve tapering of quantitative easing, and the impact onof U.S. and global interest rates, currency exchange rates and economic conditions in a number of countries; the possibility of
future inquiries or investigations regarding pending or completed foreclosure activities; the possibility that unexpected foreclosure delays could impact the rate of decline of default-related servicing costs; uncertainty regarding timing and the potential impact of regulatory capital and liquidity requirements (including Basel 3);conditions; the negative impact of the Dodd-Frank Wall Street Reform and Consumer Protection Act on the Corporation’s businessesCorporation’s business and earnings, including as a result of additional regulatory interpretationinterpretations and rulemaking and the success of the Corporation’sCorporation’s actions to mitigate such impacts; the potential impact of a prolonged low interest rate environment on debit card interchange fee revenue in connection with the U.S. District Court for the DistrictCorporation’s business, financial condition and results of Columbia’s ruling on July 31, 2013 regarding the Federal Reserve’s rules implementing the Financial Reform Act’s Durbin Amendment; the potential impact of implementing and conforming to the Volcker Rule; the potential impact of future derivative regulations;operations; adverse changes to the Corporation’sCorporation’s credit ratings from the major credit rating agencies; estimates of the fair value of certain of the Corporation’sCorporation’s assets and liabilities; reputational damage that may result from negative publicity, finesuncertainty regarding the content, timing and penalties from regulatory violations and judicial proceedings; the possibility that the European Commission will impose remedial measures in relation to its investigation of the Corporation’s competitive practices; the impact of potential regulatory enforcement action relatingcapital and liquidity requirements, including, but not limited to, optional identity theft protection services and certain optional credit card debt cancellation products; unexpected claims, damages, penalties and fines resulting from pendingany GSIB surcharge or future litigation and regulatory proceedings, including proceedings instituted byas a result of changes to our Basel 3 Advanced approaches estimates; the U.S. Department of Justice, state Attorneys General and other members of the RMBS Working Group of the Financial Fraud Enforcement Task Force; the Corporation’sCorporation’s ability to fully realize the cost savings and other anticipated benefits from Project New BAC,cost-saving initiatives, including in accordance with currently anticipated timeframes;timeframes, the impact of implementation and compliance with new and evolving U.S. and international regulations, including, but not limited to, recovery and resolution planning requirements, the Volcker Rule, and derivatives regulations; the potential impact of the U.K. tax authorities’ proposal to limit how much NOLs can offset annual profit; a failure in or breach of the Corporation’s operational or security systems or infrastructure, or those of third parties with whichwhom we do business, including as a result of cyber attacks; the impact on the Corporation’s business, financial condition and results of operations of a potential higher interest rate environment; and other similar matters.
Forward-looking statements speak only as of the date they are made, and the Corporation undertakes no obligation to update any forward-looking statement to reflect the impact of circumstances or events that arise after the date the forward-looking statement was made.
Notes to the Consolidated Financial Statements referred to in the Management’s Discussion and Analysis of Financial Condition and Results of Operations (MD&A) are incorporated by reference into the MD&A. Certain prior-periodprior-year amounts have been reclassified to conform to current periodcurrent-year presentation. Throughout the MD&A, the Corporation uses certain acronyms and abbreviations which are defined in the Glossary.
|
| | |
| | | Bank of America 20132014 2322 |
Executive Summary
Business Overview
The Corporation is a Delaware corporation, a bank holding company (BHC) and a financial holding company. When used in this report, “the Corporation” may refer to Bank of America Corporation individually, Bank of America Corporation and its subsidiaries, or certain of Bank of America Corporation’s subsidiaries or affiliates. Our principal executive offices are located in Charlotte, North Carolina. Through our banking and various nonbankingnonbank subsidiaries throughout the U.S. and in international markets, we provide a diversified range of banking and nonbankingnonbank financial services and products through five business segments: Consumer & Business Banking (CBB), Consumer Real Estate Services (CRES), Global Wealth & Investment Management (GWIM), Global Banking and Global Markets, with the remaining operations recorded in All Other. We operateEffective January 1, 2015, to align the segments with how we manage the businesses in 2015, we changed our basis of segment presentation as follows: the Home Loans subsegment within CRES was moved to CBB, and Legacy Assets & Servicing became a separate segment. Also, a portion of the Business Banking business, based on the size of the client relationship, was moved from CBB to Global Banking. Prior periods will be restated to conform to the new segment alignment. Prior to October 1, 2014, we operated our banking activities primarily under two national bank charters: Bank of America, National Association (Bank of America, N.A. or BANA) and, to a lesser extent, FIA Card Services, National Association (FIA Card Services, N.A. or FIA). On October 1, 2013, we completed the merger of our Merrill Lynch & Co., Inc. (Merrill Lynch) subsidiary2014, FIA was merged into Bank of America Corporation. This merger had no effect on the Merrill Lynch name or brand and is not expected to have any effect on customers or clients.BANA. At December 31, 20132014, the Corporation had approximately $2.1 trillion in assets and approximately 242,000224,000 full-time equivalent employees.
As of December 31, 20132014, we operated in all 50 states, the District of Columbia, the U.S. Virgin Islands, Puerto Rico and more than 4035 countries. Our retail banking footprint covers approximately 80 percent of the U.S. population and we serve approximately 5048 million consumer and small business relationships with approximately 5,1004,800 banking centers, 16,30015,800 ATMs, nationwide call centers, and leading online (www.bankofamerica.com) and mobile banking platforms.platforms (www.bankofamerica.com). We offer industry-leading support to more thanapproximately three million small business owners. Our industry leading wealth management and trust businesses, with client balances of $2.5 trillion, provide tailored solutions to meet client needs through a full set of brokerage, banking, trust and retirement products. We are a global leader in corporate and investment banking and trading across a broad range of asset classes serving corporations, governments, institutions and individuals around the world.
20132014 Economic and Business Environment
In the U.S., economic growth continued in 20132014, ending the year in the midst of its fifthsixth consecutive year of recovery. However,After a tentative and generally soft trajectory for five years where annualized GDP growth averaged 2.3 percent, there were clear
signs of accelerated growth in the year ended amid uncertainty as to whether the upward trend in economic performance would continue into 2014.final three quarters of 2014 following a first quarter impacted by adverse weather conditions. Employment gains were generally steady but moderate,picked up during the year, and the unemployment rate fell to 6.75.6 percent at year end, butend. Consumption grew slowly early in the year, before picking up steadily and ending with significant contribution from a declining labor force participation rate. Retail sales grew at a solidrobust pace through most ofin the final quarter. Core inflation remained relatively unchanged in 20132014, and following extreme weakness through mid-2013, service spending also displayed a modest rebound laterising modestly in the year. Core inflation fell in 2013 to
almostfirst half and falling thereafter, and ended the year more than half a full percentage point below the Board of Governors of the Federal Reserve System’s (Federal Reserve) longer-term annual target of two percent.
U.S. household net worth increased significantlycontinued to rise in 20132014. but at a substantially slower pace than 2013. Home price appreciation was less in 2014 than 2013 but prices still rose approximately 12five percent in 20132014, but showed signs of deceleration while equity markets gained approximately 11 percent. However, consumer spending was more significantly enhanced by sharply lower oil prices late in the year, reflecting foreign economic weakness amid an ample and equity markets surged. growing energy supply.
U.S. Treasury yields rosefell over the course of the year, amid expectations thatreversing much of the previous year’s increase. Declining world inflation and interest rates helped push U.S. Treasury yields lower even as the Federal Reserve would adjust the pace ofsteadily reduced and finally ended its purchases of agency mortgage-backed securities (MBS) and long-term U.S. Treasury securities if economic progress was sustained.
Despite a partial federal government shutdown in October, the impact on U.S. economic performance was minimal.securities. The Federal Reserve announcedended the year amid indications that it would begincan be patient with regard to reduce its securities purchases early in 2014, but would not raise its federal funds rate target until significantly afternormalizing monetary policy.
Internationally, the unemployment rate reached its 6.5 percent threshold. By year end, the U.S. Congress agreed on a two-year budget framework that reduced fiscal uncertainty, and pending implementation, restored someeurozone grew modestly for much of the planned federal sequester spending for 2014.
Internationally, Europe experienced significant economic improvementyear, with growth restrained by continued deleveraging of the financial sector, high unemployment and political uncertainty. Inflation in 2013.the eurozone also fell significantly to near zero by year end. European financial anxieties eased, reflected in sustained narrowing of bond spreads, followingyields continued to decline, especially as the European Central Bank’s 2012 assertion of its role as lender of last resort. Economic performance also improved, with the long six-quarter recessionBank eased monetary policy and expectations grew late in the year for outright purchases of sovereign and/or corporate securities in 2015, and were subsequently confirmed to begin in March 2015. The Euro/U.S. Dollar exchange rate also fell significantly, boosting European Union ending in the second quarter of 2013, followed by modest growth and varied performancecompetitiveness, particularly in the second half of 2014, in direct reaction to the year.differing directions of U.S. and eurozone monetary policies. Contentious negotiations between parties to Greek sovereign and bank support programs added to uncertainty and market volatility in the first quarter of 2015.
Monetary policies in Japan combined withIn Russia, the sharp depreciationcombination of the yen led to moderate economic expansionU.S. and European Union sanctions and sharply lower oil prices weakened growth. Select emerging nations that are net energy suppliers also saw growth diminish sharply, although other nations, including some emerging economies in 2013, butAsia received some benefits from declining energy prices.
Following a quarter of strong economic growth diminishedahead of a consumption tax increase, Japan contracted through the middle of the year and the Bank of Japan responded with stepped up quantitative easing. Amid gradual economic moderation, China also eased monetary policy late in the second half of 2013. In Japan, inflation rose gradually during the year, exceeding one percent annualized by year end. However, doubts remained about the sustainability of economic improvement in Japan in the absence of clear plans for long-run economic reform. As China’s government focused on issues beyond simply maximizing economic growth, China’s gross domestic product growth in 2013 decelerated.
Additionally, growth rates in a number of emerging nations have decreased, while select countries are also dealing with greater social and political unrest and capital markets volatility. Following the announcement of the Federal Reserve’s intent to reduce securities purchases in mid-2013, investors increased withdrawals of capital from certain emerging market countries, impacting interest rates, foreign exchange rates and credit spreads. These trends intensified as the Federal Reserve initiated its securities purchases tapering actions in January 2014, and investors became more concerned about the implications of a slowing Chinese economy on its key trading partners. For more information on our international exposure, see Non-U.S. Portfolio on page 100.year.
|
| | |
2423 Bank of America 20132014
| | |
Recent Events
BNY Mellon Settlement
In the first quarter of 2014, the New York Supreme Court entered final judgment approving the BNY Mellon Settlement. The court overruled the objections to the settlement, holding that the Trustee, BNY Mellon, acted in good faith, within its discretion and within the bounds of reasonableness in determining that the settlement agreement was in the best interests of the covered trusts. The court declined to approve the Trustee’s conduct only with respect to the Trustee’s consideration of a potential claim that a loan must be repurchased if the servicer modifies its terms. The court’s January 31, 2014 decision, order and judgment remain subject to appeal and the motion to reargue, and it is not possible to predict the timetable for appeals or when the court approval process will be completed. For additional information, including a description of the BNY Mellon Settlement, see Note 7 – Representations and Warranties Obligations and Corporate Guarantees to the Consolidated Financial Statements.
Capital and Liquidity Related Matters
In July 2013, U.S. banking regulators approved final Basel 3 Regulatory Capital rules (Basel 3) which became effective January 1, 2014. Basel 3 generally continues to be subject to interpretation by the U.S. banking regulators. Basel 3 also will require us to calculate a supplementary leverage ratio. For additional information, see Capital Management – Regulatory Capital Changes on page 68.
The Basel Committee on Banking Supervision (Basel Committee) issued two liquidity risk-related standards that are considered part of Basel 3: the Liquidity Coverage Ratio (LCR) and the Net Stable Funding Ratio (NSFR). For additional information, see Liquidity Risk – Basel 3 Liquidity Standards on page 73.
Freddie Mac Settlement
On November 27, 2013, we entered into an agreement with Freddie Mac (FHLMC) under which we paid FHLMC a total of $404 million (less credits of $13 million) to resolve all outstanding and potential mortgage repurchase and make-whole claims arising out of any alleged breach of selling representations and warranties related to loans that had been sold directly to FHLMC by entities related to Bank of America, N.A. from January 1, 2000 to December 31, 2009, and to compensate FHLMC for certain past losses and potential future losses relating to denials, rescissions and cancellations of mortgage insurance (MI).
In 2010, we had entered into an agreement with FHLMC to resolve all outstanding and potential representations and warranties claims related to loans sold by Countrywide Financial Corporation (Countrywide) to FHLMC through 2008.
With these agreements, combined with prior settlements with Fannie Mae (FNMA), Bank of America has resolved substantially all outstanding and potential representations and warranties claims on whole loans sold by legacy Bank of America and Countrywide to FNMA and FHLMC through 2008 and 2009, respectively, subject to certain exceptions which we do not believe are material.
For additional information, see Note 7 – Representations and Warranties Obligations and Corporate Guarantees to the Consolidated Financial Statements.
Common Stock Repurchases and Liability Management Actions
As disclosed in prior filings, the capital plan that the Corporation submitted to the Federal Reserve in January 2013 pursuant to the 2013 Comprehensive Capital Analysis and Review (CCAR), included a request to repurchase up to $5.0 billion of common stock and redeem $5.5 billion in preferred stock over four quarters beginning in the second quarter of 2013, and continue the quarterly common stock dividend at $0.01 per share. During 2013, we repurchased and retired 231.7 million common shares for an aggregate purchase price of approximately $3.2 billion and redeemed our Series H and 8 preferred stock for $5.5 billion. As of December 31, 2013, under the capital plan, we can purchase up to $1.8 billion of additional common stock through the first quarter of 2014.
In addition to the CCAR actions, during 2013, we redeemed certain of our preferred stock for $1.0 billion and issued $1.0 billion of our Fixed-to-Floating Rate Semi-annual Non-Cumulative Preferred Stock, Series U. For additional information, see Capital Management – Regulatory Capital on page 65 and Note 13 – Shareholders’ Equity to the Consolidated Financial Statements.
During 2013, we repurchased certain of our debt and trust preferred securities with an aggregate carrying value of $10.1 billion for $10.2 billion in cash.
We may conduct additional redemptions, tender offers, exercises and other transactions in the future depending on prevailing market conditions, capital, liquidity and other factors.
Selected Financial Data
Table 1 provides selected consolidated financial data for 20132014 and 20122013.
| | | | | | | |
| Table 1 | Selected Financial Data | | Selected Financial Data | |
| | | | | |
| (Dollars in millions, except per share information) | (Dollars in millions, except per share information) | 2013 | 2012 | (Dollars in millions, except per share information) | 2014 | 2013 |
| Income statement | Income statement | |
| |
| Income statement | |
| |
|
Revenue, net of interest expense (FTE basis) (1) | Revenue, net of interest expense (FTE basis) (1) | $ | 89,801 |
| $ | 84,235 |
| Revenue, net of interest expense (FTE basis) (1) | $ | 85,116 |
| $ | 89,801 |
|
| Net income | Net income | 11,431 |
| 4,188 |
| Net income | 4,833 |
| 11,431 |
|
| Diluted earnings per common share | Diluted earnings per common share | 0.90 |
| 0.25 |
| Diluted earnings per common share | 0.36 |
| 0.90 |
|
| Dividends paid per common share | Dividends paid per common share | 0.04 |
| 0.04 |
| Dividends paid per common share | 0.12 |
| 0.04 |
|
| Performance ratios | Performance ratios | |
| |
| Performance ratios | |
| |
|
| Return on average assets | Return on average assets | 0.53 | % | 0.19 | % | Return on average assets | 0.23 | % | 0.53 | % |
Return on average tangible shareholders’ equity (1) | 7.13 |
| 2.60 |
| |
Return on average tangible common shareholders’ equity (1) | | Return on average tangible common shareholders’ equity (1) | 2.52 |
| 6.97 |
|
Efficiency ratio (FTE basis) (1) | Efficiency ratio (FTE basis) (1) | 77.07 |
| 85.59 |
| Efficiency ratio (FTE basis) (1) | 88.25 |
| 77.07 |
|
| Asset quality | Asset quality | |
| |
| Asset quality | |
| |
|
| Allowance for loan and lease losses at December 31 | Allowance for loan and lease losses at December 31 | $ | 17,428 |
| $ | 24,179 |
| Allowance for loan and lease losses at December 31 | $ | 14,419 |
| $ | 17,428 |
|
Allowance for loan and lease losses as a percentage of total loans and leases outstanding at December 31 (2) | Allowance for loan and lease losses as a percentage of total loans and leases outstanding at December 31 (2) | 1.90 | % | 2.69 | % | Allowance for loan and lease losses as a percentage of total loans and leases outstanding at December 31 (2) | 1.65 | % | 1.90 | % |
Nonperforming loans, leases and foreclosed properties at December 31 (2) | Nonperforming loans, leases and foreclosed properties at December 31 (2) | $ | 17,772 |
| $ | 23,555 |
| Nonperforming loans, leases and foreclosed properties at December 31 (2) | $ | 12,629 |
| $ | 17,772 |
|
Net charge-offs (3) | Net charge-offs (3) | 7,897 |
| 14,908 |
| Net charge-offs (3) | 4,383 |
| 7,897 |
|
Net charge-offs as a percentage of average loans and leases outstanding (2, 3) | Net charge-offs as a percentage of average loans and leases outstanding (2, 3) | 0.87 | % | 1.67 | % | Net charge-offs as a percentage of average loans and leases outstanding (2, 3) | 0.49 | % | 0.87 | % |
Net charge-offs as a percentage of average loans and leases outstanding, excluding the purchased credit-impaired loan portfolio (2) | Net charge-offs as a percentage of average loans and leases outstanding, excluding the purchased credit-impaired loan portfolio (2) | 0.90 |
| 1.73 |
| Net charge-offs as a percentage of average loans and leases outstanding, excluding the purchased credit-impaired loan portfolio (2) | 0.50 |
| 0.90 |
|
Net charge-offs and purchased credit-impaired write-offs as a percentage of average loans and leases outstanding (2) | Net charge-offs and purchased credit-impaired write-offs as a percentage of average loans and leases outstanding (2) | 1.13 |
| 1.99 |
| Net charge-offs and purchased credit-impaired write-offs as a percentage of average loans and leases outstanding (2) | 0.58 |
| 1.13 |
|
Ratio of the allowance for loan and lease losses at December 31 to net charge-offs (3) | Ratio of the allowance for loan and lease losses at December 31 to net charge-offs (3) | 2.21 |
| 1.62 |
| Ratio of the allowance for loan and lease losses at December 31 to net charge-offs (3) | 3.29 |
| 2.21 |
|
| Ratio of the allowance for loan and lease losses at December 31 to net charge-offs, excluding the purchased credit-impaired loan portfolio | Ratio of the allowance for loan and lease losses at December 31 to net charge-offs, excluding the purchased credit-impaired loan portfolio | 1.89 |
| 1.25 |
| Ratio of the allowance for loan and lease losses at December 31 to net charge-offs, excluding the purchased credit-impaired loan portfolio | 2.91 |
| 1.89 |
|
| Ratio of the allowance for loan and lease losses at December 31 to net charge-offs and purchased credit-impaired write-offs | Ratio of the allowance for loan and lease losses at December 31 to net charge-offs and purchased credit-impaired write-offs | 1.70 |
| 1.36 |
| Ratio of the allowance for loan and lease losses at December 31 to net charge-offs and purchased credit-impaired write-offs | 2.78 |
| 1.70 |
|
| Balance sheet at year end | Balance sheet at year end | |
| |
| Balance sheet at year end | |
| |
|
| Total loans and leases | Total loans and leases | $ | 928,233 |
| $ | 907,819 |
| Total loans and leases | $ | 881,391 |
| $ | 928,233 |
|
| Total assets | Total assets | 2,102,273 |
| 2,209,974 |
| Total assets | 2,104,534 |
| 2,102,273 |
|
| Total deposits | Total deposits | 1,119,271 |
| 1,105,261 |
| Total deposits | 1,118,936 |
| 1,119,271 |
|
| Total common shareholders’ equity | Total common shareholders’ equity | 219,333 |
| 218,188 |
| Total common shareholders’ equity | 224,162 |
| 219,333 |
|
| Total shareholders’ equity | Total shareholders’ equity | 232,685 |
| 236,956 |
| Total shareholders’ equity | 243,471 |
| 232,685 |
|
Capital ratios at year end (4) | Capital ratios at year end (4) | |
| |
| Capital ratios at year end (4) | |
| |
|
| Common equity tier 1 capital | | Common equity tier 1 capital | 12.3 | % | n/a |
|
| Tier 1 common capital | Tier 1 common capital | 11.19 | % | 11.06 | % | Tier 1 common capital | n/a |
| 10.9 | % |
| Tier 1 capital | Tier 1 capital | 12.44 |
| 12.89 |
| Tier 1 capital | 13.4 |
| 12.2 |
|
| Total capital | Total capital | 15.44 |
| 16.31 |
| Total capital | 16.5 |
| 15.1 |
|
| Tier 1 leverage | Tier 1 leverage | 7.86 |
| 7.37 |
| Tier 1 leverage | 8.2 |
| 7.7 |
|
| |
(1) | Fully taxable-equivalent (FTE) basis, return on average tangible common shareholders’ equity and the efficiency ratio are non-GAAP financial measures. Other companies may define or calculate these measures differently. For more information, see Supplemental Financial Data on page 3332, and for corresponding reconciliations to GAAP financial measures, see Statistical Table XV. |
| |
(2) | Balances and ratios do not include loans accounted for under the fair value option. For additional exclusions from nonperforming loans, leases and foreclosed properties, see Consumer Portfolio Credit Risk Management – Nonperforming Consumer Loans, Leases and Foreclosed Properties Activity on page 8982 and corresponding Table 4139, and Commercial Portfolio Credit Risk Management – Nonperforming Commercial Loans, Leases and Foreclosed Properties Activity on page 9689 and corresponding Table 5048. |
| |
(3) | Net charge-offs exclude $2.3 billion810 million of write-offs in the purchased credit-impaired loan portfolio for 20132014 compared to $2.82.3 billion for 20122013. These write-offs decreased the purchased credit-impaired valuation allowance included as part of the allowance for loan and lease losses. For more information on purchased credit-impaired write-offs, see Consumer Portfolio Credit Risk Management – Purchased Credit-impaired Loan Portfolio on page 8578. |
| |
(4) | Presents capital ratios in accordance withOn January 1, 2014, the Basel 3 rules became effective, subject to transition provisions primarily related to regulatory deductions and adjustments impacting Common equity tier 1 – 2013 Rules, which includecapital and Tier 1 capital. We reported under Basel 1 (which included the Market Risk Final RuleRules) at December 31, 2013.Basel 1 did not include the Basel 1 – 2013 Rules atDecember 31, 2012.
|
|
| | |
| | 26Bank of America 2013201424
| | |
Financial Highlights
Net income was$4.8 billion, or $0.36 per diluted share in 2014 compared to $11.4 billion, or $0.90 per diluted share in 2013 compared to $4.2 billion, or $0.25 per diluted share in 2012. The results for 20132014 reflect our effortsincluded an increase of $10.3 billion in litigation expense primarily as a result of charges related to stabilize revenue, decrease costs, strengthen the balance sheetsettlements with the U.S. Department of Justice (DoJ) and improve credit quality.the Federal Housing Finance Agency (FHFA).
| | | | | | | | | | | |
| Table 2 | Summary Income Statement | | | | Summary Income Statement | | | |
| | | | | |
| (Dollars in millions) | (Dollars in millions) | 2013 | | 2012 | (Dollars in millions) | 2014 | | 2013 |
Net interest income (FTE basis) (1) | Net interest income (FTE basis) (1) | $ | 43,124 |
| | $ | 41,557 |
| Net interest income (FTE basis) (1) | $ | 40,821 |
| | $ | 43,124 |
|
| Noninterest income | Noninterest income | 46,677 |
| | 42,678 |
| Noninterest income | 44,295 |
| | 46,677 |
|
Total revenue, net of interest expense (FTE basis) (1) | Total revenue, net of interest expense (FTE basis) (1) | 89,801 |
| | 84,235 |
| Total revenue, net of interest expense (FTE basis) (1) | 85,116 |
| | 89,801 |
|
| Provision for credit losses | Provision for credit losses | 3,556 |
| | 8,169 |
| Provision for credit losses | 2,275 |
| | 3,556 |
|
| Noninterest expense | Noninterest expense | 69,214 |
| | 72,093 |
| Noninterest expense | 75,117 |
| | 69,214 |
|
| Income before income taxes | 17,031 |
| | 3,973 |
| |
Income tax expense (benefit) (FTE basis) (1) | 5,600 |
| | (215 | ) | |
Income before income taxes (FTE basis) (1) | | Income before income taxes (FTE basis) (1) | 7,724 |
| | 17,031 |
|
Income tax expense (FTE basis) (1) | | Income tax expense (FTE basis) (1) | 2,891 |
| | 5,600 |
|
| Net income | Net income | 11,431 |
| | 4,188 |
| Net income | 4,833 |
| | 11,431 |
|
| Preferred stock dividends | Preferred stock dividends | 1,349 |
| | 1,428 |
| Preferred stock dividends | 1,044 |
| | 1,349 |
|
| Net income applicable to common shareholders | Net income applicable to common shareholders | $ | 10,082 |
| | $ | 2,760 |
| Net income applicable to common shareholders | $ | 3,789 |
| | $ | 10,082 |
|
| | | | | | | | | |
| Per common share information | Per common share information | | | | Per common share information | | | |
| Earnings | Earnings | $ | 0.94 |
| | $ | 0.26 |
| Earnings | $ | 0.36 |
| | $ | 0.94 |
|
| Diluted earnings | Diluted earnings | 0.90 |
| | 0.25 |
| Diluted earnings | 0.36 |
| | 0.90 |
|
| |
(1) | FTE basis is a non-GAAP financial measure. For more information on this measure, see Supplemental Financial Data on page 3332, and for a corresponding reconciliation to GAAP financial measures, see Statistical Table XV. |
Net Interest Income
Net interest income on a fully taxable-equivalent (FTE) basis increaseddecreased $1.62.3 billion to $43.140.8 billion for 20132014 compared to 20122013. The increase was primarily due to reductions in long-term debt balances, higher yields on debt securities including the impact of market-related premium amortization expense, lower rates paid on deposits, higher commercial loan balances and increased trading-related net interest income, partially offset by lower consumer loan balances as well as lower asset yields and the low rate environment. The net interest yield on aan FTE basis increaseddecreased 12 basis points (bps) to 2.472.25 percent for 20132014. These declines compared to 2012were primarily due to the same factorsacceleration of market-related premium amortization on debt securities as described above.the decline in long-term interest rates shortened the expected lives of the securities. Also contributing to these declines were lower loan yields and consumer loan balances, lower net interest income from the asset and liability management (ALM) portfolio and a decrease in trading-related net interest income. Market-related premium amortization was an expense of $1.2 billion in 2014 compared to a benefit of $784 million in 2013. Partially offsetting these declines were reductions in funding yields, lower long-term debt balances and commercial loan growth.
Noninterest Income
| | | | | | | | | | | |
| Table 3 | Noninterest Income | | | | Noninterest Income | | | |
| | | | | | | | | |
| (Dollars in millions) | (Dollars in millions) | 2013 | | 2012 | (Dollars in millions) | 2014 | | 2013 |
| Card income | Card income | $ | 5,826 |
| | $ | 6,121 |
| Card income | $ | 5,944 |
| | $ | 5,826 |
|
| Service charges | Service charges | 7,390 |
| | 7,600 |
| Service charges | 7,443 |
| | 7,390 |
|
| Investment and brokerage services | Investment and brokerage services | 12,282 |
| | 11,393 |
| Investment and brokerage services | 13,284 |
| | 12,282 |
|
| Investment banking income | Investment banking income | 6,126 |
| | 5,299 |
| Investment banking income | 6,065 |
| | 6,126 |
|
| Equity investment income | Equity investment income | 2,901 |
| | 2,070 |
| Equity investment income | 1,130 |
| | 2,901 |
|
| Trading account profits | Trading account profits | 7,056 |
| | 5,870 |
| Trading account profits | 6,309 |
| | 7,056 |
|
| Mortgage banking income | Mortgage banking income | 3,874 |
| | 4,750 |
| Mortgage banking income | 1,563 |
| | 3,874 |
|
| Gains on sales of debt securities | Gains on sales of debt securities | 1,271 |
| | 1,662 |
| Gains on sales of debt securities | 1,354 |
| | 1,271 |
|
| Other loss | (29 | ) | | (2,034 | ) | |
| Net impairment losses recognized in earnings on AFS debt securities | (20 | ) | | (53 | ) | |
| Other income (loss) | | Other income (loss) | 1,203 |
| | (49 | ) |
| Total noninterest income | Total noninterest income | $ | 46,677 |
| | $ | 42,678 |
| Total noninterest income | $ | 44,295 |
| | $ | 46,677 |
|
Noninterest income increaseddecreased $4.02.4 billion to $46.744.3 billion for 20132014 compared to 20122013. The following highlights the significant changes.
| |
| Ÿ | Card income decreased$295 million primarily driven by lower revenue as a result of our exit of consumer protection products.
|
| |
Ÿ | Investment and brokerage services income increased $889 million1.0 billion primarily driven by increased asset management fees driven by the impact of long-term assets under management (AUM) inflows and higher market levels. |
| |
| Ÿ | Investment banking income increased $827 million primarily due to strong equity issuance fees attributable to a significant increase in global equity capital markets volume and higher debt issuance fees, primarily within leveraged finance and investment-grade underwriting. |
| |
Ÿ | Equity investment income increaseddecreased $831 million. The results for 20131.8 billion included $753 millionto $1.1 billion primarily due to a lower level of gains relatedcompared to 2013 and the salecontinued wind-down of our remaining investment in China Construction Bank Corporation (CCB) and gains of $1.4 billion on the sales of a portion of an equity investment. The results for 2012 included $1.6 billion of gains related to sales of certain equity and strategic investments.Global Principal Investments (GPI). |
| |
| Ÿ | Trading account profits decreased $747 million, which included a charge of $497 million in 2014 related to the adoption of a funding valuation adjustment (FVA) in increased$1.2 billionGlobal Markets, . Netpartially offset by a $359 million change in net debit valuation adjustmentadjustments (DVA) losses on derivatives were $508 million in 2013 compared to losses of $2.5 billion in 2012.derivatives. Excluding net the FVA/DVA charges, trading account profits decreased$783 $609 million due to decreases in our fixed-income, currencyboth lower market volumes and commodities (FICC) businesses driven by a challenging trading environment, partially offset by an increase in our equities businesses.volatility. |
| |
| Ÿ | Mortgage banking income decreased $876 million2.3 billion primarily driven by lower servicing income and lower core production revenue, partially offset by lower representations and warranties provision. |
| |
| Ÿ | Other lossincome (loss) improved decreased$2.01.3 billion due to lower negative fair value adjustmentsan increase of $1.1 billion in net DVA gains on our structured liabilities as our spreads widened, and gains associated with the sales of $649 million compared to negative fair value adjustments of $5.1 billionresidential mortgage loans, partially offset by increases in 2012.U.K. consumer payment protection insurance (PPI) costs. The prior year also included gainsthe write-down of $1.6 billion related to debt repurchases and exchanges of trust preferred securities.$450 million on a monoline receivable. |
Provision for Credit Losses
The provision for credit losses decreased $4.61.3 billion to $3.62.3 billion for 20132014 compared to 20122013. The provision for credit losses was $4.32.1 billion lower than net charge-offs for 20132014, resulting in a reduction in the allowance for credit losses due to continuedlosses. The decrease from the prior year was driven by portfolio improvement, including increased home prices in the home loans portfolio and lower unemployment levels driving improvement in the credit card portfolios. Thisportfolios, and improved asset quality in the commercial portfolio. Partially offsetting this decline was $400 million of additional costs in 2014 associated with the consumer relief portion of the settlement with the DoJ. We expect reserve releases in 2015 to moderate when compared to a reduction of $6.7 billion in the allowance for credit losses for the prior year. If the economy and our asset quality continue to improve, we anticipate additional reductions in the allowance for credit losses in future periods, although at a significantly lower level than in 2013.2014.
Net charge-offs totaled$4.4 billion, or 0.49 percent of average loans and leases for 2014 compared to $7.9 billion, or 0.87 percent of average loans and leases for 2013 compared to $14.9 billion, or 1.67 percent for 2012. The decrease in net charge-offs was primarily driven bydue to credit quality improvement across all major portfolios. Also, the prior year included charge-offs associated with the National Mortgage Settlement and loans discharged in Chapter 7 bankruptcy due to the implementation of regulatory guidance. Given improving trends in delinquenciesportfolios and the Home Price Index, absent any unexpected changes in the economy, we expect net charge-offs to continue to improve in 2014, but at a slower pace than 2013.impact of increased recoveries primarily from nonperforming and delinquent loan sales. For more information on the provision for credit losses, see Provision for Credit Losses on page 104.95.
|
| | |
| | 25Bank of America 2013272014 | | |
Noninterest Expense
| | | | | | | | | | | |
| Table 4 | Noninterest Expense | | | | Noninterest Expense | | | |
| | | | | | | | | |
| (Dollars in millions) | (Dollars in millions) | 2013 | | 2012 | (Dollars in millions) | 2014 | | 2013 |
| Personnel | Personnel | $ | 34,719 |
| | $ | 35,648 |
| Personnel | $ | 33,787 |
| | $ | 34,719 |
|
| Occupancy | Occupancy | 4,475 |
| | 4,570 |
| Occupancy | 4,260 |
| | 4,475 |
|
| Equipment | Equipment | 2,146 |
| | 2,269 |
| Equipment | 2,125 |
| | 2,146 |
|
| Marketing | Marketing | 1,834 |
| | 1,873 |
| Marketing | 1,829 |
| | 1,834 |
|
| Professional fees | Professional fees | 2,884 |
| | 3,574 |
| Professional fees | 2,472 |
| | 2,884 |
|
| Amortization of intangibles | Amortization of intangibles | 1,086 |
| | 1,264 |
| Amortization of intangibles | 936 |
| | 1,086 |
|
| Data processing | Data processing | 3,170 |
| | 2,961 |
| Data processing | 3,144 |
| | 3,170 |
|
| Telecommunications | Telecommunications | 1,593 |
| | 1,660 |
| Telecommunications | 1,259 |
| | 1,593 |
|
| Other general operating | Other general operating | 17,307 |
| | 18,274 |
| Other general operating | 25,305 |
| | 17,307 |
|
| Total noninterest expense | Total noninterest expense | $ | 69,214 |
| | $ | 72,093 |
| Total noninterest expense | $ | 75,117 |
| | $ | 69,214 |
|
Noninterest expense decreasedincreased $2.95.9 billion to $69.275.1 billion for 20132014 compared to 20122013 primarily driven by a $967 million declinehigher litigation expense in other general operating expense. Litigation expense largely dueincreased $10.3 billion primarily as a result of charges related to the settlements with the DoJ and FHFA. The increase in litigation expense was partially offset by a provisiondecrease of $1.1$3.3 billion in 2012 for the 2013 Independent Foreclosure Review (IFR) Acceleration Agreement, lower Federal Deposit Insurance Corporation (FDIC) expense,default-related staffing and lowerother default-related servicing expenses in Legacy Assets & Servicing and mortgage-related assessments, waivers and similar costs related to foreclosure delays. Partially offsetting these declines was a $1.9 billion increase in litigation expense to $6.1 billion in 2013. PersonnelServicing. Also, personnel expense decreased $929932 million in 20132014 as we continued to streamline processes and achieve cost savings. Professional fees decreased $690 million due in part to reduced default-related management activities in Legacy Assets & Servicing.
In connection with Project New BAC, which waswe first announced in the third quarter of 2011, we continueexpected to achieve cost savings in certain noninterest expense categories as we further streamlinestreamlined workflows, simplifysimplified processes and alignaligned expenses with our overall strategic plan and operating principles. We expectexpected total cost savings from Project New BAC since inception of the project, to reach $8 billion on an annualized basis, or $2 billion per quarter, by mid-2015,mid-2015. We successfully completed our Project New BAC expense program ahead of which approximately $1.5schedule by reaching our target of $2 billion in cost savings per quarter, has been realized.in the third quarter of 2014.
Income Tax Expense
| | | | | | | | | | | |
| Table 5 | Income Tax Expense | | | | Income Tax Expense | | | |
| | | | | | | | | |
| (Dollars in millions) | (Dollars in millions) | 2013 | | 2012 | (Dollars in millions) | 2014 | | 2013 |
| Income before income taxes | Income before income taxes | $ | 16,172 |
| | $ | 3,072 |
| Income before income taxes | $ | 6,855 |
| | $ | 16,172 |
|
| Income tax expense (benefit) | 4,741 |
| | (1,116 | ) | |
| Income tax expense | | Income tax expense | 2,022 |
| | 4,741 |
|
| Effective tax rate | Effective tax rate | 29.3 | % | | (36.3 | )% | Effective tax rate | 29.5 | % | | 29.3 | % |
The effective tax rate for 20132014 was driven by our recurring tax preference items, the resolution of several tax examinations and tax benefits from non-U.S. restructurings, partially offset by the non-deductible treatment of certain litigation charges. We expect an effective tax rate in the low 30 percent range, absent unusual items, for 2015.
The effective tax rate for 2013 was driven by our recurring tax preference items and by certain tax benefits related to non-U.S. operations, including additional tax benefits from the 2012 non-U.S. restructurings. These benefits were partially offset by the $1.1 billion negative impact offrom the U.K. 2013 Finance Act, enacted onin July 17, 2013, which reduced the U.K. corporate income tax rate by three percent to 20 percent. Two percent of the reduction will become effective April 1, 2014 and the additional one percent reduction on April 1, 2015. These reductions, which represented the final in a series of announced reductions, are expected to favorably affect income tax expense on future U.K. earnings but also required us to remeasure, in the period of enactment,The $1.1 billion charge resulted from remeasuring our U.K. net deferred tax assets, in the period of enactment, using the lower tax rates. Because our deferred tax assets in excess of a certain amount are disallowed in calculating regulatory capital, this charge did not impact our capital ratios.
The negative effective tax rate for 2012 included a $1.7 billion tax benefit attributable to the excess of foreign tax credits recognized in the U.S. upon repatriation of the earnings of certain subsidiaries over the related U.S. tax liability. Partially offsetting the benefit was the $788 million impact of the U.K. 2012 Finance Act enacted in July 2012, which reduced the U.K. corporate income tax rate by two percent.
|
| | |
| | 28Bank of America 2013201426
| | |
Balance Sheet Overview
| | | | | | | | | | | | | | | | | | | | | | | | | | | |
| Table 6 | Selected Balance Sheet Data | | | | | | | | | | | | Selected Balance Sheet Data | | | | | | | | | | | |
| | | | | | | | | | | | | | | | | | | | | | | | | |
| | | December 31 | | | | Average Balance | | | | December 31 | | | | Average Balance | | |
| (Dollars in millions) | (Dollars in millions) | 2013 | | 2012 | | % Change | | 2013 | | 2012 | | % Change | (Dollars in millions) | 2014 | | 2013 | | % Change | | 2014 | | 2013 | | % Change |
| Assets | Assets | |
| | |
| | | | |
| | |
| | | Assets | |
| | |
| | | | |
| | |
| | |
| Cash and cash equivalents | | Cash and cash equivalents | $ | 138,589 |
| | $ | 131,322 |
| | 6 | % | | $ | 141,078 |
| | $ | 109,014 |
| | 29 | % |
| Federal funds sold and securities borrowed or purchased under agreements to resell | Federal funds sold and securities borrowed or purchased under agreements to resell | $ | 190,328 |
| | $ | 219,924 |
| | (13 | )% | | $ | 224,331 |
| | $ | 236,042 |
| | (5 | )% | Federal funds sold and securities borrowed or purchased under agreements to resell | 191,823 |
| | 190,328 |
| | 1 |
| | 222,483 |
| | 224,331 |
| | (1 | ) |
| Trading account assets | Trading account assets | 200,993 |
| | 227,775 |
| | (12 | ) | | 217,865 |
| | 203,799 |
| | 7 |
| Trading account assets | 191,785 |
| | 200,993 |
| | (5 | ) | | 202,416 |
| | 217,865 |
| | (7 | ) |
| Debt securities | Debt securities | 323,945 |
| | 360,331 |
| | (10 | ) | | 337,953 |
| | 353,577 |
| | (4 | ) | Debt securities | 380,461 |
| | 323,945 |
| | 17 |
| | 351,702 |
| | 337,953 |
| | 4 |
|
| Loans and leases | Loans and leases | 928,233 |
| | 907,819 |
| | 2 |
| | 918,641 |
| | 898,768 |
| | 2 |
| Loans and leases | 881,391 |
| | 928,233 |
| | (5 | ) | | 903,901 |
| | 918,641 |
| | (2 | ) |
| Allowance for loan and lease losses | Allowance for loan and lease losses | (17,428 | ) | | (24,179 | ) | | (28 | ) | | (21,188 | ) | | (29,843 | ) | | (29 | ) | Allowance for loan and lease losses | (14,419 | ) | | (17,428 | ) | | (17 | ) | | (15,973 | ) | | (21,188 | ) | | (25 | ) |
| All other assets | All other assets | 476,202 |
| | 518,304 |
| | (8 | ) | | 485,911 |
| | 529,013 |
| | (8 | ) | All other assets | 334,904 |
| | 344,880 |
| | (3 | ) | | 339,983 |
| | 376,897 |
| | (10 | ) |
| Total assets | Total assets | $ | 2,102,273 |
| | $ | 2,209,974 |
| | (5 | ) | | $ | 2,163,513 |
| | $ | 2,191,356 |
| | (1 | ) | Total assets | $ | 2,104,534 |
| | $ | 2,102,273 |
| | — |
| | $ | 2,145,590 |
| | $ | 2,163,513 |
| | (1 | ) |
| Liabilities | Liabilities | |
| | |
| | | | |
| | |
| | | Liabilities | |
| | |
| | | | |
| | |
| | |
| Deposits | Deposits | $ | 1,119,271 |
| | $ | 1,105,261 |
| | 1 |
| | $ | 1,089,735 |
| | $ | 1,047,782 |
| | 4 |
| Deposits | $ | 1,118,936 |
| | $ | 1,119,271 |
| | — |
| | $ | 1,124,207 |
| | $ | 1,089,735 |
| | 3 |
|
| Federal funds purchased and securities loaned or sold under agreements to repurchase | Federal funds purchased and securities loaned or sold under agreements to repurchase | 198,106 |
| | 293,259 |
| | (32 | ) | | 257,601 |
| | 281,900 |
| | (9 | ) | Federal funds purchased and securities loaned or sold under agreements to repurchase | 201,277 |
| | 198,106 |
| | 2 |
| | 215,792 |
| | 257,600 |
| | (16 | ) |
| Trading account liabilities | Trading account liabilities | 83,469 |
| | 73,587 |
| | 13 |
| | 88,323 |
| | 78,554 |
| | 12 |
| Trading account liabilities | 74,192 |
| | 83,469 |
| | (11 | ) | | 87,151 |
| | 88,323 |
| | (1 | ) |
| Short-term borrowings | Short-term borrowings | 45,999 |
| | 30,731 |
| | 50 |
| | 43,816 |
| | 36,500 |
| | 20 |
| Short-term borrowings | 31,172 |
| | 45,999 |
| | (32 | ) | | 41,886 |
| | 43,816 |
| | (4 | ) |
| Long-term debt | Long-term debt | 249,674 |
| | 275,585 |
| | (9 | ) | | 263,416 |
| | 316,393 |
| | (17 | ) | Long-term debt | 243,139 |
| | 249,674 |
| | (3 | ) | | 253,607 |
| | 263,417 |
| | (4 | ) |
| All other liabilities | All other liabilities | 173,069 |
| | 194,595 |
| | (11 | ) | | 186,675 |
| | 194,550 |
| | (4 | ) | All other liabilities | 192,347 |
| | 173,069 |
| | 11 |
| | 184,471 |
| | 186,675 |
| | (1 | ) |
| Total liabilities | Total liabilities | 1,869,588 |
| | 1,973,018 |
| | (5 | ) | | 1,929,566 |
| | 1,955,679 |
| | (1 | ) | Total liabilities | 1,861,063 |
| | 1,869,588 |
| | — |
| | 1,907,114 |
| | 1,929,566 |
| | (1 | ) |
| Shareholders’ equity | Shareholders’ equity | 232,685 |
| | 236,956 |
| | (2 | ) | | 233,947 |
| | 235,677 |
| | (1 | ) | Shareholders’ equity | 243,471 |
| | 232,685 |
| | 5 |
| | 238,476 |
| | 233,947 |
| | 2 |
|
| Total liabilities and shareholders’ equity | Total liabilities and shareholders’ equity | $ | 2,102,273 |
| | $ | 2,209,974 |
| | (5 | ) | | $ | 2,163,513 |
| | $ | 2,191,356 |
| | (1 | ) | Total liabilities and shareholders’ equity | $ | 2,104,534 |
| | $ | 2,102,273 |
| | — |
| | $ | 2,145,590 |
| | $ | 2,163,513 |
| | (1 | ) |
Year-end balance sheet amounts may vary from average balance sheet amounts due to liquidity and balance sheet management activities, primarily involving our portfolios of highly liquid assets. These portfolios are designed to ensure the adequacy of capital while enhancing our ability to manage liquidity requirements for the Corporation and our customers, and to position the balance sheet in accordance with the Corporation’s risk appetite. The execution of these activities requires the use of balance sheet and capital-related limits including spot, average and risk-weighted asset limits, particularly within the market-making activities of our trading businesses. One of our key regulatory metrics, Tier 1 leverage ratio, is calculated based on adjusted quarterly average total assets.
Balance Sheet Management Actions in 2014
The Corporation took certain actions during 2014 to further optimize its balance sheet. While the overall size of the balance sheet remained relatively unchanged compared to December 31, 2013, the composition has improved in terms of liquidity in response to the new Basel 3 Liquidity Coverage Ratio (LCR) requirements. We shifted the mix of certain discretionary assets out of less liquid loans to more liquid debt securities. This included the sale of $10.7 billion of residential mortgage loans with standby insurance agreements and purchase of agency securities, and the sale of $6.7 billion of nonperforming and other delinquent loans. Though the Global Markets balance sheet was relatively stable, there was a decrease of $11.8 billion in low-margin prime brokerage loans. Ending deposits remained relatively unchanged
as we took actions to optimize the LCR liquidity value of deposits while growing retail deposits. Additionally, from a capital standpoint, $6.0 billion of preferred stock was issued during the year and amendments to our outstanding Series T preferred stock also improved Basel 3 Tier 1 regulatory capital.
Assets
Year-end total assets remained relatively unchanged from December 31, 2013, though the asset mix changed in connection with preparing for the new Basel 3 LCR requirements as discussed above. The key drivers were increased debt securities due to purchases of U.S. Treasury securities, and higher cash and cash equivalents from higher interest-bearing deposits with the Federal Reserve and non-U.S. central banks. These increases were largely offset by a decline in consumer loan balances due to paydowns, sales of residential loans with long-term standby agreements, nonperforming and delinquent loan sales and net charge-offs collectively outpacing new originations, and declines in all other assets and in trading account assets.
Cash and Cash Equivalents
Year-end and average cash and cash equivalents increased $7.3 billion from December 31, 2013 and $32.1 billion in 2014 driven by an increase in interest-bearing deposits with the Federal Reserve and non-U.S. central banks in connection with preparing for the Basel 3 LCR requirements. For more information, see Liquidity Risk – Basel 3 Liquidity Standards on page 67.
Federal Funds Sold and Securities Borrowed or Purchased Under Agreements to Resell
Federal funds transactions involve lending reserve balances on a short-term basis. Securities borrowed or purchased under agreements to resell are collateralized lending transactions utilized to accommodate customer transactions, earn interest rate spreads, and obtain securities for settlement and for collateral. Year-end federal funds sold and averagesecurities borrowed or purchased under agreements to resell increased $1.5 billion from December 31, 2013 driven by matched-book activity, partially offset by roll-off of supranational positions and a mix shift into securities. Average federal funds sold and securities borrowed or purchased under agreements to resell decreased $29.6 billion from December 31, 2012 and $11.7$1.8 billion in 20132014 compared to 2012 driven by a2013 due to lower matched-book as we adjust our activity to address the adverse treatment of reverse repurchase agreements under the proposed supplementary leverage ratio.activity.
Trading Account Assets
Trading account assets consist primarily of long positions in equity and fixed-income securities including U.S. government and agency securities, corporate securities and non-U.S. sovereign debt. Year-end trading account assets decreased $26.8$9.2 billion primarily due
to lower equity securities inventory as a result of a decrease in client hedging activity. Average trading account assets decreased $15.4 billion primarily due to a reduction in U.S. government and agency securities. Average trading account assets increased $14.1 billion primarily due to higher equityTreasury securities inventory and client-based activity.inventory.
Debt Securities
Debt securities primarily include U.S. Treasury and agency securities, MBS, principally agency MBS, foreign bonds, corporate bonds and municipal debt. We use the debt securities portfolio primarily to manage interest rate and liquidity risk and to take advantage of market conditions that create more economically attractive returns on these investments. Year-end and average debt securities decreased $36.4increased $56.5 billion and $15.6$13.7 billion primarily due to net salespurchases of U.S. Treasuries, paydownsTreasury securities driven by the new LCR rules, and decreasesincreases in the fair value of available-for-sale (AFS) debt securities resulting from the impact of higherlower interest rates. For more information on debt securities, see Note 3 – Securities to the Consolidated Financial Statements.
Loans and Leases
Year-end and average loans and leases increased $20.4decreased $46.8 billion and $19.9$14.7 billion. The increasesdecreases were primarily due to higher commercial loan balances primarilydriven by a decline in the U.S. commercial and non-U.S. commercial product types, partially offset by lower consumer loan balances driven by continued runoff in certain portfolios as well asdue to paydowns, loan sales and net charge-offs outpacing originations.new originations, and a decline in commercial loan balances. For a more detailed discussion ofinformation on the loan portfolio, see Credit Risk Management on page 76.70.
Allowance for Loan and Lease Losses
Year-end and average allowance for loan and lease losses decreased $6.8$3.0 billion and $8.75.2 billion primarily due to the impact of improvements in credit quality from the improving economy, partially offset by increases in reserves in the commercial portfolio due to loan growth.economy. For a more detailed discussion,information, see Allowance for Credit Losses on page 104.95.
All Other Assets
Year-end all other assets decreased $42.1$10.0 billion driven by other earning assets and time deposits placed, partially offset by an increase in derivative assets. Average all other assets decreased $36.9 billion primarily driven by lower customer and other receivables, other earning assets,time deposits placed, loans held-for-sale (LHFS) and derivative assets,assets.
Liabilities
At December 31, 2014, total liabilities were approximately $1.9 trillion, down $8.5 billion from December 31, 2013, driven by planned reductions in short-term borrowings and long-term debt as well as a decrease in trading account liabilities, partially offset by increases in cash and cash equivalents. Averageall other assets decreased $43.1 billion primarily driven by lower derivative assets, other earning assets, and cash and cash equivalents.
Liabilitiesliabilities.
Deposits
Year-end and average deposits increased $14.0 billionremained relatively unchanged from December 31, 2012 and $42.02013 due to declines in Global Banking offset by an increase in retail deposits. Average deposits increased $34.5 billion in 2013 compared to 2012. The increases were primarily driven by customer and client shifts tointo more liquid products in the low rate environment.
Federal Funds Purchased and Securities Loaned or Sold Under Agreements to Repurchase
Federal funds transactions involve borrowing reserve balances on a short-term basis. Securities loaned or sold under agreements to repurchase are collateralized borrowing transactions utilized to accommodate customer transactions, earn interest rate spreads and finance assets on the balance sheet. Year-end federal funds purchased and securities loaned or sold under agreements to repurchase decreased $95.2increased $3.2 billion primarily driven by a lower matched-book as we adjust our activity to address the adverse treatment of repurchase agreements under the proposed supplementary leverage ratio and lower trading inventory.activity. Average federal funds purchased and securities loaned or sold under agreements to repurchase decreased $24.3$41.8 billion primarily due to lower matched-book activity.targeted reductions in the balance sheet.
Trading Account Liabilities
Trading account liabilities consist primarily of short positions in equity and fixed-income securities including U.S. governmentTreasury and agency securities, corporate securities, and non-U.S. sovereign debt. Year-end and average trading account liabilities increased $9.9decreased $9.3 billion and $9.8$1.2 billion primarily due to increasedlower levels of short positions in equity securities.U.S. Treasury positions.
Short-term Borrowings
Short-term borrowings provide an additional funding source and primarily consist of Federal Home Loan Bank (FHLB) short-term borrowings, notes payable and various other borrowings that generally have maturities of one year or less. Year-end and average short-term borrowings increased $15.3decreased $14.8 billion and $7.3$1.9 billion due to an increaseplanned reductions in short-term FHLB advances.borrowings. For more information on short-term borrowings, see Note 10 – Federal Funds Sold or Purchased, Securities Financing Agreements and Short-term Borrowings to the Consolidated Financial Statements.
Long-term Debt
Year-end and average long-term debt decreased $25.9$6.5 billion and $53.0$9.8 billion. The decreases were attributable to planned reductions in long-term debt asa result of maturities outpacedoutpacing new issuances. For more information on long-term debt, see Note 11 – Long-term Debt to the Consolidated Financial Statements.
All Other Liabilities
Year-end all other liabilities increased $19.3 billion driven by increases in derivative liabilities and payables. Average all other liabilities decreased $21.5$2.2 billion driven by decreases in noninterest payables and derivative liabilities. Average all other liabilities decreased $7.9 billion driven by a decrease in derivative liabilities.
Shareholders’ Equity
Year-end and average shareholders’ equity decreased $4.3increased $10.8 billion and $1.7 billion. The decreases were driven by issuances of preferred stock, an increase in accumulated other comprehensive income (OCI) due to a decreasepositive net change in the fair value of AFS debt securities, resulting from the impact of higher interest rates, which is recorded in accumulated other comprehensive income (OCI), net preferred stock redemptions and earnings, partially offset by common stock repurchases and dividends. Average shareholders’ equity increased $4.5 billion driven by earnings and accumulated OCI, partially offset by earnings.common stock repurchases and dividends.
Cash Flows Overview
The Corporation’s operating assets and liabilities support our global markets and lending activities. We believe that cash flows from operations, available cash balances and our ability to generate cash through short- and long-term debt are sufficient to fund our operating liquidity needs. Our investing activities primarily include the debt securities portfolio and other short-term investments. Our financing activities reflect cash flows primarily related to increased customer deposits and net long-term debt reductions.
Cash and cash equivalents increased $7.3 billion during 2014 due to net cash provided by operating activities, partially offset by net cash used in financing and investing activities. This reflects actions taken in preparation for the Basel 3 LCR requirements. These changes were primarily due to higher interest-bearing deposits with the Federal Reserve and non-U.S. central banks as well as the sale of residential mortgage loans with standby insurance agreements and the purchase of agency securities, and the sale of nonperforming and other delinquent loans to further
optimize the balance sheet. Cash and cash equivalents increased$20.6 billion during 2013 due to net cash provided by operating and investing activities, partially offset by net cash used in financing activities. Cash and cash equivalents
During decreased$9.4 billion2014 during 2012 due to net cash used in operating and investing activities, partially offset by, net cash provided by financing activities.operating activities was
$26.7 billion. The more significant drivers included net decreases in trading and derivative instruments, as well as a net increase in accrued expenses and other liabilities. During 2013, net cash provided by operating activities was $92.8 billion. The more significant adjustments to net income to arrive at cash used in operating activitiesdrivers included net decreases in other assets, and trading and derivative instruments, as well as net proceeds from sales, securitizations and paydowns of loans held-for-sale (LHFS). LHFS.
During 20122014, net cash used in operatinginvesting activities was $16.14.2 billion. The more significant adjustments to, primarily driven by net income to arrive at cash usedpurchases of debt securities, partially offset by net decreases in operating activities included net increases in tradingloans and derivative instruments, and the provision for credit losses.
leases. During 2013, net cash provided by investing activities was $25.1 billion, primarily driven by a decrease in federal funds sold and securities borrowed or purchased under agreements to resell and net sales of debt securities, partially offset by a net increasesincrease in loans and leases.
During 20122014, net cash used in investingfinancing activities wasof $35.012.2 billion, primarily drivenreflected a reduction in short-term borrowings, partially offset by net purchasesthe issuance of debt securities.
preferred stock. During 2013, the net cash used in financing activities of $95.4 billion primarily reflected a decrease in federal funds purchased and securities loaned or sold under agreements to repurchase and net reductions in long-term debt, partially offset by growth in short-term borrowings and deposits. During 2012, the net cash provided by financing activities of $42.4 billion primarily reflected an increase in federal funds purchased and securities loaned or sold under agreements to repurchase and growth in deposits, partially offset by planned reductions in long-term debt.
|
| | |
3029 Bank of America 20132014
| | |
| | | | | | | | | | | | | | | | | | | | | | | |
| Table 7 | Five-year Summary of Selected Financial Data | | | | | | | | | | Five-year Summary of Selected Financial Data | | | | | | | | | |
| | | | | | | | | | | | | | | | | | | | | |
| (In millions, except per share information) | (In millions, except per share information) | 2013 | | 2012 | | 2011 | | 2010 | | 2009 | (In millions, except per share information) | 2014 | | 2013 | | 2012 | | 2011 | | 2010 |
| Income statement | Income statement | | | | | |
| | |
| | |
| Income statement | | | | | |
| | |
| | |
|
| Net interest income | Net interest income | $ | 42,265 |
| | $ | 40,656 |
| | $ | 44,616 |
| | $ | 51,523 |
| | $ | 47,109 |
| Net interest income | $ | 39,952 |
| | $ | 42,265 |
| | $ | 40,656 |
| | $ | 44,616 |
| | $ | 51,523 |
|
| Noninterest income | Noninterest income | 46,677 |
| | 42,678 |
| | 48,838 |
| | 58,697 |
| | 72,534 |
| Noninterest income | 44,295 |
| | 46,677 |
| | 42,678 |
| | 48,838 |
| | 58,697 |
|
| Total revenue, net of interest expense | Total revenue, net of interest expense | 88,942 |
| | 83,334 |
| | 93,454 |
| | 110,220 |
| | 119,643 |
| Total revenue, net of interest expense | 84,247 |
| | 88,942 |
| | 83,334 |
| | 93,454 |
| | 110,220 |
|
| Provision for credit losses | Provision for credit losses | 3,556 |
| | 8,169 |
| | 13,410 |
| | 28,435 |
| | 48,570 |
| Provision for credit losses | 2,275 |
| | 3,556 |
| | 8,169 |
| | 13,410 |
| | 28,435 |
|
| Goodwill impairment | Goodwill impairment | — |
| | — |
| | 3,184 |
| | 12,400 |
| | — |
| Goodwill impairment | — |
| | — |
| | — |
| | 3,184 |
| | 12,400 |
|
| Merger and restructuring charges | Merger and restructuring charges | — |
| | — |
| | 638 |
| | 1,820 |
| | 2,721 |
| Merger and restructuring charges | — |
| | — |
| | — |
| | 638 |
| | 1,820 |
|
All other noninterest expense (1) | All other noninterest expense (1) | 69,214 |
| | 72,093 |
| | 76,452 |
| | 68,888 |
| | 63,992 |
| All other noninterest expense (1) | 75,117 |
| | 69,214 |
| | 72,093 |
| | 76,452 |
| | 68,888 |
|
| Income (loss) before income taxes | Income (loss) before income taxes | 16,172 |
| | 3,072 |
| | (230 | ) | | (1,323 | ) | | 4,360 |
| Income (loss) before income taxes | 6,855 |
| | 16,172 |
| | 3,072 |
| | (230 | ) | | (1,323 | ) |
| Income tax expense (benefit) | Income tax expense (benefit) | 4,741 |
| | (1,116 | ) | | (1,676 | ) | | 915 |
| | (1,916 | ) | Income tax expense (benefit) | 2,022 |
| | 4,741 |
| | (1,116 | ) | | (1,676 | ) | | 915 |
|
| Net income (loss) | Net income (loss) | 11,431 |
| | 4,188 |
| | 1,446 |
| | (2,238 | ) | | 6,276 |
| Net income (loss) | 4,833 |
| | 11,431 |
| | 4,188 |
| | 1,446 |
| | (2,238 | ) |
| Net income (loss) applicable to common shareholders | Net income (loss) applicable to common shareholders | 10,082 |
| | 2,760 |
| | 85 |
| | (3,595 | ) | | (2,204 | ) | Net income (loss) applicable to common shareholders | 3,789 |
| | 10,082 |
| | 2,760 |
| | 85 |
| | (3,595 | ) |
| Average common shares issued and outstanding | Average common shares issued and outstanding | 10,731 |
| | 10,746 |
| | 10,143 |
| | 9,790 |
| | 7,729 |
| Average common shares issued and outstanding | 10,528 |
| | 10,731 |
| | 10,746 |
| | 10,143 |
| | 9,790 |
|
Average diluted common shares issued and outstanding (2)(1) | Average diluted common shares issued and outstanding (2)(1) | 11,491 |
| | 10,841 |
| | 10,255 |
| | 9,790 |
| | 7,729 |
| Average diluted common shares issued and outstanding (2)(1) | 10,585 |
| | 11,491 |
| | 10,841 |
| | 10,255 |
| | 9,790 |
|
| Performance ratios | Performance ratios | |
| | |
| | |
| | |
| | |
| Performance ratios | |
| | |
| | |
| | |
| | |
|
| Return on average assets | Return on average assets | 0.53 | % | | 0.19 | % | | 0.06 | % | | n/m |
| | 0.26 | % | Return on average assets | 0.23 | % | | 0.53 | % | | 0.19 | % | | 0.06 | % | | n/m |
|
| Return on average common shareholders’ equity | Return on average common shareholders’ equity | 4.62 |
| | 1.27 |
| | 0.04 |
| | n/m |
| | n/m |
| Return on average common shareholders’ equity | 1.70 |
| | 4.62 |
| | 1.27 |
| | 0.04 |
| | n/m |
|
Return on average tangible common shareholders’ equity (3)(2) | Return on average tangible common shareholders’ equity (3)(2) | 6.97 |
| | 1.94 |
| | 0.06 |
| | n/m |
| | n/m |
| Return on average tangible common shareholders’ equity (3)(2) | 2.52 |
| | 6.97 |
| | 1.94 |
| | 0.06 |
| | n/m |
|
Return on average tangible shareholders’ equity (3)(2) | Return on average tangible shareholders’ equity (3)(2) | 7.13 |
| | 2.60 |
| | 0.96 |
| | n/m |
| | 4.18 |
| Return on average tangible shareholders’ equity (3)(2) | 2.92 |
| | 7.13 |
| | 2.60 |
| | 0.96 |
| | n/m |
|
| Total ending equity to total ending assets | Total ending equity to total ending assets | 11.07 |
| | 10.72 |
| | 10.81 |
| | 10.08 | % | | 10.38 |
| Total ending equity to total ending assets | 11.57 |
| | 11.07 |
| | 10.72 |
| | 10.81 |
| | 10.08 | % |
| Total average equity to total average assets | Total average equity to total average assets | 10.81 |
| | 10.75 |
| | 9.98 |
| | 9.56 |
| | 10.01 |
| Total average equity to total average assets | 11.11 |
| | 10.81 |
| | 10.75 |
| | 9.98 |
| | 9.56 |
|
| Dividend payout | Dividend payout | 4.25 |
| | 15.86 |
| | n/m |
| | n/m |
| | n/m |
| Dividend payout | 33.31 |
| | 4.25 |
| | 15.86 |
| | n/m |
| | n/m |
|
| Per common share data | Per common share data | |
| | |
| | |
| | |
| | |
| Per common share data | |
| | |
| | |
| | |
| | |
|
| Earnings (loss) | Earnings (loss) | $ | 0.94 |
| | $ | 0.26 |
| | $ | 0.01 |
| | $ | (0.37 | ) | | $ | (0.29 | ) | Earnings (loss) | $ | 0.36 |
| | $ | 0.94 |
| | $ | 0.26 |
| | $ | 0.01 |
| | $ | (0.37 | ) |
Diluted earnings (loss) (2)(1) | Diluted earnings (loss) (2)(1) | 0.90 |
| | 0.25 |
| | 0.01 |
| | (0.37 | ) | | (0.29 | ) | Diluted earnings (loss) (2)(1) | 0.36 |
| | 0.90 |
| | 0.25 |
| | 0.01 |
| | (0.37 | ) |
| Dividends paid | Dividends paid | 0.04 |
| | 0.04 |
| | 0.04 |
| | 0.04 |
| | 0.04 |
| Dividends paid | 0.12 |
| | 0.04 |
| | 0.04 |
| | 0.04 |
| | 0.04 |
|
| Book value | Book value | 20.71 |
| | 20.24 |
| | 20.09 |
| | 20.99 |
| | 21.48 |
| Book value | 21.32 |
| | 20.71 |
| | 20.24 |
| | 20.09 |
| | 20.99 |
|
Tangible book value (3)(2) | Tangible book value (3)(2) | 13.79 |
| | 13.36 |
| | 12.95 |
| | 12.98 |
| | 11.94 |
| Tangible book value (3)(2) | 14.43 |
| | 13.79 |
| | 13.36 |
| | 12.95 |
| | 12.98 |
|
| Market price per share of common stock | Market price per share of common stock | |
| | |
| | | | |
| | |
| Market price per share of common stock | |
| | |
| | | | |
| | |
|
| Closing | Closing | $ | 15.57 |
| | $ | 11.61 |
| | $ | 5.56 |
| | $ | 13.34 |
| | $ | 15.06 |
| Closing | $ | 17.89 |
| | $ | 15.57 |
| | $ | 11.61 |
| | $ | 5.56 |
| | $ | 13.34 |
|
| High closing | High closing | 15.88 |
| | 11.61 |
| | 15.25 |
| | 19.48 |
| | 18.59 |
| High closing | 18.13 |
| | 15.88 |
| | 11.61 |
| | 15.25 |
| | 19.48 |
|
| Low closing | Low closing | 11.03 |
| | 5.80 |
| | 4.99 |
| | 10.95 |
| | 3.14 |
| Low closing | 14.51 |
| | 11.03 |
| | 5.80 |
| | 4.99 |
| | 10.95 |
|
| Market capitalization | Market capitalization | $ | 164,914 |
| | $ | 125,136 |
| | $ | 58,580 |
| | $ | 134,536 |
| | $ | 130,273 |
| Market capitalization | $ | 188,141 |
| | $ | 164,914 |
| | $ | 125,136 |
| | $ | 58,580 |
| | $ | 134,536 |
|
| |
(1) | Excludes merger and restructuring charges and goodwill impairment charges.The diluted earnings (loss) per common share excluded the effect of any equity instruments that are antidilutive to earnings per share. There were no potential common shares that were dilutive in 2010 because of the net loss applicable to common shareholders. |
| |
(2) | Due to a net loss applicable to common shareholders for 2010 and 2009, the impact of antidilutive equity instruments was excluded from diluted earnings (loss) per share and average diluted common shares. |
| |
(3)
| Tangible equity ratios and tangible book value per share of common stock are non-GAAP financial measures. Other companies may define or calculate these measures differently. For more information on these ratios, see Supplemental Financial Data on page 3332, and for corresponding reconciliations to GAAP financial measures, see Statistical Table XV on page 143134. |
| |
(4)(3)
| For more information on the impact of the purchased credit-impaired loan portfolio on asset quality, see Consumer Portfolio Credit Risk Management on page 7770. |
| |
(5)(4)
| Includes the allowance for loan and lease losses and the reserve for unfunded lending commitments. |
| |
(6)(5)
| Balances and ratios do not include loans accounted for under the fair value option. For additional exclusions from nonperforming loans, leases and foreclosed properties, see Consumer Portfolio Credit Risk Management – Nonperforming Consumer Loans, Leases and Foreclosed Properties Activity on page 8982 and corresponding Table 4139, and Commercial Portfolio Credit Risk Management – Nonperforming Commercial Loans, Leases and Foreclosed Properties Activity on page 9689 and corresponding Table 5048. |
| |
(7)(6)
| Primarily includes amounts allocated to the U.S. credit card and unsecured consumer lending portfolios in CBB, purchased credit-impaired loans and the non-U.S. credit card portfolio in All Other. |
| |
(8)(7)
| Net charge-offs exclude$810 million, $2.3 billion and $2.8 billion of write-offs in the purchased credit-impaired loan portfolio for 2014, 2013 and 2012., respectively. These write-offs decreased the purchased credit-impaired valuation allowance included as part of the allowance for loan and lease losses. For more information on purchased credit-impaired write-offs, see Consumer Portfolio Credit Risk Management – Purchased Credit-impaired Loan Portfolio on page 8578. |
| |
(9)(8)
| There were no write-offs of PCI loans in 2011 2010, and 2009.2010. |
| |
(10)(9)
| Presents capital ratios in accordance withOn January 1, 2014, the Basel 3 rules became effective, subject to transition provisions primarily related to regulatory deductions and adjustments impacting Common equity tier 1 – 2013 Rules, which includecapital and Tier 1 capital. We reported under Basel 1 (which included the Market Risk Final RuleRules) at December 31, 2013. Basel 1 did not include the Basel 1 – 2013 Rules atprior to December 31, 20122013.
|
n/a = not applicable
n/m = not meaningful
|
| | |
| | | Bank of America 20132014 3130 |
| | | | | | | | | | | | | | | | | | | | | | | |
| Table 7 | Five-year Summary of Selected Financial Data (continued) | Five-year Summary of Selected Financial Data (continued) |
| | | | | | | | | | | | | | | | | | | | | |
| (Dollars in millions) | (Dollars in millions) | 2013 | | 2012 | | 2011 | | 2010 | | 2009 | (Dollars in millions) | 2014 | | 2013 | | 2012 | | 2011 | | 2010 |
| Average balance sheet | Average balance sheet | |
| | |
| | |
| | |
| | |
| Average balance sheet | |
| | |
| | |
| | |
| | |
|
| Total loans and leases | Total loans and leases | $ | 918,641 |
| | $ | 898,768 |
| | $ | 938,096 |
| | $ | 958,331 |
| | $ | 948,805 |
| Total loans and leases | $ | 903,901 |
| | $ | 918,641 |
| | $ | 898,768 |
| | $ | 938,096 |
| | $ | 958,331 |
|
| Total assets | Total assets | 2,163,513 |
| | 2,191,356 |
| | 2,296,322 |
| | 2,439,606 |
| | 2,443,068 |
| Total assets | 2,145,590 |
| | 2,163,513 |
| | 2,191,356 |
| | 2,296,322 |
| | 2,439,606 |
|
| Total deposits | Total deposits | 1,089,735 |
| | 1,047,782 |
| | 1,035,802 |
| | 988,586 |
| | 980,966 |
| Total deposits | 1,124,207 |
| | 1,089,735 |
| | 1,047,782 |
| | 1,035,802 |
| | 988,586 |
|
| Long-term debt | Long-term debt | 263,416 |
| | 316,393 |
| | 421,229 |
| | 490,497 |
| | 446,634 |
| Long-term debt | 253,607 |
| | 263,417 |
| | 316,393 |
| | 421,229 |
| | 490,497 |
|
| Common shareholders’ equity | Common shareholders’ equity | 218,468 |
| | 216,996 |
| | 211,709 |
| | 212,686 |
| | 182,288 |
| Common shareholders’ equity | 223,066 |
| | 218,468 |
| | 216,996 |
| | 211,709 |
| | 212,686 |
|
| Total shareholders’ equity | Total shareholders’ equity | 233,947 |
| | 235,677 |
| | 229,095 |
| | 233,235 |
| | 244,645 |
| Total shareholders’ equity | 238,476 |
| | 233,947 |
| | 235,677 |
| | 229,095 |
| | 233,235 |
|
Asset quality (4)(3) | Asset quality (4)(3) | |
| | |
| | |
| | |
| | |
| Asset quality (4)(3) | |
| | |
| | |
| | |
| | |
|
Allowance for credit losses (5)(4) | Allowance for credit losses (5)(4) | $ | 17,912 |
| | $ | 24,692 |
| | $ | 34,497 |
| | $ | 43,073 |
| | $ | 38,687 |
| Allowance for credit losses (5)(4) | $ | 14,947 |
| | $ | 17,912 |
| | $ | 24,692 |
| | $ | 34,497 |
| | $ | 43,073 |
|
Nonperforming loans, leases and foreclosed properties (6)(5) | Nonperforming loans, leases and foreclosed properties (6)(5) | 17,772 |
| | 23,555 |
| | 27,708 |
| | 32,664 |
| | 35,747 |
| Nonperforming loans, leases and foreclosed properties (6)(5) | 12,629 |
| | 17,772 |
| | 23,555 |
| | 27,708 |
| | 32,664 |
|
Allowance for loan and lease losses as a percentage of total loans and leases outstanding (6)(5) | Allowance for loan and lease losses as a percentage of total loans and leases outstanding (6)(5) | 1.90 | % | | 2.69 | % | | 3.68 | % | | 4.47 | % | | 4.16 | % | Allowance for loan and lease losses as a percentage of total loans and leases outstanding (6)(5) | 1.65 | % | | 1.90 | % | | 2.69 | % | | 3.68 | % | | 4.47 | % |
Allowance for loan and lease losses as a percentage of total nonperforming loans and leases (6)(5) | Allowance for loan and lease losses as a percentage of total nonperforming loans and leases (6)(5) | 102 |
| | 107 |
| | 135 |
| | 136 |
| | 111 |
| Allowance for loan and lease losses as a percentage of total nonperforming loans and leases (6)(5) | 121 |
| | 102 |
| | 107 |
| | 135 |
| | 136 |
|
Allowance for loan and lease losses as a percentage of total nonperforming loans and leases, excluding the PCI loan portfolio (6)(5) | Allowance for loan and lease losses as a percentage of total nonperforming loans and leases, excluding the PCI loan portfolio (6)(5) | 87 |
| | 82 |
| | 101 |
| | 116 |
| | 99 |
| Allowance for loan and lease losses as a percentage of total nonperforming loans and leases, excluding the PCI loan portfolio (6)(5) | 107 |
| | 87 |
| | 82 |
| | 101 |
| | 116 |
|
Amounts included in allowance that are excluded from nonperforming loans and leases (7) | $ | 7,680 |
| | $ | 12,021 |
| | $ | 17,490 |
| | $ | 22,908 |
| | $ | 17,690 |
| |
Allowance as a percentage of total nonperforming loans and leases, excluding amounts included in the allowance that are excluded from nonperforming loans and leases (7) | 57 | % | | 54 | % | | 65 | % | | 62 | % | | 58 | % | |
Amounts included in allowance for loan and lease losses for loans and leases that are excluded from nonperforming loans and leases (6) | | Amounts included in allowance for loan and lease losses for loans and leases that are excluded from nonperforming loans and leases (6) | $ | 5,944 |
| | $ | 7,680 |
| | $ | 12,021 |
| | $ | 17,490 |
| | $ | 22,908 |
|
Allowance for loan and lease losses as a percentage of total nonperforming loans and leases, excluding the allowance for loan and lease losses for loans and leases that are excluded from nonperforming loans and leases (5, 6) | | Allowance for loan and lease losses as a percentage of total nonperforming loans and leases, excluding the allowance for loan and lease losses for loans and leases that are excluded from nonperforming loans and leases (5, 6) | 71 | % | | 57 | % | | 54 | % | | 65 | % | | 62 | % |
Net charge-offs (8)(7) | Net charge-offs (8)(7) | $ | 7,897 |
| | $ | 14,908 |
| | $ | 20,833 |
| | $ | 34,334 |
| | $ | 33,688 |
| Net charge-offs (8)(7) | $ | 4,383 |
| | $ | 7,897 |
| | $ | 14,908 |
| | $ | 20,833 |
| | $ | 34,334 |
|
Net charge-offs as a percentage of average loans and leases outstanding (6, 8) | 0.87 | % | | 1.67 | % | | 2.24 | % | | 3.60 | % | | 3.58 | % | |
Net charge-offs as a percentage of average loans and leases outstanding (5, 7) | | Net charge-offs as a percentage of average loans and leases outstanding (5, 7) | 0.49 | % | | 0.87 | % | | 1.67 | % | | 2.24 | % | | 3.60 | % |
Net charge-offs as a percentage of average loans and leases outstanding, excluding the PCI loan portfolio (6)(5) | Net charge-offs as a percentage of average loans and leases outstanding, excluding the PCI loan portfolio (6)(5) | 0.90 |
| | 1.73 |
| | 2.32 |
| | 3.73 |
| | 3.71 |
| Net charge-offs as a percentage of average loans and leases outstanding, excluding the PCI loan portfolio (6)(5) | 0.50 |
| | 0.90 |
| | 1.73 |
| | 2.32 |
| | 3.73 |
|
Net charge-offs and PCI write-offs as a percentage of average loans and leases outstanding (6, 9) | 1.13 |
| | 1.99 |
| | 2.24 |
| | 3.60 |
| | 3.58 |
| |
Net charge-offs and PCI write-offs as a percentage of average loans and leases outstanding (5, 8) | | Net charge-offs and PCI write-offs as a percentage of average loans and leases outstanding (5, 8) | 0.58 |
| | 1.13 |
| | 1.99 |
| | 2.24 |
| | 3.60 |
|
Nonperforming loans and leases as a percentage of total loans and leases outstanding (6)(5) | Nonperforming loans and leases as a percentage of total loans and leases outstanding (6)(5) | 1.87 |
| | 2.52 |
| | 2.74 |
| | 3.27 |
| | 3.75 |
| Nonperforming loans and leases as a percentage of total loans and leases outstanding (6)(5) | 1.37 |
| | 1.87 |
| | 2.52 |
| | 2.74 |
| | 3.27 |
|
Nonperforming loans, leases and foreclosed properties as a percentage of total loans, leases and foreclosed properties (6)(5) | Nonperforming loans, leases and foreclosed properties as a percentage of total loans, leases and foreclosed properties (6)(5) | 1.93 |
| | 2.62 |
| | 3.01 |
| | 3.48 |
| | 3.98 |
| Nonperforming loans, leases and foreclosed properties as a percentage of total loans, leases and foreclosed properties (6)(5) | 1.45 |
| | 1.93 |
| | 2.62 |
| | 3.01 |
| | 3.48 |
|
Ratio of the allowance for loan and lease losses at December 31 to net charge-offs (8)(7) | Ratio of the allowance for loan and lease losses at December 31 to net charge-offs (8)(7) | 2.21 |
| | 1.62 |
| | 1.62 |
| | 1.22 |
| | 1.10 |
| Ratio of the allowance for loan and lease losses at December 31 to net charge-offs (8)(7) | 3.29 |
| | 2.21 |
| | 1.62 |
| | 1.62 |
| | 1.22 |
|
| Ratio of the allowance for loan and lease losses at December 31 to net charge-offs, excluding the PCI loan portfolio | Ratio of the allowance for loan and lease losses at December 31 to net charge-offs, excluding the PCI loan portfolio | 1.89 |
| | 1.25 |
| | 1.22 |
| | 1.04 |
| | 1.00 |
| Ratio of the allowance for loan and lease losses at December 31 to net charge-offs, excluding the PCI loan portfolio | 2.91 |
| | 1.89 |
| | 1.25 |
| | 1.22 |
| | 1.04 |
|
Ratio of the allowance for loan and lease losses at December 31 to net charge-offs and PCI write-offs (9)(8) | Ratio of the allowance for loan and lease losses at December 31 to net charge-offs and PCI write-offs (9)(8) | 1.70 |
| | 1.36 |
| | 1.62 |
| | 1.22 |
| | 1.10 |
| Ratio of the allowance for loan and lease losses at December 31 to net charge-offs and PCI write-offs (9)(8) | 2.78 |
| | 1.70 |
| | 1.36 |
| | 1.62 |
| | 1.22 |
|
Capital ratios at year end (10) | |
| | |
| | |
| | |
| | |
| |
Capital ratios at year end (9) | | Capital ratios at year end (9) | |
| | |
| | |
| | |
| | |
|
| Risk-based capital: | Risk-based capital: | |
| | |
| | |
| | |
| | |
| Risk-based capital: | |
| | |
| | |
| | |
| | |
|
| Common equity tier 1 capital | | Common equity tier 1 capital | 12.3 | % | | n/a |
| | n/a |
| | n/a |
| | n/a |
|
| Tier 1 common capital | Tier 1 common capital | 11.19 | % | | 11.06 | % | | 9.86 | % | | 8.60 | % | | 7.81 | % | Tier 1 common capital | n/a |
| | 10.9 | % | | 10.8 | % | | 9.7 | % | | 8.5 | % |
| Tier 1 capital | Tier 1 capital | 12.44 |
| | 12.89 |
| | 12.40 |
| | 11.24 |
| | 10.40 |
| Tier 1 capital | 13.4 |
| | 12.2 |
| | 12.7 |
| | 12.2 |
| | 11.1 |
|
| Total capital | Total capital | 15.44 |
| | 16.31 |
| | 16.75 |
| | 15.77 |
| | 14.66 |
| Total capital | 16.5 |
| | 15.1 |
| | 16.1 |
| | 16.6 |
| | 15.7 |
|
| Tier 1 leverage | Tier 1 leverage | 7.86 |
| | 7.37 |
| | 7.53 |
| | 7.21 |
| | 6.88 |
| Tier 1 leverage | 8.2 |
| | 7.7 |
| | 7.2 |
| | 7.4 |
| | 7.1 |
|
Tangible equity (3) | 7.86 |
| | 7.62 |
| | 7.54 |
| | 6.75 |
| | 6.40 |
| |
Tangible common equity (3) | 7.20 |
| | 6.74 |
| | 6.64 |
| | 5.99 |
| | 5.56 |
| |
Tangible equity (2) | | Tangible equity (2) | 8.4 |
| | 7.9 |
| | 7.6 |
| | 7.5 |
| | 6.8 |
|
Tangible common equity (2) | | Tangible common equity (2) | 7.5 |
| | 7.2 |
| | 6.7 |
| | 6.6 |
| | 6.0 |
|
For footnotes see page 3130.
|
| | |
3231 Bank of America 20132014
| | |
Supplemental Financial Data
We view net interest income and related ratios and analyses on aan FTE basis, which when presented on a consolidated basis, are non-GAAP financial measures. We believe managing the business with net interest income on aan FTE basis provides a more accurate picture of the interest margin for comparative purposes. To derive the FTE basis, net interest income is adjusted to reflect tax-exempt income on an equivalent before-tax basis with a corresponding increase in income tax expense. For purposes of this calculation, we use the federal statutory tax rate of 35 percent. This measure ensures comparability of net interest income arising from taxable and tax-exempt sources.
Certain performance measures including the efficiency ratio and net interest yield utilize net interest income (and thus total revenue) on aan FTE basis. The efficiency ratio measures the costs expended to generate a dollar of revenue, and net interest yield measures the bps we earn over the cost of funds.
We also evaluate our business based on certain ratios that utilize tangible equity, a non-GAAP financial measure. Tangible equity represents an adjusted shareholders’ equity or common shareholders’ equity amount which has been reduced by goodwill and intangible assets (excluding mortgage servicing rights (MSRs)), net of related deferred tax liabilities. These measures are used to evaluate our use of equity. In addition, profitability, relationship and investment models all use both return on average tangible common shareholders’ equity and return on average tangible shareholders’ equity (ROTE) as key measures to support our overall growth goals. These ratios are as follows:
| |
| Ÿ | Return on average tangible common shareholders’ equity measures our earnings contribution as a percentage of adjusted common shareholders’ equity. The tangible common equity ratio represents adjusted ending common shareholders’ equity divided by total assets less goodwill and intangible assets (excluding MSRs), net of related deferred tax liabilities. |
| |
| Ÿ | ROTEReturn on average tangible shareholders’ equity measures our earnings contribution as a percentage of adjusted average total shareholders’ equity. The tangible equity ratio represents adjusted ending shareholders’ equity divided by total assets less goodwill and intangible assets (excluding MSRs), net of related deferred tax liabilities. |
| |
| Ÿ | Tangible book value per common share represents adjusted ending common shareholders’ equity divided by ending common shares outstanding. |
The aforementioned supplemental data and performance measures are presented in Table 7 and Statistical Table XII. In addition, in Table 8, we have excluded the impact of goodwill impairment charges of $3.2 billion and $12.4 billion recorded in 2011 and 2010 when presenting certain of these metrics. Accordingly, these are non-GAAP financial measures.
We evaluate our business segment results based on measures that utilize returnaverage allocated capital. Return on average allocated capital and prior to January 1, 2013, the return on average economic capital, both of which represent non-GAAP financial measures. These ratios areis calculated as net income adjusted for cost of funds and earnings credits and certain expenses related to intangibles, divided by average allocated capital. Allocated capital or average economic capital, as applicable.and the related return both represent non-GAAP financial measures. In addition, for purposes of goodwill impairment testing, the Corporation utilizes allocated equity as a proxy for the carrying value of its reporting units. Allocated equity forin the business segmentsreporting units is comprised of allocated capital (or economic capital prior to 2013) plus capital for the portion of goodwill and intangibles specifically assigned to the business segment.reporting unit. For additional information, see Business Segment Operations on page 3534 and Note 8 – Goodwill and Intangible Assets to the Consolidated Financial Statements.
In 2009, Common Equivalent Securities were reflected in our reconciliations given the expectation that the underlying Common Equivalent Junior Preferred Stock, Series S would convert into common stock following shareholder approval of additional authorized shares. Shareholders approved the increase in the number of authorized shares of common stock and the Common Equivalent Stock converted into common stock on February 24, 2010.
Statistical Tables XV, XVI and XVII on pages 143134, 144135 and 145136 provide reconciliations of these non-GAAP financial measures to GAAP financial measures. We believe the use of these non-GAAP financial measures provides additional clarity in assessing the results of the Corporation and our segments. Other companies may define or calculate these measures and ratios differently.
| | | | | | | | | | | | | | | | | | | | | | | |
| Table 8 | Five-year Supplemental Financial Data | | | | | | | | | | Five-year Supplemental Financial Data | | | | | | | | | |
| | | | | | | | | | | | | | | | | | | | | |
| (Dollars in millions, except per share information) | (Dollars in millions, except per share information) | 2013 | | 2012 | | 2011 | | 2010 | | 2009 | (Dollars in millions, except per share information) | 2014 | | 2013 | | 2012 | | 2011 | | 2010 |
| Fully taxable-equivalent basis data | Fully taxable-equivalent basis data | |
| | |
| | |
| | |
| | |
| Fully taxable-equivalent basis data | |
| | |
| | |
| | |
| | |
|
Net interest income (1) | Net interest income (1) | $ | 43,124 |
| | $ | 41,557 |
| | $ | 45,588 |
| | $ | 52,693 |
| | $ | 48,410 |
| Net interest income (1) | $ | 40,821 |
| | $ | 43,124 |
| | $ | 41,557 |
| | $ | 45,588 |
| | $ | 52,693 |
|
| Total revenue, net of interest expense | Total revenue, net of interest expense | 89,801 |
| | 84,235 |
| | 94,426 |
| | 111,390 |
| | 120,944 |
| Total revenue, net of interest expense | 85,116 |
| | 89,801 |
| | 84,235 |
| | 94,426 |
| | 111,390 |
|
Net interest yield (1) | Net interest yield (1) | 2.47 | % | | 2.35 | % | | 2.48 | % | | 2.78 | % | | 2.65 | % | Net interest yield (1) | 2.25 | % | | 2.37 | % | | 2.24 | % | | 2.38 | % | | 2.59 | % |
| Efficiency ratio | Efficiency ratio | 77.07 |
| | 85.59 |
| | 85.01 |
| | 74.61 |
| | 55.16 |
| Efficiency ratio | 88.25 |
| | 77.07 |
| | 85.59 |
| | 85.01 |
| | 74.61 |
|
Performance ratios, excluding goodwill impairment charges (2) | Performance ratios, excluding goodwill impairment charges (2) | |
| | |
| | |
| | |
| | |
| Performance ratios, excluding goodwill impairment charges (2) | |
| | |
| | |
| | |
| | |
|
| Per common share information | Per common share information | |
| | |
| | |
| | |
| | |
| Per common share information | |
| | |
| | |
| | |
| | |
|
| Earnings | Earnings | | | | | $ | 0.32 |
| | $ | 0.87 |
| | |
| Earnings | | | | | | | $ | 0.32 |
| | $ | 0.87 |
|
| Diluted earnings | Diluted earnings | | | | | 0.32 |
| | 0.86 |
| | |
| Diluted earnings | | | | | | | 0.32 |
| | 0.86 |
|
| Efficiency ratio (FTE basis) | Efficiency ratio (FTE basis) | | | | | 81.64 | % | | 63.48 | % | | |
| Efficiency ratio (FTE basis) | | | | | | | 81.64 | % | | 63.48 | % |
| Return on average assets | Return on average assets | | | | | 0.20 |
| | 0.42 |
| | |
| Return on average assets | | | | | | | 0.20 |
| | 0.42 |
|
| Return on average common shareholders’ equity | Return on average common shareholders’ equity | | | | | 1.54 |
| | 4.14 |
| | |
| Return on average common shareholders’ equity | | | | | | | 1.54 |
| | 4.14 |
|
| Return on average tangible common shareholders’ equity | Return on average tangible common shareholders’ equity | | | | | 2.46 |
| | 7.03 |
| | |
| Return on average tangible common shareholders’ equity | | | | | | | 2.46 |
| | 7.03 |
|
| Return on average tangible shareholders’ equity | Return on average tangible shareholders’ equity | | | | | 3.08 |
| | 7.11 |
| | |
| Return on average tangible shareholders’ equity | | | | | | | 3.08 |
| | 7.11 |
|
| |
(1) | Net interest income and net interest yield include fees earned on overnightBeginning in 2014, interest-bearing deposits placed with the Federal Reserve and fees earned on deposits, primarily overnight, placed with certain non-U.S. central banks.banks are included in earning assets. In prior periods, these balances were included with cash and due from banks in the cash and cash equivalents line, consistent with the Consolidated Balance Sheet presentation. Prior periods have been reclassified to conform to current period presentation. |
| |
(2) | Performance ratios are calculated excluding the impact of goodwill impairment charges of $3.2 billion and $12.4 billion recorded in 2011 and 2010. |
|
| | |
| | | Bank of America 20132014 3332 |
Net Interest Income Excluding Trading-related Net Interest Income
We manage net interest income on aan FTE basis and excluding the impact of trading-related activities. As discussed in Global Markets on page 4846, we evaluate our sales and trading results and strategies on a total market-based revenue approach by combining net interest income and noninterest income for Global Markets. An analysis of net interest income, average earning assets and net interest yield on earning assets, all of which adjust for the impact of trading-related net interest income from reported net interest income on aan FTE basis, is shown below. We believe the use of this non-GAAP presentation in Table 9 provides additional clarity in assessing our results.
| | | | | | | | | | | |
| Table 9 | Net Interest Income Excluding Trading-related Net Interest Income | Net Interest Income Excluding Trading-related Net Interest Income |
| | | | | | | | | |
| (Dollars in millions) | (Dollars in millions) | 2013 | | 2012 | (Dollars in millions) | 2014 | | 2013 |
| Net interest income (FTE basis) | Net interest income (FTE basis) | |
| | |
| Net interest income (FTE basis) | |
| | |
|
As reported (1) | $ | 43,124 |
| | $ | 41,557 |
| |
| As reported | | As reported | $ | 40,821 |
| | $ | 43,124 |
|
| Impact of trading-related net interest income | Impact of trading-related net interest income | (3,868 | ) | | (3,308 | ) | Impact of trading-related net interest income | (3,615 | ) | | (3,852 | ) |
Net interest income excluding trading-related net interest income (2)(1) | Net interest income excluding trading-related net interest income (2)(1) | $ | 39,256 |
| | $ | 38,249 |
| Net interest income excluding trading-related net interest income (2)(1) | $ | 37,206 |
| | $ | 39,272 |
|
Average earning assets | Average earning assets | |
| | |
| Average earning assets | |
| | |
|
| As reported | As reported | $ | 1,746,974 |
| | $ | 1,769,969 |
| As reported | $ | 1,814,930 |
| | $ | 1,819,548 |
|
| Impact of trading-related earning assets | Impact of trading-related earning assets | (469,048 | ) | | (449,660 | ) | Impact of trading-related earning assets | (445,760 | ) | | (468,999 | ) |
Average earning assets excluding trading-related earning assets (2)(1) | Average earning assets excluding trading-related earning assets (2)(1) | $ | 1,277,926 |
| | $ | 1,320,309 |
| Average earning assets excluding trading-related earning assets (2)(1) | $ | 1,369,170 |
| | $ | 1,350,549 |
|
Net interest yield contribution (FTE basis) | Net interest yield contribution (FTE basis) | |
| | |
| Net interest yield contribution (FTE basis) | |
| | |
|
As reported (1) | 2.47 | % | | 2.35 | % | |
| As reported | | As reported | 2.25 | % | | 2.37 | % |
| Impact of trading-related activities | Impact of trading-related activities | 0.60 |
| | 0.55 |
| Impact of trading-related activities | 0.47 |
| | 0.54 |
|
Net interest yield on earning assets excluding trading-related activities (2)(1) | Net interest yield on earning assets excluding trading-related activities (2)(1) | 3.07 | % | | 2.90 | % | Net interest yield on earning assets excluding trading-related activities (2)(1) | 2.72 | % | | 2.91 | % |
| |
(1) | Net interest income and net interest yield include fees earned on overnight deposits placed with the Federal Reserve and fees earned on deposits, primarily overnight, placed with certain non-U.S. central banks.Represents a non-GAAP financial measure. |
| |
(2) | Represents a non-GAAP financial measure.Beginning in 2014, interest-bearing deposits placed with the Federal Reserve and certain non-U.S. central banks are included in earning assets. In prior periods, these balances were included with cash and due from banks in the cash and cash equivalents line, consistent with the Consolidated Balance Sheet presentation. Prior periods have been reclassified to conform to current period presentation. |
Net interest income excluding trading-related net interest income increaseddecreased $1.02.1 billion to $39.337.2 billion for 20132014 compared to 20122013. The increasedecline was primarily due to reductions in long-term debt balances and yields,the impact of market-related premium amortization expense due to an increase in long-endas lower long-term interest rates andshortened the expected lives of the securities, lower rates paid on deposits, partially offset by lowerloan yields and consumer loan balances, and yields as well as lower net interest income from the discretionary assetALM portfolio. Market-related premium amortization was an expense of $1.2 billion in 2014 compared to a benefit of $784 million in 2013. Partially offsetting the decline were reductions in funding yields, lower long-term debt balances and liability management (ALM) portfolio.commercial loan growth. For more information on the impactsimpact of interest rates, see Interest Rate Risk Management for NontradingNon-trading Activities on page 113.105. For more information on market-related premium amortization, see Note 1 – Summary of Significant Accounting Principles to the Consolidated Financial Statements.
Average earning assets excluding trading-related earning assets decreasedincreased $42.418.6 billion to $1,277.91,369.2 billion, or three percent, for 20132014 compared to 20122013. The decreaseincrease was primarily due toin interest-bearing deposits with the Federal Reserve and commercial loans, partially offset by declines in consumer loans debt securities and other earning assets, partially offset by an increase in commercial loans.assets.
Net interest yield on earning assets excluding trading-related activities increaseddecreased 1719 bps to 3.072.72 percent for 20132014 compared to 20122013 due to the same factors as described above.
|
| | |
3433 Bank of America 20132014
| | |
Business Segment Operations
Segment Description and Basis of Presentation
We report the results of our operations through five business segments: CBB, CRES, GWIM, Global Banking and Global Markets, with the remaining operations recorded in All Other. The primary activities, products or businesses of the business segments and All Otheras of December 31, 2014 are shown below. For additional detailed information, see the business segment and All Other discussions which follow.
Effective January 1, 2015, to align the segments with how we manage the businesses in 2015, the Corporation changed its basis of segment presentation as follows: the Home Loans subsegment within CRES was moved to CBB, and Legacy Assets & Servicing became a separate segment. Also, a portion of the Business Banking business, based on the size of the client relationship, was moved from CBB to Global Banking. Prior periods will be restated to conform to the new segment alignment.
|
| | |
| | | Bank of America 20132014 3534 |
We prepare and evaluate segment results using certain non-GAAP financial measures. For additional information, see Supplemental Financial Data on page 3332. Table 10 provides selected summary financial data for our business segments and All Other for 20132014 compared toand 20122013.
| | | | | | | | | | | | | | | | | | | | | | | | | | | | | | | | | | | |
| Table 10 | Business Segment Results | Business Segment Results |
| | | | | | | | | | | | | | | | | | | | | | | | | | | | | | | | | |
| | | Total Revenue (1) | | Provision for Credit Losses | | Noninterest Expense | | Net Income (Loss) | | Total Revenue (1) | | Provision for Credit Losses | | Noninterest Expense | | Net Income (Loss) |
| (Dollars in millions) | (Dollars in millions) | 2013 | | 2012 | | 2013 | | 2012 | | 2013 | | 2012 | | 2013 | | 2012 | (Dollars in millions) | 2014 | | 2013 | | 2014 | | 2013 | | 2014 | | 2013 | | 2014 | | 2013 |
| Consumer & Business Banking | Consumer & Business Banking | $ | 29,867 |
| | $ | 29,790 |
| | $ | 3,107 |
| | $ | 4,148 |
| | $ | 16,357 |
| | $ | 16,995 |
| | $ | 6,588 |
| | $ | 5,546 |
| Consumer & Business Banking | $ | 29,862 |
| | $ | 29,864 |
| | $ | 2,633 |
| | $ | 3,107 |
| | $ | 15,911 |
| | $ | 16,260 |
| | $ | 7,096 |
| | $ | 6,647 |
|
| Consumer Real Estate Services | Consumer Real Estate Services | 7,716 |
| | 8,751 |
| | (156 | ) | | 1,442 |
| | 16,013 |
| | 17,190 |
| | (5,155 | ) | | (6,439 | ) | Consumer Real Estate Services | 4,848 |
| | 7,715 |
| | 160 |
| | (156 | ) | | 23,226 |
| | 15,815 |
| | (13,395 | ) | | (5,031 | ) |
| Global Wealth & Investment Management | Global Wealth & Investment Management | 17,790 |
| | 16,518 |
| | 56 |
| | 266 |
| | 13,038 |
| | 12,721 |
| | 2,974 |
| | 2,245 |
| Global Wealth & Investment Management | 18,404 |
| | 17,790 |
| | 14 |
| | 56 |
| | 13,647 |
| | 13,033 |
| | 2,974 |
| | 2,977 |
|
| Global Banking | Global Banking | 16,481 |
| | 15,674 |
| | 1,075 |
| | (342 | ) | | 7,552 |
| | 7,619 |
| | 4,974 |
| | 5,344 |
| Global Banking | 16,598 |
| | 16,479 |
| | 336 |
| | 1,075 |
| | 7,681 |
| | 7,551 |
| | 5,435 |
| | 4,973 |
|
| Global Markets | Global Markets | 16,058 |
| | 14,284 |
| | 140 |
| | 34 |
| | 12,013 |
| | 11,295 |
| | 1,563 |
| | 1,229 |
| Global Markets | 16,119 |
| | 15,390 |
| | 110 |
| | 140 |
| | 11,771 |
| | 11,996 |
| | 2,719 |
| | 1,153 |
|
| All Other | All Other | 1,889 |
| | (782 | ) | | (666 | ) | | 2,621 |
| | 4,241 |
| | 6,273 |
| | 487 |
| | (3,737 | ) | All Other | (715 | ) | | 2,563 |
| | (978 | ) | | (666 | ) | | 2,881 |
| | 4,559 |
| | 4 |
| | 712 |
|
| Total FTE basis | Total FTE basis | 89,801 |
| | 84,235 |
| | 3,556 |
| | 8,169 |
| | 69,214 |
| | 72,093 |
| | 11,431 |
| | 4,188 |
| Total FTE basis | 85,116 |
| | 89,801 |
| | 2,275 |
| | 3,556 |
| | 75,117 |
| | 69,214 |
| | 4,833 |
| | 11,431 |
|
| FTE adjustment | FTE adjustment | (859 | ) | | (901 | ) | | — |
| | — |
| | — |
| | — |
| | — |
| | — |
| FTE adjustment | (869 | ) | | (859 | ) | | — |
| | — |
| | — |
| | — |
| | — |
| | — |
|
| Total Consolidated | Total Consolidated | $ | 88,942 |
| | $ | 83,334 |
| | $ | 3,556 |
| | $ | 8,169 |
| | $ | 69,214 |
| | $ | 72,093 |
| | $ | 11,431 |
| | $ | 4,188 |
| Total Consolidated | $ | 84,247 |
| | $ | 88,942 |
| | $ | 2,275 |
| | $ | 3,556 |
| | $ | 75,117 |
| | $ | 69,214 |
| | $ | 4,833 |
| | $ | 11,431 |
|
| |
(1) | Total revenue is net of interest expense and is on aan FTE basis which for consolidated revenue is a non-GAAP financial measure. For more information on this measure, see Supplemental Financial Data on page 3332, and for a corresponding reconciliation to a GAAP financial measure, see Statistical Table XV. |
The management accountingCorporation periodically reviews capital allocated to its businesses and reporting process derives segment and business results by utilizing allocation methodologies for revenue and expense. The net income derived forallocates capital annually during the businesses is dependent upon revenue and cost allocations using an activity-based costing model, funds transfer pricing, and other methodologies and assumptions management believes are appropriate to reflect the results of the business.
Total revenue, net of interest expense, includes net interest income on a FTE basis and noninterest income. The adjustment of net interest income to a FTE basis results in a corresponding increase in income tax expense. The segment results also reflect certain revenue and expense methodologies that are utilized to determine net income. The net interest income of the businesses includes the results of a funds transfer pricing process that matches assets and liabilities with similar interest rate sensitivity and maturity characteristics. For presentation purposes, in segments where the total of liabilities and equity exceeds assets, which are generally deposit-taking segments, we allocate assets to match liabilities. Net interest income of the business segments also includes an allocation of net interest income generated by certain of our ALM activities.
Our ALM activities include an overall interest rate risk management strategy that incorporates the use of various derivatives and cash instruments to manage fluctuations in earningsstrategic and capital that are caused by interest rate volatility. Our goal is to manage interest rate sensitivity so that movements in interest rates do not significantly adversely affect earnings and capital. The results ofplanning processes. We utilize a majority of our ALM activities are allocated to the business segments and fluctuate based on the performance of the ALM activities. ALM activities include external product pricing decisions including deposit pricing strategies, the effects of our internal funds transfer pricing process and the net effects of other ALM activities.
Certain expenses not directly attributable to a specific business segment are allocated to the segments. The most significant of these expenses include data and item processing costs and
certain centralized or shared functions. Data processing costs are allocated to the segments based on equipment usage. Item processing costs are allocated to the segments based on the volume of items processed for each segment. The costs of certain other centralized or shared functions are allocated based on methodologiesmethodology that reflect utilization.
Effective January 1, 2013, on a prospective basis, we adjusted the amount of capital being allocated to our business segments. The adjustment reflected a refinement to the prior-year methodology (economic capital) which focused solely on internal risk-based economic capital models. The refined methodology (allocated capital) now also considers the effect of regulatory capital requirements in addition to internal risk-based economic capital models. The Corporation’s internal risk-based capital models use a risk-adjusted methodology incorporating each segment’s credit, market, interest rate, business and operational risk components. For more information on the nature of these risks, see Managing Risk on page 61 and Strategic Risk Management on page 6555. The capital allocated to the business segments is currently referred to as allocated capital, and, prior to January 1, 2013, was referred to as economic capital, both of which representrepresents a non-GAAP financial measures.measure. For purposes of goodwill impairment testing, the Corporation utilizes allocated equity as a proxy for the carrying value of its reporting units. Allocated equity in the reporting units is comprised of allocated capital plus capital for the portion of goodwill and intangibles specifically assigned to the reporting unit. For additional information, see Note 8 – Goodwill and Intangible Assets to the Consolidated Financial Statements.
Allocated
During 2014, we made refinements to the amount of capital is subjectallocated to change over time, and as parteach of our normal annual planningbusinesses based on multiple considerations that included, but were not limited to, Basel 3 Standardized and Advanced risk-weighted assets, business segment exposures and risk profile, and strategic plans. As a result of this process, in 2014, we adjusted the amount of capital being allocated to our business segments is expected tosegments. This change in the first quarter of 2014. We expect that this change will resultresulted in a reduction of unallocated tangible capital, which is included in All Other, and an aggregate increase toin the amount of capital being allocated to the business segments.segments, primarily Global Banking and Global Markets.
For more information on the business segments and reconciliations to consolidated total revenue, net income (loss) and year-end total assets, see Note 24 – Business Segment Information to the Consolidated Financial Statements.
|
| | |
3635 Bank of America 20132014
| | |
Consumer & Business Banking
| | | | | | | | | | | | | | | | | | | |
| | | Deposits | | Consumer Lending | | Total Consumer & Business Banking | | | | Deposits | | Consumer Lending | | Total Consumer & Business Banking | | |
| (Dollars in millions) | (Dollars in millions) | 2013 | 2012 | | 2013 | 2012 | | 2013 | 2012 | | % Change |
| (Dollars in millions) | 2014 | 2013 | | 2014 | 2013 | | 2014 | 2013 | | % Change |
|
| Net interest income (FTE basis) | Net interest income (FTE basis) | $ | 9,808 |
| $ | 9,046 |
| | $ | 10,243 |
| $ | 10,807 |
| | $ | 20,051 |
| $ | 19,853 |
| | 1 | % | Net interest income (FTE basis) | $ | 10,259 |
| $ | 9,807 |
| | $ | 9,426 |
| $ | 10,243 |
| | $ | 19,685 |
| $ | 20,050 |
| | (2 | )% |
| Noninterest income: | Noninterest income: | | | | | | | | Noninterest income: | | | | | | | |
| Card income | Card income | 60 |
| 62 |
| | 4,744 |
| 5,253 |
| | 4,804 |
| 5,315 |
| | (10 | ) | Card income | 68 |
| 60 |
| | 4,834 |
| 4,744 |
| | 4,902 |
| 4,804 |
| | 2 |
|
| Service charges | Service charges | 4,208 |
| 4,277 |
| | — |
| — |
| | 4,208 |
| 4,277 |
| | (2 | ) | Service charges | 4,364 |
| 4,206 |
| | 1 |
| 1 |
| | 4,365 |
| 4,207 |
| | 4 |
|
| All other income (loss) | 509 |
| 397 |
| | 295 |
| (52 | ) | | 804 |
| 345 |
| | 133 |
| |
| All other income | | All other income | 552 |
| 509 |
| | 358 |
| 294 |
| | 910 |
| 803 |
| | 13 |
|
| Total noninterest income | Total noninterest income | 4,777 |
| 4,736 |
| | 5,039 |
| 5,201 |
| | 9,816 |
| 9,937 |
| | (1 | ) | Total noninterest income | 4,984 |
| 4,775 |
| | 5,193 |
| 5,039 |
| | 10,177 |
| 9,814 |
| | 4 |
|
| Total revenue, net of interest expense (FTE basis) | Total revenue, net of interest expense (FTE basis) | 14,585 |
| 13,782 |
| | 15,282 |
| 16,008 |
| | 29,867 |
| 29,790 |
| | — |
| Total revenue, net of interest expense (FTE basis) | 15,243 |
| 14,582 |
| | 14,619 |
| 15,282 |
| | 29,862 |
| 29,864 |
| | — |
|
| | | | | | | | | | | | | | | | | |
| Provision for credit losses | Provision for credit losses | 299 |
| 488 |
| | 2,808 |
| 3,660 |
| | 3,107 |
| 4,148 |
| | (25 | ) | Provision for credit losses | 254 |
| 299 |
| | 2,379 |
| 2,808 |
| | 2,633 |
| 3,107 |
| | (15 | ) |
| Noninterest expense | Noninterest expense | 10,927 |
| 11,310 |
| | 5,430 |
| 5,685 |
| | 16,357 |
| 16,995 |
| | (4 | ) | Noninterest expense | 10,448 |
| 10,930 |
| | 5,463 |
| 5,330 |
| | 15,911 |
| 16,260 |
| | (2 | ) |
| Income before income taxes | 3,359 |
| 1,984 |
| | 7,044 |
| 6,663 |
| | 10,403 |
| 8,647 |
| | 20 |
| |
| Income before income taxes (FTE basis) | | Income before income taxes (FTE basis) | 4,541 |
| 3,353 |
| | 6,777 |
| 7,144 |
| | 11,318 |
| 10,497 |
| | 8 |
|
| Income tax expense (FTE basis) | Income tax expense (FTE basis) | 1,232 |
| 723 |
| | 2,583 |
| 2,378 |
| | 3,815 |
| 3,101 |
| | 23 |
| Income tax expense (FTE basis) | 1,694 |
| 1,230 |
| | 2,528 |
| 2,620 |
| | 4,222 |
| 3,850 |
| | 10 |
|
| Net income | Net income | $ | 2,127 |
| $ | 1,261 |
| | $ | 4,461 |
| $ | 4,285 |
| | $ | 6,588 |
| $ | 5,546 |
| | 19 |
| Net income | $ | 2,847 |
| $ | 2,123 |
| | $ | 4,249 |
| $ | 4,524 |
| | $ | 7,096 |
| $ | 6,647 |
| | 7 |
|
| | | | | | | | | | | | | | | | | |
| Net interest yield (FTE basis) | Net interest yield (FTE basis) | 1.88 | % | 1.90 | % | | 7.18 | % | 7.18 | % | | 3.72 | % | 4.04 | % | | | Net interest yield (FTE basis) | 1.87 | % | 1.88 | % | | 6.77 | % | 7.18 | % | | 3.48 | % | 3.72 | % | | |
Return on average allocated capital (1) | Return on average allocated capital (1) | 13.82 |
| — |
| | 30.60 |
| — |
| | 21.98 |
| — |
| | | Return on average allocated capital (1) | 17 |
| 14 |
| | 33 |
| 31 |
| | 24 |
| 22 |
| | |
Return on average economic capital (1) | — |
| 9.72 |
| | — |
| 38.83 |
| | — |
| 23.12 |
| | | |
| Efficiency ratio (FTE basis) | Efficiency ratio (FTE basis) | 74.92 |
| 82.07 |
| | 35.53 |
| 35.51 |
| | 54.76 |
| 57.05 |
| | | Efficiency ratio (FTE basis) | 68.54 |
| 74.95 |
| | 37.38 |
| 34.88 |
| | 53.28 |
| 54.44 |
| | |
| | | | | | | | | | | | | | | | | |
| Balance Sheet | | | | | | | | | | | | | | | | |
| | | | | | | | | | | | | | | | | |
| Average | | | | | | | | | | | | | | | | |
| Total loans and leases | Total loans and leases | $ | 22,437 |
| $ | 23,369 |
| | $ | 142,133 |
| $ | 149,667 |
| | $ | 164,570 |
| $ | 173,036 |
| | (5 | ) | Total loans and leases | $ | 22,388 |
| $ | 22,445 |
| | $ | 138,721 |
| $ | 142,129 |
| | $ | 161,109 |
| $ | 164,574 |
| | (2 | ) |
Total earning assets (2) | 522,870 |
| 477,142 |
| | 142,725 |
| 150,515 |
| | 539,213 |
| 491,767 |
| | 10 |
| |
Total assets (2) | 555,653 |
| 510,384 |
| | 151,443 |
| 158,333 |
| | 580,714 |
| 532,827 |
| | 9 |
| |
Total earning assets (1) | | Total earning assets (1) | 548,096 |
| 522,938 |
| | 139,145 |
| 142,721 |
| | 565,700 |
| 539,241 |
| | 5 |
|
Total assets (1) | | Total assets (1) | 580,857 |
| 555,687 |
| | 148,579 |
| 151,434 |
| | 607,895 |
| 580,703 |
| | 5 |
|
| Total deposits | Total deposits | 518,470 |
| 474,822 |
| | n/m |
| n/m |
| | 518,980 |
| 475,180 |
| | 9 |
| Total deposits | 542,589 |
| 518,407 |
| | n/m |
| n/m |
| | 543,441 |
| 518,904 |
| | 5 |
|
Allocated capital (1) | 15,400 |
| — |
| | 14,600 |
| — |
| | 30,000 |
| — |
| | n/m |
| |
Economic capital (1) | — |
| 12,985 |
| | — |
| 11,066 |
| | — |
| 24,051 |
| | n/m |
| |
| Allocated capital | | Allocated capital | 16,500 |
| 15,400 |
| | 13,000 |
| 14,600 |
| | 29,500 |
| 30,000 |
| | (2 | ) |
| | | | | | | | | | | | | | | | | |
| Year end | | | | | | | | | | | | | | | | |
| Total loans and leases | Total loans and leases | $ | 22,574 |
| $ | 22,907 |
| | $ | 142,516 |
| $ | 146,359 |
| | $ | 165,090 |
| $ | 169,266 |
| | (2 | ) | Total loans and leases | $ | 22,284 |
| $ | 22,578 |
| | $ | 141,132 |
| $ | 142,516 |
| | $ | 163,416 |
| $ | 165,094 |
| | (1 | ) |
Total earning assets (2) | 534,946 |
| 498,147 |
| | 143,917 |
| 146,809 |
| | 550,610 |
| 513,109 |
| | 7 |
| |
Total assets (2) | 567,837 |
| 531,354 |
| | 153,394 |
| 155,408 |
| | 592,978 |
| 554,915 |
| | 7 |
| |
Total earning assets (1) | | Total earning assets (1) | 560,130 |
| 535,061 |
| | 141,216 |
| 143,917 |
| | 579,283 |
| 550,698 |
| | 5 |
|
Total assets (1) | | Total assets (1) | 593,485 |
| 567,918 |
| | 150,956 |
| 153,376 |
| | 622,378 |
| 593,014 |
| | 5 |
|
| Total deposits | Total deposits | 530,947 |
| 495,711 |
| | n/m |
| n/m |
| | 531,707 |
| 496,159 |
| | 7 |
| Total deposits | 555,539 |
| 530,860 |
| | n/m |
| n/m |
| | 556,568 |
| 531,608 |
| | 5 |
|
| |
(1) | Effective January 1, 2013, we revised, on a prospective basis, the methodology for allocating capital to the business segments. In connection with the change in methodology, we updated the applicable terminology in the above table to allocated capital from economic capital as reported in prior periods. For additional information, see Business Segment Operations on page 35.
|
| |
(2)
| For presentation purposes, in segments and businesses where the total of liabilities and equity exceeds assets, we allocate assets from All Other to match the segments’ and businesses’ liabilities and allocated shareholders’ equity. As a result, total earning assets and total assets of the businesses may not equal total CBB.
|
n/m = not meaningful
CBB, which is comprised of Deposits and Consumer Lending, offers a diversified range of credit, banking and investment products and services to consumers and businesses. Our customers and clients have access to a franchise network that stretches coast to coast through 3132 states and the District of Columbia. The franchise network includes approximately 5,1004,800 banking centers, 16,30015,800 ATMs, nationwide call centers, and online and mobile platforms. During 2013, Business Banking results were moved into Deposits as we continue to integrate these businesses. Also during 2013, consumer Dealer Financial Services (DFS) results were moved into CBB from Global Banking to align this business more closely with our consumer lending activity and better serve the needs of our customers. As a result, Card Services was renamed Consumer Lending. Prior periods were reclassified to conform to current period presentation.
CBB Results
Net income for CBB increased $1.0 billion449 million to $6.67.1 billion in 20132014 compared to 20122013 primarily driven by lower provision for credit losses, higher noninterest income and lower noninterest expense.expense, partially offset by lower net interest income. Net interest income ofdecreased $365 million to $20.119.7 billion remained relatively unchangeddue to lower average loan balances and card yields, partially offset by the beneficial impact of an increase in investable assets as the impacta result of higher deposit balances was offset by the impact of lower average loan balances. Noninterest income ofincreased $363 million to $9.810.2 billion remained relatively unchanged as the allocation of certain card revenue to GWIM for clients with a credit card, as described below, and lower deposit service charges were offset by the net impact of consumer protection products, primarily due to portfolio divestiture gains, higher service charges recorded in 2012.and higher card income, partially offset by lower revenue from consumer protection products.
The provision for credit losses decreased $1.0 billion474 million to $3.12.6 billion in 20132014 primarily as a result of improvements in credit
quality. Noninterest expense decreased$638 $349 million to $16.415.9 billion primarily driven by lower operating, personnellitigation and FDICFederal Deposit Insurance Corporation (FDIC) expenses.
The return on average allocated capital was 24 percent, up from 22 percent, reflecting an increase in net income combined with a small decrease in allocated capital. For more information on capital allocated to the business segments, see Business Segment Operations on page 34.
Deposits
Deposits includes the results of consumer deposit activities which consist of a comprehensive range of products provided to consumers and small businesses. Our deposit products include traditional savings accounts, money market savings accounts, CDs and IRAs, noninterest- and interest-bearing checking accounts, as well as investment accounts and products. The revenue is allocated to the deposit products using our funds transfer pricing process that matches assets and liabilities with similar interest rate sensitivity and maturity characteristics. Deposits generates fees such as account service fees, non-sufficient funds fees, overdraft charges and ATM fees, as well as investment and brokerage fees from Merrill Edge accounts. Merrill Edge is an integrated investing and banking service targeted at customers
with less than $250,000 in investable assets. Merrill Edge provides investment advice and guidance, client brokerage asset services, a self-directed online investing platform and key banking capabilities including access to the Corporation’s network of banking centers and ATMs.
Business Banking within Deposits provides a wide range of lending-related products and services, integrated working capital management and treasury solutions to clients through our network of offices and client relationship teams along with various product partners. Our clients include U.S.-based companies generally with annual sales of $1 million to $50 million. Our lending products and services include commercial loans, lines of credit and real estate lending. Our capital management and treasury solutions include treasury management, foreign exchange and short-term investing options. Deposits also includes the results of our merchant services joint venture.
Deposits includes the net impact of migrating customers and their related deposit balances between Deposits and GWIM as well as other client-managed businesses. For more information on the migration of customer balances to or from GWIM, see GWIM on page 4442.
Net income for Deposits increased $866724 million to $2.12.8 billion in 20132014 driven by higher revenue and a decrease in noninterest expense and lower provision for credit losses.expense. Net interest income increased $762452 million to $9.810.3 billion primarily driven by a combination of pricing discipline and the beneficial impact of an increase in investable assets as a result of higher deposit balances, a customer shiftbalances. Noninterest income increased $209 million to $5.0 billion primarily due to higher spread liquid products and continued pricing discipline, partially offset by compressed deposit spreads due to the continued low rate environment. Noninterest income of $4.8 billion remained relatively unchanged.service charges.
The provision for credit losses decreased $189$45 million to $299$254 million in 2013 due to improvementsas a result of improvement in credit quality in Business Banking.quality. Noninterest expense decreased $383482 million to $10.910.4 billion due to lower operating personnelexpenses, driven in part by a reduction in banking centers as customers migrate to self-service touchpoints, in addition to lower FDIC and FDIC expenses.litigation expense.
Average loans decreased $932 million to $22.4 billion in 2013 primarily driven by continued run-off of non-core portfolios. Average deposits increased $43.624.2 billion to $518.5542.6 billion in 20132014 driven by a continuing customer shift to more liquid products in the low rate environment. Additionally, $15.5 billion of the increase in average deposits was due to net transfers from other businesses, largely GWIM. Growth in checking, traditional savings and money market savings of $49.5$34.7 billion was partially offset by a decline in time deposits of $5.9$10.5 billion. As a result of our continued pricing discipline and the shift in the mix of deposits, the rate paid on average deposits declined by sevenfive bps to 11six bps.
| | | | | | | | | |
| Key Statistics | | | | |
Key Statistics – Deposits | | | | |
| | | | | | | |
| | 2013 | | 2012 | 2014 | | 2013 |
| Total deposit spreads (excludes noninterest costs) | 1.52 | % | | 1.81 | % | 1.59 | % | | 1.52 | % |
| | | | | | | |
| Year end | | | | | | |
| Client brokerage assets (in millions) | $ | 96,048 |
| | $ | 75,946 |
| $ | 113,763 |
| | $ | 96,048 |
|
| Online banking active accounts (units in thousands) | 29,950 |
| | 29,638 |
| 30,904 |
| | 29,950 |
|
| Mobile banking active accounts (units in thousands) | 14,395 |
| | 12,013 |
| 16,539 |
| | 14,395 |
|
| Banking centers | 5,151 |
| | 5,478 |
| 4,855 |
| | 5,151 |
|
| ATMs | 16,259 |
| | 16,347 |
| 15,838 |
| | 16,259 |
|
Client brokerage assets increased $20.1$17.7 billion in 20132014 driven by market valuations andnew accounts, increased account flows.flows and higher market valuations. Mobile banking customersactive accounts increased 2.42.1 million reflecting continuing changes in our customers’ banking preferences. The number of banking centers declined 327296 and ATMs declined 88421 as we continue to optimize our consumer banking network and improve our cost-to-serve.
Consumer Lending
Consumer Lending is one of the leading issuers of credit and debit cards to consumers and small businesses in the U.S. Our lending products and services also include direct and indirect consumer loans such as automotive, marine, aircraft, recreational vehicle and consumer personal loans. In addition to earning net interest spread revenue on its lending activities, Consumer Lending generates interchange revenue from credit and debit card transactions as well as annual credit card fees and other miscellaneous fees.
Beginning in March 2013, the revenue and expense associated with GWIM clients that hold credit cards was allocated to GWIM. Beginning in the fourth quarter of 2013, Consumer Lending migrated theseincludes the net impact of migrating customers and their related credit card loan balances tobetween Consumer Lending and GWIM. For more information on the migration of customer balances to or from GWIM, see GWIM on page 4442.
On July 31, 2013, the U.S. District Court for the District of Columbia issued a ruling regarding the Federal Reserve’s rules implementing the Dodd-Frank Wall Street Reform and Consumer Protection Act’s (Financial Reform Act) Durbin Amendment. The ruling requires the Federal Reserve to reconsider the current $0.21 per transaction cap on debit card interchange fees. The Federal Reserve is appealing the ruling and final resolution is expected in the first half of 2014. If the Federal Reserve, upon final resolution, implements a lower per transaction cap than the initial range, it may have a significant adverse impact on our debit card interchange fee revenue.
Net income for Consumer Lending increaseddecreased $176275 million to $4.54.2 billion in 20132014 asprimarily due to lower net interest income and higher noninterest expense, partially offset by lower provision for credit losses and higher noninterest expense were partially offset by a decrease in revenue.income. Net interest income decreased $564817 million to $10.29.4 billion driven by the impact of lower average loan balances.balances and card yields. Noninterest income decreased$162increased $154 million to $5.05.2 billion driven by the allocation of certainportfolio divestiture gains and higher card revenue to GWIM for clients with a credit card and the net impact of portfolio sales,income, partially offset by the net impact oflower revenue from consumer protection products, primarily due to charges recorded in 2012.products.
The provision for credit losses decreased $852429 million to $2.82.4 billion in 20132014 due to improvementsas a result of continued improvement in credit quality.quality, due in part to lower delinquencies. Noninterest expense decreasedincreased $255133 million to $5.45.5 billion driven by higher operating expenses, partially offset by lower operating and personnel expenses.litigation expense.
Average loans decreased $7.53.4 billion to $142.1138.7 billion in 20132014 primarily driven by charge-offs andthe net migration of credit card loan balances to GWIM as described above, continued run-off of non-core portfolios.portfolios and portfolio divestitures, partially offset by an increase in small business lending and consumer auto loans.
| | | | | | | | | |
| Key Statistics | | | | |
Key Statistics – Consumer Lending | | | | |
| | | | | | | |
| (Dollars in millions) | 2013 | | 2012 | 2014 | | 2013 |
Total Corporation U.S. credit card (1) | | | | |
Total U.S. credit card (1) | | | | |
| Gross interest yield | 9.73 | % | | 10.02 | % | 9.34 | % | | 9.73 | % |
| Risk-adjusted margin | 8.68 |
| | 7.54 |
| 9.44 |
| | 8.68 |
|
| New accounts (in thousands) | 3,911 |
| | 3,258 |
| 4,541 |
| | 3,911 |
|
| Purchase volumes | $ | 205,914 |
| | $ | 193,500 |
| $ | 212,088 |
| | $ | 205,914 |
|
| Debit card purchase volumes | $ | 267,087 |
| | $ | 258,363 |
| $ | 272,576 |
| | $ | 267,087 |
|
| |
(1) | In addition to theTotal U.S. credit card portfolioincludes portfolios in CBB, the remaining U.S. credit card portfolio is inand GWIM.
|
During 20132014, the total Corporation U.S. credit card risk-adjusted margin increased 11476 bps due to an improvement in credit quality. During 2013, total Corporationquality and portfolio divestiture gains. Total U.S. credit card purchase volumes increased $12.46.2 billion, or six percent, to $205.9212.1 billion and debit card purchase volumes increased $8.75.5 billion, or three percent, to $267.1272.6 billion, reflecting higher levels of consumer spending.
|
| | |
| | 37Bank of America 2013392014 | | |
Consumer Real Estate Services
| | | | | | | | | | | | | | | | | | | |
|
| Home Loans | | Legacy Assets & Servicing | | Total Consumer Real Estate Services | | |
| Home Loans | | Legacy Assets & Servicing | | Total Consumer Real Estate Services | | |
| (Dollars in millions) | (Dollars in millions) | 2013 | 2012 | | 2013 | 2012 | | 2013 | 2012 | | % Change | (Dollars in millions) | 2014 | 2013 | | 2014 | 2013 | | 2014 | 2013 | | % Change |
| Net interest income (FTE basis) | Net interest income (FTE basis) | $ | 1,349 |
| $ | 1,361 |
| | $ | 1,541 |
| $ | 1,569 |
| | $ | 2,890 |
| $ | 2,930 |
| | (1 | )% | Net interest income (FTE basis) | $ | 1,315 |
| $ | 1,349 |
| | $ | 1,516 |
| $ | 1,541 |
| | $ | 2,831 |
| $ | 2,890 |
| | (2 | )% |
| Noninterest income: | Noninterest income: | | | | | | | | Noninterest income: | | | | | | | |
| Mortgage banking income | Mortgage banking income | 1,916 |
| 3,284 |
| | 2,669 |
| 2,269 |
| | 4,585 |
| 5,553 |
| | (17 | ) | Mortgage banking income | 813 |
| 1,916 |
| | 1,053 |
| 2,669 |
| | 1,866 |
| 4,585 |
| | (59 | ) |
| All other income (loss) | All other income (loss) | (6 | ) | 1 |
| | 247 |
| 267 |
| | 241 |
| 268 |
| | (10 | ) | All other income (loss) | 40 |
| (6 | ) | | 111 |
| 246 |
| | 151 |
| 240 |
| | (37 | ) |
| Total noninterest income | Total noninterest income | 1,910 |
| 3,285 |
| | 2,916 |
| 2,536 |
| | 4,826 |
| 5,821 |
| | (17 | ) | Total noninterest income | 853 |
| 1,910 |
| | 1,164 |
| 2,915 |
| | 2,017 |
| 4,825 |
| | (58 | ) |
| Total revenue, net of interest expense (FTE basis) | Total revenue, net of interest expense (FTE basis) | 3,259 |
| 4,646 |
| | 4,457 |
| 4,105 |
| | 7,716 |
| 8,751 |
| | (12 | ) | Total revenue, net of interest expense (FTE basis) | 2,168 |
| 3,259 |
| | 2,680 |
| 4,456 |
| | 4,848 |
| 7,715 |
| | (37 | ) |
| | | | | | | | | | | | | | | | | |
| Provision for credit losses | Provision for credit losses | 127 |
| 72 |
| | (283 | ) | 1,370 |
| | (156 | ) | 1,442 |
| | n/m |
| Provision for credit losses | 33 |
| 127 |
| | 127 |
| (283 | ) | | 160 |
| (156 | ) | | n/m |
|
| Noninterest expense | Noninterest expense | 3,318 |
| 3,195 |
| | 12,695 |
| 13,995 |
| | 16,013 |
| 17,190 |
| | (7 | ) | Noninterest expense | 2,587 |
| 3,334 |
| | 20,639 |
| 12,481 |
| | 23,226 |
| 15,815 |
| | 47 |
|
| Income (loss) before income taxes | (186 | ) | 1,379 |
| | (7,955 | ) | (11,260 | ) | | (8,141 | ) | (9,881 | ) | | (18 | ) | |
| Income tax expense (benefit) (FTE basis) | (68 | ) | 502 |
| | (2,918 | ) | (3,944 | ) | | (2,986 | ) | (3,442 | ) | | (13 | ) | |
| Net income (loss) | $ | (118 | ) | $ | 877 |
| | $ | (5,037 | ) | $ | (7,316 | ) | | $ | (5,155 | ) | $ | (6,439 | ) | | (20 | ) | |
| Loss before income taxes (FTE basis) | | Loss before income taxes (FTE basis) | (452 | ) | (202 | ) | | (18,086 | ) | (7,742 | ) | | (18,538 | ) | (7,944 | ) | | 133 |
|
| Income tax benefit (FTE basis) | | Income tax benefit (FTE basis) | (169 | ) | (74 | ) | | (4,974 | ) | (2,839 | ) | | (5,143 | ) | (2,913 | ) | | 77 |
|
| Net loss | | Net loss | $ | (283 | ) | $ | (128 | ) | | $ | (13,112 | ) | $ | (4,903 | ) | | $ | (13,395 | ) | $ | (5,031 | ) | | n/m |
|
| | | | | | | | | | | | | | | | | |
| Net interest yield (FTE basis) | Net interest yield (FTE basis) | 2.54 | % | 2.41 | % | | 3.19 | % | 2.45 | % | | 2.85 | % | 2.43 | % | | | Net interest yield (FTE basis) | 2.40 | % | 2.54 | % | | 4.03 | % | 3.19 | % | | 3.06 | % | 2.85 | % | | |
| Efficiency ratio (FTE basis) | n/m |
| 68.77 |
| | n/m |
| n/m |
| | n/m |
| n/m |
| | | |
| | | | | | | | | | | | | | | | | |
| Balance Sheet | | | | | | | | | | | | | | | | |
| | | | | | | | | | | | | | | | | |
| Average | | | | | | | | | | | | | | | | |
| Total loans and leases | Total loans and leases | $ | 47,675 |
| $ | 50,023 |
| | $ | 42,603 |
| $ | 53,501 |
| | $ | 90,278 |
| $ | 103,524 |
| | (13 | ) | Total loans and leases | $ | 52,336 |
| $ | 47,675 |
| | $ | 35,941 |
| $ | 42,603 |
| | $ | 88,277 |
| $ | 90,278 |
| | (2 | ) |
| Total earning assets | Total earning assets | 53,148 |
| 56,581 |
| | 48,272 |
| 64,055 |
| | 101,420 |
| 120,636 |
| | (16 | ) | Total earning assets | 54,778 |
| 53,148 |
| | 37,593 |
| 48,272 |
| | 92,371 |
| 101,420 |
| | (9 | ) |
| Total assets | Total assets | 53,429 |
| 57,552 |
| | 67,131 |
| 87,817 |
| | 120,560 |
| 145,369 |
| | (17 | ) | Total assets | 54,751 |
| 53,426 |
| | 52,134 |
| 67,130 |
| | 106,885 |
| 120,556 |
| | (11 | ) |
Allocated capital (1) | 6,000 |
| — |
| | 18,000 |
| — |
| | 24,000 |
| — |
| | n/m |
| |
Economic capital (1) | — |
| 3,734 |
| | — |
| 9,942 |
| | — |
| 13,676 |
| | n/m |
| |
| Allocated capital | | Allocated capital | 6,000 |
| 6,000 |
| | 17,000 |
| 18,000 |
| | 23,000 |
| 24,000 |
| | (4 | ) |
| | | | | | | | | | | | | | | | | |
| Year end | | | | | | | | | | | | | | | | |
| Total loans and leases | Total loans and leases | $ | 51,021 |
| $ | 47,742 |
| | $ | 38,732 |
| $ | 46,918 |
| | $ | 89,753 |
| $ | 94,660 |
| | (5 | ) | Total loans and leases | $ | 54,917 |
| $ | 51,021 |
| | $ | 33,055 |
| $ | 38,732 |
| | $ | 87,972 |
| $ | 89,753 |
| | (2 | ) |
| Total earning assets | Total earning assets | 54,071 |
| 54,394 |
| | 43,092 |
| 52,580 |
| | 97,163 |
| 106,974 |
| | (9 | ) | Total earning assets | 57,881 |
| 54,071 |
| | 33,922 |
| 43,092 |
| | 91,803 |
| 97,163 |
| | (6 | ) |
| Total assets | Total assets | 53,927 |
| 55,465 |
| | 59,459 |
| 75,594 |
| | 113,386 |
| 131,059 |
| | (13 | ) | Total assets | 57,772 |
| 53,933 |
| | 45,958 |
| 59,458 |
| | 103,730 |
| 113,391 |
| | (9 | ) |
| |
(1)
| Effective January 1, 2013, we revised, on a prospective basis, the methodology for allocating capital to the business segments. In connection with the change in methodology, we updated the applicable terminology in the above table to allocated capital from economic capital as reported in prior periods. For additional information, see Business Segment Operations on page 35.
|
n/m = not meaningful
CRES operations include Home Loans and Legacy Assets & Servicing. Home Loans is responsible for ongoing residential first mortgage and home equity loan production activities and the CRES home equity loan portfolio not selected for inclusion in the Legacy Assets & Servicing owned portfolio. Legacy Assets & Servicing is responsible for all of our mortgage servicing activities related to loans serviced for others and loans held by the Corporation, including loans that have been designated as the Legacy Assets & Servicing Portfolios. The Legacy Assets & Servicing Portfolios (both owned and serviced), herein referred to as the Legacy Owned and Legacy Serviced Portfolios, respectively (together, the Legacy Portfolios), and as further defined below, include those loans originated prior to January 1, 2011 that would not have been originated under our established underwriting standards as of December 31, 2010. For more information on our Legacy Portfolios, see page 4139. In addition, Legacy Assets & Servicing is responsible for managing legacy exposures related to CRES (e.g., litigation, representations and warranties). This alignment allows CRES management to lead the ongoing Home Loans business while also providing focus on legacy mortgage issues and servicing activities.
CRES, primarily through its Home Loans operations, generates revenue by providing an extensive line of consumer real estate products and services to customers nationwide. CRES products offered by Home Loans include fixed- and adjustable-rate first-lien mortgage loans for home purchase and refinancing needs, home equity lines of credit (HELOCs) and home equity loans. First
mortgage products are generally either sold into the secondary mortgage market to investors, while we retain MSRs (which are on the balance sheet of Legacy Assets & Servicing) and the Bank
of America customer relationships, or are held on the balance sheet in Home Loans or in All Other for ALM purposes. Home Loans is compensated for loans held for ALM purposes on a management accounting basis with the corresponding offset in All Other. Newly originated HELOCs and home equity loans are retained on the CRES balance sheet in Home Loans.
CRES includes the impact of migrating certain customers and their related loan balances betweenfrom GWIM andto CRES. For more information on the transfermigration of customer balances to or from GWIM, see GWIM on page 4442.
CRES Results
The net loss for CRES decreasedincreased $1.38.4 billion to a net loss of $5.213.4 billion for 20132014 compared to 20122013 primarily driven by higher litigation expense, which is included in noninterest expense, as a result of the settlements with the DoJ and FHFA, a lower tax benefit rate resulting from the non-deductible treatment of a portion of the settlement with the DoJ, lower mortgage banking income and lowerhigher provision for credit losses and lower noninterest expense, partially offset by lower mortgage banking income. losses.
Mortgage banking income decreased $1.02.7 billion due to both lower servicing income and lower core production revenue, partially offset by a decrease of $3.1 billion inlower representations and warranties provision as 2012 included provision related to the January 6, 2013 settlement with FNMA (the FNMA Settlement).provision. The provision for credit losses improvedincreased $1.6 billion316 million to a benefit of $156$160 million primarily driven by improved delinquencies,additional costs associated with the consumer relief portion of the settlement with the DoJ, partially offset by the continued improvement in portfolio trends including increased home pricesprices. Noninterest expense increased $7.4 billion primarily due to a $11.4 billion increase in litigation expense as a result of the settlements with the DoJ and continuedFHFA. Excluding litigation,
|
| | |
| | 40Bank of America 2013201438
| | |
loan balance run-off. Noninterestnoninterest expense decreased $1.2 $4.0 billion primarily due to lower operating$8.0 billion driven by a decline in default-related servicing expenses, including mortgage-related assessments, waivers and similar costs related to foreclosure delays in Legacy Assets & Servicing partially offset by higher litigation expense.and a decline in personnel expense resulting from lower loan originations in Home Loans.
Home Loans
Home Loans products are available to our customers through our retail network, direct telephone and online access delivered by a sales force of 3,200nearly 2,500 mortgage loan officers, including 1,7001,500 banking center mortgage loan officers covering nearly 2,5002,600 banking centers, and a 900-personnearly 700-person centralized sales force based in five call centers.
Net incomeThe net loss for Home Loans decreasedincreased $995155 million to a net loss of $118283 million driven by a decrease in noninterestlower mortgage banking income, an increase inpartially offset by lower noninterest expense and higherlower provision for credit losses. NoninterestMortgage banking income decreased $1.4$1.1 billion due to lower mortgage banking income driven by a decline in core production revenue as a result of continuedlower first mortgage origination volumes, and to a lesser extent, industry-wide margin compression and lower loan application volumes.compression. The provision for credit losses increased $55decreased $94 million reflecting a slower rate of credit qualitycontinued improvement than in 2012.portfolio trends including increased home prices. Noninterest expense increased $123decreased $747 million primarily due to higher production costs. The higher production costs were primarily personnel-related as we added mortgagelower personnel expense resulting from lower loan officers earlier in 2013, primarily in banking centers, and other employees in sales and fulfillment areas in order to expand capacity and enhance customer service. While staffing increased in early 2013, total staffing at year end decreased approximately 21 percent from December 31, 2012 following a sharp decline in the market demand for mortgages late in 2013, which is expected to continue into 2014.originations.
Legacy Assets & Servicing
Legacy Assets & Servicing is responsible for all of our in-house servicing activities related to the residential mortgage and home equity loan portfolios, including owned loans and loans serviced for others (collectively, the mortgage serviced portfolio). A portion of this portfolio has been designated as the Legacy Serviced Portfolio, which represented 26 percent, 30 percent 38 percent and 4239 percent of the total mortgage serviced portfolio, as measured by unpaid principal balance, at December 31, 20132014, 2013 and 2012, and 2011, respectively. In addition, Legacy Assets & Servicing is responsible for managing subservicing agreements.
Legacy Assets & Servicing results reflect the net cost of legacy exposures that are included in the results of CRES, including representations and warranties provision, litigation expense, financial results of the CRES home equity portfolio selected as part of the Legacy Owned Portfolio, the financial results of the servicing operations and the results of MSR activities, including net hedge results. The financial results of the servicing operations reflect certain revenues and expenses on loans serviced for others, including owned loans serviced for Home Loans, GWIM and All Other.
Servicing activities include collecting cash for principal, interest and escrow payments from borrowers, disbursing customer draws for lines of credit, accounting for and remitting principal and interest payments to investors and escrow payments to third parties, and responding to customer inquiries. Our home retention efforts, including single point of contact resources, are also part of our servicing activities, along with the supervision of
foreclosures and property dispositions. In an effortPrior to help our customers avoid foreclosure, Legacy Assets & Servicing evaluates various workout options priorin an effort to foreclosure which, combined with legislative changes at the state level and ongoing foreclosure delays in states where foreclosure requires a court order following
a legal proceeding (judicial states), have resulted in elongated default timelines.help our customers avoid foreclosure. For more information on our servicing activities, including the impact of foreclosure delays, see Off-Balance Sheet Arrangements and Contractual Obligations – Servicing, Foreclosure and Other Mortgage Matters on page 5753.
The net loss for Legacy Assets & Servicing decreasedincreased $2.38.2 billion to a net loss of $5.013.1 billion driven by higher litigation expense, which is included in noninterest expense, a decrease inlower tax benefit rate resulting from the non-deductible treatment of a portion of the settlement with the DoJ, lower mortgage banking income and higher provision for credit losses, a decrease in noninterest expense and an increase in noninterest income. Noninterestlosses.
Mortgage banking income increased $380 million due to lower representations and warranties provision, largely offset by lower servicing incomedecreased $1.6 billion primarily driven by a decline in theservicing income due to a smaller servicing portfolio combined with less favorable MSR net-of-hedge performance and the divestiture of an ancillary servicing business in 2012.performance. The provision for credit losses decreased $1.7 billion to a benefit of $283increased $410 million primarily driven by improved delinquencies, increased home prices and continued loan balance run-off.
Noninterest expense decreased $1.3 billion primarily due to a $1.6additional costs associated with the consumer relief portion of the settlement with the DoJ.
Noninterest expense increased $8.2 billion decrease in default-related staffing and other default-related servicing expenses, lower costsdue to higher litigation expense as a result of the divestiture of an ancillarysettlements with the DoJ and FHFA. Excluding litigation, noninterest expense decreased $3.3 billion to $5.4 billion driven by a decrease in default-related servicing business in 2012 and lowerexpenses, including mortgage-related assessments, waivers and similar costs related to foreclosure delays. Noninterest expense in 2012 included a $1.1 billion provision for the 2013 IFR Acceleration Agreement. These improvements were partially offset by an increase of $2.2 billion in litigation expense driven by residential mortgage-backed
securities (RMBS) exposures and the settlement with MBIA Inc. and certain of its affiliates (MBIA) in 2013 (the MBIA Settlement). For more information on the 2013 IFR Acceleration Agreement, see Off-Balance Sheet Arrangements and Contractual Obligations on page 52 and for more information on RMBS litigation, see Note 12 – Commitments and Contingenciesto the Consolidated Financial Statements. We expect that noninterest expense in Legacy Assets & Servicing, excluding litigation to decreaseexpense, will decline to approximately $1.1 billion$800 million per quarter by the fourth quarterend of 2014 compared to $1.8 billion during the fourth quarter of 2013.2015.
Legacy Portfolios
The Legacy Portfolios (both owned and serviced) include those loans originated prior to January 1, 2011 that would not have been originated under our established underwriting standards in place as of December 31, 2010. The purchased credit-impaired (PCI) portfoliosportfolio, as well as certain loans that met a pre-defined delinquency status or probability of default threshold as of January 1, 2011, are also included in the Legacy Portfolios. Since determining the pool of loans to be included in the Legacy Portfolios as of January 1, 2011, the criteria have not changed for these portfolios, but will continue to be evaluated over time.
Legacy Owned Portfolio
The Legacy Owned Portfolio includes those loans that met the criteria as described above and are on the balance sheet of the Corporation. The home equity loan portfolio is held on the balance sheet of Legacy Assets & Servicing, and the residential mortgage loan portfolio is held on the balance sheet of All Other. The financial results of the on-balance sheet loans are reported in the segment that owns the loans or in All Other. Total loans in the Legacy Owned Portfolio decreased $19.022.2 billion in 20132014 to $112.189.9 billion at December 31, 20132014, of which $38.733.1 billion waswere held on the Legacy Assets & Servicing balance sheet and the remainder was held on the balance sheet of All Other. The decrease was primarily related to paydowns, loan sales, PCI write-offs and charge-offs.
|
| | |
| | 39Bank of America 2013412014 | | |
to paydowns, PCI write-offs, charge-offs and loan sales, partially offset by the addition of loans repurchased in connection with the FNMA Settlement. For more information on the loans repurchased in connection with the FNMA Settlement, see Consumer Portfolio Credit Risk Management on page 77.
Legacy Serviced Portfolio
The Legacy Serviced Portfolio includes loans serviced by Legacy Assets & Servicing in both the Legacy Owned Portfolio and those loans serviced for outside investors that met the criteria as described above. The table below summarizes the balances of the residential mortgage loans included in the Legacy Serviced Portfolio (the Legacy Residential Mortgage Serviced Portfolio) representing 24 percent, 28 percent 38 percent and 4138 percent of the total residential mortgage serviced portfolio of $609 billion, $719 billion $1.2 trillion and $1.6$1.2 trillion, as measured by unpaid principal balance, at December 31, 20132014, 20122013 and 20112012, respectively. The decline in the Legacy Residential Mortgage Serviced Portfolio in 2013was primarily due to MSR sales, loan sales and other servicing transfers, modifications, paydowns and payoffs.
| | | | | | | | | | | | | | | |
Legacy Residential Mortgage Serviced Portfolio, a subset of the Residential Mortgage Serviced Portfolio (1, 2) | |
Legacy Residential Mortgage Serviced Portfolio, a subset of the Residential Mortgage Serviced Portfolio (1) | | Legacy Residential Mortgage Serviced Portfolio, a subset of the Residential Mortgage Serviced Portfolio (1) |
| | | | | | | | | | | | | |
| | | December 31 | | December 31 |
| (Dollars in billions) | | 2013 | | 2012 | | 2011 | | 2014 | | 2013 | | 2012 |
| Unpaid principal balance | | | | | | | | | | | | |
| Residential mortgage loans | | | | | | | | | | | | |
| Total | | $ | 203 |
| | $ | 467 |
| | $ | 659 |
| | $ | 148 |
| | $ | 203 |
| | $ | 467 |
|
| 60 days or more past due | | 49 |
| | 137 |
| | 235 |
| | 25 |
| | 49 |
| | 137 |
|
| | | | | | | | | | | | | |
| Number of loans serviced (in thousands) | | | | | | | | | | | | |
| Residential mortgage loans | | | | | | | | | | | | |
| Total | | 1,083 |
| | 2,542 |
| | 3,440 |
| | 794 |
| | 1,083 |
| | 2,542 |
|
| 60 days or more past due | | 258 |
| | 649 |
| | 1,061 |
| | 135 |
| | 258 |
| | 649 |
|
| |
(1) | Excludes loans for which servicing transferred to third parties as of December 31, 2013, with an effective MSR sale date of January 2, 2014, totaling $57 million34 billion of unpaid principal balance. |
| |
(2)
| Excludes, $39 billion, and $52 billion and $84 billion of home equity loans and HELOCs at December 31, 20132014, 20122013 and 20112012, respectively.
|
Non-Legacy Portfolio
As previously discussed, Legacy Assets & Servicing is responsible for all of our servicing activities. The table below summarizes the balances of the residential mortgage loans that are not included in the Legacy Serviced Portfolio (the Non-Legacy Residential Mortgage Serviced Portfolio) representing 76 percent, 72 percent 62 percent and 5962 percent of the total residential mortgage serviced portfolio, as measured by unpaid principal balance, at December 31, 20132014, 20122013 and 2011,2012, respectively. The decline in the Non-Legacy Residential Mortgage Serviced Portfolio was primarily due to MSR sales and other servicing transfers, paydowns and payoffs. | | | | | | | | | | | | | | | |
Non-Legacy Residential Mortgage Serviced Portfolio, a subset of the Residential Mortgage Serviced Portfolio (1, 2) | |
Non-Legacy Residential Mortgage Serviced Portfolio, a subset of the Residential Mortgage Serviced Portfolio (1) | | Non-Legacy Residential Mortgage Serviced Portfolio, a subset of the Residential Mortgage Serviced Portfolio (1) |
| | | | | | | | | | | | | |
| | | December 31 | | December 31 |
| (Dollars in billions) | | 2013 | | 2012 | | 2011 | | 2014 | | 2013 | | 2012 |
| Unpaid principal balance | | | | | | | | | | | | |
| Residential mortgage loans | | | | | | | | | | | | |
| Total | | $ | 516 |
| | $ | 755 |
| | $ | 953 |
| | $ | 461 |
| | $ | 516 |
| | $ | 755 |
|
| 60 days or more past due | | 12 |
| | 22 |
| | 17 |
| | 9 |
| | 12 |
| | 22 |
|
| | | | | | | | | | | | | |
| Number of loans serviced (in thousands) | | | | | | | | | | | | |
| Residential mortgage loans | | | | | | | | | | | | |
| Total | | 3,267 |
| | 4,764 |
| | 5,731 |
| | 2,951 |
| | 3,267 |
| | 4,764 |
|
| 60 days or more past due | | 67 |
| | 124 |
| | 95 |
| | 54 |
| | 67 |
| | 124 |
|
| |
(1) | Excludes loans for which servicing transferred to third parties as of December 31, 2013, with an effective MSR sale date of January 2, 2014, totaling $163 million50 billion of unpaid principal balance. |
| |
(2)
| Excludes, $52 billion, and $58 billion and $67 billion of home equity loans and HELOCs at December 31, 20132014, 20122013 and 20112012, respectively.
|
Mortgage Banking Income
CRES mortgage banking income is categorized into production and servicing income. Core production income is comprised primarily of revenue from the fair value gains and losses recognized on our interest rate lock commitments (IRLCs) and LHFS, the related secondary market execution and costs related to representations and warranties in the sales transactions along with other obligations incurred in the sales of mortgage loans, and revenue earned in production-related ancillary businesses.loans. Ongoing costs related to representations and warranties and other obligations that were incurred in the sales of mortgage loans in prior periods are also included in production income.
Servicing income includes income earned in connection with servicing activities and MSR valuation adjustments, net of results from risk management activities used to hedge certain market risks of the MSRs. The costs associated with our servicing activities are included in noninterest expense.
The table below summarizes the components of mortgage banking income.
| | | | | | | | | |
| Mortgage Banking Income | | | | | | |
| | | | | | | |
| (Dollars in millions) | 2013 | | 2012 | 2014 | | 2013 |
| Production income: | | | | | | |
| Core production revenue | $ | 2,543 |
| | $ | 3,760 |
| $ | 1,181 |
| | $ | 2,543 |
|
| Representations and warranties provision | (840 | ) | | (3,939 | ) | (683 | ) | | (840 | ) |
| Total production income (loss) | 1,703 |
| | (179 | ) | |
| Total production income | | 498 |
| | 1,703 |
|
| Servicing income: | | | | | | |
| Servicing fees | 3,030 |
| | 4,729 |
| 1,884 |
| | 3,030 |
|
Amortization of expected cash flows (1) | (1,043 | ) | | (1,484 | ) | (818 | ) | | (1,043 | ) |
Fair value changes of MSRs, net of risk management activities used to hedge certain market risks (2) | 867 |
| | 1,852 |
| 294 |
| | 867 |
|
| Other servicing-related revenue | 28 |
| | 635 |
| 8 |
| | 28 |
|
| Total net servicing income | 2,882 |
| | 5,732 |
| 1,368 |
| | 2,882 |
|
Total CRES mortgage banking income | 4,585 |
| | 5,553 |
| 1,866 |
| | 4,585 |
|
Eliminations (3) | (711 | ) | | (803 | ) | (303 | ) | | (711 | ) |
| Total consolidated mortgage banking income | $ | 3,874 |
| | $ | 4,750 |
| $ | 1,563 |
| | $ | 3,874 |
|
| |
(1) | Represents the net change in fair value of the MSR asset due to the recognition of modeled cash flows. |
| |
(2) | Includes gains (losses) on sales of MSRs. |
| |
(3) | Includes the effect of transfers of mortgage loans from CRES to the ALM portfolio included in All Other.and intercompany allocations of servicing costs. |
Core production revenue decreased $1.4 billion to $1.2 billion in 2014due to industry-wide margin compression combined with lower loan applicationfirst mortgage origination volumes as described below.
below, and to a lesser extent, industry-wide margin compression. The representations and warranties provision decreaseddecreased $3.1 billion in 2013157 million to $840683 million as 2012 included $2.5 billion in provisionand was primarily related to the FNMA Settlement and $500 million for obligationsnon-government-sponsored enterprises exposures, partially offset by lower exposure to FNMA related to MI rescissions. mortgage insurance companies as a result of settlements in 2014.
Net servicing income decreased $2.91.5 billion to $2.91.4 billion driven by lower servicing fees due to a smaller servicing portfolio and less favorable MSR net-of-hedge performance, andpartially offset by lower ancillary income due to the divestitureamortization of an ancillary business in 2012.expected cash flows. The decline in the size of our servicing portfolio was driven by strategic sales of MSRs during 2014 and 2013 as well as loan prepayment activity, which exceeded new originations primarily due to our exit from non-retail channels. For more information on sales of MSRs, see Sales of Mortgage Servicing Rights on page 43.
|
| | | | | | | | |
| | | | | |
| Key Statistics | | | | |
| | | | | |
| (Dollars in millions, except as noted) | 2013 | | 2012 | |
| Loan production | |
| | |
| |
Total Corporation (1): | | | | |
| First mortgage | $ | 83,421 |
| | $ | 75,074 |
| |
| Home equity | 6,355 |
| | 3,585 |
| |
| CRES: | |
| | |
| |
| First mortgage | $ | 66,914 |
| | $ | 55,518 |
| |
| Home equity | 5,498 |
| | 2,832 |
| |
| | | | | |
| Year end | |
| | |
| |
Mortgage serviced portfolio (in billions) (2, 3) | $ | 810 |
| | $ | 1,332 |
| |
| Mortgage loans serviced for investors (in billions) | 550 |
| | 1,045 |
| |
| Mortgage servicing rights: | |
| | |
| |
| Balance | 5,042 |
| | 5,716 |
| |
Capitalized mortgage servicing rights (% of loans serviced for investors) | 92 |
| bps | 55 |
| bps |
|
| | | | | | | | |
| | | | | |
| Key Statistics | | | | |
| | | | | |
| (Dollars in millions, except as noted) | 2014 | | 2013 | |
Loan production (1) | |
| | |
| |
Total (2): | | | | |
| First mortgage | $ | 43,290 |
| | $ | 83,421 |
| |
| Home equity | 11,233 |
| | 6,361 |
| |
| CRES: | |
| | |
| |
| First mortgage | $ | 32,340 |
| | $ | 66,913 |
| |
| Home equity | 10,286 |
| | 5,498 |
| |
| | | | | |
| Year end | |
| | |
| |
Mortgage serviced portfolio (in billions) (1, 3) | $ | 693 |
| | $ | 810 |
| |
Mortgage loans serviced for investors (in billions) (1) | 474 |
| | 550 |
| |
| Mortgage servicing rights: | |
| | |
| |
Balance (4) | 3,271 |
| | 5,042 |
| |
Capitalized mortgage servicing rights (% of loans serviced for investors) | 69 |
| bps | 92 |
| bps |
| |
(1) | The above loan production and year-end servicing portfolio and mortgage loans serviced for investors represent the unpaid principal balance of loans. |
| |
(2) | In addition to loan production in CRES, the remaining first mortgage and home equity loan production is primarily in GWIM. |
| |
(2)(3)
| Servicing of residential mortgage loans, HELOCs and home equity loans.loans by Legacy Assets & Servicing. |
| |
(3)(4)
| Excludes loans for which servicing transferred to third parties as of At December 31, 2013, with an effective2014, excludes $259 million of certain non-U.S. residential mortgage MSR sale date of January 2, 2014, totalingbalances that are recorded in $220 millionGlobal Markets.
|
DespiteFirst mortgage loan originations in CRES and for the total Corporation declined in 2014 compared to 2013 reflecting a decline in the overall mortgage market because ofas higher interest rates during the second halfthroughout most of 2013, first mortgage loan originations in CRESincreased$11.4 billion, or 21 percent, to $66.9 billion in 2013, and for the total Corporation, increased $8.3 billion to $83.4 billion as we increased market share due to higher fulfillment capacity. The increase in interest rates also had an adverse impact on our mortgage loan applications, particularly for refinance mortgage loans. Our volume of mortgage applications decreased 15 percent in 20132014 corresponding todrove a declinedecrease in the estimated overall U.S. demand for mortgages.refinances.
During 20132014, 8260 percent of ourthe total Corporation first mortgage production volume was for refinance originations and 1840 percent was for purchase originations compared to 8482 percent and 16 18
percent in 20122013. HARPHome Affordable Refinance Program (HARP) refinance originations were 23six percent of all refinance originations compared to 3123 percent in 20122013. Making Home Affordable non-HARP refinance originations were 1917 percent of all refinance originations as compared to 1219 percent in 20122013. The remaining 5877 percent of refinance originations was conventional refinances and remained relatively unchanged fromcompared to 58 percent in 20122013.
Home equity production for the total Corporation was$11.2 billion for 2014 compared to $6.4 billion for 2013 compared to $3.6 billion for 2012, with the increase due to a higher demand in the market based on improving housing trends, and increased market share driven by improved banking center engagement with customers and more competitive pricing.
Mortgage Servicing Rights
At December 31, 20132014, the balance of consumer MSR balanceMSRs managed within CRES, which excludes $259 million of certain non-U.S. residential mortgage MSRs recorded in Global Markets, was $5.03.3 billion, which represented 9269 bps of the related unpaid principal balance compared to $5.75.0 billion, or 5592 bps of the related unpaid principal balance at December 31, 20122013. The consumer MSR balance managed within decreased$674 millionCRES decreased $1.8 billion during 20132014 primarily driven by MSR salesa decrease in value due to lower mortgage rates at December 31, 2014 compared to December 31, 2013, which resulted in higher forecasted prepayment speeds, and the recognition of modeled cash flows. These declines wereflows, partially offset by additions to the increase in value driven by higher mortgage rates, which resulted in lower forecasted prepayment speeds and was the primary driver for the increase in the MSRs as a percentage of unpaid principal balance.portfolio. For more information on our servicing activities, see Off-Balance Sheet Arrangements and Contractual Obligations – Servicing, Foreclosure and Other Mortgage Matters on page 57.53. For more information on MSRs, see Note 23 – Mortgage Servicing Rights to the Consolidated Financial Statements.
Sales of Mortgage Servicing Rights
As previously disclosed, during 2013, we entered into definitive agreements with certain counterparties to sell the servicing rights on certain residential mortgage loans serviced for others, with an aggregate unpaid principal balance of approximately $301 billion. The sales involved approximately two million loans serviced by us as of the applicable contract dates, including approximately 180,000 residential mortgage loans and 11,700 home equity loans that were 60 days or more past due based upon current estimates.
The transfers of servicing rights were substantially completed in the first nine months of 2013. These sales led to a reduction in servicing revenue in the fourth quarter of 2013 of approximately $150 million compared to the fourth quarter of 2012.
|
| | |
| | 41Bank of America 2013432014 | | |
Global Wealth & Investment Management |
| | | | | | | | | | | |
| | | | | | | |
| (Dollars in millions) | 2013 | | 2012 | | % Change |
| Net interest income (FTE basis) | $ | 6,064 |
| | $ | 5,827 |
| | 4 | % |
| Noninterest income: | | | | | |
| Investment and brokerage services | 9,709 |
| | 8,849 |
| | 10 |
|
| All other income | 2,017 |
| | 1,842 |
| | 10 |
|
| Total noninterest income | 11,726 |
| | 10,691 |
| | 10 |
|
| Total revenue, net of interest expense (FTE basis) | 17,790 |
| | 16,518 |
| | 8 |
|
| | | | | | |
| Provision for credit losses | 56 |
| | 266 |
| | (79 | ) |
| Noninterest expense | 13,038 |
| | 12,721 |
| | 2 |
|
| Income before income taxes | 4,696 |
| | 3,531 |
| | 33 |
|
| Income tax expense (FTE basis) | 1,722 |
| | 1,286 |
| | 34 |
|
| Net income | $ | 2,974 |
| | $ | 2,245 |
| | 32 |
|
| | | | | | |
| Net interest yield (FTE basis) | 2.41 | % | | 2.35 | % | | |
Return on average allocated capital (1) | 29.90 |
| | — |
| | |
Return on average economic capital (1) | — |
| | 30.80 |
| | |
| Efficiency ratio (FTE basis) | 73.29 |
| | 77.02 |
| | |
| | | | | | |
| Balance Sheet | | | | | | |
| | | | | | |
| Average | | | | | |
| Total loans and leases | $ | 111,023 |
| | $ | 100,456 |
| | 11 |
|
| Total earning assets | 251,394 |
| | 248,475 |
| | 1 |
|
| Total assets | 270,788 |
| | 268,475 |
| | 1 |
|
| Total deposits | 242,161 |
| | 242,384 |
| | — |
|
Allocated capital (1) | 10,000 |
| | — |
| | n/m |
|
Economic capital (1) | — |
| | 7,359 |
| | n/m |
|
| | | | | | |
| Year end | |
| | |
| | |
|
| Total loans and leases | $ | 115,846 |
| | $ | 105,928 |
| | 9 |
|
| Total earning assets | 254,031 |
| | 277,121 |
| | (8 | ) |
| Total assets | 274,112 |
| | 297,326 |
| | (8 | ) |
| Total deposits | 244,901 |
| | 266,188 |
| | (8 | ) |
| |
(1)
| Effective January 1, 2013, we revised, on a prospective basis, the methodology for allocating capital to the business segments. In connection with the change in methodology, we updated the applicable terminology in the above table to allocated capital from economic capital as reported in prior periods. For additional information, see Business Segment Operations on page 35.
|
n/m = not meaningful |
| | | | | | | | | | | |
| | | | | | | |
| (Dollars in millions) | 2014 | | 2013 | | % Change |
| Net interest income (FTE basis) | $ | 5,836 |
| | $ | 6,064 |
| | (4 | )% |
| Noninterest income: | | | | | |
| Investment and brokerage services | 10,722 |
| | 9,709 |
| | 10 |
|
| All other income | 1,846 |
| | 2,017 |
| | (8 | ) |
| Total noninterest income | 12,568 |
| | 11,726 |
| | 7 |
|
| Total revenue, net of interest expense (FTE basis) | 18,404 |
| | 17,790 |
| | 3 |
|
| | | | | | |
| Provision for credit losses | 14 |
| | 56 |
| | (75 | ) |
| Noninterest expense | 13,647 |
| | 13,033 |
| | 5 |
|
| Income before income taxes (FTE basis) | 4,743 |
| | 4,701 |
| | 1 |
|
| Income tax expense (FTE basis) | 1,769 |
| | 1,724 |
| | 3 |
|
| Net income | $ | 2,974 |
| | $ | 2,977 |
| | — |
|
| | | | | | |
| Net interest yield (FTE basis) | 2.33 | % | | 2.41 | % | | |
| Return on average allocated capital | 25 |
| | 30 |
| | |
| Efficiency ratio (FTE basis) | 74.15 |
| | 73.26 |
| | |
| | | | | | |
| Balance Sheet | | | | | | |
| | | | | | |
| Average | | | | | |
| Total loans and leases | $ | 119,775 |
| | $ | 111,023 |
| | 8 |
|
| Total earning assets | 250,747 |
| | 251,395 |
| | — |
|
| Total assets | 269,279 |
| | 270,789 |
| | (1 | ) |
| Total deposits | 240,242 |
| | 242,161 |
| | (1 | ) |
| Allocated capital | 12,000 |
| | 10,000 |
| | 20 |
|
| | | | | | |
| Year end | |
| | |
| | |
|
| Total loans and leases | $ | 125,431 |
| | $ | 115,846 |
| | 8 |
|
| Total earning assets | 258,219 |
| | 254,031 |
| | 2 |
|
| Total assets | 276,587 |
| | 274,113 |
| | 1 |
|
| Total deposits | 245,391 |
| | 244,901 |
| | — |
|
GWIM consists of two primary businesses: Merrill Lynch Global Wealth Management (MLGWM) and U.S. Trust, Bank of America Private Wealth Management (U.S. Trust).
MLGWM’s advisory business provides a high-touch client experience through a network of financial advisors focused on clients with over $250,000 in total investable assets. MLGWM provides tailored solutions to meet our clients’ needs through a full set of brokerage, banking and retirement products.
U.S. Trust, together with MLGWM’s Private Banking & Investments Group, provides comprehensive wealth management solutions targeted to high net-worthnet worth and ultra high net-worthnet worth clients, as well as customized solutions to meet clients’ wealth structuring, investment management, trust and banking needs, including specialty asset management services.
Net income remained relatively unchanged in 2014 compared to 2013 as an increase in noninterest income and lower credit costs were offset by lower net interest income and higher noninterest expense.
Net interest income increased$729decreased $228 million to $3.0$5.8 billion in 2013 compared to 2012 driven by higher revenue and lower provision for credit losses, as a result of the low rate environment, partially offset by higher noninterest expense. Revenuethe impact of loan growth. Noninterest income, primarily investment and brokerage services, increased $1.3$842 million to $12.6 billion to $17.8 billion primarily driven by higherincreased asset management fees relateddue to the impact of long-term AUM inflowsflows and higher market levels, as well as higher net interest income. The provision for credit losses decreased$210 million to $56 million drivenpartially offset by continued improvement in the home equity portfolio.lower transactional revenue. Noninterest expense increased $317614 million to $13.013.6 billion primarily due to higher volume-drivenrevenue-related incentive compensation and support expenses, and higher support costs, partially offset by lower other personnel costs.expenses.
Return on average allocated capital was 25 percent, down from 30 percent due to an increase in capital allocations. For more information on capital allocated to the business segments, see Business Segment Operations on page 34.
Revenue by Business
The table below summarizes revenue for MLGWM, U.S. Trust and other GWIM businesses.
|
| | | | | | | |
| | | | |
| Revenue by Business | | | |
| | | | |
| (Dollars in millions) | 2014 | | 2013 |
| Merrill Lynch Global Wealth Management | $ | 15,256 |
| | $ | 14,771 |
|
| U.S. Trust | 3,084 |
| | 2,953 |
|
Other (1) | 64 |
| | 66 |
|
| Total revenue, net of interest expense (FTE basis) | $ | 18,404 |
| | $ | 17,790 |
|
| |
(1) | Other includes the results of BofA Global Capital Management and other administrative items. |
In 20132014, revenue from MLGWM was $14.815.3 billion, up eightthree percent, driven by increased asset management fees due to the impact of long-term AUM flows and higher market levels, partially offset by the impact of the low rate environment on net interest income and lower transactional revenue. In 2014, revenue from U.S. Trust was $3.03.1 billion, up ninefour percent, both driven by increased asset management fees due to the same factors as described above.impact of higher market levels and long-term AUM flows.
|
| | |
| | 44Bank of America 2013201442
| | |
Net Migration Summary
GWIM results are impacted by the net migration of clients and their related deposit and loan balances to or from CBB, CRES and the ALM portfolio, as presented in the table below. We move clients between business segments to better meet their needs. Transfers in 2013 were primarily comprised of the following: net deposit balances of $21 billion to CBB; HELOC balances of $5 billion to CRES; and credit card balances of $3 billion from CBB. Beginning in March 2013, revenue and expense related to credit card balance transfers are included in GWIM and included in CBB for all prior periods. The balances in the table below represent transfers that occurred during 2013 and 2012.
|
| | | | | | | |
| | | | |
| Net Migration Summary | | | |
| | | | |
| | December 31 |
| (Dollars in millions) | 2013 | | 2012 |
Total deposits, net – GWIM from / (to) CBB | $ | (20,974 | ) | | $ | 1,170 |
|
Total loans, net – GWIM from / (to) CBB, CRES and the ALM portfolio | (1,356 | ) | | (335 | ) |
Client Balances
The table below presents client balances which consist of AUM, brokerage assets, assets in custody, deposits, and loans and leases.
| | | | | | | | | |
| Client Balances by Type | | | | | | |
| | | | | | | |
| | December 31 | December 31 |
| (Dollars in millions) | 2013 | | 2012 | 2014 | | 2013 |
| Assets under management | $ | 821,449 |
| | $ | 698,095 |
| $ | 902,872 |
| | $ | 821,449 |
|
| Brokerage assets | 1,045,122 |
| | 960,351 |
| 1,081,434 |
| | 1,045,122 |
|
| Assets in custody | 136,190 |
| | 117,686 |
| 139,555 |
| | 136,190 |
|
| Deposits | 244,901 |
| | 266,188 |
| 245,391 |
| | 244,901 |
|
Loans and leases (1) | 118,776 |
| | 109,305 |
| 128,745 |
| | 118,776 |
|
| Total client balances | $ | 2,366,438 |
| | $ | 2,151,625 |
| $ | 2,497,997 |
| | $ | 2,366,438 |
|
| |
(1) | Includes margin receivables which are classified in customer and other receivables on the Consolidated Balance Sheet. |
The increase of $214.8$131.6 billion,, or 10six percent,, in client balances was driven by higher market levels and record long-term AUM inflows, partially offsetflows.
Net Migration Summary
GWIM results are impacted by the net migration of clients and their corresponding deposit, balance transferloan and brokerage balances to or from CBB, Global Banking and CRES, as presented in the table below. Migrations result from the movement of $21.0clients between business segments to better align with client needs. In addition to business-as-usual migration during 2013, GWIM identified and transferred a client population with deposit balances of $23.3 billion to CBBand home equity loan balances of $4.5 billion to CRES, while CBB as described in the Net Migration Summary section.transferred credit card loan balances of $3.2 billion to GWIM.
|
| | | | | | | |
| | | | |
| Net Migration Summary | | | |
| | | | |
| (Dollars in millions) | 2014 | | 2013 |
Total deposits, net – GWIM from (to) CBB and Global Banking | $ | 1,350 |
| | $ | (20,974 | ) |
Total loans, net – GWIM from (to) CBB and CRES | (61 | ) | | (1,356 | ) |
Total brokerage, net – GWIM from (to) CBB and Global Banking | (2,710 | ) | | (1,251 | ) |
|
| | |
| | 43Bank of America 2013452014 | | |
Global Banking
|
| | | | | | | | | | | |
| | | | | | | |
| (Dollars in millions) | 2013 | | 2012 | | % Change |
| Net interest income (FTE basis) | $ | 8,914 |
| | $ | 8,135 |
| | 10 | % |
| Noninterest income: | | | | | |
| Service charges | 2,787 |
| | 2,867 |
| | (3 | ) |
| Investment banking fees | 3,235 |
| | 2,793 |
| | 16 |
|
| All other income | 1,545 |
| | 1,879 |
| | (18 | ) |
| Total noninterest income | 7,567 |
| | 7,539 |
| | — |
|
| Total revenue, net of interest expense (FTE basis) | 16,481 |
| | 15,674 |
| | 5 |
|
| | | | | | |
| Provision for credit losses | 1,075 |
| | (342 | ) | | n/m |
|
| Noninterest expense | 7,552 |
| | 7,619 |
| | (1 | ) |
| Income before income taxes | 7,854 |
| | 8,397 |
| | (6 | ) |
| Income tax expense (FTE basis) | 2,880 |
| | 3,053 |
| | (6 | ) |
| Net income | $ | 4,974 |
| | $ | 5,344 |
| | (7 | ) |
| | | | | | |
| Net interest yield (FTE basis) | 2.96 | % | | 2.90 | % | | |
Return on average allocated capital (1) | 21.64 |
| | — |
| | |
Return on average economic capital (1) | — |
| | 27.69 |
| | |
| Efficiency ratio (FTE basis) | 45.82 |
| | 48.61 |
| | |
| | | | | | |
| Balance Sheet | | | | | | |
| | | | | | |
| Average | | | | | |
| Total loans and leases | $ | 257,245 |
| | $ | 224,336 |
| | 15 |
|
| Total earning assets | 301,204 |
| | 280,605 |
| | 7 |
|
| Total assets | 343,464 |
| | 322,701 |
| | 6 |
|
| Total deposits | 237,457 |
| | 223,940 |
| | 6 |
|
Allocated equity (1) | 23,000 |
| | — |
| | n/m |
|
Economic capital (1) | — |
| | 19,312 |
| | n/m |
|
| | | | | | |
| Year end | | | | | |
| Total loans and leases | $ | 269,469 |
| | $ | 242,340 |
| | 11 |
|
| Total earning assets | 337,154 |
| | 288,072 |
| | 17 |
|
| Total assets | 379,207 |
| | 331,611 |
| | 14 |
|
| Total deposits | 265,718 |
| | 243,306 |
| | 9 |
|
| |
(1)
| Effective January 1, 2013, we revised, on a prospective basis, the methodology for allocating capital to the business segments. In connection with the change in methodology, we updated the applicable terminology in the above table to allocated capital from economic capital as reported in prior periods. For additional information, see Business Segment Operations on page 35.
|
n/m = not meaningful |
| | | | | | | | | | | |
| | | | | | | |
| (Dollars in millions) | 2014 | | 2013 | | % Change |
| Net interest income (FTE basis) | $ | 8,999 |
| | $ | 8,914 |
| | 1 | % |
| Noninterest income: | | | | | |
| Service charges | 2,717 |
| | 2,787 |
| | (3 | ) |
| Investment banking fees | 3,213 |
| | 3,234 |
| | (1 | ) |
| All other income | 1,669 |
| | 1,544 |
| | 8 |
|
| Total noninterest income | 7,599 |
| | 7,565 |
| | — |
|
| Total revenue, net of interest expense (FTE basis) | 16,598 |
| | 16,479 |
| | 1 |
|
| | | | | | |
| Provision for credit losses | 336 |
| | 1,075 |
| | (69 | ) |
| Noninterest expense | 7,681 |
| | 7,551 |
| | 2 |
|
| Income before income taxes (FTE basis) | 8,581 |
| | 7,853 |
| | 9 |
|
| Income tax expense (FTE basis) | 3,146 |
| | 2,880 |
| | 9 |
|
| Net income | $ | 5,435 |
| | $ | 4,973 |
| | 9 |
|
| | | | | | |
| Net interest yield (FTE basis) | 2.57 | % | | 2.97 | % | | |
| Return on average allocated capital | 18 |
| | 22 |
| | |
| Efficiency ratio (FTE basis) | 46.28 |
| | 45.82 |
| | |
| | | | | | |
| Balance Sheet | | | | | | |
| | | | | | |
| Average | | | | | |
| Total loans and leases | $ | 270,164 |
| | $ | 257,249 |
| | 5 |
|
| Total earning assets | 350,668 |
| | 300,511 |
| | 17 |
|
| Total assets | 393,721 |
| | 342,772 |
| | 15 |
|
| Total deposits | 261,312 |
| | 236,765 |
| | 10 |
|
| Allocated capital | 31,000 |
| | 23,000 |
| | 35 |
|
| | | | | | |
| Year end | | | | | |
| Total loans and leases | $ | 272,572 |
| | $ | 269,469 |
| | 1 |
|
| Total earning assets | 336,776 |
| | 336,606 |
| | — |
|
| Total assets | 379,513 |
| | 378,659 |
| | — |
|
| Total deposits | 251,344 |
| | 265,171 |
| | (5 | ) |
Global Banking, which includes Global Corporate and Global Commercial Banking, and Investment Banking, provides a wide range of lending-related products and services, integrated working capital management and treasury solutions to clients, and underwriting and advisory services through our network of offices and client relationship teams. Our lending products and services include commercial loans, leases, commitment facilities, trade finance, real estate lending and asset-based lending. Our treasury solutions business includes treasury management, foreign exchange and short-term investing options. We also work with our clients to provide investment banking products to our clients such as debt and equity underwriting and distribution, and merger-related and other advisory services. Underwriting debt and equity issuances, fixed-income and equity research, and certain market-based activities are executed through our global broker/dealerbroker-dealer affiliates which are our primary dealers in several countries. Within Global Banking, Global Commercial Banking clients generally include middle-market companies, commercial real estate firms, auto dealerships and not-for-profit companies. Global Corporate Banking includes large global corporations, financial institutions and leasing clients.
During 2013, consumer DFS results were moved to CBB from Global Banking to align this business more closely with our consumer lending activity and better serve the needs of our customers. Prior periods were reclassified to conform to current period presentation.
Net income for Global Banking decreasedincreased $370462 million to $5.05.4 billion in 20132014 compared to 20122013 primarily driven by an increasea reduction in the provision for credit losses and, to a lesser degree, an increase in revenue, partially offset by higher revenue.noninterest expense. Revenue increased $807119 million to $16.5$16.6 billion in 20132014 as primarily from higher net interest income due to the impact of loan growth and higher investment banking fees were partially offset by lower other income due to gains on the liquidation of certain portfolios in 2012.income.
The provision for credit losses decreased $739 million to $336 million in 2014 driven by improved credit quality in the current year, and the prior year included increased $1.4reserves from loan growth. Noninterest expense increased $130 million to $7.7 billion to $1.1 billionin 2014 primarily from additional client-facing personnel expense and higher litigation expense.
Return on average allocated capital was 18 percent in 2014, down from 22 percent in 2013 compared to a benefit of $342 millionas growth in 2012 primarily due to increased reserves as a result of commercial loan growth.
Noninterest expense of $7.6 billion remained relatively unchanged in 2013 primarily due to lower personnel expense as we continue to streamline our business operations and achieve cost savings, largelyearnings was more than offset by higher litigation expense.increased capital allocations. For more information on capital allocated to the business segments, see Business Segment Operations on page 34.
|
| | |
| | 46Bank of America 2013201444
| | |
Global Corporate and Global Commercial Banking
Global Corporate and Global Commercial Banking each include Business Lending and Global Transaction Services (formerly Global Treasury ServicesServices) activities. Business Lending includes various lending-related products and services and related hedging activities including commercial loans, leases, commitment facilities, trade finance, real estate lending and asset-based lending. Treasury
lending. Global Transaction Services includes deposits, treasury management, credit card, foreign exchange, and short-term investment and custody solutions to corporate and commercial banking clients.
The table below presents a summary of Global Corporate and Global Commercial Banking results, which excludesexclude certain capital markets activity in Global Banking.
| | | | | | | | | | | | | | | | | | | | | | | | | | | |
| Global Corporate and Global Commercial Banking | Global Corporate and Global Commercial Banking | | | | | | | | | | | Global Corporate and Global Commercial Banking | | | | | | | | | | |
| | | | | | | | | | | | | | | | | | | | | |
| | | Global Corporate Banking | | Global Commercial Banking | | Total | | Global Corporate Banking | | Global Commercial Banking | | Total |
| (Dollars in millions) | (Dollars in millions) | 2013 | | 2012 | | 2013 |
| 2012 | | 2013 | | 2012 | (Dollars in millions) | 2014 | | 2013 | | 2014 |
| 2013 | | 2014 | | 2013 |
| Revenue | Revenue | | | | | | | | | | | | Revenue | | | | | | | | | | | |
| Business Lending | Business Lending | $ | 3,407 |
| | $ | 3,201 |
| | $ | 3,967 |
| | $ | 3,622 |
| | $ | 7,374 |
| | $ | 6,823 |
| Business Lending | $ | 3,421 |
| | $ | 3,432 |
| | $ | 3,936 |
| | $ | 3,967 |
| | $ | 7,357 |
| | $ | 7,399 |
|
| Treasury Services | 2,815 |
| | 2,633 |
| | 2,939 |
| | 2,988 |
| | 5,754 |
| | 5,621 |
| |
| Global Transaction Services | | Global Transaction Services | 3,027 |
| | 2,804 |
| | 2,893 |
| | 2,939 |
| | 5,920 |
| | 5,743 |
|
| Total revenue, net of interest expense | Total revenue, net of interest expense | $ | 6,222 |
| | $ | 5,834 |
| | $ | 6,906 |
| | $ | 6,610 |
| | $ | 13,128 |
| | $ | 12,444 |
| Total revenue, net of interest expense | $ | 6,448 |
| | $ | 6,236 |
| | $ | 6,829 |
| | $ | 6,906 |
| | $ | 13,277 |
| | $ | 13,142 |
|
| | | | | | | | | | | | | | | | | | | | | | | | | |
| Balance Sheet | | | | | | | | | | | | | | | | | | | | | | | | |
| Average | Average | | | | | | | | | | | | Average | | | | | | | | | | | |
| Total loans and leases | Total loans and leases | $ | 126,669 |
| | $ | 110,130 |
| | $ | 130,563 |
| | $ | 113,640 |
| | $ | 257,232 |
| | $ | 223,770 |
| Total loans and leases | $ | 129,610 |
| | $ | 126,630 |
| | $ | 140,539 |
| | $ | 130,606 |
| | $ | 270,149 |
| | $ | 257,236 |
|
| Total deposits | Total deposits | 128,198 |
| | 114,200 |
| | 109,225 |
| | 109,704 |
| | 237,423 |
| | 223,904 |
| Total deposits | 143,649 |
| | 128,198 |
| | 117,664 |
| | 108,532 |
| | 261,313 |
| | 236,730 |
|
| | | | | | | | | | | | | | | | | | | | | | | | | |
| Year end | Year end | | | | | | | | | | | | Year end | | | | | | | | | | | |
| Total loans and leases | Total loans and leases | $ | 130,092 |
| | $ | 116,239 |
| | $ | 139,374 |
| | $ | 126,093 |
| | $ | 269,466 |
| | $ | 242,332 |
| Total loans and leases | $ | 131,019 |
| | $ | 130,066 |
| | $ | 141,555 |
| | $ | 139,401 |
| | $ | 272,574 |
| | $ | 269,467 |
|
| Total deposits | Total deposits | 144,312 |
| | 131,184 |
| | 121,407 |
| | 112,083 |
| | 265,719 |
| | 243,267 |
| Total deposits | 130,557 |
| | 144,312 |
| | 120,787 |
| | 120,860 |
| | 251,344 |
| | 265,172 |
|
Global Corporate and Global Commercial Banking revenue increased$684 million in 2013 due to higher revenue in both Business Lending and Treasury Services.
Business Lending revenue in Global Corporate Banking increased $206 millionand Global Commercial Banking remained relatively unchanged in2014 compared to 2013 due to higher net interest income driven byas the impact of growth in average loan growth, partiallybalances was offset by lower accretion on acquired portfolios, and gains on the liquidation of certain portfolios in 2012. Business Lending revenue in Global Commercial Banking increased $345 million due to higher net interest income driven by the impact of loan growth in the commercial and industrial, and commercial real estate portfolios, as well as higher accretion on acquired portfolios.spread compression.
TreasuryGlobal Transaction Services revenue in Global Corporate Banking increased $182$223 million in 20132014 driven by the impact of growth in U.S. and non-U.S. deposit balances, partially offset by the impact of the low rate environment. Treasurybalances. Global Transaction Services revenue in Global Commercial Banking declined $49 million due toremained relatively unchanged as the impactsimpact of lower averagehigher deposit balances and the low rate environment.was more than offset by spread compression.
Average loans and leases in Global Corporate and Global Commercial Banking increased15 five percent in 20132014 driven by growth in the commercial and industrial and commercial real estate portfolios. Average deposits in Global Corporate and Global Commercial Banking increasedsix 10 percent in 20132014 due to client liquidity and international growth and new client acquisitions.growth.
Investment Banking
Client teams and product specialists underwrite and distribute debt, equity and loan products, and provide advisory services and tailored risk management solutions. The economics of most
investment banking and underwriting activities are shared primarily
between Global Banking and Global Markets based on the contributionactivities performed by and involvement of each segment. To provide a complete discussion of
our consolidated investment banking fees, the table below presents total Corporation investment banking fees as well asincluding the portion attributable to Global Banking.
| | | | | | | | | | | | | | | | | |
| Investment Banking Fees | Investment Banking Fees | | | | | Investment Banking Fees | | | | |
| | | | | | | | | | | |
| | Global Banking | | Total Corporation | Global Banking | | Total Corporation |
| (Dollars in millions) | 2013 |
| 2012 | | 2013 | | 2012 | 2014 |
| 2013 | | 2014 | | 2013 |
| Products | | | | | | | | | | | | | | |
| Advisory | $ | 1,022 |
| | $ | 995 |
| | $ | 1,131 |
| | $ | 1,066 |
| $ | 1,098 |
| | $ | 1,019 |
| | $ | 1,207 |
| | $ | 1,125 |
|
| Debt issuance | 1,620 |
| | 1,390 |
| | 3,805 |
| | 3,362 |
| 1,532 |
| | 1,620 |
| | 3,583 |
| | 3,804 |
|
| Equity issuance | 593 |
| | 408 |
| | 1,469 |
| | 1,026 |
| 583 |
| | 595 |
| | 1,490 |
| | 1,472 |
|
| Gross investment banking fees | 3,235 |
| | 2,793 |
| | 6,405 |
| | 5,454 |
| 3,213 |
| | 3,234 |
| | 6,280 |
| | 6,401 |
|
| Self-led | (92 | ) | | (43 | ) | | (279 | ) | | (155 | ) | |
| Self-led deals | | (91 | ) | | (92 | ) | | (215 | ) | | (275 | ) |
| Total investment banking fees | $ | 3,143 |
| | $ | 2,750 |
| | $ | 6,126 |
| | $ | 5,299 |
| $ | 3,122 |
| | $ | 3,142 |
| | $ | 6,065 |
| | $ | 6,126 |
|
Total Corporation investment banking fees of $6.1 billion, excluding self-led deals, included within Global Banking and Global Markets, increased 16 percentremained relatively unchanged in2014 compared to 2013 due toas strong equity issuanceinvestment-grade underwriting and advisory fees attributable to a significant increase in global equity capital markets volume and higherwere offset by lower underwriting fees for other debt issuance fees, primarily within leveraged finance and investment-grade underwriting.
products.
|
| | |
| | 45Bank of America 2013472014 | | |
Global Markets
| | | | | | | | | | | | | | | |
| (Dollars in millions) | (Dollars in millions) | 2013 | | 2012 | | % Change | (Dollars in millions) | 2014 | | 2013 | | % Change |
| Net interest income (FTE basis) | Net interest income (FTE basis) | $ | 4,239 |
| | $ | 3,672 |
| | 15 | % | Net interest income (FTE basis) | $ | 3,986 |
| | $ | 4,224 |
| | (6 | )% |
| Noninterest income: | Noninterest income: | | | | | | Noninterest income: | | | | | |
| Investment and brokerage services | Investment and brokerage services | 2,046 |
| | 1,820 |
| | 12 |
| Investment and brokerage services | 2,163 |
| | 2,046 |
| | 6 |
|
| Investment banking fees | Investment banking fees | 2,722 |
| | 2,214 |
| | 23 |
| Investment banking fees | 2,743 |
| | 2,724 |
| | 1 |
|
| Trading account profits | Trading account profits | 6,734 |
| | 5,706 |
| | 18 |
| Trading account profits | 5,997 |
| | 6,734 |
| | (11 | ) |
| All other income | 317 |
| | 872 |
| | (64 | ) | |
| All other income (loss) | | All other income (loss) | 1,230 |
| | (338 | ) | | n/m |
|
| Total noninterest income | Total noninterest income | 11,819 |
| | 10,612 |
| | 11 |
| Total noninterest income | 12,133 |
| | 11,166 |
| | 9 |
|
| Total revenue, net of interest expense (FTE basis) | Total revenue, net of interest expense (FTE basis) | 16,058 |
| | 14,284 |
| | 12 |
| Total revenue, net of interest expense (FTE basis) | 16,119 |
| | 15,390 |
| | 5 |
|
| | | | | | | | | | | | | |
| Provision for credit losses | Provision for credit losses | 140 |
| | 34 |
| | n/m |
| Provision for credit losses | 110 |
| | 140 |
| | (21 | ) |
| Noninterest expense | Noninterest expense | 12,013 |
| | 11,295 |
| | 6 |
| Noninterest expense | 11,771 |
| | 11,996 |
| | (2 | ) |
| Income before income taxes | 3,905 |
| | 2,955 |
| | 32 |
| |
| Income before income taxes (FTE basis) | | Income before income taxes (FTE basis) | 4,238 |
| | 3,254 |
| | 30 |
|
| Income tax expense (FTE basis) | Income tax expense (FTE basis) | 2,342 |
| | 1,726 |
| | 36 |
| Income tax expense (FTE basis) | 1,519 |
| | 2,101 |
| | (28 | ) |
| Net income | Net income | $ | 1,563 |
| | $ | 1,229 |
| | 27 |
| Net income | $ | 2,719 |
| | $ | 1,153 |
| | 136 |
|
| | | | | | | | | | | | | |
Return on average allocated capital (1) | Return on average allocated capital (1) | 5.24 | % | | — |
| | | Return on average allocated capital (1) | 8 | % | | 4 | % | | |
Return on average economic capital (1) | — |
| | 8.95 | % | | | |
| Efficiency ratio (FTE basis) | Efficiency ratio (FTE basis) | 74.81 |
| | 79.08 |
| | | Efficiency ratio (FTE basis) | 73.03 |
| | 77.94 |
| | |
| | | | | | | | | | | | | |
| Balance Sheet | | | | | | | | | | | | |
| | | | | | | | | | | | | |
| Average | Average | | | | | | Average | | | | | |
Total trading-related assets (2) | $ | 468,934 |
| | $ | 466,045 |
| | 1 |
| |
Total earning assets (2) | 481,482 |
| | 461,487 |
| | 4 |
| |
Total trading-related assets (1) | | Total trading-related assets (1) | $ | 449,814 |
| | $ | 468,934 |
| | (4 | ) |
| Total loans and leases | | Total loans and leases | 62,064 |
| | 60,057 |
| | 3 |
|
Total earning assets (1) | | Total earning assets (1) | 461,179 |
| | 481,433 |
| | (4 | ) |
| Total assets | Total assets | 632,804 |
| | 606,249 |
| | 4 |
| Total assets | 607,538 |
| | 632,681 |
| | (4 | ) |
Allocated capital (1) | Allocated capital (1) | 30,000 |
| | — |
| | n/m |
| Allocated capital (1) | 34,000 |
| | 30,000 |
| | 13 |
|
Economic capital (1) | — |
| | 13,824 |
| | n/m |
| |
| | | | | | | | | | | | | |
| Year end | Year end | | | | | | Year end | | | | | |
Total trading-related assets (2) | $ | 411,080 |
| | $ | 465,836 |
| | (12 | ) | |
Total earning assets (2) | 432,821 |
| | 486,470 |
| | (11 | ) | |
Total trading-related assets (1) | | Total trading-related assets (1) | $ | 418,860 |
| | $ | 411,080 |
| | 2 |
|
| Total loans and leases | | Total loans and leases | 59,388 |
| | 67,381 |
| | (12 | ) |
Total earning assets (1) | | Total earning assets (1) | 421,799 |
| | 432,807 |
| | (3 | ) |
| Total assets | Total assets | 575,709 |
| | 632,263 |
| | (9 | ) | Total assets | 579,514 |
| | 575,472 |
| | 1 |
|
| |
(1) | Effective January 1, 2013, we revised, on a prospective basis, the methodology for allocating capital to the business segments. In connection with the change in methodology, we updated the applicable terminology in the above table to allocated capital from economic capital as reported in prior periods. For additional information, see Business Segment Operations on page 35.
|
| |
(2)
| Trading-related assets include derivative assets, which are considered non-earning assets. |
n/m = not meaningful
Global Markets offers sales and trading services, including research, to institutional clients across fixed-income, credit, currency, commodity and equity businesses. Global Markets product coverage includes securities and derivative products in both the primary and secondary markets. Global Markets provides market-making, financing, securities clearing, settlement and custody services globally to our institutional investor clients in support of their investing and trading activities. We also work with our commercial and corporate clients to provide risk management products using interest rate, equity, credit, currency and commodity derivatives, foreign exchange, fixed-income and mortgage-related products. As a result of our market-making activities in these products, we may be required to manage risk in a broad range of financial products including government securities, equity and equity-linked securities, high-grade and high-yield corporate debt securities, syndicated loans, MBS, commodities and asset-backed securities (ABS). In addition, the economics of most investment banking and underwriting activities are shared primarily between Global Markets and Global Banking based on the activities performed by each segment. Global Banking originates certain deal-related transactions with our corporate and commercial clients that are executed and distributed by Global Markets. For more information on investment banking fees on a consolidated basis, see page 4745.
Net income for Global Marketsincreased$334 million increased $1.6 billion to $1.6$2.7 billion in 20132014 compared to 2012.2013. In 2014, we adopted a funding valuation adjustment into our valuation estimates primarily to include funding costs on uncollateralized derivatives and derivatives where we are not permitted to use the collateral we receive. This change in estimate resulted in a net FVA pretax charge of $497 million. Excluding net DVADVA/FVA and charges in 2013 related to the U.K. corporate income tax rate reduction, net income decreased $543$140 million to $3.0$2.9 billion primarily driven by lower FICC revenue due to a challenging trading environmentaccount profits and higher noninterest expense,net interest income, partially offset by a decrease in noninterest expense, a $240 million gain in 2014 related to the initial public offering (IPO) of an increase in equities revenue.equity investment and higher investment and brokerage services income. Results for 2013 included a $450 million write-down of a monoline receivable due to the settlement of a legacy matter. Net DVADVA/FVA losses on derivatives were $508240 million compared to losses of $2.41.2 billion in 20122013. Noninterest expense decreased $225 million to $11.8 billion due to lower litigation expense and revenue-related incentives, partially offset by higher technology costs and investments in infrastructure.
Average earning assets decreased $20.3 billion to $461.2 billion in 2014 largely driven by a decrease in trading assets to further optimize the balance sheet.
Year-end loans and leases decreased $8.0 billion in 2014 due to a decrease in low-margin prime brokerage loans.
The return on average allocated capital was eight percent, up from four percent, largely driven by higher net income, partially offset by an increase in allocated capital. Excluding net DVA/FVA and charges in 2013 related to the U.K. corporate income tax rate reduction, enacted in 2013 resulted inthe return on average allocated capital was eight percent, a $1.1 billion charge todecrease from 10 percent, driven by lower net income, excluding net DVA/FVA and the tax expense in Global Markets for remeasurement of certain deferred tax assets compared to a similar charge of $781 million in 2012. Noninterest expense increased$718 million to $12.0 billion due tochange, and an increase in litigation expense.allocated capital.
Average earning assets increased $20.0 billion to $481.5 billion in 2013 largely driven by increased client financing activity in the equities business.
Sales and Trading Revenue
Sales and trading revenue includes unrealized and realized gains and losses on trading and other assets, net interest income, and fees primarily from commissions on equity securities. Sales and trading revenue is segregated into fixed income (government debt obligations, investment and non-investment grade corporate debt
obligations, commercial mortgage-backed securities, RMBS,residential mortgage-backed securities (RMBS), collateralized debtloan obligations (CDOs)(CLOs), interest rate and credit derivative contracts), currencies (interest rate and foreign exchange contracts), commodities (primarily futures, forwards, swaps and options) and equities (equity-linked derivatives and cash equity activity). The following table below and related discussion present sales and trading revenue, substantially all of which is in Global Markets, with the remainder in Global Banking. In addition, the following table below and related discussion present sales and trading revenue excluding DVA,the impact of net DVA/FVA, which is a non-GAAP financial measure. We believe the use of this non-GAAP financial measure provides clarity in assessing the underlying performance of these businesses.
|
| | | | | | | |
| | | | |
Sales and Trading Revenue (1, 2) |
| | | | |
| (Dollars in millions) | 2014 | | 2013 |
| Sales and trading revenue | | | |
| Fixed income, currencies and commodities | $ | 8,706 |
| | $ | 8,231 |
|
| Equities | 4,215 |
| | 4,180 |
|
| Total sales and trading revenue | $ | 12,921 |
| | $ | 12,411 |
|
| | | | |
Sales and trading revenue, excluding net DVA/FVA (3) | | | |
| Fixed income, currencies and commodities | $ | 9,013 |
| | $ | 9,345 |
|
| Equities | 4,148 |
| | 4,224 |
|
| Total sales and trading revenue, excluding net DVA/FVA | $ | 13,161 |
| | $ | 13,569 |
|
|
| | | | | | | |
| | | | |
Sales and Trading Revenue (1, 2) |
| | | | |
| (Dollars in millions) | 2013 | | 2012 |
| Sales and trading revenue | | | |
| Fixed income, currencies and commodities | $ | 8,882 |
| | $ | 8,812 |
|
| Equities | 4,200 |
| | 3,014 |
|
| Total sales and trading revenue | $ | 13,082 |
| | $ | 11,826 |
|
| | | | |
Sales and trading revenue, excluding net DVA (3) | | | |
| Fixed income, currencies and commodities | $ | 9,373 |
| | $ | 11,007 |
|
| Equities | 4,217 |
| | 3,267 |
|
| Total sales and trading revenue, excluding net DVA | $ | 13,590 |
| | $ | 14,274 |
|
| |
(1) | Includes FTE adjustments of $179181 million and $220180 million for 20132014 and 20122013. For more information on sales and trading revenue, see Note 2 – Derivatives to the Consolidated Financial Statements. |
| |
(2) | Includes Global Banking sales and trading revenue of $385382 million and $522385 million for 20132014 and 20122013. |
| |
(3) | For this presentation,FICC and Equities sales and trading revenue, excludesexcluding the impact of credit spreads onnet DVA which representsand FVA, is a non-GAAP financial measure. NetFICC net DVA/FVA losses were $307 million for 2014 compared to net DVA losses of $491 million and $2.21.1 billion were included in FICC revenue, and net DVA losses of $17 million and $253 million were included in equities revenue in 2013 and. Equities net DVA/FVA 2012gains were $67 million for 2014 compared to net DVA losses of $44 million in 2013.
|
FICCFixed-income, currency and commodities (FICC) revenue, includingexcluding net DVA, increased $70 million to $8.9 billion in 2013 compared to 2012. Excluding the impact of credit spreads on net DVA, FICC revenueDVA/FVA, decreased $1.6 billion to $9.4 billion driven by a challenging trading environment arising from investor concerns around the Federal Reserve’s position on economic stimulus, political uncertainty both domestically and abroad as well as the write-down of a receivable related to the MBIA Settlement in 2013. For more information on the MBIA Settlement, see Note 7 – Representations and Warranties Obligations and Corporate Guarantees to the Consolidated Financial Statements. Equities revenue, including net DVA, increased$1.2 billion to $4.2 billion. Excluding net DVA, equities revenue increased$950332 million to $4.29.0 billion primarilydriven by declines in the rates and credit-related businesses due to continued gains in market share, higherboth lower market volumes and increased client financing balances. Sales and tradingvolatility, partially offset by improvement in the commodities business. The prior year included a $450 million write-down of a monoline receivable related to the settlement of a legacy matter. Equities revenue, included total commissions and brokerage fee revenue ofexcluding net DVA/FVA, decreased$2.0 billion76 million in 2013 compared to $1.84.1 billion in 2012, substantially all from equities, with the $226 millionincrease due to a higher market share and increased market volumesfinancing additional liquid asset buffers, pursuant to current regulatory requirements, primarily in equities.our broker-dealer entities, which also negatively impacted FICC results.
|
| | |
| | 47Bank of America 2013492014 | | |
All Other
| | | | | | | | | | | | | | | |
| (Dollars in millions) | (Dollars in millions) | 2013 | | 2012 | | % Change | (Dollars in millions) | 2014 | | 2013 | | % Change |
| Net interest income (FTE basis) | Net interest income (FTE basis) | $ | 966 |
| | $ | 1,140 |
| | (15 | )% | Net interest income (FTE basis) | $ | (516 | ) | | $ | 982 |
| | n/m |
|
| Noninterest income: | Noninterest income: | | | | | | Noninterest income: | | | | | |
| Card income | Card income | 328 |
| | 360 |
| | (9 | ) | Card income | 356 |
| | 328 |
| | 9 | % |
| Equity investment income | Equity investment income | 2,610 |
| | 1,135 |
| | 130 |
| Equity investment income | 601 |
| | 2,610 |
| | (77 | ) |
| Gains on sales of debt securities | Gains on sales of debt securities | 1,230 |
| | 1,510 |
| | (19 | ) | Gains on sales of debt securities | 1,311 |
| | 1,230 |
| | 7 |
|
| All other loss | All other loss | (3,245 | ) | | (4,927 | ) | | (34 | ) | All other loss | (2,467 | ) | | (2,587 | ) | | (5 | ) |
| Total noninterest income (loss) | 923 |
| | (1,922 | ) | | n/m |
| |
| Total noninterest income | | Total noninterest income | (199 | ) | | 1,581 |
| | n/m |
|
| Total revenue, net of interest expense (FTE basis) | Total revenue, net of interest expense (FTE basis) | 1,889 |
| | (782 | ) | | n/m |
| Total revenue, net of interest expense (FTE basis) | (715 | ) | | 2,563 |
| | n/m |
|
| | | | | | | | | | | | | |
| Provision for credit losses | (666 | ) | | 2,621 |
| | n/m |
| |
| Provision (benefit) for credit losses | | Provision (benefit) for credit losses | (978 | ) | | (666 | ) | | 47 |
|
| Noninterest expense | Noninterest expense | 4,241 |
| | 6,273 |
| | (32 | ) | Noninterest expense | 2,881 |
| | 4,559 |
| | (37 | ) |
| Loss before income taxes | (1,686 | ) | | (9,676 | ) | | (83 | ) | |
| Loss before income taxes (FTE basis) | | Loss before income taxes (FTE basis) | (2,618 | ) | | (1,330 | ) | | 97 |
|
| Income tax benefit (FTE basis) | Income tax benefit (FTE basis) | (2,173 | ) | | (5,939 | ) | | (63 | ) | Income tax benefit (FTE basis) | (2,622 | ) | | (2,042 | ) | | 28 |
|
| Net income (loss) | $ | 487 |
| | $ | (3,737 | ) | | n/m |
| |
| Net income | | Net income | $ | 4 |
| | $ | 712 |
| | (99 | ) |
| | | | | | | | | | | | | |
| Balance Sheet | | | | | | | | | | | | |
| | | | | | | | | | | | | |
| Average | Average | | | | | | Average | | | | | |
| Loans and leases: | Loans and leases: | | | | | | Loans and leases: | | | | | |
| Residential mortgage | Residential mortgage | $ | 208,535 |
| | $ | 223,795 |
| | (7 | ) | Residential mortgage | $ | 180,249 |
| | $ | 208,535 |
| | (14 | ) |
| Non-U.S. credit card | Non-U.S. credit card | 10,861 |
| | 13,549 |
| | (20 | ) | Non-U.S. credit card | 11,511 |
| | 10,861 |
| | 6 |
|
| Other | Other | 16,058 |
| | 21,897 |
| | (27 | ) | Other | 10,752 |
| | 16,064 |
| | (33 | ) |
| Total loans and leases | Total loans and leases | 235,454 |
| | 259,241 |
| | (9 | ) | Total loans and leases | 202,512 |
| | 235,460 |
| | (14 | ) |
Total assets (1) | Total assets (1) | 215,183 |
| | 315,735 |
| | (32 | ) | Total assets (1) | 160,272 |
| | 216,012 |
| | (26 | ) |
| Total deposits | Total deposits | 34,617 |
| | 43,087 |
| | (20 | ) | Total deposits | 30,255 |
| | 34,919 |
| | (13 | ) |
| | | | | | | | | | | | | |
| Year end | Year end | | | | | | Year end | | | | | |
| Loans and leases: | Loans and leases: | | | | |
|
| Loans and leases: | | | | |
|
|
| Residential mortgage | Residential mortgage | $ | 197,061 |
| | $ | 211,476 |
| | (7 | ) | Residential mortgage | $ | 155,595 |
| | $ | 197,061 |
| | (21 | ) |
| Non-U.S. credit card | Non-U.S. credit card | 11,541 |
| | 11,697 |
| | (1 | ) | Non-U.S. credit card | 10,465 |
| | 11,541 |
| | (9 | ) |
| Other | Other | 12,092 |
| | 18,808 |
| | (36 | ) | Other | 6,552 |
| | 12,088 |
| | (46 | ) |
| Total loans and leases | Total loans and leases | 220,694 |
| | 241,981 |
| | (9 | ) | Total loans and leases | 172,612 |
| | 220,690 |
| | (22 | ) |
Total assets (1) | Total assets (1) | 166,881 |
| | 262,800 |
| | (36 | ) | Total assets (1) | 142,812 |
| | 167,624 |
| | (15 | ) |
| Total deposits | Total deposits | 27,702 |
| | 36,061 |
| | (23 | ) | Total deposits | 18,898 |
| | 27,912 |
| | (32 | ) |
| |
(1) | For presentation purposes, inIn segments where the total of liabilities and equity exceeds assets, which are generally deposit-taking segments, we allocate assets from All Other to those segments to match liabilities (i.e., deposits) and allocated shareholders’ equity. Such allocated assets were $539.5595.2 billion and $504.2538.8 billion for 20132014 and 20122013, and $570.3589.9 billion and $537.6569.8 billion at December 31, 20132014 and 20122013.
|
n/m = not meaningful
All Other consists of ALM activities, equity investments, the international consumer card business, liquidating businesses, residual expense allocations and other. ALM activities encompass the whole-loan residential mortgage portfolio and investment securities, interest rate and foreign currency risk management activities including the residual net interest income allocation, gains/losses on structured liabilities, the impact of certain allocation methodologies and accounting hedge ineffectiveness. Additionally, certain residential mortgage loans that are managed by Legacy Assets & Servicing are held in All Other. The results of certain ALM activities are allocated to our business segments. For more information on our ALM activities, see Interest Rate Risk Management for NontradingNon-trading Activities on page 113105. Equity investments include Global Principal Investments (GPI)GPI which is comprised of a portfolio of equity, real estate and other alternative investments. These investments are made either directly in a company or held through a fund with related income recorded in equity investment income. Equity investments includedIn connection with our remaining investment in CCB which was sold during 2013,strategy to focus on our core businesses and certain other investments. Additionally, certain residential mortgage loans that are managed by Legacy Assets & Servicing are held in All Other.to conform with the Volcker Rule, the GPI portfolio has been actively winding down over the last several years through a series of portfolio and individual asset sale transactions.
Net income for All Other increased $4.2 billiondecreased $708 million to $4874 million in 20132014 primarily due to the negative fair value adjustmentsimpact on structured liabilitiesnet interest income of $649 million related to the improvement in our credit spreads during 2013market-related premium amortization expense on debt securities of $1.2 billion compared to a negativebenefit of $784 million in 2013 as lower long-term interest rates shortened the expected lives of the securities, a $5.1 billiondecrease in 2012, a $3.3 billion reduction in the provision for credit losses, a decrease in noninterest expense of $2.0 billion and an increase in equity investment income of $1.5 billion.and a $363 million increase in U.K. PPI costs. Partially offsetting the increasesthese decreases were $1.6 billion in gains related to debt repurchases and exchangesthe sales of trust preferred securitiesresidential mortgage loans, a $312 million improvement in 2012the provision (benefit) for credit losses and a decrease of $280 million$1.7 billion in gains on sales of debt securities.
noninterest expense. The provision (benefit) for credit losses improved $3.3 billion312 million to a benefit of $666978 million in 20132014 primarily driven by continuedthe impact of recoveries related to nonperforming and delinquent loan sales, partially offset by a slower pace of credit quality improvement in portfolio trends including increased home prices inrelated to the residential mortgage portfolio.
Noninterest expense decreased $2.01.7 billion to $4.22.9 billion primarily due to a decline in litigation expense, lower litigation expense. Thenet occupancy expense and a decline in professional fees. Also offsetting the decrease was a $580 million increase in the income tax benefit. For more information on the U.K. PPI costs, see benefitNote 12 – Commitments and Contingencies was $2.2 billion in 2013 compared to a benefit of $5.9 billion in 2012. The decrease was driven by the decline in the pre-tax loss in All Other and lower tax benefits as 2012 included a $1.7 billion tax benefit attributable to the excess of foreign tax credits recognized in the U.S. upon repatriation of the earnings of certain subsidiaries over the related U.S. tax liability.Consolidated Financial Statements.
|
| | |
| | 50Bank of America 2013201448
| | |
The income tax benefit was $2.6 billion in 2014 compared to a benefit of $2.0 billion in 2013 with the increase driven by the increase in the pretax loss in All Other and the resolution of several tax examinations, partially offset by a decrease in benefits from non-U.S. restructurings.
Equity Investment Activity
The following tables present the components of equity investments in All Other at December 31, 20132014 and 2012,2013, and also a reconciliation to the total consolidated equity investment income for 20132014 and 20122013.
| | | | | | | | | |
| Equity Investments | | | | | | |
| | | | | | | |
| | December 31 | December 31 |
| (Dollars in millions) | 2013 | | 2012 | 2014 | | 2013 |
| Global Principal Investments | $ | 1,604 |
| | $ | 3,470 |
| $ | 912 |
| | $ | 1,604 |
|
| Strategic and other investments | 807 |
| | 2,038 |
| 858 |
| | 822 |
|
Total equity investments included in All Other | $ | 2,411 |
| | $ | 5,508 |
| $ | 1,770 |
| | $ | 2,426 |
|
Equity investments included in All Other decreased $3.1 billion656 million to $2.41.8 billion during 20132014, with the decrease primarily due to sales inresulting from the continued wind down of the GPI and Strategic investments portfolios.portfolio. GPI had unfunded equity commitments of $31 million and $127 million at December 31, 20132014 compared to $224 million atand December 31, 20122013.
| | | | | | | | | |
| Equity Investment Income | | | | | | |
| | | | | | | |
| (Dollars in millions) | 2013 | | 2012 | 2014 | | 2013 |
| Global Principal Investments | $ | 378 |
| | $ | 589 |
| $ | (46 | ) | | $ | 379 |
|
| Strategic and other investments | 2,232 |
| | 546 |
| 647 |
| | 2,231 |
|
Total equity investment income included in All Other | 2,610 |
| | 1,135 |
| 601 |
| | 2,610 |
|
| Total equity investment income included in the business segments | 291 |
| | 935 |
| 529 |
| | 291 |
|
| Total consolidated equity investment income | $ | 2,901 |
| | $ | 2,070 |
| $ | 1,130 |
| | $ | 2,901 |
|
Equity investment income included indecreased All Other$1.8 billion was $2.6 billion in 2013, an increase of $1.5 billion from 2012. The increase was primarily due to the $753a $753 million gain onrelated to the sale of our remaining investment in CCB shares andChina Construction Bank Corporation (CCB) in 2013, lower gains of $1.4 billion on the sales of a portionportions of an equity investment. Total Corporation equity investment income was $2.9 billion in 2013, an increase of $831 million from 2012, duecompared to the same factors as described above,2013, and lower GPI results. These declines were partially offset by gainsa gain in 2012 on2014 related to the IPO of an equity investments included in the business segments.investment.
|
| | |
| | 49Bank of America 2013512014 | | |
Off-Balance Sheet Arrangements and Contractual Obligations
We have contractual obligations to make future payments on debt and lease agreements. Additionally, in the normal course of business, we enter into contractual arrangements whereby we commit to future purchases of products or services from unaffiliated parties. ObligationsPurchase obligations are defined as obligations that are legally binding agreements whereby we agree to purchase products or services with a specific minimum quantity at a fixed, minimum or variable price over a specified period of time are defined as purchase obligations.time. Included in purchase obligations are commitments to purchase loans of $1.5 billion and vendor contracts, of $18.4 billion. Thethe most significant vendor contractsof which include communication services, processing services and software contracts. Other long-term liabilities include our contractual funding obligations related to the Qualified Pension Plans, Non-U.S. Pension Plans, Nonqualified and Other Pension Plans, and Postretirement Health and Life Plans (collectively, the Plans). Obligations to the Plans are based on the current and projected
obligations of the Plans, performance of the Plans’ assets and any participant contributions, if applicable.
During 20132014 and 20122013, we contributed $290234 million and $381290 million to the Plans, and we expect to make $292244 million of contributions during 20142015. The Plans are more fully discussed in Note 17 – Employee Benefit Plansto the Consolidated Financial Statements.
Debt, lease, equity and other obligations are more fully discussed in Note 11 – Long-term Debt and Note 12 – Commitments and Contingenciesto the Consolidated Financial Statements. The Plans are more fully discussed in Note 17 – Employee Benefit Plans to the Consolidated Financial Statements.
We enter into commitments to extend credit such as loan commitments, standby letters of credit (SBLCs) and commercial letters of credit to meet the financing needs of our customers. For a summary of the total unfunded, or off-balance sheet, credit extension commitment amounts by expiration date, see Credit Extension Commitments in Note 12 – Commitments and Contingencies to the Consolidated Financial Statements.
Table 11 includes certain contractual obligations at December 31, 20132014.
| | | | | | | | | | | | | | | | | | | | | | | |
| Table 11 | Contractual Obligations | Contractual Obligations |
| | | | | | | | | | | | | | | | | | | | | |
| | | December 31, 2013 | | December 31, 2014 |
| (Dollars in millions) | (Dollars in millions) | Due in One Year or Less | | Due After
One Year Through Three Years | | Due After
Three Years Through Five Years | | Due After Five Years | | Total | (Dollars in millions) | Due in One Year or Less | | Due After
One Year Through Three Years | | Due After
Three Years Through Five Years | | Due After Five Years | | Total |
| Long-term debt | Long-term debt | $ | 46,076 |
| | $ | 63,241 |
| | $ | 62,830 |
| | $ | 77,527 |
| | $ | 249,674 |
| Long-term debt | $ | 30,724 |
| | $ | 80,753 |
| | $ | 49,136 |
| | $ | 82,526 |
| | $ | 243,139 |
|
| Operating lease obligations | Operating lease obligations | 2,841 |
| | 4,531 |
| | 3,003 |
| | 5,672 |
| | 16,047 |
| Operating lease obligations | 2,553 |
| | 4,157 |
| | 2,725 |
| | 4,971 |
| | 14,406 |
|
| Purchase obligations | Purchase obligations | 6,205 |
| | 6,859 |
| | 3,873 |
| | 3,838 |
| | 20,775 |
| Purchase obligations | 2,077 |
| | 2,864 |
| | 361 |
| | 242 |
| | 5,544 |
|
| Time deposits | Time deposits | 98,201 |
| | 8,784 |
| | 1,972 |
| | 2,278 |
| | 111,235 |
| Time deposits | 75,604 |
| | 5,865 |
| | 1,640 |
| | 1,734 |
| | 84,843 |
|
| Other long-term liabilities | Other long-term liabilities | 1,289 |
| | 915 |
| | 720 |
| | 1,132 |
| | 4,056 |
| Other long-term liabilities | 1,470 |
| | 928 |
| | 698 |
| | 1,136 |
| | 4,232 |
|
Estimated interest expense on long-term debt and time deposits (1) | Estimated interest expense on long-term debt and time deposits (1) | 5,189 |
| | 10,045 |
| | 9,081 |
| | 13,247 |
| | 37,562 |
| Estimated interest expense on long-term debt and time deposits (1) | 5,036 |
| | 10,511 |
| | 7,665 |
| | 12,323 |
| | 35,535 |
|
| Total contractual obligations | Total contractual obligations | $ | 159,801 |
| | $ | 94,375 |
| | $ | 81,479 |
| | $ | 103,694 |
| | $ | 439,349 |
| Total contractual obligations | $ | 117,464 |
| | $ | 105,078 |
| | $ | 62,225 |
| | $ | 102,932 |
| | $ | 387,699 |
|
| |
(1) | Represents estimated, forecasted net interest expense on long-term debt and time deposits. Forecasts are based on the contractual maturity dates of each liability, and are net of derivative hedges.hedges, where applicable. |
Representations and Warranties
We securitize first-lien residential mortgage loans generally in the form of MBSRMBS guaranteed by the government-sponsored enterprises (GSEs) or by the Government National Mortgage Association (GNMA) in the case of Federal Housing Administration (FHA)-insured, U.S. Department of Veterans Affairs (VA)-guaranteed and Rural Housing Service-guaranteed mortgage loans, and sell pools of first-lien residential mortgage loans in the form of whole loans. In addition, in prior years, legacy companies and certain subsidiaries sold pools of first-lien residential mortgage loans and home equity loans as private-label securitizations (in certain of these securitizations, monolinesmonoline insurers or other financial guarantee providers insured all or some of the securities) or in the form of whole loans. In connection with these transactions, we or certain of our subsidiaries or legacy companies make or have made various representations and warranties. Breaches of these representations and warranties have resulted in and may continue to result in the requirement to repurchase mortgage loans or to otherwise make whole or provide other remedies to the GSEs, U.S. Department of Housing and Urban Development (HUD) with respect to FHA-insured loans, VA, whole-loan investors, securitization trusts, monoline insurers or other financial guarantors (collectively, repurchases). In all such cases, subsequent to repurchasing the loan, we would be exposed to any credit loss on the repurchased mortgage loans, after
mortgage loans after accounting for any mortgage insurance (MI) or mortgage guarantee payments that we may receive.
For more information on accounting for representations and warranties and our representations and warranties repurchase claims and exposures, see Note 7 – Representations and Warranties Obligations and Corporate Guarantees and Note 12 – Commitments and Contingenciesto the Consolidated Financial Statements and Item 1A. Risk Factors.
We have vigorously contested any request for repurchase when we conclude that a valid basis for repurchase does not exist and will continue to do so in the future. However, in an effort to resolve these legacy mortgage-related issues, we have reached bulk settlements, or agreements for bulk settlements, certain of which have been for significant amounts, in lieu of a loan-by-loan review process, including with the GSEs, with threefour monoline insurers and with the Bank of New York Mellon (the(BNY Mellon), as trustee. The settlement with BNY Mellon Settlement), as trustee (the Trustee) for certain Countrywide private-label securitization trusts in 2011. As a result of various settlements with the GSEs, we have resolved substantially all outstanding and potential representations and warranties repurchase claims on whole loans sold by legacy Bank of America and Countrywide to FNMA and FHLMC through 2008 and 2009, respectively.
We may reach other settlements in the future if opportunities arise on terms we believe to be advantageous. However, there can be no assurance that we will reach future settlements or, if we do, that the terms of past settlements can be relied upon to predict the terms of future settlements. These bulk settlements generally did not cover all transactions with the relevant counterparties or all potential claims that may arise, including in some instances securities law, fraud and servicing claims. For example, we are currently involved in MBS litigation including purported class action suits, actions brought by individual MBS purchases, actions brought by FHFA as conservator for the GSEs and governmental actions. Our liability in connection with the transactions and claims not covered by these settlements could be material. For more information on our exposure to RMBS matters involving securities law, fraud or related claims, see Note 12 – Commitments and Contingenciesto the Consolidated Financial Statements.
The BNY(BNY Mellon SettlementSettlement) remains subject to final court approval and certain other conditions. It is not currently possible to predict the ultimate outcome or timing of the court approval process, which can includeincludes appeals and could take a substantial period of time. The court approval hearing began in the New York Supreme Court, New York County, on June 3, 2013 and concluded on November 21, 2013. On January 31, 2014, the court issued a decision, order and judgment approving the BNY Mellon Settlement. The court overruled the objections to the settlement, holding that the Trustee, BNY Mellon, acted in good faith, within its discretion and within the bounds of reasonableness in determining that the settlement agreement was in the best interests of the covered trusts. The court declined to approve the Trustee’s conduct only with respect to the Trustee’s consideration of a potential claim that a loan must be repurchased if the servicer modifies its terms. On February 4, 2014, one of the objectors filed a motion to stay entry of judgment and to hold additional proceedings in the trial court on issues it alleged had not been litigated or decided by the court in its January 31, 2014 decision, order and judgment. On February 18, 2014, the same objector also filed a motion for reargument of the trial court’s January 31, 2014 decision. The court held a hearing on the motion to stay on February 19, 2014, and rejected the application for stay and for further proceedings in the trial court. The court also ruled it would not hold oral argument on the objector’s motion for reargument before April 2014. On February 21, 2014, final judgment was entered and the Trustee filed a notice of appeal regarding the court’s ruling on loan modification claims in the settlement. The court’s January 31, 2014 decision, order and judgment remain subject to appeal and the motion to reargue, and it is not possible to predict the timetable for appeals or when the court approval process will be completed.
Although, we are not a party to the proceeding, certain of our rights and obligations under the settlement agreement are conditioned on final court approval of the settlement. There can be no assurance final court approval will be obtained, that all conditions to the BNY Mellon Settlement will be satisfied, or if certain conditions to the BNY Mellon Settlement permitting withdrawal are met, that we and Countrywide will not withdraw from the settlement. If final court approval is not obtained, or if we and Countrywide Financial Corporation (Countrywide) withdraw from the BNY Mellon Settlement in accordance with its terms, our future representations and warranties losses could be substantially different from existing accruals and the estimated range of possible loss over existing accruals.
For more information on accounting for representations and warranties, repurchase claims and exposures, including a summary of the larger bulk settlement actions and the related impact on the representations and warranties provision and liability,settlements, see Note 7 – Representations and Warranties Obligations and Corporate Guarantees and Note 12 – Commitments and Contingenciesto the
Consolidated Financial Statements. and Item 1A. Risk Factors of this Annual Report on Form 10-K.
Unresolved Repurchase Claims
Repurchase claims received from a counterparty are considered unresolved repurchase claims until the underlying loan is repurchased, the claim is rescinded by the counterparty or the claim is otherwise settled. Unresolved representations and warranties repurchase claims represent the notional amount of repurchase claims made by counterparties, typically the outstanding principal balance or the unpaid principal balance at the time of default. In the case of first-lien mortgages, the claim amount is often significantly greater than the expected loss amount due to the benefit of collateral and, in some cases, MI or mortgage guarantee payments. Claims received from a counterparty remain outstanding until the underlying loan is repurchased, the claim is rescinded by the counterparty or the representations and warranties claims with respect to the applicable trust are settled, and fully and finally released. When a claim is denied and we dothe Corporation does not receive a response from the counterparty, the claim remains in the unresolved repurchase claims balance until resolution.
Table 12 presentsAt December 31, 2014, we had $22.4 billion of unresolved repurchase claims, by counterpartynet of duplicate claims, compared to $18.7 billion at December 31, 2013. These repurchase claims relate primarily to private-label securitizations and 2012include claims in the amount of $4.7 billion, net of duplicate claims, where we believe the statute of limitations has expired under current law. For additional information, see .Note 7 – Representations and Warranties Obligations and Corporate Guarantees to the Consolidated Financial Statements.
|
| | | | | | | | |
| | | | | |
| Table 12 | Unresolved Repurchase Claims by Counterparty (1, 2) |
| | | | | |
| | | December 31 |
| (Dollars in millions) | 2013 | | 2012 |
Private-label securitization trustees, whole-loan investors, including third-party securitization sponsors and other (3) | $ | 17,953 |
| | $ | 12,222 |
|
| Monolines | 1,532 |
| | 2,442 |
|
| GSEs | 170 |
| | 13,437 |
|
Total unresolved repurchase claims (3) | $ | 19,655 |
| | $ | 28,101 |
|
| |
(1)
| The total notional amount of unresolved repurchase claims does not include any repurchase claims related to the trusts covered by the BNY Mellon Settlement. |
| |
(2)
| At December 31, 2013 and 2012, unresolved repurchase claims did not include repurchase demands of $1.2 billion and $1.6 billion where the Corporation believes the claimants have not satisfied the contractual thresholds.
|
| |
(3)
| Includes $13.8 billion and $11.7 billion of claims based on individual file reviews and $4.1 billion and $519 million of claims submitted without individual file reviews at December 31, 2013 and 2012.
|
The notional amount of unresolved repurchase claims from private-label securitization trustees, whole-loan investors, including third-party securitization sponsors, and others included $13.8 billion and $11.7 billion of claims based on individual file reviews and $4.1 billion and $519 million of claims submitted without individual file reviews at December 31, 2013 and 2012. Thecontinued increase in the notional amount of unresolved repurchase claims during 20132014 is primarily due toto: (1) continued submission of claims by private-label securitization trustees;trustees, (2) the level of detail, support and analysis accompanying such claims, which impact overall claim quality and, therefore, claims resolution; andresolution, (3) the lack of an established process to resolve disputes related to these claims.claims, (4) the submission of claims where we believe the statute of limitations has expired under current law and (5) the submission of duplicate claims, often in multiple submissions, on the same loan. For example, claims submitted without individual file reviews generally lack the level of detail and analysis of individual loans found in other claims that is necessary for us to respond tosupport a claim. Absent any settlements, the claim. We expectCorporation expects unresolved repurchase claims related to private-label securitizations to increase as such claims continue to be submitted and there is not an established process for the ultimate resolution of such claims on which there is a disagreement.
In addition to and not included in, the total unresolved repurchase claims, we have received repurchase demands from private-label securitization investors and a master servicer wherenotifications pertaining to loans for which we believe the claimants have not satisfied thereceived a repurchase request from sponsors of third-party securitizations with whom we engaged in whole-loan transactions and that we may owe indemnity obligations. These notifications totaled $2.0 billion and $737 million at December 31, 2014 and 2013.
We also from time to time receive correspondence purporting to raise representations and warranties breach issues from entities that do not have contractual thresholdsstanding or ability to direct the securitization trusteebring such claims. We believe such communications to take actionbe procedurally and/or that these demands are otherwise procedurally or substantively invalid. invalid, and generally do not respond to such correspondence.
The total amount outstandingpresence of such demands was $1.2 billion, comprised of $945 million of demands received during 2012 and $273 million of demands related to trusts covered by the BNY Mellon Settlement at December 31, 2013 compared to $1.6 billion at December 31, 2012. The decrease in outstanding demands is a result of certain demands that were replaced by repurchase claims submitted by trustees, whichon a given trust, receipt of notices of indemnification obligations and other communication, as discussed above, are included in Table 12. We do not believeall factors that inform our estimated liability for obligations under representations and warranties and the demands outstanding at December 31, 2013 represent valid repurchase claims and, therefore, it is notcorresponding estimated range of possible to predict the resolution with respect to such demands.loss.
The decline in unresolved monoline claims is primarily due to the MBIA Settlement. Substantially all of the remaining unresolved monoline claims pertain to second-lien loans and are currently the subject of litigation.
During 2013, we received $8.4 billion in new repurchase claims, including $6.3 billion submitted by private-label securitization trustees and a financial guarantee provider, $1.8 billion submitted by the GSEs for both Countrywide and legacy Bank of America originations not covered by the bulk settlements with the GSEs, $222 million submitted by whole-loan investors and $50 million submitted by monoline insurers. During 2013, $16.7 billion in claims were resolved, including $646 million and $12.2 billion in GSE claims resolved through settlements with FHLMC and FNMA and $945 million resolved through the MBIA Settlement. Of the remaining claims that were resolved, $1.7 billion were resolved through rescissions and $1.2 billion were resolved through mortgage repurchases and make-whole payments, primarily with the GSEs.
Representations and Warranties Liability
The liability for representations and warranties and corporate guarantees is included in accrued expenses and other liabilities on the Consolidated Balance Sheet and the related provision is included in mortgage banking income (loss) in the Consolidated Statement of Income. For additional discussion ofmore information on the representations and warranties liability and the corresponding estimated range of possible loss, see Off-Balance Sheet Arrangements and Contractual Obligations – Estimated Range of Possible Loss on page 56.53.
At December 31, 20132014 and 2012,2013, the liability for representations and warranties was $13.3$12.1 billion and $19.0 billion, with the decrease primarily driven by the FNMA Settlement.$13.3 billion. For 2013,2014, the representations and warranties provision was $840$683 million compared to $3.9 billion$840 million for 2012. The provision for 2013
2013.was driven by our remaining GSE exposures, including the FHLMC Settlement and our obligations related to MI rescissions. The provision for 2012 included $2.5 billion in provision related to the FNMA Settlement and $500 million for obligations to FNMA related to MI rescissions.
Our estimated liability at December 31, 20132014 for obligations under representations and warranties is necessarily dependent on, and limited by a number of factors including for private-label securitizations the implied repurchase experience based on the BNY Mellon Settlement, as well as certain other assumptions and judgmental factors. Accordingly, future provisions associated with obligations under representations and warranties may be materially impacted if actual experiences are different from historical experience or our understandings, interpretations or assumptions. Although we have not recorded any representations and warranties liability for certain potential private-label securitization and whole-loan exposures where we have had little to no claim activity, or where the applicable statute of limitations has expired under current law, these exposures are included in the estimated range of possible loss.
Experience with Government-sponsored Enterprises
As a result of various settlements with the GSEs, we have resolved substantially all outstanding and potential representations and warranties repurchase claims on whole loans sold by legacy Bank of America and Countrywide to FNMAFannie Mae (FNMA) and FHLMCFreddie Mac (FHLMC) through 2008June 30, 2012 and December 31, 2009, respectively. After these settlements, our exposure to representationsFor additional information, see Note 7 – Representations and warranties liability for loans originated prior to 2009Warranties Obligations and sold Corporate Guarantees to the GSEs is limited to loans with an original principal balance of $13.7 billion and loans with certain defects excluded from the settlements that we do not believe will be material, such as title defects and certain specified violations of the GSEs’ charters. As of December 31, 2013, of the $13.7 billion, approximately $10.8 billion in principal has been paid, $941 million in principal has defaulted or was severely delinquent and the notional amount of unresolved repurchase claims submitted by the GSEs was $144 million related to these vintages.Consolidated Financial Statements.
Experience with Investors Other than Government-sponsored Enterprises
In prior years, legacy companies and certain subsidiaries sold pools of first-lien residential mortgage loans and home equity loans as private-label securitizations or in the form of whole loans originated from 2004 through 2008 with an original principal balance of $965 billionto investors other than GSEs (although the GSEs are investors in certain private-label securitizations),. Such loans originated from 2004 through 2008 had an original principal balance of which $552970 billion, including $786 billion sold to private-label and whole-loan investors without monoline insurance and $185 billion with monoline insurance. Of the $970 billion, $574 billion in principal has been paid, $192$201 billion in principal has defaulted, $53$44 billion in principal was severely delinquent, and $168$151 billion in principal was current or less than 180 days past due at December 31, 20132014 as summarized in Table 12. Of the original principal balance of $716 billion for Countrywide, $409 billion is included in the BNY Mellon Settlement and, of this amount, $109 billion was defaulted or severely delinquent at December 31, 2014.
|
| | |
5451 Bank of America 20132014
| | |
Table 13 details the population of loans originated between 2004 and 2008 and sold in non-agency securitizations or as whole loans by entity and product together with the defaulted and severely delinquent loans stratified by the number of payments the borrower made prior to default or becoming severely delinquent as of December 31, 2013.
| | | | | | | | | | | | | | | | | | | | | | | | | | | | | | | | | | | | | | | |
| Table 13 | Overview of Non-Agency Securitization and Whole-loan Balances | |
| Table 12 | | Overview of Non-Agency Securitization and Whole-loan Balances from 2004 to 2008 |
| | | | | | | | | | | | | | | | | | | | | | | | | | | | | | | | | | | | | |
| | | Principal Balance | | Defaulted or Severely Delinquent | | Principal Balance | | Defaulted or Severely Delinquent |
(Dollars in billions)
By Entity | (Dollars in billions)
By Entity | Original Principal Balance | | Outstanding
Principal Balance December 31, 2013 | | Outstanding
Principal Balance 180 Days or More Past Due | | Defaulted Principal Balance | | Defaulted or Severely Delinquent | | Borrower Made Less than 13 Payments | | Borrower
Made 13 to 24 Payments | | Borrower
Made 25 to 36 Payments | | Borrower
Made More than 36 Payments | (Dollars in billions)
By Entity | Original Principal Balance | | Outstanding
Principal Balance December 31, 2014 | | Outstanding
Principal Balance 180 Days or More Past Due | | Defaulted Principal Balance | | Defaulted or Severely Delinquent | | Borrower Made Less than 13 Payments | | Borrower
Made 13 to 24 Payments | | Borrower
Made 25 to 36 Payments | | Borrower
Made More than 36 Payments |
| Bank of America | Bank of America | $ | 100 |
| | $ | 18 |
| | $ | 3 |
| | $ | 7 |
| | $ | 10 |
| | $ | 1 |
| | $ | 2 |
| | $ | 2 |
| | $ | 5 |
| Bank of America | $ | 100 |
| | $ | 15 |
| | $ | 3 |
| | $ | 7 |
| | $ | 10 |
| | $ | 1 |
| | $ | 2 |
| | $ | 2 |
| | $ | 5 |
|
| Countrywide | Countrywide | 716 |
| | 173 |
| | 43 |
| | 144 |
| | 187 |
| | 24 |
| | 45 |
| | 45 |
| | 73 |
| Countrywide | 716 |
| | 153 |
| | 35 |
| | 150 |
| | 185 |
| | 24 |
| | 44 |
| | 44 |
| | 73 |
|
| Merrill Lynch | Merrill Lynch | 67 |
| | 15 |
| | 3 |
| | 16 |
| | 19 |
| | 3 |
| | 4 |
| | 3 |
| | 9 |
| Merrill Lynch | 72 |
| | 13 |
| | 3 |
| | 18 |
| | 21 |
| | 3 |
| | 4 |
| | 3 |
| | 11 |
|
| First Franklin | First Franklin | 82 |
| | 15 |
| | 4 |
| | 25 |
| | 29 |
| | 5 |
| | 6 |
| | 5 |
| | 13 |
| First Franklin | 82 |
| | 14 |
| | 3 |
| | 26 |
| | 29 |
| | 5 |
| | 6 |
| | 5 |
| | 13 |
|
Total (1, 2) | Total (1, 2) | $ | 965 |
| | $ | 221 |
| | $ | 53 |
| | $ | 192 |
| | $ | 245 |
| | $ | 33 |
| | $ | 57 |
| | $ | 55 |
| | $ | 100 |
| Total (1, 2) | $ | 970 |
| | $ | 195 |
| | $ | 44 |
| | $ | 201 |
| | $ | 245 |
| | $ | 33 |
| | $ | 56 |
| | $ | 54 |
| | $ | 102 |
|
| By Product | By Product | |
| | |
| | |
| | |
| | |
| | |
| | |
| | |
| | |
| By Product | |
| | |
| | |
| | |
| | |
| | |
| | |
| | |
| | |
|
| Prime | Prime | $ | 302 |
| | $ | 66 |
| | $ | 8 |
| | $ | 26 |
| | $ | 34 |
| | $ | 2 |
| | $ | 6 |
| | $ | 7 |
| | $ | 19 |
| Prime | $ | 302 |
| | $ | 55 |
| | $ | 7 |
| | $ | 27 |
| | $ | 34 |
| | $ | 2 |
| | $ | 6 |
| | $ | 7 |
| | $ | 19 |
|
| Alt-A | Alt-A | 172 |
| | 50 |
| | 11 |
| | 39 |
| | 50 |
| | 7 |
| | 12 |
| | 12 |
| | 19 |
| Alt-A | 173 |
| | 44 |
| | 10 |
| | 40 |
| | 50 |
| | 7 |
| | 12 |
| | 11 |
| | 20 |
|
| Pay option | Pay option | 150 |
| | 37 |
| | 14 |
| | 41 |
| | 55 |
| | 5 |
| | 13 |
| | 15 |
| | 22 |
| Pay option | 150 |
| | 32 |
| | 10 |
| | 44 |
| | 54 |
| | 5 |
| | 13 |
| | 15 |
| | 21 |
|
| Subprime | Subprime | 247 |
| | 55 |
| | 18 |
| | 66 |
| | 84 |
| | 17 |
| | 20 |
| | 16 |
| | 31 |
| Subprime | 251 |
| | 50 |
| | 15 |
| | 70 |
| | 85 |
| | 17 |
| | 20 |
| | 16 |
| | 32 |
|
| Home equity | Home equity | 88 |
| | 11 |
| | — |
| | 18 |
| | 18 |
| | 2 |
| | 5 |
| | 4 |
| | 7 |
| Home equity | 88 |
| | 9 |
| | — |
| | 18 |
| | 18 |
| | 2 |
| | 5 |
| | 4 |
| | 7 |
|
| Other | Other | 6 |
| | 2 |
| | 2 |
| | 2 |
| | 4 |
| | — |
| | 1 |
| | 1 |
| | 2 |
| Other | 6 |
| | 5 |
| | 2 |
| | 2 |
| | 4 |
| | — |
| | — |
| | 1 |
| | 3 |
|
| Total | Total | $ | 965 |
| | $ | 221 |
| | $ | 53 |
| | $ | 192 |
| | $ | 245 |
| | $ | 33 |
| | $ | 57 |
| | $ | 55 |
| | $ | 100 |
| Total | $ | 970 |
| | $ | 195 |
| | $ | 44 |
| | $ | 201 |
| | $ | 245 |
| | $ | 33 |
| | $ | 56 |
| | $ | 54 |
| | $ | 102 |
|
| |
(1) | Excludes transactions sponsored by Bank of America and Merrill Lynch where no representations or warranties were made. |
| |
(2) | Includes exposures on third-party sponsored transactions related to legacy entity originations. |
As it relates to private-label securitizations, we believe a contractual liability to repurchase mortgage loans generally arises only if counterparties prove there is a breach of representations and warranties that materially and adversely affects the interest of the investor or all the investors in a securitization trust or of the monoline insurer or other financial guarantor (as applicable). We believe many of the loan defaults observed in these securitizations and whole-loan balances have been, and continue to be,transactions were driven by external factors like the substantial depreciation in home prices experienced after the economic downturn, persistently high unemployment and other negative economic trends, diminishing the likelihood that any loan defect, (assuming oneto the extent any exists, at all) was the cause of a loan’s default. As of December 31, 2013, approximately 25 percent of the loans sold to non-GSEs that were originated between 2004 and 2008 have defaulted or are severely delinquent. Of the original principal balance for Countrywide, $409 billion is included in the BNY Mellon Settlement and, of this amount, $109 billion was defaulted or severely delinquent at December 31, 2013.
Experience with Private-label SecuritizationsSecuritization and Whole LoansLoan Investors
Legacy entities, and to a lesser extent Bank of America, sold loans to investors via private-label securitizations or as whole loans. The majority of the loans sold were included in private-label securitizations, including third-party sponsored transactions. We provided representations and warranties to the whole-loan investors and these investors may retain those rights even when the whole loans were aggregated with other collateral into private-label securitizations sponsored by the whole-loan investors. The loans sold with an original total principal balance of $780.5 billion, included in Table 13, wereLoans originated between 2004 and 2008, and sold without monoline insurance had an original total principal balance of which $449.9$786 billion included in Table 12. Of the $786 billion, $469 billion have been paid in full and $191.3$193 billion were defaulted or severely delinquent at December 31, 2013.2014. At least 25 payments have been made on approximately 64 percent of the defaulted and severely delinquent loans. We have received
We have received approximately $25.9$33 billion of representations and warranties repurchase claims related to these vintages, including $16.9$24 billion from private-label securitization trustees and a financial guarantee provider, $8.2$8 billion from whole-loan investors and $809$815 million from one private-label securitization counterparty. In private-label securitizations, certain presentation thresholds need to be met in order for investors to direct a trustee to assert repurchase claims. Continued high levels of new private-label claims are primarily related to repurchase requests received from trustees and third-party sponsors for private-label securitization transactions not included in the BNY Mellon Settlement, including claims related to first-lien third-party sponsored securitizations that include monoline insurance. Over time, there has been an increase in requests for loan files from certain private-label securitization trustees, as well as requests for tolling agreements to toll the applicable statute of limitations relating to representations and warranties repurchase claims, and we believe it is likely that these requests will lead to an increase in repurchase claims from private-label securitization trustees with standing to bring such claims. In addition, private-label securitization trustees may have obtained loan files through other means, including litigation and administrative subpoenas, which may increase our total exposure.
A recent decision by the New York intermediate appellate court held that, under New York law, which governs many RMBS trusts, the six-year statute of limitations starts to run at the time the representations and warranties are made (i.e., the date the transaction closed and not when the repurchase demand was denied). If upheld, this decision may impact the timeliness of representations and warranties claims and/or lawsuits, where these claims have not already been tolled by agreement. We believe this ruling may lead to an increase in requests for tolling agreements as well as an increase in the pace of representations and warranties claims and/or the filing of lawsuits by private-label
securitization trustees prior the expiration of the statute of limitations.
Settlement. We have resolved $8.09 billion of the $25.9 billion ofthese claims received from whole-loan and private-label securitization counterparties with losses of $1.92 billion. The majority of these resolved claims were from third-party whole-loan investors. Approximately $3.34 billion of these claims were resolved through repurchase or indemnification, and $4.75 billion were rescinded by the investor.investor and $336 million were resolved through settlements. As of December 31, 2014, 15 percent of the whole-loan claims for loans originated between 2004 and 2008 that we initially denied have subsequently been resolved through repurchase or make-whole payments and 45 percent have been resolved through rescission of the claim by the counterparty or repayment in full by the borrower. At December 31, 20132014, for loans originated between 2004 and 2008, the notional amount of unresolved repurchase claims submitted by private-label securitization trustees, whole-loan investors, including third-party securitization sponsors and a financial guarantee providerothers was $17.924 billion., including $3 billion of duplicate claims primarily submitted without a loan file review. We have performed an initial review with respect to $14.6 billionsubstantially all of these claims and although we do not believe a valid basis for repurchase has been established by the claimant, and are stillwe consider claims activity in the processcomputation of reviewing the remaining $3.3 billion of these claims.our liability for representations and warranties. Until we receive a repurchase claim, we generally do not review loan files related to private-label securitizations sponsored by third-party whole-loan investors (andand believe we are not required by the governing documents to do so).so.
Certain whole-loan investors have engaged with us in a consistent repurchase process and we have used that and other experience to record a liability related to existing and future claims from such counterparties. The BNY Mellon Settlement and subsequent activity with certain counterparties led to the determination that we had sufficient experience to record a liability related to our exposure on certain private-label securitizations, including certain private-label securitizations sponsored by third-party whole-loan investors, however, it did not provide sufficient experience to record a liability related to other private-label securitizations sponsored by third-party whole-loan investors. As it relates to the other private-label securitizations sponsored by third-party whole-loan investors and certain other whole-loan sales, it is not possible to determine whether a loss has occurred or is probable and, therefore, no representations and warranties liability has been recorded in connection with these transactions. As discussed below, our estimated range of possible loss related to representations and warranties exposures as of December 31, 2013 included possible losses related to these whole-loan sales and private-label securitizations sponsored by third-party whole-loan investors.The representations and warranties, as governed by the private-label securitization agreements, generally require that counterparties have the ability to both assert a claim and actually prove that a loan has an actionable defect under the applicable contracts. While the Corporation believes the agreements for private-label securitizations generally contain less rigorous representations and warranties and place higher burdens on claimants seeking repurchases than the express provisions of comparable agreements with the GSEs, without regard to any variations that may have arisen as a result of dealings with the GSEs, the agreements generally include a representation that underwriting practices were prudent and customary. In the case of private-label securitization trustees and third-party sponsors, there is currently no established process in place for the parties to reach a conclusion on an individual loan if there is a disagreement on the resolution of the claim. Private-label securitization investors generally do not have the contractual right to demand repurchase of loans directly or the right to access loan files.
Experience with Monoline Insurers
Legacy companies sold $184.5 billion of loans originated between 2004 and 2008 into monoline-insured securitizations, which are included in Table 13. AtDuring December 31, 20132014, for loans originated between 2004 and 2008, the unpaid principal balance of loans related to unresolved monoline repurchase claims was $1.5 billion compared to $2.4 billion at December 31, 2012. The decrease in unresolved monoline repurchase claims was driven by the resolution of claims through the MBIA Settlement.
During 2013, there was minimal repurchase claim activity with the monolinesand the monolines did not request any loan files for review through thewe had limited loan-level representations and warranties process. However, there may be additional claims or file requests in the future.
The MBIA Settlement in 2013 resolved outstanding and potential claims between the parties to the settlement involving 31 first- and 17 second-lien RMBS trusts for which MBIA provided financial guarantee insurance, including $945 million of monoline repurchase claims outstanding at December 31, 2012.experience with the monoline insurers due to settlements and ongoing litigation with a single monoline insurer. For more information onrelated to the MBIA Settlement,monolines, see Note 7 – Representations and Warranties Obligations and Corporate Guarantees and Note 12 – Commitments and Contingenciesto the Consolidated Financial Statements.
Open Mortgage Insurance Rescission Notices
In addition to repurchase claims, we receive notices from mortgage insurance companies of claim denials, cancellations or coverage rescission (collectively, MI rescission notices). Although the number of such open notices has remained elevated, they have decreased over the last several quarters as the resolution of open notices exceeded new notices.
At December 31, 2013, we had approximately 101,000 open MI rescission notices compared to 110,000 at December 31, 2012. Open MI rescission notices at December 31, 2013 included 39,000 pertaining principally to first-lien mortgages serviced for others, 10,000 pertaining to loans held-for-investment (HFI) and 52,000 pertaining to ongoing litigation for second-lien mortgages.
For more information on open mortgage insurance rescission notices, see Note 7 – Representations and Warranties Obligations and Corporate Guaranteesto the Consolidated Financial Statements.Statements.
Estimated Range of Possible Loss
We currently estimate that the range of possible loss for representations and warranties exposures could be up to $4 billion over existing accruals at December 31, 20132014. The estimated range of possible loss reflects principally non-GSE exposures. It represents a reasonably possible loss, but does not represent a probable loss, and is based on currently available information, significant judgment and a number of assumptions that are subject to change.
The liability for representations and warranties exposures and the corresponding estimated range of possible loss do not consider any losses related to litigation matters, including RMBS litigation or litigation brought by monoline insurers, nor do they include any separate foreclosure costs and related costs, assessments and compensatory fees or any other possible losses related to potential claims for breaches of performance of servicing obligations, except as such losses are included as potential costs of the BNY Mellon Settlement, potential securities law or fraud claims or potential indemnity or other claims against us, including claims related to loans insured by the FHA. We are not able to
reasonably estimate the amount of any possible loss with respect to any such servicing, securities law, fraud or other claims against us, except to the extent reflected in existing accruals or the estimated range of possible loss for litigation and regulatory matters disclosed in Note 12 – Commitments and Contingenciesto the Consolidated Financial Statements; however, in light of the inherent uncertainties involved in these matters and the very large or indeterminate damages sought in some of these matters, an adverse outcome in one or more of these matters could be material to our results of operations or cash flows for any particular reporting period.
Future provisions and/or ranges of possible loss for representations and warranties may be significantly impacted if actual experiences are different from our assumptions in our predictive models, including, without limitation, ultimate resolution of the BNY Mellon Settlement, estimated repurchase rates, estimated MI rescission rates, economic conditions, estimated home prices, consumer and counterparty behavior, and a variety of other judgmental factors.
For more information on the methodology used to estimate the representations and warranties liability, and the corresponding estimated range of possible loss and the types of losses not considered in such estimates, see Item 1A. Risk Factors of this Annual Report on Form 10-K and Note 7 – Representations and Warranties Obligations and Corporate Guarantees to the Consolidated Financial Statements and, for more information related to the sensitivity of the assumptions used to estimate our liability for obligations under representations and warranties, see Complex Accounting Estimates – Representations and Warranties Liability on page 122.113.
Department of Justice Settlement
On August 20, 2014, we reached a comprehensive settlement with the DoJ and certain federal and state agencies (DoJ Settlement). The DoJ Settlement included releases for securitization, origination, sale and other specified conduct relating to RMBS and collateralized debt obligations (CDOs), and an origination release on specified populations of residential mortgage loans sold to GSEs and private-label RMBS trusts. The DoJ Settlement resolved certain actual and potential civil claims by the DoJ, the Securities and Exchange Commission and State Attorneys General from six states, the FHA and GNMA, as well as all pending RMBS claims against Bank of America entities brought by the FDIC. For FHA-insured loans originated on or after May 1, 2009, we also received a release of origination liability for loans only if an insurance claim had been submitted to the FHA prior to January 1, 2014. If a claim had not been submitted by that date, we did not receive a release and we may be exposed to losses on such loans. For more information on FHA-insured loans originated on or before April 30, 2009, see Off-Balance Sheet Arrangements and Contractual Obligations – National Mortgage Settlement on page 54.
As part of the DoJ Settlement, we paid civil monetary penalties and compensatory remediation payments totaling $9.65 billion in 2014 and agreed to provide $7.0 billion worth of creditable consumer relief activities primarily in the form of mortgage modifications, including first-lien principal forgiveness and forbearance modifications and second- and junior-lien extinguishments, low- to moderate-income mortgage originations, and community reinvestment and neighborhood stabilization efforts, with initiatives focused on communities experiencing, or
at risk of, blight. In addition, we recorded $400 million of provision for credit losses for additional costs associated with the consumer relief portion of the settlement. Also, we will support the expansion of available affordable rental housing. We have committed to complete delivery of the consumer relief by no later than August 31, 2018. The consumer relief requirements are subject to oversight by an independent monitor.
Servicing, Foreclosure and Other Mortgage Matters
We service a large portion of the loans we or our subsidiaries have securitized and also service loans on behalf of third-party securitization vehicles and other investors. Our servicing obligations are set forth in servicing agreements with the applicable counterparty. These obligations may include, but are not limited to, loan repurchase requirements in certain circumstances, indemnifications, payment of fees, advances for foreclosure costs that are not reimbursable, or responsibility for losses in excess of partial guarantees for VA loans.
Servicing agreements with the GSEs generally provide the GSEs with broader rights relative to the servicer than are found in servicing agreements with private investors. TheFor example, the GSEs claim that they have the contractual right to demand indemnification or loan repurchase for certain servicing breaches. In addition, the GSEs’ first-lien mortgage seller/servicer guides provide for timelines to resolve delinquent loans through workout efforts or liquidation, if necessary, and purport to require the imposition of compensatory fees if those deadlines are not satisfied except for reasons beyond the control of the servicer. In addition, many non-agency RMBS and whole-loan servicing agreements state that the servicer may be liable for failure to perform its servicing obligations in keeping with industry standards or for acts or omissions that involve willful malfeasance, bad faith or gross negligence in the performance of, or reckless disregard of, the servicer’s duties.
It is not possible to reasonably estimate our liability with respect to certain potential servicing-related claims. While we have recorded certain accruals for servicing-related claims, the amount of potential liability in excess of existing accruals could be material.
material to the Corporation’s results of operations or cash flows for any particular reporting period.2011 OCC Consent Order and 2013 IFR Acceleration Agreement
We entered into the 2011 Office of the Comptroller of the Currency (OCC) Consent Order on April 13, 2011. This consent order required servicers to make several enhancements to their servicing operations, including implementation of a single point of contact model for borrowers throughout the loss mitigation and foreclosure processes, adoption of measures designed to ensure that foreclosure activity is halted once a borrower has been approved for a modification unless the borrower fails to make payments under the modified loan and implementation of enhanced controls over third-party vendors that provide default servicing support services. In addition, the 2011 OCC Consent Order required that we retain an independent consultant, approved by the OCC, to conduct a review of all foreclosure actions pending or foreclosure sales that occurred between January 1, 2009 and December 31, 2010 and submit a plan to the OCC to remediate all financial injury to borrowers caused by any deficiencies identified through the review.
On January 7, 2013, we and other mortgage servicing institutions entered into an agreement in principle with the OCCOffice of the Comptroller of the Currency (OCC) and the Federal Reserve to cease the Independent Foreclosure Review (IFR) that had commenced pursuant to consent orders entered into by Bank of America with the Federal Reserve (2011 FRB Consent Order) and the 2011 OCC Consent Order entered into between BANA and the OCC and replaced it with an accelerated remediation process (2013 IFR Acceleration Agreement). The 2013 IFR Acceleration Agreement requires us to provide $1.8 billion of borrower assistance in the form of loan modifications and other foreclosure prevention actions, and in addition, we made a cash payment of $1.1 billion into a qualified settlement fund in 2013, which was fully reserved at December 31, 2012.2013. The borrower assistance program is not expected to result in any incremental credit provision, as we believe that the existing allowance for credit losses is adequate to absorb any costs that have not already been recorded as charge-offs.
National Mortgage SettlementFinancial Reform Act
In March 2012,The Financial Reform Act enacted sweeping financial regulatory reform across the financial services industry, including significant changes regarding capital adequacy and capital planning, stress testing, resolution planning, derivatives activities, prohibitions on proprietary trading and restrictions on debit interchange fees. As a result of the Financial Reform Act, we entered into settlement agreements (collectively,have altered and will continue to alter the National Mortgage Settlement)way in which we conduct certain businesses. Our costs and revenues could continue to be negatively impacted as additional final rules of the Financial Reform Act are adopted.
Resolution Planning
As a BHC with (1)greater than $50 billion of assets, the Corporation is required by the Federal Reserve and the FDIC to annually submit a plan for a rapid and orderly resolution in the event of material financial distress or failure.
A resolution plan is intended to be a detailed roadmap for the orderly resolution of a BHC and material entities pursuant to the U.S. DepartmentBankruptcy Code and other applicable resolution regimes under one or more hypothetical scenarios assuming no extraordinary government assistance.
If both the Federal Reserve and the FDIC determine that our plan is not credible and the deficiencies are not cured in a timely manner, the Federal Reserve and the FDIC may jointly impose on us more stringent capital, leverage or liquidity requirements or restrictions on our growth, activities or operations. A description of Justice, various federal regulatory agenciesour plan is available on the Federal Reserve and 49 state Attorneys GeneralFDIC websites.
Similarly, in the U.K., the PRA has issued rules requiring the submission of significant information about certain U.K.-incorporated subsidiaries and other financial institutions, as well as branches of non-U.K. banks located in the U.K. (including information on intra-group dependencies, legal entity separation and barriers to resolve federalresolution) to allow the PRA to develop resolution plans. As a result of the PRA review, we could be required to take certain actions over the next several years which could impose operating costs and state investigations intopotentially result in the restructuring of certain residential mortgage origination, servicingbusiness and foreclosure practices, (2) HUDsubsidiaries.
The Volcker Rule
The Volcker Rule prohibits insured depository institutions and companies affiliated with insured depository institutions (collectively, banking entities) from engaging in short-term proprietary trading of certain securities, derivatives, commodity futures and options for their own account. The Volcker Rule also imposes limits on banking entities’ investments in, and other relationships with, hedge funds and private equity funds, although the Federal Reserve extended the conformance period for certain existing covered investments and relationships to resolveJuly 2016 (with indications that the conformance period may be further extended to July 2017). The Volcker Rule provides exemptions for certain claims relatingactivities, including market-making, underwriting, hedging, trading in government obligations, insurance company activities, and organizing and offering hedge funds and private equity funds. The Volcker Rule also clarifies that certain activities are not prohibited, including acting as agent, broker or custodian. A banking entity with significant trading operations, such as the Corporation, is required to establish a detailed compliance program to comply with the restrictions of the Volcker Rule. We exited our stand-alone proprietary trading business in 2011 and continue to wind down our Global Principal Investments operations.
Derivatives
Our derivatives operations are subject to extensive regulation both in the U.S. and internationally. In the U.S., the Financial Reform Act broadens the scope of derivative instruments subject to regulation by requiring clearing and exchange trading of certain derivatives; imposing new capital, margin, reporting, registration and business conduct requirements for certain market participants; and imposing position limits on certain over-the-counter (OTC) derivatives. Additionally, in Europe, the European Commission and European Securities and Markets Authority (ESMA) have been granted authority to adopt and implement the European Market Infrastructure Regulation (EMIR), which regulates OTC derivatives, central counterparties and the trade repositories, and imposes requirements for certain market participants with respect to derivatives reporting, OTC derivatives clearing, business conduct and collateral. The adoption of many of these U.S. and European Union (EU) regulations is ongoing and their ultimate impact remains uncertain.
Capital, Liquidity and Operational Requirements
As a financial services holding company, we and our bank subsidiaries are subject to the origination of FHA-insured mortgage loans, primarily originatedrisk-based capital guidelines issued by Countrywide priorthe Federal Reserve and other U.S. banking regulators, including the FDIC and the OCC. These rules are complex and are evolving as U.S. and international regulatory authorities propose and enact enhanced capital and liquidity rules. The Corporation seeks to manage its capital position to maintain sufficient capital to meet these regulatory guidelines and for a period followingto support our acquisition of that lender,business activities. These evolving capital and (3) each ofliquidity rules are likely to influence our regulatory capital and liquidity planning processes, and require additional capital and liquidity, and may impose additional operational and compliance costs on the Corporation. In addition, the Federal Reserve and the OCC regarding civil monetary penalties related to conducthave adopted guidelines that was the subject of consent orders entered into with the banking regulators in April 2011. The National Mortgage Settlement was entered by the court as a consent judgment on April 5, 2012. The National Mortgage Settlement provided
establish minimum standards for the establishmentdesign, implementation and board oversight of certain uniform servicing standards, upfront cash payments of approximatelyBHC’s and national banks’ risk governance frameworks.
For more information on regulatory capital rules, capital composition and pending or proposed regulatory capital changes, see Capital Management – Regulatory Capital in the MD&A on page 59, and $1.9 billionNote 16 – Regulatory Requirements and Restrictions to the Consolidated Financial Statements, which are incorporated by reference in this Item 1.
Distributions
We are subject to various regulatory policies and requirements relating to capital actions, including payment of dividends and common stock repurchases. Many of our subsidiaries, including our bank and broker-dealer subsidiaries, are subject to laws that restrict dividend payments, or authorize regulatory bodies to block or reduce the flow of funds from those subsidiaries to the parent company or other subsidiaries. Additionally, the applicable federal regulatory authority is authorized to determine, under certain circumstances relating to the financial condition of a bank or BHC, that the payment of dividends would be an unsafe or unsound practice and to prohibit payment thereof. For instance, Federal Reserve regulations require major U.S. BHCs to submit a capital plan as part of an annual Comprehensive Capital Analysis and Review (CCAR). The purpose of the CCAR is to assess the capital planning process of the BHC, including any planned capital actions, such as payment of dividends on common stock and common stock repurchases.
Our ability to pay dividends is also affected by the various minimum capital requirements and the capital and non-capital standards established under the Federal Deposit Insurance Corporation Improvement Act of 1991 (FDICIA). The right of the Corporation, our stockholders and our creditors to participate in any distribution of the assets or earnings of our subsidiaries is further subject to the prior claims of creditors of the respective subsidiaries.
For more information regarding the requirements relating to the payment of dividends, including the minimum capital requirements, see Note 13 – Shareholders’ Equity and Note 16 – Regulatory Requirements and Restrictionsto the Consolidated Financial Statements.
Insolvency and the Orderly Liquidation Authority
Under the Federal Deposit Insurance Act, the FDIC may be appointed receiver of an insured depository institution if it is insolvent or in certain other circumstances. In addition, under the Financial Reform Act, when a systemically important financial institution such as the Corporation is in default or danger of default, the FDIC may be appointed receiver in order to conduct an orderly liquidation of such institution. In the event of such appointment, the FDIC could invoke the orderly liquidation authority, instead of the U.S. Bankruptcy Code, if the Secretary of the Treasury makes certain financial distress and systemic risk determinations. The orderly liquidation authority is modeled in part on the Federal Deposit Insurance Act, but also adopts certain concepts from the U.S. Bankruptcy Code.
In 2013, the FDIC issued a notice describing its preferred “single point of entry” strategy for resolving systemically important financial institutions. Under this approach, the FDIC could replace a distressed BHC with a bridge holding company, which could continue operations and result in an orderly resolution of the underlying bank, but whose equity is held solely for the benefit of creditors of the original BHC. Furthermore, the Federal Reserve Board has indicated that it will be proposing regulations regarding the minimum levels of long-term debt required for BHCs to ensure there is adequate loss absorbing capacity in the event of a resolution. The orderly liquidation authority contains certain differences from the U.S. Bankruptcy Code. For example, in certain circumstances, the FDIC could permit payment of obligations it determines to be systemically significant (e.g., short-term creditors or operating creditors) in lieu of paying other obligations (e.g., long-term creditors) without the need to obtain creditors’ consent or prior court review. The insolvency and resolution process could also lead to a large reduction or total elimination of the value of a BHC’s outstanding equity, as well as impairment or elimination of certain debt.
Deposit Insurance
Deposits placed at U.S. domiciled banks (U.S. banks) are insured by the FDIC, subject to limits and conditions of applicable law and the FDIC’s regulations. Pursuant to the Financial Reform Act, FDIC insurance coverage limits were permanently increased to $250,000 per customer. All insured depository institutions are required to pay assessments to the FDIC in order to fund the Deposit Insurance Fund (DIF).
The FDIC is required to maintain at least a designated minimum ratio of the DIF to insured deposits in the U.S. The Financial Reform Act requires the FDIC to assess insured depository institutions to achieve a DIF ratio of at least 1.35 percent by September 30, 2020. The FDIC has adopted new regulations that establish a long-term target DIF ratio of greater than two percent. The DIF ratio is currently below the required targets and the FDIC has adopted a restoration plan that may result in increased deposit insurance assessments. Deposit insurance assessment rates are subject to change by the FDIC and will be impacted by the overall economy and the stability of the banking industry as a whole. For more information regarding deposit insurance, see Item 1A. Risk Factors – Regulatory, Compliance and Legal Risk on page 12.
Source of Strength
According to the Financial Reform Act and Federal Reserve policy, BHCs are expected to act as a source of financial strength to each subsidiary bank and to commit resources to support each such subsidiary. Similarly, under the cross-guarantee provisions of FDICIA, in the event of a loss suffered or anticipated by the FDIC, either as a result of default of a banking subsidiary or related to
FDIC assistance provided to such a subsidiary in danger of default, the affiliate banks of such a subsidiary may be assessed for the FDIC’s loss, subject to certain exceptions.
Consumer Regulations
Our consumer businesses are subject to extensive regulation and oversight by federal and state regulators. Certain federal consumer finance laws to which we are subject, including, but not limited to, the Equal Credit Opportunity Act, the Home Mortgage Disclosure Act, the Electronic Fund Transfer Act, the Fair Credit Reporting Act, the Real Estate Settlement Procedures Act (RESPA), the Truth in Lending Act (TILA) and Truth in Savings Act, are enforced by the CFPB. Other federal consumer finance laws, such as the Servicemembers Civil Relief Act, are enforced by the Officer of the Comptroller of the Currency.
Transactions with Affiliates
Pursuant to Section 23A and 23B of the Federal Reserve Act, as implemented by the Federal Reserve’s Regulation W, the Banks are subject to restrictions that limit certain types of transactions between the Banks and their nonbank affiliates. In general, U.S. banks are subject to quantitative and qualitative limits on extensions of credit, purchases of assets and certain other transactions involving its nonbank affiliates. Additionally, transactions between U.S. banks and their nonbank affiliates are required to be on arm’s length terms and must be consistent with standards of safety and soundness.
Privacy and Information Security
We are subject to many U.S. federal, state and international laws and regulations governing requirements for maintaining policies and procedures to protect the non-public confidential information of our customers. The Gramm-Leach-Bliley Act requires the Banks to periodically disclose Bank of America’s privacy policies and practices relating to sharing such information and enables retail customers to opt out of our ability to share information with unaffiliated third parties under certain circumstances. Other laws and regulations, at both the federal and state level, impact our ability to share certain information with affiliates and non-affiliates for marketing and/or non-marketing purposes, or to contact customers with marketing offers. The Gramm-Leach-Bliley Act also requires the Banks to implement a comprehensive information security program that includes administrative, technical, and physical safeguards to ensure the security and confidentiality of customer records and information. These security and privacy policies and procedures for the protection of personal and confidential information are in effect across all businesses and geographic locations.
Item 1A. Risk Factors
In the course of conducting our business operations, we are exposed to a variety of risks, some of which are inherent in the financial services industry and others of which are more specific to our own businesses. The discussion below addresses the most significant factors, of which we are currently aware, that could affect our businesses, results of operations and financial condition. Additional factors that could affect our businesses, results of operations and financial condition are discussed in Forward-looking Statements in the MD&A on page 22. However, other factors not discussed below or elsewhere in this Annual Report on Form 10-K could also adversely affect our businesses, results of operations and financial condition. Therefore, the risk factors below should not be considered a complete list of potential risks that we may face.
Any risk factor described in this Annual Report on Form 10-K or in any of our other Securities and Exchange Commission (SEC) filings could by itself, or together with other factors, materially adversely affect our liquidity, cash flows, competitive position, business, reputation, results of operations, capital position or financial condition, including by materially increasing our expenses or decreasing our revenues, which could result in material losses.
General Economic and Market Conditions Risk
Our businesses and results of operations may be adversely affected by the U.S. and international financial markets, U.S. and non-U.S. fiscal and monetary policy, and economic conditions generally.
Our businesses and results of operations are affected by the financial markets and general economic conditions in the U.S. and abroad, including factors such as the level and volatility of short-term and long-term interest rates, inflation, home prices, unemployment and under-employment levels, bankruptcies, household income, consumer spending, fluctuations in both debt and equity capital markets and currencies, liquidity of the global financial markets, the availability and cost of capital and credit, investor sentiment and confidence in the financial markets, the sustainability of economic growth in the U.S., Europe, China and Japan, and economic, market, political and social conditions in several larger emerging market countries. The deterioration of any of these conditions could adversely affect our consumer and commercial businesses, our securities and derivatives portfolios, our level of charge-offs and provision for credit losses, the carrying value of our deferred tax assets, our capital levels and liquidity, and our results of operations.
Despite improving labor markets in the past year and recent sharp declines in energy costs, an elevated level of under-employment and household debt, the prolonged low interest rate environment and a strengthening U.S. Dollar, along with a continued sluggish recovery in the consumer real estate market and certain commercial real estate markets in the U.S., pose challenges for domestic economic performance and the financial services industry. The elevated level of under-employment and modest wage growth have directly impaired consumer finances and pose risks to the financial services industry.
Continued uncertainty in a number of housing markets and still elevated levels of distressed and delinquent mortgages remain risks to the housing market. The current environment of heightened scrutiny of financial institutions has resulted in increased public awareness of and sensitivity to banking fees and practices. Mortgage and housing market-related risks may be accentuated by attempts to forestall foreclosure proceedings, as well as state
and federal investigations into foreclosure practices by mortgage servicers. Each of these factors may adversely affect our fees and costs.
The recent sharp drop in oil prices, while likely a net positive for the U.S. economy, may also add distress to select regional markets that are energy industry-dependent and may negatively impact certain commercial and consumer loan portfolios.
Our businesses and results of operations are also affected by domestic and international fiscal and monetary policy. The actions of the Federal Reserve in the U.S. and central banks internationally regulate the supply of money and credit in the global financial system. Their policies affect our cost of funds for lending, investing and capital raising activities and the return we earn on those loans and investments, both of which affect our net interest margin. The actions of the Federal Reserve in the U.S. and central banks internationally also can affect the value of financial instruments and other assets, such as debt securities and mortgage servicing rights (MSRs), and its policies also can affect our borrowers, potentially increasing the risk that they may fail to repay their loans. Our businesses and earnings are also affected by the fiscal or other policies that are adopted by the U.S. government, various U.S. regulatory authorities, and non-U.S. governments and for borrower restitution, approximatelyregulatory authorities. Changes in domestic and international fiscal and monetary policies are beyond our control and difficult to predict but could have an adverse impact on our capital requirements and the costs of running our business.
For more information about economic conditions and challenges discussed above, see $7.6 billionExecutive Summary – 2014 Economic and Business Environment in borrower assistance in the form of, among other things, credits earned for principal reduction, short sales, deeds-in-lieu of foreclosureMD&A on page 23.
Liquidity Risk
Liquidity Risk is the Potential Inability to Meet Our Contractual and approximately $1.0 billion of credits earned for interest rate reduction modifications.Contingent Financial Obligations, On- or Off-balance Sheet, as they Become Due.
Adverse changes to our credit ratings from the major credit rating agencies could significantly limit our access to funding or the capital markets, increase our borrowing costs, or trigger additional collateral or funding requirements.
Our borrowing costs and ability to raise funds are directly impacted by our credit ratings. In addition, credit ratings may be important to customers or counterparties when we compete in certain markets and when we seek to engage in certain transactions, including OTC derivatives. Credit ratings and outlooks are opinions expressed by rating agencies on our creditworthiness and that of our obligations or securities, including long-term debt, short-term borrowings, preferred stock and other securities, including asset securitizations. Our credit ratings are subject to ongoing review by the settlement with HUD providedrating agencies, which consider a number of factors, including our own financial strength, performance, prospects and operations as well as factors not under our control.
Currently, the Corporation’s long-term/short-term senior debt ratings and outlooks expressed by the rating agencies are as follows: Baa2/P-2 (Stable) by Moody’s Investors Service, Inc. (Moody’s); A-/A-2 (Negative) by Standard & Poor’s Ratings Services (S&P); and A/F1 (Negative) by Fitch Ratings (Fitch). The rating agencies could make adjustments to our credit ratings at any time, including as a result of a determination to no longer incorporate an uplift for an upfront cash payment of $500 million to settle certain claims related to FHA-insured loans. WeU.S. government support. There can be no assurance that downgrades will also benot occur.
|
| | |
| | | Bank of America 20132014 576 |
obligatedA reduction in certain of our credit ratings could negatively affect our liquidity, access to credit markets, the related cost of funds, our businesses and certain trading revenues, particularly in those businesses where counterparty creditworthiness is critical. If the short-term credit ratings of our parent company, bank or broker-dealer subsidiaries were downgraded by one or more levels, we may suffer the potential loss of access to short-term funding sources such as repo financing, and/or increased cost of funds.
In addition, under the terms of certain OTC derivative contracts and other trading agreements, in the event of a downgrade of our credit ratings or certain subsidiaries’ credit ratings, counterparties to those agreements may require us or certain subsidiaries to provide additional cash paymentscollateral, terminate these contracts or agreements, or provide other remedies. At December 31, 2014, if the rating agencies had downgraded their long-term senior debt ratings for us or certain subsidiaries by one incremental notch, the amount of upadditional collateral contractually required by derivative contracts and other trading agreements would have been approximately $1.4 billion, including $1.1 billion for Bank of America, N.A. (BANA). If the rating agencies had downgraded their long-term senior debt ratings for these entities by an additional incremental notch, approximately $2.8 billion in additional incremental collateral, including $1.9 billion for BANA would have been required.
Also, if the rating agencies had downgraded their long-term senior debt ratings for us or certain subsidiaries by one incremental notch, the derivative liability that would be subject to unilateral termination by counterparties as of December 31, 2014 was $1.8 billion against which $1.5 billion of collateral has been posted. If the rating agencies had downgraded their long-term senior debt ratings for us and certain subsidiaries by a second incremental notch, the derivative liability that would be subject to unilateral termination by counterparties as of December 31, 2014 was an incremental $3.9 billion, against which $3.0 billion of collateral has been posted.
While certain potential impacts are contractual and quantifiable, the full consequences of a credit ratings downgrade to a financial institution are inherently uncertain, as they depend upon numerous dynamic, complex and inter-related factors and assumptions, including whether any downgrade of a firm’s long-term credit ratings precipitates downgrades to its short-term credit ratings, and assumptions about the potential behaviors of various customers, investors and counterparties.
For more information about our credit ratings and their potential effects to our liquidity, see $850 millionLiquidity Risk – Credit Ratings ifin the MD&A on page 68 and Note 2 – Derivativesto the Consolidated Financial Statements.
If we are unable to access the capital markets, continue to maintain deposits, or our borrowing costs increase, our liquidity and competitive position will be negatively affected.
Liquidity is essential to our businesses. We fund our assets primarily with globally sourced deposits in our bank entities, as well as secured and unsecured liabilities transacted in the capital markets. We rely on certain secured funding sources, such as repo markets, which are typically short-term and credit-sensitive in
nature. We also engage in asset securitization transactions, including with the government-sponsored enterprises (GSEs), to fund consumer lending activities. Our liquidity could be adversely affected by any inability to access the capital markets; illiquidity or volatility in the capital markets; unforeseen outflows of cash, including customer deposits, funding for commitments and contingencies; increased liquidity requirements on our banking and nonbank subsidiaries imposed by their home countries; or negative perceptions about our short- or long-term business prospects, including downgrades of our credit ratings. Several of these factors may arise due to circumstances beyond our control, such as a general market disruption, negative views about the financial services industry generally, changes in the regulatory environment, actions by credit rating agencies or an operational problem that affects third parties or us.
Our cost of obtaining funding is directly related to prevailing market interest rates and to our credit spreads. Credit spreads are the amount in excess of the interest rate of U.S. Treasury securities, or other benchmark securities, of a similar maturity that we need to pay to our funding providers. Increases in interest rates and our credit spreads can increase the cost of our funding. Changes in our credit spreads are market-driven and may be influenced by market perceptions of our creditworthiness. Changes to interest rates and our credit spreads occur continuously and may be unpredictable and highly volatile.
For more information about our liquidity position and other liquidity matters, including credit ratings and outlooks and the policies and procedures we use to manage our liquidity risks, see Liquidity Risk in the MD&A on page 65.
Bank of America Corporation is a holding company and we depend upon our subsidiaries for liquidity, including our ability to pay dividends to shareholders. Applicable laws and regulations, including capital and liquidity requirements, may restrict our ability to transfer funds from our subsidiaries to Bank of America Corporation or other subsidiaries.
Bank of America Corporation, as the parent company, is a separate and distinct legal entity from our banking and nonbank subsidiaries. We evaluate and manage liquidity on a legal entity basis. Legal entity liquidity is an important consideration as there are legal and other limitations on our ability to utilize liquidity from one legal entity to satisfy the liquidity requirements of another, including the parent company. For instance, the parent company depends on dividends, distributions and other payments from our banking and nonbank subsidiaries to fund dividend payments on our common stock and preferred stock and to fund all payments on our other obligations, including debt obligations. Many of our subsidiaries, including our bank and broker-dealer subsidiaries, are subject to laws that restrict dividend payments, or authorize regulatory bodies to block or reduce the flow of funds from those subsidiaries to the parent company or other subsidiaries. In addition, our bank and broker-dealer subsidiaries are subject to restrictions on their ability to lend or transact with affiliates and to minimum regulatory capital and liquidity requirements, as well as restrictions on their ability to use funds deposited with them in bank or brokerage accounts to fund their businesses.
Additional restrictions on related party transactions, increased capital and liquidity requirements and additional limitations on the use of funds on deposit in bank or brokerage accounts, as well as lower earnings, can reduce the amount of funds available to meet the obligations of the parent company and even require the parent company to provide additional funding to such subsidiaries. Also, additional liquidity may be required at each subsidiary entity. Regulatory action of that kind could impede access to funds we need to make payments on our obligations or dividend payments. In addition, our right to participate in a distribution of assets upon a subsidiary’s liquidation or reorganization is subject to the prior claims of the subsidiary’s creditors. For more information regarding our ability to pay dividends, see Capital Management in the MD&A on page 59 and Note 13 – Shareholders’ Equity to the Consolidated Financial Statements.
Credit Risk
Credit Risk is the Risk of Loss Arising from the Inability or Failure of a Borrower or Counterparty to Meet its Obligations.
Economic or market disruptions, insufficient credit loss reserves or concentration of credit risk may result in an increase in the provision for credit losses, which could have an adverse effect on our financial condition and results of operations.
A number of our products expose us to credit risk, including loans, letters of credit, derivatives, trading account assets and assets held-for-sale. The financial condition of our consumer and commercial borrowers and counterparties could adversely affect our earnings.
Global and U.S. economic conditions may impact our credit portfolios. To the extent economic or market disruptions occur, such disruptions would likely increase the risk that borrowers or counterparties would default or become delinquent on their obligations to us. Increases in delinquencies and default rates could adversely affect our consumer credit card, home equity, residential mortgage and purchased credit-impaired (PCI) portfolios through increased charge-offs and provision for credit losses. Additionally, increased credit risk could also adversely affect our commercial loan portfolios with weakened customer and collateral positions.
We estimate and establish an allowance for credit losses for losses inherent in our lending activities (including unfunded lending commitments), excluding those measured at fair value, through a charge to earnings. The amount of allowance is determined based on our evaluation of the potential credit losses included within our loan portfolios. The process for determining the amount of the allowance requires difficult and complex judgments, including forecasts of economic conditions and how borrowers will react to those conditions. The ability of our borrowers or counterparties to repay their obligations will likely be impacted by changes in economic conditions, which in turn could impact the accuracy of our forecasts. There is also the chance that we will fail to earn an additional $850 million of credits stemming from incremental first-lien principal reductions and satisfy certain solicitation requirements over a three-year period.accurately identify the appropriate economic indicators or that we will fail to accurately estimate their impacts.
We also entered into agreements with several states under whichmay suffer unexpected losses if the models and assumptions we committeduse to perform certain minimum levelsestablish reserves and make judgments in extending credit to our borrowers or counterparties become less predictive of principal reduction and related activities within those states in connection with the National Mortgage Settlement, and under which we could be required to make additional payments if we fail to meet such minimum levels.
Subject to confirmation by the independent monitor appointed as a result of the National Mortgage Settlement to review and certify compliance with its provisions,future events. Although we believe we have substantially fulfilled all borrower assistance, rate reduction modification and principal reduction commitments and, therefore, we do not expect to be required to make additional cash payments. The monitor has validated that through December 31, 2012, we have earned nearly $7.8 billion in credits towards our total obligation and we are awaiting confirmation on the remaining credits. The borrower assistance program did not result in any incremental credit losses as of the settlement date, as the existing allowance for credit losses was adequate to absorb any losses that had not already been charged-off. Under the interest rate reduction program, modifications of approximately 24,000 loansin compliance with an aggregate unpaid principal balance of $6.4 billion have been completed as of applicable accounting standards at December 31, 2013. These modifications,2014, there is no guarantee that it
will be sufficient to address future credit losses, particularly if economic conditions deteriorate. In such an event, we may increase the size of our allowance, which arereduces our earnings.
In the ordinary course of our business, we also may be subject to a concentration of credit risk in a particular industry, country, counterparty, borrower or issuer. A deterioration in the financial condition or prospects of a particular industry or a failure or downgrade of, or default by, any particular entity or group of entities could negatively affect our businesses and the processes by which we set limits and monitor the level of our credit exposure to individual entities, industries and countries may not accounted forfunction as troubled debt restructurings (TDRs), provided for an average interest rate reductionwe have anticipated. While our activities expose us to many different industries and counterparties, we routinely execute a high volume of approximately two percent, resultingtransactions with counterparties in an estimated decreasethe financial services industry, including brokers-dealers, commercial banks, investment banks, insurers, mutual and hedge funds, and other institutional clients. This has resulted in fair value of the modified loans of approximately $740 million and a reduction in annual interest income of approximately $120 million.
Under the terms of the National Mortgage Settlement, the federal and participating state governments agreed to release us from further liability for certain alleged residential mortgage origination, servicing and foreclosure deficiencies. In settling origination issues related to FHA-guaranteed loans originated on or before April 30, 2009, we received a release from further liability for all origination claimssignificant credit concentration with respect to such loans if an insurance claim had been submitted this industry. Financial services institutions and other counterparties are inter-related because of trading, funding, clearing or other relationships. As a result, defaults by, or even rumors or questions about the financial stability of one or more financial services institutions, or the financial services industry generally, could lead to market-wide liquidity disruptions, losses and defaults. Many of these transactions expose us to credit risk in the event of default of a counterparty. In addition, our credit risk may be heightened by market risk when the collateral held by us cannot be realized or is liquidated at prices not sufficient to recover the full amount of the loan or derivatives exposure due to us.
In the ordinary course of business, we also enter into transactions with sovereign nations, U.S. states and U.S. municipalities. Unfavorable economic or political conditions, disruptions to capital markets, currency fluctuations, changes in energy prices, social instability and changes in government policies could impact the operating budgets or credit ratings of sovereign nations, U.S. states and U.S. municipalities and expose us to credit risk.
We also have a concentration of credit risk with respect to our consumer real estate, consumer credit card and commercial real estate portfolios, which represent a large percentage of our overall credit portfolio. Economic downturns have adversely affected these portfolios. Continued economic weakness or deterioration in real estate values or household incomes could result in higher credit losses.
For more information about our credit risk and credit risk management policies and procedures, see Credit Risk Management in the MD&A on page 70 and Note 1 – Summary of Significant Accounting Principlesto the FHA priorConsolidated Financial Statements.
Our derivatives businesses may expose us to January 1, 2012unexpected risks and potential losses.
We are party to a releaselarge number of multiple damagesderivatives transactions, including credit derivatives. Our derivatives businesses may expose us to unexpected market, credit and penalties, butoperational risks that could cause us to suffer unexpected losses. Severe declines in asset values, unanticipated credit events or unforeseen circumstances that may cause previously uncorrelated factors to become correlated (and vice versa) may create losses resulting from risks not administrative indemnification claimsappropriately taken into account in the development, structuring or pricing of a derivative instrument. The terms of certain of our OTC derivative contracts and other trading agreements provide that upon the occurrence of certain specified events, such as a change in our credit ratings, we may be required
to provide additional collateral or to provide other remedies, or our counterparties may have the right to terminate or otherwise diminish our rights under these contracts or agreements.
Many derivative instruments are individually negotiated and non-standardized, which can make exiting, transferring or settling some positions difficult. Many derivatives require that we deliver to the counterparty the underlying security, loan or other obligation in order to receive payment. In a number of cases, we do not hold, and may not be able to obtain, the underlying security, loan or other obligation.
In the event of a downgrade of the Corporation’s credit ratings, certain derivative and other counterparties may request we substitute BANA (which has generally had equal or higher credit ratings than the Corporation’s) as counterparty for single damages, if nocertain derivative contracts and other trading agreements. The Corporation’s ability to substitute or make changes to these agreements to meet counterparties’ requests may be subject to certain limitations, including counterparty willingness, regulatory limitations on naming BANA as the new counterparty and the type or amount of collateral required. It is possible that such claim had been submitted.limitations on our ability to substitute or make changes to these agreements, including naming BANA as the new counterparty, could adversely affect our results of operations.
Derivatives contracts, including new and more complex derivatives products, and other transactions entered into with third parties are not always confirmed by the counterparties or settled on a timely basis. While a transaction remains unconfirmed, or during any delay in settlement, we are subject to heightened credit, market and operational risk and, in the event of default, may find it more difficult to enforce the contract. In addition, provideddisputes may arise with counterparties, including government entities, about the terms, enforceability and/or suitability of the underlying contracts. These factors could negatively impact our ability to effectively manage our risk exposures from these products and subject us to increased credit and operating costs and reputational risk. For more information on our derivatives exposure, see Note 2 – Derivativesto the Consolidated Financial Statements.
Market Risk
Market Risk is the Risk that Market Conditions May Adversely Impact the Value of Assets or Liabilities or Otherwise Negatively Impact Earnings. Market Risk is Inherent in the Financial Instruments Associated with our Operations, Including Loans, Deposits, Securities, Short-term Borrowings, Long-term Debt, Trading Account Assets and Liabilities, and Derivatives.
Increased market volatility and adverse changes in other financial or capital market conditions may increase our market risk.
Our liquidity, cash flows, competitive position, business, results of operations and financial condition are affected by market risk factors such as changes in interest and currency exchange rates, equity and futures prices, the implied volatility of interest rates, credit spreads and other economic and business factors. These market risks may adversely affect, among other things, (i) the value of our on- and off-balance sheet securities, trading assets, other financial instruments, and MSRs, (ii) the cost of debt capital and our access to credit markets, (iii) the value of assets under management (AUM), (iv) fee income relating to AUM, (v) customer
allocation of capital among investment alternatives, (vi) the volume of client activity in our trading operations, (vii) investment banking fees, and (viii) the general profitability and risk level of the transactions in which we meetengage. For example, the value of certain of our assistanceassets is sensitive to changes in market interest rates. If the Federal Reserve, or central banks internationally, change or signal a change in monetary policy, market interest rates could be affected, which could adversely impact the value of such assets. In addition, the existence of a prolonged low interest rate environment could negatively impact our cash flows, financial condition or results of operations, including future revenue and remediation commitments, the OCC agreed notearnings growth.
We use various models and strategies to assess and we willcontrol our market risk exposures but those are subject to inherent limitations. Our models, which rely on historical trends and assumptions, may not be obligatedsufficiently predictive of future results due to paylimited historical patterns, extreme or unanticipated market movements and illiquidity, especially during severe market downturns or stress events. The models that we use to assess and control our market risk exposures also reflect assumptions about the Federal Reserve, any civil monetary penalties.
The National Mortgage Settlement does not cover certain claims arising outdegree of origination, securitization (including representations made to investors with respect to MBS), criminal claims, private claims by borrowers, claims by certain states for injunctive relief or actual economic damages to borrowers related to the Mortgage Electronic Registration Systems, Inc. (MERS), and claims by the GSEs (including repurchase demands),correlation among other items.
Mortgage Electronic Registration Systems, Inc.
Mortgage notes, assignmentsprices of various asset classes or other documents are often requiredmarket indicators. In addition, market conditions in recent years have involved unprecedented dislocations and highlight the limitations inherent in using historical data to be maintainedmanage risk.
In times of market stress or other unforeseen circumstances, such as the market conditions experienced in 2008 and are often necessary2009, previously uncorrelated indicators may become correlated, or previously correlated indicators may move in different directions. These types of market movements have at times limited the effectiveness of our hedging strategies and have caused us to enforce mortgage loans. There has beenincur significant public commentary regarding the common industry practice of recording mortgageslosses, and they may do so in the name of MERS, as nominee on behalf of the note holder, and whether securitization trusts own the loans purported to be conveyed to them and have valid liens securing those loans. We
currently use the MERS system for a substantial portion of the residential mortgage loans that we originate, including loans that have been sold to investors or securitization trusts. A component of the OCC consent order requires significantfuture. These changes in the manner in which we service loanscorrelation can be exacerbated where other market participants are using risk or trading models with assumptions or algorithms that identify MERS as the mortgagee. Additionally, certain localare similar to ours. In these and state governments have commenced legal actions against us, MERS and other MERS members, questioning the validity of the MERS model. Other challenges have also been made to the process for transferring mortgage loans to securitization trusts, asserting that having a mortgagee of record that is different than the holder of the mortgage note could “break the chain of title” and cloud the ownership of the loan. In order to foreclose on a mortgage loan, in certain cases, it may be necessary or prudent for an assignment of the mortgagedifficult to be madereduce our risk positions due to the holderactivity of other market participants or widespread market dislocations, including circumstances where asset values are declining significantly or no market exists for certain assets. To the note, whichextent that we own securities that do not have an established liquid trading market or are otherwise subject to restrictions on sale or hedging, we may not be able to reduce our positions and therefore reduce our risk associated with such positions. In addition, challenging market conditions may also adversely affect our investment banking fees.
For more information about market risk and our market risk management policies and procedures, see Market Risk Management in the case of a mortgage heldMD&A on page 99.
A downgrade in the name of MERS as nominee would need to be completed by a MERS signing officer. As such, our practice is to obtain assignments of mortgages from MERS prior to instituting foreclosure. If certain required documents are missing or defective, or if the use of MERS is found not to be valid, we could be obligated to cure certain defectsU.S. government’s sovereign credit rating, or in some circumstances be subject to additional costs and expenses. Our usethe credit ratings of MERS as nominee for the mortgage may also create reputational risks for us.
Impact of Foreclosure Delays
Foreclosure delays impact our default-related servicing costs. We believe default-related servicing costs peaked in mid-2013 and they began to decline in late 2013, and we anticipate that this decline will accelerate in 2014. However, unexpected foreclosure delaysinstruments issued, insured or guaranteed by related institutions, agencies or instrumentalities, could impact the rate of decline. Default-related servicing costs include costs related to resources needed for implementing new servicing standards mandated for the industry, including as part of the National Mortgage Settlement, other operational changes and operational costs due to delayed foreclosures, and do not include mortgage-related assessments, waivers and similar costs related to foreclosure delays.
Other areas of our operations are also impacted by foreclosure delays. In 2013, we recorded $514 million of mortgage-related assessments, waivers and similar costs related to foreclosure delays compared to $867 million, including $258 million related to compensatory fees as part of the FNMA Settlement for 2012. It is also possible that the delays in foreclosure sales may result in additional costsrisks to the Corporation and expenses, including costs associatedits credit ratings and general economic conditions that we are not able to predict.
On June 6, 2014, S&P affirmed its AA+ long-term and A-1+ short-term sovereign credit rating on the U.S. government with a stable outlook. On March 21, 2014, Fitch affirmed its AAA long-term and F1+ short-term sovereign credit rating on the maintenance of properties or possible home price declines while foreclosures are delayed. Finally,U.S. government with a stable outlook. This resolved the timerating watch negative that was placed on the ratings on October 15, 2013. On July 18, 2013, Moody’s revised its outlook on the U.S. government to complete foreclosure sales may continue to be protracted, which may result in a greater number of nonperforming loansstable from negative and increased servicing advances, and may impactaffirmed its Aaa long-term sovereign credit rating on the collectability of such advances and the value of our MSR asset, MBS and real estate owned properties. Accordingly, the ultimate resolution of disagreements with counterparties, delays in foreclosure sales beyond those currently anticipated, and any issues that may arise out of alleged irregularities in our foreclosure process could significantly increase the costs associated with our mortgage operations.
Other Mortgage-related Matters
We continue to be subject to additional borrower and non-borrower litigation and governmental and regulatory scrutiny related to our past and current origination, servicing, transfer of servicing andU.S. government.
|
| | |
589 Bank of America 20132014
| | |
The ratings and perceived creditworthiness of instruments issued, insured or guaranteed by institutions, agencies or instrumentalities directly linked to the U.S. government could also be correspondingly affected by any downgrade. Instruments of this nature are often held as trading, investment or excess liquidity positions on the balance sheets of financial institutions, including the Corporation, and are widely used as collateral by financial institutions to raise cash in the secured financing markets. A downgrade of the sovereign credit ratings of the U.S. government and perceived creditworthiness of U.S. government-related obligations could impact our ability to obtain funding that is collateralized by affected instruments, as well as affecting the pricing of that funding when it is available. A downgrade may also adversely affect the market value of such instruments.
We cannot predict if, when or how any changes to the credit ratings or perceived creditworthiness of these organizations will affect economic conditions. The credit rating agencies’ ratings for the Corporation or its subsidiaries could be directly or indirectly impacted by a downgrade of the U.S. government’s sovereign rating because credit ratings of large systemically important financial institutions issued by S&P and Fitch, including those of the Corporation or its subsidiaries, currently include a degree of uplift due to rating agencies’ assumptions concerning potential government support. In addition, the Corporation presently delivers a portion of the residential mortgage loans it originates into GSEs, agencies or instrumentalities (or instruments insured or guaranteed thereby). We cannot predict if, when or how any changes to the credit ratings of these organizations will affect their ability to finance residential mortgage loans.
A downgrade of the sovereign credit ratings of the U.S. government or the credit ratings of related institutions, agencies or instrumentalities would exacerbate the other risks to which the Corporation is subject and any related adverse effects on our business, financial condition and results of operations.
Our businesses may be affected by uncertainty about the financial stability and growth rates of non-U.S. jurisdictions, the risk that those jurisdictions may face difficulties servicing their sovereign debt, and related stresses on financial markets, currencies and trade.
Risks and ongoing concerns about the financial stability of several non-U.S. jurisdictions could impact our operations and have a detrimental impact on the global economic recovery. For instance, sovereign and non-sovereign debt levels remain elevated. Market and economic disruptions have affected, and may continue to affect, consumer confidence levels and spending, corporate investment and job creation, bankruptcy rates, levels of incurrence and default on consumer debt and corporate debt, economic growth rates and asset values, among other factors.
A number of non-U.S. jurisdictions in which we do business have been negatively impacted by slowing growth rates or recessionary conditions, market volatility and/or political unrest. Additionally, there can be no assurance that market stabilization in Europe, which has recently experienced a renewed slowdown and increased volatility, is sustainable, nor can there be any assurance that future assistance packages, if required, will be available or, even if provided, will be sufficient to stabilize the affected countries and markets in Europe or elsewhere. To the extent European economic recovery uncertainty continues to negatively impact consumer and business confidence and credit factors, or should the EU enter a deep recession, both the U.S. economy and our business and results of operations could be adversely affected.
Global economic and political uncertainty, regulatory initiatives and reform have impacted, and will likely continue to impact, non-U.S. credit and trading portfolios. There can be no assurance our risk mitigation efforts in this respect will be sufficient or successful.
For more information on our exposures in the top 20 non-U.S. countries, see Non-U.S. Portfolio in the MD&A on page 93.
We may incur losses if the values of certain assets decline, including due to changes in interest rates and prepayment speeds.
We have a large portfolio of financial instruments, including, among others, certain loans and loan commitments, loans held-for-sale, securities financing agreements, asset-backed secured financings, long-term deposits, long-term debt, trading account assets and liabilities, derivative assets and liabilities, available-for-sale (AFS) debt and equity securities, other debt securities, certain MSRs and certain other assets and liabilities that we measure at fair value. We determine the fair values of these instruments based on the fair value hierarchy under applicable accounting guidance. The fair values of these financial instruments include adjustments for market liquidity, credit quality, funding impact on certain derivatives and other transaction-specific factors, where appropriate.
Gains or losses on these instruments can have a direct impact on our results of operations, including higher or lower mortgage banking income and earnings, unless we have effectively hedged our exposures. For example, decreases in interest rates and increases in mortgage prepayment speeds, which are influenced by interest rates and other factors such as reductions in mortgage insurance premiums and origination costs, could adversely impact the value of our MSR asset, cause a significant acceleration of purchase premium amortization on our mortgage portfolio, because a decline in long-term interest rates shortens the expected lives of the securities, and adversely affect our net interest margin. Conversely, increases in interest rates may result in a decrease in residential mortgage loan originations. In addition, increases in interest rates may adversely impact the fair value of debt securities and, accordingly, for debt securities classified as AFS, may adversely affect accumulated other comprehensive income and, thus, capital levels.
Fair values may be impacted by declining values of the underlying assets or the prices at which observable market transactions occur and the continued availability of these transactions. The financial strength of counterparties, with whom we have economically hedged some of our exposure to these assets, also will affect the fair value of these assets. Sudden declines and volatility in the prices of assets may curtail or eliminate the trading activity for these assets, which may make it difficult to sell, hedge or value such assets. The inability to sell or effectively hedge assets reduces our ability to limit losses in such positions and the difficulty in valuing assets may increase our risk-weighted assets, which requires us to maintain additional capital and increases our funding costs.
Asset values also directly impact revenues in our asset management businesses. We receive asset-based management fees based on the value of our clients’ portfolios or investments in funds managed by us and, in some cases, we also receive performance fees based on increases in the value of such investments. Declines in asset values can reduce the value of our clients’ portfolios or fund assets, which in turn can result in lower fees earned for managing such assets.
servicing rights,For more information about fair value measurements, see Note 20 – Fair Value Measurementsto the Consolidated Financial Statements. For more information about our asset management businesses, see GWIM in the MD&A on page 42. For more information about interest rate risk management, see Interest Rate Risk Management for Non-trading Activities in the MD&A on page 105.
Changes in the method of determining the London Interbank Offered Rate (LIBOR) or other reference rates may adversely impact the value of debt securities and foreclosure activities, including those claims not coveredother financial instruments we hold or issue that are linked to LIBOR or other reference rates in ways that are difficult to predict and could adversely impact our financial condition or results of operations.
In recent years, concerns have been raised about the accuracy of the calculation of LIBOR. Aspects of the method for determining how LIBOR is formulated and its use in the market have changed and may continue to change. Effective February 1, 2014, the transfer of LIBOR administration to the ICE Benchmark Administration, Ltd. was completed following authorization by the National Mortgage Settlement. This scrutinyU.K. Financial Conduct Authority. On July 22, 2014, the Financial Stability Board published its report recommending reforms to the administration of major benchmarks, including LIBOR. Changes to LIBOR administration include, but are not limited to, the introduction of statutory regulation of LIBOR by U.K. regulatory authorities; reducing the currencies for which LIBOR is calculated to five; reducing the tenors for which LIBOR is calculated to seven; delay in the publication of individual banks’ LIBOR submissions for three months from submission; and requiring banks to provide LIBOR submissions based on an effective methodology on the basis of relevant criteria and information, including observable market transactions where possible. Each such change and any future changes could impact the availability and volatility of LIBOR. Similar changes have occurred or may extend beyond our pending foreclosure matters to issues arising out of alleged irregularitiesoccur with respect to previouslyother reference rates. Accordingly, it is not currently possible to determine whether, or to what extent, any such changes would impact the value of any debt securities we hold or issue that are linked to LIBOR or other reference rates, or any loans, derivatives and other financial obligations or extensions of credit we hold or are due to us, or for which we are an obligor, that are linked to LIBOR or other reference rates, or whether, or to what extent, such changes would impact our financial condition or results of operations.
Mortgage and Housing Market-Related Risk
Our mortgage loan repurchase obligations or claims from third parties could result in additional losses.
We and our legacy companies have sold significant amounts of residential mortgage loans. In connection with these sales, we or certain of our subsidiaries or legacy companies make or have made various representations and warranties, breaches of which may result in a requirement that we repurchase the mortgage loans, or otherwise make whole or provide other remedies to counterparties (collectively, repurchases). At December 31, 2014, we had approximately $22.4 billion of unresolved repurchase claims, net of duplicate claims. These repurchase claims relate primarily to private-label securitizations and include claims in the amount of $4.7 billion, net of duplicate claims, where we believe the statute of limitations has expired under current law. Private-label securitization unresolved repurchase claims have increased in recent periods, and such claims may continue to increase. In
addition to unresolved repurchase claims, we have received notifications pertaining to loans for which we have not received a repurchase request from sponsors of third-party securitizations with whom the Corporation engaged in whole-loan transactions and for which we may owe indemnity obligations. We also from time to time receive correspondence purporting to raise representations and warranties breach issues from entities that do not have contractual standing or ability to bring such claims. We believe such communications to be procedurally and/or substantially invalid, and generally do not respond to such correspondence. In addition to repurchase claims, we receive notices from mortgage insurance companies of claim denials, cancellations or coverage rescission (collectively, MI rescission notices). Although they declined during 2014, the number of open MI rescission notices remains elevated.
We have recorded a liability of $12.1 billion for obligations under representations and warranties exposures (which includes exposures related to MI rescission notices). We have also established an estimated range of possible loss of up to $4 billion over our recorded liability. The liability for representations and warranties exposures and the corresponding estimated range of possible loss do not consider losses related to servicing (except as such losses are included as potential costs of the BNY Mellon Settlement), including foreclosure and related costs, fraud, indemnity, or claims (including for residential mortgage-backed securities (RMBS)) related to securities law or monoline litigations. Losses with respect to one or more of these matters could be material to the Corporation’s results of operations or cash flows for any particular reporting period.
Our recorded liability and estimated range of possible loss for representations and warranties exposures are based on currently available information and are necessarily dependent on, and limited by, a number of factors, including our historical claims and settlement experiences as well as significant judgment and a number of assumptions that are subject to change. As a result, our liability and estimated range of possible loss related to our representations and warranties exposures may materially change in the future. Additionally, if final court approval of the settlement with the Bank of New York Mellon, as trustee (BNY Mellon Settlement) is not obtained, or if the Corporation and legacy Countrywide Financial Corporation determine to withdraw from the BNY Mellon Settlement agreement in accordance with its terms, the Corporation’s future representations and warranties losses could be substantially different from existing accruals and the existing estimated range of possible loss. If future representations and warranties losses occur in excess of our recorded liability and estimated range of possible loss, such losses could have an adverse effect on our cash flows, financial condition and results of operations.
For more information about our representations and warranties exposure, including the estimated range of possible loss, see Off-Balance Sheet Arrangements and Contractual Obligations – Representations and Warranties in the MD&A on page 50, Consumer Portfolio Credit Risk Management in the MD&A on page 70 and Note 7 – Representations and Warranties Obligations and Corporate Guarantees to the Consolidated Financial Statements.
For more information regarding the BNY Mellon Settlement, see Note 7 – Representations and Warranties Obligations and Corporate Guaranteesto the Consolidated Financial Statements.
Failure to satisfy our obligations as servicer for residential mortgage securitizations, along with other losses we could incur in our capacity as servicer, and continued foreclosure delays and/or investigations into our residential mortgage foreclosure practices could cause losses.
We and our legacy companies have securitized a significant portion of the residential mortgage loans that we originated or acquired. We service a large portion of the loans we have securitized and also service loans on behalf of third-party securitization vehicles and other investors. At December 31, 2014, we serviced approximately 5.3 million loans with an aggregate unpaid principal balance of $693 billion, including loans owned by us and by others. Of the 3.2 million loans serviced for others, approximately 67 percent are held in GSE securitization vehicles and 33 percent are held in non-GSE securitization vehicles or by other investors. If we commit a material breach of our obligations as servicer or master servicer, we may be subject to termination if the breach is not cured within a specified period of time following notice, which could cause us to lose servicing income. In addition, for loans held in non-GSE securitization vehicles, we may have liability for any failure by us, as a servicer or master servicer, for any act or omission on our part that involves willful misfeasance, bad faith, gross negligence or reckless disregard of our duties. If any such breach were found to have occurred, it may harm our reputation, increase our servicing costs or adversely impact our results of operations. Additionally, with respect to foreclosures, we may incur costs or losses due to irregularities in the underlying documentation, or if the validity of a foreclosure action is challenged by a borrower or overturned by a court because of errors or deficiencies in the foreclosure process. We may also incur costs or losses relating to delays or alleged deficiencies in processing documents necessary to comply with state law governing foreclosures.
We are subject to certain legal and contractual requirements for how we hold, transfer, use or enforce promissory notes, security instruments and other documents for residential mortgage loans that we service. In recent years, challenges have been raised to whether we have adhered to these requirements, and whether, as a result in some instances, the loans can be enforced as local law otherwise would permit. Additionally, we currently use the Mortgage Electronic Registration Systems, Inc. (MERS) system for approximately half of the residential mortgage loans that remain in our servicing portfolio. Individual borrowers and certain local governments have contended that the use of MERS is improper or otherwise adversely affects the security interest. If documentation requirements were not met, or if the use of MERS or the MERS system is found not valid or effective, we could be obligated to, or choose to, take remedial actions and may be subject to additional costs or losses.
For additional information, Off-Balance Sheet Arrangements and Contractual Obligations in the MD&A on page 50.
If the U.S. housing market weakens, or home prices decline, our consumer loan portfolios, credit quality, credit losses, representations and warranties exposures, and earnings may be adversely affected.
Although U.S. home prices continued to improve during 2014, the declines in prior years have negatively impacted the demand for many of our products. Additionally, our mortgage loan production volume is generally influenced by the rate of growth in residential mortgage debt outstanding and the size of the residential mortgage market.
Conditions in the U.S. housing market in prior years have also resulted in significant write-downs of asset values in several asset classes, notably mortgage-backed securities, and increased exposure to monolines. If the U.S. housing market were to weaken, the value of real estate could decline, which could negatively affect our exposure to representations and warranties. While there were continued indications in 2014 that the U.S. economy is improving, the performance of our overall consumer portfolios may not significantly improve in the near future. A protracted continuation or worsening of difficult housing market conditions may exacerbate the adverse effects outlined above and could have an adverse effect on our financial condition and results of operations.
In addition, our home equity portfolio, which makes up approximately 28 percent of our total home loans portfolio, contains a significant percentage of loans in second-lien or more junior-lien positions, and such loans have elevated risk characteristics. Our home equity portfolio had an outstanding balance of $85.7 billion as of December 31, 2014, including $74.2 billion of home equity lines of credit (HELOC), $9.8 billion of home equity loans and $1.7 billion of reverse mortgages. Of the total home equity portfolio at December 31, 2014, $20.6 billion, or 24 percent, were in first-lien positions (26 percent excluding the PCI home equity portfolio) and $65.1 billion, or 76 percent (74 percent excluding the PCI home equity portfolio) were in second-lien or more junior-lien positions. The HELOCs that have entered the amortization period have experienced a higher percentage of early stage delinquencies and nonperforming status when compared to the HELOC portfolio as a whole. Loans in our HELOC portfolio generally have an initial draw period of 10 years and more than 75 percent of these loans will not enter their amortization period until 2016 or later. As a result, delinquencies and defaults may increase in future periods. For additional information, see Off-Balance Sheet Arrangements and Contractual Obligations in the MD&A on page 50 and Consumer Portfolio Credit Risk Management on page 70.
Regulatory, Compliance and Legal Risk
U.S. federal banking agencies may require us to hold higher levels of regulatory capital, increase our regulatory capital ratios or increase liquidity, which could result in the need to issue additional securities that qualify as regulatory capital or to take other actions, such as to sell company assets.
We are subject to the Federal Reserve’s risk-based capital rules. These rules establish regulatory capital requirements for banking institutions to meet minimum requirements as well as to qualify as a “well-capitalized” institution. If any of our subsidiary insured depository institutions fail to maintain its status as “well-capitalized” under the applicable regulatory capital rules, the Federal Reserve will require us to agree to bring the insured depository institution or institutions back to “well-capitalized” status. For the duration of such an agreement, the Federal Reserve may impose restrictions on our activities. If we were to fail to enter into such an agreement, or fail to comply with the terms of such agreement, the Federal Reserve may impose more severe restrictions on our activities, including requiring us to cease and desist activities permitted under the Bank Holding Company Act of 1956.
The current regulatory environment is fluid, with requirements frequently being introduced and amended. It is possible that increases in regulatory capital requirements, changes in how regulatory capital is calculated or increases to liquidity
requirements could cause us to increase our capital levels by issuing additional common stock, thus diluting our existing shareholders, or by taking other actions, such as selling company assets, in order to maintain our “well-capitalized” status.
In October 2013, the Federal Reserve, the Federal Deposit Insurance Corporation (FDIC) and the Office of the Comptroller of the Currency (OCC) (the Agencies, or U.S. banking regulators) published the final Basel 3 regulatory capital rules (Basel 3). Basel 3 materially changes Tier 1 and Total capital calculations and formally establishes a Common equity tier 1 capital ratio, notably phasing out trust preferred securities. Additionally, Basel 3 introduces new minimum capital ratios and buffer requirements and a supplementary leverage ratio (SLR), changes the composition of regulatory capital, revises the adequately capitalized minimum requirements under the Prompt Corrective Action (PCA) framework, expands and modifies the risk-sensitive calculation of risk weighted-assets for credit and market risk (the Advanced approaches) and introduces a Standardized approach for the calculation of risk-weighted assets, which serves as a minimum. Changes to the composition of regulatory capital under Basel 3, as compared to the Basel 1 – 2013 Rules, are subject to a transition period. The new minimum capital ratio requirements and related buffers will be phased in from January 1, 2014 through January 1, 2019. When presented on a fully phased-in basis, capital, risk-weighted assets and the capital ratios assume all regulatory capital adjustments and deductions are fully recognized. The Advanced approaches require approval by the Agencies of our internal analytical models used to calculate risk-weighted assets. As an advanced approaches bank, under Basel 3, we are required to complete a qualification period (parallel run) to demonstrate compliance with the final Basel 3 rules to the satisfaction of U.S. banking regulators. Our estimates under the Basel 3 Advanced approaches may be refined over time as a result of further rulemaking or clarification by U.S. banking regulators or as our understanding and interpretation of the rules evolve. We are currently working with the U.S. banking regulators to obtain approval of certain internal analytical models including the wholesale (e.g., commercial) and other credit models in order to exit parallel run. The U.S. banking regulators have indicated that they will require modifications to these models which would likely result in a material increase in our risk-weighted assets resulting in a decrease in our capital ratios.
In April 2014, the Agencies adopted a final rule to strengthen the SLR standards for the largest U.S. banking organizations by requiring such institutions to maintain a leverage buffer greater than 2.0 percentage points above the minimum SLR requirement of 3.0 percent, for a total of greater than 5.0 percent, to avoid restrictions on capital distributions and variable compensation payments. Banking subsidiaries of such organizations are required to maintain at least a six percent SLR to be considered “well capitalized” under the PCA framework. In addition, in September 2014, the Agencies adopted a final rule modifying the definition of the denominator of the SLR in a manner consistent with changes adopted by the Basel Committee on Banking Supervision (Basel Committee) to better capture on- and off-balance sheet exposures, including credit derivatives, repo-style transactions, and lines of credit.
In September 2014, the Agencies issued a final Liquidity Coverage Ratio (LCR) rule. This rule creates a standardized minimum liquidity requirement for the largest U.S. financial institutions. The rule will require an institution to hold high quality liquid assets (HQLA), such as central bank reserves and
government debt that can be converted easily and quickly into cash, in an amount equal to or greater than prescribed net cash outflows during a 30-day stress period. In October 2014, the Basel Committee issued its final standard for the Net Stable Funding Ratio (NSFR) regulation. The NSFR requires banks to maintain a stable funding profile in relation to their on- and off-balance sheet activities. Although the timing is uncertain, the Agencies are expected to propose similar regulation for the NSFR in the near future.
In November 2014, the Financial Stability Board, in consultation with the Basel Committee, issued for public consultation a proposal for a common international standard on total loss-absorbing capacity (TLAC) for global systemically important banks (GSIBs). Although the timing is uncertain, the Agencies are expected to propose TLAC regulation in the near future.
In December 2014, a U.S. banking regulator proposed a regulation that would implement GSIB surcharge requirements for the largest U.S. BHCs. The proposed rule would require such organizations to calculate a GSIB capital buffer that is the higher of the GSIB’s capital buffer proposed by the Basel Committee in 2012 and a modified capital buffer with a short-term wholesale funding component. As proposed, the Federal Reserve estimates that the GSIB surcharge requirements, which currently ranges from 1.0 percent to 4.5 percent, would require us to hold Common equity tier 1 capital in excess of regulatory minimums and the capital conservation buffer. Consequences of falling below this level are expected to include limitations on capital distributions and variable compensation payments.
Compliance with the regulatory capital and liquidity requirements may impact our ability to return capital to shareholders and may impact our operations by requiring us to liquidate assets, increase borrowings, issue additional equity or other securities, cease or alter certain operations, or hold highly liquid assets, which may adversely affect our results of operations.
For additional information, see Capital Management and Liquidity Risk – Basel 3 Liquidity Standards on pages 59 and 67.
We are subject to extensive government legislation and regulations, both domestically and internationally, which impact our operating costs and could require us to make changes to our operations, which could result in an adverse impact on our results of operations. Additionally, these regulations, and certain consent orders and settlements we have entered into, have increased and will continue to increase our compliance and operational costs.
We are subject to extensive laws and regulations promulgated by U.S. state, U.S. federal and non-U.S. laws in the jurisdictions in which we operate. In response to the financial crisis, the U.S. adopted the Financial Reform Act, which has resulted in significant rulemaking and proposed rulemaking by the U.S. Department of the Treasury, the Federal Reserve, the OCC, the CFPB, FSOC, the FDIC, the SEC and CFTC. In addition, non-U.S. regulators, such as the U.K. financial regulators and the European Parliament and Commission, have adopted or have proposed laws and regulations regarding financial institutions located in their jurisdictions.
The ultimate impact of these laws and regulations remains uncertain. For example, we are required to annually submit a resolution plan to the FDIC and the Federal Reserve. If the FDIC and Federal Reserve jointly determine that our resolution plan is not credible and we fail to cure the deficiencies in a timely manner, they could impose more stringent capital, leverage or liquidity requirements or restrictions on growth, activities or operations of the Corporation, and we could be required to take certain actions that could impose operating costs and could potentially result in
the divestiture or restructuring of certain businesses and subsidiaries. In August 2014, the Federal Reserve and the FDIC completed foreclosure activities. their reviews of the resolution plans submitted in 2013 by 11 large, complex banking organizations, including Bank of America, and issued letters to each of these banking organizations. Separately, in August 2014, the Federal Reserve and the FDIC issued a joint press release stating that the Board of Directors of the FDIC had determined that the plans submitted by each of the 11 banks were not credible and do not facilitate an orderly resolution under the U.S. Bankruptcy Code. However, the Federal Reserve did not join the FDIC in its determination that the submitted plans were not credible. Many rules are still being finalized, and upon finalization could require additional regulatory guidance and interpretation. Additionally, laws proposed by different jurisdictions could create competing or conflicting requirements.
We are also subject to inquiries, investigations, actionsother significant regulations, such as OFAC, FCPA, and claims from regulators, trustees, investorsU.S. and other third parties relatinginternational anti-money laundering regulations. Laws proposed by different jurisdictions could create competing or conflicting requirements. We could become subject to other mortgage-related activitiesregulatory requirements beyond those currently proposed, adopted or contemplated. We are currently subject to the terms of settlements and consent orders that we have entered into with government agencies, such as the purchase, sale, pooling,2011 OCC Consent Order and originationthe National Mortgage Settlement, and securitizationmay become subject to additional settlements or orders in the future.
While we believe that we have adopted appropriate risk management and compliance programs, compliance risks will continue to exist, particularly as we adapt to new rules and regulations. Our regulators have assumed an increasingly active oversight, inspection and investigatory role over our operations and the financial services industry generally. In addition, legal and regulatory proceedings and other contingencies will arise from time to time that may result in fines, penalties, equitable relief and changes to our business practices. As a result, we are and will continue to be subject to heightened compliance and operating costs that could adversely affect our results of operations.
Changes in the structure of the GSEs and the relationship among the GSEs, the government and the private markets, or the conversion of the current conservatorship of the GSEs into receivership, could result in significant changes to our business operations and may adversely impact our business.
During 2013 and 2014, we sold approximately $65 billion of loans to the GSEs. Each GSE is currently in a conservatorship, with its primary regulator, the Federal Housing Finance Agency, acting as well as structuring, marketing, underwritingconservator. We cannot predict if, when or how the conservatorships will end, or any associated changes to the GSEs’ business structure that could result. We also cannot predict whether the conservatorships will end in receivership. There are several proposed approaches to reform the GSEs that, if enacted, could change the structure of the GSEs and issuancethe relationship among the GSEs, the government and the private markets, including the trading markets for agency conforming mortgage loans and markets for mortgage-related securities in which weparticipate. We cannot predict the prospects for the enactment, timing or content of MBSlegislative or rulemaking proposals regarding the future status of the GSEs. Accordingly, there continues to be uncertainty regarding the future of the GSEs, including whether they will continue to exist in their current form.
We are subject to significant financial and reputational risks from potential liability arising from lawsuits, regulatory and government action.
We face significant legal risks in our business, and the volume of claims and amount of damages, penalties and fines claimed in litigation, and regulatory and government proceedings against us and other securities,financial institutions remain high. Increased litigation and investigation costs, substantial legal liability or significant regulatory or government action against us could have adverse effects on our financial condition and results of operations or cause significant reputational harm to us, which in turn could adversely impact our business prospects. We continue to experience increased litigation and other disputes, including claims relating to the adequacyfor contractual indemnification, with counterparties regarding relative rights and accuracy of disclosures in offering documentsresponsibilities. Consumers, clients and representations and warranties madeother counterparties have grown more litigious. Our experience with certain regulatory authorities suggests an increasing supervisory focus on enforcement, including in connection with whole-loan sales or securitizations. The ongoing environmentalleged violations of heightened scrutiny may subject us to governmental or regulatory inquiries, investigations, actions, penaltieslaw and fines, including by the DOJ, state Attorneys General and other members of the RMBS Working Group of the Financial Fraud Enforcement Task Force, or by other regulators or government agencies that could significantly adversely affect our reputation and result in material costs to us in excess of current reserves and management’s estimate of the aggregate range of possible loss for litigation matters.customer harm. Recent actions by regulators and government agencies indicate that they may, on an industry basis, increasingly pursue claims under the Financial Institutionsinstitutions Reform, Recovery, and Enforcement Actact of 1989 (FIRREA) and the False Claims Act (FCA). For example, the Civil Division of the U.S. Attorney’s office for the Eastern District of New York is conducting an investigation concerning our compliance with the requirements of the Federal Housing Administration’s Direct Endorsement Program.Act. FIRREA contemplates civil monetary penalties as high as $1.1 million per violation or, if permitted by the court, based on pecuniary gain derived or pecuniary loss suffered as a result of the violation. Treble damages are potentially available for FCAFalse Claims Act claims. The ongoing environment of additional regulation, increased regulatory compliance burdens, and enhanced regulatory enforcement, combined with ongoing uncertainty related to the continuing evolution of the regulatory environment, has resulted in operational and compliance costs and may limit our ability to continue providing certain products and services.
For more information on management’s estimate of the aggregate range of possible loss and regulatory investigations,litigation risks, see Note 12 – Commitments and Contingencies to the Consolidated Financial Statements.
Mortgage-related Settlements – Servicing MattersWe may be adversely affected by changes in U.S. and non-U.S. tax and other laws and regulations.
The U.S. Congress and the Administration have indicated an interest in reforming the U.S. corporate income tax code. Possible approaches include lowering the 35 percent corporate tax rate, modifying the taxation of income earned outside the U.S. and limiting or eliminating various other deductions, tax credits and/or other tax preferences. Also, it is possible that New York City will enact corporate tax reform that may conform to New York state’s tax reform enacted during 2014. It is not possible at this time to quantify either the one-time impacts from the remeasurement of deferred tax assets and liabilities that might result upon tax reform enactment or the ongoing impacts reform proposals might have on income tax expense.
In connectionaddition, income from certain non-U.S. subsidiaries has not been subject to U.S. income tax as a result of long-standing deferral provisions applicable to income that is derived in the active conduct of a banking and financing business abroad. These deferral provisions have expired for taxable years beginning on or after January 1, 2015. However, the U.S. Congress has extended these provisions several times, most recently in December 2014, when it reinstated the provisions retroactively to January 2014. Congress this year may similarly consider reinstating these provisions to apply to the 2015 taxable year. Absent an extension, active financing income earned by certain non-U.S. subsidiaries will generally be subject to a tax provision that considers
incremental U.S. income tax. The impact of the expiration of these provisions would depend upon the amount, composition and geographic mix of our future earnings.
The Corporation has $7.7 billion of U.K. net deferred tax assets which consist primarily of net operating losses (NOLs) that are expected to be realized by certain subsidiaries over an extended number of years. Pretax income for these subsidiaries for 2014, 2013 and 2012 on a cumulative basis totaled $1.7 billion, excluding the impact of debit valuation adjustments (DVA) and the adoption impact of a funding valuation adjustment (FVA). In December 2014, the U.K. Treasury announced that its 2015 Finance Bill, to be introduced soon, will include a proposal that, if enacted, would limit the amount of a bank’s taxable profits that can be reduced by the bank’s existing NOLs to 50 percent of such profits. This proposal would significantly increase the number of years over which our U.K. NOLs, which may be carried forward indefinitely, could be utilized, effectively accelerating U.K. tax that would otherwise have been paid further out in the future. The acceleration of tax and deferral of NOL utilization would not impact our results of operations, but would result in a slower improvement in the amount of our DTAs disallowed for Basel 3 regulatory capital. We are unable to predict whether this proposal will be enacted or, if enacted, what the final provisions will be. Adverse developments with respect to tax laws or to other material factors, such as a prolonged worsening of Europe’s capital markets, could lead management to reassess and/or change its current conclusion that no valuation allowance is necessary with respect to our U.K. net deferred tax assets.
Other countries have also proposed and adopted certain regulatory changes targeted at financial institutions or that otherwise affect us. The EU has adopted increased capital requirements and the BNY Mellon Settlement, BANAU.K. has agreed(i) increased liquidity requirements for local financial institutions, including regulated U.K. subsidiaries of non-U.K. BHCs and other financial institutions as well as branches of non-U.K. banks located in the U.K.; (ii) adopted a Bank Levy, which applies to the aggregate balance sheet of branches and subsidiaries of non-U.K. banks and banking groups operating in the U.K.; and (iii) proposed the creation and production of recovery and resolution plans by U.K.-regulated entities.
Risk of the Competitive Environment in which We Operate
We face significant and increasing competition in the financial services industry.
We operate in a highly competitive environment. Over time, there has been substantial consolidation among companies in the financial services industry. This trend has also hastened the globalization of the securities and financial services markets. We will continue to experience intensified competition as consolidation in and globalization of the financial services industry may result in larger, better-capitalized and more geographically diverse companies that are capable of offering a wider array of financial products and services at more competitive prices. To the extent we expand into new business areas and new geographic regions, we may face competitors with more experience and more established relationships with clients, regulators and industry participants in the relevant market, which could adversely affect our ability to compete. In addition, technological advances and the growth of e-commerce have made it possible for non-depository institutions to offer products and services that traditionally were banking products, and for financial institutions to compete with
technology companies in providing electronic and internet-based financial solutions. Increased competition may negatively affect our earnings by creating pressure to lower prices on our products and services and/or reducing market share.
Damage to our reputation could harm our businesses, including our competitive position and business prospects.
Our ability to attract and retain customers, clients, investors and employees is impacted by our reputation. We continue to face increased public and regulatory scrutiny resulting from the financial crisis and economic downturn as well as alleged irregularities in servicing, foreclosure, consumer collections, mortgage loan modifications and other practices, compensation practices, and the suitability or reasonableness of recommending particular trading or investment strategies.
Harm to our reputation can also arise from other sources, including employee misconduct, unethical behavior, litigation or regulatory outcomes, failing to deliver minimum or required standards of service and quality, compliance failures, unintended disclosure of confidential information, and the activities of our clients, customers and counterparties, including vendors. Actions by the financial services industry generally or by certain members or individuals in the industry also can adversely affect our reputation.
We are subject to complex and evolving laws and regulations regarding privacy, data protections and other matters. Principles concerning the appropriate scope of consumer and commercial privacy vary considerably in different jurisdictions, and regulatory and public expectations regarding the definition and scope of consumer and commercial privacy may remain fluid in the future. It is possible that these laws may be interpreted and applied by various jurisdictions in a manner inconsistent with our current or future practices, or that is inconsistent with one another. We face regulatory, reputational and operational risks if personal, confidential or proprietary information of customers or clients in our possession is mishandled or misused.
We could suffer reputational harm if we fail to properly identify and manage potential conflicts of interest. Management of potential conflicts of interests has become increasingly complex as we expand our business activities through more numerous transactions, obligations and interests with and among our clients. The failure to adequately address, or the perceived failure to adequately address, conflicts of interest could affect the willingness of clients to deal with us, or give rise to litigation or enforcement actions, which could adversely affect our businesses.
Our actual or perceived failure to address these and other issues gives rise to reputational risk that could cause harm to us and our business prospects, including failure to properly address operational risks. Failure to appropriately address any of these issues could also give rise to additional regulatory restrictions, legal risks and reputational harm, which could, among other consequences, increase the size and number of litigation claims and damages asserted or subject us to enforcement actions, fines and penalties and cause us to incur related costs and expenses.
Our ability to attract and retain qualified employees is critical to the success of our business and failure to do so could hurt our business prospects and competitive position.
Our performance is heavily dependent on the talents and efforts of highly skilled individuals. Competition for qualified personnel within the financial services industry and from businesses outside the financial services industry has been, and is expected to continue to be, intense. Our competitors include non-U.S. based institutions and institutions subject to different compensation and
hiring regulations than those imposed on U.S. institutions and financial institutions. The difficulty we face in competing for key personnel is exacerbated in emerging markets, where we are often competing for qualified employees with entities that may have a significantly greater presence or more extensive experience in the region.
In order to attract and retain qualified personnel, we must provide market-level compensation. As a large financial and banking institution, we may be subject to limitations on compensation practices (which may or may not affect our competitors) by the Federal Reserve, the FDIC or other regulators around the world. For instance, recent EU rules limit and subject to clawback certain forms of variable compensation for senior employees. Current and potential future limitations on executive compensation imposed by legislation or regulation could adversely affect our ability to attract and maintain qualified employees. Furthermore, a substantial portion of our annual incentive compensation paid to our senior employees has in recent years taken the form of long-term equity awards. Therefore, the ultimate value of this compensation depends on the price of our common stock when the awards vest. If we are unable to continue to attract and retain qualified individuals, our business prospects and competitive position could be adversely affected.
In addition, if we fail to retain the wealth advisors that we employ in Global Wealth & Investment Management, particularly those with significant client relationships, such failure could result in a loss of clients or the withdrawal of significant client assets.
Our inability to adapt our products and services to evolving industry standards and consumer preferences could harm our business.
Our business model is based on a diversified mix of business that provides a broad range of financial products and services, delivered through multiple distribution channels. Our success depends on our ability to adapt our products and services to evolving industry standards. There is increasing pressure by competitors to provide products and services at lower prices. This can reduce our net interest margin and revenues from our fee-based products and services. In addition, the widespread adoption of new technologies, including internet services and payment systems, could require us to incur substantial expenditures to modify or adapt our existing products and services. We might not be successful in developing or introducing new products and services, responding or adapting to changes in consumer spending and saving habits, achieving market acceptance of our products and services, or sufficiently developing and maintaining loyal customers.
We may not be able to achieve expected cost savings from cost-saving initiatives or in accordance with currently anticipated time frames.
We are currently engaged in efforts to achieve cost savings. For example, we currently expect our Legacy Assets and Servicing costs, excluding litigation costs, to decrease to approximately $800 million per quarter by the end of 2015. We may be unable to fully realize the cost savings and other anticipated benefits from our cost saving initiatives or in accordance with currently anticipated timeframes. In addition, our litigation expense may vary from period to period and may cause our noninterest expense to increase for any particular period even if we otherwise achieve cost savings as the result of our cost savings initiatives or otherwise.
Risks Related to Risk Management
Our risk management framework may not be effective in mitigating risk and reducing the potential for losses.
Our risk management framework is designed to minimize risk and loss to us. We seek to identify, measure, monitor, report and control our exposure to the types of risk to which we are subject, including strategic, credit, market, liquidity, compliance, operational and reputational risks, among others. While we employ a broad and diversified set of risk monitoring and mitigation techniques, including hedging strategies and techniques that seek to balance our ability to profit from trading positions with our exposure to potential losses, those techniques are inherently limited because they cannot anticipate the existence or future development of currently unanticipated or unknown risks. The Volcker Rule may impact our ability to engage in certain hedging strategies. Recent economic conditions, heightened legislative and regulatory scrutiny of the financial services industry and increases in the overall complexity of our operations, among other developments, have resulted in a heightened level of risk for us. Accordingly, we could suffer losses as a result of our failure to properly anticipate and manage these risks.
For more information about our risk management policies and procedures, see Managing Risk in the MD&A on page 55.
A failure in or breach of our operational or security systems or infrastructure, or those of third parties, could disrupt our businesses, and adversely impact our results of operations, cash flows, liquidity and financial condition, as well as cause reputational harm.
The potential for operational risk exposure exists throughout our organization and as a result of our interactions with third parties, and is not limited to our operational functions. Our operational and security systems, infrastructure, including our computer systems, data management, and internal processes, as well as those of third parties, are integral to our performance. In addition, we rely on our employees and third parties in our day-to-day and ongoing operations, who may, as a result of human error or malfeasance or failure or breach of third-party systems or infrastructure, expose us to risk. We have taken measures to implement certain servicing changes. The Trusteebackup systems and BANAother safeguards to support our operations, but our ability to conduct business may be adversely affected by any significant disruptions to us or to third parties with whom we interact. In addition, our ability to implement backup systems and other safeguards with respect to third-party systems is more limited than with respect to our own systems. Our financial, accounting, data processing, backup or other operating or security systems and infrastructure may fail to operate properly or become disabled or damaged as a result of a number of factors including events that are wholly or partially beyond our control which could adversely affect our ability to process these transactions or provide these services. There could be sudden increases in customer transaction volume; electrical, telecommunications or other major physical infrastructure outages; natural disasters such as earthquakes, tornadoes, hurricanes and floods; disease pandemics; and events arising from local or larger scale political or social matters, including terrorist acts. We continuously update these systems to support our operations and growth. This updating entails significant costs and creates risks associated with implementing new systems and integrating them with existing ones. Operational risk exposures could adversely impact our results of operations, cash flows, liquidity and financial condition, as well as cause reputational harm.
A cyber attack, information or security breach, or a technology failure of ours or of a third party could adversely affect our ability to conduct our business, manage our exposure to risk or expand our businesses, result in the disclosure or misuse of confidential or proprietary information, increase our costs to maintain and update our operational and security systems and infrastructure, and adversely impact our results of operations, cash flows, liquidity and financial condition, as well as cause reputational harm.
Our businesses are highly dependent on the security and efficacy of our infrastructure, computer and data management systems, as well as those of third parties with whom we interact. Cyber security risks for financial institutions have agreedsignificantly increased in recent years in part because of the proliferation of new technologies, the use of the Internet and telecommunications technologies to clarifyconduct financial transactions, and conform certain servicingthe increased sophistication and activities of organized crime, hackers, terrorists and other external parties, including foreign state actors. Our businesses rely on the secure processing, transmission, storage and retrieval of confidential, proprietary and other information in our computer and data management systems and networks, and in the computer and data management systems and networks of third parties. We rely on digital technologies, computer, database and email systems, software, and networks to conduct our operations. In addition, to access our network, products and services, our customers and other third parties may use personal mobile devices or computing devices that are outside of our network environment. We, our customers, regulators and other third parties have been subject to, and are likely to continue to be the target of, cyber attacks, including computer viruses, malicious or destructive code, phishing attacks, denial of service or information or other security breaches, that could result in the unauthorized release, gathering, monitoring, misuse, loss or destruction of confidential, proprietary and other information of the Corporation, our employees, our customers or of third parties, or otherwise materially disrupt our or our customers’ or other third parties’ network access or business operations. For example, in recent years, we have been subject to malicious activity, including distributed denial of service attacks. Additionally, several large retailers have disclosed substantial cyber security breaches affecting debit and credit card accounts of their customers, some of whom were our cardholders. Although these incidents have not, to date, had a material impact on us, we believe that such incidents will continue, and we are unable to predict the severity of such future attacks on us. Our counterparties, regulators, customers and clients, and other third parties with whom we or our customers and clients interact are exposed to similar incidents, and incidents affecting those third parties could impact us.
Although to date we have not experienced any material losses or other material consequences relating to technology failure, cyber attacks or other information or other security breaches, there can be no assurance that we will not suffer such losses or other consequences in the future. Our risk and exposure to these matters remains heightened because of, among other things, the evolving nature of these threats, our prominent size and scale, and our role in the financial services industry and the broader economy, our plans to continue to implement our internet banking and mobile banking channel strategies and develop additional remote connectivity solutions to serve our customers when and how they want to be served, our continuous transmission of sensitive information to, and storage of such information by, third
parties, including our vendors and regulators, our expanded geographic footprint and international presence, the outsourcing of some of our business operations, the continued uncertain global economic environment, threats of cyber terrorism, external extremist parties, including foreign state actors, in some circumstances as a means to promote political ends, and system and customer account updates and conversions. As a result, cyber security and the continued development and enhancement of our controls, processes and practices designed to protect our systems, computers, software, data and networks from attack, damage or unauthorized access remain a priority for us. As cyber threats continue to evolve, we may be required to expend significant additional resources to continue to modify or enhance our protective measures or to investigate and remediate any information security vulnerabilities or incidents.
We also face indirect technology, cyber security and operational risks relating to the third parties with whom we do business or upon whom we rely to facilitate or enable our business activities. In addition to customers and clients, the third parties with whom we interact and upon whom we rely include financial counterparties; financial intermediaries such as clearing agents, exchanges and clearing houses; vendors; regulators; providers of critical infrastructure such as internet access and electrical power, and retailers for whom we process transactions. Each of these third parties faces the risk of cyber attack, information breach or loss, or technology failure. Any such cyber attack, information breach or loss, or technology failure of a third party could, among other things, adversely affect our ability to effect transactions, service our clients, manage our exposure to risk or expand our businesses. As a result of financial entities and technology systems becoming more interdependent and complex, a cyber incident, information breach or loss, or technology failure that significantly degrades, deletes or compromises the systems or data of one or more financial entities could have a material impact on counterparties or other market participants, including the Corporation. For example, in recent years, there has been significant consolidation among clearing agents, exchanges and clearing houses and increased interconnectivity of multiple financial institutions with central agents, exchanges and clearing houses. This consolidation and interconnectivity increases the risk of operational failure, on both individual and industry-wide bases, as disparate complex systems need to be integrated, often on an accelerated basis. Any such cyber attack, information breach or loss, failure, termination or constraint could, among other things, adversely affect our ability to effect transactions, service our clients, manage our exposure to risk or expand our businesses.
Any of the matters discussed above could result in our loss of customers and business opportunities, significant business disruption to our operations and business, misappropriation or destruction of our confidential information and/or that of our customers, or damage to our customers’ and/or third parties’ computers or systems, and could result in a violation of applicable privacy laws and other laws, litigation exposure, regulatory fines, penalties or intervention, loss of confidence in our security measures, reputational damage, reimbursement or other compensatory costs, and additional compliance costs. In addition, any of the matters described above could adversely impact our results of operations, cash flows, liquidity and financial condition.
Risk of Being an International Business
We are subject to numerous political, economic, market, reputational, operational, legal, regulatory and other risks in the non-U.S. jurisdictions in which we operate.
We do business throughout the world, including in developing regions of the world commonly known as emerging markets. Our businesses and revenues derived from non-U.S. jurisdictions are subject to risk of loss from currency fluctuations, social or judicial instability, changes in governmental policies or policies of central banks, expropriation, nationalization and/or confiscation of assets, price controls, capital controls, exchange controls, other restrictive actions, unfavorable political and diplomatic developments, oil price fluctuation and changes in legislation. These risks are especially elevated in emerging markets. A number of non-U.S. jurisdictions in which we do business have been negatively impacted by slowing growth rates or recessionary conditions, market volatility and/or political unrest. Several emerging market economies are particularly vulnerable to the impact of rising interest rates, inflationary pressures, weaker oil and other commodity prices, large external deficits, and political uncertainty. While some of these jurisdictions are showing signs of stabilization or recovery, others, such as Russia and Greece, continue to experience increasing levels of stress and volatility. In addition, the potential risk of default on sovereign debt in some non-U.S. jurisdictions could expose us to substantial losses. Risks in one country can limit our opportunities for portfolio growth and negatively affect our operations in another country or countries, including our operations in the U.S. As a result, any such unfavorable conditions or developments could have an adverse impact on our company.
Our non-U.S. businesses are also subject to extensive regulation by various regulators, including governments, securities exchanges, central banks and other regulatory bodies, in the jurisdictions in which those businesses operate. In many countries, the laws and regulations applicable to the financial services and securities industries are uncertain and evolving, and it may be difficult for us to determine the exact requirements of local laws in every market or manage our relationships with multiple regulators in various jurisdictions. Our potential inability to remain in compliance with local laws in a particular market and manage our relationships with regulators could have an adverse effect not only on our businesses in that market but also on our reputation generally.
We also invest or trade in the securities of corporations and governments located in non-U.S. jurisdictions, including emerging markets. Revenues from the trading of non-U.S. securities may be subject to negative fluctuations as a result of the above factors. Furthermore, the impact of these fluctuations could be magnified, because non-U.S. trading markets, particularly in emerging market countries, are generally smaller, less liquid and more volatile than U.S. trading markets.
In addition to non-U.S. legislation, our international operations are also subject to U.S. legal requirements. For example, our
international operations are subject to U.S. laws on foreign corrupt practices, the Office of Foreign Assets Control, and anti-money laundering regulations.
We are subject to geopolitical risks, including acts or threats of terrorism, and actions taken by the U.S. or other governments in response thereto and/or military conflicts, which could adversely affect business and economic conditions abroad as well as in the U.S.
For more information on our non-U.S. credit and trading portfolios, see Non-U.S. Portfolio in the MD&A on page 93.
Risk from Accounting Changes
Changes in accounting standards relatedor inaccurate estimates or assumptions in applying accounting policies could adversely affect us.
Our accounting policies and methods are fundamental to loss mitigation.how we record and report our financial condition and results of operations. Some of these policies require use of estimates and assumptions that may affect the reported value of our assets or liabilities and results of operations and are critical because they require management to make difficult, subjective and complex judgments about matters that are inherently uncertain. If those assumptions, estimates or judgments were incorrectly made, we could be required to correct and restate prior-period financial statements. Accounting standard-setters and those who interpret the accounting standards (such as the Financial Accounting Standards Board (FASB), the SEC, banking regulators and our independent registered public accounting firm) may also amend or even reverse their previous interpretations or positions on how various standards should be applied. These changes may be difficult to predict and could impact how we prepare and report our financial statements. In particular, the BNY Mellon Settlement clarifies that it is permissiblesome cases, we could be required to apply a new or revised standard retroactively, resulting in the same loss mitigation strategiesCorporation needing to the Covered Trusts as are appliedrevise and republish prior-period financial statements.
The FASB issued in 2012 a proposed standard on accounting for credit losses. The standard would replace multiple existing impairment models, including replacing an “incurred loss” model for loans with an “expected loss” model. The FASB has not yet established a proposed effective date but a final standard is expected to BANA affiliates’ HFI portfolios. This portion of the agreement was effectivebe issued in the second quarterhalf of 20112015. The final standard may materially reduce retained earnings in the period of adoption.
For more information on some of our critical accounting policies and standards and recent accounting changes, see Complex Accounting Estimates in the MD&A on page 109 and Note 1 – Summary of Significant Accounting Principlesto the Consolidated Financial Statements.
Item 1B. Unresolved Staff Comments
None
Item 2. Properties
As of December 31, 2014, our principal offices and other materially important properties consisted of the following:
|
| | | | | | | | | | |
| | | | | | | | | | |
| Facility Name | | Location | | General Character of the Physical Property | | Primary Business Segment | | Property Status | | Property Square Feet (1) |
| Bank of America Corporate Center | | Charlotte, NC | | 60 Story Building | | Principal Executive Offices | | Owned | | 1,200,392 |
| Bank of America Tower at One Bryant Park | | New York, NY | | 55 Story Building | | GWIM, Global Banking and Global Markets | | Leased (2) | | 1,798,373 |
| Bank of America Merrill Lynch Financial Centre | | London, UK | | 4 Building Campus | | Global Banking and Global Markets | | Leased | | 568,032 |
| Cheung Kong Center | | Hong Kong | | 62 Story Building | | Global Banking and Global Markets | | Leased | | 149,790 |
| |
(1) | For leased properties, property square feet represents the square footage occupied by the Corporation. |
| |
(2) | The Corporation has a 49.9 percent joint venture interest in this property. |
We own or lease approximately 90.5 million square feet in 22,530 facility and ATM locations globally, including approximately 84.3 million square feet in the U.S. (all 50 states and the District of Columbia, the U.S. Virgin Islands and Puerto Rico) and approximately 6.2 million square feet in more than 35 countries.
We believe our owned and leased properties are adequate for our business needs and are well maintained. We continue to evaluate our owned and leased real estate and may determine from time to time that certain of our premises and facilities, or ownership structures, are no longer necessary for our operations. In connection therewith, we are evaluating the sale or sale/leaseback of certain properties and we may incur costs in connection with any such transactions.
Item 3. Legal Proceedings
See Litigation and Regulatory Matters in Note 12 – Commitments and Contingenciesto the Consolidated Financial Statements, which is not conditionedincorporated herein by reference.
Item 4. Mine Safety Disclosures
None
Part II
Bank of America Corporation and Subsidiaries
Item 5. Market for Registrant’s Common Equity, Related Stockholder Matters and Issuer Purchases of Equity Securities
The principal market on final court approval.
BANAwhich our common stock is traded is the New York Stock Exchange. Our common stock is also agreed to transferlisted on the servicing rights related toLondon Stock Exchange, and certain high-risk loans to qualified subservicersshares are listed on the Tokyo Stock Exchange. As of February 24, 2015, there were 203,715 registered shareholders of common stock. The table below sets forth the high and low closing sales prices of the common stock on the New York Stock Exchange for the periods indicated during 2013 and 2014, as well as the dividends we paid on a schedulequarterly basis:
|
| | | | | | | | | | | | | |
| | | | | | | | |
| | Quarter | | High | | Low | | Dividend |
| 2013 | first | | $ | 12.78 |
| | $ | 11.03 |
| | $ | 0.01 |
|
| | second | | 13.83 |
| | 11.44 |
| | 0.01 |
|
| | third | | 14.95 |
| | 12.83 |
| | 0.01 |
|
| | fourth | | 15.88 |
| | 13.69 |
| | 0.01 |
|
| 2014 | first | | 17.92 |
| | 16.10 |
| | 0.01 |
|
| | second | | 17.34 |
| | 14.51 |
| | 0.01 |
|
| | third | | 17.18 |
| | 14.98 |
| | 0.05 |
|
| | fourth | | 18.13 |
| | 15.76 |
| | 0.05 |
|
For more information regarding our ability to pay dividends, see Note 13 – Shareholders’ Equity and Note 16 – Regulatory Requirements and Restrictions to the Consolidated Financial Statements, which are incorporated herein by reference.
For information on our equity compensation plans, see Note 18 – Stock-based Compensation Plans to the Consolidated Financial Statements and Item 12 on page 270 of this report, which are incorporated herein by reference.
The table below presents share repurchase activity for the three months ended December 31, 2014. We did not have any unregistered sales of our equity securities in 2014.
|
| | | | | | | | | | | | | |
| | | | | | | | |
| (Dollars in millions, except per share information; shares in thousands) | Common Shares Repurchased (1) | | Weighted-Average Per Share Price | | Shares Purchased as
Part of Publicly
Announced Programs | | Remaining Buyback Authority Amounts (2) |
| October 1 - 31, 2014 | 339 |
| | $ | 17.29 |
| | — |
| | $ | 3,767 |
|
| November 1 - 30, 2014 | 73 |
| | 17.15 |
| | — |
| | 3,767 |
|
| December 1 - 31, 2014 | 32 |
| | 16.97 |
| | — |
| | 3,767 |
|
| Three months ended December 31, 2014 | 444 |
| | 17.24 |
| | |
| | |
|
| |
(1) | Includes shares of the Corporation’s common stock acquired by the Corporation in connection with satisfaction of tax withholding obligations on vested restricted stock or restricted stock units and certain forfeitures and terminations of employment-related awards under equity incentive plans. |
| |
(2) | On March 26, 2014, the Corporation announced that the Federal Reserve had informed the Corporation that it completed its 2014 Comprehensive Capital Analysis and Review and did not object to the Corporation’s 2014 capital plan, which included a request to repurchase up to $4.0 billion of common stock over four quarters beginning in the second quarter of 2014. On March 26, 2014, the Corporation’s Board of Directors authorized the repurchase of up to $4.0 billion of the Corporation’s common stock through open market purchases or privately negotiated transactions, including Rule 10b5-1 plans, over four quarters beginning with the second quarter of 2014. On April 28, 2014, the Corporation announced the suspension of the repurchase authorization previously announced on March 26, 2014. On May 27, 2014, the Corporation submitted a revised 2014 capital plan to the Federal Reserve that included no additional repurchases of common stock through the end of the first quarter of 2015 (excluding approximately $233 million of repurchases prior to April 27, 2014). On August 6, 2014, the Federal Reserve notified the Corporation that it did not object to the revised 2014 capital plan. Amounts shown in the column reflect remaining buyback authority under the March 26, 2014 authorization; however, the Corporation will not repurchase any shares of common stock pursuant to such authorization without prior approval by the Federal Reserve. |
Item 6. Selected Financial Data
See Table 7 in the MD&A on page 30 and Statistical Table XII in the MD&A on page 129, which are incorporated herein by reference.
|
| | | | |
Item 7. Bank of America Corporation and Subsidiaries Management’s Discussion and Analysis of Financial Condition and Results of Operation |
Management’s Discussion and Analysis of Financial Condition and Results of Operations
This report, the documents that beganit incorporates by reference and the documents into which it may be incorporated by reference may contain, and from time to time Bank of America Corporation (collectively with its subsidiaries, the signingCorporation) and its management may make certain statements that constitute forward-looking statements within the meaning of the BNY Mellon Settlement. ThisPrivate Securities Litigation Reform Act of 1995. These statements can be identified by the fact that they do not relate strictly to historical or current facts. Forward-looking statements often use words such as “anticipates,” “targets,” “expects,” “hopes,” “estimates,” “intends,” “plans,” “goal,” “believes,” “continue” and other similar expressions or future or conditional verbs such as “will,” “may,” “might,” “should,” “would” and “could.” The forward-looking statements made represent the Corporation’s current expectations, plans or forecasts of its future results and revenues, and future business and economic conditions more generally, and other future matters. These statements are not guarantees of future results or performance and involve certain known and unknown risks, uncertainties and assumptions that are difficult to predict and are often beyond the Corporation’s control. Actual outcomes and results may differ materially from those expressed in, or implied by, any of these forward-looking statements.
You should not place undue reliance on any forward-looking statement and should consider the following uncertainties and risks, as well as the risks and uncertainties more fully discussed elsewhere in this report, including under Item 1A. Risk Factors of this Annual Report on Form 10-K and in any of the Corporation’s subsequent Securities and Exchange Commission filings for further information about factors that could affect such forward-looking statements: the Corporation’s ability to resolve representations and warranties repurchase claims and the chance that the Corporation could face related servicing, transfer protocol will reducesecurities, fraud, indemnity or other claims from one or more counterparties, including monolines or private-label and other investors; the servicing fees payable to BANA in the future. Uponpossibility that final court approval of the BNY Mellon Settlement, failure to meet the established benchmarking standards for loans not in subservicing arrangements can trigger payment of agreed-upon fees. Additionally, we and Countrywide
have agreed to work to resolve with the Trustee certain mortgage documentation issues related to the enforceability of mortgages in foreclosure and to reimburse the related Covered Trust for any loss if BANA is unable to foreclose on the mortgage and the Covered Trustnegotiated settlements is not made whole by a title policy because of these issues. These agreements will terminate if finalobtained, including the possibility that the court approval ofdecision with respect to the BNY Mellon Settlement is overturned on appeal in whole or in part; the possibility that future representations and warranties losses may occur in excess of the Corporation’s recorded liability and estimated range of possible loss for its representations and warranties exposures; the possibility that the Corporation may not obtained,collect mortgage insurance claims; potential claims, damages, penalties, fines and reputational damage resulting from pending or future litigation and regulatory proceedings, including the possibility that amounts may be in excess of the Corporation’s recorded liability and estimated range of possible losses for litigation exposures; the possibility that the
European Commission will impose remedial measures in relation to its investigation of the Corporation’s competitive practices; the possible outcome of LIBOR, other reference rate and foreign exchange inquiries and investigations; uncertainties about the financial stability and growth rates of non-U.S. jurisdictions, the risk that those jurisdictions may face difficulties servicing their sovereign debt, and related stresses on financial markets, currencies and trade, and the Corporation’s exposures to such risks, including direct, indirect and operational; the impact of U.S. and global interest rates, currency exchange rates and economic conditions; the negative impact of the Dodd-Frank Wall Street Reform and Consumer Protection Act on the Corporation’s business and earnings, including as a result of additional regulatory interpretations and rulemaking and the success of the Corporation’s actions to mitigate such impacts; the potential impact of a prolonged low interest rate environment on the Corporation’s business, financial condition and results of operations; adverse changes to the Corporation’s credit ratings from the major credit rating agencies; estimates of the fair value of certain of the Corporation’s assets and liabilities; uncertainty regarding the content, timing and impact of regulatory capital and liquidity requirements, including, but not limited to, any GSIB surcharge or as a result of changes to our Basel 3 Advanced approaches estimates; the Corporation’s ability to fully realize the cost savings and other anticipated benefits from cost-saving initiatives, including in accordance with currently anticipated timeframes, the impact of implementation and compliance with new and evolving U.S. and international regulations, including, but not limited to, recovery and resolution planning requirements, the Volcker Rule, and derivatives regulations; the potential impact of the U.K. tax authorities’ proposal to limit how much NOLs can offset annual profit; a failure in or breach of the Corporation’s operational or security systems or infrastructure, or those of third parties with whom we do business, including as a result of cyber attacks; and other similar matters.
Forward-looking statements speak only as of the date they are made, and the Corporation undertakes no obligation to update any forward-looking statement to reflect the impact of circumstances or events that arise after the date the forward-looking statement was made.
Notes to the Consolidated Financial Statements referred to in the Management’s Discussion and Analysis of Financial Condition and Results of Operations (MD&A) are incorporated by reference into the MD&A. Certain prior-year amounts have been reclassified to conform to current-year presentation. Throughout the MD&A, the Corporation uses certain acronyms and abbreviations which are defined in the Glossary.
Executive Summary
Business Overview
The Corporation is a Delaware corporation, a bank holding company (BHC) and a financial holding company. When used in this report, “the Corporation” may refer to Bank of America Corporation individually, Bank of America Corporation and its subsidiaries, or certain of Bank of America Corporation’s subsidiaries or affiliates. Our principal executive offices are located in Charlotte, North Carolina. Through our banking and various nonbank subsidiaries throughout the U.S. and in international markets, we provide a diversified range of banking and nonbank financial services and products through five business segments: Consumer & Business Banking (CBB), Consumer Real Estate Services (CRES), Global Wealth & Investment Management (GWIM), Global Banking and Global Markets, with the remaining operations recorded in All Other. Effective January 1, 2015, to align the segments with how we manage the businesses in 2015, we changed our basis of segment presentation as follows: the Home Loans subsegment within CRES was moved to CBB, and Legacy Assets & Servicing became a separate segment. Also, a portion of the Business Banking business, based on the size of the client relationship, was moved from CBB to Global Banking. Prior periods will be restated to conform to the new segment alignment. Prior to October 1, 2014, we operated our banking activities primarily under two charters: Bank of America, National Association (Bank of America, N.A. or BANA) and, to a lesser extent, FIA Card Services, National Association (FIA Card Services, N.A. or FIA). On October 1, 2014, FIA was merged into BANA. At December 31, 2014, the Corporation had approximately $2.1 trillion in assets and approximately 224,000 full-time equivalent employees.
As of December 31, 2014, we operated in all 50 states, the District of Columbia, the U.S. Virgin Islands, Puerto Rico and more than 35 countries. Our retail banking footprint covers approximately 80 percent of the U.S. population and we serve approximately 48 million consumer and small business relationships with approximately 4,800 banking centers, 15,800 ATMs, nationwide call centers, and leading online and mobile banking platforms (www.bankofamerica.com). We offer industry-leading support to approximately three million small business owners. Our industry leading wealth management and trust businesses, with client balances of $2.5 trillion, provide tailored solutions to meet client needs through a full set of brokerage, banking, trust and retirement products. We are a global leader in corporate and investment banking and trading across a broad range of asset classes serving corporations, governments, institutions and individuals around the world.
2014 Economic and Business Environment
In the U.S., economic growth continued in 2014, ending the year in the midst of its sixth consecutive year of recovery. After a tentative and generally soft trajectory for five years where annualized GDP growth averaged 2.3 percent, there were clear
signs of accelerated growth in the final three quarters of 2014 following a first quarter impacted by adverse weather conditions. Employment gains picked up during the year, and the unemployment rate fell to 5.6 percent at year end. Consumption grew slowly early in the year, before picking up steadily and ending with a robust pace in the final quarter. Core inflation remained relatively unchanged in 2014, rising modestly in the first half and falling thereafter, and ended the year more than half a percentage point below the Board of Governors of the Federal Reserve System’s (Federal Reserve) longer-term annual target of two percent.
U.S. household net worth continued to rise in 2014 but at a substantially slower pace than 2013. Home price appreciation was less in 2014 than 2013 but prices still rose approximately five percent in 2014 while equity markets gained approximately 11 percent. However, consumer spending was more significantly enhanced by sharply lower oil prices late in the year, reflecting foreign economic weakness amid an ample and growing energy supply.
U.S. Treasury yields fell over the course of the year, reversing much of the previous year’s increase. Declining world inflation and interest rates helped push U.S. Treasury yields lower even as the Federal Reserve steadily reduced and finally ended its purchases of agency mortgage-backed securities (MBS) and long-term U.S. Treasury securities. The Federal Reserve ended the year amid indications that it can be patient with regard to normalizing monetary policy.
Internationally, the eurozone grew modestly for much of the year, with growth restrained by continued deleveraging of the financial sector, high unemployment and political uncertainty. Inflation in the eurozone also fell significantly to near zero by year end. European bond yields continued to decline, especially as the European Central Bank eased monetary policy and expectations grew late in the year for outright purchases of sovereign and/or corporate securities in 2015, and were subsequently confirmed to begin in March 2015. The Euro/U.S. Dollar exchange rate also fell significantly, boosting European competitiveness, particularly in the second half of 2014, in direct reaction to the differing directions of U.S. and eurozone monetary policies. Contentious negotiations between parties to Greek sovereign and bank support programs added to uncertainty and market volatility in the first quarter of 2015.
In Russia, the combination of the U.S. and European Union sanctions and sharply lower oil prices weakened growth. Select emerging nations that are net energy suppliers also saw growth diminish sharply, although we could still have exposure underother nations, including some emerging economies in Asia received some benefits from declining energy prices.
Following a quarter of strong economic growth ahead of a consumption tax increase, Japan contracted through the poolingmiddle of the year and servicing agreementsthe Bank of Japan responded with stepped up quantitative easing. Amid gradual economic moderation, China also eased monetary policy late in the year.
Selected Financial Data
Table 1 provides selected consolidated financial data for 2014 and 2013.
|
| | | | | | | |
| | | | |
| Table 1 | Selected Financial Data | | |
| | | | |
| (Dollars in millions, except per share information) | 2014 | 2013 |
| Income statement | |
| |
|
Revenue, net of interest expense (FTE basis) (1) | $ | 85,116 |
| $ | 89,801 |
|
| Net income | 4,833 |
| 11,431 |
|
| Diluted earnings per common share | 0.36 |
| 0.90 |
|
| Dividends paid per common share | 0.12 |
| 0.04 |
|
| Performance ratios | |
| |
|
| Return on average assets | 0.23 | % | 0.53 | % |
Return on average tangible common shareholders’ equity (1) | 2.52 |
| 6.97 |
|
Efficiency ratio (FTE basis) (1) | 88.25 |
| 77.07 |
|
| Asset quality | |
| |
|
| Allowance for loan and lease losses at December 31 | $ | 14,419 |
| $ | 17,428 |
|
Allowance for loan and lease losses as a percentage of total loans and leases outstanding at December 31 (2) | 1.65 | % | 1.90 | % |
Nonperforming loans, leases and foreclosed properties at December 31 (2) | $ | 12,629 |
| $ | 17,772 |
|
Net charge-offs (3) | 4,383 |
| 7,897 |
|
Net charge-offs as a percentage of average loans and leases outstanding (2, 3) | 0.49 | % | 0.87 | % |
Net charge-offs as a percentage of average loans and leases outstanding, excluding the purchased credit-impaired loan portfolio (2) | 0.50 |
| 0.90 |
|
Net charge-offs and purchased credit-impaired write-offs as a percentage of average loans and leases outstanding (2) | 0.58 |
| 1.13 |
|
Ratio of the allowance for loan and lease losses at December 31 to net charge-offs (3) | 3.29 |
| 2.21 |
|
| Ratio of the allowance for loan and lease losses at December 31 to net charge-offs, excluding the purchased credit-impaired loan portfolio | 2.91 |
| 1.89 |
|
| Ratio of the allowance for loan and lease losses at December 31 to net charge-offs and purchased credit-impaired write-offs | 2.78 |
| 1.70 |
|
| Balance sheet at year end | |
| |
|
| Total loans and leases | $ | 881,391 |
| $ | 928,233 |
|
| Total assets | 2,104,534 |
| 2,102,273 |
|
| Total deposits | 1,118,936 |
| 1,119,271 |
|
| Total common shareholders’ equity | 224,162 |
| 219,333 |
|
| Total shareholders’ equity | 243,471 |
| 232,685 |
|
Capital ratios at year end (4) | |
| |
|
| Common equity tier 1 capital | 12.3 | % | n/a |
|
| Tier 1 common capital | n/a |
| 10.9 | % |
| Tier 1 capital | 13.4 |
| 12.2 |
|
| Total capital | 16.5 |
| 15.1 |
|
| Tier 1 leverage | 8.2 |
| 7.7 |
|
| |
(1) | Fully taxable-equivalent (FTE) basis, return on average tangible common shareholders’ equity and the efficiency ratio are non-GAAP financial measures. Other companies may define or calculate these measures differently. For more information, see Supplemental Financial Data on page 32, and for corresponding reconciliations to GAAP financial measures, see Statistical Table XV. |
| |
(2) | Balances and ratios do not include loans accounted for under the fair value option. For additional exclusions from nonperforming loans, leases and foreclosed properties, see Consumer Portfolio Credit Risk Management – Nonperforming Consumer Loans, Leases and Foreclosed Properties Activity on page 82 and corresponding Table 39, and Commercial Portfolio Credit Risk Management – Nonperforming Commercial Loans, Leases and Foreclosed Properties Activity on page 89 and corresponding Table 48. |
| |
(3) | Net charge-offs exclude $810 million of write-offs in the purchased credit-impaired loan portfolio for 2014 compared to $2.3 billion for 2013. These write-offs decreased the purchased credit-impaired valuation allowance included as part of the allowance for loan and lease losses. For more information on purchased credit-impaired write-offs, see Consumer Portfolio Credit Risk Management – Purchased Credit-impaired Loan Portfolio on page 78. |
| |
(4) | On January 1, 2014, the Basel 3 rules became effective, subject to transition provisions primarily related to regulatory deductions and adjustments impacting Common equity tier 1 capital and Tier 1 capital. We reported under Basel 1 (which included the Market Risk Final Rules) atDecember 31, 2013. |
Financial Highlights
Net income was $4.8 billion, or $0.36 per diluted share in 2014 compared to $11.4 billion, or $0.90 per diluted share in 2013. The results for 2014 included an increase of $10.3 billion in litigation expense primarily as a result of charges related to the mortgagessettlements with the U.S. Department of Justice (DoJ) and the Federal Housing Finance Agency (FHFA).
|
| | | | | | | | |
| | | | | |
| Table 2 | Summary Income Statement | | | |
| | | |
| (Dollars in millions) | 2014 | | 2013 |
Net interest income (FTE basis) (1) | $ | 40,821 |
| | $ | 43,124 |
|
| Noninterest income | 44,295 |
| | 46,677 |
|
Total revenue, net of interest expense (FTE basis) (1) | 85,116 |
| | 89,801 |
|
| Provision for credit losses | 2,275 |
| | 3,556 |
|
| Noninterest expense | 75,117 |
| | 69,214 |
|
Income before income taxes (FTE basis) (1) | 7,724 |
| | 17,031 |
|
Income tax expense (FTE basis) (1) | 2,891 |
| | 5,600 |
|
| Net income | 4,833 |
| | 11,431 |
|
| Preferred stock dividends | 1,044 |
| | 1,349 |
|
| Net income applicable to common shareholders | $ | 3,789 |
| | $ | 10,082 |
|
| | | | | |
| Per common share information | | | |
| Earnings | $ | 0.36 |
| | $ | 0.94 |
|
| Diluted earnings | 0.36 |
| | 0.90 |
|
| |
(1) | FTE basis is a non-GAAP financial measure. For more information on this measure, see Supplemental Financial Data on page 32, and for a corresponding reconciliation to GAAP financial measures, see Statistical Table XV. |
Net Interest Income
Net interest income on a fully taxable-equivalent (FTE) basis decreased$2.3 billion to $40.8 billion for 2014 compared to 2013. The net interest yield on an FTE basis decreased12 basis points (bps) to 2.25 percent for 2014. These declines were primarily due to the acceleration of market-related premium amortization on debt securities as the decline in long-term interest rates shortened the expected lives of the securities. Also contributing to these declines were lower loan yields and consumer loan balances, lower net interest income from the asset and liability management (ALM) portfolio and a decrease in trading-related net interest income. Market-related premium amortization was an expense of $1.2 billion in 2014 compared to a benefit of $784 million in 2013. Partially offsetting these declines were reductions in funding yields, lower long-term debt balances and commercial loan growth.
Noninterest Income
|
| | | | | | | | |
| | | | | |
| Table 3 | Noninterest Income | | | |
| | | | | |
| (Dollars in millions) | 2014 | | 2013 |
| Card income | $ | 5,944 |
| | $ | 5,826 |
|
| Service charges | 7,443 |
| | 7,390 |
|
| Investment and brokerage services | 13,284 |
| | 12,282 |
|
| Investment banking income | 6,065 |
| | 6,126 |
|
| Equity investment income | 1,130 |
| | 2,901 |
|
| Trading account profits | 6,309 |
| | 7,056 |
|
| Mortgage banking income | 1,563 |
| | 3,874 |
|
| Gains on sales of debt securities | 1,354 |
| | 1,271 |
|
| Other income (loss) | 1,203 |
| | (49 | ) |
| Total noninterest income | $ | 44,295 |
| | $ | 46,677 |
|
Noninterest income decreased$2.4 billion to $44.3 billion for 2014 compared to 2013. The following highlights the significant changes.
| |
| Ÿ | Investment and brokerage services income increased$1.0 billion primarily driven by increased asset management fees driven by the impact of long-term assets under management (AUM) inflows and higher market levels. |
| |
| Ÿ | Equity investment income decreased$1.8 billion to $1.1 billion primarily due to a lower level of gains compared to 2013 and the continued wind-down of Global Principal Investments (GPI). |
| |
| Ÿ | Trading account profits decreased $747 million, which included a charge of $497 million in 2014 related to the adoption of a funding valuation adjustment (FVA) in Global Markets, partially offset by a $359 million change in net debit valuation adjustments (DVA) on derivatives. Excluding the FVA/DVA charges, trading account profits decreased $609 million due to both lower market volumes and volatility. |
| |
| Ÿ | Mortgage banking income decreased$2.3 billion primarily driven by lower servicing income and core production revenue, partially offset by lower representations and warranties provision. |
| |
| Ÿ | Other income (loss) improved $1.3 billion due to an increase of $1.1 billion in net DVA gains on structured liabilities as our spreads widened, and gains associated with the sales of residential mortgage loans, partially offset by increases in U.K. consumer payment protection insurance (PPI) costs. The prior year also included the write-down of $450 million on a monoline receivable. |
Provision for Credit Losses
The provision for credit losses decreased$1.3 billion to $2.3 billion for 2014 compared to 2013. The provision for credit losses was $2.1 billion lower than net charge-offs for 2014, resulting in a reduction in the Covered Trustsallowance for these issues.credit losses. The decrease from the prior year was driven by portfolio improvement, including increased home prices in the home loans portfolio and lower unemployment levels driving improvement in the credit card portfolios, and improved asset quality in the commercial portfolio. Partially offsetting this decline was $400 million of additional costs in 2014 associated with the consumer relief portion of the settlement with the DoJ. We expect reserve releases in 2015 to moderate when compared to 2014.
Net charge-offs totaled $4.4 billion, or 0.49 percent of average loans and leases for 2014 compared to $7.9 billion, or 0.87 percent for 2013. The decrease in net charge-offs was due to credit quality improvement across all major portfolios and the impact of increased recoveries primarily from nonperforming and delinquent loan sales. For more information on the provision for credit losses, see Provision for Credit Losses on page 95.
Noninterest Expense
|
| | | | | | | | |
| | | | | |
| Table 4 | Noninterest Expense | | | |
| | | | | |
| (Dollars in millions) | 2014 | | 2013 |
| Personnel | $ | 33,787 |
| | $ | 34,719 |
|
| Occupancy | 4,260 |
| | 4,475 |
|
| Equipment | 2,125 |
| | 2,146 |
|
| Marketing | 1,829 |
| | 1,834 |
|
| Professional fees | 2,472 |
| | 2,884 |
|
| Amortization of intangibles | 936 |
| | 1,086 |
|
| Data processing | 3,144 |
| | 3,170 |
|
| Telecommunications | 1,259 |
| | 1,593 |
|
| Other general operating | 25,305 |
| | 17,307 |
|
| Total noninterest expense | $ | 75,117 |
| | $ | 69,214 |
|
Noninterest expense increased$5.9 billion to $75.1 billion for 2014 compared to 2013 primarily driven by higher litigation expense in other general operating expense. Litigation expense increased $10.3 billion primarily as a result of charges related to the settlements with the DoJ and FHFA. The increase in litigation expense was partially offset by a decrease of $3.3 billion in default-related staffing and other default-related servicing expenses in Legacy Assets & Servicing. Also, personnel expense decreased$932 million in 2014 as we continued to streamline processes and achieve cost savings.
In connection with Project New BAC, which we first announced in the National Mortgage Settlement, BANA has agreedthird quarter of 2011, we expected to implementachieve cost savings in certain additional servicing changes. noninterest expense categories as we streamlined workflows, simplified processes and aligned expenses with our overall strategic plan and operating principles. We expected total cost savings from Project New BAC to reach $8 billion on an annualized basis, or $2 billion per quarter, by mid-2015. We successfully completed our Project New BAC expense program ahead of schedule by reaching our target of $2 billion in cost savings per quarter, in the third quarter of 2014.
Income Tax Expense
|
| | | | | | | | |
| | | | | |
| Table 5 | Income Tax Expense | | | |
| | | | | |
| (Dollars in millions) | 2014 | | 2013 |
| Income before income taxes | $ | 6,855 |
| | $ | 16,172 |
|
| Income tax expense | 2,022 |
| | 4,741 |
|
| Effective tax rate | 29.5 | % | | 29.3 | % |
The uniform servicing standards established undereffective tax rate for 2014 was driven by our recurring tax preference items, the National Mortgage Settlementresolution of several tax examinations and tax benefits from non-U.S. restructurings, partially offset by the non-deductible treatment of certain litigation charges. We expect an effective tax rate in the low 30 percent range, absent unusual items, for 2015.
The effective tax rate for 2013 was driven by our recurring tax preference items and by certain tax benefits related to non-U.S. operations, partially offset by the $1.1 billion negative impact from the U.K. 2013 Finance Act, enacted in July 2013, which reduced the U.K. corporate income tax rate by three percent. The $1.1 billion charge resulted from remeasuring our U.K. net deferred tax assets, in the period of enactment, using the lower rates.
Balance Sheet Overview
|
| | | | | | | | | | | | | | | | | | | | | | |
| | | | | | | | | | | | | |
| Table 6 | Selected Balance Sheet Data | | | | | | | | | | | |
| | | | | | | | | | | | | |
| | | December 31 | | | | Average Balance | | |
| (Dollars in millions) | 2014 | | 2013 | | % Change | | 2014 | | 2013 | | % Change |
| Assets | |
| | |
| | | | |
| | |
| | |
| Cash and cash equivalents | $ | 138,589 |
| | $ | 131,322 |
| | 6 | % | | $ | 141,078 |
| | $ | 109,014 |
| | 29 | % |
| Federal funds sold and securities borrowed or purchased under agreements to resell | 191,823 |
| | 190,328 |
| | 1 |
| | 222,483 |
| | 224,331 |
| | (1 | ) |
| Trading account assets | 191,785 |
| | 200,993 |
| | (5 | ) | | 202,416 |
| | 217,865 |
| | (7 | ) |
| Debt securities | 380,461 |
| | 323,945 |
| | 17 |
| | 351,702 |
| | 337,953 |
| | 4 |
|
| Loans and leases | 881,391 |
| | 928,233 |
| | (5 | ) | | 903,901 |
| | 918,641 |
| | (2 | ) |
| Allowance for loan and lease losses | (14,419 | ) | | (17,428 | ) | | (17 | ) | | (15,973 | ) | | (21,188 | ) | | (25 | ) |
| All other assets | 334,904 |
| | 344,880 |
| | (3 | ) | | 339,983 |
| | 376,897 |
| | (10 | ) |
| Total assets | $ | 2,104,534 |
| | $ | 2,102,273 |
| | — |
| | $ | 2,145,590 |
| | $ | 2,163,513 |
| | (1 | ) |
| Liabilities | |
| | |
| | | | |
| | |
| | |
| Deposits | $ | 1,118,936 |
| | $ | 1,119,271 |
| | — |
| | $ | 1,124,207 |
| | $ | 1,089,735 |
| | 3 |
|
| Federal funds purchased and securities loaned or sold under agreements to repurchase | 201,277 |
| | 198,106 |
| | 2 |
| | 215,792 |
| | 257,600 |
| | (16 | ) |
| Trading account liabilities | 74,192 |
| | 83,469 |
| | (11 | ) | | 87,151 |
| | 88,323 |
| | (1 | ) |
| Short-term borrowings | 31,172 |
| | 45,999 |
| | (32 | ) | | 41,886 |
| | 43,816 |
| | (4 | ) |
| Long-term debt | 243,139 |
| | 249,674 |
| | (3 | ) | | 253,607 |
| | 263,417 |
| | (4 | ) |
| All other liabilities | 192,347 |
| | 173,069 |
| | 11 |
| | 184,471 |
| | 186,675 |
| | (1 | ) |
| Total liabilities | 1,861,063 |
| | 1,869,588 |
| | — |
| | 1,907,114 |
| | 1,929,566 |
| | (1 | ) |
| Shareholders’ equity | 243,471 |
| | 232,685 |
| | 5 |
| | 238,476 |
| | 233,947 |
| | 2 |
|
| Total liabilities and shareholders’ equity | $ | 2,104,534 |
| | $ | 2,102,273 |
| | — |
| | $ | 2,145,590 |
| | $ | 2,163,513 |
| | (1 | ) |
Year-end balance sheet amounts may vary from average balance sheet amounts due to liquidity and balance sheet management activities, primarily involving our portfolios of highly liquid assets. These portfolios are broadly consistentdesigned to ensure the adequacy of capital while enhancing our ability to manage liquidity requirements for the Corporation and our customers, and to position the balance sheet in accordance with the Corporation’s risk appetite. The execution of these activities requires the use of balance sheet and capital-related limits including spot, average and risk-weighted asset limits, particularly within the market-making activities of our trading businesses. One of our key regulatory metrics, Tier 1 leverage ratio, is calculated based on adjusted quarterly average total assets.
Balance Sheet Management Actions in 2014
The Corporation took certain actions during 2014 to further optimize its balance sheet. While the overall size of the balance sheet remained relatively unchanged compared to December 31, 2013, the composition has improved in terms of liquidity in response to the new Basel 3 Liquidity Coverage Ratio (LCR) requirements. We shifted the mix of certain discretionary assets out of less liquid loans to more liquid debt securities. This included the sale of $10.7 billion of residential mortgage servicing practices imposedloans with standby insurance agreements and purchase of agency securities, and the sale of $6.7 billion of nonperforming and other delinquent loans. Though the Global Markets balance sheet was relatively stable, there was a decrease of $11.8 billion in low-margin prime brokerage loans. Ending deposits remained relatively unchanged
as we took actions to optimize the LCR liquidity value of deposits while growing retail deposits. Additionally, from a capital standpoint, $6.0 billion of preferred stock was issued during the year and amendments to our outstanding Series T preferred stock also improved Basel 3 Tier 1 regulatory capital.
Assets
Year-end total assets remained relatively unchanged from December 31, 2013, though the asset mix changed in connection with preparing for the new Basel 3 LCR requirements as discussed above. The key drivers were increased debt securities due to purchases of U.S. Treasury securities, and higher cash and cash equivalents from higher interest-bearing deposits with the Federal Reserve and non-U.S. central banks. These increases were largely offset by a decline in consumer loan balances due to paydowns, sales of residential loans with long-term standby agreements, nonperforming and delinquent loan sales and net charge-offs collectively outpacing new originations, and declines in all other assets and in trading account assets.
Cash and Cash Equivalents
Year-end and average cash and cash equivalents increased $7.3 billion from December 31, 2013 and $32.1 billion in 2014 driven by an increase in interest-bearing deposits with the Federal Reserve and non-U.S. central banks in connection with preparing for the Basel 3 LCR requirements. For more information, see Liquidity Risk – Basel 3 Liquidity Standards on page 67.
Federal Funds Sold and Securities Borrowed or Purchased Under Agreements to Resell
Federal funds transactions involve lending reserve balances on a short-term basis. Securities borrowed or purchased under agreements to resell are collateralized lending transactions utilized to accommodate customer transactions, earn interest rate spreads, and obtain securities for settlement and for collateral. Year-end federal funds sold and securities borrowed or purchased under agreements to resell increased $1.5 billion from December 31, 2013 driven by matched-book activity, partially offset by roll-off of supranational positions and a mix shift into securities. Average federal funds sold and securities borrowed or purchased under agreements to resell decreased $1.8 billion in 2014 compared to 2013 due to lower matched-book activity.
Trading Account Assets
Trading account assets consist primarily of long positions in equity and fixed-income securities including U.S. government and agency securities, corporate securities and non-U.S. sovereign debt. Year-end trading account assets decreased $9.2 billion primarily due to lower equity securities inventory as a result of a decrease in client hedging activity. Average trading account assets decreased $15.4 billion primarily due to a reduction in U.S. Treasury securities inventory.
Debt Securities
Debt securities primarily include U.S. Treasury and agency securities, MBS, principally agency MBS, foreign bonds, corporate bonds and municipal debt. We use the debt securities portfolio primarily to manage interest rate and liquidity risk and to take advantage of market conditions that create economically attractive returns on these investments. Year-end and average debt securities increased $56.5 billion and $13.7 billion primarily due to net purchases of U.S. Treasury securities driven by the 2011 OCC Consent Order; however, they arenew LCR rules, and increases in the fair value of available-for-sale (AFS) debt securities resulting from the impact of lower interest rates. For more prescriptiveinformation on debt securities, see Note 3 – Securities to the Consolidated Financial Statements.
Loans and coverLeases
Year-end and average loans and leases decreased $46.8 billion and $14.7 billion. The decreases were primarily driven by a broader rangedecline in consumer loan balances due to paydowns, loan sales and net charge-offs outpacing new originations, and a decline in commercial loan balances. For more information on the loan portfolio, see Credit Risk Management on page 70.
Allowance for Loan and Lease Losses
Year-end and average allowance for loan and lease losses decreased $3.0 billion and $5.2 billion primarily due to the impact of our residential mortgage servicing activities. These standards are intended to strengthen procedural safeguardsimprovements in credit quality from the improving economy. For more information, see Allowance for Credit Losses on page 95.
All Other Assets
Year-end all other assets decreased $10.0 billion driven by other earning assets and documentation requirements associated with foreclosure, bankruptcytime deposits placed, partially offset by an increase in derivative assets. Average all other assets decreased $36.9 billion primarily driven by lower customer and loss mitigation activities,other receivables, time deposits placed, loans held-for-sale (LHFS) and derivative assets.
Liabilities
At December 31, 2014, total liabilities were approximately $1.9 trillion, down $8.5 billion from December 31, 2013, driven by planned reductions in short-term borrowings and long-term debt as well as addressinga decrease in trading account liabilities, partially offset by increases in all other liabilities.
Deposits
Year-end deposits remained relatively unchanged from December 31, 2013 due to declines in Global Banking offset by an increase in retail deposits. Average deposits increased $34.5 billion primarily driven by customer and client shifts into more liquid products in the impositionlow rate environment.
Federal Funds Purchased and Securities Loaned or Sold Under Agreements to Repurchase
Federal funds transactions involve borrowing reserve balances on a short-term basis. Securities loaned or sold under agreements to repurchase are collateralized borrowing transactions utilized to accommodate customer transactions, earn interest rate spreads and finance assets on the balance sheet. Year-end federal funds purchased and securities loaned or sold under agreements to repurchase increased $3.2 billion primarily driven by matched-book activity. Average federal funds purchased and securities loaned or sold under agreements to repurchase decreased $41.8 billion primarily due to targeted reductions in the balance sheet.
Trading Account Liabilities
Trading account liabilities consist primarily of feesshort positions in equity and fixed-income securities including U.S. Treasury and agency securities, corporate securities, and non-U.S. sovereign debt. Year-end and average trading account liabilities decreased $9.3 billion and $1.2 billion primarily due to lower levels of short U.S. Treasury positions.
Short-term Borrowings
Short-term borrowings provide an additional funding source and primarily consist of Federal Home Loan Bank (FHLB) short-term borrowings, notes payable and various other borrowings that generally have maturities of one year or less. Year-end and average short-term borrowings decreased $14.8 billion and $1.9 billion due to planned reductions in FHLB borrowings. For more information on short-term borrowings, see Note 10 – Federal Funds Sold or Purchased, Securities Financing Agreements and Short-term Borrowings to the Consolidated Financial Statements.
Long-term Debt
Year-end and average long-term debt decreased $6.5 billion and $9.8 billion. The decreases were a result of maturities outpacing new issuances. For more information on long-term debt, see Note 11 – Long-term Debt to the Consolidated Financial Statements.
All Other Liabilities
Year-end all other liabilities increased $19.3 billion driven by increases in derivative liabilities and payables. Average all other liabilities decreased $2.2 billion driven by decreases in payables and derivative liabilities.
Shareholders’ Equity
Year-end shareholders’ equity increased $10.8 billion driven by issuances of preferred stock, an increase in accumulated other comprehensive income (OCI) due to a positive net change in the fair value of AFS debt securities, and earnings, partially offset by common stock repurchases and dividends. Average shareholders’ equity increased $4.5 billion driven by earnings and accumulated OCI, partially offset by common stock repurchases and dividends.
Cash Flows Overview
The Corporation’s operating assets and liabilities support our global markets and lending activities. We believe that cash flows from operations, available cash balances and our ability to generate cash through short- and long-term debt are sufficient to fund our operating liquidity needs. Our investing activities primarily include the debt securities portfolio and other short-term investments. Our financing activities reflect cash flows primarily related to increased customer deposits and net long-term debt reductions.
Cash and cash equivalents increased$7.3 billion during 2014 due to net cash provided by operating activities, partially offset by net cash used in financing and investing activities. This reflects actions taken in preparation for the Basel 3 LCR requirements. These changes were primarily due to higher interest-bearing deposits with the Federal Reserve and non-U.S. central banks as well as the sale of residential mortgage loans with standby insurance agreements and the integritypurchase of documentation,agency securities, and the sale of nonperforming and other delinquent loans to further
optimize the balance sheet. Cash and cash equivalents increased$20.6 billion during 2013 due to net cash provided by operating and investing activities, partially offset by net cash used in financing activities.
During 2014, net cash provided by operating activities was $26.7 billion. The more significant drivers included net decreases in trading and derivative instruments, as well as a net increase in accrued expenses and other liabilities. During 2013, net cash provided by operating activities was $92.8 billion. The more significant drivers included net decreases in other assets, and trading and derivative instruments, as well as net proceeds from sales, securitizations and paydowns of LHFS.
During 2014, net cash used in investing activities was $4.2 billion, primarily driven by net purchases of debt securities, partially offset by net decreases in loans and leases. During 2013, net cash provided by investing activities was $25.1 billion, primarily driven by a decrease in federal funds sold and securities borrowed or purchased under agreements to resell and net sales of debt securities, partially offset by a net increase in loans and leases.
During 2014, net cash used in financing activities of $12.2 billion primarily reflected a reduction in short-term borrowings, partially offset by the issuance of preferred stock. During 2013, the net cash used in financing activities of $95.4 billion primarily reflected a decrease in federal funds purchased and securities loaned or sold under agreements to repurchase and net reductions in long-term debt, partially offset by growth in short-term borrowings and deposits.
|
| | | | | | | | | | | | | | | | | | | | |
| | | | | | | | | | | |
| Table 7 | Five-year Summary of Selected Financial Data | | | | | | | | | |
| | | | | | | | | | | |
| (In millions, except per share information) | 2014 | | 2013 | | 2012 | | 2011 | | 2010 |
| Income statement | | | | | |
| | |
| | |
|
| Net interest income | $ | 39,952 |
| | $ | 42,265 |
| | $ | 40,656 |
| | $ | 44,616 |
| | $ | 51,523 |
|
| Noninterest income | 44,295 |
| | 46,677 |
| | 42,678 |
| | 48,838 |
| | 58,697 |
|
| Total revenue, net of interest expense | 84,247 |
| | 88,942 |
| | 83,334 |
| | 93,454 |
| | 110,220 |
|
| Provision for credit losses | 2,275 |
| | 3,556 |
| | 8,169 |
| | 13,410 |
| | 28,435 |
|
| Goodwill impairment | — |
| | — |
| | — |
| | 3,184 |
| | 12,400 |
|
| Merger and restructuring charges | — |
| | — |
| | — |
| | 638 |
| | 1,820 |
|
| All other noninterest expense | 75,117 |
| | 69,214 |
| | 72,093 |
| | 76,452 |
| | 68,888 |
|
| Income (loss) before income taxes | 6,855 |
| | 16,172 |
| | 3,072 |
| | (230 | ) | | (1,323 | ) |
| Income tax expense (benefit) | 2,022 |
| | 4,741 |
| | (1,116 | ) | | (1,676 | ) | | 915 |
|
| Net income (loss) | 4,833 |
| | 11,431 |
| | 4,188 |
| | 1,446 |
| | (2,238 | ) |
| Net income (loss) applicable to common shareholders | 3,789 |
| | 10,082 |
| | 2,760 |
| | 85 |
| | (3,595 | ) |
| Average common shares issued and outstanding | 10,528 |
| | 10,731 |
| | 10,746 |
| | 10,143 |
| | 9,790 |
|
Average diluted common shares issued and outstanding (1) | 10,585 |
| | 11,491 |
| | 10,841 |
| | 10,255 |
| | 9,790 |
|
| Performance ratios | |
| | |
| | |
| | |
| | |
|
| Return on average assets | 0.23 | % | | 0.53 | % | | 0.19 | % | | 0.06 | % | | n/m |
|
| Return on average common shareholders’ equity | 1.70 |
| | 4.62 |
| | 1.27 |
| | 0.04 |
| | n/m |
|
Return on average tangible common shareholders’ equity (2) | 2.52 |
| | 6.97 |
| | 1.94 |
| | 0.06 |
| | n/m |
|
Return on average tangible shareholders’ equity (2) | 2.92 |
| | 7.13 |
| | 2.60 |
| | 0.96 |
| | n/m |
|
| Total ending equity to total ending assets | 11.57 |
| | 11.07 |
| | 10.72 |
| | 10.81 |
| | 10.08 | % |
| Total average equity to total average assets | 11.11 |
| | 10.81 |
| | 10.75 |
| | 9.98 |
| | 9.56 |
|
| Dividend payout | 33.31 |
| | 4.25 |
| | 15.86 |
| | n/m |
| | n/m |
|
| Per common share data | |
| | |
| | |
| | |
| | |
|
| Earnings (loss) | $ | 0.36 |
| | $ | 0.94 |
| | $ | 0.26 |
| | $ | 0.01 |
| | $ | (0.37 | ) |
Diluted earnings (loss) (1) | 0.36 |
| | 0.90 |
| | 0.25 |
| | 0.01 |
| | (0.37 | ) |
| Dividends paid | 0.12 |
| | 0.04 |
| | 0.04 |
| | 0.04 |
| | 0.04 |
|
| Book value | 21.32 |
| | 20.71 |
| | 20.24 |
| | 20.09 |
| | 20.99 |
|
Tangible book value (2) | 14.43 |
| | 13.79 |
| | 13.36 |
| | 12.95 |
| | 12.98 |
|
| Market price per share of common stock | |
| | |
| | | | |
| | |
|
| Closing | $ | 17.89 |
| | $ | 15.57 |
| | $ | 11.61 |
| | $ | 5.56 |
| | $ | 13.34 |
|
| High closing | 18.13 |
| | 15.88 |
| | 11.61 |
| | 15.25 |
| | 19.48 |
|
| Low closing | 14.51 |
| | 11.03 |
| | 5.80 |
| | 4.99 |
| | 10.95 |
|
| Market capitalization | $ | 188,141 |
| | $ | 164,914 |
| | $ | 125,136 |
| | $ | 58,580 |
| | $ | 134,536 |
|
| |
(1) | The diluted earnings (loss) per common share excluded the effect of any equity instruments that are antidilutive to earnings per share. There were no potential common shares that were dilutive in 2010 because of the net loss applicable to common shareholders. |
| |
(2) | Tangible equity ratios and tangible book value per share of common stock are non-GAAP financial measures. Other companies may define or calculate these measures differently. For more information on these ratios, see Supplemental Financial Data on page 32, and for corresponding reconciliations to GAAP financial measures, see Statistical Table XV on page 134. |
| |
(3) | For more information on the impact of the purchased credit-impaired loan portfolio on asset quality, see Consumer Portfolio Credit Risk Management on page 70. |
| |
(4) | Includes the allowance for loan and lease losses and the reserve for unfunded lending commitments. |
| |
(5) | Balances and ratios do not include loans accounted for under the fair value option. For additional exclusions from nonperforming loans, leases and foreclosed properties, see Consumer Portfolio Credit Risk Management – Nonperforming Consumer Loans, Leases and Foreclosed Properties Activity on page 82 and corresponding Table 39, and Commercial Portfolio Credit Risk Management – Nonperforming Commercial Loans, Leases and Foreclosed Properties Activity on page 89 and corresponding Table 48. |
| |
(6) | Primarily includes amounts allocated to the U.S. credit card and unsecured consumer lending portfolios in CBB, purchased credit-impaired loans and the non-U.S. credit card portfolio in All Other. |
| |
(7) | Net charge-offs exclude $810 million, $2.3 billion and $2.8 billion of write-offs in the purchased credit-impaired loan portfolio for 2014, 2013 and 2012, respectively. These write-offs decreased the purchased credit-impaired valuation allowance included as part of the allowance for loan and lease losses. For more information on purchased credit-impaired write-offs, see Consumer Portfolio Credit Risk Management – Purchased Credit-impaired Loan Portfolio on page 78. |
| |
(8) | There were no write-offs of PCI loans in 2011 and 2010. |
| |
(9) | On January 1, 2014, the Basel 3 rules became effective, subject to transition provisions primarily related to regulatory deductions and adjustments impacting Common equity tier 1 capital and Tier 1 capital. We reported under Basel 1 (which included the Market Risk Final Rules) atDecember 31, 2013. Basel 1 did not include the Basel 1 – 2013 Rules prior to 2013. |
n/a = not applicable
n/m = not meaningful
|
| | | | | | | | | | | | | | | | | | | | |
| | | | | | | | | | | |
| Table 7 | Five-year Summary of Selected Financial Data (continued) |
| | | | | | | | | | | |
| (Dollars in millions) | 2014 | | 2013 | | 2012 | | 2011 | | 2010 |
| Average balance sheet | |
| | |
| | |
| | |
| | |
|
| Total loans and leases | $ | 903,901 |
| | $ | 918,641 |
| | $ | 898,768 |
| | $ | 938,096 |
| | $ | 958,331 |
|
| Total assets | 2,145,590 |
| | 2,163,513 |
| | 2,191,356 |
| | 2,296,322 |
| | 2,439,606 |
|
| Total deposits | 1,124,207 |
| | 1,089,735 |
| | 1,047,782 |
| | 1,035,802 |
| | 988,586 |
|
| Long-term debt | 253,607 |
| | 263,417 |
| | 316,393 |
| | 421,229 |
| | 490,497 |
|
| Common shareholders’ equity | 223,066 |
| | 218,468 |
| | 216,996 |
| | 211,709 |
| | 212,686 |
|
| Total shareholders’ equity | 238,476 |
| | 233,947 |
| | 235,677 |
| | 229,095 |
| | 233,235 |
|
Asset quality (3) | |
| | |
| | |
| | |
| | |
|
Allowance for credit losses (4) | $ | 14,947 |
| | $ | 17,912 |
| | $ | 24,692 |
| | $ | 34,497 |
| | $ | 43,073 |
|
Nonperforming loans, leases and foreclosed properties (5) | 12,629 |
| | 17,772 |
| | 23,555 |
| | 27,708 |
| | 32,664 |
|
Allowance for loan and lease losses as a percentage of total loans and leases outstanding (5) | 1.65 | % | | 1.90 | % | | 2.69 | % | | 3.68 | % | | 4.47 | % |
Allowance for loan and lease losses as a percentage of total nonperforming loans and leases (5) | 121 |
| | 102 |
| | 107 |
| | 135 |
| | 136 |
|
Allowance for loan and lease losses as a percentage of total nonperforming loans and leases, excluding the PCI loan portfolio (5) | 107 |
| | 87 |
| | 82 |
| | 101 |
| | 116 |
|
Amounts included in allowance for loan and lease losses for loans and leases that are excluded from nonperforming loans and leases (6) | $ | 5,944 |
| | $ | 7,680 |
| | $ | 12,021 |
| | $ | 17,490 |
| | $ | 22,908 |
|
Allowance for loan and lease losses as a percentage of total nonperforming loans and leases, excluding the allowance for loan and lease losses for loans and leases that are excluded from nonperforming loans and leases (5, 6) | 71 | % | | 57 | % | | 54 | % | | 65 | % | | 62 | % |
Net charge-offs (7) | $ | 4,383 |
| | $ | 7,897 |
| | $ | 14,908 |
| | $ | 20,833 |
| | $ | 34,334 |
|
Net charge-offs as a percentage of average loans and leases outstanding (5, 7) | 0.49 | % | | 0.87 | % | | 1.67 | % | | 2.24 | % | | 3.60 | % |
Net charge-offs as a percentage of average loans and leases outstanding, excluding the PCI loan portfolio (5) | 0.50 |
| | 0.90 |
| | 1.73 |
| | 2.32 |
| | 3.73 |
|
Net charge-offs and PCI write-offs as a percentage of average loans and leases outstanding (5, 8) | 0.58 |
| | 1.13 |
| | 1.99 |
| | 2.24 |
| | 3.60 |
|
Nonperforming loans and leases as a percentage of total loans and leases outstanding (5) | 1.37 |
| | 1.87 |
| | 2.52 |
| | 2.74 |
| | 3.27 |
|
Nonperforming loans, leases and foreclosed properties as a percentage of total loans, leases and foreclosed properties (5) | 1.45 |
| | 1.93 |
| | 2.62 |
| | 3.01 |
| | 3.48 |
|
Ratio of the allowance for loan and lease losses at December 31 to net charge-offs (7) | 3.29 |
| | 2.21 |
| | 1.62 |
| | 1.62 |
| | 1.22 |
|
| Ratio of the allowance for loan and lease losses at December 31 to net charge-offs, excluding the PCI loan portfolio | 2.91 |
| | 1.89 |
| | 1.25 |
| | 1.22 |
| | 1.04 |
|
Ratio of the allowance for loan and lease losses at December 31 to net charge-offs and PCI write-offs (8) | 2.78 |
| | 1.70 |
| | 1.36 |
| | 1.62 |
| | 1.22 |
|
Capital ratios at year end (9) | |
| | |
| | |
| | |
| | |
|
| Risk-based capital: | |
| | |
| | |
| | |
| | |
|
| Common equity tier 1 capital | 12.3 | % | | n/a |
| | n/a |
| | n/a |
| | n/a |
|
| Tier 1 common capital | n/a |
| | 10.9 | % | | 10.8 | % | | 9.7 | % | | 8.5 | % |
| Tier 1 capital | 13.4 |
| | 12.2 |
| | 12.7 |
| | 12.2 |
| | 11.1 |
|
| Total capital | 16.5 |
| | 15.1 |
| | 16.1 |
| | 16.6 |
| | 15.7 |
|
| Tier 1 leverage | 8.2 |
| | 7.7 |
| | 7.2 |
| | 7.4 |
| | 7.1 |
|
Tangible equity (2) | 8.4 |
| | 7.9 |
| | 7.6 |
| | 7.5 |
| | 6.8 |
|
Tangible common equity (2) | 7.5 |
| | 7.2 |
| | 6.7 |
| | 6.6 |
| | 6.0 |
|
For footnotes see page 30.
Supplemental Financial Data
We view net interest income and related ratios and analyses on an FTE basis, which when presented on a consolidated basis, are non-GAAP financial measures. We believe managing the business with net interest income on an FTE basis provides a more accurate picture of the interest margin for comparative purposes. To derive the FTE basis, net interest income is adjusted to reflect tax-exempt income on an equivalent before-tax basis with a goalcorresponding increase in income tax expense. For purposes of ensuring greater transparencythis calculation, we use the federal statutory tax rate of 35 percent. This measure ensures comparability of net interest income arising from taxable and tax-exempt sources.
Certain performance measures including the efficiency ratio and net interest yield utilize net interest income (and thus total revenue) on an FTE basis. The efficiency ratio measures the costs expended to generate a dollar of revenue, and net interest yield measures the bps we earn over the cost of funds.
We also evaluate our business based on certain ratios that utilize tangible equity, a non-GAAP financial measure. Tangible equity represents an adjusted shareholders’ equity or common shareholders’ equity amount which has been reduced by goodwill and intangible assets (excluding mortgage servicing rights (MSRs)), net of related deferred tax liabilities. These measures are used to evaluate our use of equity. In addition, profitability, relationship and investment models use both return on average tangible common shareholders’ equity and return on average tangible shareholders’ equity as key measures to support our overall growth goals. These ratios are as follows:
| |
| Ÿ | Return on average tangible common shareholders’ equity measures our earnings contribution as a percentage of adjusted common shareholders’ equity. The tangible common equity ratio represents adjusted ending common shareholders’ equity divided by total assets less goodwill and intangible assets (excluding MSRs), net of related deferred tax liabilities. |
| |
| Ÿ | Return on average tangible shareholders’ equity measures our earnings contribution as a percentage of adjusted average total shareholders’ equity. The tangible equity ratio represents adjusted ending shareholders’ equity divided by total assets less goodwill and intangible assets (excluding MSRs), net of related deferred tax liabilities. |
| |
| Ÿ | Tangible book value per common share represents adjusted ending common shareholders’ equity divided by ending common shares outstanding. |
The aforementioned supplemental data and performance measures are presented in Table 7 and Statistical Table XII. In addition, in Table 8, we have excluded the impact of goodwill impairment charges of $3.2 billion and $12.4 billion recorded in 2011 and 2010 when presenting certain of these metrics. Accordingly, these are non-GAAP financial measures.
We evaluate our business segment results based on measures that utilize average allocated capital. Return on average allocated capital is calculated as net income adjusted for borrowers. These uniform servicing standards also obligate uscost of funds and earnings credits and certain expenses related to implement compliance processes reasonably designedintangibles, divided by average allocated capital. Allocated capital and the related return both represent non-GAAP financial measures. In addition, for purposes of goodwill impairment testing, the Corporation utilizes allocated equity as a proxy for the carrying value of its reporting units. Allocated equity in the reporting units is comprised of allocated capital plus capital for the portion of goodwill and intangibles specifically assigned to the reporting unit. For additional information, see Business Segment Operations on page 34 and Note 8 – Goodwill and Intangible Assets to the Consolidated Financial Statements.
Statistical Tables XV, XVI and XVII on pages 134, 135 and 136provide assurancereconciliations of these non-GAAP financial measures to GAAP financial measures. We believe the use of these non-GAAP financial measures provides additional clarity in assessing the results of the achievementCorporation and our segments. Other companies may define or calculate these measures and ratios differently.
|
| | | | | | | | | | | | | | | | | | | | |
| | | | | | | | | | | |
| Table 8 | Five-year Supplemental Financial Data | | | | | | | | | |
| | | | | | | | | | | |
| (Dollars in millions, except per share information) | 2014 | | 2013 | | 2012 | | 2011 | | 2010 |
| Fully taxable-equivalent basis data | |
| | |
| | |
| | |
| | |
|
| Net interest income | $ | 40,821 |
| | $ | 43,124 |
| | $ | 41,557 |
| | $ | 45,588 |
| | $ | 52,693 |
|
| Total revenue, net of interest expense | 85,116 |
| | 89,801 |
| | 84,235 |
| | 94,426 |
| | 111,390 |
|
Net interest yield (1) | 2.25 | % | | 2.37 | % | | 2.24 | % | | 2.38 | % | | 2.59 | % |
| Efficiency ratio | 88.25 |
| | 77.07 |
| | 85.59 |
| | 85.01 |
| | 74.61 |
|
Performance ratios, excluding goodwill impairment charges (2) | |
| | |
| | |
| | |
| | |
|
| Per common share information | |
| | |
| | |
| | |
| | |
|
| Earnings | | | | | | | $ | 0.32 |
| | $ | 0.87 |
|
| Diluted earnings | | | | | | | 0.32 |
| | 0.86 |
|
| Efficiency ratio (FTE basis) | | | | | | | 81.64 | % | | 63.48 | % |
| Return on average assets | | | | | | | 0.20 |
| | 0.42 |
|
| Return on average common shareholders’ equity | | | | | | | 1.54 |
| | 4.14 |
|
| Return on average tangible common shareholders’ equity | | | | | | | 2.46 |
| | 7.03 |
|
| Return on average tangible shareholders’ equity | | | | | | | 3.08 |
| | 7.11 |
|
| |
(1) | Beginning in 2014, interest-bearing deposits placed with the Federal Reserve and certain non-U.S. central banks are included in earning assets. In prior periods, these balances were included with cash and due from banks in the cash and cash equivalents line, consistent with the Consolidated Balance Sheet presentation. Prior periods have been reclassified to conform to current period presentation. |
| |
(2) | Performance ratios are calculated excluding the impact of goodwill impairment charges of $3.2 billion and $12.4 billion recorded in 2011 and 2010. |
Net Interest Income Excluding Trading-related Net Interest Income
We manage net interest income on an FTE basis and excluding the impact of these objectives. Compliancetrading-related activities. As discussed in Global Markets on page 46, we evaluate our sales and trading results and strategies on a total market-based revenue approach by combining net interest income and noninterest income for Global Markets. An analysis of net interest income, average earning assets and net interest yield on earning assets, all of which adjust for the impact of trading-related net interest income from reported net interest income on an FTE basis, is shown below. We believe the use of this non-GAAP presentation in Table 9 provides additional clarity in assessing our results.
|
| | | | | | | | |
| | | | | |
| Table 9 | Net Interest Income Excluding Trading-related Net Interest Income |
| | | | | |
| (Dollars in millions) | 2014 | | 2013 |
| Net interest income (FTE basis) | |
| | |
|
| As reported | $ | 40,821 |
| | $ | 43,124 |
|
| Impact of trading-related net interest income | (3,615 | ) | | (3,852 | ) |
Net interest income excluding trading-related net interest income (1) | $ | 37,206 |
| | $ | 39,272 |
|
Average earning assets (2) | |
| | |
|
| As reported | $ | 1,814,930 |
| | $ | 1,819,548 |
|
| Impact of trading-related earning assets | (445,760 | ) | | (468,999 | ) |
Average earning assets excluding trading-related earning assets (1) | $ | 1,369,170 |
| | $ | 1,350,549 |
|
Net interest yield contribution (FTE basis) (2) | |
| | |
|
| As reported | 2.25 | % | | 2.37 | % |
| Impact of trading-related activities | 0.47 |
| | 0.54 |
|
Net interest yield on earning assets excluding trading-related activities (1) | 2.72 | % | | 2.91 | % |
| |
(1) | Represents a non-GAAP financial measure. |
| |
(2) | Beginning in 2014, interest-bearing deposits placed with the Federal Reserve and certain non-U.S. central banks are included in earning assets. In prior periods, these balances were included with cash and due from banks in the cash and cash equivalents line, consistent with the Consolidated Balance Sheet presentation. Prior periods have been reclassified to conform to current period presentation. |
Net interest income excluding trading-related net interest income decreased $2.1 billion to $37.2 billion for 2014 compared to 2013. The decline was primarily due to the impact of market-related premium amortization as lower long-term interest rates shortened the expected lives of the securities, lower loan yields and consumer loan balances, and lower net interest income from the ALM portfolio. Market-related premium amortization was an expense of $1.2 billion in 2014 compared to a benefit of $784 million in 2013. Partially offsetting the decline were reductions in funding yields, lower long-term debt balances and commercial loan growth. For more information on the impact of interest rates, see Interest Rate Risk Management for Non-trading Activities on page 105. For more information on market-related premium amortization, see Note 1 – Summary of Significant Accounting Principles to the Consolidated Financial Statements.
Average earning assets excluding trading-related earning assets increased$18.6 billion to $1,369.2 billion for 2014 compared to 2013. The increase was primarily in interest-bearing deposits with the uniform servicing standards is being assessedFederal Reserve and commercial loans, partially offset by declines in consumer loans and other earning assets.
Net interest yield on earning assets excluding trading-related activities decreased19 bps to 2.72 percent for 2014 compared to 2013 due to the same factors as described above.
Business Segment Operations
Segment Description and Basis of Presentation
We report the results of our operations through five business segments: CBB, CRES, GWIM, Global Banking and Global Markets, with the remaining operations recorded in All Other. The primary activities, products or businesses of the business segments and All Other as of December 31, 2014 are shown below. For additional detailed information, see the business segment and All Other discussions which follow.
Effective January 1, 2015, to align the segments with how we manage the businesses in 2015, the Corporation changed its basis of segment presentation as follows: the Home Loans subsegment within CRES was moved to CBB, and Legacy Assets & Servicing became a monitorseparate segment. Also, a portion of the Business Banking business, based on the measurementsize of outcomes with respectthe client relationship, was moved from CBB to these objectives. ImplementationGlobal Banking. Prior periods will be restated to conform to the new segment alignment.
We prepare and evaluate segment results using certain non-GAAP measures. For additional information, see Supplemental Financial Data on page 32. Table 10 provides selected summary financial data for our business segments and All Other for 2014 and 2013.
|
| | | | | | | | | | | | | | | | | | | | | | | | | | | | | | | | |
| | | | | | | | | | | | | | | | | |
| Table 10 | Business Segment Results |
| | | | | | | | | | | | | | | | | |
| | | Total Revenue (1) | | Provision for Credit Losses | | Noninterest Expense | | Net Income (Loss) |
| (Dollars in millions) | 2014 | | 2013 | | 2014 | | 2013 | | 2014 | | 2013 | | 2014 | | 2013 |
| Consumer & Business Banking | $ | 29,862 |
| | $ | 29,864 |
| | $ | 2,633 |
| | $ | 3,107 |
| | $ | 15,911 |
| | $ | 16,260 |
| | $ | 7,096 |
| | $ | 6,647 |
|
| Consumer Real Estate Services | 4,848 |
| | 7,715 |
| | 160 |
| | (156 | ) | | 23,226 |
| | 15,815 |
| | (13,395 | ) | | (5,031 | ) |
| Global Wealth & Investment Management | 18,404 |
| | 17,790 |
| | 14 |
| | 56 |
| | 13,647 |
| | 13,033 |
| | 2,974 |
| | 2,977 |
|
| Global Banking | 16,598 |
| | 16,479 |
| | 336 |
| | 1,075 |
| | 7,681 |
| | 7,551 |
| | 5,435 |
| | 4,973 |
|
| Global Markets | 16,119 |
| | 15,390 |
| | 110 |
| | 140 |
| | 11,771 |
| | 11,996 |
| | 2,719 |
| | 1,153 |
|
| All Other | (715 | ) | | 2,563 |
| | (978 | ) | | (666 | ) | | 2,881 |
| | 4,559 |
| | 4 |
| | 712 |
|
| Total FTE basis | 85,116 |
| | 89,801 |
| | 2,275 |
| | 3,556 |
| | 75,117 |
| | 69,214 |
| | 4,833 |
| | 11,431 |
|
| FTE adjustment | (869 | ) | | (859 | ) | | — |
| | — |
| | — |
| | — |
| | — |
| | — |
|
| Total Consolidated | $ | 84,247 |
| | $ | 88,942 |
| | $ | 2,275 |
| | $ | 3,556 |
| | $ | 75,117 |
| | $ | 69,214 |
| | $ | 4,833 |
| | $ | 11,431 |
|
| |
(1) | Total revenue is net of interest expense and is on an FTE basis which for consolidated revenue is a non-GAAP financial measure. For more information on this measure, see Supplemental Financial Data on page 32, and for a corresponding reconciliation to a GAAP financial measure, see Statistical Table XV. |
The Corporation periodically reviews capital allocated to its businesses and allocates capital annually during the strategic and capital planning processes. We utilize a methodology that considers the effect of regulatory capital requirements in addition to internal risk-based capital models. The Corporation’s internal risk-based capital models use a risk-adjusted methodology incorporating each segment’s credit, market, interest rate, business and operational risk components. For more information on the nature of these uniform servicing standards has contributedrisks, see Managing Risk on page 55. The capital allocated to elevated costs associated with the servicing process, butbusiness segments is not expectedreferred to result in material delays or dislocationas allocated capital, which represents a non-GAAP financial measure. For purposes of goodwill impairment testing, the Corporation utilizes allocated equity as a proxy for the carrying value of its reporting units. Allocated equity in the performancereporting units is comprised of allocated capital plus capital for the portion of goodwill and intangibles specifically assigned to the reporting unit. For additional information, see Note 8 – Goodwill and Intangible Assetsto the Consolidated Financial Statements.
During 2014, we made refinements to the amount of capital allocated to each of our mortgage servicing obligations, includingbusinesses based on multiple considerations that included, but were not limited to, Basel 3 Standardized and Advanced risk-weighted assets, business segment exposures and risk profile, and strategic plans. As a result of this process, in 2014, we adjusted the completionamount of foreclosures.
Regulatory Matterscapital being allocated to our business segments. This change resulted in a reduction of unallocated capital, which is included in All Other, and an aggregate increase in the amount of capital being allocated to the business segments, primarily Global Banking and Global Markets.
For more information regarding regulatory matterson the business segments and risks,reconciliations to consolidated total revenue, net income and year-end total assets, see Item 1A. Risk FactorsNote 24 – Business Segment Informationto the Consolidated Financial Statements.
Consumer & Business Banking
|
| | | | | | | | | | | | | | | | | | | | | | | | |
| | | | | | | | | | | | |
| | Deposits | | Consumer Lending | | Total Consumer & Business Banking | | |
| (Dollars in millions) | 2014 | 2013 | | 2014 | 2013 | | 2014 | 2013 | | % Change |
|
| Net interest income (FTE basis) | $ | 10,259 |
| $ | 9,807 |
| | $ | 9,426 |
| $ | 10,243 |
| | $ | 19,685 |
| $ | 20,050 |
| | (2 | )% |
| Noninterest income: | | | | | | | | | | |
| Card income | 68 |
| 60 |
| | 4,834 |
| 4,744 |
| | 4,902 |
| 4,804 |
| | 2 |
|
| Service charges | 4,364 |
| 4,206 |
| | 1 |
| 1 |
| | 4,365 |
| 4,207 |
| | 4 |
|
| All other income | 552 |
| 509 |
| | 358 |
| 294 |
| | 910 |
| 803 |
| | 13 |
|
| Total noninterest income | 4,984 |
| 4,775 |
| | 5,193 |
| 5,039 |
| | 10,177 |
| 9,814 |
| | 4 |
|
| Total revenue, net of interest expense (FTE basis) | 15,243 |
| 14,582 |
| | 14,619 |
| 15,282 |
| | 29,862 |
| 29,864 |
| | — |
|
| | | | | | | | | | | |
| Provision for credit losses | 254 |
| 299 |
| | 2,379 |
| 2,808 |
| | 2,633 |
| 3,107 |
| | (15 | ) |
| Noninterest expense | 10,448 |
| 10,930 |
| | 5,463 |
| 5,330 |
| | 15,911 |
| 16,260 |
| | (2 | ) |
| Income before income taxes (FTE basis) | 4,541 |
| 3,353 |
| | 6,777 |
| 7,144 |
| | 11,318 |
| 10,497 |
| | 8 |
|
| Income tax expense (FTE basis) | 1,694 |
| 1,230 |
| | 2,528 |
| 2,620 |
| | 4,222 |
| 3,850 |
| | 10 |
|
| Net income | $ | 2,847 |
| $ | 2,123 |
| | $ | 4,249 |
| $ | 4,524 |
| | $ | 7,096 |
| $ | 6,647 |
| | 7 |
|
| | | | | | | | | | | |
| Net interest yield (FTE basis) | 1.87 | % | 1.88 | % | | 6.77 | % | 7.18 | % | | 3.48 | % | 3.72 | % | | |
| Return on average allocated capital | 17 |
| 14 |
| | 33 |
| 31 |
| | 24 |
| 22 |
| | |
| Efficiency ratio (FTE basis) | 68.54 |
| 74.95 |
| | 37.38 |
| 34.88 |
| | 53.28 |
| 54.44 |
| | |
| | | | | | | | | | | | |
| Balance Sheet | | | | | | | | | | | |
| | | | | | | | | | | | |
| Average | | | | | | | | | | | |
| Total loans and leases | $ | 22,388 |
| $ | 22,445 |
| | $ | 138,721 |
| $ | 142,129 |
| | $ | 161,109 |
| $ | 164,574 |
| | (2 | ) |
Total earning assets (1) | 548,096 |
| 522,938 |
| | 139,145 |
| 142,721 |
| | 565,700 |
| 539,241 |
| | 5 |
|
Total assets (1) | 580,857 |
| 555,687 |
| | 148,579 |
| 151,434 |
| | 607,895 |
| 580,703 |
| | 5 |
|
| Total deposits | 542,589 |
| 518,407 |
| | n/m |
| n/m |
| | 543,441 |
| 518,904 |
| | 5 |
|
| Allocated capital | 16,500 |
| 15,400 |
| | 13,000 |
| 14,600 |
| | 29,500 |
| 30,000 |
| | (2 | ) |
| | | | | | | | | | | | |
| Year end | | | | | | | | | | | |
| Total loans and leases | $ | 22,284 |
| $ | 22,578 |
| | $ | 141,132 |
| $ | 142,516 |
| | $ | 163,416 |
| $ | 165,094 |
| | (1 | ) |
Total earning assets (1) | 560,130 |
| 535,061 |
| | 141,216 |
| 143,917 |
| | 579,283 |
| 550,698 |
| | 5 |
|
Total assets (1) | 593,485 |
| 567,918 |
| | 150,956 |
| 153,376 |
| | 622,378 |
| 593,014 |
| | 5 |
|
| Total deposits | 555,539 |
| 530,860 |
| | n/m |
| n/m |
| | 556,568 |
| 531,608 |
| | 5 |
|
| |
(1) | In segments and businesses where the total of liabilities and equity exceeds assets, we allocate assets from All Other to match the segments’ and businesses’ liabilities and allocated shareholders’ equity. As a result, total earning assets and total assets of the businesses may not equal total CBB. |
n/m = not meaningful
CBB, which is comprised of Deposits and Consumer Lending, offers a diversified range of credit, banking and investment products and services to consumers and businesses. Our customers and clients have access to a franchise network that stretches coast to coast through 32 states and the District of Columbia. The franchise network includes approximately 4,800 banking centers, 15,800 ATMs, nationwide call centers, and online and mobile platforms.
CBB Results
Net income for CBBincreased$449 million to $7.1 billion in 2014 compared to 2013 primarily driven by lower provision for credit losses, higher noninterest income and lower noninterest expense, partially offset by lower net interest income. Net interest income decreased $365 million to $19.7 billion due to lower average loan balances and card yields, partially offset by the beneficial impact of an increase in investable assets as a result of higher deposit balances. Noninterest income increased $363 million to $10.2 billion primarily due to portfolio divestiture gains, higher service charges and higher card income, partially offset by lower revenue from consumer protection products.
The provision for credit losses decreased$474 million to $2.6 billion in 2014 primarily as a result of improvements in credit
quality. Noninterest expense decreased $349 million to $15.9 billion primarily driven by lower operating, litigation and Federal Deposit Insurance Corporation (FDIC) expenses.
The return on average allocated capital was 24 percent, up from 22 percent, reflecting an increase in net income combined with a small decrease in allocated capital. For more information on capital allocated to the business segments, see Business Segment Operations on page 34.
Deposits
Deposits includes the results of consumer deposit activities which consist of a comprehensive range of products provided to consumers and small businesses. Our deposit products include traditional savings accounts, money market savings accounts, CDs and IRAs, noninterest- and interest-bearing checking accounts, as well as investment accounts and products. The revenue is allocated to the deposit products using our funds transfer pricing process that matches assets and liabilities with similar interest rate sensitivity and maturity characteristics. Deposits generates fees such as account service fees, non-sufficient funds fees, overdraft charges and ATM fees, as well as investment and brokerage fees from Merrill Edge accounts. Merrill Edge is an integrated investing and banking service targeted at customers
with less than $250,000 in investable assets. Merrill Edge provides investment advice and guidance, client brokerage asset services, a self-directed online investing platform and key banking capabilities including access to the Corporation’s network of banking centers and ATMs.
Business Banking within Deposits provides a wide range of lending-related products and services, integrated working capital management and treasury solutions to clients through our network of offices and client relationship teams along with various product partners. Our clients include U.S.-based companies generally with annual sales of $1 million to $50 million. Our lending products and services include commercial loans, lines of credit and real estate lending. Our capital management and treasury solutions include treasury management, foreign exchange and short-term investing options. Deposits also includes the results of our merchant services joint venture.
Deposits includes the net impact of migrating customers and their related deposit balances between Deposits and GWIM as well as other client-managed businesses. For more information on the migration of customer balances to or from GWIM, Capital Management – Regulatory Capitalsee GWIM on page 6542.
Net income for Deposits increased$724 million to $2.8 billion in 2014 driven by higher revenue and a decrease in noninterest expense. Net interest income increased$452 million to $10.3 billion primarily driven by a combination of pricing discipline and the beneficial impact of an increase in investable assets as a result of higher deposit balances. Noninterest income increased $209 million to $5.0 billion primarily due to higher deposit service charges.
The provision for credit losses decreased $45 million to $254 million as a result of improvement in credit quality. Noninterest expense decreased$482 million to $10.4 billion due to lower operating expenses, driven in part by a reduction in banking centers as customers migrate to self-service touchpoints, in addition to lower FDIC and litigation expense.
Average deposits increased$24.2 billion to $542.6 billion in 2014 driven by a continuing customer shift to more liquid products in the low rate environment. Growth in checking, traditional savings and money market savings of $34.7 billion was partially offset by a decline in time deposits of $10.5 billion. As a result of our continued pricing discipline and the shift in the mix of deposits, the rate paid on average deposits declined by five bps to six bps.
|
| | | | | | | |
| | | | |
Key Statistics – Deposits | | | |
| | | | |
| | 2014 | | 2013 |
| Total deposit spreads (excludes noninterest costs) | 1.59 | % | | 1.52 | % |
| | | | |
| Year end | | | |
| Client brokerage assets (in millions) | $ | 113,763 |
| | $ | 96,048 |
|
| Online banking active accounts (units in thousands) | 30,904 |
| | 29,950 |
|
| Mobile banking active accounts (units in thousands) | 16,539 |
| | 14,395 |
|
| Banking centers | 4,855 |
| | 5,151 |
|
| ATMs | 15,838 |
| | 16,259 |
|
Client brokerage assets increased $17.7 billion in 2014 driven by new accounts, increased account flows and higher market valuations. Mobile banking active accounts increased2.1 million reflecting continuing changes in our customers’ banking preferences. The number of banking centers declined296 and ATMs declined421 as we continue to optimize our consumer banking network and improve our cost-to-serve.
Consumer Lending
Consumer Lending is one of the leading issuers of credit and debit cards to consumers and small businesses in the U.S. Our lending products and services also include direct and indirect consumer loans such as automotive, marine, aircraft, recreational vehicle and consumer personal loans. In addition to earning net interest spread revenue on its lending activities, Consumer Lending generates interchange revenue from credit and debit card transactions as well as annual credit card fees and other miscellaneous fees.
Consumer Lending includes the net impact of migrating customers and their related credit card loan balances between Consumer Lending and GWIM. For more information on the migration of customer balances to or from GWIM, see GWIM on page 42.
Net income for Consumer Lending decreased$275 million to $4.2 billion in 2014 primarily due to lower net interest income and higher noninterest expense, partially offset by lower provision for credit losses and higher noninterest income. Net interest income decreased$817 million to $9.4 billion driven by the impact of lower average loan balances and card yields. Noninterest income increased $154 million to $5.2 billion driven by portfolio divestiture gains and higher card income, partially offset by lower revenue from consumer protection products.
The provision for credit losses decreased$429 million to $2.4 billion in 2014 as a result of continued improvement in credit quality, due in part to lower delinquencies. Noninterest expense increased$133 million to $5.5 billion driven by higher operating expenses, partially offset by lower litigation expense.
Average loans decreased$3.4 billion to $138.7 billion in 2014 primarily driven by the net migration of credit card loan balances to GWIM as described above, continued run-off of non-core portfolios and portfolio divestitures, partially offset by an increase in small business lending and consumer auto loans.
|
| | | | | | | |
| | | | |
Key Statistics – Consumer Lending | | | |
| | | | |
| (Dollars in millions) | 2014 | | 2013 |
Total U.S. credit card (1) | | | |
| Gross interest yield | 9.34 | % | | 9.73 | % |
| Risk-adjusted margin | 9.44 |
| | 8.68 |
|
| New accounts (in thousands) | 4,541 |
| | 3,911 |
|
| Purchase volumes | $ | 212,088 |
| | $ | 205,914 |
|
| Debit card purchase volumes | $ | 272,576 |
| | $ | 267,087 |
|
| |
(1) | Total U.S. credit card includes portfolios in CBB and GWIM. |
During 2014, the total U.S. credit card risk-adjusted margin increased76 bps due to an improvement in credit quality and portfolio divestiture gains. Total U.S. credit card purchase volumes increased$6.2 billion to $212.1 billion and debit card purchase volumes increased$5.5 billion to $272.6 billion, reflecting higher levels of consumer spending.
Consumer Real Estate Services
|
| | | | | | | | | | | | | | | | | | | | | | | | |
| | | | | | | | | | | | |
| Home Loans | | Legacy Assets & Servicing | | Total Consumer Real Estate Services | | |
| (Dollars in millions) | 2014 | 2013 | | 2014 | 2013 | | 2014 | 2013 | | % Change |
| Net interest income (FTE basis) | $ | 1,315 |
| $ | 1,349 |
| | $ | 1,516 |
| $ | 1,541 |
| | $ | 2,831 |
| $ | 2,890 |
| | (2 | )% |
| Noninterest income: | | | | | | | | | | |
| Mortgage banking income | 813 |
| 1,916 |
| | 1,053 |
| 2,669 |
| | 1,866 |
| 4,585 |
| | (59 | ) |
| All other income (loss) | 40 |
| (6 | ) | | 111 |
| 246 |
| | 151 |
| 240 |
| | (37 | ) |
| Total noninterest income | 853 |
| 1,910 |
| | 1,164 |
| 2,915 |
| | 2,017 |
| 4,825 |
| | (58 | ) |
| Total revenue, net of interest expense (FTE basis) | 2,168 |
| 3,259 |
| | 2,680 |
| 4,456 |
| | 4,848 |
| 7,715 |
| | (37 | ) |
| | | | | | | | | | | |
| Provision for credit losses | 33 |
| 127 |
| | 127 |
| (283 | ) | | 160 |
| (156 | ) | | n/m |
|
| Noninterest expense | 2,587 |
| 3,334 |
| | 20,639 |
| 12,481 |
| | 23,226 |
| 15,815 |
| | 47 |
|
| Loss before income taxes (FTE basis) | (452 | ) | (202 | ) | | (18,086 | ) | (7,742 | ) | | (18,538 | ) | (7,944 | ) | | 133 |
|
| Income tax benefit (FTE basis) | (169 | ) | (74 | ) | | (4,974 | ) | (2,839 | ) | | (5,143 | ) | (2,913 | ) | | 77 |
|
| Net loss | $ | (283 | ) | $ | (128 | ) | | $ | (13,112 | ) | $ | (4,903 | ) | | $ | (13,395 | ) | $ | (5,031 | ) | | n/m |
|
| | | | | | | | | | | |
| Net interest yield (FTE basis) | 2.40 | % | 2.54 | % | | 4.03 | % | 3.19 | % | | 3.06 | % | 2.85 | % | | |
| | | | | | | | | | | | |
| Balance Sheet | | | | | | | | | | | |
| | | | | | | | | | | | |
| Average | | | | | | | | | | | |
| Total loans and leases | $ | 52,336 |
| $ | 47,675 |
| | $ | 35,941 |
| $ | 42,603 |
| | $ | 88,277 |
| $ | 90,278 |
| | (2 | ) |
| Total earning assets | 54,778 |
| 53,148 |
| | 37,593 |
| 48,272 |
| | 92,371 |
| 101,420 |
| | (9 | ) |
| Total assets | 54,751 |
| 53,426 |
| | 52,134 |
| 67,130 |
| | 106,885 |
| 120,556 |
| | (11 | ) |
| Allocated capital | 6,000 |
| 6,000 |
| | 17,000 |
| 18,000 |
| | 23,000 |
| 24,000 |
| | (4 | ) |
| | | | | | | | | | | | |
| Year end | | | | | | | | | | | |
| Total loans and leases | $ | 54,917 |
| $ | 51,021 |
| | $ | 33,055 |
| $ | 38,732 |
| | $ | 87,972 |
| $ | 89,753 |
| | (2 | ) |
| Total earning assets | 57,881 |
| 54,071 |
| | 33,922 |
| 43,092 |
| | 91,803 |
| 97,163 |
| | (6 | ) |
| Total assets | 57,772 |
| 53,933 |
| | 45,958 |
| 59,458 |
| | 103,730 |
| 113,391 |
| | (9 | ) |
n/m = not meaningful
CRES operations include Home Loans and Legacy Assets & Servicing. Home Loans is responsible for ongoing residential first mortgage and home equity loan production activities and the CRES home equity loan portfolio not selected for inclusion in the Legacy Assets & Servicing owned portfolio. Legacy Assets & Servicing is responsible for our mortgage servicing activities related to loans serviced for others and loans held by the Corporation, including loans that have been designated as the Legacy Assets & Servicing Portfolios. The Legacy Assets & Servicing Portfolios (both owned and serviced), herein referred to as the Legacy Owned and Legacy Serviced Portfolios, respectively (together, the Legacy Portfolios), and as further defined below, include those loans originated prior to January 1, 2011 that would not have been originated under our established underwriting standards as of December 31, 2010. For more information on our Legacy Portfolios, see page 39. In addition, Legacy Assets & Servicing is responsible for managing legacy exposures related to CRES (e.g., litigation, representations and warranties). This alignment allows CRES management to lead the ongoing Home Loans business while also providing focus on legacy mortgage issues and servicing activities.
CRES, primarily through its Home Loans operations, generates revenue by providing an extensive line of consumer real estate products and services to customers nationwide. CRES products offered by Home Loans include fixed- and adjustable-rate first-lien mortgage loans for home purchase and refinancing needs, home equity lines of credit (HELOCs) and home equity loans. First mortgage products are generally either sold into the secondary mortgage market to investors, while we retain MSRs (which are on the balance sheet of Legacy Assets & Servicing) and the Bank
of America customer relationships, or are held on the balance sheet in Home Loans or in All Other for ALM purposes. Home Loans is compensated for loans held for ALM purposes on a management accounting basis with the corresponding offset in All Other. Newly originated HELOCs and home equity loans are retained on the CRES balance sheet in Home Loans.
CRES includes the impact of migrating certain customers and their related loan balances from GWIM to CRES. For more information on the migration of customer balances to or from GWIM, see GWIM on page 42.
CRES Results
The net loss for CRESincreased$8.4 billion to a net loss of $13.4 billion for 2014 compared to 2013 primarily driven by higher litigation expense, which is included in noninterest expense, as a result of the settlements with the DoJ and FHFA, a lower tax benefit rate resulting from the non-deductible treatment of a portion of the settlement with the DoJ, lower mortgage banking income and higher provision for credit losses.
Mortgage banking income decreased$2.7 billion due to both lower servicing income and core production revenue, partially offset by a lower representations and warranties provision. The provision for credit losses increased$316 million to $160 million driven by additional costs associated with the consumer relief portion of the settlement with the DoJ, partially offset by the continued improvement in portfolio trends including increased home prices. Noninterest expense increased $7.4 billion primarily due to a $11.4 billion increase in litigation expense as a result of the settlements with the DoJ and FHFA. Excluding litigation,
noninterest expense decreased $4.0 billion to $8.0 billion driven by a decline in default-related servicing expenses, including mortgage-related assessments, waivers and similar costs related to foreclosure delays in Legacy Assets & Servicing and a decline in personnel expense resulting from lower loan originations in Home Loans.
Home Loans
Home Loans products are available to our customers through our retail network, direct telephone and online access delivered by a sales force of nearly 2,500 mortgage loan officers, including 1,500 banking center mortgage loan officers covering 2,600 banking centers, and a nearly 700-person centralized sales force based in five call centers.
The net loss for Home Loans increased$155 million to a net loss of $283 million driven by lower mortgage banking income, partially offset by lower noninterest expense and lower provision for credit losses. Mortgage banking income decreased $1.1 billion due to a decline in core production revenue as a result of lower first mortgage origination volumes, and to a lesser extent, industry-wide margin compression. The provision for credit losses decreased $94 million reflecting continued improvement in portfolio trends including increased home prices. Noninterest expense decreased $747 million primarily due to lower personnel expense resulting from lower loan originations.
Legacy Assets & Servicing
Legacy Assets & Servicing is responsible for all of our in-house servicing activities related to the residential mortgage and home equity loan portfolios, including owned loans and loans serviced for others (collectively, the mortgage serviced portfolio). A portion of this portfolio has been designated as the Legacy Serviced Portfolio, which represented 26 percent, 30 percent and 39 percent of the total mortgage serviced portfolio, as measured by unpaid principal balance, at December 31, 2014, 2013 and 2012, respectively. In addition, Legacy Assets & Servicing is responsible for managing subservicing agreements.
Legacy Assets & Servicing results reflect the net cost of legacy exposures that are included in the results of CRES, including representations and warranties provision, litigation expense, financial results of the CRES home equity portfolio selected as part of the Legacy Owned Portfolio, the financial results of the servicing operations and the results of MSR activities, including net hedge results. The financial results of the servicing operations reflect certain revenues and expenses on loans serviced for others, including owned loans serviced for Home Loans, GWIM and All Other.
Servicing activities include collecting cash for principal, interest and escrow payments from borrowers, disbursing customer draws for lines of credit, accounting for and remitting principal and interest payments to investors and escrow payments to third parties, and responding to customer inquiries. Our home retention efforts, including single point of contact resources, are also part of our servicing activities, along with supervision of
foreclosures and property dispositions. Prior to foreclosure, Legacy Assets & Servicing evaluates various workout options in an effort to help our customers avoid foreclosure. For more information on our servicing activities, including the impact of foreclosure delays, see Off-Balance Sheet Arrangements and Contractual Obligations – Servicing, Foreclosure and Other Mortgage Matters on page 53.
The net loss for Legacy Assets & Servicing increased $8.2 billion to a net loss of $13.1 billion driven by higher litigation expense, which is included in noninterest expense, a lower tax benefit rate resulting from the non-deductible treatment of a portion of the settlement with the DoJ, lower mortgage banking income and higher provision for credit losses.
Mortgage banking income decreased $1.6 billion primarily driven by a decline in servicing income due to a smaller servicing portfolio combined with less favorable MSR net-of-hedge performance. The provision for credit losses increased $410 million primarily due to additional costs associated with the consumer relief portion of the settlement with the DoJ.
Noninterest expense increased $8.2 billion due to higher litigation expense as a result of the settlements with the DoJ and FHFA. Excluding litigation, noninterest expense decreased $3.3 billion to $5.4 billion driven by a decrease in default-related servicing expenses, including mortgage-related assessments, waivers and similar costs related to foreclosure delays. We expect that noninterest expense in Legacy Assets & Servicing, excluding litigation expense, will decline to approximately $800 million per quarter by the end of 2015.
Legacy Portfolios
The Legacy Portfolios (both owned and serviced) include those loans originated prior to January 1, 2011 that would not have been originated under our established underwriting standards in place as of December 31, 2010. The purchased credit-impaired (PCI) portfolio, as well as certain loans that met a pre-defined delinquency status or probability of default threshold as of January 1, 2011, are also included in the Legacy Portfolios. Since determining the pool of loans to be included in the Legacy Portfolios as of January 1, 2011, the criteria have not changed for these portfolios, but will continue to be evaluated over time.
Legacy Owned Portfolio
The Legacy Owned Portfolio includes those loans that met the criteria as described above and are on the balance sheet of the Corporation. The home equity loan portfolio is held on the balance sheet of Legacy Assets & Servicing, and the residential mortgage loan portfolio is held on the balance sheet of All Other. The financial results of the on-balance sheet loans are reported in the segment that owns the loans or in All Other. Total loans in the Legacy Owned Portfolio decreased$22.2 billion in 2014 to $89.9 billion at December 31, 2014, of which $33.1 billion were held on the Legacy Assets & Servicing balance sheet and the remainder was held on the balance sheet of All Other. The decrease was primarily related to paydowns, loan sales, PCI write-offs and charge-offs.
Legacy Serviced Portfolio
The Legacy Serviced Portfolio includes loans serviced by Legacy Assets & Servicing in both the Legacy Owned Portfolio and those loans serviced for outside investors that met the criteria as described above. The table below summarizes the balances of the residential mortgage loans included in the Legacy Serviced Portfolio (the Legacy Residential Mortgage Serviced Portfolio) representing 24 percent, 28 percent and 38 percent of the total residential mortgage serviced portfolio of $609 billion, $719 billion and $1.2 trillion, as measured by unpaid principal balance, at December 31, 2014, 2013 and 2012, respectively. The decline in the Legacy Residential Mortgage Serviced Portfolio was primarily due to MSR sales, loan sales and other servicing transfers, paydowns and payoffs.
|
| | | | | | | | | | | | |
| | | | | | | |
Legacy Residential Mortgage Serviced Portfolio, a subset of the Residential Mortgage Serviced Portfolio (1) |
| | | | | | | |
| | | December 31 |
| (Dollars in billions) | | 2014 | | 2013 | | 2012 |
| Unpaid principal balance | | | | | | |
| Residential mortgage loans | | | | | | |
| Total | | $ | 148 |
| | $ | 203 |
| | $ | 467 |
|
| 60 days or more past due | | 25 |
| | 49 |
| | 137 |
|
| | | | | | | |
| Number of loans serviced (in thousands) | | | | | | |
| Residential mortgage loans | | | | | | |
| Total | | 794 |
| | 1,083 |
| | 2,542 |
|
| 60 days or more past due | | 135 |
| | 258 |
| | 649 |
|
| |
(1) | Excludes $34 billion, $39 billion and $52 billion of home equity loans and HELOCs at December 31, 2014, 2013 and 2012, respectively. |
Non-Legacy Portfolio
As previously discussed, Legacy Assets & Servicing is responsible for all of our servicing activities. The table below summarizes the balances of the residential mortgage loans that are not included in the Legacy Serviced Portfolio (the Non-Legacy Residential Mortgage Serviced Portfolio) representing 76 percent, 72 percent and 62 percent of the total residential mortgage serviced portfolio, as measured by unpaid principal balance, at December 31, 2014, 2013 and 2012, respectively. The decline in the Non-Legacy Residential Mortgage Serviced Portfolio was primarily due to MSR sales and other servicing transfers, paydowns and payoffs. |
| | | | | | | | | | | | |
| | | | | | | |
Non-Legacy Residential Mortgage Serviced Portfolio, a subset of the Residential Mortgage Serviced Portfolio (1) |
| | | | | | | |
| | | December 31 |
| (Dollars in billions) | | 2014 | | 2013 | | 2012 |
| Unpaid principal balance | | | | | | |
| Residential mortgage loans | | | | | | |
| Total | | $ | 461 |
| | $ | 516 |
| | $ | 755 |
|
| 60 days or more past due | | 9 |
| | 12 |
| | 22 |
|
| | | | | | | |
| Number of loans serviced (in thousands) | | | | | | |
| Residential mortgage loans | | | | | | |
| Total | | 2,951 |
| | 3,267 |
| | 4,764 |
|
| 60 days or more past due | | 54 |
| | 67 |
| | 124 |
|
| |
(1) | Excludes $50 billion, $52 billion and $58 billion of home equity loans and HELOCs at December 31, 2014, 2013 and 2012, respectively. |
Mortgage Banking Income
CRES mortgage banking income is categorized into production and servicing income. Core production income is comprised primarily of revenue from the fair value gains and losses recognized on our interest rate lock commitments (IRLCs) and LHFS, the related secondary market execution and costs related to representations and warranties in the sales transactions along with other obligations incurred in the sales of mortgage loans. Ongoing costs related to representations and warranties and other obligations that were incurred in the sales of mortgage loans in prior periods are also included in production income.
Servicing income includes income earned in connection with servicing activities and MSR valuation adjustments, net of results from risk management activities used to hedge certain market risks of the MSRs. The costs associated with our servicing activities are included in noninterest expense.
The table below summarizes the components of mortgage banking income.
|
| | | | | | | |
| | | | |
| Mortgage Banking Income | | | |
| | | | |
| (Dollars in millions) | 2014 | | 2013 |
| Production income: | | | |
| Core production revenue | $ | 1,181 |
| | $ | 2,543 |
|
| Representations and warranties provision | (683 | ) | | (840 | ) |
| Total production income | 498 |
| | 1,703 |
|
| Servicing income: | | | |
| Servicing fees | 1,884 |
| | 3,030 |
|
Amortization of expected cash flows (1) | (818 | ) | | (1,043 | ) |
Fair value changes of MSRs, net of risk management activities used to hedge certain market risks (2) | 294 |
| | 867 |
|
| Other servicing-related revenue | 8 |
| | 28 |
|
| Total net servicing income | 1,368 |
| | 2,882 |
|
Total CRES mortgage banking income | 1,866 |
| | 4,585 |
|
Eliminations (3) | (303 | ) | | (711 | ) |
| Total consolidated mortgage banking income | $ | 1,563 |
| | $ | 3,874 |
|
| |
(1) | Represents the net change in fair value of the MSR asset due to the recognition of modeled cash flows. |
| |
(2) | Includes gains (losses) on sales of MSRs. |
| |
(3) | Includes the effect of transfers of mortgage loans from CRES to the ALM portfolio included in All Other and intercompany allocations of servicing costs. |
Core production revenue decreased $1.4 billion to $1.2 billion in 2014 due to lower first mortgage origination volumes as described below, and to a lesser extent, industry-wide margin compression. The representations and warranties provision decreased $157 million to $683 million and was primarily related to non-government-sponsored enterprises exposures, partially offset by lower exposure to mortgage insurance companies as a result of settlements in 2014.
Net servicing income decreased$1.5 billion to $1.4 billion driven by lower servicing fees due to a smaller servicing portfolio and less favorable MSR net-of-hedge performance, partially offset by lower amortization of expected cash flows. The decline in the size of our servicing portfolio was driven by strategic sales of MSRs during 2014 and 2013 as well as loan prepayment activity, which exceeded new originations primarily due to our exit from non-retail channels.
|
| | | | | | | | |
| | | | | |
| Key Statistics | | | | |
| | | | | |
| (Dollars in millions, except as noted) | 2014 | | 2013 | |
Loan production (1) | |
| | |
| |
Total (2): | | | | |
| First mortgage | $ | 43,290 |
| | $ | 83,421 |
| |
| Home equity | 11,233 |
| | 6,361 |
| |
| CRES: | |
| | |
| |
| First mortgage | $ | 32,340 |
| | $ | 66,913 |
| |
| Home equity | 10,286 |
| | 5,498 |
| |
| | | | | |
| Year end | |
| | |
| |
Mortgage serviced portfolio (in billions) (1, 3) | $ | 693 |
| | $ | 810 |
| |
Mortgage loans serviced for investors (in billions) (1) | 474 |
| | 550 |
| |
| Mortgage servicing rights: | |
| | |
| |
Balance (4) | 3,271 |
| | 5,042 |
| |
Capitalized mortgage servicing rights (% of loans serviced for investors) | 69 |
| bps | 92 |
| bps |
| |
(1) | The above loan production and year-end servicing portfolio and mortgage loans serviced for investors represent the unpaid principal balance of loans. |
| |
(2) | In addition to loan production in CRES, the remaining first mortgage and home equity loan production is primarily in GWIM. |
| |
(3) | Servicing of residential mortgage loans, HELOCs and home equity loans by Legacy Assets & Servicing. |
| |
(4) | At December 31, 2014, excludes $259 million of certain non-U.S. residential mortgage MSR balances that are recorded in Global Markets. |
First mortgage loan originations in CRES and for the total Corporation declined in 2014 compared to 2013 reflecting a decline in the overall mortgage market as higher interest rates throughout most of 2014 drove a decrease in refinances.
During 2014, 60 percent of the total Corporation first mortgage production volume was for refinance originations and 40 percent was for purchase originations compared to 82 percent and 18
percent in 2013. Home Affordable Refinance Program (HARP) refinance originations were six percent of all refinance originations compared to 23 percent in 2013. Making Home Affordable non-HARP refinance originations were 17 percent of all refinance originations compared to 19 percent in 2013. The remaining 77 percent of refinance originations was conventional refinances compared to 58 percent in 2013.
Home equity production for the total Corporation was $11.2 billion for 2014 compared to $6.4 billion for 2013, with the increase due to a higher demand in the market based on improving housing trends, and increased market share driven by improved banking center engagement with customers and more competitive pricing.
Mortgage Servicing Rights
At December 31, 2014, the balance of consumer MSRs managed within CRES, which excludes $259 million of certain non-U.S. residential mortgage MSRs recorded in Global Markets, was $3.3 billion, which represented 69 bps of the related unpaid principal balance compared to $5.0 billion, or 92 bps of the related unpaid principal balance at December 31, 2013. The consumer MSR balance managed within CRES decreased $1.8 billion during 2014 primarily driven by a decrease in value due to lower mortgage rates at December 31, 2014 compared to December 31, 2013, which resulted in higher forecasted prepayment speeds, and the recognition of modeled cash flows, partially offset by additions to the portfolio. For more information on our servicing activities, see Off-Balance Sheet Arrangements and Contractual Obligations – Servicing, Foreclosure and Other Mortgage Matters on page 53. For more information on MSRs, see Note 23 – Mortgage Servicing Rightsto the Consolidated Financial Statements.
Global Wealth & Investment Management |
| | | | | | | | | | | |
| | | | | | | |
| (Dollars in millions) | 2014 | | 2013 | | % Change |
| Net interest income (FTE basis) | $ | 5,836 |
| | $ | 6,064 |
| | (4 | )% |
| Noninterest income: | | | | | |
| Investment and brokerage services | 10,722 |
| | 9,709 |
| | 10 |
|
| All other income | 1,846 |
| | 2,017 |
| | (8 | ) |
| Total noninterest income | 12,568 |
| | 11,726 |
| | 7 |
|
| Total revenue, net of interest expense (FTE basis) | 18,404 |
| | 17,790 |
| | 3 |
|
| | | | | | |
| Provision for credit losses | 14 |
| | 56 |
| | (75 | ) |
| Noninterest expense | 13,647 |
| | 13,033 |
| | 5 |
|
| Income before income taxes (FTE basis) | 4,743 |
| | 4,701 |
| | 1 |
|
| Income tax expense (FTE basis) | 1,769 |
| | 1,724 |
| | 3 |
|
| Net income | $ | 2,974 |
| | $ | 2,977 |
| | — |
|
| | | | | | |
| Net interest yield (FTE basis) | 2.33 | % | | 2.41 | % | | |
| Return on average allocated capital | 25 |
| | 30 |
| | |
| Efficiency ratio (FTE basis) | 74.15 |
| | 73.26 |
| | |
| | | | | | |
| Balance Sheet | | | | | | |
| | | | | | |
| Average | | | | | |
| Total loans and leases | $ | 119,775 |
| | $ | 111,023 |
| | 8 |
|
| Total earning assets | 250,747 |
| | 251,395 |
| | — |
|
| Total assets | 269,279 |
| | 270,789 |
| | (1 | ) |
| Total deposits | 240,242 |
| | 242,161 |
| | (1 | ) |
| Allocated capital | 12,000 |
| | 10,000 |
| | 20 |
|
| | | | | | |
| Year end | |
| | |
| | |
|
| Total loans and leases | $ | 125,431 |
| | $ | 115,846 |
| | 8 |
|
| Total earning assets | 258,219 |
| | 254,031 |
| | 2 |
|
| Total assets | 276,587 |
| | 274,113 |
| | 1 |
|
| Total deposits | 245,391 |
| | 244,901 |
| | — |
|
GWIM consists of two primary businesses: Merrill Lynch Global Wealth Management (MLGWM) andU.S. Trust, Bank of America Private Wealth Management (U.S. Trust).
MLGWM’s advisory business provides a high-touch client experience through a network of financial advisors focused on clients with over $250,000 in total investable assets. MLGWM provides tailored solutions to meet our clients’ needs through a full set of brokerage, banking and retirement products.
U.S. Trust, together with MLGWM’s Private Banking & Investments Group, provides comprehensive wealth management solutions targeted to high net worth and ultra high net worth clients, as well as customized solutions to meet clients’ wealth structuring, investment management, trust and banking needs, including specialty asset management services.
Net income remained relatively unchanged in 2014 compared to 2013 as an increase in noninterest income and lower credit costs were offset by lower net interest income and higher noninterest expense.
Net interest income decreased $228 million to $5.8 billion as a result of the low rate environment, partially offset by the impact of loan growth. Noninterest income, primarily investment and brokerage services, increased $842 million to $12.6 billion driven by increased asset management fees due to the impact of long-term AUM flows and higher market levels, partially offset by lower transactional revenue. Noninterest expense increased$614 million to $13.6 billion primarily due to higher revenue-related incentive compensation and support expenses, partially offset by lower other expenses.
Return on average allocated capital was 25 percent, down from 30 percent due to an increase in capital allocations. For more information on capital allocated to the business segments, see Business Segment Operations on page 34.
Revenue by Business
The table below summarizes revenue for MLGWM, U.S. Trust and other GWIM businesses.
|
| | | | | | | |
| | | | |
| Revenue by Business | | | |
| | | | |
| (Dollars in millions) | 2014 | | 2013 |
| Merrill Lynch Global Wealth Management | $ | 15,256 |
| | $ | 14,771 |
|
| U.S. Trust | 3,084 |
| | 2,953 |
|
Other (1) | 64 |
| | 66 |
|
| Total revenue, net of interest expense (FTE basis) | $ | 18,404 |
| | $ | 17,790 |
|
| |
(1) | Other includes the results of BofA Global Capital Management and other administrative items. |
In 2014, revenue from MLGWM was $15.3 billion, upthree percent, driven by increased asset management fees due to the impact of long-term AUM flows and higher market levels, partially offset by the impact of the low rate environment on net interest income and lower transactional revenue. In 2014, revenue from U.S. Trust was $3.1 billion, upfour percent, driven by increased asset management fees due to the impact of higher market levels and long-term AUM flows.
Client Balances
The table below presents client balances which consist of AUM, brokerage assets, assets in custody, deposits, and loans and leases.
|
| | | | | | | |
| | | | |
| Client Balances by Type | | | |
| | | | |
| | December 31 |
| (Dollars in millions) | 2014 | | 2013 |
| Assets under management | $ | 902,872 |
| | $ | 821,449 |
|
| Brokerage assets | 1,081,434 |
| | 1,045,122 |
|
| Assets in custody | 139,555 |
| | 136,190 |
|
| Deposits | 245,391 |
| | 244,901 |
|
Loans and leases (1) | 128,745 |
| | 118,776 |
|
| Total client balances | $ | 2,497,997 |
| | $ | 2,366,438 |
|
| |
(1) | Includes margin receivables which are classified in customer and other receivables on the Consolidated Balance Sheet. |
The increase of $131.6 billion, or six percent, in client balances was driven by higher market levels and long-term AUM flows.
Net Migration Summary
GWIM results are impacted by the net migration of clients and their corresponding deposit, loan and brokerage balances to or from CBB, Global Banking and CRES, as presented in the table below. Migrations result from the movement of clients between business segments to better align with client needs. In addition to business-as-usual migration during 2013, GWIM identified and transferred a client population with deposit balances of $23.3 billion to CBB and home equity loan balances of $4.5 billion to CRES, while CBB transferred credit card loan balances of $3.2 billion to GWIM.
|
| | | | | | | |
| | | | |
| Net Migration Summary | | | |
| | | | |
| (Dollars in millions) | 2014 | | 2013 |
Total deposits, net – GWIM from (to) CBB and Global Banking | $ | 1,350 |
| | $ | (20,974 | ) |
Total loans, net – GWIM from (to) CBB and CRES | (61 | ) | | (1,356 | ) |
Total brokerage, net – GWIM from (to) CBB and Global Banking | (2,710 | ) | | (1,251 | ) |
Global Banking
|
| | | | | | | | | | | |
| | | | | | | |
| (Dollars in millions) | 2014 | | 2013 | | % Change |
| Net interest income (FTE basis) | $ | 8,999 |
| | $ | 8,914 |
| | 1 | % |
| Noninterest income: | | | | | |
| Service charges | 2,717 |
| | 2,787 |
| | (3 | ) |
| Investment banking fees | 3,213 |
| | 3,234 |
| | (1 | ) |
| All other income | 1,669 |
| | 1,544 |
| | 8 |
|
| Total noninterest income | 7,599 |
| | 7,565 |
| | — |
|
| Total revenue, net of interest expense (FTE basis) | 16,598 |
| | 16,479 |
| | 1 |
|
| | | | | | |
| Provision for credit losses | 336 |
| | 1,075 |
| | (69 | ) |
| Noninterest expense | 7,681 |
| | 7,551 |
| | 2 |
|
| Income before income taxes (FTE basis) | 8,581 |
| | 7,853 |
| | 9 |
|
| Income tax expense (FTE basis) | 3,146 |
| | 2,880 |
| | 9 |
|
| Net income | $ | 5,435 |
| | $ | 4,973 |
| | 9 |
|
| | | | | | |
| Net interest yield (FTE basis) | 2.57 | % | | 2.97 | % | | |
| Return on average allocated capital | 18 |
| | 22 |
| | |
| Efficiency ratio (FTE basis) | 46.28 |
| | 45.82 |
| | |
| | | | | | |
| Balance Sheet | | | | | | |
| | | | | | |
| Average | | | | | |
| Total loans and leases | $ | 270,164 |
| | $ | 257,249 |
| | 5 |
|
| Total earning assets | 350,668 |
| | 300,511 |
| | 17 |
|
| Total assets | 393,721 |
| | 342,772 |
| | 15 |
|
| Total deposits | 261,312 |
| | 236,765 |
| | 10 |
|
| Allocated capital | 31,000 |
| | 23,000 |
| | 35 |
|
| | | | | | |
| Year end | | | | | |
| Total loans and leases | $ | 272,572 |
| | $ | 269,469 |
| | 1 |
|
| Total earning assets | 336,776 |
| | 336,606 |
| | — |
|
| Total assets | 379,513 |
| | 378,659 |
| | — |
|
| Total deposits | 251,344 |
| | 265,171 |
| | (5 | ) |
Global Banking, which includes Global Corporate and Global Commercial Banking, and Investment Banking, provides a wide range of lending-related products and services, integrated working capital management and treasury solutions to clients, and underwriting and advisory services through our network of offices and client relationship teams. Our lending products and services include commercial loans, leases, commitment facilities, trade finance, real estate lending and asset-based lending. Our treasury solutions business includes treasury management, foreign exchange and short-term investing options. We also provide investment banking products to our clients such as debt and equity underwriting and distribution, and merger-related and other advisory services. Underwriting debt and equity issuances, fixed-income and equity research, and certain market-based activities are executed through our global broker-dealer affiliates which are our primary dealers in several countries. Within Global Banking, Global Commercial Banking clients generally include middle-market companies, commercial real estate firms, auto dealerships and not-for-profit companies. Global Corporate Banking includes large global corporations, financial institutions and leasing clients.
Net income for Global Bankingincreased$462 million to $5.4 billion in 2014 compared to 2013 primarily driven by a reduction in the provision for credit losses and, to a lesser degree, an increase in revenue, partially offset by higher noninterest expense. Revenue increased$119 million to $16.6 billion in 2014 primarily from higher net interest income.
The provision for credit losses decreased $739 million to $336 million in 2014 driven by improved credit quality in the current year, and the prior year included increased reserves from loan growth. Noninterest expense increased $130 million to $7.7 billion in 2014 primarily from additional client-facing personnel expense and higher litigation expense.
Return on average allocated capital was 18 percent in 2014, down from 22 percent in 2013 as growth in earnings was more than offset by increased capital allocations. For more information on capital allocated to the business segments, see Business Segment Operations on page 34.
Global Corporate and Global Commercial Banking
Global Corporate and Global Commercial Banking each include Business Lending and Global Transaction Services (formerly Global Treasury Services) activities. Business Lending includes various lending-related products and services and related hedging activities including commercial loans, leases, commitment facilities, trade finance, real estate lending and asset-based
lending. Global Transaction Services includes deposits, treasury management, credit card, foreign exchange, and short-term investment and custody solutions to corporate and commercial banking clients.
The table below presents a summary of Global Corporate and Global Commercial Banking results, which exclude certain capital markets activity in Global Banking.
|
| | | | | | | | | | | | | | | | | | | | | | | | |
| | | | | | | | | | | | | |
| Global Corporate and Global Commercial Banking | | | | | | | | | | |
| | | | | | | | | | | |
| | | Global Corporate Banking | | Global Commercial Banking | | Total |
| (Dollars in millions) | 2014 | | 2013 | | 2014 |
| 2013 | | 2014 | | 2013 |
| Revenue | | | | | | | | | | | |
| Business Lending | $ | 3,421 |
| | $ | 3,432 |
| | $ | 3,936 |
| | $ | 3,967 |
| | $ | 7,357 |
| | $ | 7,399 |
|
| Global Transaction Services | 3,027 |
| | 2,804 |
| | 2,893 |
| | 2,939 |
| | 5,920 |
| | 5,743 |
|
| Total revenue, net of interest expense | $ | 6,448 |
| | $ | 6,236 |
| | $ | 6,829 |
| | $ | 6,906 |
| | $ | 13,277 |
| | $ | 13,142 |
|
| | | | | | | | | | | | |
| Balance Sheet | | | | | | | | | | | | |
| Average | | | | | | | | | | | |
| Total loans and leases | $ | 129,610 |
| | $ | 126,630 |
| | $ | 140,539 |
| | $ | 130,606 |
| | $ | 270,149 |
| | $ | 257,236 |
|
| Total deposits | 143,649 |
| | 128,198 |
| | 117,664 |
| | 108,532 |
| | 261,313 |
| | 236,730 |
|
| | | | | | | | | | | | |
| Year end | | | | | | | | | | | |
| Total loans and leases | $ | 131,019 |
| | $ | 130,066 |
| | $ | 141,555 |
| | $ | 139,401 |
| | $ | 272,574 |
| | $ | 269,467 |
|
| Total deposits | 130,557 |
| | 144,312 |
| | 120,787 |
| | 120,860 |
| | 251,344 |
| | 265,172 |
|
Business Lending revenue in Global Corporate Banking and Global Commercial Banking remained relatively unchanged in 2014 compared to 2013 as the impact of growth in average loan balances was offset by spread compression.
Global Transaction Services revenue in Global Corporate Banking increased $223 million in 2014 driven by the impact of growth in U.S. and non-U.S. deposit balances. Global Transaction Services revenue in Global Commercial Banking remained relatively unchanged as the impact of higher deposit balances was more than offset by spread compression.
Average loans and leases in Global Corporate and Global Commercial Banking increased five percent in 2014 driven by growth in the commercial and industrial and commercial real estate portfolios. Average deposits in Global Corporate and Global Commercial Banking increased 10 percent in 2014 due to client liquidity and international growth.
Investment Banking
Client teams and product specialists underwrite and distribute debt, equity and loan products, and provide advisory services and tailored risk management solutions. The economics of most investment banking and underwriting activities are shared primarily between Global Banking and Global Markets based on the activities performed by each segment. To provide a complete discussion of
our consolidated investment banking fees, the table below presents total Corporation investment banking fees including the portion attributable to Global Banking.
|
| | | | | | | | | | | | | | | |
| | | | | | | | |
| Investment Banking Fees | | | | |
| | | | | | |
| | Global Banking | | Total Corporation |
| (Dollars in millions) | 2014 |
| 2013 | | 2014 | | 2013 |
| Products | | | | | | | |
| Advisory | $ | 1,098 |
| | $ | 1,019 |
| | $ | 1,207 |
| | $ | 1,125 |
|
| Debt issuance | 1,532 |
| | 1,620 |
| | 3,583 |
| | 3,804 |
|
| Equity issuance | 583 |
| | 595 |
| | 1,490 |
| | 1,472 |
|
| Gross investment banking fees | 3,213 |
| | 3,234 |
| | 6,280 |
| | 6,401 |
|
| Self-led deals | (91 | ) | | (92 | ) | | (215 | ) | | (275 | ) |
| Total investment banking fees | $ | 3,122 |
| | $ | 3,142 |
| | $ | 6,065 |
| | $ | 6,126 |
|
Total Corporation investment banking fees of $6.1 billion, excluding self-led deals, included within Global Banking and Global Markets, remained relatively unchanged in 2014 compared to 2013 as strong investment-grade underwriting and advisory fees were offset by lower underwriting fees for other debt products.
Global Markets
|
| | | | | | | | | | | |
| | | | | | | |
| (Dollars in millions) | 2014 | | 2013 | | % Change |
| Net interest income (FTE basis) | $ | 3,986 |
| | $ | 4,224 |
| | (6 | )% |
| Noninterest income: | | | | | |
| Investment and brokerage services | 2,163 |
| | 2,046 |
| | 6 |
|
| Investment banking fees | 2,743 |
| | 2,724 |
| | 1 |
|
| Trading account profits | 5,997 |
| | 6,734 |
| | (11 | ) |
| All other income (loss) | 1,230 |
| | (338 | ) | | n/m |
|
| Total noninterest income | 12,133 |
| | 11,166 |
| | 9 |
|
| Total revenue, net of interest expense (FTE basis) | 16,119 |
| | 15,390 |
| | 5 |
|
| | | | | | |
| Provision for credit losses | 110 |
| | 140 |
| | (21 | ) |
| Noninterest expense | 11,771 |
| | 11,996 |
| | (2 | ) |
| Income before income taxes (FTE basis) | 4,238 |
| | 3,254 |
| | 30 |
|
| Income tax expense (FTE basis) | 1,519 |
| | 2,101 |
| | (28 | ) |
| Net income | $ | 2,719 |
| | $ | 1,153 |
| | 136 |
|
| | | | | | |
| Return on average allocated capital | 8 | % | | 4 | % | | |
| Efficiency ratio (FTE basis) | 73.03 |
| | 77.94 |
| | |
| | | | | | |
| Balance Sheet | | | | | | |
| | | | | | |
| Average | | | | | |
Total trading-related assets (1) | $ | 449,814 |
| | $ | 468,934 |
| | (4 | ) |
| Total loans and leases | 62,064 |
| | 60,057 |
| | 3 |
|
Total earning assets (1) | 461,179 |
| | 481,433 |
| | (4 | ) |
| Total assets | 607,538 |
| | 632,681 |
| | (4 | ) |
| Allocated capital | 34,000 |
| | 30,000 |
| | 13 |
|
| | | | | | |
| Year end | | | | | |
Total trading-related assets (1) | $ | 418,860 |
| | $ | 411,080 |
| | 2 |
|
| Total loans and leases | 59,388 |
| | 67,381 |
| | (12 | ) |
Total earning assets (1) | 421,799 |
| | 432,807 |
| | (3 | ) |
| Total assets | 579,514 |
| | 575,472 |
| | 1 |
|
| |
(1) | Trading-related assets include derivative assets, which are considered non-earning assets. |
n/m = not meaningful
Global Markets offers sales and trading services, including research, to institutional clients across fixed-income, credit, currency, commodity and equity businesses. Global Markets product coverage includes securities and derivative products in both the primary and secondary markets. Global Markets provides market-making, financing, securities clearing, settlement and custody services globally to our institutional investor clients in support of their investing and trading activities. We also work with our commercial and corporate clients to provide risk management products using interest rate, equity, credit, currency and commodity derivatives, foreign exchange, fixed-income and mortgage-related products. As a result of our market-making activities in these products, we may be required to manage risk in a broad range of financial products including government securities, equity and equity-linked securities, high-grade and high-yield corporate debt securities, syndicated loans, MBS, commodities and asset-backed securities (ABS). In addition, the economics of most investment banking and underwriting activities are shared primarily between Global Markets and Global Banking based on the activities performed by each segment. Global Banking originates certain deal-related transactions with our corporate and commercial clients that are executed and distributed by Global Markets. For more information on investment banking fees on a consolidated basis, see page 45.
Net income for Global Markets increased $1.6 billion to $2.7 billion in 2014 compared to 2013. In 2014, we adopted a funding valuation adjustment into our valuation estimates primarily to include funding costs on uncollateralized derivatives and derivatives where we are not permitted to use the collateral we receive. This change in estimate resulted in a net FVA pretax charge of $497 million. Excluding net DVA/FVA and charges in 2013 related to the U.K. corporate income tax rate reduction, net income decreased $140 million to $2.9 billion primarily driven by lower trading account profits and net interest income, partially offset by a decrease in noninterest expense, a $240 million gain in 2014 related to the initial public offering (IPO) of an equity investment and higher investment and brokerage services income. Results for 2013 included a $450 million write-down of a monoline receivable due to the settlement of a legacy matter. Net DVA/FVA losses were $240 million compared to losses of $1.2 billion in 2013. Noninterest expense decreased $225 million to $11.8 billion due to lower litigation expense and revenue-related incentives, partially offset by higher technology costs and investments in infrastructure.
Average earning assets decreased $20.3 billion to $461.2 billion in 2014 largely driven by a decrease in trading assets to further optimize the balance sheet.
Year-end loans and leases decreased $8.0 billion in 2014 due to a decrease in low-margin prime brokerage loans.
The return on average allocated capital was eight percent, up from four percent, largely driven by higher net income, partially offset by an increase in allocated capital. Excluding net DVA/FVA and charges in 2013 related to the U.K. corporate income tax rate reduction, the return on average allocated capital was eight percent, a decrease from 10 percent, driven by lower net income, excluding net DVA/FVA and the tax change, and an increase in allocated capital.
Sales and Trading Revenue
Sales and trading revenue includes unrealized and realized gains and losses on trading and other assets, net interest income, and fees primarily from commissions on equity securities. Sales and trading revenue is segregated into fixed income (government debt obligations, investment and non-investment grade corporate debt obligations, commercial mortgage-backed securities, residential mortgage-backed securities (RMBS), collateralized loan obligations (CLOs), interest rate and credit derivative contracts), currencies (interest rate and foreign exchange contracts), commodities (primarily futures, forwards, swaps and options) and equities (equity-linked derivatives and cash equity activity). The following table and related discussion present sales and trading revenue, substantially all of which is in Global Markets, with the remainder in Global Banking. In addition, the following table and related discussion present sales and trading revenue excluding the impact of net DVA/FVA, which is a non-GAAP financial measure. We believe the use of this non-GAAP financial measure provides clarity in assessing the underlying performance of these businesses.
|
| | | | | | | |
| | | | |
Sales and Trading Revenue (1, 2) |
| | | | |
| (Dollars in millions) | 2014 | | 2013 |
| Sales and trading revenue | | | |
| Fixed income, currencies and commodities | $ | 8,706 |
| | $ | 8,231 |
|
| Equities | 4,215 |
| | 4,180 |
|
| Total sales and trading revenue | $ | 12,921 |
| | $ | 12,411 |
|
| | | | |
Sales and trading revenue, excluding net DVA/FVA (3) | | | |
| Fixed income, currencies and commodities | $ | 9,013 |
| | $ | 9,345 |
|
| Equities | 4,148 |
| | 4,224 |
|
| Total sales and trading revenue, excluding net DVA/FVA | $ | 13,161 |
| | $ | 13,569 |
|
| |
(1) | Includes FTE adjustments of $181 million and $180 million for 2014 and 2013. For more information on sales and trading revenue, see Note 2 – Derivativesto the Consolidated Financial Statements. |
| |
(2) | Includes Global Banking sales and trading revenue of $382 million and $385 million for 2014 and 2013. |
| |
(3) | FICC and Equities sales and trading revenue, excluding the impact of net DVA and FVA, is a non-GAAP financial measure. FICC net DVA/FVA losses were $307 million for 2014 compared to net DVA losses of $1.1 billion in 2013. Equities net DVA/FVA gains were $67 million for 2014 compared to net DVA losses of $44 million in 2013. |
Fixed-income, currency and commodities (FICC) revenue, excluding net DVA/FVA, decreased$332 million to $9.0 billion driven by declines in the rates and credit-related businesses due to both lower market volumes and volatility, partially offset by improvement in the commodities business. The prior year included a $450 million write-down of a monoline receivable related to the settlement of a legacy matter. Equities revenue, excluding net DVA/FVA, decreased$76 million to $4.1 billion due to financing additional liquid asset buffers, pursuant to current regulatory requirements, primarily in our broker-dealer entities, which also negatively impacted FICC results.
All Other
|
| | | | | | | | | | | |
| | | | | | | |
| (Dollars in millions) | 2014 | | 2013 | | % Change |
| Net interest income (FTE basis) | $ | (516 | ) | | $ | 982 |
| | n/m |
|
| Noninterest income: | | | | | |
| Card income | 356 |
| | 328 |
| | 9 | % |
| Equity investment income | 601 |
| | 2,610 |
| | (77 | ) |
| Gains on sales of debt securities | 1,311 |
| | 1,230 |
| | 7 |
|
| All other loss | (2,467 | ) | | (2,587 | ) | | (5 | ) |
| Total noninterest income | (199 | ) | | 1,581 |
| | n/m |
|
| Total revenue, net of interest expense (FTE basis) | (715 | ) | | 2,563 |
| | n/m |
|
| | | | | | |
| Provision (benefit) for credit losses | (978 | ) | | (666 | ) | | 47 |
|
| Noninterest expense | 2,881 |
| | 4,559 |
| | (37 | ) |
| Loss before income taxes (FTE basis) | (2,618 | ) | | (1,330 | ) | | 97 |
|
| Income tax benefit (FTE basis) | (2,622 | ) | | (2,042 | ) | | 28 |
|
| Net income | $ | 4 |
| | $ | 712 |
| | (99 | ) |
| | | | | | | |
| Balance Sheet | | | | | | |
| | | | | | | |
| Average | | | | | |
| Loans and leases: | | | | | |
| Residential mortgage | $ | 180,249 |
| | $ | 208,535 |
| | (14 | ) |
| Non-U.S. credit card | 11,511 |
| | 10,861 |
| | 6 |
|
| Other | 10,752 |
| | 16,064 |
| | (33 | ) |
| Total loans and leases | 202,512 |
| | 235,460 |
| | (14 | ) |
Total assets (1) | 160,272 |
| | 216,012 |
| | (26 | ) |
| Total deposits | 30,255 |
| | 34,919 |
| | (13 | ) |
| | | | | | | |
| Year end | | | | | |
| Loans and leases: | | | | |
|
|
| Residential mortgage | $ | 155,595 |
| | $ | 197,061 |
| | (21 | ) |
| Non-U.S. credit card | 10,465 |
| | 11,541 |
| | (9 | ) |
| Other | 6,552 |
| | 12,088 |
| | (46 | ) |
| Total loans and leases | 172,612 |
| | 220,690 |
| | (22 | ) |
Total assets (1) | 142,812 |
| | 167,624 |
| | (15 | ) |
| Total deposits | 18,898 |
| | 27,912 |
| | (32 | ) |
| |
(1) | In segments where the total of liabilities and equity exceeds assets, which are generally deposit-taking segments, we allocate assets from All Other to those segments to match liabilities (i.e., deposits) and allocated shareholders’ equity. Such allocated assets were $595.2 billion and $538.8 billion for 2014 and 2013, and $589.9 billion and $569.8 billion at December 31, 2014 and 2013. |
n/m = not meaningful
All Other consists of ALM activities, equity investments, the international consumer card business, liquidating businesses, residual expense allocations and other. ALM activities encompass the whole-loan residential mortgage portfolio and investment securities, interest rate and foreign currency risk management activities including the residual net interest income allocation, the impact of certain allocation methodologies and accounting hedge ineffectiveness. Additionally, certain residential mortgage loans that are managed by Legacy Assets & Servicing are held in All Other. The results of certain ALM activities are allocated to our business segments. For more information on our ALM activities, see Interest Rate Risk Management for Non-trading Activities on page 105. Equity investments include GPI which is comprised of a portfolio of equity, real estate and other alternative investments. These investments are made either directly in a company or held through a fund with related income recorded in equity investment income. In connection with our strategy to focus on our core businesses and to conform with the Volcker Rule, the GPI portfolio has been actively winding down over the last several years through a series of portfolio and individual asset sale transactions.
Net income for All Other decreased $708 million to $4 million in 2014 primarily due to the negative impact on net interest income of market-related premium amortization expense on debt securities of $1.2 billion compared to a benefit of $784 million in 2013 as lower long-term interest rates shortened the expected lives of the securities, a decrease of $2.0 billion in equity investment income and a $363 million increase in U.K. PPI costs. Partially offsetting these decreases were gains related to the sales of residential mortgage loans, a $312 million improvement in the provision (benefit) for credit losses and a decrease of $1.7 billion in noninterest expense. The provision (benefit) for credit losses improved $312 million to a benefit of $978 million in 2014 primarily driven by the impact of recoveries related to nonperforming and delinquent loan sales, partially offset by a slower pace of credit quality improvement related to the residential mortgage portfolio. Noninterest expense decreased $1.7 billion to $2.9 billion primarily due to a decline in litigation expense, lower net occupancy expense and a decline in professional fees. Also offsetting the decrease was a $580 million increase in the income tax benefit. For more information on the U.K. PPI costs, see Note 12 – Commitments and Contingencies to the Consolidated Financial Statements.
The income tax benefit was $2.6 billion in 2014 compared to a benefit of $2.0 billion in 2013 with the increase driven by the increase in the pretax loss in All Other and the resolution of several tax examinations, partially offset by a decrease in benefits from non-U.S. restructurings.
Equity Investment Activity
The following tables present the components of equity investments in All Other at December 31, 2014 and 2013, and also a reconciliation to the total consolidated equity investment income for 2014 and 2013.
|
| | | | | | | |
| | | | |
| Equity Investments | | | |
| | | | |
| | December 31 |
| (Dollars in millions) | 2014 | | 2013 |
| Global Principal Investments | $ | 912 |
| | $ | 1,604 |
|
| Strategic and other investments | 858 |
| | 822 |
|
Total equity investments included in All Other | $ | 1,770 |
| | $ | 2,426 |
|
Equity investments included in All Otherdecreased$656 million to $1.8 billion during 2014, with the decrease primarily due to sales resulting from the continued wind down of the GPI portfolio. GPI had unfunded equity commitments of $31 million and $127 million at December 31, 2014 and 2013.
|
| | | | | | | |
| | | | |
| Equity Investment Income | | | |
| | | | |
| (Dollars in millions) | 2014 | | 2013 |
| Global Principal Investments | $ | (46 | ) | | $ | 379 |
|
| Strategic and other investments | 647 |
| | 2,231 |
|
Total equity investment income included in All Other | 601 |
| | 2,610 |
|
| Total equity investment income included in the business segments | 529 |
| | 291 |
|
| Total consolidated equity investment income | $ | 1,130 |
| | $ | 2,901 |
|
Equity investment income decreased $1.8 billion primarily due to a $753 million gain related to the sale of our remaining investment in China Construction Bank Corporation (CCB) in 2013, lower gains on sales of portions of an equity investment compared to 2013, and lower GPI results. These declines were partially offset by a gain in 2014 related to the IPO of an equity investment.
Off-Balance Sheet Arrangements and Contractual Obligations
We have contractual obligations to make future payments on debt and lease agreements. Additionally, in the normal course of business, we enter into contractual arrangements whereby we commit to future purchases of products or services from unaffiliated parties. Purchase obligations are defined as obligations that are legally binding agreements whereby we agree to purchase products or services with a specific minimum quantity at a fixed, minimum or variable price over a specified period of time. Included in purchase obligations are vendor contracts, the most significant of which include communication services, processing services and software contracts. Other long-term liabilities include our contractual funding obligations related to the Qualified Pension Plans, Non-U.S. Pension Plans, Nonqualified and Other Pension Plans, and Postretirement Health and Life Plans (collectively, the Plans). Obligations to the Plans are based on the current and projected obligations of the Plans, performance of the Plans’ assets and any participant contributions, if applicable.
During 2014 and 2013, we contributed $234 million and $290 million to the Plans, and we expect to make $244 million of contributions during 2015. The Plans are more fully discussed in Note 17 – Employee Benefit Plansto the Consolidated Financial Statements.
Debt, lease, equity and other obligations are more fully discussed in Note 11 – Long-term Debt and Note 12 – Commitments and Contingencies to the Consolidated Financial Statements.
We enter into commitments to extend credit such as loan commitments, standby letters of credit (SBLCs) and commercial letters of credit to meet the financing needs of our customers. For a summary of the total unfunded, or off-balance sheet, credit extension commitment amounts by expiration date, see Credit Extension Commitments in Note 12 – Commitments and Contingenciesto the Consolidated Financial Statements.
Table 11 includes certain contractual obligations at December 31, 2014.
|
| | | | | | | | | | | | | | | | | | | | |
| | | | | | | | | | | |
| Table 11 | Contractual Obligations |
| | | | | | | | | | | |
| | | December 31, 2014 |
| (Dollars in millions) | Due in One Year or Less | | Due After
One Year Through Three Years | | Due After
Three Years Through Five Years | | Due After Five Years | | Total |
| Long-term debt | $ | 30,724 |
| | $ | 80,753 |
| | $ | 49,136 |
| | $ | 82,526 |
| | $ | 243,139 |
|
| Operating lease obligations | 2,553 |
| | 4,157 |
| | 2,725 |
| | 4,971 |
| | 14,406 |
|
| Purchase obligations | 2,077 |
| | 2,864 |
| | 361 |
| | 242 |
| | 5,544 |
|
| Time deposits | 75,604 |
| | 5,865 |
| | 1,640 |
| | 1,734 |
| | 84,843 |
|
| Other long-term liabilities | 1,470 |
| | 928 |
| | 698 |
| | 1,136 |
| | 4,232 |
|
Estimated interest expense on long-term debt and time deposits (1) | 5,036 |
| | 10,511 |
| | 7,665 |
| | 12,323 |
| | 35,535 |
|
| Total contractual obligations | $ | 117,464 |
| | $ | 105,078 |
| | $ | 62,225 |
| | $ | 102,932 |
| | $ | 387,699 |
|
| |
(1) | Represents forecasted net interest expense on long-term debt and time deposits. Forecasts are based on the contractual maturity dates of each liability, and are net of derivative hedges, where applicable. |
Representations and Warranties
We securitize first-lien residential mortgage loans generally in the form of RMBS guaranteed by the government-sponsored enterprises (GSEs) or by the Government National Mortgage Association (GNMA) in the case of Federal Housing Administration (FHA)-insured, U.S. Department of Veterans Affairs (VA)-guaranteed and Rural Housing Service-guaranteed mortgage loans, and sell pools of first-lien residential mortgage loans in the form of whole loans. In addition, in prior years, legacy companies and certain subsidiaries sold pools of first-lien residential mortgage loans and home equity loans as private-label securitizations (in certain of these securitizations, monoline insurers or other financial guarantee providers insured all or some of the securities) or in the form of whole loans. In connection with these transactions, we or certain of our subsidiaries or legacy companies make or have made various representations and warranties. Breaches of these representations and warranties have resulted in and may continue to result in the requirement to repurchase mortgage loans or to otherwise make whole or provide other remedies to the GSEs, U.S. Department of Housing and Urban Development (HUD) with respect to FHA-insured loans, VA, whole-loan investors, securitization trusts, monoline insurers or other financial guarantors (collectively, repurchases). In all such cases, subsequent to repurchasing the loan, we would be exposed to any credit loss on the repurchased mortgage loans, after
accounting for any mortgage insurance (MI) or mortgage guarantee payments that we may receive.
We have vigorously contested any request for repurchase when we conclude that a valid basis for repurchase does not exist and will continue to do so in the future. However, in an effort to resolve these legacy mortgage-related issues, we have reached settlements, certain of which have been for significant amounts, in lieu of a loan-by-loan review process, including with the GSEs, four monoline insurers and Bank of New York Mellon (BNY Mellon), as trustee. The settlement with BNY Mellon (BNY Mellon Settlement) remains subject to final court approval and certain other conditions. It is not currently possible to predict the ultimate outcome or timing of the court approval process, which includes appeals and could take a substantial period of time. If final court approval is not obtained, or if we and Countrywide Financial Corporation (Countrywide) withdraw from the BNY Mellon Settlement in accordance with its terms, our future representations and warranties losses could be substantially different from existing accruals and the estimated range of possible loss over existing accruals.
For more information on accounting for representations and warranties, repurchase claims and exposures, including a summary of the larger bulk settlements, see Note 7 – Representations and Warranties Obligations and Corporate Guarantees and Note 12 – Commitments and Contingencies to the
Consolidated Financial Statements and Item 1A. Risk Factors of this Annual Report on Form 10-K.
Unresolved Repurchase Claims
Unresolved representations and warranties repurchase claims represent the notional amount of repurchase claims made by counterparties, typically the outstanding principal balance or the unpaid principal balance at the time of default. In the case of first-lien mortgages, the claim amount is often significantly greater than the expected loss amount due to the benefit of collateral and, in some cases, MI or mortgage guarantee payments. Claims received from a counterparty remain outstanding until the underlying loan is repurchased, the claim is rescinded by the counterparty or the representations and warranties claims with respect to the applicable trust are settled, and fully and finally released. When a claim is denied and the Corporation does not receive a response from the counterparty, the claim remains in the unresolved repurchase claims balance until resolution.
At December 31, 2014, we had $22.4 billion of unresolved repurchase claims, net of duplicate claims, compared to $18.7 billion at December 31, 2013. These repurchase claims relate primarily to private-label securitizations and include claims in the amount of $4.7 billion, net of duplicate claims, where we believe the statute of limitations has expired under current law. For additional information, see Note 7 – Representations and Warranties Obligations and Corporate Guarantees to the Consolidated Financial Statements.
The continued increase in the notional amount of unresolved repurchase claims during 2014 is primarily due to: (1) continued submission of claims by private-label securitization trustees, (2) the level of detail, support and analysis accompanying such claims, which impact overall claim quality and, therefore, claims resolution, (3) the lack of an established process to resolve disputes related to these claims, (4) the submission of claims where we believe the statute of limitations has expired under current law and (5) the submission of duplicate claims, often in multiple submissions, on the same loan. For example, claims submitted without individual file reviews generally lack the level of detail and analysis of individual loans found in other claims that is necessary to support a claim. Absent any settlements, the Corporation expects unresolved repurchase claims related to private-label securitizations to increase as such claims continue to be submitted and there is not an established process for the ultimate resolution of such claims on which there is a disagreement.
In addition to unresolved repurchase claims, we have received notifications pertaining to loans for which we have not received a repurchase request from sponsors of third-party securitizations with whom we engaged in whole-loan transactions and that we may owe indemnity obligations. These notifications totaled $2.0 billion and $737 million at December 31, 2014 and 2013.
We also from time to time receive correspondence purporting to raise representations and warranties breach issues from entities that do not have contractual standing or ability to bring such claims. We believe such communications to be procedurally and/or substantively invalid, and generally do not respond to such correspondence.
The presence of repurchase claims on a given trust, receipt of notices of indemnification obligations and other communication, as discussed above, are all factors that inform our estimated liability for obligations under representations and warranties and the corresponding estimated range of possible loss.
Representations and Warranties Liability
The liability for representations and warranties and corporate guarantees is included in accrued expenses and other liabilities on the Consolidated Balance Sheet and the related provision is included in mortgage banking income in the Consolidated Statement of Income. For more information on the representations and warranties liability and the corresponding estimated range of possible loss, see Off-Balance Sheet Arrangements and Contractual Obligations – Estimated Range of Possible Loss on page 53.
At December 31, 2014 and 2013, the liability for representations and warranties was $12.1 billion and $13.3 billion. For 2014, the representations and warranties provision was $683 million compared to $840 million for 2013.
Our estimated liability at December 31, 2014 for obligations under representations and warranties is necessarily dependent on, and limited by a number of factors including for private-label securitizations the implied repurchase experience based on the BNY Mellon Settlement, as well as certain other assumptions and judgmental factors. Accordingly, future provisions associated with obligations under representations and warranties may be materially impacted if actual experiences are different from historical experience or our understandings, interpretations or assumptions. Although we have not recorded any representations and warranties liability for certain potential private-label securitization and whole-loan exposures where we have had little to no claim activity, or where the applicable statute of limitations has expired under current law, these exposures are included in the estimated range of possible loss.
Experience with Government-sponsored Enterprises
As a result of various settlements with the GSEs, we have resolved substantially all outstanding and potential representations and warranties repurchase claims on whole loans sold by legacy Bank of America and Countrywide to Fannie Mae (FNMA) and Freddie Mac (FHLMC) through June 30, 2012 and December 31, 2009, respectively. For additional information, see Note 7 – Representations and Warranties Obligations and Corporate Guarantees to the Consolidated Financial Statements.
Experience with Investors Other than Government-sponsored Enterprises
In prior years, legacy companies and certain subsidiaries sold pools of first-lien residential mortgage loans and home equity loans as private-label securitizations or in the form of whole loans to investors other than GSEs (although the GSEs are investors in certain private-label securitizations). Such loans originated from 2004 through 2008 had an original principal balance of $970 billion, including $786 billion sold to private-label and whole-loan investors without monoline insurance and $185 billion with monoline insurance. Of the $970 billion, $574 billion in principal has been paid, $201 billion in principal has defaulted, $44 billion in principal was severely delinquent, and $151 billion in principal was current or less than 180 days past due at December 31, 2014 as summarized in Table 12. Of the original principal balance of $716 billion for Countrywide, $409 billion is included in the BNY Mellon Settlement and, of this amount, $109 billion was defaulted or severely delinquent at December 31, 2014.
|
| | | | | | | | | | | | | | | | | | | | | | | | | | | | | | | | | | | | |
| | | | | | | | | | | | | | | | | | | |
| Table 12 | Overview of Non-Agency Securitization and Whole-loan Balances from 2004 to 2008 |
| | | | | | | | | | | | | | | | | | | |
| | Principal Balance | | Defaulted or Severely Delinquent |
(Dollars in billions)
By Entity | Original Principal Balance | | Outstanding
Principal Balance December 31, 2014 | | Outstanding
Principal Balance 180 Days or More Past Due | | Defaulted Principal Balance | | Defaulted or Severely Delinquent | | Borrower Made Less than 13 Payments | | Borrower
Made 13 to 24 Payments | | Borrower
Made 25 to 36 Payments | | Borrower
Made More than 36 Payments |
| Bank of America | $ | 100 |
| | $ | 15 |
| | $ | 3 |
| | $ | 7 |
| | $ | 10 |
| | $ | 1 |
| | $ | 2 |
| | $ | 2 |
| | $ | 5 |
|
| Countrywide | 716 |
| | 153 |
| | 35 |
| | 150 |
| | 185 |
| | 24 |
| | 44 |
| | 44 |
| | 73 |
|
| Merrill Lynch | 72 |
| | 13 |
| | 3 |
| | 18 |
| | 21 |
| | 3 |
| | 4 |
| | 3 |
| | 11 |
|
| First Franklin | 82 |
| | 14 |
| | 3 |
| | 26 |
| | 29 |
| | 5 |
| | 6 |
| | 5 |
| | 13 |
|
Total (1, 2) | $ | 970 |
| | $ | 195 |
| | $ | 44 |
| | $ | 201 |
| | $ | 245 |
| | $ | 33 |
| | $ | 56 |
| | $ | 54 |
| | $ | 102 |
|
| By Product | |
| | |
| | |
| | |
| | |
| | |
| | |
| | |
| | |
|
| Prime | $ | 302 |
| | $ | 55 |
| | $ | 7 |
| | $ | 27 |
| | $ | 34 |
| | $ | 2 |
| | $ | 6 |
| | $ | 7 |
| | $ | 19 |
|
| Alt-A | 173 |
| | 44 |
| | 10 |
| | 40 |
| | 50 |
| | 7 |
| | 12 |
| | 11 |
| | 20 |
|
| Pay option | 150 |
| | 32 |
| | 10 |
| | 44 |
| | 54 |
| | 5 |
| | 13 |
| | 15 |
| | 21 |
|
| Subprime | 251 |
| | 50 |
| | 15 |
| | 70 |
| | 85 |
| | 17 |
| | 20 |
| | 16 |
| | 32 |
|
| Home equity | 88 |
| | 9 |
| | — |
| | 18 |
| | 18 |
| | 2 |
| | 5 |
| | 4 |
| | 7 |
|
| Other | 6 |
| | 5 |
| | 2 |
| | 2 |
| | 4 |
| | — |
| | — |
| | 1 |
| | 3 |
|
| Total | $ | 970 |
| | $ | 195 |
| | $ | 44 |
| | $ | 201 |
| | $ | 245 |
| | $ | 33 |
| | $ | 56 |
| | $ | 54 |
| | $ | 102 |
|
| |
(1) | Excludes transactions sponsored by Bank of America and Merrill Lynch where no representations or warranties were made. |
| |
(2) | Includes exposures on third-party sponsored transactions related to legacy entity originations. |
As it relates to private-label securitizations, we believe a contractual liability to repurchase mortgage loans generally arises if there is a breach of representations and warranties that materially and adversely affects the interest of the investor or all the investors in a securitization trust or of the monoline insurer or other financial guarantor (as applicable). We believe many of the loan defaults observed in these securitizations and whole-loan transactions were driven by external factors like the substantial depreciation in home prices experienced after the economic downturn, persistently high unemployment and other negative economic trends, diminishing the likelihood that any loan defect, to the extent any exists, was the cause of a loan’s default.
Experience with Private-label Securitization and Whole Loan Investors
Legacy entities, and to a lesser extent Bank of America, sold loans to investors via private-label securitizations or as whole loans. The majority of the loans sold were included in private-label securitizations, including third-party sponsored transactions. We provided representations and warranties to the whole-loan investors and these investors may retain those rights even when the whole loans were aggregated with other collateral into private-label securitizations sponsored by the whole-loan investors. Loans originated between 2004 and 2008 and sold without monoline insurance had an original total principal balance of $786 billion included in Table 12. Of the $786 billion, $469 billion have been paid in full and $193 billion were defaulted or severely delinquent at December 31, 2014. At least 25 payments have been made on approximately 64 percent of the defaulted and severely delinquent loans.
We have received approximately $33 billion of representations and warranties repurchase claims related to these vintages, including $24 billion from private-label securitization trustees and a financial guarantee provider, $8 billion from whole-loan investors and $815 million from one private-label securitization counterparty. Continued high levels of new private-label claims are primarily related to repurchase requests received from trustees for private-label securitization transactions not included in the BNY Mellon Settlement. We have resolved $9 billion of these claims with losses of $2 billion. The majority of these resolved claims were from third-party whole-loan investors. Approximately $4 billion of these claims were resolved through repurchase or indemnification, $5 billion were rescinded by the investor and $336 million were resolved through settlements. As of December 31, 2014, 15 percent of the whole-loan claims for loans originated between 2004 and 2008 that we initially denied have subsequently been resolved through repurchase or make-whole payments and 45 percent have been resolved through rescission of the claim by the counterparty or repayment in full by the borrower. At December 31, 2014, for loans originated between 2004 and 2008, the notional amount of unresolved repurchase claims submitted by private-label securitization trustees, whole-loan investors, including third-party securitization sponsors and others was $24 billion, including $3 billion of duplicate claims primarily submitted without a loan file review. We have performed an initial review with respect to substantially all of these claims and although we do not believe a valid basis for repurchase has been established by the claimant, we consider claims activity in the computation of our liability for representations and warranties. Until we receive a repurchase claim, we generally do not review loan files related to private-label securitizations and believe we are not required by the governing documents to do so.
Experience with Monoline Insurers
During 2014, we had limited loan-level representations and warranties repurchase claims experience with the monoline insurers due to settlements and ongoing litigation with a single monoline insurer. For more information related to the monolines, see Note 7 – Representations and Warranties Obligations and Corporate Guarantees and Note 12 – Commitments and Contingencies to the Consolidated Financial Statements.
Estimated Range of Possible Loss
We currently estimate that the range of possible loss for representations and warranties exposures could be up to $4 billion over existing accruals at December 31, 2014. The estimated range of possible loss reflects principally non-GSE exposures. It represents a reasonably possible loss, but does not represent a probable loss, and is based on currently available information, significant judgment and a number of assumptions that are subject to change.
For more information on the methodology used to estimate the representations and warranties liability, the corresponding estimated range of possible loss and the types of losses not considered in such estimates, see Item 1A. Risk Factors of this Annual Report on Form 10-K and Note 7 – Representations and Warranties Obligations and Corporate Guaranteesto the Consolidated Financial Statements and, for more information related to the sensitivity of the assumptions used to estimate our liability for obligations under representations and warranties, see Complex Accounting Estimates – Representations and Warranties Liability on page 113.
Department of Justice Settlement
On August 20, 2014, we reached a comprehensive settlement with the DoJ and certain federal and state agencies (DoJ Settlement). The DoJ Settlement included releases for securitization, origination, sale and other specified conduct relating to RMBS and collateralized debt obligations (CDOs), and an origination release on specified populations of residential mortgage loans sold to GSEs and private-label RMBS trusts. The DoJ Settlement resolved certain actual and potential civil claims by the DoJ, the Securities and Exchange Commission and State Attorneys General from six states, the FHA and GNMA, as well as all pending RMBS claims against Bank of America entities brought by the FDIC. For FHA-insured loans originated on or after May 1, 2009, we also received a release of origination liability for loans only if an insurance claim had been submitted to the FHA prior to January 1, 2014. If a claim had not been submitted by that date, we did not receive a release and we may be exposed to losses on such loans. For more information on FHA-insured loans originated on or before April 30, 2009, see Off-Balance Sheet Arrangements and Contractual Obligations – National Mortgage Settlement on page 54.
As part of the DoJ Settlement, we paid civil monetary penalties and compensatory remediation payments totaling $9.65 billion in 2014 and agreed to provide $7.0 billion worth of creditable consumer relief activities primarily in the form of mortgage modifications, including first-lien principal forgiveness and forbearance modifications and second- and junior-lien extinguishments, low- to moderate-income mortgage originations, and community reinvestment and neighborhood stabilization efforts, with initiatives focused on communities experiencing, or
at risk of, blight. In addition, we recorded $400 million of provision for credit losses for additional costs associated with the consumer relief portion of the settlement. Also, we will support the expansion of available affordable rental housing. We have committed to complete delivery of the consumer relief by no later than August 31, 2018. The consumer relief requirements are subject to oversight by an independent monitor.
Servicing, Foreclosure and Other Mortgage Matters
We service a large portion of the loans we or our subsidiaries have securitized and also service loans on behalf of third-party securitization vehicles and other investors. Our servicing obligations are set forth in servicing agreements with the applicable counterparty. These obligations may include, but are not limited to, loan repurchase requirements in certain circumstances, indemnifications, payment of fees, advances for foreclosure costs that are not reimbursable, or responsibility for losses in excess of partial guarantees for VA loans.
Servicing agreements with the GSEs generally provide the GSEs with broader rights relative to the servicer than are found in servicing agreements with private investors. For example, the GSEs claim that they have the contractual right to demand indemnification or loan repurchase for certain servicing breaches. In addition, the GSEs’ first-lien mortgage seller/servicer guides provide timelines to resolve delinquent loans through workout efforts or liquidation, if necessary, and purport to require the imposition of compensatory fees if those deadlines are not satisfied except for reasons beyond the control of the servicer. In addition, many non-agency RMBS and whole-loan servicing agreements state that the servicer may be liable for failure to perform its servicing obligations in keeping with industry standards or for acts or omissions that involve willful malfeasance, bad faith or gross negligence in the performance of, or reckless disregard of, the servicer’s duties.
It is not possible to reasonably estimate our liability with respect to certain potential servicing-related claims. While we have recorded certain accruals for servicing-related claims, the amount of potential liability in excess of existing accruals could be material to the Corporation’s results of operations or cash flows for any particular reporting period.
2013 IFR Acceleration Agreement
On January 7, 2013, we and other mortgage servicing institutions entered into an agreement in principle with the Office of the Comptroller of the Currency (OCC) and the Federal Reserve to cease the Independent Foreclosure Review (IFR) that had commenced pursuant to consent orders entered into by Bank of America with the Federal Reserve (2011 FRB Consent Order) and the 2011 OCC Consent Order entered into between BANA and the OCC and replaced it with an accelerated remediation process (2013 IFR Acceleration Agreement). The 2013 IFR Acceleration Agreement requires us to provide $1.8 billion of borrower assistance in the form of loan modifications and other foreclosure prevention actions, and in addition, we made a cash payment of $1.1 billion into a qualified settlement fund in 2013. The borrower assistance program is not expected to result in any incremental credit provision, as we believe that the existing allowance for credit losses is adequate to absorb any costs that have not already been recorded as charge-offs.
Financial Reform Act
The Financial Reform Act which was signed into law on July 21, 2010, enacted sweeping financial regulatory reform across the financial services industry, including significant changes regarding capital adequacy and hascapital planning, stress testing, resolution planning, derivatives activities, prohibitions on proprietary trading and restrictions on debit interchange fees. As a result of the Financial Reform Act, we have altered and will continue to alter the way in which we conduct certain businesses, increase ourbusinesses. Our costs and reduce our revenues. Many aspectsrevenues could continue to be negatively impacted as additional final rules of the Financial Reform Act remain subject to final rulemaking which will take effect over several years, making it difficult to anticipate the precise impact on the Corporation, our customers or the financial services industry.
Debit Interchange Fees
On June 29, 2011, the Federal Reserve adopted a final rule with respect to the Durbin Amendment effective on October 1, 2011 which, among other things, established a regulatory cap for many types of debit interchange transactions to equal no more than $0.21 plus five bps of the value of the transaction. The Federal Reserve also adopted a rule to allow a debit card issuer to recover $0.01 per transaction for fraud prevention purposes if the issuer complies with certain fraud-related requirements, with which we are currently in compliance. The Federal Reserve also approved rules governing routing and exclusivity, requiring issuers to offer two unaffiliated networks for routing transactions on each debit or prepaid product, which became effective April 1, 2012. On July
31, 2013, the U.S. District Court for the District of Columbia issued a ruling regarding the Federal Reserve’s rules implementing the Financial Reform Act’s Durbin Amendment. The ruling requires the Federal Reserve to reconsider the $0.21 per transaction cap on debit card interchange fees. The Federal Reserve has appealed the ruling and a decision on the appeal is expected in the first half of 2014. It is possible that revised rules could have a significant adverse impact on debit interchange revenue as well as transaction routing.
Limitations on Proprietary Trading; Sponsorship and Investment in Hedge Funds and Private Equity Funds
On December 10, 2013, the Federal Reserve, OCC, FDIC, Securities and Exchange Commission (SEC) and Commodity Futures Trading Commission (CFTC) issued final regulations under the Financial Reform Act implementing limitations on proprietary trading as well as the sponsorship of or investment in hedge funds and private equity funds (the Volcker Rule) and set a conformance period that will expire on July 21, 2015. The Volcker Rule prohibits insured depository institutions and companies affiliated with insured depository institutions (collectively, banking entities) from engaging in short-term proprietary trading of certain securities, derivatives, commodity futures and options for their own account. The Volcker Rule also imposes limits on banking entities’ investments in, and other relationships with, hedge funds or private equity funds. The Volcker Rule provides exemptions for certain activities, including market making, underwriting, hedging, trading in government obligations, insurance company activities, and organizing and offering hedge funds or private equity funds. The Volcker Rule also clarifies that certain activities are not prohibited, including acting as agent, broker or custodian. A banking entity with significant trading operations, such as the Corporation, will be required to establish a detailed compliance program to comply with the restrictions of the Volcker Rule.
The statutory provisions of the Volcker Rule became effective on July 21, 2012 and gave financial institutions two years from the effective date, with the possibility for extensions for certain investments, to bring activities and investments into compliance with the statutory provisions. The Federal Reserve has now extended the conformance period to July 21, 2015.
Although we exited our stand-alone proprietary trading business as of June 30, 2011 in anticipation of the Volcker Rule and to further our initiative to optimize our balance sheet, we are still in the process of evaluating the full impact of the Volcker Rule on our current trading activities and our ownership interests in and transactions with hedge funds, private equity funds, commodity pools and other subsidiary operations. The Volcker Rule will likely increase our operational and compliance costs, reduce our trading revenues, and adversely affect our results of operations. For more information about our trading business, see Global Markets on page 48.
Derivatives
The Financial Reform Act includes measures to broaden the scope of derivative instruments subject to regulation by requiring clearing and exchange trading of certain derivatives; imposing new capital, margin, reporting, registration and business conduct requirements for certain market participants; and imposing position limits on certain over-the-counter (OTC) derivatives. The Financial Reform Act grants to the CFTC and the SEC substantial new authority and requires numerous rulemakings by these agencies. Swap dealers
conducting dealing activity with U.S. persons above a specified dollar threshold were required to register with the CFTC on or before December 31, 2012, and this registration requirement was extended to guaranteed non-U.S. entities, requiring registration of such entities by December 31, 2013. Upon registration, swap dealers become subject to additional CFTC rules, including measures regarding clearing and exchange trading of certain derivatives, new capital and margin requirements and additional reporting, external and internal business conduct, swap documentation, portfolio compression and reconciliation requirements for derivatives. Most of these requirements, with the exception of margin, capital and exchange/swap execution facility trading, have gone into effect for us, except with respect to swaps between our non-U.S. swap dealers and some non-U.S. branches of BANA with certain non-U.S. counterparties. Swap dealers are now required to clear certain interest rate and index credit derivative transactions when facing all counterparty types unless either counterparty qualifies for the “end-user exception” to the clearing mandate. These products will also likely become subject to exchange/swap execution facility trading requirements beginning in the first quarter of 2014. The timing for margin and capital implementation remains unknown. The SEC must propose and finalize many of its security-based swaps-related rules and has, to date, implemented a small number of clearing-related and definitional rules. The Financial Reform Act also requires banking entities to “push out” certain derivatives activity to one or more non-bank affiliates.
In Europe, the European Commission and European Securities and Markets Authority (ESMA) have been granted authority to adopt and implement the European Market Infrastructure Regulation (EMIR), which regulates OTC derivatives, central counterparties and trade repositories, and imposes requirements for certain market participants with respect to derivatives reporting, clearing, business conduct and collateral. Several of our entities are subject to EMIR requirements regarding record keeping, marking to market, timely confirmation, derivative contract reporting, portfolio reconciliation and dispute resolution. Further EMIR-implementing measures are expected, but the timing is currently unknown.
The ultimate impact of the derivatives regulations that have not yet been finalized and the time it will take to comply remain uncertain. The final regulations will impose additional operational and compliance costs on us and may require us to restructure certain businesses and may negatively impact our results of operations.adopted.
Resolution Planning
TheAs a BHC with greater than $50 billion of assets, the Corporation is required by the Federal Reserve and the FDIC require that the Corporation and other BHCs with assets of $50 billion or more, as well as companies designated as systemically important by the Financial Stability Oversight Council,to annually submit annually their plansa plan for a rapid and orderly resolution in the event of material financial distress or failure.
A resolution plan is intended to be a detailed roadmap for the orderly resolution of thea BHC and material entities pursuant to the U.S. Bankruptcy Code and other applicable resolution regimes under one or more hypothetical scenarios assuming no extraordinary government assistance.
If both the Federal Reserve and the FDIC determine that our plan is not credible and we fail to cure the deficiencies are not cured in a timely manner, the Federal Reserve and the FDIC may jointly impose on us more stringent capital, leverage or liquidity requirements or restrictions on our growth, activities or operations.
|
| | |
60 Bank A description of America 2013
| | |
We submitted our 2013 plan in Octoberis available on the Federal Reserve and are required to update it annually.FDIC websites.
Similarly, in the U.K., the Prudential Regulation Authority (PRA)PRA has issued proposed rules requiring the submission of significant information about certain U.K.-incorporated subsidiaries and other financial institutions, as well as branches of non-U.K. banks located in the U.K. (including information on intra-group dependencies, legal entity separation and barriers to resolution) to allow the PRA to develop resolution plans. As a result of the PRA review, we could be required to take certain actions over the next several years which could impose operating costs and potentially result in the restructuring of certain business and subsidiaries.
The Volcker Rule
The Volcker Rule prohibits insured depository institutions and companies affiliated with insured depository institutions (collectively, banking entities) from engaging in short-term proprietary trading of certain securities, derivatives, commodity futures and options for their own account. The Volcker Rule also imposes limits on banking entities’ investments in, and other relationships with, hedge funds and private equity funds, although the Federal Reserve extended the conformance period for certain existing covered investments and relationships to July 2016 (with indications that the conformance period may be further extended to July 2017). The Volcker Rule provides exemptions for certain activities, including market-making, underwriting, hedging, trading in government obligations, insurance company activities, and organizing and offering hedge funds and private equity funds. The Volcker Rule also clarifies that certain activities are not prohibited, including acting as agent, broker or custodian. A banking entity with significant trading operations, such as the Corporation, is required to establish a detailed compliance program to comply with the restrictions of the Volcker Rule. We exited our stand-alone proprietary trading business in 2011 and continue to wind down our Global Principal Investments operations.
Derivatives
Our derivatives operations are subject to extensive regulation both in the U.S. and internationally. In the U.S., the Financial Reform Act broadens the scope of derivative instruments subject to regulation by requiring clearing and exchange trading of certain derivatives; imposing new capital, margin, reporting, registration and business conduct requirements for certain market participants; and imposing position limits on certain over-the-counter (OTC) derivatives. Additionally, in Europe, the European Commission and European Securities and Markets Authority (ESMA) have been granted authority to adopt and implement the European Market Infrastructure Regulation (EMIR), which regulates OTC derivatives, central counterparties and the trade repositories, and imposes requirements for certain market participants with respect to derivatives reporting, OTC derivatives clearing, business conduct and collateral. The adoption of many of these U.S. and European Union (EU) regulations is ongoing and their ultimate impact remains uncertain.
Capital, Liquidity and Operational Requirements
As a financial services holding company, we and our bank subsidiaries are subject to the risk-based capital guidelines issued by the Federal Reserve and other U.S. banking regulators, including the FDIC and the OCC. These rules are complex and are evolving as U.S. and international regulatory authorities propose and enact enhanced capital and liquidity rules. The Corporation seeks to manage its capital position to maintain sufficient capital to meet these regulatory guidelines and to support our business activities. These evolving capital and liquidity rules are likely to influence our regulatory capital and liquidity planning processes, and require additional capital and liquidity, and may impose additional operational and compliance costs on the Corporation. In addition, the Federal Reserve and the OCC have adopted guidelines that
establish minimum standards for the design, implementation and board oversight of BHC’s and national banks’ risk governance frameworks.
For more information on regulatory capital rules, capital composition and pending or proposed regulatory capital changes, see Capital Management – Regulatory Capital in the MD&A on page 59, and Note 16 – Regulatory Requirements and Restrictions to the Consolidated Financial Statements, which are incorporated by reference in this Item 1.
Distributions
We are subject to various regulatory policies and requirements relating to capital actions, including payment of dividends and common stock repurchases. Many of our subsidiaries, including our bank and broker-dealer subsidiaries, are subject to laws that restrict dividend payments, or authorize regulatory bodies to block or reduce the flow of funds from those subsidiaries to the parent company or other subsidiaries. Additionally, the applicable federal regulatory authority is authorized to determine, under certain circumstances relating to the financial condition of a bank or BHC, that the payment of dividends would be an unsafe or unsound practice and to prohibit payment thereof. For instance, Federal Reserve regulations require major U.S. BHCs to submit a capital plan as part of an annual Comprehensive Capital Analysis and Review (CCAR). The purpose of the CCAR is to assess the capital planning process of the BHC, including any planned capital actions, such as payment of dividends on common stock and common stock repurchases.
Our ability to pay dividends is also affected by the various minimum capital requirements and the capital and non-capital standards established under the Federal Deposit Insurance Corporation Improvement Act of 1991 (FDICIA). The right of the Corporation, our stockholders and our creditors to participate in any distribution of the assets or earnings of our subsidiaries is further subject to the prior claims of creditors of the respective subsidiaries.
For more information regarding the requirements relating to the payment of dividends, including the minimum capital requirements, see Note 13 – Shareholders’ Equity and Note 16 – Regulatory Requirements and Restrictionsto the Consolidated Financial Statements.
Insolvency and the Orderly Liquidation Authority
Under the Federal Deposit Insurance Act, the FDIC may be appointed receiver of an insured depository institution if it is insolvent or in certain other circumstances. In addition, under the Financial Reform Act, when a systemically important financial institution such as the Corporation is in default or danger of default, the FDIC may be appointed receiver in order to conduct an orderly liquidation of such systemically important financial institution. In the event of such appointment, the FDIC could invoke a new form of resolution authority, the orderly liquidation authority, instead of the U.S. Bankruptcy Code, if the Secretary of the Treasury makes certain financial distress and systemic risk determinations. The orderly liquidation authority is modeled in part on the Federal Deposit Insurance Act, but also adopts certain concepts from the U.S. Bankruptcy Code.
In 2013, the FDIC issued a notice describing its preferred “single point of entry” strategy for resolving systemically important financial institutions. Under this approach, the FDIC could replace a distressed BHC with a bridge holding company, which could continue operations and result in an orderly resolution of the underlying bank, but whose equity is held solely for the benefit of creditors of the original BHC. Furthermore, the Federal Reserve Board has indicated that it will be proposing regulations regarding the minimum levels of long-term debt required for BHCs to ensure there is adequate loss absorbing capacity in the event of a resolution. The orderly liquidation authority contains certain differences from the U.S. Bankruptcy Code. For example, in certain circumstances, the FDIC could permit payment of obligations it determines to be systemically significant (e.g., short-term creditors or operating creditors) in lieu of paying other obligations (e.g., long-term creditors) without the need to obtain creditors’ consent or prior court review. The insolvency and resolution process could also lead to a large reduction or total elimination of the value of a BHC’s outstanding equity. For example,equity, as well as impairment or elimination of certain debt.
Deposit Insurance
Deposits placed at U.S. domiciled banks (U.S. banks) are insured by the FDIC, could followsubject to limits and conditions of applicable law and the FDIC’s regulations. Pursuant to the Financial Reform Act, FDIC insurance coverage limits were permanently increased to $250,000 per customer. All insured depository institutions are required to pay assessments to the FDIC in order to fund the Deposit Insurance Fund (DIF).
The FDIC is required to maintain at least a “single pointdesignated minimum ratio of entry” approachthe DIF to insured deposits in the U.S. The Financial Reform Act requires the FDIC to assess insured depository institutions to achieve a DIF ratio of at least 1.35 percent by September 30, 2020. The FDIC has adopted new regulations that establish a long-term target DIF ratio of greater than two percent. The DIF ratio is currently below the required targets and replacethe FDIC has adopted a distressed BHC with a bridge holding company, which could continue operations andrestoration plan that may result in an orderly resolutionincreased deposit insurance assessments. Deposit insurance assessment rates are subject to change by the FDIC and will be impacted by the overall economy and the stability of the underlyingbanking industry as a whole. For more information regarding deposit insurance, see Item 1A. Risk Factors – Regulatory, Compliance and Legal Risk on page 12.
Source of Strength
According to the Financial Reform Act and Federal Reserve policy, BHCs are expected to act as a source of financial strength to each subsidiary bank but whose equity is held solely for the benefit of creditors of the original BHC. Additionally,and to commit resources to support each such subsidiary. Similarly, under the orderly liquidation authority, amounts owed tocross-guarantee provisions of FDICIA, in the U.S. government generally receive a statutory payment priority.
Credit Risk Retention
On August 28, 2013, federal regulators jointly issued a re-proposalevent of a rule regarding credit risk retention (Credit Risk Retention Rule) that would, among other things, require sponsorsloss suffered or anticipated by the FDIC, either as a result of default of a banking subsidiary or related to retain at least five percent of the credit risk of the assets underlying certain ABS and MBS securitizations and would limit sponsors’ ability to transfer or hedge that credit risk. The proposed rule, as currently written, would likely have some adverse impacts on our ability to engage in many types of MBS and ABS securitizations and resecuritizations, impose additional operational and compliance costs, and negatively influence the value, liquidity and transferability of ABS or MBS, loans and other assets. However, it remains unclear what requirements will be included in the final rule and what the ultimate impact will be on our results of operations.
ConsumerFDIC assistance provided to such a subsidiary in danger of default, the affiliate banks of such a subsidiary may be assessed for the FDIC’s loss, subject to certain exceptions.
Consumer Regulations
Our consumer businesses are subject to extensive regulation and oversight by federal and state regulators. Certain federal consumer finance laws to which the Corporation iswe are subject, including, but not limited to, the Equal Credit Opportunity Act, the Home Mortgage Disclosure Act, the Electronic Fund Transfer Act, the Fair Credit Reporting Act, the Real Estate Settlement Procedures Act (RESPA), the Truth in Lending Act (TILA) and Truth in Savings Act, are enforced by the ConsumerCFPB. Other federal consumer finance laws, such as the Servicemembers Civil Relief Act, are enforced by the Officer of the Comptroller of the Currency.
Transactions with Affiliates
Pursuant to Section 23A and 23B of the Federal Reserve Act, as implemented by the Federal Reserve’s Regulation W, the Banks are subject to restrictions that limit certain types of transactions between the Banks and their nonbank affiliates. In general, U.S. banks are subject to quantitative and qualitative limits on extensions of credit, purchases of assets and certain other transactions involving its nonbank affiliates. Additionally, transactions between U.S. banks and their nonbank affiliates are required to be on arm’s length terms and must be consistent with standards of safety and soundness.
Privacy and Information Security
We are subject to many U.S. federal, state and international laws and regulations governing requirements for maintaining policies and procedures to protect the non-public confidential information of our customers. The Gramm-Leach-Bliley Act requires the Banks to periodically disclose Bank of America’s privacy policies and practices relating to sharing such information and enables retail customers to opt out of our ability to share information with unaffiliated third parties under certain circumstances. Other laws and regulations, at both the federal and state level, impact our ability to share certain information with affiliates and non-affiliates for marketing and/or non-marketing purposes, or to contact customers with marketing offers. The Gramm-Leach-Bliley Act also requires the Banks to implement a comprehensive information security program that includes administrative, technical, and physical safeguards to ensure the security and confidentiality of customer records and information. These security and privacy policies and procedures for the protection of personal and confidential information are in effect across all businesses and geographic locations.
Item 1A. Risk Factors
In the course of conducting our business operations, we are exposed to a variety of risks, some of which are inherent in the financial services industry and others of which are more specific to our own businesses. The discussion below addresses the most significant factors, of which we are currently aware, that could affect our businesses, results of operations and financial condition. Additional factors that could affect our businesses, results of operations and financial condition are discussed in Forward-looking Statements in the MD&A on page 22. However, other factors not discussed below or elsewhere in this Annual Report on Form 10-K could also adversely affect our businesses, results of operations and financial condition. Therefore, the risk factors below should not be considered a complete list of potential risks that we may face.
Any risk factor described in this Annual Report on Form 10-K or in any of our other Securities and Exchange Commission (SEC) filings could by itself, or together with other factors, materially adversely affect our liquidity, cash flows, competitive position, business, reputation, results of operations, capital position or financial condition, including by materially increasing our expenses or decreasing our revenues, which could result in material losses.
General Economic and Market Conditions Risk
Our businesses and results of operations may be adversely affected by the U.S. and international financial markets, U.S. and non-U.S. fiscal and monetary policy, and economic conditions generally.
Our businesses and results of operations are affected by the financial markets and general economic conditions in the U.S. and abroad, including factors such as the level and volatility of short-term and long-term interest rates, inflation, home prices, unemployment and under-employment levels, bankruptcies, household income, consumer spending, fluctuations in both debt and equity capital markets and currencies, liquidity of the global financial markets, the availability and cost of capital and credit, investor sentiment and confidence in the financial markets, the sustainability of economic growth in the U.S., Europe, China and Japan, and economic, market, political and social conditions in several larger emerging market countries. The deterioration of any of these conditions could adversely affect our consumer and commercial businesses, our securities and derivatives portfolios, our level of charge-offs and provision for credit losses, the carrying value of our deferred tax assets, our capital levels and liquidity, and our results of operations.
Despite improving labor markets in the past year and recent sharp declines in energy costs, an elevated level of under-employment and household debt, the prolonged low interest rate environment and a strengthening U.S. Dollar, along with a continued sluggish recovery in the consumer real estate market and certain commercial real estate markets in the U.S., pose challenges for domestic economic performance and the financial services industry. The elevated level of under-employment and modest wage growth have directly impaired consumer finances and pose risks to the financial services industry.
Continued uncertainty in a number of housing markets and still elevated levels of distressed and delinquent mortgages remain risks to the housing market. The current environment of heightened scrutiny of financial institutions has resulted in increased public awareness of and sensitivity to banking fees and practices. Mortgage and housing market-related risks may be accentuated by attempts to forestall foreclosure proceedings, as well as state
and federal investigations into foreclosure practices by mortgage servicers. Each of these factors may adversely affect our fees and costs.
The recent sharp drop in oil prices, while likely a net positive for the U.S. economy, may also add distress to select regional markets that are energy industry-dependent and may negatively impact certain commercial and consumer loan portfolios.
Our businesses and results of operations are also affected by domestic and international fiscal and monetary policy. The actions of the Federal Reserve in the U.S. and central banks internationally regulate the supply of money and credit in the global financial system. Their policies affect our cost of funds for lending, investing and capital raising activities and the return we earn on those loans and investments, both of which affect our net interest margin. The actions of the Federal Reserve in the U.S. and central banks internationally also can affect the value of financial instruments and other assets, such as debt securities and mortgage servicing rights (MSRs), and its policies also can affect our borrowers, potentially increasing the risk that they may fail to repay their loans. Our businesses and earnings are also affected by the fiscal or other policies that are adopted by the U.S. government, various U.S. regulatory authorities, and non-U.S. governments and regulatory authorities. Changes in domestic and international fiscal and monetary policies are beyond our control and difficult to predict but could have an adverse impact on our capital requirements and the costs of running our business.
For more information about economic conditions and challenges discussed above, see Executive Summary – 2014 Economic and Business Environment in the MD&A on page 23.
Liquidity Risk
Liquidity Risk is the Potential Inability to Meet Our Contractual and Contingent Financial Protection Bureau (CFPB)Obligations, On- or Off-balance Sheet, as they Become Due.
Adverse changes to our credit ratings from the major credit rating agencies could significantly limit our access to funding or the capital markets, increase our borrowing costs, or trigger additional collateral or funding requirements.
Our borrowing costs and ability to raise funds are directly impacted by our credit ratings. In addition, credit ratings may be important to customers or counterparties when we compete in certain markets and when we seek to engage in certain transactions, including OTC derivatives. Credit ratings and outlooks are opinions expressed by rating agencies on our creditworthiness and that of our obligations or securities, including long-term debt, short-term borrowings, preferred stock and other securities, including asset securitizations. Our credit ratings are subject to ongoing review by the rating agencies, which consider a number of factors, including our own financial strength, performance, prospects and operations as well as factors not under our control.
Currently, the Corporation’s long-term/short-term senior debt ratings and outlooks expressed by the rating agencies are as follows: Baa2/P-2 (Stable) by Moody’s Investors Service, Inc. (Moody’s); A-/A-2 (Negative) by Standard & Poor’s Ratings Services (S&P); and A/F1 (Negative) by Fitch Ratings (Fitch). The rating agencies could make adjustments to our credit ratings at any time, including as a result of a determination to no longer incorporate an uplift for U.S. government support. There can be no assurance that downgrades will not occur.
A reduction in certain of our credit ratings could negatively affect our liquidity, access to credit markets, the related cost of funds, our businesses and certain trading revenues, particularly in those businesses where counterparty creditworthiness is critical. If the short-term credit ratings of our parent company, bank or broker-dealer subsidiaries were downgraded by one or more levels, we may suffer the potential loss of access to short-term funding sources such as repo financing, and/or increased cost of funds.
In addition, under the terms of certain OTC derivative contracts and other trading agreements, in the event of a downgrade of our credit ratings or certain subsidiaries’ credit ratings, counterparties to those agreements may require us or certain subsidiaries to provide additional collateral, terminate these contracts or agreements, or provide other remedies. At December 31, 2014, if the rating agencies had downgraded their long-term senior debt ratings for us or certain subsidiaries by one incremental notch, the amount of additional collateral contractually required by derivative contracts and other trading agreements would have been approximately $1.4 billion, including $1.1 billion for Bank of America, N.A. (BANA). If the rating agencies had downgraded their long-term senior debt ratings for these entities by an additional incremental notch, approximately $2.8 billion in additional incremental collateral, including $1.9 billion for BANA would have been required.
Also, if the rating agencies had downgraded their long-term senior debt ratings for us or certain subsidiaries by one incremental notch, the derivative liability that would be subject to unilateral termination by counterparties as of December 31, 2014 was $1.8 billion against which $1.5 billion of collateral has been posted. If the rating agencies had downgraded their long-term senior debt ratings for us and certain subsidiaries by a second incremental notch, the derivative liability that would be subject to unilateral termination by counterparties as of December 31, 2014 was an incremental $3.9 billion, against which $3.0 billion of collateral has been posted.
While certain potential impacts are contractual and quantifiable, the full consequences of a credit ratings downgrade to a financial institution are inherently uncertain, as they depend upon numerous dynamic, complex and inter-related factors and assumptions, including whether any downgrade of a firm’s long-term credit ratings precipitates downgrades to its short-term credit ratings, and assumptions about the potential behaviors of various customers, investors and counterparties.
For more information about our credit ratings and their potential effects to our liquidity, see Liquidity Risk – Credit Ratings in the MD&A on page 68 and Note 2 – Derivativesto the Consolidated Financial Statements.
If we are unable to access the capital markets, continue to maintain deposits, or our borrowing costs increase, our liquidity and competitive position will be negatively affected.
Liquidity is essential to our businesses. We fund our assets primarily with globally sourced deposits in our bank entities, as well as secured and unsecured liabilities transacted in the capital markets. We rely on certain secured funding sources, such as repo markets, which are typically short-term and credit-sensitive in
nature. We also engage in asset securitization transactions, including with the government-sponsored enterprises (GSEs), to fund consumer lending activities. Our liquidity could be adversely affected by any inability to access the capital markets; illiquidity or volatility in the capital markets; unforeseen outflows of cash, including customer deposits, funding for commitments and contingencies; increased liquidity requirements on our banking and nonbank subsidiaries imposed by their home countries; or negative perceptions about our short- or long-term business prospects, including downgrades of our credit ratings. Several of these factors may arise due to circumstances beyond our control, such as a general market disruption, negative views about the financial services industry generally, changes in the regulatory environment, actions by credit rating agencies or an operational problem that affects third parties or us.
Our cost of obtaining funding is directly related to prevailing market interest rates and to our credit spreads. Credit spreads are the amount in excess of the interest rate of U.S. Treasury securities, or other benchmark securities, of a similar maturity that we need to pay to our funding providers. Increases in interest rates and our credit spreads can increase the cost of our funding. Changes in our credit spreads are market-driven and may be influenced by market perceptions of our creditworthiness. Changes to interest rates and our credit spreads occur continuously and may be unpredictable and highly volatile.
For more information about our liquidity position and other liquidity matters, including credit ratings and outlooks and the policies and procedures we use to manage our liquidity risks, see Liquidity Risk in the MD&A on page 65.
Bank of America Corporation is a holding company and we depend upon our subsidiaries for liquidity, including our ability to pay dividends to shareholders. Applicable laws and regulations, including capital and liquidity requirements, may restrict our ability to transfer funds from our subsidiaries to Bank of America Corporation or other subsidiaries.
Bank of America Corporation, as the parent company, is a separate and distinct legal entity from our banking and nonbank subsidiaries. We evaluate and manage liquidity on a legal entity basis. Legal entity liquidity is an important consideration as there are legal and other limitations on our ability to utilize liquidity from one legal entity to satisfy the liquidity requirements of another, including the parent company. For instance, the parent company depends on dividends, distributions and other payments from our banking and nonbank subsidiaries to fund dividend payments on our common stock and preferred stock and to fund all payments on our other obligations, including debt obligations. Many of our subsidiaries, including our bank and broker-dealer subsidiaries, are subject to laws that restrict dividend payments, or authorize regulatory bodies to block or reduce the flow of funds from those subsidiaries to the parent company or other subsidiaries. In addition, our bank and broker-dealer subsidiaries are subject to restrictions on their ability to lend or transact with affiliates and to minimum regulatory capital and liquidity requirements, as well as restrictions on their ability to use funds deposited with them in bank or brokerage accounts to fund their businesses.
Additional restrictions on related party transactions, increased capital and liquidity requirements and additional limitations on the use of funds on deposit in bank or brokerage accounts, as well as lower earnings, can reduce the amount of funds available to meet the obligations of the parent company and even require the parent company to provide additional funding to such subsidiaries. Also, additional liquidity may be required at each subsidiary entity. Regulatory action of that kind could impede access to funds we need to make payments on our obligations or dividend payments. In addition, our right to participate in a distribution of assets upon a subsidiary’s liquidation or reorganization is subject to the prior claims of the subsidiary’s creditors. For more information regarding our ability to pay dividends, see Capital Management in the MD&A on page 59 and Note 13 – Shareholders’ Equity to the Consolidated Financial Statements.
Credit Risk
Credit Risk is the Risk of Loss Arising from the Inability or Failure of a Borrower or Counterparty to Meet its Obligations.
Economic or market disruptions, insufficient credit loss reserves or concentration of credit risk may result in an increase in the provision for credit losses, which could have an adverse effect on our financial condition and results of operations.
A number of our products expose us to credit risk, including loans, letters of credit, derivatives, trading account assets and assets held-for-sale. The financial condition of our consumer and commercial borrowers and counterparties could adversely affect our earnings.
Global and U.S. economic conditions may impact our credit portfolios. To the extent economic or market disruptions occur, such disruptions would likely increase the risk that borrowers or counterparties would default or become delinquent on their obligations to us. Increases in delinquencies and default rates could adversely affect our consumer credit card, home equity, residential mortgage and purchased credit-impaired (PCI) portfolios through increased charge-offs and provision for credit losses. Additionally, increased credit risk could also adversely affect our commercial loan portfolios with weakened customer and collateral positions.
We estimate and establish an allowance for credit losses for losses inherent in our lending activities (including unfunded lending commitments), excluding those measured at fair value, through a charge to earnings. The amount of allowance is determined based on our evaluation of the potential credit losses included within our loan portfolios. The process for determining the amount of the allowance requires difficult and complex judgments, including forecasts of economic conditions and how borrowers will react to those conditions. The ability of our borrowers or counterparties to repay their obligations will likely be impacted by changes in economic conditions, which in turn could impact the accuracy of our forecasts. There is also the chance that we will fail to accurately identify the appropriate economic indicators or that we will fail to accurately estimate their impacts.
We may suffer unexpected losses if the models and assumptions we use to establish reserves and make judgments in extending credit to our borrowers or counterparties become less predictive of future events. Although we believe that our allowance for credit losses was in compliance with applicable accounting standards at December 31, 2014, there is no guarantee that it
will be sufficient to address future credit losses, particularly if economic conditions deteriorate. In such an event, we may increase the size of our allowance, which reduces our earnings.
In the ordinary course of our business, we also may be subject to a concentration of credit risk in a particular industry, country, counterparty, borrower or issuer. A deterioration in the financial condition or prospects of a particular industry or a failure or downgrade of, or default by, any particular entity or group of entities could negatively affect our businesses and the processes by which we set limits and monitor the level of our credit exposure to individual entities, industries and countries may not function as we have anticipated. While our activities expose us to many different industries and counterparties, we routinely execute a high volume of transactions with counterparties in the financial services industry, including brokers-dealers, commercial banks, investment banks, insurers, mutual and hedge funds, and other institutional clients. This has resulted in significant credit concentration with respect to this industry. Financial services institutions and other counterparties are inter-related because of trading, funding, clearing or other relationships. As a result, defaults by, or even rumors or questions about the financial stability of one or more financial services institutions, or the financial services industry generally, could lead to market-wide liquidity disruptions, losses and defaults. Many of these transactions expose us to credit risk in the event of default of a counterparty. In addition, our credit risk may be heightened by market risk when the collateral held by us cannot be realized or is liquidated at prices not sufficient to recover the full amount of the loan or derivatives exposure due to us.
In the ordinary course of business, we also enter into transactions with sovereign nations, U.S. states and U.S. municipalities. Unfavorable economic or political conditions, disruptions to capital markets, currency fluctuations, changes in energy prices, social instability and changes in government policies could impact the operating budgets or credit ratings of sovereign nations, U.S. states and U.S. municipalities and expose us to credit risk.
We also have a concentration of credit risk with respect to our consumer real estate, consumer credit card and commercial real estate portfolios, which represent a large percentage of our overall credit portfolio. Economic downturns have adversely affected these portfolios. Continued economic weakness or deterioration in real estate values or household incomes could result in higher credit losses.
For more information about our credit risk and credit risk management policies and procedures, see Credit Risk Management in the MD&A on page 70 and Note 1 – Summary of Significant Accounting Principlesto the Consolidated Financial Statements.
Our derivatives businesses may expose us to unexpected risks and potential losses.
We are party to a large number of derivatives transactions, including credit derivatives. Our derivatives businesses may expose us to unexpected market, credit and operational risks that could cause us to suffer unexpected losses. Severe declines in asset values, unanticipated credit events or unforeseen circumstances that may cause previously uncorrelated factors to become correlated (and vice versa) may create losses resulting from risks not appropriately taken into account in the development, structuring or pricing of a derivative instrument. The terms of certain of our OTC derivative contracts and other trading agreements provide that upon the occurrence of certain specified events, such as a change in our credit ratings, we may be required
to provide additional collateral or to provide other remedies, or our counterparties may have the right to terminate or otherwise diminish our rights under these contracts or agreements.
Many derivative instruments are individually negotiated and non-standardized, which can make exiting, transferring or settling some positions difficult. Many derivatives require that we deliver to the counterparty the underlying security, loan or other obligation in order to receive payment. In a number of cases, we do not hold, and may not be able to obtain, the underlying security, loan or other obligation.
In the event of a downgrade of the Corporation’s credit ratings, certain derivative and other counterparties may request we substitute BANA (which has generally had equal or higher credit ratings than the Corporation’s) as counterparty for certain derivative contracts and other trading agreements. The Corporation’s ability to substitute or make changes to these agreements to meet counterparties’ requests may be subject to certain statutory limitations. Through its rulemaking authority,limitations, including counterparty willingness, regulatory limitations on naming BANA as the CFPB has promulgated several proposednew counterparty and final rulesthe type or amount of collateral required. It is possible that willsuch limitations on our ability to substitute or make changes to these agreements, including naming BANA as the new counterparty, could adversely affect our consumer businesses. On January 10, 2014, several significant CFPB rulemakings became effective,results of operations.
Derivatives contracts, including new and more complex derivatives products, and other transactions entered into with third parties are not always confirmed by the Ability-to-Repaycounterparties or settled on a timely basis. While a transaction remains unconfirmed, or during any delay in settlement, we are subject to heightened credit, market and Qualified Mortgage Ruleoperational risk and, new mortgage servicing standards.in the event of default, may find it more difficult to enforce the contract. In addition, disputes may arise with counterparties, including government entities, about the terms, enforceability and/or suitability of the underlying contracts. These factors could negatively impact our ability to effectively manage our risk exposures from these products and subject us to increased credit and operating costs and reputational risk. For more information on our derivatives exposure, see Note 2 – Derivativesto the Consolidated Financial Statements.
Market Risk
Market Risk is the Risk that Market Conditions May Adversely Impact the Value of Assets or Liabilities or Otherwise Negatively Impact Earnings. Market Risk is Inherent in the Financial Instruments Associated with our Operations, Including Loans, Deposits, Securities, Short-term Borrowings, Long-term Debt, Trading Account Assets and Liabilities, and Derivatives.
Increased market volatility and adverse changes in other financial or capital market conditions may increase our market risk.
Our liquidity, cash flows, competitive position, business, results of operations and financial condition are affected by market risk factors such as changes in interest and currency exchange rates, equity and futures prices, the implied volatility of interest rates, credit spreads and other economic and business factors. These market risks may adversely affect, among other things, (i) the value of our on- and off-balance sheet securities, trading assets, other financial instruments, and MSRs, (ii) the cost of debt capital and our access to credit markets, (iii) the value of assets under management (AUM), (iv) fee income relating to AUM, (v) customer
allocation of capital among investment alternatives, (vi) the volume of client activity in our trading operations, (vii) investment banking fees, and (viii) the general profitability and risk level of the transactions in which we engage. For example, the value of certain of our assets is sensitive to changes in market interest rates. If the Federal Reserve, or central banks internationally, change or signal a change in monetary policy, market interest rates could be affected, which could adversely impact the value of such assets. In addition, the CFPBexistence of a prolonged low interest rate environment could negatively impact our cash flows, financial condition or results of operations, including future revenue and earnings growth.
We use various models and strategies to assess and control our market risk exposures but those are subject to inherent limitations. Our models, which rely on historical trends and assumptions, may not be sufficiently predictive of future results due to limited historical patterns, extreme or unanticipated market movements and illiquidity, especially during severe market downturns or stress events. The models that we use to assess and control our market risk exposures also reflect assumptions about the degree of correlation among prices of various asset classes or other market indicators. In addition, market conditions in recent years have involved unprecedented dislocations and highlight the limitations inherent in using historical data to manage risk.
In times of market stress or other unforeseen circumstances, such as the market conditions experienced in 2008 and 2009, previously uncorrelated indicators may become correlated, or previously correlated indicators may move in different directions. These types of market movements have at times limited the effectiveness of our hedging strategies and have caused us to incur significant losses, and they may do so in the future. These changes in correlation can be exacerbated where other market participants are using risk or trading models with assumptions or algorithms that are similar to ours. In these and other cases, it may be difficult to reduce our risk positions due to the activity of other market participants or widespread market dislocations, including circumstances where asset values are declining significantly or no market exists for certain assets. To the extent that we own securities that do not have an established liquid trading market or are otherwise subject to restrictions on sale or hedging, we may not be able to reduce our positions and therefore reduce our risk associated with such positions. In addition, challenging market conditions may also adversely affect our investment banking fees.
For more information about market risk and our market risk management policies and procedures, see Market Risk Management in the MD&A on page 99.
A downgrade in the U.S. government’s sovereign credit rating, or in the credit ratings of instruments issued, insured or guaranteed by related institutions, agencies or instrumentalities, could result in risks to the Corporation and its credit ratings and general economic conditions that we are not able to predict.
On June 6, 2014, S&P affirmed its AA+ long-term and A-1+ short-term sovereign credit rating on the U.S. government with a stable outlook. On March 21, 2014, Fitch affirmed its AAA long-term and F1+ short-term sovereign credit rating on the U.S. government with a stable outlook. This resolved the rating watch negative that was placed on the ratings on October 15, 2013. On July 18, 2013, Moody’s revised its outlook on the U.S. government to stable from negative and affirmed its Aaa long-term sovereign credit rating on the U.S. government.
The ratings and perceived creditworthiness of instruments issued, insured or guaranteed by institutions, agencies or instrumentalities directly linked to the U.S. government could also be correspondingly affected by any downgrade. Instruments of this nature are often held as trading, investment or excess liquidity positions on the balance sheets of financial institutions, including the Corporation, and are widely used as collateral by financial institutions to raise cash in the secured financing markets. A downgrade of the sovereign credit ratings of the U.S. government and perceived creditworthiness of U.S. government-related obligations could impact our ability to obtain funding that is collateralized by affected instruments, as well as affecting the pricing of that funding when it is available. A downgrade may also adversely affect the market value of such instruments.
We cannot predict if, when or how any changes to the credit ratings or perceived creditworthiness of these organizations will affect economic conditions. The credit rating agencies’ ratings for the Corporation or its subsidiaries could be directly or indirectly impacted by a downgrade of the U.S. government’s sovereign rating because credit ratings of large systemically important financial institutions issued by S&P and Fitch, including those of the Corporation or its subsidiaries, currently include a degree of uplift due to rating agencies’ assumptions concerning potential government support. In addition, the Corporation presently delivers a portion of the residential mortgage loans it originates into GSEs, agencies or instrumentalities (or instruments insured or guaranteed thereby). We cannot predict if, when or how any changes to the credit ratings of these organizations will affect their ability to finance residential mortgage loans.
A downgrade of the sovereign credit ratings of the U.S. government or the credit ratings of related institutions, agencies or instrumentalities would exacerbate the other risks to which the Corporation is subject and any related adverse effects on our business, financial condition and results of operations.
Our businesses may be affected by uncertainty about the financial stability and growth rates of non-U.S. jurisdictions, the risk that those jurisdictions may face difficulties servicing their sovereign debt, and related stresses on financial markets, currencies and trade.
Risks and ongoing concerns about the financial stability of several non-U.S. jurisdictions could impact our operations and have a detrimental impact on the global economic recovery. For instance, sovereign and non-sovereign debt levels remain elevated. Market and economic disruptions have affected, and may continue to affect, consumer confidence levels and spending, corporate investment and job creation, bankruptcy rates, levels of incurrence and default on consumer debt and corporate debt, economic growth rates and asset values, among other factors.
A number of non-U.S. jurisdictions in which we do business have been negatively impacted by slowing growth rates or recessionary conditions, market volatility and/or political unrest. Additionally, there can be no assurance that market stabilization in Europe, which has either proposedrecently experienced a renewed slowdown and increased volatility, is sustainable, nor can there be any assurance that future assistance packages, if required, will be available or, even if provided, will be sufficient to stabilize the affected countries and markets in Europe or elsewhere. To the extent European economic recovery uncertainty continues to negatively impact consumer and business confidence and credit factors, or should the EU enter a deep recession, both the U.S. economy and our business and results of operations could be adversely affected.
Global economic and political uncertainty, regulatory initiatives and reform have impacted, and will likely continue to impact, non-U.S. credit and trading portfolios. There can be no assurance our risk mitigation efforts in this respect will be sufficient or successful.
For more information on our exposures in the top 20 non-U.S. countries, see Non-U.S. Portfolio in the MD&A on page 93.
We may incur losses if the values of certain assets decline, including due to changes in interest rates and prepayment speeds.
We have a large portfolio of financial instruments, including, among others, certain loans and loan commitments, loans held-for-sale, securities financing agreements, asset-backed secured financings, long-term deposits, long-term debt, trading account assets and liabilities, derivative assets and liabilities, available-for-sale (AFS) debt and equity securities, other debt securities, certain MSRs and certain other assets and liabilities that we measure at fair value. We determine the fair values of these instruments based on the fair value hierarchy under applicable accounting guidance. The fair values of these financial instruments include adjustments for market liquidity, credit quality, funding impact on certain derivatives and other transaction-specific factors, where appropriate.
Gains or losses on these instruments can have a direct impact on our results of operations, including higher or lower mortgage banking income and earnings, unless we have effectively hedged our exposures. For example, decreases in interest rates and increases in mortgage prepayment speeds, which are influenced by interest rates and other factors such as reductions in mortgage insurance premiums and origination costs, could adversely impact the value of our MSR asset, cause a significant acceleration of purchase premium amortization on our mortgage portfolio, because a decline in long-term interest rates shortens the expected lives of the securities, and adversely affect our net interest margin. Conversely, increases in interest rates may result in a decrease in residential mortgage loan originations. In addition, increases in interest rates may adversely impact the fair value of debt securities and, accordingly, for debt securities classified as AFS, may adversely affect accumulated other comprehensive income and, thus, capital levels.
Fair values may be impacted by declining values of the underlying assets or the prices at which observable market transactions occur and the continued availability of these transactions. The financial strength of counterparties, with whom we have economically hedged some of our exposure to these assets, also will affect the fair value of these assets. Sudden declines and volatility in the prices of assets may curtail or eliminate the trading activity for these assets, which may make it difficult to sell, hedge or value such assets. The inability to sell or effectively hedge assets reduces our ability to limit losses in such positions and the difficulty in valuing assets may increase our risk-weighted assets, which requires us to maintain additional capital and increases our funding costs.
Asset values also directly impact revenues in our asset management businesses. We receive asset-based management fees based on the value of our clients’ portfolios or investments in funds managed by us and, in some cases, we also receive performance fees based on increases in the value of such investments. Declines in asset values can reduce the value of our clients’ portfolios or fund assets, which in turn can result in lower fees earned for managing such assets.
For more information about fair value measurements, see Note 20 – Fair Value Measurementsto the Consolidated Financial Statements. For more information about our asset management businesses, see GWIM in the MD&A on page 42. For more information about interest rate risk management, see Interest Rate Risk Management for Non-trading Activities in the MD&A on page 105.
Changes in the method of determining the London Interbank Offered Rate (LIBOR) or other reference rates may adversely impact the value of debt securities and other financial instruments we hold or issue that are linked to LIBOR or other reference rates in ways that are difficult to predict and could adversely impact our financial condition or results of operations.
In recent years, concerns have been raised about the accuracy of the calculation of LIBOR. Aspects of the method for determining how LIBOR is considering rulemakingsformulated and its use in the market have changed and may continue to change. Effective February 1, 2014, the transfer of LIBOR administration to the ICE Benchmark Administration, Ltd. was completed following authorization by the U.K. Financial Conduct Authority. On July 22, 2014, the Financial Stability Board published its report recommending reforms to the administration of major benchmarks, including LIBOR. Changes to LIBOR administration include, but are not limited to, the introduction of statutory regulation of LIBOR by U.K. regulatory authorities; reducing the currencies for which LIBOR is calculated to five; reducing the tenors for which LIBOR is calculated to seven; delay in the publication of individual banks’ LIBOR submissions for three months from submission; and requiring banks to provide LIBOR submissions based on an effective methodology on the basis of relevant criteria and information, including observable market transactions where possible. Each such change and any future changes could impact the availability and volatility of LIBOR. Similar changes have occurred or may occur with respect to other reference rates. Accordingly, it is not currently possible to determine whether, or to what extent, any such changes would impact the value of any debt securities we hold or issue that are linked to LIBOR or other reference rates, or any loans, derivatives and other financial obligations or extensions of credit we hold or are due to us, or for which we are an obligor, that are linked to LIBOR or other reference rates, or whether, or to what extent, such changes would impact our financial condition or results of operations.
Mortgage and Housing Market-Related Risk
Our mortgage loan repurchase obligations or claims from third parties could result in additional losses.
We and our legacy companies have sold significant amounts of residential mortgage loans. In connection with these sales, we or certain of our subsidiaries or legacy companies make or have made various representations and warranties, breaches of which may result in a requirement that we repurchase the mortgage loans, or otherwise make whole or provide other remedies to counterparties (collectively, repurchases). At December 31, 2014, we had approximately $22.4 billion of unresolved repurchase claims, net of duplicate claims. These repurchase claims relate primarily to private-label securitizations and include claims in the amount of $4.7 billion, net of duplicate claims, where we believe the statute of limitations has expired under current law. Private-label securitization unresolved repurchase claims have increased in recent periods, and such claims may continue to increase. In
addition to unresolved repurchase claims, we have received notifications pertaining to loans for which we have not received a repurchase request from sponsors of third-party securitizations with whom the Corporation engaged in whole-loan transactions and for which we may owe indemnity obligations. We also from time to time receive correspondence purporting to raise representations and warranties breach issues from entities that do not have contractual standing or ability to bring such claims. We believe such communications to be procedurally and/or substantially invalid, and generally do not respond to such correspondence. In addition to repurchase claims, we receive notices from mortgage insurance companies of claim denials, cancellations or coverage rescission (collectively, MI rescission notices). Although they declined during 2014, the number of open MI rescission notices remains elevated.
We have recorded a liability of $12.1 billion for obligations under representations and warranties exposures (which includes exposures related to debt collection, prepaid cards, integrated disclosures under RESPAMI rescission notices). We have also established an estimated range of possible loss of up to $4 billion over our recorded liability. The liability for representations and TILA,warranties exposures and disclosuresthe corresponding estimated range of possible loss do not consider losses related to remittance transfer transactions.servicing (except as such losses are included as potential costs of the BNY Mellon Settlement), including foreclosure and related costs, fraud, indemnity, or claims (including for residential mortgage-backed securities (RMBS)) related to securities law or monoline litigations. Losses with respect to one or more of these matters could be material to the Corporation’s results of operations or cash flows for any particular reporting period.
Our recorded liability and estimated range of possible loss for representations and warranties exposures are based on currently available information and are necessarily dependent on, and limited by, a number of factors, including our historical claims and settlement experiences as well as significant judgment and a number of assumptions that are subject to change. As a result, our liability and estimated range of possible loss related to our representations and warranties exposures may materially change in the future. Additionally, if final court approval of the settlement with the Bank of New York Mellon, as noted above,trustee (BNY Mellon Settlement) is not obtained, or if the Corporation and legacy Countrywide Financial Corporation determine to withdraw from the BNY Mellon Settlement agreement in August 2013 several federal agencies jointly re-proposedaccordance with its terms, the Corporation’s future representations and warranties losses could be substantially different from existing accruals and the existing estimated range of possible loss. If future representations and warranties losses occur in excess of our recorded liability and estimated range of possible loss, such losses could have an adverse effect on our cash flows, financial condition and results of operations.
For more information about our representations and warranties exposure, including the estimated range of possible loss, see Off-Balance Sheet Arrangements and Contractual Obligations – Representations and Warranties in the MD&A on page 50, Consumer Portfolio Credit Risk Retention Rule, which will impose credit risk retention requirementsManagement in the MD&A on sponsors securitizing certainpage 70 and Note 7 – Representations and Warranties Obligations and Corporate Guarantees to the Consolidated Financial Statements.
For more information regarding the BNY Mellon Settlement, see Note 7 – Representations and Warranties Obligations and Corporate Guaranteesto the Consolidated Financial Statements.
Failure to satisfy our obligations as servicer for residential mortgage securitizations, along with other losses we could incur in our capacity as servicer, and continued foreclosure delays and/or investigations into our residential mortgage foreclosure practices could cause losses.
We and our legacy companies have securitized a significant portion of the residential mortgage loans that we originated or acquired. We service a large portion of the loans we have securitized and also service loans on behalf of third-party securitization vehicles and other investors. At December 31, 2014, we serviced approximately 5.3 million loans with an aggregate unpaid principal balance of $693 billion, including loans owned by us and by others. Of the 3.2 million loans serviced for others, approximately 67 percent are held in GSE securitization vehicles and 33 percent are held in non-GSE securitization vehicles or by other investors. If we commit a material breach of our obligations as servicer or master servicer, we may be subject to termination if the breach is not cured within a specified period of time following notice, which could cause us to lose servicing income. In addition, for loans held in non-GSE securitization vehicles, we may have liability for any failure by us, as a servicer or master servicer, for any act or omission on our part that involves willful misfeasance, bad faith, gross negligence or reckless disregard of our duties. If any such breach were found to have occurred, it may harm our reputation, increase our servicing costs or adversely impact our results of operations. Additionally, with respect to foreclosures, we may incur costs or losses due to irregularities in the underlying documentation, or if the validity of a foreclosure action is challenged by a borrower or overturned by a court because of errors or deficiencies in the foreclosure process. We may also incur costs or losses relating to delays or alleged deficiencies in processing documents necessary to comply with state law governing foreclosures.
We are subject to certain legal and contractual requirements for how we hold, transfer, use or enforce promissory notes, security instruments and other documents for residential mortgage loans that we service. In recent years, challenges have been raised to whether we have adhered to these requirements, and whether, as a result in some instances, the loans can be enforced as local law otherwise would permit. Additionally, we currently use the Mortgage Electronic Registration Systems, Inc. (MERS) system for approximately half of the residential mortgage loans that remain in our servicing portfolio. Individual borrowers and certain local governments have contended that the use of MERS is improper or otherwise adversely affects the security interest. If documentation requirements were not met, or if the use of MERS or the MERS system is found not valid or effective, we could be obligated to, or choose to, take remedial actions and may be subject to additional costs or losses.
For additional information, Off-Balance Sheet Arrangements and Contractual Obligations in the MD&A on page 50.
If the U.S. housing market weakens, or home prices decline, our consumer loan portfolios, credit quality, credit losses, representations and warranties exposures, and earnings may be adversely affected.
Although U.S. home prices continued to improve during 2014, the declines in prior years have negatively impacted the demand for many of our products. Additionally, our mortgage loan production volume is generally influenced by the rate of growth in residential mortgage debt outstanding and the size of the residential mortgage market.
Conditions in the U.S. housing market in prior years have also resulted in significant write-downs of asset values in several asset classes, notably mortgage-backed securities, and increased exposure to monolines. If the U.S. housing market were to weaken, the value of real estate could decline, which could negatively affect our exposure to representations and warranties. While there were continued indications in 2014 that the U.S. economy is improving, the performance of our overall consumer portfolios may not significantly improve in the near future. A protracted continuation or worsening of difficult housing market conditions may exacerbate the adverse effects outlined above and could have an adverse effect on our financial condition and results of operations.
In addition, our home equity portfolio, which makes up approximately 28 percent of our total home loans portfolio, contains a significant percentage of loans in second-lien or more junior-lien positions, and such loans have elevated risk characteristics. Our home equity portfolio had an outstanding balance of $85.7 billion as of December 31, 2014, including $74.2 billion of home equity lines of credit (HELOC), $9.8 billion of home equity loans and $1.7 billion of reverse mortgages. Of the total home equity portfolio at December 31, 2014, $20.6 billion, or 24 percent, were in first-lien positions (26 percent excluding the PCI home equity portfolio) and $65.1 billion, or 76 percent (74 percent excluding the PCI home equity portfolio) were in second-lien or more junior-lien positions. The HELOCs that have entered the amortization period have experienced a higher percentage of early stage delinquencies and nonperforming status when compared to the HELOC portfolio as a whole. Loans in our HELOC portfolio generally have an initial draw period of 10 years and more than 75 percent of these loans will not enter their amortization period until 2016 or later. As a result, delinquencies and defaults may increase in future periods. For additional information, see Off-Balance Sheet Arrangements and Contractual Obligations in the MD&A on page 50 and Consumer Portfolio Credit Risk Management on page 70.
Regulatory, Compliance and Legal Risk
U.S. federal banking agencies may require us to hold higher levels of regulatory capital, increase our regulatory capital ratios or increase liquidity, which could result in the need to issue additional securities that qualify as regulatory capital or to take other actions, such as to sell company assets.
We are subject to the Federal Reserve’s risk-based capital rules. These rules establish regulatory capital requirements for banking institutions to meet minimum requirements as well as to qualify as a “well-capitalized” institution. If any of our subsidiary insured depository institutions fail to maintain its status as “well-capitalized” under the applicable regulatory capital rules, the Federal Reserve will require us to agree to bring the insured depository institution or institutions back to “well-capitalized” status. For the duration of such an agreement, the Federal Reserve may impose restrictions on our activities. If we were to fail to enter into such an agreement, or fail to comply with the terms of such agreement, the Federal Reserve may impose more severe restrictions on our activities, including requiring us to cease and desist activities permitted under the Bank Holding Company Act of 1956.
The current regulatory environment is fluid, with requirements frequently being introduced and amended. It is possible that increases in regulatory capital requirements, changes in how regulatory capital is calculated or increases to liquidity
requirements could cause us to increase our capital levels by issuing additional common stock, thus diluting our existing shareholders, or by taking other actions, such as selling company assets, in order to maintain our “well-capitalized” status.
In October 2013, the Federal Reserve, the Federal Deposit Insurance Corporation (FDIC) and the Office of the Comptroller of the Currency (OCC) (the Agencies, or U.S. banking regulators) published the final Basel 3 regulatory capital rules (Basel 3). Basel 3 materially changes Tier 1 and Total capital calculations and formally establishes a Common equity tier 1 capital ratio, notably phasing out trust preferred securities. Additionally, Basel 3 introduces new minimum capital ratios and buffer requirements and a supplementary leverage ratio (SLR), changes the composition of regulatory capital, revises the adequately capitalized minimum requirements under the Prompt Corrective Action (PCA) framework, expands and modifies the risk-sensitive calculation of risk weighted-assets for credit and market risk (the Advanced approaches) and introduces a Standardized approach for the calculation of risk-weighted assets, which serves as a minimum. Changes to the composition of regulatory capital under Basel 3, as compared to the Basel 1 – 2013 Rules, are subject to a transition period. The new minimum capital ratio requirements and related buffers will be phased in from January 1, 2014 through January 1, 2019. When presented on a fully phased-in basis, capital, risk-weighted assets and the capital ratios assume all regulatory capital adjustments and deductions are fully recognized. The Advanced approaches require approval by the Agencies of our internal analytical models used to calculate risk-weighted assets. As an advanced approaches bank, under Basel 3, we are required to complete a qualification period (parallel run) to demonstrate compliance with the final Basel 3 rules to the satisfaction of U.S. banking regulators. Our estimates under the Basel 3 Advanced approaches may be refined over time as a result of further rulemaking or clarification by U.S. banking regulators or as our understanding and interpretation of the rules evolve. We are currently working with the U.S. banking regulators to obtain approval of certain internal analytical models including the wholesale (e.g., commercial) and other credit models in order to exit parallel run. The U.S. banking regulators have indicated that they will require modifications to these models which would likely result in a material increase in our risk-weighted assets resulting in a decrease in our capital ratios.
In April 2014, the Agencies adopted a final rule to strengthen the SLR standards for the largest U.S. banking organizations by requiring such institutions to maintain a leverage buffer greater than 2.0 percentage points above the minimum SLR requirement of 3.0 percent, for a total of greater than 5.0 percent, to avoid restrictions on capital distributions and variable compensation payments. Banking subsidiaries of such organizations are required to maintain at least a six percent SLR to be considered “well capitalized” under the PCA framework. In addition, in September 2014, the Agencies adopted a final rule modifying the definition of the denominator of the SLR in a manner consistent with changes adopted by the Basel Committee on Banking Supervision (Basel Committee) to better capture on- and off-balance sheet exposures, including credit derivatives, repo-style transactions, and lines of credit.
In September 2014, the Agencies issued a final Liquidity Coverage Ratio (LCR) rule. This rule creates a standardized minimum liquidity requirement for the largest U.S. financial institutions. The rule will require an institution to hold high quality liquid assets (HQLA), such as central bank reserves and
government debt that can be converted easily and quickly into cash, in an amount equal to or greater than prescribed net cash outflows during a 30-day stress period. In October 2014, the Basel Committee issued its final standard for the Net Stable Funding Ratio (NSFR) regulation. The NSFR requires banks to maintain a stable funding profile in relation to their on- and off-balance sheet activities. Although the timing is uncertain, the Agencies are expected to propose similar regulation for the NSFR in the near future.
In November 2014, the Financial Stability Board, in consultation with the Basel Committee, issued for public consultation a proposal for a common international standard on total loss-absorbing capacity (TLAC) for global systemically important banks (GSIBs). Although the timing is uncertain, the Agencies are expected to propose TLAC regulation in the near future.
In December 2014, a U.S. banking regulator proposed a regulation that would implement GSIB surcharge requirements for the largest U.S. BHCs. The proposed rule would require such organizations to calculate a GSIB capital buffer that is the higher of the GSIB’s capital buffer proposed by the Basel Committee in 2012 and a modified capital buffer with a short-term wholesale funding component. As proposed, the Federal Reserve estimates that the GSIB surcharge requirements, which currently ranges from 1.0 percent to 4.5 percent, would require us to hold Common equity tier 1 capital in excess of regulatory minimums and the capital conservation buffer. Consequences of falling below this level are expected to include limitations on capital distributions and variable compensation payments.
Compliance with the regulatory capital and liquidity requirements may impact our ability to return capital to shareholders and may impact our operations by requiring us to liquidate assets, increase borrowings, issue additional equity or other securities, cease or alter certain operations, or hold highly liquid assets, which may adversely affect our results of operations.
For additional information, see Capital Management and Liquidity Risk – Basel 3 Liquidity Standards on pages 59 and 67.
We are subject to extensive government legislation and regulations, both domestically and internationally, which impact our operating costs and could require us to make changes to our operations, which could result in an adverse impact on our results of operations. Additionally, these regulations, and certain consent orders and settlements we have entered into, have increased and will continue to increase our compliance and operational costs.
We are subject to extensive laws and regulations promulgated by U.S. state, U.S. federal and non-U.S. laws in the jurisdictions in which we operate. In response to the financial crisis, the U.S. adopted the Financial Reform Act, which has resulted in significant rulemaking and proposed rulemaking by the U.S. Department of the Treasury, the Federal Reserve, the OCC, the CFPB, FSOC, the FDIC, the SEC and CFTC. In addition, non-U.S. regulators, such as the U.K. financial regulators and the European Parliament and Commission, have adopted or have proposed laws and regulations regarding financial institutions located in their jurisdictions.
The ultimate impact of these laws and regulations remains uncertain. For example, we are required to annually submit a resolution plan to the FDIC and the Federal Reserve. If the FDIC and Federal Reserve jointly determine that our resolution plan is not credible and we fail to cure the deficiencies in a timely manner, they could impose more stringent capital, leverage or liquidity requirements or restrictions on growth, activities or operations of the Corporation, and we could be required to take certain actions that could impose operating costs and could potentially result in
the divestiture or restructuring of certain businesses and subsidiaries. In August 2014, the Federal Reserve and the FDIC completed their reviews of the resolution plans submitted in 2013 by 11 large, complex banking organizations, including Bank of America, and issued letters to each of these banking organizations. Separately, in August 2014, the Federal Reserve and the FDIC issued a joint press release stating that the Board of Directors of the FDIC had determined that the plans submitted by each of the 11 banks were not credible and do not meetfacilitate an orderly resolution under the U.S. Bankruptcy Code. However, the Federal Reserve did not join the FDIC in its determination that the submitted plans were not credible. Many rules are still being finalized, and upon finalization could require additional regulatory guidance and interpretation. Additionally, laws proposed by different jurisdictions could create competing or conflicting requirements.
We are also subject to other significant regulations, such as OFAC, FCPA, and U.S. and international anti-money laundering regulations. Laws proposed by different jurisdictions could create competing or conflicting requirements. We could become subject to regulatory requirements beyond those currently proposed, adopted or contemplated. We are currently subject to the terms of settlements and consent orders that we have entered into with government agencies, such as the 2011 OCC Consent Order and the National Mortgage Settlement, and may become subject to additional settlements or orders in the future.
While we believe that we have adopted appropriate risk management and compliance programs, compliance risks will continue to exist, particularly as we adapt to new rules and regulations. Our regulators have assumed an increasingly active oversight, inspection and investigatory role over our operations and the financial services industry generally. In addition, legal and regulatory proceedings and other contingencies will arise from time to time that may result in fines, penalties, equitable relief and changes to our business practices. As a result, we are and will continue to be subject to heightened compliance and operating costs that could adversely affect our results of operations.
Changes in the structure of the GSEs and the relationship among the GSEs, the government and the private markets, or the conversion of the current conservatorship of the GSEs into receivership, could result in significant changes to our business operations and may adversely impact our business.
During 2013 and 2014, we sold approximately $65 billion of loans to the GSEs. Each GSE is currently in a conservatorship, with its primary regulator, the Federal Housing Finance Agency, acting as conservator. We cannot predict if, when or how the conservatorships will end, or any associated changes to the GSEs’ business structure that could result. We also cannot predict whether the conservatorships will end in receivership. There are several proposed approaches to reform the GSEs that, if enacted, could change the structure of the GSEs and the relationship among the GSEs, the government and the private markets, including the trading markets for agency conforming mortgage loans and markets for mortgage-related securities in which weparticipate. We cannot predict the prospects for the enactment, timing or content of legislative or rulemaking proposals regarding the future status of the GSEs. Accordingly, there continues to be uncertainty regarding the future of the GSEs, including whether they will continue to exist in their current form.
We are subject to significant financial and reputational risks from potential liability arising from lawsuits, regulatory and government action.
We face significant legal risks in our business, and the volume of claims and amount of damages, penalties and fines claimed in litigation, and regulatory and government proceedings against us and other financial institutions remain high. Increased litigation and investigation costs, substantial legal liability or significant regulatory or government action against us could have adverse effects on our financial condition and results of operations or cause significant reputational harm to us, which in turn could adversely impact our business prospects. We continue to experience increased litigation and other disputes, including claims for contractual indemnification, with counterparties regarding relative rights and responsibilities. Consumers, clients and other counterparties have grown more litigious. Our experience with certain regulatory authorities suggests an increasing supervisory focus on enforcement, including in connection with alleged violations of law and customer harm. Recent actions by regulators and government agencies indicate that they may, on an industry basis, increasingly pursue claims under the Financial institutions Reform, Recovery, and Enforcement act of 1989 (FIRREA) and the False Claims Act. FIRREA contemplates civil monetary penalties as high as $1.1 million per violation or, if permitted by the court, based on pecuniary gain derived or pecuniary loss suffered as a result of the violation. Treble damages are potentially available for False Claims Act claims. The ongoing environment of additional regulation, increased regulatory compliance burdens, and enhanced regulatory enforcement, combined with ongoing uncertainty related to the continuing evolution of the regulatory environment, has resulted in operational and compliance costs and may limit our ability to continue providing certain products and services.
For more information on litigation risks, see Note 12 – Commitments and Contingenciesto the Consolidated Financial Statements.
We may be adversely affected by changes in U.S. and non-U.S. tax and other laws and regulations.
The U.S. Congress and the Administration have indicated an interest in reforming the U.S. corporate income tax code. Possible approaches include lowering the 35 percent corporate tax rate, modifying the taxation of income earned outside the U.S. and limiting or eliminating various other deductions, tax credits and/or other tax preferences. Also, it is possible that New York City will enact corporate tax reform that may conform to New York state’s tax reform enacted during 2014. It is not possible at this time to quantify either the one-time impacts from the remeasurement of deferred tax assets and liabilities that might result upon tax reform enactment or the ongoing impacts reform proposals might have on income tax expense.
In addition, income from certain non-U.S. subsidiaries has not been subject to U.S. income tax as a result of long-standing deferral provisions applicable to income that is derived in the active conduct of a banking and financing business abroad. These deferral provisions have expired for taxable years beginning on or after January 1, 2015. However, the U.S. Congress has extended these provisions several times, most recently in December 2014, when it reinstated the provisions retroactively to January 2014. Congress this year may similarly consider reinstating these provisions to apply to the 2015 taxable year. Absent an extension, active financing income earned by certain non-U.S. subsidiaries will generally be subject to a tax provision that considers
incremental U.S. income tax. The impact of the expiration of these provisions would depend upon the amount, composition and geographic mix of our future earnings.
The Corporation has $7.7 billion of U.K. net deferred tax assets which consist primarily of net operating losses (NOLs) that are expected to be realized by certain subsidiaries over an extended number of years. Pretax income for these subsidiaries for 2014, 2013 and 2012 on a cumulative basis totaled $1.7 billion, excluding the impact of debit valuation adjustments (DVA) and the adoption impact of a funding valuation adjustment (FVA). In December 2014, the U.K. Treasury announced that its 2015 Finance Bill, to be introduced soon, will include a proposal that, if enacted, would limit the amount of a bank’s taxable profits that can be reduced by the bank’s existing NOLs to 50 percent of such profits. This proposal would significantly increase the number of years over which our U.K. NOLs, which may be carried forward indefinitely, could be utilized, effectively accelerating U.K. tax that would otherwise have been paid further out in the future. The acceleration of tax and deferral of NOL utilization would not impact our results of operations, but would result in a slower improvement in the amount of our DTAs disallowed for Basel 3 regulatory capital. We are unable to predict whether this proposal will be enacted or, if enacted, what the final provisions will be. Adverse developments with respect to tax laws or to other material factors, such as a prolonged worsening of Europe’s capital markets, could lead management to reassess and/or change its current conclusion that no valuation allowance is necessary with respect to our U.K. net deferred tax assets.
Other countries have also proposed and adopted certain regulatory changes targeted at financial institutions or that otherwise affect us. The EU has adopted increased capital requirements and the U.K. has (i) increased liquidity requirements for local financial institutions, including regulated U.K. subsidiaries of non-U.K. BHCs and other financial institutions as well as branches of non-U.K. banks located in the U.K.; (ii) adopted a Bank Levy, which applies to the aggregate balance sheet of branches and subsidiaries of non-U.K. banks and banking groups operating in the U.K.; and (iii) proposed the creation and production of recovery and resolution plans by U.K.-regulated entities.
Risk of the Competitive Environment in which We Operate
We face significant and increasing competition in the financial services industry.
We operate in a highly competitive environment. Over time, there has been substantial consolidation among companies in the financial services industry. This trend has also hastened the globalization of the securities and financial services markets. We will continue to experience intensified competition as consolidation in and globalization of the financial services industry may result in larger, better-capitalized and more geographically diverse companies that are capable of offering a wider array of financial products and services at more competitive prices. To the extent we expand into new business areas and new geographic regions, we may face competitors with more experience and more established relationships with clients, regulators and industry participants in the relevant market, which could adversely affect our ability to compete. In addition, technological advances and the growth of e-commerce have made it possible for non-depository institutions to offer products and services that traditionally were banking products, and for financial institutions to compete with
technology companies in providing electronic and internet-based financial solutions. Increased competition may negatively affect our earnings by creating pressure to lower prices on our products and services and/or reducing market share.
Damage to our reputation could harm our businesses, including our competitive position and business prospects.
Our ability to attract and retain customers, clients, investors and employees is impacted by our reputation. We continue to face increased public and regulatory scrutiny resulting from the financial crisis and economic downturn as well as alleged irregularities in servicing, foreclosure, consumer collections, mortgage loan modifications and other practices, compensation practices, and the suitability or reasonableness of recommending particular trading or investment strategies.
Harm to our reputation can also arise from other sources, including employee misconduct, unethical behavior, litigation or regulatory outcomes, failing to deliver minimum or required standards of service and quality, compliance failures, unintended disclosure of confidential information, and the activities of our clients, customers and counterparties, including vendors. Actions by the financial services industry generally or by certain members or individuals in the industry also can adversely affect our reputation.
We are subject to complex and evolving laws and regulations regarding privacy, data protections and other matters. Principles concerning the appropriate scope of consumer and commercial privacy vary considerably in different jurisdictions, and regulatory and public expectations regarding the definition and scope of consumer and commercial privacy may remain fluid in the future. It is possible that these laws may be interpreted and applied by various jurisdictions in a “qualified residential mortgage”manner inconsistent with our current or future practices, or that is inconsistent with one another. We face regulatory, reputational and operational risks if personal, confidential or proprietary information of customers or clients in our possession is mishandled or misused.
We could suffer reputational harm if we fail to properly identify and manage potential conflicts of interest. Management of potential conflicts of interests has become increasingly complex as we expand our business activities through more numerous transactions, obligations and interests with and among our clients. The failure to adequately address, or the perceived failure to adequately address, conflicts of interest could affect the willingness of clients to deal with us, or give rise to litigation or enforcement actions, which could adversely affect our businesses.
Our actual or perceived failure to address these and other issues gives rise to reputational risk that could cause harm to us and our business prospects, including failure to properly address operational risks. Failure to appropriately address any of these issues could also give rise to additional regulatory restrictions, legal risks and reputational harm, which could, among other consequences, increase the size and number of litigation claims and damages asserted or subject us to enforcement actions, fines and penalties and cause us to incur related costs and expenses.
Our ability to attract and retain qualified employees is critical to the success of our business and failure to do so could hurt our business prospects and competitive position.
Our performance is heavily dependent on the talents and efforts of highly skilled individuals. Competition for qualified personnel within the financial services industry and from businesses outside the financial services industry has been, and is expected to continue to be, intense. Our competitors include non-U.S. based institutions and institutions subject to different compensation and
hiring regulations than those imposed on U.S. institutions and financial institutions. The difficulty we face in competing for key personnel is exacerbated in emerging markets, where we are often competing for qualified employees with entities that may have a significantly greater presence or more extensive experience in the region.
In order to attract and retain qualified personnel, we must provide market-level compensation. As a large financial and banking institution, we may be subject to limitations on compensation practices (which may or may not affect our competitors) by the Federal Reserve, the FDIC or other regulators around the world. For instance, recent EU rules limit and subject to clawback certain forms of variable compensation for senior employees. Current and potential future limitations on executive compensation imposed by legislation or regulation could adversely affect our ability to attract and maintain qualified employees. Furthermore, a substantial portion of our annual incentive compensation paid to our senior employees has in recent years taken the form of long-term equity awards. Therefore, the ultimate value of this compensation depends on the price of our common stock when the awards vest. If we are unable to continue to attract and retain qualified individuals, our business prospects and competitive position could be adversely affected.
In addition, if we fail to retain the wealth advisors that we employ in Global Wealth & Investment Management, particularly those with significant client relationships, such failure could result in a loss of clients or the withdrawal of significant client assets.
Our inability to adapt our products and services to evolving industry standards and consumer preferences could harm our business.
Our business model is based on a diversified mix of business that provides a broad range of financial products and services, delivered through multiple distribution channels. Our success depends on our ability to adapt our products and services to evolving industry standards. There is increasing pressure by competitors to provide products and services at lower prices. This can reduce our net interest margin and revenues from our fee-based products and services. In addition, the widespread adoption of new technologies, including internet services and payment systems, could require us to incur substantial expenditures to modify or adapt our existing products and services. We might not be successful in developing or introducing new products and services, responding or adapting to changes in consumer spending and saving habits, achieving market acceptance of our products and services, or sufficiently developing and maintaining loyal customers.
We may not be able to achieve expected cost savings from cost-saving initiatives or in accordance with currently anticipated time frames.
We are currently engaged in efforts to achieve cost savings. For example, we currently expect our Legacy Assets and Servicing costs, excluding litigation costs, to decrease to approximately $800 million per quarter by the end of 2015. We may be unable to fully realize the cost savings and other anticipated benefits from our cost saving initiatives or in accordance with currently anticipated timeframes. In addition, our litigation expense may vary from period to period and may cause our noninterest expense to increase for any particular period even if we otherwise achieve cost savings as the result of our cost savings initiatives or otherwise.
Risks Related to Risk Management
Our risk management framework may not be effective in mitigating risk and reducing the potential for losses.
Our risk management framework is designed to minimize risk and loss to us. We seek to identify, measure, monitor, report and control our exposure to the types of risk to which we are subject, including strategic, credit, market, liquidity, compliance, operational and reputational risks, among others. While we employ a broad and diversified set of risk monitoring and mitigation techniques, including hedging strategies and techniques that seek to balance our ability to profit from trading positions with our exposure to potential losses, those techniques are inherently limited because they cannot anticipate the existence or future development of currently unanticipated or unknown risks. The Volcker Rule may impact our ability to engage in certain hedging strategies. Recent economic conditions, heightened legislative and regulatory scrutiny of the financial services industry and increases in the overall complexity of our operations, among other developments, have resulted in a heightened level of risk for us. Accordingly, we could suffer losses as a result of our failure to properly anticipate and manage these risks.
For more information about our risk management policies and procedures, see Managing Risk in the MD&A on page 55.
A failure in or breach of our operational or security systems or infrastructure, or those of third parties, could disrupt our businesses, and adversely impact our results of operations, cash flows, liquidity and financial condition, as well as cause reputational harm.
The potential for operational risk exposure exists throughout our organization and as a result of our interactions with third parties, and is not limited to our operational functions. Our operational and security systems, infrastructure, including our computer systems, data management, and internal processes, as well as those of third parties, are integral to our performance. In addition, we rely on our employees and third parties in our day-to-day and ongoing operations, who may, as a result of human error or malfeasance or failure or breach of third-party systems or infrastructure, expose us to risk. We have taken measures to implement backup systems and other safeguards to support our operations, but our ability to conduct business may be adversely affected by any significant disruptions to us or to third parties with whom we interact. In addition, our ability to implement backup systems and other safeguards with respect to third-party systems is more limited than with respect to our own systems. Our financial, accounting, data processing, backup or other operating or security systems and infrastructure may fail to operate properly or become disabled or damaged as a result of a number of factors including events that are wholly or partially beyond our control which could adversely affect our ability to process these transactions or provide these services. There could be sudden increases in customer transaction volume; electrical, telecommunications or other major physical infrastructure outages; natural disasters such as earthquakes, tornadoes, hurricanes and floods; disease pandemics; and events arising from local or larger scale political or social matters, including terrorist acts. We continuously update these systems to support our operations and growth. This updating entails significant costs and creates risks associated with implementing new systems and integrating them with existing ones. Operational risk exposures could adversely impact our results of operations, cash flows, liquidity and financial condition, as well as cause reputational harm.
A cyber attack, information or security breach, or a technology failure of ours or of a third party could adversely affect our ability to conduct our business, manage our exposure to risk or expand our businesses, result in the disclosure or misuse of confidential or proprietary information, increase our costs to maintain and update our operational and security systems and infrastructure, and adversely impact our results of operations, cash flows, liquidity and financial condition, as well as cause reputational harm.
Our businesses are highly dependent on the security and efficacy of our infrastructure, computer and data management systems, as well as those of third parties with whom we interact. Cyber security risks for financial institutions have significantly increased in recent years in part because of the proliferation of new technologies, the use of the Internet and telecommunications technologies to conduct financial transactions, and the increased sophistication and activities of organized crime, hackers, terrorists and other external parties, including foreign state actors. Our businesses rely on the secure processing, transmission, storage and retrieval of confidential, proprietary and other information in our computer and data management systems and networks, and in the computer and data management systems and networks of third parties. We rely on digital technologies, computer, database and email systems, software, and networks to conduct our operations. In addition, to access our network, products and services, our customers and other third parties may use personal mobile devices or computing devices that are outside of our network environment. We, our customers, regulators and other third parties have been subject to, and are likely to continue to be the target of, cyber attacks, including computer viruses, malicious or destructive code, phishing attacks, denial of service or information or other security breaches, that could result in the unauthorized release, gathering, monitoring, misuse, loss or destruction of confidential, proprietary and other information of the Corporation, our employees, our customers or of third parties, or otherwise materially disrupt our or our customers’ or other third parties’ network access or business operations. For example, in recent years, we have been subject to malicious activity, including distributed denial of service attacks. Additionally, several large retailers have disclosed substantial cyber security breaches affecting debit and credit card accounts of their customers, some of whom were our cardholders. Although these incidents have not, to date, had a material impact on us, we believe that such incidents will continue, and we are unable to predict the severity of such future attacks on us. Our counterparties, regulators, customers and clients, and other third parties with whom we or our customers and clients interact are exposed to similar incidents, and incidents affecting those third parties could impact us.
Although to date we have not experienced any material losses or other material consequences relating to technology failure, cyber attacks or other information or other security breaches, there can be no assurance that we will not suffer such losses or other consequences in the future. Our risk and exposure to these matters remains heightened because of, among other things, the evolving nature of these threats, our prominent size and scale, and our role in the financial services industry and the broader economy, our plans to continue to implement our internet banking and mobile banking channel strategies and develop additional remote connectivity solutions to serve our customers when and how they want to be served, our continuous transmission of sensitive information to, and storage of such information by, third
parties, including our vendors and regulators, our expanded geographic footprint and international presence, the outsourcing of some of our business operations, the continued uncertain global economic environment, threats of cyber terrorism, external extremist parties, including foreign state actors, in some circumstances as a means to promote political ends, and system and customer account updates and conversions. As a result, cyber security and the continued development and enhancement of our controls, processes and practices designed to protect our systems, computers, software, data and networks from attack, damage or unauthorized access remain a priority for us. As cyber threats continue to evolve, we may be required to expend significant additional resources to continue to modify or enhance our protective measures or to investigate and remediate any information security vulnerabilities or incidents.
We also face indirect technology, cyber security and operational risks relating to the third parties with whom we do business or upon whom we rely to facilitate or enable our business activities. In addition to customers and clients, the third parties with whom we interact and upon whom we rely include financial counterparties; financial intermediaries such as clearing agents, exchanges and clearing houses; vendors; regulators; providers of critical infrastructure such as internet access and electrical power, and retailers for whom we process transactions. Each of these third parties faces the risk of cyber attack, information breach or loss, or technology failure. Any such cyber attack, information breach or loss, or technology failure of a third party could, among other things, adversely affect our ability to effect transactions, service our clients, manage our exposure to risk or expand our businesses. As a result of financial entities and technology systems becoming more interdependent and complex, a cyber incident, information breach or loss, or technology failure that significantly degrades, deletes or compromises the systems or data of one or more financial entities could have a material impact on counterparties or other market participants, including the Corporation. For example, in recent years, there has been significant consolidation among clearing agents, exchanges and clearing houses and increased interconnectivity of multiple financial institutions with central agents, exchanges and clearing houses. This consolidation and interconnectivity increases the risk of operational failure, on both individual and industry-wide bases, as disparate complex systems need to be integrated, often on an accelerated basis. Any such cyber attack, information breach or loss, failure, termination or constraint could, among other things, adversely affect our ability to effect transactions, service our clients, manage our exposure to risk or expand our businesses.
Any of the matters discussed above could result in our loss of customers and business opportunities, significant business disruption to our operations and business, misappropriation or destruction of our confidential information and/or that of our customers, or damage to our customers’ and/or third parties’ computers or systems, and could result in a violation of applicable privacy laws and other laws, litigation exposure, regulatory fines, penalties or intervention, loss of confidence in our security measures, reputational damage, reimbursement or other compensatory costs, and additional compliance costs. In addition, any of the matters described above could adversely impact our results of operations, cash flows, liquidity and financial condition.
Risk of Being an International Business
We are subject to numerous political, economic, market, reputational, operational, legal, regulatory and other risks in the non-U.S. jurisdictions in which we operate.
We do business throughout the world, including in developing regions of the world commonly known as emerging markets. Our businesses and revenues derived from non-U.S. jurisdictions are subject to risk of loss from currency fluctuations, social or judicial instability, changes in governmental policies or policies of central banks, expropriation, nationalization and/or confiscation of assets, price controls, capital controls, exchange controls, other restrictive actions, unfavorable political and diplomatic developments, oil price fluctuation and changes in legislation. These risks are especially elevated in emerging markets. A number of non-U.S. jurisdictions in which we do business have been negatively impacted by slowing growth rates or recessionary conditions, market volatility and/or political unrest. Several emerging market economies are particularly vulnerable to the impact of rising interest rates, inflationary pressures, weaker oil and other commodity prices, large external deficits, and political uncertainty. While some of these jurisdictions are showing signs of stabilization or recovery, others, such as Russia and Greece, continue to experience increasing levels of stress and volatility. In addition, the potential risk of default on sovereign debt in some non-U.S. jurisdictions could expose us to substantial losses. Risks in one country can limit our opportunities for portfolio growth and negatively affect our operations in another country or countries, including our operations in the U.S. As a result, any such unfavorable conditions or developments could have an adverse impact on our company.
Our non-U.S. businesses are also subject to extensive regulation by various regulators, including governments, securities exchanges, central banks and other regulatory bodies, in the jurisdictions in which those businesses operate. In many countries, the laws and regulations applicable to the financial services and securities industries are uncertain and evolving, and it may be difficult for us to determine the exact requirements of local laws in every market or manage our relationships with multiple regulators in various jurisdictions. Our potential inability to remain in compliance with local laws in a particular market and manage our relationships with regulators could have an adverse effect not only on our businesses in that market but also on our reputation generally.
We also invest or trade in the securities of corporations and governments located in non-U.S. jurisdictions, including emerging markets. Revenues from the trading of non-U.S. securities may be subject to negative fluctuations as a result of the above factors. Furthermore, the impact of these fluctuations could be magnified, because non-U.S. trading markets, particularly in emerging market countries, are generally smaller, less liquid and more volatile than U.S. trading markets.
In addition to non-U.S. legislation, our international operations are also subject to U.S. legal requirements. For example, our
international operations are subject to U.S. laws on foreign corrupt practices, the Office of Foreign Assets Control, and anti-money laundering regulations.
We are subject to geopolitical risks, including acts or threats of terrorism, and actions taken by the U.S. or other governments in response thereto and/or military conflicts, which could adversely affect business and economic conditions abroad as well as in the U.S.
For more information on our non-U.S. credit and trading portfolios, see Non-U.S. Portfolio in the MD&A on page 93.
Risk from Accounting Changes
Changes in accounting standards or inaccurate estimates or assumptions in applying accounting policies could adversely affect us.
Our accounting policies and methods are fundamental to how we record and report our financial condition and results of operations. Some of these policies require use of estimates and assumptions that may affect the reported value of our assets or liabilities and results of operations and are critical because they require management to make difficult, subjective and complex judgments about matters that are inherently uncertain. If those assumptions, estimates or judgments were incorrectly made, we could be required to correct and restate prior-period financial statements. Accounting standard-setters and those who interpret the accounting standards (such as the Financial Accounting Standards Board (FASB), the SEC, banking regulators and our independent registered public accounting firm) may also amend or even reverse their previous interpretations or positions on how various standards should be applied. These changes may be difficult to predict and could impact how we prepare and report our financial statements. In some cases, we could be required to apply a new or revised standard retroactively, resulting in the Corporation needing to revise and republish prior-period financial statements.
The FASB issued in 2012 a proposed standard on accounting for credit losses. The standard would replace multiple existing impairment models, including replacing an “incurred loss” model for loans with an “expected loss” model. The FASB has not yet established a proposed effective date but a final standard is expected to be issued in the second half of 2015. The final standard may materially reduce retained earnings in the period of adoption.
For more information on some of our critical accounting policies and standards and recent accounting changes, see Complex Accounting Estimates in the MD&A on page 109 and Note 1 – Summary of Significant Accounting Principlesto the Consolidated Financial Statements.
Item 1B. Unresolved Staff Comments
None
Item 2. Properties
As of December 31, 2014, our principal offices and other materially important properties consisted of the following:
|
| | | | | | | | | | |
| | | | | | | | | | |
| Facility Name | | Location | | General Character of the Physical Property | | Primary Business Segment | | Property Status | | Property Square Feet (1) |
| Bank of America Corporate Center | | Charlotte, NC | | 60 Story Building | | Principal Executive Offices | | Owned | | 1,200,392 |
| Bank of America Tower at One Bryant Park | | New York, NY | | 55 Story Building | | GWIM, Global Banking and Global Markets | | Leased (2) | | 1,798,373 |
| Bank of America Merrill Lynch Financial Centre | | London, UK | | 4 Building Campus | | Global Banking and Global Markets | | Leased | | 568,032 |
| Cheung Kong Center | | Hong Kong | | 62 Story Building | | Global Banking and Global Markets | | Leased | | 149,790 |
| |
(1) | For leased properties, property square feet represents the square footage occupied by the Corporation. |
| |
(2) | The Corporation has a 49.9 percent joint venture interest in this property. |
We own or lease approximately 90.5 million square feet in 22,530 facility and ATM locations globally, including approximately 84.3 million square feet in the U.S. (all 50 states and the District of Columbia, the U.S. Virgin Islands and Puerto Rico) and approximately 6.2 million square feet in more than 35 countries.
We believe our owned and leased properties are adequate for our business needs and are well maintained. We continue to evaluate our owned and leased real estate and may determine from time to time that certain of our premises and facilities, or ownership structures, are no longer necessary for our operations. In connection therewith, we are evaluating the sale or sale/leaseback of certain properties and we may incur costs in connection with any such transactions.
Item 3. Legal Proceedings
See Litigation and Regulatory Matters in Note 12 – Commitments and Contingenciesto the Consolidated Financial Statements, which is incorporated herein by reference.
Item 4. Mine Safety Disclosures
None
Part II
Bank of America Corporation and Subsidiaries
Item 5. Market for Registrant’s Common Equity, Related Stockholder Matters and Issuer Purchases of Equity Securities
The principal market on which our common stock is traded is the New York Stock Exchange. Our common stock is also listed on the London Stock Exchange, and certain shares are listed on the Tokyo Stock Exchange. As of February 24, 2015, there were 203,715 registered shareholders of common stock. The table below sets forth the high and low closing sales prices of the common stock on the New York Stock Exchange for the periods indicated during 2013 and 2014, as well as the dividends we paid on a quarterly basis:
|
| | | | | | | | | | | | | |
| | | | | | | | |
| | Quarter | | High | | Low | | Dividend |
| 2013 | first | | $ | 12.78 |
| | $ | 11.03 |
| | $ | 0.01 |
|
| | second | | 13.83 |
| | 11.44 |
| | 0.01 |
|
| | third | | 14.95 |
| | 12.83 |
| | 0.01 |
|
| | fourth | | 15.88 |
| | 13.69 |
| | 0.01 |
|
| 2014 | first | | 17.92 |
| | 16.10 |
| | 0.01 |
|
| | second | | 17.34 |
| | 14.51 |
| | 0.01 |
|
| | third | | 17.18 |
| | 14.98 |
| | 0.05 |
|
| | fourth | | 18.13 |
| | 15.76 |
| | 0.05 |
|
For more information regarding our ability to pay dividends, see Note 13 – Shareholders’ Equity and Note 16 – Regulatory Requirements and Restrictions to the Consolidated Financial Statements, which are incorporated herein by reference.
For information on our equity compensation plans, see Note 18 – Stock-based Compensation Plans to the Consolidated Financial Statements and Item 12 on page 270 of this report, which are incorporated herein by reference.
The table below presents share repurchase activity for the three months ended December 31, 2014. We did not have any unregistered sales of our equity securities in 2014.
|
| | | | | | | | | | | | | |
| | | | | | | | |
| (Dollars in millions, except per share information; shares in thousands) | Common Shares Repurchased (1) | | Weighted-Average Per Share Price | | Shares Purchased as
Part of Publicly
Announced Programs | | Remaining Buyback Authority Amounts (2) |
| October 1 - 31, 2014 | 339 |
| | $ | 17.29 |
| | — |
| | $ | 3,767 |
|
| November 1 - 30, 2014 | 73 |
| | 17.15 |
| | — |
| | 3,767 |
|
| December 1 - 31, 2014 | 32 |
| | 16.97 |
| | — |
| | 3,767 |
|
| Three months ended December 31, 2014 | 444 |
| | 17.24 |
| | |
| | |
|
| |
(1) | Includes shares of the Corporation’s common stock acquired by the Corporation in connection with satisfaction of tax withholding obligations on vested restricted stock or restricted stock units and certain forfeitures and terminations of employment-related awards under equity incentive plans. |
| |
(2) | On March 26, 2014, the Corporation announced that the Federal Reserve had informed the Corporation that it completed its 2014 Comprehensive Capital Analysis and Review and did not object to the Corporation’s 2014 capital plan, which included a request to repurchase up to $4.0 billion of common stock over four quarters beginning in the second quarter of 2014. On March 26, 2014, the Corporation’s Board of Directors authorized the repurchase of up to $4.0 billion of the Corporation’s common stock through open market purchases or privately negotiated transactions, including Rule 10b5-1 plans, over four quarters beginning with the second quarter of 2014. On April 28, 2014, the Corporation announced the suspension of the repurchase authorization previously announced on March 26, 2014. On May 27, 2014, the Corporation submitted a revised 2014 capital plan to the Federal Reserve that included no additional repurchases of common stock through the end of the first quarter of 2015 (excluding approximately $233 million of repurchases prior to April 27, 2014). On August 6, 2014, the Federal Reserve notified the Corporation that it did not object to the revised 2014 capital plan. Amounts shown in the column reflect remaining buyback authority under the March 26, 2014 authorization; however, the Corporation will not repurchase any shares of common stock pursuant to such authorization without prior approval by the Federal Reserve. |
Item 6. Selected Financial Data
See Table 7 in the MD&A on page 30 and Statistical Table XII in the MD&A on page 129, which are incorporated herein by reference.
|
| | | | |
Item 7. Bank of America Corporation and Subsidiaries Management’s Discussion and Analysis of Financial Condition and Results of Operation |
Management’s Discussion and Analysis of Financial Condition and Results of Operations
This report, the documents that it incorporates by reference and the documents into which it may be incorporated by reference may contain, and from time to time Bank of America Corporation (collectively with its subsidiaries, the Corporation) and its management may make certain statements that constitute forward-looking statements within the meaning of the Private Securities Litigation Reform Act of 1995. These statements can be identified by the fact that they do not relate strictly to historical or current facts. Forward-looking statements often use words such as “anticipates,” “targets,” “expects,” “hopes,” “estimates,” “intends,” “plans,” “goal,” “believes,” “continue” and other similar expressions or future or conditional verbs such as “will,” “may,” “might,” “should,” “would” and “could.” The forward-looking statements made represent the Corporation’s current expectations, plans or forecasts of its future results and revenues, and future business and economic conditions more generally, and other future matters. These statements are not guarantees of future results or performance and involve certain known and unknown risks, uncertainties and assumptions that are difficult to predict and are often beyond the Corporation’s control. Actual outcomes and results may differ materially from those expressed in, or implied by, any of these forward-looking statements.
You should not place undue reliance on any forward-looking statement and should consider the following uncertainties and risks, as well as the risks and uncertainties more fully discussed elsewhere in this report, including under Item 1A. Risk Factors of this Annual Report on Form 10-K and in any of the Corporation’s subsequent Securities and Exchange Commission filings for further information about factors that could affect such forward-looking statements: the Corporation’s ability to resolve representations and warranties repurchase claims and the chance that the Corporation could face related servicing, securities, fraud, indemnity or other claims from one or more counterparties, including monolines or private-label and other investors; the possibility that final court approval of negotiated settlements is not obtained, including the possibility that the court decision with respect to the BNY Mellon Settlement is overturned on appeal in whole or in part; the possibility that future representations and warranties losses may occur in excess of the Corporation’s recorded liability and estimated range of possible loss for its representations and warranties exposures; the possibility that the Corporation may not collect mortgage insurance claims; potential claims, damages, penalties, fines and reputational damage resulting from pending or future litigation and regulatory proceedings, including the possibility that amounts may be in excess of the Corporation’s recorded liability and estimated range of possible losses for litigation exposures; the possibility that the
European Commission will impose remedial measures in relation to its investigation of the Corporation’s competitive practices; the possible outcome of LIBOR, other reference rate and foreign exchange inquiries and investigations; uncertainties about the financial stability and growth rates of non-U.S. jurisdictions, the risk that those jurisdictions may face difficulties servicing their sovereign debt, and related stresses on financial markets, currencies and trade, and the Corporation’s exposures to such risks, including direct, indirect and operational; the impact of U.S. and global interest rates, currency exchange rates and economic conditions; the negative impact of the Dodd-Frank Wall Street Reform and Consumer Protection Act on the Corporation’s business and earnings, including as a result of additional regulatory interpretations and rulemaking and the success of the Corporation’s actions to mitigate such impacts; the potential impact of a prolonged low interest rate environment on the Corporation’s business, financial condition and results of operations; adverse changes to the Corporation’s credit ratings from the major credit rating agencies; estimates of the fair value of certain of the Corporation’s assets and liabilities; uncertainty regarding the content, timing and impact of regulatory capital and liquidity requirements, including, but not limited to, any GSIB surcharge or as a result of changes to our Basel 3 Advanced approaches estimates; the Corporation’s ability to fully realize the cost savings and other anticipated benefits from cost-saving initiatives, including in accordance with currently anticipated timeframes, the impact of implementation and compliance with new and evolving U.S. and international regulations, including, but not limited to, recovery and resolution planning requirements, the Volcker Rule, and derivatives regulations; the potential impact of the U.K. tax authorities’ proposal to limit how much NOLs can offset annual profit; a failure in or breach of the Corporation’s operational or security systems or infrastructure, or those of third parties with whom we do business, including as a result of cyber attacks; and other similar matters.
Forward-looking statements speak only as of the date they are made, and the Corporation undertakes no obligation to update any forward-looking statement to reflect the impact of circumstances or events that arise after the date the forward-looking statement was made.
Notes to the Consolidated Financial Statements referred to in the Management’s Discussion and Analysis of Financial Condition and Results of Operations (MD&A) are incorporated by reference into the MD&A. Certain prior-year amounts have been reclassified to conform to current-year presentation. Throughout the MD&A, the Corporation uses certain acronyms and abbreviations which are defined in the final version of the Credit Risk Retention Rule. Glossary.
Executive Summary
Business Overview
The Corporation is evaluatinga Delaware corporation, a bank holding company (BHC) and a financial holding company. When used in this report, “the Corporation” may refer to Bank of America Corporation individually, Bank of America Corporation and its subsidiaries, or certain of Bank of America Corporation’s subsidiaries or affiliates. Our principal executive offices are located in Charlotte, North Carolina. Through our banking and various nonbank subsidiaries throughout the variousU.S. and in international markets, we provide a diversified range of banking and nonbank financial services and products through five business segments: Consumer & Business Banking (CBB), Consumer Real Estate Services (CRES), Global Wealth & Investment Management (GWIM), Global Banking and Global Markets, with the remaining operations recorded in All Other. Effective January 1, 2015, to align the segments with how we manage the businesses in 2015, we changed our basis of segment presentation as follows: the Home Loans subsegment within CRES was moved to CBB, and Legacy Assets & Servicing became a separate segment. Also, a portion of the Business Banking business, based on the size of the client relationship, was moved from CBB to Global Banking. Prior periods will be restated to conform to the new segment alignment. Prior to October 1, 2014, we operated our banking activities primarily under two charters: Bank of America, National Association (Bank of America, N.A. or BANA) and, to a lesser extent, FIA Card Services, National Association (FIA Card Services, N.A. or FIA). On October 1, 2014, FIA was merged into BANA. At December 31, 2014, the Corporation had approximately $2.1 trillion in assets and approximately 224,000 full-time equivalent employees.
As of December 31, 2014, we operated in all 50 states, the District of Columbia, the U.S. Virgin Islands, Puerto Rico and more than 35 countries. Our retail banking footprint covers approximately 80 percent of the U.S. population and we serve approximately 48 million consumer and small business relationships with approximately 4,800 banking centers, 15,800 ATMs, nationwide call centers, and leading online and mobile banking platforms (www.bankofamerica.com). We offer industry-leading support to approximately three million small business owners. Our industry leading wealth management and trust businesses, with client balances of $2.5 trillion, provide tailored solutions to meet client needs through a full set of brokerage, banking, trust and retirement products. We are a global leader in corporate and investment banking and trading across a broad range of asset classes serving corporations, governments, institutions and individuals around the world.
2014 Economic and Business Environment
In the U.S., economic growth continued in 2014, ending the year in the midst of its sixth consecutive year of recovery. After a tentative and generally soft trajectory for five years where annualized GDP growth averaged 2.3 percent, there were clear
signs of accelerated growth in the final three quarters of 2014 following a first quarter impacted by adverse weather conditions. Employment gains picked up during the year, and the unemployment rate fell to 5.6 percent at year end. Consumption grew slowly early in the year, before picking up steadily and ending with a robust pace in the final quarter. Core inflation remained relatively unchanged in 2014, rising modestly in the first half and falling thereafter, and ended the year more than half a percentage point below the Board of Governors of the Federal Reserve System’s (Federal Reserve) longer-term annual target of two percent.
U.S. household net worth continued to rise in 2014 but at a substantially slower pace than 2013. Home price appreciation was less in 2014 than 2013 but prices still rose approximately five percent in 2014 while equity markets gained approximately 11 percent. However, consumer spending was more significantly enhanced by sharply lower oil prices late in the year, reflecting foreign economic weakness amid an ample and growing energy supply.
U.S. Treasury yields fell over the course of the year, reversing much of the previous year’s increase. Declining world inflation and interest rates helped push U.S. Treasury yields lower even as the Federal Reserve steadily reduced and finally ended its purchases of agency mortgage-backed securities (MBS) and long-term U.S. Treasury securities. The Federal Reserve ended the year amid indications that it can be patient with regard to normalizing monetary policy.
Internationally, the eurozone grew modestly for much of the year, with growth restrained by continued deleveraging of the financial sector, high unemployment and political uncertainty. Inflation in the eurozone also fell significantly to near zero by year end. European bond yields continued to decline, especially as the European Central Bank eased monetary policy and expectations grew late in the year for outright purchases of sovereign and/or corporate securities in 2015, and were subsequently confirmed to begin in March 2015. The Euro/U.S. Dollar exchange rate also fell significantly, boosting European competitiveness, particularly in the second half of 2014, in direct reaction to the differing directions of U.S. and eurozone monetary policies. Contentious negotiations between parties to Greek sovereign and bank support programs added to uncertainty and market volatility in the first quarter of 2015.
In Russia, the combination of the U.S. and European Union sanctions and sharply lower oil prices weakened growth. Select emerging nations that are net energy suppliers also saw growth diminish sharply, although other nations, including some emerging economies in Asia received some benefits from declining energy prices.
Following a quarter of strong economic growth ahead of a consumption tax increase, Japan contracted through the middle of the year and the Bank of Japan responded with stepped up quantitative easing. Amid gradual economic moderation, China also eased monetary policy late in the year.
Selected Financial Data
Table 1 provides selected consolidated financial data for 2014 and 2013.
|
| | | | | | | |
| | | | |
| Table 1 | Selected Financial Data | | |
| | | | |
| (Dollars in millions, except per share information) | 2014 | 2013 |
| Income statement | |
| |
|
Revenue, net of interest expense (FTE basis) (1) | $ | 85,116 |
| $ | 89,801 |
|
| Net income | 4,833 |
| 11,431 |
|
| Diluted earnings per common share | 0.36 |
| 0.90 |
|
| Dividends paid per common share | 0.12 |
| 0.04 |
|
| Performance ratios | |
| |
|
| Return on average assets | 0.23 | % | 0.53 | % |
Return on average tangible common shareholders’ equity (1) | 2.52 |
| 6.97 |
|
Efficiency ratio (FTE basis) (1) | 88.25 |
| 77.07 |
|
| Asset quality | |
| |
|
| Allowance for loan and lease losses at December 31 | $ | 14,419 |
| $ | 17,428 |
|
Allowance for loan and lease losses as a percentage of total loans and leases outstanding at December 31 (2) | 1.65 | % | 1.90 | % |
Nonperforming loans, leases and foreclosed properties at December 31 (2) | $ | 12,629 |
| $ | 17,772 |
|
Net charge-offs (3) | 4,383 |
| 7,897 |
|
Net charge-offs as a percentage of average loans and leases outstanding (2, 3) | 0.49 | % | 0.87 | % |
Net charge-offs as a percentage of average loans and leases outstanding, excluding the purchased credit-impaired loan portfolio (2) | 0.50 |
| 0.90 |
|
Net charge-offs and purchased credit-impaired write-offs as a percentage of average loans and leases outstanding (2) | 0.58 |
| 1.13 |
|
Ratio of the allowance for loan and lease losses at December 31 to net charge-offs (3) | 3.29 |
| 2.21 |
|
| Ratio of the allowance for loan and lease losses at December 31 to net charge-offs, excluding the purchased credit-impaired loan portfolio | 2.91 |
| 1.89 |
|
| Ratio of the allowance for loan and lease losses at December 31 to net charge-offs and purchased credit-impaired write-offs | 2.78 |
| 1.70 |
|
| Balance sheet at year end | |
| |
|
| Total loans and leases | $ | 881,391 |
| $ | 928,233 |
|
| Total assets | 2,104,534 |
| 2,102,273 |
|
| Total deposits | 1,118,936 |
| 1,119,271 |
|
| Total common shareholders’ equity | 224,162 |
| 219,333 |
|
| Total shareholders’ equity | 243,471 |
| 232,685 |
|
Capital ratios at year end (4) | |
| |
|
| Common equity tier 1 capital | 12.3 | % | n/a |
|
| Tier 1 common capital | n/a |
| 10.9 | % |
| Tier 1 capital | 13.4 |
| 12.2 |
|
| Total capital | 16.5 |
| 15.1 |
|
| Tier 1 leverage | 8.2 |
| 7.7 |
|
| |
(1) | Fully taxable-equivalent (FTE) basis, return on average tangible common shareholders’ equity and the efficiency ratio are non-GAAP financial measures. Other companies may define or calculate these measures differently. For more information, see Supplemental Financial Data on page 32, and for corresponding reconciliations to GAAP financial measures, see Statistical Table XV. |
| |
(2) | Balances and ratios do not include loans accounted for under the fair value option. For additional exclusions from nonperforming loans, leases and foreclosed properties, see Consumer Portfolio Credit Risk Management – Nonperforming Consumer Loans, Leases and Foreclosed Properties Activity on page 82 and corresponding Table 39, and Commercial Portfolio Credit Risk Management – Nonperforming Commercial Loans, Leases and Foreclosed Properties Activity on page 89 and corresponding Table 48. |
| |
(3) | Net charge-offs exclude $810 million of write-offs in the purchased credit-impaired loan portfolio for 2014 compared to $2.3 billion for 2013. These write-offs decreased the purchased credit-impaired valuation allowance included as part of the allowance for loan and lease losses. For more information on purchased credit-impaired write-offs, see Consumer Portfolio Credit Risk Management – Purchased Credit-impaired Loan Portfolio on page 78. |
| |
(4) | On January 1, 2014, the Basel 3 rules became effective, subject to transition provisions primarily related to regulatory deductions and adjustments impacting Common equity tier 1 capital and Tier 1 capital. We reported under Basel 1 (which included the Market Risk Final Rules) atDecember 31, 2013. |
Financial Highlights
Net income was $4.8 billion, or $0.36 per diluted share in 2014 compared to $11.4 billion, or $0.90 per diluted share in 2013. The results for 2014 included an increase of $10.3 billion in litigation expense primarily as a result of charges related to the settlements with the U.S. Department of Justice (DoJ) and the Federal Housing Finance Agency (FHFA).
|
| | | | | | | | |
| | | | | |
| Table 2 | Summary Income Statement | | | |
| | | |
| (Dollars in millions) | 2014 | | 2013 |
Net interest income (FTE basis) (1) | $ | 40,821 |
| | $ | 43,124 |
|
| Noninterest income | 44,295 |
| | 46,677 |
|
Total revenue, net of interest expense (FTE basis) (1) | 85,116 |
| | 89,801 |
|
| Provision for credit losses | 2,275 |
| | 3,556 |
|
| Noninterest expense | 75,117 |
| | 69,214 |
|
Income before income taxes (FTE basis) (1) | 7,724 |
| | 17,031 |
|
Income tax expense (FTE basis) (1) | 2,891 |
| | 5,600 |
|
| Net income | 4,833 |
| | 11,431 |
|
| Preferred stock dividends | 1,044 |
| | 1,349 |
|
| Net income applicable to common shareholders | $ | 3,789 |
| | $ | 10,082 |
|
| | | | | |
| Per common share information | | | |
| Earnings | $ | 0.36 |
| | $ | 0.94 |
|
| Diluted earnings | 0.36 |
| | 0.90 |
|
| |
(1) | FTE basis is a non-GAAP financial measure. For more information on this measure, see Supplemental Financial Data on page 32, and for a corresponding reconciliation to GAAP financial measures, see Statistical Table XV. |
Net Interest Income
Net interest income on a fully taxable-equivalent (FTE) basis decreased$2.3 billion to $40.8 billion for 2014 compared to 2013. The net interest yield on an FTE basis decreased12 basis points (bps) to 2.25 percent for 2014. These declines were primarily due to the acceleration of market-related premium amortization on debt securities as the decline in long-term interest rates shortened the expected lives of the securities. Also contributing to these declines were lower loan yields and consumer loan balances, lower net interest income from the asset and liability management (ALM) portfolio and a decrease in trading-related net interest income. Market-related premium amortization was an expense of $1.2 billion in 2014 compared to a benefit of $784 million in 2013. Partially offsetting these declines were reductions in funding yields, lower long-term debt balances and commercial loan growth.
Noninterest Income
|
| | | | | | | | |
| | | | | |
| Table 3 | Noninterest Income | | | |
| | | | | |
| (Dollars in millions) | 2014 | | 2013 |
| Card income | $ | 5,944 |
| | $ | 5,826 |
|
| Service charges | 7,443 |
| | 7,390 |
|
| Investment and brokerage services | 13,284 |
| | 12,282 |
|
| Investment banking income | 6,065 |
| | 6,126 |
|
| Equity investment income | 1,130 |
| | 2,901 |
|
| Trading account profits | 6,309 |
| | 7,056 |
|
| Mortgage banking income | 1,563 |
| | 3,874 |
|
| Gains on sales of debt securities | 1,354 |
| | 1,271 |
|
| Other income (loss) | 1,203 |
| | (49 | ) |
| Total noninterest income | $ | 44,295 |
| | $ | 46,677 |
|
Noninterest income decreased$2.4 billion to $44.3 billion for 2014 compared to 2013. The following highlights the significant changes.
| |
| Ÿ | Investment and brokerage services income increased$1.0 billion primarily driven by increased asset management fees driven by the impact of long-term assets under management (AUM) inflows and higher market levels. |
| |
| Ÿ | Equity investment income decreased$1.8 billion to $1.1 billion primarily due to a lower level of gains compared to 2013 and the continued wind-down of Global Principal Investments (GPI). |
| |
| Ÿ | Trading account profits decreased $747 million, which included a charge of $497 million in 2014 related to the adoption of a funding valuation adjustment (FVA) in Global Markets, partially offset by a $359 million change in net debit valuation adjustments (DVA) on derivatives. Excluding the FVA/DVA charges, trading account profits decreased $609 million due to both lower market volumes and volatility. |
| |
| Ÿ | Mortgage banking income decreased$2.3 billion primarily driven by lower servicing income and core production revenue, partially offset by lower representations and warranties provision. |
| |
| Ÿ | Other income (loss) improved $1.3 billion due to an increase of $1.1 billion in net DVA gains on structured liabilities as our spreads widened, and gains associated with the sales of residential mortgage loans, partially offset by increases in U.K. consumer payment protection insurance (PPI) costs. The prior year also included the write-down of $450 million on a monoline receivable. |
Provision for Credit Losses
The provision for credit losses decreased$1.3 billion to $2.3 billion for 2014 compared to 2013. The provision for credit losses was $2.1 billion lower than net charge-offs for 2014, resulting in a reduction in the allowance for credit losses. The decrease from the prior year was driven by portfolio improvement, including increased home prices in the home loans portfolio and lower unemployment levels driving improvement in the credit card portfolios, and improved asset quality in the commercial portfolio. Partially offsetting this decline was $400 million of additional costs in 2014 associated with the consumer relief portion of the settlement with the DoJ. We expect reserve releases in 2015 to moderate when compared to 2014.
Net charge-offs totaled $4.4 billion, or 0.49 percent of average loans and leases for 2014 compared to $7.9 billion, or 0.87 percent for 2013. The decrease in net charge-offs was due to credit quality improvement across all major portfolios and the impact of increased recoveries primarily from nonperforming and delinquent loan sales. For more information on the provision for credit losses, see Provision for Credit Losses on page 95.
Noninterest Expense
|
| | | | | | | | |
| | | | | |
| Table 4 | Noninterest Expense | | | |
| | | | | |
| (Dollars in millions) | 2014 | | 2013 |
| Personnel | $ | 33,787 |
| | $ | 34,719 |
|
| Occupancy | 4,260 |
| | 4,475 |
|
| Equipment | 2,125 |
| | 2,146 |
|
| Marketing | 1,829 |
| | 1,834 |
|
| Professional fees | 2,472 |
| | 2,884 |
|
| Amortization of intangibles | 936 |
| | 1,086 |
|
| Data processing | 3,144 |
| | 3,170 |
|
| Telecommunications | 1,259 |
| | 1,593 |
|
| Other general operating | 25,305 |
| | 17,307 |
|
| Total noninterest expense | $ | 75,117 |
| | $ | 69,214 |
|
Noninterest expense increased$5.9 billion to $75.1 billion for 2014 compared to 2013 primarily driven by higher litigation expense in other general operating expense. Litigation expense increased $10.3 billion primarily as a result of charges related to the settlements with the DoJ and FHFA. The increase in litigation expense was partially offset by a decrease of $3.3 billion in default-related staffing and other default-related servicing expenses in Legacy Assets & Servicing. Also, personnel expense decreased$932 million in 2014 as we continued to streamline processes and achieve cost savings.
In connection with Project New BAC, which we first announced in the third quarter of 2011, we expected to achieve cost savings in certain noninterest expense categories as we streamlined workflows, simplified processes and aligned expenses with our overall strategic plan and operating principles. We expected total cost savings from Project New BAC to reach $8 billion on an annualized basis, or $2 billion per quarter, by mid-2015. We successfully completed our Project New BAC expense program ahead of schedule by reaching our target of $2 billion in cost savings per quarter, in the third quarter of 2014.
Income Tax Expense
|
| | | | | | | | |
| | | | | |
| Table 5 | Income Tax Expense | | | |
| | | | | |
| (Dollars in millions) | 2014 | | 2013 |
| Income before income taxes | $ | 6,855 |
| | $ | 16,172 |
|
| Income tax expense | 2,022 |
| | 4,741 |
|
| Effective tax rate | 29.5 | % | | 29.3 | % |
The effective tax rate for 2014 was driven by our recurring tax preference items, the resolution of several tax examinations and tax benefits from non-U.S. restructurings, partially offset by the non-deductible treatment of certain litigation charges. We expect an effective tax rate in the low 30 percent range, absent unusual items, for 2015.
The effective tax rate for 2013 was driven by our recurring tax preference items and by certain tax benefits related to non-U.S. operations, partially offset by the $1.1 billion negative impact from the U.K. 2013 Finance Act, enacted in July 2013, which reduced the U.K. corporate income tax rate by three percent. The $1.1 billion charge resulted from remeasuring our U.K. net deferred tax assets, in the period of enactment, using the lower rates.
Balance Sheet Overview
|
| | | | | | | | | | | | | | | | | | | | | | |
| | | | | | | | | | | | | |
| Table 6 | Selected Balance Sheet Data | | | | | | | | | | | |
| | | | | | | | | | | | | |
| | | December 31 | | | | Average Balance | | |
| (Dollars in millions) | 2014 | | 2013 | | % Change | | 2014 | | 2013 | | % Change |
| Assets | |
| | |
| | | | |
| | |
| | |
| Cash and cash equivalents | $ | 138,589 |
| | $ | 131,322 |
| | 6 | % | | $ | 141,078 |
| | $ | 109,014 |
| | 29 | % |
| Federal funds sold and securities borrowed or purchased under agreements to resell | 191,823 |
| | 190,328 |
| | 1 |
| | 222,483 |
| | 224,331 |
| | (1 | ) |
| Trading account assets | 191,785 |
| | 200,993 |
| | (5 | ) | | 202,416 |
| | 217,865 |
| | (7 | ) |
| Debt securities | 380,461 |
| | 323,945 |
| | 17 |
| | 351,702 |
| | 337,953 |
| | 4 |
|
| Loans and leases | 881,391 |
| | 928,233 |
| | (5 | ) | | 903,901 |
| | 918,641 |
| | (2 | ) |
| Allowance for loan and lease losses | (14,419 | ) | | (17,428 | ) | | (17 | ) | | (15,973 | ) | | (21,188 | ) | | (25 | ) |
| All other assets | 334,904 |
| | 344,880 |
| | (3 | ) | | 339,983 |
| | 376,897 |
| | (10 | ) |
| Total assets | $ | 2,104,534 |
| | $ | 2,102,273 |
| | — |
| | $ | 2,145,590 |
| | $ | 2,163,513 |
| | (1 | ) |
| Liabilities | |
| | |
| | | | |
| | |
| | |
| Deposits | $ | 1,118,936 |
| | $ | 1,119,271 |
| | — |
| | $ | 1,124,207 |
| | $ | 1,089,735 |
| | 3 |
|
| Federal funds purchased and securities loaned or sold under agreements to repurchase | 201,277 |
| | 198,106 |
| | 2 |
| | 215,792 |
| | 257,600 |
| | (16 | ) |
| Trading account liabilities | 74,192 |
| | 83,469 |
| | (11 | ) | | 87,151 |
| | 88,323 |
| | (1 | ) |
| Short-term borrowings | 31,172 |
| | 45,999 |
| | (32 | ) | | 41,886 |
| | 43,816 |
| | (4 | ) |
| Long-term debt | 243,139 |
| | 249,674 |
| | (3 | ) | | 253,607 |
| | 263,417 |
| | (4 | ) |
| All other liabilities | 192,347 |
| | 173,069 |
| | 11 |
| | 184,471 |
| | 186,675 |
| | (1 | ) |
| Total liabilities | 1,861,063 |
| | 1,869,588 |
| | — |
| | 1,907,114 |
| | 1,929,566 |
| | (1 | ) |
| Shareholders’ equity | 243,471 |
| | 232,685 |
| | 5 |
| | 238,476 |
| | 233,947 |
| | 2 |
|
| Total liabilities and shareholders’ equity | $ | 2,104,534 |
| | $ | 2,102,273 |
| | — |
| | $ | 2,145,590 |
| | $ | 2,163,513 |
| | (1 | ) |
Year-end balance sheet amounts may vary from average balance sheet amounts due to liquidity and balance sheet management activities, primarily involving our portfolios of highly liquid assets. These portfolios are designed to ensure the adequacy of capital while enhancing our ability to manage liquidity requirements for the Corporation and our customers, and to position the balance sheet in accordance with the Corporation’s risk appetite. The execution of these activities requires the use of balance sheet and capital-related limits including spot, average and risk-weighted asset limits, particularly within the market-making activities of our trading businesses. One of our key regulatory metrics, Tier 1 leverage ratio, is calculated based on adjusted quarterly average total assets.
Balance Sheet Management Actions in 2014
The Corporation took certain actions during 2014 to further optimize its balance sheet. While the overall size of the balance sheet remained relatively unchanged compared to December 31, 2013, the composition has improved in terms of liquidity in response to the new Basel 3 Liquidity Coverage Ratio (LCR) requirements. We shifted the mix of certain discretionary assets out of less liquid loans to more liquid debt securities. This included the sale of $10.7 billion of residential mortgage loans with standby insurance agreements and purchase of agency securities, and the sale of $6.7 billion of nonperforming and other delinquent loans. Though the Global Markets balance sheet was relatively stable, there was a decrease of $11.8 billion in low-margin prime brokerage loans. Ending deposits remained relatively unchanged
as we took actions to optimize the LCR liquidity value of deposits while growing retail deposits. Additionally, from a capital standpoint, $6.0 billion of preferred stock was issued during the year and amendments to our outstanding Series T preferred stock also improved Basel 3 Tier 1 regulatory capital.
Assets
Year-end total assets remained relatively unchanged from December 31, 2013, though the asset mix changed in connection with preparing for the new Basel 3 LCR requirements as discussed above. The key drivers were increased debt securities due to purchases of U.S. Treasury securities, and higher cash and cash equivalents from higher interest-bearing deposits with the Federal Reserve and non-U.S. central banks. These increases were largely offset by a decline in consumer loan balances due to paydowns, sales of residential loans with long-term standby agreements, nonperforming and delinquent loan sales and net charge-offs collectively outpacing new originations, and declines in all other assets and in trading account assets.
Cash and Cash Equivalents
Year-end and average cash and cash equivalents increased $7.3 billion from December 31, 2013 and $32.1 billion in 2014 driven by an increase in interest-bearing deposits with the Federal Reserve and non-U.S. central banks in connection with preparing for the Basel 3 LCR requirements. For more information, see Liquidity Risk – Basel 3 Liquidity Standards on page 67.
Federal Funds Sold and Securities Borrowed or Purchased Under Agreements to Resell
Federal funds transactions involve lending reserve balances on a short-term basis. Securities borrowed or purchased under agreements to resell are collateralized lending transactions utilized to accommodate customer transactions, earn interest rate spreads, and obtain securities for settlement and for collateral. Year-end federal funds sold and securities borrowed or purchased under agreements to resell increased $1.5 billion from December 31, 2013 driven by matched-book activity, partially offset by roll-off of supranational positions and a mix shift into securities. Average federal funds sold and securities borrowed or purchased under agreements to resell decreased $1.8 billion in 2014 compared to 2013 due to lower matched-book activity.
Trading Account Assets
Trading account assets consist primarily of long positions in equity and fixed-income securities including U.S. government and agency securities, corporate securities and non-U.S. sovereign debt. Year-end trading account assets decreased $9.2 billion primarily due to lower equity securities inventory as a result of a decrease in client hedging activity. Average trading account assets decreased $15.4 billion primarily due to a reduction in U.S. Treasury securities inventory.
Debt Securities
Debt securities primarily include U.S. Treasury and agency securities, MBS, principally agency MBS, foreign bonds, corporate bonds and municipal debt. We use the debt securities portfolio primarily to manage interest rate and liquidity risk and to take advantage of market conditions that create economically attractive returns on these investments. Year-end and average debt securities increased $56.5 billion and $13.7 billion primarily due to net purchases of U.S. Treasury securities driven by the new LCR rules, and proposalsincreases in the fair value of available-for-sale (AFS) debt securities resulting from the impact of lower interest rates. For more information on debt securities, see Note 3 – Securities to facilitatethe Consolidated Financial Statements.
Loans and Leases
Year-end and average loans and leases decreased $46.8 billion and $14.7 billion. The decreases were primarily driven by a decline in consumer loan balances due to paydowns, loan sales and net charge-offs outpacing new originations, and a decline in commercial loan balances. For more information on the loan portfolio, see Credit Risk Management on page 70.
Allowance for Loan and Lease Losses
Year-end and average allowance for loan and lease losses decreased $3.0 billion and $5.2 billion primarily due to the impact of improvements in credit quality from the improving economy. For more information, see Allowance for Credit Losses on page 95.
All Other Assets
Year-end all other assets decreased $10.0 billion driven by other earning assets and time deposits placed, partially offset by an increase in derivative assets. Average all other assets decreased $36.9 billion primarily driven by lower customer and other receivables, time deposits placed, loans held-for-sale (LHFS) and derivative assets.
Liabilities
At December 31, 2014, total liabilities were approximately $1.9 trillion, down $8.5 billion from December 31, 2013, driven by planned reductions in short-term borrowings and long-term debt as well as a decrease in trading account liabilities, partially offset by increases in all other liabilities.
Deposits
Year-end deposits remained relatively unchanged from December 31, 2013 due to declines in Global Banking offset by an increase in retail deposits. Average deposits increased $34.5 billion primarily driven by customer and client shifts into more liquid products in the low rate environment.
Federal Funds Purchased and Securities Loaned or Sold Under Agreements to Repurchase
Federal funds transactions involve borrowing reserve balances on a short-term basis. Securities loaned or sold under agreements to repurchase are collateralized borrowing transactions utilized to accommodate customer transactions, earn interest rate spreads and finance assets on the balance sheet. Year-end federal funds purchased and securities loaned or sold under agreements to repurchase increased $3.2 billion primarily driven by matched-book activity. Average federal funds purchased and securities loaned or sold under agreements to repurchase decreased $41.8 billion primarily due to targeted reductions in the balance sheet.
Trading Account Liabilities
Trading account liabilities consist primarily of short positions in equity and fixed-income securities including U.S. Treasury and agency securities, corporate securities, and non-U.S. sovereign debt. Year-end and average trading account liabilities decreased $9.3 billion and $1.2 billion primarily due to lower levels of short U.S. Treasury positions.
Short-term Borrowings
Short-term borrowings provide an additional funding source and primarily consist of Federal Home Loan Bank (FHLB) short-term borrowings, notes payable and various other borrowings that generally have maturities of one year or less. Year-end and average short-term borrowings decreased $14.8 billion and $1.9 billion due to planned reductions in FHLB borrowings. For more information on short-term borrowings, see Note 10 – Federal Funds Sold or Purchased, Securities Financing Agreements and Short-term Borrowings to the Consolidated Financial Statements.
Long-term Debt
Year-end and average long-term debt decreased $6.5 billion and $9.8 billion. The decreases were a result of maturities outpacing new issuances. For more information on long-term debt, see Note 11 – Long-term Debt to the Consolidated Financial Statements.
All Other Liabilities
Year-end all other liabilities increased $19.3 billion driven by increases in derivative liabilities and payables. Average all other liabilities decreased $2.2 billion driven by decreases in payables and derivative liabilities.
Shareholders’ Equity
Year-end shareholders’ equity increased $10.8 billion driven by issuances of preferred stock, an increase in accumulated other comprehensive income (OCI) due to a positive net change in the fair value of AFS debt securities, and earnings, partially offset by common stock repurchases and dividends. Average shareholders’ equity increased $4.5 billion driven by earnings and accumulated OCI, partially offset by common stock repurchases and dividends.
Cash Flows Overview
The Corporation’s operating assets and liabilities support our global markets and lending activities. We believe that cash flows from operations, available cash balances and our ability to generate cash through short- and long-term debt are sufficient to fund our operating liquidity needs. Our investing activities primarily include the debt securities portfolio and other short-term investments. Our financing activities reflect cash flows primarily related to increased customer deposits and net long-term debt reductions.
Cash and cash equivalents increased$7.3 billion during 2014 due to net cash provided by operating activities, partially offset by net cash used in financing and investing activities. This reflects actions taken in preparation for the Basel 3 LCR requirements. These changes were primarily due to higher interest-bearing deposits with the Federal Reserve and non-U.S. central banks as well as the sale of residential mortgage loans with standby insurance agreements and the purchase of agency securities, and the sale of nonperforming and other delinquent loans to further
optimize the balance sheet. Cash and cash equivalents increased$20.6 billion during 2013 due to net cash provided by operating and investing activities, partially offset by net cash used in financing activities.
During 2014, net cash provided by operating activities was $26.7 billion. The more significant drivers included net decreases in trading and derivative instruments, as well as a net increase in accrued expenses and other liabilities. During 2013, net cash provided by operating activities was $92.8 billion. The more significant drivers included net decreases in other assets, and trading and derivative instruments, as well as net proceeds from sales, securitizations and paydowns of LHFS.
During 2014, net cash used in investing activities was $4.2 billion, primarily driven by net purchases of debt securities, partially offset by net decreases in loans and leases. During 2013, net cash provided by investing activities was $25.1 billion, primarily driven by a decrease in federal funds sold and securities borrowed or purchased under agreements to resell and net sales of debt securities, partially offset by a net increase in loans and leases.
During 2014, net cash used in financing activities of $12.2 billion primarily reflected a reduction in short-term borrowings, partially offset by the issuance of preferred stock. During 2013, the net cash used in financing activities of $95.4 billion primarily reflected a decrease in federal funds purchased and securities loaned or sold under agreements to repurchase and net reductions in long-term debt, partially offset by growth in short-term borrowings and deposits.
|
| | | | | | | | | | | | | | | | | | | | |
| | | | | | | | | | | |
| Table 7 | Five-year Summary of Selected Financial Data | | | | | | | | | |
| | | | | | | | | | | |
| (In millions, except per share information) | 2014 | | 2013 | | 2012 | | 2011 | | 2010 |
| Income statement | | | | | |
| | |
| | |
|
| Net interest income | $ | 39,952 |
| | $ | 42,265 |
| | $ | 40,656 |
| | $ | 44,616 |
| | $ | 51,523 |
|
| Noninterest income | 44,295 |
| | 46,677 |
| | 42,678 |
| | 48,838 |
| | 58,697 |
|
| Total revenue, net of interest expense | 84,247 |
| | 88,942 |
| | 83,334 |
| | 93,454 |
| | 110,220 |
|
| Provision for credit losses | 2,275 |
| | 3,556 |
| | 8,169 |
| | 13,410 |
| | 28,435 |
|
| Goodwill impairment | — |
| | — |
| | — |
| | 3,184 |
| | 12,400 |
|
| Merger and restructuring charges | — |
| | — |
| | — |
| | 638 |
| | 1,820 |
|
| All other noninterest expense | 75,117 |
| | 69,214 |
| | 72,093 |
| | 76,452 |
| | 68,888 |
|
| Income (loss) before income taxes | 6,855 |
| | 16,172 |
| | 3,072 |
| | (230 | ) | | (1,323 | ) |
| Income tax expense (benefit) | 2,022 |
| | 4,741 |
| | (1,116 | ) | | (1,676 | ) | | 915 |
|
| Net income (loss) | 4,833 |
| | 11,431 |
| | 4,188 |
| | 1,446 |
| | (2,238 | ) |
| Net income (loss) applicable to common shareholders | 3,789 |
| | 10,082 |
| | 2,760 |
| | 85 |
| | (3,595 | ) |
| Average common shares issued and outstanding | 10,528 |
| | 10,731 |
| | 10,746 |
| | 10,143 |
| | 9,790 |
|
Average diluted common shares issued and outstanding (1) | 10,585 |
| | 11,491 |
| | 10,841 |
| | 10,255 |
| | 9,790 |
|
| Performance ratios | |
| | |
| | |
| | |
| | |
|
| Return on average assets | 0.23 | % | | 0.53 | % | | 0.19 | % | | 0.06 | % | | n/m |
|
| Return on average common shareholders’ equity | 1.70 |
| | 4.62 |
| | 1.27 |
| | 0.04 |
| | n/m |
|
Return on average tangible common shareholders’ equity (2) | 2.52 |
| | 6.97 |
| | 1.94 |
| | 0.06 |
| | n/m |
|
Return on average tangible shareholders’ equity (2) | 2.92 |
| | 7.13 |
| | 2.60 |
| | 0.96 |
| | n/m |
|
| Total ending equity to total ending assets | 11.57 |
| | 11.07 |
| | 10.72 |
| | 10.81 |
| | 10.08 | % |
| Total average equity to total average assets | 11.11 |
| | 10.81 |
| | 10.75 |
| | 9.98 |
| | 9.56 |
|
| Dividend payout | 33.31 |
| | 4.25 |
| | 15.86 |
| | n/m |
| | n/m |
|
| Per common share data | |
| | |
| | |
| | |
| | |
|
| Earnings (loss) | $ | 0.36 |
| | $ | 0.94 |
| | $ | 0.26 |
| | $ | 0.01 |
| | $ | (0.37 | ) |
Diluted earnings (loss) (1) | 0.36 |
| | 0.90 |
| | 0.25 |
| | 0.01 |
| | (0.37 | ) |
| Dividends paid | 0.12 |
| | 0.04 |
| | 0.04 |
| | 0.04 |
| | 0.04 |
|
| Book value | 21.32 |
| | 20.71 |
| | 20.24 |
| | 20.09 |
| | 20.99 |
|
Tangible book value (2) | 14.43 |
| | 13.79 |
| | 13.36 |
| | 12.95 |
| | 12.98 |
|
| Market price per share of common stock | |
| | |
| | | | |
| | |
|
| Closing | $ | 17.89 |
| | $ | 15.57 |
| | $ | 11.61 |
| | $ | 5.56 |
| | $ | 13.34 |
|
| High closing | 18.13 |
| | 15.88 |
| | 11.61 |
| | 15.25 |
| | 19.48 |
|
| Low closing | 14.51 |
| | 11.03 |
| | 5.80 |
| | 4.99 |
| | 10.95 |
|
| Market capitalization | $ | 188,141 |
| | $ | 164,914 |
| | $ | 125,136 |
| | $ | 58,580 |
| | $ | 134,536 |
|
| |
(1) | The diluted earnings (loss) per common share excluded the effect of any equity instruments that are antidilutive to earnings per share. There were no potential common shares that were dilutive in 2010 because of the net loss applicable to common shareholders. |
| |
(2) | Tangible equity ratios and tangible book value per share of common stock are non-GAAP financial measures. Other companies may define or calculate these measures differently. For more information on these ratios, see Supplemental Financial Data on page 32, and for corresponding reconciliations to GAAP financial measures, see Statistical Table XV on page 134. |
| |
(3) | For more information on the impact of the purchased credit-impaired loan portfolio on asset quality, see Consumer Portfolio Credit Risk Management on page 70. |
| |
(4) | Includes the allowance for loan and lease losses and the reserve for unfunded lending commitments. |
| |
(5) | Balances and ratios do not include loans accounted for under the fair value option. For additional exclusions from nonperforming loans, leases and foreclosed properties, see Consumer Portfolio Credit Risk Management – Nonperforming Consumer Loans, Leases and Foreclosed Properties Activity on page 82 and corresponding Table 39, and Commercial Portfolio Credit Risk Management – Nonperforming Commercial Loans, Leases and Foreclosed Properties Activity on page 89 and corresponding Table 48. |
| |
(6) | Primarily includes amounts allocated to the U.S. credit card and unsecured consumer lending portfolios in CBB, purchased credit-impaired loans and the non-U.S. credit card portfolio in All Other. |
| |
(7) | Net charge-offs exclude $810 million, $2.3 billion and $2.8 billion of write-offs in the purchased credit-impaired loan portfolio for 2014, 2013 and 2012, respectively. These write-offs decreased the purchased credit-impaired valuation allowance included as part of the allowance for loan and lease losses. For more information on purchased credit-impaired write-offs, see Consumer Portfolio Credit Risk Management – Purchased Credit-impaired Loan Portfolio on page 78. |
| |
(8) | There were no write-offs of PCI loans in 2011 and 2010. |
| |
(9) | On January 1, 2014, the Basel 3 rules became effective, subject to transition provisions primarily related to regulatory deductions and adjustments impacting Common equity tier 1 capital and Tier 1 capital. We reported under Basel 1 (which included the Market Risk Final Rules) atDecember 31, 2013. Basel 1 did not include the Basel 1 – 2013 Rules prior to 2013. |
n/a = not applicable
n/m = not meaningful
|
| | | | | | | | | | | | | | | | | | | | |
| | | | | | | | | | | |
| Table 7 | Five-year Summary of Selected Financial Data (continued) |
| | | | | | | | | | | |
| (Dollars in millions) | 2014 | | 2013 | | 2012 | | 2011 | | 2010 |
| Average balance sheet | |
| | |
| | |
| | |
| | |
|
| Total loans and leases | $ | 903,901 |
| | $ | 918,641 |
| | $ | 898,768 |
| | $ | 938,096 |
| | $ | 958,331 |
|
| Total assets | 2,145,590 |
| | 2,163,513 |
| | 2,191,356 |
| | 2,296,322 |
| | 2,439,606 |
|
| Total deposits | 1,124,207 |
| | 1,089,735 |
| | 1,047,782 |
| | 1,035,802 |
| | 988,586 |
|
| Long-term debt | 253,607 |
| | 263,417 |
| | 316,393 |
| | 421,229 |
| | 490,497 |
|
| Common shareholders’ equity | 223,066 |
| | 218,468 |
| | 216,996 |
| | 211,709 |
| | 212,686 |
|
| Total shareholders’ equity | 238,476 |
| | 233,947 |
| | 235,677 |
| | 229,095 |
| | 233,235 |
|
Asset quality (3) | |
| | |
| | |
| | |
| | |
|
Allowance for credit losses (4) | $ | 14,947 |
| | $ | 17,912 |
| | $ | 24,692 |
| | $ | 34,497 |
| | $ | 43,073 |
|
Nonperforming loans, leases and foreclosed properties (5) | 12,629 |
| | 17,772 |
| | 23,555 |
| | 27,708 |
| | 32,664 |
|
Allowance for loan and lease losses as a percentage of total loans and leases outstanding (5) | 1.65 | % | | 1.90 | % | | 2.69 | % | | 3.68 | % | | 4.47 | % |
Allowance for loan and lease losses as a percentage of total nonperforming loans and leases (5) | 121 |
| | 102 |
| | 107 |
| | 135 |
| | 136 |
|
Allowance for loan and lease losses as a percentage of total nonperforming loans and leases, excluding the PCI loan portfolio (5) | 107 |
| | 87 |
| | 82 |
| | 101 |
| | 116 |
|
Amounts included in allowance for loan and lease losses for loans and leases that are excluded from nonperforming loans and leases (6) | $ | 5,944 |
| | $ | 7,680 |
| | $ | 12,021 |
| | $ | 17,490 |
| | $ | 22,908 |
|
Allowance for loan and lease losses as a percentage of total nonperforming loans and leases, excluding the allowance for loan and lease losses for loans and leases that are excluded from nonperforming loans and leases (5, 6) | 71 | % | | 57 | % | | 54 | % | | 65 | % | | 62 | % |
Net charge-offs (7) | $ | 4,383 |
| | $ | 7,897 |
| | $ | 14,908 |
| | $ | 20,833 |
| | $ | 34,334 |
|
Net charge-offs as a percentage of average loans and leases outstanding (5, 7) | 0.49 | % | | 0.87 | % | | 1.67 | % | | 2.24 | % | | 3.60 | % |
Net charge-offs as a percentage of average loans and leases outstanding, excluding the PCI loan portfolio (5) | 0.50 |
| | 0.90 |
| | 1.73 |
| | 2.32 |
| | 3.73 |
|
Net charge-offs and PCI write-offs as a percentage of average loans and leases outstanding (5, 8) | 0.58 |
| | 1.13 |
| | 1.99 |
| | 2.24 |
| | 3.60 |
|
Nonperforming loans and leases as a percentage of total loans and leases outstanding (5) | 1.37 |
| | 1.87 |
| | 2.52 |
| | 2.74 |
| | 3.27 |
|
Nonperforming loans, leases and foreclosed properties as a percentage of total loans, leases and foreclosed properties (5) | 1.45 |
| | 1.93 |
| | 2.62 |
| | 3.01 |
| | 3.48 |
|
Ratio of the allowance for loan and lease losses at December 31 to net charge-offs (7) | 3.29 |
| | 2.21 |
| | 1.62 |
| | 1.62 |
| | 1.22 |
|
| Ratio of the allowance for loan and lease losses at December 31 to net charge-offs, excluding the PCI loan portfolio | 2.91 |
| | 1.89 |
| | 1.25 |
| | 1.22 |
| | 1.04 |
|
Ratio of the allowance for loan and lease losses at December 31 to net charge-offs and PCI write-offs (8) | 2.78 |
| | 1.70 |
| | 1.36 |
| | 1.62 |
| | 1.22 |
|
Capital ratios at year end (9) | |
| | |
| | |
| | |
| | |
|
| Risk-based capital: | |
| | |
| | |
| | |
| | |
|
| Common equity tier 1 capital | 12.3 | % | | n/a |
| | n/a |
| | n/a |
| | n/a |
|
| Tier 1 common capital | n/a |
| | 10.9 | % | | 10.8 | % | | 9.7 | % | | 8.5 | % |
| Tier 1 capital | 13.4 |
| | 12.2 |
| | 12.7 |
| | 12.2 |
| | 11.1 |
|
| Total capital | 16.5 |
| | 15.1 |
| | 16.1 |
| | 16.6 |
| | 15.7 |
|
| Tier 1 leverage | 8.2 |
| | 7.7 |
| | 7.2 |
| | 7.4 |
| | 7.1 |
|
Tangible equity (2) | 8.4 |
| | 7.9 |
| | 7.6 |
| | 7.5 |
| | 6.8 |
|
Tangible common equity (2) | 7.5 |
| | 7.2 |
| | 6.7 |
| | 6.6 |
| | 6.0 |
|
For footnotes see page 30.
Supplemental Financial Data
We view net interest income and related ratios and analyses on an FTE basis, which when presented on a consolidated basis, are non-GAAP financial measures. We believe managing the business with net interest income on an FTE basis provides a more accurate picture of the interest margin for comparative purposes. To derive the FTE basis, net interest income is adjusted to reflect tax-exempt income on an equivalent before-tax basis with a corresponding increase in income tax expense. For purposes of this calculation, we use the federal statutory tax rate of 35 percent. This measure ensures comparability of net interest income arising from taxable and tax-exempt sources.
Certain performance measures including the efficiency ratio and net interest yield utilize net interest income (and thus total revenue) on an FTE basis. The efficiency ratio measures the costs expended to generate a dollar of revenue, and net interest yield measures the bps we earn over the cost of funds.
We also evaluate our business based on certain ratios that utilize tangible equity, a non-GAAP financial measure. Tangible equity represents an adjusted shareholders’ equity or common shareholders’ equity amount which has been reduced by goodwill and intangible assets (excluding mortgage servicing rights (MSRs)), net of related deferred tax liabilities. These measures are used to evaluate our use of equity. In addition, profitability, relationship and investment models use both return on average tangible common shareholders’ equity and return on average tangible shareholders’ equity as key measures to support our overall growth goals. These ratios are as follows:
| |
| Ÿ | Return on average tangible common shareholders’ equity measures our earnings contribution as a percentage of adjusted common shareholders’ equity. The tangible common equity ratio represents adjusted ending common shareholders’ equity divided by total assets less goodwill and intangible assets (excluding MSRs), net of related deferred tax liabilities. |
| |
| Ÿ | Return on average tangible shareholders’ equity measures our earnings contribution as a percentage of adjusted average total shareholders’ equity. The tangible equity ratio represents adjusted ending shareholders’ equity divided by total assets less goodwill and intangible assets (excluding MSRs), net of related deferred tax liabilities. |
| |
| Ÿ | Tangible book value per common share represents adjusted ending common shareholders’ equity divided by ending common shares outstanding. |
The aforementioned supplemental data and performance measures are presented in Table 7 and Statistical Table XII. In addition, in Table 8, we have excluded the impact of goodwill impairment charges of $3.2 billion and $12.4 billion recorded in 2011 and 2010 when presenting certain of these metrics. Accordingly, these are non-GAAP financial measures.
We evaluate our business segment results based on measures that utilize average allocated capital. Return on average allocated capital is calculated as net income adjusted for cost of funds and earnings credits and certain expenses related to intangibles, divided by average allocated capital. Allocated capital and the related return both represent non-GAAP financial measures. In addition, for purposes of goodwill impairment testing, the Corporation utilizes allocated equity as a proxy for the carrying value of its reporting units. Allocated equity in the reporting units is comprised of allocated capital plus capital for the portion of goodwill and intangibles specifically assigned to the reporting unit. For additional information, see Business Segment Operations on page 34 and Note 8 – Goodwill and Intangible Assets to the Consolidated Financial Statements.
Statistical Tables XV, XVI and XVII on pages 134, 135 and 136 provide reconciliations of these non-GAAP financial measures to GAAP financial measures. We believe the use of these non-GAAP financial measures provides additional clarity in assessing the results of the Corporation and our segments. Other companies may define or calculate these measures and ratios differently.
|
| | | | | | | | | | | | | | | | | | | | |
| | | | | | | | | | | |
| Table 8 | Five-year Supplemental Financial Data | | | | | | | | | |
| | | | | | | | | | | |
| (Dollars in millions, except per share information) | 2014 | | 2013 | | 2012 | | 2011 | | 2010 |
| Fully taxable-equivalent basis data | |
| | |
| | |
| | |
| | |
|
| Net interest income | $ | 40,821 |
| | $ | 43,124 |
| | $ | 41,557 |
| | $ | 45,588 |
| | $ | 52,693 |
|
| Total revenue, net of interest expense | 85,116 |
| | 89,801 |
| | 84,235 |
| | 94,426 |
| | 111,390 |
|
Net interest yield (1) | 2.25 | % | | 2.37 | % | | 2.24 | % | | 2.38 | % | | 2.59 | % |
| Efficiency ratio | 88.25 |
| | 77.07 |
| | 85.59 |
| | 85.01 |
| | 74.61 |
|
Performance ratios, excluding goodwill impairment charges (2) | |
| | |
| | |
| | |
| | |
|
| Per common share information | |
| | |
| | |
| | |
| | |
|
| Earnings | | | | | | | $ | 0.32 |
| | $ | 0.87 |
|
| Diluted earnings | | | | | | | 0.32 |
| | 0.86 |
|
| Efficiency ratio (FTE basis) | | | | | | | 81.64 | % | | 63.48 | % |
| Return on average assets | | | | | | | 0.20 |
| | 0.42 |
|
| Return on average common shareholders’ equity | | | | | | | 1.54 |
| | 4.14 |
|
| Return on average tangible common shareholders’ equity | | | | | | | 2.46 |
| | 7.03 |
|
| Return on average tangible shareholders’ equity | | | | | | | 3.08 |
| | 7.11 |
|
| |
(1) | Beginning in 2014, interest-bearing deposits placed with the Federal Reserve and certain non-U.S. central banks are included in earning assets. In prior periods, these balances were included with cash and due from banks in the cash and cash equivalents line, consistent with the Consolidated Balance Sheet presentation. Prior periods have been reclassified to conform to current period presentation. |
| |
(2) | Performance ratios are calculated excluding the impact of goodwill impairment charges of $3.2 billion and $12.4 billion recorded in 2011 and 2010. |
Net Interest Income Excluding Trading-related Net Interest Income
We manage net interest income on an FTE basis and excluding the impact of trading-related activities. As discussed in Global Markets on page 46, we evaluate our sales and trading results and strategies on a total market-based revenue approach by combining net interest income and noninterest income for Global Markets. An analysis of net interest income, average earning assets and net interest yield on earning assets, all of which adjust for the impact of trading-related net interest income from reported net interest income on an FTE basis, is shown below. We believe the use of this non-GAAP presentation in Table 9 provides additional clarity in assessing our results.
|
| | | | | | | | |
| | | | | |
| Table 9 | Net Interest Income Excluding Trading-related Net Interest Income |
| | | | | |
| (Dollars in millions) | 2014 | | 2013 |
| Net interest income (FTE basis) | |
| | |
|
| As reported | $ | 40,821 |
| | $ | 43,124 |
|
| Impact of trading-related net interest income | (3,615 | ) | | (3,852 | ) |
Net interest income excluding trading-related net interest income (1) | $ | 37,206 |
| | $ | 39,272 |
|
Average earning assets (2) | |
| | |
|
| As reported | $ | 1,814,930 |
| | $ | 1,819,548 |
|
| Impact of trading-related earning assets | (445,760 | ) | | (468,999 | ) |
Average earning assets excluding trading-related earning assets (1) | $ | 1,369,170 |
| | $ | 1,350,549 |
|
Net interest yield contribution (FTE basis) (2) | |
| | |
|
| As reported | 2.25 | % | | 2.37 | % |
| Impact of trading-related activities | 0.47 |
| | 0.54 |
|
Net interest yield on earning assets excluding trading-related activities (1) | 2.72 | % | | 2.91 | % |
| |
(1) | Represents a non-GAAP financial measure. |
| |
(2) | Beginning in 2014, interest-bearing deposits placed with the Federal Reserve and certain non-U.S. central banks are included in earning assets. In prior periods, these balances were included with cash and due from banks in the cash and cash equivalents line, consistent with the Consolidated Balance Sheet presentation. Prior periods have been reclassified to conform to current period presentation. |
Net interest income excluding trading-related net interest income decreased $2.1 billion to $37.2 billion for 2014 compared to 2013. The decline was primarily due to the impact of market-related premium amortization as lower long-term interest rates shortened the expected lives of the securities, lower loan yields and consumer loan balances, and lower net interest income from the ALM portfolio. Market-related premium amortization was an expense of $1.2 billion in 2014 compared to a benefit of $784 million in 2013. Partially offsetting the decline were reductions in funding yields, lower long-term debt balances and commercial loan growth. For more information on the impact of interest rates, see Interest Rate Risk Management for Non-trading Activities on page 105. For more information on market-related premium amortization, see Note 1 – Summary of Significant Accounting Principles to the Consolidated Financial Statements.
Average earning assets excluding trading-related earning assets increased$18.6 billion to $1,369.2 billion for 2014 compared to 2013. The increase was primarily in interest-bearing deposits with the Federal Reserve and commercial loans, partially offset by declines in consumer loans and other earning assets.
Net interest yield on earning assets excluding trading-related activities decreased19 bps to 2.72 percent for 2014 compared to 2013 due to the same factors as described above.
Business Segment Operations
Segment Description and Basis of Presentation
We report the results of our operations through five business segments: CBB, CRES, GWIM, Global Banking and Global Markets, with the remaining operations recorded in All Other. The primary activities, products or businesses of the business segments and All Other as of December 31, 2014 are shown below. For additional detailed information, see the business segment and All Other discussions which follow.
Effective January 1, 2015, to align the segments with how we manage the businesses in 2015, the Corporation changed its basis of segment presentation as follows: the Home Loans subsegment within CRES was moved to CBB, and Legacy Assets & Servicing became a separate segment. Also, a portion of the Business Banking business, based on the size of the client relationship, was moved from CBB to Global Banking. Prior periods will be restated to conform to the new segment alignment.
We prepare and evaluate segment results using certain non-GAAP measures. For additional information, see Supplemental Financial Data on page 32. Table 10 provides selected summary financial data for our business segments and All Other for 2014 and 2013.
|
| | | | | | | | | | | | | | | | | | | | | | | | | | | | | | | | |
| | | | | | | | | | | | | | | | | |
| Table 10 | Business Segment Results |
| | | | | | | | | | | | | | | | | |
| | | Total Revenue (1) | | Provision for Credit Losses | | Noninterest Expense | | Net Income (Loss) |
| (Dollars in millions) | 2014 | | 2013 | | 2014 | | 2013 | | 2014 | | 2013 | | 2014 | | 2013 |
| Consumer & Business Banking | $ | 29,862 |
| | $ | 29,864 |
| | $ | 2,633 |
| | $ | 3,107 |
| | $ | 15,911 |
| | $ | 16,260 |
| | $ | 7,096 |
| | $ | 6,647 |
|
| Consumer Real Estate Services | 4,848 |
| | 7,715 |
| | 160 |
| | (156 | ) | | 23,226 |
| | 15,815 |
| | (13,395 | ) | | (5,031 | ) |
| Global Wealth & Investment Management | 18,404 |
| | 17,790 |
| | 14 |
| | 56 |
| | 13,647 |
| | 13,033 |
| | 2,974 |
| | 2,977 |
|
| Global Banking | 16,598 |
| | 16,479 |
| | 336 |
| | 1,075 |
| | 7,681 |
| | 7,551 |
| | 5,435 |
| | 4,973 |
|
| Global Markets | 16,119 |
| | 15,390 |
| | 110 |
| | 140 |
| | 11,771 |
| | 11,996 |
| | 2,719 |
| | 1,153 |
|
| All Other | (715 | ) | | 2,563 |
| | (978 | ) | | (666 | ) | | 2,881 |
| | 4,559 |
| | 4 |
| | 712 |
|
| Total FTE basis | 85,116 |
| | 89,801 |
| | 2,275 |
| | 3,556 |
| | 75,117 |
| | 69,214 |
| | 4,833 |
| | 11,431 |
|
| FTE adjustment | (869 | ) | | (859 | ) | | — |
| | — |
| | — |
| | — |
| | — |
| | — |
|
| Total Consolidated | $ | 84,247 |
| | $ | 88,942 |
| | $ | 2,275 |
| | $ | 3,556 |
| | $ | 75,117 |
| | $ | 69,214 |
| | $ | 4,833 |
| | $ | 11,431 |
|
| |
(1) | Total revenue is net of interest expense and is on an FTE basis which for consolidated revenue is a non-GAAP financial measure. For more information on this measure, see Supplemental Financial Data on page 32, and for a corresponding reconciliation to a GAAP financial measure, see Statistical Table XV. |
The Corporation periodically reviews capital allocated to its businesses and allocates capital annually during the strategic and capital planning processes. We utilize a methodology that considers the effect of regulatory capital requirements in addition to internal risk-based capital models. The Corporation’s internal risk-based capital models use a risk-adjusted methodology incorporating each segment’s credit, market, interest rate, business and operational risk components. For more information on the nature of these risks, see Managing Risk on page 55. The capital allocated to the business segments is referred to as allocated capital, which represents a non-GAAP financial measure. For purposes of goodwill impairment testing, the Corporation utilizes allocated equity as a proxy for the carrying value of its reporting units. Allocated equity in the reporting units is comprised of allocated capital plus capital for the portion of goodwill and intangibles specifically assigned to the reporting unit. For additional information, see Note 8 – Goodwill and Intangible Assetsto the Consolidated Financial Statements.
During 2014, we made refinements to the amount of capital allocated to each of our businesses based on multiple considerations that included, but were not limited to, Basel 3 Standardized and Advanced risk-weighted assets, business segment exposures and risk profile, and strategic plans. As a result of this process, in 2014, we adjusted the amount of capital being allocated to our business segments. This change resulted in a reduction of unallocated capital, which is included in All Other, and an aggregate increase in the amount of capital being allocated to the business segments, primarily Global Banking and Global Markets.
For more information on the business segments and reconciliations to consolidated total revenue, net income and year-end total assets, see Note 24 – Business Segment Informationto the Consolidated Financial Statements.
Consumer & Business Banking
|
| | | | | | | | | | | | | | | | | | | | | | | | |
| | | | | | | | | | | | |
| | Deposits | | Consumer Lending | | Total Consumer & Business Banking | | |
| (Dollars in millions) | 2014 | 2013 | | 2014 | 2013 | | 2014 | 2013 | | % Change |
|
| Net interest income (FTE basis) | $ | 10,259 |
| $ | 9,807 |
| | $ | 9,426 |
| $ | 10,243 |
| | $ | 19,685 |
| $ | 20,050 |
| | (2 | )% |
| Noninterest income: | | | | | | | | | | |
| Card income | 68 |
| 60 |
| | 4,834 |
| 4,744 |
| | 4,902 |
| 4,804 |
| | 2 |
|
| Service charges | 4,364 |
| 4,206 |
| | 1 |
| 1 |
| | 4,365 |
| 4,207 |
| | 4 |
|
| All other income | 552 |
| 509 |
| | 358 |
| 294 |
| | 910 |
| 803 |
| | 13 |
|
| Total noninterest income | 4,984 |
| 4,775 |
| | 5,193 |
| 5,039 |
| | 10,177 |
| 9,814 |
| | 4 |
|
| Total revenue, net of interest expense (FTE basis) | 15,243 |
| 14,582 |
| | 14,619 |
| 15,282 |
| | 29,862 |
| 29,864 |
| | — |
|
| | | | | | | | | | | |
| Provision for credit losses | 254 |
| 299 |
| | 2,379 |
| 2,808 |
| | 2,633 |
| 3,107 |
| | (15 | ) |
| Noninterest expense | 10,448 |
| 10,930 |
| | 5,463 |
| 5,330 |
| | 15,911 |
| 16,260 |
| | (2 | ) |
| Income before income taxes (FTE basis) | 4,541 |
| 3,353 |
| | 6,777 |
| 7,144 |
| | 11,318 |
| 10,497 |
| | 8 |
|
| Income tax expense (FTE basis) | 1,694 |
| 1,230 |
| | 2,528 |
| 2,620 |
| | 4,222 |
| 3,850 |
| | 10 |
|
| Net income | $ | 2,847 |
| $ | 2,123 |
| | $ | 4,249 |
| $ | 4,524 |
| | $ | 7,096 |
| $ | 6,647 |
| | 7 |
|
| | | | | | | | | | | |
| Net interest yield (FTE basis) | 1.87 | % | 1.88 | % | | 6.77 | % | 7.18 | % | | 3.48 | % | 3.72 | % | | |
| Return on average allocated capital | 17 |
| 14 |
| | 33 |
| 31 |
| | 24 |
| 22 |
| | |
| Efficiency ratio (FTE basis) | 68.54 |
| 74.95 |
| | 37.38 |
| 34.88 |
| | 53.28 |
| 54.44 |
| | |
| | | | | | | | | | | | |
| Balance Sheet | | | | | | | | | | | |
| | | | | | | | | | | | |
| Average | | | | | | | | | | | |
| Total loans and leases | $ | 22,388 |
| $ | 22,445 |
| | $ | 138,721 |
| $ | 142,129 |
| | $ | 161,109 |
| $ | 164,574 |
| | (2 | ) |
Total earning assets (1) | 548,096 |
| 522,938 |
| | 139,145 |
| 142,721 |
| | 565,700 |
| 539,241 |
| | 5 |
|
Total assets (1) | 580,857 |
| 555,687 |
| | 148,579 |
| 151,434 |
| | 607,895 |
| 580,703 |
| | 5 |
|
| Total deposits | 542,589 |
| 518,407 |
| | n/m |
| n/m |
| | 543,441 |
| 518,904 |
| | 5 |
|
| Allocated capital | 16,500 |
| 15,400 |
| | 13,000 |
| 14,600 |
| | 29,500 |
| 30,000 |
| | (2 | ) |
| | | | | | | | | | | | |
| Year end | | | | | | | | | | | |
| Total loans and leases | $ | 22,284 |
| $ | 22,578 |
| | $ | 141,132 |
| $ | 142,516 |
| | $ | 163,416 |
| $ | 165,094 |
| | (1 | ) |
Total earning assets (1) | 560,130 |
| 535,061 |
| | 141,216 |
| 143,917 |
| | 579,283 |
| 550,698 |
| | 5 |
|
Total assets (1) | 593,485 |
| 567,918 |
| | 150,956 |
| 153,376 |
| | 622,378 |
| 593,014 |
| | 5 |
|
| Total deposits | 555,539 |
| 530,860 |
| | n/m |
| n/m |
| | 556,568 |
| 531,608 |
| | 5 |
|
| |
(1) | In segments and businesses where the total of liabilities and equity exceeds assets, we allocate assets from All Other to match the segments’ and businesses’ liabilities and allocated shareholders’ equity. As a result, total earning assets and total assets of the businesses may not equal total CBB. |
n/m = not meaningful
CBB, which is comprised of Deposits and Consumer Lending, offers a diversified range of credit, banking and investment products and services to consumers and businesses. Our customers and clients have access to a franchise network that stretches coast to coast through 32 states and the District of Columbia. The franchise network includes approximately 4,800 banking centers, 15,800 ATMs, nationwide call centers, and online and mobile platforms.
CBB Results
Net income for CBBincreased$449 million to $7.1 billion in 2014 compared to 2013 primarily driven by lower provision for credit losses, higher noninterest income and lower noninterest expense, partially offset by lower net interest income. Net interest income decreased $365 million to $19.7 billion due to lower average loan balances and card yields, partially offset by the beneficial impact of an increase in investable assets as a result of higher deposit balances. Noninterest income increased $363 million to $10.2 billion primarily due to portfolio divestiture gains, higher service charges and higher card income, partially offset by lower revenue from consumer protection products.
The provision for credit losses decreased$474 million to $2.6 billion in 2014 primarily as a result of improvements in credit
quality. Noninterest expense decreased $349 million to $15.9 billion primarily driven by lower operating, litigation and Federal Deposit Insurance Corporation (FDIC) expenses.
The return on average allocated capital was 24 percent, up from 22 percent, reflecting an increase in net income combined with a small decrease in allocated capital. For more information on capital allocated to the business segments, see Business Segment Operations on page 34.
Deposits
Deposits includes the results of consumer deposit activities which consist of a comprehensive range of products provided to consumers and small businesses. Our deposit products include traditional savings accounts, money market savings accounts, CDs and IRAs, noninterest- and interest-bearing checking accounts, as well as investment accounts and products. The revenue is allocated to the deposit products using our funds transfer pricing process that matches assets and liabilities with similar interest rate sensitivity and maturity characteristics. Deposits generates fees such as account service fees, non-sufficient funds fees, overdraft charges and ATM fees, as well as investment and brokerage fees from Merrill Edge accounts. Merrill Edge is an integrated investing and banking service targeted at customers
with less than $250,000 in investable assets. Merrill Edge provides investment advice and guidance, client brokerage asset services, a self-directed online investing platform and key banking capabilities including access to the Corporation’s network of banking centers and ATMs.
Business Banking within Deposits provides a wide range of lending-related products and services, integrated working capital management and treasury solutions to clients through our network of offices and client relationship teams along with various product partners. Our clients include U.S.-based companies generally with annual sales of $1 million to $50 million. Our lending products and services include commercial loans, lines of credit and real estate lending. Our capital management and treasury solutions include treasury management, foreign exchange and short-term investing options. Deposits also includes the results of our merchant services joint venture.
Deposits includes the net impact of migrating customers and their related deposit balances between Deposits and GWIM as well as other client-managed businesses. For more information on the migration of customer balances to or from GWIM, see GWIM on page 42.
Net income for Deposits increased$724 million to $2.8 billion in 2014 driven by higher revenue and a decrease in noninterest expense. Net interest income increased$452 million to $10.3 billion primarily driven by a combination of pricing discipline and the beneficial impact of an increase in investable assets as a result of higher deposit balances. Noninterest income increased $209 million to $5.0 billion primarily due to higher deposit service charges.
The provision for credit losses decreased $45 million to $254 million as a result of improvement in credit quality. Noninterest expense decreased$482 million to $10.4 billion due to lower operating expenses, driven in part by a reduction in banking centers as customers migrate to self-service touchpoints, in addition to lower FDIC and litigation expense.
Average deposits increased$24.2 billion to $542.6 billion in 2014 driven by a continuing customer shift to more liquid products in the low rate environment. Growth in checking, traditional savings and money market savings of $34.7 billion was partially offset by a decline in time deposits of $10.5 billion. As a result of our continued pricing discipline and the shift in the mix of deposits, the rate paid on average deposits declined by five bps to six bps.
|
| | | | | | | |
| | | | |
Key Statistics – Deposits | | | |
| | | | |
| | 2014 | | 2013 |
| Total deposit spreads (excludes noninterest costs) | 1.59 | % | | 1.52 | % |
| | | | |
| Year end | | | |
| Client brokerage assets (in millions) | $ | 113,763 |
| | $ | 96,048 |
|
| Online banking active accounts (units in thousands) | 30,904 |
| | 29,950 |
|
| Mobile banking active accounts (units in thousands) | 16,539 |
| | 14,395 |
|
| Banking centers | 4,855 |
| | 5,151 |
|
| ATMs | 15,838 |
| | 16,259 |
|
Client brokerage assets increased $17.7 billion in 2014 driven by new accounts, increased account flows and higher market valuations. Mobile banking active accounts increased2.1 million reflecting continuing changes in our customers’ banking preferences. The number of banking centers declined296 and ATMs declined421 as we continue to optimize our consumer banking network and improve our cost-to-serve.
Consumer Lending
Consumer Lending is one of the leading issuers of credit and debit cards to consumers and small businesses in the U.S. Our lending products and services also include direct and indirect consumer loans such as automotive, marine, aircraft, recreational vehicle and consumer personal loans. In addition to earning net interest spread revenue on its lending activities, Consumer Lending generates interchange revenue from credit and debit card transactions as well as annual credit card fees and other miscellaneous fees.
Consumer Lending includes the net impact of migrating customers and their related credit card loan balances between Consumer Lending and GWIM. For more information on the migration of customer balances to or from GWIM, see GWIM on page 42.
Net income for Consumer Lending decreased$275 million to $4.2 billion in 2014 primarily due to lower net interest income and higher noninterest expense, partially offset by lower provision for credit losses and higher noninterest income. Net interest income decreased$817 million to $9.4 billion driven by the impact of lower average loan balances and card yields. Noninterest income increased $154 million to $5.2 billion driven by portfolio divestiture gains and higher card income, partially offset by lower revenue from consumer protection products.
The provision for credit losses decreased$429 million to $2.4 billion in 2014 as a result of continued improvement in credit quality, due in part to lower delinquencies. Noninterest expense increased$133 million to $5.5 billion driven by higher operating expenses, partially offset by lower litigation expense.
Average loans decreased$3.4 billion to $138.7 billion in 2014 primarily driven by the net migration of credit card loan balances to GWIM as described above, continued run-off of non-core portfolios and portfolio divestitures, partially offset by an increase in small business lending and consumer auto loans.
|
| | | | | | | |
| | | | |
Key Statistics – Consumer Lending | | | |
| | | | |
| (Dollars in millions) | 2014 | | 2013 |
Total U.S. credit card (1) | | | |
| Gross interest yield | 9.34 | % | | 9.73 | % |
| Risk-adjusted margin | 9.44 |
| | 8.68 |
|
| New accounts (in thousands) | 4,541 |
| | 3,911 |
|
| Purchase volumes | $ | 212,088 |
| | $ | 205,914 |
|
| Debit card purchase volumes | $ | 272,576 |
| | $ | 267,087 |
|
| |
(1) | Total U.S. credit card includes portfolios in CBB and GWIM. |
During 2014, the total U.S. credit card risk-adjusted margin increased76 bps due to an improvement in credit quality and portfolio divestiture gains. Total U.S. credit card purchase volumes increased$6.2 billion to $212.1 billion and debit card purchase volumes increased$5.5 billion to $272.6 billion, reflecting higher levels of consumer spending.
Consumer Real Estate Services
|
| | | | | | | | | | | | | | | | | | | | | | | | |
| | | | | | | | | | | | |
| Home Loans | | Legacy Assets & Servicing | | Total Consumer Real Estate Services | | |
| (Dollars in millions) | 2014 | 2013 | | 2014 | 2013 | | 2014 | 2013 | | % Change |
| Net interest income (FTE basis) | $ | 1,315 |
| $ | 1,349 |
| | $ | 1,516 |
| $ | 1,541 |
| | $ | 2,831 |
| $ | 2,890 |
| | (2 | )% |
| Noninterest income: | | | | | | | | | | |
| Mortgage banking income | 813 |
| 1,916 |
| | 1,053 |
| 2,669 |
| | 1,866 |
| 4,585 |
| | (59 | ) |
| All other income (loss) | 40 |
| (6 | ) | | 111 |
| 246 |
| | 151 |
| 240 |
| | (37 | ) |
| Total noninterest income | 853 |
| 1,910 |
| | 1,164 |
| 2,915 |
| | 2,017 |
| 4,825 |
| | (58 | ) |
| Total revenue, net of interest expense (FTE basis) | 2,168 |
| 3,259 |
| | 2,680 |
| 4,456 |
| | 4,848 |
| 7,715 |
| | (37 | ) |
| | | | | | | | | | | |
| Provision for credit losses | 33 |
| 127 |
| | 127 |
| (283 | ) | | 160 |
| (156 | ) | | n/m |
|
| Noninterest expense | 2,587 |
| 3,334 |
| | 20,639 |
| 12,481 |
| | 23,226 |
| 15,815 |
| | 47 |
|
| Loss before income taxes (FTE basis) | (452 | ) | (202 | ) | | (18,086 | ) | (7,742 | ) | | (18,538 | ) | (7,944 | ) | | 133 |
|
| Income tax benefit (FTE basis) | (169 | ) | (74 | ) | | (4,974 | ) | (2,839 | ) | | (5,143 | ) | (2,913 | ) | | 77 |
|
| Net loss | $ | (283 | ) | $ | (128 | ) | | $ | (13,112 | ) | $ | (4,903 | ) | | $ | (13,395 | ) | $ | (5,031 | ) | | n/m |
|
| | | | | | | | | | | |
| Net interest yield (FTE basis) | 2.40 | % | 2.54 | % | | 4.03 | % | 3.19 | % | | 3.06 | % | 2.85 | % | | |
| | | | | | | | | | | | |
| Balance Sheet | | | | | | | | | | | |
| | | | | | | | | | | | |
| Average | | | | | | | | | | | |
| Total loans and leases | $ | 52,336 |
| $ | 47,675 |
| | $ | 35,941 |
| $ | 42,603 |
| | $ | 88,277 |
| $ | 90,278 |
| | (2 | ) |
| Total earning assets | 54,778 |
| 53,148 |
| | 37,593 |
| 48,272 |
| | 92,371 |
| 101,420 |
| | (9 | ) |
| Total assets | 54,751 |
| 53,426 |
| | 52,134 |
| 67,130 |
| | 106,885 |
| 120,556 |
| | (11 | ) |
| Allocated capital | 6,000 |
| 6,000 |
| | 17,000 |
| 18,000 |
| | 23,000 |
| 24,000 |
| | (4 | ) |
| | | | | | | | | | | | |
| Year end | | | | | | | | | | | |
| Total loans and leases | $ | 54,917 |
| $ | 51,021 |
| | $ | 33,055 |
| $ | 38,732 |
| | $ | 87,972 |
| $ | 89,753 |
| | (2 | ) |
| Total earning assets | 57,881 |
| 54,071 |
| | 33,922 |
| 43,092 |
| | 91,803 |
| 97,163 |
| | (6 | ) |
| Total assets | 57,772 |
| 53,933 |
| | 45,958 |
| 59,458 |
| | 103,730 |
| 113,391 |
| | (9 | ) |
n/m = not meaningful
CRES operations include Home Loans and Legacy Assets & Servicing. Home Loans is responsible for ongoing residential first mortgage and home equity loan production activities and the CRES home equity loan portfolio not selected for inclusion in the Legacy Assets & Servicing owned portfolio. Legacy Assets & Servicing is responsible for our mortgage servicing activities related to loans serviced for others and loans held by the Corporation, including loans that have been designated as the Legacy Assets & Servicing Portfolios. The Legacy Assets & Servicing Portfolios (both owned and serviced), herein referred to as the Legacy Owned and Legacy Serviced Portfolios, respectively (together, the Legacy Portfolios), and as further defined below, include those loans originated prior to January 1, 2011 that would not have been originated under our established underwriting standards as of December 31, 2010. For more information on our Legacy Portfolios, see page 39. In addition, Legacy Assets & Servicing is responsible for managing legacy exposures related to CRES (e.g., litigation, representations and warranties). This alignment allows CRES management to lead the ongoing Home Loans business while also providing focus on legacy mortgage issues and servicing activities.
CRES, primarily through its Home Loans operations, generates revenue by providing an extensive line of consumer real estate products and services to customers nationwide. CRES products offered by Home Loans include fixed- and adjustable-rate first-lien mortgage loans for home purchase and refinancing needs, home equity lines of credit (HELOCs) and home equity loans. First mortgage products are generally either sold into the secondary mortgage market to investors, while we retain MSRs (which are on the balance sheet of Legacy Assets & Servicing) and the Bank
of America customer relationships, or are held on the balance sheet in Home Loans or in All Other for ALM purposes. Home Loans is compensated for loans held for ALM purposes on a management accounting basis with the corresponding offset in All Other. Newly originated HELOCs and home equity loans are retained on the CRES balance sheet in Home Loans.
CRES includes the impact of migrating certain customers and their related loan balances from GWIM to CRES. For more information on the migration of customer balances to or from GWIM, see GWIM on page 42.
CRES Results
The net loss for CRESincreased$8.4 billion to a net loss of $13.4 billion for 2014 compared to 2013 primarily driven by higher litigation expense, which is included in noninterest expense, as a result of the settlements with the DoJ and FHFA, a lower tax benefit rate resulting from the non-deductible treatment of a portion of the settlement with the DoJ, lower mortgage banking income and higher provision for credit losses.
Mortgage banking income decreased$2.7 billion due to both lower servicing income and core production revenue, partially offset by a lower representations and warranties provision. The provision for credit losses increased$316 million to $160 million driven by additional costs associated with the consumer relief portion of the settlement with the DoJ, partially offset by the continued improvement in portfolio trends including increased home prices. Noninterest expense increased $7.4 billion primarily due to a $11.4 billion increase in litigation expense as a result of the settlements with the DoJ and FHFA. Excluding litigation,
noninterest expense decreased $4.0 billion to $8.0 billion driven by a decline in default-related servicing expenses, including mortgage-related assessments, waivers and similar costs related to foreclosure delays in Legacy Assets & Servicing and a decline in personnel expense resulting from lower loan originations in Home Loans.
Home Loans
Home Loans products are available to our customers through our retail network, direct telephone and online access delivered by a sales force of nearly 2,500 mortgage loan officers, including 1,500 banking center mortgage loan officers covering 2,600 banking centers, and a nearly 700-person centralized sales force based in five call centers.
The net loss for Home Loans increased$155 million to a net loss of $283 million driven by lower mortgage banking income, partially offset by lower noninterest expense and lower provision for credit losses. Mortgage banking income decreased $1.1 billion due to a decline in core production revenue as a result of lower first mortgage origination volumes, and to a lesser extent, industry-wide margin compression. The provision for credit losses decreased $94 million reflecting continued improvement in portfolio trends including increased home prices. Noninterest expense decreased $747 million primarily due to lower personnel expense resulting from lower loan originations.
Legacy Assets & Servicing
Legacy Assets & Servicing is responsible for all of our in-house servicing activities related to the residential mortgage and home equity loan portfolios, including owned loans and loans serviced for others (collectively, the mortgage serviced portfolio). A portion of this portfolio has been designated as the Legacy Serviced Portfolio, which represented 26 percent, 30 percent and 39 percent of the total mortgage serviced portfolio, as measured by unpaid principal balance, at December 31, 2014, 2013 and 2012, respectively. In addition, Legacy Assets & Servicing is responsible for managing subservicing agreements.
Legacy Assets & Servicing results reflect the net cost of legacy exposures that are included in the results of CRES, including representations and warranties provision, litigation expense, financial results of the CRES home equity portfolio selected as part of the Legacy Owned Portfolio, the financial results of the servicing operations and the results of MSR activities, including net hedge results. The financial results of the servicing operations reflect certain revenues and expenses on loans serviced for others, including owned loans serviced for Home Loans, GWIM and All Other.
Servicing activities include collecting cash for principal, interest and escrow payments from borrowers, disbursing customer draws for lines of credit, accounting for and remitting principal and interest payments to investors and escrow payments to third parties, and responding to customer inquiries. Our home retention efforts, including single point of contact resources, are also part of our servicing activities, along with supervision of
foreclosures and property dispositions. Prior to foreclosure, Legacy Assets & Servicing evaluates various workout options in an effort to help our customers avoid foreclosure. For more information on our servicing activities, including the impact of foreclosure delays, see Off-Balance Sheet Arrangements and Contractual Obligations – Servicing, Foreclosure and Other Mortgage Matters on page 53.
The net loss for Legacy Assets & Servicing increased $8.2 billion to a net loss of $13.1 billion driven by higher litigation expense, which is included in noninterest expense, a lower tax benefit rate resulting from the non-deductible treatment of a portion of the settlement with the DoJ, lower mortgage banking income and higher provision for credit losses.
Mortgage banking income decreased $1.6 billion primarily driven by a decline in servicing income due to a smaller servicing portfolio combined with less favorable MSR net-of-hedge performance. The provision for credit losses increased $410 million primarily due to additional costs associated with the consumer relief portion of the settlement with the DoJ.
Noninterest expense increased $8.2 billion due to higher litigation expense as a result of the settlements with the DoJ and FHFA. Excluding litigation, noninterest expense decreased $3.3 billion to $5.4 billion driven by a decrease in default-related servicing expenses, including mortgage-related assessments, waivers and similar costs related to foreclosure delays. We expect that noninterest expense in Legacy Assets & Servicing, excluding litigation expense, will decline to approximately $800 million per quarter by the end of 2015.
Legacy Portfolios
The Legacy Portfolios (both owned and serviced) include those loans originated prior to January 1, 2011 that would not have been originated under our established underwriting standards in place as of December 31, 2010. The purchased credit-impaired (PCI) portfolio, as well as certain loans that met a pre-defined delinquency status or probability of default threshold as of January 1, 2011, are also included in the Legacy Portfolios. Since determining the pool of loans to be included in the Legacy Portfolios as of January 1, 2011, the criteria have not changed for these portfolios, but will continue to be evaluated over time.
Legacy Owned Portfolio
The Legacy Owned Portfolio includes those loans that met the criteria as described above and are on the balance sheet of the Corporation. The home equity loan portfolio is held on the balance sheet of Legacy Assets & Servicing, and the residential mortgage loan portfolio is held on the balance sheet of All Other. The financial results of the on-balance sheet loans are reported in the segment that owns the loans or in All Other. Total loans in the Legacy Owned Portfolio decreased$22.2 billion in 2014 to $89.9 billion at December 31, 2014, of which $33.1 billion were held on the Legacy Assets & Servicing balance sheet and the remainder was held on the balance sheet of All Other. The decrease was primarily related to paydowns, loan sales, PCI write-offs and charge-offs.
Legacy Serviced Portfolio
The Legacy Serviced Portfolio includes loans serviced by Legacy Assets & Servicing in both the Legacy Owned Portfolio and those loans serviced for outside investors that met the criteria as described above. The table below summarizes the balances of the residential mortgage loans included in the Legacy Serviced Portfolio (the Legacy Residential Mortgage Serviced Portfolio) representing 24 percent, 28 percent and 38 percent of the total residential mortgage serviced portfolio of $609 billion, $719 billion and $1.2 trillion, as measured by unpaid principal balance, at December 31, 2014, 2013 and 2012, respectively. The decline in the Legacy Residential Mortgage Serviced Portfolio was primarily due to MSR sales, loan sales and other servicing transfers, paydowns and payoffs.
|
| | | | | | | | | | | | |
| | | | | | | |
Legacy Residential Mortgage Serviced Portfolio, a subset of the Residential Mortgage Serviced Portfolio (1) |
| | | | | | | |
| | | December 31 |
| (Dollars in billions) | | 2014 | | 2013 | | 2012 |
| Unpaid principal balance | | | | | | |
| Residential mortgage loans | | | | | | |
| Total | | $ | 148 |
| | $ | 203 |
| | $ | 467 |
|
| 60 days or more past due | | 25 |
| | 49 |
| | 137 |
|
| | | | | | | |
| Number of loans serviced (in thousands) | | | | | | |
| Residential mortgage loans | | | | | | |
| Total | | 794 |
| | 1,083 |
| | 2,542 |
|
| 60 days or more past due | | 135 |
| | 258 |
| | 649 |
|
| |
(1) | Excludes $34 billion, $39 billion and $52 billion of home equity loans and HELOCs at December 31, 2014, 2013 and 2012, respectively. |
Non-Legacy Portfolio
As previously discussed, Legacy Assets & Servicing is responsible for all of our servicing activities. The table below summarizes the balances of the residential mortgage loans that are not included in the Legacy Serviced Portfolio (the Non-Legacy Residential Mortgage Serviced Portfolio) representing 76 percent, 72 percent and 62 percent of the total residential mortgage serviced portfolio, as measured by unpaid principal balance, at December 31, 2014, 2013 and 2012, respectively. The decline in the Non-Legacy Residential Mortgage Serviced Portfolio was primarily due to MSR sales and other servicing transfers, paydowns and payoffs. |
| | | | | | | | | | | | |
| | | | | | | |
Non-Legacy Residential Mortgage Serviced Portfolio, a subset of the Residential Mortgage Serviced Portfolio (1) |
| | | | | | | |
| | | December 31 |
| (Dollars in billions) | | 2014 | | 2013 | | 2012 |
| Unpaid principal balance | | | | | | |
| Residential mortgage loans | | | | | | |
| Total | | $ | 461 |
| | $ | 516 |
| | $ | 755 |
|
| 60 days or more past due | | 9 |
| | 12 |
| | 22 |
|
| | | | | | | |
| Number of loans serviced (in thousands) | | | | | | |
| Residential mortgage loans | | | | | | |
| Total | | 2,951 |
| | 3,267 |
| | 4,764 |
|
| 60 days or more past due | | 54 |
| | 67 |
| | 124 |
|
| |
(1) | Excludes $50 billion, $52 billion and $58 billion of home equity loans and HELOCs at December 31, 2014, 2013 and 2012, respectively. |
Mortgage Banking Income
CRES mortgage banking income is categorized into production and servicing income. Core production income is comprised primarily of revenue from the fair value gains and losses recognized on our interest rate lock commitments (IRLCs) and LHFS, the related secondary market execution and costs related to representations and warranties in the sales transactions along with other obligations incurred in the sales of mortgage loans. Ongoing costs related to representations and warranties and other obligations that were incurred in the sales of mortgage loans in prior periods are also included in production income.
Servicing income includes income earned in connection with servicing activities and MSR valuation adjustments, net of results from risk management activities used to hedge certain market risks of the MSRs. The costs associated with our servicing activities are included in noninterest expense.
The table below summarizes the components of mortgage banking income.
|
| | | | | | | |
| | | | |
| Mortgage Banking Income | | | |
| | | | |
| (Dollars in millions) | 2014 | | 2013 |
| Production income: | | | |
| Core production revenue | $ | 1,181 |
| | $ | 2,543 |
|
| Representations and warranties provision | (683 | ) | | (840 | ) |
| Total production income | 498 |
| | 1,703 |
|
| Servicing income: | | | |
| Servicing fees | 1,884 |
| | 3,030 |
|
Amortization of expected cash flows (1) | (818 | ) | | (1,043 | ) |
Fair value changes of MSRs, net of risk management activities used to hedge certain market risks (2) | 294 |
| | 867 |
|
| Other servicing-related revenue | 8 |
| | 28 |
|
| Total net servicing income | 1,368 |
| | 2,882 |
|
Total CRES mortgage banking income | 1,866 |
| | 4,585 |
|
Eliminations (3) | (303 | ) | | (711 | ) |
| Total consolidated mortgage banking income | $ | 1,563 |
| | $ | 3,874 |
|
| |
(1) | Represents the net change in fair value of the MSR asset due to the recognition of modeled cash flows. |
| |
(2) | Includes gains (losses) on sales of MSRs. |
| |
(3) | Includes the effect of transfers of mortgage loans from CRES to the ALM portfolio included in All Other and intercompany allocations of servicing costs. |
Core production revenue decreased $1.4 billion to $1.2 billion in 2014 due to lower first mortgage origination volumes as described below, and to a lesser extent, industry-wide margin compression. The representations and warranties provision decreased $157 million to $683 million and was primarily related to non-government-sponsored enterprises exposures, partially offset by lower exposure to mortgage insurance companies as a result of settlements in 2014.
Net servicing income decreased$1.5 billion to $1.4 billion driven by lower servicing fees due to a smaller servicing portfolio and less favorable MSR net-of-hedge performance, partially offset by lower amortization of expected cash flows. The decline in the size of our servicing portfolio was driven by strategic sales of MSRs during 2014 and 2013 as well as loan prepayment activity, which exceeded new originations primarily due to our exit from non-retail channels.
|
| | | | | | | | |
| | | | | |
| Key Statistics | | | | |
| | | | | |
| (Dollars in millions, except as noted) | 2014 | | 2013 | |
Loan production (1) | |
| | |
| |
Total (2): | | | | |
| First mortgage | $ | 43,290 |
| | $ | 83,421 |
| |
| Home equity | 11,233 |
| | 6,361 |
| |
| CRES: | |
| | |
| |
| First mortgage | $ | 32,340 |
| | $ | 66,913 |
| |
| Home equity | 10,286 |
| | 5,498 |
| |
| | | | | |
| Year end | |
| | |
| |
Mortgage serviced portfolio (in billions) (1, 3) | $ | 693 |
| | $ | 810 |
| |
Mortgage loans serviced for investors (in billions) (1) | 474 |
| | 550 |
| |
| Mortgage servicing rights: | |
| | |
| |
Balance (4) | 3,271 |
| | 5,042 |
| |
Capitalized mortgage servicing rights (% of loans serviced for investors) | 69 |
| bps | 92 |
| bps |
| |
(1) | The above loan production and year-end servicing portfolio and mortgage loans serviced for investors represent the unpaid principal balance of loans. |
| |
(2) | In addition to loan production in CRES, the remaining first mortgage and home equity loan production is primarily in GWIM. |
| |
(3) | Servicing of residential mortgage loans, HELOCs and home equity loans by Legacy Assets & Servicing. |
| |
(4) | At December 31, 2014, excludes $259 million of certain non-U.S. residential mortgage MSR balances that are recorded in Global Markets. |
First mortgage loan originations in CRES and for the total Corporation declined in 2014 compared to 2013 reflecting a decline in the overall mortgage market as higher interest rates throughout most of 2014 drove a decrease in refinances.
During 2014, 60 percent of the total Corporation first mortgage production volume was for refinance originations and 40 percent was for purchase originations compared to 82 percent and 18
percent in 2013. Home Affordable Refinance Program (HARP) refinance originations were six percent of all refinance originations compared to 23 percent in 2013. Making Home Affordable non-HARP refinance originations were 17 percent of all refinance originations compared to 19 percent in 2013. The remaining 77 percent of refinance originations was conventional refinances compared to 58 percent in 2013.
Home equity production for the total Corporation was $11.2 billion for 2014 compared to $6.4 billion for 2013, with the increase due to a higher demand in the market based on improving housing trends, and increased market share driven by improved banking center engagement with customers and more competitive pricing.
Mortgage Servicing Rights
At December 31, 2014, the balance of consumer MSRs managed within CRES, which excludes $259 million of certain non-U.S. residential mortgage MSRs recorded in Global Markets, was $3.3 billion, which represented 69 bps of the related unpaid principal balance compared to $5.0 billion, or 92 bps of the related unpaid principal balance at December 31, 2013. The consumer MSR balance managed within CRES decreased $1.8 billion during 2014 primarily driven by a decrease in value due to lower mortgage rates at December 31, 2014 compared to December 31, 2013, which resulted in higher forecasted prepayment speeds, and the recognition of modeled cash flows, partially offset by additions to the portfolio. For more information on our servicing activities, see Off-Balance Sheet Arrangements and Contractual Obligations – Servicing, Foreclosure and Other Mortgage Matters on page 53. For more information on MSRs, see Note 23 – Mortgage Servicing Rightsto the Consolidated Financial Statements.
Global Wealth & Investment Management |
| | | | | | | | | | | |
| | | | | | | |
| (Dollars in millions) | 2014 | | 2013 | | % Change |
| Net interest income (FTE basis) | $ | 5,836 |
| | $ | 6,064 |
| | (4 | )% |
| Noninterest income: | | | | | |
| Investment and brokerage services | 10,722 |
| | 9,709 |
| | 10 |
|
| All other income | 1,846 |
| | 2,017 |
| | (8 | ) |
| Total noninterest income | 12,568 |
| | 11,726 |
| | 7 |
|
| Total revenue, net of interest expense (FTE basis) | 18,404 |
| | 17,790 |
| | 3 |
|
| | | | | | |
| Provision for credit losses | 14 |
| | 56 |
| | (75 | ) |
| Noninterest expense | 13,647 |
| | 13,033 |
| | 5 |
|
| Income before income taxes (FTE basis) | 4,743 |
| | 4,701 |
| | 1 |
|
| Income tax expense (FTE basis) | 1,769 |
| | 1,724 |
| | 3 |
|
| Net income | $ | 2,974 |
| | $ | 2,977 |
| | — |
|
| | | | | | |
| Net interest yield (FTE basis) | 2.33 | % | | 2.41 | % | | |
| Return on average allocated capital | 25 |
| | 30 |
| | |
| Efficiency ratio (FTE basis) | 74.15 |
| | 73.26 |
| | |
| | | | | | |
| Balance Sheet | | | | | | |
| | | | | | |
| Average | | | | | |
| Total loans and leases | $ | 119,775 |
| | $ | 111,023 |
| | 8 |
|
| Total earning assets | 250,747 |
| | 251,395 |
| | — |
|
| Total assets | 269,279 |
| | 270,789 |
| | (1 | ) |
| Total deposits | 240,242 |
| | 242,161 |
| | (1 | ) |
| Allocated capital | 12,000 |
| | 10,000 |
| | 20 |
|
| | | | | | |
| Year end | |
| | |
| | |
|
| Total loans and leases | $ | 125,431 |
| | $ | 115,846 |
| | 8 |
|
| Total earning assets | 258,219 |
| | 254,031 |
| | 2 |
|
| Total assets | 276,587 |
| | 274,113 |
| | 1 |
|
| Total deposits | 245,391 |
| | 244,901 |
| | — |
|
GWIM consists of two primary businesses: Merrill Lynch Global Wealth Management (MLGWM) andU.S. Trust, Bank of America Private Wealth Management (U.S. Trust).
MLGWM’s advisory business provides a high-touch client experience through a network of financial advisors focused on clients with over $250,000 in total investable assets. MLGWM provides tailored solutions to meet our clients’ needs through a full set of brokerage, banking and retirement products.
U.S. Trust, together with MLGWM’s Private Banking & Investments Group, provides comprehensive wealth management solutions targeted to high net worth and ultra high net worth clients, as well as customized solutions to meet clients’ wealth structuring, investment management, trust and banking needs, including specialty asset management services.
Net income remained relatively unchanged in 2014 compared to 2013 as an increase in noninterest income and lower credit costs were offset by lower net interest income and higher noninterest expense.
Net interest income decreased $228 million to $5.8 billion as a result of the low rate environment, partially offset by the impact of loan growth. Noninterest income, primarily investment and brokerage services, increased $842 million to $12.6 billion driven by increased asset management fees due to the impact of long-term AUM flows and higher market levels, partially offset by lower transactional revenue. Noninterest expense increased$614 million to $13.6 billion primarily due to higher revenue-related incentive compensation and support expenses, partially offset by lower other expenses.
Return on average allocated capital was 25 percent, down from 30 percent due to an increase in capital allocations. For more information on capital allocated to the business segments, see Business Segment Operations on page 34.
Revenue by Business
The table below summarizes revenue for MLGWM, U.S. Trust and other GWIM businesses.
|
| | | | | | | |
| | | | |
| Revenue by Business | | | |
| | | | |
| (Dollars in millions) | 2014 | | 2013 |
| Merrill Lynch Global Wealth Management | $ | 15,256 |
| | $ | 14,771 |
|
| U.S. Trust | 3,084 |
| | 2,953 |
|
Other (1) | 64 |
| | 66 |
|
| Total revenue, net of interest expense (FTE basis) | $ | 18,404 |
| | $ | 17,790 |
|
| |
(1) | Other includes the results of BofA Global Capital Management and other administrative items. |
In 2014, revenue from MLGWM was $15.3 billion, upthree percent, driven by increased asset management fees due to the impact of long-term AUM flows and higher market levels, partially offset by the impact of the low rate environment on net interest income and lower transactional revenue. In 2014, revenue from U.S. Trust was $3.1 billion, upfour percent, driven by increased asset management fees due to the impact of higher market levels and long-term AUM flows.
Client Balances
The table below presents client balances which consist of AUM, brokerage assets, assets in custody, deposits, and loans and leases.
|
| | | | | | | |
| | | | |
| Client Balances by Type | | | |
| | | | |
| | December 31 |
| (Dollars in millions) | 2014 | | 2013 |
| Assets under management | $ | 902,872 |
| | $ | 821,449 |
|
| Brokerage assets | 1,081,434 |
| | 1,045,122 |
|
| Assets in custody | 139,555 |
| | 136,190 |
|
| Deposits | 245,391 |
| | 244,901 |
|
Loans and leases (1) | 128,745 |
| | 118,776 |
|
| Total client balances | $ | 2,497,997 |
| | $ | 2,366,438 |
|
| |
(1) | Includes margin receivables which are classified in customer and other receivables on the Consolidated Balance Sheet. |
The increase of $131.6 billion, or six percent, in client balances was driven by higher market levels and long-term AUM flows.
Net Migration Summary
GWIM results are impacted by the net migration of clients and their corresponding deposit, loan and brokerage balances to or from CBB, Global Banking and CRES, as presented in the table below. Migrations result from the movement of clients between business segments to better align with client needs. In addition to business-as-usual migration during 2013, GWIM identified and transferred a client population with deposit balances of $23.3 billion to CBB and home equity loan balances of $4.5 billion to CRES, while CBB transferred credit card loan balances of $3.2 billion to GWIM.
|
| | | | | | | |
| | | | |
| Net Migration Summary | | | |
| | | | |
| (Dollars in millions) | 2014 | | 2013 |
Total deposits, net – GWIM from (to) CBB and Global Banking | $ | 1,350 |
| | $ | (20,974 | ) |
Total loans, net – GWIM from (to) CBB and CRES | (61 | ) | | (1,356 | ) |
Total brokerage, net – GWIM from (to) CBB and Global Banking | (2,710 | ) | | (1,251 | ) |
Global Banking
|
| | | | | | | | | | | |
| | | | | | | |
| (Dollars in millions) | 2014 | | 2013 | | % Change |
| Net interest income (FTE basis) | $ | 8,999 |
| | $ | 8,914 |
| | 1 | % |
| Noninterest income: | | | | | |
| Service charges | 2,717 |
| | 2,787 |
| | (3 | ) |
| Investment banking fees | 3,213 |
| | 3,234 |
| | (1 | ) |
| All other income | 1,669 |
| | 1,544 |
| | 8 |
|
| Total noninterest income | 7,599 |
| | 7,565 |
| | — |
|
| Total revenue, net of interest expense (FTE basis) | 16,598 |
| | 16,479 |
| | 1 |
|
| | | | | | |
| Provision for credit losses | 336 |
| | 1,075 |
| | (69 | ) |
| Noninterest expense | 7,681 |
| | 7,551 |
| | 2 |
|
| Income before income taxes (FTE basis) | 8,581 |
| | 7,853 |
| | 9 |
|
| Income tax expense (FTE basis) | 3,146 |
| | 2,880 |
| | 9 |
|
| Net income | $ | 5,435 |
| | $ | 4,973 |
| | 9 |
|
| | | | | | |
| Net interest yield (FTE basis) | 2.57 | % | | 2.97 | % | | |
| Return on average allocated capital | 18 |
| | 22 |
| | |
| Efficiency ratio (FTE basis) | 46.28 |
| | 45.82 |
| | |
| | | | | | |
| Balance Sheet | | | | | | |
| | | | | | |
| Average | | | | | |
| Total loans and leases | $ | 270,164 |
| | $ | 257,249 |
| | 5 |
|
| Total earning assets | 350,668 |
| | 300,511 |
| | 17 |
|
| Total assets | 393,721 |
| | 342,772 |
| | 15 |
|
| Total deposits | 261,312 |
| | 236,765 |
| | 10 |
|
| Allocated capital | 31,000 |
| | 23,000 |
| | 35 |
|
| | | | | | |
| Year end | | | | | |
| Total loans and leases | $ | 272,572 |
| | $ | 269,469 |
| | 1 |
|
| Total earning assets | 336,776 |
| | 336,606 |
| | — |
|
| Total assets | 379,513 |
| | 378,659 |
| | — |
|
| Total deposits | 251,344 |
| | 265,171 |
| | (5 | ) |
Global Banking, which includes Global Corporate and Global Commercial Banking, and Investment Banking, provides a wide range of lending-related products and services, integrated working capital management and treasury solutions to clients, and underwriting and advisory services through our network of offices and client relationship teams. Our lending products and services include commercial loans, leases, commitment facilities, trade finance, real estate lending and asset-based lending. Our treasury solutions business includes treasury management, foreign exchange and short-term investing options. We also provide investment banking products to our clients such as debt and equity underwriting and distribution, and merger-related and other advisory services. Underwriting debt and equity issuances, fixed-income and equity research, and certain market-based activities are executed through our global broker-dealer affiliates which are our primary dealers in several countries. Within Global Banking, Global Commercial Banking clients generally include middle-market companies, commercial real estate firms, auto dealerships and not-for-profit companies. Global Corporate Banking includes large global corporations, financial institutions and leasing clients.
Net income for Global Bankingincreased$462 million to $5.4 billion in 2014 compared to 2013 primarily driven by a reduction in the provision for credit losses and, to a lesser degree, an increase in revenue, partially offset by higher noninterest expense. Revenue increased$119 million to $16.6 billion in 2014 primarily from higher net interest income.
The provision for credit losses decreased $739 million to $336 million in 2014 driven by improved credit quality in the current year, and the prior year included increased reserves from loan growth. Noninterest expense increased $130 million to $7.7 billion in 2014 primarily from additional client-facing personnel expense and higher litigation expense.
Return on average allocated capital was 18 percent in 2014, down from 22 percent in 2013 as growth in earnings was more than offset by increased capital allocations. For more information on capital allocated to the business segments, see Business Segment Operations on page 34.
Global Corporate and Global Commercial Banking
Global Corporate and Global Commercial Banking each include Business Lending and Global Transaction Services (formerly Global Treasury Services) activities. Business Lending includes various lending-related products and services and related hedging activities including commercial loans, leases, commitment facilities, trade finance, real estate lending and asset-based
lending. Global Transaction Services includes deposits, treasury management, credit card, foreign exchange, and short-term investment and custody solutions to corporate and commercial banking clients.
The table below presents a summary of Global Corporate and Global Commercial Banking results, which exclude certain capital markets activity in Global Banking.
|
| | | | | | | | | | | | | | | | | | | | | | | | |
| | | | | | | | | | | | | |
| Global Corporate and Global Commercial Banking | | | | | | | | | | |
| | | | | | | | | | | |
| | | Global Corporate Banking | | Global Commercial Banking | | Total |
| (Dollars in millions) | 2014 | | 2013 | | 2014 |
| 2013 | | 2014 | | 2013 |
| Revenue | | | | | | | | | | | |
| Business Lending | $ | 3,421 |
| | $ | 3,432 |
| | $ | 3,936 |
| | $ | 3,967 |
| | $ | 7,357 |
| | $ | 7,399 |
|
| Global Transaction Services | 3,027 |
| | 2,804 |
| | 2,893 |
| | 2,939 |
| | 5,920 |
| | 5,743 |
|
| Total revenue, net of interest expense | $ | 6,448 |
| | $ | 6,236 |
| | $ | 6,829 |
| | $ | 6,906 |
| | $ | 13,277 |
| | $ | 13,142 |
|
| | | | | | | | | | | | |
| Balance Sheet | | | | | | | | | | | | |
| Average | | | | | | | | | | | |
| Total loans and leases | $ | 129,610 |
| | $ | 126,630 |
| | $ | 140,539 |
| | $ | 130,606 |
| | $ | 270,149 |
| | $ | 257,236 |
|
| Total deposits | 143,649 |
| | 128,198 |
| | 117,664 |
| | 108,532 |
| | 261,313 |
| | 236,730 |
|
| | | | | | | | | | | | |
| Year end | | | | | | | | | | | |
| Total loans and leases | $ | 131,019 |
| | $ | 130,066 |
| | $ | 141,555 |
| | $ | 139,401 |
| | $ | 272,574 |
| | $ | 269,467 |
|
| Total deposits | 130,557 |
| | 144,312 |
| | 120,787 |
| | 120,860 |
| | 251,344 |
| | 265,172 |
|
Business Lending revenue in Global Corporate Banking and Global Commercial Banking remained relatively unchanged in 2014 compared to 2013 as the impact of growth in average loan balances was offset by spread compression.
Global Transaction Services revenue in Global Corporate Banking increased $223 million in 2014 driven by the impact of growth in U.S. and non-U.S. deposit balances. Global Transaction Services revenue in Global Commercial Banking remained relatively unchanged as the impact of higher deposit balances was more than offset by spread compression.
Average loans and leases in Global Corporate and Global Commercial Banking increased five percent in 2014 driven by growth in the commercial and industrial and commercial real estate portfolios. Average deposits in Global Corporate and Global Commercial Banking increased 10 percent in 2014 due to client liquidity and international growth.
Investment Banking
Client teams and product specialists underwrite and distribute debt, equity and loan products, and provide advisory services and tailored risk management solutions. The economics of most investment banking and underwriting activities are shared primarily between Global Banking and Global Markets based on the activities performed by each segment. To provide a complete discussion of
our consolidated investment banking fees, the table below presents total Corporation investment banking fees including the portion attributable to Global Banking.
|
| | | | | | | | | | | | | | | |
| | | | | | | | |
| Investment Banking Fees | | | | |
| | | | | | |
| | Global Banking | | Total Corporation |
| (Dollars in millions) | 2014 |
| 2013 | | 2014 | | 2013 |
| Products | | | | | | | |
| Advisory | $ | 1,098 |
| | $ | 1,019 |
| | $ | 1,207 |
| | $ | 1,125 |
|
| Debt issuance | 1,532 |
| | 1,620 |
| | 3,583 |
| | 3,804 |
|
| Equity issuance | 583 |
| | 595 |
| | 1,490 |
| | 1,472 |
|
| Gross investment banking fees | 3,213 |
| | 3,234 |
| | 6,280 |
| | 6,401 |
|
| Self-led deals | (91 | ) | | (92 | ) | | (215 | ) | | (275 | ) |
| Total investment banking fees | $ | 3,122 |
| | $ | 3,142 |
| | $ | 6,065 |
| | $ | 6,126 |
|
Total Corporation investment banking fees of $6.1 billion, excluding self-led deals, included within Global Banking and Global Markets, remained relatively unchanged in 2014 compared to 2013 as strong investment-grade underwriting and advisory fees were offset by lower underwriting fees for other debt products.
Global Markets
|
| | | | | | | | | | | |
| | | | | | | |
| (Dollars in millions) | 2014 | | 2013 | | % Change |
| Net interest income (FTE basis) | $ | 3,986 |
| | $ | 4,224 |
| | (6 | )% |
| Noninterest income: | | | | | |
| Investment and brokerage services | 2,163 |
| | 2,046 |
| | 6 |
|
| Investment banking fees | 2,743 |
| | 2,724 |
| | 1 |
|
| Trading account profits | 5,997 |
| | 6,734 |
| | (11 | ) |
| All other income (loss) | 1,230 |
| | (338 | ) | | n/m |
|
| Total noninterest income | 12,133 |
| | 11,166 |
| | 9 |
|
| Total revenue, net of interest expense (FTE basis) | 16,119 |
| | 15,390 |
| | 5 |
|
| | | | | | |
| Provision for credit losses | 110 |
| | 140 |
| | (21 | ) |
| Noninterest expense | 11,771 |
| | 11,996 |
| | (2 | ) |
| Income before income taxes (FTE basis) | 4,238 |
| | 3,254 |
| | 30 |
|
| Income tax expense (FTE basis) | 1,519 |
| | 2,101 |
| | (28 | ) |
| Net income | $ | 2,719 |
| | $ | 1,153 |
| | 136 |
|
| | | | | | |
| Return on average allocated capital | 8 | % | | 4 | % | | |
| Efficiency ratio (FTE basis) | 73.03 |
| | 77.94 |
| | |
| | | | | | |
| Balance Sheet | | | | | | |
| | | | | | |
| Average | | | | | |
Total trading-related assets (1) | $ | 449,814 |
| | $ | 468,934 |
| | (4 | ) |
| Total loans and leases | 62,064 |
| | 60,057 |
| | 3 |
|
Total earning assets (1) | 461,179 |
| | 481,433 |
| | (4 | ) |
| Total assets | 607,538 |
| | 632,681 |
| | (4 | ) |
| Allocated capital | 34,000 |
| | 30,000 |
| | 13 |
|
| | | | | | |
| Year end | | | | | |
Total trading-related assets (1) | $ | 418,860 |
| | $ | 411,080 |
| | 2 |
|
| Total loans and leases | 59,388 |
| | 67,381 |
| | (12 | ) |
Total earning assets (1) | 421,799 |
| | 432,807 |
| | (3 | ) |
| Total assets | 579,514 |
| | 575,472 |
| | 1 |
|
| |
(1) | Trading-related assets include derivative assets, which are considered non-earning assets. |
n/m = not meaningful
Global Markets offers sales and trading services, including research, to institutional clients across fixed-income, credit, currency, commodity and equity businesses. Global Markets product coverage includes securities and derivative products in both the primary and secondary markets. Global Markets provides market-making, financing, securities clearing, settlement and custody services globally to our institutional investor clients in support of their investing and trading activities. We also work with our commercial and corporate clients to provide risk management products using interest rate, equity, credit, currency and commodity derivatives, foreign exchange, fixed-income and mortgage-related products. As a result of our market-making activities in these products, we may be required to manage risk in a broad range of financial products including government securities, equity and equity-linked securities, high-grade and high-yield corporate debt securities, syndicated loans, MBS, commodities and asset-backed securities (ABS). In addition, the economics of most investment banking and underwriting activities are shared primarily between Global Markets and Global Banking based on the activities performed by each segment. Global Banking originates certain deal-related transactions with our corporate and commercial clients that are executed and distributed by Global Markets. For more information on investment banking fees on a consolidated basis, see page 45.
Net income for Global Markets increased $1.6 billion to $2.7 billion in 2014 compared to 2013. In 2014, we adopted a funding valuation adjustment into our valuation estimates primarily to include funding costs on uncollateralized derivatives and derivatives where we are not permitted to use the collateral we receive. This change in estimate resulted in a net FVA pretax charge of $497 million. Excluding net DVA/FVA and charges in 2013 related to the U.K. corporate income tax rate reduction, net income decreased $140 million to $2.9 billion primarily driven by lower trading account profits and net interest income, partially offset by a decrease in noninterest expense, a $240 million gain in 2014 related to the initial public offering (IPO) of an equity investment and higher investment and brokerage services income. Results for 2013 included a $450 million write-down of a monoline receivable due to the settlement of a legacy matter. Net DVA/FVA losses were $240 million compared to losses of $1.2 billion in 2013. Noninterest expense decreased $225 million to $11.8 billion due to lower litigation expense and revenue-related incentives, partially offset by higher technology costs and investments in infrastructure.
Average earning assets decreased $20.3 billion to $461.2 billion in 2014 largely driven by a decrease in trading assets to further optimize the balance sheet.
Year-end loans and leases decreased $8.0 billion in 2014 due to a decrease in low-margin prime brokerage loans.
The return on average allocated capital was eight percent, up from four percent, largely driven by higher net income, partially offset by an increase in allocated capital. Excluding net DVA/FVA and charges in 2013 related to the U.K. corporate income tax rate reduction, the return on average allocated capital was eight percent, a decrease from 10 percent, driven by lower net income, excluding net DVA/FVA and the tax change, and an increase in allocated capital.
Sales and Trading Revenue
Sales and trading revenue includes unrealized and realized gains and losses on trading and other assets, net interest income, and fees primarily from commissions on equity securities. Sales and trading revenue is segregated into fixed income (government debt obligations, investment and non-investment grade corporate debt obligations, commercial mortgage-backed securities, residential mortgage-backed securities (RMBS), collateralized loan obligations (CLOs), interest rate and credit derivative contracts), currencies (interest rate and foreign exchange contracts), commodities (primarily futures, forwards, swaps and options) and equities (equity-linked derivatives and cash equity activity). The following table and related discussion present sales and trading revenue, substantially all of which is in Global Markets, with the remainder in Global Banking. In addition, the following table and related discussion present sales and trading revenue excluding the impact of net DVA/FVA, which is a non-GAAP financial measure. We believe the use of this non-GAAP financial measure provides clarity in assessing the underlying performance of these businesses.
|
| | | | | | | |
| | | | |
Sales and Trading Revenue (1, 2) |
| | | | |
| (Dollars in millions) | 2014 | | 2013 |
| Sales and trading revenue | | | |
| Fixed income, currencies and commodities | $ | 8,706 |
| | $ | 8,231 |
|
| Equities | 4,215 |
| | 4,180 |
|
| Total sales and trading revenue | $ | 12,921 |
| | $ | 12,411 |
|
| | | | |
Sales and trading revenue, excluding net DVA/FVA (3) | | | |
| Fixed income, currencies and commodities | $ | 9,013 |
| | $ | 9,345 |
|
| Equities | 4,148 |
| | 4,224 |
|
| Total sales and trading revenue, excluding net DVA/FVA | $ | 13,161 |
| | $ | 13,569 |
|
| |
(1) | Includes FTE adjustments of $181 million and $180 million for 2014 and 2013. For more information on sales and trading revenue, see Note 2 – Derivativesto the Consolidated Financial Statements. |
| |
(2) | Includes Global Banking sales and trading revenue of $382 million and $385 million for 2014 and 2013. |
| |
(3) | FICC and Equities sales and trading revenue, excluding the impact of net DVA and FVA, is a non-GAAP financial measure. FICC net DVA/FVA losses were $307 million for 2014 compared to net DVA losses of $1.1 billion in 2013. Equities net DVA/FVA gains were $67 million for 2014 compared to net DVA losses of $44 million in 2013. |
Fixed-income, currency and commodities (FICC) revenue, excluding net DVA/FVA, decreased$332 million to $9.0 billion driven by declines in the rates and credit-related businesses due to both lower market volumes and volatility, partially offset by improvement in the commodities business. The prior year included a $450 million write-down of a monoline receivable related to the settlement of a legacy matter. Equities revenue, excluding net DVA/FVA, decreased$76 million to $4.1 billion due to financing additional liquid asset buffers, pursuant to current regulatory requirements, primarily in our broker-dealer entities, which also negatively impacted FICC results.
All Other
|
| | | | | | | | | | | |
| | | | | | | |
| (Dollars in millions) | 2014 | | 2013 | | % Change |
| Net interest income (FTE basis) | $ | (516 | ) | | $ | 982 |
| | n/m |
|
| Noninterest income: | | | | | |
| Card income | 356 |
| | 328 |
| | 9 | % |
| Equity investment income | 601 |
| | 2,610 |
| | (77 | ) |
| Gains on sales of debt securities | 1,311 |
| | 1,230 |
| | 7 |
|
| All other loss | (2,467 | ) | | (2,587 | ) | | (5 | ) |
| Total noninterest income | (199 | ) | | 1,581 |
| | n/m |
|
| Total revenue, net of interest expense (FTE basis) | (715 | ) | | 2,563 |
| | n/m |
|
| | | | | | |
| Provision (benefit) for credit losses | (978 | ) | | (666 | ) | | 47 |
|
| Noninterest expense | 2,881 |
| | 4,559 |
| | (37 | ) |
| Loss before income taxes (FTE basis) | (2,618 | ) | | (1,330 | ) | | 97 |
|
| Income tax benefit (FTE basis) | (2,622 | ) | | (2,042 | ) | | 28 |
|
| Net income | $ | 4 |
| | $ | 712 |
| | (99 | ) |
| | | | | | | |
| Balance Sheet | | | | | | |
| | | | | | | |
| Average | | | | | |
| Loans and leases: | | | | | |
| Residential mortgage | $ | 180,249 |
| | $ | 208,535 |
| | (14 | ) |
| Non-U.S. credit card | 11,511 |
| | 10,861 |
| | 6 |
|
| Other | 10,752 |
| | 16,064 |
| | (33 | ) |
| Total loans and leases | 202,512 |
| | 235,460 |
| | (14 | ) |
Total assets (1) | 160,272 |
| | 216,012 |
| | (26 | ) |
| Total deposits | 30,255 |
| | 34,919 |
| | (13 | ) |
| | | | | | | |
| Year end | | | | | |
| Loans and leases: | | | | |
|
|
| Residential mortgage | $ | 155,595 |
| | $ | 197,061 |
| | (21 | ) |
| Non-U.S. credit card | 10,465 |
| | 11,541 |
| | (9 | ) |
| Other | 6,552 |
| | 12,088 |
| | (46 | ) |
| Total loans and leases | 172,612 |
| | 220,690 |
| | (22 | ) |
Total assets (1) | 142,812 |
| | 167,624 |
| | (15 | ) |
| Total deposits | 18,898 |
| | 27,912 |
| | (32 | ) |
| |
(1) | In segments where the total of liabilities and equity exceeds assets, which are generally deposit-taking segments, we allocate assets from All Other to those segments to match liabilities (i.e., deposits) and allocated shareholders’ equity. Such allocated assets were $595.2 billion and $538.8 billion for 2014 and 2013, and $589.9 billion and $569.8 billion at December 31, 2014 and 2013. |
n/m = not meaningful
All Other consists of ALM activities, equity investments, the international consumer card business, liquidating businesses, residual expense allocations and other. ALM activities encompass the whole-loan residential mortgage portfolio and investment securities, interest rate and foreign currency risk management activities including the residual net interest income allocation, the impact of certain allocation methodologies and accounting hedge ineffectiveness. Additionally, certain residential mortgage loans that are managed by Legacy Assets & Servicing are held in All Other. The results of certain ALM activities are allocated to our business segments. For more information on our ALM activities, see Interest Rate Risk Management for Non-trading Activities on page 105. Equity investments include GPI which is comprised of a portfolio of equity, real estate and other alternative investments. These investments are made either directly in a company or held through a fund with related income recorded in equity investment income. In connection with our strategy to focus on our core businesses and to conform with the Volcker Rule, the GPI portfolio has been actively winding down over the last several years through a series of portfolio and individual asset sale transactions.
Net income for All Other decreased $708 million to $4 million in 2014 primarily due to the negative impact on net interest income of market-related premium amortization expense on debt securities of $1.2 billion compared to a benefit of $784 million in 2013 as lower long-term interest rates shortened the expected lives of the securities, a decrease of $2.0 billion in equity investment income and a $363 million increase in U.K. PPI costs. Partially offsetting these decreases were gains related to the sales of residential mortgage loans, a $312 million improvement in the provision (benefit) for credit losses and a decrease of $1.7 billion in noninterest expense. The provision (benefit) for credit losses improved $312 million to a benefit of $978 million in 2014 primarily driven by the impact of recoveries related to nonperforming and delinquent loan sales, partially offset by a slower pace of credit quality improvement related to the residential mortgage portfolio. Noninterest expense decreased $1.7 billion to $2.9 billion primarily due to a decline in litigation expense, lower net occupancy expense and a decline in professional fees. Also offsetting the decrease was a $580 million increase in the income tax benefit. For more information on the U.K. PPI costs, see Note 12 – Commitments and Contingencies to the Consolidated Financial Statements.
The income tax benefit was $2.6 billion in 2014 compared to a benefit of $2.0 billion in 2013 with the increase driven by the increase in the pretax loss in All Other and the resolution of several tax examinations, partially offset by a decrease in benefits from non-U.S. restructurings.
Equity Investment Activity
The following tables present the components of equity investments in All Other at December 31, 2014 and 2013, and also a reconciliation to the total consolidated equity investment income for 2014 and 2013.
|
| | | | | | | |
| | | | |
| Equity Investments | | | |
| | | | |
| | December 31 |
| (Dollars in millions) | 2014 | | 2013 |
| Global Principal Investments | $ | 912 |
| | $ | 1,604 |
|
| Strategic and other investments | 858 |
| | 822 |
|
Total equity investments included in All Other | $ | 1,770 |
| | $ | 2,426 |
|
Equity investments included in All Otherdecreased$656 million to $1.8 billion during 2014, with the decrease primarily due to sales resulting from the continued wind down of the GPI portfolio. GPI had unfunded equity commitments of $31 million and $127 million at December 31, 2014 and 2013.
|
| | | | | | | |
| | | | |
| Equity Investment Income | | | |
| | | | |
| (Dollars in millions) | 2014 | | 2013 |
| Global Principal Investments | $ | (46 | ) | | $ | 379 |
|
| Strategic and other investments | 647 |
| | 2,231 |
|
Total equity investment income included in All Other | 601 |
| | 2,610 |
|
| Total equity investment income included in the business segments | 529 |
| | 291 |
|
| Total consolidated equity investment income | $ | 1,130 |
| | $ | 2,901 |
|
Equity investment income decreased $1.8 billion primarily due to a $753 million gain related to the sale of our remaining investment in China Construction Bank Corporation (CCB) in 2013, lower gains on sales of portions of an equity investment compared to 2013, and lower GPI results. These declines were partially offset by a gain in 2014 related to the IPO of an equity investment.
Off-Balance Sheet Arrangements and Contractual Obligations
We have contractual obligations to make future payments on debt and lease agreements. Additionally, in the normal course of business, we enter into contractual arrangements whereby we commit to future purchases of products or services from unaffiliated parties. Purchase obligations are defined as obligations that are legally binding agreements whereby we agree to purchase products or services with a specific minimum quantity at a fixed, minimum or variable price over a specified period of time. Included in purchase obligations are vendor contracts, the most significant of which include communication services, processing services and software contracts. Other long-term liabilities include our contractual funding obligations related to the Qualified Pension Plans, Non-U.S. Pension Plans, Nonqualified and Other Pension Plans, and Postretirement Health and Life Plans (collectively, the Plans). Obligations to the Plans are based on the current and projected obligations of the Plans, performance of the Plans’ assets and any participant contributions, if applicable.
During 2014 and 2013, we contributed $234 million and $290 million to the Plans, and we expect to make $244 million of contributions during 2015. The Plans are more fully discussed in Note 17 – Employee Benefit Plansto the Consolidated Financial Statements.
Debt, lease, equity and other obligations are more fully discussed in Note 11 – Long-term Debt and Note 12 – Commitments and Contingenciesto the Consolidated Financial Statements.
We enter into commitments to extend credit such as loan commitments, standby letters of credit (SBLCs) and commercial letters of credit to meet the financing needs of our customers. For a summary of the total unfunded, or off-balance sheet, credit extension commitment amounts by expiration date, see Credit Extension Commitments in Note 12 – Commitments and Contingenciesto the Consolidated Financial Statements.
Table 11 includes certain contractual obligations at December 31, 2014.
|
| | | | | | | | | | | | | | | | | | | | |
| | | | | | | | | | | |
| Table 11 | Contractual Obligations |
| | | | | | | | | | | |
| | | December 31, 2014 |
| (Dollars in millions) | Due in One Year or Less | | Due After
One Year Through Three Years | | Due After
Three Years Through Five Years | | Due After Five Years | | Total |
| Long-term debt | $ | 30,724 |
| | $ | 80,753 |
| | $ | 49,136 |
| | $ | 82,526 |
| | $ | 243,139 |
|
| Operating lease obligations | 2,553 |
| | 4,157 |
| | 2,725 |
| | 4,971 |
| | 14,406 |
|
| Purchase obligations | 2,077 |
| | 2,864 |
| | 361 |
| | 242 |
| | 5,544 |
|
| Time deposits | 75,604 |
| | 5,865 |
| | 1,640 |
| | 1,734 |
| | 84,843 |
|
| Other long-term liabilities | 1,470 |
| | 928 |
| | 698 |
| | 1,136 |
| | 4,232 |
|
Estimated interest expense on long-term debt and time deposits (1) | 5,036 |
| | 10,511 |
| | 7,665 |
| | 12,323 |
| | 35,535 |
|
| Total contractual obligations | $ | 117,464 |
| | $ | 105,078 |
| | $ | 62,225 |
| | $ | 102,932 |
| | $ | 387,699 |
|
| |
(1) | Represents forecasted net interest expense on long-term debt and time deposits. Forecasts are based on the contractual maturity dates of each liability, and are net of derivative hedges, where applicable. |
Representations and Warranties
We securitize first-lien residential mortgage loans generally in the form of RMBS guaranteed by the government-sponsored enterprises (GSEs) or by the Government National Mortgage Association (GNMA) in the case of Federal Housing Administration (FHA)-insured, U.S. Department of Veterans Affairs (VA)-guaranteed and Rural Housing Service-guaranteed mortgage loans, and sell pools of first-lien residential mortgage loans in the form of whole loans. In addition, in prior years, legacy companies and certain subsidiaries sold pools of first-lien residential mortgage loans and home equity loans as private-label securitizations (in certain of these securitizations, monoline insurers or other financial guarantee providers insured all or some of the securities) or in the form of whole loans. In connection with these transactions, we or certain of our subsidiaries or legacy companies make or have made various representations and warranties. Breaches of these representations and warranties have resulted in and may continue to result in the requirement to repurchase mortgage loans or to otherwise make whole or provide other remedies to the GSEs, U.S. Department of Housing and Urban Development (HUD) with respect to FHA-insured loans, VA, whole-loan investors, securitization trusts, monoline insurers or other financial guarantors (collectively, repurchases). In all such cases, subsequent to repurchasing the loan, we would be exposed to any credit loss on the repurchased mortgage loans, after
accounting for any mortgage insurance (MI) or mortgage guarantee payments that we may receive.
We have vigorously contested any request for repurchase when we conclude that a valid basis for repurchase does not exist and will continue to do so in the future. However, in an effort to resolve these legacy mortgage-related issues, we have reached settlements, certain of which have been for significant amounts, in lieu of a loan-by-loan review process, including with the GSEs, four monoline insurers and Bank of New York Mellon (BNY Mellon), as trustee. The settlement with BNY Mellon (BNY Mellon Settlement) remains subject to final court approval and certain other conditions. It is not currently possible to predict the ultimate outcome or timing of the court approval process, which includes appeals and could take a substantial period of time. If final court approval is not obtained, or if we and Countrywide Financial Corporation (Countrywide) withdraw from the BNY Mellon Settlement in accordance with its terms, our future representations and warranties losses could be substantially different from existing accruals and the estimated range of possible loss over existing accruals.
For more information on accounting for representations and warranties, repurchase claims and exposures, including a summary of the larger bulk settlements, see Note 7 – Representations and Warranties Obligations and Corporate Guarantees and Note 12 – Commitments and Contingencies to the
Consolidated Financial Statements and Item 1A. Risk Factors of this Annual Report on Form 10-K.
Unresolved Repurchase Claims
Unresolved representations and warranties repurchase claims represent the notional amount of repurchase claims made by counterparties, typically the outstanding principal balance or the unpaid principal balance at the time of default. In the case of first-lien mortgages, the claim amount is often significantly greater than the expected loss amount due to the benefit of collateral and, in some cases, MI or mortgage guarantee payments. Claims received from a counterparty remain outstanding until the underlying loan is repurchased, the claim is rescinded by the counterparty or the representations and warranties claims with respect to the applicable trust are settled, and fully and finally released. When a claim is denied and the Corporation does not receive a response from the counterparty, the claim remains in the unresolved repurchase claims balance until resolution.
At December 31, 2014, we had $22.4 billion of unresolved repurchase claims, net of duplicate claims, compared to $18.7 billion at December 31, 2013. These repurchase claims relate primarily to private-label securitizations and include claims in the amount of $4.7 billion, net of duplicate claims, where we believe the statute of limitations has expired under current law. For additional information, see Note 7 – Representations and Warranties Obligations and Corporate Guarantees to the Consolidated Financial Statements.
The continued increase in the notional amount of unresolved repurchase claims during 2014 is primarily due to: (1) continued submission of claims by private-label securitization trustees, (2) the level of detail, support and analysis accompanying such claims, which impact overall claim quality and, therefore, claims resolution, (3) the lack of an established process to resolve disputes related to these claims, (4) the submission of claims where we believe the statute of limitations has expired under current law and (5) the submission of duplicate claims, often in multiple submissions, on the same loan. For example, claims submitted without individual file reviews generally lack the level of detail and analysis of individual loans found in other claims that is necessary to support a claim. Absent any settlements, the Corporation expects unresolved repurchase claims related to private-label securitizations to increase as such claims continue to be submitted and there is not an established process for the ultimate resolution of such claims on which there is a disagreement.
In addition to unresolved repurchase claims, we have received notifications pertaining to loans for which we have not received a repurchase request from sponsors of third-party securitizations with whom we engaged in whole-loan transactions and that we may owe indemnity obligations. These notifications totaled $2.0 billion and $737 million at December 31, 2014 and 2013.
We also from time to time receive correspondence purporting to raise representations and warranties breach issues from entities that do not have contractual standing or ability to bring such claims. We believe such communications to be procedurally and/or substantively invalid, and generally do not respond to such correspondence.
The presence of repurchase claims on a given trust, receipt of notices of indemnification obligations and other communication, as discussed above, are all factors that inform our estimated liability for obligations under representations and warranties and the corresponding estimated range of possible loss.
Representations and Warranties Liability
The liability for representations and warranties and corporate guarantees is included in accrued expenses and other liabilities on the Consolidated Balance Sheet and the related provision is included in mortgage banking income in the Consolidated Statement of Income. For more information on the representations and warranties liability and the corresponding estimated range of possible loss, see Off-Balance Sheet Arrangements and Contractual Obligations – Estimated Range of Possible Loss on page 53.
At December 31, 2014 and 2013, the liability for representations and warranties was $12.1 billion and $13.3 billion. For 2014, the representations and warranties provision was $683 million compared to $840 million for 2013.
Our estimated liability at December 31, 2014 for obligations under representations and warranties is necessarily dependent on, and limited by a number of factors including for private-label securitizations the implied repurchase experience based on the BNY Mellon Settlement, as well as certain other assumptions and judgmental factors. Accordingly, future provisions associated with obligations under representations and warranties may be materially impacted if actual experiences are different from historical experience or our understandings, interpretations or assumptions. Although we have not recorded any representations and warranties liability for certain potential private-label securitization and whole-loan exposures where we have had little to no claim activity, or where the applicable statute of limitations has expired under current law, these exposures are included in the estimated range of possible loss.
Experience with Government-sponsored Enterprises
As a result of various settlements with the GSEs, we have resolved substantially all outstanding and potential representations and warranties repurchase claims on whole loans sold by legacy Bank of America and Countrywide to Fannie Mae (FNMA) and Freddie Mac (FHLMC) through June 30, 2012 and December 31, 2009, respectively. For additional information, see Note 7 – Representations and Warranties Obligations and Corporate Guarantees to the Consolidated Financial Statements.
Experience with Investors Other than Government-sponsored Enterprises
In prior years, legacy companies and certain subsidiaries sold pools of first-lien residential mortgage loans and home equity loans as private-label securitizations or in the form of whole loans to investors other than GSEs (although the GSEs are investors in certain private-label securitizations). Such loans originated from 2004 through 2008 had an original principal balance of $970 billion, including $786 billion sold to private-label and whole-loan investors without monoline insurance and $185 billion with monoline insurance. Of the $970 billion, $574 billion in principal has been paid, $201 billion in principal has defaulted, $44 billion in principal was severely delinquent, and $151 billion in principal was current or less than 180 days past due at December 31, 2014 as summarized in Table 12. Of the original principal balance of $716 billion for Countrywide, $409 billion is included in the BNY Mellon Settlement and, of this amount, $109 billion was defaulted or severely delinquent at December 31, 2014.
|
| | | | | | | | | | | | | | | | | | | | | | | | | | | | | | | | | | | | |
| | | | | | | | | | | | | | | | | | | |
| Table 12 | Overview of Non-Agency Securitization and Whole-loan Balances from 2004 to 2008 |
| | | | | | | | | | | | | | | | | | | |
| | Principal Balance | | Defaulted or Severely Delinquent |
(Dollars in billions)
By Entity | Original Principal Balance | | Outstanding
Principal Balance December 31, 2014 | | Outstanding
Principal Balance 180 Days or More Past Due | | Defaulted Principal Balance | | Defaulted or Severely Delinquent | | Borrower Made Less than 13 Payments | | Borrower
Made 13 to 24 Payments | | Borrower
Made 25 to 36 Payments | | Borrower
Made More than 36 Payments |
| Bank of America | $ | 100 |
| | $ | 15 |
| | $ | 3 |
| | $ | 7 |
| | $ | 10 |
| | $ | 1 |
| | $ | 2 |
| | $ | 2 |
| | $ | 5 |
|
| Countrywide | 716 |
| | 153 |
| | 35 |
| | 150 |
| | 185 |
| | 24 |
| | 44 |
| | 44 |
| | 73 |
|
| Merrill Lynch | 72 |
| | 13 |
| | 3 |
| | 18 |
| | 21 |
| | 3 |
| | 4 |
| | 3 |
| | 11 |
|
| First Franklin | 82 |
| | 14 |
| | 3 |
| | 26 |
| | 29 |
| | 5 |
| | 6 |
| | 5 |
| | 13 |
|
Total (1, 2) | $ | 970 |
| | $ | 195 |
| | $ | 44 |
| | $ | 201 |
| | $ | 245 |
| | $ | 33 |
| | $ | 56 |
| | $ | 54 |
| | $ | 102 |
|
| By Product | |
| | |
| | |
| | |
| | |
| | |
| | |
| | |
| | |
|
| Prime | $ | 302 |
| | $ | 55 |
| | $ | 7 |
| | $ | 27 |
| | $ | 34 |
| | $ | 2 |
| | $ | 6 |
| | $ | 7 |
| | $ | 19 |
|
| Alt-A | 173 |
| | 44 |
| | 10 |
| | 40 |
| | 50 |
| | 7 |
| | 12 |
| | 11 |
| | 20 |
|
| Pay option | 150 |
| | 32 |
| | 10 |
| | 44 |
| | 54 |
| | 5 |
| | 13 |
| | 15 |
| | 21 |
|
| Subprime | 251 |
| | 50 |
| | 15 |
| | 70 |
| | 85 |
| | 17 |
| | 20 |
| | 16 |
| | 32 |
|
| Home equity | 88 |
| | 9 |
| | — |
| | 18 |
| | 18 |
| | 2 |
| | 5 |
| | 4 |
| | 7 |
|
| Other | 6 |
| | 5 |
| | 2 |
| | 2 |
| | 4 |
| | — |
| | — |
| | 1 |
| | 3 |
|
| Total | $ | 970 |
| | $ | 195 |
| | $ | 44 |
| | $ | 201 |
| | $ | 245 |
| | $ | 33 |
| | $ | 56 |
| | $ | 54 |
| | $ | 102 |
|
| |
(1) | Excludes transactions sponsored by Bank of America and Merrill Lynch where no representations or warranties were made. |
| |
(2) | Includes exposures on third-party sponsored transactions related to legacy entity originations. |
As it relates to private-label securitizations, we believe a contractual liability to repurchase mortgage loans generally arises if there is a breach of representations and warranties that materially and adversely affects the interest of the investor or all the investors in a securitization trust or of the monoline insurer or other financial guarantor (as applicable). We believe many of the loan defaults observed in these securitizations and whole-loan transactions were driven by external factors like the substantial depreciation in home prices experienced after the economic downturn, persistently high unemployment and other negative economic trends, diminishing the likelihood that any loan defect, to the extent any exists, was the cause of a loan’s default.
Experience with Private-label Securitization and Whole Loan Investors
Legacy entities, and to a lesser extent Bank of America, sold loans to investors via private-label securitizations or as whole loans. The majority of the loans sold were included in private-label securitizations, including third-party sponsored transactions. We provided representations and warranties to the whole-loan investors and these investors may retain those rights even when the whole loans were aggregated with other collateral into private-label securitizations sponsored by the whole-loan investors. Loans originated between 2004 and 2008 and sold without monoline insurance had an original total principal balance of $786 billion included in Table 12. Of the $786 billion, $469 billion have been paid in full and $193 billion were defaulted or severely delinquent at December 31, 2014. At least 25 payments have been made on approximately 64 percent of the defaulted and severely delinquent loans.
We have received approximately $33 billion of representations and warranties repurchase claims related to these vintages, including $24 billion from private-label securitization trustees and a financial guarantee provider, $8 billion from whole-loan investors and $815 million from one private-label securitization counterparty. Continued high levels of new private-label claims are primarily related to repurchase requests received from trustees for private-label securitization transactions not included in the BNY Mellon Settlement. We have resolved $9 billion of these claims with losses of $2 billion. The majority of these resolved claims were from third-party whole-loan investors. Approximately $4 billion of these claims were resolved through repurchase or indemnification, $5 billion were rescinded by the investor and $336 million were resolved through settlements. As of December 31, 2014, 15 percent of the whole-loan claims for loans originated between 2004 and 2008 that we initially denied have subsequently been resolved through repurchase or make-whole payments and 45 percent have been resolved through rescission of the claim by the counterparty or repayment in full by the borrower. At December 31, 2014, for loans originated between 2004 and 2008, the notional amount of unresolved repurchase claims submitted by private-label securitization trustees, whole-loan investors, including third-party securitization sponsors and others was $24 billion, including $3 billion of duplicate claims primarily submitted without a loan file review. We have performed an initial review with respect to substantially all of these claims and although we do not believe a valid basis for repurchase has been established by the claimant, we consider claims activity in the computation of our liability for representations and warranties. Until we receive a repurchase claim, we generally do not review loan files related to private-label securitizations and believe we are not required by the governing documents to do so.
Experience with Monoline Insurers
During 2014, we had limited loan-level representations and warranties repurchase claims experience with the monoline insurers due to settlements and ongoing litigation with a single monoline insurer. For more information related to the monolines, see Note 7 – Representations and Warranties Obligations and Corporate Guarantees and Note 12 – Commitments and Contingencies to the Consolidated Financial Statements.
Estimated Range of Possible Loss
We currently estimate that the range of possible loss for representations and warranties exposures could be up to $4 billion over existing accruals at December 31, 2014. The estimated range of possible loss reflects principally non-GSE exposures. It represents a reasonably possible loss, but does not represent a probable loss, and is based on currently available information, significant judgment and a number of assumptions that are subject to change.
For more information on the methodology used to estimate the representations and warranties liability, the corresponding estimated range of possible loss and the types of losses not considered in such estimates, see Item 1A. Risk Factors of this Annual Report on Form 10-K and Note 7 – Representations and Warranties Obligations and Corporate Guaranteesto the Consolidated Financial Statements and, for more information related to the sensitivity of the assumptions used to estimate our liability for obligations under representations and warranties, see Complex Accounting Estimates – Representations and Warranties Liability on page 113.
Department of Justice Settlement
On August 20, 2014, we reached a comprehensive settlement with the DoJ and certain federal and state agencies (DoJ Settlement). The DoJ Settlement included releases for securitization, origination, sale and other specified conduct relating to RMBS and collateralized debt obligations (CDOs), and an origination release on specified populations of residential mortgage loans sold to GSEs and private-label RMBS trusts. The DoJ Settlement resolved certain actual and potential civil claims by the DoJ, the Securities and Exchange Commission and State Attorneys General from six states, the FHA and GNMA, as well as all pending RMBS claims against Bank of America entities brought by the FDIC. For FHA-insured loans originated on or after May 1, 2009, we also received a release of origination liability for loans only if an insurance claim had been submitted to the FHA prior to January 1, 2014. If a claim had not been submitted by that date, we did not receive a release and we may be exposed to losses on such loans. For more information on FHA-insured loans originated on or before April 30, 2009, see Off-Balance Sheet Arrangements and Contractual Obligations – National Mortgage Settlement on page 54.
As part of the DoJ Settlement, we paid civil monetary penalties and compensatory remediation payments totaling $9.65 billion in 2014 and agreed to provide $7.0 billion worth of creditable consumer relief activities primarily in the form of mortgage modifications, including first-lien principal forgiveness and forbearance modifications and second- and junior-lien extinguishments, low- to moderate-income mortgage originations, and community reinvestment and neighborhood stabilization efforts, with initiatives focused on communities experiencing, or
at risk of, blight. In addition, we recorded $400 million of provision for credit losses for additional costs associated with the consumer relief portion of the settlement. Also, we will support the expansion of available affordable rental housing. We have committed to complete delivery of the consumer relief by no later than August 31, 2018. The consumer relief requirements are subject to oversight by an independent monitor.
Servicing, Foreclosure and Other Mortgage Matters
We service a large portion of the loans we or our subsidiaries have securitized and also service loans on behalf of third-party securitization vehicles and other investors. Our servicing obligations are set forth in servicing agreements with the applicable counterparty. These obligations may include, but are not limited to, loan repurchase requirements in certain circumstances, indemnifications, payment of fees, advances for foreclosure costs that are not reimbursable, or responsibility for losses in excess of partial guarantees for VA loans.
Servicing agreements with the GSEs generally provide the GSEs with broader rights relative to the servicer than are found in servicing agreements with private investors. For example, the GSEs claim that they have the contractual right to demand indemnification or loan repurchase for certain servicing breaches. In addition, the GSEs’ first-lien mortgage seller/servicer guides provide timelines to resolve delinquent loans through workout efforts or liquidation, if necessary, and purport to require the imposition of compensatory fees if those deadlines are not satisfied except for reasons beyond the control of the servicer. In addition, many non-agency RMBS and whole-loan servicing agreements state that the servicer may be liable for failure to perform its servicing obligations in keeping with industry standards or for acts or omissions that involve willful malfeasance, bad faith or gross negligence in the performance of, or reckless disregard of, the servicer’s duties.
It is not possible to reasonably estimate our liability with respect to certain potential servicing-related claims. While we have recorded certain accruals for servicing-related claims, the amount of potential liability in excess of existing accruals could be material to the Corporation’s results of operations or cash flows for any particular reporting period.
2013 IFR Acceleration Agreement
On January 7, 2013, we and other mortgage servicing institutions entered into an agreement in principle with the Office of the Comptroller of the Currency (OCC) and the Federal Reserve to cease the Independent Foreclosure Review (IFR) that had commenced pursuant to consent orders entered into by Bank of America with the Federal Reserve (2011 FRB Consent Order) and the 2011 OCC Consent Order entered into between BANA and the OCC and replaced it with an accelerated remediation process (2013 IFR Acceleration Agreement). The 2013 IFR Acceleration Agreement requires us to provide $1.8 billion of borrower assistance in the form of loan modifications and other foreclosure prevention actions, and in addition, we made a cash payment of $1.1 billion into a qualified settlement fund in 2013. The borrower assistance program is not expected to result in any incremental credit provision, as we believe that the existing allowance for credit losses is adequate to absorb any costs that have not already been recorded as charge-offs.
National Mortgage Settlement
In March 2012, we entered into settlement agreements (collectively, the National Mortgage Settlement) with the U.S. Department of Justice, 49 State Attorneys General and certain federal agencies. The National Mortgage Settlement provided for the establishment of certain uniform servicing standards, upfront cash payments of approximately $1.9 billion to the state and federal governments and for borrower restitution, an upfront cash payment of $500 million to settle certain claims related to FHA-insured loans, approximately $7.6 billion worth of borrower assistance in the form of credits earned for, among other things, principal reduction, and approximately $1.0 billion of credits earned for interest rate reduction modifications. The resulting interest rate reductions, which were not accounted for as troubled debt restructurings, resulted in an estimated decrease in fair value of the modified loans of approximately $740 million and a reduction in annual interest income of approximately $120 million.
The parties to the National Mortgage Settlement agreed to release us from further liability for certain alleged residential mortgage origination, servicing and foreclosure deficiencies. For FHA-guaranteed loans originated on or before April 30, 2009, we also received (1) a release of origination liability for loans where an insurance claim had been submitted to the FHA prior to January 1, 2012 and (2) a release of multiple damages and penalties, but not administrative indemnification claims for single damages, for loans where no insurance claim had been submitted by January 1, 2012.
The independent monitor appointed as a result of the National Mortgage Settlement to review and certify compliance with its provisions has confirmed that we have substantially fulfilled all commitments for borrower assistance, including principal reductions, and interest rate reductions.
Mortgage Electronic Registration Systems, Inc.
We are subject to certain legal and contractual requirements for how we hold, transfer, use or enforce promissory notes, security instruments and other documents for residential mortgage loans that we service. In recent years, challenges have been raised to whether we have adhered to these rules.requirements, and whether, as a result in some instances, the loans can be enforced as local law otherwise would permit. Additionally, we currently use the MERS system for approximately half of the residential mortgage loans that remain in our servicing portfolio, but individuals and certain local governments have contended that the use of MERS is improper or otherwise adversely affects the security interest. If documentation requirements were not met, or if the use of MERS or the MERS system is found not valid or effective, we could be obligated to, or choose to, take remedial actions and may be subject to additional costs or losses.
Impact of Foreclosure Delays
Foreclosure delays that impact our default-related servicing costs, which include mortgage-related assessments, waivers and similar costs, peaked in mid-2013 and have declined throughout 2014 as delinquencies declined. However, unexpected foreclosure delays could impact the rate of decline. In 2014, we recorded $14 million of mortgage-related assessments, waivers and similar costs related to foreclosure delays compared to $514 million in 2013.
Other Mortgage-related Matters
We continue to be subject to additional borrower and non-borrower litigation and governmental and regulatory scrutiny related to our past and current origination, servicing, transfer of servicing and servicing rights, and foreclosure activities, including those claims not covered by the National Mortgage Settlement or the DoJ Settlement. This scrutiny may extend beyond our pending foreclosure matters to issues arising out of alleged irregularities with respect to previously completed foreclosure activities. The ongoing environment of additional regulation, increased regulatory compliance obligations, and enhanced regulatory enforcement, combined with ongoing uncertainty related to the continuing evolution of the regulatory environment, has resulted in operational and compliance costs and may limit our ability to continue providing certain products and services. For more information on management’s estimate of the aggregate range of possible loss and on regulatory investigations, see Note 12 – Commitments and Contingencies to the Consolidated Financial Statements.
Mortgage-related Settlements – Servicing Matters
In connection with the BNY Mellon Settlement, BANA has agreed to implement certain servicing changes related to loss mitigation activities. BANA also agreed to transfer the servicing rights related to certain high-risk loans to qualified subservicers on a schedule that began with the signing of the BNY Mellon Settlement. This servicing transfer protocol has reduced the servicing fees payable to BANA. Upon final court approval of the BNY Mellon Settlement, failure to meet the established benchmarking standards for loans not in subservicing arrangements can trigger payment of agreed-upon fees. Additionally, we and Countrywide have agreed to work to resolve with the Trustee certain mortgage documentation issues related to the enforceability of mortgages in foreclosure and to reimburse the related Covered Trust for any loss if BANA is unable to foreclose on the mortgage and the Covered Trust is not made whole by a title policy because of these issues. These agreements will terminate if final court approval of the BNY Mellon Settlement is not obtained, although we could still have exposure under the pooling and servicing agreements related to the mortgages in the Covered Trusts for these issues.
BANA has agreed to implement uniform servicing standards established under the National Mortgage Settlement. These standards are intended to strengthen procedural safeguards and documentation requirements associated with foreclosure, bankruptcy and loss mitigation activities, as well as addressing the imposition of fees and the integrity of documentation, with a goal of ensuring greater transparency for borrowers. These uniform servicing standards also obligate us to implement compliance processes reasonably designed to provide assurance of the achievement of these objectives. Compliance with the uniform servicing standards is subject to ongoing review by the independent monitor. Implementation of these uniform servicing standards has contributed to elevated costs associated with the servicing process, but is not expected to result in material delays or dislocation in the performance of our mortgage servicing obligations, including the completion of foreclosures.
Managing Risk
Overview
Risk is inherent in every materialall our business activity that we undertake. Ouractivities. Sound risk management enables us to serve our customers and deliver for our shareholders. If not managed well, risks can result in financial loss, regulatory sanctions and penalties, and damage to our reputation, each of which may adversely impact our ability to execute our business exposes us tostrategies. The seven types of risk faced by Bank of America are strategic, credit, market, liquidity, compliance, operational and reputational risks. We must manage these risks to maximize our long-term results by ensuring the integrity of our assets and the quality of our earnings.
Strategic risk is the risk that resultsresulting from adverse business decisions,incorrect assumptions about external or internal factors, inappropriate business plans, ineffective business strategy execution, or failure to respond in a timely manner to changes in the regulatory, macroeconomic environment, such as business cycles, competitor actions, changing customer preferences, product obsolescence, technology developments and regulatory environment.or competitive environments. Credit risk is the risk of loss arising from the inability or failure of a borrower’sborrower or counterparty’s inabilitycounterparty to meet its obligations. Market risk is the risk that values of assets and liabilities, or revenues will be adversely affected by changes in market conditions such as interest rate movements.may adversely impact the value of assets or liabilities, or otherwise negatively impact earnings. Liquidity risk is the risk of anpotential inability to meet contractual andor contingent financial obligations, either on- or off-balance sheet, as they come due. Compliance risk is the risk that arisesof legal or regulatory sanctions or penalties arising from the failure of the Corporation to adhere tocomply with requirements of applicable laws, rules regulations, or internal policies and procedures.regulations. Operational risk is the risk of loss resulting from inadequate or failed internal processes, people and systems, or from external events. Reputational risk is the potential that negative publicity regarding an organization’sperceptions of the Corporation’s conduct or business practices willmay adversely affectimpact its profitability or operations through an inability to establish new or customer base, or result in costly litigation or require other measures.maintain existing customer/client relationships. Reputational risk is evaluated along with all of the risk categories and throughout the risk management process and, as such, is not discussed separately herein. The following sections, Strategic Risk Management and Capital Management both on page 65, Liquidity Risk58, Capital Management on page 71, 59 Liquidity Risk on page 65, Credit Risk Management on page 76, 70, Market Risk Management on page 108, 99, Compliance Risk Management on page 108 and Operational Risk Management both on page 116,109, address in more detail the specific procedures,
measures and analyses of the major categories of risk. This discussion of managing risk focuses on the Risk Framework that, we manage.
In choosing when and how to take risks, we evaluate our capacity for risk and seek to protect our brand and reputation, our financial flexibility, the value of our assets and the strategic potential of the Corporation. We intend to maintain a strong and flexible financial position. We also intend to focus on maintaining our relevance and value to customers, employees and shareholders. Asas part of our efforts to achieve these objectives, we continue to build a comprehensive risk management culture and to implement governance and control measures to strengthen that culture.
We take a comprehensive approach to risk management. We have a defined risk framework and articulated risk appetite which areits annual review process, was approved annually by the Corporation’s Board of Directors (the Board). and its Enterprise Risk Committee (ERC) in January 2015. The key enhancements from the 2014 Risk Framework include further increasing the focus on our strong risk culture and ensuring consistency with recent regulatory guidance. It continues to recognize the same seven key risk types as discussed above, and the five components of our risk management planningapproach as outlined below.
A strong risk culture is integrated with strategic, financialfundamental to our core values and customer/client planning so that goalsoperating principles. It requires us to focus on risk in all activities and encourages the necessary mindset and behavior to enable effective risk management, and promotes sound risk taking within our risk appetite. Sustaining a strong risk culture throughout the organization is critical to the success of the Corporation and is a clear expectation of our executive management team and the Board.
Our Risk Framework is the foundation for comprehensive management of the risks facing the Corporation. It outlines clear responsibilities and accountabilities for managing risk. The Risk Framework sets forth roles and responsibilities are aligned acrossfor the organization. Risk is managed in a systematic manner
management of risk by focusing on the Corporation as a whole as well as managing risk across the enterprise and within individual businessfront line units products, services and transactions, and across all geographic locations. We maintain a governance structure that delineates the responsibilities for(FLUs), independent risk management, activities, as well as governancecontrol functions and oversightCorporate Audit, each of thosewhich is described below in Managing Risk – Risk Management Governance, and provides a blueprint for how the Board, through delegation of authority to committees and executive officers, establishes risk appetite and associated limits for our activities. It describes the five components of our risk management approach (risk culture, risk appetite, risk management processes, risk data aggregation and reporting, and risk governance) and the seven key types of risk we face.
Executive management assesses, with Board oversight, the risk-adjusted returns of each business segment.business. Management reviews and approves strategic and financial operating plans, and recommends a financial plan annually to the Board for approval a financial plan annually.approval. Our strategic plan takes into consideration return objectives and financial resources, which must align with risk capacity and risk appetite. Management sets financial objectives for each business by allocating capital and setting a target for return on capital for each business. Capital allocations and operating limits are regularly evaluated as part of our overall governance processes as the businesses and the economic environment in which we operate continue to evolve. For more information regarding capital allocations, see Business Segment Operations on page 34.
In additionOur Risk Appetite Statement is intended to reputational considerations, businessesensure that the Corporation maintains an acceptable risk profile by providing a common framework and a comparable set of measures for senior management and the Board to clearly indicate the level of risk the Corporation is willing to accept. The Risk Appetite Statement includes both quantitative limits and qualitative components. Risk appetite is set at least annually in conjunction with the strategic, capital and financial operating plans to align risk appetite with the Corporation’s strategy and financial resources. Line of business strategies and risk appetite are also aligned. As part of its annual review, the Board approved the Risk Appetite Statement in January 2015.
Our overall capacity to take risk is limited; therefore, we prioritize the risks we take in order to maintain a strong and flexible financial position so we can withstand challenging economic times and take advantage of organic growth opportunities. Therefore, we set objectives and targets for capital and liquidity that are intended to permit the Corporation to continue to operate in a safe and sound manner at all times, including during periods of stress.
Each of our lines of business operates within their credit, market compliance and operational risk standards and limits in order to adhere to the risk appetite.appetite limits. These limits are based on analyses of risk and reward inwithin each line of business. Executive management is responsible for tracking and reporting performance measurements as well as any exceptions to guidelines or limits. The Board, and its committees when appropriate, monitoroversees financial performance, execution of the strategic and financial operating plans, compliance with theadherence to risk appetite limits and the adequacy of internal controls.
As partRisk Management Governance
The Risk Framework includes delegations of its annual review,authority whereby the Board and its committees may delegate authority to management-level committees or executive officers. Such delegations may authorize certain decision-making and approval functions, which may be evidenced in, for example, committee charters, job descriptions, meeting minutes and resolutions.
The chart below illustrates the inter-relationship among the Board, Board committees and management committees that have the majority of risk oversight responsibilities for the Corporation. This chart reflects the revised Risk Framework approved bothby the Board in January 2015.
(1) This presentation does not include committees for other legal entities.
(2) Reports to the CEO and CFO with oversight by the Audit Committee.
Board of Directors and Board Committees
The Board, which consists of a substantial majority of independent directors, authorizes management to maintain an effective Risk Framework, and oversees compliance with safe and sound banking practices. In addition, the Board or its committees conduct appropriate inquiries of, and receive reports from management on risk-related matters to determine whether there are scope or resource limitations that impede the ability of independent risk management and/or Corporate Audit to execute its responsibilities. The following Board committees have the principal responsibility for enterprise-wide oversight of our risk management activities. These committees and other Board committees, as applicable, regularly report to the Board on risk-related matters. Through these activities, the Board and applicable committees are provided with thorough information on the Corporation’s risk profile, and challenge executive management to appropriately address key risks facing the Corporation. Other Board committees as described below provide additional oversight of specific risks.
Each of the committees shown on the above chart regularly reports to the Board on risk related matters within the committee’s responsibilities, which is intended to collectively provide the Board with integrated, thorough insight about our management of enterprise-wide risks.
Enterprise Risk Appetite Statement in January 2014. Committee
The Enterprise Risk Committee (ERC) has primary responsibility for oversight of the Corporation’s Risk Framework definesand material risks facing the accountability ofCorporation. It approves the Corporation and its employeesRisk Framework and the Risk Appetite Statement definesand further recommends these documents to the parameters under which we will take risk. Both documents are intended to enable us to maximize our long-term resultsBoard for approval. The ERC oversees senior management’s responsibilities for the identification, measure-ment, monitoring and ensurecontrol of all key risks facing the Corporation. The ERC may consult with other Board committees on risk-related matters.
Audit Committee
The Audit Committee oversees the qualifications, performance and independence of the Independent Registered Public Accounting Firm, the performance of the Corporation’s corporate audit function, the integrity of our assetsthe Corporation’s consolidated financial statements, compliance by the Corporation with legal and regulatory requirements, and makes inquiries of management or the qualityCorporate General Auditor (CGA) to determine whether there are scope or resource limitations that impede the ability of Corporate Audit to execute its responsibilities. The Audit Committee is also responsible for overseeing compliance risk pursuant to the New York Stock Exchange listing standards.
Credit Committee
The Credit Committee provides additional oversight of senior management’s responsibilities for the identification and management of corporation-wide credit exposures. Our Credit Committee oversees, among other things, the identification and management of our earnings. The Risk Framework is designedcredit exposures on an enterprise-wide basis, our responses to be used by our employees to understand risk management activities, including their individual roles and accountabilities. It also defines how risk management is integrated into our core business processes, and it definestrends affecting those exposures, the risk management governance structure, including management’s involvement. The risk management responsibilitiesadequacy of the businesses,allowance for credit losses and our credit-related policies.
Other Board Committees
Our Corporate Governance Committee oversees our Board’s governance processes, identifies and control functions,reviews the qualifications of potential Board members, recommends nominees for election to our Board and Corporate Audit are also clearly defined. The risk management process
recommends committee appointments for Board approval.includes four critical elements: identifyOur Compensation and measure risk, mitigateBenefits Committee oversees establishing, maintaining and control risk, monitoradministering our compensation programs and test risk,employee benefit plans, including approving and report and review risk, and is applied across all business activities to enable an integrated and comprehensive review of risk consistent with the Risk Appetite Statement.
Risk Management Processes and Methods
To supportrecommending our corporate goals and objectives, risk appetite, and business and risk strategies, we maintain a governance structure that delineates the responsibilities for risk management activities, as well as governance and oversight of those activities, by management and the Board. All employees have accountability for risk management. Each employee’s risk management responsibilities fall into one of three major categories: businesses, governance and control, and Corporate Audit.
Business managers and employees are accountable for identifying, managing and escalating attention to all risks in their business units, including existing and emerging risks. Business managers must ensure that their business activities are conducted within the risk appetite defined by management and approved by the Board. The limits and controls for each business must be consistent with the Risk Appetite Statement. Employees in client and customer facing businesses are responsible for day-to-day business activities, including developing and delivering profitable products and services, fulfilling customer requests and maintaining desirable customer relationships. These employees are accountable for conducting their daily work in accordance with policies and procedures. It is the responsibility of each employee to protect the Corporation and defend the interests of the shareholders.
Governance and control functions are comprised of Global Risk Management, Global Compliance, Legal and the enterprise control functions, and are tasked with independently overseeing and managing risk activities. Global Compliance (which includes Regulatory Relations) and Legal report to the Global General Counsel and Head of Compliance and Regulatory Relations Executive. Enterprise control functions consist of the Chief Financial Officer (CFO) Group, Global Technology and Operations, Global Human Resources, and Global Marketing and Corporate Affairs.
Global Risk Management is led by the Chief Risk Officer (CRO). The CRO leads senior management in managing risk, is independent from the Corporation’s businesses and enterprise control functions, and maintains sufficient autonomy to develop and implement meaningful risk management measures. This position serves to protect the Corporation and its shareholders. The CRO reports to the Chief Executive OfficerOfficer’s (CEO) compensation to our Board for further approval by all independent directors, and is the management team lead or a participant in Board-level risk governance committees. The CRO has the mandate to ensure that appropriate risk management practices are in place,reviewing and are effective and consistent withapproving all of our overall business strategy and risk appetite. Global Risk Management is comprised of two types of risk teams, Enterprise risk teams and independent business risk teams, which report to the CRO and are independent from the business and enterprise control functions.
Enterprise risk teams are responsible for setting and establishing enterprise policies, programs and standards, assessing program adherence, providing enterprise-level risk oversight, and reporting and monitoring systemic and emerging risk issues. In addition, the enterprise risk teams are responsible for monitoring and ensuring that risk limits are reasonable andexecutive officers’ compensation.
|
| | |
| | 62Bank of America 2013201456
| | |
Management Committees
Management committees may receive their authority from the Board, a Board committee, another management committee or from one or more executive officers. The primary management-level risk committee for the Corporation is the Management Risk Committee (MRC). Subject to Board oversight, the MRC is responsible for management oversight of all key risks facing the Corporation. The MRC provides management oversight of the Corporation’s credit portfolio, compliance and operational risk programs, balance sheet and capital management, funding activities and other liquidity activities, stress testing, trading activities, recovery and resolution planning, model risk, subsidiary governance and activities between banks and their nonbank affiliates pursuant to Federal Reserve rules and regulations. The MRC is responsible for holistic risk management, including an integrated evaluation of risk, earnings, capital and liquidity, and it reports on these matters to the Board or Board committees.
Lines of Defense
In addition to the role of Executive Officers in managing risk, we have clear ownership and accountability across the three lines of defense: FLUs, independent risk management and Corporate Audit. The Corporation also has control functions outside of FLUs and independent risk management (e.g., Legal and Global Human Resources). The three lines of defense are integrated into our management-level governance structure. Each of these is described in more detail below.
Executive Officers
Executive officers lead various functions representing the functional roles. Authority for functional roles may be delegated to executive officers from the Board, Board committees or management-level committees. Executive officers, in turn, may further delegate responsibilities, as appropriate, to management-level committees, management routines or individuals. Executive officers review the Corporation’s activities for consistency with our Risk Framework, Risk Appetite Statement, and applicable strategic, capital and financial operating plans, as well as applicable policies, standards, procedures and processes. Executive officers and other employees make decisions individually on a day-to-day basis, consistent with the authority they have been delegated. Executive officers and other employees may also serve on committees and participate in committee decisions.
Front Line Units
FLUs include the lines of business and two organizational units, the Global Technology and Operations Group and Strategic Initiatives. FLUs are held accountable by the CEO and the Board for appropriately assessing and effectively managing all of the risks associated with their activities.
Two organizational units that include FLU and control function activities, but are not part of independent risk appetite. Thesemanagement are the Chief Financial Officer (CFO) Group and Global Marketing and Corporate Affairs (GM&CA).
Independent Risk Management
Independent risk management (IRM) is part of our control functions and includes Global Risk Management and Global Compliance. We have other control functions that are not part of IRM (other control functions may also provide oversight to FLU activities), including Legal, Global Human Resources and certain activities
within the CFO Group, and GM&CA. IRM, led by the CRO, is responsible for independently assessing and overseeing risks within FLUs and other control functions. IRM establishes written enterprise policies and procedures that include concentration risk limits where appropriate. Such policies and procedures outline how aggregate risks are identified, measured, monitored and controlled.
The CRO has the authority and independence to develop and implement a meaningful risk management framework. The CRO has unrestricted access to the Board and reports directly to both the ERC and to the CEO. Global Risk Management is organized into enterprise risk teams also carry out risk-based oversight of the enterprise control functions.
Independent businessand FLU risk teams are responsible for establishing policies, limits, standards, controls, metricsthat work collaboratively in executing their respective duties.
Within IRM, Global Compliance independently assesses compliance risk, and thresholds withinevaluates adherence to applicable laws, rules and regulations, including identifying compliance issues and risks, performing monitoring and testing, and reporting on the defined corporate standards forstate of compliance activities across the businesses to which they are aligned. The independent business risk teams are also responsible for ensuring that risk limitsCorporation. Additionally, Global Compliance works with FLUs and standards are reasonable and consistent with the risk appetite.
Enterprise control functions are independent of the businesses and have risk governance and control responsibilities for enterprise programs. In this role, they are responsible for setting policies, standards and limits; providing risk reporting; monitoring systemic risk issues including existing and emerging; and implementing procedures and controls at the enterprise and business levels for their respective control functions.so that day-to-day activities operate in a compliant manner.
The Corporate Audit
Corporate Audit function maintainsand the CGA maintain their independence from the businessesFLUs, IRM and governance andother control functions by reporting directly to the Audit Committee ofCommittee. The CGA administratively reports to the Board.CEO. Corporate Audit provides independent assessment and validation through testing of key processes and controls across the Corporation. Corporate Audit also providesincludes Credit Review which periodically tests and examines credit portfolios and processes.
Risk Management Processes
The Corporation’s Risk Framework requires that strong risk management practices are integrated in key strategic, capital and financial planning processes and day-to-day business processes across the Corporation, with a goal of ensuring risks are appropriately considered, evaluated and responded to in a timely manner.
We employ a risk management process, referred to as IMMC: Identify, Measure, Monitor and Control, as part of our daily activities.
Identify – To be effectively managed, risks must be clearly defined and proactively identified. Proper risk identification focuses on recognizing and understanding all key risks inherent in our business activities and risks that may arise from business initiatives or external factors. Risk identification is an independent assessment ofongoing process occurring at both the Corporation’s managementindividual transaction and internal control systems. Corporate Audit activities are designedportfolio level. Each employee is expected to provide reasonable assurance that resources are adequately protected; significant financial, managerialidentify and operating informationescalate risks promptly.
Measure –Once a risk is materially complete, accurateidentified, it must be measured. Risk is measured at various levels including, but not limited to, risk type, FLU, legal entity and reliable;on an aggregate basis. These metrics help us assess our risk profile and employees’ actions are in compliance with the Corporation’sadherence to our risk appetite.
Monitor –We monitor risk levels regularly to track adherence to risk appetites, policies, standards, procedures and applicable lawsprocesses. Through our monitoring, we can determine our level of risk relative to limits and regulations.can take action in a timely manner. We also can determine when risk limits are breached and have processes to appropriately report and escalate exceptions. This includes immediate requests for approval to managers
and alerts to executive management, management-level committees or the CorporationBoard (directly or through an appropriate committee).
Control –We establish and communicate risk limits and controls through policies, standards, procedures and processes that define the responsibilities and authority for risk taking. The limits and controls can be adjusted by the Board or management when conditions or risk tolerances warrant. These limits may be absolute (e.g., loan amount, trading volume) or relative (e.g., percentage of loan book in achieving its goals and objectives, risk appetite, andhigher-risk categories). Our lines of business and risk strategies, we utilize a risk management process that is applied acrossare held accountable to perform within the execution of all business activities. This risk management process, which is an integral part of our Risk Framework, enables the Corporation to review risk in an integrated and comprehensive manner across all risk categories and make strategic and business decisions based on that comprehensive view. Corporate goals and objectives are established by management, and management reflects these goals and objectives in our risk appetite.limits.
One ofAmong the key tools ofin the risk management process isare the use of Risk and Control Self Assessments (RCSAs). RCSAs areThe RCSA process, consistent with IMMC, is one of our primary methods for capturing the primary method for facilitating managementidentification and assessment of the business environmentoperational risk exposures, including inherent and internalresidual operational risk ratings, and control factor data.effectiveness ratings. The end-to-end RCSA process incorporates risk identification and assessment of the control environment; monitoring, reporting and escalating risk; quality assurance and data validation; and integration with the risk appetite. The RCSA process also incorporates documentation by either the business or governance and control functions of the business environment, risks, controls, and monitoring and reporting. This results in a comprehensive risk management view that enables understanding of and action on operational risks and controls for all of our processes, products, activities and systems.
The formal processes used to manage risk represent a part of our overall risk management process. Corporate culture and the actions of our employees are also critical to effective risk management. Through our Code of Conduct, we set a high standard
for our employees. The Code of Conduct provides a framework for all of our employees to conduct themselves with the highest integrity. We instill a strong and comprehensive risk management culture through communications, training, policies, procedures, and organizational roles and responsibilities. Additionally, we continue to strengthen the link between the employee performance management process and individual compensation to encourage employees to work toward enterprise-wide risk goals.
Enterprise-wideCorporation-wide Stress Testing
As a part of our core risk management practices, we conduct enterprise-widecorporation-wide stress tests on a periodic basis to better understand balance sheet, earnings, capital and liquidity sensitivities to certain economic and business scenarios, including economic and market conditions that are more severe than anticipated. These enterprise-widecorporation-wide stress tests provide illustrative hypothetical potential impacts from our risk profile on our balance sheet, earnings, capital and liquidity and serve as a key component of our capital, liquidity and risk management practices. Scenarios are recommended by the Asset Liability and Market Risk Committee (ALMRC)MRC and approved by the CFO and the CRO. Impacts to each business from each scenario are then determined and analyzed, primarily by leveraging the models and processes utilized in everyday management routines. Impacts are assessed along with potential mitigating actions that may be taken. Analysis from such stress scenarios is compiled for and reviewed through our Chief Financial Officer Risk Committee (CFORC), ALMRCby the MRC and the Board’s Enterprise Risk Committee.ERC.
Contingency Planning Routines
We have developed and maintain contingency plans that are designed to prepare us in advance to respond in the event of potential adverse outcomes and scenarios. These contingency planning routines include capital contingency planning, liquidity
contingency funding plans, recovery planning and enterprise resiliency, and provide monitoring, escalation routines and response plans. Contingency response plans are designed to enable us to increase capital, access funding sources and reduce risk through consideration of potential actions that includesinclude asset sales, business sales, capital or debt issuances, and other de-risking strategies.
Board Oversight of Risk
The Board is comprised of a substantial majority of independent directors. The Board is committed to strong, independent oversight of management and risk through a governance structure that includes Board committees and management committees. The Board’s standing committees that oversee the management of the majority of the risks faced by the Corporation include the Audit and Enterprise Risk Committees, comprised of independent directors, and the Credit Committee, comprised of non-management directors. This governance structure is designed to align the interests of the Board and management with those of our shareholders and to foster integrity over risk management throughout the Corporation.
The chart below illustrates the inter-relationship among the Board, Board committees and management committees with the majority of risk oversight responsibilities for the Corporation.
| |
(1)
| Chart is not comprehensive; there may be additional subcommittees not represented in this chart. This presentation does not include committees for other legal entities. |
| |
(2)
| Reports through the Audit Committee for compliance and through the Enterprise Risk Committee for operational and reputational risk. |
| |
(3)
| Reports to the CEO and CFO with oversight by the Audit Committee. |
Our Board’s Audit, Credit and Enterprise Risk Committees have the principal responsibility for assisting the Board with enterprise-wide oversight of the Corporation’s management and handling of risk.
Our Audit Committee assists the Board in the oversight of, among other things, the integrity of our consolidated financial statements, our compliance with legal and regulatory requirements, and the overall effectiveness of our system of internal controls. Our Audit Committee also, taking into consideration the Board’s allocation of the review of risk among various committees of the Board, discusses with management guidelines and policies to govern the process by which risk assessment and risk management are undertaken, including the assessment of our major financial risk exposures and the steps management has taken to monitor and control such exposures.
Our Credit Committee oversees, among other things, the identification and management of our credit exposures on an enterprise-wide basis, our responses to trends affecting those exposures, the adequacy of the allowance for credit losses and our credit-related policies.
Our Enterprise Risk Committee oversees, among other things, our identification of, management of and planning for material risks on an enterprise-wide basis, including market risk, interest rate risk, liquidity risk, operational risk and reputational risk. Our Enterprise Risk Committee also oversees our capital management and liquidity planning.
Each of these committees regularly reports to our Board on risk-related matters within the committee’s responsibilities, which collectively provides our Board with integrated, thorough insight about our management of enterprise-wide risks. At meetings of our Audit, Credit and Enterprise Risk Committees and our Board, directors receive updates from management regarding enterprise risk management, including our performance against our risk appetite and risk framework.
Executive management develops for Board approval the Corporation’s Risk Framework, Risk Appetite Statement, strategic plans, capital plans and financial operating plans. Management monitors, and the Board oversees, through the Credit, Enterprise Risk and Audit Committees, financial performance, execution of the strategic and financial operating plans, compliance with the risk appetite and the adequacy of internal controls.
Strategic Risk Management
Strategic risk is embedded in every business and is one of the major risk categories along with credit, market, liquidity, compliance, operational and reputational risks. It is the risk that results from adverseincorrect assumptions, unsuitable business decisions,plans, ineffective or inappropriate business plans,strategy execution, or failure to respond in a timely manner to changes in the regulatory, macroeconomic environment, such as business cycles, competitor actions,and competitive environments, customer preferences, product obsolescence,and technology developments andin the regulatory environment.geographic locations in which we operate. We face significant strategic risk due to the changing regulatory environment and the fast-paced development of new products and technologies in the financial services industries. Our appetite for strategic risk is assessed based on the strategic plan, with strategic risks selectively and carefully considered against the backdrop of the evolving marketplace. Strategic risk is managed in the context of our overall financial condition, risk appetite and stress test results, among other considerations. The CEO and executive management team manage and act on significant strategic actions, such as divestitures, consolidation of legal entities or capital actions subsequent to required review and approval by the Board.
Executive management develops and approves a strategic plan each year, which is reviewed and approved by the Board. Annually, executive management develops a financial operating plan, which is reviewed and approved by the Board, that implements the strategic goals for that year. With oversight by the Board, executive management ensures that consistency is applied while executing the Corporation’s strategic plan, core operating tenets and risk appetite. The following are assessed in the executive reviews: forecasted earnings and returns on capital, the current risk profile, current capital and liquidity requirements, staffing levels and changes required to support the plan, stress testing results, and other qualitative factors such as market growth rates and peer analysis. At the business level, as we introduce new products, we monitor their performance relative to evaluate expectations (e.g., for earnings and returns on capital). With oversight by the Board and the ERC, executive management performs similar analyses throughout the year, and evaluates changes to the financial forecast or the risk, capital or liquidity positions as deemed appropriate to balance and optimize achieving the targeted risk appetite, shareholder returns and maintaining the targeted financial strength.
We use proprietary models to measure the capital requirements for credit, country, market, operational and strategic risks. The allocated capital assigned to each business is based on its unique risk exposures. With oversight by the Board, executive management assesses the risk-adjusted returns of each business in approving strategic and financial operating plans. The businesses use allocated capital to define business strategies, and price products and transactions. For more information on how this measure is calculated, see Supplemental Financial Data on page 3332.
Capital Management
The Corporation manages its capital position to maintain sufficient capital to support its business activities and maintain capital, risk and risk appetite commensurate with one another. Additionally, we seek to maintain safety and soundness at all times includingeven under adverse conditions,scenarios, take advantage of potentialorganic growth opportunities, maintain ready access to financial markets, continue to serve as a credit intermediary, remain a source of
strength for our subsidiaries, and satisfy current and future regulatory capital requirements. Capital management is integrated into our risk and governance processes, as capital is a key consideration in the development of theour strategic plan, risk appetite and risk limits.
We set goals for capital ratios to meet key stakeholder expectations, including investors, regulators and rating agencies, and regulators, andto achieve our financial performance objectives and strategic goals, while maintaining adequate capital, including during periods of stress. We assess capital adequacy at least on a quarterly basis to operate in a safe and sound manner and maintain adequate capital in relation to the risks associated with our business activities and strategy.
At least quarterly weWe conduct an Internal Capital Adequacy Assessment Process (ICAAP). on a quarterly basis. The ICAAP is a forward-looking assessment of our projected capital needs and resources, incorporating earnings, balance sheet and risk forecasts under baseline and adverse economic and market conditions. We utilize quarterly stress tests to assess the potential impacts to our balance sheet, earnings, regulatory capital and liquidity under a variety of stress scenarios. We perform qualitative risk assessments to identify and assess material risks not fully captured in theour forecasts or stress tests or economic capital.tests. We assess the capital impacts of proposed changes to regulatory capital requirements. Management assesses ICAAP results and provides documented quarterly assessments of the adequacy of theour capital guidelines and capital position to the Board or its committees.
Effective January 1, 2013, on a prospective basis, we adjusted the amount ofThe Corporation periodically reviews capital being allocated to our business segments. The adjustment reflects a refinement toits businesses and allocates capital annually during the prior-year methodology (economic capital) which focused solely on internal risk-based economicstrategic and capital models. The refined methodology (allocated capital) also considers the effect of regulatory capital requirements in addition to internal risk-based economic capital models. The Corporation’s internal risk-based capital models use a risk-adjusted methodology incorporating each segment’s credit, market, interest rate, business and operational risk components.planning processes. For more information, on the nature of these risks, see Managing Risk on page 61 and Strategic Risk Management on page 65. The capital allocated to the business segments is currently referred to as allocated capital and, prior to January 1, 2013, was referred to as economic capital, both of which represent non-GAAP financial measures. Allocated capital is reviewed periodically based on business segment exposures and risk profile, regulatory constraints and strategic plans, and is subject to change over time. For more information on the refined methodology, see Business Segment Operations on page 35.34.
CCAR and Capital Planning
The Federal Reserve requires BHCs to submit a capital plan and requests for capital actions on an annual basis, consistent with the rules governing the Comprehensive Capital Analysis and Review (CCAR) capital plan. The CCAR capital plan is the central element of the Federal Reserve’s approach to ensure that large BHCs have adequate capital and robust processes for managing their capital.
On October 17, 2014, the Federal Reserve released 2015 CCAR instructions as well as an update to the capital plan and stress test rules. The revised rules shift the dates of the annual stress testing cycle by approximately three months to April, beginning with 2016 CCAR capital plans.
In January 2015, we submitted our 2015 CCAR capital plan and related supervisory stress tests. The Federal Reserve has announced that it will release summary results, including supervisory projections of capital ratios, losses and revenues under stress scenarios, and publish the results of stress tests
conducted under the supervisory adverse and supervisory severely adverse scenarios in March 2015.
In January 2014, we submitted our 2014 CCAR capital plan and received results in March 2014. Based on the information in our January 2014 submission, the Federal Reserve advised that it did not object to our 2014 capital actions. In April 2014, we announced the revision of certain regulatory capital amounts and ratios that had previously been reported, and suspended our previously announced 2014 capital actions stating that we would resubmit information pursuant to the 2014 CCAR to the Federal Reserve. In May 2014, we submitted our revised 2014 CCAR capital plan, and in August 2014, the Federal Reserve informed us that it did not object to our revised 2014 CCAR capital plan. The requested capital actions included an increase in the quarterly common stock dividend to $0.05 per share from $0.01 per share, but no additional common stock repurchases.
Regulatory Capital
As a financial services holding company, we are subject to the general risk-basedregulatory capital rules issued by federalU.S. banking regulators which was Basel 1 through December 31, 2012.regulators. On January 1, 2013, Basel 1 was amended prospectively, introducing changes2014, we became subject to the measurementBasel 3 rules, which include certain transition provisions through January 1, 2019 (Basel 3 Standardized – Transition). Basel 3 generally continues to be subject to interpretation and clarification by U.S. banking regulators. Basel 3 also expands and modifies the risk-sensitive calculation of risk-weighted assets for exposures subject to market risk (Market Risk Final Rule) and is referred to herein as(defined in the Basel 1 – 2013 Rules.Rules) for credit and market risk (applicable to banks that meet the definition as advanced approaches); and introduces a Standardized approach for the calculation of risk-weighted assets, which serves as a minimum. The Corporation and its primary affiliated banking entities,entity, BANA, meet the definition of an advanced approaches bank and FIA, measure regulatory capital adequacy based upon these rules. For more information on the Market Risk Final Rule, see Capital ManagementBasel 3 rules. Through December 31, 2013, we were subject to the Basel 1 general risk-based capital rules which included new measures of market risk including a charge related to stressed Value-at-Risk (VaR), an incremental risk charge and the comprehensive risk measure (CRM), as well as other technical modifications to Basel 1 (the Basel 1 – Regulatory Capital Changes on page 682013 Rules).
Federal banking regulators, in connection withThe risk-sensitive approach for calculating risk-weighted assets under Basel 3 replaces the Supervisory Capital Assessment Program in 2009, introduced an additional measure of capital, Tierapproach under the Basel 1 common capital. Tier 1 common capital is not an official regulatory ratio and is defined as Tier 1 capital less preferred stock, trust preferred securities (Trust Securities), hybrid securities and qualifying noncontrolling interest in subsidiaries.
– 2013 Rules. Risk-weighted assets are calculated for credit risk for all on- and off-balance sheet credit exposures and for market risk on trading assets and liabilities, including derivative exposures. Credit risk-weighted assets are calculated by assigning a prescribed risk-weightrisk weight to all on-balance sheet assets and to the credit equivalent amount of certain off-balance sheet exposures. The risk-weight is defined in the regulatory rules based upon the obligor or guarantor type and collateral, if applicable. Off-balance sheet exposures include financial guarantees, unfunded lending commitments, letters of credit and derivatives. Market risk-weighted assets are calculated using risk models for trading account positions, including all foreign exchange and commodity positions regardless of the applicable accounting guidance. Any assets that are a direct deduction from the computation of capital are excluded from risk-weighted assets and adjusted average total assets, consistent with regulatory guidance. Under Basel 1, there are no risk-weighted assets calculated for operational risk.
The Federal Reserve requires BHCs to submit a capital plan and requests for capital actions on an annual basis, consistent with the rules governing the Comprehensive Capital Analysis and Review (CCAR). The CCAR is the central element of the Federal Reserve’s approach to ensure that large BHCs have adequate capital and robust processes for managing their capital. In January 2013, we submitted our 2013 capital plan, and received results on March 14, 2013. The Federal Reserve’s stress scenario projections for the Corporation, based on the 2013 capital plan, estimated a minimum Tier 1 common capital ratio under the Basel 1 – 2013 Rules of 6.0 percent under severe adverse economic conditions with all proposed capital actions through the end of 2014, exceeding the five percent reference rate for all institutions involved in the CCAR. The capital plan submitted by the Corporation included a request to repurchase up to $5.0 billion of common stock and redeem $5.5 billion in preferred stock over four quarters beginning in the second quarter of 2013, and continue the quarterly common stock dividend at $0.01 per share. As of December 31, 2013, in connection with the 2013 CCAR capital plan, we have repurchased and retired approximately 231.7 million common shares for an aggregate purchase price of approximately $3.2 billion and we redeemed $5.5 billion of preferred stock consisting of Series H and 8. As of December 31, 2013, under the capital plan, we can purchase up to $1.8 billion of additional common stock through the first quarter of 2014.
The timing and amount of common stock repurchases through March 31, 2014 have been and will continue to be consistent with the Corporation’s 2013 capital plan and will be subject to various factors, including the Corporation’s capital position, liquidity, applicable legal considerations, financial performance and
alternative uses of capital, stock trading price, and general market conditions, and may be suspended at any time. The remaining common stock repurchases may be effected through open market purchases or privately negotiated transactions, including repurchase plans that satisfy the conditions of Rule 10b5-1 of the Securities Exchange Act of 1934.
In January 2014, we submitted our 2014 CCAR plan and related supervisory stress tests. The Federal Reserve has announced that it will release summary results, including supervisory projections of capital ratios, losses and revenues under stress scenarios, and publish the results of stress tests conducted under the supervisory adverse scenario in March 2014.
For more information on thesethe regulatory capital amounts and other regulatory requirements,calculations, see Note 16 – Regulatory Requirements and Restrictionsto the Consolidated Financial Statements.Basel 3 below.
Capital Composition and Ratios
Table 14 presents Bank of America Corporation’s capital ratios and related information in accordance with the Basel 1 – 2013 Rules as measured at December 31, 2013 and Basel 1 at December 31, 2012.
|
| | | | | | | | |
| | | | | |
| Table 14 | Bank of America Corporation Regulatory Capital – Actual and Pro-Forma |
| | | | | |
| | | December 31 |
| (Dollars in billions) | 2013 | | 2012 |
| Tier 1 common capital ratio | 11.19 | % | | 11.06 | % |
Tier 1 common capital ratio (pro forma) (1) | n/a |
| | 10.38 |
|
| Tier 1 capital ratio | 12.44 |
| | 12.89 |
|
| Total capital ratio | 15.44 |
| | 16.31 |
|
| Tier 1 leverage ratio | 7.86 |
| | 7.37 |
|
| Risk-weighted assets | $ | 1,298 |
| | $ | 1,206 |
|
Adjusted quarterly average total assets (2) | 2,053 |
| | 2,111 |
|
| |
(1)
| Pro-forma Tier 1 common capital ratio at December 31, 2012 includes the estimated impact of the Basel 1 – 2013 Rules. Represents a non-GAAP financial measure. On a pro-forma basis, risk-weighted assets would have been approximately $1,285 billion with the inclusion of $78.8 billion in pro-forma risk-weighted assets.
|
| |
(2)
| Reflects adjusted average total assets for the three months ended December 31, 2013 and
|
2012.
n/a = not applicable
Tier 1 common capital under the Basel 1 – 2013 Rules was $145.2 billion at December 31, 2013, an increase of $11.8 billion under Basel 1 at December 31, 2012. The increase was due to earnings eligible to be included in capital, partially offset by the impact of the common stock repurchases. At December 31, 2012, pro-forma Tier 1 common capital of $133.4 billion would have been unchanged, assuming the Basel 1 – 2013 Rules had been in effect at that time. During 2013, total capital increased$3.6 billion to $200.3 billion primarily driven by the increase in Tier 1 common capital and the portion of the allowance for loan and lease losses eligible to be included in capital, partially offset by decreases in qualifying preferred stock, qualifying subordinated debt and Trust Securities. For additional information, see Tables 14 and 16.
|
| | |
6659 Bank of America 20132014
| | |
In 2013, we entered into an agreement with Berkshire Hathaway, Inc. and its affiliates (Berkshire), who hold all the outstanding shares of the Corporation’s 6% Cumulative Perpetual Preferred Stock, Series T (Series T Preferred Stock) to amend the terms of the Series T Preferred Stock. As of December 31, 2013, the Series T Preferred Stock has a carrying value of $2.9 billion, which does not qualify as Tier 1 capital. The material changes to the terms of the Series T Preferred Stock proposed in the amendment are: (1) dividends will no longer be cumulative; (2) the dividend rate will be fixed at 6%; and (3) we may redeem the Series T Preferred Stock only after the fifth anniversary of the effective date of the amendment. Under Delaware law and our certificate of incorporation, the amendment must be approved by the holders of the Series T Preferred Stock, voting as a separate class, and a majority of the outstanding shares of our common stock, Series B Preferred Stock and Series 1 through 5 Preferred Stock, voting together as a class. The amendment will be presented to our stockholders for approval at the annual meeting of stockholders scheduled to be held on May 7, 2014. Berkshire has granted us an irrevocable proxy to vote their shares of Series T Preferred Stock in favor of the amendment at the annual meeting. If our stockholders approve the amendment and it becomes effective, our Tier 1 capital will increase by approximately $2.9 billion, which will benefit our Tier 1 capital and leverage ratios. We do not expect any impact to our financial condition or results of operations as a result of this amendment. For more information on the Series T Preferred Stock, see Note 13 – Shareholders’ Equityto the Consolidated Financial Statements.
At December 31, 2013, an increase or decrease in our Tier 1 common, Tier 1 or Total capital ratios by one bp would require a change of $130 million in Tier 1 common, Tier 1 or Total capital. We could also increase our Tier 1 common, Tier 1 or Total capital ratios by one bp on such date by a reduction in risk-weighted assets of $1.2 billion, $1.0 billion or $840 million, respectively. An increase in our Tier 1 leverage ratio by one bp on such date would
require $205 million of additional Tier 1 capital or a reduction of $2.6 billion in adjusted average assets.
Risk-weighted assets increased $91.6 billion in 2013 to $1,298 billion at December 31, 2013. The increase was primarily due to the net impact of the Basel 1 – 2013 Rules which increased risk-weighted assets by approximately $87 billion and reduced the Tier 1 common capital ratio by an estimated 77 bps. The Tier 1 leverage ratio increased 49 bps in 2013 primarily driven by the increase in Tier 1 capital and a reduction in adjusted quarterly average total assets.
Table 15 presents Bank of America Corporation’s risk-weighted assets activity for 2013.
|
| | | | |
| | | |
| Table 15 | Risk-weighted Asset Activity | |
| | | |
| (Dollars in billions) | 2013 |
| Risk-weighted assets, January 1 | $ | 1,206 |
|
| Changes to risk-weighted assets | |
Increase related to Comprehensive Risk Measure (1) | 22 |
|
Increase related to Incremental Risk Charge (1) | 7 |
|
| Increase related to market risk regulatory VaR | 21 |
|
Standard specific risk (2) | 28 |
|
| Increase due to items no longer eligible to be included in market risk | 9 |
|
| Increases related to implementation of Basel 1 – 2013 Rules | 87 |
|
| Decrease related to trading and banking book exposures | (3 | ) |
| Other changes | 8 |
|
| Total risk-weighted assets, December 31 | $ | 1,298 |
|
| |
(1)
| For additional information, see Capital Management – Regulatory Capital Changes on page 68.
|
| |
(2)
| A measure of the risk of loss on a position that could result from factors other than broad market movements. |
Table 16 presents the capital composition in accordance with the Basel 1 – 2013 Rules as measured at December 31, 2013 and Basel 1 at December 31, 2012.
|
| | | | | | | | |
| | | | | |
| Table 16 | Capital Composition | | | |
| | | | | |
| | | December 31 |
| (Dollars in millions) | 2013 | | 2012 |
| Total common shareholders’ equity | $ | 219,333 |
| | $ | 218,188 |
|
| Goodwill | (69,844 | ) | | (69,976 | ) |
| Nonqualifying intangible assets (includes core deposit intangibles, affinity relationships, customer relationships and other intangibles) | (4,263 | ) | | (4,994 | ) |
| Net unrealized (gains) losses on AFS debt and marketable equity securities and net losses on derivatives recorded in accumulated OCI, net-of-tax | 5,538 |
| | (2,036 | ) |
| Unamortized net periodic benefit costs recorded in accumulated OCI, net-of-tax | 2,407 |
| | 4,456 |
|
Fair value adjustments related to structured liabilities (1) | 4,485 |
| | 4,084 |
|
| Disallowed deferred tax asset | (13,974 | ) | | (17,940 | ) |
| Other | 1,553 |
| | 1,621 |
|
| Total Tier 1 common capital | 145,235 |
| | 133,403 |
|
| Qualifying preferred stock | 10,435 |
| | 15,851 |
|
| Trust preferred securities | 5,786 |
| | 6,207 |
|
| Total Tier 1 capital | 161,456 |
| | 155,461 |
|
| Long-term debt qualifying as Tier 2 capital | 21,175 |
| | 24,287 |
|
| Allowance for loan and lease losses | 17,428 |
| | 24,179 |
|
| Reserve for unfunded lending commitments | 484 |
| | 513 |
|
| Allowance for loan and lease losses exceeding 1.25 percent of risk-weighted assets | (1,637 | ) | | (9,459 | ) |
| 45 percent of the pre-tax net unrealized gains (losses) on AFS marketable equity securities | (3 | ) | | 329 |
|
| Other | 1,378 |
| | 1,370 |
|
| Total capital | $ | 200,281 |
| | $ | 196,680 |
|
| |
(1)
| Represents loss on structured liabilities, net-of-tax, that is excluded from Tier 1 common capital, Tier 1 capital and Total capital for regulatory capital purposes. |
Regulatory Capital Changes
Market Risk Final Rule
At December 31, 2013, we measured and reported our capital ratios and related information in accordance with the Basel 1 – 2013 Rules, which introduced new measures of market risk including a charge related to stressed Value-at-Risk (VaR), an incremental risk charge and the comprehensive risk measure (CRM), as well as other technical modifications, all of which were effective January 1, 2013. The CRM is used to determine the risk-weighted assets for correlation trading positions. With approval from U.S. banking regulators, but not sooner than one year following compliance with the Market Risk Final Rule, we may remove a surcharge applicable to the CRM. This benefit is not yet included in our reported results. The implementation of the Basel 1 – 2013 Rules was the primary driver of the changes in total risk-weighted assets, and the Tier 1, Tier 1 common and Total capital ratios from December 31, 2012.
In December 2013, U.S. banking regulators issued an amendment to the Market Risk Final Rule, effective on April 1, 2014, to reflect certain aspects of the final Basel 3 Regulatory Capital rules (Basel 3). Revisions were made to the treatment of sovereign exposures and certain traded securitization positions as well as clarification as to the timing of required disclosures. These revisions are not expected to materially impact us.
Basel 3 Regulatory Capital Rules
The final Basel 3 rules became effective on January 1, 2014. Various aspects of Basel 3 will be subject to multi-year transition periods ending December 31, 2018 and Basel 3 generally continues to be subject to interpretation by the U.S. banking regulators. Basel 3 will materially change our Tier 1 common,changes Tier 1 and Total capital calculations.calculations and formally establishes a Common equity tier 1 capital ratio. Basel 3 introduces new minimum capital ratios and buffer requirements and a supplementary leverage ratio;ratio (SLR); changes the composition of regulatory capital; and revises the adequately capitalized minimum requirements under the Prompt Corrective Action framework; expands and modifies(PCA) framework. Changes to the calculationcomposition of risk-weighted assets for credit and market risk (the Advanced approach); and introduces a Standardized approach for the calculation of risk-weighted assets. This will replaceregulatory capital under Basel 3, as compared to the Basel 1 – 2013 Rules, effectiveare subject to a transition period as described below. The new minimum capital ratio requirements and related buffers will be phased in from January 1, 2015.2014 through January 1, 2019. For more information on the Standardized approach,SLR, see Capital Management – Other Regulatory Capital Matters on page 69.64.
UnderAs an advanced approaches bank, under Basel 3, we are required to complete a qualification period (parallel run) to demonstrate compliance with the final Basel 3 rules to the satisfaction of U.S. banking regulators. Upon notification of approval by U.S. banking regulators to exit our parallel run, we will be required to calculate regulatory capital ratios and risk-weighted assets under both the Standardized approach and upon notification of approval by U.S. banking regulators anytime on or after January 1, 2014, the Advanced approach. For 2014, the Standardized approach uses risk-weighted assets as measured under the Basel 1 – 2013 Rules and Basel 3 capital in the determination of the Basel 3 Standardized approach capital ratios.approaches. The approach that yields the lower ratio is to be used to assess capital adequacy including under the Prompt Corrective ActionPCA framework. Prior to receipt of notification of approval, we are required to assess our capital adequacy under the Standardized approach only.
Effective January 1, 2015, the PCA framework was amended to reflect the new capital requirements under Basel 3. The Prompt Corrective ActionPCA framework establishes categories of capitalization, including “well
capitalized,” based on regulatory ratio requirements. U.S. banking regulators are required to take certain mandatory actions depending on the category of capitalization, with no mandatory actions required for “well-
“well capitalized” banking entities. While we continue to evaluate the impact of both the Standardized and Advanced approaches, we generally expect that initially the Standardized approach will yield lower ratios.
In November 2011, the Basel Committee on Banking Supervision (Basel Committee) published a methodology to identify global systematically important banks (G-SIBs) and impose an additional loss absorbency requirement through the introduction of a buffer of up to 3.5 percent for systemically important financial institutions (SIFIs). The assessment methodology relies on an indicator-based measurement approach to determine a score relative to the global banking industry. The chosen indicators are size, complexity, cross-jurisdictional activity, interconnectedness and substitutability/financial institution infrastructure. Institutions with the highest scores are designated as G-SIBs and are assigned to one of four loss absorbency buckets from one percent to 2.5 percent, in 0.5 percent increments based on each institution’s relative score and supervisory judgment. The fifth loss absorbency bucket of 3.5 percent is currently empty and serves to discourage banks from becoming more systemically important.
In July 2013, the Basel Committee updated the November 2011 methodology to recalibrate the substitutability/financial institution infrastructure indicator by introducing a cap on the weighting of that component, and require the annual publication by the Financial Stability Board (FSB) of key information necessary to permit each G-SIB to calculate its score and observe its position within the buckets and relative to the industry total for each indicator. Every three years, beginning onorganizations. Effective January 1, 2016, the Basel Committee will reconsider and recalibrate the bucket thresholds. The Basel Committee and FSB expect banks to change their behavior in response to the incentives of the G-SIB framework, as well as other aspects of Basel 3 and jurisdiction-specific regulations.
The SIFI buffer requirement will begin to phase in effective January 2016, with full implementation in January 2019. Data from 2013, measured as of December 31, 2013, will be used to determine the SIFI buffer that will be effective for us in 2016.
As of December 31, 2013, we estimate our SIFI buffer would be 1.5 percent, based on the publication of the key information used2015, Common equity tier 1 capital is included in the SIFI methodology by the Basel Committee in November 2013, and considering the FSB’s report, “Updatemeasurement of group of global systemically important banks.“well capitalized.” Our SIFI buffer could change each year based on our actions and those of our peers, as the score used to determine each G-SIB’s SIFI buffer is based on the industry total. If our score were to increase, we could be subject to a higher SIFI buffer requirement. U.S. banking regulators have not yet issued proposed or final rules related to the SIFI buffer or disclosure requirements.
Regulatory Capital TransitionsComposition – Transition
Important differences in determining the composition of regulatory capital between the Basel 1 – 2013 Rules and Basel 3 include changes in capital deductions related to our MSRs, deferred tax assets and defined benefit pension assets, and the inclusion of unrealized gains and losses on AFS debt and certain marketable equity securities recorded in accumulated OCI, each of whichOCI. These changes will be impacted by, among other things, future changes in interest rates, overall earnings performance or otherand corporate actions.
Changes to the composition of regulatory capital under Basel 3, such as recognizingcompared to the impact of unrealized gains or losses on AFS debt securities in TierBasel 1 common capital,– 2013 Rules, are subject to a transition period where the impact is recognized in 20 percent annual increments. These regulatory capital adjustmentsincrements, and deductions will be fully implemented in 2018. The phase-in period for the new minimum capital ratio requirements and related buffers
under Basel 3 is fromrecognized as of January 1, 2014 through December 31, 2018. When presented on a fully phased-in basis, capital, risk-weighted assets and the capital ratios assume all regulatory capital adjustments and deductions are fully recognized.
Table 1713 summarizes how certain regulatory capital deductions and adjustments have been or will be transitioned from 2014 through 2018 for TierCommon equity tier 1 common and Tier 1 capital.
|
| | | | | | | | | | |
| | | | | | | | | | | |
| Table 17 | Summary of Certain Basel 3 Regulatory Capital Transition Provisions | | | | | | |
| | | | | | | | | | | |
| Beginning on January 1 of each year | 2014 | | 2015 | | 2016 | | 2017 | | 2018 |
| Tier 1 common capital | | | | | | | | | |
| Percent of total amount deducted from Tier 1 common capital includes: | 20% | | 40% | | 60% | | 80% | | 100% |
| Deferred tax assets arising from net operating loss and tax credit carryforwards; intangibles, other than mortgage servicing rights and goodwill; defined benefit pension fund net assets; net gains (losses) related to changes in own credit risk on liabilities, including derivatives, measured at fair value; direct and indirect investments in own Tier 1 common capital instruments; certain amounts exceeding the threshold by 10 percent individually and 15 percent in aggregate |
Percent of total amount used to adjust Tier 1 common capital includes (1): | 80% | | 60% | | 40% | | 20% | | 0% |
| Net unrealized gains (losses) on AFS debt and certain marketable equity securities recorded in accumulated OCI; employee benefit plan adjustments recorded in accumulated OCI |
| Tier 1 capital | | | | | | | | | |
| Percent of total amount deducted from Tier 1 capital includes: | 80% | | 60% | | 40% | | 20% | | 0% |
| Deferred tax assets arising from net operating loss and tax credit carryforwards; defined benefit pension fund net assets; net gains (losses) related to changes in own credit risk on liabilities, including derivatives, measured at fair value |
|
| | | | | | | | | | |
| | | | | | | | | | | |
| Table 13 | Summary of Certain Basel 3 Regulatory Capital Transition Provisions | | | | | | |
| | | | | | | | | | | |
| Beginning on January 1 of each year | 2014 | | 2015 | | 2016 | | 2017 | | 2018 |
| Common equity tier 1 capital | | | | | | | | | |
| Percent of total amount deducted from Common equity tier 1 capital includes: | 20% | | 40% | | 60% | | 80% | | 100% |
| Deferred tax assets arising from net operating loss and tax credit carryforwards; intangibles, other than mortgage servicing rights and goodwill; defined benefit pension fund net assets; net unrealized cumulative gains (losses) related to changes in own credit risk on liabilities, including derivatives, measured at fair value; direct and indirect investments in own Common equity tier 1 capital instruments; certain amounts exceeding the threshold by 10 percent individually and 15 percent in aggregate |
Percent of total amount used to adjust Common equity tier 1 capital includes (1): | 80% | | 60% | | 40% | | 20% | | 0% |
| Net unrealized gains (losses) on AFS debt and certain marketable equity securities recorded in accumulated OCI; employee benefit plan adjustments recorded in accumulated OCI |
| Tier 1 capital | | | | | | | | | |
| Percent of total amount deducted from Tier 1 capital includes: | 80% | | 60% | | 40% | | 20% | | 0% |
| Deferred tax assets arising from net operating loss and tax credit carryforwards; defined benefit pension fund net assets; net unrealized cumulative gains (losses) related to changes in own credit risk on liabilities, including derivatives, measured at fair value |
| |
(1) | Represents the phase-out percentage of the exclusion by year (e.g., 20 percent of net unrealized gains (losses) on AFS debt and certain marketable equity securities recorded in accumulated OCI will be included in 2014). |
In addition,Additionally, Basel 3 revised the regulatory capital treatment for Trust Securities, requiring them to be partially transitioned from Tier 1 capital into Tier 2 capital in 2014 and 2015, until fully excluded from Tier 1 capital in 2016, and partially transitioned and excluded from Tier 2 capital beginning in 2016. The exclusion from Tier 2 capital starts at 40 percent on January 1, 2016 increasing 10 percent each year untilwith the full amount is excluded from Tier 2 capital beginning on January 1,in 2022. As of December 31, 20132014, our qualifying Trust Securities were $5.8$2.9 billion (approximately 4523 bps of Tier 1 capital) and will no longer qualify asthe Tier 1 capital or Tier 2 capital beginning in 2016, subject to the transition provisions previously described.ratio).
Standardized Approach
TheUnder the Basel 3 Standardized approach, measures risk-weighted assets primarily for market risk and credit risk exposures. Exposuresexposures subject to market risk as defined under the rules, are measured on a basis generally consistent with how market risk-weighted assets were measured under the same basis as the Market Risk Final Rule, described previously.Basel 1 – 2013 Rules. Credit risk exposuresrisk-weighted assets are measured by applying fixed risk weights to theeach exposure, determined based on the characteristics of the exposure, such as type of obligor,
Organization for Economic Cooperation and Development (OECD) country risk code and maturity, among others. Under the Standardized approach, no distinction is made for variations in credit quality for corporate exposures, and the economic benefit of collateral is restricted to a limited list of eligible securities and cash. Some key differences betweenWe estimate our Common equity tier 1 capital ratio under the Basel 3 Standardized approach, on a fully phased-in basis, would have been 10.0 percent at December 31, 2014. As of December 31, 2014, we estimate that our Basel 3 Standardized Common equity tier 1 capital would have been $141.2 billion and total risk-weighted assets would have been $1,415 billion, on a fully phased-in basis. For a reconciliation of Basel 3 Standardized – Transition to Basel 3 Standardized estimates on a fully phased-in basis for Common equity tier 1 capital and risk-weighted assets, see Table 16. Our estimates under the Basel 3 Standardized approach may be refined over time as a result of further rulemaking
or clarification by U.S. banking regulators or as our understanding and interpretation of the rules evolve. Actual results could differ from those estimates and assumptions.
Advanced Approaches
In addition to the exposures calculated under the Basel 3 Standardized approach, the Basel 3 Advanced approaches are that the Advanced approach includes a measureinclude measures of operational risk and arisks related to the credit valuation adjustment (CVA) capital charge in credit risk and reliesfor over-the-counter (OTC) derivative exposures. The Advanced approaches rely on internal analytical models to measure credit risk-weighted assets, as more fully described below. Under the Basel 3 Standardized approach, we estimate our Tier 1 common capital ratio, on a fully phased-in basis, to be just above nine percent at December 31, 2013.
Advanced Approach
Under the Basel 3 Advanced approach, risk-weighted assets are determined primarilyrisk weights for market risk, credit risk exposures and operational risk.allow the use of models to estimate the exposure at default (EAD) for certain exposure types. Market risk capital measurements are consistent with the Standardized approach, except for securitization exposures, where the Supervisory Formula Approach is also permitted, and certain differences arising from the inclusion of the CVA capital charge in the credit risk capital measurement.permitted. Credit risk exposures are measured using advanced internal ratings-based models to determine the applicable risk weight by estimating the probability of default, loss-given default (LGD) and, in certain instances, exposure at default (EAD).EAD. The internal analytical models primarily rely on internal historical default and loss experience. Operational risk is measured using advanced internal analytical models which rely on both internal and external operational loss experience and data. The calculations under Basel 3 require management to make estimates, assumptions and interpretations, including with respect to the probability of future events based on historical experience. Actual results could differ from those estimates and assumptions.
The Basel 3 Advanced approach requiresapproaches require approval by the U.S. regulatory agenciesbanking regulators of our internal analytical models used to
calculate risk-weighted assets. If these models are not approved, it would likely lead to an increase inWe estimate our risk-weighted assets, which in some cases could be significant.
Prior to calculating and assessingCommon equity tier 1 capital adequacy and reporting regulatory capital ratios using Basel 3 Advanced approach risk-weighted assets, we must receive notification of approval to do so from the U.S banking regulators. Underratio under the Basel 3 Advanced approach, we estimated our Tier 1 common capital ratio,approaches, on a fully phased-in basis, to be 9.96would have been 9.6 percent at December 31, 20132014. As of December 31, 20132014, we estimatedestimate that our TierBasel 3 Advanced Common equity tier 1 common capital would be $132.3have been $141.2 billion and total risk-weighted assets would be $1,329have been $1,465 billion,, on a fully phased-in basis. This assumesThese estimates assume approval by U.S. banking regulators of our internal analytical models, but doesand do not include the benefit of the removal of the surcharge applicable to the Comprehensive Risk Measure (CRM).CRM. Our estimates under the Basel 3 Advanced approaches may be refined over time as a result of further rulemaking or clarification by U.S. banking regulators or as our understanding and interpretation of the rules evolve. We are currently working with the U.S. banking regulators to obtain approval of certain internal analytical models including the wholesale (e.g., commercial) and other credit models in order to exit parallel run. The calculationsU.S. banking regulators have indicated that they will require modifications to these models which would likely result in a material increase in our risk-weighted assets resulting in a decrease in our capital ratios.
Capital Composition and Ratios
Table 14 presents Bank of America Corporation’s capital ratios and related information in accordance with Basel 3 Standardized – Transition as measured at December 31, 2014 and the Basel 1 – 2013 Rules at December 31, 2013.
|
| | | | | | | | | | | | | | |
| | | | | | | | | |
| Table 14 | Bank of America Corporation Regulatory Capital | | |
| | | | | | | | | |
| | | December 31 |
| | 2014 | | 2013 |
| | Basel 3 Transition | | Basel 1 |
| (Dollars in billions) | Ratio | | Minimum
Required (1) | | Ratio | | Minimum
Required (1) |
Common equity tier 1 capital ratio (2, 3) | 12.3 | % | | 4.0 | % | | n/a |
| | n/a |
|
| Tier 1 common capital ratio | n/a |
| | n/a |
| | 10.9 | % | | n/a |
|
| Tier 1 capital ratio | 13.4 |
| | 6.0 |
| | 12.2 |
| | 6.0 | % |
| Total capital ratio | 16.5 |
| | 10.0 |
| | 15.1 |
| | 10.0 |
|
| Tier 1 leverage ratio | 8.2 |
| | 5.0 |
| | 7.7 |
| | 5.0 |
|
Risk-weighted assets (3) | $ | 1,262 |
| | n/a |
| | $ | 1,298 |
| | n/a |
|
Adjusted quarterly average total assets (4) | 2,060 |
| | n/a |
| | 2,052 |
| | n/a |
|
| |
(1) | Percent required to meet guidelines to be considered “well capitalized” under the Prompt Corrective Action framework, except for Common equity tier 1 capital which reflects capital adequacy minimum requirements as an advanced approaches bank under Basel 3 during a transition period in 2014. |
| |
(2) | When presented on a fully phased-in basis, beginning January 1, 2019, the minimum Basel 3 Common equity tier 1 capital ratio requirement for the Corporation is expected to significantly increase and will be comprised of the minimum ratio of the then-applicable 4.5 percent, plus a capital conservation buffer and the GSIB buffer. |
| |
(3) | On a pro-forma basis, under Basel 3 Standardized – Transition, the December 31, 2013 Common equity tier 1 capital ratio would have been 11.6 percent and risk-weighted assets would have been $1,316 billion. |
| |
(4) | Reflects adjusted average total assets for the three months ended December 31, 2014 and 2013. |
n/a = not applicable
Common equity tier 1 capital under Basel 3 require managementStandardized – Transition was $155.4 billion at December 31, 2014, an increase of $13.8 billion from Tier 1 common capital under the Basel 1 – 2013 Rules at December 31, 2013. The increase was largely attributable to make estimates, assumptionsthe impact of certain transition provisions under Basel 3 Standardized – Transition, particularly in regard to deferred tax assets and interpre-tations, includingearnings. For more information on Basel 3 transition provisions, see Table 13. During 2014, Total capital increased
$12.1 billion primarily driven by the probabilityincrease in Common equity tier 1 capital, partially offset by the impact of future events based on historical experience. Realized results could differ from those estimatescertain transition provisions under Basel 3 Standardized – Transition, particularly in regard to long-term debt that qualifies as Tier 2 capital. The Tier 1 leverage ratio increased 52 bps during 2014 primarily driven by an increase in Tier 1 capital. For additional information, see Tables 14 and assumptions.15.
At December 31, 2014, an increase or decrease in our Common equity tier 1, Tier 1 or Total capital ratios by one bp would require a change of $126 million in Common equity tier 1, Tier 1 or Total capital. We could also increase our Common equity tier 1, Tier 1 or Total capital ratios by one bp on such date by a reduction in risk-weighted assets of $1.0 billion, $941 million and $762 million, respectively. An increase in our Tier 1 leverage ratio by one bp on such date would require $206 million of additional Tier 1 capital or a reduction of $2.5 billion in adjusted average assets.
Risk-weighted assets decreased $36 billion during 2014 to $1,262 billion primarily due to decreases in market risk, and residential mortgage and consumer credit card balances, partially offset by the impact of certain transition provisions under Basel 3 Standardized – Transition, and an increase in commercial loans.
Table 15 presents the capital composition as measured under Basel 3 Standardized – Transition at December 31, 2014 and the Basel 1 – 2013 Rules at December 31, 2013.
|
| | | | | | | | |
| | | | | |
| Table 15 | Capital Composition | | | |
| | | | | |
| | | December 31 |
| | 2014 | | 2013 |
| (Dollars in millions) | Basel 3 Transition | | Basel 1 |
| Total common shareholders’ equity | $ | 224,162 |
| | $ | 219,333 |
|
| Goodwill | (69,234 | ) | | (69,844 | ) |
| Intangibles, other than mortgage servicing rights and goodwill | (639 | ) | | — |
|
| Nonqualifying intangible assets (includes core deposit intangibles, affinity relationships, customer relationships and other intangibles) | — |
| | (4,263 | ) |
| Net unrealized gains (losses) on AFS debt securities and net losses on derivatives recorded in accumulated OCI, net-of-tax | 573 |
| | 5,538 |
|
| Unamortized net periodic benefit costs recorded in accumulated OCI, net-of-tax | 2,680 |
| | 2,407 |
|
DVA related to liabilities and derivatives (1) | 231 |
| | 2,188 |
|
Deferred tax assets arising from net operating loss and tax credit carryforwards (2) | (2,226 | ) | | (15,391 | ) |
| Other | (186 | ) | | 1,554 |
|
Common equity tier 1 capital (3) | 155,361 |
| | 141,522 |
|
| Qualifying preferred stock, net of issuance cost | 19,308 |
| | 10,435 |
|
| Deferred tax assets arising from net operating loss and tax credit carryforwards under transition | (8,905 | ) | | — |
|
| DVA related to liabilities and derivatives under transition | 925 |
| | — |
|
| Defined benefit pension fund assets | (599 | ) | | — |
|
| Trust preferred securities | 2,893 |
| | 5,785 |
|
| Other | (10 | ) | | — |
|
| Total Tier 1 capital | 168,973 |
| | 157,742 |
|
| Long-term debt qualifying as Tier 2 capital | 17,953 |
| | 21,175 |
|
| Nonqualifying trust preferred securities subject to phase out from Tier 2 capital | 3,881 |
| | — |
|
| Allowance for loan and lease losses | 14,419 |
| | 17,428 |
|
| Reserve for unfunded lending commitments | 528 |
| | 484 |
|
| Allowance for loan and lease losses exceeding 1.25 percent of risk-weighted assets | (313 | ) | | (1,637 | ) |
| Other | 3,229 |
| | 1,375 |
|
| Total capital | $ | 208,670 |
| | $ | 196,567 |
|
| |
(1) | Represents loss on structured liabilities and derivatives, net-of-tax, that is excluded from Common equity tier 1, Tier 1 and Total capital for regulatory capital purposes. |
| |
(2) | December 31, 2014 amount represents phase-in portion under Basel 3 Standardized – Transition. The December 31, 2013 amount represents the full Basel 1 deferred tax asset disallowance. |
| |
(3) | Tier 1 common capital under the Basel 1 – 2013 Rules at December 31, 2013. |
|
| | |
| | | Bank of America 20132014 6962 |
Table 1816 presents a reconciliationreconciliations of our TierCommon equity tier 1 common capital and risk-weighted assets in accordance with the Basel 1 – 2013 Rules to ourand Basel 3 Standardized – Transition to the Basel 3 Standardized approach fully phased-in estimates at December 31, 2013and Basel 1 to Basel 3 Advanced approaches fully phased-in estimates at December 31, 2012. Our estimates under the Basel 3 Advanced approach may be refined over time as a result of further rulemaking
or clarification by U.S. banking regulators or as our understanding2014 and interpretation of the rules evolve.2013. Basel 3 regulatory capital metricsratios on a fully phased-in basis are considered non-GAAP financial measures until the end of the transition period on January 1, 20142019 when they are fully adopted and required by U.S. banking regulators.
|
| | | | | | | | |
| | | | | |
| Table 18 | Basel 1 to Basel 3 (fully phased-in) Reconciliation (1) | | | |
| | | | | |
| | | December 31 |
| (Dollars in millions) | 2013 | | 2012 |
| Regulatory capital – Basel 1 to Basel 3 (fully phased-in) | | | |
| Basel 1 Tier 1 capital | $ | 161,456 |
| | $ | 155,461 |
|
| Deduction of qualifying preferred stock and trust preferred securities | (16,221 | ) | | (22,058 | ) |
| Basel 1 Tier 1 common capital | 145,235 |
| | 133,403 |
|
| Deduction of defined benefit pension assets | (829 | ) | | (737 | ) |
| Deferred tax assets and threshold deductions (deferred tax asset temporary differences, MSRs and significant investments) | (4,803 | ) | | (3,020 | ) |
| Net unrealized gains (losses) in accumulated OCI on AFS debt and certain marketable equity securities, and employee benefit plans | (5,668 | ) | | 449 |
|
| Other deductions, net | (1,620 | ) | | (1,469 | ) |
| Basel 3 Advanced approach (fully phased-in) Tier 1 common capital | $ | 132,315 |
| | $ | 128,626 |
|
| | | | |
| Risk-weighted assets – Basel 1 to Basel 3 (fully phased-in) | | | |
| Basel 1 risk-weighted assets | $ | 1,297,534 |
| | $ | 1,205,976 |
|
| Credit and other risk-weighted assets | 31,510 |
| | 103,085 |
|
Increase due to Market Risk Final Rule (2) | — |
| | 81,811 |
|
| Basel 3 Advanced approach (fully phased-in) risk-weighted assets | $ | 1,329,044 |
| | $ | 1,390,872 |
|
| | | | |
| Tier 1 common capital ratios | | | |
| Basel 1 | 11.19 | % | | 11.06 | % |
| Basel 3 Advanced approach (fully phased-in) | 9.96 |
| | 9.25 |
|
|
| | | | | | | | |
| | | | | |
| Table 16 | Regulatory Capital Reconciliations (1, 2) | | | |
| | | | |
| | | | December 31
2013 |
| (Dollars in millions) | | | Basel 1 |
| Regulatory capital – Basel 1 to Basel 3 (fully phased-in) | | | |
| Basel 1 Tier 1 capital | | | $ | 157,742 |
|
| Deduction of qualifying preferred stock and trust preferred securities | | | (16,220 | ) |
| Basel 1 Tier 1 common capital | | | 141,522 |
|
| Deduction of defined benefit pension assets | | | (829 | ) |
| Deferred tax assets and threshold deductions (deferred tax asset temporary differences, MSRs and significant investments) | | | (5,459 | ) |
| Net unrealized losses in accumulated OCI on AFS debt and certain marketable equity securities, and employee benefit plans | | | (5,664 | ) |
| Other deductions, net | | | (1,624 | ) |
| Basel 3 Common equity tier 1 capital (fully phased-in) | | | $ | 127,946 |
|
| | | | |
| | December 31
2014 | | |
| | Basel 3 Transition | | |
| Regulatory capital – Basel 3 transition to fully phased-in | | | |
| Common equity tier 1 capital (transition) | $ | 155,361 |
| | |
| Deferred tax assets arising from net operating loss and tax credit carryforwards phased in during transition | (8,905 | ) | | |
| DVA related to liabilities and derivatives phased in during transition | 925 |
| | |
| Defined benefit pension fund assets phased in during transition | (599 | ) | | |
| Other adjustments and deductions phased in during transition | (5,565 | ) | | |
| Common equity tier 1 capital (fully phased-in) | $ | 141,217 |
| | |
| | | | |
| | December 31 |
| | 2014 | | 2013 |
| | Basel 3 Transition | | Basel 1 |
| Risk-weighted assets – As reported to Basel 3 (fully phased-in) | | | |
| As reported risk-weighted assets | $ | 1,261,544 |
| | $ | 1,297,593 |
|
| Changes in risk-weighted assets from reported to fully phased-in | 153,722 |
| | 162,731 |
|
| Basel 3 Standardized approach risk-weighted assets (fully phased-in) | 1,415,266 |
| | 1,460,324 |
|
| Changes in risk-weighted assets for advanced models | 50,213 |
| | (133,027 | ) |
| Basel 3 Advanced approaches risk-weighted assets (fully phased-in) | $ | 1,465,479 |
| | $ | 1,327,297 |
|
| | | | |
| Regulatory capital ratios | | | |
| Basel 1 Tier 1 common | n/a |
| | 10.9 | % |
| Basel 3 Standardized approach Common equity tier 1 (transition) | 12.3 | % | | n/a |
|
| Basel 3 Standardized approach Common equity tier 1 (fully phased-in) | 10.0 |
| | 8.8 |
|
Basel 3 Advanced approaches Common equity tier 1 (fully phased-in) (3) | 9.6 |
| | 9.6 |
|
| |
(1) | IncludesFully phased-in Basel 3 estimates are based on our current understanding of the Market Risk Final Rule at December 31, 2013.Standardized and Advanced approaches under the Basel 1 did3 rules. The Advanced approaches estimates assume approval by U.S. banking regulators of our internal analytical models, and do not include the Market Risk Final Rule at December 31, 2012.
benefit of the removal of the surcharge applicable to the CRM. |
| |
(2) | On January 1, 2014, we became subject to the Basel 3 rules, which include certain transition provisions primarily related to regulatory deductions and adjustments impacting Common equity tier 1 capital and Tier 1 capital. We reported under the Basel 1 – 2013 Rules at December 31, 2013. |
| |
Excludes(3)
| We are currently working with the benefitU.S. banking regulators to obtain approval of certain hedges at December 31, 2012. Includinginternal analytical models including the wholesale (e.g., commercial) and other credit models in order to exit parallel run. The U.S. banking regulators have indicated that they will require modifications to these hedges, themodels which would likely result in a material increase due to the Market Risk Final Rule would have been $78.8 billion. For additional information, see Capital Management – Capital Composition and Ratios on page 66.in our risk-weighted assets resulting in a decrease in our capital ratios. |
n/a = not applicable
Bank of America, N.A. Regulatory Capital
Prior to October 1, 2014, we operated our banking activities primarily under two charters: BANA and, to a lesser extent, FIA.
On October 1, 2014, FIA was merged into BANA. Table 17 presents regulatory capital information for BANA at December 31, 2014 and 2013.
|
| | | | | | | | | | | | | | | | | | | | |
| | | | | | | | | | | | | |
| Table 17 | Bank of America, N.A. Regulatory Capital | | |
| | | | | | | | | | | | | |
| | | December 31 |
| | | 2014 | | 2013 |
| (Dollars in millions) | Ratio | | Amount | | Minimum
Required (1) | | Ratio | | Amount | | Minimum
Required (1) |
Common equity tier 1 capital (2) | 13.1 | % | | $ | 145,150 |
| | 4.0 | % | | n/a |
| | n/a |
| | n/a |
|
| Tier 1 capital | 13.1 |
| | 145,150 |
| | 6.0 |
| | 12.3 | % | | $ | 125,886 |
| | 6.0 | % |
| Total capital | 14.6 |
| | 161,623 |
| | 10.0 |
| | 13.8 |
| | 141,232 |
| | 10.0 |
|
| Tier 1 leverage | 9.6 |
| | 145,150 |
| | 5.0 |
| | 9.2 |
| | 125,886 |
| | 5.0 |
|
| |
(1) | Percent required to meet guidelines to be considered “well capitalized” under the Prompt Corrective Action framework, except for Common equity tier 1 capital which reflects capital adequacy minimum requirements as an advanced approaches bank under Basel 3 during a transition period in 2014. |
| |
(2) | When presented on a fully phased-in basis, beginning January 1, 2019, the minimum Basel 3 Common equity tier 1 capital ratio requirement for BANA is expected to significantly increase and will be comprised of the minimum ratio of the then-applicable 4.5 percent, plus a capital conservation buffer and the GSIB buffer. |
n/a = not applicable
BANA’s Tier 1 capital ratio under Basel 3 Standardized – Transition was 13.1 percent at December 31, 2014, an increase of 80 bps from December 31, 2013. The increase was largely attributable to the merger of FIA into BANA in 2014. The Total capital ratio increased 79 bps to 14.6 percent at December 31, 2014 compared to December 31, 2013. The Tier 1 leverage ratio increased 42 bps to 9.6 percent. The increase in the Total capital ratio was driven by the same factors as the Tier 1 capital ratio. The increase in the Tier 1 leverage ratio was driven by an increase in Tier 1 capital, partially offset by an increase in adjusted quarterly average total assets. Further, the merger with FIA positively impacted these ratios.
Other Regulatory Capital Matters
Supplementary Leverage Ratio
Basel 3 also will require us to calculatethe calculation of a supplementary leverage ratio (SLR). The SLR is determined by dividing Tier 1 capital, using quarter-end Basel 3 Tier 1 capital on a fully phased-in basis, by totalsupplementary leverage exposure for each month-end during a fiscal quarter, and then calculatingcalculated as the daily average of the sum of on-balance sheet as well as the simple average. Totalaverage of certain off-balance sheet exposures at the end of each month in the quarter. Supplementary leverage exposure is comprised of all on-balance sheet assets, plus a measure of certain off-balance sheet exposures, including among others,other items, lending commitments, letters of credit, OTC derivatives, repo-style transactions and margin loan commitments. The minimum supplementary leverage ratio requirement of three percent is notWe are required to disclose our SLR effective until January 1, 2018. We2015. Effective January 1, 2018, the Corporation will be required to disclose our supplementary leverage ratio effective January 1, 2015.
In July 2013, U.S. banking regulators issued a notice of proposed rulemaking (NPR) to modify the supplementary leverage ratio minimum requirements under Basel 3 effective in 2018. This proposal would only be applicable to BHCs with more than $700 billion in total assets or more than $10 trillion in total assets under custody. If adopted, it would require the Corporation to maintain a minimum supplementary leverage ratioSLR of three3.0 percent, plus a supplementary leverage buffer of two2.0 percent, for a total SLR of five5.0 percent. If the Corporation’s supplementary leverage buffer is not greater than or equal to two2.0 percent, then the Corporation wouldwill be subject to mandatory limits on its ability to make distributions of capital to shareholders, whether through dividends, stock repurchases or otherwise. In addition, the insured depository institutions of such BHCs, which for the Corporation would includeis primarily BANA, and FIA, wouldwill be required to maintain a minimum six6.0 percent leverage ratioSLR to be considered “well capitalized.”
On September 3, 2014, U.S. banking regulators adopted a final rule to revise the definition and scope of the denominator of the SLR. The final rule prescribes the calculation of total leverage exposure, the frequency of calculation and required disclosures. The definition of total leverage exposure is revised to include the
effective notional principal amount of credit derivatives and other similar instruments through which credit protection is sold. Calculations of the components of total leverage exposure for derivative and repo-style transactions are modified. The credit conversion factors (CCF) applied to certain off-balance sheet exposures are conformed to the graduated CCF used by the Standardized approach, subject to the minimum 10 percent credit conversion factor.
As of December 31, 2013,2014, we estimate the Corporation’s supplementary leverage ratio to be in excess of fiveSLR would have been approximately 5.9 percent, based
on these proposed requirements, and our primary bank subsidiaries, BANA and FIA, to be in excess ofwhich exceeds the six5.0 percent threshold that represents the minimum proposed requirement. The proposal is not yet final and, when finalized, could have provisions significantly different from those currently proposed. The provisions of the NPR onplus the supplementary leverage ratio, if finalized as currently proposed, could have an impact on certainbuffer for BHCs. The estimated SLR for BANA was approximately 7.0 percent, which exceeds the 6.0 percent “well capitalized” level for insured depository institutions of our businesses. We continue to evaluate the impact of the proposed NPR on us.BHCs.
On January 12, 2014,Global Systemically Important Bank Surcharge
In November 2011, the Basel Committee issued final guidance introducing changeson Banking Supervision (Basel Committee) published a methodology to identify global systemically important banks (GSIBs) and impose an additional loss absorbency requirement through the introduction of a surcharge of up to 3.5 percent, which must be satisfied with Common equity tier 1 capital. The assessment methodology relies on an indicator-based measurement approach to determine a score relative to the method of calculating total leverage exposure under the international Basel 3 framework.global banking industry. The total leverage exposure was revised to measure derivatives on a gross basis with cash variation margin reducing the exposure if certain conditionschosen indicators are met, include off-balance sheet commitments measured using the notional amount multiplied by conversion factors between 10 percentsize, complexity, cross-jurisdictional activity, inter-connectedness and 100 percent consistentsubstitutability/financial institution infrastructure. Institutions with the general risk-based capital ruleshighest scores are designated as GSIBs and a changeare assigned to measure written credit derivatives using a notional-based approach capped atone of four loss absorbency buckets from 1.0 percent to 2.5 percent, in 0.5 percent increments based on each institution’s relative score and supervisory judgment. The fifth loss absorbency bucket of 3.5 percent is currently empty and serves to discourage banks from becoming more systemically important. Also in November 2011, the maximum loss with limited netting permitted. U.S. banking regulators may considerFinancial Stability Board (FSB) published an integrated set of policy measures and identified an initial group of GSIBs, which included the Corporation.
In July 2013, the Basel Committee’s final guidance in connection withCommittee updated the July 2013 NPR.
Other Regulatory Matters
On February 18, 2014,November 2011 methodology to recalibrate the Federal Reserve approvedsubstitutability/financial institution infrastructure indicator by introducing a final rule implementing certain enhanced supervisorycap on the weighting of that component, and prudential requirements established underrequiring the Financial Reform Act. The final rule formalizes risk management requirements primarily relatedannual publication by the FSB of key information necessary to governancepermit each GSIB to calculate its score and liquidity risk managementobserve its position within the buckets and reiteratesrelative to the provisions of previously issued final rules related to risk-basedindustry total for each indicator. Every three years,
|
| | |
| | 70Bank of America 2013201464
| | |
beginning on January 1, 2016, the Basel Committee will reconsider and leverage capitalrecalibrate the bucket thresholds. The Basel Committee and stress test requirements. Also, a debt-to-equity limit may be enacted for an individual BHC if determinedFSB expect banks to pose a grave threatchange their behavior in response to the financial stabilityincentives of the U.S., at the discretionGSIB framework, as well as other aspects of the Financial Stability Oversight Council (FSOC) or the Federal Reserve on behalf of the FSOC.
For more information regarding Basel 3 and otherjurisdiction-specific regulations.
In November 2014, the Basel Committee published an updated list of GSIBs and their respective loss absorbency buckets. As of December 31, 2014, we estimated our surcharge at 1.5 percent based on the Basel 3 information and considering the FSB’s report, “2014 update of list of global systemically important banks (GSIBs).” Our surcharge could change each year based on our actions and those of our peers, as the scoring methods utilize data from the Corporation in combination with the industry. If our score were to increase, we could be subject to a higher GSIB surcharge.
In December 2014, a U.S. banking regulator proposed regulatory capital changes, see Note 16 – Regulatory Requirements and Restrictionsa regulation that would implement GSIB surcharge requirements for the largest U.S. BHCs. Under the proposal, assignment to loss absorbency buckets would be determined by the higher score as calculated according to two methods. Method 1 is substantially similar to the Consolidated Financial Statements.Basel Committee’s methodology, whereas Method 2 replaces the substitutability/financial institution infrastructure indicator with a measure of short-term wholesale funding and then multiplies the overall score by two. The Federal Reserve estimates that Method 2 will yield a higher surcharge, currently ranging from 1.0 percent to 4.5 percent.
BankUnder the proposed U.S. rules, the GSIB surcharge requirement will begin to phase in effective January 2016, with full implementation in January 2019. Data from the original five indicators, measured as of America, N.A. and FIA Card Services, N.A. Regulatory Capital
Table 19 presents regulatory capital information for BANA and FIA at December 31, 2013 and 2012.
|
| | | | | | | | | | | | | | |
| | | | | | | | | |
| Table 19 | Bank of America, N.A. and FIA Card Services, N.A. Regulatory Capital (1) |
| | | | | | | | | |
| | | December 31 |
| | | 2013 | | 2012 |
| (Dollars in millions) | Ratio | | Amount | | Ratio | | Amount |
| Tier 1 capital | | |
| | |
| | |
| | |
|
| Bank of America, N.A. | 12.34 | % | | $ | 125,886 |
| | 12.44 | % | | $ | 118,431 |
|
| FIA Card Services, N.A. | 16.83 |
| | 20,135 |
| | 17.34 |
| | 22,061 |
|
| Total capital | | |
| | |
| | |
| | |
|
| Bank of America, N.A. | 13.84 |
| | 141,232 |
| | 14.76 |
| | 140,434 |
|
| FIA Card Services, N.A. | 18.12 |
| | 21,672 |
| | 18.64 |
| | 23,707 |
|
| Tier 1 leverage | |
| | |
| | |
| | |
|
| Bank of America, N.A. | 9.21 |
| | 125,886 |
| | 8.59 |
| | 118,431 |
|
| FIA Card Services, N.A. | 12.91 |
| | 20,135 |
| | 13.67 |
| | 22,061 |
|
| |
(1)
| BANA regulatory capital information included the Basel 1 – 2013 Rules at December 31, 2013. At December 31, 2012, BANA regulatory capital information did not include the Basel 1 – 2013 Rules. FIA is not impacted by the Basel 1 – 2013 Rules.
|
BANA’s Tier 1 capital ratio decreased10 bps to 12.34 percent and2014, combined with short-term wholesale funding data covering the Total capital ratio decreased92 bps to 13.84 percent at December 31, 2013 compared to December 31, 2012. The Tier 1 leverage ratio increased62 bps to 9.21 percent at December 31, 2013 compared to December 31, 2012. The decrease in the Tier 1 capital ratio was driven by an increase in risk-weighted assetsthird quarter of $68.5 billion compared to the prior year, dividends and returns of capital to the Corporation of $8.5 billion and $2.2 billion during 2013, partially offset by earnings eligible2015, is proposed to be includedused to determine the GSIB surcharge that will be effective for us in capital of $16.5 billion. The increase in risk-weighted assets was primarily due to the impact of implementing the Basel 1 – 2013 Rules and an increase in loans. The decrease in the Total capital ratio was driven by the same factors as the Tier 1 capital ratio as well as a $7.0 billion decrease in qualifying subordinated debt during 2013. The increase in the Tier 1 leverage ratio was driven by an increase in Tier 1 capital and a decrease in adjusted quarterly average total assets of $11.6 billion.2016.
FIA’s Tier 1 capital ratio decreased51 bps to 16.83 percent and the Total capital ratio decreased52 bps to 18.12 percent at December 31, 2013 compared to December 31, 2012. The Tier 1 leverage ratio decreased76 bps to 12.91 percent at December 31, 2013 compared to December 31, 2012. The decrease in the Tier 1 capital and Total capital ratios was driven by returns of capital of $6.5 billion to the Corporation during 2013, partially offset by earnings eligible to be included in capital of $4.3 billion and a decrease in risk-weighted assets of $7.6 billion primarily due to a decrease in loans. The decrease in the Tier 1 leverage ratio was driven by the decrease in Tier 1 capital, partially offset by a decrease in adjusted quarterly average total assets of
$5.3 billion. FIA was not impacted by the implementation of the Basel 1 – 2013 Rules.
Broker/DealerBroker-dealer Regulatory Capital and Securities Regulation
The Corporation’s principal U.S. broker/dealerbroker-dealer subsidiaries are Merrill Lynch, Pierce, Fenner & Smith (MLPF&S) and Merrill Lynch Professional Clearing Corp (MLPCC). MLPCC is a fully-guaranteed subsidiary of MLPF&S and provides clearing and settlement services. Both entities are subject to the net capital requirements of SEC Rule 15c3-1. Both entities are also registered as futures commission merchants and are subject to the Commodity Futures Trading Commission Regulation 1.17.
MLPF&S has elected to compute the minimum capital requirement in accordance with the Alternative Net Capital Requirement as permitted by SEC Rule 15c3-1. At December 31, 2013,2014, MLPF&S’s regulatory net capital as defined by Rule 15c3-1 was $10.0$9.7 billion and exceeded the minimum requirement of $951 million$1.3 billion by $9.0$8.4 billion. MLPCC’s net capital of $2.2$3.4 billion exceeded the minimum requirement of $366$508 million by $1.8$2.9 billion.
In accordance with the Alternative Net Capital Requirements, MLPF&S is required to maintain tentative net capital in excess of $1.0 billion, net capital in excess of $500 million and notify the SEC in the event its tentative net capital is less than $5.0 billion. At December 31, 2013,2014, MLPF&S had tentative net capital and net capital in excess of the minimum and notification requirements.
Merrill Lynch International (MLI), a U.K. investment firm, is regulated by the PRAPrudential Regulation Authority and the FCAFinancial Conduct Authority, and is subject to certain regulatory capital requirements. Following an increase in capital resources in advance of the implementation of Basel 3 in 2014, at At December 31, 2013,2014, MLI’s capital resources
were $28.2$32.3 billion andwhich exceeded the minimum requirement of $10.8 billion and had enough excess to cover any additional requirements as set by the regulators.$17.9 billion.
Common Stock Dividends
For a summary of our declared quarterly cash dividends on common stock during 20132014 and through February 25, 20142015, see Note 13 – Shareholders’ Equity to the Consolidated Financial Statements.
Liquidity Risk
Funding and Liquidity Risk Management
We define liquidity risk as the potential inability to meet our contractual and contingent financial obligations, on- or off-balance sheet, as they come due. Our primary liquidity objective is to provide adequate funding for our businesses throughout market cycles, including periods of financial stress. To achieve that objective, we analyze and monitor our liquidity risk, maintain excess liquidity and access diverse funding sources including our stable deposit base. We define excess liquidity as readily available assets, limited to cash and high-quality, liquid, unencumbered securities that we can use to meet our funding requirements as those obligations arise.
Global funding and primary liquidity risk management activities are centralized within Corporate Treasury. We believe that a centralized approach to funding and liquidity risk management enhances our ability to monitor liquidity requirements, maximizes access to funding sources, minimizes borrowing costs and facilitates timely responses to liquidity events.
The Enterprise Risk CommitteeBoard approves the Corporation’s liquidity policy and the ERC approves the contingency funding plan, including establishing liquidity risk tolerance levels. The ALMRCMRC monitors our liquidity position and reviews the impact of strategic decisions on our liquidity. ALMRCThe MRC is responsible for managingoverseeing liquidity risks and maintaining exposures within the established tolerance levels. ALMRC delegates additional oversight responsibilities to the CFORC, which reports to the ALMRC. The CFORCMRC reviews and monitors our liquidity position, cash flow forecasts, stress testing scenarios and results, and implements our liquidity limits and guidelines. For additional information, see Managing Risk – Board Oversight of Riskon page 63.55. Under this governance framework, we have developed certain funding and liquidity risk management practices which include: maintaining excess liquidity at the parent company and selected subsidiaries, including our bank subsidiaries and other regulated entities; determining what amounts of excess liquidity are appropriate for these entities based on analysis of debt maturities and other potential cash outflows, including those that we may experience during stressed market conditions; diversifying funding sources, considering our asset profile and legal entity structure; and performing contingency planning.
Global Excess Liquidity Sources and Other Unencumbered Assets
We maintain excess liquidity available to Bank of America Corporation, or the parent company and selected subsidiaries in the form of cash and high-quality, liquid, unencumbered securities. These assets, which we call our Global Excess Liquidity Sources, serve as our primary means of liquidity risk mitigation. Our cash is primarily on deposit with the Federal Reserve and, to a lesser extent, central banks outside of the U.S. We limit the composition of high-quality, liquid, unencumbered securities to U.S. government securities, U.S. agency securities, U.S. agency MBS and a select
group of non-U.S. government and supranational securities. We believe we can quickly obtain cash for these securities, even in stressed market conditions, through repurchase agreements or outright sales. We hold our Global Excess Liquidity Sources in legal entities that allow us to meet the liquidity requirements of our global businesses, and we consider the impact of potential regulatory, tax, legal and other restrictions that could limit the transferability of funds among entities. Our Global Excess Liquidity Sources metric is similarare substantially the same in composition to what qualifies as High Quality Liquid Assets in(HQLA) under the proposedfinal LCR rulemaking.rules. For more information on the proposed rulemaking,final rules, see Liquidity Risk – Basel 3 Liquidity Standards on page 7367.
Our Global Excess Liquidity Sources were $376439 billion and $372376 billion at December 31, 20132014 and 20122013, and were maintained as presented in Table 2018.
|
| | | | | | | | | | | |
| | | | | | |
| Table 20 | Global Excess Liquidity Sources | |
| | | | |
| | | December 31 | Average for Three Months Ended December 31 2013 |
| (Dollars in billions) | 2013 | | 2012 |
| Parent company | $ | 95 |
| | $ | 103 |
| $ | 92 |
|
| Bank subsidiaries | 249 |
| | 247 |
| 248 |
|
| Other regulated entities | 32 |
| | 22 |
| 30 |
|
| Total Global Excess Liquidity Sources | $ | 376 |
| | $ | 372 |
| $ | 370 |
|
|
| | | | | | | | | | | |
| | | | | | |
| Table 18 | Global Excess Liquidity Sources | |
| | | | |
| | | December 31 | Average for Three Months Ended December 31 2014 |
| (Dollars in billions) | 2014 | | 2013 |
| Parent company | $ | 98 |
| | $ | 95 |
| $ | 92 |
|
| Bank subsidiaries | 306 |
| | 249 |
| 314 |
|
| Other regulated entities | 35 |
| | 32 |
| 32 |
|
| Total Global Excess Liquidity Sources | $ | 439 |
| | $ | 376 |
| $ | 438 |
|
As shown in Table 2018, parent company Global Excess Liquidity Sources totaled $9598 billion and $10395 billion at December 31, 20132014 and 2012.2013. The decreaseincrease in parent company liquidity was primarily due to debt maturities and capital actions,bank subsidiary inflows, partially offset by capital returns from subsidiaries and debt issuances.payments in connection with litigation settlements. Typically, parent company excess liquidity is in the form of cash is deposited overnight with BANA.
Global Excess Liquidity Sources available to our bank subsidiaries totaled $249306 billion and $247249 billion at December 31, 20132014 and 2012.2013. The increase in bank subsidiaries’ liquidity remained relatively unchanged as deposit growth and an increase in short-term borrowings was largelyprimarily due to a shift from less liquid mortgage loans into more liquid securities, partially offset by loan growth, a decrease in the fair valuedividends and returns of debt securities and capital returns to the parent company. Global Excess Liquidity amounts are distinct fromSources at bank subsidiaries exclude the cash deposited by the parent company. Our bank subsidiaries can also generate incremental liquidity by pledging a range of other unencumbered loans and securities to certain FHLBsFederal Home Loan Banks (FHLBs) and the Federal Reserve Discount Window. The cash we could have obtained by borrowing against this pool of specifically-identified eligible assets was approximately $218$214 billion and $194$218 billion at December 31, 20132014 and 2012.2013. We have established operational procedures to enable us to borrow against these assets, including regularly monitoring our total pool of eligible loansloan and securities collateral. Eligibility is defined by guidelines outlined by the FHLBs and the Federal Reserve and is subject to change at their discretion. Due to regulatory restrictions, liquidity generated by the bank subsidiaries can onlygenerally be used only to fund obligations within the bank subsidiaries and can only be transferred to the parent company or non-banknonbank subsidiaries with prior regulatory approval.
Global Excess Liquidity Sources available to our other regulated entities, comprised primarily of broker-dealer subsidiaries, totaled$35 billion and $32 billion and $22 billionat December 31, 20132014 and 2012.2013. Our other regulated entities also held other unencumbered investment-grade securities and equities that we believe could be used to
generate additional liquidity. Liquidity held in an other regulated entity is primarily available to meet the obligations of that entity and transfers to the parent company or to any other subsidiary may be subject to prior regulatory approval due to regulatory restrictions and minimum requirements.
Table 2119 presents the composition of Global Excess Liquidity Sources at December 31, 20132014 and 2012.2013.
| | | | | | | | | | | |
| Table 21 | Global Excess Liquidity Sources Composition | |
| Table 19 | | Global Excess Liquidity Sources Composition |
| | | | | |
| | | December 31 | | December 31 |
| (Dollars in billions) | (Dollars in billions) | 2013 | | 2012 | (Dollars in billions) | 2014 | | 2013 |
| Cash on deposit | Cash on deposit | $ | 90 |
| | $ | 65 |
| Cash on deposit | $ | 97 |
| | $ | 90 |
|
| U.S. Treasuries | 20 |
| | 21 |
| |
| U.S. Treasury securities | | U.S. Treasury securities | 74 |
| | 20 |
|
| U.S. agency securities and mortgage-backed securities | U.S. agency securities and mortgage-backed securities | 245 |
| | 271 |
| U.S. agency securities and mortgage-backed securities | 252 |
| | 245 |
|
| Non-U.S. government and supranational securities | Non-U.S. government and supranational securities | 21 |
| | 15 |
| Non-U.S. government and supranational securities | 16 |
| | 21 |
|
| Total Global Excess Liquidity Sources | Total Global Excess Liquidity Sources | $ | 376 |
| | $ | 372 |
| Total Global Excess Liquidity Sources | $ | 439 |
| | $ | 376 |
|
Time to RequiredTime-to-required Funding and Stress Modeling
We use a variety of metrics to determine the appropriate amounts of excess liquidity to maintain at the parent company, and our bank subsidiaries and other regulated entities. One metric we use to evaluate the appropriate level of excess liquidity at the parent company is “Time to Required Funding.“time-to-required funding.” This debt coverage measure indicates the number of months that the parent company can continue to meet its unsecured contractual obligations as they come due using only its Global Excess Liquidity Sources without issuing any new debt or accessing any additional liquidity sources. We define unsecured contractual obligations for purposes of this
metric as maturities of senior or subordinated debt issued or guaranteed by Bank of America Corporation. These include certain unsecured debt instruments, primarily structured liabilities, which we may be required to settle for cash prior to maturity. Our Time to Required Fundingtime-to-required funding was 3839 months at December 31, 20132014, which is above the Corporation’s target minimum of 21 months.. For purposes of calculating Time to Required Funding,time-to-required funding, at December 31, 20132014, we have included in the amount of unsecured contractual obligations the $8.6$8.6 billion liability related to the BNY Mellon Settlement. The BNY Mellon Settlement is subject to final court approval and certain other conditions, and the timing of payment is not certain. For information on current developments related to the BNY Mellon Settlement see, Recent Events – BNY Mellon Settlement on page 25. The merger of Merrill Lynch & Co., Inc. into Bank of America Corporation on October 1, 2013 had no impact on the unsecured contractual obligations included in this metric.
We utilize liquidity stress models to assist us in determining the appropriate amounts of excess liquidity to maintain at the parent company, and our bank subsidiaries and other regulated entities. These models are risk sensitive and have become increasingly important in analyzing our potential contractual and contingent cash outflows beyond those outflows considered in the Time to Required Fundingtime-to-required funding analysis. We evaluate the liquidity requirements under a range of scenarios with varying levels of severity and time horizons. The scenarios we consider and utilize incorporate market-wide and Corporation-specific events, including potential credit rating downgrades for the parent company and our subsidiaries, and are based on historical experience, regulatory guidance, and both expected and unexpected future events.
The types of potential contractual and contingent cash outflows we consider in our scenarios may include, but are not limited to, upcoming contractual maturities of unsecured debt and reductions in new debt issuance; diminished access to secured financing markets; potential deposit withdrawals; increased draws on loan commitments, liquidity facilities and letters of credit, including Variable Rate Demand Notes;credit; additional collateral that counterparties could call if our credit ratings were downgraded; collateral and margin requirements arising from market value changes; and potential liquidity required to maintain
businesses and finance customer activities. Changes in certain market factors, including, but not limited to, credit rating downgrades, could negatively impact potential contractual and contingent outflows and the related financial instruments, and in some cases these impacts could be material to our financial results.
We consider all sources of funds that we could access during each stress scenario and focus particularly on matching available sources with corresponding liquidity requirements by legal entity. We also use the stress modeling results to manage our asset-liability profile and establish limits and guidelines on certain funding sources and businesses.
Basel 3 Liquidity Standards
The Basel Committee has issued two liquidity risk-related standards that are considered part of the Basel 3 liquidity standards: the LCRLiquidity Coverage Ratio (LCR) and the NSFR.Net Stable Funding Ratio (NSFR). The LCR is calculated as the amount of a financial institution’s unencumbered high-quality, liquid assetsHQLA relative to the estimated net cash outflows the institution could encounter underover a 30-day period of significant liquidity stress, expressed as a percentage. TheAs with other Basel Committee standards, the Basel Committee’s liquidity risk-related standards do not directly apply to U.S. financial institutions, currently, and would only apply once U.S. rules are finalizedbut require adoption by the U.S. banking regulators.regulators as described below.
On October 24, 2013,In 2014, the U.S. banking regulators jointly proposed regulations that would implementfinalized LCR requirements for the largest U.S. financial institutions on a consolidated basis and for their subsidiary depository institutions with total assets greater than $10 billion. Under the proposal,final rule, an initial minimum LCR of 80 percent would beis required in January 2015, and wouldwill increase thereafter increase in 10 percentage point increments annually through January 2017. These minimum requirements would beare applicable to the Corporation on a consolidated basis and atto our insured depository institutions, including BANA, FIA and Bankinstitutions. As of America California, N.A. We are evaluatingDecember 31, 2014, we estimate the proposal and the potential impactconsolidated Corporation to be in compliance with LCR on a fully phased-in basis. For more information on our businessesbalance sheet actions to reduce risk and we expectincrease liquidity related to meet or exceed the final LCR, requirement within the regulatory timelines.see Executive Summary – Balance Sheet Overview on page 27.
On January 12,In 2014, the Basel Committee issued a final standard for comment a revisedthe NSFR, the standard that is intended to reduce funding risk over a longer time horizon. The NSFR is designed to ensure an appropriate amount of stable funding, generally capital and liabilities maturing beyond one year, given the mix of assets and off-balance sheet items. The revised proposal would alignfinal standard aligns the NSFR to some of the 2013 revisions to the LCR and givegives more credit to a wider range of funding. The proposalfinal standard also includes adjustments to the stable funding required for certain types of assets, some of which reduce the stable funding requirement and some of which increase it. The Basel Committee expects to complete the NSFR recalibration in 2014 and expects the minimum standard to be in place by 2018. Assuming adoption by the U.S. banking regulators weare expected to propose a similar NSFR regulation in the near future. We expect to meet the final NSFR requirement within the regulatory timelines.timeline.
Diversified Funding Sources
We fund our assets primarily with a mix of deposits and secured and unsecured liabilities through a centralized, globally
coordinated funding strategy. We diversify our funding globally across products, programs, markets, currencies and investor groups.
The primary benefits expected fromof our centralized funding strategy include greater control, reduced funding costs, wider name recognition by investors and greater flexibility to meet the variable funding requirements of subsidiaries. Where regulations, time zone differences or other business considerations make parent company funding impractical, certain other subsidiaries may issue their own debt.
We fund a substantial portion of our lending activities through our deposits, which were $1.12 trillion and $1.11 trillionat both December 31, 20132014 and 2012.2013. Deposits are primarily generated by our CBB, GWIM and Global Banking segments. These deposits are diversified by clients, product type and geography, and the majority of our U.S. deposits are insured by the FDIC. We consider a substantial portion of our deposits to be a stable, low-cost and consistent source of funding. We believe this deposit funding is generally less sensitive to interest rate changes, market volatility or changes in our credit ratings than wholesale funding sources. Our lending activities may also be financed through secured borrowings, including credit card securitizations and securitizations with GSEs, the FHA and private-label investors, as well as FHLB loans. During 2014, $4.1 billion of new senior debt was issued to third-party investors from the credit card securitization trusts.
Our trading activities in other regulated entities are primarily funded on a secured basis through securities lending and repurchase agreements and these amounts will vary based on customer activity and market conditions. We believe funding these activities in the secured financing markets is more cost-efficient and less sensitive to changes in our credit ratings than unsecured financing. Repurchase agreements are generally short-term and often overnight. Disruptions in secured financing markets for financial institutions have occurred in prior market cycles which resulted in adverse changes in terms or significant reductions in the availability of such financing. We manage the liquidity risks arising from secured funding by sourcing funding globally from a diverse group of counterparties, providing a range of securities collateral and pursuing longer durations, when appropriate. For more information on secured financing agreements, see Note 10 – Federal Funds Sold or Purchased, Securities Financing Agreements and Short-term Borrowings to the Consolidated Financial Statements.
We issue the majority of our long-term unsecured debt at the parent company. During 2013, we issued $31.4 billion of long-term unsecured debt, including structured liabilities of $8.4 billion. We may also issue long-term unsecured debt through BANA in a variety of maturities and currencies to achieve cost-efficient funding and to maintain an appropriate maturity profile. During 20132014, we issued $2.5$32.7 billion of long-term unsecured debt, including structured note issuance of $2.8 billion, a majority of which was issued by the parent company. We also issued $3.3 billion of unsecured long-term debt through BANA. While the cost and availability of unsecured funding may be negatively impacted by general market conditions or by matters specific to the financial services industry or the Corporation, we seek to mitigate refinancing risk by actively managing the amount of our borrowings that we anticipate will mature within any month or quarter.
In 2013, we redeemed $9.0 billion of certain senior notes maturing in 2014 through tender offers. In January 2014, we issued $1.25 billion of 2.6% notes due January 2019, $400 million of floating-rate notes due January 2019, $2.5 billion of 4.125% notes due January 2024 and $2.0 billion of 5.0% notes due January 2044. The Corporation converted substantially all of this newly issued fixed-rate debt to floating-rate exposure with derivative transactions.
Table 2220 presents our long-term debt by major currency at December 31, 20132014 and 2012.2013.
| | | | | | | | | | | |
| Table 22 | Long-term Debt by Major Currency | |
| Table 20 | | Long-term Debt by Major Currency |
| | | | | |
| | | December 31 | | December 31 |
| (Dollars in millions) | (Dollars in millions) | 2013 | | 2012 | (Dollars in millions) | 2014 | | 2013 |
| U.S. Dollar | U.S. Dollar | $ | 176,294 |
| | $ | 180,329 |
| U.S. Dollar | $ | 191,264 |
| | $ | 176,294 |
|
| Euro | Euro | 46,029 |
| | 58,985 |
| Euro | 30,687 |
| | 46,029 |
|
| British Pound | British Pound | 9,772 |
| | 11,126 |
| British Pound | 7,881 |
| | 9,772 |
|
| Japanese Yen | Japanese Yen | 9,115 |
| | 12,749 |
| Japanese Yen | 6,058 |
| | 9,115 |
|
| Australian Dollar | | Australian Dollar | 2,135 |
| | 1,870 |
|
| Canadian Dollar | Canadian Dollar | 2,402 |
| | 3,560 |
| Canadian Dollar | 1,779 |
| | 2,402 |
|
| Australian Dollar | 1,870 |
| | 2,760 |
| |
| Swiss Franc | Swiss Franc | 1,274 |
| | 1,917 |
| Swiss Franc | 897 |
| | 1,274 |
|
| Other | Other | 2,918 |
| | 4,159 |
| Other | 2,438 |
| | 2,918 |
|
| Total long-term debt | Total long-term debt | $ | 249,674 |
| | $ | 275,585 |
| Total long-term debt | $ | 243,139 |
| | $ | 249,674 |
|
Total long-term debt decreased $25.96.5 billion, or ninethree percent, in 20132014, primarily driven by maturities outpacing new issuances. This reflects our ongoing initiative to reduce our debt balances over time and we anticipate that debt levels will continue to decline through 2014, although at a slower pace than 2013. We may, from time to time, purchase outstanding debt instruments in various transactions, depending on prevailing market conditions, liquidity and other factors. In addition, our other regulated entities may make markets in our debt instruments to provide liquidity for investors. For more information on long-term debt funding, see Note 11 – Long-term Debt to the Consolidated Financial Statements.
We use derivative transactions to manage the duration, interest rate and currency risks of our borrowings, considering the characteristics of the assets they are funding. For further details on our ALM activities, see Interest Rate Risk Management for NontradingNon-trading Activities on page 113105.
We may also diversify ourissue unsecured funding sources by issuing various typesdebt in the form of debt instruments including structured liabilities, whichnotes for client purposes. Structured notes are debt obligations that pay investors returns linked to other debt or equity securities, indices, currencies or commodities. We typically hedge the returns we are obligated to pay on these liabilities with derivative positions and/or investments in the underlying instruments, so that from a funding perspective, the cost is similar to our other unsecured long-term debt. We could be required to settle certain structured liability obligations for cash or other securities prior to maturity under certain circumstances, which we consider for liquidity planning purposes. We believe, however, that a portion of such borrowings will remain outstanding beyond the earliest put or redemption date. We had outstanding structured liabilities with a carrying value of $48.4$38.8 billion and $51.7$48.4 billion at December 31, 20132014 and 2012.2013.
Substantially all of our senior and subordinated debt obligations contain no provisions that could trigger a requirement for an early repayment, require additional collateral support, result in changes to terms, accelerate maturity or create additional financial obligations upon an adverse change in our credit ratings, financial ratios, earnings, cash flows or stock price.
Contingency Planning
We maintain contingency funding plans that outline our potential responses to liquidity stress events at various levels of severity. These policies and plans are based on stress scenarios and include potential funding strategies and communication and notification procedures that we would implement in the event we experienced stressed liquidity conditions. We periodically review and test the contingency funding plans to validate efficacy and assess readiness.
Our U.S. bank subsidiaries can access contingency funding through the Federal Reserve Discount Window. Certain non-U.S. subsidiaries have access to central bank facilities in the jurisdictions in which they operate. While we do not rely on these sources in our liquidity modeling, we maintain the policies, procedures and governance processes that would enable us to access these sources if necessary.
Credit Ratings
Our borrowing costs and ability to raise funds are impacted by our credit ratings. In addition, credit ratings may be important to customers or counterparties when we compete in certain markets and when we seek to engage in certain transactions, including OTC derivatives. Thus, it is our objective to maintain high-quality credit ratings, and management maintains an active dialogue with the rating agencies.
Credit ratings and outlooks are opinions expressed by rating agencies on our creditworthiness and that of our obligations or securities, including long-term debt, short-term borrowings, preferred stock and other securities, including asset securitizations. Our credit ratings are subject to ongoing review by the rating agencies and they consider a number of factors, including our own financial strength, performance, prospects and operations as well as factors not under our control. The rating agencies could make adjustments to our ratings at any time and they provide no assurances that they will maintain our ratings at current levels.
Other factors that influence our credit ratings include changes to the rating agencies’ methodologies for our industry or certain security types, the rating agencies’ assessment of the general operating environment for financial services companies, the sovereign credit ratings of the U.S. government, our
mortgage exposures (including litigation), our relative positions in the markets in which we compete, reputation, liquidity position, diversity of funding sources, funding costs, the level and volatility of earnings, corporate governance and risk management policies, capital position, capital management practices, and current or future regulatory and legislative initiatives.
All three agencies have indicated that, as a systemically important financial institution, the senior credit ratings of the Corporation and Bank of America, N.A. (or in the case of Moody’s InvestorInvestors Service, Inc. (Moody’s), only the ratings of Bank of America, N.A.) currently reflect the expectation that, if necessary, we would receive significant support from the U.S. government, and that they will continue to assess such support in the context of sovereign financial strength and regulatory and legislative developments.
On December 20, 2013,2, 2014, Standard & Poor’s Ratings Services (S&P) affirmed the ratings of Bank of America, Corporation. S&P continuesand revised the outlook on our core operating subsidiaries, including Bank of America, N.A., MLPF&S, and MLI, to evaluate the possible removal of uplift for extraordinary government support in its holding company ratings for the U.S. banks that it views as having high systemic importance. Due to this ongoing evaluation and Corporation-specific factors, S&P maintained itsstable from negative. The negative outlook on the ratings of Bank of America Corporation reflects S&P’s ongoing evaluation of whether to continue to include uplift for extraordinary U.S. government support in the ratings of systemically-important BHCs. On November 25, 2014, Fitch Ratings (Fitch) concluded their periodic review of 12 large, complex securities trading and universal banks, including Bank of America Corporation. As a result of this review, Fitch affirmed all of the Corporation’s ratings.credit ratings and retained a negative outlook. The negative outlook reflects Fitch’s expectation that the probability of the U.S. government providing support to a systemically important financial institution during a crisis is likely to decline due to the
orderly liquidation provisions of the Dodd-Frank Wall Street Reform and Consumer Protection Act. On November 14, 2013, Moody’s concluded its review of the ratings for Bank of America and certain other systemically important U.S. BHCs, affirming our current ratings and noting that those ratings no longer incorporate any uplift for U.S. government support. Concurrently, Moody’s upgraded Bank of America, N.A.’s senior debt and stand-alone
ratings by one notch, citing a number of positive developments at Bank of America. Moody’s also moved its outlook for all of our ratings to stable. On May 16, 2013, Fitch Ratings (Fitch) announced the results of its periodic review of its ratings for 12 large, complex securities trading and universal banks, including Bank of America. As part of this action, Fitch affirmed the Corporation’s senior credit ratings and upgraded the rating of our stand-alone creditworthiness, as well as the ratings for our subordinated debt, trust preferred and preferred stock, each by one notch.
Table 2321 presents the Corporation’s current long-term/short-term senior debt ratings and outlooks expressed by the rating agencies.
|
| | | | | | | | | | | | | | | | | | |
| | | | | | | | | | | | | | | | | | | |
Table 2321 | Senior Debt Ratings | | | | | | | | | | | | | | |
| | | |
| | | Moody’s InvestorInvestors Service | | Standard & Poor’s | | Fitch Ratings |
| | Long-term | | Short-term | | Outlook | | Long-term | | Short-term | | Outlook | | Long-term | | Short-term | | Outlook |
| Bank of America Corporation | Baa2 | | P-2 | | Stable | | A- | | A-2 | | Negative | | A | | F1 | | StableNegative |
| Bank of America, N.A. | A2 | | P-1 | | Stable | | A | | A-1 | | NegativeStable | | A | | F1 | | StableNegative |
| Merrill Lynch, Pierce, Fenner & Smith | NR | | NR | | NR | | A | | A-1 | | NegativeStable | | A | | F1 | | StableNegative |
| Merrill Lynch International | NR | | NR | | NR | | A | | A-1 | | NegativeStable | | A | | F1 | | StableNegative |
NR = not rated
A reduction in certain of our credit ratings or the ratings of certain asset-backed securitizations may have a material adverse effect on our liquidity, potential loss of access to credit markets, the related cost of funds, our businesses and on certain trading revenues, particularly in those businesses where counterparty creditworthiness is critical. In addition, under the terms of certain OTC derivative contracts and other trading agreements, in the event of downgrades of our or our rated subsidiaries’ credit ratings,
the counterparties to those agreements may require us to provide additional collateral, or to terminate these contracts or agreements, which could cause us to sustain losses and/or adversely impact our liquidity. If the short-term credit ratings of our parent company, bank or broker/dealerbroker-dealer subsidiaries were downgraded by one or more levels, the potential loss of access to short-term funding sources such as repo financing and the effect on our incremental cost of funds could be material.
Table 2422 presents the amount of additional collateral that would have been contractually required by derivative contracts and other trading agreements at December 31, 20132014 if the rating agencies had downgraded their long-term senior debt ratings for the Corporation or certain subsidiaries by one incremental notch and by an additional second incremental notch.
|
| | | | | | | |
| | | | |
| Table 24 | Additional Collateral Required to be Posted Upon Downgrade |
| | | |
| | | December 31, 2013 |
| (Dollars in millions) | One incremental notch | Second incremental notch |
| Bank of America Corporation | $ | 1,302 |
| $ | 4,101 |
|
Bank of America, N.A. and subsidiaries (1) | 881 |
| 3,039 |
|
| |
(1)
| Included in Bank of America Corporation collateral requirements in this table. |
Table 25 presents the derivative liability that would be subject to unilateral termination by counterparties and the amounts of collateral that would have been posted at December 31, 2013, if the rating agencies had downgraded their long-term senior debt ratings for the Corporation or certain subsidiaries by one incremental notch and by an additional second incremental notch.
|
| | | | | | | |
| | | | |
| Table 25 | Derivative Liability Subject to Unilateral Termination Upon Downgrade |
| | | |
| | | December 31, 2013 |
| (Dollars in millions) | One incremental notch | Second incremental notch |
| Derivative liability | $ | 927 |
| $ | 1,878 |
|
| Collateral posted | 733 |
| 1,467 |
|
|
| | | | | | | |
| | | | |
| Table 22 | Additional Collateral Required to be Posted Upon Downgrade |
| | | |
| | | December 31, 2014 |
| (Dollars in millions) | One incremental notch | Second incremental notch |
| Bank of America Corporation | $ | 1,402 |
| $ | 2,825 |
|
Bank of America, N.A. and subsidiaries (1) | 1,072 |
| 1,886 |
|
| |
(1) | Included in Bank of America Corporation collateral requirements in this table. |
Table 23 presents the derivative liabilities that would be subject to unilateral termination by counterparties and the amounts of collateral that would have been contractually required at December 31, 2014, if the long-term senior debt ratings for the Corporation or certain subsidiaries had been lower by one incremental notch and by an additional second incremental notch.
|
| | | | | | | |
| | | | |
| Table 23 | Derivative Liabilities Subject to Unilateral Termination Upon Downgrade |
| | | |
| | | December 31, 2014 |
| (Dollars in millions) | One incremental notch | Second incremental notch |
| Derivative liability | $ | 1,785 |
| $ | 3,850 |
|
| Collateral posted | 1,520 |
| 2,986 |
|
While certain potential impacts are contractual and quantifiable, the full scope of the consequences of a credit ratingsrating downgrade to a financial institution is inherently uncertain, as it depends upon numerous dynamic, complex and inter-related factors and assumptions, including whether any downgrade of a company’s long-term credit ratings precipitates downgrades to its short-term credit ratings, and assumptions about the potential behaviors of various customers, investors and counterparties. For more information on potential impacts of credit rating downgrades, see Liquidity Risk – Time to RequiredTime-to-required Funding and Stress Modeling on page 7266.
For more information on the additional collateral and termination payments that could be required in connection with certain OTC derivative contracts and other trading agreements as a result of such a credit rating downgrade, see Note 2 – Derivatives to the Consolidated Financial Statements and Item 1A. Risk Factors.Statements.
On October 15, 2013,June 6, 2014, S&P affirmed its AA+ long-term and A-1+ short-term sovereign credit rating on the U.S. government with a stable outlook. On March 21, 2014, Fitch placedaffirmed its AAA long-term and F1+ short-term sovereign credit rating on the U.S. government onwith a stable outlook. This resolved the rating watch negative.negative that was placed on the ratings on October 15, 2013. On July 18, 2013, Moody’s revised its outlook on the U.S. government to stable from negative and affirmed its Aaa long-term sovereign credit rating on the U.S. government. On June 10, 2013, S&P affirmed its AA+ long-term and A-1+ short-term sovereign credit rating on the U.S. government, as the outlook on the long-term credit rating was revised to stable from negative.
Credit Risk Management
Credit quality improved during 20132014 due in part to improving economic conditions. In addition, our proactive credit risk management activities positively impacted the credit portfolio as charge-offs and delinquencies continued to improve. For additional information, see Executive Summary – 20132014 Economic and Business Environment on page 2423.
Credit risk is the risk of loss arising from the inability or failure of a borrower or counterparty to meet its obligations. Credit risk can also arise from operational failures that result in an erroneous advance, commitment or investment of funds. We define the credit exposure to a borrower or counterparty as the loss potential arising from all product classifications including loans and leases, deposit overdrafts, derivatives, assets held-for-sale and unfunded lending commitments which include loan commitments, letters of credit and financial guarantees. Derivative positions are recorded at fair value and assets held-for-sale are recorded at either fair value or the lower of cost or fair value. Certain loans and unfunded commitments are accounted for under the fair value option. Credit risk for categories of assets carried at fair value is not accounted for as part of the allowance for credit losses but as part of the fair value adjustments recorded in earnings. For derivative positions, our credit risk is measured as the net cost in the event the counterparties with contracts in which we are in a gain position fail to perform under the terms of those contracts. We use the current fair value to represent credit exposure without giving consideration to future mark-to-market changes. The credit risk amounts take into consideration the effects of legally enforceable master netting agreements and cash collateral. Our consumer and commercial credit extension and review procedures encompass funded and unfunded credit exposures. For more information on derivativederivatives and credit extension commitments, see Note 2 – Derivatives and Note 12 – Commitments and Contingencies to the Consolidated Financial Statements.
We manage credit risk based on the risk profile of the borrower or counterparty, repayment sources, the nature of underlying collateral, and other support given current events, conditions and expectations. We classify our portfolios as either consumer or commercial and monitor credit risk in each as discussed below.
We proactively refine our underwriting and credit management practices as well as credit standards to meet the changing economic environment. To actively mitigate losses and enhance customer support in our consumer businesses, we have in place collection programs and loan modification and customer assistance infrastructures. We utilize a number of actions to mitigate losses in the commercial businesses including increasing the frequency and intensity of portfolio monitoring, hedging activity and our practice of transferring management of deteriorating commercial exposures to independent special asset officers as credits enter criticized categories.
We have non-U.S. exposure largely in Europe and Asia Pacific. Our exposure to certain European countries, including Greece, Ireland, Italy, Portugal and Spain, has experienced varying degrees of financial stress. For more information on our exposures and related risks in non-U.S. countries, see Non-U.S. Portfolio on page 10093 and Item 1A. Risk Factors.Factors of this Annual Report on Form 10-K.
For more information on our credit risk management activities, see Consumer Portfolio Credit Risk Management on page 7770, Commercial Portfolio Credit Risk Management on page 9184, Non-U.S. Portfolio on page 10093, Provision for Credit Losses on page 95 and Allowance for Credit Losses both on page 10495, Note 1 – Summary of Significant Accounting Principles, Note 4 – Outstanding Loans and Leases and Note 5 – Allowance for Credit Losses to the Consolidated Financial Statements.
Consumer Portfolio Credit Risk Management
Credit risk management for the consumer portfolio begins with initial underwriting and continues throughout a borrower’s credit cycle. Statistical techniques in conjunction with experiential judgment are used in all aspects of portfolio management including underwriting, product pricing, risk appetite, setting credit limits, and establishing operating processes and metrics to quantify and balance risks and returns. Statistical models are built using detailed behavioral information from external sources such as credit bureaus and/or internal historical experience. These models are a component of our consumer credit risk management process and are used in part to assist in making both new and ongoing credit decisions, as well as portfolio management strategies, including authorizations and line management, collection practices and strategies, and determination of the allowance for loan and lease losses and allocated capital for credit risk.
From January 2008 through 2013, Bank of America and Countrywide have completed more than 1.3 million loan modifications with customers. During 20132014, we completed nearly 170,000approximately 71,600 customer loan modifications with a total unpaid principal balance of approximately $35$13 billion, including approximately 52,00033,400 permanent modifications, under the U.S. government’s Making Home Affordable Program. Of the loan modifications completed in 20132014, in terms of both the volume of modifications and the unpaid principal balance associated with the underlying loans, mostapproximately half were in the portfolio serviced for investors and were not on our balance sheet. The most common types of modifications include a combination of rate reduction and/or capitalization of past due amounts which represented 66 percent of the volume of modifications completed in 2013, while principal reductions and forgiveness represented 14 percent, principal forbearance represented 11 percent and capitalization of past due amounts represented six percent.Corporation’s held-for-investment (HFI) portfolio. For modified loans on our balance sheet, these modification types are generally considered TDRs.troubled debt restructurings (TDRs). For more information on TDRs and portfolio impacts, see Consumer Portfolio
Credit Risk Management – Nonperforming Consumer Loans, Leases and Foreclosed Properties Activity on page 8982 and Note 4 – Outstanding Loans and Leases to the Consolidated Financial Statements.
Consumer Credit Portfolio
Improvement in the U.S. economy, labor markets and home prices continued during 20132014 resulting in improved credit quality and lower credit losses across nearly all major consumer portfolios compared to 20122013. Consumer loans 30 days or more past due and 90 days or more past due declined during 20132014 across all consumer portfolios and nonperforming consumer loans and foreclosed property continued to decline as outflows, including the impact of loans sales, outpaced inflows as a result of improved delinquency trends. Although home prices have shown steady improvement since the beginning of 2012,, they have not fully recovered to their 2006 levels.
Improved credit quality, increased home prices and continued loan balance run-off across the consumer portfolio drove a $7.73.4 billion decrease in 2013 to $13.4 billion in the consumer allowance for loan and lease losses.losses in 2014 to $10.0 billion at December 31, 2014. For additionalmore information, see Allowance for Credit Losses on page 10495.
In connection with the 2013 settlement with FNMA, we entered into the FNMA Settlement to resolve substantially all outstanding and potential repurchase andrepurchased certain other claims relating to the origination, sale and delivery of residential mortgage loans originated andthat had previously been sold directly to FNMA, from January 1, 2000 through which we have valued at less than the purchase price. As of December 31, 2008 by entities related to Countrywide and BANA. In connection with the FNMA Settlement, we repurchased certain loans from FNMA and, as of December 31, 2013,2014, these loans had an unpaid principal balance of $5.7$4.4 billion and a carrying value of $4.9$3.8 billion, of which $5.3$4.1 billion of unpaid principal balance and $4.6$3.5 billion of carrying value were classified as PCI loans. All of these loans are included in the Legacy Assets & Servicing portfolio in Table 29.27. For more information on PCI loans, see Consumer Portfolio Credit Risk Management – Purchased Credit-impaired Loan Portfolio on page 8578 and Note 4 – Outstanding Loans and Leases to the Consolidated Financial Statements.
For more information on our accounting policies regarding delinquencies, nonperforming status, charge-offs and TDRs for the
consumer portfolio, see Note 1 – Summary of Significant Accounting Principlesto the FNMA Settlement,Consolidated Financial Statements. For more information on representations and warranties related to our residential mortgage and home equity portfolios, see Off-Balance Sheet Arrangements and Contractual Obligations – Representations and Warranties on page 50 and Note 7 – Representations and Warranties Obligations and Corporate Guarantees to the Consolidated Financial Statements.
For more information on our accounting policies regarding delinquencies, nonperforming status, charge-offs and TDRs for the consumer portfolio, see Note 1 – Summary of Significant Accounting Principlesto the Consolidated Financial Statements.
Table 2624 presents our outstanding consumer loans and leases, and the PCI loan portfolio. In addition to being included in the “Outstandings”
“Outstandings” columns in Table 2624, PCI loans are also shown separately, net of purchase accounting adjustments, in the “Purchased Credit-impaired Loan Portfolio” columns. The impact of the PCI loan portfolio on certain credit statistics is reported where appropriate. Given the continued run-off of our discontinued real estate portfolio, effective January 1, 2013, pay option loans
are included as part of our residential mortgage and home equity portfolios. The majority of these loans were considered credit-impaired and were written down to fair value upon acquisition. Prior periods were reclassified to conform to current period presentation. For more information on pay optionPCI loans, see Consumer Portfolio Credit Risk Management – Purchased Credit-impaired Residential Mortgage Loan Portfolio on page 86.78 and Note 4 – Outstanding Loans and Leasesto the Consolidated Financial Statements.
| | | | | | | | | | | | | | | | | | | |
| Table 26 | Consumer Loans and Leases | | | | | | | | |
| Table 24 | | Consumer Loans and Leases | | | | | | | |
| | | | | | | | | | | | | | | | | |
| | | December 31 | | December 31 |
| | | Outstandings | | Purchased Credit-impaired Loan Portfolio | | Outstandings | | Purchased Credit-impaired Loan Portfolio |
| (Dollars in millions) | (Dollars in millions) | 2013 | | 2012 | | 2013 | | 2012 | (Dollars in millions) | 2014 | | 2013 | | 2014 | | 2013 |
Residential mortgage (1) | Residential mortgage (1) | $ | 248,066 |
| | $ | 252,929 |
| | $ | 18,672 |
| | $ | 17,451 |
| Residential mortgage (1) | $ | 216,197 |
| | $ | 248,066 |
| | $ | 15,152 |
| | $ | 18,672 |
|
| Home equity | Home equity | 93,672 |
| | 108,140 |
| | 6,593 |
| | 8,667 |
| Home equity | 85,725 |
| | 93,672 |
| | 5,617 |
| | 6,593 |
|
| U.S. credit card | U.S. credit card | 92,338 |
| | 94,835 |
| | n/a |
| | n/a |
| U.S. credit card | 91,879 |
| | 92,338 |
| | n/a |
| | n/a |
|
| Non-U.S. credit card | Non-U.S. credit card | 11,541 |
| | 11,697 |
| | n/a |
| | n/a |
| Non-U.S. credit card | 10,465 |
| | 11,541 |
| | n/a |
| | n/a |
|
Direct/Indirect consumer (2) | Direct/Indirect consumer (2) | 82,192 |
| | 83,205 |
| | n/a |
| | n/a |
| Direct/Indirect consumer (2) | 80,381 |
| | 82,192 |
| | n/a |
| | n/a |
|
Other consumer (3) | Other consumer (3) | 1,977 |
| | 1,628 |
| | n/a |
| | n/a |
| Other consumer (3) | 1,846 |
| | 1,977 |
| | n/a |
| | n/a |
|
| Consumer loans excluding loans accounted for under the fair value option | Consumer loans excluding loans accounted for under the fair value option | 529,786 |
| | 552,434 |
| | 25,265 |
| | 26,118 |
| Consumer loans excluding loans accounted for under the fair value option | 486,493 |
| | 529,786 |
| | 20,769 |
| | 25,265 |
|
Loans accounted for under the fair value option (4) | Loans accounted for under the fair value option (4) | 2,164 |
| | 1,005 |
| | n/a |
| | n/a |
| Loans accounted for under the fair value option (4) | 2,077 |
| | 2,164 |
| | n/a |
| | n/a |
|
| Total consumer loans and leases | Total consumer loans and leases | $ | 531,950 |
| | $ | 553,439 |
| | $ | 25,265 |
| | $ | 26,118 |
| Total consumer loans and leases | $ | 488,570 |
| | $ | 531,950 |
| | $ | 20,769 |
| | $ | 25,265 |
|
| |
(1) | Outstandings include pay option loans of $4.43.2 billion and $6.74.4 billion and non-U.S. residential mortgage loans of $0 and $93 million at December 31, 20132014 and 20122013. We no longer originate pay option loans. |
| |
(2) | Outstandings include dealer financial services loans of $38.537.7 billion and $35.938.5 billion, unsecured consumer lending loans of $2.71.5 billion and $4.72.7 billion, U.S. securities-based lending loans of $31.235.8 billion and $28.331.2 billion, non-U.S. consumer loans of $4.74.0 billion and $8.34.7 billion, student loans of $4.1 billion632 million and $4.84.1 billion and other consumer loans of $1.0 billion761 million and $1.21.0 billion at December 31, 20132014 and 20122013. |
| |
(3) | Outstandings include consumer finance loans of $1.2 billion676 million and $1.41.2 billion, consumer leases of $606 million$1.0 billion and $34$606 million, consumer overdrafts of $176162 million and $177176 million and other non-U.S. consumer loans of $53 million and $5 million at December 31, 20132014 and 20122013. |
| |
(4) | Consumer loans accounted for under the fair value option include residential mortgage loans of $2.0$1.9 billion and $1.0$2.0 billion and home equity loans of $147$196 million and $0$147 million at December 31, 20132014 and 20122013. For more information on the fair value option, see Consumer Portfolio Credit Risk Management – Consumer Loans Accounted for Under the Fair Value Option on page 8982 and Note 21 – Fair Value Option to the Consolidated Financial Statements. |
n/a = not applicable
|
| | |
7871 Bank of America 20132014
| | |
Table 2725 presents consumer nonperforming loans and accruing consumer loans past due 90 days or more. Nonperforming loans do not include past due consumer credit card loans, other unsecured loans and in general, consumer non-real estate-secured loans (loans discharged in Chapter 7 bankruptcy are included) as these loans are typically charged off no later than the end of the month in which the loan becomes 180 days past due. Real estate-secured past due consumer loans that are insured by the FHA or individually insured under long-term stand-bystandby agreements with
FNMA and FHLMC (collectively, the fully-insured loan portfolio) are reported as accruing as opposed to nonperforming since the principal repayment is insured. Fully-insured loans included in accruing past due 90 days or more are primarily from our repurchases of delinquent FHA loans pursuant to our servicing agreements with GNMA. Additionally, nonperforming loans and accruing balances past due 90 days or more do not include the PCI loan portfolio or loans accounted for under the fair value option even though the customer may be contractually past due.
| | | | | | | | | | | | | | | | | | | |
| Table 27 | Consumer Credit Quality | | | | | | | | |
| Table 25 | | Consumer Credit Quality | | | | | | | |
| | | | | | | | | | | | | | | | | |
| | | December 31 | | December 31 |
| | | Nonperforming | | Accruing Past Due
90 Days or More | | Nonperforming | | Accruing Past Due
90 Days or More |
| (Dollars in millions) | (Dollars in millions) | 2013 | | 2012 | | 2013 | | 2012 | (Dollars in millions) | 2014 | | 2013 | | 2014 | | 2013 |
Residential mortgage (1) | Residential mortgage (1) | $ | 11,712 |
| | $ | 15,055 |
| | $ | 16,961 |
| | $ | 22,157 |
| Residential mortgage (1) | $ | 6,889 |
| | $ | 11,712 |
| | $ | 11,407 |
| | $ | 16,961 |
|
| Home equity | Home equity | 4,075 |
| | 4,282 |
| | — |
| | — |
| Home equity | 3,901 |
| | 4,075 |
| | — |
| | — |
|
| U.S. credit card | U.S. credit card | n/a |
| | n/a |
| | 1,053 |
| | 1,437 |
| U.S. credit card | n/a |
| | n/a |
| | 866 |
| | 1,053 |
|
| Non-U.S. credit card | Non-U.S. credit card | n/a |
| | n/a |
| | 131 |
| | 212 |
| Non-U.S. credit card | n/a |
| | n/a |
| | 95 |
| | 131 |
|
| Direct/Indirect consumer | Direct/Indirect consumer | 35 |
| | 92 |
| | 408 |
| | 545 |
| Direct/Indirect consumer | 28 |
| | 35 |
| | 64 |
| | 408 |
|
| Other consumer | Other consumer | 18 |
| | 2 |
| | 2 |
| | 2 |
| Other consumer | 1 |
| | 18 |
| | 1 |
| | 2 |
|
Total (2) | Total (2) | $ | 15,840 |
| | $ | 19,431 |
| | $ | 18,555 |
| | $ | 24,353 |
| Total (2) | $ | 10,819 |
| | $ | 15,840 |
| | $ | 12,433 |
| | $ | 18,555 |
|
Consumer loans and leases as a percentage of outstanding consumer loans and leases (2) | Consumer loans and leases as a percentage of outstanding consumer loans and leases (2) | 2.99 | % | | 3.52 | % | | 3.50 | % | | 4.41 | % | Consumer loans and leases as a percentage of outstanding consumer loans and leases (2) | 2.22 | % | | 2.99 | % | | 2.56 | % | | 3.50 | % |
Consumer loans and leases as a percentage of outstanding loans and leases, excluding PCI and fully-insured loan portfolios (2) | Consumer loans and leases as a percentage of outstanding loans and leases, excluding PCI and fully-insured loan portfolios (2) | 3.80 |
| | 4.46 |
| | 0.38 |
| | 0.50 |
| Consumer loans and leases as a percentage of outstanding loans and leases, excluding PCI and fully-insured loan portfolios (2) | 2.70 |
| | 3.80 |
| | 0.26 |
| | 0.38 |
|
| |
(1) | Residential mortgage loans accruing past due 90 days or more are fully-insured loans. At December 31, 20132014 and 20122013, residential mortgage included $13.07.3 billion and $17.813.0 billion of loans on which interest has been curtailed by the FHA, and therefore are no longer accruing interest, although principal is still insured, and $4.04.1 billion and $4.44.0 billion of loans on which interest was still accruing. |
| |
(2) | Balances exclude consumer loans accounted for under the fair value option. At December 31, 20132014 and 20122013, $445392 million and $391445 million of loans accounted for under the fair value option were past due 90 days or more and not accruing interest. |
n/a = not applicable
Table 2826 presents net charge-offs and related ratios for consumer loans and leases.
| | | | | | | | | | | | | | | | | | | |
| Table 28 | Consumer Net Charge-offs and Related Ratios | | | | | | | | |
| Table 26 | | Consumer Net Charge-offs and Related Ratios | | | | | | | |
| | | | | | | | | | | | | | | | | |
| | | Net Charge-offs (1) | | Net Charge-off Ratios (1, 2) | | Net Charge-offs (1) | | Net Charge-off Ratios (1, 2) |
| (Dollars in millions) | (Dollars in millions) | 2013 | | 2012 | | 2013 | | 2012 | (Dollars in millions) | 2014 | | 2013 | | 2014 | | 2013 |
| Residential mortgage | Residential mortgage | $ | 1,084 |
| | $ | 3,111 |
| | 0.42 | % | | 1.18 | % | Residential mortgage | $ | (114 | ) | | $ | 1,084 |
| | (0.05 | )% | | 0.42 | % |
| Home equity | Home equity | 1,803 |
| | 4,242 |
| | 1.80 |
| | 3.62 |
| Home equity | 907 |
| | 1,803 |
| | 1.01 |
| | 1.80 |
|
| U.S. credit card | U.S. credit card | 3,376 |
| | 4,632 |
| | 3.74 |
| | 4.88 |
| U.S. credit card | 2,638 |
| | 3,376 |
| | 2.96 |
| | 3.74 |
|
| Non-U.S. credit card | Non-U.S. credit card | 399 |
| | 581 |
| | 3.68 |
| | 4.29 |
| Non-U.S. credit card | 242 |
| | 399 |
| | 2.10 |
| | 3.68 |
|
| Direct/Indirect consumer | Direct/Indirect consumer | 345 |
| | 763 |
| | 0.42 |
| | 0.90 |
| Direct/Indirect consumer | 169 |
| | 345 |
| | 0.20 |
| | 0.42 |
|
| Other consumer | Other consumer | 234 |
| | 232 |
| | 12.96 |
| | 9.85 |
| Other consumer | 229 |
| | 234 |
| | 11.27 |
| | 12.96 |
|
| Total | Total | $ | 7,241 |
| | $ | 13,561 |
| | 1.34 |
| | 2.36 |
| Total | $ | 4,071 |
| | $ | 7,241 |
| | 0.80 |
| | 1.34 |
|
| |
(1) | Net charge-offs exclude write-offs in the PCI loan portfolio of $1.2 billion545 million in residential mortgage and $265 million in home equity andin 2014 compared to $1.1 billion in residential mortgage inand 2013 compared to $2.81.2 billion in home equity in 20122013. These write-offs decreased the PCI valuation allowance included as part of the allowance for loan and lease losses. For more information on PCI write-offs, see Consumer Portfolio Credit Risk Management – Purchased Credit-impaired Loan Portfolio on page 8578. |
| |
(2) | Net charge-off ratios are calculated as net charge-offs divided by average outstanding loans and leases excluding loans accounted for under the fair value option. |
Net charge-off ratios, excluding the PCI and fully-insured loan portfolios, were 0.74(0.08) percent and 2.040.74 percent for residential mortgage, 1.941.09 percent and 3.991.94 percent for home equity and 1.711.00 percent and 2.991.71 percent for the total consumer portfolio for 20132014 and 20122013., respectively. These are the only product classifications that include PCI and fully-insured loans for these periods.loans.
Net charge-offs exclude write-offs in the PCI loan portfolio of $1.2 billion in home equity$545 million and $1.1 billion in residential mortgage
for 2013, and $2.8$265 million and $1.2 billion in home equity for 20122014. and 2013,
respectively. These write-offs decreased the PCI valuation allowance included as part of the allowance for loan and lease losses. Net charge-off ratios including the PCI write-offs were 3.050.18 percent for home equity and 0.85 percent for residential mortgage in 2013, and 6.021.31 percent and 3.05 percent for home equity in 20122014. and 2013, respectively. For more information on PCI write-offs, see Consumer Portfolio Credit Risk Management – Purchased Credit-impaired Loan Portfolio on page 8578.
|
| | |
| | | Bank of America 20132014 7972 |
Table 2927 presents outstandings, nonperforming balances, net charge-offs, allowance for loan and lease losses and provision for loan and lease losses for the Core portfolio and the Legacy Assets & Servicing portfolio within the home loans portfolio. For more information on Legacy Assets & Servicing, see CRES on page 4038.
| | | | | | | | | | | | | | | | | | | | | | | | | | | |
| Table 29 | Home Loans Portfolio (1) | | | | | |
| Table 27 | | Home Loans Portfolio (1) | | | | |
| | | | | | | | | | | | | |
| | | December 31 | | | | | | December 31 | | | | |
| | | Outstandings | | Nonperforming | | Net Charge-offs (2) | | Outstandings | | Nonperforming | | Net Charge-offs (2) |
| (Dollars in millions) | (Dollars in millions) | 2013 | | 2012 | | 2013 | | 2012 | | 2013 | | 2012 | (Dollars in millions) | 2014 | | 2013 | | 2014 | | 2013 | | 2014 | | 2013 |
| Core portfolio | Core portfolio | |
| | |
| | |
| | |
| | |
| | | Core portfolio | |
| | |
| | |
| | |
| | |
| | |
| Residential mortgage | Residential mortgage | $ | 177,336 |
| | $ | 170,116 |
| | $ | 3,316 |
| | $ | 3,193 |
| | $ | 274 |
| | $ | 544 |
| Residential mortgage | $ | 162,220 |
| | $ | 177,336 |
| | $ | 2,398 |
| | $ | 3,316 |
| | $ | 140 |
| | $ | 274 |
|
| Home equity | Home equity | 54,499 |
| | 60,851 |
| | 1,431 |
| | 1,265 |
| | 439 |
| | 811 |
| Home equity | 51,887 |
| | 54,499 |
| | 1,496 |
| | 1,431 |
| | 275 |
| | 439 |
|
| Total Core portfolio | Total Core portfolio | 231,835 |
| | 230,967 |
| | 4,747 |
| | 4,458 |
| | 713 |
| | 1,355 |
| Total Core portfolio | 214,107 |
| | 231,835 |
| | 3,894 |
| | 4,747 |
| | 415 |
| | 713 |
|
| Legacy Assets & Servicing portfolio | Legacy Assets & Servicing portfolio | | | |
| | |
| | |
| | | | | Legacy Assets & Servicing portfolio | | | |
| | |
| | |
| | | | |
| Residential mortgage | Residential mortgage | 70,730 |
| | 82,813 |
| | 8,396 |
| | 11,862 |
| | 810 |
| | 2,567 |
| Residential mortgage | 53,977 |
| | 70,730 |
| | 4,491 |
| | 8,396 |
| | (254 | ) | | 810 |
|
| Home equity | Home equity | 39,173 |
| | 47,289 |
| | 2,644 |
| | 3,017 |
| | 1,364 |
| | 3,431 |
| Home equity | 33,838 |
| | 39,173 |
| | 2,405 |
| | 2,644 |
| | 632 |
| | 1,364 |
|
| Total Legacy Assets & Servicing portfolio | Total Legacy Assets & Servicing portfolio | 109,903 |
| | 130,102 |
| | 11,040 |
| | 14,879 |
| | 2,174 |
| | 5,998 |
| Total Legacy Assets & Servicing portfolio | 87,815 |
| | 109,903 |
| | 6,896 |
| | 11,040 |
| | 378 |
| | 2,174 |
|
| Home loans portfolio | Home loans portfolio | |
| | |
| | |
| | |
| | |
| | |
| Home loans portfolio | |
| | |
| | |
| | |
| | |
| | |
|
| Residential mortgage | Residential mortgage | 248,066 |
| | 252,929 |
| | 11,712 |
| | 15,055 |
| | 1,084 |
| | 3,111 |
| Residential mortgage | 216,197 |
| | 248,066 |
| | 6,889 |
| | 11,712 |
| | (114 | ) | | 1,084 |
|
| Home equity | Home equity | 93,672 |
| | 108,140 |
| | 4,075 |
| | 4,282 |
| | 1,803 |
| | 4,242 |
| Home equity | 85,725 |
| | 93,672 |
| | 3,901 |
| | 4,075 |
| | 907 |
| | 1,803 |
|
| Total home loans portfolio | Total home loans portfolio | $ | 341,738 |
| | $ | 361,069 |
| | $ | 15,787 |
| | $ | 19,337 |
| | $ | 2,887 |
| | $ | 7,353 |
| Total home loans portfolio | $ | 301,922 |
| | $ | 341,738 |
| | $ | 10,790 |
| | $ | 15,787 |
| | $ | 793 |
| | $ | 2,887 |
|
| | | | | | | | | | | | | | | | | | | | | | | | | |
| | | | | | | December 31 | | | | | | | | | | December 31 | | | | |
| | | | | | | Allowance for Loan and Lease Losses | | Provision for Loan and Lease Losses | | | | | | Allowance for Loan and Lease Losses | | Provision for Loan and Lease Losses |
| | | | | | | 2013 | | 2012 | | 2013 | | 2012 | | | | | | 2014 | | 2013 | | 2014 | | 2013 |
| Core portfolio | Core portfolio | | | | | | | | | | | | Core portfolio | | | | | | | | | | | |
| Residential mortgage | Residential mortgage | | | | | $ | 728 |
| | $ | 829 |
| | $ | 166 |
| | $ | 523 |
| Residential mortgage | | | | | $ | 593 |
| | $ | 728 |
| | $ | (47 | ) | | $ | 166 |
|
| Home equity | Home equity | | | | | 965 |
| | 1,286 |
| | 119 |
| | 256 |
| Home equity | | | | | 702 |
| | 965 |
| | 3 |
| | 119 |
|
| Total Core portfolio | Total Core portfolio | | | | | 1,693 |
| | 2,115 |
| | 285 |
| | 779 |
| Total Core portfolio | | | | | 1,295 |
| | 1,693 |
| | (44 | ) | | 285 |
|
| Legacy Assets & Servicing portfolio | Legacy Assets & Servicing portfolio | | | | | |
| | |
| | | | |
| Legacy Assets & Servicing portfolio | | | | | |
| | |
| | | | |
|
| Residential mortgage | Residential mortgage | | | | | 3,356 |
| | 6,259 |
| | (979 | ) | | 1,802 |
| Residential mortgage | | | | | 2,307 |
| | 3,356 |
| | (696 | ) | | (979 | ) |
| Home equity | Home equity | | | | | 3,469 |
| | 6,559 |
| | (430 | ) | | 1,492 |
| Home equity | | | | | 2,333 |
| | 3,469 |
| | (236 | ) | | (430 | ) |
| Total Legacy Assets & Servicing portfolio | Total Legacy Assets & Servicing portfolio | | | | | 6,825 |
| | 12,818 |
| | (1,409 | ) | | 3,294 |
| Total Legacy Assets & Servicing portfolio | | | | | 4,640 |
| | 6,825 |
| | (932 | ) | | (1,409 | ) |
| Home loans portfolio | Home loans portfolio | | | | | |
| | |
| | |
| | |
| Home loans portfolio | | | | | |
| | |
| | |
| | |
|
| Residential mortgage | Residential mortgage | | | | | 4,084 |
| | 7,088 |
| | (813 | ) | | 2,325 |
| Residential mortgage | | | | | 2,900 |
| | 4,084 |
| | (743 | ) | | (813 | ) |
| Home equity | Home equity | | | | | 4,434 |
| | 7,845 |
| | (311 | ) | | 1,748 |
| Home equity | | | | | 3,035 |
| | 4,434 |
| | (233 | ) | | (311 | ) |
| Total home loans portfolio | Total home loans portfolio | | | | | $ | 8,518 |
| | $ | 14,933 |
| | $ | (1,124 | ) | | $ | 4,073 |
| Total home loans portfolio | | | | | $ | 5,935 |
| | $ | 8,518 |
| | $ | (976 | ) | | $ | (1,124 | ) |
| |
(1) | Outstandings and nonperforming amounts exclude loans accounted for under the fair value option. Consumer loans accounted for under the fair value option include residential mortgage loans of $2.01.9 billion and $1.02.0 billion and home equity loans of $147196 million and $0147 million at December 31, 20132014 and 20122013. For more information on the fair value option, see Consumer Portfolio Credit Risk Management – Consumer Loans Accounted for Under the Fair Value Option on page 8982 and Note 21 – Fair Value Option to the Consolidated Financial Statements. |
| |
(2) | Net charge-offs exclude write-offs in the PCI loan portfolio of $1.2 billion545 million in residential mortgage and $265 million in home equity and $1.1 billion in residential mortgage in 20132014, which are included in the Legacy Assets & Servicing portfolio, compared to $2.81.1 billion in residential mortgage and $1.2 billion in home equity in 20122013. Write-offs in the PCI loan portfolio decrease the PCI valuation allowance included as part of the allowance for loan and lease losses. For more information on PCI write-offs, see Consumer Portfolio Credit Risk Management – Purchased Credit-impaired Loan Portfolio on page 8578. |
We believe that the presentation of information adjusted to exclude the impact of the PCI loan portfolio, the fully-insured loan portfolio and loans accounted for under the fair value option is more representative of the ongoing operations and credit quality of the business. As a result, in the following discussions of the residential mortgage and home equity portfolios, we provide information that excludes the impact of the PCI loan portfolio, the fully-insured loan portfolio and loans accounted for under the fair value option in certain credit quality statistics. We separately disclose information on the PCI loan portfolio on page 8578.
Residential Mortgage
The residential mortgage portfolio makes up the largest percentage of our consumer loan portfolio at 4744 percent of consumer loans and leases at December 31, 20132014. Approximately 1924 percent of the residential mortgage portfolio is in GWIM and represents residential mortgages that are originated for the home purchase and refinancing needs of our wealth management clients. The remaining portion of the portfolio is primarily in All Other and is comprised of originated loans, purchased loans used
in our overall ALM activities, loans repurchased in connection with the FNMA Settlement, delinquent FHA loans repurchased pursuant to our servicing agreements with GNMA as well as loans repurchased related to our representations and warranties.
Outstanding balances in the residential mortgage portfolio, excluding loans accounted for under the fair value option, decreased $4.9$31.9 billion during 20132014 due to paydowns, sales, charge-offs and transfers to foreclosed propertiesproperties. Of the decline, more than 50 percent was due to the sale of $10.7 billion of loans with standby insurance agreements and $6.7 billion of nonperforming and other delinquent loan sales. These were partially offset by new origination volume retained on our balance sheet, loans repurchased as part of the FNMA Settlement, as well as repurchases of delinquent loans pursuant to our servicing agreements with GNMA, which isare part of our mortgage banking activities.
At December 31, 20132014 and 20122013, the residential mortgage portfolio included $87.265.0 billion and $90.987.2 billion of outstanding fully-insured loans. On this portion of the residential mortgage portfolio, we are protected against principal loss as a result of either FHA insurance or long-term stand-bystandby agreements with FNMA and FHLMC. At December 31, 20132014 and 20122013, $59.0$47.8 billion and $66.6 billion had FHA insurance with the remainder protected by
|
| | |
8073 Bank of America 20132014
| | |
$59.0 billion had FHA insurance with the remainder protected by long-term stand-bystandby agreements. At December 31, 20132014 and 20122013, $22.5$15.9 billion and $25.5$22.5 billion of the FHA-insured loan population were repurchases of delinquent FHA loans pursuant to our servicing agreements with GNMA. All of these loans are individually insured and therefore the Corporation does not record a significant allowance for creditloan and lease losses with respect to these loans.
The long-term standby agreements with FNMA and FHLMC reduce our regulatory risk-weighted assets due to the transfer of a portion of our credit risk to unaffiliated parties. At December 31, 2014, these programs had the cumulative effect of reducing our risk-weighted assets by $5.2 billion, increasing both our Tier 1 capital ratio and Common equity tier 1 capital ratio by five bps under the Basel 3 Standardized – Transition. This compared to reducing our risk-weighted assets by $8.4 billion, increasing our Tier 1 capital ratio by eight bps and increasing our Tier 1 common capital ratio by seven bps at December 31, 2013 under Basel 1 (which included the Market Risk Final Rules).
In addition to the long-term stand-bystandby agreements with FNMA and FHLMC, we have mitigated a portion of our credit risk on the residential mortgage portfolio through the use of synthetic securitization vehicles. These vehicles issue long-term notes to investors, the proceeds of which are held as described in Note 4 – Outstanding Loans and Leasescash collateral. We pay a premium to the Consolidated Financial Statementsvehicles to purchase mezzanine loss protection on a portfolio of residential mortgage loans HFI. Cash held in the vehicles is used to reimburse us in the event that losses on the mortgage portfolio exceed 10 bps of the original pool balance, up to the remaining amount of purchased loss protection of $270 million and $339 million at December 31, 2014 and 2013.
Amounts due from the vehicles are recorded in other income (loss) in the Consolidated Statement of Income when we recognize a reimbursable loss. Amounts are collected when reimbursable losses are realized through the sale of the underlying collateral. At December 31, 20132014 and 20122013, the synthetic securitization vehicles referenced principal balances of $12.57.0 billion and $17.612.5 billion of residential mortgage loans and provided loss protection up to $339 million and $500 million. At December 31, 2013 and 2012, the Corporationwe had a receivable of $198146 million and $305198 million from these vehicles for reimbursement of losses. The Corporation recordsWe record an allowance for creditloan and lease losses on loans referenced by the synthetic securitization vehicles.vehicles without regard to the existence of the purchased loss protection as the protection does not represent a guarantee of individual loans. The reported net charge-offs for the residential mortgage portfolio do not include the benefit of amounts reimbursable from these vehicles. Adjusting for the benefit of the credit protection from the synthetic securitizations, the residential mortgage net charge-off ratio,
excluding the PCI and fully-insured loan portfolios, in 2013 and 2012 would have been reduced by three bps and nine bps.
The long-term stand-by agreements with FNMA and FHLMC and to a lesser extent the synthetic securitizations together reduce our regulatory risk-weighted assets due to the transfer of a portion of our credit risk to unaffiliated parties. At December 31, 2013 and 2012, these programs had the cumulative effect of reducing our risk-weighted assets by $8.4 billion and $7.2 billion and increasing our Tier 1 capital ratio by eight bps and increasing our Tier 1 common capital ratio by seven bps at both year ends.
Table 3028 presents certain residential mortgage key credit statistics on both a reported basis excluding loans accounted for under the fair value option, and excluding the PCI loan portfolio, our fully-insured loan portfolio and loans accounted for under the fair value option. Additionally, in the “Reported Basis” columns in the table below, accruing balances past due and nonperforming loans do not include the PCI loan portfolio, in accordance with our accounting policies, even though the customer may be contractually past due. As such, the following discussion presents the residential mortgage portfolio excluding the PCI loan portfolio, the fully-insured loan portfolio and loans accounted for under the fair value option. For more information on the PCI loan portfolio, see page 8578.
| | | | | | | | | | | | | | | | | | | |
| Table 30 | Residential Mortgage – Key Credit Statistics | |
| Table 28 | | Residential Mortgage – Key Credit Statistics |
| | | | | | | | | | | | | | | | | |
| | | December 31 | | December 31 |
| | | Reported Basis (1) | | Excluding Purchased
Credit-impaired and
Fully-insured Loans | | Reported Basis (1) | | Excluding Purchased
Credit-impaired and
Fully-insured Loans |
| (Dollars in millions) | (Dollars in millions) | 2013 | | 2012 | | 2013 | | 2012 | (Dollars in millions) | 2014 | | 2013 | | 2014 | | 2013 |
| Outstandings | Outstandings | $ | 248,066 |
| | $ | 252,929 |
| | $ | 142,147 |
| | $ | 144,624 |
| Outstandings | $ | 216,197 |
| | $ | 248,066 |
| | $ | 136,075 |
| | $ | 142,147 |
|
| Accruing past due 30 days or more | Accruing past due 30 days or more | 23,052 |
| | 28,815 |
| | 2,371 |
| | 3,117 |
| Accruing past due 30 days or more | 16,485 |
| | 23,052 |
| | 1,868 |
| | 2,371 |
|
| Accruing past due 90 days or more | Accruing past due 90 days or more | 16,961 |
| | 22,157 |
| | — |
| | — |
| Accruing past due 90 days or more | 11,407 |
| | 16,961 |
| | — |
| | — |
|
| Nonperforming loans | Nonperforming loans | 11,712 |
| | 15,055 |
| | 11,712 |
| | 15,055 |
| Nonperforming loans | 6,889 |
| | 11,712 |
| | 6,889 |
| | 11,712 |
|
| Percent of portfolio | Percent of portfolio | |
| | |
| | |
| | |
| Percent of portfolio | |
| | |
| | |
| | |
|
Refreshed LTV greater than 90 but less than or equal to 100 | Refreshed LTV greater than 90 but less than or equal to 100 | 12 | % | | 15 | % | | 7 | % | | 10 | % | Refreshed LTV greater than 90 but less than or equal to 100 | 9 | % | | 11 | % | | 6 | % | | 8 | % |
Refreshed LTV greater than 100 | Refreshed LTV greater than 100 | 13 |
| | 28 |
| | 10 |
| | 20 |
| Refreshed LTV greater than 100 | 12 |
| | 17 |
| | 7 |
| | 11 |
|
| Refreshed FICO below 620 | Refreshed FICO below 620 | 21 |
| | 23 |
| | 11 |
| | 14 |
| Refreshed FICO below 620 | 16 |
| | 20 |
| | 8 |
| | 11 |
|
2006 and 2007 vintages (2)(3) | 2006 and 2007 vintages (2)(3) | 21 |
| | 25 |
| | 27 |
| | 34 |
| 2006 and 2007 vintages (2)(3) | 19 |
| | 21 |
| | 22 |
| | 27 |
|
Net charge-off ratio (3)(4) | Net charge-off ratio (3)(4) | 0.42 |
| | 1.18 |
| | 0.74 |
| | 2.04 |
| Net charge-off ratio (3)(4) | (0.05 | ) | | 0.42 |
| | (0.08 | ) | | 0.74 |
|
| |
(1) | Outstandings, accruing past due, nonperforming loans and percentages of portfolio exclude loans accounted for under the fair value option. There were $2.01.9 billion and $1.02.0 billion of residential mortgage loans accounted for under the fair value option at December 31, 20132014 and 20122013. For more information on the fair value option, see Consumer Portfolio Credit Risk Management – Consumer Loans Accounted for Under the Fair Value Option on page 8982 and Note 21 – Fair Value Option to the Consolidated Financial Statements. |
| |
(2) | Effective December 31, 2014, with the exception of high-value properties, underlying values for LTV ratios are primarily determined using automated valuation models. For high-value properties, generally with an original value of $1 million or more, estimated property values are determined using the CoreLogic Case-Shiller Index. Prior-period values have been updated to reflect this change. Previously reported values were primarily determined through an index-based approach. |
| |
(3) | These vintages of loans account for $2.8 billion, or 41 percent, and $6.2 billion, or 53 percent and 61 percent, of nonperforming residential mortgage loans at December 31, 20132014 and 20122013,. Additionally, these vintages contributed net recoveries of $233 million to residential mortgage net recoveries in 2014 and $653 million, or 60 percent and 71 percent, of total residential mortgage net charge-offs in 2013 and 2012. |
| |
(3)(4)
| Net charge-off ratios are calculated as net charge-offs divided by average outstanding loans excluding loans accounted for under the fair value option. |
Nonperforming residential mortgage loans decreased $3.34.8 billion in 20132014 as sales of $4.1 billion, paydowns, returns to performing status, charge-offs, and transfers to foreclosed properties and held-for-sale outpaced new inflows. Also impactingOf the decrease were sales of nonperforming residential mortgage loans of $1.5 billion and transfers to held-for-sale of $663 million, of which $273 million had been sold prior to December 31, 2013.
Atat December 31, 20132014, borrowers$1.8 billion, or 26 percent were current on contractual payments with respect to $3.9payments. Nonperforming loans that are contractually current primarily consist of collateral-dependent TDRs, including those that have
been discharged in Chapter 7 bankruptcy, as well as loans that have not yet demonstrated a sustained period of payment performance. In addition, $3.8 billion, or 34 percent of nonperforming residential mortgage loans, and $5.8 billion, or 4955 percent of nonperforming residential mortgage loans were 180 days or more past due and had been written down to the estimated fair value of the collateral, less costs to sell. Accruing loans past due 30 days or more decreased $746503 million in 20132014.
Net charge-offs decreased $2.01.2 billion to a net recovery of $1.1 billion114 million in 20132014, or 0.74(0.08) percent of total average residential mortgage loans,
compared to net charge-offs of $3.11.1 billion, or 2.040.74 percent, in 20122013. This decrease in net charge-offs was primarily driven by favorable portfolio trends and decreased write-downs on loans greater than 180 days past due, which were written down to the estimated fair value of the collateral, less costs to sell, due in part to improvement in home prices and the U.S. economy.
Loans in the residential mortgage portfolio with certain characteristics have greater risk of loss than others. These characteristics include loans with a high refreshed loan-to-value (LTV), loans originated at the peak of home prices in 2006 and 2007, interest-only loans and loans to borrowers located in California and Florida where we have concentrations and where significant declines in home prices had been experienced. Although the disclosures in this section address each of these risk characteristics separately, there is significant overlap in loans with these characteristics, which contributed to a disproportionate
share of the losses in the portfolio. The residential mortgage loans with all of these higher risk characteristics comprised two percent and four percent of the residential mortgage portfolio at December 31, 2013 and 2012, and accounted for 10 percent and 20 percent of the residential mortgage In addition, net charge-offs declined due to the impact of recoveries of $407 million related to nonperforming loan sales in 2013 and 20122014.
Residential mortgage loans with a greater than 90 percent but less than or equal to 100 percent refreshed LTVloan-to-value (LTV) represented sevensix percent and 10eight percent of the residential mortgage portfolio at December 31, 20132014 and 20122013. Loans with a refreshed LTV greater than 100 percent represented 10seven percent and 2011 percent of the residential mortgage loan portfolio at December 31, 20132014 and 20122013. Of the loans with a refreshed LTV greater than 100 percent, 9496 percent and 9295 percent were performing at December 31, 20132014 and 20122013. Loans with a refreshed LTV greater than 100 percent reflect loans where the outstanding carrying value of the loan is greater than the most recent valuation of the property securing the loan. The majority of these loans have a refreshed LTV greater than 100 percent primarily due to home price deterioration since 2006, somewhat mitigated by recentsubsequent appreciation. Loans to borrowers with refreshed FICO scores below 620 represented 11eight percent and 1411 percent of the residential mortgage portfolio at December 31, 20132014 and 20122013.
Of the $142.1136.1 billion in total residential mortgage loans outstanding at December 31, 2013,2014, as shown in Table 3129, 4039 percent were originated as interest-only loans. The outstanding balance of interest-only residential mortgage loans that have entered the amortization period was $15.4$12.5 billion, or 2723 percent
at December 31, 20132014. Residential mortgage loans that have entered the amortization period generally have experienced a higher rate of early stage delinquencies and nonperforming status compared to the residential mortgage portfolio as a whole. At December 31, 20132014, $320$256 million, or two percent of outstanding interest-only residential mortgages that had entered the amortization period were accruing past due 30 days or more compared to $2.41.9 billion, or twoone percent for the entire residential mortgage portfolio. In addition, at December 31, 20132014, $2.5 billion,$862 million, or 17seven percent of outstanding interest-only residential mortgages that had entered the amortization period were nonperforming, of which $441 million were contractually current, compared to $11.76.9 billion, or eightfive percent for the entire residential mortgage portfolio.portfolio, of which $1.8 billion were contractually current. Loans in our interest-only residential mortgage portfolio have an interest-only period of three to ten years and more than 90 percent of these loans that have yet to enter the amortization period will not be required to make a fully-amortizing payment until 20152016 or later.
Table 3129 presents outstandings, nonperforming loans and net charge-offs by certain state concentrations for the residential mortgage portfolio. The Los Angeles-Long Beach-Santa Ana Metropolitan Statistical Area (MSA) within California represented 13 percent and 12 percent of outstandings at both December 31, 20132014 and 20122013. LoansIn 2014, loans within this MSA comprised onlycontributed net recoveries of $81 million within the residential mortgage portfolio. In 2013, loans within this MSA contributed three percent and eight percent of net charge-offs in 2013 and 2012.within the residential mortgage portfolio. In the New York area, the New York-Northern New Jersey-Long Island MSA made up 11 percent and 10 percent of outstandings at both December 31, 20132014 and 20122013. LoansIn 2014, loans within this MSA comprisedcontributed net charge-offs of $27 million within the residential mortgage portfolio. In 2013, loans within this MSA contributed 11 percent and five percent of net charge-offs in 2013 and 2012.within the residential mortgage portfolio.
| | | | | | | | | | | | | | | | | | | | | | | | | | | |
| Table 31 | Residential Mortgage State Concentrations | |
| Table 29 | | Residential Mortgage State Concentrations |
| | | | | | | | | | | | | | | | | | | | | | | | | |
| | | December 31 | | | | December 31 | | |
| | | Outstandings (1) | | Nonperforming (1) | | Net Charge-offs (2) | | Outstandings (1) | | Nonperforming (1) | | Net Charge-offs (2) |
| (Dollars in millions) | (Dollars in millions) | 2013 | | 2012 | | 2013 | | 2012 | | 2013 | | 2012 | (Dollars in millions) | 2014 | | 2013 | | 2014 | | 2013 | | 2014 | | 2013 |
| California | California | $ | 47,885 |
| | $ | 48,671 |
| | $ | 3,396 |
| | $ | 4,580 |
| | $ | 148 |
| | $ | 1,139 |
| California | $ | 45,496 |
| | $ | 47,885 |
| | $ | 1,459 |
| | $ | 3,396 |
| | $ | (280 | ) | | $ | 148 |
|
New York (3) | New York (3) | 11,787 |
| | 11,290 |
| | 789 |
| | 972 |
| | 59 |
| | 82 |
| New York (3) | 11,826 |
| | 11,787 |
| | 477 |
| | 789 |
| | 15 |
| | 59 |
|
Florida (3) | Florida (3) | 10,777 |
| | 11,100 |
| | 1,359 |
| | 1,773 |
| | 117 |
| | 371 |
| Florida (3) | 10,116 |
| | 10,777 |
| | 858 |
| | 1,359 |
| | (43 | ) | | 117 |
|
| Texas | Texas | 6,766 |
| | 6,928 |
| | 407 |
| | 498 |
| | 25 |
| | 55 |
| Texas | 6,635 |
| | 6,766 |
| | 269 |
| | 407 |
| | 1 |
| | 25 |
|
| Virginia | Virginia | 4,774 |
| | 5,096 |
| | 369 |
| | 410 |
| | 31 |
| | 52 |
| Virginia | 4,402 |
| | 4,774 |
| | 244 |
| | 369 |
| | 4 |
| | 31 |
|
| Other U.S./Non-U.S. | Other U.S./Non-U.S. | 60,158 |
| | 61,539 |
| | 5,392 |
| | 6,822 |
| | 704 |
| | 1,412 |
| Other U.S./Non-U.S. | 57,600 |
| | 60,158 |
| | 3,582 |
| | 5,392 |
| | 189 |
| | 704 |
|
Residential mortgage loans (4) | Residential mortgage loans (4) | $ | 142,147 |
| | $ | 144,624 |
| | $ | 11,712 |
| | $ | 15,055 |
| | $ | 1,084 |
| | $ | 3,111 |
| Residential mortgage loans (4) | $ | 136,075 |
| | $ | 142,147 |
| | $ | 6,889 |
| | $ | 11,712 |
| | $ | (114 | ) | | $ | 1,084 |
|
| Fully-insured loan portfolio | Fully-insured loan portfolio | 87,247 |
| | 90,854 |
| | |
| | |
| | |
| | |
| Fully-insured loan portfolio | 64,970 |
| | 87,247 |
| | |
| | |
| | |
| | |
|
| Purchased credit-impaired residential mortgage loan portfolio | Purchased credit-impaired residential mortgage loan portfolio | 18,672 |
| | 17,451 |
| | |
| | |
| | |
| | |
| Purchased credit-impaired residential mortgage loan portfolio | 15,152 |
| | 18,672 |
| | |
| | |
| | |
| | |
|
| Total residential mortgage loan portfolio | Total residential mortgage loan portfolio | $ | 248,066 |
| | $ | 252,929 |
| | |
| | |
| | |
| | |
| Total residential mortgage loan portfolio | $ | 216,197 |
| | $ | 248,066 |
| | |
| | |
| | |
| | |
|
| |
(1) | Outstandings and nonperforming amounts exclude loans accounted for under the fair value option. There were $2.01.9 billion and $1.02.0 billion of residential mortgage loans accounted for under the fair value option at December 31, 20132014 and 20122013. For more information on the fair value option, see Consumer Portfolio Credit Risk Management – Consumer Loans Accounted for Under the Fair Value Option on page 8982 and Note 21 – Fair Value Option to the Consolidated Financial Statements. |
| |
(2) | Net charge-offs exclude $1.1 billion545 million of write-offs in the residential mortgage PCI loan portfolio in 20132014 compared to none$1.1 billion in 20122013. These write-offs decreased the PCI valuation allowance included as part of the allowance for loan and lease losses. For more information on PCI write-offs, see Consumer Portfolio Credit Risk Management – Purchased Credit-impaired Loan Portfolio on page 8578. |
| |
(3) | In these states, foreclosure requires a court order following a legal proceeding (judicial states). |
| |
(4) | Amount excludes the PCI residential mortgage and fully-insured loan portfolios. |
The Community Reinvestment Act (CRA) encourages banks to meet the credit needs of their communities for housing and other purposes, particularly in neighborhoods with low or moderate incomes. Our CRA portfolio was $10.3$9.0 billion and $11.3$10.3 billion at December 31, 20132014 and 20122013, or seven percent and eight percent of the residential mortgage portfolio.portfolio, at both December 31, 2014 and 2013. The CRA portfolio included
$1.7 billion $986 million and $2.5$1.7 billion of nonperforming loans at December 31, 20132014 and 20122013, representing 14 percent and 16 percent of total nonperforming residential mortgage loans.loans, at both December 31, 2014 and 2013. Net charge-offs in the CRA portfolio were $260$52 million and $641compared to net recoveries of $114 million for the residential mortgage portfolio in 20132014 and 2012, or 24 percent and 21 percent$260 million of the $1.1 billion total net charge-offs for the residential mortgage portfolio.portfolio in 2013.
Home Equity
At December 31, 20132014, the home equity portfolio made up 18 percent of the consumer portfolio and is comprised of HELOCs, home equity loans and reverse mortgages.
At December 31, 20132014, our HELOC portfolio had an outstanding balance of $80.3$74.2 billion, or 8687 percent of the total home equity portfolio compared to $91.3$80.3 billion, or 8586 percent, at December 31, 20122013. HELOCs generally have an initial draw period of 10 years. During the initial draw period, the borrowers are only required to pay the interest due on the loans on a monthly basis. After the initial draw period ends, the loans generally convert to 15-year amortizing loans.
At December 31, 20132014, our home equity loan portfolio had an outstanding balance of $12.0$9.8 billion, or 1311 percent of the total home equity portfolio compared to $15.3$12.0 billion, or 1413 percent, at December 31, 20122013. Home equity loans are almost all fixed-rate loans with amortizing payment terms of 10 to 30 years and of the $12.0$9.8 billion at December 31, 20132014, 5153 percent of these loans have 25- to 30-year terms. At both December 31, 2013 and 20122014, our reverse mortgage portfolio had an outstanding balance, excluding loans accounted for under
the fair value option, of $1.4$1.7 billion, or onetwo percent of the total home equity portfolio.portfolio compared to $1.4 billion, or one percent, at December 31, 2013. We no longer originate these products.reverse mortgages.
At December 31, 20132014, approximately 9190 percent of the home equity portfolio was included in CRES while the remainder of the portfolio was primarily in GWIM. Outstanding balances in the home equity portfolio, excluding loans accounted for under the fair value option, decreased $14.57.9 billion in 20132014 primarily due to paydowns
and charge-offs outpacing new originations and draws on existing lines. Of the total home equity portfolio at December 31, 20132014 and 20122013, $23.0$20.6 billion and $24.7$20.7 billion, or 2524 percent and 2322 percent, were in first-lien positions (26 percent and 2524 percent excluding the PCI home equity portfolio). At December 31, 20132014, outstanding balances in the home equity portfolio that were in a second-lien or more junior-lien position and where we also held the first-lien loan totaled $17.6$15.4 billion, or 2019 percent of our total home equity portfolio excluding the PCI loan portfolio.
Unused HELOCs totaled $56.853.7 billion and $60.956.8 billion at December 31, 20132014 and 20122013. ThisThe decrease was primarily due to customers choosing to close accounts, which more than offset customer paydowns of principal balances, as well as the impact of new production. The HELOC utilization rate was 58 percent and 59 percent at December 31, 20132014 compared to 60 percent atand December 31, 20122013.
Table 3230 presents certain home equity portfolio key credit statistics on both a reported basis excluding loans accounted for under the fair value option, and excluding the PCI loan portfolio.portfolio and loans accounted for under the fair value option. Additionally, in the “Reported Basis” columns in the table below, accruing balances past due 30 days or more and nonperforming loans do not include the PCI loan portfolio, in accordance with our accounting policies, even though the customer may be contractually past due. As such, the following discussion presents the home equity portfolio excluding the PCI loan portfolio and loans accounted for under the fair value option. For more information on the PCI loan portfolio, see page 8578.
| | | | | | | | | | | | | | | | | | | |
| Table 32 | Home Equity – Key Credit Statistics | |
| Table 30 | | Home Equity – Key Credit Statistics |
| | | | | | | | | | | | | | | | | |
| | | December 31 | | December 31 |
| | | Reported Basis (1) | | Excluding Purchased
Credit-impaired Loans | | Reported Basis (1) | | Excluding Purchased
Credit-impaired Loans |
| (Dollars in millions) | (Dollars in millions) | 2013 | | 2012 | | 2013 | | 2012 | (Dollars in millions) | 2014 | | 2013 | | 2014 | | 2013 |
| Outstandings | Outstandings | $ | 93,672 |
| | $ | 108,140 |
| | $ | 87,079 |
| | $ | 99,473 |
| Outstandings | $ | 85,725 |
| | $ | 93,672 |
| | $ | 80,108 |
| | $ | 87,079 |
|
Accruing past due 30 days or more (2) | Accruing past due 30 days or more (2) | 901 |
| | 1,099 |
| | 901 |
| | 1,099 |
| Accruing past due 30 days or more (2) | 640 |
| | 901 |
| | 640 |
| | 901 |
|
Nonperforming loans (2) | Nonperforming loans (2) | 4,075 |
| | 4,282 |
| | 4,075 |
| | 4,282 |
| Nonperforming loans (2) | 3,901 |
| | 4,075 |
| | 3,901 |
| | 4,075 |
|
| Percent of portfolio | Percent of portfolio | |
| | |
| | |
| | |
| Percent of portfolio | |
| | |
| | |
| | |
|
| Refreshed combined LTV greater than 90 but less than or equal to 100 | 9 | % | | 10 | % | | 9 | % | | 10 | % | |
| Refreshed combined LTV greater than 100 | 22 |
| | 31 |
| | 19 |
| | 29 |
| |
Refreshed CLTV greater than 90 but less than or equal to 100 (3) | | Refreshed CLTV greater than 90 but less than or equal to 100 (3) | 8 | % | | 9 | % | | 7 | % | | 8 | % |
Refreshed CLTV greater than 100 (3) | | Refreshed CLTV greater than 100 (3) | 16 |
| | 23 |
| | 14 |
| | 21 |
|
| Refreshed FICO below 620 | Refreshed FICO below 620 | 8 |
| | 9 |
| | 8 |
| | 8 |
| Refreshed FICO below 620 | 8 |
| | 8 |
| | 7 |
| | 8 |
|
2006 and 2007 vintages (3)(4) | 2006 and 2007 vintages (3)(4) | 48 |
| | 48 |
| | 45 |
| | 46 |
| 2006 and 2007 vintages (3)(4) | 46 |
| | 48 |
| | 43 |
| | 45 |
|
Net charge-off ratio (4)(5) | Net charge-off ratio (4)(5) | 1.80 |
| | 3.62 |
| | 1.94 |
| | 3.99 |
| Net charge-off ratio (4)(5) | 1.01 |
| | 1.80 |
| | 1.09 |
| | 1.94 |
|
| |
(1) | Outstandings, accruing past due, nonperforming loans and percentages of the portfolio exclude loans accounted for under the fair value option. There were$196 million and $147 million of home equity loans accounted for under the fair value option at December 31, 2014 and 2013 compared to none at December 31, 2012. For more information on the fair value option, see Consumer Portfolio Credit Risk Management – Consumer Loans Accounted for Under the Fair Value Option on page 8982 and Note 21 – Fair Value Option to the Consolidated Financial Statements. |
| |
(2) | Accruing past due 30 days or more includes $16498 million and $321131 million and nonperforming loans includes $410505 million and $824582 million of loans where we serviced the underlying first-lien at December 31, 20132014 and 20122013. |
| |
(3) | Effective December 31, 2014, with the exception of high-value properties, underlying values for LTV ratios are primarily determined using automated valuation models. For high-value properties, generally with an original value of $1 million or more, estimated property values are determined using the CoreLogic Case-Shiller Index. Prior-period values have been updated to reflect this change. Previously reported values were primarily determined through an index-based approach. |
| |
(4) | These vintages of loans have higher refreshed combined LTV ratios and accounted for 5047 percent and 5150 percent of nonperforming home equity loans at December 31, 20132014 and 20122013, and accounted for 6359 percent and 6063 percent of net charge-offs in 20132014 and 20122013. |
| |
(4)(5)
| Net charge-off ratios are calculated as net charge-offs divided by average outstanding loans excluding loans accounted for under the fair value option. |
Nonperforming outstanding balances in the home equity portfolio decreased$207 $174 million in 20132014 primarily due to charge-offs and returns to performingenhanced identification of the delinquency status outpacing new inflows.
At December 31, 2013, on $2.0 billion, or 48 percent offirst-lien loans serviced by other financial institutions. This was partially offset by an increase in contractually current nonperforming loans where the loan has been modified in a TDR. Of the nonperforming home equity loans, the borrowersportfolio at December 31, 2014, $1.8 billion, or 45 percent, were current on contractual payments. At December 31, 2013,Nonperforming loans that are contractually current primarily consist of collateral-dependent TDRs, including those that have been discharged in Chapter 7 bankruptcy, junior-lien loans where the underlying first is 90 days or more past due, as well as loans that have not yet demonstrated a sustained period of payment performance. In addition, $1.4 billion, or 3537 percent of nonperforming home equity loans, were 180 days or more past due and had been written down to the estimated fair value of the collateral, less costs to sell. Outstanding balances accruing past due 30 days or more decreased$198 $261 million in 2013.2014.
In some cases, the junior-lien home equity outstanding balance that we hold is performing, but the underlying first-lien is not. For outstanding balances in the home equity portfolio on which we service the first-lien loan, we are able to track whether the first-lien loan is in default. For loans where the first-lien is serviced by a third party, we utilize credit bureau data to estimate the delinquency status of the first-lien. Given that the credit bureau database we use does not include a property address for the mortgages, we are unable to identify with certainty whether a reported delinquent first-lien mortgage pertains to the same property for which we hold a junior-lien loan. We also utilize a third-party vendor to combine credit bureau and public record data to better link a junior-lien loan with the underlying first-lien mortgage. At December 31, 20132014, we estimate that $2.1$1.7 billion of current and $382$217 million
of 30 to 89 days past due junior-lien loans were behind a delinquent first-lien loan. We service the first-lien loans on $421$279 million of these combined amounts, with the remaining $2.1$1.6 billion serviced by third parties. Of the $2.5$1.9 billion of current to 89 days past due junior-lien loans, based on available credit bureau data and our own internal servicing data, we estimate that approximately $1.2 billion$800 million had first-lien loans that were 90 days or more past due.
Net charge-offs decreased $2.4 billion896 million to $907 million, or 1.09 percent of the total average home equity portfolio in 2014, compared to $1.8 billion, or 1.94 percent of the total average home equity portfolio, in 2013 compared to $4.2 billion, or 3.99 percent in 2012. The decrease in net charge-offs was primarily driven by favorable portfolio trends due in part to improvement in home prices and the U.S. economy. Also, 2012 included charge-offs associated with the National Mortgage Settlement and loans discharged in Chapter 7 bankruptcy due to the implementation of regulatory guidance in 2012. The net charge-off ratio in ratios for 2014 and 2013 was were also impacted by lower outstanding balances primarily as a result of paydowns and charge-offs outpacing new originations and draws on existing lines.
There are certain characteristics of the home equity portfolio that have contributed to higher losses including those loans with a high refreshed combined loan-to-value (CLTV), loans that were originated at the peak of home prices in 2006 and 2007, and loans in geographic areas that have experienced the most significant declines in home prices. Although we have seen recent home price appreciation, home price declines since 2006 coupled with the fact that most home equity outstandings are secured by second-lien positions have significantly reduced and, in some cases, eliminated all collateral value after consideration of the first-lien position. Although the disclosures in this section address each of these risk characteristics separately, there is significant overlap in outstanding balances with these characteristics, which has contributed to a disproportionate share of losses in the portfolio. Outstanding balances in the home equity portfolio with all of these higher risk characteristics comprised five percent and eight percent of the total home equity portfolio at December 31, 2013 and 2012, and accounted for 20 percent of the home equity net charge-offs in 2013 compared to 24 percent in 2012.
Outstanding balances in the home equity portfolio with greater than 90 percent but less than or equal to 100 percent refreshed CLTVscombined loan-to-value (CLTVs) comprised nineseven percent and 10eight percent of the home equity portfolio at December 31, 20132014 and 20122013. Outstanding balances with refreshed CLTVs greater than
100 percent comprised 1914 percent and 2921 percent of the home equity portfolio at December 31, 20132014 and 20122013. Outstanding balances in the home equity portfolio with a refreshed CLTV greater than 100 percent reflect
loans where the carrying value and available line of credit of the combined loans are equal to or greater than the most recent valuation of the property securing the loan. Depending on the value of the property, there may be collateral in excess of the first-lien that is available to reduce the severity of loss on the second-lien. Home price deterioration since 2006, somewhatpartially mitigated by recentsubsequent appreciation, has contributed to an increase in CLTV ratios. Of those outstanding balances with a refreshed CLTV greater than 100 percent, 9697 percent of the customers were current on their home equity loan and 9193 percent of second-lien loans with a refreshed CLTV greater than 100 percent were current on both their second-lien and underlying first-lien loans at December 31, 20132014. Outstanding balances in the home equity portfolio to borrowers with a refreshed FICO score below 620 represented seven percent and eight percent of the home equity portfolio at both December 31, 20132014 and 20122013.
Of the $87.180.1 billion in total home equity portfolio outstandings at December 31, 2013,2014, as shown in Table 33, 7631, 75 percent were interest-only loans, almost all of which were HELOCs. The outstanding balance of HELOCs that have entered the amortization period was $2.6$5.3 billion, or threeseven percent of total HELOCs at December 31, 20132014. The HELOCs that have entered the amortization period have experienced a higher percentage of early stage delinquencies and nonperforming status when compared to the HELOC portfolio as a whole. At December 31, 20132014, $78$135 million, or three percent of outstanding HELOCs that had entered the amortization period were accruing past due 30 days or more compared to $817$581 million, or one percent for the entire HELOC portfolio. In addition, at December 31, 20132014, $211$817 million, or eight15 percent of outstanding HELOCs that had entered the amortization period were nonperforming, of which $373 million were contractually current, compared to $3.6$3.5 billion, or fourfive percent for the entire HELOC portfolio.portfolio, of which $1.5 billion were contractually current. Loans in our HELOC portfolio generally have an initial draw period of 10 years and more than 8575 percent of these loans that have yet to enter the amortization period will not be required to make a fully-amortizing payment until 20152016 or later. We communicate to contractually current customers more than a year prior to the end of their draw period to inform them of the potential change to the payment structure before entering the amortization period, and provide payment options to customers prior to the end of the draw period.
Although we do not actively track how many of our home equity customers pay only the minimum amount due on their home equity loans and lines, we can infer some of this information through a review of our HELOC portfolio that we service and that is still in its revolving period (i.e., customers may draw on and repay their line of credit, but are generally only required to pay interest on a monthly basis). During 20132014, approximately 41 percent of these customers with an outstanding balance did not pay any principal on their HELOCs.
|
| | |
8477 Bank of America 20132014
| | |
Table 3331 presents outstandings, nonperforming balances and net charge-offs by certain state concentrations for the home equity portfolio. In the New York area, the New York-Northern New Jersey-Long Island MSA made up 12 percent and 11 percent of the outstanding home equity portfolio at both December 31, 20132014 and 20122013. Loans within this MSA comprisedcontributed 14 percent and nine percent and eight percent of net
charge-offs in 20132014 and 20122013. within the home equity portfolio. The Los Angeles-Long Beach-Santa Ana MSA within California made up 12 percent of the outstanding home equity portfolio at both December 31,
2013 2014 and 20122013. Loans within this MSA comprised ninecontributed four percent and 11nine percent of net charge-offs in 20132014 and 20122013.
For more information on representations and warranties related to our within the home equity portfolio, see Off-Balance Sheet Arrangements and Contractual Obligations – Representations and Warranties on page 52 and Note 7 – Representations and Warranties Obligations and Corporate Guaranteesto the Consolidated Financial Statements.portfolio.
| | | | | | | | | | | | | | | | | | | | | | | | | | | |
| Table 33 | Home Equity State Concentrations | |
| Table 31 | | Home Equity State Concentrations |
| | | | | | | | | | | | | | | | | | | | | | | | | |
| | | December 31 | | | | December 31 | | |
| | | Outstandings (1) | | Nonperforming (1) | | Net Charge-offs (2) | | Outstandings (1) | | Nonperforming (1) | | Net Charge-offs (2) |
| (Dollars in millions) | (Dollars in millions) | 2013 | | 2012 | | 2013 | | 2012 | | 2013 | | 2012 | (Dollars in millions) | 2014 | | 2013 | | 2014 | | 2013 | | 2014 | | 2013 |
| California | California | $ | 25,061 |
| | $ | 28,730 |
| | $ | 1,047 |
| | $ | 1,128 |
| | $ | 509 |
| | $ | 1,333 |
| California | $ | 23,250 |
| | $ | 25,061 |
| | $ | 1,012 |
| | $ | 1,047 |
| | $ | 118 |
| | $ | 509 |
|
Florida (3) | Florida (3) | 10,604 |
| | 11,899 |
| | 643 |
| | 706 |
| | 315 |
| | 602 |
| Florida (3) | 9,633 |
| | 10,604 |
| | 574 |
| | 643 |
| | 170 |
| | 315 |
|
New Jersey (3) | New Jersey (3) | 6,153 |
| | 6,789 |
| | 304 |
| | 312 |
| | 93 |
| | 210 |
| New Jersey (3) | 5,883 |
| | 6,153 |
| | 299 |
| | 304 |
| | 68 |
| | 93 |
|
New York (3) | New York (3) | 6,035 |
| | 6,736 |
| | 405 |
| | 419 |
| | 110 |
| | 222 |
| New York (3) | 5,671 |
| | 6,035 |
| | 387 |
| | 405 |
| | 81 |
| | 110 |
|
| Massachusetts | Massachusetts | 3,881 |
| | 4,381 |
| | 144 |
| | 140 |
| | 42 |
| | 91 |
| Massachusetts | 3,655 |
| | 3,881 |
| | 148 |
| | 144 |
| | 30 |
| | 42 |
|
| Other U.S./Non-U.S. | Other U.S./Non-U.S. | 35,345 |
| | 40,938 |
| | 1,532 |
| | 1,577 |
| | 734 |
| | 1,784 |
| Other U.S./Non-U.S. | 32,016 |
| | 35,345 |
| | 1,481 |
| | 1,532 |
| | 440 |
| | 734 |
|
Home equity loans (4) | Home equity loans (4) | $ | 87,079 |
| | $ | 99,473 |
| | $ | 4,075 |
| | $ | 4,282 |
| | $ | 1,803 |
| | $ | 4,242 |
| Home equity loans (4) | $ | 80,108 |
| | $ | 87,079 |
| | $ | 3,901 |
| | $ | 4,075 |
| | $ | 907 |
| | $ | 1,803 |
|
| Purchased credit-impaired home equity portfolio | Purchased credit-impaired home equity portfolio | 6,593 |
| | 8,667 |
| | |
| | |
| | |
| | |
| Purchased credit-impaired home equity portfolio | 5,617 |
| | 6,593 |
| | |
| | |
| | |
| | |
|
| Total home equity loan portfolio | Total home equity loan portfolio | $ | 93,672 |
| | $ | 108,140 |
| | |
| | |
| | |
| | |
| Total home equity loan portfolio | $ | 85,725 |
| | $ | 93,672 |
| | |
| | |
| | |
| | |
|
| |
(1) | Outstandings and nonperforming amounts exclude loans accounted for under the fair value option. There were $196 million and $147 million of home equity loans accounted for under the fair value option at December 31, 2014 and 2013 compared to none at December 31, 2012. For more information on the fair value option, see Consumer Portfolio Credit Risk Management – Consumer Loans Accounted for Under the Fair Value Option on page 8982 and Note 21 – Fair Value Option to the Consolidated Financial Statements. |
| |
(2) | Net charge-offs exclude $1.2 billion265 million of write-offs in the home equity PCI loan portfolio in 20132014 compared to $2.81.2 billion in 20122013. These write-offs decreased the PCI valuation allowance included as part of the allowance for loan and lease losses. For more information on PCI write-offs, see Consumer Portfolio Credit Risk Management – Purchased Credit-impaired Loan Portfolio on page 8578. |
| |
(3) | In these states, foreclosure requires a court order following a legal proceeding (judicial states). |
| |
(4) | Amount excludes the PCI home equity portfolio. |
Purchased Credit-impaired Loan Portfolio
Loans acquired with evidence of credit quality deterioration since origination and for which it is probable at purchase that we will be unable to collect all contractually required payments are accounted for under the accounting guidance for PCI loans, which addresses accounting for differences between contractual and expected cash flows to be collected from the purchaser’s initial investment in loans if those differences are attributable, at least in part, to credit quality. Evidence of credit quality deterioration as of the acquisition date may include statistics such as past due status, refreshed FICO scores and refreshed LTVs.For more information on PCI loans, are recorded at fair value upon acquisition andsee Note 1 – Summary of Significant Accounting Principles to the applicable accounting guidance prohibits carrying over or recording a valuation allowance in the initial accounting.
PCI loans that have similar risk characteristics, primarily credit risk, collateral type and interest rate risk, are pooled and accounted for as a single asset with a single composite interest rate and an aggregate expectation of cash flows. Once a pool is assembled, it is treated as if it were one loan for purposes of applying theConsolidated Financial Statements.
accounting guidance for PCI loans. An individual loan is removed from a PCI loan pool if it is sold, foreclosed, forgiven or the expectation of any future proceeds is remote. When a loan is removed from a PCI loan pool and the foreclosure or recovery value of the loan is less than the loan’s carrying value, the difference is first applied against the PCI pool’s nonaccretable difference. If the nonaccretable difference has been fully utilized, only then is the PCI pool’s basis applicable to that loan written-off against its valuation reserve; however, the integrity of the pool is maintained and it continues to be accounted for as if it were one loan.
In 2013, in connection with the FNMA Settlement, we repurchased certain residential mortgage loans that had previously been sold to FNMA, which we have valued at less than the purchase price. As of December 31, 2013,2014, loans repurchased in connection with the settlement with FNMA Settlement that we classified as PCI had an unpaid principal balance of $5.3$4.4 billion and a carrying value of $4.6$3.8 billion,. of which $4.1 billion of unpaid principal balance and $3.5 billion of carrying value were classified as PCI loans. For additional information, see Note 7 – Representations and Warranties Obligations and Corporate Guaranteesto the Consolidated Financial Statements.Statements.
Table 3432 presents the unpaid principal balance, carrying value, related valuation allowance and the net carrying value as a percentage of the unpaid principal balance for the PCI loan portfolio.
| | | | | | | | | | | | | | | | | | | | | | | |
| Table 34 | Purchased Credit-impaired Loan Portfolio | |
| Table 32 | | Purchased Credit-impaired Loan Portfolio |
| | | | | | | | | | | | | | | | | | | | | |
| | | December 31, 2013 | | December 31, 2014 |
| (Dollars in millions) | (Dollars in millions) | Unpaid
Principal
Balance | | Carrying
Value | | Related
Valuation
Allowance | | Carrying
Value Net of
Valuation
Allowance | | Percent of Unpaid
Principal
Balance | (Dollars in millions) | Unpaid
Principal
Balance | | Carrying
Value | | Related
Valuation
Allowance | | Carrying
Value Net of
Valuation
Allowance | | Percent of Unpaid
Principal
Balance |
| Residential mortgage | Residential mortgage | $ | 19,558 |
| | $ | 18,672 |
| | $ | 1,446 |
| | $ | 17,226 |
| | 88.08 | % | Residential mortgage | $ | 15,726 |
| | $ | 15,152 |
| | $ | 880 |
| | $ | 14,272 |
| | 90.75 | % |
| Home equity | Home equity | 6,523 |
| | 6,593 |
| | 1,047 |
| | 5,546 |
| | 85.02 |
| Home equity | 5,605 |
| | 5,617 |
| | 772 |
| | 4,845 |
| | 86.44 |
|
| Total purchased credit-impaired loan portfolio | Total purchased credit-impaired loan portfolio | $ | 26,081 |
| | $ | 25,265 |
| | $ | 2,493 |
| | $ | 22,772 |
| | 87.31 |
| Total purchased credit-impaired loan portfolio | $ | 21,331 |
| | $ | 20,769 |
| | $ | 1,652 |
| | $ | 19,117 |
| | 89.62 |
|
| | | | | | | | | | | | | | | | | | | | | |
| | | December 31, 2012 | | December 31, 2013 |
| Residential mortgage | Residential mortgage | $ | 18,069 |
| | $ | 17,451 |
| | $ | 3,108 |
| | $ | 14,343 |
| | 79.38 | % | Residential mortgage | $ | 19,558 |
| | $ | 18,672 |
| | $ | 1,446 |
| | $ | 17,226 |
| | 88.08 | % |
| Home equity | Home equity | 8,434 |
| | 8,667 |
| | 2,428 |
| | 6,239 |
| | 73.97 |
| Home equity | 6,523 |
| | 6,593 |
| | 1,047 |
| | 5,546 |
| | 85.02 |
|
| Total purchased credit-impaired loan portfolio | Total purchased credit-impaired loan portfolio | $ | 26,503 |
| | $ | 26,118 |
| | $ | 5,536 |
| | $ | 20,582 |
| | 77.66 |
| Total purchased credit-impaired loan portfolio | $ | 26,081 |
| | $ | 25,265 |
| | $ | 2,493 |
| | $ | 22,772 |
| | 87.31 |
|
The total PCI unpaid principal balance decreased $422 million4.8 billion, or two18 percent, in 20132014 primarily driven by liquidations, including sales, payoffs, paydowns and write-offs, partially offset by the $5.3write-offs. During 2014, we sold PCI loans with a carrying value of $1.9 billion compared to sales of loans repurchased$1.3 billion in connection with the FNMA Settlement.2013.
Of the unpaid principal balance of $26.121.3 billion at December 31, 20132014, $4.7$17.0 billion, or 80 percent, was current
based on the contractual terms, $1.5 billion, or seven percent, was in early stage delinquency, and $2.2 billion was 180 days or more past due, including $4.6$2.1 billion of first-lien mortgages and $91$94 million of home equity loans. Of the $21.4 billion that was less than 180 days past due, $18.4 billion, or 86 percent of the total unpaid principal balance was current based on the contractual terms while $2.0 billion, or nine percent, was in early stage delinquency.
During 20132014, we recorded a provision benefit of $707$31 million for the PCI loan portfolio including a provision benefit of $552$21 million for residential mortgage and a provision benefit of $155$10 million for home equity. This compared to a total provision benefit of $103$707 million in 20122013. The provision benefit in 20132014 was primarily driven by an improvementchanges in our home price outlook.liquidation assumptions and improved macro-economic conditions.
The PCI valuation allowance declined $3.0 billion841 million during 20132014 due to write-offs in the PCI loan portfolio of $1.2 billion$545 million in residential mortgage and $265 million in home equity, and $1.1 billion in residential mortgage, and a provision benefit of $707 million for the PCI loan portfolio. Write-offs during 2013 included certain home equity PCI loans that were ineligible for the National Mortgage Settlement, but had similar characteristics as the eligible loans and the expectation of future cash proceeds was considered remote.$31 million.
Purchased Credit-impaired Residential Mortgage Loan Portfolio
The PCI residential mortgage loan portfolio represented 7473 percent of the total PCI loan portfolio at December 31, 20132014. Those loans to borrowers with a refreshed FICO score below 620 represented 5240 percent of the PCI residential mortgage loan portfolio at December 31, 20132014. Loans with a refreshed LTV greater than 90 percent, after consideration of purchase accounting adjustments and the related valuation allowance, represented 3934 percent of the PCI residential mortgage loan portfolio and 5146 percent based on the unpaid principal balance at December 31, 20132014. Table 3533 presents outstandings net of purchase accounting adjustments and before the related valuation allowance, by certain state concentrations.
| | | | | | | | | | | |
| Table 35 | Outstanding Purchased Credit-impaired Loan Portfolio – Residential Mortgage State Concentrations | |
| Table 33 | | Outstanding Purchased Credit-impaired Loan Portfolio – Residential Mortgage State Concentrations |
| | | | | | | | | |
| | | December 31 | | December 31 |
| (Dollars in millions) | (Dollars in millions) | 2013 | | 2012 | (Dollars in millions) | 2014 | | 2013 |
| California | California | $ | 8,180 |
| | $ | 9,238 |
| California | $ | 6,885 |
| | $ | 8,180 |
|
Florida (1) | Florida (1) | 1,750 |
| | 1,797 |
| Florida (1) | 1,289 |
| | 1,750 |
|
| Virginia | Virginia | 760 |
| | 715 |
| Virginia | 640 |
| | 760 |
|
| Maryland | Maryland | 728 |
| | 417 |
| Maryland | 602 |
| | 728 |
|
| Texas | Texas | 433 |
| | 192 |
| Texas | 318 |
| | 433 |
|
| Other U.S./Non-U.S. | Other U.S./Non-U.S. | 6,821 |
| | 5,092 |
| Other U.S./Non-U.S. | 5,418 |
| | 6,821 |
|
| Total | Total | $ | 18,672 |
| | $ | 17,451 |
| Total | $ | 15,152 |
| | $ | 18,672 |
|
| |
(1) | In this state, foreclosure requires a court order following a legal proceeding (judicial state). |
Pay option adjustable-rate mortgages (ARMs), which are included in the PCI residential mortgage portfolio, have interest rates that adjust monthly and minimum required payments that adjust annually, subject to resetting if minimum payments are made and deferred interest limits are reached. Annual payment adjustments are subject to a 7.5 percent maximum change. To ensure that contractual loan payments are adequate to repay a
loan, the fully-amortizing loan payment amount is re-established after the initial five- or ten-year period and again every five years thereafter. These payment adjustments are not subject to the 7.5 percent limit and may be substantial due to changes in interest rates and the addition of unpaid interest to the loan balance. Payment advantage ARMs have interest rates that are fixed for an initial period of five years. Payments are subject to reset if the minimum payments are made and deferred interest limits are reached. If interest deferrals cause a loan’s principal balance to reach a certain level within the first 10 years of the life of the loan, the payment is reset to the interest-only payment; then at the 10-year point, the fully-amortizing payment is required.
The difference between the frequency of changes in a loan’s interest rates and payments along with a limitation on changes in the minimum monthly payments of 7.5 percent per year can result in payments that are not sufficient to pay all of the monthly interest charges (i.e., negative amortization). Unpaid interest is added to the loan balance until the loan balance increases to a specified limit, which can be no more than 115 percent of the original loan amount, at which time a new monthly payment amount adequate to repay the loan over its remaining contractual life is established.
At December 31, 20132014, the unpaid principal balance of pay option loans, which include pay option ARMs and payment advantage ARMs, was $4.5$3.3 billion, with a carrying value of $4.4$3.2 billion, including $4.0$2.8 billion of loans that were credit-impaired upon acquisition and, accordingly, the reserve is based on a life-of-loan loss estimate. The total unpaid principal balance of pay option loans with accumulated negative amortization was $2.2$1.1 billion, including $137$63 million of negative amortization. For those borrowers who are making payments in accordance with their contractual terms, fiveone percent and 10five percent at December 31, 20132014 and 20122013 elected to make only the minimum payment on pay option ARMs.loans. We believe the majority of borrowers are now making scheduled payments primarily because the low rate environment has caused the fully indexed rates to be affordable to more borrowers. We continue to evaluate our exposure to payment resets on the acquired negative-amortizing loans including the PCI pay option loan portfolio and have taken into consideration in the evaluation several assumptions including prepayment and default rates. Of the loans in the pay option portfolio at December 31, 20132014 that have not already experienced a payment reset, less than onetwo percent are expected to reset before 2016, 26in 2015, 32 percent are expected to reset in 2016 and approximately 1011 percent are expected to reset thereafter. In addition, 1018 percent are expected to prepay and approximately 5337 percent are expected to default prior to being reset, most of which were severely delinquent as of December 31, 20132014. We no longer originate pay option loans.
Purchased Credit-impaired Home Equity Loan Portfolio
The PCI home equity portfolio represented 2627 percent of the total PCI loan portfolio at December 31, 20132014. Those loans with a refreshed FICO score below 620 represented 1615 percent of the PCI home equity portfolio at December 31, 20132014. Loans with a refreshed CLTV greater than 90 percent, after consideration of purchase accounting adjustments and the related valuation allowance, represented 6964 percent of the PCI home equity portfolio and 7168 percent based on the unpaid principal balance at December 31, 20132014. Table 3634 presents outstandings net of purchase accounting adjustments and before the related valuation allowance, by certain state concentrations.
| | | | | | | | | | | |
| Table 36 | Outstanding Purchased Credit-impaired Loan Portfolio – Home Equity State Concentrations | |
| Table 34 | | Outstanding Purchased Credit-impaired Loan Portfolio – Home Equity State Concentrations |
| | | | | | | | | |
| | | December 31 | | December 31 |
| (Dollars in millions) | (Dollars in millions) | 2013 | | 2012 | (Dollars in millions) | 2014 | | 2013 |
| California | California | $ | 1,921 |
| | $ | 2,629 |
| California | $ | 1,646 |
| | $ | 1,921 |
|
Florida (1) | Florida (1) | 356 |
| | 524 |
| Florida (1) | 313 |
| | 356 |
|
| Virginia | Virginia | 310 |
| | 383 |
| Virginia | 265 |
| | 310 |
|
| Arizona | Arizona | 214 |
| | 297 |
| Arizona | 188 |
| | 214 |
|
| Colorado | Colorado | 199 |
| | 264 |
| Colorado | 151 |
| | 199 |
|
| Other U.S./Non-U.S. | Other U.S./Non-U.S. | 3,593 |
| | 4,570 |
| Other U.S./Non-U.S. | 3,054 |
| | 3,593 |
|
| Total | Total | $ | 6,593 |
| | $ | 8,667 |
| Total | $ | 5,617 |
| | $ | 6,593 |
|
| |
(1) | In this state, foreclosure requires a court order following a legal proceeding (judicial state). |
U.S. Credit Card
At December 31, 2013,2014, 96 percent of the U.S. credit card portfolio was managed in CBB with the remainder managed in GWIM. Outstandings in the U.S. credit card portfolio decreased $459decreased$2.5 billion
million in 20132014 primarily due to higher payment volumes as well as net charge-offs and the transfer of loans to LHFS, partially offset by new originations.a portfolio divestiture. Net charge-offs decreased$1.3 billion $738 million to $3.4$2.6 billion in 20132014 due to improvements in delinquencies and bankruptcies as a result of an improved economic environment account management on higher risk accounts and the impact of higher credit quality originations. U.S. credit card loans 30 days or more past due and still accruing interest decreased$675 $372 million while loans 90 days or more past due and still accruing interest declined $384decreased $187 million in 20132014 as a result of the factors mentioned above that contributed to lower net charge-offs.
Table 3735 presents certain key credit statistics for the U.S. credit card portfolio.
| | | | | | | | | | | |
| Table 37 | U.S. Credit Card – Key Credit Statistics | |
| Table 35 | | U.S. Credit Card – Key Credit Statistics |
| | | | | |
| | | December 31 | | December 31 |
| (Dollars in millions) | (Dollars in millions) | 2013 | | 2012 | (Dollars in millions) | 2014 | | 2013 |
| Outstandings | Outstandings | $ | 92,338 |
| | $ | 94,835 |
| Outstandings | $ | 91,879 |
| | $ | 92,338 |
|
| Accruing past due 30 days or more | Accruing past due 30 days or more | 2,073 |
| | 2,748 |
| Accruing past due 30 days or more | 1,701 |
| | 2,073 |
|
| Accruing past due 90 days or more | Accruing past due 90 days or more | 1,053 |
| | 1,437 |
| Accruing past due 90 days or more | 866 |
| | 1,053 |
|
| | | | | | | | | |
| | | 2013 | | 2012 | | 2014 | | 2013 |
| Net charge-offs | Net charge-offs | $ | 3,376 |
| | $ | 4,632 |
| Net charge-offs | $ | 2,638 |
| | $ | 3,376 |
|
Net charge-off ratios (1) | Net charge-off ratios (1) | 3.74 | % | | 4.88 | % | Net charge-off ratios (1) | 2.96 | % | | 3.74 | % |
| |
(1) | Net charge-off ratios are calculated as net charge-offs divided by average outstanding loans. |
Unused lines of credit for U.S. credit card totaled $305.9 billion and $315.1 billion and $335.5 billion at December 31, 20132014 and 2012.2013. The $20.4$9.2 billion decrease was driven by the closure of inactive accounts partially offset by new originations and a portfolio divestiture.
Table 36 presents certain state concentrations for the U.S. credit line increases.card portfolio.
|
| | | | | | | | | | | | | | | | | | | | | | | | |
| | | | | | | | | | | | | |
| Table 36 | U.S. Credit Card State Concentrations |
| | | | | | | | | | | | | |
| | | December 31 | | |
| | | Outstandings | | Accruing Past Due
90 Days or More | | Net Charge-offs |
| (Dollars in millions) | 2014 | | 2013 | | 2014 | | 2013 | | 2014 | | 2013 |
| California | $ | 13,682 |
| | $ | 13,689 |
| | $ | 127 |
| | $ | 162 |
| | $ | 414 |
| | $ | 562 |
|
| Florida | 7,530 |
| | 7,339 |
| | 89 |
| | 105 |
| | 278 |
| | 359 |
|
| Texas | 6,586 |
| | 6,405 |
| | 58 |
| | 72 |
| | 177 |
| | 217 |
|
| New York | 5,655 |
| | 5,624 |
| | 59 |
| | 70 |
| | 174 |
| | 219 |
|
| New Jersey | 3,943 |
| | 3,868 |
| | 40 |
| | 48 |
| | 116 |
| | 150 |
|
| Other U.S. | 54,483 |
| | 55,413 |
| | 493 |
| | 596 |
| | 1,479 |
| | 1,869 |
|
| Total U.S. credit card portfolio | $ | 91,879 |
| | $ | 92,338 |
| | $ | 866 |
| | $ | 1,053 |
| | $ | 2,638 |
| | $ | 3,376 |
|
|
| | |
| | | Bank of America 20132014 8780 |
Table 38 presents certain state concentrations for the U.S. credit card portfolio.
|
| | | | | | | | | | | | | | | | | | | | | | | | |
| | | | | | | | | | | | | |
| Table 38 | U.S. Credit Card State Concentrations |
| | | | | | | | | | | | | |
| | | December 31 | | |
| | | Outstandings | | Accruing Past Due
90 Days or More | | Net Charge-offs |
| (Dollars in millions) | 2013 | | 2012 | | 2013 | | 2012 | | 2013 | | 2012 |
| California | $ | 13,689 |
| | $ | 14,101 |
| | $ | 162 |
| | $ | 235 |
| | $ | 562 |
| | $ | 840 |
|
| Florida | 7,339 |
| | 7,469 |
| | 105 |
| | 149 |
| | 359 |
| | 512 |
|
| Texas | 6,405 |
| | 6,448 |
| | 72 |
| | 92 |
| | 217 |
| | 290 |
|
| New York | 5,624 |
| | 5,746 |
| | 70 |
| | 91 |
| | 219 |
| | 263 |
|
| New Jersey | 3,868 |
| | 3,959 |
| | 48 |
| | 60 |
| | 150 |
| | 178 |
|
| Other U.S. | 55,413 |
| | 57,112 |
| | 596 |
| | 810 |
| | 1,869 |
| | 2,549 |
|
| Total U.S. credit card portfolio | $ | 92,338 |
| | $ | 94,835 |
| | $ | 1,053 |
| | $ | 1,437 |
| | $ | 3,376 |
| | $ | 4,632 |
|
Non-U.S. Credit Card
Outstandings in the non-U.S. credit card portfolio, which are recorded in All Other, decreased $156 million1.1 billion in 20132014 due to higher payment volumes as well as net charge-offs, partially offset by new origination volumea portfolio divestiture and a stronger foreign currency exchange rate.weakening of the British Pound against the U.S. Dollar. Net charge-offs decreased $182157 million to $399242 million in 20132014 due primarily to improvement in delinquencies as a result of higher credit quality originations.originations and an improved economic environment, as well as improved recovery rates on previously charged-off loans.
Unused lines of credit for non-U.S. credit card totaled $31.1$28.2 billion and $32.2$31.1 billion at December 31, 20132014 and 20122013. The $1.1$2.9 billion decrease was driven by closureweakening of accounts, partially offset by new originations, credit line increasesthe British Pound against the U.S. Dollar and a stronger foreign currency exchange rate.portfolio divestiture.
Table 3937 presents certain key credit statistics for the non-U.S. credit card portfolio.
| | | | | | | | | | | |
| Table 39 | Non-U.S. Credit Card – Key Credit Statistics | |
| Table 37 | | Non-U.S. Credit Card – Key Credit Statistics |
| | | | | |
| | | December 31 | | December 31 |
| (Dollars in millions) | (Dollars in millions) | 2013 | | 2012 | (Dollars in millions) | 2014 | | 2013 |
| Outstandings | Outstandings | $ | 11,541 |
| | $ | 11,697 |
| Outstandings | $ | 10,465 |
| | $ | 11,541 |
|
| Accruing past due 30 days or more | Accruing past due 30 days or more | 248 |
| | 403 |
| Accruing past due 30 days or more | 183 |
| | 248 |
|
| Accruing past due 90 days or more | Accruing past due 90 days or more | 131 |
| | 212 |
| Accruing past due 90 days or more | 95 |
| | 131 |
|
| | | | | | | | | |
| | | 2013 | | 2012 | | 2014 | | 2013 |
| Net charge-offs | Net charge-offs | $ | 399 |
| | $ | 581 |
| Net charge-offs | $ | 242 |
| | $ | 399 |
|
Net charge-off ratios (1) | Net charge-off ratios (1) | 3.68 | % | | 4.29 | % | Net charge-off ratios (1) | 2.10 | % | | 3.68 | % |
| |
(1) | Net charge-off ratios are calculated as net charge-offs divided by average outstanding loans. |
Direct/Indirect Consumer
At December 31, 20132014, approximately 50 percent of the direct/indirect portfolio was included in GWIM (principally securities-based lending loans and other personal loans), 49 percent was included in CBB (consumer dealer financial services – automotive, marine, aircraft, recreational vehicle loans and consumer personal loans), 43 percent was included in GWIM (principally securities-based lending loans and other personal loans) and the remainder was primarily in All Other (the GWIM(student loans and the International Wealth Management (IWM) businesses based outside of the U.S. and student loans)businesses).
Outstandings in the direct/indirect portfolio decreased $1.01.8 billion in 20132014 as a transfer of the government-guaranteed portion of the student loan sale in the securities-based lending portfolio in connection with the Corporation’s agreement to sell the IWM businessesLHFS and lower outstandings in the unsecured consumer lending portfolioand consumer dealer financial services portfolios were partially offset by growth in the consumer dealer financial services auto portfolio and the securities-based lending portfolio.
Net charge-offs decreased $418176 million to $345169 million in 20132014, or 0.420.20 percent of total average direct/indirect loans, compared to $763$345 million, or 0.900.42 percent, in 20122013. This decrease in net charge-offs was primarily driven by improvements in delinquencies and bankruptcies in the unsecured consumer lending portfolio as a result of an improved economic environment as well as reduced outstandings in this portfolio.
Net charge-offs in the unsecured consumer lending portfolio decreased $295$143 million to $190$47 million in 20132014, or 5.262.30 percent of total average unsecured consumer lending loans compared to 7.685.26 percent in 20122013. Direct/indirect loans that were past due 30 days or more and still accruing interest declined $339$634 million to $1.0 billion$379 million in 20132014 due primarily to improvements in the unsecured consumer lending, dealer financial services andtransfer of the government-guaranteed portion of the student lending portfolios.loan portfolio to LHFS.
|
| | |
8881 Bank of America 20132014
| | |
Table 4038 presents certain state concentrations for the direct/indirect consumer loan portfolio.
| | | | | | | | | | | | | | | | | | | | | | | | | | | |
| Table 40 | Direct/Indirect State Concentrations | |
| Table 38 | | Direct/Indirect State Concentrations |
| | | | | | | | | | | | | | | | | | | | | | | | | |
| | | December 31 | | | | December 31 | | |
| | | Outstandings | | Accruing Past Due
90 Days or More | | Net Charge-offs | | Outstandings | | Accruing Past Due
90 Days or More | | Net Charge-offs |
| (Dollars in millions) | (Dollars in millions) | 2013 | | 2012 | | 2013 | | 2012 | | 2013 | | 2012 | (Dollars in millions) | 2014 | | 2013 | | 2014 | | 2013 | | 2014 | | 2013 |
| California | California | $ | 10,041 |
| | $ | 10,793 |
| | $ | 57 |
| | $ | 53 |
| | $ | 42 |
| | $ | 102 |
| California | $ | 9,770 |
| | $ | 10,041 |
| | $ | 5 |
| | $ | 57 |
| | $ | 18 |
| | $ | 42 |
|
| Florida | | Florida | 7,930 |
| | 7,634 |
| | 5 |
| | 25 |
| | 27 |
| | 41 |
|
| Texas | Texas | 7,850 |
| | 7,239 |
| | 66 |
| | 41 |
| | 32 |
| | 64 |
| Texas | 7,741 |
| | 7,850 |
| | 5 |
| | 66 |
| | 19 |
| | 32 |
|
| Florida | 7,634 |
| | 7,363 |
| | 25 |
| | 37 |
| | 41 |
| | 88 |
| |
| New York | New York | 4,611 |
| | 4,794 |
| | 33 |
| | 28 |
| | 20 |
| | 43 |
| New York | 4,458 |
| | 4,611 |
| | 2 |
| | 33 |
| | 9 |
| | 20 |
|
| Georgia | 2,564 |
| | 2,491 |
| | 16 |
| | 31 |
| | 14 |
| | 30 |
| |
| New Jersey | | New Jersey | 2,625 |
| | 2,526 |
| | 2 |
| | 8 |
| | 5 |
| | 12 |
|
| Other U.S./Non-U.S. | Other U.S./Non-U.S. | 49,492 |
| | 50,525 |
| | 211 |
| | 355 |
| | 196 |
| | 436 |
| Other U.S./Non-U.S. | 47,857 |
| | 49,530 |
| | 45 |
| | 219 |
| | 91 |
| | 198 |
|
| Total direct/indirect loan portfolio | Total direct/indirect loan portfolio | $ | 82,192 |
| | $ | 83,205 |
| | $ | 408 |
| | $ | 545 |
| | $ | 345 |
| | $ | 763 |
| Total direct/indirect loan portfolio | $ | 80,381 |
| | $ | 82,192 |
| | $ | 64 |
| | $ | 408 |
| | $ | 169 |
| | $ | 345 |
|
Other Consumer
At December 31, 20132014, approximately 6037 percent of the $2.01.8 billion other consumer portfolio was associated with certain consumer finance businesses that we previously exited. The remainder is primarily leases within the consumer dealer financial services portfolio included in CBB.
Consumer Loans Accounted for Under the Fair Value Option
Outstanding consumer loans accounted for under the fair value option totaled $2.2$2.1 billion at December 31, 20132014 and were comprised of residential mortgage loans that were previously classified as held-for-sale, residential mortgage loans held in consolidated variable interest entities (VIEs) and repurchases ofrepurchased home equity loans. The loans that were previously classified as held-for-sale were transferred to the residential mortgage portfolio in connection with the decision to retain the loans. The fair value option had been elected at the time of origination and the loans continue to be measured at fair value after the reclassification. In 20132014, we recorded net losses of $2$13 million resulting from changes in the fair value of these loans, including gainslosses of $41$45 million on loans held in consolidated VIEs that were offset by lossesgains recorded on related long-term debt.
Nonperforming Consumer Loans, Leases and Foreclosed Properties Activity
Table 4139 presents nonperforming consumer loans, leases and foreclosed properties activity during 20132014 and 20122013. Nonperforming LHFS are excluded from nonperforming loans as they are recorded at either fair value or the lower of cost or fair value. Nonperforming loans do not include past due consumer credit card loans, other unsecured loans and in general, consumer non-real estate-secured loans (loans discharged in Chapter 7 bankruptcy are included) as these loans are typically charged off no later than the end of the month in which the loan becomes 180 days past due. The charge-offs on these loans have no impact on nonperforming activity and, accordingly, are excluded from this table. The fully-insured loan portfolio is not reported as nonperforming as principal repayment is insured. Additionally, nonperforming loans do not include the PCI loan portfolio or loans
accounted for under the fair value option. For more information on nonperforming loans, see Note 1 – Summary of Significant Accounting Principles to the Consolidated Financial Statements. During 20132014, nonperforming consumer loans declined $3.65.0 billion to $15.8$10.8 billion as outflows including the impact of loan sales, returns to performing status and charge-offs outpaced new inflows which continued to improve due to favorable delinquency trends.
The outstanding balance of a real estate-secured loan that is in excess of the estimated property value less costs to sell is charged off no later than the end of the month in which the loan becomes 180 days past due unless repayment of the loan is fully insured. At December 31, 20132014, $7.7$5.9 billion, or 4751 percent of nonperforming consumer real estate loans and foreclosed properties had been written down to their estimated property value less costs to sell, including $7.2$5.2 billion of nonperforming loans 180 days or more past due and $533$630 million of foreclosed properties. In addition, at December 31, 20132014, $5.9$3.6 billion, or 3733 percent of nonperforming consumer loans were modified and are now current after successful trial periods, or are current loans classified as nonperforming loans in accordance with applicable policies.
Foreclosed properties decreasedincreased $11797 million in 20132014 as liquidationsadditions outpaced additions.liquidations. PCI loans are excluded from nonperforming loans as these loans were written down to fair value at the acquisition date; however, once the underlying real estate is acquired by the Corporation upon foreclosure of the delinquent PCI loan, it is included in foreclosed properties. PCI-related foreclosed properties increased $165$198 million in 20132014. Not included in foreclosed properties at December 31, 20132014 was $1.4$1.1 billion of real estate that was acquired upon foreclosure of delinquent FHA-insured loans. We hold this real estate on our balance sheet until we convey these properties to the FHA. We exclude these amounts from our nonperforming loans and foreclosed properties activity as we expect we will be reimbursed once the property is conveyed to the FHA for principal and, up to certain limits, costs incurred during the foreclosure process and interest incurred during the holding period. For more information on the review of our foreclosure processes, see Off-Balance Sheet Arrangements and Contractual Obligations – Servicing, Foreclosure and Other Mortgage Matters on page 5753.
|
| | |
| | | Bank of America 20132014 8982 |
Restructured Loans
Nonperforming loans also include certain loans that have been modified in TDRs where economic concessions have been granted to borrowers experiencing financial difficulties. These concessions typically result from the Corporation’s loss mitigation activities and could include reductions in the interest rate, payment extensions,
forgiveness of principal, forbearance or other actions. Certain TDRs are classified as nonperforming at the time of restructuring and may only be returned to performing status after considering the borrower’s sustained repayment performance for a reasonable period, generally six months. Nonperforming TDRs, excluding those modified loans in the PCI loan portfolio, are included in Table 4139.
|
| | | | | | | | |
| | | | | |
| Table 41 | Nonperforming Consumer Loans, Leases and Foreclosed Properties Activity (1) |
| | | | | |
| (Dollars in millions) | 2013 | | 2012 |
| Nonperforming loans, January 1 | $ | 19,431 |
| | $ | 18,768 |
|
| Additions to nonperforming loans and leases: | | | |
| New nonperforming loans and leases | 9,652 |
| | 13,084 |
|
Impact of change in treatment of loans discharged in bankruptcies (2) | n/a |
| | 1,162 |
|
Implementation of regulatory interagency guidance (2) | n/a |
| | 1,853 |
|
| Reductions to nonperforming loans and leases: | | | |
| Paydowns and payoffs | (2,782 | ) | | (3,801 | ) |
| Sales | (1,528 | ) | | (47 | ) |
Returns to performing status (3) | (4,273 | ) | | (4,203 | ) |
| Charge-offs | (3,514 | ) | | (6,544 | ) |
Transfers to foreclosed properties (4) | (483 | ) | | (841 | ) |
Transfers to loans held-for-sale (5) | (663 | ) | | — |
|
| Total net additions (reductions) to nonperforming loans and leases | (3,591 | ) | | 663 |
|
Total nonperforming loans and leases, December 31 (6) | 15,840 |
| | 19,431 |
|
| Foreclosed properties, January 1 | 650 |
| | 1,991 |
|
| Additions to foreclosed properties: | | | |
New foreclosed properties (4) | 936 |
| | 1,129 |
|
| Reductions to foreclosed properties: | | | |
| Sales | (930 | ) | | (2,283 | ) |
| Write-downs | (123 | ) | | (187 | ) |
| Total net reductions to foreclosed properties | (117 | ) | | (1,341 | ) |
Total foreclosed properties, December 31 (7) | 533 |
| | 650 |
|
| Nonperforming consumer loans, leases and foreclosed properties, December 31 | $ | 16,373 |
| | $ | 20,081 |
|
Nonperforming consumer loans and leases as a percentage of outstanding consumer loans and leases (8) | 2.99 | % | | 3.52 | % |
Nonperforming consumer loans, leases and foreclosed properties as a percentage of outstanding consumer loans, leases and foreclosed properties (8) | 3.09 |
| | 3.63 |
|
|
| | | | | | | | |
| | | | | |
| Table 39 | Nonperforming Consumer Loans, Leases and Foreclosed Properties Activity (1) |
| | | | | |
| (Dollars in millions) | 2014 | | 2013 |
| Nonperforming loans and leases, January 1 | $ | 15,840 |
| | $ | 19,431 |
|
| Additions to nonperforming loans and leases: | | | |
| New nonperforming loans and leases | 7,077 |
| | 9,652 |
|
| Reductions to nonperforming loans and leases: | | | |
| Paydowns and payoffs | (1,625 | ) | | (2,782 | ) |
| Sales | (4,129 | ) | | (1,528 | ) |
Returns to performing status (2) | (3,277 | ) | | (4,273 | ) |
| Charge-offs | (2,187 | ) | | (3,514 | ) |
Transfers to foreclosed properties (3) | (672 | ) | | (483 | ) |
Transfers to loans held-for-sale (4) | (208 | ) | | (663 | ) |
| Total net reductions to nonperforming loans and leases | (5,021 | ) | | (3,591 | ) |
Total nonperforming loans and leases, December 31 (5) | 10,819 |
| | 15,840 |
|
| Foreclosed properties, January 1 | 533 |
| | 650 |
|
| Additions to foreclosed properties: | | | |
New foreclosed properties (3) | 1,011 |
| | 936 |
|
| Reductions to foreclosed properties: | | | |
| Sales | (829 | ) | | (930 | ) |
| Write-downs | (85 | ) | | (123 | ) |
| Total net additions (reductions) to foreclosed properties | 97 |
| | (117 | ) |
Total foreclosed properties, December 31 (6) | 630 |
| | 533 |
|
| Nonperforming consumer loans, leases and foreclosed properties, December 31 | $ | 11,449 |
| | $ | 16,373 |
|
Nonperforming consumer loans and leases as a percentage of outstanding consumer loans and leases (7) | 2.22 | % | | 2.99 | % |
Nonperforming consumer loans, leases and foreclosed properties as a percentage of outstanding consumer loans, leases and foreclosed properties (7) | 2.35 |
| | 3.09 |
|
| |
(1) | Balances do not include nonperforming LHFS of $3767 million and $622376 million and nonaccruing TDRs removed from the PCI loan portfolio prior to January 1, 2010 of $260102 million and $521260 million at December 31, 20132014 and 20122013 as well as loans accruing past due 90 days or more as presented in Table 2725 and Note 4 – Outstanding Loans and Leases to the Consolidated Financial Statements. |
| |
(2) | As a result of the implementation of regulatory guidance in 2012 on loans discharged in Chapter 7 bankruptcy, we added $1.2 billion to nonperforming loans. As a result of the implementation of regulatory interagency guidance in 2012, we reclassified $1.9 billion of performing home equity loans (of which $1.6 billion were current) to nonperforming.
|
| |
(3)
| Consumer loans may be returned to performing status when all principal and interest is current and full repayment of the remaining contractual principal and interest is expected, or when the loan otherwise becomes well-secured and is in the process of collection. |
| |
(4)(3)
| New foreclosed properties represents transfers of nonperforming loans to foreclosed properties net of charge-offs taken during the first 90 days after transfer of a loan to foreclosed properties. New foreclosed properties also includes properties obtained upon foreclosure of delinquent PCI loans, properties repurchased due to representations and warranties exposure and properties acquired with newly consolidated subsidiaries. |
| |
(5)(4)
| TransfersFor 2014 and 2013, transfers to loans held-for-sale includesincluded $208 million and $273 million of loans that were sold prior to December 31, 2014 and 2013.
|
| |
(6)(5)
| At December 31, 20132014, 4648 percent of nonperforming loans were 180 days or more past due and were written down through charge-offs to 6566 percent of their unpaid principal balance. |
| |
(7)(6)
| Foreclosed property balances do not include loans that are insured by the FHA and have entered foreclosure of $1.41.1 billion and $2.51.4 billion at December 31, 20132014 and 20122013. |
| |
(8)(7)
| Outstanding consumer loans and leases exclude loans accounted for under the fair value option. |
n/a = not applicable
Our policy is to record any losses in the value of foreclosed properties as a reduction in the allowance for loan and lease losses during the first 90 days after transfer of a loan to foreclosed properties. Thereafter, further losses in value as well as gains and losses on sale are recorded in noninterest expense. New foreclosed properties included in Table 4139 are net of $190$191 million and $261$190 million of charge-offs in 20132014 and 20122013, recorded during the first 90 days after transfer.
We classify consumer real estate loans that have been discharged in Chapter 7 bankruptcy and not reaffirmed by the borrower as TDRs, irrespective of payment history or delinquency status, even if the repayment terms for the loan have not been otherwise modified. We continue to have a lien on the underlying collateral. At December 31, 2013, $3.6 billion of loans discharged in Chapter 7 bankruptcy with no change in repayment terms at the time of discharge were included in TDRs, of which $1.8 billion were classified as nonperforming and $1.8 billion were loans fully-
insured by the FHA. Of the $3.6 billion of TDRs, approximately 27 percent, 30 percent and 43 percent were discharged in Chapter 7 bankruptcy in 2013, 2012 and years prior to 2012, respectively. In addition, at December 31, 2013, of the $1.8 billion of nonperforming loans discharged in Chapter 7 bankruptcy, $1.1 billion were current on their contractual payments while $642 million were 90 days or more past due. Of the contractually current nonperforming loans, nearly 80 percent were discharged in Chapter 7 bankruptcy more than 12 months ago, and nearly 50 percent were discharged 24 months or more ago. As subsequent cash payments are received on the loans that are contractually current, the interest component of the payments is generally recorded as interest income on a cash basis and the principal component is recorded as a reduction in the carrying value of the loan. For more information on the impacts to consumer home loan TDRs, see Note 4 – Outstanding Loans and Leasesto the Consolidated Financial Statements.
We classify junior-lien home equity loans as nonperforming when the first-lien loan becomes 90 days past due even if the junior-lien loan is performing. At December 31, 20132014 and 20122013, $1.2 billion800 million and $1.5$1.2 billion of such junior-lien home equity loans were included in nonperforming loans and leases. This decline was driven by enhanced identification of the delinquency on first-lien loans serviced by other financial institutions.
Table 4240 presents TDRs for the home loans portfolio. Performing TDR balances are excluded from nonperforming loans and leases in Table 41.39.
| | | | | | | | | | | | | | | | | | | | | | | | | | | |
| Table 42 | Home Loans Troubled Debt Restructurings | |
| Table 40 | | Home Loans Troubled Debt Restructurings |
| | | | | | | | | | | | | | | | | | | | | | | | | |
| | | December 31 | | December 31 |
| | | 2013 | | 2012 | | 2014 | | 2013 |
| (Dollars in millions) | (Dollars in millions) | Total | | Nonperforming | | Performing | | Total | | Nonperforming | | Performing | (Dollars in millions) | Total | | Nonperforming | | Performing | | Total | | Nonperforming | | Performing |
Residential mortgage (1, 2) | Residential mortgage (1, 2) | $ | 29,312 |
| | $ | 7,555 |
| | $ | 21,757 |
| | $ | 28,125 |
| | $ | 9,040 |
| | $ | 19,085 |
| Residential mortgage (1, 2) | $ | 23,270 |
| | $ | 4,529 |
| | $ | 18,741 |
| | $ | 29,312 |
| | $ | 7,555 |
| | $ | 21,757 |
|
Home equity (3) | Home equity (3) | 2,146 |
| | 1,389 |
| | 757 |
| | 2,125 |
| | 1,242 |
| | 883 |
| Home equity (3) | 2,358 |
| | 1,595 |
| | 763 |
| | 2,146 |
| | 1,389 |
| | 757 |
|
| Total home loans troubled debt restructurings | Total home loans troubled debt restructurings | $ | 31,458 |
| | $ | 8,944 |
| | $ | 22,514 |
| | $ | 30,250 |
| | $ | 10,282 |
| | $ | 19,968 |
| Total home loans troubled debt restructurings | $ | 25,628 |
| | $ | 6,124 |
| | $ | 19,504 |
| | $ | 31,458 |
| | $ | 8,944 |
| | $ | 22,514 |
|
| |
(1) | Residential mortgage TDRs deemed collateral dependent totaled $8.25.8 billion and $9.48.2 billion, and included $5.73.6 billion and $6.45.7 billion of loans classified as nonperforming and $2.52.2 billion and $3.02.5 billion of loans classified as performing at December 31, 20132014 and 20122013. |
| |
(2) | Residential mortgage performing TDRs included $14.311.9 billion and $11.914.3 billion of loans that were fully-insured at December 31, 20132014 and 20122013. |
| |
(3) | Home equity TDRs deemed collateral dependent totaled $1.41.6 billion and $1.4 billion, and included $1.21.4 billion and $1.01.2 billion of loans classified as nonperforming and $227178 million and $348227 million of loans classified as performing at December 31, 20132014 and 20122013. |
WeIn addition to modifying home loans, we work with customers thatwho are experiencing financial difficulty by modifying credit card and other consumer loans, while complying with Federal Financial Institutions Examination Council (FFIEC) guidelines.loans. Credit card and other consumer loan modifications generally involve a reduction in the customer’s interest rate on the account and placing the customer on a fixed payment plan not exceeding 60 months, all of which are considered TDRs (the renegotiated TDR portfolio). In addition, the accounts of non-U.S. credit card modifications may involve reducing the interest rate on the account without placing the customer oncustomers who do not qualify for a fixed payment plan and thesemay have their interest rates reduced, as required by certain local jurisdictions. These modifications, which are also considered TDRs, (also a part oftend to experience higher payment default rates given that the renegotiated TDR portfolio).
borrowers may lack the ability to repay even with the interest rate reduction. In all cases, the customer’s available line of credit is canceled. We make modifications
Modifications of credit card and other consumer loans are primarily made through internal renegotiation programs utilizing direct customer contact, but may also utilize external renegotiation programs. The renegotiated TDR portfolio is excluded in large part from Table 4139 as substantially all of the loans remain on accrual status until either charged off or paid in full. At December 31, 20132014 and 20122013, our renegotiated TDR portfolio was $2.11.1 billion and $3.92.1 billion, of which $1.6 billion907 million and $3.11.6 billion were current or less than 30 days past due under the modified terms. The decline in the renegotiated TDR portfolio was primarily driven by paydowns and charge-offs as well as lower program enrollments. For more information on the renegotiated TDR portfolio, see Note 4 – Outstanding Loans and Leases to the Consolidated Financial Statements.
Commercial Portfolio Credit Risk Management
Credit risk management for the commercial portfolio begins with an assessment of the credit risk profile of the borrower or counterparty based on an analysis of its financial position. As part of the overall credit risk assessment, our commercial credit exposures are assigned a risk rating and are subject to approval based on defined credit approval standards. Subsequent to loan origination, risk ratings are monitored on an ongoing basis, and if necessary, adjusted to reflect changes in the financial condition, cash flow, risk profile or outlook of a borrower or counterparty. In making credit decisions, we consider risk rating, collateral, country, industry and single name concentration limits while also balancing this with the total borrower or counterparty relationship. Our business and risk management personnel use a variety of tools to continuously monitor the ability of a borrower or counterparty to perform under its obligations. We use risk rating aggregations to
measure and evaluate concentrations within portfolios. In
addition, risk ratings are a factor in determining the level of allocated capital and the allowance for credit losses.
As part of our ongoing risk mitigation initiatives, we attempt to work with clients experiencing financial difficulty to modify their loans to terms that better align with their current ability to pay. In situations where an economic concession has been granted to a borrower experiencing financial difficulty, we identify these loans as TDRs. For more information on our accounting policies regarding delinquencies, nonperforming status and net charge-offs for the commercial portfolio, see Note 1 – Summary of Significant Accounting Principles to the Consolidated Financial Statements.
Management of Commercial Credit Risk
Concentrations
Commercial credit risk is evaluated and managed with the goal that concentrations of credit exposure do not result in undesirable levels of risk. We review, measure and manage concentrations of credit exposure by industry, product, geography, customer relationship and loan size. We also review, measure and manage commercial real estate loans by geographic location and property type. In addition, within our non-U.S. portfolio, we evaluate exposures by region and by country. Tables 4745, 5250, 6057 and 6158 summarize our concentrations. We also utilize syndications of exposure to third parties, loan sales, hedging and other risk mitigation techniques to manage the size and risk profile of the commercial credit portfolio.
As part of our ongoing risk mitigation initiatives, we attempt to work with clients experiencing financial difficulty to modify their loans to terms that better align with their current ability to pay. In situations where an economic concession has been granted to a borrower experiencing financial difficulty, we identify these loans as TDRs.
We account for certain large corporate loans and loan commitments, including issued but unfunded letters of credit which are considered utilized for credit risk management purposes, that exceed our single name credit risk concentration guidelines under the fair value option. Lending commitments, both funded and unfunded, are actively managed and monitored, and as appropriate, credit risk for these lending relationships may be mitigated through the use of credit derivatives, with the Corporation’s credit view and market perspectives determining the size and timing of the hedging activity. In addition, we purchase credit protection to cover the funded portion as well as the unfunded portion of certain other credit exposures. To lessen the cost of obtaining our desired credit protection levels, credit exposure may be added within an industry, borrower or counterparty group by selling protection. These credit derivatives
do not meet the requirements for treatment as accounting hedges. They are carried at fair value with changes in fair value recorded in other income (loss).
In addition, the Corporation is a member of various securities and derivative exchanges and clearinghouses, both in the U.S. and other countries. As a member, the Corporation may be required to pay a pro-rata share of the losses incurred by some of these organizations as a result of another member default and under other loss scenarios. For additional information, see Note 12 – Commitments and Contingencies to the Consolidated Financial Statements.
Commercial Credit Portfolio
During 20132014, tightening of credit qualityspreads, combined with improved commercial real estate pricing and higher equity markets, drove further improvements in the commercial loan portfoliocredit quality. Our focus on balance sheet optimization drove new originations to be weighted to higher rated investment-grade obligors.
Outstanding commercial loans and leases decreased $3.5 billion, primarily in non-U.S. commercial, partially offset by growth
in U.S. commercial. Credit quality continued to show improvement. Reservableimprovement with declines in reservable criticized balances and nonperforming loans, leases and foreclosed property balances declined during 2014. Nonperforming commercial loans and leases as a percentage of outstanding commercial loans and leases decreased during 2014 to 0.28 percent from 0.33 percent (0.29 percent from 0.34 percent excluding loans accounted for under the fair value option) at December 31, 2013 with the declines primarily in the U.S. commercial and commercial real estate portfolios. Most other credit quality indicators across the remaining commercial
portfolios also improved.. The allowance for loan and lease losses for the commercial portfolio increased $899432 million in 2013to $4.4 billion at December 31, 2014 compared to $4.0 billionDecember 31, 2013 as continued improvement in credit quality was more than offset by an increase associated with loan growth across the core commercial portfolio (total commercial products excluding U.S. small business). For additionalmore information, see Allowance for Credit Losses on page 10495.
Table 4341 presents our commercial loans and leases portfolio, and related credit quality information at December 31, 20132014 and 20122013.
| | | | | | | | | | | | | | | | | | | | | | | | | | | |
| Table 43 | Commercial Loans and Leases | |
| Table 41 | | Commercial Loans and Leases |
| | | | | |
| | | December 31 | | December 31 |
| | | Outstandings | | Nonperforming | | Accruing Past Due 90 Days or More | | Outstandings | | Nonperforming | | Accruing Past Due 90 Days or More |
| (Dollars in millions) | (Dollars in millions) | 2013 | | 2012 | | 2013 | | 2012 | | 2013 | | 2012 | (Dollars in millions) | 2014 | | 2013 | | 2014 | | 2013 | | 2014 | | 2013 |
| U.S. commercial | U.S. commercial | $ | 212,557 |
| | $ | 197,126 |
| | $ | 819 |
| | $ | 1,484 |
| | $ | 47 |
| | $ | 65 |
| U.S. commercial | $ | 220,293 |
| | $ | 212,557 |
| | $ | 701 |
| | $ | 819 |
| | $ | 110 |
| | $ | 47 |
|
Commercial real estate (1) | Commercial real estate (1) | 47,893 |
| | 38,637 |
| | 322 |
| | 1,513 |
| | 21 |
| | 29 |
| Commercial real estate (1) | 47,682 |
| | 47,893 |
| | 321 |
| | 322 |
| | 3 |
| | 21 |
|
| Commercial lease financing | Commercial lease financing | 25,199 |
| | 23,843 |
| | 16 |
| | 44 |
| | 41 |
| | 15 |
| Commercial lease financing | 24,866 |
| | 25,199 |
| | 3 |
| | 16 |
| | 41 |
| | 41 |
|
| Non-U.S. commercial | Non-U.S. commercial | 89,462 |
| | 74,184 |
| | 64 |
| | 68 |
| | 17 |
| | — |
| Non-U.S. commercial | 80,083 |
| | 89,462 |
| | 1 |
| | 64 |
| | — |
| | 17 |
|
| | | 375,111 |
| | 333,790 |
| | 1,221 |
| | 3,109 |
| | 126 |
| | 109 |
| | 372,924 |
| | 375,111 |
| | 1,026 |
| | 1,221 |
| | 154 |
| | 126 |
|
U.S. small business commercial (2) | U.S. small business commercial (2) | 13,294 |
| | 12,593 |
| | 88 |
| | 115 |
| | 78 |
| | 120 |
| U.S. small business commercial (2) | 13,293 |
| | 13,294 |
| | 87 |
| | 88 |
| | 67 |
| | 78 |
|
| Commercial loans excluding loans accounted for under the fair value option | Commercial loans excluding loans accounted for under the fair value option | 388,405 |
| | 346,383 |
| | 1,309 |
| | 3,224 |
| | 204 |
| | 229 |
| Commercial loans excluding loans accounted for under the fair value option | 386,217 |
| | 388,405 |
| | 1,113 |
| | 1,309 |
| | 221 |
| | 204 |
|
Loans accounted for under the fair value option (3) | Loans accounted for under the fair value option (3) | 7,878 |
| | 7,997 |
| | 2 |
| | 11 |
| | — |
| | — |
| Loans accounted for under the fair value option (3) | 6,604 |
| | 7,878 |
| | — |
| | 2 |
| | — |
| | — |
|
| Total commercial loans and leases | Total commercial loans and leases | $ | 396,283 |
| | $ | 354,380 |
| | $ | 1,311 |
| | $ | 3,235 |
| | $ | 204 |
| | $ | 229 |
| Total commercial loans and leases | $ | 392,821 |
| | $ | 396,283 |
| | $ | 1,113 |
| | $ | 1,311 |
| | $ | 221 |
| | $ | 204 |
|
| |
(1) | Includes U.S. commercial real estate loans of $46.345.2 billion and $37.246.3 billion and non-U.S. commercial real estate loans of $1.62.5 billion and $1.51.6 billion at December 31, 20132014 and 20122013. |
| |
(2) | Includes card-related products. |
| |
(3) | Commercial loans accounted for under the fair value option include U.S. commercial loans of $1.51.9 billion and $2.31.5 billion and non-U.S. commercial loans of $6.44.7 billion and $5.76.4 billion at December 31, 20132014 and 20122013. For more information on the fair value option, see Note 21 – Fair Value Option to the Consolidated Financial Statements. |
Outstanding commercial loans and leases increased$41.9 billion in 2013, primarily in U.S. commercial and non-U.S. commercial product types. Nonperforming commercial loans and leases as a percentage of outstanding commercial loans and leases improved during 2013 to 0.33 percent from 0.91 percent
(0.34 percent and 0.93 percent excluding loans accounted for under the fair value option) at December 31, 2012.
Table 4442 presents net charge-offs and related ratios for our commercial loans and leases for 20132014 and 2012.2013. Improving trends across the portfolio drove lower charge-offs.
| | | | | | | | | | | | | | | | | | | |
| Table 44 | Commercial Net Charge-offs and Related Ratios | |
| Table 42 | | Commercial Net Charge-offs and Related Ratios |
| | | | | | | | | | | | | | | | | |
| | | Net Charge-offs | | Net Charge-off Ratios (1) | | Net Charge-offs | | Net Charge-off Ratios (1) |
| (Dollars in millions) | (Dollars in millions) | 2013 | | 2012 | | 2013 | | 2012 | (Dollars in millions) | 2014 | | 2013 | | 2014 | | 2013 |
| U.S. commercial | U.S. commercial | $ | 128 |
| | $ | 242 |
| | 0.06 | % | | 0.13 | % | U.S. commercial | $ | 88 |
| | $ | 128 |
| | 0.04 | % | | 0.06 | % |
| Commercial real estate | Commercial real estate | 149 |
| | 384 |
| | 0.35 |
| | 1.01 |
| Commercial real estate | (83 | ) | | 149 |
| | (0.18 | ) | | 0.35 |
|
| Commercial lease financing | Commercial lease financing | (25 | ) | | (6 | ) | | (0.10 | ) | | (0.03 | ) | Commercial lease financing | (9 | ) | | (25 | ) | | (0.04 | ) | | (0.10 | ) |
| Non-U.S. commercial | Non-U.S. commercial | 45 |
| | 28 |
| | 0.05 |
| | 0.05 |
| Non-U.S. commercial | 34 |
| | 45 |
| | 0.04 |
| | 0.05 |
|
| | | 297 |
| | 648 |
| | 0.08 |
| | 0.21 |
| | 30 |
| | 297 |
| | 0.01 |
| | 0.08 |
|
| U.S. small business commercial | U.S. small business commercial | 359 |
| | 699 |
| | 2.84 |
| | 5.46 |
| U.S. small business commercial | 282 |
| | 359 |
| | 2.10 |
| | 2.84 |
|
| Total commercial | Total commercial | $ | 656 |
| | $ | 1,347 |
| | 0.18 |
| | 0.43 |
| Total commercial | $ | 312 |
| | $ | 656 |
| | 0.08 |
| | 0.18 |
|
| |
(1) | Net charge-off ratios are calculated as net charge-offs divided by average outstanding loans and leases excluding loans accounted for under the fair value option. |
|
| | |
9285 Bank of America 20132014
| | |
Table 4543 presents commercial credit exposure by type for utilized, unfunded and total binding committed credit exposure. Commercial utilized credit exposure includes SBLCs and financial guarantees, bankers’ acceptances and commercial letters of credit for which we are legally bound to advance funds under prescribed conditions, during a specified time period. Although funds have not yet been advanced, these exposure types are considered utilized for credit risk management purposes. Total
commercial committed credit exposure increased$56.8 billion in 2013 primarily driven by increases in loans and leases.
Total commercial utilized credit exposure increaseddecreased $35.8 billion852 million in 20132014 primarily driven by increases in loans and leases.leases, SBLCs and financial guarantees, debt securities and other investments, partially offset by an increase in derivative assets. The utilization rate for loans and leases, SBLCs and financial guarantees, commercial letters of credit and bankers’bankers acceptances, in the aggregate, was 5857 percent and 58 percent at both December 31, 20132014 and 20122013.
| | | | | | | | | | | | | | | | | | | | | | | | | | | |
| Table 45 | Commercial Credit Exposure by Type | |
| Table 43 | | Commercial Credit Exposure by Type |
| | | | | | | | | | | | | | | | | | | | | | | | | |
| | | December 31 | | December 31 |
| | | Commercial Utilized (1) | | Commercial Unfunded (2, 3) | | Total Commercial Committed | | Commercial Utilized (1) | | Commercial Unfunded (2, 3) | | Total Commercial Committed |
| (Dollars in millions) | (Dollars in millions) | 2013 | | 2012 | | 2013 | | 2012 | | 2013 | | 2012 | (Dollars in millions) | 2014 | | 2013 | | 2014 | | 2013 | | 2014 | | 2013 |
| Loans and leases | Loans and leases | $ | 396,283 |
| | $ | 354,380 |
| | $ | 307,478 |
| | $ | 281,915 |
| | $ | 703,761 |
| | $ | 636,295 |
| Loans and leases | $ | 392,821 |
| | $ | 396,283 |
| | $ | 317,258 |
| | $ | 307,478 |
| | $ | 710,079 |
| | $ | 703,761 |
|
Derivative assets (4) | Derivative assets (4) | 47,495 |
| | 53,497 |
| | — |
| | — |
| | 47,495 |
| | 53,497 |
| Derivative assets (4) | 52,682 |
| | 47,495 |
| | — |
| | — |
| | 52,682 |
| | 47,495 |
|
| Standby letters of credit and financial guarantees | Standby letters of credit and financial guarantees | 35,893 |
| | 41,036 |
| | 1,334 |
| | 2,119 |
| | 37,227 |
| | 43,155 |
| Standby letters of credit and financial guarantees | 33,550 |
| | 35,893 |
| | 745 |
| | 1,334 |
| | 34,295 |
| | 37,227 |
|
| Debt securities and other investments | Debt securities and other investments | 18,505 |
| | 10,937 |
| | 6,903 |
| | 6,914 |
| | 25,408 |
| | 17,851 |
| Debt securities and other investments | 17,301 |
| | 18,505 |
| | 5,315 |
| | 6,903 |
| | 22,616 |
| | 25,408 |
|
| Loans held-for-sale | Loans held-for-sale | 6,604 |
| | 7,928 |
| | 101 |
| | 3,763 |
| | 6,705 |
| | 11,691 |
| Loans held-for-sale | 7,036 |
| | 6,604 |
| | 2,315 |
| | 101 |
| | 9,351 |
| | 6,705 |
|
| Commercial letters of credit | Commercial letters of credit | 2,054 |
| | 2,065 |
| | 515 |
| | 564 |
| | 2,569 |
| | 2,629 |
| Commercial letters of credit | 2,037 |
| | 2,054 |
| | 126 |
| | 515 |
| | 2,163 |
| | 2,569 |
|
| Bankers’ acceptances | Bankers’ acceptances | 246 |
| | 185 |
| | — |
| | 3 |
| | 246 |
| | 188 |
| Bankers’ acceptances | 255 |
| | 246 |
| | — |
| | — |
| | 255 |
| | 246 |
|
Foreclosed properties and other (5) | Foreclosed properties and other (5) | 414 |
| | 1,699 |
| | — |
| | — |
| | 414 |
| | 1,699 |
| Foreclosed properties and other (5) | 960 |
| | 414 |
| | — |
| | — |
| | 960 |
| | 414 |
|
| Total | | $ | 507,494 |
| | $ | 471,727 |
| | $ | 316,331 |
| | $ | 295,278 |
| | $ | 823,825 |
| | $ | 767,005 |
| | $ | 506,642 |
| | $ | 507,494 |
| | $ | 325,759 |
| | $ | 316,331 |
| | $ | 832,401 |
| | $ | 823,825 |
|
| |
(1) | Total commercial utilized exposure includes loans of $6.6 billion and $7.9 billionand issued letters of credit accounted for under the fair value option and is comprised of loans outstanding of $7.9 billion and $8.0 billion and letters of credit with a notional amount of $503535 million and $672503 million at December 31, 20132014 and 20122013. |
| |
(2) | Total commercial unfunded exposure includes loan commitments accounted for under the fair value option with a notional amount of $12.59.4 billion and $17.612.5 billion at December 31, 20132014 and 20122013. |
| |
(3) | Excludes unused business card lines which are not legally binding. |
| |
(4) | Derivative assets are carried at fair value, reflect the effects of legally enforceable master netting agreements and have been reduced by cash collateral of $47.3 billion and $58.1 billionat both December 31, 20132014 and 20122013. Not reflected in utilized and committed exposure is additional derivative collateral held of $17.124.0 billion and $18.717.1 billion which consists primarily of other marketable securities. |
| |
(5)
| The net monoline exposure of $1.3 billion at December 31, 2012 was settled during 2013.
|
Table 4644 presents commercial utilized reservable criticized exposure by productloan type. Criticized exposure corresponds to the Special Mention, Substandard and Doubtful asset categories as defined by regulatory authorities. Total commercial utilized reservable criticized exposure decreased $3.11.3 billion, or 19 10
percent, in 20132014 primarily inthroughout most of the commercial real estate portfolio
driven largely by continued paydowns, upgrades charge-offs and salescharge-offs outpacing downgrades. At December 31, 2013, approximatelyApproximately 87 percent and 84 percent of commercial utilized reservable criticized exposure was secured compared to 82 percent at December 31, 20122014 and 2013.
| | | | | | | | | | | | | | | | | | | |
| Table 46 | Commercial Utilized Reservable Criticized Exposure | |
| Table 44 | | Commercial Utilized Reservable Criticized Exposure |
| | | | | | | | | | | | | | | | | |
| | | December 31 | | December 31 |
| | | 2013 | | 2012 | | 2014 | | 2013 |
| (Dollars in millions) | (Dollars in millions) | Amount (1) | | Percent (2) | | Amount (1) | | Percent (2) | (Dollars in millions) | Amount (1) | | Percent (2) | | Amount (1) | | Percent (2) |
| U.S. commercial | U.S. commercial | $ | 8,362 |
| | 3.45 | % | | $ | 8,631 |
| | 3.72 | % | U.S. commercial | $ | 7,597 |
| | 3.07 | % | | $ | 8,362 |
| | 3.45 | % |
| Commercial real estate | Commercial real estate | 1,452 |
| | 2.92 |
| | 3,782 |
| | 9.24 |
| Commercial real estate | 1,108 |
| | 2.24 |
| | 1,452 |
| | 2.92 |
|
| Commercial lease financing | Commercial lease financing | 988 |
| | 3.92 |
| | 969 |
| | 4.06 |
| Commercial lease financing | 1,034 |
| | 4.16 |
| | 988 |
| | 3.92 |
|
| Non-U.S. commercial | Non-U.S. commercial | 1,424 |
| | 1.49 |
| | 1,614 |
| | 2.02 |
| Non-U.S. commercial | 887 |
| | 1.03 |
| | 1,424 |
| | 1.49 |
|
| | | 12,226 |
| | 2.96 |
| | 14,996 |
| | 3.98 |
| | 10,626 |
| | 2.60 |
| | 12,226 |
| | 2.96 |
|
| U.S. small business commercial | U.S. small business commercial | 635 |
| | 4.77 |
| | 940 |
| | 7.45 |
| U.S. small business commercial | 944 |
| | 7.10 |
| | 635 |
| | 4.77 |
|
| Total commercial utilized reservable criticized exposure | Total commercial utilized reservable criticized exposure | $ | 12,861 |
| | 3.02 |
| | $ | 15,936 |
| | 4.10 |
| Total commercial utilized reservable criticized exposure | $ | 11,570 |
| | 2.74 |
| | $ | 12,861 |
| | 3.02 |
|
| |
(1) | Total commercial utilized reservable criticized exposure includes loans and leases of $11.5$10.2 billion and $14.6$11.5 billion and commercial letters of credit of $1.4$1.3 billion and $1.3$1.4 billion at December 31, 20132014 and 20122013. |
| |
(2) | Percentages are calculated as commercial utilized reservable criticized exposure divided by total commercial utilized reservable exposure for each exposure category. |
U.S. Commercial
At December 31, 20132014, 6263 percent of the U.S. commercial loan portfolio, excluding small business, was managed in Global Banking, 1716 percent in Global Markets, 10 percent in GWIM (business-purpose(generally business-purpose loans for high net-worthnet worth clients) and the remainder primarily in CBB. U.S. commercial loans, excluding
loans accounted for under the fair value option, increased $7.7 billion, or four percent, during increased$15.4 billion,
or eight percent, in 20132014 with growth across the majority of core commercial portfolios.primarily from middle-market and corporate clients. Nonperforming loans and leases decreased $665$118 million, or 14 percent, in 20132014. Net charge-offs decreased $11440 million to $128$88 million induring 20132014. The declines were broad-based with respect to clients and industries, driven by improved client credit profiles and liquidity.
|
| | |
| | | Bank of America 20132014 9386 |
Commercial Real Estate
Commercial real estate primarily includes commercial loans and leases secured by non-owner-occupied real estate and is dependent on the sale or lease of the real estate as the primary source of repayment. The portfolio remains diversified across property types and geographic regions. California represented the largest state concentration at 22 percent and 23 percentof the commercial real estate loans and leases portfolio at both December 31, 20132014 and 20122013. The commercial real estate portfolio is predominantly managed in Global Banking and consists of loans made primarily to public and private developers, and commercial real estate firms. Outstanding loans decreased $211 million during increased$9.3 billion, or 24 percent, in 20132014 primarily due to new originations in major metropolitan markets.portfolio sales.
During 20132014, we continued to see improvements in credit quality in both the residential and non-residential portfolios. We
use a number of proactive risk mitigation initiatives to reduce adversely rated exposure in the commercial real estate portfolio including transfers of deteriorating exposures to management by independent special asset officers and the pursuit of loan restructurings or asset sales to achieve the best results for our customers and the Corporation.
Nonperforming commercial real estate loans and foreclosed properties decreased $1.4 billion24 million, or 77six percent, and reservable criticized balances decreased $2.3 billion344 million, or 6224 percent, in 20132014.
Net charge-offs declined $235232 million to $149a net recovery of $83 million in 20132014. These improvements were primarily in the non-residential portfolio.
Table 4745 presents outstanding commercial real estate loans by geographic region, based on the geographic location of the collateral, and by property type.
| | | | | | | | | | | |
| Table 47 | Outstanding Commercial Real Estate Loans | |
| Table 45 | | Outstanding Commercial Real Estate Loans |
| | | | | | | | | |
| | | December 31 | | December 31 |
| (Dollars in millions) | (Dollars in millions) | 2013 | | 2012 | (Dollars in millions) | 2014 | | 2013 |
| By Geographic Region | By Geographic Region | |
| | |
| By Geographic Region | |
| | |
|
| California | California | $ | 10,358 |
| | $ | 8,792 |
| California | $ | 10,352 |
| | $ | 10,358 |
|
| Northeast | Northeast | 9,487 |
| | 7,315 |
| Northeast | 8,781 |
| | 9,487 |
|
| Southwest | Southwest | 6,913 |
| | 4,612 |
| Southwest | 6,570 |
| | 6,913 |
|
| Southeast | Southeast | 5,314 |
| | 4,440 |
| Southeast | 5,495 |
| | 5,314 |
|
| Midwest | Midwest | 3,109 |
| | 3,421 |
| Midwest | 2,867 |
| | 3,109 |
|
| Illinois | | Illinois | 2,785 |
| | 2,319 |
|
| Florida | Florida | 3,030 |
| | 2,148 |
| Florida | 2,520 |
| | 3,030 |
|
| Illinois | 2,319 |
| | 1,700 |
| |
| Northwest | Northwest | 2,037 |
| | 1,553 |
| Northwest | 2,151 |
| | 2,037 |
|
| Midsouth | Midsouth | 2,013 |
| | 1,980 |
| Midsouth | 1,724 |
| | 2,013 |
|
| Non-U.S. | Non-U.S. | 1,582 |
| | 1,483 |
| Non-U.S. | 2,494 |
| | 1,582 |
|
Other (1) | Other (1) | 1,731 |
| | 1,193 |
| Other (1) | 1,943 |
| | 1,731 |
|
| Total outstanding commercial real estate loans | Total outstanding commercial real estate loans | $ | 47,893 |
| | $ | 38,637 |
| Total outstanding commercial real estate loans | $ | 47,682 |
| | $ | 47,893 |
|
| By Property Type | By Property Type | |
| | |
| By Property Type | |
| | |
|
| Non-residential | Non-residential | | | | Non-residential | | | |
| Office | Office | $ | 12,799 |
| | $ | 9,324 |
| Office | $ | 13,306 |
| | $ | 12,799 |
|
| Multi-family rental | Multi-family rental | 8,559 |
| | 5,893 |
| Multi-family rental | 8,382 |
| | 8,559 |
|
| Shopping centers/retail | Shopping centers/retail | 7,470 |
| | 5,780 |
| Shopping centers/retail | 7,969 |
| | 7,470 |
|
| Industrial/warehouse | Industrial/warehouse | 4,522 |
| | 3,839 |
| Industrial/warehouse | 4,550 |
| | 4,522 |
|
| Hotels/motels | Hotels/motels | 3,926 |
| | 3,095 |
| Hotels/motels | 3,578 |
| | 3,926 |
|
| Multi-use | Multi-use | 1,960 |
| | 2,186 |
| Multi-use | 1,943 |
| | 1,960 |
|
| Land and land development | Land and land development | 855 |
| | 1,157 |
| Land and land development | 490 |
| | 855 |
|
| Other | Other | 6,283 |
| | 5,722 |
| Other | 5,754 |
| | 6,283 |
|
| Total non-residential | Total non-residential | 46,374 |
| | 36,996 |
| Total non-residential | 45,972 |
| | 46,374 |
|
| Residential | Residential | 1,519 |
| | 1,641 |
| Residential | 1,710 |
| | 1,519 |
|
| Total outstanding commercial real estate loans | Total outstanding commercial real estate loans | $ | 47,893 |
| | $ | 38,637 |
| Total outstanding commercial real estate loans | $ | 47,682 |
| | $ | 47,893 |
|
| |
(1) | Includes unsecured loans to real estate investment trusts and national home builders whose portfolios of properties span multiple geographic regions and properties in the states of Colorado, Utah, Hawaii, Wyoming and Montana. |
|
| | |
9487 Bank of America 20132014
| | |
Tables 4846 and 4947 present commercial real estate credit quality data by non-residential and residential property types. The residential portfolio presented in Tables 4745, 4846 and 4947 includes condominiums and other residential real estate. Other property
types in Tables 4745, 4846 and 4947 primarily include special purpose, nursing/retirement homes, medical facilities and restaurants, as well as unsecured loans to borrowers whose primary business is commercial real estate.
| | | | | | | | | | | | | | | | | | | |
| Table 48 | Commercial Real Estate Credit Quality Data | |
| Table 46 | | Commercial Real Estate Credit Quality Data |
| | | | | | | | | | | | | | | | | |
| | | December 31 | | December 31 |
| | | Nonperforming Loans and Foreclosed Properties (1) | | Utilized Reservable Criticized Exposure (2) | | Nonperforming Loans and Foreclosed Properties (1) | | Utilized Reservable Criticized Exposure (2) |
| (Dollars in millions) | (Dollars in millions) | 2013 | | 2012 | | 2013 | | 2012 | (Dollars in millions) | 2014 | | 2013 | | 2014 | | 2013 |
| Non-residential | Non-residential | |
| | |
| | |
| | |
| Non-residential | |
| | |
| | |
| | |
|
| Office | Office | $ | 96 |
| | $ | 295 |
| | $ | 367 |
| | $ | 914 |
| Office | $ | 177 |
| | $ | 96 |
| | $ | 235 |
| | $ | 367 |
|
| Multi-family rental | Multi-family rental | 15 |
| | 109 |
| | 234 |
| | 375 |
| Multi-family rental | 21 |
| | 15 |
| | 125 |
| | 234 |
|
| Shopping centers/retail | Shopping centers/retail | 57 |
| | 230 |
| | 144 |
| | 464 |
| Shopping centers/retail | 46 |
| | 57 |
| | 350 |
| | 144 |
|
| Industrial/warehouse | Industrial/warehouse | 22 |
| | 160 |
| | 119 |
| | 324 |
| Industrial/warehouse | 42 |
| | 22 |
| | 67 |
| | 119 |
|
| Hotels/motels | Hotels/motels | 5 |
| | 45 |
| | 38 |
| | 202 |
| Hotels/motels | 3 |
| | 5 |
| | 26 |
| | 38 |
|
| Multi-use | Multi-use | 19 |
| | 123 |
| | 157 |
| | 309 |
| Multi-use | 11 |
| | 19 |
| | 55 |
| | 157 |
|
| Land and land development | Land and land development | 73 |
| | 321 |
| | 92 |
| | 359 |
| Land and land development | 51 |
| | 73 |
| | 63 |
| | 92 |
|
| Other | Other | 23 |
| | 87 |
| | 173 |
| | 301 |
| Other | 15 |
| | 23 |
| | 159 |
| | 173 |
|
| Total non-residential | Total non-residential | 310 |
| | 1,370 |
| | 1,324 |
| | 3,248 |
| Total non-residential | 366 |
| | 310 |
| | 1,080 |
| | 1,324 |
|
| Residential | Residential | 102 |
| | 393 |
| | 128 |
| | 534 |
| Residential | 22 |
| | 102 |
| | 28 |
| | 128 |
|
| Total commercial real estate | Total commercial real estate | $ | 412 |
| | $ | 1,763 |
| | $ | 1,452 |
| | $ | 3,782 |
| Total commercial real estate | $ | 388 |
| | $ | 412 |
| | $ | 1,108 |
| | $ | 1,452 |
|
| |
(1) | Includes commercial foreclosed properties of $9067 million and $25090 million at December 31, 20132014 and 20122013. |
| |
(2) | Includes loans, SBLCs and bankers’ acceptances and excludes loans accounted for under the fair value option. |
| | | | | | | | | | | | | | | | | | | |
| Table 49 | Commercial Real Estate Net Charge-offs and Related Ratios | |
| Table 47 | | Commercial Real Estate Net Charge-offs and Related Ratios |
| | | | | | | | | | | | | | | | | |
| | | Net Charge-offs | | Net Charge-off Ratios (1) | | Net Charge-offs | | Net Charge-off Ratios (1) |
| (Dollars in millions) | (Dollars in millions) | 2013 | | 2012 | | 2013 | | 2012 | (Dollars in millions) | 2014 | | 2013 | | 2014 | | 2013 |
| Non-residential | Non-residential | |
| | |
| | |
| | |
| Non-residential | |
| | |
| | |
| | |
|
| Office | Office | $ | 42 |
| | $ | 106 |
| | 0.39 | % | | 1.36 | % | Office | $ | (4 | ) | | $ | 42 |
| | (0.04 | )% | | 0.39 | % |
| Multi-family rental | Multi-family rental | 2 |
| | 13 |
| | 0.02 |
| | 0.23 |
| Multi-family rental | (22 | ) | | 2 |
| | (0.25 | ) | | 0.02 |
|
| Shopping centers/retail | Shopping centers/retail | 12 |
| | 57 |
| | 0.18 |
| | 1.00 |
| Shopping centers/retail | 4 |
| | 12 |
| | 0.06 |
| | 0.18 |
|
| Industrial/warehouse | Industrial/warehouse | 23 |
| | 49 |
| | 0.55 |
| | 1.31 |
| Industrial/warehouse | (1 | ) | | 23 |
| | (0.03 | ) | | 0.55 |
|
| Hotels/motels | Hotels/motels | 18 |
| | 11 |
| | 0.52 |
| | 0.39 |
| Hotels/motels | (3 | ) | | 18 |
| | (0.07 | ) | | 0.52 |
|
| Multi-use | Multi-use | 5 |
| | 66 |
| | 0.26 |
| | 2.46 |
| Multi-use | (9 | ) | | 5 |
| | (0.49 | ) | | 0.26 |
|
| Land and land development | Land and land development | 23 |
| | (23 | ) | | 2.35 |
| | (1.73 | ) | Land and land development | (2 | ) | | 23 |
| | (0.31 | ) | | 2.35 |
|
| Other | Other | (23 | ) | | 31 |
| | (0.41 | ) | | 0.51 |
| Other | (38 | ) | | (23 | ) | | (0.64 | ) | | (0.41 | ) |
| Total non-residential | Total non-residential | 102 |
| | 310 |
| | 0.25 |
| | 0.86 |
| Total non-residential | (75 | ) | | 102 |
| | (0.16 | ) | | 0.25 |
|
| Residential | Residential | 47 |
| | 74 |
| | 3.04 |
| | 3.74 |
| Residential | (8 | ) | | 47 |
| | (0.47 | ) | | 3.04 |
|
| Total commercial real estate | Total commercial real estate | $ | 149 |
| | $ | 384 |
| | 0.35 |
| | 1.01 |
| Total commercial real estate | $ | (83 | ) | | $ | 149 |
| | (0.18 | ) | | 0.35 |
|
| |
(1) | Net charge-off ratios are calculated as net charge-offs divided by average outstanding loans excluding loans accounted for under the fair value option. |
At December 31, 20132014, total committed non-residential exposure was $68.6$67.7 billion compared to $54.5$68.6 billion at December 31, 20122013, of which $46.4$46.0 billion and $37.0$46.4 billion were funded secured loans. Non-residential nonperforming loans and foreclosed properties declined $1.1 billion,increased $56 million, or 7718 percent, to $310366 million at December 31, 20132014 compared to $1.4 billion at December 31, 20122013, which represented 0.670.79 percent and 3.680.67 percent of total non-residential loans and foreclosed properties. The declineincrease in nonperforming loans and foreclosed properties in the non-residential portfolio was driven by decreases across allprimarily in the office property types.type. Non-residential utilized reservable criticized exposure decreased $1.9 billion,$244 million, or 5918 percent, to $1.31.1 billion at December 31, 20132014 compared to $3.2 billion at December 31, 20122013, which represented 2.752.27 percent and 8.272.75 percent of non-residential utilized reservable exposure, with the decrease primarily due to continued resolution of legacy criticized exposure. The decrease in reservable criticized exposure was driven by decreases across all property types. For the non-residential portfolio, net charge-offs decreased $208177 million to $102a net recovery of $75 million
in 20132014 primarily due to lower overall levels of criticized and nonperforming assets.assets as well as recoveries of prior-period charge-offs.
At December 31, 20132014, total committed residential exposure was $3.1$3.6 billion compared to $3.2$3.1 billion at December 31, 20122013, of which $1.5$1.7 billion and $1.6$1.5 billion were funded secured loans. ResidentialIn 2014, residential nonperforming loans and foreclosed properties decreased $29180 million, or 7478 percent, in 2013 due to repayments, sales and loan restructuring. Residentialresidential utilized reservable criticized exposure decreased $406100 million, or 7678 percent, during 2013 due to continued resolution of criticized exposure.repayments, sales and loan restructurings. The nonperforming loans, leases and foreclosed properties and the utilized reservable criticized ratios for the residential portfolio were 1.28 percent and 1.51 percent at December 31, 2014 compared to 6.65 percent and 7.81 percent at December 31, 2013 compared to 23.33 percent and 31.56 percent at December 31, 2012. Residential portfolio net charge-offs decreased $2755 million to a net recovery of $8 million in 2013 compared to 20122014.
At December 31, 20132014 and 20122013, the commercial real estate loan portfolio included $7.0$6.7 billion and $6.7$7.0 billion of funded construction and land development loans that were originated to fund the construction and/or rehabilitation of commercial properties. Reservable criticized construction and land
|
| | |
| | | Bank of America 20132014 9588 |
fund the construction and/or rehabilitation of commercial properties. Reservable criticized construction and land development loans totaled $431$164 million and $1.5 billion,$431 million, and nonperforming construction and land development loans and foreclosed properties totaled $100$80 million and $730$100 million at December 31, 20132014 and 20122013. During a property’s construction phase, interest income is typically paid from interest reserves that are established at the inception of the loan. As construction is completed and the property is put into service, these interest reserves are depleted and interest payments from operating cash flows begin. We do not recognize interest income on nonperforming loans regardless of the existence of an interest reserve.
Non-U.S. Commercial
At December 31, 20132014, 7077 percent of the non-U.S. commercial loan portfolio was managed in Global Banking and 3023 percent in Global Markets. Outstanding loans, excluding loans accounted for under the fair value option, increased$15.3decreased $9.4 billion in 20132014 primarily due to increased demand from large corporate clients and client financing activity.activity including prime brokerage loans. Net charge-offs increaseddecreased $1711 million to $45$34 million in 20132014. For more information on the non-U.S. commercial portfolio, see Non-U.S. Portfolio on page 10093.
U.S. Small Business Commercial
The U.S. small business commercial loan portfolio is comprised of small business card loans and small business loans managed in CBB. Credit card-related products were 43 percent and 45 percent of the U.S. small business commercial portfolio at both December 31, 20132014 and 20122013. Net charge-offs decreased $34077 million to $359$282 million in 20132014 driven by lower delinquencies and bankruptcies resulting from an improvement in credit quality, within the small business loan portfolio,including lower delinquencies as a result of an improved economic environment, a reduction in higher risk vintages and the impact of higher credit quality originations. Of the U.S. small business commercial net charge-offs, 73 percent were credit card-related products in both 2014 and 2013 compared to 58 percent in 2012.
Commercial Loans Accounted for Under the Fair Value Option
The portfolio of commercial loans accounted for under the fair value option is managedheld primarily in Global Markets andGlobal Banking. Outstanding commercial loans accounted for under the fair value
option decreased$119 million $1.3 billion to an aggregate fair value of $7.96.6 billion at December 31, 20132014 primarily due to decreased corporate borrowings under bank credit facilities. We recorded net losses of $11 million in 2014 compared to net gains of $88 million in 2013 compared to $213 million in 2012 resulting from changes in the fair value of thethis loan portfolio. These amounts were primarily attributable to changes in instrument-specific credit risk, were recorded in other income (loss) and do not reflect the results of hedging activities.
In addition, unfunded lending commitments and letters of credit accounted for under the fair value option had an aggregate fair value of $354405 million and $528354 million at December 31, 20132014 and 20122013, which was recorded in accrued expenses and other liabilities. The associated aggregate notional amount of unfunded lending commitments and letters of credit accounted for under the fair value option was $13.0$9.9 billion and $18.3$13.0 billion at December 31, 20132014 and 20122013. We recorded net gainslosses of $18064 million from changes in the fair value of commitments and letters of credit during 20132014 compared to net gains of $704180 million in 20122013 resulting from maturities and terminations at par value and changes in the fair value of the loan portfolio.. These amounts were primarily attributable to changes in instrument-specific credit risk, were recorded in other income (loss) and do not reflect the results of hedging activities.
Nonperforming Commercial Loans, Leases and Foreclosed Properties Activity
Table 5048 presents the nonperforming commercial loans, leases and foreclosed properties activity during 20132014 and 20122013. Nonperforming loans do not include loans accounted for under the fair value option. During 20132014, nonperforming commercial loans and leases decreased $1.9 billion196 million to $1.31.1 billion driven by paydowns, charge-offs and salesreturns to performing status outpacing new nonperforming loans. Approximately 9198 percent of commercial nonperforming loans, leases and foreclosed properties were secured and approximately 5545 percent were contractually current. Commercial nonperforming loans were carried at approximately 7179 percent of their unpaid principal balance before consideration of the allowance for loan and lease losses as the carrying value of these loans has been reduced to the estimated property value less costs to sell.
|
| | |
9689 Bank of America 20132014
| | |
| | | | | | | | | | | |
| Table 50 | Nonperforming Commercial Loans, Leases and Foreclosed Properties Activity (1, 2) | |
| Table 48 | | Nonperforming Commercial Loans, Leases and Foreclosed Properties Activity (1, 2) |
| | | | | | | | | |
| (Dollars in millions) | (Dollars in millions) | 2013 | | 2012 | (Dollars in millions) | 2014 | | 2013 |
| Nonperforming loans and leases, January 1 | Nonperforming loans and leases, January 1 | $ | 3,224 |
| | $ | 6,337 |
| Nonperforming loans and leases, January 1 | $ | 1,309 |
| | $ | 3,224 |
|
| Additions to nonperforming loans and leases: | Additions to nonperforming loans and leases: | |
| | |
| Additions to nonperforming loans and leases: | |
| | |
|
| New nonperforming loans and leases | New nonperforming loans and leases | 1,112 |
| | 2,334 |
| New nonperforming loans and leases | 1,228 |
| | 1,112 |
|
| Advances | Advances | 30 |
| | 85 |
| Advances | 48 |
| | 30 |
|
| Reductions to nonperforming loans and leases: | Reductions to nonperforming loans and leases: | |
| | |
| Reductions to nonperforming loans and leases: | |
| | |
|
| Paydowns | Paydowns | (1,342 | ) | | (2,372 | ) | Paydowns | (717 | ) | | (1,342 | ) |
| Sales | Sales | (498 | ) | | (840 | ) | Sales | (149 | ) | | (498 | ) |
Returns to performing status (3) | Returns to performing status (3) | (588 | ) | | (808 | ) | Returns to performing status (3) | (261 | ) | | (588 | ) |
| Charge-offs | Charge-offs | (549 | ) | | (1,164 | ) | Charge-offs | (332 | ) | | (549 | ) |
Transfers to foreclosed properties (4) | Transfers to foreclosed properties (4) | (54 | ) | | (302 | ) | Transfers to foreclosed properties (4) | (13 | ) | | (54 | ) |
| Transfers to loans held-for-sale | Transfers to loans held-for-sale | (26 | ) | | (46 | ) | Transfers to loans held-for-sale | — |
| | (26 | ) |
| Total net reductions to nonperforming loans and leases | Total net reductions to nonperforming loans and leases | (1,915 | ) | | (3,113 | ) | Total net reductions to nonperforming loans and leases | (196 | ) | | (1,915 | ) |
| Total nonperforming loans and leases, December 31 | Total nonperforming loans and leases, December 31 | 1,309 |
| | 3,224 |
| Total nonperforming loans and leases, December 31 | 1,113 |
| | 1,309 |
|
| Foreclosed properties, January 1 | Foreclosed properties, January 1 | 250 |
| | 612 |
| Foreclosed properties, January 1 | 90 |
| | 250 |
|
| Additions to foreclosed properties: | Additions to foreclosed properties: | |
| | |
| Additions to foreclosed properties: | |
| | |
|
New foreclosed properties (4) | New foreclosed properties (4) | 38 |
| | 222 |
| New foreclosed properties (4) | 11 |
| | 38 |
|
| Reductions to foreclosed properties: | Reductions to foreclosed properties: | |
| | |
| Reductions to foreclosed properties: | |
| | |
|
| Sales | Sales | (169 | ) | | (516 | ) | Sales | (26 | ) | | (169 | ) |
| Write-downs | Write-downs | (29 | ) | | (68 | ) | Write-downs | (8 | ) | | (29 | ) |
| Total net reductions to foreclosed properties | Total net reductions to foreclosed properties | (160 | ) | | (362 | ) | Total net reductions to foreclosed properties | (23 | ) | | (160 | ) |
| Total foreclosed properties, December 31 | Total foreclosed properties, December 31 | 90 |
| | 250 |
| Total foreclosed properties, December 31 | 67 |
| | 90 |
|
| Nonperforming commercial loans, leases and foreclosed properties, December 31 | Nonperforming commercial loans, leases and foreclosed properties, December 31 | $ | 1,399 |
| | $ | 3,474 |
| Nonperforming commercial loans, leases and foreclosed properties, December 31 | $ | 1,180 |
| | $ | 1,399 |
|
Nonperforming commercial loans and leases as a percentage of outstanding commercial loans and leases (5) | Nonperforming commercial loans and leases as a percentage of outstanding commercial loans and leases (5) | 0.34 | % | | 0.93 | % | Nonperforming commercial loans and leases as a percentage of outstanding commercial loans and leases (5) | 0.29 | % | | 0.34 | % |
Nonperforming commercial loans, leases and foreclosed properties as a percentage of outstanding commercial loans, leases and foreclosed properties (5) | Nonperforming commercial loans, leases and foreclosed properties as a percentage of outstanding commercial loans, leases and foreclosed properties (5) | 0.36 |
| | 1.00 |
| Nonperforming commercial loans, leases and foreclosed properties as a percentage of outstanding commercial loans, leases and foreclosed properties (5) | 0.31 |
| | 0.36 |
|
| |
(1) | Balances do not include nonperforming LHFS of $296$212 million and $437$296 million at December 31, 20132014 and 20122013. |
| |
(2) | Includes U.S. small business commercial activity. Small business card loans are excluded as they are not classified as nonperforming. |
| |
(3) | Commercial loans and leases may be returned to performing status when all principal and interest is current and full repayment of the remaining contractual principal and interest is expected, or when the loan otherwise becomes well-secured and is in the process of collection. TDRs are generally classified as performing after a sustained period of demonstrated payment performance. |
| |
(4) | New foreclosed properties represents transfers of nonperforming loans to foreclosed properties net of charge-offs recorded during the first 90 days after transfer of a loan to foreclosed properties. |
| |
(5) | Outstanding commercial loans exclude loans accounted for under the fair value option. |
Table 5149 presents our commercial TDRs by product type and performing status. U.S. small business commercial TDRs are comprised of renegotiated small business card loans and are not classified as nonperforming as they are charged off no later than
the end of the month in which the loan becomes 180 days past due. For more information on TDRs, see Note 4 – Outstanding Loans and Leases to the Consolidated Financial Statements.
| | | | | | | | | | | | | | | | | | | | | | | | | | | |
| Table 51 | Commercial Troubled Debt Restructurings | |
| Table 49 | | Commercial Troubled Debt Restructurings |
| | | | | |
| | | December 31 | | December 31 |
| | | 2013 | | 2012 | | 2014 | | 2013 |
| (Dollars in millions) | (Dollars in millions) | Total | | Nonperforming | | Performing | | Total | | Nonperforming | | Performing | (Dollars in millions) | Total | | Nonperforming | | Performing | | Total | | Nonperforming | | Performing |
| U.S. commercial | U.S. commercial | $ | 1,318 |
| | $ | 298 |
| | $ | 1,020 |
| | $ | 1,328 |
| | $ | 565 |
| | $ | 763 |
| U.S. commercial | $ | 1,096 |
| | $ | 308 |
| | $ | 788 |
| | $ | 1,318 |
| | $ | 298 |
| | $ | 1,020 |
|
| Commercial real estate | Commercial real estate | 835 |
| | 198 |
| | 637 |
| | 1,391 |
| | 740 |
| | 651 |
| Commercial real estate | 456 |
| | 234 |
| | 222 |
| | 835 |
| | 198 |
| | 637 |
|
| Non-U.S. commercial | Non-U.S. commercial | 48 |
| | 38 |
| | 10 |
| | 100 |
| | 15 |
| | 85 |
| Non-U.S. commercial | 43 |
| | — |
| | 43 |
| | 48 |
| | 38 |
| | 10 |
|
| U.S. small business commercial | U.S. small business commercial | 88 |
| | — |
| | 88 |
| | 202 |
| | — |
| | 202 |
| U.S. small business commercial | 35 |
| | — |
| | 35 |
| | 88 |
| | — |
| | 88 |
|
| Total commercial troubled debt restructurings | Total commercial troubled debt restructurings | $ | 2,289 |
| | $ | 534 |
| | $ | 1,755 |
| | $ | 3,021 |
| | $ | 1,320 |
| | $ | 1,701 |
| Total commercial troubled debt restructurings | $ | 1,630 |
| | $ | 542 |
| | $ | 1,088 |
| | $ | 2,289 |
| | $ | 534 |
| | $ | 1,755 |
|
Industry Concentrations
Table 5250 presents commercial committed and utilized credit exposure by industry and the total net credit default protection purchased to cover the funded and unfunded portions of certain credit exposures. Our commercial credit exposure is diversified across a broad range of industries. Total commercial committed commercial credit exposure increased$56.8 $8.6 billion, or seven percent, in 2014 to $823.8832.4 billion at December 31, 2013. The increase in commercial committed exposure was concentrated in diversified financials, real estate,energy, food, beverage and tobacco, retailing, and capital goods,health care equipment and services, partially offset by lower exposure in food, beveragediversified financials and tobacco.telecommunications services.
Industry limits are used internally to manage industry concentrations and are based on committed exposures and capital
usage that are allocated on an industry-by-industry basis. A risk management framework is in place to set and approve industry limits as well as to provide ongoing monitoring. Management’s Credit Risk Committee (CRC) overseesManagement oversight of industry limit governance.concentrations, including industry limits, is the responsibility of a subcommittee of the MRC.
Diversified financials, our largest industry concentration experienced an increase inwith committed exposure of $21.5$103.5 billion, decreased $14.6 billion, or 2212 percent, in 20132014, driven by higher funded. The decrease primarily reflected lower margin loans and certain asset-backed lending products.consumer finance exposure.
Real estate, our second largest industry concentration experienced an increase inwith committed exposure of $10.8$76.2 billion, or 16 percent,decreased $265 million in 20132014 primarily. The decrease was largely driven by portfolio sales, and a combination of prepayments and paydowns due to new originations and renewals outpacing paydowns and sales. Real estate construction and land development exposure represented 14 percent of thefavorable
|
| | |
| | | Bank of America 20132014 9790 |
market liquidity, and lower levels of originations. Real estate construction and land development exposure represented 13 percent and 14 percent of the total real estate industry committed exposure at December 31, 20132014 and 20122013. For more information on commercial real estate and related portfolios, see Commercial Portfolio Credit Risk Management – Commercial Real Estate on page 9487.
Retailing,The following changes in our third largest industry concentration experienced an increase in committed exposure of $6.9 billion, or 14 percent, inoccurred during 20132014 driven by loans to auto dealers and wholesalers, apparel retail, and specialty stores.. Committed exposure to the food,energy industry increased $6.5 billion, or 16 percent, driven by higher exposure in the oil and gas refining and marketing, exploration and production, and equipment and services sectors. The latter two sectors include bridge financing, a significant portion of which was subsequently distributed. Food, beverage and tobacco industry decreased$6.8 billion, or 18 percent, in 2013, primarily related to commitment reductions and paydowns. Capital goods committed exposure increased $3.7$3.9 billion, or 13 percent, primarily reflecting bridge financing in the beverage sector. Retailing industry committed exposure increased $3.4 billion, or six percent, driven by higher exposure to internet retail and wholesale food and beverage sectors. The healthcare equipment and services industry increased $3.4 billion, or seven percent, in 2013primarily driven by heavy electrical equipment and machinery exposure. Healthcare equipment andbridge financing for acquisitions. Telecommunications services committed exposure increased$3.6decreased $2.1 billion,, or eight19 percent,, in 2013 driven by health care distributors, doctors, dentists primarily reflecting broadly distributed commitment reductions and practitioners, and health care equipment. Energy committed exposure increased$2.7 billion, or seven percent, in 2013 reflecting higher exposure to the integrated oil and gas, and exploration and production sectors.paydowns.
The significant decline in oil prices since June 2014 has impacted and may continue to impact the financial performance of energy producers as well as energy equipment and service providers. While we did not experience material asset quality deterioration in our energy portfolio through December 31, 2014, the magnitude of the impact over time will depend upon the level and duration of future oil prices.
Our committed state and municipal exposure of $35.9$38.5 billion at December 31, 20132014 consisted of $29.4$31.7 billion of commercial utilized exposure (including $18.6$19.1 billion of funded loans, $7.3$6.3 billion of SBLCs and $1.7$2.4 billion of derivative assets) and $6.5$6.8 billion of unfunded commercial exposure (primarily unfunded loan commitments and letters of credit) and is reported in the government and public education industry in Table 5250. WhileWith the slow pace of economic recovery continues to pressure budgets,U.S. economy gradually strengthening, most state and local governments have implemented offsettingare experiencing improved fiscal adjustmentsconditions and continue to honor debt obligations as agreed. While historical default rates have been low, as part of our overall and ongoing risk management processes, we continually monitor these exposures through a rigorous review process. Additionally, internal communications are regularly circulated such that exposure levels are maintained in compliance with established concentration guidelines.
| | | | | | | | | | | | | | | | | | | |
| Table 52 | Commercial Credit Exposure by Industry (1) | |
| Table 50 | | Commercial Credit Exposure by Industry (1) |
| | | | | | | | | | | | | | | | | |
| | | December 31 | | December 31 |
| | | Commercial Utilized | | Total Commercial Committed | | Commercial Utilized | | Total Commercial Committed |
| (Dollars in millions) | (Dollars in millions) | 2013 | | 2012 | | 2013 | | 2012 | (Dollars in millions) | 2014 | | 2013 | | 2014 | | 2013 |
| Diversified financials | Diversified financials | $ | 78,423 |
| | $ | 66,102 |
| | $ | 121,075 |
| | $ | 99,574 |
| Diversified financials | $ | 63,306 |
| | $ | 76,673 |
| | $ | 103,528 |
| | $ | 118,092 |
|
Real estate (2) | Real estate (2) | 54,336 |
| | 47,479 |
| | 76,418 |
| | 65,639 |
| Real estate (2) | 53,834 |
| | 54,336 |
| | 76,153 |
| | 76,418 |
|
| Retailing | Retailing | 32,859 |
| | 28,065 |
| | 54,616 |
| | 47,719 |
| Retailing | 33,683 |
| | 32,859 |
| | 58,043 |
| | 54,616 |
|
| Capital goods | Capital goods | 28,016 |
| | 25,071 |
| | 52,849 |
| | 49,196 |
| Capital goods | 29,028 |
| | 28,016 |
| | 54,653 |
| | 52,849 |
|
| Healthcare equipment and services | Healthcare equipment and services | 30,828 |
| | 29,396 |
| | 49,063 |
| | 45,488 |
| Healthcare equipment and services | 32,923 |
| | 30,828 |
| | 52,450 |
| | 49,063 |
|
| Government and public education | Government and public education | 40,253 |
| | 41,441 |
| | 48,322 |
| | 50,277 |
| Government and public education | 42,095 |
| | 40,253 |
| | 49,937 |
| | 48,322 |
|
| Banking | Banking | 39,649 |
| | 39,829 |
| | 45,095 |
| | 44,822 |
| Banking | 42,330 |
| | 41,399 |
| | 48,353 |
| | 48,078 |
|
| Energy | | Energy | 23,830 |
| | 19,739 |
| | 47,667 |
| | 41,156 |
|
| Materials | Materials | 22,384 |
| | 21,809 |
| | 42,699 |
| | 40,493 |
| Materials | 23,664 |
| | 22,384 |
| | 45,821 |
| | 42,699 |
|
| Energy | 19,739 |
| | 17,661 |
| | 41,156 |
| | 38,441 |
| |
| Food, beverage and tobacco | | Food, beverage and tobacco | 16,131 |
| | 14,437 |
| | 34,465 |
| | 30,541 |
|
| Consumer services | Consumer services | 21,080 |
| | 23,093 |
| | 34,217 |
| | 36,367 |
| Consumer services | 21,657 |
| | 21,080 |
| | 33,269 |
| | 34,217 |
|
| Commercial services and supplies | Commercial services and supplies | 19,770 |
| | 19,020 |
| | 32,007 |
| | 30,257 |
| Commercial services and supplies | 17,997 |
| | 19,770 |
| | 30,451 |
| | 32,007 |
|
| Food, beverage and tobacco | 14,437 |
| | 14,738 |
| | 30,541 |
| | 37,344 |
| |
| Utilities | Utilities | 9,253 |
| | 8,403 |
| | 25,243 |
| | 23,425 |
| Utilities | 9,399 |
| | 9,253 |
| | 25,235 |
| | 25,243 |
|
| Transportation | | Transportation | 17,538 |
| | 15,280 |
| | 24,541 |
| | 22,595 |
|
| Media | Media | 13,070 |
| | 13,091 |
| | 22,655 |
| | 21,705 |
| Media | 11,128 |
| | 13,070 |
| | 21,502 |
| | 22,655 |
|
| Transportation | 15,280 |
| | 13,791 |
| | 22,595 |
| | 20,255 |
| |
| Individuals and trusts | Individuals and trusts | 14,864 |
| | 13,916 |
| | 18,681 |
| | 17,801 |
| Individuals and trusts | 16,749 |
| | 14,864 |
| | 21,195 |
| | 18,681 |
|
| Software and services | Software and services | 6,814 |
| | 5,549 |
| | 14,172 |
| | 12,125 |
| Software and services | 5,927 |
| | 6,814 |
| | 14,071 |
| | 14,172 |
|
| Pharmaceuticals and biotechnology | Pharmaceuticals and biotechnology | 6,455 |
| | 3,846 |
| | 13,986 |
| | 11,401 |
| Pharmaceuticals and biotechnology | 5,707 |
| | 6,455 |
| | 13,493 |
| | 13,986 |
|
| Technology hardware and equipment | Technology hardware and equipment | 6,166 |
| | 5,111 |
| | 12,733 |
| | 11,101 |
| Technology hardware and equipment | 5,489 |
| | 6,166 |
| | 12,350 |
| | 12,733 |
|
| Insurance, including monolines | Insurance, including monolines | 5,926 |
| | 8,491 |
| | 12,203 |
| | 14,117 |
| Insurance, including monolines | 5,204 |
| | 5,926 |
| | 11,252 |
| | 12,203 |
|
| Telecommunication services | 4,541 |
| | 4,008 |
| | 11,423 |
| | 10,276 |
| |
| Consumer durables and apparel | Consumer durables and apparel | 5,427 |
| | 4,246 |
| | 9,757 |
| | 8,438 |
| Consumer durables and apparel | 6,111 |
| | 5,427 |
| | 10,613 |
| | 9,757 |
|
| Automobiles and components | Automobiles and components | 3,165 |
| | 3,312 |
| | 8,424 |
| | 7,675 |
| Automobiles and components | 4,114 |
| | 3,165 |
| | 9,683 |
| | 8,424 |
|
| Telecommunication services | | Telecommunication services | 3,814 |
| | 4,541 |
| | 9,295 |
| | 11,423 |
|
| Food and staples retailing | Food and staples retailing | 3,950 |
| | 3,528 |
| | 7,909 |
| | 6,838 |
| Food and staples retailing | 3,848 |
| | 3,950 |
| | 7,418 |
| | 7,909 |
|
| Religious and social organizations | Religious and social organizations | 5,452 |
| | 6,850 |
| | 7,677 |
| | 9,107 |
| Religious and social organizations | 4,881 |
| | 5,452 |
| | 6,548 |
| | 7,677 |
|
| Other | Other | 5,357 |
| | 3,881 |
| | 8,309 |
| | 7,124 |
| Other | 6,255 |
| | 5,357 |
| | 10,415 |
| | 8,309 |
|
| Total commercial credit exposure by industry | Total commercial credit exposure by industry | $ | 507,494 |
| | $ | 471,727 |
| | $ | 823,825 |
| | $ | 767,005 |
| Total commercial credit exposure by industry | $ | 506,642 |
| | $ | 507,494 |
| | $ | 832,401 |
| | $ | 823,825 |
|
Net credit default protection purchased on total commitments (3) | Net credit default protection purchased on total commitments (3) | |
| | |
| | $ | (8,085 | ) | | $ | (14,657 | ) | Net credit default protection purchased on total commitments (3) | |
| | |
| | $ | (7,302 | ) | | $ | (8,085 | ) |
| |
(1) | Includes U.S. small business commercial exposure. |
| |
(2) | Industries are viewed from a variety of perspectives to best isolate the perceived risks. For purposes of this table, the real estate industry is defined based on the borrowers’ or counterparties’ primary business activity using operating cash flows and primary source of repayment as key factors. |
| |
(3) | Represents net notional credit protection purchased. For additional information, see Commercial Portfolio Credit Risk Management – Risk Mitigation on page 9992. |
|
| | |
9891 Bank of America 20132014
| | |
Monoline Exposure
Monoline exposure is reported in the insurance industry and managed under insurance portfolio industry limits. We have indirect exposure to monolines primarily in the form of guarantees supporting our loans, investment portfolios, securitizations and credit-enhanced securities as part of our public finance business, and other selected products. Such indirect exposure exists when we purchase credit protection from monolines to hedge all or a portion of the credit risk on certain credit exposures including loans and CDOs. We underwrite our public finance exposure by evaluating the underlying securities.
We also have indirect exposure to monolines in the form of guarantees supporting our mortgage and other loan sales. Indirect exposure may exist when credit protection was purchased from monolines to hedge all or a portion of the credit risk on certain mortgage and other loan exposures. A loss may occur when we are required to repurchase a loan due to a breach of the representations and warranties, and the market value of the loan has declined, or we are required to indemnify or provide recourse for a guarantor’s loss. For more information regarding our exposure to representations and warranties, see Off-Balance Sheet Arrangements and Contractual Obligations – Representations and Warranties on page 5250 and Note 7 – Representations and Warranties Obligations and Corporate Guarantees to the Consolidated Financial Statements.
Table 5351 presents the notional amount of our monoline derivative credit exposure, mark-to-market adjustment and the counterparty credit valuation adjustment.CVA. The notional amount of monoline exposure decreased $2.9 billion in 20132014 due to terminations, paydowns and maturities of monoline contracts.
| | | | | | | | | | | |
| Table 53 | Derivative Credit Exposures | |
| Table 51 | | Monoline Derivative Credit Exposures |
| | | | | | | | | |
| | | December 31 | | December 31 |
| (Dollars in millions) | (Dollars in millions) | 2013 | | 2012 | (Dollars in millions) | 2014 | | 2013 |
| Notional amount of monoline exposure | Notional amount of monoline exposure | $ | 10,631 |
| | $ | 13,547 |
| Notional amount of monoline exposure | $ | 7,720 |
| | $ | 10,631 |
|
| | | | | | | | | |
| Mark-to-market | Mark-to-market | $ | 97 |
| | $ | 898 |
| Mark-to-market | $ | 49 |
| | $ | 97 |
|
| Counterparty credit valuation adjustment | Counterparty credit valuation adjustment | (15 | ) | | (118 | ) | Counterparty credit valuation adjustment | (6 | ) | | (15 | ) |
| Net mark-to-market | Net mark-to-market | $ | 82 |
| | $ | 780 |
| Net mark-to-market | $ | 43 |
| | $ | 82 |
|
| | | | | | | | | |
| | | 2013 | | 2012 | | 2014 | | 2013 |
| Gains from credit valuation changes | $ | 73 |
| | $ | 213 |
| |
| Gains (losses) from credit valuation changes | | Gains (losses) from credit valuation changes | $ | (2 | ) | | $ | 73 |
|
Risk Mitigation
We purchase credit protection to cover the funded portion as well as the unfunded portion of certain credit exposures. To lower the cost of obtaining our desired credit protection levels, we may add credit exposure within an industry, borrower or counterparty group by selling protection.
At December 31, 20132014 and 20122013, net notional credit default protection purchased in our credit derivatives portfolio to hedge our funded and unfunded exposures for which we elected the fair value option, as well as certain other credit exposures, was $8.17.3 billion and $14.78.1 billion. The mark-to-market effects resulted inWe recorded net losses of $50 million and $356 million in 2014 and 2013 compared to $1.0 billion in 2012.on these positions. The gains and losses on these instruments were offset by gains and losses on the related exposures. The VaR results for these exposures are included in the fair value option portfolio information in Table 54 presents the average VaR statistics at a 99 percent confidence interval for the hedged credit exposure, the purchased credit protection and the remaining position. See 61. For more information, see Trading Risk Management on page 109 for a100.
description of our VaR calculation for the market-based trading portfolio.
|
| | | | | | | | |
| | | | | |
| Table 54 | Credit Derivative VaR Statistics |
| | | | | |
| (Dollars in millions) | 2013 | | 2012 |
| Hedged credit exposure, average | $ | 44 |
| | $ | 79 |
|
| Purchased credit protection, average | 19 |
| | 52 |
|
Remaining, average (1) | 28 |
| | 24 |
|
| |
(1)
| Reflects the diversification effect between net credit default protection hedging our credit exposure and the related credit exposure. |
Tables 5552 and 5653 present the maturity profiles and the credit exposure debt ratings of the net credit default protection portfolio at December 31, 20132014 and 20122013.
| | | | | | | | | | | |
| Table 55 | Net Credit Default Protection by Maturity | |
| Table 52 | | Net Credit Default Protection by Maturity |
| | | | | | | | | |
| | | December 31 | | December 31 |
| | | 2013 | | 2012 | | 2014 | | 2013 |
| Less than or equal to one year | Less than or equal to one year | 35 | % | | 21 | % | Less than or equal to one year | 43 | % | | 35 | % |
| Greater than one year and less than or equal to five years | Greater than one year and less than or equal to five years | 63 |
| | 75 |
| Greater than one year and less than or equal to five years | 55 |
| | 63 |
|
| Greater than five years | Greater than five years | 2 |
| | 4 |
| Greater than five years | 2 |
| | 2 |
|
| Total net credit default protection | Total net credit default protection | 100 | % | | 100 | % | Total net credit default protection | 100 | % | | 100 | % |
| | | | | | | | | | | | | | | | | | | |
| Table 56 | Net Credit Default Protection by Credit Exposure Debt Rating | |
| Table 53 | | Net Credit Default Protection by Credit Exposure Debt Rating |
| | | | | | | | | | | | | | | | | |
| | | December 31 | | December 31 |
| | | 2013 | | 2012 | | 2014 | | 2013 |
| (Dollars in millions) | (Dollars in millions) | Net Notional (1) | | Percent of Total | | Net Notional (1) | | Percent of Total | (Dollars in millions) | Net Notional (1) | | Percent of Total | | Net Notional (1) | | Percent of Total |
Ratings (2, 3) | Ratings (2, 3) | |
| | |
| | |
| | |
| Ratings (2, 3) | |
| | |
| | |
| | |
|
| AAA | $ | — |
| | — | % | | $ | (120 | ) | | 0.8 | % | |
| AA | AA | (7 | ) | | 0.1 |
| | (474 | ) | | 3.2 |
| AA | $ | — |
| | — | % | | $ | (7 | ) | | 0.1 | % |
| A | A | (2,560 | ) | | 31.7 |
| | (5,861 | ) | | 40.0 |
| A | (1,310 | ) | | 17.9 |
| | (2,560 | ) | | 31.7 |
|
| BBB | BBB | (3,880 | ) | | 48.0 |
| | (6,067 | ) | | 41.4 |
| BBB | (4,207 | ) | | 57.6 |
| | (3,880 | ) | | 48.0 |
|
| BB | BB | (1,137 | ) | | 14.1 |
| | (1,101 | ) | | 7.5 |
| BB | (1,001 | ) | | 13.7 |
| | (1,137 | ) | | 14.1 |
|
| B | B | (452 | ) | | 5.6 |
| | (937 | ) | | 6.4 |
| B | (643 | ) | | 8.8 |
| | (452 | ) | | 5.6 |
|
| CCC and below | CCC and below | (115 | ) | | 1.4 |
| | (247 | ) | | 1.7 |
| CCC and below | (131 | ) | | 1.8 |
| | (115 | ) | | 1.4 |
|
NR (4) | NR (4) | 66 |
| | (0.9 | ) | | 150 |
| | (1.0 | ) | NR (4) | (10 | ) | | 0.2 |
| | 66 |
| | (0.9 | ) |
| Total net credit default protection | Total net credit default protection | $ | (8,085 | ) | | 100.0 | % | | $ | (14,657 | ) | | 100.0 | % | Total net credit default protection | $ | (7,302 | ) | | 100.0 | % | | $ | (8,085 | ) | | 100.0 | % |
| |
(1) | Represents net credit default protection (purchased) sold. |
| |
(2) | Ratings are refreshed on a quarterly basis. |
| |
(3) | Ratings of BBB- or higher are considered to meet the definition of investment grade. |
| |
(4) | NR is comprised of index positions held and any names that have not been rated. |
In addition to our net notional credit default protection purchased to cover the funded and unfunded portion of certain credit exposures, credit derivatives are used for market-making activities for clients and establishing positions intended to profit from directional or relative value changes. We execute the majority of our credit derivative trades in the OTC market with large, multinational financial institutions, including broker/dealersbroker-dealers and, to a lesser degree, with a variety of other investors. Because these transactions are executed in the OTC market, we are subject to settlement risk. We are also subject to credit risk in the event that these counterparties fail to perform under the terms of these contracts. In most cases, credit derivative transactions are executed on a daily margin basis. Therefore, events such as a credit downgrade, depending on the ultimate rating level, or a breach of credit covenants would typically require an increase in
the amount of collateral required by the counterparty, where applicable, and/or allow us to take additional protective measures such as early termination of all trades.
Table 5754 presents the total contract/notional amount of credit derivatives outstanding and includes both purchased and written credit derivatives. The credit risk amounts are measured as net asset exposure by counterparty, taking into consideration all contracts with the counterparty. For more information on our written credit derivatives, see Note 2 – Derivatives to the Consolidated Financial Statements.
The credit risk amounts discussed above and presented in Table 5754 take into consideration the effects of legally enforceable master netting agreements, while amounts disclosed in Note 2 – Derivatives to the Consolidated Financial Statements are shown
on a gross basis. Credit risk reflects the potential benefit from offsetting exposure to non-credit derivative products with the same counterparties that may be netted upon the occurrence of certain events, thereby reducing our overall exposure.
| | | | | | | | | | | | | | | | | | | |
| Table 57 | Credit Derivatives | |
| Table 54 | | Credit Derivatives |
| | | | | | | | | | | | | | | | | |
| | | December 31 | | December 31 |
| | | 2013 | | 2012 | | 2014 | | 2013 |
| (Dollars in millions) | (Dollars in millions) | Contract/ Notional | | Credit Risk | | Contract/ Notional | | Credit Risk | (Dollars in millions) | Contract/ Notional | | Credit Risk | | Contract/ Notional | | Credit Risk |
| Purchased credit derivatives: | Purchased credit derivatives: | |
| | |
| | |
| | |
| Purchased credit derivatives: | |
| | |
| | |
| | |
|
| Credit default swaps | Credit default swaps | $ | 1,305,090 |
| | $ | 6,042 |
| | $ | 1,559,472 |
| | $ | 8,987 |
| Credit default swaps | $ | 1,094,796 |
| | $ | 3,833 |
| | $ | 1,305,090 |
| | $ | 6,042 |
|
| Total return swaps/other | Total return swaps/other | 38,094 |
| | 402 |
| | 43,489 |
| | 402 |
| Total return swaps/other | 44,333 |
| | 510 |
| | 38,094 |
| | 402 |
|
| Total purchased credit derivatives | Total purchased credit derivatives | $ | 1,343,184 |
| | $ | 6,444 |
| | $ | 1,602,961 |
| | $ | 9,389 |
| Total purchased credit derivatives | $ | 1,139,129 |
| | $ | 4,343 |
| | $ | 1,343,184 |
| | $ | 6,444 |
|
| Written credit derivatives: | Written credit derivatives: | |
| | |
| | |
| | |
| Written credit derivatives: | |
| | |
| | |
| | |
|
| Credit default swaps | Credit default swaps | $ | 1,265,380 |
| | n/a |
| | $ | 1,531,504 |
| | n/a |
| Credit default swaps | $ | 1,073,101 |
| | n/a |
| | $ | 1,265,380 |
| | n/a |
|
| Total return swaps/other | Total return swaps/other | 63,407 |
| | n/a |
| | 68,811 |
| | n/a |
| Total return swaps/other | 61,031 |
| | n/a |
| | 63,407 |
| | n/a |
|
| Total written credit derivatives | Total written credit derivatives | $ | 1,328,787 |
| | n/a |
| | $ | 1,600,315 |
| | n/a |
| Total written credit derivatives | $ | 1,134,132 |
| | n/a |
| | $ | 1,328,787 |
| | n/a |
|
n/a = not applicable
Counterparty Credit Risk Valuation Adjustments
We record counterparty credit risk valuation adjustments on certain derivative assets, including our credit default protection purchased, in order to properly reflect the credit risk of the counterparty.counterparty, as presented in Table 55. We calculate CVA based on a modeled expected exposure that incorporates current market risk factors including changes in market spreads and non-credit related market factors that affect the value of a derivative. The exposure also takes into consideration credit mitigants such as legally enforceable master netting agreements and collateral. For additional information, see Note 2 – Derivatives to the Consolidated Financial Statements.
|
| | | | | | | | | | | | | | | | | | | | |
| | | | | | | | | |
| Table 58 | Credit Valuation Gains and Losses |
| | | | | | | | | |
| | | 2013 | | 2012 |
| (Dollars in millions) | Gross | Hedge | Net | | Gross | Hedge | Net |
| Credit valuation gains (losses) | $ | 738 |
| $ | (834 | ) | $ | (96 | ) | | $ | 1,022 |
| $ | (731 | ) | $ | 291 |
|
|
| | | | | | | | | | | | | | | | | | | | |
| | | | | | | | | |
| Table 55 | Credit Valuation Gains and Losses |
| | | | | | | | | |
| Gains (Losses) | 2014 | | 2013 |
| (Dollars in millions) | Gross | Hedge | Net | | Gross | Hedge | Net |
| Credit valuation | $ | (22 | ) | $ | 213 |
| $ | 191 |
| | $ | 738 |
| $ | (834 | ) | $ | (96 | ) |
Non-U.S. Portfolio
Our non-U.S. credit and trading portfolios are subject to country risk. We define country risk as the risk of loss from unfavorable economic and political conditions, currency fluctuations, social instability and changes in government policies. A risk management framework is in place to measure, monitor and manage non-U.S. risk and exposures. Management oversight of country risk, including cross-border risk, is provided by the Country Credit Risk Committee,responsibility of a subcommittee of the CRC.MRC. In addition to the direct risk of doing business in a country, we also are exposed to indirect country risks (e.g., related to the collateral received on secured financing transactions or related to client clearing activities). These indirect exposures are managed in the normal course of business through credit, market and operational risk governance, rather than through country risk governance.
Table 5956 presents our total non-U.S. exposure broken out by region at December 31, 20132014 and 20122013. Non-U.S. exposure is presented on an internal risk management basis and includes sovereign and non-sovereign credit exposure, securities and other investments issued by or domiciled in countries other than the U.S. The risk assignments by country can be adjusted for external guarantees and certain collateral types. Exposures that are subject to external guarantees are reported under the country of the guarantor. Exposures with tangible collateral are reflected in the country where the collateral is held. For securities received, other than cross-border resale agreements, outstandings are assigned to the domicile of the issuer of the securities.
| | | | | | | | | | | | | | | |
| Table 59 | Total Non-U.S. Exposure by Region | |
| Table 56 | | Total Non-U.S. Exposure by Region | | |
| | | | | | | | | | |
| | | | | | | December 31 |
| | | December 31 | | 2014 | | 2013 |
| (Dollars in millions) | (Dollars in millions) | 2013 | | 2012 | (Dollars in millions) | Amount | | Percent of Total | | Amount | | Percent of Total |
| Europe | Europe | $ | 133,303 |
| | $ | 137,778 |
| Europe | $ | 129,573 |
| | 49 | % | | $ | 133,303 |
| | 53 | % |
| Asia Pacific | Asia Pacific | 69,266 |
| | 92,412 |
| Asia Pacific | 78,792 |
| | 30 |
| | 69,266 |
| | 27 |
|
| Latin America | Latin America | 21,723 |
| | 21,246 |
| Latin America | 23,403 |
| | 9 |
| | 21,723 |
| | 9 |
|
| Middle East and Africa | Middle East and Africa | 8,691 |
| | 8,200 |
| Middle East and Africa | 10,801 |
| | 4 |
| | 8,691 |
| | 3 |
|
Other (1) | Other (1) | 20,866 |
| | 22,014 |
| Other (1) | 22,701 |
| | 8 |
| | 20,866 |
| | 8 |
|
| Total | Total | $ | 253,849 |
| | $ | 281,650 |
| Total | $ | 265,270 |
| | 100 | % | | $ | 253,849 |
| | 100 | % |
| |
(1) | Other includes Canada exposure of $19.8$20.4 billion and $20.3$19.8 billion at December 31, 20132014 and 20122013. |
Our total non-U.S. exposure was $253.8265.3 billion at December 31, 20132014, aan decreaseincrease of $27.811.4 billion from December 31, 20122013. The decreaseincrease in non-U.S. exposure was driven by a reductiongrowth in Asia Pacific and Europe,Latin America exposures, partially offset by growtha reduction in other regions.Europe. Our non-U.S. exposure remained concentrated in Europe which accounted for $133.3129.6 billion, or 5349 percent of total non-U.S. exposure. The European exposure was mostly in Western Europe and was distributed across a variety of industries. Select European countries are further presented in Table 61. Asia Pacific was our second largest non-U.S. exposure
|
| | |
10093 Bank of America 20132014
| | |
at Table 57$69.3 billion presents our 20 largest non-U.S. country exposures. These exposures accounted for , or 2788 percent of our total non-U.S. exposure. Latin America accounted forexposure at both $21.7 billion, or nine percent of total non-U.S. exposure. Middle East and Africa accounted for $8.7 billion, or three percent of total non-U.S. exposure. Other non-U.S. exposure accounted for $20.9 billion or eight percent of total non-U.S. exposure. For information on country specific exposures, see Tables 60December 31, 2014 and 612013. Net country exposure for these 20 countries increased $13.6 billion in 2014 driven by higher funded and unfunded loans and loan equivalents exposure in Japan and Hong Kong, increased derivatives exposure in the United Kingdom, Japan, Hong Kong and Germany, and increased trading securities exposure in the United Kingdom, Italy and India. These increases were partially offset by reductions in funded and unfunded loans and loan equivalents exposure in Russia, the United Kingdom, Australia and Italy, and decreases in securities exposure in Germany and Japan.
Funded loans and loan equivalents include loans, leases, and other extensions of credit and funds, including letters of credit and due from placements, which have not been reduced by collateral, hedges or credit default protection. Funded loans and loan equivalents are reported net of charge-offs but prior to any allowance for loan and lease losses. Unfunded commitments are the undrawn portion of legally binding commitments related to loans and loan equivalents.
Net counterparty exposure includes the fair value of derivatives, including the counterparty risk associated with credit default
swaps (CDS), and secured financing transactions. DerivativeDerivatives exposures are presented net of collateral, which is predominantly cash, pledged under legally enforceable master netting agreements. Secured financing transaction exposures are presented net of eligible cash or securities pledged as collateral.
Securities and other investments are carried at fair value and long securities exposures are netted against short exposures with
the same underlying issuer to, but not below, zero (i.e., negative issuer exposures are reported as zero). Other investments include our GPI portfolio and strategic investments.
Net country exposure represents country exposure less hedges and credit default protection purchased, net of credit default protection sold. We hedge certain of our country exposures with credit default protection primarily in the form of single-name, as well as indexed and tranched CDS. The exposures associated with these hedges represent the amount that would be realized upon the isolated default of an individual issuer in the relevant country assuming a zero recovery rate for that individual issuer, and are calculated based on the CDS notional amount lessadjusted for any fair value receivable or payable. Changes in the assumption of an isolated default can produce different results in a particular tranche.
|
| | | | | | | | | | | | | | | | | | | | | | | | | | | | | | | | |
| | | | | | | | | | | | | | | | | |
| Table 57 | Top 20 Non-U.S. Countries Exposure |
| | | | | | | | | | | | | | | | | |
| (Dollars in millions) | Funded Loans and Loan Equivalents | | Unfunded Loan Commitments | | Net Counterparty Exposure | | Securities/
Other Investments | | Country Exposure at December 31
2014 | | Hedges and Credit Default Protection | | Net Country Exposure at December 31
2014 | | Increase (Decrease) from December 31
2013 |
| United Kingdom | $ | 23,727 |
| | $ | 11,921 |
| | $ | 6,373 |
| | $ | 7,769 |
| | $ | 49,790 |
| | $ | (4,243 | ) | | $ | 45,547 |
| | $ | 1,961 |
|
| Canada | 6,388 |
| | 6,847 |
| | 1,950 |
| | 5,173 |
| | 20,358 |
| | (1,818 | ) | | 18,540 |
| | 129 |
|
| Japan | 12,518 |
| | 506 |
| | 3,589 |
| | 1,453 |
| | 18,066 |
| | (1,332 | ) | | 16,734 |
| | 8,619 |
|
| Brazil | 9,923 |
| | 727 |
| | 511 |
| | 4,183 |
| | 15,344 |
| | (360 | ) | | 14,984 |
| | 1,352 |
|
| Germany | 5,341 |
| | 5,840 |
| | 3,477 |
| | 1,489 |
| | 16,147 |
| | (3,588 | ) | | 12,559 |
| | (159 | ) |
| China | 10,238 |
| | 725 |
| | 556 |
| | 1,483 |
| | 13,002 |
| | (710 | ) | | 12,292 |
| | (629 | ) |
| India | 5,631 |
| | 507 |
| | 496 |
| | 4,126 |
| | 10,760 |
| | (174 | ) | | 10,586 |
| | 335 |
|
| France | 3,246 |
| | 5,117 |
| | 1,495 |
| | 5,038 |
| | 14,896 |
| | (4,458 | ) | | 10,438 |
| | 275 |
|
| Hong Kong | 6,413 |
| | 616 |
| | 924 |
| | 691 |
| | 8,644 |
| | (36 | ) | | 8,608 |
| | 3,251 |
|
| Netherlands | 2,928 |
| | 3,392 |
| | 675 |
| | 2,275 |
| | 9,270 |
| | (1,135 | ) | | 8,135 |
| | 500 |
|
| Australia | 3,237 |
| | 1,908 |
| | 826 |
| | 2,235 |
| | 8,206 |
| | (533 | ) | | 7,673 |
| | (324 | ) |
| Switzerland | 2,493 |
| | 3,663 |
| | 1,018 |
| | 622 |
| | 7,796 |
| | (1,265 | ) | | 6,531 |
| | 985 |
|
| South Korea | 3,559 |
| | 707 |
| | 534 |
| | 2,327 |
| | 7,127 |
| | (678 | ) | | 6,449 |
| | 14 |
|
| Italy | 2,545 |
| | 1,596 |
| | 2,484 |
| | 1,752 |
| | 8,377 |
| | (2,978 | ) | | 5,399 |
| | 197 |
|
| Mexico | 3,038 |
| | 807 |
| | 245 |
| | 566 |
| | 4,656 |
| | (385 | ) | | 4,271 |
| | 272 |
|
| Singapore | 1,984 |
| | 203 |
| | 673 |
| | 1,206 |
| | 4,066 |
| | (62 | ) | | 4,004 |
| | 175 |
|
| Taiwan | 2,248 |
| | — |
| | 437 |
| | 1,180 |
| | 3,865 |
| | — |
| | 3,865 |
| | (207 | ) |
| Spain | 2,296 |
| | 994 |
| | 296 |
| | 1,022 |
| | 4,608 |
| | (992 | ) | | 3,616 |
| | 213 |
|
| Russia | 4,124 |
| | 80 |
| | 732 |
| | 66 |
| | 5,002 |
| | (1,393 | ) | | 3,609 |
| | (3,113 | ) |
| Turkey | 2,695 |
| | 75 |
| | 15 |
| | 185 |
| | 2,970 |
| | (482 | ) | | 2,488 |
| | (205 | ) |
| Total top 20 non-U.S. countries exposure | $ | 114,572 |
| | $ | 46,231 |
| | $ | 27,306 |
| | $ | 44,841 |
| | $ | 232,950 |
| | $ | (26,622 | ) | | $ | 206,328 |
| | $ | 13,641 |
|
Table 60Russian intervention in Ukraine during 2014 presents our 20 largest non-U.S. country exposures. These exposures accounted for 88 percentsignificantly increased regional geopolitical tensions. The Russian economy is slowing due to the negative impacts of weak oil prices, ongoing economic sanctions and 89 percent of our total non-U.S.high interest rates resulting from Russian central bank actions taken to counter ruble depreciation. Net exposure to Russia was reduced to $3.6 billion at December 31, 20132014, concentrated in oil and gas companies and commercial banks. Our exposure to Ukraine at December 31, 2014 was minimal. In response to Russian actions, U.S. and 2012. Net country exposure for these 20 countries decreased $30.5 billion in 2013 driven byEuropean governments have imposed sanctions on a decrease in funded loanslimited number of Russian individuals and loan equivalents in Japanbusiness entities. Geopolitical and France resulting from a decrease in central bank deposits and a reduction in unfunded loan commitments in Singapore.
|
| | | | | | | | | | | | | | | | | | | | | | | | | | | | | | | | |
| | | | | | | | | | | | | | | | | |
| Table 60 | Top 20 Non-U.S. Countries Exposure |
| | | | | | | | | | | | | | | | | |
| (Dollars in millions) | Funded Loans and Loan Equivalents | | Unfunded Loan Commitments | | Net Counterparty Exposure | | Securities/
Other Investments | | Country Exposure at December 31
2013 | | Hedges and Credit Default Protection | | Net Country Exposure at December 31
2013 | | Increase (Decrease) from December 31
2012 |
| United Kingdom | $ | 25,898 |
| | $ | 12,046 |
| | $ | 5,259 |
| | $ | 4,812 |
| | $ | 48,015 |
| | $ | (4,429 | ) | | $ | 43,586 |
| | $ | (3,606 | ) |
| Canada | 6,075 |
| | 6,942 |
| | 1,568 |
| | 5,223 |
| | 19,808 |
| | (1,397 | ) | | 18,411 |
| | (565 | ) |
| Brazil | 8,591 |
| | 698 |
| | 416 |
| | 4,106 |
| | 13,811 |
| | (179 | ) | | 13,632 |
| | 1,129 |
|
| China | 10,712 |
| | 587 |
| | 642 |
| | 1,468 |
| | 13,409 |
| | (488 | ) | | 12,921 |
| | 3,734 |
|
| Germany | 6,262 |
| | 4,973 |
| | 2,800 |
| | 3,173 |
| | 17,208 |
| | (4,490 | ) | | 12,718 |
| | 1,698 |
|
| India | 6,256 |
| | 643 |
| | 361 |
| | 3,204 |
| | 10,464 |
| | (213 | ) | | 10,251 |
| | (3,467 | ) |
| France | 1,914 |
| | 6,790 |
| | 976 |
| | 5,228 |
| | 14,908 |
| | (4,745 | ) | | 10,163 |
| | (6,128 | ) |
| Japan | 4,340 |
| | 477 |
| | 1,827 |
| | 2,854 |
| | 9,498 |
| | (1,383 | ) | | 8,115 |
| | (15,724 | ) |
| Australia | 4,374 |
| | 2,136 |
| | 565 |
| | 2,048 |
| | 9,123 |
| | (1,126 | ) | | 7,997 |
| | (1,732 | ) |
| Netherlands | 3,599 |
| | 2,758 |
| | 555 |
| | 2,496 |
| | 9,408 |
| | (1,773 | ) | | 7,635 |
| | (3,047 | ) |
| Russian Federation | 5,824 |
| | 960 |
| | 230 |
| | 621 |
| | 7,635 |
| | (913 | ) | | 6,722 |
| | 1,810 |
|
| South Korea | 3,771 |
| | 811 |
| | 566 |
| | 2,236 |
| | 7,384 |
| | (949 | ) | | 6,435 |
| | (714 | ) |
| Switzerland | 2,760 |
| | 3,150 |
| | 625 |
| | 629 |
| | 7,164 |
| | (1,618 | ) | | 5,546 |
| | (274 | ) |
| Hong Kong | 4,296 |
| | 374 |
| | 81 |
| | 847 |
| | 5,598 |
| | (241 | ) | | 5,357 |
| | (86 | ) |
| Italy | 3,096 |
| | 3,573 |
| | 2,328 |
| | 763 |
| | 9,760 |
| | (4,558 | ) | | 5,202 |
| | 364 |
|
| Taiwan | 2,614 |
| | — |
| | 132 |
| | 1,385 |
| | 4,131 |
| | (59 | ) | | 4,072 |
| | 850 |
|
| Mexico | 3,030 |
| | 687 |
| | 129 |
| | 657 |
| | 4,503 |
| | (504 | ) | | 3,999 |
| | 340 |
|
| Singapore | 2,401 |
| | 138 |
| | 157 |
| | 1,280 |
| | 3,976 |
| | (147 | ) | | 3,829 |
| | (6,345 | ) |
| Spain | 3,475 |
| | 892 |
| | 115 |
| | 519 |
| | 5,001 |
| | (1,598 | ) | | 3,403 |
| | 749 |
|
| Turkey | 2,354 |
| | 75 |
| | 10 |
| | 271 |
| | 2,710 |
| | (17 | ) | | 2,693 |
| | 551 |
|
| Total top 20 non-U.S. countries exposure | $ | 111,642 |
| | $ | 48,710 |
| | $ | 19,342 |
| | $ | 43,820 |
| | $ | 223,514 |
| | $ | (30,827 | ) | | $ | 192,687 |
| | $ | (30,463 | ) |
economic conditions remain fluid with potential for further escalation of tensions, severity of sanctions against Russian interests, sustained low oil prices and rating agency downgrades.
Certain European countries, including Italy, Spain, Ireland, Greece Ireland, Italy,and Portugal, and Spain, have experienced varying degrees of financial stress in recent years. Risks from the ongoingWhile market conditions have improved in Europe, policymakers continue to address fundamental challenges of competitiveness, growth, deflation and high unemployment. A return of political stress or financial instability in these countries could continue to disrupt the financial markets which couldand have a detrimental impact on global economic conditions and sovereign and non-sovereign debt
countries. Market volatility is expectedNet exposure at December 31, 2014 to continueItaly and Spain was $5.4 billion and $3.6 billion as policymakers addresspresented in Table 57. For the fundamental challenges of competitiveness, growth and fiscal solvency.remaining three countries noted above, net exposure at December 31, 2014 was $2.1 billion which primarily relates to Ireland. We expect to continue to support client activities in the region and our exposures may vary over time as we monitor the situation and manage our risk profile.
Table 61 presents our direct sovereign and non-sovereign exposures in these countries at December 31, 2013. Our total sovereign and non-sovereign exposure to these countries was $17.1 billion at December 31, 2013 compared to $14.5 billion at December 31, 2012. The total exposure to these countries, net of all hedges, was $10.4 billion at December 31, 2013 compared to $9.5 billion at December 31, 2012. At December 31, 2013 and
2012, hedges and credit default protection purchased, net of credit default protection sold, was $6.8 billion and $5.1 billion. Net country exposure increased$901 million in 2013 driven by increased funded loan and loan equivalents with financial institutions in Spain and Italy, partially offset by a decrease in total sovereign exposures.
|
| | | | | | | | | | | | | | | | | | | | | | | | | | | | | | | | |
| | | | | | | | | | | | | | | | | |
| Table 61 | Select European Countries |
| | | | | | | | | | | | | | | | | |
| (Dollars in millions) | Funded Loans and Loan Equivalents | | Unfunded Loan Commitments | | Net Counterparty Exposure (1) | | Securities/Other Investments (2) | | Country Exposure at December 31
2013 | | Hedges and Credit Default Protection (3) | | Net Country Exposure at December 31 2013 | | Increase (Decrease) from December 31
2012 |
| Greece | |
| | |
| | |
| | |
| | |
| | |
| | |
| | |
| Sovereign | $ | — |
| | $ | — |
| | $ | — |
| | $ | 58 |
| | $ | 58 |
| | $ | — |
| | $ | 58 |
| | $ | 56 |
|
| Financial institutions | — |
| | — |
| | — |
| | 27 |
| | 27 |
| | (30 | ) | | (3 | ) | | 2 |
|
| Corporates | 63 |
| | 61 |
| | 2 |
| | 13 |
| | 139 |
| | (41 | ) | | 98 |
| | (211 | ) |
| Total Greece | $ | 63 |
| | $ | 61 |
| | $ | 2 |
| | $ | 98 |
| | $ | 224 |
| | $ | (71 | ) | | $ | 153 |
| | $ | (153 | ) |
| Ireland | |
| | |
| | |
| | |
| | |
| | |
| | |
| | |
| Sovereign | $ | 19 |
| | $ | — |
| | $ | 19 |
| | $ | — |
| | $ | 38 |
| | $ | (43 | ) | | $ | (5 | ) | | $ | (63 | ) |
| Financial institutions | 812 |
| | 10 |
| | 124 |
| | 44 |
| | 990 |
| | (10 | ) | | 980 |
| | 388 |
|
| Corporates | 356 |
| | 338 |
| | 69 |
| | 55 |
| | 818 |
| | (49 | ) | | 769 |
| | (160 | ) |
| Total Ireland | $ | 1,187 |
| | $ | 348 |
| | $ | 212 |
| | $ | 99 |
| | $ | 1,846 |
| | $ | (102 | ) | | $ | 1,744 |
| | $ | 165 |
|
| Italy | |
| | |
| | |
| | |
| | |
| | |
| | |
| | |
| Sovereign | $ | 2 |
| | $ | — |
| | $ | 1,611 |
| | $ | 269 |
| | $ | 1,882 |
| | $ | (2,095 | ) | | $ | (213 | ) | | $ | (243 | ) |
| Financial institutions | 1,938 |
| | 348 |
| | 179 |
| | 175 |
| | 2,640 |
| | (1,230 | ) | | 1,410 |
| | 333 |
|
| Corporates | 1,156 |
| | 3,225 |
| | 538 |
| | 319 |
| | 5,238 |
| | (1,233 | ) | | 4,005 |
| | 274 |
|
| Total Italy | $ | 3,096 |
| | $ | 3,573 |
| | $ | 2,328 |
| | $ | 763 |
| | $ | 9,760 |
| | $ | (4,558 | ) | | $ | 5,202 |
| | $ | 364 |
|
| Portugal | |
| | |
| | |
| | |
| | |
| | |
| | |
| | |
| Sovereign | $ | — |
| | $ | — |
| | $ | 15 |
| | $ | 35 |
| | $ | 50 |
| | $ | (27 | ) | | $ | 23 |
| | $ | 60 |
|
| Financial institutions | 4 |
| | — |
| | 2 |
| | — |
| | 6 |
| | (108 | ) | | (102 | ) | | (140 | ) |
| Corporates | 90 |
| | 103 |
| | — |
| | 40 |
| | 233 |
| | (292 | ) | | (59 | ) | | (144 | ) |
| Total Portugal | $ | 94 |
| | $ | 103 |
| | $ | 17 |
| | $ | 75 |
| | $ | 289 |
| | $ | (427 | ) | | $ | (138 | ) | | $ | (224 | ) |
| Spain | |
| | |
| | |
| | |
| | |
| | |
| | |
| | |
| Sovereign | $ | 37 |
| | $ | — |
| | $ | 63 |
| | $ | 2 |
| | $ | 102 |
| | $ | (163 | ) | | $ | (61 | ) | | $ | (288 | ) |
| Financial institutions | 1,223 |
| | 1 |
| | 14 |
| | 131 |
| | 1,369 |
| | (421 | ) | | 948 |
| | 790 |
|
| Corporates | 2,215 |
| | 891 |
| | 38 |
| | 386 |
| | 3,530 |
| | (1,014 | ) | | 2,516 |
| | 247 |
|
| Total Spain | $ | 3,475 |
| | $ | 892 |
| | $ | 115 |
| | $ | 519 |
| | $ | 5,001 |
| | $ | (1,598 | ) | | $ | 3,403 |
| | $ | 749 |
|
| Total | |
| | |
| | |
| | |
| | |
| | |
| | |
| | |
| Sovereign | $ | 58 |
| | $ | — |
| | $ | 1,708 |
| | $ | 364 |
| | $ | 2,130 |
| | $ | (2,328 | ) | | $ | (198 | ) | | $ | (478 | ) |
| Financial institutions | 3,977 |
| | 359 |
| | 319 |
| | 377 |
| | 5,032 |
| | (1,799 | ) | | 3,233 |
| | 1,373 |
|
| Corporates | 3,880 |
| | 4,618 |
| | 647 |
| | 813 |
| | 9,958 |
| | (2,629 | ) | | 7,329 |
| | 6 |
|
| Total select European exposure | $ | 7,915 |
| | $ | 4,977 |
| | $ | 2,674 |
| | $ | 1,554 |
| | $ | 17,120 |
| | $ | (6,756 | ) | | $ | 10,364 |
| | $ | 901 |
|
| |
(1)
| Net counterparty exposure includes the fair value of derivatives, including the counterparty risk associated with CDS, and secured financing transactions. Derivative exposures are presented net of $1.1 billion in collateral, which is predominantly cash, pledged under legally enforceable master netting agreements. Secured financing transaction exposures are presented net of eligible cash or securities pledged as collateral. The notional amount of reverse repurchase transactions was $4.0 billion. Counterparty exposure is not presented net of hedges or credit default protection.
|
| |
(2)
| Long securities exposures are netted on a single-name basis to, but not below, zero by short exposures of $4.9 billion and net CDS purchased of $1.9 billion, consisting of $1.5 billion of net single-name CDS purchased and $406 million of net indexed and tranched CDS purchased.
|
| |
(3)
| Represents credit default protection purchased, net of credit default protection sold, which is used to mitigate the Corporation’s risk to country exposures as listed, including $4.5 billion, consisting of $3.0 billion in net single-name CDS purchased and $1.5 billion in net indexed and tranched CDS purchased, to hedge loans and securities, $2.3 billion in additional credit default protection purchased to hedge derivative assets and $127 million in other short exposures.
|
The majority of our CDS contracts on reference assets in Greece, Ireland, Italy, Portugal and Spain are with highly-rated financial institutions primarily outside of the Eurozone and we work to limit or eliminate correlated CDS. Due to our engagement in market-making activities, our CDS portfolio contains contracts with various maturities to a diverse set of counterparties. We work to
limit mismatches in maturities between our exposures and the CDS we use to hedge them. However, there may be instances where the protection purchased has a different maturity than the exposure for which the protection was purchased, in which case, those exposures and hedges are subject to more active monitoring and management.
Table 62 presents the notional amount and fair value of single-name CDS purchased and sold on reference assets in Greece, Ireland, Italy, Portugal and Spain. Table 62 includes only single-name CDS netted at the counterparty level, whereas, Table 61 includes single-name, indexed and tranched CDS exposures netted by the reference asset that they are intended to hedge; therefore, CDS purchased and sold information is not comparable between tables.
|
| | | | | | | | | | | | | | | | |
| | | | | | | | | |
| Table 62 | Single-Name CDS with Reference Assets in Greece, Ireland, Italy, Portugal and Spain (1) |
| | | | | | | | | |
| | | December 31, 2013 |
| | | Notional | | Fair Value |
| (Dollars in billions) | Purchased | | Sold | | Purchased | | Sold |
| Greece | | | | | | | |
| Aggregate | $ | 1.4 |
| | $ | 1.4 |
| | $ | 0.1 |
| | $ | 0.1 |
|
After legally netting (2) | 0.3 |
| | 0.3 |
| | — |
| | — |
|
| Ireland | | | | | | | |
| Aggregate | 2.4 |
| | 2.2 |
| | 0.1 |
| | 0.1 |
|
After legally netting (2) | 0.9 |
| | 0.7 |
| | 0.1 |
| | — |
|
| Italy | | | | | | | |
| Aggregate | 53.8 |
| | 47.9 |
| | 2.5 |
| | 1.7 |
|
After legally netting (2) | 13.0 |
| | 7.0 |
| | 1.1 |
| | 0.4 |
|
| Portugal | | | | | | | |
| Aggregate | 7.5 |
| | 7.5 |
| | 0.4 |
| | 0.4 |
|
After legally netting (2) | 1.2 |
| | 1.3 |
| | 0.1 |
| | 0.1 |
|
| Spain | | | | | | | |
| Aggregate | 20.7 |
| | 20.8 |
| | 0.6 |
| | 0.6 |
|
After legally netting (2) | 3.2 |
| | 3.2 |
| | 0.1 |
| | 0.1 |
|
| |
(1)
| The majority of our CDS contracts on reference assets in Greece, Ireland, Italy, Portugal and Spain are primarily with non-Eurozone counterparties. |
| |
(2)
| Amounts listed are after consideration of legally enforceable counterparty master netting agreements. |
Losses could result even if there is credit default protection purchased because the purchased credit protection contracts may only pay out under certain scenarios and thus not all losses may be covered by the credit protection contracts. The effectiveness of our CDS protection as a hedge of these risks is influenced by a number of factors, including the contractual terms of the CDS. Generally, only the occurrence of a credit event as defined by the CDS terms (which may include, among other events, the failure to pay by, or restructuring of, the reference entity) results in a payment under the purchased credit protection contracts. The determination as to whether a credit event has occurred is made by the relevant International Swaps and Derivatives Association, Inc. (ISDA) Determination Committee (comprised of various ISDA member firms) based on the terms of the CDS and facts and
circumstances for the event. Accordingly, uncertainties exist as to whether any particular strategy or policy action for addressing the European financial instability would constitute a credit event under the CDS. A voluntary restructuring may not trigger a credit event under CDS terms and consequently may not trigger a payment under the CDS contract.
In addition to our direct sovereign and non-sovereign exposures, a significant deterioration of the European financial instability could result in material reductions in the value of sovereign debt and other asset classes posted as collateral, disruptions in capital markets, widening of credit spreads of U.S. and non-U.S. financial institutions, loss of investor confidence in the financial services industry, a slowdown in global economic activity and other adverse developments. For more information on the financial instability in Europe, see Item 1A. Risk Factors.
Table 6358 presents countries where total cross-border exposure exceeded one percent of our total assets. At December 31, 20132014, the United Kingdom wasand France were the only countrycountries where total cross-border exposure exceeded one percent of our total assets. At December 31, 20132014, FranceGermany had total cross-border exposure of $17.8$15.9 billion representing 0.850.76 percent of our total assets. No other countries had total cross-border exposure that exceeded 0.75 percent of our total assets at December 31, 20132014.
|
| | | | | | | | |
| | | | | |
| Table 63 | Total Cross-border Exposure Exceeding One Percent of Total Assets |
| | | | | |
| | | United Kingdom |
| (Dollars in millions) | 2013 | | 2012 |
| Public sector | $ | 6 |
| | $ | 95 |
|
| Banks | 7,027 |
| | 5,656 |
|
| Private sector | 32,466 |
| | 31,595 |
|
| Cross-border exposure | $ | 39,499 |
| | $ | 37,346 |
|
| Exposure as a percentage of total assets | 1.88 | % | | 1.69 | % |
Cross-border exposures in Table 58 are calculated using FFIECFederal Financial Institutions Examination Council (FFIEC) guidelines and not our internal risk management view; therefore, exposures are not comparable between tables.Tables 57 and 58. Exposure includes cross-border claims by our non-U.S. offices including loans, acceptances, time deposits placed, trading account assets, securities, derivative assets, other interest-earning investments and other monetary assets. Amounts also include unfunded commitments, letters of credit and financial guarantees, and the notional amount of cash lentloaned under secured financing transactions. Sector definitions are consistent with FFIEC reporting requirements for preparing the Country Exposure Report.
|
| | | | | | | | | | | | | | | | | | | | | |
| | | | | | | | | | | | | |
| Table 58 | Total Cross-border Exposure Exceeding One Percent of Total Assets |
| | | | | | | | | | | | | |
| (Dollars in millions) | December 31 | | Public Sector | | Banks | | Private Sector | | Cross-border
Exposure | | Exposure as a
Percent of
Total Assets |
| United Kingdom | 2014 | | $ | 11 |
| | $ | 2,056 |
| | $ | 34,595 |
| | $ | 36,662 |
| | 1.74 | % |
| | 2013 | | 6 |
| | 7,027 |
| | 32,466 |
| | 39,499 |
| | 1.88 |
|
France (1) | 2014 | | 4,479 |
| | 2,631 |
| | 14,368 |
| | 21,478 |
| | 1.02 |
|
|
| | |
| | Bank of America 2013103(1)
| At December 31, 2013, total cross-border exposure for France was $17.8 billion, representing 0.85 percent of total assets. |
Provision for Credit Losses
The provision for credit losses decreased $4.61.3 billion to $3.62.3 billion in 20132014 compared to 20122013. The provision for credit losses was $4.32.1 billion lower than net charge-offs for 20132014, resulting in a reduction in the allowance for credit losses due to continued improvement in the home loans and credit card portfolios.losses. This compared to a reduction of $6.7$4.3 billion in the allowance for credit losses for 2012. If the economy and our asset quality continue2013. We expect reserve releases in 2015 to improve, we anticipate additional reductions in the allowance for credit losses in future periods, although at a significantly lower level than in 2013.moderate when compared to 2014.
The provision for credit losses for the consumer portfolio decreased $6.0 billion533 million to $2.01.5 billion in 20132014 compared to 2012,2013. The decrease was primarily due to continued improvement in the home loans portfolio primarilyportfolios as a result of improved delinquencies, increased home prices, improved delinquencies and continued loan balance run-off, as well as improvement in the credit card portfolios primarily driven by lower delinquencies. Theunemployment levels. These were partially offset by a lower provision for credit lossesbenefit related to the PCI loan portfolio was a benefitof $70731 million in 20132014 primarily due to improvement in our home price outlook compared to a benefit of $103$707 million in 2012.2013. Also offsetting the improvement was $400 million of additional costs associated with the consumer relief portion of the DoJ Settlement. For more information on the DoJ Settlement, see Off-Balance Sheet Arrangements and Contractual Obligations – Servicing, Foreclosure and Other Mortgage Matters on page 53.
The provision for credit losses for the commercial portfolio, including unfunded lending commitments, increaseddecreased $1.3 billion748 million to $1.5 billion793 million in 20132014 compared to 20122013 due to stabilization of creditdriven by improved asset quality an increase in reserves due to loan growth and a higher volume of loan resolutions in the prior year within the core commercial portfolio.2014.
Allowance for Credit Losses
Allowance for Loan and Lease Losses
The allowance for loan and lease losses is comprised of two components. The first component covers nonperforming commercial loans and TDRs. The second component covers loans and leases on which there are incurred losses that are not yet individually identifiable, as well as incurred losses that may not be represented in the loss forecast models. We evaluate the adequacy of the allowance for loan and lease losses based on the total of these two components, each of which is described in more detail below. The allowance for loan and lease losses excludes LHFS and loans accounted for under the fair value option as the fair value reflects a credit risk component.
The first component of the allowance for loan and lease losses covers both nonperforming commercial loans and all TDRs within the consumer and commercial portfolios. These loans are subject to impairment measurement based on the present value of projected future cash flows discounted at the loan’s original effective interest rate, or in certain circumstances, impairment may also be based upon the collateral value or the loan’s observable market price if available. Impairment measurement for the renegotiated consumer credit card, small business credit card and unsecured consumer TDR portfolios is based on the present value of projected cash flows discounted using the average portfolio contractual interest rate, excluding promotionally priced loans, in effect prior to restructuring. For purposes of computing this specific loss component of the allowance, larger impaired loans are evaluated individually and smaller impaired loans are evaluated as a pool using historical experience for the respective product types and risk ratings of the loans.
The second component of the allowance for loan and lease losses covers the remaining consumer and commercial loans and
leases that have incurred losses whichthat are not yet individually identifiable. The allowance for consumer and certain homogeneous commercial loan and lease products is based on aggregated portfolio evaluations, generally by product type. Loss forecast models are utilized that consider a variety of factors including, but not limited to, historical loss experience, estimated defaults or foreclosures based on portfolio trends, delinquencies, economic trends and credit scores. Our consumer real estate loss forecast model estimates the portion of loans that will default based on individual loan attributes, the most significant of which are refreshed LTV or CLTV, and borrower credit score as well as vintage and geography, all of which are further broken down into current delinquency status. Additionally, we incorporate the delinquency status of underlying first-lien loans on our junior-lien home equity portfolio in our allowance process. Incorporating refreshed LTV and CLTV into our probability of default allows us to factor the impact of changes in home prices into our allowance for loan and lease losses. These loss forecast models are updated on a quarterly basis to incorporate information reflecting the current economic environment. As of December 31, 20132014, the loss forecast process resulted in reductions in the allowance for all major consumer portfolios.portfolios compared to December 31, 2013.
The allowance for commercial loan and lease losses is established by product type after analyzing historical loss experience, internal risk rating, current economic conditions, industry performance trends, geographic and obligor concentrations within each portfolio and any other pertinent information. The statistical models for commercial loans are generally updated annually and utilize our historical database of actual defaults and other data. The loan risk ratings and composition of the commercial portfolios used to calculate the allowance are updated quarterly to incorporate the most recent data reflecting the current economic environment. For risk-rated commercial loans, we estimate the probability of default and the LGD based on our historical experience of defaults and credit losses. Factors considered when assessing the internal risk rating include the value of the underlying collateral, if applicable, the industry in which the obligor operates, the obligor’s liquidity and other financial indicators, and other quantitative and qualitative factors relevant to the obligor’s credit risk. As of December 31, 20132014, changes in portfolio size and composition resulted in an increase in the allowance increased for all major commercial portfolios.portfolios compared to December 31, 2013.
Also included within the second component of the allowance for loan and lease losses are reserves to cover losses that are incurred but, in our assessment, may not be adequately represented in the historical loss data used in the loss forecast models. For example, factors that we consider include, among others, changes in lending policies and procedures, changes in economic and business conditions, changes in the nature and size of the portfolio, changes in portfolio concentrations, changes in the volume and severity of past due loans and nonaccrual loans, the effect of external factors such as competition, and legal and regulatory requirements. We also consider factors that are applicable to unique portfolio segments. For example, we consider the risk of uncertainty in our loss forecasting models related to junior-lien home equity loans that are current, but have first-lien
loans that we do not service that are 30 days or more past due. In addition, we consider the increased risk of default associated with our interest-only loans that have yet to enter the amortization period. Given the heightened risk of loss with these loans, additional reserves are recorded to the allowance for loan and
lease losses. Further, we consider the inherent uncertainty in mathematical models that are built upon historical data.
During 20132014, the factors that impacted the allowance for loan and lease losses included significant overall improvements in the credit quality of the portfolios driven by continuing improvements in the U.S. economy and housing and labor markets, continuing proactive credit risk management initiatives and the impact of recent higher credit quality originations. Additionally, the resolution of uncertainties through current recognition of net charge-offs has impacted the amount of reserve needed in certain portfolios. Evidencing the improvements in the U.S. economy and housing and labor markets are modest growth in consumer spending, improvements in unemployment levels, a decrease in the absolute level and our share of national consumer bankruptcy filings, and a rise in both residential building activity and overall home prices. In addition to these improvements, paydowns, charge-offs, sales, returns to performing status and upgrades out of criticized continued to outpace new nonaccrual consumer loans and reservable criticized commercial loans, but such loans remained elevated relative to levels experienced prior to the financial crisis.loans.
We monitor differences between estimated and actual incurred loan and lease losses. This monitoring process includes periodic assessments by senior management of loan and lease portfolios and the models used to estimate incurred losses in those portfolios.
Additions to, or reductions of, the allowance for loan and lease losses generally are recorded through charges or credits to the provision for credit losses. Credit exposures deemed to be uncollectible are charged against the allowance for loan and lease losses. Recoveries of previously charged off amounts are credited to the allowance for loan and lease losses.
The allowance for loan and lease losses for the consumer portfolio, as presented in Table 6560, was $13.410.0 billion at December 31, 20132014, a decrease of $7.73.4 billion from December 31, 20122013. The decrease was primarily driven byin the residential mortgage and home equity and residential mortgage portfolios due to improved delinquencies andincreased home prices, as evidenced by improving LTV statistics as presented in Tables 3028 and 3230 as well as continued, improved delinquencies and a decrease in consumer loan balance run-off. In addition,balances. Further, the residential mortgage and home equity and residential mortgage allowance declined due to write-offs in our PCI loan portfolio. These write-offs decreased the PCI valuation allowance included as part of the allowance for loan and lease losses.
The decrease in the allowance related to the U.S. credit card and unsecured consumer lending portfolios in CBB was primarily due to improvement in delinquencies and bankruptcies. For example, in the U.S. credit card portfolio, accruing loans 30 days or more past due decreased to $2.11.7 billion at December 31, 20132014 from $2.72.1 billion (to 2.251.85 percent from 2.902.25 percent of outstanding U.S. credit card loans) at December 31, 20122013, and accruing loans 90 days or more past due declineddecreased to $1.1 billion866 million at December 31, 20132014 from $1.41.1 billion (to 1.140.94 percent from 1.521.14 percent of outstanding U.S. credit card loans) at December 31, 2012.2013. See Tables 2725, 2826, 3735 and 3937 for additional details on key credit statistics for the credit card and other unsecured consumer lending portfolios.
The allowance for loan and lease losses for the commercial portfolio, as presented in Table 6560, was $4.04.4 billion at December 31, 20132014, aan increase of $899432 millionincrease from December 31, 20122013, as continued improvement in credit quality was more than offset by loan growth across the commercial portfolio.. The commercial utilized reservable criticized exposure decreased to $12.911.6 billion at December 31, 20132014 from $15.912.9 billion (to 3.022.74 percent from 4.103.02 percent of total commercial utilized reservable exposure) at December 31, 20122013. Similarly, nonperformingNonperforming commercial loans declineddecreased to $1.3 billion at$196 million from December 31, 2013 fromto $3.21.1 billion (to 0.340.29 percent from 0.930.34 percent of outstanding commercial loans) at December 31, 20122014. See Tables 4341, 4442 and 4644 for additional details on key commercial credit statistics.
The allowance for loan and lease losses as a percentage of total loans and leases outstanding was 1.65 percent at
December 31, 2014 compared to 1.90 percent at December 31, 2013 compared to 2.69 percent at December 31, 2012. The decrease in the ratio was primarily due to improved credit quality driven by improved economic conditions and write-offs in the PCI loan portfolio for home equity and residential mortgage which led to the reduction in the allowance for credit losses discussed above.portfolio. The December 31, 20132014 and 20122013 ratios above include the PCI loan portfolio. Excluding the PCI loan portfolio, the allowance for loan and lease losses as a percentage of total loans and leases outstanding was 1.50 percent and 1.67 percent at December 31, 20132014 compared to 2.14 percent atand December 31, 20122013.
Table 6459 presents a rollforward of the allowance for credit losses, which includes the allowance for loan and lease losses and the reserve for unfunded lending commitments, for 20132014 and 20122013.
| | | | | | | | | | | |
| Table 64 | Allowance for Credit Losses | | | | |
| Table 59 | | Allowance for Credit Losses | | | |
| | | | | | | | | |
| (Dollars in millions) | (Dollars in millions) | 2013 | | 2012 | (Dollars in millions) | 2014 | | 2013 |
| Allowance for loan and lease losses, January 1 | Allowance for loan and lease losses, January 1 | $ | 24,179 |
| | $ | 33,783 |
| Allowance for loan and lease losses, January 1 | $ | 17,428 |
| | $ | 24,179 |
|
| Loans and leases charged off | Loans and leases charged off | | | | Loans and leases charged off | | | |
| Residential mortgage | Residential mortgage | (1,508 | ) | | (3,276 | ) | Residential mortgage | (855 | ) | | (1,508 | ) |
| Home equity | Home equity | (2,258 | ) | | (4,573 | ) | Home equity | (1,364 | ) | | (2,258 | ) |
| U.S. credit card | U.S. credit card | (4,004 | ) | | (5,360 | ) | U.S. credit card | (3,068 | ) | | (4,004 | ) |
| Non-U.S. credit card | Non-U.S. credit card | (508 | ) | | (835 | ) | Non-U.S. credit card | (357 | ) | | (508 | ) |
| Direct/Indirect consumer | Direct/Indirect consumer | (710 | ) | | (1,258 | ) | Direct/Indirect consumer | (456 | ) | | (710 | ) |
| Other consumer | Other consumer | (273 | ) | | (274 | ) | Other consumer | (268 | ) | | (273 | ) |
| Total consumer charge-offs | Total consumer charge-offs | (9,261 | ) | | (15,576 | ) | Total consumer charge-offs | (6,368 | ) | | (9,261 | ) |
U.S. commercial (1) | U.S. commercial (1) | (774 | ) | | (1,309 | ) | U.S. commercial (1) | (584 | ) | | (774 | ) |
| Commercial real estate | Commercial real estate | (251 | ) | | (719 | ) | Commercial real estate | (29 | ) | | (251 | ) |
| Commercial lease financing | Commercial lease financing | (4 | ) | | (32 | ) | Commercial lease financing | (10 | ) | | (4 | ) |
| Non-U.S. commercial | Non-U.S. commercial | (79 | ) | | (36 | ) | Non-U.S. commercial | (35 | ) | | (79 | ) |
| Total commercial charge-offs | Total commercial charge-offs | (1,108 | ) | | (2,096 | ) | Total commercial charge-offs | (658 | ) | | (1,108 | ) |
| Total loans and leases charged off | Total loans and leases charged off | (10,369 | ) | | (17,672 | ) | Total loans and leases charged off | (7,026 | ) | | (10,369 | ) |
| Recoveries of loans and leases previously charged off | Recoveries of loans and leases previously charged off | | | | Recoveries of loans and leases previously charged off | | | |
| Residential mortgage | Residential mortgage | 424 |
| | 165 |
| Residential mortgage | 969 |
| | 424 |
|
| Home equity | Home equity | 455 |
| | 331 |
| Home equity | 457 |
| | 455 |
|
| U.S. credit card | U.S. credit card | 628 |
| | 728 |
| U.S. credit card | 430 |
| | 628 |
|
| Non-U.S. credit card | Non-U.S. credit card | 109 |
| | 254 |
| Non-U.S. credit card | 115 |
| | 109 |
|
| Direct/Indirect consumer | Direct/Indirect consumer | 365 |
| | 495 |
| Direct/Indirect consumer | 287 |
| | 365 |
|
| Other consumer | Other consumer | 39 |
| | 42 |
| Other consumer | 39 |
| | 39 |
|
| Total consumer recoveries | Total consumer recoveries | 2,020 |
| | 2,015 |
| Total consumer recoveries | 2,297 |
| | 2,020 |
|
U.S. commercial (2) | U.S. commercial (2) | 287 |
| | 368 |
| U.S. commercial (2) | 214 |
| | 287 |
|
| Commercial real estate | Commercial real estate | 102 |
| | 335 |
| Commercial real estate | 112 |
| | 102 |
|
| Commercial lease financing | Commercial lease financing | 29 |
| | 38 |
| Commercial lease financing | 19 |
| | 29 |
|
| Non-U.S. commercial | Non-U.S. commercial | 34 |
| | 8 |
| Non-U.S. commercial | 1 |
| | 34 |
|
| Total commercial recoveries | Total commercial recoveries | 452 |
| | 749 |
| Total commercial recoveries | 346 |
| | 452 |
|
| Total recoveries of loans and leases previously charged off | Total recoveries of loans and leases previously charged off | 2,472 |
| | 2,764 |
| Total recoveries of loans and leases previously charged off | 2,643 |
| | 2,472 |
|
| Net charge-offs | Net charge-offs | (7,897 | ) | | (14,908 | ) | Net charge-offs | (4,383 | ) | | (7,897 | ) |
| Write-offs of PCI loans | Write-offs of PCI loans | (2,336 | ) | | (2,820 | ) | Write-offs of PCI loans | (810 | ) | | (2,336 | ) |
| Provision for loan and lease losses | Provision for loan and lease losses | 3,574 |
| | 8,310 |
| Provision for loan and lease losses | 2,231 |
| | 3,574 |
|
Other (3) | Other (3) | (92 | ) | | (186 | ) | Other (3) | (47 | ) | | (92 | ) |
| Allowance for loan and lease losses, December 31 | Allowance for loan and lease losses, December 31 | 17,428 |
| | 24,179 |
| Allowance for loan and lease losses, December 31 | 14,419 |
| | 17,428 |
|
| Reserve for unfunded lending commitments, January 1 | Reserve for unfunded lending commitments, January 1 | 513 |
| | 714 |
| Reserve for unfunded lending commitments, January 1 | 484 |
| | 513 |
|
| Provision for unfunded lending commitments | Provision for unfunded lending commitments | (18 | ) | | (141 | ) | Provision for unfunded lending commitments | 44 |
| | (18 | ) |
Other (4) | Other (4) | (11 | ) | | (60 | ) | Other (4) | — |
| | (11 | ) |
| Reserve for unfunded lending commitments, December 31 | Reserve for unfunded lending commitments, December 31 | 484 |
| | 513 |
| Reserve for unfunded lending commitments, December 31 | 528 |
| | 484 |
|
| Allowance for credit losses, December 31 | Allowance for credit losses, December 31 | $ | 17,912 |
| | $ | 24,692 |
| Allowance for credit losses, December 31 | $ | 14,947 |
| | $ | 17,912 |
|
| |
(1) | Includes U.S. small business commercial charge-offs of $457345 million and $799457 million in 20132014 and 20122013. |
| |
(2) | Includes U.S. small business commercial recoveries of $9863 million and $10098 million in 20132014 and 20122013. |
| |
(3) | Primarily represents the net impact of portfolio sales, consolidations and deconsolidations, and foreign currency translation adjustments. |
| |
(4)
| Primarily represents accretion of the Merrill Lynch purchase accounting adjustment. |
|
| | |
10697 Bank of America 20132014
| | |
|
| | | | | | | | |
| | | | | |
| Table 64 | Allowance for Credit Losses (continued) | | | |
| | | | | |
| (Dollars in millions) | 2013 | | 2012 |
| Loan and allowance ratios: | | | |
Loans and leases outstanding at December 31 (5) | $ | 918,191 |
| | $ | 898,817 |
|
Allowance for loan and lease losses as a percentage of total loans and leases and outstanding at December 31 (5) | 1.90 | % | | 2.69 | % |
Consumer allowance for loan and lease losses as a percentage of total consumer loans and leases outstanding at December 31 (6) | 2.53 |
| | 3.81 |
|
Commercial allowance for loan and lease losses as a percentage of total commercial loans and leases outstanding at December 31 (7) | 1.03 |
| | 0.90 |
|
Average loans and leases outstanding (5) | $ | 909,127 |
| | $ | 890,337 |
|
Net charge-offs as a percentage of average loans and leases outstanding (5, 8) | 0.87 | % | | 1.67 | % |
Net charge-offs and PCI write-offs as a percentage of average loans and leases outstanding (5) | 1.13 |
| | 1.99 |
|
Allowance for loan and lease losses as a percentage of total nonperforming loans and leases at December 31 (5, 9) | 102 |
| | 107 |
|
Ratio of the allowance for loan and lease losses at December 31 to net charge-offs (8) | 2.21 |
| | 1.62 |
|
| Ratio of the allowance for loan and lease losses at December 31 to net charge-offs and PCI write-offs | 1.70 |
| | 1.36 |
|
Amounts included in the allowance for loan and lease losses that are excluded from nonperforming loans and leases at December 31 (10) | $ | 7,680 |
| | $ | 12,021 |
|
Allowance for loan and lease losses as a percentage of total nonperforming loans and leases, excluding amounts included in the allowance for loan and lease losses that are excluded from nonperforming loans and leases at December 31 (10) | 57 | % | | 54 | % |
Loan and allowance ratios excluding PCI loans and the related valuation allowance: (11) | |
| | |
Allowance for loan and lease losses as a percentage of total loans and leases outstanding at December 31 (5) | 1.67 | % | | 2.14 | % |
Consumer allowance for loan and lease losses as a percentage of total consumer loans and leases outstanding at December 31 (6) | 2.17 |
| | 2.95 |
|
Net charge-offs as a percentage of average loans and leases outstanding (5) | 0.90 |
| | 1.73 |
|
Allowance for loan and lease losses as a percentage of total nonperforming loans and leases at December 31 (5, 9) | 87 |
| | 82 |
|
| Ratio of the allowance for loan and lease losses at December 31 to net charge-offs | 1.89 |
| | 1.25 |
|
|
| | | | | | | | |
| | | | | |
| Table 59 | Allowance for Credit Losses (continued) | | | |
| | | | | |
| (Dollars in millions) | 2014 | | 2013 |
| Loan and allowance ratios: | | | |
Loans and leases outstanding at December 31 (4) | $ | 872,710 |
| | $ | 918,191 |
|
Allowance for loan and lease losses as a percentage of total loans and leases outstanding at December 31 (4) | 1.65 | % | | 1.90 | % |
Consumer allowance for loan and lease losses as a percentage of total consumer loans and leases outstanding at December 31 (5) | 2.05 |
| | 2.53 |
|
Commercial allowance for loan and lease losses as a percentage of total commercial loans and leases outstanding at December 31 (6) | 1.15 |
| | 1.03 |
|
Average loans and leases outstanding (4) | $ | 894,001 |
| | $ | 909,127 |
|
Net charge-offs as a percentage of average loans and leases outstanding (4, 7) | 0.49 | % | | 0.87 | % |
Net charge-offs and PCI write-offs as a percentage of average loans and leases outstanding (4) | 0.58 |
| | 1.13 |
|
Allowance for loan and lease losses as a percentage of total nonperforming loans and leases at December 31 (4, 8) | 121 |
| | 102 |
|
Ratio of the allowance for loan and lease losses at December 31 to net charge-offs (7) | 3.29 |
| | 2.21 |
|
| Ratio of the allowance for loan and lease losses at December 31 to net charge-offs and PCI write-offs | 2.78 |
| | 1.70 |
|
Amounts included in allowance for loan and lease losses for loans and leases that are excluded from nonperforming loans and leases at December 31 (9) | $ | 5,944 |
| | $ | 7,680 |
|
Allowance for loan and lease losses as a percentage of total nonperforming loans and leases, excluding the allowance for loan and lease losses for loans and leases that are excluded from nonperforming loans and leases at December 31 (4, 9) | 71 | % | | 57 | % |
Loan and allowance ratios excluding PCI loans and the related valuation allowance: (10) | |
| | |
Allowance for loan and lease losses as a percentage of total loans and leases outstanding at December 31 (4) | 1.50 | % | | 1.67 | % |
Consumer allowance for loan and lease losses as a percentage of total consumer loans and leases outstanding at December 31 (5) | 1.79 |
| | 2.17 |
|
Net charge-offs as a percentage of average loans and leases outstanding (4) | 0.50 |
| | 0.90 |
|
Allowance for loan and lease losses as a percentage of total nonperforming loans and leases at December 31 (4, 8) | 107 |
| | 87 |
|
| Ratio of the allowance for loan and lease losses at December 31 to net charge-offs | 2.91 |
| | 1.89 |
|
| |
(5)(4)
| Outstanding loan and lease balances and ratios do not include loans accounted for under the fair value option which wereof $10.08.7 billion and $9.010.0 billion at December 31, 20132014 and 20122013. Average loans accounted for under the fair value option were $9.59.9 billion and $8.49.5 billion in 20132014 and 20122013. |
| |
(6)(5)
| Excludes consumer loans accounted for under the fair value option of $2.22.1 billion and $1.02.2 billion at December 31, 20132014 and 20122013. |
| |
(7)(6)
| Excludes commercial loans accounted for under the fair value option of $7.96.6 billion and $8.07.9 billion at December 31, 20132014 and 20122013. |
| |
(8)(7)
| Net charge-offs exclude $2.3 billion810 million and $2.82.3 billion of write-offs in the PCI loan portfolio in 20132014 and 20122013. These write-offs decreased the PCI valuation allowance included as part of the allowance for loan and lease losses. For more information on PCI write-offs, see Consumer Portfolio Credit Risk Management – Purchased Credit-impaired Loan Portfolio on page 8578. |
| |
(9)(8)
| For more information on our definition of nonperforming loans, see pages 8982 and 9689. |
| |
(10)(9)
| Primarily includes amounts allocated to U.S. credit card and unsecured consumer lending portfolios in CBB, PCI loans and the non-U.S. credit card portfolio in All Other. |
| |
(11)(10)
| For more information on the PCI loan portfolio and the valuation allowance for PCI loans, see Note 4 – Outstanding Loans and Leases and Note 5 – Allowance for Credit Losses to the Consolidated Financial Statements. |
For reporting purposes, we allocate the allowance for credit losses across products. However, the allowance is generally available to absorb any credit losses without restriction. Table 6560 presents our allocation by product type.
| | | | | | | | | | | | | | | | | | | | | | | | | | | |
| Table 65 | Allocation of the Allowance for Credit Losses by Product Type | |
| Table 60 | | Allocation of the Allowance for Credit Losses by Product Type |
| | | | | | | | | |
| | | December 31, 2013 | | December 31, 2012 | | December 31, 2014 | | December 31, 2013 |
| (Dollars in millions) | (Dollars in millions) | Amount | | Percent of Total | | Percent of
Loans and
Leases Outstanding (1) | | Amount | | Percent of Total | | Percent of
Loans and
Leases Outstanding (1) | (Dollars in millions) | Amount | | Percent of Total | | Percent of
Loans and
Leases Outstanding (1) | | Amount | | Percent of Total | | Percent of
Loans and
Leases Outstanding (1) |
| Allowance for loan and lease losses | Allowance for loan and lease losses | |
| | |
| | |
| | |
| | |
| | |
| Allowance for loan and lease losses | |
| | |
| | |
| | |
| | |
| | |
|
| Residential mortgage | Residential mortgage | $ | 4,084 |
| | 23.43 | % | | 1.65 | % | | $ | 7,088 |
| | 29.31 | % | | 2.80 | % | Residential mortgage | $ | 2,900 |
| | 20.11 | % | | 1.34 | % | | $ | 4,084 |
| | 23.43 | % | | 1.65 | % |
| Home equity | Home equity | 4,434 |
| | 25.44 |
| | 4.73 |
| | 7,845 |
| | 32.45 |
| | 7.26 |
| Home equity | 3,035 |
| | 21.05 |
| | 3.54 |
| | 4,434 |
| | 25.44 |
| | 4.73 |
|
| U.S. credit card | U.S. credit card | 3,930 |
| | 22.55 |
| | 4.26 |
| | 4,718 |
| | 19.51 |
| | 4.97 |
| U.S. credit card | 3,320 |
| | 23.03 |
| | 3.61 |
| | 3,930 |
| | 22.55 |
| | 4.26 |
|
| Non-U.S. credit card | Non-U.S. credit card | 459 |
| | 2.63 |
| | 3.98 |
| | 600 |
| | 2.48 |
| | 5.13 |
| Non-U.S. credit card | 369 |
| | 2.56 |
| | 3.53 |
| | 459 |
| | 2.63 |
| | 3.98 |
|
| Direct/Indirect consumer | Direct/Indirect consumer | 417 |
| | 2.39 |
| | 0.51 |
| | 718 |
| | 2.97 |
| | 0.86 |
| Direct/Indirect consumer | 299 |
| | 2.07 |
| | 0.37 |
| | 417 |
| | 2.39 |
| | 0.51 |
|
| Other consumer | Other consumer | 99 |
| | 0.58 |
| | 5.02 |
| | 104 |
| | 0.43 |
| | 6.40 |
| Other consumer | 59 |
| | 0.41 |
| | 3.15 |
| | 99 |
| | 0.58 |
| | 5.02 |
|
| Total consumer | Total consumer | 13,423 |
| | 77.02 |
| | 2.53 |
| | 21,073 |
| | 87.15 |
| | 3.81 |
| Total consumer | 9,982 |
| | 69.23 |
| | 2.05 |
| | 13,423 |
| | 77.02 |
| | 2.53 |
|
U.S. commercial (2) | U.S. commercial (2) | 2,394 |
| | 13.74 |
| | 1.06 |
| | 1,885 |
| | 7.80 |
| | 0.90 |
| U.S. commercial (2) | 2,619 |
| | 18.16 |
| | 1.12 |
| | 2,394 |
| | 13.74 |
| | 1.06 |
|
| Commercial real estate | Commercial real estate | 917 |
| | 5.26 |
| | 1.91 |
| | 846 |
| | 3.50 |
| | 2.19 |
| Commercial real estate | 1,016 |
| | 7.05 |
| | 2.13 |
| | 917 |
| | 5.26 |
| | 1.91 |
|
| Commercial lease financing | Commercial lease financing | 118 |
| | 0.68 |
| | 0.47 |
| | 78 |
| | 0.32 |
| | 0.33 |
| Commercial lease financing | 153 |
| | 1.06 |
| | 0.62 |
| | 118 |
| | 0.68 |
| | 0.47 |
|
| Non-U.S. commercial | Non-U.S. commercial | 576 |
| | 3.30 |
| | 0.64 |
| | 297 |
| | 1.23 |
| | 0.40 |
| Non-U.S. commercial | 649 |
| | 4.50 |
| | 0.81 |
| | 576 |
| | 3.30 |
| | 0.64 |
|
Total commercial (3) | Total commercial (3) | 4,005 |
| | 22.98 |
| | 1.03 |
| | 3,106 |
| | 12.85 |
| | 0.90 |
| Total commercial (3) | 4,437 |
| | 30.77 |
| | 1.15 |
| | 4,005 |
| | 22.98 |
| | 1.03 |
|
Allowance for loan and lease losses | Allowance for loan and lease losses | 17,428 |
| | 100.00 | % | | 1.90 |
| | 24,179 |
| | 100.00 | % | | 2.69 |
| Allowance for loan and lease losses | 14,419 |
| | 100.00 | % | | 1.65 |
| | 17,428 |
| | 100.00 | % | | 1.90 |
|
| Reserve for unfunded lending commitments | Reserve for unfunded lending commitments | 484 |
| | | | | | 513 |
| | |
| | |
| Reserve for unfunded lending commitments | 528 |
| | | | | | 484 |
| | |
| | |
|
Allowance for credit losses (4) | Allowance for credit losses (4) | $ | 17,912 |
| | | | | | $ | 24,692 |
| | |
| | |
| Allowance for credit losses (4) | $ | 14,947 |
| | | | | | $ | 17,912 |
| | |
| | |
|
| |
(1) | Ratios are calculated as allowance for loan and lease losses as a percentage of loans and leases outstanding excluding loans accounted for under the fair value option. Consumer loans accounted for under the fair value option included residential mortgage loans of $2.01.9 billion and $1.02.0 billion and home equity loans of $147196 million and $0147 million at December 31, 20132014 and 20122013. Commercial loans accounted for under the fair value option included U.S. commercial loans of $1.51.9 billion and $2.31.5 billion and non-U.S. commercial loans of $6.44.7 billion and $5.76.4 billion at December 31, 20132014 and 20122013. |
| |
(2) | Includes allowance for loan and lease losses for U.S. small business commercial loans of $462536 million and $642462 million at December 31, 20132014 and 20122013. |
| |
(3) | Includes allowance for loan and lease losses for impaired commercial loans of $277159 million and $475277 million at December 31, 20132014 and 20122013. |
| |
(4) | Includes $2.51.7 billion and $5.52.5 billion of valuation allowance included as part ofpresented with the allowance for creditloan and lease losses related to PCI loans at December 31, 20132014 and 20122013. |
|
| | |
| | | Bank of America 20132014 10798 |
Reserve for Unfunded Lending Commitments
In addition to the allowance for loan and lease losses, we also estimate probable losses related to unfunded lending commitments such as letters of credit, financial guarantees, unfunded bankers’ acceptances and binding loan commitments, excluding commitments accounted for under the fair value option. Unfunded lending commitments are subject to the same assessment as funded loans, including estimates of probability of default and LGD. Due to the nature of unfunded commitments, the estimate of probable losses must also consider utilization. To estimate the portion of these undrawn commitments that is likely to be drawn by a borrower at the time of estimated default, analyses of the Corporation’s historical experience are applied to the unfunded commitments to estimate the funded EAD. The expected loss for unfunded lending commitments is the product of the probability of default, the LGD and the EAD, adjusted for any qualitative factors including economic uncertainty and inherent imprecision in models.
The reserve for unfunded lending commitments was $484528 million at December 31, 20132014, a decreasean increase of $2944 million from December 31, 20122013. The decreaseincrease was driven by improved credit qualityincreases in the unfunded portfolio.expected loss.
Market Risk Management
Market risk is the risk that values of assets and liabilities or revenues will be adversely affected by changes in market conditions. This risk is inherent in the financial instruments associated with our operations, primarily within our Global Markets segment. We are also exposed to these risks in other areas of the Corporation (e.g., our ALM activities). In the event of market stress, these risks could have a material impact on the results of the Corporation. For additional information, see Interest Rate Risk Management for NontradingNon-trading Activities on page 113105.
Our traditional banking loan and deposit products are nontradingnon-trading positions and are generally reported at amortized cost for assets or the amount owed for liabilities (historical cost). However, these positions are still subject to changes in economic value based on varying market conditions, with one of the primary risks being changes in the levels of interest rates. The risk of adverse changes in the economic value of our nontradingnon-trading positions arising from changes in interest rates is managed through our ALM activities. We have elected to account for certain assets and liabilities under the fair value option.
Our trading positions are reported at fair value with changes reflected in income. Trading positions are subject to various changes in market-based risk factors. The majority of this risk is generated by our activities in the interest rate, foreign exchange, credit, mortgage, equity and commodities markets. In addition, the values of assets and liabilities could change due to market liquidity, correlations across markets and expectations of market volatility. We seek to manage these risk exposures by using a variety of techniques that encompass a broad range of financial instruments. The key risk management techniques are discussed in more detail in the Trading Risk Management section.
Global Markets Risk Management is an independent function within the Corporation that supports the Global Banking and Markets Risk Executive. The Global Markets Risk Committee (GMRC), chaired by the Global Markets Risk Executive,A subcommittee has been designated by ALMRCthe MRC as the primary risk governance authority for Global Markets(Global Markets, or GM subcommittee). The GMRC’sGM subcommittee’s focus is to take a forward-looking view of the primary credit, market and operational risks impacting Global
Markets and prioritize those that need a proactive risk mitigation strategy.
Global Markets Risk Management is responsible for providing senior management with a clear and comprehensive understanding of the trading risks to which the Corporation is exposed. These responsibilities include ownership of market risk policy, developing and maintaining quantitative risk models, calculating aggregated risk measures, establishing and monitoring position limits consistent with risk appetite, conducting daily reviews and analysis of trading inventory, approving material risk exposures and fulfilling regulatory requirements. Market risks that impact businesses outside of Global Markets are monitored and governed by their respective governance functions.
Quantitative risk models, such as VaR, are an essential component in evaluating the market risks within a portfolio. The Enterprise Model Risk Committee (EMRC) reports toA subcommittee of the ALMRC andMRC is responsible for providing management oversight and approval of model risk management and governance.governance (Risk Management, or RM subcommittee). The EMRCRM subcommittee defines model risk standards, consistent with the Corporation’s Risk Frameworkrisk framework and risk appetite, prevailing regulatory guidance and industry best practice. Models must meet certain validation criteria, including effective challenge of the model development process and a sufficient demonstration of developmental evidence incorporating a comparison of alternative theories and approaches. The EMRCRM subcommittee ensures that model standards are consistent with model risk requirements and monitors the effective challenge in the model validation process across the Corporation. In addition, the relevant stakeholders must agree on any required limitationsactions or restrictions to the models and maintain a stringent monitoring process to ensure continued compliance.
For more information on the fair value of certain financial assets and liabilities, see Note 20 – Fair Value Measurements to the Consolidated Financial Statements.
Interest Rate Risk
Interest rate risk represents exposures to instruments whose values vary with the level or volatility of interest rates. These instruments include, but are not limited to, loans, debt securities, certain trading-related assets and liabilities, deposits, borrowings and derivatives. Hedging instruments used to mitigate these risks include derivatives such as options, futures, forwards and swaps.
Foreign Exchange Risk
Foreign exchange risk represents exposures to changes in the values of current holdings and future cash flows denominated in currencies other than the U.S. dollar.Dollar. The types of instruments exposed to this risk include investments in non-U.S. subsidiaries, foreign currency-denominated loans and securities, future cash flows in foreign currencies arising from foreign exchange transactions, foreign currency-denominated debt and various foreign exchange derivatives whose values fluctuate with changes in the level or volatility of currency exchange rates or non-U.S. interest rates. Hedging instruments used to mitigate this risk include foreign exchange options, currency swaps, futures, forwards, and foreign currency-denominated debt and deposits.
Mortgage Risk
Mortgage risk represents exposures to changes in the values of mortgage-related instruments. The values of these instruments are sensitive to prepayment rates, mortgage rates, agency debt ratings, default, market liquidity, government participation and interest rate volatility. Our exposure to these instruments takes
|
| | |
10899 Bank of America 20132014
| | |
interest rate volatility. Our exposure to these instruments takes several forms. First, we trade and engage in market-making activities in a variety of mortgage securities including whole loans, pass-through certificates, commercial mortgages and collateralized mortgage obligations including CDOs using mortgages as underlying collateral. Second, we originate a variety of MBS which involves the accumulation of mortgage-related loans in anticipation of eventual securitization. Third, we may hold positions in mortgage securities and residential mortgage loans as part of the ALM portfolio. Fourth, we create MSRs as part of our mortgage origination activities. For more information on MSRs, see Note 1 – Summary of Significant Accounting Principles and Note 23 – Mortgage Servicing Rights to the Consolidated Financial Statements. Hedging instruments used to mitigate this risk include contracts and derivatives such as options, swaps, futures and forwards. For additional information, see Mortgage Banking Risk Management on page 116108.
Equity Market Risk
Equity market risk represents exposures to securities that represent an ownership interest in a corporation in the form of domestic and foreign common stock or other equity-linked instruments. Instruments that would lead to this exposure include, but are not limited to, the following: common stock, exchange-traded funds, American Depositary Receipts, convertible bonds, listed equity options (puts and calls), OTC equity options, equity total return swaps, equity index futures and other equity derivative products. Hedging instruments used to mitigate this risk include options, futures, swaps, convertible bonds and cash positions.
Commodity Risk
Commodity risk represents exposures to instruments traded in the petroleum, natural gas, power and metals markets. These instruments consist primarily of futures, forwards, swaps and options. Hedging instruments used to mitigate this risk include options, futures and swaps in the same or similar commodity product, as well as cash positions.
Issuer Credit Risk
Issuer credit risk represents exposures to changes in the creditworthiness of individual issuers or groups of issuers. Our portfolio is exposed to issuer credit risk where the value of an asset may be adversely impacted by changes in the levels of credit spreads, by credit migration or by defaults. Hedging instruments used to mitigate this risk include bonds, CDS and other credit fixed-income instruments.
Market Liquidity Risk
Market liquidity risk represents the risk that the level of expected market activity changes dramatically and, in certain cases, may even cease. This exposes us to the risk that we will not be able to transact business and execute trades in an orderly manner which may impact our results. This impact could be further exacerbated if expected hedging or pricing correlations are compromised by disproportionate demand or lack of demand for certain instruments. We utilize various risk mitigating techniques as discussed in more detail in Trading Risk Management.
Trading Risk Management
To evaluate risk in our trading activities, we focus on the actual and potential volatility of revenues generated by individual positions as well as portfolios of positions. Various techniques and procedures are utilized to enable the most complete understanding of these risks. Quantitative measures of market risk are evaluated on a daily basis from a single position to the portfolio of the Corporation. These measures include sensitivities of positions to various market risk factors, such as the potential impact on revenue from a one basis point change in interest rates, and statistical measures utilizing both actual and hypothetical market moves, such as VaR and stress testing. Periods of extreme market stress influence the reliability of these techniques to varying degrees. Qualitative evaluations of market risk utilize the suite of quantitative risk measures while understanding each of their respective limitations. Additionally, risk managers independently evaluate the risk of the portfolios under the current market environment and potential future environments.
VaR is a common statistic used to measure market risk as it allows the aggregation of market risk factors, including the effects of portfolio diversification. A VaR model simulates the value of a portfolio under a range of scenarios in order to generate a distribution of potential gains and losses. VaR represents the loss a portfolio is not expected to exceed more than a certain number of times per period, based on a specified holding period, confidence intervallevel and window of historical data. We use one VaR model consistently across the trading portfolios thatand it uses a historical simulation approach based on a three-year window of historical data. Our primary VaR statistic is equivalent to a 99 percent confidence level. This means that for a VaR with a one-day holding period, there should not be losses in excess of VaR, on average, 99 out of 100 trading days.
Within any VaR model, there are significant and numerous assumptions that will differ from company to company. The accuracy of a VaR model depends on the availability and quality of historical data for each of the risk factors in the portfolio. A VaR model may require additional modeling assumptions for new products that do not have the necessary historical market data or for less liquid positions for which accurate daily prices are not consistently available. For positions with insufficient historical data for the VaR calculation, the process for establishing an appropriate proxy is based on fundamental and statistical analysis of the new product or less liquid position. This analysis identifies reasonable alternatives that replicate both the expected volatility and correlation to other market risk factors that the missing data would be expected to experience.
VaR may not be indicative of realized revenue volatility as changes in market conditions or in the composition of the portfolio can have a material impact on the results. In particular, the historical data used for the VaR calculation might indicate higher or lower levels of portfolio diversification than will be experienced. In order for the VaR model to reflect current market conditions, we update the historical data underlying our VaR model on a bi-weeklyweekly basis, or more frequently during periods of market stress, and regularly review the assumptions underlying the model. A relatively minor portion of risks related to our trading positions are not included in VaR. These risks are reviewed as part of our ICAAP.
|
| | |
| | | Bank of America 20132014 109100 |
Global Markets Risk Management continually reviews, evaluates and enhances our VaR model so that it reflects the material risks in our trading portfolio. Changes to the VaR model are reviewed and approved prior to implementation and any material changes are reported to management through the appropriate governancemanagement committees.
Market risk VaR for trading activities as presented in Table 66 differs from VaR used for regulatory capital calculations (regulatory VaR). The VaR disclosed in Table 66 excludes both counterparty CVA, which are adjustments to the mark-to-market value of our derivative exposures to reflect the impact of the credit quality of counterparties on our derivatives assets, and the corresponding hedges. Regulatory standards require that regulatory VaR only
exclude counterparty CVA but include the corresponding hedges. The holding period for regulatory VaR is 10 days while for the market risk VaR presented below, it is one day. Both regulatory and market risk VaR values utilize the same process and methodology. For more information on certain components in regulatory VaR, see Capital Management – Regulatory Capital Changes on page 68.
The market risk across all business segments to which the Corporation is exposed is included in the total market-based trading portfolio VaR results. The majority of this portfolio is within the Global Markets segment.
Table 66 presents year-end, average, high and low daily trading VaR for 2013 and 2012.
|
| | | | | | | | | | | | | | | | | | | | | | | | | | | | | | | | |
| | | | | | | | | | | | | | | | | |
| Table 66 | Market Risk VaR for Trading Activities | | | | |
| | | | | | | | | | | | | | | | | |
| | | 2013 | | 2012 |
| (Dollars in millions) | Year End | | Average | | High (1) | | Low (1) | | Year End | | Average | | High (1) | | Low (1) |
| Foreign exchange | $ | 16 |
| | $ | 20 |
| | $ | 42 |
| | $ | 12 |
| | $ | 26 |
| | $ | 21 |
| | $ | 34 |
| | $ | 12 |
|
| Interest rate | 32 |
| | 34 |
| | 66 |
| | 20 |
| | 49 |
| | 46 |
| | 75 |
| | 30 |
|
| Credit | 66 |
| | 53 |
| | 72 |
| | 33 |
| | 73 |
| | 50 |
| | 81 |
| | 31 |
|
| Real estate/mortgage | 35 |
| | 28 |
| | 44 |
| | 20 |
| | 37 |
| | 34 |
| | 45 |
| | 28 |
|
| Equities | 25 |
| | 29 |
| | 56 |
| | 17 |
| | 27 |
| | 28 |
| | 55 |
| | 15 |
|
| Commodities | 7 |
| | 12 |
| | 18 |
| | 7 |
| | 13 |
| | 13 |
| | 18 |
| | 7 |
|
| Portfolio diversification | (82 | ) | | (107 | ) | | — |
| | — |
| | (103 | ) | | (117 | ) | | — |
| | — |
|
| Total market-based trading portfolio | $ | 99 |
| | $ | 69 |
| | $ | 115 |
| | $ | 42 |
| | $ | 122 |
| | $ | 75 |
| | $ | 128 |
| | $ | 42 |
|
| |
(1)
| The high and low for the total portfolio may have occurred on different trading days than the high and low for the individual components. Therefore the amount of portfolio diversification, which is the difference between the total portfolio and the sum of the individual components, is not relevant. |
The decrease in average VaR during 2013 was driven by lower levels of exposures in the interest rate and real estate/mortgage markets.
The graph below presents the daily total market-based trading portfolio VaR for 2013, corresponding to the data presented in Table 66.
To enhance the visibility of the market risks to which we are exposed, additional VaR statistics produced within the Corporation’s single VaR model are provided in Table 67. Evaluating VaR with additional statistics allows for an increased understanding of the risks in the portfolio as the historical market
data used in the VaR calculation does not necessarily follow a predefined statistical distribution. Table 67 presents average trading VaR statistics for 99 percent and 95 percent confidence intervals for 2013 and 2012.
|
| | | | | | | | | | | | | | | | | |
| | | | | | | | | | |
| Table 67 | Average Market Risk VaR for Trading Activities – Additional VaR Statistics | | | | |
| | | | | | | | | | |
| | | | 2013 | | 2012 |
| (Dollars in millions) | | 99 percent | | 95 percent | | 99 percent | | 95 percent (1) |
| Foreign exchange | | $ | 20 |
| | $ | 13 |
| | $ | 21 |
| | $ | 12 |
|
| Interest rate | | 34 |
| | 20 |
| | 46 |
| | 26 |
|
| Credit | | 53 |
| | 23 |
| | 50 |
| | 24 |
|
| Real estate/mortgage | | 28 |
| | 17 |
| | 34 |
| | 18 |
|
| Equities | | 29 |
| | 16 |
| | 28 |
| | 16 |
|
| Commodities | | 12 |
| | 7 |
| | 13 |
| | 7 |
|
| Portfolio diversification | | (107 | ) | | (63 | ) | | (117 | ) | | (65 | ) |
| Total market-based trading portfolio | | $ | 69 |
| | $ | 33 |
| | $ | 75 |
| | $ | 38 |
|
| |
(1)
| Due to system constraints, the 95 percent VaR for the three months ended March 31, 2012 is not available and therefore average 95 percent VaR for that period has been estimated. It is not expected that this estimation materially affected the average 95 percent VaR for 2012. |
LimitsTrading limits on quantitative risk measures, including VaR, are monitored on a daily basis. TheThese trading limits are independently set by market risk managementGlobal Markets Risk Management and reviewed on a regular basis to ensure they remain relevant and within our overall risk appetite for market risks. LimitsTrading limits are reviewed in the context of market liquidity, volatility and strategic business priorities. TheTrading limits are set at both a granular level to ensure extensive coverage of risks as well as at aggregated portfolios to account for correlations among risk factors. TradingAll trading limits are approved at least annually. The ALMRCannually and the MRC has given authority to the GMRCGM subcommittee to approve changes to trading limits throughout the year. Approved trading limits are stored and tracked in a centralized limits management system. Trading limit excesses are communicated to management for review. Certain quantitative market risk measures and corresponding limits have been identified as critical in the Corporation’s Risk Appetite Statement. These risk appetite limits are monitored on a daily basis and are approved at least annually by the ERC and the Board. The market risk based risk appetite limits were not exceeded during 2013.
In periods of market stress, the GMRCGM subcommittee members communicate daily to discuss losses, key risk positions and any limit excesses. As a result of this process, the businesses may selectively reduce risk. Where economically feasible,
Market risk VaR for trading activities as presented in Table 61 differs from VaR used for regulatory capital calculations (regulatory VaR). The VaR disclosed in Table 61 excludes both CVA, which are adjustments to the mark-to-market value of our derivative exposures to reflect the impact of the credit quality of counterparties on our derivative assets, and the corresponding hedges. Current regulatory standards require that regulatory VaR
only exclude CVA but include the corresponding hedges. The holding period for regulatory VaR for capital calculations is 10 days, while for the market risk VaR presented below, it is one day. Except for the differences between regulatory and market risk VaR regarding the inclusion of CVA hedges and the holding period, both measures utilize the same process and methodology.
To provide visibility of market risks to which the Corporation is exposed, Table 61 presents the total market-based trading portfolio VaR which includes our total covered positions trading portfolio and the impact from less liquid trading exposures. Covered positions are solddefined by regulatory standards as trading assets and liabilities, both on- and off-balance sheet, that meet a defined set of specifications. These specifications identify the most liquid trading positions which are intended to be held for a short-term horizon and where the Corporation is able to hedge the material risk elements in a two-way market. Positions in less liquid markets, or macroeconomicwhere there are restrictions on the ability to trade the positions, typically do not qualify as covered positions. Foreign exchange and commodity positions are always considered covered positions, except for structural foreign currency positions that we choose to exclude with prior regulatory approval. Certain positions related to our CVA and corresponding hedges are executedconsidered covered positions; however, these are excluded from the VaR results presented in Table 61. In addition, Table 61 presents our fair value option portfolio, which includes the funded and unfunded exposures for which we elect the fair value option, and their corresponding hedges. The fair value option portfolio combined with the total market-based trading portfolio VaR represents the Corporation’s total market-based portfolio VaR. This population is consistent with the risk appetite limits set by the ERC and the Board.
The market risk across all business segments to reducewhich the exposures.Corporation is exposed is included in the total market-based portfolio VaR results. The majority of this portfolio is within the Global Markets segment.
Table 61 presents year-end, average, high and low daily trading VaR for 2014 and 2013 using a 99 percent confidence level.
|
| | | | | | | | | | | | | | | | | | | | | | | | | | | | | | | | |
| | | | | | | | | | | | | | | | | |
| Table 61 | Market Risk VaR for Trading Activities | | | | |
| | | | | | | | | | | | | | | | | |
| | | 2014 | | 2013 |
| (Dollars in millions) | Year End | | Average | | High (1) | | Low (1) | | Year End | | Average | | High (1) | | Low (1) |
| Foreign exchange | $ | 13 |
| | $ | 16 |
| | $ | 24 |
| | $ | 8 |
| | $ | 15 |
| | $ | 19 |
| | $ | 41 |
| | $ | 11 |
|
| Interest rate | 24 |
| | 34 |
| | 60 |
| | 19 |
| | 34 |
| | 32 |
| | 61 |
| | 20 |
|
| Credit | 43 |
| | 52 |
| | 82 |
| | 32 |
| | 61 |
| | 58 |
| | 86 |
| | 41 |
|
| Equities | 16 |
| | 17 |
| | 32 |
| | 11 |
| | 23 |
| | 28 |
| | 57 |
| | 16 |
|
| Commodities | 8 |
| | 8 |
| | 10 |
| | 6 |
| | 6 |
| | 13 |
| | 20 |
| | 6 |
|
| Portfolio diversification | (56 | ) | | (78 | ) | | — |
| | — |
| | (68 | ) | | (85 | ) | | — |
| | — |
|
| Total covered positions trading portfolio | 48 |
| | 49 |
| | 86 |
| | 33 |
| | 71 |
| | 65 |
| | 117 |
| | 39 |
|
| Impact from less liquid exposures | 7 |
| | 7 |
| | — |
| | — |
| | 20 |
| | 4 |
| | — |
| | — |
|
| Total market-based trading portfolio | 55 |
| | 56 |
| | 101 |
| | 38 |
| | 91 |
| | 69 |
| | 115 |
| | 44 |
|
| Fair value option loans | 35 |
| | 31 |
| | 40 |
| | 21 |
| | 33 |
| | 42 |
| | 55 |
| | 29 |
|
| Fair value option hedges | 21 |
| | 14 |
| | 23 |
| | 8 |
| | 15 |
| | 19 |
| | 31 |
| | 12 |
|
| Fair value option portfolio diversification | (37 | ) | | (24 | ) | | — |
| | — |
| | (25 | ) | | (32 | ) | | — |
| | — |
|
| Total fair value option portfolio | 19 |
| | 21 |
| | 28 |
| | 15 |
| | 23 |
| | 29 |
| | 39 |
| | 21 |
|
| Portfolio diversification | (7 | ) | | (12 | ) | | — |
| | — |
| | (1 | ) | | (13 | ) | | — |
| | — |
|
| Total market-based portfolio | $ | 67 |
| | $ | 65 |
| | $ | 120 |
| | $ | 44 |
| | $ | 113 |
| | $ | 85 |
| | $ | 127 |
| | $ | 60 |
|
| |
(1) | The high and low for each portfolio may have occurred on different trading days than the high and low for the components. Therefore the impact from less liquid exposures and the amount of portfolio diversification, which is the difference between the total portfolio and the sum of the individual components, are not relevant. |
The year-end and the average total market-based trading portfolio VaR decreased during 2014 due to elevated market volatility experienced during the 2011 roll-out of the three-year window of historical data used in the VaR calculation. Additionally, a smaller impact to the reduction in total market-based trading
portfolio VaR was due to an overall reduction from portfolio changes.
The graph below presents the daily total market-based trading portfolio VaR for 2014, corresponding to the data in Table 61.
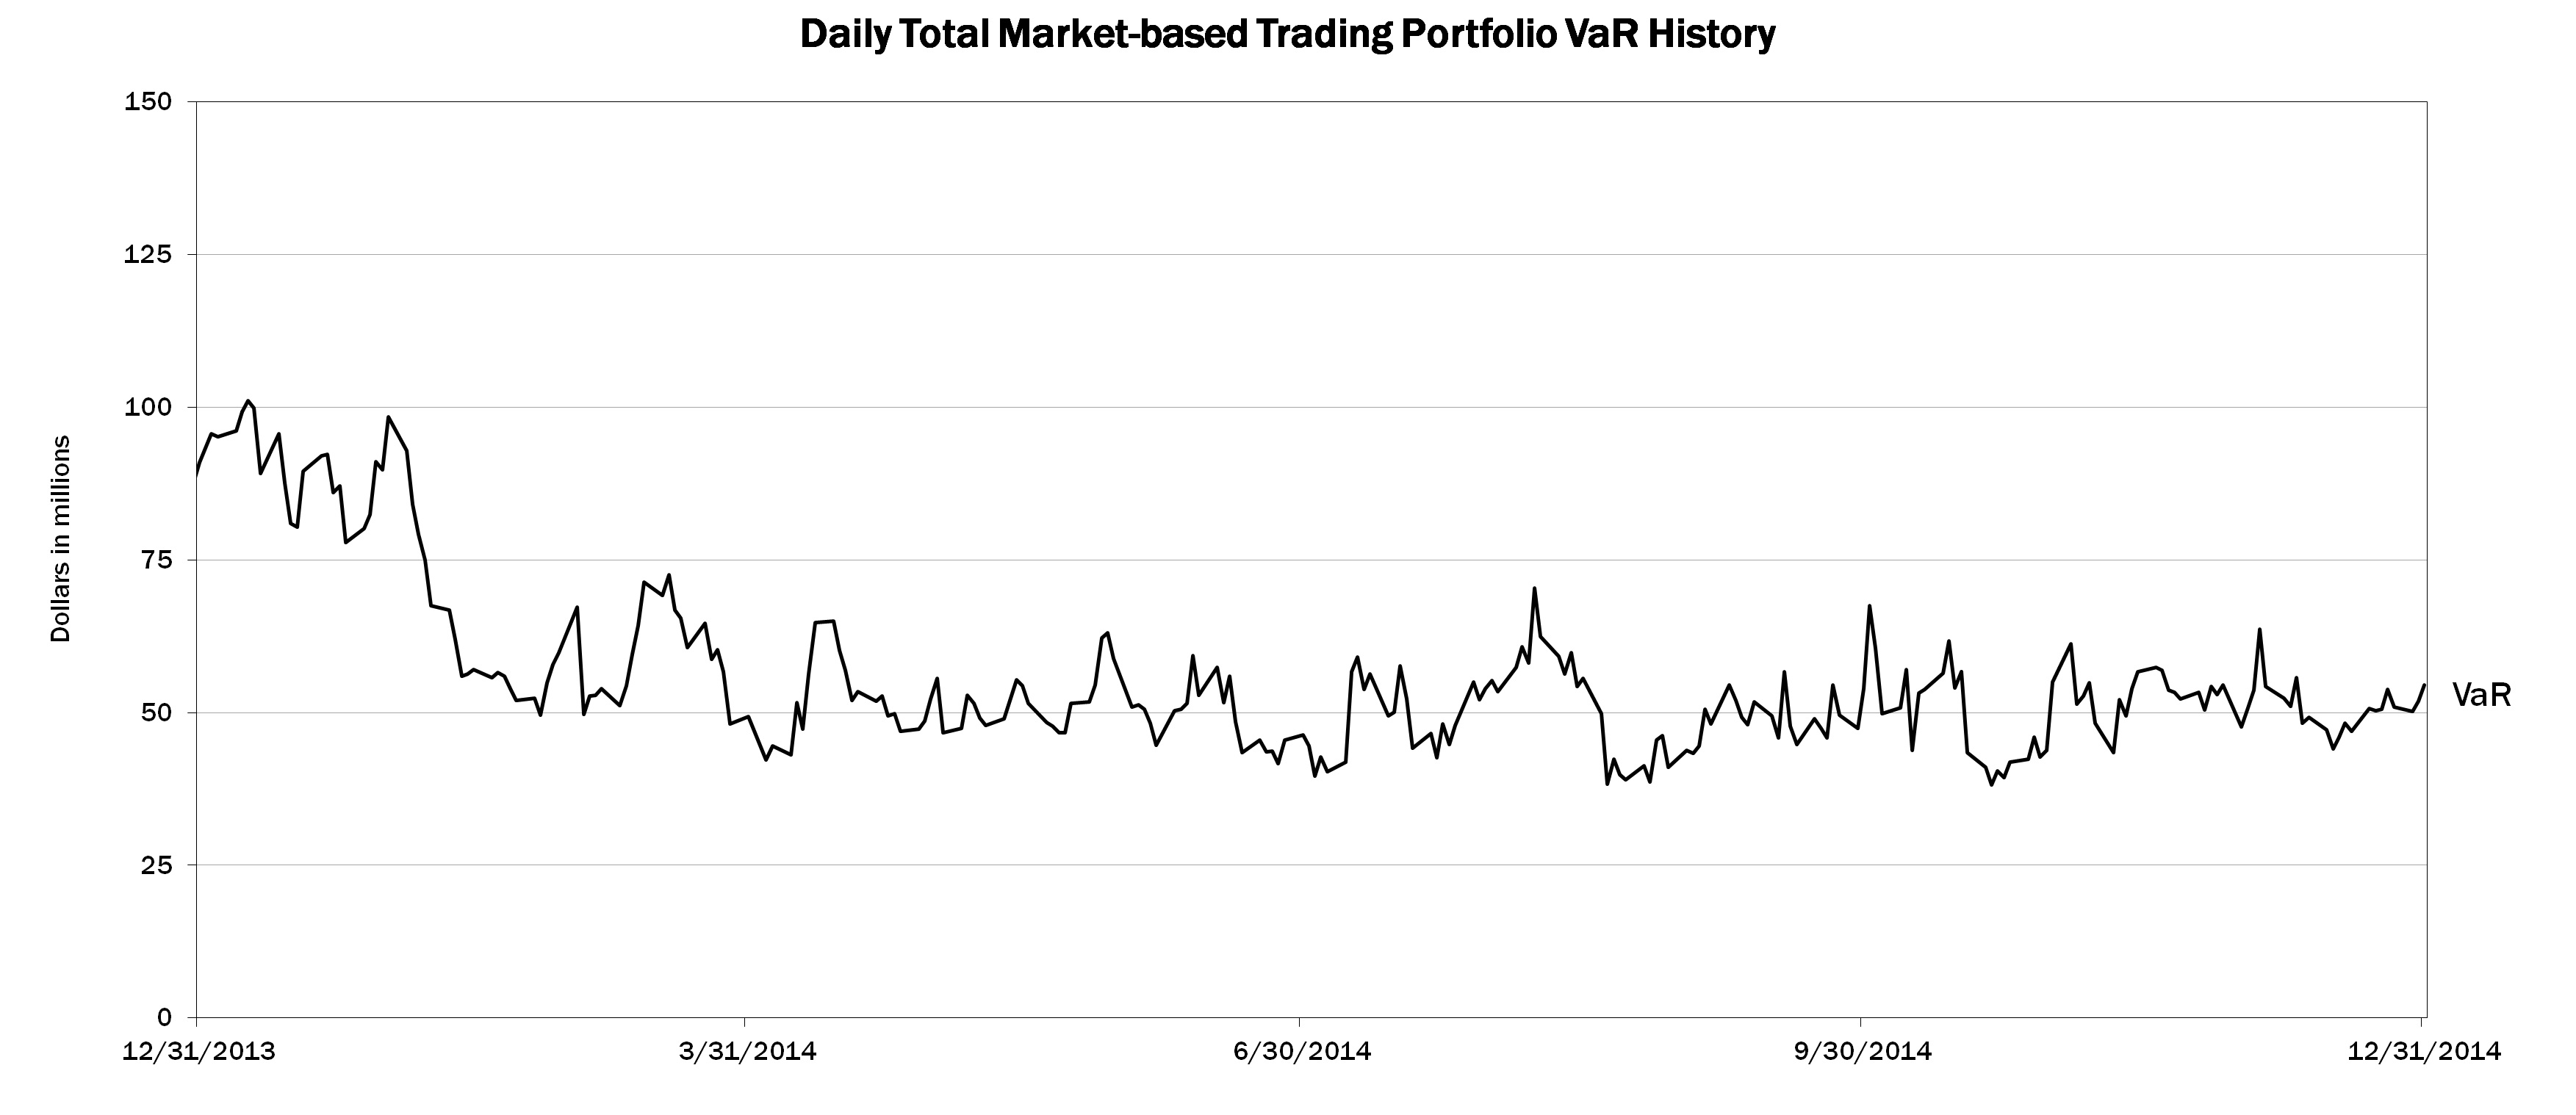
Additional VaR statistics produced within the Corporation’s single VaR model are provided in Table 62 at the same level of detail as in Table 61. Evaluating VaR with additional statistics allows for an increased understanding of the risks in the portfolio
as the historical market data used in the VaR calculation does not necessarily follow a predefined statistical distribution. Table 62 presents average trading VaR statistics for 99 percent and 95 percent confidence levels for 2014 and 2013.
|
| | | | | | | | | | | | | | | | | |
| | | | | | | | | | |
| Table 62 | Average Market Risk VaR for Trading Activities – 99 percent and 95 percent VaR Statistics | | |
| | | | | | | | | | |
| | | | 2014 | | 2013 |
| (Dollars in millions) | | 99 percent | | 95 percent | | 99 percent | | 95 percent |
| Foreign exchange | | $ | 16 |
| | $ | 9 |
| | $ | 19 |
| | $ | 12 |
|
| Interest rate | | 34 |
| | 21 |
| | 32 |
| | 19 |
|
| Credit | | 52 |
| | 26 |
| | 58 |
| | 33 |
|
| Equities | | 17 |
| | 9 |
| | 28 |
| | 15 |
|
| Commodities | | 8 |
| | 4 |
| | 13 |
| | 8 |
|
| Portfolio diversification | | (78 | ) | | (43 | ) | | (85 | ) | | (51 | ) |
| Total covered positions trading portfolio | | 49 |
| | 26 |
| | 65 |
| | 36 |
|
| Impact from less liquid exposures | | 7 |
| | 3 |
| | 4 |
| | 3 |
|
| Total market-based trading portfolio | | 56 |
| | 29 |
| | 69 |
| | 39 |
|
| Fair value option loans | | 31 |
| | 15 |
| | 42 |
| | 21 |
|
| Fair value option hedges | | 14 |
| | 9 |
| | 19 |
| | 13 |
|
| Fair value option portfolio diversification | | (24 | ) | | (14 | ) | | (32 | ) | | (19 | ) |
| Total fair value option portfolio | | 21 |
| | 10 |
| | 29 |
| | 15 |
|
| Portfolio diversification | | (12 | ) | | (8 | ) | | (13 | ) | | (9 | ) |
| Total market-based portfolio | | $ | 65 |
| | $ | 31 |
| | $ | 85 |
| | $ | 45 |
|
Backtesting
The accuracy of the VaR methodology is evaluated by backtesting, which compares the daily regulatory VaR results, utilizing a one-day holding period, against the realized daily profit and loss. Backtesting excesses occura comparable subset of trading revenue. A backtesting excess occurs when a trading loss exceeds the VaR for the corresponding day. These excesses are evaluated to understand the positions and market moves that produced the trading loss and to ensure that the VaR methodology accurately represents those losses. As our primary VaR statistic used for backtesting is based on a 99 percent confidence intervallevel and a one-day holding period, we expect one trading loss in excess of VaR every 100 days, or between two to three trading losses in excess of VaR over the course of a year. The number of backtesting excesses observed can differ from the statistically expected number of excesses if the current level of market volatility is
materially different than the level of market volatility that existed during the three years of historical data used in the VaR calculation.
We conduct daily backtesting on our portfolios, ranging from the total market-based portfolio to individual trading areas. Additionally, we conduct daily backtesting on our regulatory VaR results as well as the VaR results for key legal entities, regions and report therisk factors. These results are reported to senior market risk management. Senior management including the GMRC, regularly reviews and evaluates the results of these tests. The government agencies that regulate our operations also regularly review these results.
The trading revenue used for backtesting is defined by regulatory agencies in order to most closely align with the VaR component of the regulatory capital calculation. This revenue differs from total trading-related revenue in that it excludes revenuesrevenue from trading activities that either do not generate market risk or the market risk cannot be included in VaR. Some examples of the
types of revenue excluded for backtesting are fees, commissions, reserves, net interest income and intraday trading revenues. In addition, counterparty CVA is not included in the VaR component of the regulatory capital calculation and is therefore not included in the revenue used for backtesting.backtesting of the regulatory VaR results.
ThereDuring 2014, there were no days within which there was a backtesting excess for our total market-based portfolio, utilizing a one-day holding period. There were three backtesting excesses for our total market-based trading portfolioregulatory VaR results, utilizing a one-day holding period, due to increased volatility during the three months ended 2013December 31, 2014.
Total Trading Revenue
Total trading-related revenue, excluding brokerage fees, represents the total amount earned from trading positions, including market-based net interest income, which are taken in a diverse range of financial instruments and markets. Trading account assets and liabilities are reported at fair value. For more information on fair value, see Note 20 – Fair Value Measurements to the Consolidated Financial Statements. Trading-related revenues can be volatile and are largely driven by general market conditions and customer demand. Also, trading-related revenues are dependent on the volume and type of transactions, the level of risk assumed, and the volatility of price and rate movements at any given time within the ever-changing market environment. Significant daily revenues by business are monitored and the primary drivers of these are reviewed. When it is deemed material, an explanation of these revenues is provided to the GMRC.GM subcommittee.
|
| | |
| | 103Bank of America 20131112014 | | |
The histogram below is a graphic depiction of trading volatility and illustrates the daily level of trading-related revenue for 20132014 and 2012.2013. During 2014, positive trading-related revenue was recorded for 95 percent of the trading days, of which 72 percent were daily trading gains of over $25 million and the largest loss
was $17 million. This compares to 2013, where positive trading-related revenue was recorded for 96 percent or 241 of the 251 trading days, of which 74 percent (186 days) were daily trading gains of over $25 million
and the largest loss was $54 million. This compares to 2012 where positive trading-related revenue was recorded for 98 percent, or 243 of the 249 trading days, of which 80 percent (199 days) were daily trading gains of over $25 million and the largest loss was $50$54 million.
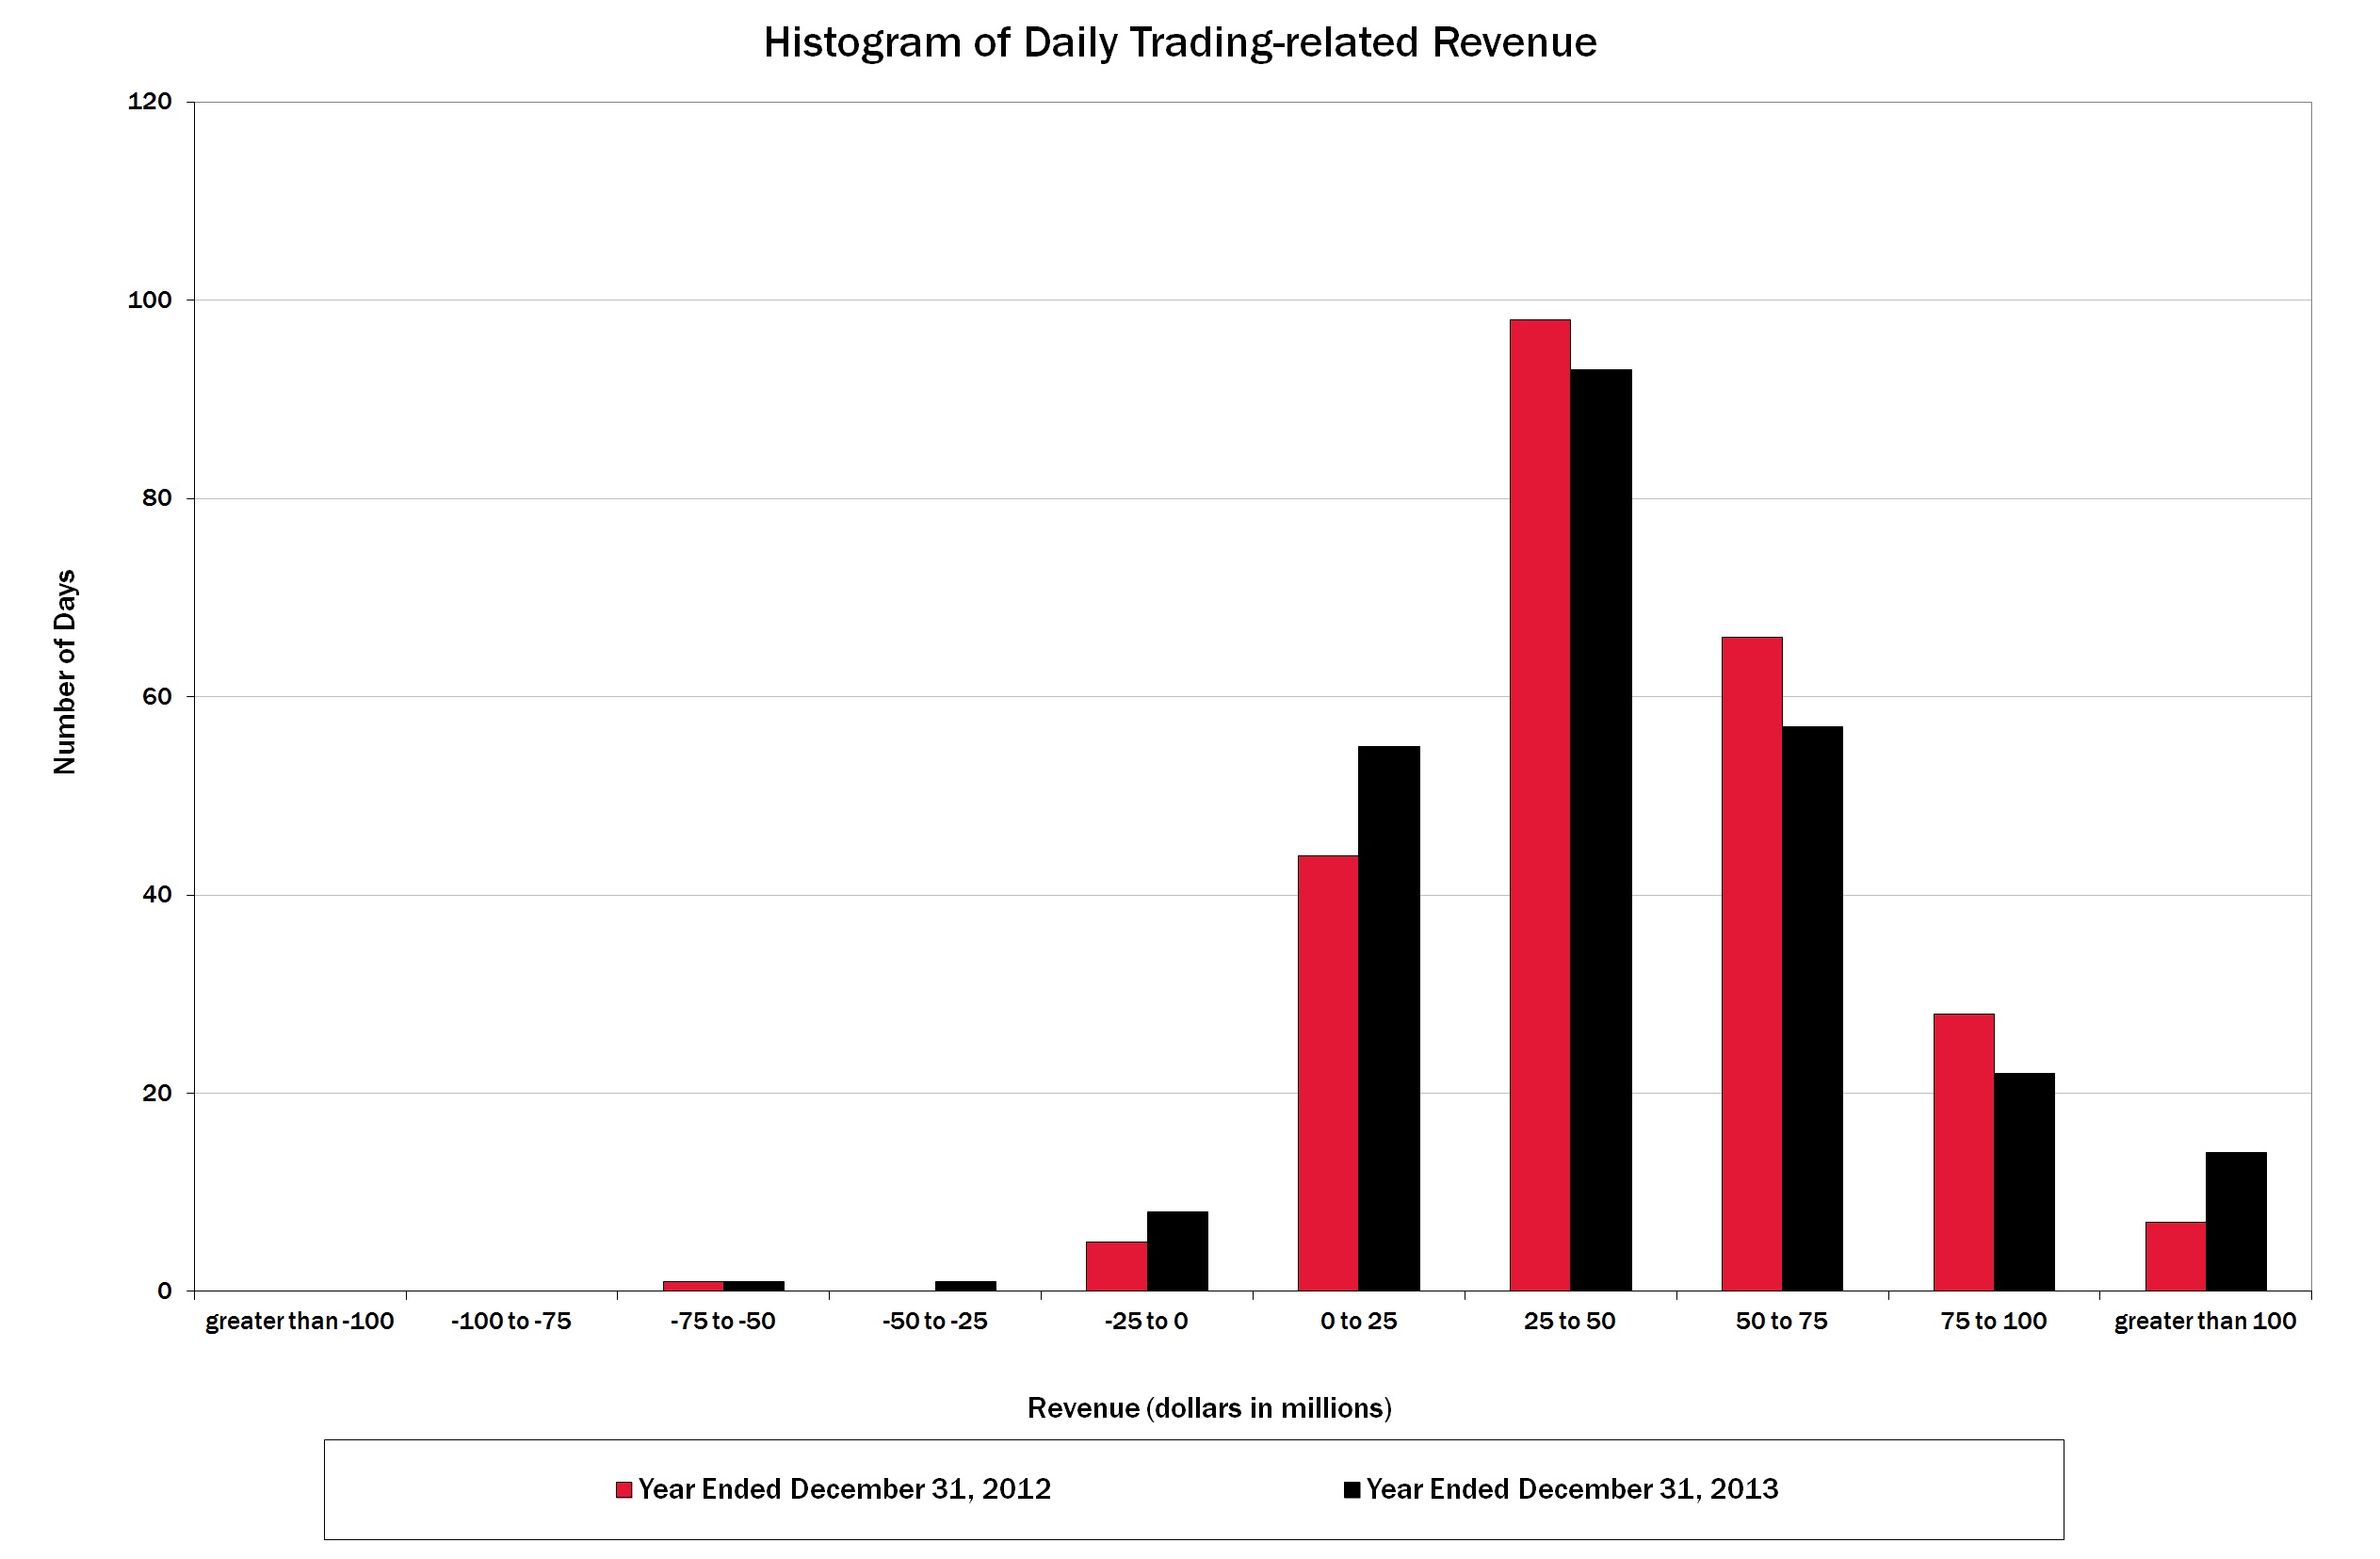
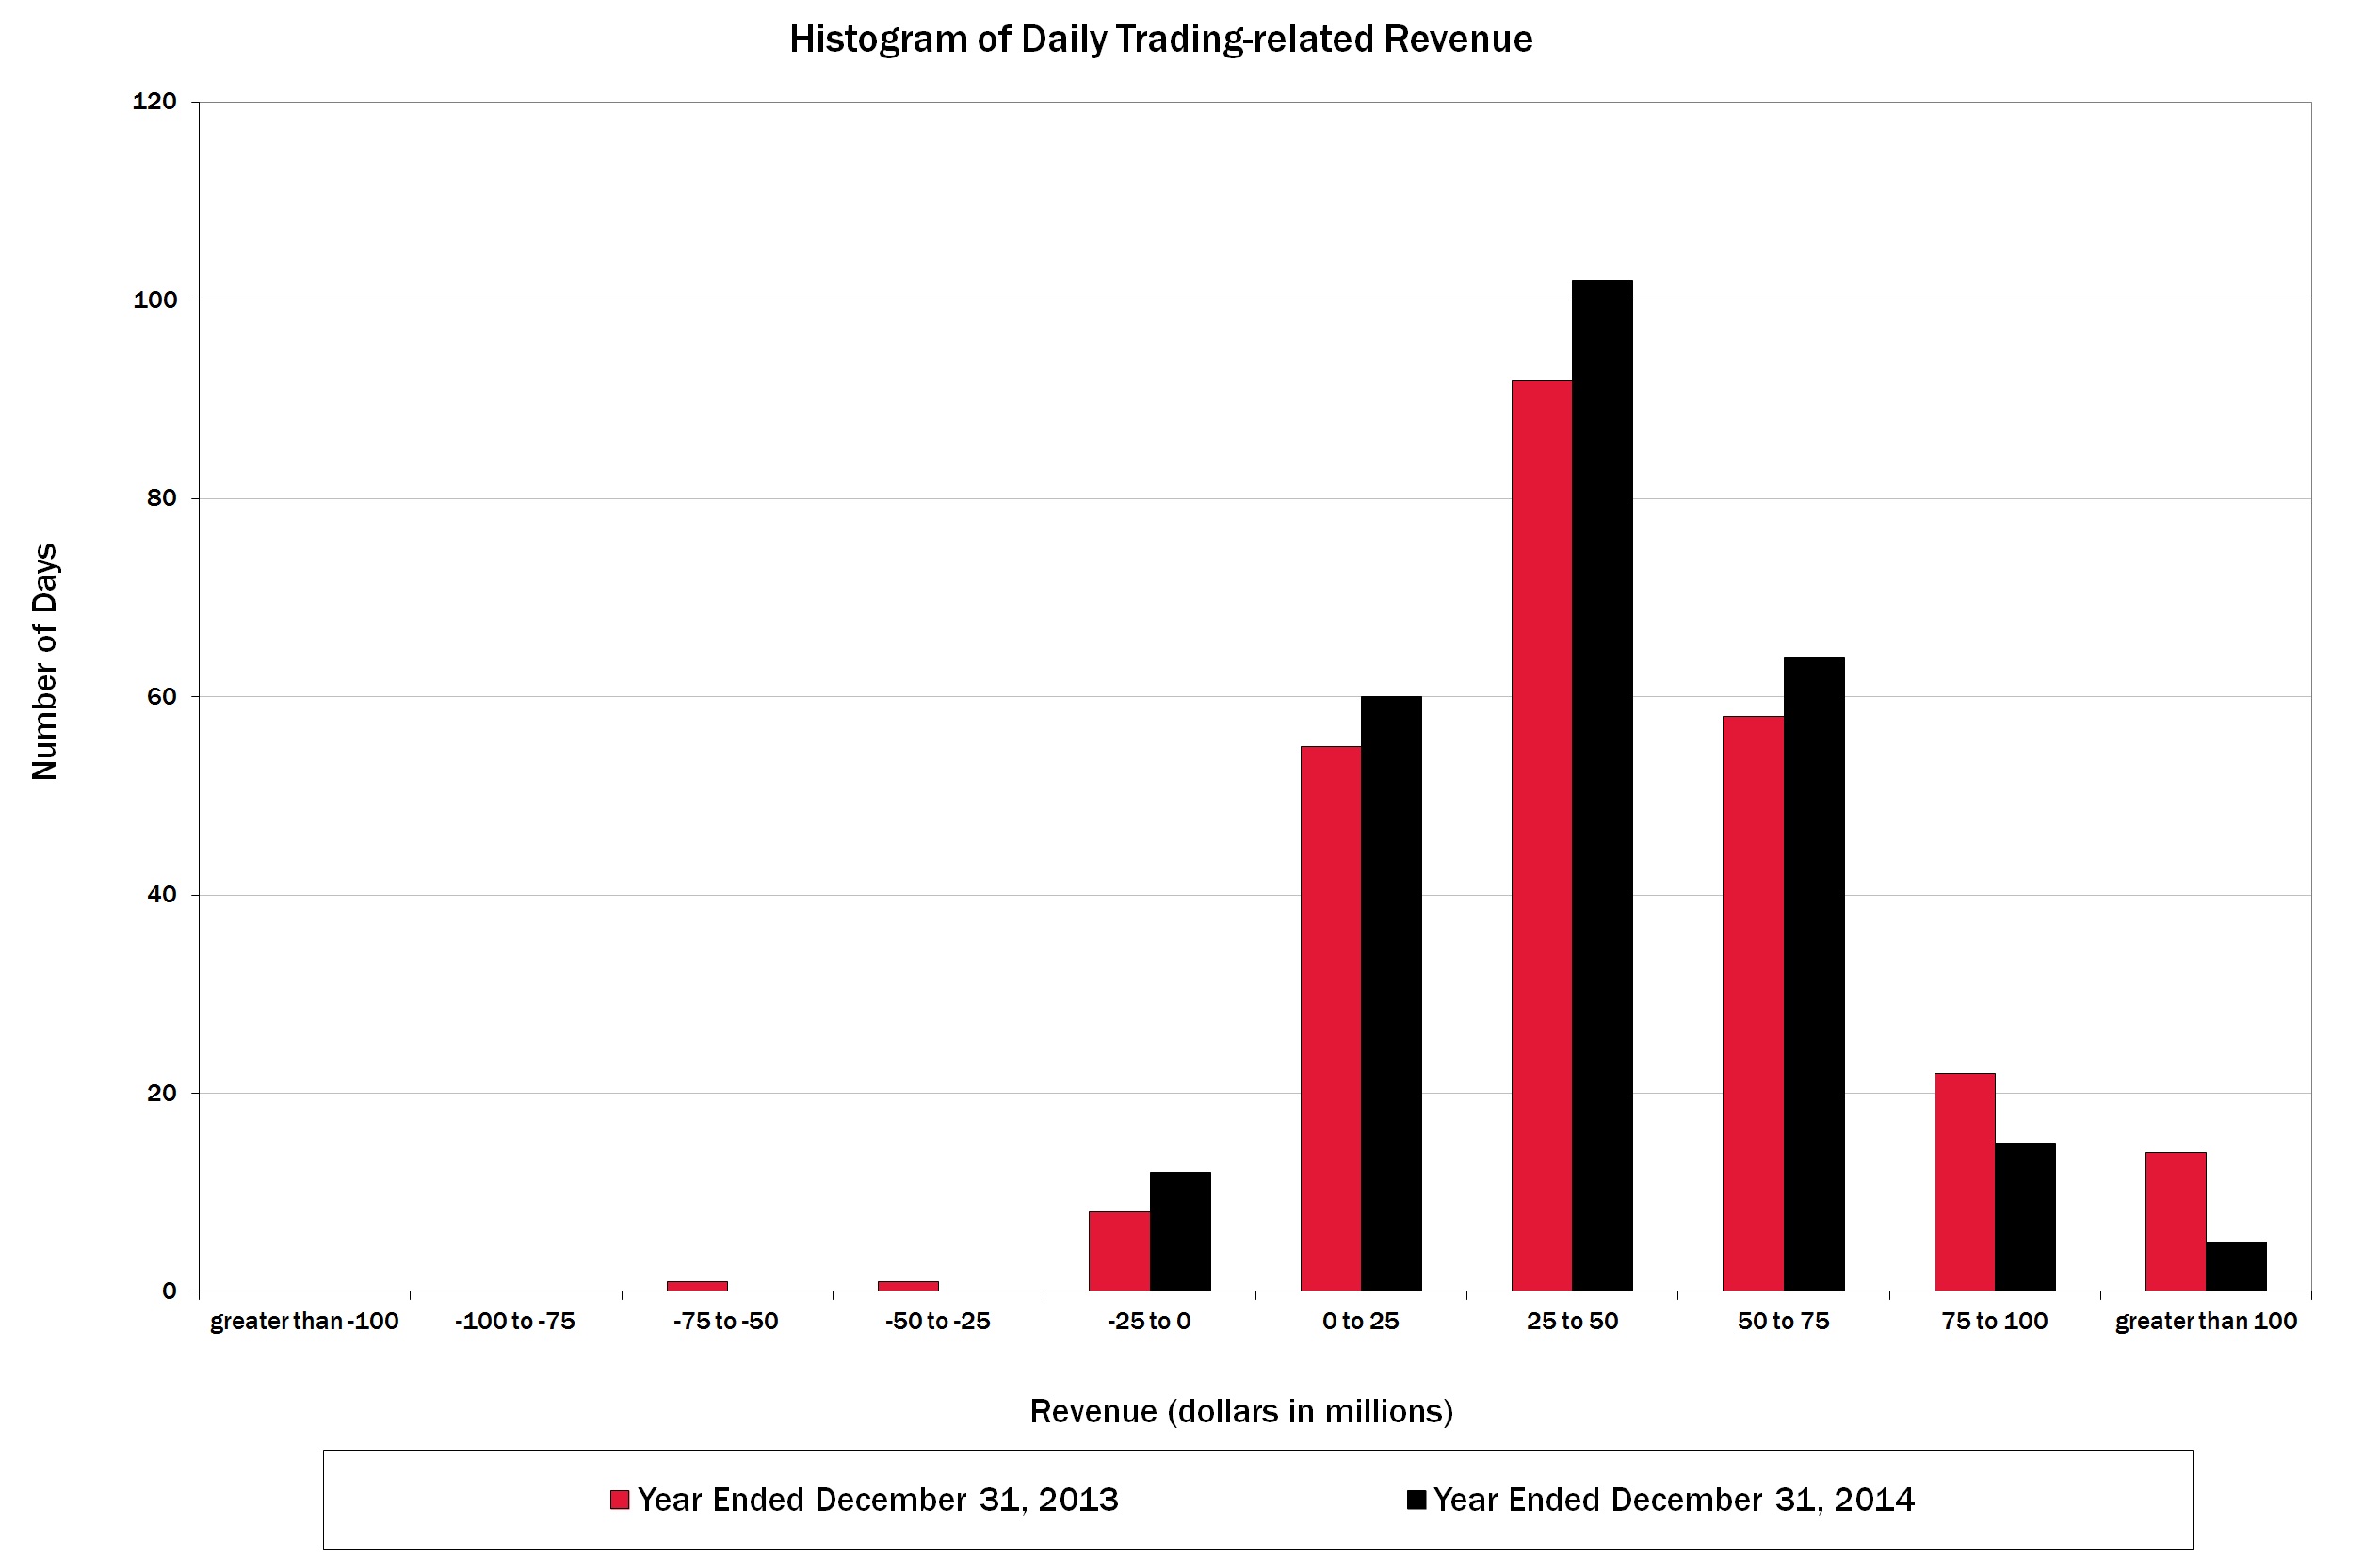
Trading Portfolio Stress Testing
Because the very nature of a VaR model suggests results can exceed our estimates and areit is dependent on a limited historical window, we also stress test our portfolio using scenario analysis. This analysis estimates the change in value of our trading portfolio that may result from abnormal market movements.
A set of scenarios, categorized as either historical or hypothetical, are computed daily for the overall trading portfolio and individual businesses. These scenarios include shocks to underlying market risk factors that may be well beyond the shocks found in the historical data used to calculate VaR. Historical scenarios simulate the impact of the market moves that occurred during a period of extended historical market stress. Generally, a 10-business day window or longer representing the most severe point during a crisis is selected for each historical scenario. Hypothetical scenarios provide simulations of the estimated portfolio impact from potential future market stress events. Scenarios are reviewed and updated in response to changing
positions and new economic or political information. In addition, new or adhoc scenarios are developed to address specific potential market events. For example, a stress test was conducted to estimate the impact of a significant increase in global interest rates and the corresponding impact across other asset classes. The stress tests are reviewed on a regular basis and the results are presented to senior management.
Stress testing for the trading portfolio is integrated with enterprise-wide stress testing and incorporated into the limits framework. A process is in place to promote consistency between the scenarios used for the trading portfolio and those used for enterprise-wide stress testing. The scenarios used for enterprise-wide stress testing purposes differ from the typical trading portfolio scenarios in that they have a longer time horizon and the results are forecasted over multiple periods for use in consolidated capital and liquidity planning. For additional information, see Managing Risk – Enterprise-wideCorporation-wide Stress Testing on page 6358.
|
| | |
| | 112Bank of America 20132014104
| | |
Interest Rate Risk Management for Nontrading Activities
The following discussion presents net interest income excluding the impact of trading-related activities.
Interest rate risk represents the most significant market risk exposure to our nontradingnon-trading balance sheet. Interest rate risk is measured as the potential change in net interest income caused by movements in market interest rates. Client-facing activities, primarily lending and deposit-taking, create interest rate sensitive positions on our balance sheet.
We prepare forward-looking forecasts of net interest income. The baseline forecast takes into consideration expected future business growth, ALM positioning and the direction of interest rate movements as implied by the market-based forward curve. We then measure and evaluate the impact that alternative interest rate scenarios have on the baseline forecast in order to assess interest rate sensitivity under varied conditions. The net interest income forecast is frequently updated for changing assumptions and differing outlooks based on economic trends, market conditions and business strategies. Thus, we continually monitor our balance sheet position in an effortorder to maintain an acceptable level of exposure to interest rate changes.
The interest rate scenarios that we analyze incorporate balance sheet assumptions such as loan and deposit growth and pricing, changes in funding mix, product repricing and maturity characteristics. Our overall goal is to manage interest rate risk so that movements in interest rates do not significantly adversely affect earnings and capital.
Table 6863 presents the spot and 12-month forward rates used in our baseline forecasts at December 31, 20132014 and 20122013.
|
| | | | | | | | | |
| | | | | | | |
| Table 68 | Forward Rates | | | | | |
| | | | | | | |
| | | December 31, 2013 |
| | | Federal Funds | | Three-Month LIBOR | | 10-Year Swap |
| Spot rates | 0.25 | % | | 0.25 | % | | 3.09 | % |
| 12-month forward rates | 0.25 |
| | 0.43 |
| | 3.52 |
|
| | | | | | | |
| | | December 31, 2012 |
| Spot rates | 0.25 | % | | 0.31 | % | | 1.84 | % |
| 12-month forward rates | 0.25 |
| | 0.37 |
| | 2.10 |
|
|
| | | | | | | | | |
| | | | | | | |
| Table 63 | Forward Rates | | | | | |
| | | | | | | |
| | | December 31, 2014 |
| | | Federal Funds | | Three-Month LIBOR | | 10-Year Swap |
| Spot rates | 0.25 | % | | 0.26 | % | | 2.28 | % |
| 12-month forward rates | 0.75 |
| | 0.91 |
| | 2.55 |
|
| | | | | | | |
| | | December 31, 2013 |
| Spot rates | 0.25 | % | | 0.25 | % | | 3.09 | % |
| 12-month forward rates | 0.25 |
| | 0.43 |
| | 3.52 |
|
Table 6964 shows the pre-taxpretax dollar impact to forecasted net interest income over the next 12 months from December 31, 20132014 and 2012,2013, resulting from instantaneous parallel and non-parallel shocks to the market-based forward curve. Periodically, we evaluate the scenarios presented to ensure that they are meaningful in the context of the current rate environment. For further discussion ofmore
information on net interest income excluding the impact of trading-related activities, see page 34.33.
During 2013, the 10-year Treasury rate increased more than 120 bps. We continue to be asset sensitiveasset-sensitive to both a parallel move in interest rates and to a lesser degree a long-end led steepening of the yield curve. Additionally, rising interest rates impact the fair value of debt securities and, accordingly, for debt securities classified as AFS, may adversely affect accumulated OCI and thus capital levels.levels under the Basel 3 capital rules. Under instantaneous upward parallel shifts, the near term adverse impact to accumulated OCI and Basel 3 capital is reduced over time by offsetting positive impacts to net interest income. For more information on the phase-in provisions of Basel 3 including accumulated OCI, see Capital Management – Regulatory Capital on page 59.
| | | | | | | | | | | | | | | | | | | |
| Table 69 | Estimated Net Interest Income Excluding Trading-related Net Interest Income | |
| Table 64 | | Estimated Net Interest Income Excluding Trading-related Net Interest Income |
| | | | | | | | | | | | | | | | | |
| (Dollars in millions) | (Dollars in millions) | Short Rate (bps) | | Long Rate (bps) | | December 31 | (Dollars in millions) | Short Rate (bps) | | Long Rate (bps) | | December 31 |
| Curve Change | Curve Change | | 2013 | | 2012 | Curve Change | | 2014 | | 2013 |
| Parallel Shifts | Parallel Shifts | | | | | | | | Parallel Shifts | | | | | | | |
+100 bps instantaneous shift | +100 bps instantaneous shift | +100 | | +100 | | $ | 3,229 |
| | $ | 4,350 |
| +100 bps instantaneous shift | +100 | | +100 | | $ | 3,685 |
| | $ | 3,229 |
|
-50 bps instantaneous shift | -50 bps instantaneous shift | --50 |
| | --50 |
| | (1,616 | ) | | (2,322 | ) | -50 bps instantaneous shift | -50 |
| | -50 |
| | (3,043 | ) | | (1,616 | ) |
| Flatteners | Flatteners | |
| | |
| | |
| | |
| Flatteners | |
| | |
| | |
| | |
|
Short end instantaneous change | +100 | | — |
| | 2,210 |
| | 2,130 |
| |
Long end instantaneous change | — |
| | --50 |
| | (641 | ) | | (1,669 | ) | |
Short-end instantaneous change | | Short-end instantaneous change | +100 | | — |
| | 1,966 |
| | 2,210 |
|
Long-end instantaneous change | | Long-end instantaneous change | — |
| | -50 |
| | (1,772 | ) | | (641 | ) |
| Steepeners | Steepeners | |
| | |
| | |
| | |
| Steepeners | |
| | |
| | |
| | |
|
Short end instantaneous change | --50 |
| | — |
| | (937 | ) | | (648 | ) | |
Long end instantaneous change | — |
| | +100 | | 1,066 |
| | 2,238 |
| |
Short-end instantaneous change | | Short-end instantaneous change | -50 |
| | — |
| | (1,261 | ) | | (937 | ) |
Long-end instantaneous change | | Long-end instantaneous change | — |
| | +100 | | 1,782 |
| | 1,066 |
|
The sensitivity analysis in Table 6964 assumes that we take no action in response to these rate shocks.shocks and does not assume any change in other macroeconomic variables normally correlated with changes in interest rates. As part of our ALM activities, we use securities, residential mortgages, and interest rate and foreign exchange derivatives in managing interest rate sensitivity.
The behavior of our deposit portfolio in the baseline forecast and in alternate interest rate scenarios is a key assumption in our projected estimates of net interest income. The sensitivity analysis in Table 64 assumes no change in deposit portfolio size or mix from the baseline forecast in alternate rate environments. In higher rate scenarios, any customer activity resulting in the replacement of low-cost or noninterest-bearing deposits with higher-yielding deposits or market-based funding would reduce the Corporation’s benefit in those scenarios.
|
| | |
| | 105Bank of America 20131132014 | | |
Securities
The securities portfolio is an integral part of our interest rate risk management, which includes our ALM positioning, and is primarily comprised of debt securities including MBS and to a lesser extent U.S. Treasury corporate, municipal and other debt securities. As part of the ALM positioning, we use derivatives to hedge interest rate and duration risk. At December 31, 20132014 and 20122013, our debt securities portfolio used for ALM positioning had a carrying value of $323.9$380.5 billion and $360.3$323.9 billion.
During 20132014 and 20122013, we purchased debt securities of $190.4$293.8 billion and $185.5$190.4 billion, sold $117.7157.7 billion and $72.4117.7 billion, and had maturities and received paydowns of $94.0$87.6 billion and $77.8$94.0 billion, respectively. We realized $1.31.4 billion and $1.71.3 billion in net gains on sales of AFS debt securities.
At December 31, 2013 and 2012,2014, accumulated OCI included after-tax net unrealized gains of $1.3 billion on AFS debt securities and after-tax net unrealized gains of $17 million on AFS marketable equity securities compared to after-tax net unrealized losses of $3.3 billion and gains of $4.4 billion on AFS debt securities and after-tax net unrealized losses of $4 million and gains of $462 million on AFS marketable equity securities.at December 31, 2013. For more information on accumulated OCI, see Note 14 – Accumulated Other Comprehensive Income (Loss) to the Consolidated Financial Statements. The pre-taxpretax net amounts in accumulated OCI related to AFS debt securities decreasedincreased $12.27.4 billion during 20132014 to a $5.2$2.2 billion net unrealized lossgain primarily due to the impact of higher interest rates. For more information on our securities portfolio, see Note 3 – Securities to the Consolidated Financial Statements.
We recognized $20$16 million of other-than-temporary impairment (OTTI) losses in earnings on AFS debt securities in 20132014 compared to losses of $53$20 million in 20122013. OTTI losses during 2014 and 2013 were on non-agency RMBS and were recorded in other income on the Consolidated Statement of Income. The recognition of OTTI losses is based on a variety of factors, including the length of time and extent to which the market value has been less than amortized cost, the financial condition of the issuer of the security including credit ratings and any specific events affecting the operations of the issuer, underlying assets that collateralize the debt security, other industry and macroeconomic conditions, and our intent and ability to hold the security to recovery.
Residential Mortgage Portfolio
At December 31, 20132014 and 20122013, our residential mortgage portfolio was $248.1216.2 billion and $252.9248.1 billion excluding $2.0$1.9 billion and $1.0$2.0 billion of consumer residential mortgage loans accounted for under the fair value option.option at each period end. For more information on consumer fair value option loans, see Consumer Portfolio Credit Risk Management – Consumer Loans
Accounted for Under the Fair Value Option on page 8982. The $4.931.9 billion decrease in 20132014 was primarily due to paydowns, sales, charge-offs and transfers to foreclosed
properties properties. Of the decline, more than 50 percent was due to the sale of $10.7 billion of loans with standby insurance agreements and $6.7 billion of nonperforming and other delinquent loan sales. These were partially offset by new origination volume retained on our balance sheet, loans repurchased as part of the FNMA Settlement, as well as repurchases of delinquent loans pursuant to our servicing agreements with GNMA, which isare part of our mortgage banking activities. For more information on the FNMA Settlement, see Note 7 – Representations and Warranties Obligations and Corporate Guaranteesto the Consolidated Financial Statements.
During 20132014, CRES and GWIM originated $44.5$23.2 billion of first-lien mortgages that we retained compared to $35.4$44.5 billion in 20122013. Additionally, duringWe received paydowns of $37.8 billion in 2014 compared to $53.0 billion in 2013 in connection with the FNMA Settlement, we repurchased $5.3 billion of certain residential mortgage loans as mentioned above.. We repurchased net of loans redelivered, $5.5$5.0 billion of loans pursuant to our servicing agreements with GNMA and redelivered $3.6 billion, primarily FHA-insured loans, compared to $7.0repurchases of $10.4 billion and redeliveries of $5.0 billion in 20122013. Sales of loans, excluding redelivered FHAFHA-insured loans, during 20132014 were $4.0$17.4 billion compared to $302 million$4.0 billion in 20122013. Substantially all of the loans sold in 2013 were nonperforming or PCI. Gains recognized on the sales of residential mortgages in both yearsmortgage loans during 2014 were not material. We received paydowns of $53.0 billion$668 million compared to $75 million in 2013 compared to $54.3 billion in 2012.
Interest Rate and Foreign Exchange Derivative Contracts
Interest rate and foreign exchange derivative contracts are utilized in our ALM activities and serve as an efficient tool to manage our interest rate and foreign exchange risk. We use derivatives to hedge the variability in cash flows or changes in fair value on our balance sheet due to interest rate and foreign exchange components. For more information on our hedging activities, see Note 2 – Derivatives to the Consolidated Financial Statements.
Our interest rate contracts are generally non-leveraged generic interest rate and foreign exchange basis swaps, options, futures and forwards. In addition, we use foreign exchange contracts, including cross-currency interest rate swaps, foreign currency futures contracts, foreign currency forward contracts and options to mitigate the foreign exchange risk associated with foreign currency-denominated assets and liabilities.
Changes to the composition of our derivatives portfolio during 20132014 reflect actions taken for interest rate and foreign exchange rate risk management. The decisions to reposition our derivatives portfolio are based on the current assessment of economic and financial conditions including the interest rate and foreign currency environments, balance sheet composition and trends, and the relative mix of our cash and derivative positions.
|
| | |
| | 114Bank of America 20132014106
| | |
Table 7065 presents derivatives utilized in our ALM activities including those designated as accounting and economic hedging instruments and shows the notional amount, fair value, weighted-average receive-fixed and pay-fixed rates, expected maturity and average estimated durations of our open ALM derivatives at December 31, 20132014 and 20122013. These amounts do not include derivative hedges on our MSRs.
| | | | | | | | | | | | | | | | | | | | | | | | | | | | | | | | | | | | | | | |
| Table 70 | Asset and Liability Management Interest Rate and Foreign Exchange Contracts | |
| Table 65 | | Asset and Liability Management Interest Rate and Foreign Exchange Contracts |
| | | | | | | | | | | | | |
| | | | | December 31, 2013 | | | | | | December 31, 2014 | | |
| | | | | Expected Maturity | | | | | | Expected Maturity | | |
| (Dollars in millions, average estimated duration in years) | (Dollars in millions, average estimated duration in years) | Fair Value | | Total | | 2014 | | 2015 | | 2016 | | 2017 | | 2018 | | Thereafter | | Average
Estimated Duration | (Dollars in millions, average estimated duration in years) | Fair Value | | Total | | 2015 | | 2016 | | 2017 | | 2018 | | 2019 | | Thereafter | | Average
Estimated Duration |
Receive-fixed interest rate swaps (1, 2) | Receive-fixed interest rate swaps (1, 2) | $ | 5,074 |
| | |
| | |
| | |
| | |
| | |
| | |
| | |
| | 4.67 |
| Receive-fixed interest rate swaps (1, 2) | $ | 7,626 |
| | |
| | |
| | |
| | |
| | |
| | |
| | |
| | 4.34 |
|
| Notional amount | Notional amount | |
| | $ | 109,539 |
| | $ | 7,604 |
| | $ | 12,873 |
| | $ | 15,339 |
| | $ | 19,803 |
| | $ | 20,733 |
| | $ | 33,187 |
| | |
| Notional amount | |
| | $ | 113,766 |
| | $ | 11,785 |
| | $ | 15,339 |
| | $ | 21,453 |
| | $ | 15,299 |
| | $ | 10,233 |
| | $ | 39,657 |
| | |
|
| Weighted-average fixed-rate | Weighted-average fixed-rate | |
| | 3.42 | % | | 3.79 | % | | 3.32 | % | | 3.12 | % | | 3.87 | % | | 3.34 | % | | 3.29 | % | | |
| Weighted-average fixed-rate | |
| | 2.98 | % | | 3.56 | % | | 3.12 | % | | 3.64 | % | | 4.07 | % | | 0.49 | % | | 2.63 | % | | |
|
Pay-fixed interest rate swaps (1, 2) | Pay-fixed interest rate swaps (1, 2) | 427 |
| | |
| | |
| | |
| | |
| | |
| | |
| | |
| | 5.92 |
| Pay-fixed interest rate swaps (1, 2) | (829 | ) | | |
| | |
| | |
| | |
| | |
| | |
| | |
| | 8.05 |
|
| Notional amount | Notional amount | |
| | $ | 28,418 |
| | $ | 4,645 |
| | $ | 520 |
| | $ | 1,025 |
| | $ | 1,527 |
| | $ | 8,529 |
| | $ | 12,172 |
| | |
| Notional amount | |
| | $ | 14,668 |
| | $ | 520 |
| | $ | 1,025 |
| | $ | 1,527 |
| | $ | 2,908 |
| | $ | 425 |
| | $ | 8,263 |
| | |
|
| Weighted-average fixed-rate | Weighted-average fixed-rate | |
| | 1.87 | % | | 0.54 | % | | 2.30 | % | | 1.65 | % | | 1.84 | % | | 1.52 | % | | 2.62 | % | | |
| Weighted-average fixed-rate | |
| | 2.27 | % | | 2.30 | % | | 1.65 | % | | 1.84 | % | | 1.62 | % | | 0.09 | % | | 2.77 | % | | |
|
Same-currency basis swaps (3) | Same-currency basis swaps (3) | 6 |
| | |
| | |
| | |
| | |
| | |
| | |
| | |
| | |
| Same-currency basis swaps (3) | (74 | ) | | |
| | |
| | |
| | |
| | |
| | |
| | |
| | |
|
| Notional amount | Notional amount | |
| | $ | 145,184 |
| | $ | 47,529 |
| | $ | 25,171 |
| | $ | 28,157 |
| | $ | 15,283 |
| | $ | 9,156 |
| | $ | 19,888 |
| | |
| Notional amount | |
| | $ | 94,413 |
| | $ | 18,881 |
| | $ | 15,691 |
| | $ | 21,068 |
| | $ | 11,026 |
| | $ | 6,787 |
| | $ | 20,960 |
| | |
|
Foreign exchange basis swaps (2, 4, 5) | 1,208 |
| | |
| | |
| | |
| | |
| | |
| | |
| | |
| | |
| |
Foreign exchange basis swaps (2, 4, 5, 6) | | Foreign exchange basis swaps (2, 4, 5, 6) | (2,352 | ) | | |
| | |
| | |
| | |
| | |
| | |
| | |
| | |
|
| Notional amount | Notional amount | |
| | 205,560 |
| | 39,151 |
| | 37,298 |
| | 27,293 |
| | 24,304 |
| | 14,517 |
| | 62,997 |
| | |
| Notional amount | |
| | 161,196 |
| | 27,629 |
| | 26,118 |
| | 27,026 |
| | 14,255 |
| | 12,359 |
| | 53,809 |
| | |
|
Option products (6) | 21 |
| | |
| | |
| | |
| | |
| | |
| | |
| | |
| | |
| |
Notional amount (7) | |
| | (641 | ) | | (649 | ) | | (11 | ) | | — |
| | — |
| | — |
| | 19 |
| | |
| |
Foreign exchange contracts (2, 5, 8) | 1,619 |
| | |
| | |
| | |
| | |
| | |
| | |
| | |
| | |
| |
Notional amount (7) | | | (19,515 | ) | | (35,991 | ) | | 1,873 |
| | (669 | ) | | 7,224 |
| | 2,026 |
| | 6,022 |
| | |
| |
Option products (7) | | Option products (7) | 11 |
| | |
| | |
| | |
| | |
| | |
| | |
| | |
| | |
|
Notional amount (8) | | Notional amount (8) | |
| | 980 |
| | 964 |
| | — |
| | — |
| | — |
| | — |
| | 16 |
| | |
|
Foreign exchange contracts (2, 6, 9) | | Foreign exchange contracts (2, 6, 9) | 3,700 |
| | |
| | |
| | |
| | |
| | |
| | |
| | |
| | |
|
Notional amount (8) | | Notional amount (8) | | | (22,572 | ) | | (29,931 | ) | | (2,036 | ) | | 6,134 |
| | (2,335 | ) | | 2,359 |
| | 3,237 |
| | |
|
| Futures and forward rate contracts | Futures and forward rate contracts | 147 |
| | |
| | |
| | |
| | |
| | |
| | |
| | |
| | |
| Futures and forward rate contracts | (129 | ) | | |
| | |
| | |
| | |
| | |
| | |
| | |
| | |
|
Notional amount (7) | |
| | (19,427 | ) | | (19,427 | ) | | — |
| | — |
| | — |
| | — |
| | — |
| | |
| |
Notional amount (8) | | Notional amount (8) | |
| | (14,949 | ) | | (14,949 | ) | | — |
| | — |
| | — |
| | — |
| | — |
| | |
|
| Net ALM contracts | Net ALM contracts | $ | 8,502 |
| | |
| | |
| | |
| | |
| | |
| | |
| | |
| | |
| Net ALM contracts | $ | 7,953 |
| | |
| | |
| | |
| | |
| | |
| | |
| | |
| | |
|
| | | | | | | | | | | | | | | | | | | | | | | | | | | | | | | | | | | | | |
| | | | | December 31, 2012 | | | | | | December 31, 2013 | | |
| | | | | Expected Maturity | | | | | | Expected Maturity | | |
| (Dollars in millions, average estimated duration in years) | (Dollars in millions, average estimated duration in years) | Fair Value | | Total | | 2013 | | 2014 | | 2015 | | 2016 | | 2017 | | Thereafter | | Average Estimated Duration | (Dollars in millions, average estimated duration in years) | Fair Value | | Total | | 2014 | | 2015 | | 2016 | | 2017 | | 2018 | | Thereafter | | Average Estimated Duration |
Receive-fixed interest rate swaps (1, 2) | Receive-fixed interest rate swaps (1, 2) | $ | 10,491 |
| | |
| | |
| | |
| | |
| | |
| | |
| | |
| | 5.30 |
| Receive-fixed interest rate swaps (1, 2) | $ | 5,074 |
| | |
| | |
| | |
| | |
| | |
| | |
| | |
| | 4.67 |
|
| Notional amount | Notional amount | |
| | $ | 85,899 |
| | $ | 7,175 |
| | $ | 7,604 |
| | $ | 11,785 |
| | $ | 11,362 |
| | $ | 19,693 |
| | $ | 28,280 |
| | |
| Notional amount | |
| | $ | 109,539 |
| | $ | 7,604 |
| | $ | 12,873 |
| | $ | 15,339 |
| | $ | 19,803 |
| | $ | 20,733 |
| | $ | 33,187 |
| | |
|
| Weighted-average fixed-rate | Weighted-average fixed-rate | |
| | 4.12 | % | | 4.06 | % | | 3.79 | % | | 3.56 | % | | 3.98 | % | | 3.89 | % | | 4.67 | % | | |
| Weighted-average fixed-rate | |
| | 3.42 | % | | 3.79 | % | | 3.32 | % | | 3.12 | % | | 3.87 | % | | 3.34 | % | | 3.29 | % | | |
|
Pay-fixed interest rate swaps (1, 2) | Pay-fixed interest rate swaps (1, 2) | (4,903 | ) | | |
| | |
| | |
| | |
| | |
| | |
| | |
| | 15.47 |
| Pay-fixed interest rate swaps (1, 2) | 427 |
| | |
| | |
| | |
| | |
| | |
| | |
| | |
| | 5.92 |
|
| Notional amount | Notional amount | |
| | $ | 26,548 |
| | $ | 27 |
| | $ | 3,989 |
| | $ | 520 |
| | $ | 1,025 |
| | $ | 1,527 |
| | $ | 19,460 |
| | |
| Notional amount | |
| | $ | 28,418 |
| | $ | 4,645 |
| | $ | 520 |
| | $ | 1,025 |
| | $ | 1,527 |
| | $ | 8,529 |
| | $ | 12,172 |
| | |
|
| Weighted-average fixed-rate | Weighted-average fixed-rate | |
| | 3.09 | % | | 6.91 | % | | 0.79 | % | | 2.30 | % | | 1.65 | % | | 1.84 | % | | 3.75 | % | | |
| Weighted-average fixed-rate | |
| | 1.87 | % | | 0.54 | % | | 2.30 | % | | 1.65 | % | | 1.84 | % | | 1.52 | % | | 2.62 | % | | |
|
Same-currency basis swaps (3) | Same-currency basis swaps (3) | 45 |
| | |
| | |
| | |
| | |
| | |
| | |
| | |
| | |
| Same-currency basis swaps (3) | 6 |
| | |
| | |
| | |
| | |
| | |
| | |
| | |
| | |
|
| Notional amount | Notional amount | |
| | $ | 213,458 |
| | $ | 82,716 |
| | $ | 54,534 |
| | $ | 19,995 |
| | $ | 20,361 |
| | $ | 13,542 |
| | $ | 22,310 |
| | |
| Notional amount | |
| | $ | 145,184 |
| | $ | 47,529 |
| | $ | 25,171 |
| | $ | 28,157 |
| | $ | 15,283 |
| | $ | 9,156 |
| | $ | 19,888 |
| | |
|
Foreign exchange basis swaps (2, 4, 5) | 431 |
| | |
| | |
| | |
| | |
| | |
| | |
| | |
| | |
| |
Foreign exchange basis swaps (2, 4, 5, 6) | | Foreign exchange basis swaps (2, 4, 5, 6) | 1,208 |
| | |
| | |
| | |
| | |
| | |
| | |
| | |
| | |
|
| Notional amount | Notional amount | |
| | 191,925 |
| | 32,590 |
| | 44,732 |
| | 27,569 |
| | 15,965 |
| | 20,134 |
| | 50,935 |
| | |
| Notional amount | |
| | 205,560 |
| | 39,151 |
| | 37,298 |
| | 27,293 |
| | 24,304 |
| | 14,517 |
| | 62,997 |
| | |
|
Option products (6) | (147 | ) | | |
| | |
| | |
| | |
| | |
| | |
| | |
| | |
| |
Notional amount (7) | |
| | 4,218 |
| | 4,000 |
| | — |
| | — |
| | — |
| | — |
| | 218 |
| | |
| |
Foreign exchange contracts (2, 5, 8) | 5,636 |
| | |
| | |
| | |
| | |
| | |
| | |
| | |
| | |
| |
Notional amount (7) | |
| | (1,200 | ) | | (23,438 | ) | | 8,615 |
| | 1,303 |
| | 582 |
| | 6,183 |
| | 5,555 |
| | |
| |
Option products (7) | | Option products (7) | 21 |
| | |
| | |
| | |
| | |
| | |
| | |
| | |
| | |
|
Notional amount (8) | | Notional amount (8) | |
| | (641 | ) | | (649 | ) | | (11 | ) | | — |
| | — |
| | — |
| | 19 |
| | |
|
Foreign exchange contracts (2, 6, 9) | | Foreign exchange contracts (2, 6, 9) | 1,619 |
| | |
| | |
| | |
| | |
| | |
| | |
| | |
| | |
|
Notional amount (8) | | Notional amount (8) | |
| | (19,515 | ) | | (35,991 | ) | | 1,873 |
| | (669 | ) | | 7,224 |
| | 2,026 |
| | 6,022 |
| | |
|
| Futures and forward rate contracts | Futures and forward rate contracts | 24 |
| | |
| | |
| | |
| | |
| | |
| | |
| | |
| | |
| Futures and forward rate contracts | 147 |
| | |
| | |
| | |
| | |
| | |
| | |
| | |
| | |
|
Notional amount (7) | |
| | (11,595 | ) | | (11,595 | ) | | — |
| | — |
| | — |
| | — |
| | — |
| | |
| |
Notional amount (8) | | Notional amount (8) | |
| | (19,427 | ) | | (19,427 | ) | | — |
| | — |
| | — |
| | — |
| | — |
| | |
|
| Net ALM contracts | Net ALM contracts | $ | 11,577 |
| | |
| | |
| | |
| | |
| | |
| | |
| | |
| | |
| Net ALM contracts | $ | 8,502 |
| | |
| | |
| | |
| | |
| | |
| | |
| | |
| | |
|
| |
(1) | At December 31, 2013, theThe receive-fixed interest rate swap notional amounts that represent forward starting swaps and which will not be effective until their respective contractual start dates totaled $600$600 million compared to none at December 31, 20122013. TheThere were no forward starting receive-fixed interest rate swap positions at December 31, 2014. There were no forward starting pay-fixed swap positions at December 31, 2013 and 20122014 were $1.1compared to $1.1 billion and $520 million. at December 31, 2013.
|
| |
(2) | Does not include basis adjustments on either fixed-rate debt issued by the Corporation or AFS debt securities, which are hedged using derivatives designated as fair value hedging instruments, that substantially offset the fair values of these derivatives. |
| |
(3) | At December 31, 20132014 and 20122013, the notional amount of same-currency basis swaps was comprised of $145.294.4 billion and $213.5145.2 billion in both foreign currency and U.S. dollar-denominatedDollar-denominated basis swaps in which both sides of the swap are in the same currency. |
| |
(4) | The change in the fair value for foreign exchange basis swaps was primarily driven by the weakening of foreign currencies against the U.S. Dollar throughout 2014 compared to 2013. |
| |
(5) | Foreign exchange basis swaps consisted of cross-currency variable interest rate swaps used separately or in conjunction with receive-fixed interest rate swaps. |
| |
(5)(6)
| Does not include foreign currency translation adjustments on certain non-U.S. debt issued by the Corporation that substantially offset the fair values of these derivatives. |
| |
(6)(7)
| The notional amount of option products of $980 million at December 31, 2014 was comprised of $974 million in foreign exchange options, $16 million in purchased caps/floors and $(10) million in swaptions. Option products of $(641) million at December 31, 2013 waswere comprised of $(2.0) billion in swaptions, $1.4 billion in foreign exchange options and $19 million in purchased caps/floors. Option products of $4.2 billion at December 31, 2012 were comprised of $4.2 billion in swaptions and $18 million in purchased caps/floors. |
| |
(7)(8)
| Reflects the net of long and short positions. Amounts shown as negative reflect a net short position. |
| |
(8)(9)
| The notional amount of foreign exchange contracts of $(22.6) billion at December 31, 2014 was comprised of $21.0 billion in foreign currency-denominated and cross-currency receive-fixed swaps, $(36.4) billion in net foreign currency forward rate contracts, $(8.3) billion in foreign currency-denominated pay-fixed swaps and $1.1 billion in net foreign currency futures contracts. Foreign exchange contracts of $(19.5) billion at December 31, 2013 waswere comprised of $36.1 billion in foreign currency-denominated and cross-currency receive-fixed swaps, $(49.3) billion in net foreign currency forward rate contracts, $(10.3) billion in foreign currency-denominated pay-fixed swaps and $4.0 billion in foreign currency futures contracts. Foreign exchange contracts of $(1.2) billion at December 31, 2012 were comprised of $41.9 billion in foreign currency-denominated and cross-currency receive-fixed swaps, $(10.5) billion in foreign currency-denominated pay-fixed swaps and $(32.6) billion in net foreign currency forward rate contracts. |
|
| | |
| | 107Bank of America 20131152014 | | |
We use interest rate derivative instruments to hedge the variability in the cash flows of our assets and liabilities and other forecasted transactions (collectively referred to as cash flow hedges). The net losses on both open and terminated cash flow hedge derivative instruments recorded in accumulated OCI net-of-tax, were $2.3$2.7 billion and $2.9$3.6 billion, on a pretax basis, at December 31, 20132014 and 20122013. These net losses are expected to be reclassified into earnings in the same period as the hedged cash flows affect earnings and will decrease income or increase expense on the respective hedged cash flows. Assuming no change in open cash flow derivative hedge positions and no changes in prices or interest rates beyond what is implied in forward yield curves at December 31, 20132014, the pre-taxpretax net losses are expected to be reclassified into earnings as follows: $784$803 million, or 2230 percent within the next year, 5846 percent in years two through five, and 1416 percent in years six through ten, with the remaining sixeight percent thereafter. For more information on derivatives designated as cash flow hedges, see Note 2 – Derivatives to the Consolidated Financial Statements.
We hedge our net investment in non-U.S. operations determined to have functional currencies other than the U.S. dollarDollar using forward foreign exchange contracts that typically settle in less than 180 days, cross-currency basis swaps and foreign exchange options. We recorded net after-tax losses on derivatives in accumulated OCI associated with net investment hedges which were offset by gains on our net investments in consolidated non-U.S. entities at December 31, 20132014.
Mortgage Banking Risk Management
We originate, fund and service mortgage loans, which subject us to credit, liquidity and interest rate risks, among others. We determine whether loans will be HFI or held-for-sale at the time of commitment and manage credit and liquidity risks by selling or securitizing a portion of the loans we originate.
Interest rate risk and market risk can be substantial in the mortgage business. Fluctuations in interest rates drive consumer demand for new mortgages and the level of refinancing activity, which in turn affects total origination and servicing income. Hedging the various sources of interest rate risk in mortgage banking is a complex process that requires complex modeling and ongoing monitoring. Typically, an increase in mortgage interest rates will lead to a decrease in mortgage originations and related fees. IRLCs and the related residential first mortgage LHFS are subject to interest rate risk between the date of the IRLC and the date the loans are sold to the secondary market, as an increase in mortgage interest rates will typically lead to a decrease in the value of these instruments. To hedge interest rate risk and certain market risks of IRLCs and residential first mortgage LHFS, we utilize forward loan sale commitments and other derivative instruments including purchased options. At December 31, 2013 and 2012, the notional amounts of derivatives economically hedging the IRLCs and residential first mortgage LHFS were $7.9 billion and $31.1 billion.
MSRs are nonfinancial assets created when the underlying mortgage loan is sold to investors and we retain the right to service the loan. Typically, an increase in mortgage rates will lead to an increase in the value of the MSRs driven by lower prepayment expectations. WeThis increase in value from increases in mortgage rates is opposite of, and therefore offsets, the risk described for IRLCs and LHFS. Previously we hedged MSRs separately from the IRLCs and first mortgage LHFS assets. Because the interest rate risks of these two hedged items offset, we decided to combine them into one overall hedged item with one combined economic hedge portfolio.
Beginning in the fourth quarter of 2014, interest rate and certain market risks of IRLCs and residential mortgage LHFS were economically hedged in combination with MSRs. To hedge these combined assets, we use certain derivatives such as interest rate options, interest rate swaps, forward settlement contractssale commitments, eurodollar and EurodollarU.S. Treasury futures, and mortgage TBAs, as well as other securities including agency MBS, principal-only and interest-only MBS and U.S. Treasuries to hedge interest rateTreasury securities. The fair value and certain other market
risksnotional amounts of MSRs.the derivative contracts and the fair value of securities hedging the combined MSRs, IRLCs and residential first mortgage LHFS were $(3.6) billion, $1.1 trillion and $558 million at December 31, 2014. The fair value and notional amounts of the derivative contracts and the fair value of securities hedging the MSRs at December 31, 2013were $(2.9) billion, $1.8 trillion and $2.5 billionbillion. The notional amount of derivatives economically hedging only the IRLCs and residential first mortgage LHFS at December 31, 2013 and $2.3 billion, $1.6 trillion and $2.3 billion at December 31, 2012.were $7.9 billion. In 20132014, we recorded in mortgage banking income lossesgains of $1.1$1.6 billion related to the change in fair value of the derivative contracts and other securities used to hedge the market risks of the MSRs compared to gainslosses of $2.3$1.1 billion for 20122013. For more information on MSRs, see Note 23 – Mortgage Servicing Rights to the Consolidated Financial Statements and for more information on mortgage banking income, see CRES on page 4038.
Compliance Risk Management
The Global Compliance organization is responsible for overseeing compliance risk which is the risk of legal or regulatory sanctions, material financial loss or damage to the reputation of the Corporation in the event of the failure of the Corporation to comply with the requirements of applicable banking and financial services laws, rules, and regulations, related self-regulatory organization standards and codes of conduct.conduct (collectively, applicable laws, rules and regulations). Global Compliance independently assesses compliance risk, and evaluates adherence to applicable laws, rules and regulations, including identifying compliance issues and risks, performing monitoring and testing, and reporting on the state of compliance activities across the Corporation. Additionally, Global Compliance works with FLUs and control functions so that day-to-day activities operate in a compliant manner. For more information on FLUs and control functions, see Managing Risk on page 55.
The Corporation’s approach to the management of compliance risk is atfurther described in the coreGlobal Compliance Policy, which outlines the requirements of the Corporation’s culture and is a key component of risk management discipline.
The Global Compliance Framework, an addendum to our Risk Framework, details the high-level requirements of the global compliance program, in one comprehensive document. The Global Compliance Framework also clearlyand defines roles and responsibilities related to the implementation, execution and is supported by policies that articulate detailed requirements for implementation and executionmanagement of the global compliance program. As such,program by Global Compliance. The requirements work together to drive a comprehensive risk-based approach for the Global Compliance Framework is designed to support responsible, well-informedproactive identification, management and escalation of compliance risk management that incorporates an ongoing, disciplined approach to proactive planning, oversight, escalation and decision making acrossrisks throughout the Corporation.
The Global Compliance Framework also provides an outlinePolicy sets the requirements for seniorreporting compliance risk information to executive management andas well as the Board and/or appropriate Board-level committees such as the Audit Committee, to overseewith an outline for conducting objective oversight of the Corporation’s compliance risk management.management activities. The Board provides oversight of compliance risks through its Audit Committee.Committee and ERC.
Operational Risk Management
The Corporation defines operational risk as the risk of loss resulting from inadequate or failed internal processes, people and systems or from external events. Operational risk may occur anywhere in the Corporation, including outsourced business processes, and is not limited to operations functions. Its effects may extend beyond financial losses. Operational risk includes legal risk. Successful operational risk management is particularly important to diversified financial services companies because of the nature, volume and complexity of the financial services business. Operational risk is a significant component in the calculation of total risk-weighted assets used in the Basel 3 capital determination.estimate under the Advanced approaches. For more information on Basel 3 Advanced approaches, see Capital Management – Regulatory Capital ChangesAdvanced Approaches on page 68.61.
We approach operational risk management from two perspectives to manage operational risk within the structure of the Corporation: (1) at the enterprise level to provide independent, integrated management of operational risk across the organization, and (2) at the business and enterprise control function levels to address operational risk in revenue producing and non-revenue producing units. The Operational Risk Management Program addresses the overarching processes for
identifying, measuring, mitigating,monitoring and controlling monitoring, testing and reviewing operational risk, and reporting operational risk information to management and the Board. A sound internal governance structure enhances the effectiveness of the Corporation’s Operational Risk Management Program and is accomplished at the enterprise level through formal oversight by the Board, the ERC, the CRO and a variety of management committees and risk oversight groups aligned to the Corporation’s overall risk governance framework and practices. Of these, the Compliance and Operational Risk Committee (CORC)MRC oversees the Corporation’s policies and processes for sound operational risk management. The CORCMRC also serves as an escalation point for critical operational risk matters within the Corporation. The CORCMRC reports operational risk activities to the EnterpriseERC. The independent operational risk management teams oversee the businesses and control functions to monitor adherence to the Operational Risk Committee of the Board.Management Program and advise and challenge operational risk exposures.
Within the Global Risk Management organization, the Corporate Operational Risk team develops and guides the strategies, enterprise-wide policies, practices, controls and monitoring tools for assessing and managing operational risks across the organization and reports results to businesses, enterprise control functions, senior management, governance committees and the Board.
Corporate Audit provides independent assessmentERC and validation through testing of key processes and controls across the Corporation. An annual Audit Plan ensures that coverage activities address the significant aspects of the Corporation’s risk profile. Risk assessments incorporating operational risk are completed within the audit planning process.Board.
The businessbusinesses and enterprise control functions are responsible for assessing, monitoring and managing all the risks within their units, including operational risks. In addition to enterprise risk management tools such as loss reporting, scenario analysis and RCSAs, operational risk executives, working in conjunction with senior business executives, have developed key tools to help identify, measure, mitigatemonitor and monitorcontrol risk in each business and enterprise control function. Examples of these include personnel management practices; data reconciliation processes; fraud management units; cybersecurity controls, processes and systems; transaction processing, monitoring and analysis; business recovery planning; and new product introduction processes. The business and enterprise control functions are also responsible for consistently implementing and monitoring adherence to corporate practices.
Business and enterprise control function management uses the enterprise RCSA process to identifycapture the identification and
assessment of operational risk exposures and evaluate the status of risk and control issues including mitigation plans, as appropriate. The goals of this process are to assess changing market and business conditions, evaluate key risks impacting each business and enterprise control function, and assess the controls in place to mitigate the risks. Key operational risk indicators for these risks have been developed and are used to assist in identifying trends and issues on an enterprise, business and enterprise control function level. Independent review and challenge to the Corporation’s overall operational risk management framework is performed by the Corporate Operational Risk Validation Team.
Enterprise control functions have risk governanceProgram Adherence Team and control responsibilities for their enterprise programs (e.g., Global Technology and Operations Group, CFO Group, Global Marketing and Corporate Affairs, Global Human Resources). They provide insights on day-to-day risk activities throughout the Corporation by overseeing and managing the performance of their functions against Corporation-wide expectations. The enterprise control functions participate inreported through the operational risk governance committees and management process
in two ways. First, these organizations manage risk in their functional department. Second, they provide specialized risk management services (e.g., information management, vendor management) within their area of expertise to the enterprise, businesses and other enterprise control functions they support. These groups also work with business and risk executives to develop and guide appropriate strategies, policies, practices, controls and monitoring tools for each business and enterprise control function relative to these programs.routines.
Where appropriate, insurance policies are purchased to mitigate the impact of operational losses. These insurance policies are explicitly incorporated in the structural features of operational risk evaluation. As insurance recoveries, especially given recent market events, are subject to legal and financial uncertainty, the inclusion of these insurance policies is subject to reductions in their expected mitigating benefits.
Complex Accounting Estimates
Our significant accounting principles, as described in Note 1 – Summary of Significant Accounting Principles to the Consolidated Financial Statements, are essential in understanding the MD&A. Many of our significant accounting principles require complex judgments to estimate the values of assets and liabilities. We have procedures and processes in place to facilitate making these judgments.
The more judgmental estimates are summarized in the following discussion. We have identified and described the development of the variables most important in the estimation processes that involve mathematical models to derive the estimates. In many cases, there are numerous alternative judgments that could be used in the process of determining the inputs to the models. Where alternatives exist, we have used the factors that we believe represent the most reasonable value in developing the inputs. Actual performance that differs from our estimates of the key variables could impact our results of operations. Separate from the possible future impact to our results of operations from input and model variables, the value of our lending portfolio and market-sensitive assets and liabilities may change subsequent to the balance sheet date, often significantly, due to the nature and magnitude of future credit and market conditions. Such credit and market conditions may change quickly and in unforeseen ways and the resulting volatility could have a significant, negative effect on future operating results. These fluctuations would not be indicative of deficiencies in our models or inputs.
Allowance for Credit Losses
The allowance for credit losses, which includes the allowance for loan and lease losses and the reserve for unfunded lending commitments, represents management’s estimate of probable losses inherent in the Corporation’s loan portfolio excluding those loans accounted for under the fair value option. Our process for determining the allowance for credit losses is discussed in Note 1 – Summary of Significant Accounting Principles to the Consolidated Financial Statements. We evaluate our allowance at the portfolio segment level and our portfolio segments are Home Loans, Credit Card and Other Consumer, and Commercial. Due to the variability in the drivers of the assumptions used in this
process, estimates of the portfolio’s inherent risks and overall collectability change with changes in the economy, individual industries, countries, and borrowers’ ability and willingness to repay their obligations. The degree to which any particular
assumption affects the allowance for credit losses depends on the severity of the change and its relationship to the other assumptions.
Key judgments used in determining the allowance for credit losses include risk ratings for pools of commercial loans and leases, market and collateral values and discount rates for individually evaluated loans, product type classifications for consumer and commercial loans and leases, loss rates used for consumer and commercial loans and leases, adjustments made to address current events and conditions, considerations regarding domestic and global economic uncertainty, and overall credit conditions.
Our estimate for the allowance for loan and lease losses is sensitive to the loss rates and expected cash flows from our Home Loans and Credit Card and Other Consumer portfolio segments, as well as our U.S. small business commercial card portfolio within the Commercial portfolio segment. For each one percent increase in the loss rates on loans collectively evaluated for impairment in our Home Loans portfolio segment, excluding PCI loans, coupled with a one percent decrease in the discounted cash flows on those loans individually evaluated for impairment within this portfolio segment, the allowance for loan and lease losses at December 31, 20132014 would have increased by $127$84 million. PCI loans within our Home Loans portfolio segment are initially recorded at fair value. Applicable accounting guidance prohibits carry-over or creation of valuation allowances in the initial accounting. However, subsequent decreases in the expected cash flows from the date of acquisition result in a charge to the provision for credit losses and a corresponding increase to the allowance for loan and lease losses. We subject our PCI portfolio to stress scenarios to evaluate the potential impact given certain events. A one percent decrease in the expected cash flows could result in a $205$169 million impairment of the portfolio. For each one percent increase in the loss rates on loans collectively evaluated for impairment within our Credit Card and Other Consumer portfolio segment and U.S. small business commercial card portfolio, coupled with a one percent decrease in the expected cash flows on those loans individually evaluated for impairment within the Credit Card and Other Consumer portfolio segment and the U.S. small business commercial card portfolio, the allowance for loan and lease losses at December 31, 20132014 would have increased by $59$45 million.
Our allowance for loan and lease losses is sensitive to the risk ratings assigned to loans and leases within the Commercial portfolio segment (excluding the U.S. small business commercial card portfolio). Assuming a downgrade of one level in the internal risk ratings for commercial loans and leases, except loans and leases already risk-rated Doubtful as defined by regulatory authorities, the allowance for loan and lease losses would have increased by $2.2$2.0 billion at December 31, 20132014.
The allowance for loan and lease losses as a percentage of total loans and leases at December 31, 20132014 was 1.901.65 percent and these hypothetical increases in the allowance would raise the ratio to 2.181.90 percent.
These sensitivity analyses do not represent management’s expectations of the deterioration in risk ratings or the increases
in loss rates but are provided as hypothetical scenarios to assess the sensitivity of the allowance for loan and lease losses to changes in key inputs. We believe the risk ratings and loss
severities currently in use are appropriate and that the probability of the alternative scenarios outlined above occurring within a short period of time is remote.
The process of determining the level of the allowance for credit losses requires a high degree of judgment. It is possible that others, given the same information, may at any point in time reach different reasonable conclusions.
For a discussion ofmore information on the Financial Accounting Standards Board’s proposed standard on accounting for credit losses, see Note 1 – Summary of Significant Accounting Principles to the Consolidated Financial Statements.
Mortgage Servicing Rights
MSRs are nonfinancial assets that are created when a mortgage loan is sold and we retain the right to service the loan. We account for consumer MSRs, including residential mortgage and home equity MSRs, at fair value with changes in fair value recorded in mortgage banking income (loss) in the Consolidated Statement of Income.
We determine the fair value of our consumer MSRs using a valuation model that calculates the present value of estimated future net servicing income. The model incorporates key economic assumptions including estimates of prepayment rates and resultant weighted-average lives of the MSRs, and the option-adjusted spread levels. These variables can, and generally do, change from quarter to quarter as market conditions and projected interest rates change. These assumptions are subjective in nature and changes in these assumptions could materially affect our operating results. For example, increasing the prepayment rate assumption used in the valuation of our consumer MSRs by 10 percent while keeping all other assumptions unchanged could have resulted in an estimated decrease of $244$208 million in both MSRs and mortgage banking income (loss) for 20132014. This impact does not reflect any hedge strategies that may be undertaken to mitigate such risk.
We manage potential changes in the fair value of MSRs through a comprehensive risk management program. The intent is to mitigate the effects of changes in the fair value of MSRs through the use of risk management instruments. To reduce the sensitivity of earnings to interest rate and market value fluctuations, securities including MBS and U.S. Treasuries,Treasury securities, as well as certain derivatives such as options and interest rate swaps, may be used to hedge certain market risks of the MSRs, but are not designated as accounting hedges. These instruments are carried at fair value with changes in fair value recognized in mortgage banking income (loss).income. For additional information, see Mortgage Banking Risk Management on page 116108.
For more information on MSRs, including the sensitivity of weighted-average lives and the fair value of MSRs to changes in modeled assumptions, see Note 23 – Mortgage Servicing Rights to the Consolidated Financial Statements.
Fair Value of Financial Instruments
We classify the fair values of financial instruments based on the fair value hierarchy established under applicable accounting guidance which requires an entity to maximize the use of observable inputs and minimize the use of unobservable inputs when measuring fair value. Applicable accounting guidance establishes three levels of inputs used to measure fair value. We carry trading account assets and liabilities, derivative assets and liabilities, AFS debt and equity securities, other debt securities, carried at fair value, certain
consumer MSRs and certain other assets at fair value. Also, we account for certain loans and loan commitments, LHFS, short-term borrowings, securities financing agreements, asset-backed secured financings, long-term deposits and long-term debt under the fair value option. For additional information, see Note 20 – Fair Value Measurements and Note 21 – Fair Value Optionto the Consolidated Financial Statements.
The fair values of assets and liabilities may include adjustments, such as market liquidity and credit quality, where appropriate. Valuations of products using models or other techniques are sensitive to assumptions used for the significant inputs. Where market data is available, the inputs used for valuation reflect that information as of our valuation date. Inputs to valuation models are considered unobservable if they are supported by little or no market activity. In periods of extreme volatility, lessened liquidity or in illiquid markets, there may be more variability in market pricing or a lack of market data to use in the valuation process. In keeping with the prudent application of estimates and management judgment in determining the fair value of assets and liabilities, we have in place various processes and controls that include: a model validation policy that requires review and approval of quantitative models used for deal pricing, financial statement fair value determination and risk quantification; a trading product valuation policy that requires verification of all traded product valuations; and a periodic review and substantiation of daily profit and loss reporting for all traded products. Primarily through validation controls, we utilize both broker and pricing service inputs which can and do include both market-observable and internally-modeled values and/or valuation inputs. Our reliance on this information is temperedaffected by the knowledgeour understanding of how the broker and/or pricing service develops its data with a higher degree of reliance applied to those that are more directly observable and lesser reliance applied to those
developed through their own internal modeling. Similarly, broker quotes that are executable are given a higher level of reliance than indicative broker quotes, which are not executable. These processes and controls are performed independently of the business.
Trading account assets and liabilities are carried at fair value based primarily on actively traded markets where prices are based on either direct market quotes or observed transactions. Liquidity is a significant factor in the determination of the fair values of trading account assets and liabilities. Market price quotes may
not be readily available for some positions, or positions within a market sector where trading activity has slowed significantly or ceased. Situations of illiquidity generally are triggered by the market’s perception of credit uncertainty regarding a single company or a specific market sector. In these instances, fair value is determined based on limited available market For additional information, and other factors, principally from reviewing the issuer’s financial statements and changes in credit ratings made by one or more rating agencies.
Trading account profits, which represent the net amount earned from our trading positions, can be volatile and are largely driven by general market conditions and customer demand. Trading account profits are dependent on the volume and type of transactions, the level of risk assumed, and the volatility of price and rate movements at any given time within the ever-changing market environment. To evaluate risk in our trading activities, we focus on the actual and potential volatility of individual positions as well as portfolios. At a portfolio and corporate level, we use trading limits, stress testing and tools such as VaR modeling, which estimates a potential daily loss that we do not expect to exceed with a specified confidence level, to measure and manage market risk. For more information on VaR, see Trading Risk ManagementNote 20 – Fair Value Measurements on pageand 109Note 21 – Fair Value Optionto the Consolidated Financial Statements.
The fair valuesIn 2014, we adopted an FVA into valuation estimates primarily to include funding costs on uncollateralized derivatives and derivatives where we are not permitted to use the collateral received. This change resulted in a pretax net FVA charge of derivative assets$497 million. Significant judgment is required in modeling expected exposure profiles and liabilities traded in discounting for the OTC market are determined using quantitative models that utilize multiple market inputs including interest rates, prices and indices to generate continuous yield or pricing curves and volatility factors to value the position. The majority of market inputs are actively quoted and can be validated through external sources, including brokers, market transactions and third-party pricing services. Estimationfunding risk is greater for derivative asset and liability positions that are either option-based or have longer maturity dates where observable market inputs are less readily available, or are unobservable,premium inherent in which case, quantitative-based extrapolations of rate, price or index scenarios are used in determining fair values. The fair values of derivative assets and liabilities include adjustments for market liquidity, counterparty credit quality and other instrument-specific factors, where appropriate. In addition, the Corporation incorporates within its fair value measurements of OTC derivatives a valuation adjustment to reflect the credit risk associated with the net position. Positions are netted by counterparty, and fair value for net long exposures is adjusted for counterparty credit risk while the fair value for net short exposures is adjusted for our own credit risk. An estimate of severity of loss is also used in the determination of fair value, primarily based on market data. We do not incorporate a funding valuation or funding benefit adjustment (collectively, FVA) into the fair value of our uncollateralizedthese derivatives. There is diversity in industry practice regarding FVA and such views continue to evolve. We continue to evaluate FVA as it relates to our valuation methodologies used to comply with applicable fair value accounting guidance.
Level 3 Assets and Liabilities
Financial assets and liabilities where values are based on valuation techniques that require inputs that are both unobservable and are significant to the overall fair value measurement are classified as Level 3 under the fair value hierarchy established in applicable accounting guidance. The Level 3 financial assets and liabilities include certain loans, MBS, ABS,
CDOs, CLOs and structured liabilities, as well as highly structured, complex or long-dated derivative contracts, private equity investments and consumer MSRs. The fair value of these Level 3 financial assets and liabilities is determined using pricing models, discounted cash flow methodologies or similar techniques for which the determination of fair value requires significant management judgment or estimation.
| | | | | | | | | | | | | | | | | | | | | | | | | | | |
| Table 71 | Level 3 Asset and Liability Summary | | | | | | | | | | | | |
| Table 66 | | Recurring Level 3 Asset and Liability Summary | | | | | | | | | | |
| | | | | | | | | | | | | | | | | | | | | | | | | |
| | | December 31 | | December 31 |
| | | 2013 | | 2012 | | 2014 | | 2013 |
| (Dollars in millions) | (Dollars in millions) | Level 3 Fair Value | | As a %
of Total
Level 3 Assets | | As a %
of Total Assets | | Level 3 Fair Value | | As a %
of Total
Level 3 Assets | | As a %
of Total Assets | (Dollars in millions) | Level 3 Fair Value | | As a %
of Total
Level 3 Assets | | As a %
of Total Assets | | Level 3 Fair Value | | As a %
of Total
Level 3 Assets | | As a %
of Total Assets |
| Trading account assets | Trading account assets | $ | 9,044 |
| | 28.46 | % | | 0.43 | % | | $ | 9,559 |
| | 26.13 | % | | 0.43 | % | Trading account assets | $ | 6,259 |
| | 28.12 | % | | 0.30 | % | | $ | 9,044 |
| | 28.46 | % | | 0.43 | % |
| Derivative assets | Derivative assets | 7,277 |
| | 22.90 |
| | 0.35 |
| | 8,073 |
| | 22.06 |
| | 0.37 |
| Derivative assets | 6,851 |
| | 30.77 |
| | 0.33 |
| | 7,277 |
| | 22.90 |
| | 0.35 |
|
| AFS debt securities | AFS debt securities | 4,760 |
| | 14.98 |
| | 0.23 |
| | 5,091 |
| | 13.91 |
| | 0.23 |
| AFS debt securities | 2,555 |
| | 11.48 |
| | 0.12 |
| | 4,760 |
| | 14.98 |
| | 0.23 |
|
| All other Level 3 assets at fair value | All other Level 3 assets at fair value | 10,697 |
| | 33.66 |
| | 0.50 |
| | 13,865 |
| | 37.90 |
| | 0.63 |
| All other Level 3 assets at fair value | 6,597 |
| | 29.63 |
| | 0.31 |
| | 10,697 |
| | 33.66 |
| | 0.50 |
|
Total Level 3 assets at fair value (1) | Total Level 3 assets at fair value (1) | $ | 31,778 |
| | 100.00 | % | | 1.51 | % | | $ | 36,588 |
| | 100.00 | % | | 1.66 | % | Total Level 3 assets at fair value (1) | $ | 22,262 |
| | 100.00 | % | | 1.06 | % | | $ | 31,778 |
| | 100.00 | % | | 1.51 | % |
| | | Level 3 Fair Value | | As a %
of Total
Level 3 Liabilities | | As a %
of Total Liabilities | | Level 3 Fair Value | | As a %
of Total
Level 3 Liabilities | | As a %
of Total Liabilities | | | | | | | | | | | | |
| | | | Level 3 Fair Value | | As a %
of Total
Level 3 Liabilities | | As a %
of Total Liabilities | | Level 3 Fair Value | | As a %
of Total
Level 3 Liabilities | | As a %
of Total Liabilities |
| Derivative liabilities | Derivative liabilities | $ | 7,301 |
| | 78.20 | % | | 0.39 | % | | $ | 6,605 |
| | 73.51 | % | | 0.33 | % | Derivative liabilities | $ | 7,771 |
| | 76.34 | % | | 0.42 | % | | $ | 7,501 |
| | 78.66 | % | | 0.40 | % |
| Long-term debt | Long-term debt | 1,990 |
| | 21.32 |
| | 0.11 |
| | 2,301 |
| | 25.61 |
| | 0.12 |
| Long-term debt | 2,362 |
| | 23.20 |
| | 0.13 |
| | 1,990 |
| | 20.87 |
| | 0.11 |
|
| All other Level 3 liabilities at fair value | All other Level 3 liabilities at fair value | 45 |
| | 0.48 |
| | — |
| | 79 |
| | 0.88 |
| | 0.01 |
| All other Level 3 liabilities at fair value | 46 |
| | 0.46 |
| | — |
| | 45 |
| | 0.47 |
| | — |
|
Total Level 3 liabilities at fair value (1) | Total Level 3 liabilities at fair value (1) | $ | 9,336 |
| | 100.00 | % | | 0.50 | % | | $ | 8,985 |
| | 100.00 | % | | 0.46 | % | Total Level 3 liabilities at fair value (1) | $ | 10,179 |
| | 100.00 | % | | 0.55 | % | | $ | 9,536 |
| | 100.00 | % | | 0.51 | % |
| |
(1) | Level 3 total assets and liabilities are shown before the impact of cash collateral and counterparty netting related to our derivative positions. |
During 2013, we recognized net gains of $2.0 billion on Level 3 assets and liabilities. The net gains were primarily gains on MSRs and trading account assets, partially offset by losses on net derivative assets and other assets. Gains on MSRs were primarily due to the impact of the increase in interest rates on forecasted prepayments. Gains on trading account assets were primarily due to realized gains on the sale of corporate bonds as well as distributions received on secondary loan positions held in inventory, partially offset by unrealized losses on certain collateralized loan and debt obligations. Losses on net derivative assets were driven by unrealized losses associated with certain structured products and credit default and total return swaps, partially offset by unrealized gains associated with the performance of various index option contracts as well as gains on IRLCs. Losses on other assets were primarily due to a write-down of a receivable. There were net unrealized gains of $40 million (pre-tax) in accumulated OCI on Level 3 assets and liabilities at December 31, 2013. For more information on the components of net realized and unrealized gains and losses during 2013, see Note 20 – Fair Value Measurementsto the Consolidated Financial Statements.
Level 3 financial instruments such as our consumer MSRs, may be hedged with derivatives classified as Level 1 or 2; therefore, gains or losses associated with Level 3 financial instruments may be offset by gains or losses associated with financial instruments classified in other levels of the fair value hierarchy. The Level 3 gains and losses recorded in earnings did not have a significant impact on our liquidity or capital resources.
We conduct a review of our fair value hierarchy
classifications on a quarterly basis. Transfers into or out of Level 3 are made if the significant inputs used in the financial models measuring the fair values of the assets and liabilities became unobservable or
observable, respectively, in the current marketplace. These transfers are considered to be effective as of the beginning of the quarter in which they occur. For more information on the significant transfers into and out of Level 3
during 20132014, see Note 20 – Fair Value Measurements to the Consolidated Financial Statements.
Accrued Income Taxes and Deferred Tax Assets
Accrued income taxes, reported as a component of either other assets or accrued expenses and other liabilities on the Consolidated Balance Sheet, represent the net amount of current income taxes we expect to pay to or receive from various taxing jurisdictions attributable to our operations to date. We currently file income tax returns in more than 100 jurisdictions and consider many factors, including statutory, judicial and regulatory guidance, in estimating the appropriate accrued income taxes for each jurisdiction.
Consistent with the applicable accounting guidance, we monitor relevant tax authorities and change our estimate of accrued income taxes due to changes in income tax laws and their interpretation by the courts and regulatory authorities. These revisions of our estimate of accrued income taxes, which also may result from our income tax planning and from the resolution of income tax controversies, may be material to our operating results for any given period.
Net deferred tax assets, reported as a component of other assets on the Consolidated Balance Sheet, represent the net decrease in taxes expected to be paid in the future because of net operating loss (NOL) and tax credit carryforwards and because of future reversals of temporary differences in the bases of assets and liabilities as measured by tax laws and their bases as reported in the financial statements. NOL and tax credit carryforwards result in reductions to future tax liabilities, and many of these attributes can expire if not utilized within certain periods. We consider the
need for valuation allowances to reduce net deferred tax assets to the amounts that we estimate are more-likely-than-not to be realized.
While we have established some valuation allowances for certain state and non-U.S. deferred tax assets, we have concluded that no valuation allowance was necessary with respect to all U.S. federal and U.K. deferred tax assets, including NOL and tax credit carryforwards, that are not subject to any special limitations (such as change-in-control limitations) prior to any expiration. Management’s conclusion is supported by recent financial results and forecasts, the reorganization of certain business activities and the indefinite period to carry forward NOLs. The majority of our U.K. net deferred tax assets, which consist primarily of NOLs, are expected to be realized by certain subsidiaries over an extended number of years. However, significant changes to our estimates, such as changes that would be caused by substantial and prolonged worsening of the condition of Europe’s capital markets, or to applicable tax laws, such as laws affecting the realizability of NOLs or other deferred tax assets, could lead management to reassess its U.K. valuation allowance conclusions. See Note 19 – Income Taxes to the Consolidated Financial Statements for a table of significant tax attributes and additional information. For more information, see page 15 under Item 1A. Risk Factors of this Annual Report on Form 10-K.
Goodwill and Intangible Assets
Background
The nature of and accounting for goodwill and intangible assets are discussed in Note 1 – Summary of Significant Accounting Principles and Note 8 – Goodwill and Intangible Assets to the Consolidated Financial Statements. Goodwill is reviewed for potential impairment at the reporting unit level on an annual basis, which for the Corporation is as of June 30, and in interim periods if events or circumstances indicate a potential impairment. A reporting unit is an operating segment or one level below. As reporting units are determined after an acquisition or evolve with changes in business strategy, goodwill is assigned to reporting units and it no longer retains its association with a particular acquisition. All of the revenue streams and related activities of a reporting unit, whether acquired or organic, are available to support the value of the goodwill.
Effective January 1, 2013, on a prospective basis, the Corporation adjusted the amount of capital being allocated to the business segments. The adjustment reflects a refinement to the prior-year methodology (economic capital), which focused solely on internal risk-based economic capital models. The refined methodology (allocated capital) now also considers the effect of regulatory capital requirements in addition to internal risk-based economic capital models. For purposes of goodwill impairment testing, we utilizedthe Corporation utilizes allocated equity as a proxy for the carrying value of ourits reporting units. Allocated equity in the reporting units is comprised of allocated capital plus capital for the portion of goodwill and intangibles specifically assigned to the reporting unit. The goodwill impairment test involves comparing the fair value of each reporting unit with its carrying value, including goodwill, as measured by allocated equity. During 2014, the Corporation made refinements to the amount of capital allocated to each of its businesses based on multiple considerations that included, but were not limited to, risk-weighted assets measured under the Basel 3 Standardized and Advanced approaches, business segment exposures and risk profile, and strategic plans. As a result of this process, in 2014, the Corporation adjusted the amount of capital being allocated to its business segments. This change resulted in a reduction of the unallocated capital, which is reflected in All Other, and an aggregate increase to the amount of capital being allocated to the business segments. An increase in allocated capital in the business segments generally results in a reduction of the excess of the fair value over the carrying value and a reduction to the estimated fair value as a percentage of allocated carrying value for an individual reporting unit.
The Corporation’s common stock price improved during 2013;2014; however, ourits market capitalization remained below ourits recorded book value. We estimate that the fair value of all reporting units with assigned goodwill in aggregate as of the June 30, 20132014 annual goodwill impairment test was $290.9$307.1 billion and the aggregate carrying value of all reporting units with assigned goodwill, as measured by allocated equity, was $163.5$175.7 billion. The common stock market capitalization of the Corporation as of June 30, 20132014 was $138.2161.6 billion ($164.9188.1 billion at December 31, 20132014). As none of our reporting units are publicly traded, individual reporting unit fair value determinations do not directly correlate to the
Corporation’s stock price. Although we believe it is reasonable to conclude that market capitalization could be an indicator of fair value over time, we do not believe that our current market capitalization reflects the aggregate fair value of our individual reporting units.
Estimating the fair value of reporting units is a subjective process that involves the use of estimates and judgments, particularly related to cash flows, the appropriate discount rates and an applicable control premium. We determined the fair values of the reporting units using a combination of valuation techniques consistent with the market approach and the income approach and also utilized independent valuation specialists.
The market approach we used estimates the fair value of the individual reporting units by incorporating any combination of the tangible capital, book capital and earnings multiples from comparable publicly-traded companies in industries similar to that of the reporting unit. The relative weight assigned to these multiples varies among the reporting units based on qualitative and quantitative characteristics, primarily the size and relative profitability of the reporting unit as compared to the comparable publicly-traded companies. Since the fair values determined under the market approach are representative of a noncontrolling interest, we added a control premium to arrive at the reporting units’ estimated fair values on a controlling basis.
For purposes of the income approach, we calculated discounted cash flows by taking the net present value of estimated future cash flows and an appropriate terminal value. Our discounted cash flow analysis employs a capital asset pricing model in estimating the discount rate (i.e., cost of equity financing) for each reporting unit. The inputs to this model include the risk-free rate of return, beta, which is a measure of the level of non-diversifiable risk associated with comparable companies for each specific reporting unit, size premium to reflect the historical incremental return on stocks, market equity risk premium and in certain cases an unsystematic (company-specific) risk factor. The unsystematic risk factor is the input that specifically addresses uncertainty related to our projections of earnings and growth, including the uncertainty related to loss expectations. We utilized discount rates that we believe adequately reflect the risk and uncertainty in the financial markets generally and specifically in our internally developed forecasts. We estimated expected rates of equity returns based on historical market returns and risk/return rates for similar industries of each reporting unit. We use our internal forecasts to estimate future cash flows and actual results may differ from forecasted results.
In 2013, the consumer DFS business, including $1.7 billion of goodwill, was moved from Global Banking to CBB in order to align this business more closely with our consumer lending activity and better serve the needs of our customers. In 2012, the International Wealth Management businesses within GWIM, including $230 million of goodwill, were moved to All Other in connection with our agreement to sell these businesses in a series of transactions. Certain of the sales transactions were completed in 2013 and most of the remaining sales transactions are expected to close over the next year. Prior periods were reclassified to conform to current period presentation.
20132014 Annual Impairment Test
During the three months ended September 30, 2013,2014, we completed our annual goodwill impairment test as of June 30, 20132014 for all of our reporting units that had goodwill. In performing the first step of the annual goodwill impairment analysis, we
compared the fair value of each reporting unit to its estimated carrying value as measured by allocated equity, which includes goodwill. During our 20132014 annual goodwill impairment test, we also evaluated the U.K. Card business which is a reporting unit, within All Other, as the U.K. Card business comprises the majority of the goodwill included in All Other. To determine fair value, we utilized a combination of the market approach and the income approach. Under the market approach, we compared earnings and equity multiples of the individual reporting units to multiples of public companies comparable to the individual reporting units. The control premium used in the June 30, 20132014 annual goodwill impairment test was 3530 percent for all reporting units. Under the income approach, we updated our assumptions to reflect the current market environment. The discount rates used in the June 30, 20132014 annual goodwill impairment test ranged from 1110.5 percent to 1413 percent depending on the relative risk of a reporting unit. Growth rates
developed by management for individual revenue and expense items in each reporting unit ranged from (5.4)(2.9) percent to 11.48.5 percent.
Based on the results of step one of the annual goodwill impairment test, we determined that step two was not required for any of the reporting units as their fair value exceeded their carrying value indicating there was no impairment.
As described above, during the three months ended June 30, 2013, the consumer DFS business was moved from Global Banking to CBB and subsequently constitutes a new separate reporting unit. The goodwill allocated to this reporting unit was reviewed for impairment as part of the goodwill testing process. Based on the results of step one of the annual goodwill impairment test, we determined that the fair value of the reporting unit exceeded its carrying value. Although not required, given the recent move and the results of step one, and to further substantiate the value of goodwill, we performed step two of the goodwill impairment test for this reporting unit. The fair value for Card Services as of June 30, 2014 no longer considers the reporting unit was estimated based on the income approach. Significant assumptions for the valuationnegative impact of consumer DFS under the income approach included cash flow estimates, including expected new account growth, the discount rate and the terminal value. In performing step two, significant assumptions used in measuring the fair value of the assets and liabilities of the reporting unit included discount rates, loss rates and interest rates. The results of step two further supported that the goodwill for the consumer DFS reporting unit was not impaired.
Ona July 31, 2013 the U.S. District Court for the District of Columbia issued acourt ruling regarding the Federal Reserve’s rules implementing the Financial Reform Act’s Durbin Amendment. The ruling requireson debit card interchange fees, which would have required the Federal Reserve to reconsider the $0.21 per transaction cap on debit card interchange fees. The Federal Reserve is appealing the ruling and final resolution is expected in the first half of 2014. In performing the annual goodwill impairment test for Card Services within CBB, we considered the impact of the recent ruling in determining the fair value as of June 30, 2013 considered that potential negative impact contributing to an estimated fair value as a percent of allocated carrying value of 120.3 percent. The U.S. Supreme Court indicated in January 2015 that it would not hear the reporting unit and, assuming the range initially included inchallenge to the Federal Reserve’s rule is used for forecasting interchange fees, no goodwill impairment would result. If the Federal Reserve, upon final resolution, implements a lower per transaction cap than the initial range, it may have a significant adverse impact on our debit card interchange fee revenue and the associated goodwill allocated to the Card Services reporting unit.
rules.20122013 Annual Impairment Tests
During the three months ended September 30, 2012,2013, we completed our annual goodwill impairment test as of June 30, 20122013 for all of our reporting units which had goodwill. Additionally, we also evaluated the U.K. Card business within All Other as the U.K. Card business comprises the majority of the goodwill included in All Other.
Based on the results of step one of the annual goodwill impairment test, we determined that step two was not required for any of the reporting units as their respective fair values exceeded their carrying values indicating there was no impairment.
Representations and Warranties Liability
The methodology used to estimate the liability for obligations under representations and warranties related to transfers of residential mortgage loans is a function of the representations and warranties given and considers a variety of factors. Depending upon the counterparty, these factors include actual defaults, estimated future defaults, historical loss experience, estimated home prices, other economic conditions, estimated probability that we will receive a repurchase request, including consideration of whether presentation thresholds will be met, number of payments made by the borrower prior to default and estimated probability that we will be required to repurchase a loan. It also considers other relevant facts and circumstances, such as bulk settlements and identity of the counterparty or type of counterparty, as appropriate. The estimate of the liability for obligations under representations and warranties is based upon currently available information, significant judgment, and a number of factors, including those set forth above, that are subject to change. Changes to any one of these factors could significantly impact the estimate of our liability.
The representations and warranties provision may vary significantly each period as the methodology used to estimate the expense continues to be refined based on the level and type of repurchase requests presented, defects identified, the latest experience gained on repurchase requests and other relevant facts and circumstances. The estimate of the liability for representations and warranties is sensitive to future defaults, loss severity and the net repurchase rate. An assumed simultaneous increase or decrease of 10 percent in estimated future defaults, loss severity and the net repurchase rate would result in an increase or decrease of approximately $550400 million in the representations and warranties liability as of December 31, 20132014. These sensitivities are hypothetical and are intended to provide an indication of the
impact of a significant change in these key assumptions on the representations and warranties liability. In reality, changes in one assumption may result in changes in other assumptions, which may or may not counteract the sensitivity.
For more information on representations and warranties exposure and the corresponding estimated range of possible loss, see Off-Balance Sheet Arrangements and Contractual Obligations – Representations and Warranties on page 5250, as well as Note 7 – Representations and Warranties Obligations and Corporate Guarantees and Note 12 – Commitments and Contingencies to the Consolidated Financial Statements.
Litigation Reserve
In accordance with applicable accounting guidance, the Corporation establishes an accrued liability for litigation and regulatory matters when those matters present loss contingencies that are both probable and estimable. In such cases, there may be an exposure to loss in excess of any amounts accrued. When a loss contingency is not both probable and estimable, the Corporation does not establish an accrued liability. As a litigation or regulatory matter develops, the Corporation, in conjunction with any outside counsel handling the matter, evaluates on an ongoing basis whether such matter presents a loss contingency that is both probable and estimable. If, at the time of evaluation, the loss contingency related to a litigation or regulatory matter is not both probable and estimable, the matter will continue to be monitored for further developments that would make such loss contingency both probable and estimable. Once the loss contingency related to a litigation or regulatory matter is deemed to be both probable and estimable, the Corporation will establish an accrued liability with respect to such loss contingency and record a corresponding amount of litigation-related expense. The Corporation will continue to monitor the matter for further developments that could affect the amount of the accrued liability that has been previously established.
For a limited number of the matters disclosed in Note 12 – Commitments and Contingencies to the Consolidated Financial Statements for which a loss is probable or reasonably possible in future periods, whether in excess of a related accrued liability or where there is no accrued liability, we are able to estimate a range of possible loss. In determining whether it is possible to provide an estimate of loss or range of possible loss, the Corporation reviews and evaluates its material litigation and regulatory matters on an ongoing basis, in conjunction with any outside counsel handling the matter, in light of potentially relevant factual and legal developments. These may include information learned through the discovery process, rulings on dispositive motions, settlement discussions, and other rulings by courts, arbitrators or others. In cases in which the Corporation possesses sufficient information to develop an estimate of loss or range of possible loss, that estimate is aggregated and disclosed in Note 12 – Commitments and Contingencies to the Consolidated Financial Statements. For other disclosed matters for which a loss is probable or reasonably possible, such an estimate is not possible. Those matters for which an estimate is not possible are not included within this estimated range. Therefore, the estimated range of possible loss represents what we believe to be an estimate of possible loss only for certain matters meeting these criteria. It does not represent the Corporation’s maximum loss exposure. Information is provided in Note 12 – Commitments and Contingencies to the Consolidated Financial Statements regarding the nature of all of these contingencies and, where specified, the amount of the claim associated with these loss contingencies.
Consolidation and Accounting for Variable Interest Entities
In accordance with applicable accounting guidance, an entity that has a controlling financial interest in a VIE is referred to as the primary beneficiary and consolidates the VIE. The Corporation is deemed to have a controlling financial interest and is the primary beneficiary of a VIE if it has both the power to direct the activities of the VIE that most significantly impact the VIE’s economic performance and an obligation to absorb losses or the right to receive benefits that could potentially be significant to the VIE.
Determining whether an entity has a controlling financial interest in a VIE requires significant judgment. An entity must assess the purpose and design of the VIE, including explicit and implicit contractual arrangements, and the entity’s involvement in both the design of the VIE and its ongoing activities. The entity must then determine which activities have the most significant impact on the economic performance of the VIE and whether the entity has the power to direct such activities. For VIEs that hold financial assets, the party that services the assets or makes
investment management decisions may have the power to direct the most significant activities of a VIE. Alternatively, a third party that has the unilateral right to replace the servicer or investment manager or to liquidate the VIE may be deemed to be the party with power. If there are no significant ongoing activities, the party that was responsible for the design of the VIE may be deemed to have power. If the entity determines that it has the power to direct the most significant activities of the VIE, then the entity must determine if it has either an obligation to absorb losses or the right to receive benefits that could potentially be significant to the VIE. Such economic interests may include investments in debt or equity instruments issued by the VIE, liquidity commitments, and explicit and implicit guarantees.
On a quarterly basis, we reassess whether we have a controlling financial interest and are the primary beneficiary of a VIE. The quarterly reassessment process considers whether we have acquired or divested the power to direct the activities of the VIE through changes in governing documents or other circumstances. The reassessment also considers whether we have acquired or disposed of a financial interest that could be significant to the VIE, or whether an interest in the VIE has become significant or is no longer significant. The consolidation status of the VIEs with which we are involved may change as a result of such reassessments. Changes in consolidation status are applied prospectively, with assets and liabilities of a newly consolidated VIE initially recorded at fair value. A gain or loss may be recognized upon deconsolidation of a VIE depending on the carrying values of deconsolidated assets and liabilities compared to the fair value of retained interests and ongoing contractual arrangements.
20122013 Compared to 20112012
The following discussion and analysis provide a comparison of our results of operations for 20122013 and 20112012. This discussion should be read in conjunction with the Consolidated Financial Statements and related Notes. Tables 7 and 8 contain financial data to supplement this discussion.
Overview
Net Income
Net income was $11.4 billion in 2013 compared to $4.2 billion in 2012 compared to $1.4 billion in 2011. Including preferred stock dividends, net income applicable to common shareholders was $10.1 billion, or $0.90 per diluted share for 2013 and $2.8 billion, or $0.25 per diluted share for 2012 and $85 million, or $0.01 per diluted share for 20112012.
Net Interest Income
Net interest income on aan FTE basis was $41.643.1 billion for 20122013, a decreasean increase of $4.0$1.6 billion compared to 20112012. The declineincrease was primarily due to reductions in long-term debt balances, higher yields on debt securities including the impact of market-related premium amortization expense, lower rates paid on deposits, higher commercial loan balances and increased trading-related net interest income, partially offset by lower consumer loan balances as well as lower asset yields and yields, recouponing of the ALM portfolio to a lower yield and decreased commercial loan yields. Lower trading-related net interest income also negatively impacted 2012 results. These decreases were partially offset by ongoing reductions in long-term debt and lower rates paid on deposits.low rate environment. The net interest yield on aan FTE basis was 2.352.37 percent for 20122013, a decreasean increase of 13 bps compared to 20112012 as the yield continued to be under pressure due to the aforementioned items and the low rate environment.same factors as described above.
Noninterest Income
Noninterest income was $42.746.7 billion in 20122013, a decreasean increase of $6.24.0 billion compared to 20112012.
| |
| Ÿ | Card income decreased $1.1 billion$295 million primarily driven by the implementation of interchange fee rules under the Durbin Amendment, which became effective on October 1, 2011. |
| |
Ÿ | Service charges decreased $494 million primarily due to the impact of lower accretion on acquired portfolios and reduced reimbursed merchant processing fees.revenue from consumer protection products. |
| |
| Ÿ | Investment and brokerage services income decreased $433increased $889 million primarily driven by lower transactional volumes.the impact of long-term AUM inflows and higher market levels. |
| |
| Ÿ | Investment banking income increased $827 million primarily due to strong equity issuance fees attributable to a significant increase in global equity capital markets volume and higher debt issuance fees, primarily within leveraged finance and investment-grade underwriting. |
| |
| Ÿ | Equity investment income decreased $5.3 billion.increased $831 million. The results for 2013 included $753 million of gains related to the sale of our remaining investment in CCB and gains of $1.4 billion on the sales of a portion of an equity investment. The results for 2012 included $1.6 billion of gains which primarily related to the sales of certain equity and strategic investments. The results for 2011 included $6.5 billion of gains on the sale of CCB shares, $836 million of CCB dividends and a $377 million gain on the sale of our investment in BlackRock, Inc., partially offset by $1.1 billion of impairment charges on our merchant services joint venture. |
| |
| Ÿ | Trading account profits decreased $827 million.increased $1.2 billion. Net DVAdebit valuation adjustment (DVA) losses on derivatives were $509 million in 2013 compared to losses of $2.5 billion in 2012 compared to net DVA gains of $1.0 billion in 2011.2012. Excluding net DVA, trading account profits increased $2.7 billion in 2012 compared to 2011decreased $782 million due to decreases in our FICC businesses driven by a challenging trading environment, partially offset by an improved market environment.increase in our equities businesses. |
| |
| Ÿ | Mortgage banking income increased $13.6 billiondecreased $876 million primarily due to an $11.7 billion decrease in thedriven by lower servicing income and lower core production revenue, partially offset by lower representations and warranties provision. The 2012 results included $2.5 billion in provision related to the FNMA Settlement, a $500 million provision for obligations to FNMA related to MI rescissions, partially offset by an increase in servicing income of $1.1 billion due to improved MSR results. The 2011 results included $15.6 |
billion in representations and warranties provision related to the agreement to resolve nearly all legacy Countrywide-issued first-lien non-GSE RMBS repurchase exposures and other non-GSE exposures.
| |
| Ÿ | Other income decreased $10.2(loss) improved $2.0 billion due to lower negative fair value adjustments on our structured liabilities of $5.1 billion$649 million compared to positivenegative fair value adjustments of $3.3$5.1 billion in 2011. In addition, 20122012. The prior year included gains of $1.6 billion of gains related to debt repurchases and exchanges of trust preferred securities compared to gains of $1.2 billion in the prior year.securities. |
Provision for Credit Losses
The provision for credit losses was $8.23.6 billion for 20122013, a decrease of $5.24.6 billion compared to 20112012. The provision for credit losses was $6.7$4.3 billion lower than net charge-offs for 2012,2013, resulting in a reduction in the allowance for credit losses driven by improved portfolio trendsdue to continued improvement in the home loans and increasing home prices in consumer real estate products, lower bankruptcy filings and delinquencies affecting the credit card portfolio, and improvementportfolios. This compared to a $6.7 billion reduction in overallthe allowance for credit quality within the core commercial portfolio.losses in 2012.
Net charge-offs totaled $14.9$7.9 billion, or 1.670.87 percent of average loans and leases for 20122013 compared to $20.8$14.9 billion, or 2.241.67 percent for 20112012. The decrease in net charge-offs was primarily driven by fewer delinquentcredit quality improvement across all major portfolios. Also, included in 2012 were charge-offs associated with the National Mortgage Settlement and loans and lowerdischarged in Chapter 7 bankruptcy filings indue to the credit card portfolio, as well as lower net charge-offs in the consumer real estate and core commercial portfolios in 2012.implementation of regulatory guidance.
Noninterest Expense
Noninterest expense was $72.169.2 billion for 20122013, a decrease of $8.22.9 billion compared to 20112012. The decrease was primarily driven by $3.2 billion of goodwill impairment charges in 2011 and none in 2012, a $2.8 billion decrease$967 million decline in other general operating expense primarily relatedlargely due to a provision of $1.1 billion in 2012 for the 2013 Independent Foreclosure Review (IFR) Acceleration Agreement, lower litigationFDIC expense, and lower default-related servicing expenses in Legacy Assets & Servicing and mortgage-related assessments, waivers and similar costs related to foreclosure delays, partially offset bydelays. Partially offsetting these declines was a provision of $1.1$1.9 billion increase in litigation expense to $6.1 billion in 2012 related to the 2013 IFR Acceleration Agreement.2013. Personnel expense decreased $1.3 billion$929 million in 20122013 as we continued to streamline processes and achieve cost savings. Partially offsetting the decreases were increasesProfessional fees decreased $690 million due in professional fees and data processing expenses duepart to continuing defaultreduced default-related management activities in Legacy Assets & Servicing. Also, 2011 included $638 million in merger and restructuring charges.
Income Tax BenefitExpense
The income tax expense was $4.7 billion on pretax income of $16.2 billion for 2013 compared to an income tax benefit wasof $1.1 billion on pre-taxthe pretax income of $3.1 billion for 2012 compared. The effective tax rate for 2013 was driven by our recurring tax preference items and by tax benefits related to annon-U.S. restructurings. These benefits were partially offset by the $1.1 billion charge to reduce the carrying value of certain U.K deferred tax assets due to the U.K corporate income tax benefit of $1.7 billion on the pre-tax loss of $230 million for 2011. Includedrate reduction in the income2013. The negative effective tax benefitrate for 2012 wasincluded a $1.7 billion tax benefit attributable to the excess of foreign tax credits recognized in the U.S. upon repatriation of the earnings of certain subsidiaries over the related U.S. tax liability. Also included inPartially offsetting the income tax benefit was a $788 million charge to reduce the carrying value of certain U.K. deferred tax assets due to the two percent U.K. corporate income tax rate reduction enacted in 2012. Our effective tax rate for 2012 excluding these two items was a benefit of seven percent and differed from the statutory rate due to the impact of our recurring tax preference items (e.g., affordable housing credits and tax-exempt income) on the level of pre-tax earnings.
The income tax benefit for 2011 was driven by our recurring tax preference items, a $1.0 billion benefit from the release of the remaining valuation allowance applicable to the Merrill Lynch capital loss carryover deferred tax asset and a benefit of $823 million for planned realization of previously unrecognized deferred tax assets related to the tax basis in certain subsidiaries. These benefits were partially offset by a $782 million charge for the two percent U.K. corporate income tax rate reduction enacted in 2011. The $3.2 billion of goodwill impairment charges recorded during 2011 were non-deductible.
Business Segment Operations
Consumer & Business Banking
CBB recorded net income of $5.56.6 billion in 2013 compared to $5.6 billion in 2012 compared to $7.8 billion in 2011with the decreaseincrease primarily due to lower revenue and higher provision for credit losses partially offset by lowerand noninterest expense. Net interest income decreased $2.4 billion to $19.9 billion due toremained relatively unchanged as the impact of higher deposit balances was offset by the impact of lower average loan balancesbalances. Noninterest income of $9.8 billion remained relatively unchanged as well as compressedthe allocation of certain card revenue to GWIM for clients with a credit card, and lower deposit spreadsservice charges were offset by the net impact of consumer protection products primarily due to the continued low rate environment. Noninterest income decreased $1.6 billion to $9.9 billion due to lower interchange fees as a result of implementing the Durbin Amendment, lower gains on sales of portfolios and the impact of charges related to our consumer protection products.changes in 2012. The provision for credit losses increaseddecreased $4711.0 billion to $3.1 billion in 2013 primarily as a result of improvements in credit quality. Noninterest expense decreased $661 million to $4.1 billion as portfolio trends stabilized during 2012. Noninterest expense decreased $917 million to $17.016.3 billion primarily due to lower operating, personnel and FDIC and operating expenses, partially offset by an increase in litigation expense.expenses.
Consumer Real Estate Services
CRES recorded a net loss of $6.45.0 billion in 20122013 compared to a net loss of $19.46.3 billion in 20112012 with the decrease in the net loss primarily driven by mortgage banking income of $5.6 billion in 2012 compared to a loss of $8.1 billion in 2011. The representations and warranties provision for 2011, which is included in mortgage banking income, included $8.6 billion related to the settlement with BNY Mellon and $7.0 billion related to other non-GSE, and to a lesser extent, GSE exposures. Also contributing to the decrease in the net loss was a decrease in thelower provision for credit losses and a decline inlower noninterest expense, partially offset by lower other noninterestmortgage banking income. Mortgage banking income increased $13.7 billiondecreased $968 million due to an $11.7both lower servicing income and lower core production revenue, partially offset by a $3.1 billion decrease in the representations and warranties provision and higher servicing income and core production revenue.as 2012 included provision related to the January 2013 settlement with FNMA. The provision for credit losses improved $1.6 billion to a benefit of $156 million due to improved delinquencies, increased home prices and continued loan balance run-off. Noninterest expense decreased $3.11.2 billion to $1.415.8 billion due to improved portfolio trends and increasing home priceslower operating expenses in both the non-PCI and PCI home equity loan portfolios. Noninterest expense decreased $4.5 billion to $17.2 billion due to a decline in litigation expense and lower mortgage-related assessments, waivers and similar costs related to foreclosure delays,Legacy Assets & Servicing, partially offset by higher default-related servicing costs and a provision for the 2013 IFR Acceleration Agreement. Noninterest expense in 2011 included a $2.6 billion goodwill impairment charge.litigation expense.
Global Wealth & Investment Management
GWIM recorded net income of $3.0 billion in 2013 compared to $2.2 billion in 2012 compared to $1.7 billion in 2011with the increase driven by lower noninterest expensehigher revenue and lower provision for credit losses.losses, partially offset by higher noninterest expense. Revenue remained
relatively unchanged as an increase inincreased $1.3 billion primarily driven by higher asset management fees due to higher AUM flows and higher market levels was offset by lower transactional revenue and lower net interest income due to the impact of the continued low rate environment.fees. The provision for credit losses decreased $132210 million to $26656 million driven by lower delinquencies and improving portfolio trends withincontinued improvement in the residential mortgagehome equity portfolio. Noninterest expense decreasedincreased $615311 million to $12.713.0 billion due to lower FDIC expense, lower litigationhigher volume-driven expenses and higher support costs, and other expense reductions, partially offset by higher production-related expenses.lower other personnel costs.
Global Banking
Global Banking recorded net income of $5.0 billion in 2013 compared to $5.3 billion in 2012 compared to $5.6 billion in 2011 with the decrease primarily driven by an increase in the provision for credit losses, partially offset by lower noninterest expense.higher revenue. Revenue remained relatively unchanged with lowerincreased $810 million to $16.5 billion in 2013 as higher net interest income due to the impact of loan growth, and higher investment banking fees and lower net interest income as a result of spread compression and the benefit in the prior year from higher accretion on acquired portfolios, largelywere partially offset by the impact of higher average loan and deposit balances andlower other income due to gains on the liquidation of certain legacy portfolios.portfolios in 2012. The provision for credit losses was a benefit ofincreased $1.4 billion to $342 million1.1 billion compared to a benefit of $1.3 billion$342 million in 2011 with the reduction in the benefit reflecting stabilization
2012 primarily due to increased reserves as a result of asset quality, core commercial loan growth and the impact of a higher volume of loan resolutions in the commercial real estate portfolio in the prior year.growth. Noninterest expense decreased $410 million to $7.6 billionremained relatively unchanged in 2013 primarily due to lower personnel and operating expenses.expense largely offset by higher litigation expense.
Global Markets
Global Markets recorded net income of $1.2 billion in 20122013 compared to a net loss of $1.12.0 billion in 20112012. Sales and trading revenue decreased due to net DVA losses compared to net DVA gains in the prior year. Excluding net DVA sales and trading revenue increased $2.4charges of $1.1 billion related to the U.K. corporate income tax rate reduction in 2013 and $781 million in 2012, net income decreased $548 million to $3.0 billion primarily driven by ourlower FICC business as a result of improved performance in our rates and currencies, and credit-related businessesrevenue due to a challenging trading environment, and higher noninterest expense, partially offset by an improved global economic climate, and a gain on the saleincrease in equities revenue. Net DVA losses were $1.2 billion compared to losses of an equity investment.$7.6 billion in 2012. Noninterest expense decreasedincreased $1.6 billion711 million to $11.312.0 billion due to a reductionan increase in personnel-related expenses and in brokerage, clearing and exchange fees, and other operating expenses.litigation expense. Income tax expense for both years included a $781 million charge for remeasurement of certain deferred tax assets due to the decreases in the U.K. corporate tax rate compared to a similar charge of $774 million in 2011.rate.
All Other
All Other recorded net income of $712 million in 2013 compared to a net loss of $3.7 billion703 million in 2012 compared to net income of $4.6 billion in 2011 primarily due to negative fair value adjustments on structured liabilities of $5.1 billion related towith the increase driven by improvement in ourthe provision for credit spreads in 2012 compared to $3.3 billion of positive fair value adjustments in 2011, a $6.0 billion decrease inlosses, higher equity investment income as 2011 includedand lower noninterest expense, partially offset by a $6.5 billion gain on the sale of portion of our investment in CCB,lower income tax benefit and lower gains on sales of debt securities. Partially offsetting these items was a reduction in theThe provision for credit losses ofimproved $3.63.3 billion to a benefit of $2.6666 million in 2013 primarily driven by continued improvement in portfolio trends including increased home prices in the residential mortgage portfolio. Noninterest expense decreased $2.0 billion. to $4.6 billion primarily due to lower litigation expense. The income tax benefit was $2.0 billion in 2013 compared to a benefit of $4.2 billion in 2012. The decrease was driven by the decline in the pretax loss in All Other and lower tax benefits as 2012 included a $1.7 billion tax benefit attributable to the excess of foreign tax credits recognized in the U.S. upon repatriation of the earnings of certain subsidiaries over the related U.S. tax liability.
|
| | |
| | | Bank of America 20132014 125116 |
|
| | |
126117 Bank of America 20132014
| | |
| | | | | | | | | | | | | | | | | | | | | | | | | | | | | | | | | | | | | |
Table I Average Balances and Interest Rates – FTE Basis | Table I Average Balances and Interest Rates – FTE Basis | Table I Average Balances and Interest Rates – FTE Basis |
| | | | | | | | | | | | | | | | | | | | | | | | | | | | | | | | | | | |
| | 2013 | | 2012 | | 2011 | 2014 | | 2013 | | 2012 |
| (Dollars in millions) | Average
Balance | | Interest
Income/
Expense | | Yield/
Rate | | Average
Balance | | Interest
Income/
Expense | | Yield/
Rate | | Average
Balance | | Interest
Income/
Expense | | Yield/
Rate | Average
Balance | | Interest
Income/
Expense | | Yield/
Rate | | Average
Balance | | Interest
Income/
Expense | | Yield/
Rate | | Average
Balance | | Interest
Income/
Expense | | Yield/
Rate |
| Earning assets | |
| | |
| | |
| | |
| | |
| | |
| | |
| | |
| | |
| |
| | |
| | |
| | |
| | |
| | |
| | |
| | |
| | |
|
Time deposits placed and other short-term investments (1) | $ | 16,066 |
| | $ | 187 |
| | 1.16 | % | | $ | 22,888 |
| | $ | 237 |
| | 1.03 | % | | $ | 28,242 |
| | $ | 366 |
| | 1.29 | % | |
Interest-bearing deposits with the Federal Reserve and non-U.S. central banks (1) | | $ | 113,999 |
| | $ | 308 |
| | 0.27 | % | | $ | 72,574 |
| | $ | 182 |
| | 0.25 | % | | $ | 81,741 |
| | $ | 190 |
| | 0.23 | % |
| Time deposits placed and other short-term investments | | 11,032 |
| | 170 |
| | 1.54 |
| | 16,066 |
| | 187 |
| | 1.16 |
| | 22,888 |
| | 236 |
| | 1.03 |
|
| Federal funds sold and securities borrowed or purchased under agreements to resell | 224,331 |
| | 1,229 |
| | 0.55 |
| | 236,042 |
| | 1,502 |
| | 0.64 |
| | 245,069 |
| | 2,147 |
| | 0.88 |
| 222,483 |
| | 1,039 |
| | 0.47 |
| | 224,331 |
| | 1,229 |
| | 0.55 |
| | 236,042 |
| | 1,502 |
| | 0.64 |
|
| Trading account assets | 168,998 |
| | 4,879 |
| | 2.89 |
| | 170,647 |
| | 5,306 |
| | 3.11 |
| | 181,996 |
| | 6,142 |
| | 3.37 |
| 145,686 |
| | 4,716 |
| | 3.24 |
| | 168,998 |
| | 4,879 |
| | 2.89 |
| | 170,647 |
| | 5,306 |
| | 3.11 |
|
Debt securities (2) | 337,953 |
| | 9,779 |
| | 2.89 |
| | 353,577 |
| | 8,931 |
| | 2.53 |
| | 342,650 |
| | 9,606 |
| | 2.80 |
| 351,702 |
| | 8,062 |
| | 2.28 |
| | 337,953 |
| | 9,779 |
| | 2.89 |
| | 353,577 |
| | 8,931 |
| | 2.53 |
|
Loans and leases (3): | |
| | |
| | |
| | |
| | |
| | |
| | |
| | |
| | |
| |
| | |
| | |
| | |
| | |
| | |
| | |
| | |
| | |
|
Residential mortgage (4) | 256,531 |
| | 9,319 |
| | 3.63 |
| | 264,164 |
| | 9,845 |
| | 3.73 |
| | 280,112 |
| | 11,588 |
| | 4.14 |
| 237,270 |
| | 8,462 |
| | 3.57 |
| | 256,535 |
| | 9,317 |
| | 3.63 |
| | 264,164 |
| | 9,845 |
| | 3.73 |
|
| Home equity | 100,267 |
| | 3,831 |
| | 3.82 |
| | 117,339 |
| | 4,426 |
| | 3.77 |
| | 130,945 |
| | 5,050 |
| | 3.86 |
| 89,705 |
| | 3,340 |
| | 3.72 |
| | 100,263 |
| | 3,835 |
| | 3.82 |
| | 117,339 |
| | 4,426 |
| | 3.77 |
|
| U.S. credit card | 90,369 |
| | 8,792 |
| | 9.73 |
| | 94,863 |
| | 9,504 |
| | 10.02 |
| | 105,478 |
| | 10,808 |
| | 10.25 |
| 88,962 |
| | 8,313 |
| | 9.34 |
| | 90,369 |
| | 8,792 |
| | 9.73 |
| | 94,863 |
| | 9,504 |
| | 10.02 |
|
| Non-U.S. credit card | 10,861 |
| | 1,271 |
| | 11.70 |
| | 13,549 |
| | 1,572 |
| | 11.60 |
| | 24,049 |
| | 2,656 |
| | 11.04 |
| 11,511 |
| | 1,200 |
| | 10.42 |
| | 10,861 |
| | 1,271 |
| | 11.70 |
| | 13,549 |
| | 1,572 |
| | 11.60 |
|
Direct/Indirect consumer (5) | 82,907 |
| | 2,370 |
| | 2.86 |
| | 84,424 |
| | 2,900 |
| | 3.44 |
| | 90,163 |
| | 3,716 |
| | 4.12 |
| 82,410 |
| | 2,099 |
| | 2.55 |
| | 82,907 |
| | 2,370 |
| | 2.86 |
| | 84,424 |
| | 2,900 |
| | 3.44 |
|
Other consumer (6) | 1,805 |
| | 72 |
| | 4.02 |
| | 2,359 |
| | 140 |
| | 5.95 |
| | 2,760 |
| | 176 |
| | 6.39 |
| 2,028 |
| | 139 |
| | 6.86 |
| | 1,807 |
| | 72 |
| | 4.02 |
| | 2,359 |
| | 140 |
| | 5.95 |
|
| Total consumer | 542,740 |
| | 25,655 |
| | 4.73 |
| | 576,698 |
| | 28,387 |
| | 4.92 |
| | 633,507 |
| | 33,994 |
| | 5.37 |
| 511,886 |
| | 23,553 |
| | 4.60 |
| | 542,742 |
| | 25,657 |
| | 4.73 |
| | 576,698 |
| | 28,387 |
| | 4.92 |
|
| U.S. commercial | 218,875 |
| | 6,811 |
| | 3.11 |
| | 201,352 |
| | 6,979 |
| | 3.47 |
| | 192,524 |
| | 7,360 |
| | 3.82 |
| 230,175 |
| | 6,630 |
| | 2.88 |
| | 218,874 |
| | 6,809 |
| | 3.11 |
| | 201,352 |
| | 6,979 |
| | 3.47 |
|
Commercial real estate (7) | 42,346 |
| | 1,392 |
| | 3.29 |
| | 37,982 |
| | 1,332 |
| | 3.51 |
| | 44,406 |
| | 1,522 |
| | 3.43 |
| 47,524 |
| | 1,411 |
| | 2.97 |
| | 42,346 |
| | 1,391 |
| | 3.29 |
| | 37,982 |
| | 1,332 |
| | 3.51 |
|
| Commercial lease financing | 23,865 |
| | 851 |
| | 3.56 |
| | 21,879 |
| | 874 |
| | 4.00 |
| | 21,383 |
| | 1,001 |
| | 4.68 |
| 24,423 |
| | 837 |
| | 3.43 |
| | 23,863 |
| | 851 |
| | 3.56 |
| | 21,879 |
| | 874 |
| | 4.00 |
|
| Non-U.S. commercial | 90,815 |
| | 2,082 |
| | 2.29 |
| | 60,857 |
| | 1,594 |
| | 2.62 |
| | 46,276 |
| | 1,382 |
| | 2.99 |
| 89,893 |
| | 2,218 |
| | 2.47 |
| | 90,816 |
| | 2,083 |
| | 2.29 |
| | 60,857 |
| | 1,594 |
| | 2.62 |
|
| Total commercial | 375,901 |
| | 11,136 |
| | 2.96 |
| | 322,070 |
| | 10,779 |
| | 3.35 |
| | 304,589 |
| | 11,265 |
| | 3.70 |
| 392,015 |
| | 11,096 |
| | 2.83 |
| | 375,899 |
| | 11,134 |
| | 2.96 |
| | 322,070 |
| | 10,779 |
| | 3.35 |
|
| Total loans and leases | 918,641 |
| | 36,791 |
| | 4.00 |
| | 898,768 |
| | 39,166 |
| | 4.36 |
| | 938,096 |
| | 45,259 |
| | 4.82 |
| 903,901 |
| | 34,649 |
| | 3.83 |
| | 918,641 |
| | 36,791 |
| | 4.00 |
| | 898,768 |
| | 39,166 |
| | 4.36 |
|
| Other earning assets | 80,985 |
| | 2,832 |
| | 3.50 |
| | 88,047 |
| | 2,970 |
| | 3.36 |
| | 98,606 |
| | 3,502 |
| | 3.55 |
| 66,127 |
| | 2,811 |
| | 4.25 |
| | 80,985 |
| | 2,832 |
| | 3.50 |
| | 88,047 |
| | 2,970 |
| | 3.36 |
|
Total earning assets (8) | 1,746,974 |
| | 55,697 |
| | 3.19 |
| | 1,769,969 |
| | 58,112 |
| | 3.28 |
| | 1,834,659 |
| | 67,022 |
| | 3.65 |
| 1,814,930 |
| | 51,755 |
| | 2.85 |
| | 1,819,548 |
| | 55,879 |
| | 3.07 |
| | 1,851,710 |
| | 58,301 |
| | 3.15 |
|
Cash and cash equivalents (1) | 109,014 |
| | 182 |
| | |
| | 115,739 |
| | 189 |
| | |
| | 112,616 |
| | 186 |
| | |
| |
Cash and due from banks (1) | | 27,079 |
| | | | |
| | 36,440 |
| | | | |
| | 33,998 |
| | | | |
|
| Other assets, less allowance for loan and lease losses | 307,525 |
| | |
| | |
| | 305,648 |
| | |
| | |
| | 349,047 |
| | |
| | |
| 303,581 |
| | |
| | |
| | 307,525 |
| | |
| | |
| | 305,648 |
| | |
| | |
|
| Total assets | $ | 2,163,513 |
| | |
| | |
| | $ | 2,191,356 |
| | |
| | |
| | $ | 2,296,322 |
| | |
| | |
| $ | 2,145,590 |
| | |
| | |
| | $ | 2,163,513 |
| | |
| | |
| | $ | 2,191,356 |
| | |
| | |
|
| Interest-bearing liabilities | |
| | |
| | |
| | |
| | |
| | |
| | |
| | |
| | |
| |
| | |
| | |
| | |
| | |
| | |
| | |
| | |
| | |
|
| U.S. interest-bearing deposits: | |
| | |
| | |
| | |
| | |
| | |
| | |
| | |
| | |
| |
| | |
| | |
| | |
| | |
| | |
| | |
| | |
| | |
|
| Savings | $ | 43,868 |
| | $ | 22 |
| | 0.05 | % | | $ | 41,453 |
| | $ | 45 |
| | 0.11 | % | | $ | 40,364 |
| | $ | 100 |
| | 0.25 | % | $ | 46,270 |
| | $ | 3 |
| | 0.01 | % | | $ | 43,868 |
| | $ | 22 |
| | 0.05 | % | | $ | 41,453 |
| | $ | 45 |
| | 0.11 | % |
| NOW and money market deposit accounts | 506,082 |
| | 413 |
| | 0.08 |
| | 466,096 |
| | 693 |
| | 0.15 |
| | 470,519 |
| | 1,060 |
| | 0.23 |
| 518,894 |
| | 316 |
| | 0.06 |
| | 506,082 |
| | 413 |
| | 0.08 |
| | 466,096 |
| | 693 |
| | 0.15 |
|
| Consumer CDs and IRAs | 82,963 |
| | 481 |
| | 0.58 |
| | 95,559 |
| | 693 |
| | 0.73 |
| | 110,922 |
| | 1,045 |
| | 0.94 |
| 66,798 |
| | 264 |
| | 0.40 |
| | 79,914 |
| | 471 |
| | 0.59 |
| | 95,559 |
| | 693 |
| | 0.73 |
|
| Negotiable CDs, public funds and other deposits | 23,504 |
| | 106 |
| | 0.45 |
| | 20,928 |
| | 128 |
| | 0.61 |
| | 17,227 |
| | 120 |
| | 0.70 |
| 31,502 |
| | 106 |
| | 0.33 |
| | 26,553 |
| | 116 |
| | 0.43 |
| | 20,928 |
| | 128 |
| | 0.61 |
|
| Total U.S. interest-bearing deposits | 656,417 |
| | 1,022 |
| | 0.16 |
| | 624,036 |
| | 1,559 |
| | 0.25 |
| | 639,032 |
| | 2,325 |
| | 0.36 |
| 663,464 |
| | 689 |
| | 0.10 |
| | 656,417 |
| | 1,022 |
| | 0.16 |
| | 624,036 |
| | 1,559 |
| | 0.25 |
|
| Non-U.S. interest-bearing deposits: | |
| | |
| | |
| | |
| | |
| | |
| | |
| | |
| | |
| |
| | |
| | |
| | |
| | |
| | |
| | |
| | |
| | |
|
| Banks located in non-U.S. countries | 12,419 |
| | 70 |
| | 0.56 |
| | 14,737 |
| | 94 |
| | 0.64 |
| | 20,782 |
| | 138 |
| | 0.66 |
| 8,744 |
| | 74 |
| | 0.84 |
| | 12,432 |
| | 80 |
| | 0.64 |
| | 14,737 |
| | 94 |
| | 0.64 |
|
| Governments and official institutions | 1,032 |
| | 2 |
| | 0.24 |
| | 1,019 |
| | 4 |
| | 0.35 |
| | 1,985 |
| | 7 |
| | 0.35 |
| 1,740 |
| | 3 |
| | 0.15 |
| | 1,584 |
| | 3 |
| | 0.18 |
| | 1,019 |
| | 4 |
| | 0.35 |
|
| Time, savings and other | 56,193 |
| | 302 |
| | 0.54 |
| | 53,318 |
| | 333 |
| | 0.63 |
| | 61,632 |
| | 532 |
| | 0.86 |
| 60,732 |
| | 314 |
| | 0.52 |
| | 55,628 |
| | 291 |
| | 0.52 |
| | 53,318 |
| | 333 |
| | 0.63 |
|
| Total non-U.S. interest-bearing deposits | 69,644 |
| | 374 |
| | 0.54 |
| | 69,074 |
| | 431 |
| | 0.62 |
| | 84,399 |
| | 677 |
| | 0.80 |
| 71,216 |
| | 391 |
| | 0.55 |
| | 69,644 |
| | 374 |
| | 0.54 |
| | 69,074 |
| | 431 |
| | 0.62 |
|
| Total interest-bearing deposits | 726,061 |
| | 1,396 |
| | 0.19 |
| | 693,110 |
| | 1,990 |
| | 0.29 |
| | 723,431 |
| | 3,002 |
| | 0.42 |
| 734,680 |
| | 1,080 |
| | 0.15 |
| | 726,061 |
| | 1,396 |
| | 0.19 |
| | 693,110 |
| | 1,990 |
| | 0.29 |
|
| Federal funds purchased, securities loaned or sold under agreements to repurchase and short-term borrowings | 301,417 |
| | 2,923 |
| | 0.97 |
| | 318,400 |
| | 3,572 |
| | 1.12 |
| | 324,269 |
| | 4,599 |
| | 1.42 |
| 257,678 |
| | 2,578 |
| | 1.00 |
| | 301,416 |
| | 2,923 |
| | 0.97 |
| | 318,400 |
| | 3,572 |
| | 1.12 |
|
| Trading account liabilities | 88,323 |
| | 1,638 |
| | 1.85 |
| | 78,554 |
| | 1,763 |
| | 2.24 |
| | 84,689 |
| | 2,212 |
| | 2.61 |
| 87,151 |
| | 1,576 |
| | 1.81 |
| | 88,323 |
| | 1,638 |
| | 1.85 |
| | 78,554 |
| | 1,763 |
| | 2.24 |
|
| Long-term debt | 263,416 |
| | 6,798 |
| | 2.58 |
| | 316,393 |
| | 9,419 |
| | 2.98 |
| | 421,229 |
| | 11,807 |
| | 2.80 |
| 253,607 |
| | 5,700 |
| | 2.25 |
| | 263,417 |
| | 6,798 |
| | 2.58 |
| | 316,393 |
| | 9,419 |
| | 2.98 |
|
Total interest-bearing liabilities (8) | 1,379,217 |
| | 12,755 |
| | 0.92 |
| | 1,406,457 |
| | 16,744 |
| | 1.19 |
| | 1,553,618 |
| | 21,620 |
| | 1.39 |
| 1,333,116 |
| | 10,934 |
| | 0.82 |
| | 1,379,217 |
| | 12,755 |
| | 0.92 |
| | 1,406,457 |
| | 16,744 |
| | 1.19 |
|
| Noninterest-bearing sources: | |
| | |
| | |
| | |
| | |
| | |
| | |
| | |
| | |
| |
| | |
| | |
| | |
| | |
| | |
| | |
| | |
| | |
|
| Noninterest-bearing deposits | 363,674 |
| | |
| | |
| | 354,672 |
| | |
| | |
| | 312,371 |
| | |
| | |
| 389,527 |
| | |
| | |
| | 363,674 |
| | |
| | |
| | 354,672 |
| | |
| | |
|
| Other liabilities | 186,675 |
| | |
| | |
| | 194,550 |
| | |
| | |
| | 201,238 |
| | |
| | |
| 184,471 |
| | |
| | |
| | 186,675 |
| | |
| | |
| | 194,550 |
| | |
| | |
|
| Shareholders’ equity | 233,947 |
| | |
| | |
| | 235,677 |
| | |
| | |
| | 229,095 |
| | |
| | |
| 238,476 |
| | |
| | |
| | 233,947 |
| | |
| | |
| | 235,677 |
| | |
| | |
|
| Total liabilities and shareholders’ equity | $ | 2,163,513 |
| | |
| | |
| | $ | 2,191,356 |
| | |
| | |
| | $ | 2,296,322 |
| | |
| | |
| $ | 2,145,590 |
| | |
| | |
| | $ | 2,163,513 |
| | |
| | |
| | $ | 2,191,356 |
| | |
| | |
|
| Net interest spread | |
| | |
| | 2.27 | % | | |
| | |
| | 2.09 | % | | |
| | |
| | 2.26 | % | |
| | |
| | 2.03 | % | | |
| | |
| | 2.15 | % | | |
| | |
| | 1.96 | % |
| Impact of noninterest-bearing sources | |
| | |
| | 0.19 |
| | |
| | |
| | 0.25 |
| | |
| | |
| | 0.21 |
| |
| | |
| | 0.22 |
| | |
| | |
| | 0.22 |
| | |
| | |
| | 0.28 |
|
Net interest income/yield on earning assets (1) | |
| | $ | 42,942 |
| | 2.46 | % | | |
| | $ | 41,368 |
| | 2.34 | % | | |
| | $ | 45,402 |
| | 2.47 | % | |
| Net interest income/yield on earning assets | | |
| | $ | 40,821 |
| | 2.25 | % | | |
| | $ | 43,124 |
| | 2.37 | % | | |
| | $ | 41,557 |
| | 2.24 | % |
| |
(1) | For this presentation, fees earned on overnightBeginning in 2014, interest-bearing deposits placed with the Federal Reserve and certain non-U.S. central banks are included in earning assets. In prior periods, these balances were included with cash and due from banks in the cash and cash equivalents line, consistent with the Consolidated Balance Sheet presentation of these deposits. In addition, beginning in the third quarter of 2012, fees earned on deposits, primarily overnight, placed with certain non-U.S. central banks, which are included in the time deposits placed and other short-term investments line in priorpresentation. Prior periods are included in the cash and cash equivalents line. Net interest income and net interest yield are calculated excluding the fees included in the cash and cash equivalents line.have been reclassified to conform to current period presentation. |
| |
(2) | YieldsBeginning in 2014, yields on debt securities carried at fair value are calculated on the cost basis. Prior to 2014, yields on debt securities carried at fair value were calculated based on fair value rather than the cost basis. The use of fair value does not have a material impact on net interest yield. |
| |
(3) | Nonperforming loans are included in the respective average loan balances. Income on these nonperforming loans is generally recognized on a cost recovery basis. PCI loans were recorded at fair value upon acquisition and accrete interest income over the remaining life of the loan. |
| |
(4) | Includes non-U.S. residential mortgage loans of $792 million, $9079 million and $9190 million in 20132014, 20122013 and 20112012, respectively. |
| |
(5) | Includes non-U.S. consumer loans of $6.74.4 billion, $7.86.7 billion and $8.57.8 billion in 20132014, 20122013 and 20112012, respectively. |
| |
(6) | Includes consumer finance loans of $1.31.1 billion, $1.51.3 billion and $1.81.5 billion; consumer leases of $351818 million, $0351 million and $0; consumer overdrafts of $148 million, $153 million and $128 million; and other non-U.S. consumer loans of $53 million, $6995 million and $878699 million; and consumer overdrafts ofin $153 million2014, $128 million2013 and $93 million in 2013, 2012 and 2011, respectively. |
| |
(7) | Includes U.S. commercial real estate loans of $40.746.0 billion, $36.440.7 billion and $42.136.4 billion, and non-U.S. commercial real estate loans of $1.6 billion, $1.6 billion and $2.31.6 billion in 20132014, 20122013 and 20112012, respectively. |
| |
(8) | Interest income includes the impact of interest rate risk management contracts, which decreased interest income on the underlying assets by $20558 million, $754205 million and $2.6 billion754 million in 20132014, 20122013 and 20112012, respectively. Interest expense includes the impact of interest rate risk management contracts, which decreased interest expense on the underlying liabilities by $2.42.5 billion, $2.32.4 billion and $2.62.3 billion in 20132014, 20122013 and 20112012, respectively. For more information on interest rate contracts, see Interest Rate Risk Management for NontradingNon-trading Activities on page 113105. |
|
| | |
| | | Bank of America 20132014 127118 |
| | | | | | | | | | | | | | | | | | | | | | | | | |
Table II Analysis of Changes in Net Interest Income – FTE Basis | Table II Analysis of Changes in Net Interest Income – FTE Basis | Table II Analysis of Changes in Net Interest Income – FTE Basis |
| | | | | | | | | | | | | | | | | | | | | | | |
| | From 2012 to 2013 | | From 2011 to 2012 | From 2013 to 2014 | | From 2012 to 2013 |
| | Due to Change in (1) | | | | Due to Change in (1) | | | Due to Change in (1) | | | | Due to Change in (1) | | |
| (Dollars in millions) | Volume | | Rate | | Net Change | | Volume | | Rate | | Net Change | Volume | | Rate | | Net Change | | Volume | | Rate | | Net Change |
| Increase (decrease) in interest income | |
| | |
| | |
| | |
| | |
| | |
| |
| | |
| | |
| | |
| | |
| | |
|
Time deposits placed and other short-term investments (2) | $ | (72 | ) | | $ | 22 |
| | $ | (50 | ) | | $ | (71 | ) | | $ | (58 | ) | | $ | (129 | ) | |
Interest-bearing deposits with the Federal Reserve and non-U.S. central banks (2) | | $ | 103 |
| | $ | 23 |
| | $ | 126 |
| | $ | (23 | ) | | $ | 15 |
| | $ | (8 | ) |
| Time deposits placed and other short-term investments | | (59 | ) | | 42 |
| | (17 | ) | | (71 | ) | | 22 |
| | (49 | ) |
| Federal funds sold and securities borrowed or purchased under agreements to resell | (66 | ) | | (207 | ) | | (273 | ) | | (70 | ) | | (575 | ) | | (645 | ) | (5 | ) | | (185 | ) | | (190 | ) | | (66 | ) | | (207 | ) | | (273 | ) |
| Trading account assets | (50 | ) | | (377 | ) | | (427 | ) | | (391 | ) | | (445 | ) | | (836 | ) | (669 | ) | | 506 |
| | (163 | ) | | (50 | ) | | (377 | ) | | (427 | ) |
| Debt securities | (381 | ) | | 1,229 |
| | 848 |
| | 294 |
| | (969 | ) | | (675 | ) | 385 |
| | (2,102 | ) | | (1,717 | ) | | (381 | ) | | 1,229 |
| | 848 |
|
| Loans and leases: | |
| | |
| | | | |
| | |
| | |
| | | | | | | |
| | |
| | |
|
| Residential mortgage | (276 | ) | | (250 | ) | | (526 | ) | | (652 | ) | | (1,091 | ) | | (1,743 | ) | (704 | ) | | (151 | ) | | (855 | ) | | (276 | ) | | (252 | ) | | (528 | ) |
| Home equity | (646 | ) | | 51 |
| | (595 | ) | | (521 | ) | | (103 | ) | | (624 | ) | (408 | ) | | (87 | ) | | (495 | ) | | (646 | ) | | 55 |
| | (591 | ) |
| U.S. credit card | (449 | ) | | (263 | ) | | (712 | ) | | (1,085 | ) | | (219 | ) | | (1,304 | ) | (136 | ) | | (343 | ) | | (479 | ) | | (449 | ) | | (263 | ) | | (712 | ) |
| Non-U.S. credit card | (312 | ) | | 11 |
| | (301 | ) | | (1,160 | ) | | 76 |
| | (1,084 | ) | 76 |
| | (147 | ) | | (71 | ) | | (312 | ) | | 11 |
| | (301 | ) |
| Direct/Indirect consumer | (48 | ) | | (482 | ) | | (530 | ) | | (238 | ) | | (578 | ) | | (816 | ) | (13 | ) | | (258 | ) | | (271 | ) | | (48 | ) | | (482 | ) | | (530 | ) |
| Other consumer | (33 | ) | | (35 | ) | | (68 | ) | | (25 | ) | | (11 | ) | | (36 | ) | 10 |
| | 57 |
| | 67 |
| | (32 | ) | | (36 | ) | | (68 | ) |
| Total consumer | |
| | |
| | (2,732 | ) | | |
| | |
| | (5,607 | ) | |
| | |
| | (2,104 | ) | | |
| | |
| | (2,730 | ) |
| U.S. commercial | 616 |
| | (784 | ) | | (168 | ) | | 332 |
| | (713 | ) | | (381 | ) | 349 |
| | (528 | ) | | (179 | ) | | 616 |
| | (786 | ) | | (170 | ) |
| Commercial real estate | 154 |
| | (94 | ) | | 60 |
| | (219 | ) | | 29 |
| | (190 | ) | 173 |
| | (153 | ) | | 20 |
| | 154 |
| | (95 | ) | | 59 |
|
| Commercial lease financing | 81 |
| | (104 | ) | | (23 | ) | | 23 |
| | (150 | ) | | (127 | ) | 18 |
| | (32 | ) | | (14 | ) | | 81 |
| | (104 | ) | | (23 | ) |
| Non-U.S. commercial | 785 |
| | (297 | ) | | 488 |
| | 438 |
| | (226 | ) | | 212 |
| (24 | ) | | 159 |
| | 135 |
| | 785 |
| | (296 | ) | | 489 |
|
| Total commercial | |
| | |
| | 357 |
| | |
| | |
| | (486 | ) | |
| | |
| | (38 | ) | | |
| | |
| | 355 |
|
| Total loans and leases | |
| | |
| | (2,375 | ) | | |
| | |
| | (6,093 | ) | |
| | |
| | (2,142 | ) | | |
| | |
| | (2,375 | ) |
| Other earning assets | (249 | ) | | 111 |
| | (138 | ) | | (376 | ) | | (156 | ) | | (532 | ) | (518 | ) | | 497 |
| | (21 | ) | | (249 | ) | | 111 |
| | (138 | ) |
| Total interest income | |
| | |
| | $ | (2,415 | ) | | |
| | |
| | $ | (8,910 | ) | |
| | |
| | $ | (4,124 | ) | | |
| | |
| | $ | (2,422 | ) |
| Increase (decrease) in interest expense | |
| | |
| | |
| | |
| | |
| | |
| |
| | |
| | |
| | |
| | |
| | |
|
| U.S. interest-bearing deposits: | |
| | |
| | |
| | |
| | |
| | |
| |
| | |
| | |
| | |
| | |
| | |
|
| Savings | $ | 3 |
| | $ | (26 | ) | | $ | (23 | ) | | $ | 4 |
| | $ | (59 | ) | | $ | (55 | ) | $ | 1 |
| | $ | (20 | ) | | $ | (19 | ) | | $ | 3 |
| | $ | (26 | ) | | $ | (23 | ) |
| NOW and money market deposit accounts | 66 |
| | (346 | ) | | (280 | ) | | 12 |
| | (379 | ) | | (367 | ) | 2 |
| | (99 | ) | | (97 | ) | | 66 |
| | (346 | ) | | (280 | ) |
| Consumer CDs and IRAs | (87 | ) | | (125 | ) | | (212 | ) | | (147 | ) | | (205 | ) | | (352 | ) | (77 | ) | | (130 | ) | | (207 | ) | | (110 | ) | | (112 | ) | | (222 | ) |
| Negotiable CDs, public funds and other deposits | 15 |
| | (37 | ) | | (22 | ) | | 26 |
| | (18 | ) | | 8 |
| 19 |
| | (29 | ) | | (10 | ) | | 34 |
| | (46 | ) | | (12 | ) |
| Total U.S. interest-bearing deposits | |
| | |
| | (537 | ) | | |
| | |
| | (766 | ) | |
| | |
| | (333 | ) | | |
| | |
| | (537 | ) |
| Non-U.S. interest-bearing deposits: | |
| | |
| | |
| | |
| | |
| | |
| |
| | |
| | |
| | |
| | |
| | |
|
| Banks located in non-U.S. countries | (15 | ) | | (9 | ) | | (24 | ) | | (41 | ) | | (3 | ) | | (44 | ) | (24 | ) | | 18 |
| | (6 | ) | | (14 | ) | | — |
| | (14 | ) |
| Governments and official institutions | — |
| | (2 | ) | | (2 | ) | | (3 | ) | | — |
| | (3 | ) | — |
| | — |
| | — |
| | 2 |
| | (3 | ) | | (1 | ) |
| Time, savings and other | 21 |
| | (52 | ) | | (31 | ) | | (73 | ) | | (126 | ) | | (199 | ) | 25 |
| | (2 | ) | | 23 |
| | 17 |
| | (59 | ) | | (42 | ) |
| Total non-U.S. interest-bearing deposits | |
| | |
| | (57 | ) | | |
| | |
| | (246 | ) | |
| | |
| | 17 |
| | |
| | |
| | (57 | ) |
| Total interest-bearing deposits | |
| | |
| | (594 | ) | | |
| | |
| | (1,012 | ) | |
| | |
| | (316 | ) | | |
| | |
| | (594 | ) |
| Federal funds purchased, securities loaned or sold under agreements to repurchase and short-term borrowings | (196 | ) | | (453 | ) | | (649 | ) | | (78 | ) | | (949 | ) | | (1,027 | ) | (424 | ) | | 79 |
| | (345 | ) | | (196 | ) | | (453 | ) | | (649 | ) |
| Trading account liabilities | 215 |
| | (340 | ) | | (125 | ) | | (162 | ) | | (287 | ) | | (449 | ) | (26 | ) | | (36 | ) | | (62 | ) | | 215 |
| | (340 | ) | | (125 | ) |
| Long-term debt | (1,569 | ) | | (1,052 | ) | | (2,621 | ) | | (2,948 | ) | | 560 |
| | (2,388 | ) | (255 | ) | | (843 | ) | | (1,098 | ) | | (1,569 | ) | | (1,052 | ) | | (2,621 | ) |
| Total interest expense | |
| | |
| | (3,989 | ) | | |
| | |
| | (4,876 | ) | |
| | |
| | (1,821 | ) | | |
| | |
| | (3,989 | ) |
Net increase (decrease) in net interest income (2) | |
| | |
| | $ | 1,574 |
| | |
| | |
| | $ | (4,034 | ) | |
| Net increase (decrease) in net interest income | | |
| | |
| | $ | (2,303 | ) | | |
| | |
| | $ | 1,567 |
|
| |
(1) | The changes for each category of interest income and expense are divided between the portion of change attributable to the variance in volume and the portion of change attributable to the variance in rate for that category. The unallocated change in rate or volume variance is allocated between the rate and volume variances. |
| |
(2) | For this presentation, fees earned on overnightBeginning in 2014, interest-bearing deposits placed with the Federal Reserve and certain non-U.S. central banks are included in earning assets. In prior periods, these balances were included with cash and due from banks in the cash and cash equivalents line, consistent with the Consolidated Balance Sheet presentation of these deposits. In addition, beginning in the third quarter of 2012, fees earned on deposits, primarily overnight, placed with certain non-U.S. central banks, which are included in the time deposits placed and other short-term investments line in priorpresentation. Prior periods are included in the cash and cash equivalents line. Net interest income in the table is calculated excluding the fees included in the cash and cash equivalents line.have been reclassified to conform to current period presentation. |
|
| | |
128119 Bank of America 20132014
| | |
|
| | | | | | | | | | | | | | | | | | |
| | | | | | | | | | | | | | |
Table III Preferred Stock Cash Dividend Summary (as of February 25, 2014) |
| | | | | | | | | | | | | | |
| | December 31, 2013 | | | | | | | | | | |
| Preferred Stock | | Outstanding
Notional
Amount (in millions) | | | Declaration Date | | Record Date | | Payment Date | | Per Annum Dividend Rate | | Dividend Per Share |
Series B (1) | | $ | 1 |
| | | February 11, 2014 | | April 11, 2014 | | April 25, 2014 | | 7.00 | % | | $ | 1.75 |
|
| | | | | | October 24, 2013 | | January 10, 2014 | | January 24, 2014 | | 7.00 |
| | 1.75 |
|
| | | |
| | | July 24, 2013 | | October 11, 2013 | | October 25, 2013 | | 7.00 |
| | 1.75 |
|
| | | |
| | | April 30, 2013 | | July 11, 2013 | | July 25, 2013 | | 7.00 |
| | 1.75 |
|
| | | |
| | | January 23, 2013 | | April 11, 2013 | | April 25, 2013 | | 7.00 |
| | 1.75 |
|
Series D (2) | | $ | 654 |
| | | January 13, 2014 | | February 28, 2014 | | March 14, 2014 | | 6.204 | % | | $ | 0.38775 |
|
| | | |
| | | October 15, 2013 | | November 29, 2013 | | December 16, 2013 | | 6.204 |
| | 0.38775 |
|
| | | |
| | | July 2, 2013 | | August 30, 2013 | | September 16, 2013 | | 6.204 |
| | 0.38775 |
|
| | | | | | April 2, 2013 | | May 31, 2013 | | June 14, 2013 | | 6.204 |
| | 0.38775 |
|
| | | | | | January 3, 2013 | | February 28, 2013 | | March 14, 2013 | | 6.204 |
| | 0.38775 |
|
Series E (2) | | $ | 317 |
| | | January 13, 2014 | | January 31, 2014 | | February 18, 2014 | | Floating |
| | $ | 0.25556 |
|
| | | | | | October 15, 2013 | | October 31, 2013 | | November 15, 2013 | | Floating |
| | 0.25556 |
|
| | | |
| | | July 2, 2013 | | July 31, 2013 | | August 15, 2013 | | Floating |
| | 0.25556 |
|
| | | | | | April 2, 2013 | | April 30, 2013 | | May 15, 2013 | | Floating |
| | 0.24722 |
|
| | | | | | January 3, 2013 | | January 31, 2013 | | February 15, 2013 | | Floating |
| | 0.25556 |
|
| Series F | | $ | 141 |
| | | January 13, 2014 | | February 28, 2014 | | March 17, 2014 | | Floating |
| | $ | 1,000.00 |
|
| | | | | | October 15, 2013 | | November 29, 2013 | | December 16, 2013 | | Floating |
| | 1,011.1111 |
|
| | | | | | July 2, 2013 | | August 30, 2013 | | September 16, 2013 | | Floating |
| | 1,022.2222 |
|
| | | | | | April 2, 2013 | | May 31, 2013 | | June 17, 2013 | | Floating |
| | 1,044.44 |
|
| | | | | | January 3, 2013 | | February 28, 2013 | | March 15, 2013 | | Floating |
| | 1,000.00 |
|
| Series G | | $ | 493 |
| | | January 13, 2014 | | February 28, 2014 | | March 17, 2014 | | Adjustable |
| | $ | 1,000.00 |
|
| | | | | | October 15, 2013 | | November 29, 2013 | | December 16, 2013 | | Adjustable |
| | 1,011.1111 |
|
| | | | | | July 2, 2013 | | August 30, 2013 | | September 16, 2013 | | Adjustable |
| | 1,022.2222 |
|
| | | | | | April 2, 2013 | | May 31, 2013 | | June 17, 2013 | | Adjustable |
| | 1,044.44 |
|
| | | | | | January 3, 2013 | | February 28, 2013 | | March 15, 2013 | | Adjustable |
| | 1,000.00 |
|
Series H (2, 3) | | $ | — |
| | | April 2, 2013 | | April 15, 2013 | | May 1, 2013 | | 8.20 | % | | $ | 0.51250 |
|
| | | |
| | | January 3, 2013 | | January 15, 2013 | | February 1, 2013 | | 8.20 |
| | 0.51250 |
|
Series I (2) | | $ | 365 |
| | | January 13, 2014 | | March 15, 2014 | | April 1, 2014 | | 6.625 | % | | $ | 0.4140625 |
|
| | | |
| | | October 15, 2013 | | December 15, 2013 | | January 2, 2014 | | 6.625 |
| | 0.4140625 |
|
| | | |
| | | July 2, 2013 | | September 15, 2013 | | October 1, 2013 | | 6.625 |
| | 0.4140625 |
|
| | | |
| | | April 2, 2013 | | June 15, 2013 | | July 1, 2013 | | 6.625 |
| | 0.41406 |
|
| | | |
| | | January 3, 2013 | | March 15, 2013 | | April 1, 2013 | | 6.625 |
| | 0.41406 |
|
Series J (2, 4) | | $ | — |
| | | July 2, 2013 | | July 15, 2013 | | August 1, 2013 | | 7.25 | % | | $ | 0.453125 |
|
| | | |
| | | April 2, 2013 | | April 15, 2013 | | May 1, 2013 | | 7.25 |
| | 0.453125 |
|
| | | |
| | | January 3, 2013 | | January 15, 2013 | | February 1, 2013 | | 7.25 |
| | 0.45312 |
|
Series K (5, 6) | | $ | 1,544 |
| | | January 13, 2014 | | January 15, 2014 | | January 30, 2014 | | Fixed-to-floating |
| | $ | 40.00 |
|
| | | |
| | | July 2, 2013 | | July 15, 2013 | | July 30, 2013 | | Fixed-to-floating |
| | 40.00 |
|
| | | |
| | | January 3, 2013 | | January 15, 2013 | | January 30, 2013 | | Fixed-to-floating |
| | 40.00 |
|
| Series L | | $ | 3,080 |
| | | December 16, 2013 | | January 1, 2014 | | January 30, 2014 | | 7.25 | % | | $ | 18.125 |
|
| | | |
| | | September 16, 2013 | | October 1, 2013 | | October 30, 2013 | | 7.25 |
| | 18.125 |
|
| | | |
| | | June 17, 2013 | | July 1, 2013 | | July 30, 2013 | | 7.25 |
| | 18.125 |
|
| | | |
| | | March 15, 2013 | | April 1, 2013 | | April 30, 2013 | | 7.25 |
| | 18.125 |
|
Series M (5, 6) | | $ | 1,310 |
| | | October 15, 2013 | | October 31, 2013 | | November 15, 2013 | | Fixed-to-floating |
| | $ | 40.62500 |
|
| | | |
| | | April 2, 2013 | | April 30, 2013 | | May 15, 2013 | | Fixed-to-floating |
| | 40.62500 |
|
Series T (1, 7) | | $ | 5,000 |
| | | December 16, 2013 | | December 26, 2013 | | January 10, 2014 | | 6.00 | % | | $ | 1,500.00 |
|
| | | | | | September 16, 2013 | | September 25, 2013 | | October 10, 2013 | | 6.00 |
| | 1,500.00 |
|
| | | | | | June 17, 2013 | | June 25, 2013 | | July 10, 2013 | | 6.00 |
| | 1,500.00 |
|
| | | | | | March 15, 2013 | | March 26, 2013 | | April 10, 2013 | | 6.00 |
| | 1,500.00 |
|
| Series U | | $ | 1,000 |
| | | October 15, 2013 | | November 15, 2013 | | December 2, 2013 | | Fixed-to-floating |
| | $ | 26.288889 |
|
|
| | | | | | | | | | | | | | | | | | |
| | | | | | | | | | | | | | |
Table III Preferred Stock Cash Dividend Summary (1) |
| | | | | | | | | | | | | | |
| | December 31, 2014 | | | | | | | | | | |
| Preferred Stock | | Outstanding
Notional
Amount (in millions) | | | Declaration Date | | Record Date | | Payment Date | | Per Annum Dividend Rate | | Dividend Per Share |
Series B (2) | | $ | 1 |
| | | February 10, 2015 | | April 10, 2015 | | April 24, 2015 | | 7.00 | % | | $ | 1.75 |
|
| | | | | | October 23, 2014 | | January 9, 2015 | | January 23, 2015 | | 7.00 |
| | 1.75 |
|
| | | | | | August 6, 2014 | | October 10, 2014 | | October 24, 2014 | | 7.00 |
| | 1.75 |
|
| | | |
| | | June 18, 2014 | | July 11, 2014 | | July 25, 2014 | | 7.00 |
| | 1.75 |
|
| | | |
| | | February 11, 2014 | | April 11, 2014 | | April 25, 2014 | | 7.00 |
| | 1.75 |
|
Series D (3) | | $ | 654 |
| | | January 9, 2015 | | February 27, 2015 | | March 16, 2015 | | 6.204 | % | | $ | 0.38775 |
|
| | | |
| | | October 9, 2014 | | November 28, 2014 | | December 15, 2014 | | 6.204 |
| | 0.38775 |
|
| | | |
| | | July 9, 2014 | | August 29, 2014 | | September 15, 2014 | | 6.204 |
| | 0.38775 |
|
| | | | | | April 2, 2014 | | May 30, 2014 | | June 16, 2014 | | 6.204 |
| | 0.38775 |
|
| | | | | | January 13, 2014 | | February 28, 2014 | | March 14, 2014 | | 6.204 |
| | 0.38775 |
|
Series E (3) | | $ | 317 |
| | | January 9, 2015 | | January 30, 2015 | | February 17, 2015 | | Floating |
| | $ | 0.25556 |
|
| | | | | | October 9, 2014 | | October 31, 2014 | | November 17, 2014 | | Floating |
| | 0.25556 |
|
| | | |
| | | July 9, 2014 | | July 31, 2014 | | August 15, 2014 | | Floating |
| | 0.25556 |
|
| | | | | | April 2, 2014 | | April 30, 2014 | | May 15, 2014 | | Floating |
| | 0.24722 |
|
| | | | | | January 13, 2014 | | January 31, 2014 | | February 18, 2014 | | Floating |
| | 0.25556 |
|
| Series F | | $ | 141 |
| | | January 9, 2015 | | February 27, 2015 | | March 16, 2015 | | Floating |
| | $ | 1,000.00 |
|
| | | | | | October 9, 2014 | | November 28, 2014 | | December 15, 2014 | | Floating |
| | 1,011.11111 |
|
| | | | | | July 9, 2014 | | August 29, 2014 | | September 15, 2014 | | Floating |
| | 1,022.22222 |
|
| | | | | | April 2, 2014 | | May 30, 2014 | | June 16, 2014 | | Floating |
| | 1,022.22222 |
|
| | | | | | January 13, 2014 | | February 28, 2014 | | March 17, 2014 | | Floating |
| | 1,000.00 |
|
| Series G | | $ | 493 |
| | | January 9, 2015 | | February 27, 2015 | | March 16, 2015 | | Adjustable |
| | $ | 1,000.00 |
|
| | | | | | October 9, 2014 | | November 28, 2014 | | December 15, 2014 | | Adjustable |
| | 1,011.11111 |
|
| | | | | | July 9, 2014 | | August 29, 2014 | | September 15, 2014 | | Adjustable |
| | 1,022.22222 |
|
| | | | | | April 2, 2014 | | May 30, 2014 | | June 16, 2014 | | Adjustable |
| | 1,022.22222 |
|
| | | | | | January 13, 2014 | | February 28, 2014 | | March 17, 2014 | | Adjustable |
| | 1,000.00 |
|
Series I (3) | | $ | 365 |
| | | January 9, 2015 | | March 15, 2015 | | April 1, 2015 | | 6.625 | % | | $ | 0.4140625 |
|
| | | |
| | | October 9, 2014 | | December 15, 2014 | | January 2, 2015 | | 6.625 |
| | 0.4140625 |
|
| | | |
| | | July 9, 2014 | | September 15, 2014 | | October 1, 2014 | | 6.625 |
| | 0.4140625 |
|
| | | |
| | | April 2, 2014 | | June 15, 2014 | | July 1, 2014 | | 6.625 |
| | 0.4140625 |
|
| | | |
| | | January 13, 2014 | | March 15, 2014 | | April 1, 2014 | | 6.625 |
| | 0.4140625 |
|
Series K (4, 5) | | $ | 1,544 |
| | | January 9, 2015 | | January 15, 2015 | | January 30, 2015 | | Fixed-to-floating |
| | $ | 40.00 |
|
| | | |
| | | July 9, 2014 | | July 15, 2014 | | July 30, 2014 | | Fixed-to-floating |
| | 40.00 |
|
| | | |
| | | January 13, 2014 | | January 15, 2014 | | January 30, 2014 | | Fixed-to-floating |
| | 40.00 |
|
| Series L | | $ | 3,080 |
| | | December 17, 2014 | | January 1, 2015 | | January 30, 2015 | | 7.25 | % | | $ | 18.125 |
|
| | | |
| | | September 16, 2014 | | October 1, 2014 | | October 30, 2014 | | 7.25 |
| | 18.125 |
|
| | | |
| | | June 18, 2014 | | July 1, 2014 | | July 30, 2014 | | 7.25 |
| | 18.125 |
|
| | | |
| | | March 6, 2014 | | April 1, 2014 | | April 30, 2014 | | 7.25 |
| | 18.125 |
|
Series M (4, 5) | | $ | 1,310 |
| | | October 9, 2014 | | October 31, 2014 | | November 17, 2014 | | Fixed-to-floating |
| | $ | 40.625 |
|
| | | |
| | | April 2, 2014 | | April 30, 2014 | | May 15, 2014 | | Fixed-to-floating |
| | 40.625 |
|
Series T (6) | | $ | 5,000 |
| | | February 10, 2015 | | March 26, 2015 | | April 10, 2015 | | 6.00 | % | | $ | 1,500.00 |
|
| | | | | | October 23, 2014 | | December 25, 2014 | | January 10, 2015 | | 6.00 |
| | 1,500.00 |
|
| | | | | | August 6, 2014 | | September 25, 2014 | | October 10, 2014 | | 6.00 |
| | 1,500.00 |
|
| | | | | | June 18, 2014 | | June 25, 2014 | | July 10, 2014 | | 6.00 |
| | 1,500.00 |
|
| | | | | | March 6, 2014 | | March 26, 2014 | | April 10, 2014 | | 6.00 |
| | 1,500.00 |
|
Series U (4, 5) | | $ | 1,000 |
| | | October 9, 2014 | | November 15, 2014 | | December 1, 2014 | | Fixed-to-floating |
| | $ | 26.00 |
|
| | | | | | April 2, 2014 | | May 15, 2014 | | June 2, 2014 | | Fixed-to-floating |
| | 26.00 |
|
Series V (4, 5) | | $ | 1,500 |
| | | October 9, 2014 | | December 1, 2014 | | December 17, 2014 | | Fixed-to-floating |
| | $ | 25.625 |
|
Series W (3) | | $ | 1,100 |
| | | January 9, 2015 | | February 15, 2015 | | March 9, 2015 | | Fixed |
| | $ | 0.4140625 |
|
| | | | | | October 9, 2014 | | November 15, 2014 | | December 9, 2014 | | Fixed |
| | 0.4140625 |
|
Series X (4, 5) | | $ | 2,000 |
| | | January 9, 2015 | | February 15, 2015 | | March 5, 2015 | | Fixed-to-floating |
| | $ | 31.25 |
|
| |
(1) | Preferred stock cash dividend summary is as of February 25, 2015. |
| |
(2) | Dividends are cumulative. |
| |
(2)(3)
| Dividends per depositary share, each representing a 1/1,000th interest in a share of preferred stock. |
| |
(3)
| This series was redeemed on May 1, 2013. |
| |
(4) | This series was redeemed on August 1, 2013. |
| |
(5)
| Initially pays dividends semi-annually. |
| |
(6)(5)
| Dividends per depositary share, each representing a 1/25th interest in a share of preferred stock. |
| |
(7)(6)
| For more information on the restructuringamendment of the Series T Preferred Stock, which is subject to shareholder approval, see Capital ManagementNote 13 – Capital Composition and RatiosShareholders’ Equity on page 66.to the Consolidated Financial Statements. |
|
| | |
| | | Bank of America 20132014 129120 |
| | | | | | | | | | | | | | | |
Table III Preferred Stock Cash Dividend Summary (as of February 25, 2014) (continued) | |
Table III Preferred Stock Cash Dividend Summary (1) (continued) | | Table III Preferred Stock Cash Dividend Summary (1) (continued) |
| | | | | | | | | | | | | |
| | December 31, 2013 | | | | | December 31, 2014 | | | | |
| Preferred Stock | | Outstanding
Notional
Amount (in millions) | | Declaration Date | | Record Date | | Payment Date | | Per Annum Dividend Rate | | Dividend Per Share | | Outstanding
Notional
Amount (in millions) | | Declaration Date | | Record Date | | Payment Date | | Per Annum Dividend Rate | | Dividend Per Share |
Series 1 (8)(7) | | $ | 98 |
| | January 13, 2014 | | February 15, 2014 | | February 28, 2014 | | Floating |
| | $ | 0.18750 |
| | $ | 98 |
| | January 9, 2015 | | February 15, 2015 | | February 27, 2015 | | Floating |
| | $ | 0.18750 |
|
| | | | | October 15, 2013 | | November 15, 2013 | | November 29, 2013 | | Floating |
| | 0.18750 |
| | | | October 9, 2014 | | November 15, 2014 | | November 28, 2014 | | Floating |
| | 0.18750 |
|
| | | |
| | July 2, 2013 | | August 15, 2013 | | August 28, 2013 | | Floating |
| | 0.18750 |
| | |
| | July 9, 2014 | | August 15, 2014 | | August 28, 2014 | | Floating |
| | 0.18750 |
|
| | | | | April 2, 2013 | | May 15, 2013 | | May 28, 2013 | | Floating |
| | 0.18750 |
| | | | April 2, 2014 | | May 15, 2014 | | May 28, 2014 | | Floating |
| | 0.18750 |
|
| | | | | January 3, 2013 | | February 15, 2013 | | February 28, 2013 | | Floating |
| | 0.18750 |
| | | | January 13, 2014 | | February 15, 2014 | | February 28, 2014 | | Floating |
| | 0.18750 |
|
Series 2 (8)(7) | | $ | 299 |
| | January 13, 2014 | | February 15, 2014 | | February 28, 2014 | | Floating |
| | $ | 0.19167 |
| | $ | 299 |
| | January 9, 2015 | | February 15, 2015 | | February 27, 2015 | | Floating |
| | $ | 0.19167 |
|
| | | | | October 15, 2013 | | November 15, 2013 | | November 29, 2013 | | Floating |
| | 0.19167 |
| | | | October 9, 2014 | | November 15, 2014 | | November 28, 2014 | | Floating |
| | 0.19167 |
|
| | | |
| | July 2, 2013 | | August 15, 2013 | | August 28, 2013 | | Floating |
| | 0.19167 |
| | |
| | July 9, 2014 | | August 15, 2014 | | August 28, 2014 | | Floating |
| | 0.19167 |
|
| | | | | April 2, 2013 | | May 15, 2013 | | May 28, 2013 | | Floating |
| | 0.18542 |
| | | | April 2, 2014 | | May 15, 2014 | | May 28, 2014 | | Floating |
| | 0.18542 |
|
| | | | | January 3, 2013 | | February 15, 2013 | | February 28, 2013 | | Floating |
| | 0.19167 |
| | | | January 13, 2014 | | February 15, 2014 | | February 28, 2014 | | Floating |
| | 0.19167 |
|
Series 3 (8)(7) | | $ | 653 |
| | January 13, 2014 | | February 15, 2014 | | February 28, 2014 | | 6.375 | % | | $ | 0.3984375 |
| | $ | 653 |
| | January 9, 2015 | | February 15, 2015 | | March 2, 2015 | | 6.375 | % | | $ | 0.3984375 |
|
| | | |
| | October 15, 2013 | | November 15, 2013 | | November 29, 2013 | | 6.375 |
| | 0.39844 |
| | |
| | October 9, 2014 | | November 15, 2014 | | November 28, 2014 | | 6.375 |
| | 0.3984375 |
|
| | | |
| | July 2, 2013 | | August 15, 2013 | | August 28, 2013 | | 6.375 |
| | 0.3984375 |
| | |
| | July 9, 2014 | | August 15, 2014 | | August 28, 2014 | | 6.375 |
| | 0.3984375 |
|
| | | |
| | April 2, 2013 | | May 15, 2013 | | May 28, 2013 | | 6.375 |
| | 0.39843 |
| | |
| | April 2, 2014 | | May 15, 2014 | | May 28, 2014 | | 6.375 |
| | 0.3984375 |
|
| | | |
| | January 3, 2013 | | February 15, 2013 | | February 28, 2013 | | 6.375 |
| | 0.39843 |
| | |
| | January 13, 2014 | | February 15, 2014 | | February 28, 2014 | | 6.375 |
| | 0.3984375 |
|
Series 4 (8)(7) | | $ | 210 |
| | January 13, 2014 | | February 15, 2014 | | February 28, 2014 | | Floating |
| | $ | 0.25556 |
| | $ | 210 |
| | January 9, 2015 | | February 15, 2015 | | February 27, 2015 | | Floating |
| | $ | 0.25556 |
|
| | | | | October 15, 2013 | | November 15, 2013 | | November 29, 2013 | | Floating |
| | 0.25556 |
| | | | October 9, 2014 | | November 15, 2014 | | November 28, 2014 | | Floating |
| | 0.25556 |
|
| | | |
| | July 2, 2013 | | August 15, 2013 | | August 28, 2013 | | Floating |
| | 0.25556 |
| | |
| | July 9, 2014 | | August 15, 2014 | | August 28, 2014 | | Floating |
| | 0.25556 |
|
| | | | | April 2, 2013 | | May 15, 2013 | | May 28, 2013 | | Floating |
| | 0.24722 |
| | | | April 2, 2014 | | May 15, 2014 | | May 28, 2014 | | Floating |
| | 0.24722 |
|
| | | | | January 3, 2013 | | February 15, 2013 | | February 28, 2013 | | Floating |
| | 0.25556 |
| | | | January 13, 2014 | | February 15, 2014 | | February 28, 2014 | | Floating |
| | 0.25556 |
|
Series 5 (8)(7) | | $ | 422 |
| | January 13, 2014 | | February 1, 2014 | | February 21, 2014 | | Floating |
| | $ | 0.25556 |
| | $ | 422 |
| | January 9, 2015 | | February 1, 2015 | | February 23, 2015 | | Floating |
| | $ | 0.25556 |
|
| | | | | October 15, 2013 | | November 1, 2013 | | November 21, 2013 | | Floating |
| | 0.25556 |
| | | | October 9, 2014 | | November 1, 2014 | | November 21, 2014 | | Floating |
| | 0.25556 |
|
| | | |
| | July 2, 2013 | | August 1, 2013 | | August 21, 2013 | | Floating |
| | 0.25556 |
| | |
| | July 9, 2014 | | August 1, 2014 | | August 21, 2014 | | Floating |
| | 0.25556 |
|
| | | | | April 2, 2013 | | May 1, 2013 | | May 21, 2013 | | Floating |
| | 0.24722 |
| | | | April 2, 2014 | | May 1, 2014 | | May 21, 2014 | | Floating |
| | 0.24722 |
|
| | | | | January 3, 2013 | | February 1, 2013 | | February 21, 2013 | | Floating |
| | 0.25556 |
| | | | January 13, 2014 | | February 1, 2014 | | February 21, 2014 | | Floating |
| | 0.25556 |
|
Series 6 (9, 10) | | $ | — |
| | April 2, 2013 | | June 15, 2013 | | June 28, 2013 | | 6.70 | % | | $ | 0.41875 |
| |
| | | | | January 3, 2013 | | March 15, 2013 | | March 29, 2013 | | 6.70 |
| | 0.41875 |
| |
Series 7 (9, 10) | | $ | — |
| | April 2, 2013 | | June 15, 2013 | | June 28, 2013 | | 6.25 | % | | $ | 0.390625 |
| |
| | | |
| | January 3, 2013 | | March 15, 2013 | | March 29, 2013 | | 6.25 |
| | 0.39062 |
| |
Series 8 (8, 11) | | $ | — |
| | April 2, 2013 | | May 15, 2013 | | May 28, 2013 | | 8.625 | % | | $ | 0.53906 |
| |
| | | |
| | January 3, 2013 | | February 15, 2013 | | February 28, 2013 | | 8.625 |
| | 0.53906 |
| |
| |
(8)(7)
| Dividends per depositary share, each representing a 1/1,200th interest in a share of preferred stock. |
| |
(9)
| Dividends per depositary share, each representing a 1/40th interest in a share of preferred stock.
|
| |
(10)
| These series were redeemed on June 28, 2013. |
| |
(11)
| This series was redeemed on May 28, 2013. |
|
| | |
130121 Bank of America 20132014
| | |
| | | | | | | | | | | | | | | | | | | | | |
Table IV Outstanding Loans and Leases (1) | | | | | | | | | | | | | | | | | | | | |
| | December 31 | December 31 |
| (Dollars in millions) | 2013 | | 2012 | | 2011 | | 2010 | | 2009 | 2014 | | 2013 | | 2012 | | 2011 | | 2010 |
| Consumer | |
| | |
| | |
| | |
| | |
| |
| | |
| | |
| | |
| | |
|
Residential mortgage (2)(1) | $ | 248,066 |
| | $ | 252,929 |
| | $ | 273,228 |
| | $ | 270,901 |
| | $ | 256,748 |
| $ | 216,197 |
| | $ | 248,066 |
| | $ | 252,929 |
| | $ | 273,228 |
| | $ | 270,901 |
|
| Home equity | 93,672 |
| | 108,140 |
| | 124,856 |
| | 138,161 |
| | 149,361 |
| 85,725 |
| | 93,672 |
| | 108,140 |
| | 124,856 |
| | 138,161 |
|
| U.S. credit card | 92,338 |
| | 94,835 |
| | 102,291 |
| | 113,785 |
| | 49,453 |
| 91,879 |
| | 92,338 |
| | 94,835 |
| | 102,291 |
| | 113,785 |
|
| Non-U.S. credit card | 11,541 |
| | 11,697 |
| | 14,418 |
| | 27,465 |
| | 21,656 |
| 10,465 |
| | 11,541 |
| | 11,697 |
| | 14,418 |
| | 27,465 |
|
Direct/Indirect consumer (3)(2) | 82,192 |
| | 83,205 |
| | 89,713 |
| | 90,308 |
| | 97,236 |
| 80,381 |
| | 82,192 |
| | 83,205 |
| | 89,713 |
| | 90,308 |
|
Other consumer (4)(3) | 1,977 |
| | 1,628 |
| | 2,688 |
| | 2,830 |
| | 3,110 |
| 1,846 |
| | 1,977 |
| | 1,628 |
| | 2,688 |
| | 2,830 |
|
| Total consumer loans excluding loans accounted for under the fair value option | 529,786 |
| | 552,434 |
| | 607,194 |
| | 643,450 |
| | 577,564 |
| 486,493 |
| | 529,786 |
| | 552,434 |
| | 607,194 |
| | 643,450 |
|
Consumer loans accounted for under the fair value option (5)(4) | 2,164 |
| | 1,005 |
| | 2,190 |
| | — |
| | — |
| 2,077 |
| | 2,164 |
| | 1,005 |
| | 2,190 |
| | — |
|
| Total consumer | 531,950 |
| | 553,439 |
| | 609,384 |
| | 643,450 |
| | 577,564 |
| 488,570 |
| | 531,950 |
| | 553,439 |
| | 609,384 |
| | 643,450 |
|
| Commercial | | | | | | | | | | | | | | | | | | |
U.S. commercial (6)(5) | 225,851 |
| | 209,719 |
| | 193,199 |
| | 190,305 |
| | 198,903 |
| 233,586 |
| | 225,851 |
| | 209,719 |
| | 193,199 |
| | 190,305 |
|
Commercial real estate (7)(6) | 47,893 |
| | 38,637 |
| | 39,596 |
| | 49,393 |
| | 69,447 |
| 47,682 |
| | 47,893 |
| | 38,637 |
| | 39,596 |
| | 49,393 |
|
| Commercial lease financing | 25,199 |
| | 23,843 |
| | 21,989 |
| | 21,942 |
| | 22,199 |
| 24,866 |
| | 25,199 |
| | 23,843 |
| | 21,989 |
| | 21,942 |
|
| Non-U.S. commercial | 89,462 |
| | 74,184 |
| | 55,418 |
| | 32,029 |
| | 27,079 |
| 80,083 |
| | 89,462 |
| | 74,184 |
| | 55,418 |
| | 32,029 |
|
| Total commercial loans excluding loans accounted for under the fair value option | 388,405 |
| | 346,383 |
| | 310,202 |
| | 293,669 |
| | 317,628 |
| 386,217 |
| | 388,405 |
| | 346,383 |
| | 310,202 |
| | 293,669 |
|
Commercial loans accounted for under the fair value option (5)(4) | 7,878 |
| | 7,997 |
| | 6,614 |
| | 3,321 |
| | 4,936 |
| 6,604 |
| | 7,878 |
| | 7,997 |
| | 6,614 |
| | 3,321 |
|
| Total commercial | 396,283 |
| | 354,380 |
| | 316,816 |
| | 296,990 |
| | 322,564 |
| 392,821 |
| | 396,283 |
| | 354,380 |
| | 316,816 |
| | 296,990 |
|
| Total loans and leases | $ | 928,233 |
| | $ | 907,819 |
| | $ | 926,200 |
| | $ | 940,440 |
| | $ | 900,128 |
| $ | 881,391 |
| | $ | 928,233 |
| | $ | 907,819 |
| | $ | 926,200 |
| | $ | 940,440 |
|
| |
(1) | Includes pay option loans of $3.2 billion, $4.4 billion, $6.7 billion, $9.9 billion and $11.8 billion and non-U.S. residential mortgage loans of $2 million, $0, $93 million, $85 million and $90 million at December 31, 2014, 2013, 2012, 2011 and 2010 are presented in accordance with consolidation guidance that was effective January 1, 2010., respectively. The Corporation no longer originates pay option loans. |
| |
(2) | Includes pay optiondealer financial services loans of $4.437.7 billion, $6.738.5 billion, $9.935.9 billion, $11.843.0 billion and $13.443.3 billion, unsecured consumer lending loans of $1.5 billion, $2.7 billion, $4.7 billion, $8.0 billion and $12.4 billion, U.S. securities-based lending loans of $35.8 billion, $31.2 billion, $28.3 billion, $23.6 billion and $16.6 billion, non-U.S. consumer loans of $4.0 billion, $4.7 billion, $8.3 billion, $7.6 billion and $8.0 billion, student loans of $632 million, $4.1 billion, $4.8 billion, $6.0 billion and $6.8 billion, and non-U.S. residential mortgageother consumer loans of $0, $93761 million, $85 million1.0 billion, $90 million1.2 billion, $1.5 billion and $552 million3.2 billion at December 31, 2014, 2013, 2012, 2011, and 2010 and 2009, respectively. The Corporation no longer originates pay option loans |
| |
(3) | Includes dealer financial servicesconsumer finance loans of $38.5 billion676 million,$35.9 billion, $43.0 billion, $43.3 billion and $41.6 billion; consumer lending loans of $2.7 billion, $4.7 billion, $8.0 billion, $12.4 billion and $19.7 billion; U.S. securities-based lending loans of $31.2 billion, $28.3 billion, $23.6 billion, $16.6 billion and $12.9 billion; non-U.S. consumer loans of $4.7 billion, $8.3 billion, $7.6 billion, $8.0 billion and $8.0 billion; student loans of $4.1 billion, $4.8 billion, $6.0 billion, $6.8 billion and $10.8 billion; and other consumer loans of $1.0 billion, $1.2 billion, $1.5 billion, $3.2 billion and $4.2 billion at December 31, 2013, 2012, 2011, 2010 and 2009, respectively. |
| |
(4)
| Includes consumer finance loans of $1.2 billion, $1.4 billion, $1.7 billion, and $1.9 billion and $2.3 billion;, consumer leases of$1.0 billion, $606 million, $34 million, $0, $0$0 and $0;$0, consumer overdrafts of$162 million, $176 million, $177 million, $103 million, and $88 million and $144 million;, and other non-U.S. consumer loans of$3 million, $5 million, $5 million, $929 million, and $803 million and $709 million at December 31, 2014, 2013, 2012, 2011, and 2010 and 2009, respectively.
|
| |
(5)(4)
| Consumer loans accounted for under the fair value option were residential mortgage loans of$1.9 billion, $2.0 billion, $1.0 billion and $2.2 billion, and home equity loans of $196 million, $147 million, $0 and $0$0 at December 31, 2014, 2013, 2012 and 2011, respectively. There were no consumer loans accounted for under the fair value option prior to 2011. Commercial loans accounted for under the fair value option were U.S. commercial loans of $1.9 billion, $1.5 billion, $2.3 billion, $2.2 billion, and $1.6 billion and $3.0 billion;, commercial real estate loans of $0, $0, $0, $79 million0 and $9079 million;, and non-U.S. commercial loans of$4.7 billion, $6.4 billion, $5.7 billion, $4.4 billion, and $1.7 billion and $1.9 billion at December 31, 2014, 2013, 2012, 2011, and 2010 and 2009, respectively. |
| |
(6)(5)
| Includes U.S. small business commercial loans, including card-related products, of $13.3 billion, $13.3 billion, $12.6 billion, $13.3 billion, and $14.7 billion and $17.5 billion at December 31, 2014, 2013, 2012, 2011, and 2010 and 2009, respectively. |
| |
(7)(6)
| Includes U.S. commercial real estate loans of$45.2 billion, $46.3 billion, $37.2 billion, $37.8 billion, and $46.9 billion and $66.5 billion, and non-U.S. commercial real estate loans of$2.5 billion, $1.6 billion, $1.5 billion, $1.8 billion, and $2.5 billion and $3.0 billion at December 31, 2014, 2013, 2012, 2011, and 2010 and 2009, respectively. |
|
| | |
| | | Bank of America 20132014 131122 |
| | | | | | | | | | | | | | | | | | | | | |
Table V Nonperforming Loans, Leases and Foreclosed Properties (1) | Table V Nonperforming Loans, Leases and Foreclosed Properties (1) | Table V Nonperforming Loans, Leases and Foreclosed Properties (1) |
| | | | | | | | | | | | | | | | | | | |
| | December 31 | December 31 |
| (Dollars in millions) | 2013 | | 2012 | | 2011 | | 2010 | | 2009 | 2014 | | 2013 | | 2012 | | 2011 | | 2010 |
| Consumer | |
| | |
| | |
| | |
| | |
| |
| | |
| | |
| | |
| | |
|
| Residential mortgage | $ | 11,712 |
| | $ | 15,055 |
| | $ | 16,259 |
| | $ | 18,020 |
| | $ | 16,841 |
| $ | 6,889 |
| | $ | 11,712 |
| | $ | 15,055 |
| | $ | 16,259 |
| | $ | 18,020 |
|
| Home equity | 4,075 |
| | 4,282 |
| | 2,454 |
| | 2,696 |
| | 3,808 |
| 3,901 |
| | 4,075 |
| | 4,282 |
| | 2,454 |
| | 2,696 |
|
| Direct/Indirect consumer | 35 |
| | 92 |
| | 40 |
| | 90 |
| | 86 |
| 28 |
| | 35 |
| | 92 |
| | 40 |
| | 90 |
|
| Other consumer | 18 |
| | 2 |
| | 15 |
| | 48 |
| | 104 |
| 1 |
| | 18 |
| | 2 |
| | 15 |
| | 48 |
|
Total consumer (2) | 15,840 |
| | 19,431 |
| | 18,768 |
| | 20,854 |
| | 20,839 |
| 10,819 |
| | 15,840 |
| | 19,431 |
| | 18,768 |
| | 20,854 |
|
| Commercial | |
| | |
| | |
| | |
| | |
| |
| | |
| | |
| | |
| | |
|
| U.S. commercial | 819 |
| | 1,484 |
| | 2,174 |
| | 3,453 |
| | 4,925 |
| 701 |
| | 819 |
| | 1,484 |
| | 2,174 |
| | 3,453 |
|
| Commercial real estate | 322 |
| | 1,513 |
| | 3,880 |
| | 5,829 |
| | 7,286 |
| 321 |
| | 322 |
| | 1,513 |
| | 3,880 |
| | 5,829 |
|
| Commercial lease financing | 16 |
| | 44 |
| | 26 |
| | 117 |
| | 115 |
| 3 |
| | 16 |
| | 44 |
| | 26 |
| | 117 |
|
| Non-U.S. commercial | 64 |
| | 68 |
| | 143 |
| | 233 |
| | 177 |
| 1 |
| | 64 |
| | 68 |
| | 143 |
| | 233 |
|
| | 1,221 |
| | 3,109 |
| | 6,223 |
| | 9,632 |
| | 12,503 |
| 1,026 |
| | 1,221 |
| | 3,109 |
| | 6,223 |
| | 9,632 |
|
| U.S. small business commercial | 88 |
| | 115 |
| | 114 |
| | 204 |
| | 200 |
| 87 |
| | 88 |
| | 115 |
| | 114 |
| | 204 |
|
Total commercial (3) | 1,309 |
| | 3,224 |
| | 6,337 |
| | 9,836 |
| | 12,703 |
| 1,113 |
| | 1,309 |
| | 3,224 |
| | 6,337 |
| | 9,836 |
|
| Total nonperforming loans and leases | 17,149 |
| | 22,655 |
| | 25,105 |
| | 30,690 |
| | 33,542 |
| 11,932 |
| | 17,149 |
| | 22,655 |
| | 25,105 |
| | 30,690 |
|
| Foreclosed properties | 623 |
| | 900 |
| | 2,603 |
| | 1,974 |
| | 2,205 |
| 697 |
| | 623 |
| | 900 |
| | 2,603 |
| | 1,974 |
|
| Total nonperforming loans, leases and foreclosed properties | $ | 17,772 |
| | $ | 23,555 |
| | $ | 27,708 |
| | $ | 32,664 |
| | $ | 35,747 |
| $ | 12,629 |
| | $ | 17,772 |
| | $ | 23,555 |
| | $ | 27,708 |
| | $ | 32,664 |
|
| |
(1) | Balances do not include PCI loans even though the customer may be contractually past due. PCI loans were recorded at fair value upon acquisition and accrete interest income over the remaining life of the loan. In addition, balances do not include foreclosed properties that are insured by the FHA and have entered foreclosure of $1.1 billion, $1.4 billion, $2.5 billion and $1.4$1.4 billion at December 31, 2014, 2013, 2012 and 2011, respectively. |
| |
(2) | In 20132014, $2.31.8 billion in interest income was estimated to be contractually due on $10.8 billion of consumer loans and leases classified as nonperforming, andat December 31, 2104, as presented in the table above, plus $20.6 billion of TDRs classified as performing if these loans and leases had been paying according to their terms and conditions. Atat December 31, 20132014, the TDRs classified as performing of $22.5 billion are not included in the table above.. Approximately $1.4 billion960 million of the estimated $2.31.8 billion in contractual interest was received and included in interest income for 20132014. |
| |
(3) | In 20132014, $157110 million in interest income was estimated to be contractually due on $1.1 billion of commercial loans and leases classified as nonperforming, andat December 31, 2014, as presented in the table above, plus $1.1 billion of TDRs classified as performing if these loans and leases had been paying according to their terms and conditions. Atat December 31, 20132014, the TDRs classified as performing of $1.8 billion are not included in the table above.. Approximately $7566 million of the estimated $157110 million in contractual interest was received and included in interest income for 20132014. |
|
| | |
132123 Bank of America 20132014
| | |
| | | | | | | | | | | | | | | | | | | | | |
Table VI Accruing Loans and Leases Past Due 90 Days or More (1) | Table VI Accruing Loans and Leases Past Due 90 Days or More (1) | Table VI Accruing Loans and Leases Past Due 90 Days or More (1) |
| | | | | | | | | | | | | | | | | | | |
| | December 31 | December 31 |
| (Dollars in millions) | 2013 | | 2012 | | 2011 | | 2010 | | 2009 | 2014 | | 2013 | | 2012 | | 2011 | | 2010 |
| Consumer | |
| | |
| | |
| | |
| | |
| |
| | |
| | |
| | |
| | |
|
Residential mortgage (2) | $ | 16,961 |
| | $ | 22,157 |
| | $ | 21,164 |
| | $ | 16,768 |
| | $ | 11,680 |
| $ | 11,407 |
| | $ | 16,961 |
| | $ | 22,157 |
| | $ | 21,164 |
| | $ | 16,768 |
|
| U.S. credit card | 1,053 |
| | 1,437 |
| | 2,070 |
| | 3,320 |
| | 2,158 |
| 866 |
| | 1,053 |
| | 1,437 |
| | 2,070 |
| | 3,320 |
|
| Non-U.S. credit card | 131 |
| | 212 |
| | 342 |
| | 599 |
| | 515 |
| 95 |
| | 131 |
| | 212 |
| | 342 |
| | 599 |
|
| Direct/Indirect consumer | 408 |
| | 545 |
| | 746 |
| | 1,058 |
| | 1,488 |
| 64 |
| | 408 |
| | 545 |
| | 746 |
| | 1,058 |
|
| Other consumer | 2 |
| | 2 |
| | 2 |
| | 2 |
| | 3 |
| 1 |
| | 2 |
| | 2 |
| | 2 |
| | 2 |
|
| Total consumer | 18,555 |
| | 24,353 |
| | 24,324 |
| | 21,747 |
| | 15,844 |
| 12,433 |
| | 18,555 |
| | 24,353 |
| | 24,324 |
| | 21,747 |
|
| Commercial | |
| | |
| | | | |
| | |
| |
| | |
| | |
| | | | |
|
| U.S. commercial | 47 |
| | 65 |
| | 75 |
| | 236 |
| | 213 |
| 110 |
| | 47 |
| | 65 |
| | 75 |
| | 236 |
|
| Commercial real estate | 21 |
| | 29 |
| | 7 |
| | 47 |
| | 80 |
| 3 |
| | 21 |
| | 29 |
| | 7 |
| | 47 |
|
| Commercial lease financing | 41 |
| | 15 |
| | 14 |
| | 18 |
| | 32 |
| 41 |
| | 41 |
| | 15 |
| | 14 |
| | 18 |
|
| Non-U.S. commercial | 17 |
| | — |
| | — |
| | 6 |
| | 67 |
| — |
| | 17 |
| | — |
| | — |
| | 6 |
|
| | 126 |
| | 109 |
| | 96 |
| | 307 |
| | 392 |
| 154 |
| | 126 |
| | 109 |
| | 96 |
| | 307 |
|
| U.S. small business commercial | 78 |
| | 120 |
| | 216 |
| | 325 |
| | 624 |
| 67 |
| | 78 |
| | 120 |
| | 216 |
| | 325 |
|
| Total commercial | 204 |
| | 229 |
| | 312 |
| | 632 |
| | 1,016 |
| 221 |
| | 204 |
| | 229 |
| | 312 |
| | 632 |
|
Total accruing loans and leases past due 90 days or more (3) | $ | 18,759 |
| | $ | 24,582 |
| | $ | 24,636 |
| | $ | 22,379 |
| | $ | 16,860 |
| $ | 12,654 |
| | $ | 18,759 |
| | $ | 24,582 |
| | $ | 24,636 |
| | $ | 22,379 |
|
| |
(1) | Our policy is to classify consumer real estate-secured loans as nonperforming at 90 days past due, except the PCI loan portfolio, the fully-insured loan portfolio and loans accounted for under the fair value option as referenced in footnote 3. |
| |
(2) | Balances are fully-insured loans. |
| |
(3) | Balances exclude loans accounted for under the fair value option. At December 31, 20132014 and 20092013, $8$5 million and $87$8 million of loans accounted for under the fair value option were past due 90 days or more and still accruing interest. At December 31, 2012, 2011 and 2010, there were no loans accounted for under the fair value option that were past due 90 days or more and still accruing interest. |
|
| | |
| | | Bank of America 20132014 133124 |
| | | | | | | | | | | | | | | | | | | | | |
Table VII Allowance for Credit Losses | Table VII Allowance for Credit Losses | Table VII Allowance for Credit Losses |
| | | | | | | | | | | | | | | | | | | |
| (Dollars in millions) | 2013 | | 2012 | | 2011 | | 2010 | | 2009 | 2014 | | 2013 | | 2012 | | 2011 | | 2010 |
Allowance for loan and lease losses, January 1 (1) | $ | 24,179 |
| | $ | 33,783 |
| | $ | 41,885 |
| | $ | 47,988 |
| | $ | 23,071 |
| $ | 17,428 |
| | $ | 24,179 |
| | $ | 33,783 |
| | $ | 41,885 |
| | $ | 47,988 |
|
| Loans and leases charged off | | | | | |
| | |
| | |
| | | | | |
| | |
| | |
|
| Residential mortgage | (1,508 | ) | | (3,276 | ) | | (4,294 | ) | | (3,843 | ) | | (4,525 | ) | (855 | ) | | (1,508 | ) | | (3,276 | ) | | (4,294 | ) | | (3,843 | ) |
| Home equity | (2,258 | ) | | (4,573 | ) | | (4,997 | ) | | (7,072 | ) | | (7,220 | ) | (1,364 | ) | | (2,258 | ) | | (4,573 | ) | | (4,997 | ) | | (7,072 | ) |
| U.S. credit card | (4,004 | ) | | (5,360 | ) | | (8,114 | ) | | (13,818 | ) | | (6,753 | ) | (3,068 | ) | | (4,004 | ) | | (5,360 | ) | | (8,114 | ) | | (13,818 | ) |
| Non-U.S. credit card | (508 | ) | | (835 | ) | | (1,691 | ) | | (2,424 | ) | | (1,332 | ) | (357 | ) | | (508 | ) | | (835 | ) | | (1,691 | ) | | (2,424 | ) |
| Direct/Indirect consumer | (710 | ) | | (1,258 | ) | | (2,190 | ) | | (4,303 | ) | | (6,406 | ) | (456 | ) | | (710 | ) | | (1,258 | ) | | (2,190 | ) | | (4,303 | ) |
| Other consumer | (273 | ) | | (274 | ) | | (252 | ) | | (320 | ) | | (491 | ) | (268 | ) | | (273 | ) | | (274 | ) | | (252 | ) | | (320 | ) |
| Total consumer charge-offs | (9,261 | ) | | (15,576 | ) | | (21,538 | ) | | (31,780 | ) | | (26,727 | ) | (6,368 | ) | | (9,261 | ) | | (15,576 | ) | | (21,538 | ) | | (31,780 | ) |
U.S. commercial (2) | (774 | ) | | (1,309 | ) | | (1,690 | ) | | (3,190 | ) | | (5,237 | ) | (584 | ) | | (774 | ) | | (1,309 | ) | | (1,690 | ) | | (3,190 | ) |
| Commercial real estate | (251 | ) | | (719 | ) | | (1,298 | ) | | (2,185 | ) | | (2,744 | ) | (29 | ) | | (251 | ) | | (719 | ) | | (1,298 | ) | | (2,185 | ) |
| Commercial lease financing | (4 | ) | | (32 | ) | | (61 | ) | | (96 | ) | | (217 | ) | (10 | ) | | (4 | ) | | (32 | ) | | (61 | ) | | (96 | ) |
| Non-U.S. commercial | (79 | ) | | (36 | ) | | (155 | ) | | (139 | ) | | (558 | ) | (35 | ) | | (79 | ) | | (36 | ) | | (155 | ) | | (139 | ) |
| Total commercial charge-offs | (1,108 | ) | | (2,096 | ) | | (3,204 | ) | | (5,610 | ) | | (8,756 | ) | (658 | ) | | (1,108 | ) | | (2,096 | ) | | (3,204 | ) | | (5,610 | ) |
| Total loans and leases charged off | (10,369 | ) | | (17,672 | ) | | (24,742 | ) | | (37,390 | ) | | (35,483 | ) | (7,026 | ) | | (10,369 | ) | | (17,672 | ) | | (24,742 | ) | | (37,390 | ) |
| Recoveries of loans and leases previously charged off | | | | | |
| | |
| | |
| | | | | |
| | |
| | |
|
| Residential mortgage | 424 |
| | 165 |
| | 377 |
| | 117 |
| | 89 |
| 969 |
| | 424 |
| | 165 |
| | 377 |
| | 117 |
|
| Home equity | 455 |
| | 331 |
| | 517 |
| | 279 |
| | 155 |
| 457 |
| | 455 |
| | 331 |
| | 517 |
| | 279 |
|
| U.S. credit card | 628 |
| | 728 |
| | 838 |
| | 791 |
| | 206 |
| 430 |
| | 628 |
| | 728 |
| | 838 |
| | 791 |
|
| Non-U.S. credit card | 109 |
| | 254 |
| | 522 |
| | 217 |
| | 93 |
| 115 |
| | 109 |
| | 254 |
| | 522 |
| | 217 |
|
| Direct/Indirect consumer | 365 |
| | 495 |
| | 714 |
| | 967 |
| | 943 |
| 287 |
| | 365 |
| | 495 |
| | 714 |
| | 967 |
|
| Other consumer | 39 |
| | 42 |
| | 50 |
| | 59 |
| | 63 |
| 39 |
| | 39 |
| | 42 |
| | 50 |
| | 59 |
|
| Total consumer recoveries | 2,020 |
| | 2,015 |
| | 3,018 |
| | 2,430 |
| | 1,549 |
| 2,297 |
| | 2,020 |
| | 2,015 |
| | 3,018 |
| | 2,430 |
|
U.S. commercial (3) | 287 |
| | 368 |
| | 500 |
| | 391 |
| | 161 |
| 214 |
| | 287 |
| | 368 |
| | 500 |
| | 391 |
|
| Commercial real estate | 102 |
| | 335 |
| | 351 |
| | 168 |
| | 42 |
| 112 |
| | 102 |
| | 335 |
| | 351 |
| | 168 |
|
| Commercial lease financing | 29 |
| | 38 |
| | 37 |
| | 39 |
| | 22 |
| 19 |
| | 29 |
| | 38 |
| | 37 |
| | 39 |
|
| Non-U.S. commercial | 34 |
| | 8 |
| | 3 |
| | 28 |
| | 21 |
| 1 |
| | 34 |
| | 8 |
| | 3 |
| | 28 |
|
| Total commercial recoveries | 452 |
| | 749 |
| | 891 |
| | 626 |
| | 246 |
| 346 |
| | 452 |
| | 749 |
| | 891 |
| | 626 |
|
| Total recoveries of loans and leases previously charged off | 2,472 |
| | 2,764 |
| | 3,909 |
| | 3,056 |
| | 1,795 |
| 2,643 |
| | 2,472 |
| | 2,764 |
| | 3,909 |
| | 3,056 |
|
| Net charge-offs | (7,897 | ) | | (14,908 | ) | | (20,833 | ) | | (34,334 | ) | | (33,688 | ) | (4,383 | ) | | (7,897 | ) | | (14,908 | ) | | (20,833 | ) | | (34,334 | ) |
| Write-offs of PCI loans | (2,336 | ) | | (2,820 | ) | | — |
| | — |
| | — |
| (810 | ) | | (2,336 | ) | | (2,820 | ) | | — |
| | — |
|
| Provision for loan and lease losses | 3,574 |
| | 8,310 |
| | 13,629 |
| | 28,195 |
| | 48,366 |
| 2,231 |
| | 3,574 |
| | 8,310 |
| | 13,629 |
| | 28,195 |
|
Other (4) | (92 | ) | | (186 | ) | | (898 | ) | | 36 |
| | (549 | ) | (47 | ) | | (92 | ) | | (186 | ) | | (898 | ) | | 36 |
|
| Allowance for loan and lease losses, December 31 | 17,428 |
| | 24,179 |
| | 33,783 |
| | 41,885 |
| | 37,200 |
| 14,419 |
| | 17,428 |
| | 24,179 |
| | 33,783 |
| | 41,885 |
|
| Reserve for unfunded lending commitments, January 1 | 513 |
| | 714 |
| | 1,188 |
| | 1,487 |
| | 421 |
| 484 |
| | 513 |
| | 714 |
| | 1,188 |
| | 1,487 |
|
| Provision for unfunded lending commitments | (18 | ) | | (141 | ) | | (219 | ) | | 240 |
| | 204 |
| 44 |
| | (18 | ) | | (141 | ) | | (219 | ) | | 240 |
|
Other (5) | (11 | ) | | (60 | ) | | (255 | ) | | (539 | ) | | 862 |
| — |
| | (11 | ) | | (60 | ) | | (255 | ) | | (539 | ) |
| Reserve for unfunded lending commitments, December 31 | 484 |
| | 513 |
| | 714 |
| | 1,188 |
| | 1,487 |
| 528 |
| | 484 |
| | 513 |
| | 714 |
| | 1,188 |
|
| Allowance for credit losses, December 31 | $ | 17,912 |
| | $ | 24,692 |
| | $ | 34,497 |
| | $ | 43,073 |
| | $ | 38,687 |
| $ | 14,947 |
| | $ | 17,912 |
| | $ | 24,692 |
| | $ | 34,497 |
| | $ | 43,073 |
|
| |
(1) | The 2010 balance includes $10.8 billion of allowance for loan and lease losses related to the adoption of consolidation guidance that was effective January 1, 2010. |
| |
(2) | Includes U.S. small business commercial charge-offs of $345 million, $457 million, $799 million, $1.1$1.1 billion $2.0 and $2.0 billion and $3.0 billion in2014, 2013, 2012, 2011, and 2010 and 2009, respectively. |
| |
(3) | Includes U.S. small business commercial recoveries of $63 million, $98 million, $100 million, $106$106 million $107 and $107 million and $65 million in2014, 2013, 2012, 2011, and 2010 and 2009, respectively. |
| |
(4) | The 2014, 2013, 2012 and 2011 amounts primarily represent the net impact of portfolio sales, consolidations and deconsolidations, and foreign currency translation adjustments. In addition, the 2011 amount includes a $449 million reduction in the allowance for loan and lease losses related to Canadian consumer card loans that were transferred to LHFS. The 2009 amount includes a $750 million reduction in the allowance for loan and lease losses related to credit card loans of $8.5 billion which were exchanged for $7.8 billion in held-to-maturity debt securities that were issued by the Corporation’s U.S. Credit Card Securitization Trust and retained by the Corporation. |
| |
(5) | The 2013, 2012, 2011 and 2010 amounts primarily representPrimarily represents accretion of the Merrill Lynch purchase accounting adjustment and the impact of funding previously unfunded positions. The 2009 amount includes the remaining balance of the acquired Merrill Lynch reserve excluding those commitments accounted for under the fair value option, net of accretion, and the impact of funding previously unfunded positions. |
|
| | |
134125 Bank of America 20132014
| | |
| | | | | | | | | | | | | | | | | | | | | |
Table VII Allowance for Credit Losses (continued) | Table VII Allowance for Credit Losses (continued) | Table VII Allowance for Credit Losses (continued) |
| | | | | | | | | | | | | | | | | | | |
| (Dollars in millions) | 2013 | | 2012 | | 2011 | | 2010 | | 2009 | 2014 | | 2013 | | 2012 | | 2011 | | 2010 |
| Loan and allowance ratios: | | | | | | | | | | | | | | | | | | |
Loans and leases outstanding at December 31 (6) | $ | 918,191 |
| | $ | 898,817 |
| | $ | 917,396 |
| | $ | 937,119 |
| | $ | 895,192 |
| $ | 872,710 |
| | $ | 918,191 |
| | $ | 898,817 |
| | $ | 917,396 |
| | $ | 937,119 |
|
Allowance for loan and lease losses as a percentage of total loans and leases outstanding at December 31 (6) | 1.90 | % | | 2.69 | % | | 3.68 | % | | 4.47 | % | | 4.16 | % | 1.65 | % | | 1.90 | % | | 2.69 | % | | 3.68 | % | | 4.47 | % |
Consumer allowance for loan and lease losses as a percentage of total consumer loans and leases outstanding at December 31 (7) | 2.53 |
| | 3.81 |
| | 4.88 |
| | 5.40 |
| | 4.81 |
| 2.05 |
| | 2.53 |
| | 3.81 |
| | 4.88 |
| | 5.40 |
|
Commercial allowance for loan and lease losses as a percentage of total commercial loans and leases outstanding at December 31 (8) | 1.03 |
| | 0.90 |
| | 1.33 |
| | 2.44 |
| | 2.96 |
| 1.15 |
| | 1.03 |
| | 0.90 |
| | 1.33 |
| | 2.44 |
|
Average loans and leases outstanding (6) | $ | 909,127 |
| | $ | 890,337 |
| | $ | 929,661 |
| | $ | 954,278 |
| | $ | 941,862 |
| $ | 894,001 |
| | $ | 909,127 |
| | $ | 890,337 |
| | $ | 929,661 |
| | $ | 954,278 |
|
Net charge-offs as a percentage of average loans and leases outstanding (6, 9) | 0.87 | % | | 1.67 | % | | 2.24 | % | | 3.60 | % | | 3.58 | % | 0.49 | % | | 0.87 | % | | 1.67 | % | | 2.24 | % | | 3.60 | % |
Net charge-offs and PCI write-offs as a percentage of average loans and leases outstanding (6, 10) | 1.13 |
| | 1.99 |
| | 2.24 |
| | 3.60 |
| | 3.58 |
| 0.58 |
| | 1.13 |
| | 1.99 |
| | 2.24 |
| | 3.60 |
|
Allowance for loan and lease losses as a percentage of total nonperforming loans and leases at December 31 (6, 11) | 102 |
| | 107 |
| | 135 |
| | 136 |
| | 111 |
| 121 |
| | 102 |
| | 107 |
| | 135 |
| | 136 |
|
Ratio of the allowance for loan and lease losses at December 31 to net charge-offs (9) | 2.21 |
| | 1.62 |
| | 1.62 |
| | 1.22 |
| | 1.10 |
| 3.29 |
| | 2.21 |
| | 1.62 |
| | 1.62 |
| | 1.22 |
|
Ratio of the allowance for loan and lease losses at December 31 to net charge-offs and PCI write-offs (10) | 1.70 |
| | 1.36 |
| | 1.62 |
| | 1.22 |
| | 1.10 |
| 2.78 |
| | 1.70 |
| | 1.36 |
| | 1.62 |
| | 1.22 |
|
Amounts included in allowance for loan and lease losses that are excluded from nonperforming loans and leases at December 31 (12) | $ | 7,680 |
| | $ | 12,021 |
| | $ | 17,490 |
| | $ | 22,908 |
| | $ | 17,690 |
| |
Allowance for loan and lease losses as a percentage of total nonperforming loans and leases, excluding amounts included in the allowance for loan and lease losses that are excluded from nonperforming loans and leases at December 31 (12) | 57 | % | | 54 | % | | 65 | % | | 62 | % | | 58 | % | |
Amounts included in allowance for loan and lease losses for loans and leases that are excluded from nonperforming loans and leases at December 31 (12) | | $ | 5,944 |
| | $ | 7,680 |
| | $ | 12,021 |
| | $ | 17,490 |
| | $ | 22,908 |
|
Allowance for loan and lease losses as a percentage of total nonperforming loans and leases, excluding the allowance for loan and lease losses for loans and leases that are excluded from nonperforming loans and leases at December 31 (6, 12) | | 71 | % | | 57 | % | | 54 | % | | 65 | % | | 62 | % |
Loan and allowance ratios excluding PCI loans and the related valuation allowance: (13) | | | | | | | | | |
| | | | | | | | | |
|
Allowance for loan and lease losses as a percentage of total loans and leases outstanding at December 31 (6) | 1.67 | % | | 2.14 | % | | 2.86 | % | | 3.94 | % | | 3.88 | % | 1.50 | % | | 1.67 | % | | 2.14 | % | | 2.86 | % | | 3.94 | % |
Consumer allowance for loan and lease losses as a percentage of total consumer loans and leases outstanding at December 31 (7) | 2.17 |
| | 2.95 |
| | 3.68 |
| | 4.66 |
| | 4.43 |
| 1.79 |
| | 2.17 |
| | 2.95 |
| | 3.68 |
| | 4.66 |
|
Net charge-offs as a percentage of average loans and leases outstanding (6) | 0.90 |
| | 1.73 |
| | 2.32 |
| | 3.73 |
| | 3.71 |
| 0.50 |
| | 0.90 |
| | 1.73 |
| | 2.32 |
| | 3.73 |
|
Allowance for loan and lease losses as a percentage of total nonperforming loans and leases at December 31 (6, 11) | 87 |
| | 82 |
| | 101 |
| | 116 |
| | 99 |
| 107 |
| | 87 |
| | 82 |
| | 101 |
| | 116 |
|
| Ratio of the allowance for loan and lease losses at December 31 to net charge-offs | 1.89 |
| | 1.25 |
| | 1.22 |
| | 1.04 |
| | 1.00 |
| 2.91 |
| | 1.89 |
| | 1.25 |
| | 1.22 |
| | 1.04 |
|
| |
(6) | Outstanding loan and lease balances and ratios do not include loans accounted for under the fair value option which wereof $8.7 billion, $10.0 billion, $9.0$9.0 billion,, $8.8 billion $3.3 billion and $4.9$3.3 billion at December 31, 2014, 2013, 2012, 2011, and 2010 and 2009, respectively. Average loans accounted for under the fair value option were $9.59.9 billion, $8.49.5 billion, $8.4 billion, $8.4 billion and $4.1 billion and $6.9 billion in2014, 2013, 2012, 2011, and 2010 and 2009, respectively. |
| |
(7) | Excludes consumer loans accounted for under the fair value option of $2.22.1 billion, $1.02.2 billion, $1.0 billion and $2.2 billion at December 31, 2014, 2013, 2012 and 2011. There were no consumer loans accounted for under the fair value option prior to 2011. |
| |
(8) | Excludes commercial loans accounted for under the fair value option of $7.96.6 billion, $8.07.9 billion, $8.0 billion, $6.6 billion $3.3 billion and $4.9$3.3 billion at December 31, 2014, 2013, 2012, 2011, and 2010 and 2009, respectively. |
| |
(9) | Net charge-offs exclude $810 million, $2.3 billion and $2.8$2.8 billion of write-offs in the PCI loan portfolio in2014, 2013 and 2012. These write-offs decreased the PCI valuation allowance included as part of the allowance for loan and lease losses. For more information on PCI write-offs, see Consumer Portfolio Credit Risk Management – Purchased Credit-impaired Loan Portfolio on page 8578. |
| |
(10) | There were no write-offs of PCI loans in 2011 2010 and 2009.2010. |
| |
(11) | For more information on our definition of nonperforming loans, see pages 8982 and 9689. |
| |
(12) | Primarily includes amounts allocated to the U.S. credit card and unsecured lending portfolios in CBB, PCI loans and the non-U.S. credit portfolio in All Other. |
| |
(13) | For more information on the PCI loan portfolio and the valuation allowance for PCI loans, see Note 4 – Outstanding Loans and Leases and Note 5 – Allowance for Credit Losses to the Consolidated Financial Statements. |
|
| | |
| | | Bank of America 20132014 135126 |
| | | | | | | | | | | | | | | | | | | | | | | | | | | | | | | | | | | | | | | | | |
Table VIII Allocation of the Allowance for Credit Losses by Product Type | Table VIII Allocation of the Allowance for Credit Losses by Product Type | Table VIII Allocation of the Allowance for Credit Losses by Product Type |
| | | | | | | | | | | | | | | | | | | | | | | | | | | | | | | | | | | | | | | |
| | December 31 | December 31 |
| | 2013 | | 2012 | | 2011 | | 2010 | | 2009 | 2014 | | 2013 | | 2012 | | 2011 | | 2010 |
| (Dollars in millions) | Amount | | Percent of Total | | Amount | | Percent of Total | | Amount | | Percent of Total | | Amount | | Percent of Total | | Amount | | Percent of Total | Amount | | Percent of Total | | Amount | | Percent of Total | | Amount | | Percent of Total | | Amount | | Percent of Total | | Amount | | Percent of Total |
| Allowance for loan and lease losses | |
| | |
| | |
| | |
| | |
| | |
| | |
| | |
| | |
| | |
| |
| | |
| | |
| | |
| | |
| | |
| | |
| | |
| | |
| | |
|
| Residential mortgage | $ | 4,084 |
| | 23.43 | % | | $ | 7,088 |
| | 29.31 | % | | $ | 7,985 |
| | 23.64 | % | | $ | 6,365 |
| | 15.20 | % | | $ | 5,640 |
| | 15.17 | % | $ | 2,900 |
| | 20.11 | % | | $ | 4,084 |
| | 23.43 | % | | $ | 7,088 |
| | 29.31 | % | | $ | 7,985 |
| | 23.64 | % | | $ | 6,365 |
| | 15.20 | % |
| Home equity | 4,434 |
| | 25.44 |
| | 7,845 |
| | 32.45 |
| | 13,094 |
| | 38.76 |
| | 12,887 |
| | 30.77 |
| | 10,116 |
| | 27.19 |
| 3,035 |
| | 21.05 |
| | 4,434 |
| | 25.44 |
| | 7,845 |
| | 32.45 |
| | 13,094 |
| | 38.76 |
| | 12,887 |
| | 30.77 |
|
| U.S. credit card | 3,930 |
| | 22.55 |
| | 4,718 |
| | 19.51 |
| | 6,322 |
| | 18.71 |
| | 10,876 |
| | 25.97 |
| | 6,017 |
| | 16.17 |
| 3,320 |
| | 23.03 |
| | 3,930 |
| | 22.55 |
| | 4,718 |
| | 19.51 |
| | 6,322 |
| | 18.71 |
| | 10,876 |
| | 25.97 |
|
| Non-U.S. credit card | 459 |
| | 2.63 |
| | 600 |
| | 2.48 |
| | 946 |
| | 2.80 |
| | 2,045 |
| | 4.88 |
| | 1,581 |
| | 4.25 |
| 369 |
| | 2.56 |
| | 459 |
| | 2.63 |
| | 600 |
| | 2.48 |
| | 946 |
| | 2.80 |
| | 2,045 |
| | 4.88 |
|
| Direct/Indirect consumer | 417 |
| | 2.39 |
| | 718 |
| | 2.97 |
| | 1,153 |
| | 3.41 |
| | 2,381 |
| | 5.68 |
| | 4,227 |
| | 11.36 |
| 299 |
| | 2.07 |
| | 417 |
| | 2.39 |
| | 718 |
| | 2.97 |
| | 1,153 |
| | 3.41 |
| | 2,381 |
| | 5.68 |
|
| Other consumer | 99 |
| | 0.58 |
| | 104 |
| | 0.43 |
| | 148 |
| | 0.44 |
| | 161 |
| | 0.38 |
| | 204 |
| | 0.55 |
| 59 |
| | 0.41 |
| | 99 |
| | 0.58 |
| | 104 |
| | 0.43 |
| | 148 |
| | 0.44 |
| | 161 |
| | 0.38 |
|
| Total consumer | 13,423 |
| | 77.02 |
| | 21,073 |
| | 87.15 |
| | 29,648 |
| | 87.76 |
| | 34,715 |
| | 82.88 |
| | 27,785 |
| | 74.69 |
| 9,982 |
| | 69.23 |
| | 13,423 |
| | 77.02 |
| | 21,073 |
| | 87.15 |
| | 29,648 |
| | 87.76 |
| | 34,715 |
| | 82.88 |
|
U.S. commercial (1) | 2,394 |
| | 13.74 |
| | 1,885 |
| | 7.80 |
| | 2,441 |
| | 7.23 |
| | 3,576 |
| | 8.54 |
| | 5,152 |
| | 13.85 |
| 2,619 |
| | 18.16 |
| | 2,394 |
| | 13.74 |
| | 1,885 |
| | 7.80 |
| | 2,441 |
| | 7.23 |
| | 3,576 |
| | 8.54 |
|
| Commercial real estate | 917 |
| | 5.26 |
| | 846 |
| | 3.50 |
| | 1,349 |
| | 3.99 |
| | 3,137 |
| | 7.49 |
| | 3,567 |
| | 9.59 |
| 1,016 |
| | 7.05 |
| | 917 |
| | 5.26 |
| | 846 |
| | 3.50 |
| | 1,349 |
| | 3.99 |
| | 3,137 |
| | 7.49 |
|
| Commercial lease financing | 118 |
| | 0.68 |
| | 78 |
| | 0.32 |
| | 92 |
| | 0.27 |
| | 126 |
| | 0.30 |
| | 291 |
| | 0.78 |
| 153 |
| | 1.06 |
| | 118 |
| | 0.68 |
| | 78 |
| | 0.32 |
| | 92 |
| | 0.27 |
| | 126 |
| | 0.30 |
|
| Non-U.S. commercial | 576 |
| | 3.30 |
| | 297 |
| | 1.23 |
| | 253 |
| | 0.75 |
| | 331 |
| | 0.79 |
| | 405 |
| | 1.09 |
| 649 |
| | 4.50 |
| | 576 |
| | 3.30 |
| | 297 |
| | 1.23 |
| | 253 |
| | 0.75 |
| | 331 |
| | 0.79 |
|
Total commercial (2) | 4,005 |
| | 22.98 |
| | 3,106 |
| | 12.85 |
| | 4,135 |
| | 12.24 |
| | 7,170 |
| | 17.12 |
| | 9,415 |
| | 25.31 |
| 4,437 |
| | 30.77 |
| | 4,005 |
| | 22.98 |
| | 3,106 |
| | 12.85 |
| | 4,135 |
| | 12.24 |
| | 7,170 |
| | 17.12 |
|
Allowance for loan and lease losses | 17,428 |
| | 100.00 | % | | 24,179 |
| | 100.00 | % | | 33,783 |
| | 100.00 | % | | 41,885 |
| | 100.00 | % | | 37,200 |
| | 100.00 | % | 14,419 |
| | 100.00 | % | | 17,428 |
| | 100.00 | % | | 24,179 |
| | 100.00 | % | | 33,783 |
| | 100.00 | % | | 41,885 |
| | 100.00 | % |
| Reserve for unfunded lending commitments | 484 |
| | | | 513 |
| | |
| | 714 |
| | | | 1,188 |
| | | | 1,487 |
| | | 528 |
| | | | 484 |
| | |
| | 513 |
| | | | 714 |
| | | | 1,188 |
| | |
Allowance for credit losses (3) | $ | 17,912 |
| | | | $ | 24,692 |
| | |
| | $ | 34,497 |
| | | | $ | 43,073 |
| | | | $ | 38,687 |
| | | $ | 14,947 |
| | | | $ | 17,912 |
| | |
| | $ | 24,692 |
| | | | $ | 34,497 |
| | | | $ | 43,073 |
| | |
| |
(1) | Includes allowance for loan and lease losses for U.S. small business commercial loans of $536 million, $462 million, $642 million, $893 million, and $1.5 billion and $2.4 billion at December 31, 2014, 2013, 2012, 2011, and 2010 and 2009, respectively. |
| |
(2) | Includes allowance for loan and lease losses for impaired commercial loans of $159 million, $277 million, $475 million, $545 million, and $1.1 billion and $1.2 billion at December 31, 2014, 2013, 2012, 2011, and 2010 and 2009, respectively. |
| |
(3) | Includes $1.7 billion, $2.5 billion, $5.5 billion, $8.5 billion, and $6.4 billion and $3.9 billionof valuation allowance included as part ofpresented with the allowance for creditloan and lease losses related to PCI loans at December 31, 2014, 2013, 2012, 2011, and 2010 and 2009, respectively. |
|
| | |
136127 Bank of America 20132014
| | |
| | | | | | | | | | | | | | | | | |
Table IX Selected Loan Maturity Data (1, 2) | Table IX Selected Loan Maturity Data (1, 2) | Table IX Selected Loan Maturity Data (1, 2) |
| | | | | | | | | | | | | | | |
| | December 31, 2013 | December 31, 2014 |
| (Dollars in millions) | Due in One Year or Less | | Due After
One Year
Through Five Years | | Due After Five Years | | Total | Due in One Year or Less | | Due After
One Year
Through Five Years | | Due After Five Years | | Total |
| U.S. commercial | $ | 58,522 |
| | $ | 122,739 |
| | $ | 46,114 |
| | $ | 227,375 |
| $ | 66,039 |
| | $ | 126,522 |
| | $ | 42,916 |
| | $ | 235,477 |
|
| U.S. commercial real estate | 7,244 |
| | 32,826 |
| | 6,242 |
| | 46,312 |
| 8,714 |
| | 31,825 |
| | 4,648 |
| | 45,187 |
|
Non-U.S. and other (3) | 78,201 |
| | 14,026 |
| | 5,170 |
| | 97,397 |
| 61,524 |
| | 21,015 |
| | 4,752 |
| | 87,291 |
|
| Total selected loans | $ | 143,967 |
| | $ | 169,591 |
| | $ | 57,526 |
| | $ | 371,084 |
| $ | 136,277 |
| | $ | 179,362 |
| | $ | 52,316 |
| | $ | 367,955 |
|
| Percent of total | 39 | % | | 46 | % | | 15 | % | | 100 | % | 37 | % | | 49 | % | | 14 | % | | 100 | % |
| Sensitivity of selected loans to changes in interest rates for loans due after one year: | |
| | |
| | |
| | |
| |
| | |
| | |
| | |
|
| Fixed interest rates | |
| | $ | 12,668 |
| | $ | 28,463 |
| | |
| |
| | $ | 14,070 |
| | $ | 27,379 |
| | |
|
| Floating or adjustable interest rates | |
| | 156,923 |
| | 29,063 |
| | |
| |
| | 165,292 |
| | 24,937 |
| | |
|
| Total | |
| | $ | 169,591 |
| | $ | 57,526 |
| | |
| |
| | $ | 179,362 |
| | $ | 52,316 |
| | |
|
| |
(1) | Loan maturities are based on the remaining maturities under contractual terms. |
| |
(2) | Includes loans accounted for under the fair value option. |
| |
(3) | Loan maturities include non-U.S. commercial and commercial real estate loans. |
|
| | | | | | | |
| | | | |
Table X Non-exchange Traded Commodity Contracts |
| | | | |
| | December 31, 2013 |
| (Dollars in millions) | Asset Positions | | Liability Positions |
| Net fair value of contracts outstanding, January 1, 2013 | $ | 4,041 |
| | $ | 3,977 |
|
| Effects of legally enforceable master netting agreements | 5,110 |
| | 5,110 |
|
| Gross fair value of contracts outstanding, January 1, 2013 | 9,151 |
| | 9,087 |
|
| Contracts realized or otherwise settled | (5,494 | ) | | (5,229 | ) |
| Fair value of new contracts | 4,076 |
| | 4,023 |
|
| Other changes in fair value | 1,268 |
| | 984 |
|
| Gross fair value of contracts outstanding, December 31, 2013 | 9,001 |
| | 8,865 |
|
| Effects of legally enforceable master netting agreements | (4,625 | ) | | (4,625 | ) |
| Net fair value of contracts outstanding, December 31, 2013 | $ | 4,376 |
| | $ | 4,240 |
|
|
| | | | | | | |
| | | | |
Table X Non-exchange Traded Commodity Contracts |
| | | | |
| | 2014 |
| (Dollars in millions) | Asset Positions | | Liability Positions |
| Net fair value of contracts outstanding, January 1, 2014 | $ | 4,376 |
| | $ | 4,240 |
|
| Effect of legally enforceable master netting agreements | 4,625 |
| | 4,625 |
|
| Gross fair value of contracts outstanding, January 1, 2014 | 9,001 |
| | 8,865 |
|
| Contracts realized or otherwise settled | (4,738 | ) | | (4,581 | ) |
| Fair value of new contracts | 8,281 |
| | 7,833 |
|
| Other changes in fair value | 1,014 |
| | 1,982 |
|
| Gross fair value of contracts outstanding, December 31, 2014 | 13,558 |
| | 14,099 |
|
| Less: Legally enforceable master netting agreements | (5,506 | ) | | (5,506 | ) |
| Net fair value of contracts outstanding, December 31, 2014 | $ | 8,052 |
| | $ | 8,593 |
|
| | | | | | | | | |
Table XI Non-exchange Traded Commodity Contract Maturities | Table XI Non-exchange Traded Commodity Contract Maturities | Table XI Non-exchange Traded Commodity Contract Maturities |
| | | | | | | |
| | December 31, 2013 | 2014 |
| (Dollars in millions) | Asset
Positions | | Liability
Positions | Asset
Positions | | Liability
Positions |
| Less than one year | $ | 4,737 |
| | $ | 4,575 |
| $ | 8,262 |
| | $ | 9,114 |
|
| Greater than or equal to one year and less than three years | 2,108 |
| | 2,411 |
| 2,598 |
| | 2,798 |
|
| Greater than or equal to three years and less than five years | 494 |
| | 489 |
| 599 |
| | 533 |
|
| Greater than or equal to five years | 1,662 |
| | 1,390 |
| 2,099 |
| | 1,654 |
|
| Gross fair value of contracts outstanding | 9,001 |
| | 8,865 |
| 13,558 |
| | 14,099 |
|
| Effects of legally enforceable master netting agreements | (4,625 | ) | | (4,625 | ) | |
| Less: Legally enforceable master netting agreements | | (5,506 | ) | | (5,506 | ) |
| Net fair value of contracts outstanding | $ | 4,376 |
| | $ | 4,240 |
| $ | 8,052 |
| | $ | 8,593 |
|
|
| | |
| | | Bank of America 20132014 137128 |
| | | | | | | | | | | | | | | | | | | | | | | | | | | | | | | | | |
Table XII Selected Quarterly Financial Data | Table XII Selected Quarterly Financial Data | Table XII Selected Quarterly Financial Data |
| | | | | | | | | | | | | | | | | | | | | | | | | | | | | | | |
| | 2013 Quarters | | 2012 Quarters | 2014 Quarters | | 2013 Quarters |
| (In millions, except per share information) | Fourth | | Third | | Second | | First | | Fourth | | Third | | Second | | First | Fourth | | Third | | Second | | First | | Fourth | | Third | | Second | | First |
| Income statement | |
| | |
| | |
| | |
| | |
| | |
| | |
| | |
| |
| | |
| | |
| | |
| | |
| | |
| | |
| | |
|
| Net interest income | $ | 10,786 |
| | $ | 10,266 |
| | $ | 10,549 |
| | $ | 10,664 |
| | $ | 10,324 |
| | $ | 9,938 |
| | $ | 9,548 |
| | $ | 10,846 |
| $ | 9,635 |
| | $ | 10,219 |
| | $ | 10,013 |
| | $ | 10,085 |
| | $ | 10,786 |
| | $ | 10,266 |
| | $ | 10,549 |
| | $ | 10,664 |
|
| Noninterest income | 10,702 |
| | 11,264 |
| | 12,178 |
| | 12,533 |
| | 8,336 |
| | 10,490 |
| | 12,420 |
| | 11,432 |
| 9,090 |
| | 10,990 |
| | 11,734 |
| | 12,481 |
| | 10,702 |
| | 11,264 |
| | 12,178 |
| | 12,533 |
|
| Total revenue, net of interest expense | 21,488 |
| | 21,530 |
| | 22,727 |
| | 23,197 |
| | 18,660 |
| | 20,428 |
| | 21,968 |
| | 22,278 |
| 18,725 |
| | 21,209 |
| | 21,747 |
| | 22,566 |
| | 21,488 |
| | 21,530 |
| | 22,727 |
| | 23,197 |
|
| Provision for credit losses | 336 |
| | 296 |
| | 1,211 |
| | 1,713 |
| | 2,204 |
| | 1,774 |
| | 1,773 |
| | 2,418 |
| 219 |
| | 636 |
| | 411 |
| | 1,009 |
| | 336 |
| | 296 |
| | 1,211 |
| | 1,713 |
|
| Noninterest expense | 17,307 |
| | 16,389 |
| | 16,018 |
| | 19,500 |
| | 18,360 |
| | 17,544 |
| | 17,048 |
| | 19,141 |
| 14,196 |
| | 20,142 |
| | 18,541 |
| | 22,238 |
| | 17,307 |
| | 16,389 |
| | 16,018 |
| | 19,500 |
|
| Income (loss) before income taxes | 3,845 |
| | 4,845 |
| | 5,498 |
| | 1,984 |
| | (1,904 | ) | | 1,110 |
| | 3,147 |
| | 719 |
| 4,310 |
| | 431 |
| | 2,795 |
| | (681 | ) | | 3,845 |
| | 4,845 |
| | 5,498 |
| | 1,984 |
|
| Income tax expense (benefit) | 406 |
| | 2,348 |
| | 1,486 |
| | 501 |
| | (2,636 | ) | | 770 |
| | 684 |
| | 66 |
| 1,260 |
| | 663 |
| | 504 |
| | (405 | ) | | 406 |
| | 2,348 |
| | 1,486 |
| | 501 |
|
| Net income | 3,439 |
| | 2,497 |
| | 4,012 |
| | 1,483 |
| | 732 |
| | 340 |
| | 2,463 |
| | 653 |
| |
| Net income (loss) | | 3,050 |
| | (232 | ) | | 2,291 |
| | (276 | ) | | 3,439 |
| | 2,497 |
| | 4,012 |
| | 1,483 |
|
| Net income (loss) applicable to common shareholders | 3,183 |
| | 2,218 |
| | 3,571 |
| | 1,110 |
| | 367 |
| | (33 | ) | | 2,098 |
| | 328 |
| 2,738 |
| | (470 | ) | | 2,035 |
| | (514 | ) | | 3,183 |
| | 2,218 |
| | 3,571 |
| | 1,110 |
|
| Average common shares issued and outstanding | 10,633 |
| | 10,719 |
| | 10,776 |
| | 10,799 |
| | 10,777 |
| | 10,776 |
| | 10,776 |
| | 10,651 |
| 10,516 |
| | 10,516 |
| | 10,519 |
| | 10,561 |
| | 10,633 |
| | 10,719 |
| | 10,776 |
| | 10,799 |
|
Average diluted common shares issued and outstanding (1) | 11,404 |
| | 11,482 |
| | 11,525 |
| | 11,155 |
| | 10,885 |
| | 10,776 |
| | 11,556 |
| | 10,762 |
| 11,274 |
| | 10,516 |
| | 11,265 |
| | 10,561 |
| | 11,404 |
| | 11,482 |
| | 11,525 |
| | 11,155 |
|
| Performance ratios | |
| | |
| | |
| | |
| | |
| | |
| | |
| | |
| |
| | |
| | |
| | |
| | |
| | |
| | |
| | |
|
| Return on average assets | 0.64 | % | | 0.47 | % | | 0.74 | % | | 0.27 | % | | 0.13 | % | | 0.06 | % | | 0.45 | % | | 0.12 | % | 0.57 | % | | n/m |
| | 0.42 | % | | n/m |
| | 0.64 | % | | 0.47 | % | | 0.74 | % | | 0.27 | % |
Four quarter trailing return on average assets (2) | 0.53 |
| | 0.40 |
| | 0.30 |
| | 0.23 |
| | 0.19 |
| | 0.25 |
| | 0.51 |
| | n/m |
| 0.23 |
| | 0.24 | % | | 0.37 |
| | 0.45 | % | | 0.53 |
| | 0.40 |
| | 0.30 |
| | 0.23 |
|
| Return on average common shareholders’ equity | 5.74 |
| | 4.06 |
| | 6.55 |
| | 2.06 |
| | 0.67 |
| | n/m |
| | 3.89 |
| | 0.62 |
| 4.84 |
| | n/m |
| | 3.68 |
| | n/m |
| | 5.74 |
| | 4.06 |
| | 6.55 |
| | 2.06 |
|
Return on average tangible common shareholders’ equity (3) | 8.61 |
| | 6.15 |
| | 9.88 |
| | 3.12 |
| | 1.01 |
| | n/m |
| | 5.95 |
| | 0.95 |
| 7.15 |
| | n/m |
| | 5.47 |
| | n/m |
| | 8.61 |
| | 6.15 |
| | 9.88 |
| | 3.12 |
|
Return on average tangible shareholders’ equity (3) | 8.53 |
| | 6.32 |
| | 9.98 |
| | 3.69 |
| | 1.77 |
| | 0.84 |
| | 6.16 |
| | 1.67 |
| 7.08 |
| | n/m |
| | 5.64 |
| | n/m |
| | 8.53 |
| | 6.32 |
| | 9.98 |
| | 3.69 |
|
| Total ending equity to total ending assets | 11.07 |
| | 10.92 |
| | 10.88 |
| | 10.91 |
| | 10.72 |
| | 11.02 |
| | 10.92 |
| | 10.66 |
| 11.57 |
| | 11.24 |
| | 10.94 |
| | 10.79 |
| | 11.07 |
| | 10.92 |
| | 10.88 |
| | 10.91 |
|
| Total average equity to total average assets | 10.93 |
| | 10.85 |
| | 10.76 |
| | 10.71 |
| | 10.79 |
| | 10.86 |
| | 10.73 |
| | 10.63 |
| 11.39 |
| | 11.14 |
| | 10.87 |
| | 11.06 |
| | 10.93 |
| | 10.85 |
| | 10.76 |
| | 10.71 |
|
| Dividend payout | 3.33 |
| | 4.82 |
| | 3.01 |
| | 9.75 |
| | 29.33 |
| | n/m |
| | 5.60 |
| | 34.97 |
| 19.21 |
| | n/m |
| | 5.16 |
| | n/m |
| | 3.33 |
| | 4.82 |
| | 3.01 |
| | 9.75 |
|
| Per common share data | |
| | |
| | |
| | |
| | |
| | |
| | |
| | |
| |
| | |
| | |
| | |
| | |
| | |
| | |
| | |
|
| Earnings | $ | 0.30 |
| | $ | 0.21 |
| | $ | 0.33 |
| | $ | 0.10 |
| | $ | 0.03 |
| | $ | 0.00 |
| | $ | 0.19 |
| | $ | 0.03 |
| |
Diluted earnings (1) | 0.29 |
| | 0.20 |
| | 0.32 |
| | 0.10 |
| | 0.03 |
| | 0.00 |
| | 0.19 |
| | 0.03 |
| |
| Earnings (loss) | | $ | 0.26 |
| | $ | (0.04 | ) | | $ | 0.19 |
| | $ | (0.05 | ) | | $ | 0.30 |
| | $ | 0.21 |
| | $ | 0.33 |
| | $ | 0.10 |
|
Diluted earnings (loss) (1) | | 0.25 |
| | (0.04 | ) | | 0.19 |
| | (0.05 | ) | | 0.29 |
| | 0.20 |
| | 0.32 |
| | 0.10 |
|
| Dividends paid | 0.01 |
| | 0.01 |
| | 0.01 |
| | 0.01 |
| | 0.01 |
| | 0.01 |
| | 0.01 |
| | 0.01 |
| 0.05 |
| | 0.05 |
| | 0.01 |
| | 0.01 |
| | 0.01 |
| | 0.01 |
| | 0.01 |
| | 0.01 |
|
| Book value | 20.71 |
| | 20.50 |
| | 20.18 |
| | 20.19 |
| | 20.24 |
| | 20.40 |
| | 20.16 |
| | 19.83 |
| 21.32 |
| | 20.99 |
| | 21.16 |
| | 20.75 |
| | 20.71 |
| | 20.50 |
| | 20.18 |
| | 20.19 |
|
Tangible book value (3) | 13.79 |
| | 13.62 |
| | 13.32 |
| | 13.36 |
| | 13.36 |
| | 13.48 |
| | 13.22 |
| | 12.87 |
| 14.43 |
| | 14.09 |
| | 14.24 |
| | 13.81 |
| | 13.79 |
| | 13.62 |
| | 13.32 |
| | 13.36 |
|
| Market price per share of common stock | |
| | |
| | |
| | |
| | |
| | |
| | |
| | |
| |
| | |
| | |
| | |
| | |
| | |
| | |
| | |
|
| Closing | $ | 15.57 |
| | $ | 13.80 |
| | $ | 12.86 |
| | $ | 12.18 |
| | $ | 11.61 |
| | $ | 8.83 |
| | $ | 8.18 |
| | $ | 9.57 |
| $ | 17.89 |
| | $ | 17.05 |
| | $ | 15.37 |
| | $ | 17.20 |
| | $ | 15.57 |
| | $ | 13.80 |
| | $ | 12.86 |
| | $ | 12.18 |
|
| High closing | 15.88 |
| | 14.95 |
| | 13.83 |
| | 12.78 |
| | 11.61 |
| | 9.55 |
| | 9.68 |
| | 9.93 |
| 18.13 |
| | 17.18 |
| | 17.34 |
| | 17.92 |
| | 15.88 |
| | 14.95 |
| | 13.83 |
| | 12.78 |
|
| Low closing | 13.69 |
| | 12.83 |
| | 11.44 |
| | 11.03 |
| | 8.93 |
| | 7.04 |
| | 6.83 |
| | 5.80 |
| 15.76 |
| | 14.98 |
| | 14.51 |
| | 16.10 |
| | 13.69 |
| | 12.83 |
| | 11.44 |
| | 11.03 |
|
| Market capitalization | $ | 164,914 |
| | $ | 147,429 |
| | $ | 138,156 |
| | $ | 131,817 |
| | $ | 125,136 |
| | $ | 95,163 |
| | $ | 88,155 |
| | $ | 103,123 |
| $ | 188,141 |
| | $ | 179,296 |
| | $ | 161,628 |
| | $ | 181,117 |
| | $ | 164,914 |
| | $ | 147,429 |
| | $ | 138,156 |
| | $ | 131,817 |
|
| |
(1) | DueThe diluted earnings (loss) per common share excluded the effect of any equity instruments that are antidilutive to aearnings per share. There were no potential common shares that were dilutive in the third and first quarters of 2014 because of the net loss applicable to common shareholders for the third quarter of 2012, the impact of antidilutive equity instruments was excluded from diluted earnings per share and average diluted common shares.shareholders. |
| |
(2) | Calculated as total net income (loss) for four consecutive quarters divided by annualized average assets for four consecutive quarters. |
| |
(3) | Tangible equity ratios and tangible book value per share of common stock are non-GAAP financial measures. Other companies may define or calculate these measures differently. For more information on these ratios, see Supplemental Financial Data on page 3332, and for corresponding reconciliations to GAAP financial measures, see Statistical Table XVII. |
| |
(4) | For more information on the impact of the PCIpurchased credit-impaired loan portfolio on asset quality, see Consumer Portfolio Credit Risk Management on page 7770. |
| |
(5) | Includes the allowance for loan and lease losses and the reserve for unfunded lending commitments. |
| |
(6) | Balances and ratios do not include loans accounted for under the fair value option. For additional exclusions from nonperforming loans, leases and foreclosed properties, see Consumer Portfolio Credit Risk Management – Nonperforming Consumer Loans, Leases and Foreclosed Properties Activity on page 8982 and corresponding Table 4139, and Commercial Portfolio Credit Risk Management – Nonperforming Commercial Loans, Leases and Foreclosed Properties Activity on page 9689 and corresponding Table 5048. |
| |
(7) | Primarily includes amounts allocated to the U.S. credit card and unsecured consumer lending portfolios in CBB, PCIpurchased credit-impaired loans and the non-U.S. credit card portfolio in All Other. |
| |
(8) | Net charge-offs exclude $13 million, $246 million, $160 million and $391 million of write-offs in the purchased credit-impaired loan portfolio in the fourth, third, second and first quarters of 2014, respectively, and $741 million, $443 million, $313 million and $839 million of write-offs in the PCI loan portfolio for the fourth, third, second and first quarters of 2013, respectively, and $1.1 billion and $1.7 billion for the fourth and third quarters of 2012.respectively. These write-offs decreased the PCIpurchased credit-impaired valuation allowance included as part of the allowance for loan and lease losses. For more information on PCIpurchased credit-impaired write-offs, see Consumer Portfolio Credit Risk Management – Purchased Credit-impaired Loan Portfolio on page 85.78. |
| |
(9) | There were no write-offs of PCI loans in the second and first quarters of 2012. |
| |
(10)
| Presents capital ratios in accordance withOn January 1, 2014, the Basel 3 rules became effective, subject to transition provisions primarily related to regulatory deductions and adjustments impacting Common equity tier 1 – 2013 Rules, which includecapital and Tier 1 capital. We reported under Basel 1 (which included the Market Risk Final Rule at December 31, 2013. Basel 1 did not include the Basel 1 – 2013 Rules at December 31, 2012.
Rules) for 2013. |
n/a = not applicable
n/m = not meaningful
|
| | |
138129 Bank of America 20132014
| | |
| | | | | | | | | | | | | | | | | | | | | | | | | | | | | | | | | |
Table XII Selected Quarterly Financial Data (continued) | Table XII Selected Quarterly Financial Data (continued) | Table XII Selected Quarterly Financial Data (continued) |
| | | | | | | | | | | | | | | | | | | | | | | | | | | | | | | |
| | 2013 Quarters | | 2012 Quarters | 2014 Quarters | | 2013 Quarters |
| (Dollars in millions) | Fourth | | Third | | Second | | First | | Fourth | | Third | | Second | | First | Fourth | | Third | | Second | | First | | Fourth | | Third | | Second | | First |
| Average balance sheet | |
| | |
| | |
| | |
| | |
| | |
| | |
| | |
| |
| | |
| | |
| | |
| | |
| | |
| | |
| | |
|
| Total loans and leases | $ | 929,777 |
| | $ | 923,978 |
| | $ | 914,234 |
| | $ | 906,259 |
| | $ | 893,166 |
| | $ | 888,859 |
| | $ | 899,498 |
| | $ | 913,722 |
| $ | 884,733 |
| | $ | 899,241 |
| | $ | 912,580 |
| | $ | 919,482 |
| | $ | 929,777 |
| | $ | 923,978 |
| | $ | 914,234 |
| | $ | 906,259 |
|
| Total assets | 2,134,875 |
| | 2,123,430 |
| | 2,184,610 |
| | 2,212,430 |
| | 2,210,365 |
| | 2,173,312 |
| | 2,194,563 |
| | 2,187,174 |
| 2,137,551 |
| | 2,136,109 |
| | 2,169,555 |
| | 2,139,266 |
| | 2,134,875 |
| | 2,123,430 |
| | 2,184,610 |
| | 2,212,430 |
|
| Total deposits | 1,112,674 |
| | 1,090,611 |
| | 1,079,956 |
| | 1,075,280 |
| | 1,078,076 |
| | 1,049,697 |
| | 1,032,888 |
| | 1,030,112 |
| 1,122,514 |
| | 1,127,488 |
| | 1,128,563 |
| | 1,118,178 |
| | 1,112,674 |
| | 1,090,611 |
| | 1,079,956 |
| | 1,075,280 |
|
| Long-term debt | 251,055 |
| | 258,717 |
| | 270,198 |
| | 273,999 |
| | 277,894 |
| | 291,684 |
| | 333,173 |
| | 363,518 |
| 249,221 |
| | 251,772 |
| | 259,825 |
| | 253,678 |
| | 251,055 |
| | 258,717 |
| | 270,198 |
| | 273,999 |
|
| Common shareholders’ equity | 220,088 |
| | 216,766 |
| | 218,790 |
| | 218,225 |
| | 219,744 |
| | 217,273 |
| | 216,782 |
| | 214,150 |
| 224,473 |
| | 222,368 |
| | 222,215 |
| | 223,201 |
| | 220,088 |
| | 216,766 |
| | 218,790 |
| | 218,225 |
|
| Total shareholders’ equity | 233,415 |
| | 230,392 |
| | 235,063 |
| | 236,995 |
| | 238,512 |
| | 236,039 |
| | 235,558 |
| | 232,566 |
| 243,448 |
| | 238,034 |
| | 235,797 |
| | 236,553 |
| | 233,415 |
| | 230,392 |
| | 235,063 |
| | 236,995 |
|
Asset quality (4) | |
| | |
| | |
| | |
| | |
| | |
| | |
| | |
| |
| | |
| | |
| | |
| | |
| | |
| | |
| | |
|
Allowance for credit losses (5) | $ | 17,912 |
| | $ | 19,912 |
| | $ | 21,709 |
| | $ | 22,927 |
| | $ | 24,692 |
| | $ | 26,751 |
| | $ | 30,862 |
| | $ | 32,862 |
| $ | 14,947 |
| | $ | 15,635 |
| | $ | 16,314 |
| | $ | 17,127 |
| | $ | 17,912 |
| | $ | 19,912 |
| | $ | 21,709 |
| | $ | 22,927 |
|
Nonperforming loans, leases and foreclosed properties (6) | 17,772 |
| | 20,028 |
| | 21,280 |
| | 22,842 |
| | 23,555 |
| | 24,925 |
| | 25,377 |
| | 27,790 |
| 12,629 |
| | 14,232 |
| | 15,300 |
| | 17,732 |
| | 17,772 |
| | 20,028 |
| | 21,280 |
| | 22,842 |
|
Allowance for loan and lease losses as a percentage of total loans and leases outstanding (6) | 1.90 | % | | 2.10 | % | | 2.33 | % | | 2.49 | % | | 2.69 | % | | 2.96 | % | | 3.43 | % | | 3.61 | % | 1.65 | % | | 1.71 | % | | 1.75 | % | | 1.84 | % | | 1.90 | % | | 2.10 | % | | 2.33 | % | | 2.49 | % |
Allowance for loan and lease losses as a percentage of total nonperforming loans and leases (6) | 102 |
| | 100 |
| | 103 |
| | 102 |
| | 107 |
| | 111 |
| | 127 |
| | 126 |
| 121 |
| | 112 |
| | 108 |
| | 97 |
| | 102 |
| | 100 |
| | 103 |
| | 102 |
|
Allowance for loan and lease losses as a percentage of total nonperforming loans and leases, excluding the PCI loan portfolio (6) | 87 |
| | 84 |
| | 84 |
| | 82 |
| | 82 |
| | 81 |
| | 90 |
| | 91 |
| 107 |
| | 100 |
| | 95 |
| | 85 |
| | 87 |
| | 84 |
| | 84 |
| | 82 |
|
Amounts included in allowance that are excluded from nonperforming loans and leases (7) | $ | 7,680 |
| | $ | 8,972 |
| | $ | 9,919 |
| | $ | 10,690 |
| | $ | 12,021 |
| | $ | 13,978 |
| | $ | 16,327 |
| | $ | 17,006 |
| |
Allowance as a percentage of total nonperforming loans and leases, excluding amounts included in the allowance that are excluded from nonperforming loans and leases (7) | 57 | % | | 54 | % | | 55 | % | | 53 | % | | 54 | % | | 52 | % | | 59 | % | | 60 | % | |
Amounts included in allowance for loan and lease losses for loans and leases that are excluded from nonperforming loans and leases (7) | | $ | 5,944 |
| | $ | 6,013 |
| | $ | 6,488 |
| | $ | 7,143 |
| | $ | 7,680 |
| | $ | 8,972 |
| | $ | 9,919 |
| | $ | 10,690 |
|
Allowance for loan and lease losses as a percentage of total nonperforming loans and leases, excluding the allowance for loan and lease losses for loans and leases that are excluded from nonperforming loans and leases (6, 7) | | 71 | % | | 67 | % | | 64 | % | | 55 | % | | 57 | % | | 54 | % | | 55 | % | | 53 | % |
Net charge-offs (8) | $ | 1,582 |
| | $ | 1,687 |
| | $ | 2,111 |
| | $ | 2,517 |
| | $ | 3,104 |
| | $ | 4,122 |
| | $ | 3,626 |
| | $ | 4,056 |
| $ | 879 |
| | $ | 1,043 |
| | $ | 1,073 |
| | $ | 1,388 |
| | $ | 1,582 |
| | $ | 1,687 |
| | $ | 2,111 |
| | $ | 2,517 |
|
Annualized net charge-offs as a percentage of average loans and leases outstanding (6, 8) | 0.68 | % | | 0.73 | % | | 0.94 | % | | 1.14 | % | | 1.40 | % | | 1.86 | % | | 1.64 | % | | 1.80 | % | 0.40 | % | | 0.46 | % | | 0.48 | % | | 0.62 | % | | 0.68 | % | | 0.73 | % | | 0.94 | % | | 1.14 | % |
Annualized net charge-offs as a percentage of average loans and leases outstanding, excluding the PCI loan portfolio (6) | 0.70 |
| | 0.75 |
| | 0.97 |
| | 1.18 |
| | 1.44 |
| | 1.93 |
| | 1.69 |
| | 1.87 |
| 0.41 |
| | 0.48 |
| | 0.49 |
| | 0.64 |
| | 0.70 |
| | 0.75 |
| | 0.97 |
| | 1.18 |
|
Annualized net charge-offs and PCI write-offs as a percentage of average loans and leases outstanding (6, 9) | 1.00 |
| | 0.92 |
| | 1.07 |
| | 1.52 |
| | 1.90 |
| | 2.63 |
| | 1.64 |
| | 1.80 |
| |
Annualized net charge-offs and PCI write-offs as a percentage of average loans and leases outstanding (6) | | 0.40 |
| | 0.57 |
| | 0.55 |
| | 0.79 |
| | 1.00 |
| | 0.92 |
| | 1.07 |
| | 1.52 |
|
Nonperforming loans and leases as a percentage of total loans and leases outstanding (6) | 1.87 |
| | 2.10 |
| | 2.26 |
| | 2.44 |
| | 2.52 |
| | 2.68 |
| | 2.70 |
| | 2.85 |
| 1.37 |
| | 1.53 |
| | 1.63 |
| | 1.89 |
| | 1.87 |
| | 2.10 |
| | 2.26 |
| | 2.44 |
|
Nonperforming loans, leases and foreclosed properties as a percentage of total loans, leases and foreclosed properties (6) | 1.93 |
| | 2.17 |
| | 2.33 |
| | 2.53 |
| | 2.62 |
| | 2.81 |
| | 2.87 |
| | 3.10 |
| 1.45 |
| | 1.61 |
| | 1.70 |
| | 1.96 |
| | 1.93 |
| | 2.17 |
| | 2.33 |
| | 2.53 |
|
Ratio of the allowance for loan and lease losses at period end to annualized net charge-offs (8) | 2.78 |
| | 2.90 |
| | 2.51 |
| | 2.20 |
| | 1.96 |
| | 1.60 |
| | 2.08 |
| | 1.97 |
| 4.14 |
| | 3.65 |
| | 3.67 |
| | 2.95 |
| | 2.78 |
| | 2.90 |
| | 2.51 |
| | 2.20 |
|
| Ratio of the allowance for loan and lease losses at period end to annualized net charge-offs, excluding the PCI loan portfolio | 2.38 |
| | 2.42 |
| | 2.04 |
| | 1.76 |
| | 1.51 |
| | 1.17 |
| | 1.46 |
| | 1.43 |
| 3.66 |
| | 3.27 |
| | 3.25 |
| | 2.58 |
| | 2.38 |
| | 2.42 |
| | 2.04 |
| | 1.76 |
|
Ratio of the allowance for loan and lease losses at period end to annualized net charge-offs and PCI write-offs (9) | 1.89 |
| | 2.30 |
| | 2.18 |
| | 1.65 |
| | 1.44 |
| | 1.13 |
| | 2.08 |
| | 1.97 |
| 4.08 |
| | 2.95 |
| | 3.20 |
| | 2.30 |
| | 1.89 |
| | 2.30 |
| | 2.18 |
| | 1.65 |
|
Capital ratios at period end (10) | |
| | |
| | |
| | |
| | |
| | |
| | |
| | |
| |
Capital ratios at period end (9) | | |
| | |
| | |
| | |
| | |
| | |
| | |
| | |
|
| Risk-based capital: | |
| | |
| | |
| | |
| | |
| | |
| | |
| | |
| |
| | |
| | |
| | |
| | |
| | |
| | |
| | |
|
| Common equity tier 1 capital | | 12.3 | % | | 12.0 | % | | 12.0 | % | | 11.8 | % | | n/a |
| | n/a |
| | n/a |
| | n/a |
|
| Tier 1 common capital | 11.19 | % | | 11.08 | % | | 10.83 | % | | 10.49 | % | | 11.06 | % | | 11.41 | % | | 11.24 | % | | 10.78 | % | n/a |
| | n/a |
| | n/a |
| | n/a |
| | 10.9 | % | | 10.8 | % | | 10.6 | % | | 10.3 | % |
| Tier 1 capital | 12.44 |
| | 12.33 |
| | 12.16 |
| | 12.22 |
| | 12.89 |
| | 13.64 |
| | 13.80 |
| | 13.37 |
| 13.4 |
| | 12.8 |
| | 12.5 |
| | 11.9 |
| | 12.2 |
| | 12.1 |
| | 11.9 |
| | 12.0 |
|
| Total capital | 15.44 |
| | 15.36 |
| | 15.27 |
| | 15.50 |
| | 16.31 |
| | 17.16 |
| | 17.51 |
| | 17.49 |
| 16.5 |
| | 15.8 |
| | 15.3 |
| | 14.8 |
| | 15.1 |
| | 15.1 |
| | 15.1 |
| | 15.3 |
|
| Tier 1 leverage | 7.86 |
| | 7.79 |
| | 7.49 |
| | 7.49 |
| | 7.37 |
| | 7.84 |
| | 7.84 |
| | 7.79 |
| 8.2 |
| | 7.9 |
| | 7.7 |
| | 7.4 |
| | 7.7 |
| | 7.6 |
| | 7.4 |
| | 7.4 |
|
Tangible equity (3) | 7.86 |
| | 7.73 |
| | 7.67 |
| | 7.78 |
| | 7.62 |
| | 7.85 |
| | 7.73 |
| | 7.48 |
| 8.4 |
| | 8.1 |
| | 7.9 |
| | 7.7 |
| | 7.9 |
| | 7.7 |
| | 7.7 |
| | 7.8 |
|
Tangible common equity (3) | 7.20 |
| | 7.08 |
| | 6.98 |
| | 6.88 |
| | 6.74 |
| | 6.95 |
| | 6.83 |
| | 6.58 |
| 7.5 |
| | 7.2 |
| | 7.1 |
| | 7.0 |
| | 7.2 |
| | 7.1 |
| | 7.0 |
| | 6.9 |
|
For footnotes see page 138129.
|
| | |
| | | Bank of America 20132014 139130 |
| | | | | | | | | | | | | | | | | | | | | | | | | |
Table XIII Quarterly Average Balances and Interest Rates – FTE Basis | Table XIII Quarterly Average Balances and Interest Rates – FTE Basis | Table XIII Quarterly Average Balances and Interest Rates – FTE Basis |
| | | | | | | | | | | | | | | | | | | | | | | |
| | Fourth Quarter 2013 | | Third Quarter 2013 | Fourth Quarter 2014 | | Third Quarter 2014 |
| (Dollars in millions) | Average Balance | | Interest
Income/ Expense | | Yield/ Rate | | Average Balance | | Interest
Income/ Expense | | Yield/ Rate | Average Balance | | Interest
Income/ Expense | | Yield/ Rate | | Average Balance | | Interest
Income/ Expense | | Yield/ Rate |
| Earning assets | |
| | |
| | |
| | |
| | |
| | |
| |
| | |
| | |
| | |
| | |
| | |
|
Time deposits placed and other short-term investments (1) | $ | 15,782 |
| | $ | 48 |
| | 1.21 | % | | $ | 17,256 |
| | $ | 47 |
| | 1.07 | % | |
Interest-bearing deposits with the Federal Reserve and non-U.S. central banks (1) | | $ | 109,042 |
| | $ | 74 |
| | 0.27 | % | | $ | 110,876 |
| | $ | 77 |
| | 0.28 | % |
| Time deposits placed and other short-term investments | | 9,339 |
| | 41 |
| | 1.73 |
| | 10,457 |
| | 41 |
| | 1.54 |
|
| Federal funds sold and securities borrowed or purchased under agreements to resell | 203,415 |
| | 304 |
| | 0.59 |
| | 223,434 |
| | 291 |
| | 0.52 |
| 217,982 |
| | 238 |
| | 0.43 |
| | 223,978 |
| | 239 |
| | 0.42 |
|
| Trading account assets | 156,194 |
| | 1,182 |
| | 3.01 |
| | 144,502 |
| | 1,093 |
| | 3.01 |
| 144,147 |
| | 1,141 |
| | 3.15 |
| | 143,282 |
| | 1,148 |
| | 3.18 |
|
Debt securities (2) | 325,119 |
| | 2,455 |
| | 3.02 |
| | 327,493 |
| | 2,211 |
| | 2.70 |
| 371,014 |
| | 1,687 |
| | 1.82 |
| | 359,653 |
| | 2,236 |
| | 2.48 |
|
Loans and leases (3): | | | | | | | |
| | |
| | |
| | | | | | | |
| | |
| | |
|
Residential mortgage (4) | 253,974 |
| | 2,374 |
| | 3.74 |
| | 256,297 |
| | 2,359 |
| | 3.68 |
| 223,132 |
| | 1,946 |
| | 3.49 |
| | 235,271 |
| | 2,083 |
| | 3.54 |
|
| Home equity | 95,388 |
| | 953 |
| | 3.97 |
| | 98,172 |
| | 930 |
| | 3.77 |
| 86,825 |
| | 809 |
| | 3.70 |
| | 88,590 |
| | 836 |
| | 3.76 |
|
| U.S. credit card | 90,057 |
| | 2,125 |
| | 9.36 |
| | 90,005 |
| | 2,226 |
| | 9.81 |
| 89,381 |
| | 2,086 |
| | 9.26 |
| | 88,866 |
| | 2,093 |
| | 9.34 |
|
| Non-U.S. credit card | 11,171 |
| | 310 |
| | 11.01 |
| | 10,633 |
| | 317 |
| | 11.81 |
| 10,950 |
| | 280 |
| | 10.14 |
| | 11,784 |
| | 304 |
| | 10.25 |
|
Direct/Indirect consumer (5) | 82,990 |
| | 565 |
| | 2.70 |
| | 83,773 |
| | 587 |
| | 2.78 |
| 83,121 |
| | 522 |
| | 2.49 |
| | 82,669 |
| | 523 |
| | 2.51 |
|
Other consumer (6) | 1,929 |
| | 17 |
| | 3.73 |
| | 1,867 |
| | 19 |
| | 3.89 |
| 2,031 |
| | 85 |
| | 16.75 |
| | 2,111 |
| | 19 |
| | 3.44 |
|
| Total consumer | 535,509 |
| | 6,344 |
| | 4.72 |
| | 540,747 |
| | 6,438 |
| | 4.74 |
| 495,440 |
| | 5,728 |
| | 4.60 |
| | 509,291 |
| | 5,858 |
| | 4.58 |
|
| U.S. commercial | 225,596 |
| | 1,700 |
| | 2.99 |
| | 221,542 |
| | 1,704 |
| | 3.05 |
| 231,217 |
| | 1,648 |
| | 2.83 |
| | 230,891 |
| | 1,658 |
| | 2.85 |
|
Commercial real estate (7) | 46,341 |
| | 374 |
| | 3.20 |
| | 43,164 |
| | 352 |
| | 3.24 |
| 46,993 |
| | 342 |
| | 2.89 |
| | 46,071 |
| | 344 |
| | 2.96 |
|
| Commercial lease financing | 24,468 |
| | 206 |
| | 3.37 |
| | 23,869 |
| | 204 |
| | 3.41 |
| 24,238 |
| | 198 |
| | 3.28 |
| | 24,325 |
| | 212 |
| | 3.48 |
|
| Non-U.S. commercial | 97,863 |
| | 544 |
| | 2.20 |
| | 94,656 |
| | 528 |
| | 2.22 |
| 86,845 |
| | 546 |
| | 2.49 |
| | 88,663 |
| | 560 |
| | 2.51 |
|
| Total commercial | 394,268 |
| | 2,824 |
| | 2.84 |
| | 383,231 |
| | 2,788 |
| | 2.89 |
| 389,293 |
| | 2,734 |
| | 2.79 |
| | 389,950 |
| | 2,774 |
| | 2.83 |
|
| Total loans and leases | 929,777 |
| | 9,168 |
| | 3.92 |
| | 923,978 |
| | 9,226 |
| | 3.97 |
| 884,733 |
| | 8,462 |
| | 3.80 |
| | 899,241 |
| | 8,632 |
| | 3.82 |
|
| Other earning assets | 78,214 |
| | 709 |
| | 3.61 |
| | 74,022 |
| | 677 |
| | 3.62 |
| 65,864 |
| | 739 |
| | 4.46 |
| | 65,995 |
| | 710 |
| | 4.27 |
|
Total earning assets (8) | 1,708,501 |
| | 13,866 |
| | 3.23 |
| | 1,710,685 |
| | 13,545 |
| | 3.15 |
| 1,802,121 |
| | 12,382 |
| | 2.74 |
| | 1,813,482 |
| | 13,083 |
| | 2.87 |
|
Cash and cash equivalents (1) | 125,259 |
| | 59 |
| | | | 113,064 |
| | 50 |
| | |
| |
Cash and due from banks (1) | | 27,590 |
| | | | | | 25,120 |
| | | | |
|
| Other assets, less allowance for loan and lease losses | 301,115 |
| | | | | | 299,681 |
| | |
| | |
| 307,840 |
| | | | | | 297,507 |
| | |
| | |
|
| Total assets | $ | 2,134,875 |
| | | | | | $ | 2,123,430 |
| | |
| | |
| $ | 2,137,551 |
| | | | | | $ | 2,136,109 |
| | |
| | |
|
| Interest-bearing liabilities | |
| | |
| | |
| | |
| | |
| | |
| |
| | |
| | |
| | |
| | |
| | |
|
| U.S. interest-bearing deposits: | |
| | |
| | |
| | |
| | |
| | |
| |
| | |
| | |
| | |
| | |
| | |
|
| Savings | $ | 43,665 |
| | $ | 5 |
| | 0.05 | % | | $ | 43,968 |
| | $ | 5 |
| | 0.05 | % | $ | 45,621 |
| | $ | 1 |
| | 0.01 | % | | $ | 46,803 |
| | $ | 1 |
| | 0.01 | % |
| NOW and money market deposit accounts | 514,220 |
| | 89 |
| | 0.07 |
| | 508,136 |
| | 100 |
| | 0.08 |
| 515,995 |
| | 76 |
| | 0.06 |
| | 517,043 |
| | 78 |
| | 0.06 |
|
| Consumer CDs and IRAs | 77,424 |
| | 97 |
| | 0.50 |
| | 81,190 |
| | 116 |
| | 0.56 |
| 61,880 |
| | 51 |
| | 0.33 |
| | 65,579 |
| | 59 |
| | 0.35 |
|
| Negotiable CDs, public funds and other deposits | 26,271 |
| | 28 |
| | 0.40 |
| | 24,079 |
| | 25 |
| | 0.42 |
| 30,951 |
| | 23 |
| | 0.29 |
| | 31,806 |
| | 27 |
| | 0.34 |
|
| Total U.S. interest-bearing deposits | 661,580 |
| | 219 |
| | 0.13 |
| | 657,373 |
| | 246 |
| | 0.15 |
| 654,447 |
| | 151 |
| | 0.09 |
| | 661,231 |
| | 165 |
| | 0.10 |
|
| Non-U.S. interest-bearing deposits: | | | | | | | |
| | |
| | |
| | | | | | | |
| | |
| | |
|
| Banks located in non-U.S. countries | 13,878 |
| | 18 |
| | 0.52 |
| | 12,789 |
| | 16 |
| | 0.47 |
| 5,413 |
| | 12 |
| | 0.88 |
| | 8,022 |
| | 22 |
| | 1.10 |
|
| Governments and official institutions | 1,258 |
| | — |
| | 0.22 |
| | 1,041 |
| | 1 |
| | 0.25 |
| 1,647 |
| | 1 |
| | 0.15 |
| | 1,706 |
| | 1 |
| | 0.15 |
|
| Time, savings and other | 59,029 |
| | 77 |
| | 0.51 |
| | 55,446 |
| | 71 |
| | 0.52 |
| 57,030 |
| | 73 |
| | 0.51 |
| | 61,331 |
| | 82 |
| | 0.54 |
|
| Total non-U.S. interest-bearing deposits | 74,165 |
| | 95 |
| | 0.51 |
| | 69,276 |
| | 88 |
| | 0.50 |
| 64,090 |
| | 86 |
| | 0.53 |
| | 71,059 |
| | 105 |
| | 0.59 |
|
| Total interest-bearing deposits | 735,745 |
| | 314 |
| | 0.17 |
| | 726,649 |
| | 334 |
| | 0.18 |
| 718,537 |
| | 237 |
| | 0.13 |
| | 732,290 |
| | 270 |
| | 0.15 |
|
| Federal funds purchased, securities loaned or sold under agreements to repurchase and short-term borrowings | 271,538 |
| | 682 |
| | 1.00 |
| | 279,425 |
| | 683 |
| | 0.97 |
| 251,432 |
| | 615 |
| | 0.97 |
| | 255,111 |
| | 591 |
| | 0.92 |
|
| Trading account liabilities | 82,393 |
| | 364 |
| | 1.75 |
| | 84,648 |
| | 375 |
| | 1.76 |
| 78,173 |
| | 351 |
| | 1.78 |
| | 84,988 |
| | 392 |
| | 1.83 |
|
| Long-term debt | 251,055 |
| | 1,566 |
| | 2.48 |
| | 258,717 |
| | 1,724 |
| | 2.65 |
| 249,221 |
| | 1,314 |
| | 2.10 |
| | 251,772 |
| | 1,386 |
| | 2.19 |
|
Total interest-bearing liabilities (8) | 1,340,731 |
| | 2,926 |
| | 0.87 |
| | 1,349,439 |
| | 3,116 |
| | 0.92 |
| 1,297,363 |
| | 2,517 |
| | 0.77 |
| | 1,324,161 |
| | 2,639 |
| | 0.79 |
|
| Noninterest-bearing sources: | | | | | | | |
| | |
| | |
| | | | | | | |
| | |
| | |
|
| Noninterest-bearing deposits | 376,929 |
| | | | | | 363,962 |
| | |
| | |
| 403,977 |
| | | | | | 395,198 |
| | |
| | |
|
| Other liabilities | 183,800 |
| | | | | | 179,637 |
| | |
| | |
| 192,763 |
| | | | | | 178,716 |
| | |
| | |
|
| Shareholders’ equity | 233,415 |
| | | | | | 230,392 |
| | |
| | |
| 243,448 |
| | | | | | 238,034 |
| | |
| | |
|
| Total liabilities and shareholders’ equity | $ | 2,134,875 |
| | | | | | $ | 2,123,430 |
| | |
| | |
| $ | 2,137,551 |
| | | | | | $ | 2,136,109 |
| | |
| | |
|
| Net interest spread | | | | | 2.36 | % | | |
| | |
| | 2.23 | % | | | | | 1.97 | % | | |
| | |
| | 2.08 | % |
| Impact of noninterest-bearing sources | | | | | 0.19 |
| | |
| | |
| | 0.20 |
| | | | | 0.21 |
| | |
| | |
| | 0.21 |
|
Net interest income/yield on earning assets (1) | | | $ | 10,940 |
| | 2.55 | % | | |
| | $ | 10,429 |
| | 2.43 | % | |
| Net interest income/yield on earning assets | | | | $ | 9,865 |
| | 2.18 | % | | |
| | $ | 10,444 |
| | 2.29 | % |
| |
(1) | For this presentation, fees earned on overnightBeginning in 2014, interest-bearing deposits placed with the Federal Reserve and certain non-U.S. central banks are included in earning assets. In prior periods, these balances were included with cash and due from banks in the cash and cash equivalents line, consistent with the Consolidated Balance Sheet presentation of these deposits. In addition, beginning in the third quarter of 2012, fees earned on deposits, primarily overnight, placed with certain non-U.S. central banks, which are included in the time deposits placed and other short-term investments line in priorpresentation. Prior periods are included in the cash and cash equivalents line. Net interest income and net interest yield are calculated excluding the fees included in the cash and cash equivalents line.have been reclassified to conform to current period presentation. |
| |
(2) | YieldsBeginning in 2014, yields on debt securities carried at fair value are calculated on the cost basis. Prior to 2014, yields on debt securities carried at fair value were calculated based on fair value rather than the cost basis. The use of fair value doesdid not have a material impact on net interest yield. |
| |
(3) | Nonperforming loans are included in the respective average loan balances. Income on these nonperforming loans is generally recognized on a cost recovery basis. PCIPurchased credit-impaired loans were recorded at fair value upon acquisition and accrete interest income over the remaining life of the loan. |
| |
(4) | Includes non-U.S. residential mortgage loans of $563 million, $833 million, $862 million and $900 million in the fourth, third, second and first quarters of 20132014, respectively, and $9356 million in the fourth quarter of 20122013., respectively. |
| |
(5) | Includes non-U.S. consumer loans of $5.14.2 billion, $6.74.3 billion, $7.54.4 billion and $7.74.6 billion in the fourth, third, second and first quarters of 20132014, respectively, and $8.15.1 billion in the fourth quarter of 20122013., respectively. |
| |
(6) | Includes consumer finance loans of $1.2907 million, $1.1 billion, $1.3 billion, $1.31.1 billion and $1.41.2 billion in the fourth, third, second and first quarters of 20132014, respectively, and $1.41.2 billion in the fourth quarter of 20122013;, respectively; consumer leases of $549965 million, $422887 million, $291762 million and $138656 million in the fourth, third, second and first quarters of 20132014, respectively, and $3549 million in the fourth quarter of 2012; other non-U.S. consumer loans of $5 million for each of the quarters of 2013, and $4 million in the fourth quarter of 2012; andrespectively; consumer overdrafts of $163156 million, $172161 million, $136137 million and $142140 million in the fourth, third, second and first quarters of 20132014, respectively, and $156163 million in the fourth quarter of 20122013, respectively; and other non-U.S. consumer loans of $3 million for each of the quarters of 2014, and $2 million in the fourth quarter of 2013. |
| |
(7) | Includes U.S. commercial real estate loans of $44.545.1 billion, $41.545.0 billion, $39.146.7 billion and $37.747.0 billion in the fourth, third, second and first quarters of 20132014, respectively, and $36.744.5 billion in the fourth quarter of 20122013;, respectively; and non-U.S. commercial real estate loans of $1.81.9 billion, $1.71.0 billion, $1.51.6 billion and $1.51.8 billion in the fourth, third, second and first quarters of 20132014, respectively, and $1.51.8 billion in the fourth quarter of 20122013., respectively. |
| |
(8) | Interest income includes the impact of interest rate risk management contracts, which decreased interest income on the underlying assets by $0, $110 million, $6330 million, $13 million and $1415 million in the fourth, third, second and first quarters of 20132014, respectively, and $1460 million in the fourth quarter of 20122013., respectively. Interest expense includes the impact of interest rate risk management contracts, which decreased interest expense on the underlying liabilities by $588659 million, $556602 million, $660621 million and $618592 million in the fourth, third, second and first quarters of 20132014, respectively, and $598588 million in the fourth quarter of 20122013., respectively. For more information on interest rate contracts, see Interest Rate Risk Management for NontradingNon-trading Activities on page 113105. |
|
| | |
140131 Bank of America 20132014
| | |
| | | | | | | | | | | | | | | | | | | | | | | | | | | | | | | | | | | | | |
Table XIII Quarterly Average Balances and Interest Rates – FTE Basis (continued) | Table XIII Quarterly Average Balances and Interest Rates – FTE Basis (continued) | Table XIII Quarterly Average Balances and Interest Rates – FTE Basis (continued) |
| | | | | | | | | | | | | | | | | | | | | | | | | | | | | | | | | | | |
| | Second Quarter 2013 | | First Quarter 2013 | | Fourth Quarter 2012 | Second Quarter 2014 | | First Quarter 2014 | | Fourth Quarter 2013 |
| (Dollars in millions) | Average Balance | | Interest
Income/ Expense | | Yield/ Rate | | Average Balance | | Interest
Income/ Expense | | Yield/ Rate | | Average Balance | | Interest
Income/ Expense | | Yield/ Rate | Average Balance | | Interest
Income/ Expense | | Yield/ Rate | | Average Balance | | Interest
Income/ Expense | | Yield/ Rate | | Average Balance | | Interest
Income/ Expense | | Yield/ Rate |
| Earning assets | |
| | |
| | |
| | |
| | |
| | |
| | |
| | |
| | |
| |
| | |
| | |
| | |
| | |
| | |
| | |
| | |
| | |
|
Time deposits placed and other short-term investments (1) | $ | 15,088 |
| | $ | 46 |
| | 1.21 | % | | $ | 16,129 |
| | $ | 46 |
| | 1.17 | % | | $ | 16,967 |
| | $ | 50 |
| | 1.14 | % | |
Interest-bearing deposits with the Federal Reserve and non-U.S. central banks (1) | | $ | 123,582 |
| | $ | 85 |
| | 0.28 | % | | $ | 112,570 |
| | $ | 72 |
| | 0.26 | % | | $ | 90,196 |
| | $ | 59 |
| | 0.26 | % |
| Time deposits placed and other short-term investments | | 10,509 |
| | 39 |
| | 1.51 |
| | 13,880 |
| | 49 |
| | 1.43 |
| | 15,782 |
| | 48 |
| | 1.21 |
|
| Federal funds sold and securities borrowed or purchased under agreements to resell | 233,394 |
| | 319 |
| | 0.55 |
| | 237,463 |
| | 315 |
| | 0.54 |
| | 241,950 |
| | 329 |
| | 0.54 |
| 235,393 |
| | 297 |
| | 0.51 |
| | 212,504 |
| | 265 |
| | 0.51 |
| | 203,415 |
| | 304 |
| | 0.59 |
|
| Trading account assets | 181,620 |
| | 1,224 |
| | 2.70 |
| | 194,364 |
| | 1,380 |
| | 2.87 |
| | 186,252 |
| | 1,362 |
| | 2.91 |
| 147,798 |
| | 1,214 |
| | 3.29 |
| | 147,583 |
| | 1,213 |
| | 3.32 |
| | 156,194 |
| | 1,182 |
| | 3.01 |
|
Debt securities (2) | 343,260 |
| | 2,557 |
| | 2.98 |
| | 356,399 |
| | 2,556 |
| | 2.87 |
| | 360,213 |
| | 2,201 |
| | 2.44 |
| 345,889 |
| | 2,134 |
| | 2.46 |
| | 329,711 |
| | 2,005 |
| | 2.41 |
| | 325,119 |
| | 2,454 |
| | 3.02 |
|
Loans and leases (3): | |
| | |
| | |
| | |
| | |
| | |
| | |
| | |
| | |
| |
| | |
| | |
| | |
| | |
| | |
| | |
| | |
| | |
|
Residential mortgage (4) | 257,275 |
| | 2,246 |
| | 3.49 |
| | 258,630 |
| | 2,340 |
| | 3.62 |
| | 256,564 |
| | 2,292 |
| | 3.57 |
| 243,405 |
| | 2,195 |
| | 3.61 |
| | 247,561 |
| | 2,238 |
| | 3.62 |
| | 253,988 |
| | 2,373 |
| | 3.74 |
|
| Home equity | 101,708 |
| | 951 |
| | 3.74 |
| | 105,939 |
| | 997 |
| | 3.80 |
| | 110,270 |
| | 1,068 |
| | 3.86 |
| 90,729 |
| | 842 |
| | 3.72 |
| | 92,754 |
| | 853 |
| | 3.71 |
| | 95,374 |
| | 954 |
| | 3.98 |
|
| U.S. credit card | 89,722 |
| | 2,192 |
| | 9.80 |
| | 91,712 |
| | 2,249 |
| | 9.95 |
| | 92,849 |
| | 2,336 |
| | 10.01 |
| 88,058 |
| | 2,042 |
| | 9.30 |
| | 89,545 |
| | 2,092 |
| | 9.48 |
| | 90,057 |
| | 2,125 |
| | 9.36 |
|
| Non-U.S. credit card | 10,613 |
| | 315 |
| | 11.93 |
| | 11,027 |
| | 329 |
| | 12.10 |
| | 13,081 |
| | 383 |
| | 11.66 |
| 11,759 |
| | 308 |
| | 10.51 |
| | 11,554 |
| | 308 |
| | 10.79 |
| | 11,171 |
| | 310 |
| | 11.01 |
|
Direct/Indirect consumer (5) | 82,485 |
| | 598 |
| | 2.90 |
| | 82,364 |
| | 620 |
| | 3.06 |
| | 82,583 |
| | 662 |
| | 3.19 |
| 82,102 |
| | 524 |
| | 2.56 |
| | 81,728 |
| | 530 |
| | 2.63 |
| | 82,990 |
| | 565 |
| | 2.70 |
|
Other consumer (6) | 1,756 |
| | 17 |
| | 4.17 |
| | 1,666 |
| | 19 |
| | 4.36 |
| | 1,602 |
| | 19 |
| | 4.57 |
| 2,012 |
| | 17 |
| | 3.60 |
| | 1,962 |
| | 18 |
| | 3.66 |
| | 1,929 |
| | 17 |
| | 3.73 |
|
| Total consumer | 543,559 |
| | 6,319 |
| | 4.66 |
| | 551,338 |
| | 6,554 |
| | 4.79 |
| | 556,949 |
| | 6,760 |
| | 4.84 |
| 518,065 |
| | 5,928 |
| | 4.58 |
| | 525,104 |
| | 6,039 |
| | 4.64 |
| | 535,509 |
| | 6,344 |
| | 4.72 |
|
| U.S. commercial | 217,464 |
| | 1,741 |
| | 3.21 |
| | 210,706 |
| | 1,666 |
| | 3.20 |
| | 209,496 |
| | 1,729 |
| | 3.28 |
| 230,486 |
| | 1,673 |
| | 2.91 |
| | 228,058 |
| | 1,651 |
| | 2.93 |
| | 225,596 |
| | 1,700 |
| | 2.99 |
|
Commercial real estate (7) | 40,612 |
| | 340 |
| | 3.36 |
| | 39,179 |
| | 326 |
| | 3.38 |
| | 38,192 |
| | 341 |
| | 3.55 |
| 48,315 |
| | 357 |
| | 2.97 |
| | 48,753 |
| | 368 |
| | 3.06 |
| | 46,341 |
| | 373 |
| | 3.20 |
|
| Commercial lease financing | 23,579 |
| | 205 |
| | 3.48 |
| | 23,534 |
| | 236 |
| | 4.01 |
| | 22,839 |
| | 184 |
| | 3.23 |
| 24,409 |
| | 193 |
| | 3.16 |
| | 24,727 |
| | 234 |
| | 3.78 |
| | 24,468 |
| | 206 |
| | 3.37 |
|
| Non-U.S. commercial | 89,020 |
| | 543 |
| | 2.45 |
| | 81,502 |
| | 467 |
| | 2.32 |
| | 65,690 |
| | 433 |
| | 2.62 |
| 91,305 |
| | 569 |
| | 2.50 |
| | 92,840 |
| | 543 |
| | 2.37 |
| | 97,863 |
| | 544 |
| | 2.21 |
|
| Total commercial | 370,675 |
| | 2,829 |
| | 3.06 |
| | 354,921 |
| | 2,695 |
| | 3.07 |
| | 336,217 |
| | 2,687 |
| | 3.18 |
| 394,515 |
| | 2,792 |
| | 2.84 |
| | 394,378 |
| | 2,796 |
| | 2.87 |
| | 394,268 |
| | 2,823 |
| | 2.84 |
|
| Total loans and leases | 914,234 |
| | 9,148 |
| | 4.01 |
| | 906,259 |
| | 9,249 |
| | 4.12 |
| | 893,166 |
| | 9,447 |
| | 4.21 |
| 912,580 |
| | 8,720 |
| | 3.83 |
| | 919,482 |
| | 8,835 |
| | 3.88 |
| | 929,777 |
| | 9,167 |
| | 3.92 |
|
| Other earning assets | 81,740 |
| | 713 |
| | 3.50 |
| | 90,172 |
| | 733 |
| | 3.29 |
| | 90,388 |
| | 771 |
| | 3.40 |
| 65,099 |
| | 665 |
| | 4.09 |
| | 67,568 |
| | 697 |
| | 4.18 |
| | 78,214 |
| | 711 |
| | 3.61 |
|
Total earning assets (8) | 1,769,336 |
| | 14,007 |
| | 3.17 |
| | 1,800,786 |
| | 14,279 |
| | 3.20 |
| | 1,788,936 |
| | 14,160 |
| | 3.16 |
| 1,840,850 |
| | 13,154 |
| | 2.86 |
| | 1,803,298 |
| | 13,136 |
| | 2.93 |
| | 1,798,697 |
| | 13,925 |
| | 3.08 |
|
Cash and cash equivalents (1) | 104,486 |
| | 40 |
| | |
| | 92,846 |
| | 33 |
| | |
| | 111,671 |
| | 42 |
| | |
| 27,377 |
| | | | |
| | 28,258 |
| | | | |
| | 35,063 |
| | | | |
|
| Other assets, less allowance for loan and lease losses | 310,788 |
| | |
| | |
| | 318,798 |
| | |
| | |
| | 309,758 |
| | |
| | |
| 301,328 |
| | |
| | |
| | 307,710 |
| | |
| | |
| | 301,115 |
| | |
| | |
|
| Total assets | $ | 2,184,610 |
| | |
| | |
| | $ | 2,212,430 |
| | |
| | |
| | $ | 2,210,365 |
| | |
| | |
| $ | 2,169,555 |
| | |
| | |
| | $ | 2,139,266 |
| | |
| | |
| | $ | 2,134,875 |
| | |
| | |
|
| Interest-bearing liabilities | |
| | |
| | |
| | |
| | |
| | |
| | |
| | |
| | |
| |
| | |
| | |
| | |
| | |
| | |
| | |
| | |
| | |
|
| U.S. interest-bearing deposits: | |
| | |
| | |
| | |
| | |
| | |
| | |
| | |
| | |
| |
| | |
| | |
| | |
| | |
| | |
| | |
| | |
| | |
|
| Savings | $ | 44,897 |
| | $ | 6 |
| | 0.05 | % | | $ | 42,934 |
| | $ | 6 |
| | 0.05 | % | | $ | 41,294 |
| | $ | 6 |
| | 0.06 | % | $ | 47,450 |
| | $ | — |
| | — | % | | $ | 45,196 |
| | $ | 1 |
| | 0.01 | % | | $ | 43,665 |
| | $ | 5 |
| | 0.05 | % |
| NOW and money market deposit accounts | 500,628 |
| | 107 |
| | 0.09 |
| | 501,177 |
| | 117 |
| | 0.09 |
| | 479,130 |
| | 146 |
| | 0.12 |
| 519,399 |
| | 79 |
| | 0.06 |
| | 523,237 |
| | 83 |
| | 0.06 |
| | 514,220 |
| | 89 |
| | 0.07 |
|
| Consumer CDs and IRAs | 85,001 |
| | 130 |
| | 0.62 |
| | 88,376 |
| | 138 |
| | 0.63 |
| | 91,256 |
| | 156 |
| | 0.68 |
| 68,706 |
| | 70 |
| | 0.41 |
| | 71,141 |
| | 84 |
| | 0.48 |
| | 74,635 |
| | 96 |
| | 0.51 |
|
| Negotiable CDs, public funds and other deposits | 22,721 |
| | 27 |
| | 0.46 |
| | 20,880 |
| | 26 |
| | 0.52 |
| | 19,904 |
| | 27 |
| | 0.54 |
| 33,412 |
| | 29 |
| | 0.35 |
| | 29,826 |
| | 27 |
| | 0.37 |
| | 29,060 |
| | 29 |
| | 0.39 |
|
| Total U.S. interest-bearing deposits | 653,247 |
| | 270 |
| | 0.17 |
| | 653,367 |
| | 287 |
| | 0.18 |
| | 631,584 |
| | 335 |
| | 0.21 |
| 668,967 |
| | 178 |
| | 0.11 |
| | 669,400 |
| | 195 |
| | 0.12 |
| | 661,580 |
| | 219 |
| | 0.13 |
|
| Non-U.S. interest-bearing deposits: | |
| | |
| | |
| | |
| | |
| | |
| | |
| | |
| | |
| |
| | |
| | |
| | |
| | |
| | |
| | |
| | |
| | |
|
| Banks located in non-U.S. countries | 10,832 |
| | 17 |
| | 0.64 |
| | 12,155 |
| | 19 |
| | 0.64 |
| | 11,970 |
| | 22 |
| | 0.71 |
| 10,538 |
| | 19 |
| | 0.72 |
| | 11,071 |
| | 21 |
| | 0.75 |
| | 13,902 |
| | 22 |
| | 0.62 |
|
| Governments and official institutions | 924 |
| | — |
| | 0.26 |
| | 901 |
| | 1 |
| | 0.23 |
| | 876 |
| | 1 |
| | 0.29 |
| 1,754 |
| | — |
| | 0.14 |
| | 1,857 |
| | 1 |
| | 0.14 |
| | 1,734 |
| | 1 |
| | 0.18 |
|
| Time, savings and other | 55,661 |
| | 79 |
| | 0.56 |
| | 54,597 |
| | 75 |
| | 0.56 |
| | 53,649 |
| | 80 |
| | 0.60 |
| 64,091 |
| | 85 |
| | 0.53 |
| | 60,506 |
| | 74 |
| | 0.50 |
| | 58,529 |
| | 72 |
| | 0.49 |
|
| Total non-U.S. interest-bearing deposits | 67,417 |
| | 96 |
| | 0.57 |
| | 67,653 |
| | 95 |
| | 0.57 |
| | 66,495 |
| | 103 |
| | 0.62 |
| 76,383 |
| | 104 |
| | 0.55 |
| | 73,434 |
| | 96 |
| | 0.53 |
| | 74,165 |
| | 95 |
| | 0.51 |
|
| Total interest-bearing deposits | 720,664 |
| | 366 |
| | 0.20 |
| | 721,020 |
| | 382 |
| | 0.22 |
| | 698,079 |
| | 438 |
| | 0.25 |
| 745,350 |
| | 282 |
| | 0.15 |
| | 742,834 |
| | 291 |
| | 0.16 |
| | 735,745 |
| | 314 |
| | 0.17 |
|
| Federal funds purchased, securities loaned or sold under agreements to repurchase and short-term borrowings | 318,028 |
| | 809 |
| | 1.02 |
| | 337,644 |
| | 749 |
| | 0.90 |
| | 336,341 |
| | 855 |
| | 1.01 |
| 271,247 |
| | 763 |
| | 1.13 |
| | 252,971 |
| | 609 |
| | 0.98 |
| | 271,538 |
| | 682 |
| | 1.00 |
|
| Trading account liabilities | 94,349 |
| | 427 |
| | 1.82 |
| | 92,047 |
| | 472 |
| | 2.08 |
| | 80,084 |
| | 420 |
| | 2.09 |
| 95,153 |
| | 398 |
| | 1.68 |
| | 90,448 |
| | 435 |
| | 1.95 |
| | 82,393 |
| | 364 |
| | 1.75 |
|
| Long-term debt | 270,198 |
| | 1,674 |
| | 2.48 |
| | 273,999 |
| | 1,834 |
| | 2.70 |
| | 277,894 |
| | 1,934 |
| | 2.77 |
| 259,825 |
| | 1,485 |
| | 2.29 |
| | 253,678 |
| | 1,515 |
| | 2.41 |
| | 251,055 |
| | 1,566 |
| | 2.48 |
|
Total interest-bearing liabilities (8) | 1,403,239 |
| | 3,276 |
| | 0.94 |
| | 1,424,710 |
| | 3,437 |
| | 0.98 |
| | 1,392,398 |
| | 3,647 |
| | 1.04 |
| 1,371,575 |
| | 2,928 |
| | 0.86 |
| | 1,339,931 |
| | 2,850 |
| | 0.86 |
| | 1,340,731 |
| | 2,926 |
| | 0.87 |
|
| Noninterest-bearing sources: | |
| | |
| | |
| | |
| | |
| | |
| | |
| | |
| | |
| |
| | |
| | |
| | |
| | |
| | |
| | |
| | |
| | |
|
| Noninterest-bearing deposits | 359,292 |
| | |
| | |
| | 354,260 |
| | |
| | |
| | 379,997 |
| | |
| | |
| 383,213 |
| | |
| | |
| | 375,344 |
| | |
| | |
| | 376,929 |
| | |
| | |
|
| Other liabilities | 187,016 |
| | |
| | |
| | 196,465 |
| | |
| | |
| | 199,458 |
| | |
| | |
| 178,970 |
| | |
| | |
| | 187,438 |
| | |
| | |
| | 183,800 |
| | |
| | |
|
| Shareholders’ equity | 235,063 |
| | |
| | |
| | 236,995 |
| | |
| | |
| | 238,512 |
| | |
| | |
| 235,797 |
| | |
| | |
| | 236,553 |
| | |
| | |
| | 233,415 |
| | |
| | |
|
| Total liabilities and shareholders’ equity | $ | 2,184,610 |
| | |
| | |
| | $ | 2,212,430 |
| | |
| | |
| | $ | 2,210,365 |
| | |
| | |
| $ | 2,169,555 |
| | |
| | |
| | $ | 2,139,266 |
| | |
| | |
| | $ | 2,134,875 |
| | |
| | |
|
| Net interest spread | |
| | |
| | 2.23 | % | | |
| | |
| | 2.22 | % | | |
| | |
| | 2.12 | % | |
| | |
| | 2.00 | % | | |
| | |
| | 2.07 | % | | |
| | |
| | 2.21 | % |
| Impact of noninterest-bearing sources | |
| | |
| | 0.20 |
| | |
| | |
| | 0.21 |
| | |
| | |
| | 0.22 |
| |
| | |
| | 0.22 |
| | |
| | |
| | 0.22 |
| | |
| | |
| | 0.23 |
|
Net interest income/yield on earning assets (1) | |
| | $ | 10,731 |
| | 2.43 | % | | |
| | $ | 10,842 |
| | 2.43 | % | | |
| | $ | 10,513 |
| | 2.34 | % | |
| Net interest income/yield on earning assets | | |
| | $ | 10,226 |
| | 2.22 | % | | |
| | $ | 10,286 |
| | 2.29 | % | | |
| | $ | 10,999 |
| | 2.44 | % |
140131.
|
| | |
| | | Bank of America 20132014 141132 |
| | | | | | | | | | | | | | | | | | | | | | | | | | | | | | | | | |
Table XIV Quarterly Supplemental Financial Data | Table XIV Quarterly Supplemental Financial Data | Table XIV Quarterly Supplemental Financial Data |
| | | | | | | | | | | | | | | | | | | | | | | | | | | | | | | |
| | 2013 Quarters | | 2012 Quarters | 2014 Quarters | | 2013 Quarters |
| (Dollars in millions, except per share information) | Fourth | | Third | | Second | | First | | Fourth | | Third | | Second | | First | Fourth | | Third | | Second | | First | | Fourth | | Third | | Second | | First |
Fully taxable-equivalent basis data (1) | |
| | |
| | |
| | |
| | |
| | |
| | |
| | |
| |
| | |
| | |
| | |
| | |
| | |
| | |
| | |
|
Net interest income (2) | $ | 10,999 |
| | $ | 10,479 |
| | $ | 10,771 |
| | $ | 10,875 |
| | $ | 10,555 |
| | $ | 10,167 |
| | $ | 9,782 |
| | $ | 11,053 |
| $ | 9,865 |
| | $ | 10,444 |
| | $ | 10,226 |
| | $ | 10,286 |
| | $ | 10,999 |
| | $ | 10,479 |
| | $ | 10,771 |
| | $ | 10,875 |
|
| Total revenue, net of interest expense | 21,701 |
| | 21,743 |
| | 22,949 |
| | 23,408 |
| | 18,891 |
| | 20,657 |
| | 22,202 |
| | 22,485 |
| 18,955 |
| | 21,434 |
| | 21,960 |
| | 22,767 |
| | 21,701 |
| | 21,743 |
| | 22,949 |
| | 23,408 |
|
Net interest yield (2) | 2.56 | % | | 2.44 | % | | 2.44 | % | | 2.43 | % | | 2.35 | % | | 2.32 | % | | 2.21 | % | | 2.51 | % | 2.18 | % | | 2.29 | % | | 2.22 | % | | 2.29 | % | | 2.44 | % | | 2.33 | % | | 2.35 | % | | 2.36 | % |
| Efficiency ratio | 79.75 |
| | 75.38 |
| | 69.80 |
| | 83.31 |
| | 97.19 |
| | 84.93 |
| | 76.79 |
| | 85.13 |
| 74.90 |
| | 93.97 |
| | 84.43 |
| | 97.68 |
| | 79.75 |
| | 75.38 |
| | 69.80 |
| | 83.31 |
|
| |
(1) | FTE basis is a non-GAAP financial measure. FTE basis is a performance measure used by management in operating the business that management believes provides investors with a more accurate picture of the interest margin for comparative purposes. For more information on these performance measures and ratios, see Supplemental Financial Data on page 3332 and for corresponding reconciliations to GAAP financial measures, see Statistical Table XVII. |
| |
(2) | Net interest income and net interest yield include fees earned on overnightBeginning in 2014, interest-bearing deposits placed with the Federal Reserve and fees earned on deposits, primarily overnight, placed with certain non-U.S. central banks.banks are included in earning assets. Prior period yields have been reclassified to conform to current period presentation. |
|
| | |
142133 Bank of America 20132014
| | |
| | | | | | | | | | | | | | | | | | | | | |
Table XV Five-year Reconciliations to GAAP Financial Measures (1) | Table XV Five-year Reconciliations to GAAP Financial Measures (1) | Table XV Five-year Reconciliations to GAAP Financial Measures (1) |
| | | | | | | | | | | | | | | | | | | |
| (Dollars in millions, shares in thousands) | 2013 | | 2012 | | 2011 | | 2010 | | 2009 | 2014 | | 2013 | | 2012 | | 2011 | | 2010 |
| Reconciliation of net interest income to net interest income on a fully taxable-equivalent basis | |
| | |
| | |
| | |
| | |
| |
| | |
| | |
| | |
| | |
|
| Net interest income | $ | 42,265 |
| | $ | 40,656 |
| | $ | 44,616 |
| | $ | 51,523 |
| | $ | 47,109 |
| $ | 39,952 |
| | $ | 42,265 |
| | $ | 40,656 |
| | $ | 44,616 |
| | $ | 51,523 |
|
| Fully taxable-equivalent adjustment | 859 |
| | 901 |
| | 972 |
| | 1,170 |
| | 1,301 |
| 869 |
| | 859 |
| | 901 |
| | 972 |
| | 1,170 |
|
| Net interest income on a fully taxable-equivalent basis | $ | 43,124 |
| | $ | 41,557 |
| | $ | 45,588 |
| | $ | 52,693 |
| | $ | 48,410 |
| $ | 40,821 |
| | $ | 43,124 |
| | $ | 41,557 |
| | $ | 45,588 |
| | $ | 52,693 |
|
| Reconciliation of total revenue, net of interest expense to total revenue, net of interest expense on a fully taxable-equivalent basis | |
| | |
| | |
| | |
| | |
| |
| | |
| | |
| | |
| | |
|
| Total revenue, net of interest expense | $ | 88,942 |
| | $ | 83,334 |
| | $ | 93,454 |
| | $ | 110,220 |
| | $ | 119,643 |
| $ | 84,247 |
| | $ | 88,942 |
| | $ | 83,334 |
| | $ | 93,454 |
| | $ | 110,220 |
|
| Fully taxable-equivalent adjustment | 859 |
| | 901 |
| | 972 |
| | 1,170 |
| | 1,301 |
| 869 |
| | 859 |
| | 901 |
| | 972 |
| | 1,170 |
|
| Total revenue, net of interest expense on a fully taxable-equivalent basis | $ | 89,801 |
| | $ | 84,235 |
| | $ | 94,426 |
| | $ | 111,390 |
| | $ | 120,944 |
| $ | 85,116 |
| | $ | 89,801 |
| | $ | 84,235 |
| | $ | 94,426 |
| | $ | 111,390 |
|
| Reconciliation of total noninterest expense to total noninterest expense, excluding goodwill impairment charges | |
| | |
| | |
| | |
| | |
| |
| | |
| | |
| | |
| | |
|
| Total noninterest expense | $ | 69,214 |
| | $ | 72,093 |
| | $ | 80,274 |
| | $ | 83,108 |
| | $ | 66,713 |
| $ | 75,117 |
| | $ | 69,214 |
| | $ | 72,093 |
| | $ | 80,274 |
| | $ | 83,108 |
|
| Goodwill impairment charges | — |
| | — |
| | (3,184 | ) | | (12,400 | ) | | — |
| — |
| | — |
| | — |
| | (3,184 | ) | | (12,400 | ) |
| Total noninterest expense, excluding goodwill impairment charges | $ | 69,214 |
| | $ | 72,093 |
| | $ | 77,090 |
| | $ | 70,708 |
| | $ | 66,713 |
| $ | 75,117 |
| | $ | 69,214 |
| | $ | 72,093 |
| | $ | 77,090 |
| | $ | 70,708 |
|
| Reconciliation of income tax expense (benefit) to income tax expense (benefit) on a fully taxable-equivalent basis | |
| | |
| | |
| | |
| | |
| |
| | |
| | |
| | |
| | |
|
| Income tax expense (benefit) | $ | 4,741 |
| | $ | (1,116 | ) | | $ | (1,676 | ) | | $ | 915 |
| | $ | (1,916 | ) | $ | 2,022 |
| | $ | 4,741 |
| | $ | (1,116 | ) | | $ | (1,676 | ) | | $ | 915 |
|
| Fully taxable-equivalent adjustment | 859 |
| | 901 |
| | 972 |
| | 1,170 |
| | 1,301 |
| 869 |
| | 859 |
| | 901 |
| | 972 |
| | 1,170 |
|
| Income tax expense (benefit) on a fully taxable-equivalent basis | $ | 5,600 |
| | $ | (215 | ) | | $ | (704 | ) | | $ | 2,085 |
| | $ | (615 | ) | $ | 2,891 |
| | $ | 5,600 |
| | $ | (215 | ) | | $ | (704 | ) | | $ | 2,085 |
|
| Reconciliation of net income (loss) to net income, excluding goodwill impairment charges | |
| | |
| | |
| | |
| | |
| |
| | |
| | |
| | |
| | |
|
| Net income (loss) | $ | 11,431 |
| | $ | 4,188 |
| | $ | 1,446 |
| | $ | (2,238 | ) | | $ | 6,276 |
| $ | 4,833 |
| | $ | 11,431 |
| | $ | 4,188 |
| | $ | 1,446 |
| | $ | (2,238 | ) |
| Goodwill impairment charges | — |
| | — |
| | 3,184 |
| | 12,400 |
| | — |
| — |
| | — |
| | — |
| | 3,184 |
| | 12,400 |
|
| Net income, excluding goodwill impairment charges | $ | 11,431 |
| | $ | 4,188 |
| | $ | 4,630 |
| | $ | 10,162 |
| | $ | 6,276 |
| $ | 4,833 |
| | $ | 11,431 |
| | $ | 4,188 |
| | $ | 4,630 |
| | $ | 10,162 |
|
| Reconciliation of net income (loss) applicable to common shareholders to net income (loss) applicable to common shareholders, excluding goodwill impairment charges | |
| | |
| | |
| | |
| | |
| |
| Reconciliation of net income (loss) applicable to common shareholders to net income applicable to common shareholders, excluding goodwill impairment charges | | |
| | |
| | |
| | |
| | |
|
| Net income (loss) applicable to common shareholders | $ | 10,082 |
| | $ | 2,760 |
| | $ | 85 |
| | $ | (3,595 | ) | | $ | (2,204 | ) | $ | 3,789 |
| | $ | 10,082 |
| | $ | 2,760 |
| | $ | 85 |
| | $ | (3,595 | ) |
| Goodwill impairment charges | — |
| | — |
| | 3,184 |
| | 12,400 |
| | — |
| — |
| | — |
| | — |
| | 3,184 |
| | 12,400 |
|
| Net income (loss) applicable to common shareholders, excluding goodwill impairment charges | $ | 10,082 |
| | $ | 2,760 |
| | $ | 3,269 |
| | $ | 8,805 |
| | $ | (2,204 | ) | |
| Net income applicable to common shareholders, excluding goodwill impairment charges | | $ | 3,789 |
| | $ | 10,082 |
| | $ | 2,760 |
| | $ | 3,269 |
| | $ | 8,805 |
|
| Reconciliation of average common shareholders’ equity to average tangible common shareholders’ equity | |
| | |
| | |
| | |
| | |
| |
| | |
| | |
| | |
| | |
|
| Common shareholders’ equity | $ | 218,468 |
| | $ | 216,996 |
| | $ | 211,709 |
| | $ | 212,686 |
| | $ | 182,288 |
| $ | 223,066 |
| | $ | 218,468 |
| | $ | 216,996 |
| | $ | 211,709 |
| | $ | 212,686 |
|
| Common Equivalent Securities | — |
| | — |
| | — |
| | 2,900 |
| | 1,213 |
| — |
| | — |
| | — |
| | — |
| | 2,900 |
|
| Goodwill | (69,910 | ) | | (69,974 | ) | | (72,334 | ) | | (82,600 | ) | | (86,034 | ) | (69,809 | ) | | (69,910 | ) | | (69,974 | ) | | (72,334 | ) | | (82,600 | ) |
| Intangible assets (excluding MSRs) | (6,132 | ) | | (7,366 | ) | | (9,180 | ) | | (10,985 | ) | | (12,220 | ) | (5,109 | ) | | (6,132 | ) | | (7,366 | ) | | (9,180 | ) | | (10,985 | ) |
| Related deferred tax liabilities | 2,328 |
| | 2,593 |
| | 2,898 |
| | 3,306 |
| | 3,831 |
| 2,090 |
| | 2,328 |
| | 2,593 |
| | 2,898 |
| | 3,306 |
|
| Tangible common shareholders’ equity | $ | 144,754 |
| | $ | 142,249 |
| | $ | 133,093 |
| | $ | 125,307 |
| | $ | 89,078 |
| $ | 150,238 |
| | $ | 144,754 |
| | $ | 142,249 |
| | $ | 133,093 |
| | $ | 125,307 |
|
| Reconciliation of average shareholders’ equity to average tangible shareholders’ equity | |
| | |
| | |
| | |
| | |
| |
| | |
| | |
| | |
| | |
|
| Shareholders’ equity | $ | 233,947 |
| | $ | 235,677 |
| | $ | 229,095 |
| | $ | 233,235 |
| | $ | 244,645 |
| $ | 238,476 |
| | $ | 233,947 |
| | $ | 235,677 |
| | $ | 229,095 |
| | $ | 233,235 |
|
| Goodwill | (69,910 | ) | | (69,974 | ) | | (72,334 | ) | | (82,600 | ) | | (86,034 | ) | (69,809 | ) | | (69,910 | ) | | (69,974 | ) | | (72,334 | ) | | (82,600 | ) |
| Intangible assets (excluding MSRs) | (6,132 | ) | | (7,366 | ) | | (9,180 | ) | | (10,985 | ) | | (12,220 | ) | (5,109 | ) | | (6,132 | ) | | (7,366 | ) | | (9,180 | ) | | (10,985 | ) |
| Related deferred tax liabilities | 2,328 |
| | 2,593 |
| | 2,898 |
| | 3,306 |
| | 3,831 |
| 2,090 |
| | 2,328 |
| | 2,593 |
| | 2,898 |
| | 3,306 |
|
| Tangible shareholders’ equity | $ | 160,233 |
| | $ | 160,930 |
| | $ | 150,479 |
| | $ | 142,956 |
| | $ | 150,222 |
| $ | 165,648 |
| | $ | 160,233 |
| | $ | 160,930 |
| | $ | 150,479 |
| | $ | 142,956 |
|
| Reconciliation of year-end common shareholders’ equity to year-end tangible common shareholders’ equity | |
| | |
| | |
| | |
| | |
| |
| | |
| | |
| | |
| | |
|
| Common shareholders’ equity | $ | 219,333 |
| | $ | 218,188 |
| | $ | 211,704 |
| | $ | 211,686 |
| | $ | 194,236 |
| $ | 224,162 |
| | $ | 219,333 |
| | $ | 218,188 |
| | $ | 211,704 |
| | $ | 211,686 |
|
| Common Equivalent Securities | — |
| | — |
| | — |
| | — |
| | 19,244 |
| |
| Goodwill | (69,844 | ) | | (69,976 | ) | | (69,967 | ) | | (73,861 | ) | | (86,314 | ) | (69,777 | ) | | (69,844 | ) | | (69,976 | ) | | (69,967 | ) | | (73,861 | ) |
| Intangible assets (excluding MSRs) | (5,574 | ) | | (6,684 | ) | | (8,021 | ) | | (9,923 | ) | | (12,026 | ) | (4,612 | ) | | (5,574 | ) | | (6,684 | ) | | (8,021 | ) | | (9,923 | ) |
| Related deferred tax liabilities | 2,166 |
| | 2,428 |
| | 2,702 |
| | 3,036 |
| | 3,498 |
| 1,960 |
| | 2,166 |
| | 2,428 |
| | 2,702 |
| | 3,036 |
|
| Tangible common shareholders’ equity | $ | 146,081 |
| | $ | 143,956 |
| | $ | 136,418 |
| | $ | 130,938 |
| | $ | 118,638 |
| $ | 151,733 |
| | $ | 146,081 |
| | $ | 143,956 |
| | $ | 136,418 |
| | $ | 130,938 |
|
| Reconciliation of year-end shareholders’ equity to year-end tangible shareholders’ equity | |
| | |
| | |
| | |
| | |
| |
| | |
| | |
| | |
| | |
|
| Shareholders’ equity | $ | 232,685 |
| | $ | 236,956 |
| | $ | 230,101 |
| | $ | 228,248 |
| | $ | 231,444 |
| $ | 243,471 |
| | $ | 232,685 |
| | $ | 236,956 |
| | $ | 230,101 |
| | $ | 228,248 |
|
| Goodwill | (69,844 | ) | | (69,976 | ) | | (69,967 | ) | | (73,861 | ) | | (86,314 | ) | (69,777 | ) | | (69,844 | ) | | (69,976 | ) | | (69,967 | ) | | (73,861 | ) |
| Intangible assets (excluding MSRs) | (5,574 | ) | | (6,684 | ) | | (8,021 | ) | | (9,923 | ) | | (12,026 | ) | (4,612 | ) | | (5,574 | ) | | (6,684 | ) | | (8,021 | ) | | (9,923 | ) |
| Related deferred tax liabilities | 2,166 |
| | 2,428 |
| | 2,702 |
| | 3,036 |
| | 3,498 |
| 1,960 |
| | 2,166 |
| | 2,428 |
| | 2,702 |
| | 3,036 |
|
| Tangible shareholders’ equity | $ | 159,433 |
| | $ | 162,724 |
| | $ | 154,815 |
| | $ | 147,500 |
| | $ | 136,602 |
| $ | 171,042 |
| | $ | 159,433 |
| | $ | 162,724 |
| | $ | 154,815 |
| | $ | 147,500 |
|
| Reconciliation of year-end assets to year-end tangible assets | |
| | |
| | |
| | |
| | |
| |
| | |
| | |
| | |
| | |
|
| Assets | $ | 2,102,273 |
| | $ | 2,209,974 |
| | $ | 2,129,046 |
| | $ | 2,264,909 |
| | $ | 2,230,232 |
| $ | 2,104,534 |
| | $ | 2,102,273 |
| | $ | 2,209,974 |
| | $ | 2,129,046 |
| | $ | 2,264,909 |
|
| Goodwill | (69,844 | ) | | (69,976 | ) | | (69,967 | ) | | (73,861 | ) | | (86,314 | ) | (69,777 | ) | | (69,844 | ) | | (69,976 | ) | | (69,967 | ) | | (73,861 | ) |
| Intangible assets (excluding MSRs) | (5,574 | ) | | (6,684 | ) | | (8,021 | ) | | (9,923 | ) | | (12,026 | ) | (4,612 | ) | | (5,574 | ) | | (6,684 | ) | | (8,021 | ) | | (9,923 | ) |
| Related deferred tax liabilities | 2,166 |
| | 2,428 |
| | 2,702 |
| | 3,036 |
| | 3,498 |
| 1,960 |
| | 2,166 |
| | 2,428 |
| | 2,702 |
| | 3,036 |
|
| Tangible assets | $ | 2,029,021 |
| | $ | 2,135,742 |
| | $ | 2,053,760 |
| | $ | 2,184,161 |
| | $ | 2,135,390 |
| $ | 2,032,105 |
| | $ | 2,029,021 |
| | $ | 2,135,742 |
| | $ | 2,053,760 |
| | $ | 2,184,161 |
|
| Reconciliation of year-end common shares outstanding to year-end tangible common shares outstanding | |
| | |
| | |
| | |
| | |
| |
| Common shares outstanding | 10,591,808 |
| | 10,778,264 |
| | 10,535,938 |
| | 10,085,155 |
| | 8,650,244 |
| |
Assumed conversion of common equivalent shares (2) | — |
| | — |
| | — |
| | — |
| | 1,286,000 |
| |
| Tangible common shares outstanding | 10,591,808 |
| | 10,778,264 |
| | 10,535,938 |
| | 10,085,155 |
| | 9,936,244 |
| |
| |
(1) | Presents reconciliations of non-GAAP financial measures to GAAP financial measures. We believe the use of these non-GAAP financial measures provides additional clarity in assessing the results of the Corporation. Other companies may define or calculate these measures differently. For more information on non-GAAP financial measures and ratios we use in assessing the results of the Corporation, see Supplemental Financial Data on page 3332. |
| |
(2)
| On February 24, 2010, the common equivalent shares converted into common shares. |
|
| | |
| | | Bank of America 20132014 143134 |
| | | | | | | | | |
Table XVI Two-year Reconciliations to GAAP Financial Measures (1, 2) | Table XVI Two-year Reconciliations to GAAP Financial Measures (1, 2) | Table XVI Two-year Reconciliations to GAAP Financial Measures (1, 2) |
| | | | | | | |
| (Dollars in millions) | 2013 | | 2012 | 2014 | | 2013 |
| Consumer & Business Banking | |
| | |
| |
| | |
|
| Reported net income | $ | 6,588 |
| | $ | 5,546 |
| $ | 7,096 |
| | $ | 6,647 |
|
Adjustment related to intangibles (3) | 7 |
| | 13 |
| 4 |
| | 7 |
|
| Adjusted net income | $ | 6,595 |
| | $ | 5,559 |
| $ | 7,100 |
| | $ | 6,654 |
|
| | | | | | | |
Average allocated equity (4) | $ | 62,045 |
| | $ | 56,214 |
| $ | 61,449 |
| | $ | 62,037 |
|
| Adjustment related to goodwill and a percentage of intangibles | (32,045 | ) | | (32,163 | ) | (31,949 | ) | | (32,037 | ) |
| Average allocated capital/economic capital | $ | 30,000 |
| | $ | 24,051 |
| |
| Average allocated capital | | $ | 29,500 |
| | $ | 30,000 |
|
| | | | | | | |
| Deposits | | | | | | |
| Reported net income | $ | 2,127 |
| | $ | 1,261 |
| $ | 2,847 |
| | $ | 2,123 |
|
Adjustment related to intangibles (3) | 1 |
| | 2 |
| — |
| | 1 |
|
| Adjusted net income | $ | 2,128 |
| | $ | 1,263 |
| $ | 2,847 |
| | $ | 2,124 |
|
| | | | | | | |
Average allocated equity (4) | $ | 35,400 |
| | $ | 33,006 |
| $ | 36,484 |
| | $ | 35,392 |
|
| Adjustment related to goodwill and a percentage of intangibles | (20,000 | ) | | (20,021 | ) | (19,984 | ) | | (19,992 | ) |
| Average allocated capital/economic capital | $ | 15,400 |
| | $ | 12,985 |
| |
| Average allocated capital | | $ | 16,500 |
| | $ | 15,400 |
|
| | | | | | | |
| Consumer Lending | | | | | | |
| Reported net income | $ | 4,461 |
| | $ | 4,285 |
| $ | 4,249 |
| | $ | 4,524 |
|
Adjustment related to intangibles (3) | 7 |
| | 12 |
| 4 |
| | 7 |
|
| Adjusted net income | $ | 4,468 |
| | $ | 4,297 |
| $ | 4,253 |
| | $ | 4,531 |
|
| | | | | | | |
Average allocated equity (4) | $ | 26,644 |
| | $ | 23,208 |
| $ | 24,965 |
| | $ | 26,644 |
|
| Adjustment related to goodwill and a percentage of intangibles | (12,044 | ) | | (12,142 | ) | (11,965 | ) | | (12,044 | ) |
| Average allocated capital/economic capital | $ | 14,600 |
| | $ | 11,066 |
| |
| Average allocated capital | | $ | 13,000 |
| | $ | 14,600 |
|
| | | | | | | |
| Global Wealth & Investment Management | | | | | | |
| Reported net income | $ | 2,974 |
| | $ | 2,245 |
| $ | 2,974 |
| | $ | 2,977 |
|
Adjustment related to intangibles (3) | 16 |
| | 22 |
| 13 |
| | 16 |
|
| Adjusted net income | $ | 2,990 |
| | $ | 2,267 |
| $ | 2,987 |
| | $ | 2,993 |
|
| | | | | | | |
Average allocated equity (4) | $ | 20,292 |
| | $ | 17,729 |
| $ | 22,214 |
| | $ | 20,292 |
|
| Adjustment related to goodwill and a percentage of intangibles | (10,292 | ) | | (10,370 | ) | (10,214 | ) | | (10,292 | ) |
| Average allocated capital/economic capital | $ | 10,000 |
| | $ | 7,359 |
| |
| Average allocated capital | | $ | 12,000 |
| | $ | 10,000 |
|
| | | | | | | |
| Global Banking | | | | | | |
| Reported net income | $ | 4,974 |
| | $ | 5,344 |
| $ | 5,435 |
| | $ | 4,973 |
|
Adjustment related to intangibles (3) | 2 |
| | 4 |
| 2 |
| | 3 |
|
| Adjusted net income | $ | 4,976 |
| | $ | 5,348 |
| $ | 5,437 |
| | $ | 4,976 |
|
| | | | | | | |
Average allocated equity (4) | $ | 45,412 |
| | $ | 41,742 |
| $ | 53,404 |
| | $ | 45,412 |
|
| Adjustment related to goodwill and a percentage of intangibles | (22,412 | ) | | (22,430 | ) | (22,404 | ) | | (22,412 | ) |
| Average allocated capital/economic capital | $ | 23,000 |
| | $ | 19,312 |
| |
| Average allocated capital | | $ | 31,000 |
| | $ | 23,000 |
|
| | | | | | | |
| Global Markets | | | | | | |
| Reported net income | $ | 1,563 |
| | $ | 1,229 |
| $ | 2,719 |
| | $ | 1,153 |
|
Adjustment related to intangibles (3) | 8 |
| | 9 |
| 9 |
| | 9 |
|
| Adjusted net income | $ | 1,571 |
| | $ | 1,238 |
| $ | 2,728 |
| | $ | 1,162 |
|
| | | | | | | |
Average allocated equity (4) | $ | 35,373 |
| | $ | 19,193 |
| $ | 39,374 |
| | $ | 35,370 |
|
| Adjustment related to goodwill and a percentage of intangibles | (5,373 | ) | | (5,369 | ) | (5,374 | ) | | (5,370 | ) |
| Average allocated capital/economic capital | $ | 30,000 |
| | $ | 13,824 |
| |
| Average allocated capital | | $ | 34,000 |
| | $ | 30,000 |
|
| |
(1) | Presents reconciliations of non-GAAP financial measures to GAAP financial measures. We believe the use of these non-GAAP financial measures provides additional clarity in assessing the results of the Corporation and our segments. Other companies may define or calculate these measures differently. For more information on non-GAAP financial measures and ratios we use in assessing the results of the Corporation, see Supplemental Financial Data on page 3332. |
| |
(2) | There are no adjustments to reported net income (loss) or average allocated equity for CRES. |
| |
(3) | Represents cost of funds, earnings credits and certain expenses related to intangibles. |
| |
(4) | Average allocated equity is comprised of average allocated capital (or economic capital prior to 2013) plus capital for the portion of goodwill and intangibles specifically assigned to the business segment. For more information on allocated capital, and economic capital, see Business Segment Operations on page 3534 and Note 8 – Goodwill and Intangible Assets to the Consolidated Financial Statements. |
|
| | |
144135 Bank of America 20132014
| | |
| | | | | | | | | | | | | | | | | | | | | | | | | | | | | | | | | |
Table XVII Quarterly Reconciliations to GAAP Financial Measures (1) | Table XVII Quarterly Reconciliations to GAAP Financial Measures (1) | Table XVII Quarterly Reconciliations to GAAP Financial Measures (1) |
| | | | | | | | | | | | | | | | | | | | | | | | | | | | | | | |
| | 2013 Quarters | | 2012 Quarters | 2014 Quarters | | 2013 Quarters |
| (Dollars in millions) | Fourth | | Third | | Second | | First | | Fourth | | Third | | Second | | First | Fourth | | Third | | Second | | First | | Fourth | | Third | | Second | | First |
| Reconciliation of net interest income to net interest income on a fully taxable-equivalent basis | |
| | |
| | |
| | |
| | |
| | |
| | |
| | |
| |
| | |
| | |
| | |
| | |
| | |
| | |
| | |
|
| Net interest income | $ | 10,786 |
| | $ | 10,266 |
| | $ | 10,549 |
| | $ | 10,664 |
| | $ | 10,324 |
| | $ | 9,938 |
| | $ | 9,548 |
| | $ | 10,846 |
| $ | 9,635 |
| | $ | 10,219 |
| | $ | 10,013 |
| | $ | 10,085 |
| | $ | 10,786 |
| | $ | 10,266 |
| | $ | 10,549 |
| | $ | 10,664 |
|
| Fully taxable-equivalent adjustment | 213 |
| | 213 |
| | 222 |
| | 211 |
| | 231 |
| | 229 |
| | 234 |
| | 207 |
| 230 |
| | 225 |
| | 213 |
| | 201 |
| | 213 |
| | 213 |
| | 222 |
| | 211 |
|
| Net interest income on a fully taxable-equivalent basis | $ | 10,999 |
| | $ | 10,479 |
| | $ | 10,771 |
| | $ | 10,875 |
| | $ | 10,555 |
| | $ | 10,167 |
| | $ | 9,782 |
| | $ | 11,053 |
| $ | 9,865 |
| | $ | 10,444 |
| | $ | 10,226 |
| | $ | 10,286 |
| | $ | 10,999 |
| | $ | 10,479 |
| | $ | 10,771 |
| | $ | 10,875 |
|
| Reconciliation of total revenue, net of interest expense to total revenue, net of interest expense on a fully taxable-equivalent basis | |
| | |
| | |
| | |
| | |
| | |
| | |
| | |
| |
| | |
| | |
| | |
| | |
| | |
| | |
| | |
|
| Total revenue, net of interest expense | $ | 21,488 |
| | $ | 21,530 |
| | $ | 22,727 |
| | $ | 23,197 |
| | $ | 18,660 |
| | $ | 20,428 |
| | $ | 21,968 |
| | $ | 22,278 |
| $ | 18,725 |
| | $ | 21,209 |
| | $ | 21,747 |
| | $ | 22,566 |
| | $ | 21,488 |
| | $ | 21,530 |
| | $ | 22,727 |
| | $ | 23,197 |
|
| Fully taxable-equivalent adjustment | 213 |
| | 213 |
| | 222 |
| | 211 |
| | 231 |
| | 229 |
| | 234 |
| | 207 |
| 230 |
| | 225 |
| | 213 |
| | 201 |
| | 213 |
| | 213 |
| | 222 |
| | 211 |
|
| Total revenue, net of interest expense on a fully taxable-equivalent basis | $ | 21,701 |
| | $ | 21,743 |
| | $ | 22,949 |
| | $ | 23,408 |
| | $ | 18,891 |
| | $ | 20,657 |
| | $ | 22,202 |
| | $ | 22,485 |
| $ | 18,955 |
| | $ | 21,434 |
| | $ | 21,960 |
| | $ | 22,767 |
| | $ | 21,701 |
| | $ | 21,743 |
| | $ | 22,949 |
| | $ | 23,408 |
|
| Reconciliation of income tax expense (benefit) to income tax expense (benefit) on a fully taxable-equivalent basis | |
| | |
| | |
| | |
| | |
| | |
| | |
| | |
| |
| | |
| | |
| | |
| | |
| | |
| | |
| | |
|
| Income tax expense (benefit) | $ | 406 |
| | $ | 2,348 |
| | $ | 1,486 |
| | $ | 501 |
| | $ | (2,636 | ) | | $ | 770 |
| | $ | 684 |
| | $ | 66 |
| $ | 1,260 |
| | $ | 663 |
| | $ | 504 |
| | $ | (405 | ) | | $ | 406 |
| | $ | 2,348 |
| | $ | 1,486 |
| | $ | 501 |
|
| Fully taxable-equivalent adjustment | 213 |
| | 213 |
| | 222 |
| | 211 |
| | 231 |
| | 229 |
| | 234 |
| | 207 |
| 230 |
| | 225 |
| | 213 |
| | 201 |
| | 213 |
| | 213 |
| | 222 |
| | 211 |
|
| Income tax expense (benefit) on a fully taxable-equivalent basis | $ | 619 |
| | $ | 2,561 |
| | $ | 1,708 |
| | $ | 712 |
| | $ | (2,405 | ) | | $ | 999 |
| | $ | 918 |
| | $ | 273 |
| $ | 1,490 |
| | $ | 888 |
| | $ | 717 |
| | $ | (204 | ) | | $ | 619 |
| | $ | 2,561 |
| | $ | 1,708 |
| | $ | 712 |
|
| Reconciliation of average common shareholders’ equity to average tangible common shareholders’ equity | |
| | |
| | |
| | |
| | |
| | |
| | |
| | |
| |
| | |
| | |
| | |
| | |
| | |
| | |
| | |
|
| Common shareholders’ equity | $ | 220,088 |
| | $ | 216,766 |
| | $ | 218,790 |
| | $ | 218,225 |
| | $ | 219,744 |
| | $ | 217,273 |
| | $ | 216,782 |
| | $ | 214,150 |
| $ | 224,473 |
| | $ | 222,368 |
| | $ | 222,215 |
| | $ | 223,201 |
| | $ | 220,088 |
| | $ | 216,766 |
| | $ | 218,790 |
| | $ | 218,225 |
|
| Goodwill | (69,864 | ) | | (69,903 | ) | | (69,930 | ) | | (69,945 | ) | | (69,976 | ) | | (69,976 | ) | | (69,976 | ) | | (69,967 | ) | (69,782 | ) | | (69,792 | ) | | (69,822 | ) | | (69,842 | ) | | (69,864 | ) | | (69,903 | ) | | (69,930 | ) | | (69,945 | ) |
| Intangible assets (excluding MSRs) | (5,725 | ) | | (5,993 | ) | | (6,270 | ) | | (6,549 | ) | | (6,874 | ) | | (7,194 | ) | | (7,533 | ) | | (7,869 | ) | (4,747 | ) | | (4,992 | ) | | (5,235 | ) | | (5,474 | ) | | (5,725 | ) | | (5,993 | ) | | (6,270 | ) | | (6,549 | ) |
| Related deferred tax liabilities | 2,231 |
| | 2,296 |
| | 2,360 |
| | 2,425 |
| | 2,490 |
| | 2,556 |
| | 2,626 |
| | 2,700 |
| 2,019 |
| | 2,077 |
| | 2,100 |
| | 2,165 |
| | 2,231 |
| | 2,296 |
| | 2,360 |
| | 2,425 |
|
| Tangible common shareholders’ equity | $ | 146,730 |
| | $ | 143,166 |
| | $ | 144,950 |
| | $ | 144,156 |
| | $ | 145,384 |
| | $ | 142,659 |
| | $ | 141,899 |
| | $ | 139,014 |
| $ | 151,963 |
| | $ | 149,661 |
| | $ | 149,258 |
| | $ | 150,050 |
| | $ | 146,730 |
| | $ | 143,166 |
| | $ | 144,950 |
| | $ | 144,156 |
|
| Reconciliation of average shareholders’ equity to average tangible shareholders’ equity | |
| | |
| | |
| | |
| | |
| | |
| | |
| | |
| |
| | |
| | |
| | |
| | |
| | |
| | |
| | |
|
| Shareholders’ equity | $ | 233,415 |
| | $ | 230,392 |
| | $ | 235,063 |
| | $ | 236,995 |
| | $ | 238,512 |
| | $ | 236,039 |
| | $ | 235,558 |
| | $ | 232,566 |
| $ | 243,448 |
| | $ | 238,034 |
| | $ | 235,797 |
| | $ | 236,553 |
| | $ | 233,415 |
| | $ | 230,392 |
| | $ | 235,063 |
| | $ | 236,995 |
|
| Goodwill | (69,864 | ) | | (69,903 | ) | | (69,930 | ) | | (69,945 | ) | | (69,976 | ) | | (69,976 | ) | | (69,976 | ) | | (69,967 | ) | (69,782 | ) | | (69,792 | ) | | (69,822 | ) | | (69,842 | ) | | (69,864 | ) | | (69,903 | ) | | (69,930 | ) | | (69,945 | ) |
| Intangible assets (excluding MSRs) | (5,725 | ) | | (5,993 | ) | | (6,270 | ) | | (6,549 | ) | | (6,874 | ) | | (7,194 | ) | | (7,533 | ) | | (7,869 | ) | (4,747 | ) | | (4,992 | ) | | (5,235 | ) | | (5,474 | ) | | (5,725 | ) | | (5,993 | ) | | (6,270 | ) | | (6,549 | ) |
| Related deferred tax liabilities | 2,231 |
| | 2,296 |
| | 2,360 |
| | 2,425 |
| | 2,490 |
| | 2,556 |
| | 2,626 |
| | 2,700 |
| 2,019 |
| | 2,077 |
| | 2,100 |
| | 2,165 |
| | 2,231 |
| | 2,296 |
| | 2,360 |
| | 2,425 |
|
| Tangible shareholders’ equity | $ | 160,057 |
| | $ | 156,792 |
| | $ | 161,223 |
| | $ | 162,926 |
| | $ | 164,152 |
| | $ | 161,425 |
| | $ | 160,675 |
| | $ | 157,430 |
| $ | 170,938 |
| | $ | 165,327 |
| | $ | 162,840 |
| | $ | 163,402 |
| | $ | 160,057 |
| | $ | 156,792 |
| | $ | 161,223 |
| | $ | 162,926 |
|
| Reconciliation of period-end common shareholders’ equity to period-end tangible common shareholders’ equity | |
| | |
| | |
| | |
| | |
| | |
| | |
| | |
| |
| | |
| | |
| | |
| | |
| | |
| | |
| | |
|
| Common shareholders’ equity | $ | 219,333 |
| | $ | 218,967 |
| | $ | 216,791 |
| | $ | 218,513 |
| | $ | 218,188 |
| | $ | 219,838 |
| | $ | 217,213 |
| | $ | 213,711 |
| $ | 224,162 |
| | $ | 220,768 |
| | $ | 222,565 |
| | $ | 218,536 |
| | $ | 219,333 |
| | $ | 218,967 |
| | $ | 216,791 |
| | $ | 218,513 |
|
| Goodwill | (69,844 | ) | | (69,891 | ) | | (69,930 | ) | | (69,930 | ) | | (69,976 | ) | | (69,976 | ) | | (69,976 | ) | | (69,976 | ) | (69,777 | ) | | (69,784 | ) | | (69,810 | ) | | (69,842 | ) | | (69,844 | ) | | (69,891 | ) | | (69,930 | ) | | (69,930 | ) |
| Intangible assets (excluding MSRs) | (5,574 | ) | | (5,843 | ) | | (6,104 | ) | | (6,379 | ) | | (6,684 | ) | | (7,030 | ) | | (7,335 | ) | | (7,696 | ) | (4,612 | ) | | (4,849 | ) | | (5,099 | ) | | (5,337 | ) | | (5,574 | ) | | (5,843 | ) | | (6,104 | ) | | (6,379 | ) |
| Related deferred tax liabilities | 2,166 |
| | 2,231 |
| | 2,297 |
| | 2,363 |
| | 2,428 |
| | 2,494 |
| | 2,559 |
| | 2,628 |
| 1,960 |
| | 2,019 |
| | 2,078 |
| | 2,100 |
| | 2,166 |
| | 2,231 |
| | 2,297 |
| | 2,363 |
|
| Tangible common shareholders’ equity | $ | 146,081 |
| | $ | 145,464 |
| | $ | 143,054 |
| | $ | 144,567 |
| | $ | 143,956 |
| | $ | 145,326 |
| | $ | 142,461 |
| | $ | 138,667 |
| $ | 151,733 |
| | $ | 148,154 |
| | $ | 149,734 |
| | $ | 145,457 |
| | $ | 146,081 |
| | $ | 145,464 |
| | $ | 143,054 |
| | $ | 144,567 |
|
| Reconciliation of period-end shareholders’ equity to period-end tangible shareholders’ equity | |
| | |
| | |
| | |
| | |
| | |
| | |
| | |
| |
| | |
| | |
| | |
| | |
| | |
| | |
| | |
|
| Shareholders’ equity | $ | 232,685 |
| | $ | 232,282 |
| | $ | 231,032 |
| | $ | 237,293 |
| | $ | 236,956 |
| | $ | 238,606 |
| | $ | 235,975 |
| | $ | 232,499 |
| $ | 243,471 |
| | $ | 238,681 |
| | $ | 237,411 |
| | $ | 231,888 |
| | $ | 232,685 |
| | $ | 232,282 |
| | $ | 231,032 |
| | $ | 237,293 |
|
| Goodwill | (69,844 | ) | | (69,891 | ) | | (69,930 | ) | | (69,930 | ) | | (69,976 | ) | | (69,976 | ) | | (69,976 | ) | | (69,976 | ) | (69,777 | ) | | (69,784 | ) | | (69,810 | ) | | (69,842 | ) | | (69,844 | ) | | (69,891 | ) | | (69,930 | ) | | (69,930 | ) |
| Intangible assets (excluding MSRs) | (5,574 | ) | | (5,843 | ) | | (6,104 | ) | | (6,379 | ) | | (6,684 | ) | | (7,030 | ) | | (7,335 | ) | | (7,696 | ) | (4,612 | ) | | (4,849 | ) | | (5,099 | ) | | (5,337 | ) | | (5,574 | ) | | (5,843 | ) | | (6,104 | ) | | (6,379 | ) |
| Related deferred tax liabilities | 2,166 |
| | 2,231 |
| | 2,297 |
| | 2,363 |
| | 2,428 |
| | 2,494 |
| | 2,559 |
| | 2,628 |
| 1,960 |
| | 2,019 |
| | 2,078 |
| | 2,100 |
| | 2,166 |
| | 2,231 |
| | 2,297 |
| | 2,363 |
|
| Tangible shareholders’ equity | $ | 159,433 |
| | $ | 158,779 |
| | $ | 157,295 |
| | $ | 163,347 |
| | $ | 162,724 |
| | $ | 164,094 |
| | $ | 161,223 |
| | $ | 157,455 |
| $ | 171,042 |
| | $ | 166,067 |
| | $ | 164,580 |
| | $ | 158,809 |
| | $ | 159,433 |
| | $ | 158,779 |
| | $ | 157,295 |
| | $ | 163,347 |
|
| Reconciliation of period-end assets to period-end tangible assets | |
| | |
| | |
| | |
| | |
| | |
| | |
| | |
| |
| | |
| | |
| | |
| | |
| | |
| | |
| | |
|
| Assets | $ | 2,102,273 |
| | $ | 2,126,653 |
| | $ | 2,123,320 |
| | $ | 2,174,819 |
| | $ | 2,209,974 |
| | $ | 2,166,162 |
| | $ | 2,160,854 |
| | $ | 2,181,449 |
| $ | 2,104,534 |
| | $ | 2,123,613 |
| | $ | 2,170,557 |
| | $ | 2,149,851 |
| | $ | 2,102,273 |
| | $ | 2,126,653 |
| | $ | 2,123,320 |
| | $ | 2,174,819 |
|
| Goodwill | (69,844 | ) | | (69,891 | ) | | (69,930 | ) | | (69,930 | ) | | (69,976 | ) | | (69,976 | ) | | (69,976 | ) | | (69,976 | ) | (69,777 | ) | | (69,784 | ) | | (69,810 | ) | | (69,842 | ) | | (69,844 | ) | | (69,891 | ) | | (69,930 | ) | | (69,930 | ) |
| Intangible assets (excluding MSRs) | (5,574 | ) | | (5,843 | ) | | (6,104 | ) | | (6,379 | ) | | (6,684 | ) | | (7,030 | ) | | (7,335 | ) | | (7,696 | ) | (4,612 | ) | | (4,849 | ) | | (5,099 | ) | | (5,337 | ) | | (5,574 | ) | | (5,843 | ) | | (6,104 | ) | | (6,379 | ) |
| Related deferred tax liabilities | 2,166 |
| | 2,231 |
| | 2,297 |
| | 2,363 |
| | 2,428 |
| | 2,494 |
| | 2,559 |
| | 2,628 |
| 1,960 |
| | 2,019 |
| | 2,078 |
| | 2,100 |
| | 2,166 |
| | 2,231 |
| | 2,297 |
| | 2,363 |
|
| Tangible assets | $ | 2,029,021 |
| | $ | 2,053,150 |
| | $ | 2,049,583 |
| | $ | 2,100,873 |
| | $ | 2,135,742 |
| | $ | 2,091,650 |
| | $ | 2,086,102 |
| | $ | 2,106,405 |
| $ | 2,032,105 |
| | $ | 2,050,999 |
| | $ | 2,097,726 |
| | $ | 2,076,772 |
| | $ | 2,029,021 |
| | $ | 2,053,150 |
| | $ | 2,049,583 |
| | $ | 2,100,873 |
|
| |
(1) | Presents reconciliations of non-GAAP financial measures to GAAP financial measures. We believe the use of these non-GAAP financial measures provides additional clarity in assessing the results of the Corporation. Other companies may define or calculate these measures differently. For more information on non-GAAP financial measures and ratios we use in assessing the results of the Corporation, see Supplemental Financial Data on page 3332. |
|
| | |
| | | Bank of America 20132014 145136 |
Glossary
Alt-A Mortgage – A type of U.S. mortgage that, for various reasons, is considered riskier than A-paper, or “prime,” and less risky than “subprime,” the riskiest category. Alt-A interest rates, which are determined by credit risk, therefore tend to be between those of prime and subprime home loans. Typically, Alt-A mortgages are characterized by borrowers with less than full documentation, lower credit scores and higher LTVs.
Assets in Custody – Consist largely of custodial and non-discretionary trust assets excluding brokerage assets administered for clients. Trust assets encompass a broad range of asset types including real estate, private company ownership interest, personal property and investments.
Assets Under Management (AUM) – The total market value of assets under the investment advisory and discretion of GWIM which generate asset management fees based on a percentage of the assets’ market values. AUM reflects assets that are generally managed for institutional, high net-worthnet worth and retail clients, and are distributed through various investment products including mutual funds, other commingled vehicles and separate accounts.
Basel 1 AUM is classified in two categories, Liquidity AUM and Long-term AUM. Liquidity AUM are assets under advisory and discretion of –GWIM 2013 Rulesin which the investment strategy seeks to maximize income while maintaining liquidity and capital preservation. The duration of these strategies is primarily less than one year. Long-term AUM are assets under advisory and discretion of – Financial services holding companies are subject toGWIM in which the general risk-based capital rules issued by federal banking regulators which was Basel 1 through December 31, 2012. Asduration of January 1, 2013, Basel 1 was amended prospectively, introducing changes to the measurement of risk-weighted assets for exposures subject to market risk.investment strategy is longer than one year.
Carrying Value (with respect to loans) – The amount at which a loan is recorded on the balance sheet. For loans recorded at amortized cost, carrying value is the unpaid principal balance net of unamortized deferred loan origination fees and costs, and unamortized purchase premium or discount. For loans that are or have been on nonaccrual status, the carrying value is also reduced by any net charge-offs that have been recorded and the amount of interest payments applied as a reduction of principal under the cost recovery method. For PCI loans, the carrying value equals fair value upon acquisition adjusted for subsequent cash collections and yield accreted to date. For credit card loans, the carrying value also includes interest that has been billed to the customer. For loans classified as held-for-sale, carrying value is the lower of carrying value as described in the sentences above, or fair value. For loans for which we have elected the fair value option, the carrying value is fair value.
Client Brokerage Assets – Include client assets which are held in brokerage accounts. This includes non-discretionary brokerage and fee-based assets which generate brokerage income and asset management fee revenue.
Committed Credit Exposure – Includes any funded portion of a facility plus the unfunded portion of a facility on which the lender is legally bound to advance funds during a specified period under prescribed conditions.
Credit Derivatives – Contractual agreements that provide protection against a credit event on one or more referenced
obligations. The nature of a credit event is established by the protection purchaser and protection seller at the inception of the transaction, and such events generally include bankruptcy or insolvency of the referenced credit entity, failure to meet payment obligations when due, as well as acceleration of indebtedness and payment repudiation or moratorium. The purchaser of the credit derivative pays a periodic fee in return for a payment by the protection seller upon the occurrence, if any, of such a credit event. A credit default swap is a type of a credit derivative.
Credit Valuation Adjustment (CVA) – A portfolio adjustment required to properly reflect the counterparty credit risk exposure as part of the fair value of derivative instruments.
Debit Valuation Adjustment (DVA) – A portfolio adjustment required to properly reflect the Corporation’s own credit risk exposure as part of the fair value of derivative instruments.instruments and/or structured liabilities.
Funding Valuation Adjustment (FVA)– A portfolio adjustment required to include funding costs on uncollateralized derivatives and derivatives where the Corporation is not permitted to use the collateral it receives.
Interest Rate Lock Commitment (IRLC) – Commitment with a loan applicant in which the loan terms, including interest rate and price, are guaranteed for a designated period of time subject to credit approval.
Letter of Credit – A document issued on behalf of a customer to a third party promising to pay the third party upon presentation of specified documents. A letter of credit effectively substitutes the issuer’s credit for that of the customer.
Loan-to-value (LTV) – A commonly used credit quality metric that is reported in terms of ending and average LTV. Ending LTV is calculated as the outstanding carrying value of the loan at the end of the period divided by the estimated value of the property securing the loan. Estimated property values are primarily determined by utilizing the Case-Schiller Home Index, a widely used index based on data from repeat sales of single family homes. Case-Schiller indices are updated quarterly and are reported on a three-month or one-quarter lag. An additional metric related to LTV is combined loan-to-value (CLTV) which is similar to the LTV metric, yet combines the outstanding balance on the residential mortgage loan and the outstanding carrying value on the home equity loan or available line of credit, both of which are secured by the same property, divided by the estimated value of the property. A LTV of 100 percent reflects a loan that is currently secured by a property valued at an amount exactly equal to the carrying value or available line of the loan. Under certain circumstances, estimatedEstimated property values can also beare generally determined by utilizing anthrough the use of automated valuation method (AVM)models (AVMs) or Mortgage Risk Assessment Corporation (MRAC) index.the CoreLogic Case-Shiller Index. An AVM is a tool that estimates the value of a property by reference to large volumes of market data including sales of comparable properties and price trends specific to the MSA in which the property being valued is located. The MRACCoreLogic Case-Shiller is a widely used index is similar to the Case-Schiller Home Index in that it is an index that is based on data from repeat sales of single family homes and ishomes. CoreLogic Case-Shiller indexed-based values are reported on a three-month or one-quarter lag.
Margin Receivable – An extension of credit secured by eligible securities in certain brokerage accounts.
Matched-bookMatched Book – Repurchase and resale agreements and securities borrowed and loaned transactions entered into to accommodate customers and earn interest rate spreads.
Mortgage Servicing Right (MSR) – The right to service a mortgage loan when the underlying loan is sold or securitized. Servicing includes collections for principal, interest and escrow payments from borrowers and accounting for and remitting principal and interest payments to investors.
Net Interest Yield – Net interest income divided by average total interest-earning assets.
Nonperforming Loans and Leases – Includes loans and leases that have been placed on nonaccrual status, including nonaccruing loans whose contractual terms have been restructured in a manner that grants a concession to a borrower experiencing financial difficulties (TDRs). Loans accounted for under the fair value option, PCI loans and LHFS are not reported as nonperforming loans and leases. Consumer credit card loans, business card loans, consumer loans secured by personal property (except for certain secured consumer loans, including those that have been modified in a TDR), and consumer loans secured by real estate that are insured by the FHA or through long-term credit protection agreements with FNMA and FHLMC (fully-insured loan portfolio), are not placed on nonaccrual status and are, therefore, not reported as nonperforming loans and leases.
Purchased Credit-impaired (PCI) Loan – A loan purchased as an individual loan, in a portfolio of loans or in a business combination with evidence of deterioration in credit quality since origination for which it is probable, upon acquisition, that the investor will be unable to collect all contractually required payments. These loans are recorded at fair value upon acquisition.
Subprime Loans – Although a standard industry definition for subprime loans (including subprime mortgage loans) does not exist, the Corporation defines subprime loans as specific product offerings for higher risk borrowers, including individuals with one or a combination of high credit risk factors, such as low FICO scores, high debt to income ratios and inferior payment history.
Tier 1 Common Capital – Tier 1 capital less preferred stock, qualifying trust preferred securities, hybrid securities and qualifying noncontrolling interest in subsidiaries.
Troubled Debt Restructurings (TDRs) – Loans whose contractual terms have been restructured in a manner that grants a concession to a borrower experiencing financial difficulties. Certain consumer loans for which a binding offer to restructure has been extended are also classified as TDRs. Concessions could include a reduction in the interest rate to a rate that is below market on the loan, payment extensions, forgiveness of principal, forbearance, loans discharged in bankruptcy or other actions intended to maximize collection. Secured consumer loans that have been discharged in Chapter 7 bankruptcy and have not been reaffirmed by the borrower are classified as TDRs at the time of discharge from bankruptcy. TDRs are generally reported as nonperforming loans and leases while on nonaccrual status. Nonperforming TDRs may be returned to accrual status when, among other criteria, payment in full of all amounts due under the restructured terms is expected and the borrower has demonstrated a sustained period of repayment performance, generally six months. TDRs that are on accrual status are reported as performing TDRs through the end of the calendar year in which the restructuring occurred or the year in which they are returned to accrual status. In addition, if accruing TDRs bear less than a market rate of interest at the time of modification, they are reported as performing TDRs throughout their remaining lives unless and until they cease to perform in accordance with their modified contractual terms, at which time they would be placed on nonaccrual status and reported as nonperforming TDRs.
Value-at-Risk (VaR) – VaR is a model that simulates the value of a portfolio under a range of hypothetical scenarios in order to generate a distribution of potential gains and losses. VaR represents the loss the portfolio is expected to experience with a given confidence level based on historical data. A VaR model is an effective tool in estimating ranges of potential gains and losses on our trading portfolios.
|
| | |
| | | Bank of America 20132014 147138 |
Acronyms
|
| |
| ABS | Asset-backed securities |
| AFS | Available-for-sale |
| ALM | Asset and liability management |
ALMRC | Asset Liability and Market Risk Committee |
| ARM | Adjustable-rate mortgage |
| AUM | Assets under management |
| BHC | Bank holding company |
| CCAR | Comprehensive Capital Analysis and Review |
| CDO | Collateralized debt obligation |
| CGA | Corporate General Auditor |
| CLO | Collateralized loan obligation |
CMBS | Commercial mortgage-backed securities |
| CRA | Community Reinvestment Act |
CRCCVA | Credit Risk Committeevaluation adjustment |
| DVA | Debit valuation adjustment |
| EAD | Exposure at default |
| ERC | Enterprise Risk Committee |
| FDIC | Federal Deposit Insurance Corporation |
| FHA | Federal Housing Administration |
| FHFA | Federal Housing Finance Agency |
| FHLB | Federal Home Loan Bank |
| FHLMC | Freddie Mac |
| FICC | Fixed income,Fixed-income, currencies and commodities |
| FICO | Fair Isaac Corporation (credit score) |
| FLUs | Front line units |
| FNMA | Fannie Mae |
| FTE | Fully taxable-equivalent |
| FVA | Funding valuation adjustment |
| GAAP | Accounting principles generally accepted in the United States of America |
GMRCGM&CA | Global Markets Risk CommitteeMarketing and Corporate Affairs |
| GNMA | Government National Mortgage Association |
| GSE | Government-sponsored enterprise |
|
| |
| HELOC | Home equity lines of credit |
| HFI | Held-for-investment |
| HUD | U.S. Department of Housing and Urban Development |
| IRM | Independent risk management |
| LCR | Liquidity Coverage Ratio |
| LGD | Loss-given default |
| LHFS | Loans held-for-sale |
| LIBOR | London InterBank Offered Rate |
MBSLTV | Mortgage-backed securitiesLoan-to-value |
| MD&A | Management’s Discussion and Analysis of Financial Condition and Results of Operations |
| MI | Mortgage insurance |
| MRC | Management Risk Committee |
| MSA | Metropolitan statistical area |
| MSR | Mortgage servicing right |
| NSFR | Net Stable Funding Ratio |
| OCC | Office of the Comptroller of the Currency |
| OCI | Other comprehensive income |
| OTC | Over-the-counter |
| OTTI | Other-than-temporary impairment |
| PCI | Purchased credit-impaired |
| PPI | Payment protection insurance |
| RCSAs | Risk and Control Self Assessments |
| RMBS | Residential mortgage-backed securities |
| SBLCs | Standby letters of credit |
| SEC | Securities and Exchange Commission |
VASLR | U.S. Department of Veterans AffairsSupplementary leverage ratio |
| TDR | Troubled debt restructurings |
| VIE | Variable interest entity |
|
| | |
148139 Bank of America 20132014
| | |
Item 7A. Quantitative and Qualitative Disclosures About Market Risk
See Market Risk Management on page 10899 in the MD&A and the sections referenced therein for Quantitative and Qualitative Disclosures about Market Risk.
|
|
| Item 8. Financial Statements and Supplementary Data |
Item 8. Financial Statements and Supplementary Data
|
| | |
| | | Bank of America 20132014 149140 |
Report of Management on Internal Control Over Financial Reporting
The management of Bank of America Corporation is responsible for establishing and maintaining adequate internal control over financial reporting.
The Corporation’s internal control over financial reporting is a process designed to provide reasonable assurance regarding the reliability of financial reporting and the preparation of financial statements for external purposes in accordance with accounting principles generally accepted in the United States of America. The Corporation’s internal control over financial reporting includes those policies and procedures that: (i) pertain to the maintenance of records that, in reasonable detail, accurately and fairly reflect the transactions and dispositions of the assets of the Corporation; (ii) provide reasonable assurance that transactions are recorded as necessary to permit preparation of financial statements in accordance with accounting principles generally accepted in the United States of America, and that receipts and expenditures of the Corporation are being made only in accordance with authorizations of management and directors of the Corporation; and (iii) provide reasonable assurance regarding prevention or timely detection of unauthorized acquisition, use, or disposition of the Corporation’s assets that could have a material effect on the financial statements.
Because of its inherent limitations, internal control over financial reporting may not prevent or detect misstatements. Also, projections of any evaluation of effectiveness to future periods are subject to the risk that controls may become inadequate because of changes in conditions, or that the degree of compliance with the policies or procedures may deteriorate.
Management assessed the effectiveness of the Corporation’s internal control over financial reporting as of December 31, 20132014
based on the framework set forth by the Committee of Sponsoring Organizations of the Treadway Commission in Internal Control – Integrated Framework (1992)(2013). Based on that assessment, management concluded that, as of December 31, 20132014, the Corporation’s internal control over financial reporting is effective based on the criteria established in Internal Control – Integrated Framework (1992)(2013).
The Corporation’s internal control over financial reporting as of December 31, 20132014 has been audited by PricewaterhouseCoopers, LLP, an independent registered public accounting firm, as stated in their accompanying report which expresses an unqualified opinion on the effectiveness of the Corporation’s internal control over financial reporting as of December 31, 20132014.
Brian T. Moynihan
Chairman, Chief Executive Officer and President
Bruce R. Thompson
Chief Financial Officer
|
| | |
150141 Bank of America 20132014
| | |
Report of Independent Registered Public Accounting Firm
To the Board of Directors and Shareholders of Bank of America Corporation:
In our opinion, the accompanying Consolidated Balance Sheet and the related Consolidated Statement of Income, Consolidated Statement of Comprehensive Income, Consolidated Statement of Changes in Shareholders’ Equity and Consolidated Statement of Cash Flows present fairly, in all material respects, the financial position of Bank of America Corporation and its subsidiaries at December 31, 20132014 and 20122013, and the results of their operations and their cash flows for each of the three years in the period ended December 31, 20132014 in conformity with accounting principles generally accepted in the United States of America. Also in our opinion, the Corporation maintained, in all material respects, effective internal control over financial reporting as of December 31, 20132014, based on criteria established in Internal Control – Integrated Framework (1992)(2013) issued by the Committee of Sponsoring Organizations of the Treadway Commission (COSO). The Corporation’s management is responsible for these financial statements, for maintaining effective internal control over financial reporting and for its assessment of the effectiveness of internal control over financial reporting, included in the accompanying Report of Management on Internal Control Over Financial Reporting. Our responsibility is to express opinions on these financial statements and on the Corporation’s internal control over financial reporting based on our integrated audits. We conducted our audits in accordance with the standards of the Public Company Accounting Oversight Board (United States). Those standards require that we plan and perform the audits to obtain reasonable assurance about whether the financial statements are free of material misstatement and whether effective internal control over financial reporting was maintained in all material respects. Our audits of the financial statements included examining, on a test basis, evidence supporting the amounts and disclosures in the financial statements, assessing the accounting principles used and significant estimates made by management, and evaluating the overall financial statement presentation. Our audit of internal control over financial reporting included obtaining an understanding of internal control over financial reporting,
assessing the risk that a material weakness exists, and testing
and evaluating the design and operating effectiveness of internal control based on the assessed risk. Our audits also included performing such other procedures as we considered necessary in the circumstances. We believe that our audits provide a reasonable basis for our opinions.
A company’s internal control over financial reporting is a process designed to provide reasonable assurance regarding the reliability of financial reporting and the preparation of financial statements for external purposes in accordance with generally accepted accounting principles. A company’s internal control over financial reporting includes those policies and procedures that (i) pertain to the maintenance of records that, in reasonable detail, accurately and fairly reflect the transactions and dispositions of the assets of the company; (ii) provide reasonable assurance that transactions are recorded as necessary to permit preparation of financial statements in accordance with generally accepted accounting principles, and that receipts and expenditures of the company are being made only in accordance with authorizations of management and directors of the company; and (iii) provide reasonable assurance regarding prevention or timely detection of unauthorized acquisition, use, or disposition of the company’s assets that could have a material effect on the financial statements.
Because of its inherent limitations, internal control over financial reporting may not prevent or detect misstatements. Also, projections of any evaluation of effectiveness to future periods are subject to the risk that controls may become inadequate because of changes in conditions, or that the degree of compliance with the policies or procedures may deteriorate.
Charlotte, North Carolina
February 25, 20142015
|
| | |
| | | Bank of America 20132014 151142 |
Bank of America Corporation and Subsidiaries | | | | | | | | | | | | | |
Consolidated Statement of Income | | | | | | | | | | | | |
| (Dollars in millions, except per share information) | 2013 | | 2012 | | 2011 | 2014 | | 2013 | | 2012 |
| Interest income | |
| | |
| | |
| |
| | |
| | |
|
| Loans and leases | $ | 36,470 |
| | $ | 38,880 |
| | $ | 44,966 |
| $ | 34,307 |
| | $ | 36,470 |
| | $ | 38,880 |
|
| Debt securities | 9,749 |
| | 8,908 |
| | 9,525 |
| 8,021 |
| | 9,749 |
| | 8,908 |
|
| Federal funds sold and securities borrowed or purchased under agreements to resell | 1,229 |
| | 1,502 |
| | 2,147 |
| 1,039 |
| | 1,229 |
| | 1,502 |
|
| Trading account assets | 4,706 |
| | 5,094 |
| | 5,961 |
| 4,561 |
| | 4,706 |
| | 5,094 |
|
| Other interest income | 2,866 |
| | 3,016 |
| | 3,637 |
| 2,958 |
| | 2,866 |
| | 3,016 |
|
| Total interest income | 55,020 |
| | 57,400 |
| | 66,236 |
| 50,886 |
| | 55,020 |
| | 57,400 |
|
| | | | | | | | | | | |
| Interest expense | |
| | |
| | |
| |
| | |
| | |
|
| Deposits | 1,396 |
| | 1,990 |
| | 3,002 |
| 1,080 |
| | 1,396 |
| | 1,990 |
|
| Short-term borrowings | 2,923 |
| | 3,572 |
| | 4,599 |
| 2,578 |
| | 2,923 |
| | 3,572 |
|
| Trading account liabilities | 1,638 |
| | 1,763 |
| | 2,212 |
| 1,576 |
| | 1,638 |
| | 1,763 |
|
| Long-term debt | 6,798 |
| | 9,419 |
| | 11,807 |
| 5,700 |
| | 6,798 |
| | 9,419 |
|
| Total interest expense | 12,755 |
| | 16,744 |
| | 21,620 |
| 10,934 |
| | 12,755 |
| | 16,744 |
|
| Net interest income | 42,265 |
| | 40,656 |
| | 44,616 |
| 39,952 |
| | 42,265 |
| | 40,656 |
|
| | | | | | | | | | | |
| Noninterest income | |
| | |
| | |
| |
| | |
| | |
|
| Card income | 5,826 |
| | 6,121 |
| | 7,184 |
| 5,944 |
| | 5,826 |
| | 6,121 |
|
| Service charges | 7,390 |
| | 7,600 |
| | 8,094 |
| 7,443 |
| | 7,390 |
| | 7,600 |
|
| Investment and brokerage services | 12,282 |
| | 11,393 |
| | 11,826 |
| 13,284 |
| | 12,282 |
| | 11,393 |
|
| Investment banking income | 6,126 |
| | 5,299 |
| | 5,217 |
| 6,065 |
| | 6,126 |
| | 5,299 |
|
| Equity investment income | 2,901 |
| | 2,070 |
| | 7,360 |
| 1,130 |
| | 2,901 |
| | 2,070 |
|
| Trading account profits | 7,056 |
| | 5,870 |
| | 6,697 |
| 6,309 |
| | 7,056 |
| | 5,870 |
|
| Mortgage banking income (loss) | 3,874 |
| | 4,750 |
| | (8,830 | ) | |
| Mortgage banking income | | 1,563 |
| | 3,874 |
| | 4,750 |
|
| Gains on sales of debt securities | 1,271 |
| | 1,662 |
| | 3,374 |
| 1,354 |
| | 1,271 |
| | 1,662 |
|
| Other income (loss) | (29 | ) | | (2,034 | ) | | 8,215 |
| 1,203 |
| | (49 | ) | | (2,087 | ) |
| Other-than-temporary impairment losses on available-for-sale debt securities: | |
| | |
| | |
| |
| Total other-than-temporary impairment losses | (21 | ) | | (57 | ) | | (360 | ) | |
| Less: Portion of other-than-temporary impairment losses recognized in other comprehensive income | 1 |
| | 4 |
| | 61 |
| |
| Net impairment losses recognized in earnings on available-for-sale debt securities | (20 | ) | | (53 | ) | | (299 | ) | |
| Total noninterest income | 46,677 |
| | 42,678 |
| | 48,838 |
| 44,295 |
| | 46,677 |
| | 42,678 |
|
| Total revenue, net of interest expense | 88,942 |
| | 83,334 |
| | 93,454 |
| 84,247 |
| | 88,942 |
| | 83,334 |
|
| | | | | | | | | | | |
| Provision for credit losses | 3,556 |
| | 8,169 |
| | 13,410 |
| 2,275 |
| | 3,556 |
| | 8,169 |
|
| | | | | | | | | | | |
| Noninterest expense | |
| | |
| | | |
| | |
| | |
| Personnel | 34,719 |
| | 35,648 |
| | 36,965 |
| 33,787 |
| | 34,719 |
| | 35,648 |
|
| Occupancy | 4,475 |
| | 4,570 |
| | 4,748 |
| 4,260 |
| | 4,475 |
| | 4,570 |
|
| Equipment | 2,146 |
| | 2,269 |
| | 2,340 |
| 2,125 |
| | 2,146 |
| | 2,269 |
|
| Marketing | 1,834 |
| | 1,873 |
| | 2,203 |
| 1,829 |
| | 1,834 |
| | 1,873 |
|
| Professional fees | 2,884 |
| | 3,574 |
| | 3,381 |
| 2,472 |
| | 2,884 |
| | 3,574 |
|
| Amortization of intangibles | 1,086 |
| | 1,264 |
| | 1,509 |
| 936 |
| | 1,086 |
| | 1,264 |
|
| Data processing | 3,170 |
| | 2,961 |
| | 2,652 |
| 3,144 |
| | 3,170 |
| | 2,961 |
|
| Telecommunications | 1,593 |
| | 1,660 |
| | 1,553 |
| 1,259 |
| | 1,593 |
| | 1,660 |
|
| Other general operating | 17,307 |
| | 18,274 |
| | 21,101 |
| 25,305 |
| | 17,307 |
| | 18,274 |
|
| Goodwill impairment | — |
| | — |
| | 3,184 |
| |
| Merger and restructuring charges | — |
| | — |
| | 638 |
| |
| Total noninterest expense | 69,214 |
| | 72,093 |
| | 80,274 |
| 75,117 |
| | 69,214 |
| | 72,093 |
|
| Income (loss) before income taxes | 16,172 |
| | 3,072 |
| | (230 | ) | |
| Income before income taxes | | 6,855 |
| | 16,172 |
| | 3,072 |
|
| Income tax expense (benefit) | 4,741 |
| | (1,116 | ) | | (1,676 | ) | 2,022 |
| | 4,741 |
| | (1,116 | ) |
| Net income | $ | 11,431 |
| | $ | 4,188 |
| | $ | 1,446 |
| $ | 4,833 |
| | $ | 11,431 |
| | $ | 4,188 |
|
| Preferred stock dividends | 1,349 |
| | 1,428 |
| | 1,361 |
| 1,044 |
| | 1,349 |
| | 1,428 |
|
| Net income applicable to common shareholders | $ | 10,082 |
| | $ | 2,760 |
| | $ | 85 |
| $ | 3,789 |
| | $ | 10,082 |
| | $ | 2,760 |
|
| | | | | | | | | | | |
| Per common share information | |
| | |
| | |
| |
| | |
| | |
|
| Earnings | $ | 0.94 |
| | $ | 0.26 |
| | $ | 0.01 |
| $ | 0.36 |
| | $ | 0.94 |
| | $ | 0.26 |
|
| Diluted earnings | 0.90 |
| | 0.25 |
| | 0.01 |
| 0.36 |
| | 0.90 |
| | 0.25 |
|
| Dividends paid | 0.04 |
| | 0.04 |
| | 0.04 |
| 0.12 |
| | 0.04 |
| | 0.04 |
|
| Average common shares issued and outstanding (in thousands) | 10,731,165 |
| | 10,746,028 |
| | 10,142,625 |
| 10,527,818 |
| | 10,731,165 |
| | 10,746,028 |
|
| Average diluted common shares issued and outstanding (in thousands) | 11,491,418 |
| | 10,840,854 |
| | 10,254,824 |
| 10,584,535 |
| | 11,491,418 |
| | 10,840,854 |
|
See accompanying Notes to Consolidated Financial Statements.
|
| | |
152143 Bank of America 20132014
| | |
Bank of America Corporation and Subsidiaries
| | | | | | | | | | | | | |
Consolidated Statement of Comprehensive Income | | | | | | | | | | | | |
| (Dollars in millions) | 2013 | | 2012 | | 2011 | 2014 | | 2013 | | 2012 |
| Net income | $ | 11,431 |
| | $ | 4,188 |
| | $ | 1,446 |
| $ | 4,833 |
| | $ | 11,431 |
| | $ | 4,188 |
|
| Other comprehensive income (loss), net-of-tax: | | | | | | | | | | |
| Net change in available-for-sale debt and marketable equity securities | (8,166 | ) | | 1,802 |
| | (4,270 | ) | 4,621 |
| | (8,166 | ) | | 1,802 |
|
| Net change in derivatives | 592 |
| | 916 |
| | (549 | ) | 616 |
| | 592 |
| | 916 |
|
| Employee benefit plan adjustments | 2,049 |
| | (65 | ) | | (444 | ) | (943 | ) | | 2,049 |
| | (65 | ) |
| Net change in foreign currency translation adjustments | (135 | ) | | (13 | ) | | (108 | ) | (157 | ) | | (135 | ) | | (13 | ) |
| Other comprehensive income (loss) | (5,660 | ) | | 2,640 |
| | (5,371 | ) | 4,137 |
| | (5,660 | ) | | 2,640 |
|
| Comprehensive income (loss) | $ | 5,771 |
| | $ | 6,828 |
| | $ | (3,925 | ) | |
| Comprehensive income | | $ | 8,970 |
| | $ | 5,771 |
| | $ | 6,828 |
|
See accompanying Notes to Consolidated Financial Statements.
|
| | |
| | | Bank of America 20132014 153144 |
Bank of America Corporation and Subsidiaries
| | | | | | | | | |
Consolidated Balance Sheet | | | | |
| | December 31 | December 31 |
| (Dollars in millions) | 2013 | | 2012 | 2014 | | 2013 |
| Assets | |
| | |
| |
| | |
|
| Cash and due from banks | | $ | 33,118 |
| | $ | 36,852 |
|
| Interest-bearing deposits with the Federal Reserve and non-U.S. central banks | | 105,471 |
| | 94,470 |
|
| Cash and cash equivalents | $ | 131,322 |
| | $ | 110,752 |
| 138,589 |
| | 131,322 |
|
| Time deposits placed and other short-term investments | 11,540 |
| | 18,694 |
| 7,510 |
| | 11,540 |
|
Federal funds sold and securities borrowed or purchased under agreements to resell (includes $75,614 and $98,670 measured at fair value) | 190,328 |
| | 219,924 |
| |
Trading account assets (includes $111,817 and $115,821 pledged as collateral) | 200,993 |
| | 227,775 |
| |
Federal funds sold and securities borrowed or purchased under agreements to resell (includes $62,182 and $68,656 measured at fair value) | | 191,823 |
| | 190,328 |
|
Trading account assets (includes $110,923 and $111,817 pledged as collateral) | | 191,785 |
| | 200,993 |
|
| Derivative assets | 47,495 |
| | 53,497 |
| 52,682 |
| | 47,495 |
|
| Debt securities: | |
| | |
| |
| | |
|
Carried at fair value (includes $51,408 and $63,349 pledged as collateral) | 268,795 |
| | 310,850 |
| |
Held-to-maturity, at cost (fair value – $52,430 and $50,270; $20,869 and $22,461 pledged as collateral) | 55,150 |
| | 49,481 |
| |
Carried at fair value (includes $46,976 and $52,283 pledged as collateral) | | 320,695 |
| | 268,795 |
|
Held-to-maturity, at cost (fair value – $59,641 and $52,430; $17,124 and $20,869 pledged as collateral) | | 59,766 |
| | 55,150 |
|
| Total debt securities | 323,945 |
| | 360,331 |
| 380,461 |
| | 323,945 |
|
Loans and leases (includes $10,042 and $9,002 measured at fair value and $74,166 and $50,289 pledged as collateral) | 928,233 |
| | 907,819 |
| |
Loans and leases (includes $8,681 and $10,042 measured at fair value and $52,959 and $71,579 pledged as collateral) | | 881,391 |
| | 928,233 |
|
| Allowance for loan and lease losses | (17,428 | ) | | (24,179 | ) | (14,419 | ) | | (17,428 | ) |
| Loans and leases, net of allowance | 910,805 |
| | 883,640 |
| 866,972 |
| | 910,805 |
|
| Premises and equipment, net | 10,475 |
| | 11,858 |
| 10,049 |
| | 10,475 |
|
Mortgage servicing rights (includes $5,042 and $5,716 measured at fair value) | 5,052 |
| | 5,851 |
| |
Mortgage servicing rights (includes $3,530 and $5,042 measured at fair value) | | 3,530 |
| | 5,052 |
|
| Goodwill | 69,844 |
| | 69,976 |
| 69,777 |
| | 69,844 |
|
| Intangible assets | 5,574 |
| | 6,684 |
| 4,612 |
| | 5,574 |
|
Loans held-for-sale (includes $6,656 and $11,659 measured at fair value) | 11,362 |
| | 19,413 |
| |
Loans held-for-sale (includes $6,801 and $6,656 measured at fair value) | | 12,836 |
| | 11,362 |
|
| Customer and other receivables | 59,448 |
| | 71,467 |
| 61,845 |
| | 59,448 |
|
Other assets (includes $18,055 and $26,490 measured at fair value) | 124,090 |
| | 150,112 |
| |
Other assets (includes $13,873 and $18,055 measured at fair value) | | 112,063 |
| | 124,090 |
|
| Total assets | $ | 2,102,273 |
| | $ | 2,209,974 |
| $ | 2,104,534 |
| | $ | 2,102,273 |
|
| | | | | | | |
| | | | | | | |
| | | | | | | |
Assets of consolidated variable interest entities included in total assets above (isolated to settle the liabilities of the variable interest entities) | | Trading account assets | $ | 8,412 |
| | $ | 7,906 |
| $ | 6,890 |
| | $ | 8,412 |
|
| Derivative assets | 185 |
| | 333 |
| 6 |
| | 185 |
|
| Loans and leases | 109,118 |
| | 123,227 |
| 95,187 |
| | 109,118 |
|
| Allowance for loan and lease losses | (2,674 | ) | | (3,658 | ) | (1,968 | ) | | (2,674 | ) |
| Loans and leases, net of allowance | 106,444 |
| | 119,569 |
| 93,219 |
| | 106,444 |
|
| Loans held-for-sale | 1,384 |
| | 1,969 |
| 1,822 |
| | 1,384 |
|
| All other assets | 4,577 |
| | 4,654 |
| 2,763 |
| | 4,577 |
|
| Total assets of consolidated variable interest entities | $ | 121,002 |
| | $ | 134,431 |
| $ | 104,700 |
| | $ | 121,002 |
|
See accompanying Notes to Consolidated Financial Statements.
|
| | |
154145 Bank of America 20132014
| | |
Bank of America Corporation and Subsidiaries
| | | | | | | | | |
Consolidated Balance Sheet (continued) | | | | |
| | December 31 | December 31 |
| (Dollars in millions) | 2013 | | 2012 | 2014 | | 2013 |
| Liabilities | |
| | |
| |
| | |
|
| Deposits in U.S. offices: | |
| | |
| |
| | |
|
| Noninterest-bearing | $ | 373,092 |
| | $ | 372,546 |
| $ | 392,790 |
| | $ | 373,070 |
|
Interest-bearing (includes $1,899 and $2,262 measured at fair value) | 667,714 |
| | 654,332 |
| |
Interest-bearing (includes $1,469 and $1,899 measured at fair value) | | 660,161 |
| | 667,714 |
|
| Deposits in non-U.S. offices: | | | |
| | | |
|
| Noninterest-bearing | 8,233 |
| | 7,573 |
| 7,542 |
| | 8,255 |
|
| Interest-bearing | 70,232 |
| | 70,810 |
| 58,443 |
| | 70,232 |
|
| Total deposits | 1,119,271 |
| | 1,105,261 |
| 1,118,936 |
| | 1,119,271 |
|
Federal funds purchased and securities loaned or sold under agreements to repurchase (includes $33,684 and $42,639 measured at fair value) | 198,106 |
| | 293,259 |
| |
Federal funds purchased and securities loaned or sold under agreements to repurchase (includes $35,357 and $26,500 measured at fair value) | | 201,277 |
| | 198,106 |
|
| Trading account liabilities | 83,469 |
| | 73,587 |
| 74,192 |
| | 83,469 |
|
| Derivative liabilities | 37,407 |
| | 46,016 |
| 46,909 |
| | 37,407 |
|
Short-term borrowings (includes $1,520 and $4,074 measured at fair value) | 45,999 |
| | 30,731 |
| |
Accrued expenses and other liabilities (includes $11,233 and $16,594 measured at fair value and $484 and $513 of reserve for unfunded lending commitments) | 135,662 |
| | 148,579 |
| |
Long-term debt (includes $47,035 and $49,161 measured at fair value) | 249,674 |
| | 275,585 |
| |
Short-term borrowings (includes $2,697 and $1,520 measured at fair value) | | 31,172 |
| | 45,999 |
|
Accrued expenses and other liabilities (includes $12,055 and $11,233 measured at fair value and $528 and $484 of reserve for unfunded lending commitments) | | 145,438 |
| | 135,662 |
|
Long-term debt (includes $36,404 and $47,035 measured at fair value) | | 243,139 |
| | 249,674 |
|
| Total liabilities | 1,869,588 |
| | 1,973,018 |
| 1,861,063 |
| | 1,869,588 |
|
Commitments and contingencies (Note 6 – Securitizations and Other Variable Interest Entities, Note 7 – Representations and Warranties Obligations and Corporate Guarantees and Note 12 – Commitments and Contingencies) |
|
| |
|
|
|
| |
|
|
| Shareholders’ equity | |
| | |
| |
| | |
|
Preferred stock, $0.01 par value; authorized – 100,000,000 shares; issued and outstanding – 3,407,790 and 3,685,410 shares | 13,352 |
| | 18,768 |
| |
Common stock and additional paid-in capital, $0.01 par value; authorized – 12,800,000,000 shares; issued and outstanding – 10,591,808,296 and 10,778,263,628 shares | 155,293 |
| | 158,142 |
| |
Preferred stock, $0.01 par value; authorized – 100,000,000 shares; issued and outstanding – 3,647,790 and 3,407,790 shares | | 19,309 |
| | 13,352 |
|
Common stock and additional paid-in capital, $0.01 par value; authorized – 12,800,000,000 shares; issued and outstanding – 10,516,542,476 and 10,591,808,296 shares | | 153,458 |
| | 155,293 |
|
| Retained earnings | 72,497 |
| | 62,843 |
| 75,024 |
| | 72,497 |
|
| Accumulated other comprehensive income (loss) | (8,457 | ) | | (2,797 | ) | (4,320 | ) | | (8,457 | ) |
| Total shareholders’ equity | 232,685 |
| | 236,956 |
| 243,471 |
| | 232,685 |
|
| Total liabilities and shareholders’ equity | $ | 2,102,273 |
| | $ | 2,209,974 |
| $ | 2,104,534 |
| | $ | 2,102,273 |
|
| | | | | | | |
| Liabilities of consolidated variable interest entities included in total liabilities above | |
| | |
| |
| | |
|
Short-term borrowings (includes $77 and $872 of non-recourse borrowings) | $ | 1,150 |
| | $ | 3,731 |
| |
Long-term debt (includes $16,209 and $29,476 of non-recourse debt) | 19,448 |
| | 34,256 |
| |
All other liabilities (includes $138 and $149 of non-recourse liabilities) | 253 |
| | 360 |
| |
Short-term borrowings (includes $0 and $77 of non-recourse borrowings) | | $ | 1,032 |
| | $ | 1,150 |
|
Long-term debt (includes $11,943 and $16,209 of non-recourse debt) | | 13,307 |
| | 19,448 |
|
All other liabilities (includes $84 and $138 of non-recourse liabilities) | | 138 |
| | 253 |
|
| Total liabilities of consolidated variable interest entities | $ | 20,851 |
| | $ | 38,347 |
| $ | 14,477 |
| | $ | 20,851 |
|
See accompanying Notes to Consolidated Financial Statements.
|
| | |
| | | Bank of America 20132014 155146 |
Bank of America Corporation and Subsidiaries
| | | | | | | | | | | | | | | | | | | | | | | | | | | |
Consolidated Statement of Changes in Shareholders’ Equity | | | | | | | | | | | | | | | | | | | | | | | | | | |
| | Preferred Stock | | Common Stock and Additional Paid-in Capital | | Retained Earnings | | Accumulated
Other Comprehensive Income (Loss) | | Other | | Total Shareholders’ Equity | Preferred Stock | | Common Stock and Additional Paid-in Capital | | Retained Earnings | | Accumulated
Other Comprehensive Income (Loss) | | Total Shareholders’ Equity |
| (Dollars in millions, shares in thousands) | | Shares | | Amount | | | Shares | | Amount | |
| | | | | | | | | | | | | | | | | | | | | | | | | |
| Balance, December 31, 2010 | $ | 16,562 |
| | 10,085,155 |
| | $ | 150,905 |
| | $ | 60,849 |
| | $ | (66 | ) | | $ | (2 | ) | | $ | 228,248 |
| |
| Net income | |
| | |
| | |
| | 1,446 |
| | | | |
| | 1,446 |
| |
| Net change in available-for-sale debt and marketable equity securities | |
| | |
| | |
| | |
| | (4,270 | ) | | |
| | (4,270 | ) | |
| Net change in derivatives | |
| | |
| | |
| | |
| | (549 | ) | | |
| | (549 | ) | |
| Employee benefit plan adjustments | |
| | |
| | |
| | |
| | (444 | ) | | |
| | (444 | ) | |
| Net change in foreign currency translation adjustments | |
| | |
| | |
| | | | (108 | ) | | |
| | (108 | ) | |
| Dividends paid: | |
| | |
| | |
| | | | |
| | |
| | | |
| Common | | | |
| | | | (413 | ) | | |
| | |
| | (413 | ) | |
| Preferred | | | |
| | |
| | (1,325 | ) | | |
| | |
| | (1,325 | ) | |
| Issuance of preferred stock and warrants | 2,918 |
| | | | 2,082 |
| | | | | | | | 5,000 |
| |
| Common stock issued in connection with exchanges of preferred stock and trust preferred securities | (1,083 | ) | | 400,000 |
| | 2,754 |
| | (36 | ) | | | | | | 1,635 |
| |
| Common stock issued under employee plans and related tax effects | | | 50,783 |
| | 880 |
| | |
| | |
| | 2 |
| | 882 |
| |
| Other | | | |
| | |
| | (1 | ) | | |
| | | | (1 | ) | |
| Balance, December 31, 2011 | 18,397 |
| | 10,535,938 |
| | 156,621 |
| | 60,520 |
| | (5,437 | ) | | — |
| | 230,101 |
| $ | 18,397 |
| | 10,535,938 |
| | $ | 156,621 |
| | $ | 60,520 |
| | $ | (5,437 | ) | | $ | 230,101 |
|
| Net income | | | | | | | 4,188 |
| | | | | | 4,188 |
| |
| | |
| | |
| | 4,188 |
| | | | 4,188 |
|
| Net change in available-for-sale debt and marketable equity securities | | | | | | | | | 1,802 |
| | | | 1,802 |
| |
| | |
| | |
| | |
| | 1,802 |
| | 1,802 |
|
| Net change in derivatives | | | | | | | | | 916 |
| | | | 916 |
| |
| | |
| | |
| | |
| | 916 |
| | 916 |
|
| Employee benefit plan adjustments | | | | | | | | | (65 | ) | | | | (65 | ) | |
| | |
| | |
| | |
| | (65 | ) | | (65 | ) |
| Net change in foreign currency translation adjustments | | | | | | | | | (13 | ) | | | | (13 | ) | |
| | |
| | |
| | | | (13 | ) | | (13 | ) |
| Dividends paid: | | | | | | | | | | | | | | |
| | |
| | |
| | | | |
| | |
| Common | | | | | | | (437 | ) | | | | | | (437 | ) | | | |
| | | | (437 | ) | | |
| | (437 | ) |
| Preferred | | | | | | | (1,472 | ) | | | | | | (1,472 | ) | | | |
| | |
| | (1,472 | ) | | |
| | (1,472 | ) |
| Net Issuance of preferred stock | 667 |
| | | | | | | | | | | | 667 |
| |
| Net issuance of preferred stock | | 667 |
| | | |
|
| | | | | | 667 |
|
| Common stock issued in connection with exchanges of preferred stock and trust preferred securities | (296 | ) | | 49,867 |
| | 412 |
| | 44 |
| | | | | | 160 |
| (296 | ) | | 49,867 |
| | 412 |
| | 44 |
| | | | 160 |
|
| Common stock issued under employee plans and related tax effects | | | 192.459 |
| | 1,109 |
| | | | | | | | 1,109 |
| | | 192,459 |
| | 1,109 |
| | |
| | |
| | 1,109 |
|
| Balance, December 31, 2012 | 18,768 |
| | 10,778,264 |
| | 158,142 |
| | 62,843 |
| | (2,797 | ) | | — |
| | 236,956 |
| 18,768 |
| | 10,778,264 |
| | 158,142 |
| | 62,843 |
| | (2,797 | ) | | 236,956 |
|
| Net income | | | | | | | 11,431 |
| | | | | | 11,431 |
| | | | | | | 11,431 |
| | | | 11,431 |
|
| Net change in available-for-sale debt and marketable equity securities | | | | | | | | | (8,166 | ) | | | | (8,166 | ) | | | | | | | | | (8,166 | ) | | (8,166 | ) |
| Net change in derivatives | | | | | | | | | 592 |
| | | | 592 |
| | | | | | | | | 592 |
| | 592 |
|
| Employee benefit plan adjustments | | | | | | | | | 2,049 |
| | | | 2,049 |
| | | | | | | | | 2,049 |
| | 2,049 |
|
| Net change in foreign currency translation adjustments | | | | | | | | | (135 | ) | | | | (135 | ) | | | | | | | | | (135 | ) | | (135 | ) |
| Dividends paid: | | | | | | | | | | | | | | | | | | | | | | | | |
| Common | | | | | | | (428 | ) | | | | | | (428 | ) | | | | | | | (428 | ) | | | | (428 | ) |
| Preferred | | | | | | | (1,249 | ) | | | | | | (1,249 | ) | | | | | | | (1,249 | ) | | | | (1,249 | ) |
| Issuance of preferred stock | 1,008 |
| | | | | | | | | | | | 1,008 |
| 1,008 |
| | | | | | | | | | 1,008 |
|
| Redemption of preferred stock | (6,461 | ) | | | | | | (100 | ) | | | | | | (6,561 | ) | (6,461 | ) | | | | | | (100 | ) | | | | (6,561 | ) |
| Common stock issued under employee plans and related tax effects | | | 45,288 |
| | 371 |
| | | | | | | | 371 |
| | | 45,288 |
| | 371 |
| | | | | | 371 |
|
| Common stock repurchased | | | (231,744 | ) | | (3,220 | ) | | | | | | | | (3,220 | ) | | | (231,744 | ) | | (3,220 | ) | | | | | | (3,220 | ) |
| Other | 37 |
| | | | | | | | | | | | 37 |
| 37 |
| | | | | | | | | | 37 |
|
| Balance, December 31, 2013 | $ | 13,352 |
| | 10,591,808 |
| | $ | 155,293 |
| | $ | 72,497 |
| | $ | (8,457 | ) | | $ | — |
| | $ | 232,685 |
| 13,352 |
| | 10,591,808 |
| | 155,293 |
| | 72,497 |
| | (8,457 | ) | | 232,685 |
|
| Net income | | | | | | | | 4,833 |
| | | | 4,833 |
|
| Net change in available-for-sale debt and marketable equity securities | | | | | | | | | | 4,621 |
| | 4,621 |
|
| Net change in derivatives | | | | | | | | | | 616 |
| | 616 |
|
| Employee benefit plan adjustments | | | | | | | | | | (943 | ) | | (943 | ) |
| Net change in foreign currency translation adjustments | | | | | | | | | | (157 | ) | | (157 | ) |
| Dividends paid: | | | | | | | | | | | | |
| Common | | | | | | | | (1,262 | ) | | | | (1,262 | ) |
| Preferred | | | | | | | | (1,044 | ) | | | | (1,044 | ) |
| Issuance of preferred stock | | 5,957 |
| | | | | | | | | | 5,957 |
|
| Common stock issued under employee plans and related tax effects | | | | 25,866 |
| | (160 | ) | | | | | | (160 | ) |
| Common stock repurchased | | | | (101,132 | ) | | (1,675 | ) | | | | | | (1,675 | ) |
| Balance, December 31, 2014 | | $ | 19,309 |
| | 10,516,542 |
| | $ | 153,458 |
| | $ | 75,024 |
| | $ | (4,320 | ) | | $ | 243,471 |
|
See accompanying Notes to Consolidated Financial Statements.
|
| | |
156147 Bank of America 20132014
| | |
Bank of America Corporation and Subsidiaries
|
| | | | | | | | | | | |
| | | | | | |
| Consolidated Statement of Cash Flows |
| | | | | | |
| (Dollars in millions) | 2013 | | 2012 | | 2011 |
| Operating activities | |
| | |
| | |
|
| Net income | $ | 11,431 |
| | $ | 4,188 |
| | $ | 1,446 |
|
| Reconciliation of net income to net cash provided by (used in) operating activities: | |
| | |
| | |
|
| Provision for credit losses | 3,556 |
| | 8,169 |
| | 13,410 |
|
| Goodwill impairment | — |
| | — |
| | 3,184 |
|
| Gains on sales of debt securities | (1,271 | ) | | (1,662 | ) | | (3,374 | ) |
| Fair value adjustments on structured liabilities | 649 |
| | 5,107 |
| | (3,320 | ) |
| Depreciation and premises improvements amortization | 1,597 |
| | 1,774 |
| | 1,976 |
|
| Amortization of intangibles | 1,086 |
| | 1,264 |
| | 1,509 |
|
| Net amortization of premium/discount on debt securities | 1,577 |
| | 2,580 |
| | 2,046 |
|
| Deferred income taxes | 3,262 |
| | (2,735 | ) | | (1,949 | ) |
| Originations and purchases of loans held-for-sale | (65,688 | ) | | (59,540 | ) | | (118,168 | ) |
| Proceeds from sales, securitizations and paydowns of loans held-for-sale | 77,707 |
| | 54,817 |
| | 141,862 |
|
| Net (increase) decrease in trading and derivative instruments | 33,870 |
| | (47,606 | ) | | 25,481 |
|
| Net (increase) decrease in other assets | 35,154 |
| | (11,424 | ) | | 21,285 |
|
| Net increase (decrease) in accrued expenses and other liabilities | (12,919 | ) | | 24,061 |
| | (18,124 | ) |
| Other operating activities, net | 2,806 |
| | 4,951 |
| | (2,816 | ) |
| Net cash provided by (used in) operating activities | 92,817 |
| | (16,056 | ) | | 64,448 |
|
| Investing activities | |
| | |
| | |
|
| Net decrease in time deposits placed and other short-term investments | 7,154 |
| | 7,310 |
| | 105 |
|
| Net (increase) decrease in federal funds sold and securities borrowed or purchased under agreements to resell | 29,596 |
| | (8,741 | ) | | (1,567 | ) |
| Proceeds from sales of debt securities carried at fair value | 119,013 |
| | 74,068 |
| | 120,125 |
|
| Proceeds from paydowns and maturities of debt securities carried at fair value | 85,554 |
| | 71,509 |
| | 56,732 |
|
| Purchases of debt securities carried at fair value | (175,983 | ) | | (164,491 | ) | | (99,536 | ) |
| Proceeds from paydowns and maturities of held-to-maturity debt securities | 8,472 |
| | 6,261 |
| | 602 |
|
| Purchases of held-to-maturity debt securities | (14,388 | ) | | (20,991 | ) | | (35,552 | ) |
| Proceeds from sales of loans and leases | 12,331 |
| | 1,837 |
| | 3,124 |
|
| Purchases of loans and leases | (16,734 | ) | | (9,178 | ) | | (9,638 | ) |
| Other changes in loans and leases, net | (34,256 | ) | | 2,557 |
| | 2,864 |
|
| Net sales (purchases) of premises and equipment | (521 | ) | | 5 |
| | (1,307 | ) |
| Proceeds from sales of foreclosed properties | 1,099 |
| | 2,799 |
| | 2,532 |
|
| Proceeds from sales of investments | 4,818 |
| | 2,396 |
| | 14,840 |
|
| Other investing activities, net | (1,097 | ) | | (320 | ) | | (895 | ) |
| Net cash provided by (used in) investing activities | 25,058 |
| | (34,979 | ) | | 52,429 |
|
| Financing activities | |
| | |
| | |
|
| Net increase in deposits | 14,010 |
| | 72,220 |
| | 22,611 |
|
| Net increase (decrease) in federal funds purchased and securities loaned or sold under agreements to repurchase | (95,153 | ) | | 78,395 |
| | (30,495 | ) |
| Net increase (decrease) in short-term borrowings | 16,009 |
| | (5,017 | ) | | (24,264 | ) |
| Proceeds from issuance of long-term debt | 45,658 |
| | 22,200 |
| | 26,001 |
|
| Retirement of long-term debt | (65,602 | ) | | (124,389 | ) | | (101,814 | ) |
| Proceeds from issuance of preferred stock and warrants | 1,008 |
| | 667 |
| | 5,000 |
|
| Redemption of preferred stock | (6,461 | ) | | — |
| | — |
|
| Common stock repurchased | (3,220 | ) | | — |
| | — |
|
| Cash dividends paid | (1,677 | ) | | (1,909 | ) | | (1,738 | ) |
| Excess tax benefits on share-based payments | 12 |
| | 13 |
| | 42 |
|
| Other financing activities, net | (26 | ) | | 236 |
| | 3 |
|
| Net cash provided by (used in) financing activities | (95,442 | ) | | 42,416 |
| | (104,654 | ) |
| Effect of exchange rate changes on cash and cash equivalents | (1,863 | ) | | (731 | ) | | (548 | ) |
| Net increase (decrease) in cash and cash equivalents | 20,570 |
| | (9,350 | ) | | 11,675 |
|
| Cash and cash equivalents at January 1 | 110,752 |
| | 120,102 |
| | 108,427 |
|
| Cash and cash equivalents at December 31 | $ | 131,322 |
| | $ | 110,752 |
| | $ | 120,102 |
|
| Supplemental cash flow disclosures | |
| | |
| | |
|
| Interest paid | $ | 12,912 |
| | $ | 18,268 |
| | $ | 25,207 |
|
| Income taxes paid | 1,559 |
| | 1,372 |
| | 1,653 |
|
| Income taxes refunded | (244 | ) | | (338 | ) | | (781 | ) |
During 2011, the Corporation entered into an agreement with Assured Guaranty Ltd. and subsidiaries which resulted in non-cash increases to loans of $2.2 billion, other assets of $82 million and long-term debt of $2.3 billion.
During 2011, the Corporation exchanged preferred stock, with a carrying value of $1.1 billion, for 92 million common shares valued at $522 million and senior notes valued at $360 million.
During 2011, the Corporation exchanged trust preferred securities for 308 million common shares valued at $1.7 billion and senior notes valued at $2.0 billion. The trust preferred securities, and underlying junior subordinated notes and stock purchase agreements, with a carrying value of $5.2 billion, were immediately canceled. |
| | | | | | | | | | | |
| | | | | | |
| Consolidated Statement of Cash Flows |
| | | | | | |
| (Dollars in millions) | 2014 | | 2013 | | 2012 |
| Operating activities | |
| | |
| | |
|
| Net income | $ | 4,833 |
| | $ | 11,431 |
| | $ | 4,188 |
|
| Adjustments to reconcile net income to net cash provided by (used in) operating activities: | |
| | |
| | |
|
| Provision for credit losses | 2,275 |
| | 3,556 |
| | 8,169 |
|
| Gains on sales of debt securities | (1,354 | ) | | (1,271 | ) | | (1,662 | ) |
| Fair value adjustments on structured liabilities | (407 | ) | | 649 |
| | 5,107 |
|
| Depreciation and premises improvements amortization | 1,586 |
| | 1,597 |
| | 1,774 |
|
| Amortization of intangibles | 936 |
| | 1,086 |
| | 1,264 |
|
| Net amortization of premium/discount on debt securities | 2,688 |
| | 1,577 |
| | 2,580 |
|
| Deferred income taxes | 726 |
| | 3,262 |
| | (2,735 | ) |
| Loans held-for-sale: | | | | | |
| Originations and purchases | (40,113 | ) | | (65,688 | ) | | (59,540 | ) |
| Proceeds from sales and paydowns of loans originally classified as held-for-sale | 38,528 |
| | 77,707 |
| | 54,817 |
|
| Net change in: | | | | | |
| Trading and derivative instruments | 6,621 |
| | 33,870 |
| | (47,606 | ) |
| Other assets | 2,380 |
| | 35,154 |
| | (11,424 | ) |
| Accrued expenses and other liabilities | 9,702 |
| | (12,919 | ) | | 24,061 |
|
| Other operating activities, net | (1,662 | ) | | 2,806 |
| | 4,951 |
|
| Net cash provided by (used in) operating activities | 26,739 |
| | 92,817 |
| | (16,056 | ) |
| Investing activities | |
| | |
| | |
|
| Net change in: | | | | | |
| Time deposits placed and other short-term investments | 4,030 |
| | 7,154 |
| | 7,310 |
|
| Federal funds sold and securities borrowed or purchased under agreements to resell | (1,495 | ) | | 29,596 |
| | (8,741 | ) |
| Debt securities carried at fair value: | | | | | |
| Proceeds from sales | 159,071 |
| | 119,013 |
| | 74,068 |
|
| Proceeds from paydowns and maturities | 79,704 |
| | 85,554 |
| | 71,509 |
|
| Purchases | (280,571 | ) | | (175,983 | ) | | (164,491 | ) |
| Held-to-maturity debt securities: | | | | | |
| Proceeds from paydowns and maturities | 7,889 |
| | 8,472 |
| | 6,261 |
|
| Purchases | (13,274 | ) | | (14,388 | ) | | (20,991 | ) |
| Loans and leases: | | | | | |
| Proceeds from sales | 28,765 |
| | 12,331 |
| | 1,837 |
|
| Purchases | (10,609 | ) | | (16,734 | ) | | (9,178 | ) |
| Other changes in loans and leases, net | 22,635 |
| | (34,256 | ) | | 2,557 |
|
| Net sales (purchases) of premises and equipment | (1,160 | ) | | (521 | ) | | 5 |
|
| Proceeds from sales of foreclosed properties | 855 |
| | 1,099 |
| | 2,799 |
|
| Proceeds from sales of investments | 1,577 |
| | 4,818 |
| | 2,396 |
|
| Other investing activities, net | (1,621 | ) | | (1,097 | ) | | (320 | ) |
| Net cash provided by (used in) investing activities | (4,204 | ) | | 25,058 |
| | (34,979 | ) |
| Financing activities | |
| | |
| | |
|
| Net change in: | | | | | |
| Deposits | (335 | ) | | 14,010 |
| | 72,220 |
|
| Federal funds purchased and securities loaned or sold under agreements to repurchase | 3,171 |
| | (95,153 | ) | | 78,395 |
|
| Short-term borrowings | (14,827 | ) | | 16,009 |
| | (5,017 | ) |
| Long-term debt: | | | | | |
| Proceeds from issuance | 51,573 |
| | 45,658 |
| | 22,200 |
|
| Retirement of long-term debt | (53,749 | ) | | (65,602 | ) | | (124,389 | ) |
| Preferred stock: | | | | | |
| Proceeds from issuance | 5,957 |
| | 1,008 |
| | 667 |
|
| Redemption | — |
| | (6,461 | ) | | — |
|
| Common stock repurchased | (1,675 | ) | | (3,220 | ) | | — |
|
| Cash dividends paid | (2,306 | ) | | (1,677 | ) | | (1,909 | ) |
| Excess tax benefits on share-based payments | 34 |
| | 12 |
| | 13 |
|
| Other financing activities, net | (44 | ) | | (26 | ) | | 236 |
|
| Net cash provided by (used in) financing activities | (12,201 | ) | | (95,442 | ) | | 42,416 |
|
| Effect of exchange rate changes on cash and cash equivalents | (3,067 | ) | | (1,863 | ) | | (731 | ) |
| Net increase (decrease) in cash and cash equivalents | 7,267 |
| | 20,570 |
| | (9,350 | ) |
| Cash and cash equivalents at January 1 | 131,322 |
| | 110,752 |
| | 120,102 |
|
| Cash and cash equivalents at December 31 | $ | 138,589 |
| | $ | 131,322 |
| | $ | 110,752 |
|
| Supplemental cash flow disclosures | |
| | |
| | |
|
| Interest paid | $ | 11,082 |
| | $ | 12,912 |
| | $ | 18,268 |
|
| Income taxes paid | 2,558 |
| | 1,559 |
| | 1,372 |
|
| Income taxes refunded | (144 | ) | | (244 | ) | | (338 | ) |
See accompanying Notes to Consolidated Financial Statements.
|
| | |
| | | Bank of America 20132014 157148 |
Bank of America Corporation and Subsidiaries
Notes to Consolidated Financial Statements
NOTE 1 Summary of Significant Accounting Principles
Bank of America Corporation (together with its consolidated subsidiaries, the Corporation), a bank holding company (BHC) and a financial holding company, provides a diverse range of financial services and products throughout the U.S. and in certain international markets. The term “the Corporation” as used herein may refer to Bank of America Corporation individually, Bank of America Corporation and its subsidiaries, or certain of Bank of America Corporation’s subsidiaries or affiliates.
The Corporation conducts its activities through banking and nonbankingnonbank subsidiaries. ThePrior to October 1, 2014, the Corporation operatesoperated its banking activities primarily under two charters: Bank of America, National Association (Bank of America, N.A. or BANA) and, to a lesser extent, FIA Card Services, National Association (FIA Card Services, N.A. or FIA). On October 1, 2014, FIA was merged into BANA.
Principles of Consolidation and Basis of Presentation
The Consolidated Financial Statements include the accounts of the Corporation and its majority-owned subsidiaries, and those variable interest entities (VIEs) where the Corporation is the primary beneficiary. Intercompany accounts and transactions have been eliminated. Results of operations of acquired companies are included from the dates of acquisition and for VIEs, from the dates that the Corporation became the primary beneficiary. Assets held in an agency or fiduciary capacity are not included in the Consolidated Financial Statements. The Corporation accounts for investments in companies for which it owns a voting interest and for which it has the ability to exercise significant influence over operating and financing decisions using the equity method of accounting or at fair value under the fair value option.accounting. These investments are included in other assets. Equity method investments are subject to impairment testing and the Corporation’s proportionate share of income or loss is included in equity investment income.
The preparation of the Consolidated Financial Statements in conformity with accounting principles generally accepted in the United States of America requires management to make estimates and assumptions that affect reported amounts and disclosures. Realized results could differ from those estimates and assumptions.
The Corporation evaluates subsequent events through the date of filing with the Securities and Exchange Commission (SEC). Certain prior-period amounts have been reclassified to conform to current period presentation.
New Accounting Pronouncements
Effective January 1, 2013, the Corporation retrospectively adopted new accounting guidance fromIn August 2014, the Financial Accounting Standards Board (FASB) requiring additional disclosuresissued new accounting guidance on the effectclassification and measurement of netting arrangements on an entity’s financial position. The disclosures relate to derivatives and securities financing agreementsforeclosed mortgage loans that are either offset on the balance sheet under existing accounting guidance or are subject to a legally enforceable master netting or similar agreement.government guaranteed. This new guidance addresses only disclosuresstates that such foreclosed properties should be classified as other assets and accordingly, did not have an impactmeasured based on the Corporation’s consolidated financial position or resultsamount of operations.the loan balance expected to be recovered
Effectivefrom the guarantor. The new guidance is effective beginning on January 1, 2012, the Corporation adopted amendments from the FASB to the fair value accounting guidance. The amendments clarify the application of the highest and best use, and valuation premise concepts, preclude the application of “blockage factors” in the valuation of all financial instruments and include criteria for applying the fair value measurement principles to portfolios of financial instruments. The amendments also prescribe additional disclosures for Level 3 fair value measurements and financial instruments not carried at fair value. The adoption of this2015 using either a prospective or modified retrospective transition method. This new guidance didwill not have a material impact on the Corporation’s consolidated financial position or results of operations. For
In August 2014, the related disclosures, see Note 20 – Fair Value Measurements and Note 22 – Fair Value of Financial Instruments.
Effective January 1, 2012, the Corporation adoptedFASB issued new accounting guidance fromthat provides a measurement alternative for entities that consolidate a collateralized financing entity (CFE). The new guidance allows an entity to measure both the financial assets and financial liabilities of a CFE using the fair value of either the financial assets or financial liabilities, whichever is more observable. This alternative is available for CFEs where the financial assets and financial liabilities are carried at fair value and changes in fair value are reported in earnings. The new guidance is effective beginning on January 1, 2016. This new guidance will not have a material impact on the Corporation’s consolidated financial position or results of operations.
In June 2014, the FASB issued new guidance on accounting and disclosure of repurchase-to-maturity (RTM) transactions and repurchase financings (repos). Under this new accounting guidance, RTMs will be accounted for as secured borrowings rather than sales of an asset, and transfers of financial assets with a contemporaneous repo will no longer be evaluated to determine whether they should be accounted for on a combined basis as forward contracts. The new guidance also prescribes additional disclosures particularly on the presentationnature of comprehensive incomecollateral pledged in repos accounted for as secured borrowings. The new guidance is effective beginning on January 1, 2015. This new guidance will not have a material impact on the Corporation’s consolidated financial statements.position or results of operations.
In May 2014, the FASB issued new accounting guidance to clarify the principles for recognizing revenue from contracts with customers. The new accounting guidance, which does not apply to financial instruments, is effective on a retrospective basis beginning on January 1, 2017. The Corporation adopteddoes not expect the new guidance by reporting the componentsto have a material impact on its consolidated financial position or results of comprehensive income in two separate but consecutive statements. For the new statement and related information, see the Consolidated Statement of Comprehensive Income and Note 14 – Accumulated Other Comprehensive Income (Loss).operations.
OnIn January 15, 2014, the FASB issued new guidance on accounting for qualified affordable housing projects which permits entities to make an accounting policy election to apply the proportionateproportional amortization method when specific conditions are met. The new accounting guidance is effective on a retrospective basis beginning on January 1, 2015 with early adoption permitted. The Corporation is currently assessing whether it will adopt the proportionateproportional amortization method. If such method is adopted, the Corporation does not expect it to have a material impact on theits consolidated financial position or results of operations.
In December 2012, the FASB issued a proposed standard on accounting for credit losses. It would replace multiple existing impairment models, including an “incurred loss” model for loans, with an “expected loss” model. The FASB announced it would establish thehas not yet established an effective date when it issues the final standard. The Corporation cannot predict at this time whether or whenbut a final standard willis expected to be issued when it will be effective or what its final provisions will be.in the second half of 2015. The final standard may materially reduce retained earnings in the period of adoption.
Cash and Cash Equivalents
Cash and cash equivalents include cash on hand, cash items in the process of collection, cash segregated under federal and other brokerage regulations, and amounts due from correspondent banks, the Federal Reserve Bank and certain non-U.S. central banks.
Securities Financing Agreements
Securities borrowed or purchased under agreements to resell and securities loaned or sold under agreements to repurchase (securities financing agreements) are treated as collateralized financing transactions except in instances where the transaction is required to be accounted for as individual sale and purchase transactions. Generally, these agreements are recorded at the amounts at which the securities were acquired or sold plus accrued interest, except for certain securities financing agreements that the Corporation accounts for under the fair value option. Changes
in the fair value of securities financing agreements that are accounted for under the fair value option are recorded in trading account profits in the Consolidated Statement of Income. For more information on securities financing agreements that the Corporation accounts for under the fair value option, see Note 21 – Fair Value Option.
The Corporation’s policy is to obtain possession of collateral with a market value equal to or in excess of the principal amount loaned under resale agreements. To ensure that the market value of the underlying collateral remains sufficient, collateral is generally valued daily and the Corporation may require counterparties to deposit additional collateral or may return collateral pledged when appropriate. Securities financing agreements give rise to negligible credit risk as a result of these collateral provisions and, accordingly, no allowance for loan losses is considered necessary.
Substantially all repurchase and resale activities are transacted under legally enforceable master repurchase agreements that give the Corporation, in the event of default by the counterparty, the right to liquidate securities held and to offset receivables and payables with the same counterparty. The Corporation offsets repurchase and resale transactions with the same counterparty on the Consolidated Balance Sheet where it has such a legally enforceable master netting agreement and the transactions have the same maturity date.
In transactions where the Corporation acts as the lender in a securities lending agreement and receives securities that can be pledged or sold as collateral, it recognizes an asset on the Consolidated Balance Sheet at fair value, representing the securities received, and a liability, for the same amount, representing the obligation to return those securities.
In repurchase transactions, typically, the termination date for a repurchase agreement is before the maturity date of the underlying security. However, in certain situations, the Corporation may enter into repurchase agreements where the termination date of the repurchase transaction is the same as the maturity date of the underlying security and these transactions are referred to as “repo-to-maturity” (RTM) transactions. In accordance with applicable accounting guidance, the Corporation accounts for RTM transactions as sales and purchases when the transferred securities are highly liquid. In instances where securities are considered sold or purchased, the Corporation removes the securities from or recognizes the securities on the Consolidated Balance Sheet and, in the case of sales, recognizes a gain or loss,
where applicable, in the Consolidated Statement of Income. At December 31, 20132014 and 2012,2013, the Corporation had no outstanding RTM transactions that had been accounted for as sales and an immaterial amount of transactions that had been accounted for as purchases.
Collateral
The Corporation accepts securities as collateral that it is permitted by contract or custom to sell or repledge. At December 31, 20132014 and 2012,2013, the fair value of this collateral was $575.3519.2 billion and $513.2575.3 billion, of which $361.5424.5 billion and $362.0430.4 billion was sold or repledged. The primary source of this collateral is securities borrowed or purchased under agreements to resell. The Corporation also pledges company-owned securities and loans as collateral in transactions that include repurchase agreements, securities loaned, public and trust deposits, U.S. Treasury tax and loan notes, and short-term borrowings. This collateral, which in
some cases can be sold or repledged by the counterparties to the transactions, is parenthetically disclosed on the Consolidated Balance Sheet.
In certain cases, the Corporation has transferred assets to consolidated VIEs where those restricted assets serve as collateral for the interests issued by the VIEs. These assets are included on the Consolidated Balance Sheet in Assets of Consolidated VIEs.
In addition, the Corporation obtains collateral in connection with its derivative contracts. Required collateral levels vary depending on the credit risk rating and the type of counterparty. Generally, the Corporation accepts collateral in the form of cash, U.S. Treasury securities and other marketable securities. Based on provisions contained in master netting agreements, the Corporation nets cash collateral received against derivative assets. The Corporation also pledges collateral on its own derivative positions which can be applied against derivative liabilities.
Trading Instruments
Financial instruments utilized in trading activities are carried at fair value. Fair value is generally based on quoted market prices or quoted market prices for similar assets and liabilities. If these market prices are not available, fair values are estimated based on dealer quotes, pricing models, discounted cash flow methodologies, or similar techniques where the determination of fair value may require significant management judgment or estimation. Realized gains and losses are recorded on a trade-date basis. Realized and unrealized gains and losses are recognized in trading account profits.
Derivatives and Hedging Activities
Derivatives are entered into on behalf of customers, for trading or to support risk management activities. Derivatives used in risk management activities include derivatives that are both designated in qualifying accounting hedge relationships and derivatives used to hedge market risks in relationships that are not designated in qualifying accounting hedge relationships (referred to as other risk management activities). Derivatives utilized by the Corporation include swaps, financial futures and forward settlement contracts, and option contracts. A swap agreement is a contract between two parties to exchange cash flows based on specified underlying notional amounts, assets and/or indices. Financial futures and forward settlement contracts
are agreements to buy or sell a quantity of a financial instrument (including another derivative financial instrument), index, currency or commodity at a predetermined rate or price during a period or at a date in the future. Option agreements can be transacted on organized exchanges or directly between parties.
All derivatives are recorded on the Consolidated Balance Sheet at fair value, taking into consideration the effects of legally enforceable master netting agreements that allow the Corporation to settle positive and negative positions and offset cash collateral held with the same counterparty on a net basis. For exchange-traded contracts, fair value is based on quoted market prices in active or inactive markets or is derived from observable market- based pricing parameters, similar to those applied to over-the-counter (OTC) derivatives. For non-exchange traded contracts, fair value is based on dealer quotes, pricing models, discounted cash flow methodologies or similar techniques for which the determination of fair value may require significant management judgment or estimation.
Valuations of derivative assets and liabilities reflect the value of the instrument including counterparty credit risk. These values also take into account the Corporation’s own credit standing.
Trading Derivatives and Other Risk Management Activities
Derivatives held for trading purposes are included in derivative assets or derivative liabilities on the Consolidated Balance Sheet with changes in fair value included in trading account profits.
Derivatives used for other risk management activities are included in derivative assets or derivative liabilities. Derivatives used in other risk management activities have not been designated in a qualifying accounting hedge relationship because they did not qualify or the risk that is being mitigated pertains to an item that is reported at fair value through earnings so that the effect of measuring the derivative instrument and the asset or liability to which the risk exposure pertains will offset in the Consolidated Statement of Income to the extent effective. The changes in the fair value of derivatives that serve to mitigate certain risks associated with mortgage servicing rights (MSRs), interest rate lock commitments (IRLCs) and first mortgage loans held-for-sale (LHFS) that are originated by the Corporation are recorded in mortgage banking income (loss).income. Changes in the fair value of derivatives that serve to mitigate interest rate risk and foreign currency risk are included in other income (loss). Credit derivatives are also used by the Corporation to mitigate the risk associated with various credit exposures. The changes in the fair value of these derivatives are included in other income (loss).
Derivatives Used For Hedge Accounting Purposes (Accounting Hedges)
For accounting hedges, the Corporation formally documents at inception all relationships between hedging instruments and hedged items, as well as the risk management objectives and strategies for undertaking various accounting hedges. Additionally, the Corporation primarily uses regression analysis at the inception of a hedge and for each reporting period thereafter to assess whether the derivative used in a hedging transaction is expected to be and has been highly effective in offsetting changes in the fair value or cash flows of a hedged item or forecasted transaction. The Corporation discontinues hedge accounting when it is determined that a derivative is not expected to be or has ceased to be highly effective as a hedge, and then reflects changes in fair
value of the derivative in earnings after termination of the hedge relationship.
The Corporation uses its accounting hedges as either fair value hedges, cash flow hedges or hedges of net investments in foreign operations. The Corporation manages interest rate and foreign currency exchange rate sensitivity predominantly through the use of derivatives. Fair value hedges are used to protect against changes in the fair value of the Corporation’s assets and liabilities that are attributable to interest rate or foreign exchange volatility. Cash flow hedges are used primarily to minimize the variability in cash flows of assets or liabilities, or forecasted transactions caused by interest rate or foreign exchange fluctuations. For terminated cash flow hedges, the maximum length of time over which forecasted transactions are hedged is approximately 25 years, with a substantial portion of the hedged transactions being less than 10 years. For open or future cash flow hedges, the maximum length of time over which forecasted transactions are or will be hedged is less than seven years.
Changes in the fair value of derivatives designated as fair value hedges are recorded in earnings, together and in the same income statement line item with changes in the fair value of the related hedged item. Changes in the fair value of derivatives designated as cash flow hedges are recorded in accumulated other comprehensive income (OCI) and are reclassified into the line item in the income statement in which the hedged item is recorded in the same period the hedged item affects earnings. Hedge ineffectiveness and gains and losses on the excluded component of a derivative in assessing hedge effectiveness are recorded in earnings in the same income statement line item. The Corporation records changes in the fair value of derivatives used as hedges of the net investment in foreign operations, to the extent effective, as a component of accumulated OCI.
If a derivative instrument in a fair value hedge is terminated or the hedge designation removed, the previous adjustments to the carrying value of the hedged asset or liability are subsequently accounted for in the same manner as other components of the carrying value of that asset or liability. For interest-earning assets and interest-bearing liabilities, such adjustments are amortized to earnings over the remaining life of the respective asset or liability. If a derivative instrument in a cash flow hedge is terminated or the hedge designation is removed, related amounts in accumulated OCI are reclassified into earnings in the same period or periods during which the hedged forecasted transaction affects earnings. If it becomes probable that a forecasted transaction will not occur, any related amounts in accumulated OCI are reclassified into earnings in that period.
Interest Rate Lock Commitments
The Corporation enters into IRLCs in connection with its mortgage banking activities to fund residential mortgage loans at specified times in the future. IRLCs that relate to the origination of mortgage loans that will be classified as held-for-sale are considered derivative instruments under applicable accounting guidance. As such, these IRLCs are recorded at fair value with changes in fair value recorded in mortgage banking income, (loss), typically resulting in recognition of a gain when the Corporation enters into IRLCs.
In estimating the fair value of an IRLC, the Corporation assigns a probability that the loan commitment will be exercised and the loan will be funded. The fair value of the commitments is derived from the fair value of related mortgage loans which is based on observable market data and includes the expected net future cash
flows related to servicing of the loans. Changes in the fair value of IRLCs are recognized based on interest rate changes, changes in the probability that the commitment will be exercised and the passage of time. Changes from the expected future cash flows related to the customer relationship are excluded from the valuation of IRLCs.
Outstanding IRLCs expose the Corporation to the risk that the price of the loans underlying the commitments might decline from inception of the rate lock to funding of the loan. To manage this risk, the Corporation utilizes forward loan sales commitments and other derivative instruments, including interest rate swaps and options, to economically hedge the risk of potential changes in the value of the loans that would result from the commitments. The changes in the fair value of these derivatives are recorded in mortgage banking income (loss).income.
Securities
Debt securities are recorded on the Consolidated Balance Sheet as of their trade date. Debt securities bought principally with the intent to buy and sell in the short term as part of the Corporation’s trading activities are reported at fair value in trading account assets with unrealized gains and losses included in trading account profits. Debt securities purchased for longer term investment purposes, as part of asset and liability management (ALM) and other strategic activities are generally reported at fair value as available-for-sale (AFS) securities with net unrealized gains and losses net-of-tax included in accumulated OCI. Certain other debt securities purchased for ALM and other strategic purposes are reported at fair value with unrealized gains and losses reported in other income (loss). These are referred to as other debt securities carried at fair value. AFS securities and other debt securities carried at fair value are reported in debt securities on the Consolidated Balance Sheet. The Corporation may hedge these other debt securities with risk management derivatives with the unrealized gains and losses also reported in other income (loss). The debt securities are carried at fair value with unrealized gains and losses reported in other income (loss) to mitigate accounting asymmetry with the risk management derivatives and to achieve operational simplifications. Debt securities which management has the intent and ability to hold to maturity are reported at amortized cost. Certain debt securities purchased for use in other risk management activities, such as hedging certain market risks related to MSRs, are reported in other assets at fair value with unrealized gains and losses reported in the same line item as the item being hedged.
The Corporation regularly evaluates each AFS and held-to-maturity (HTM) debt security where the value has declined below amortized cost to assess whether the decline in fair value is other than temporary. In determining whether an impairment is other than temporary, the Corporation considers the severity and duration of the decline in fair value, the length of time expected for recovery, the financial condition of the issuer, and other qualitative factors, as well as whether the Corporation either plans to sell the security or it is more-likely-than-not that it will be required to sell the security before recovery of the amortized cost. If the impairment of the AFS or HTM debt security is credit-related, an other-than-temporary impairment (OTTI) loss is recorded in earnings. For AFS debt securities, the non-credit-related impairment loss is recognized in accumulated OCI. If the Corporation intends to sell an AFS debt security or believes it will
more-likely-than-not be required to sell a security, the Corporation records the full amount of the impairment loss as an OTTI loss.
Interest on debt securities, including amortization of premiums and accretion of discounts, is included in interest income. Premiums and discounts are amortized to interest income over the estimated lives of the securities. Prepayment experience, which is primarily driven by interest rates, is continually evaluated to determine the estimated lives of the securities. When a change is made to the estimated lives of the securities, the related premium or discount is adjusted, with a corresponding charge or credit to interest income, to the appropriate amount had the current estimated lives been applied since the acquisition of the securities. Realized gains and losses from the sales of debt securities are determined using the specific identification method.
Marketable equity securities are classified based on management’s intention on the date of purchase and recorded on the Consolidated Balance Sheet as of the trade date. Marketable equity securities that are bought and held principally for the purpose of resale in the near term are classified as trading and are carried at fair value with unrealized gains and losses included in trading account profits. Other marketable equity securities are accounted for as AFS and classified in other assets. All AFS marketable equity securities are carried at fair value with net unrealized gains and losses included in accumulated OCI on an after-tax basis. If there is an other-than-temporary decline in the fair value of any individual AFS marketable equity security, the cost
basis is reduced and the Corporation reclassifies the associated net unrealized loss out of accumulated OCI with a corresponding charge to equity investment income. Dividend income on AFS marketable equity securities is included in equity investment income. Realized gains and losses on the sale of all AFS marketable equity securities, which are recorded in equity investment income, are determined using the specific identification method.
Certain equity investments held by Global Principal Investments (GPI), the Corporation’s diversified equity investor in private equity, real estate and other alternative investments, are subject to investment company accounting under applicable accounting guidance and, accordingly, are carried at fair value with changes in fair value reported in equity investment income. These investments are included in other assets. Initially, the transaction price of the investment is generally considered to be the best indicator of fair value. Thereafter, valuation of direct investments is based on an assessment of each individual investment using methodologies that include publicly-traded comparables derived by multiplying a key performance metric (e.g., earnings before interest, taxes, depreciation and amortization) of the portfolio company by the relevant valuation multiple observed for comparable companies, acquisition comparables, entry level multiples and discounted cash flow analyses, and are subject to appropriate discounts for lack of liquidity or marketability. Certain factors that may influence changes in fair value include but are not limited to recapitalizations, subsequent rounds of financing and offerings in the equity or debt capital markets. For fund investments, the Corporation generally records the fair value of its proportionate interest in the fund’s capital as reported by the respective fund managers. Other investments held by GPI are accounted for under either the equity method or at cost, depending on the Corporation’s ownership interest, and are reported in other assets.
Loans and Leases
Loans, with the exception of loans accounted for under the fair value option, are measured at historical cost and reported at their outstanding principal balances net of any unearned income, charge-offs, unamortized deferred fees and costs on originated loans, and for purchased loans, net of any unamortized premiums or discounts. Loan origination fees and certain direct origination
costs are deferred and recognized as adjustments to interest income over the lives of the related loans. Unearned income, discounts and premiums are amortized to interest income using a level yield methodology. The Corporation elects to account for certain consumer and commercial loans under the fair value option with changes in fair value reported in other income (loss).
Under applicable accounting guidance, for reporting purposes, the loan and lease portfolio is categorized by portfolio segment and, within each portfolio segment, by class of financing receivables. A portfolio segment is defined as the level at which an entity develops and documents a systematic methodology to determine the allowance for credit losses, and a class of financing receivables is defined as the level of disaggregation of portfolio segments based on the initial measurement attribute, risk characteristics and methods for assessing risk. The Corporation’s three portfolio segments are Home Loans, Credit Card and Other Consumer, and Commercial. The classes within the Home Loans portfolio segment are core portfolio residential mortgage, Legacy Assets & Servicing residential mortgage, core portfolio home
equity and Legacy Assets & Servicing home equity. The classes within the Credit Card and Other Consumer portfolio segment are U.S. credit card, non-U.S. credit card, direct/indirect consumer and other consumer. The classes within the Commercial portfolio segment are U.S. commercial, commercial real estate, commercial lease financing, non-U.S. commercial and U.S. small business commercial.
Purchased Credit-impaired Loans
The Corporation purchases loans with and without evidence of credit quality deterioration since origination. Evidence of credit quality deterioration as of the purchase date may include statistics such as past due status, refreshed borrower credit scores and refreshed loan-to-value (LTV) ratios, some of which are not immediately available as of the purchase date. Purchased loans with evidence of credit quality deterioration for which it is probable that the Corporation will not receive all contractually required payments receivable are accounted for as purchased credit- impaired (PCI) loans. The excess of the cash flows expected to be collected on PCI loans, measured as of the acquisition date, over the estimated fair value is referred to as the accretable yield and is recognized in interest income over the remaining life of the loan using a level yield methodology. The difference between contractually required payments as of the acquisition date and the cash flows expected to be collected is referred to as the nonaccretable difference. PCI loans that have similar risk characteristics, primarily credit risk, collateral type and interest rate risk, are pooled and accounted for as a single asset with a single composite interest rate and an aggregate expectation of cash flows. Once a pool is assembled, it is treated as if it was one loan for purposes of applying the accounting guidance for PCI loans. An individual loan is removed from a PCI loan pool if it is sold, foreclosed, forgiven or the expectation of any future proceeds is remote. When a loan is removed from a PCI loan pool and the foreclosure or recovery value of the loan is less than the loan’s carrying value, the difference is first applied against the PCI pool’s nonaccretable difference. If the nonaccretable difference has been fully utilized, only then is the PCI pool’s basis applicable to that loan written-off against its valuation reserve; however, the integrity of the pool is maintained and it continues to be accounted for as if it was one loan.
The Corporation continues to estimate cash flows expected to be collected over the life of the PCI loans using internal credit risk, interest rate and prepayment risk models that incorporate management’s best estimate of current key assumptions such as default rates, loss severity and paymentprepayment speeds. If, upon subsequent evaluation, the Corporation determines it is probable that the present value of the expected cash flows has decreased, the PCI loan is considered to be further impaired resulting in a charge to the provision for credit losses and a corresponding increase to a valuation allowance included in the allowance for loan and lease losses. The present value of the expected cash flows is then recalculated each period, which may result in additional impairment or a reduction of the valuation allowance. If there is no valuation allowance and it is probable that there is a significant increase in the present value of the expected cash flows, the Corporation recalculates the amount of accretable yield as the excess of the revised expected cash flows over the current carrying value resulting in a reclassification from nonaccretable difference to accretable yield. Reclassifications from nonaccretable difference can also occur if there is a change in the expected lives of the loans. The present value of the expected
cash flows is determined using the PCI loans’ effective interest rate, adjusted for changes in the PCI loans’ interest rate indices.
Leases
The Corporation provides equipment financing to its customers through a variety of lease arrangements. Direct financing leases are carried at the aggregate of lease payments receivable plus estimated residual value of the leased property less unearned income. Leveraged leases, which are a form of financing leases, are reported net of non-recourse debt. Unearned income on leveraged and direct financing leases is accreted to interest income over the lease terms using methods that approximate the interest method.
Allowance for Credit Losses
The allowance for credit losses, which includes the allowance for loan and lease losses and the reserve for unfunded lending commitments, represents management’s estimate of probable losses inherent in the Corporation’s lending activities. The allowance for loan and lease losses and the reserve for unfunded lending commitments exclude amounts for loans and unfunded lending commitments accounted for under the fair value option as the fair values of these instruments reflect a credit component. The allowance for loan and lease losses does not include amounts related to accrued interest receivable, other than billed interest and fees on credit card receivables, as accrued interest receivable is reversed when a loan is placed on nonaccrual status. The allowance for loan and lease losses represents the estimated probable credit losses on funded consumer and commercial loans and leases while the reserve for unfunded lending commitments, including standby letters of credit and binding unfunded loan commitments, represents estimated probable credit losses on these unfunded credit instruments based on utilization assumptions. Lending-related credit exposures deemed to be uncollectible, excluding loans carried at fair value, are charged off against these accounts. Write-offs on PCI loans on which there is a valuation allowance are written-off against the valuation allowance. For additional information, see the Purchased Credit-impaired Loans in this Note. Cash recovered on previously charged offcharged-off amounts is recorded as a recovery to these accounts.
Management evaluates the adequacy of the allowance for credit losses based on the combined total of the allowance for loan and lease losses and the reserve for unfunded lending commitments.
The Corporation performs periodic and systematic detailed reviews of its lending portfolios to identify credit risks and to assess the overall collectability of those portfolios. The allowance on certain homogeneous consumer loan portfolios, which generally consist of consumer real estate within the Home Loans portfolio segment and credit card loans within the Credit Card and Other Consumer portfolio segment, is based on aggregated portfolio segment evaluations generally by product type. Loss forecast models are utilized for these portfolios which consider a variety of factors including, but not limited to, historical loss experience, estimated defaults or foreclosures based on portfolio trends, delinquencies, bankruptcies, economic conditions and credit scores.
The Corporation’s Home Loans portfolio segment is comprised primarily of large groups of homogeneous consumer loans secured by residential real estate. The amount of losses incurred in the homogeneous loan pools is estimated based on the number of loans that will default and the loss in the event of default. Using
modeling methodologies, the Corporation estimates the number of homogeneous loans that will default based on the individual loans’ attributes aggregated into pools of homogeneous loans with similar attributes. The attributes that are most significant to the probability of default and are used to estimate defaults include refreshed LTV or, in the case of a subordinated lien, refreshed combined loan-to-value,LTV, borrower credit score, months since origination (referred to as vintage) and geography, all of which are further broken down by present collection status (whether the loan is current, delinquent, in default or in bankruptcy). This estimate is based on the Corporation’s historical experience with the loan portfolio. The estimate is adjusted to reflect an assessment of environmental factors not yet reflected in the historical data underlying the loss estimates, such as changes in real estate values, local and national economies, underwriting standards and the regulatory environment. The probability of default on a loan is based on an analysis of the movement of loans with the measured attributes from either current or any of the delinquency categories to default over a 12-month period. On home equity loans where the Corporation holds only a second-lien position and foreclosure is not the best alternative, the loss severity is estimated at 100 percent.
The allowance on certain commercial loans (except business card and certain small business loans) is calculated using loss rates delineated by risk rating and product type. Factors considered when assessing loss rates include the value of the underlying collateral, if applicable, the industry of the obligor, and the obligor’s liquidity and other financial indicators along with certain qualitative factors. These statistical models are updated regularly for changes in economic and business conditions. Included in the analysis of consumer and commercial loan portfolios are reserves which are maintained to cover uncertainties that affect the Corporation’s estimate of probable losses including domestic and global economic uncertainty and large single namesingle-name defaults.
The remaining portfolios, including nonperforming commercial loans, as well as consumer and commercial loans modified in a troubled debt restructuring (TDR), are reviewed in accordance with applicable accounting guidance on impaired loans and TDRs. If necessary, a specific allowance is established for these loans if they are deemed to be impaired. A loan is considered impaired when, based on current information and events, it is probable that
the Corporation will be unable to collect all amounts due, including principal and/or interest, in accordance with the contractual terms of the agreement, or the loan has been modified in a TDR. Once a loan has been identified as impaired, management measures impairment primarily based on the present value of payments expected to be received, discounted at the loans’ original effective contractual interest rates, or discounted at the portfolio average contractual annual percentage rate, excluding promotionally priced loans, in effect prior to restructuring. Impaired loans and TDRs may also be measured based on observable market prices, or for loans that are solely dependent on the collateral for repayment, the estimated fair value of the collateral less costs to sell. If the recorded investment in impaired loans exceeds this amount, a specific allowance is established as a component of the allowance for loan and lease losses unless these are secured consumer loans that are solely dependent on the collateral for repayment, in which case the amount that exceeds the fair value of the collateral is charged off.
Generally, when determining the fair value of the collateral securing consumer real estate-secured loans that are solely dependent on the collateral for repayment, prior to performing a
detailed property valuation including a walk-through of a property, the Corporation initially estimates the fair value of the collateral securing these consumer loans using an automated valuation method (AVM). An AVM is a tool that estimates the value of a property by reference to market data including sales of comparable properties and price trends specific to the Metropolitan Statistical Area in which the property being valued is located. In the event that an AVM value is not available, the Corporation utilizes publicized indices or if these methods provide less reliable valuations, the Corporation uses appraisals or broker price opinions to estimate the fair value of the collateral. While there is inherent imprecision in these valuations, the Corporation believes that they are representative of the portfolio in the aggregate.
In addition to the allowance for loan and lease losses, the Corporation also estimates probable losses related to unfunded lending commitments, such as letters of credit and financial guarantees, and binding unfunded loan commitments. The reserve for unfunded lending commitments excludes commitments accounted for under the fair value option. Unfunded lending commitments are subject to individual reviews and are analyzed and segregated by risk according to the Corporation’s internal risk rating scale. These risk classifications, in conjunction with an analysis of historical loss experience, utilization assumptions, current economic conditions, performance trends within the portfolio and any other pertinent information, result in the estimation of the reserve for unfunded lending commitments.
The allowance for credit losses related to the loan and lease portfolio is reported separately on the Consolidated Balance Sheet whereas the reserve for unfunded lending commitments is reported on the Consolidated Balance Sheet in accrued expenses and other liabilities. The provision for credit losses related to the loan and lease portfolio and unfunded lending commitments is reported in the Consolidated Statement of Income.
Nonperforming Loans and Leases, Charge-offs and Delinquencies
Nonperforming loans and leases generally include loans and leases that have been placed on nonaccrual status, including nonaccruing loans whose contractual terms have been restructured in a manner that grants a concession to a borrower
experiencing financial difficulties. Loans accounted for under the fair value option, PCI loans and LHFS are not reported as nonperforming.
In accordance with the Corporation’s policies, consumer real estate-secured loans, including residential mortgages and home equity loans, are generally placed on nonaccrual status and classified as nonperforming at 90 days past due unless repayment of the loan is insured by the Federal Housing Administration or through individually insured long-term standby agreements with Fannie Mae or Freddie Mac (the fully-insured portfolio). Residential mortgage loans in the fully-insured portfolio are not placed on nonaccrual status and, therefore, are not reported as nonperforming. Junior-lien home equity loans are placed on nonaccrual status and classified as nonperforming when the underlying first-lien mortgage loan becomes 90 days past due even if the junior-lien loan is current. Accrued interest receivable is reversed when a consumer loan is placed on nonaccrual status. Interest collections on nonaccruing consumer loans for which the ultimate collectability of principal is uncertain are generally applied as principal reductions; otherwise, such collections are credited to interest income when received. These loans may be restored
to accrual status when all principal and interest is current and full repayment of the remaining contractual principal and interest is expected, or when the loan otherwise becomes well-secured and is in the process of collection. The outstanding balance of real estate-secured loans that is in excess of the estimated property value less costs to sell is charged off no later than the end of the month in which the loan becomes 180 days past due unless the loan is fully insured. The estimated property value less costs to sell is determined using the same process as described for impaired loans in the Allowance for Credit Losses in this Note.
Consumer loans secured by personal property, credit card loans and other unsecured consumer loans are not placed on nonaccrual status prior to charge-off and, therefore, are not reported as nonperforming loans, except for certain secured consumer loans, including those that have been modified in a TDR. Personal property-secured loans are charged off to collateral value no later than the end of the month in which the account becomes 120 days past due or, for loans in bankruptcy, 60 days past due. Credit card and other unsecured consumer loans are charged off no later than the end of the month in which the account becomes 180 days past due or within 60 days after receipt of notification of death or bankruptcy.
Commercial loans and leases, excluding business card loans, that are past due 90 days or more as to principal or interest, or where reasonable doubt exists as to timely collection, including loans that are individually identified as being impaired, are generally placed on nonaccrual status and classified as nonperforming unless well-secured and in the process of collection.
Accrued interest receivable is reversed when commercial loans and leases are placed on nonaccrual status. Interest collections on nonaccruing commercial loans and leases for which the ultimate collectability of principal is uncertain are applied as principal reductions; otherwise, such collections are credited to income when received. Commercial loans and leases may be restored to accrual status when all principal and interest is current and full repayment of the remaining contractual principal and interest is expected, or when the loan otherwise becomes well-secured and is in the process of collection. Business card loans are charged off no later than the end of the month in which the
account becomes 180 days past due or 60 days after receipt of notification of death or bankruptcy. These loans are not placed on nonaccrual status prior to charge-off and, therefore, are not reported as nonperforming loans. Other commercial loans and leases are generally charged off when all or a portion of the principal amount is determined to be uncollectible.
The entire balance of a consumer loan or commercial loan or lease is contractually delinquent if the minimum payment is not received by the specified due date on the customer’s billing statement. Interest and fees continue to accrue on past due loans and leases until the date the loan is placed on nonaccrual status, if applicable.
PCI loans are recorded at fair value at the acquisition date. Although the PCI loans may be contractually delinquent, the Corporation does not classify these loans as nonperforming as the loans were written down to fair value at the acquisition date and the accretable yield is recognized in interest income over the remaining life of the loan. In addition, reported net charge-offs exclude write-offs on PCI loans as the fair value already considers the estimated credit losses.
Troubled Debt Restructurings
Consumer loans and commercial loans and leases whose contractual terms have been restructured in a manner that grants a concession to a borrower experiencing financial difficulties are classified as TDRs. Concessions could include a reduction in the interest rate to a rate that is below market on the loan, payment extensions, forgiveness of principal, forbearance or other actions designed to maximize collections. Secured consumer loans that have been discharged in Chapter 7 bankruptcy and have not been reaffirmed by the borrower are classified as TDRs at the time of discharge. Consumer real estate-secured loans for which a binding offer to restructure has been extended are also classified as TDRs. Loans classified as TDRs are considered impaired loans. Loans that are carried at fair value, LHFS and PCI loans are not classified as TDRs.
Secured consumer loans whose contractual terms have been modified in a TDR and are current at the time of restructuring generally remain on accrual status if there is demonstrated performance prior to the restructuring and payment in full under the restructured terms is expected. Otherwise, the loans are placed on nonaccrual status and reported as nonperforming, except for the fully-insured loans, until there is sustained repayment performance for a reasonable period, generally six months. If accruing consumer TDRs cease to perform in accordance with their modified contractual terms, they are placed on nonaccrual status and reported as nonperforming TDRs. Consumer TDRs that bear a below-market rate of interest are generally reported as TDRs throughout their remaining lives. Secured consumer loans that have been discharged in Chapter 7 bankruptcy are placed on nonaccrual status and written down to the estimated collateral value less costs to sell no later than at the time of discharge. If these loans are contractually current, interest collections are generally recorded in interest income on a cash basis. Credit card and other unsecured consumer loans that have been renegotiated in a TDR are not placed on nonaccrual status. Credit card and other unsecured consumer loans that have been renegotiated and placed on a fixed payment plan after July 1, 2012 are generally charged off no later than the end of the month in which the account becomes 120 days past due.
Commercial loans and leases whose contractual terms have been modified in a TDR are typically placed on nonaccrual status and reported as nonperforming until the loans or leases have performed for an adequate period of time under the restructured agreement, generally six months. If the borrower had demonstrated performance under the previous terms and the underwriting process shows the capacity to continue to perform under the modified terms, the loan may remain on accrual status. Accruing commercial TDRs are reported as performing TDRs through the end of the calendar year in which the loans are returned to accrual status. In addition, if accruing commercial TDRs bear less than a market rate of interest at the time of modification, they are reported as performing TDRs throughout their remaining lives unless and until they cease to perform in accordance with their modified contractual terms, at which time they are placed on nonaccrual status and reported as nonperforming TDRs.
A loan that had previously been modified in a TDR and is subsequently refinanced under current underwriting standards at a market rate with no concessionary terms is accounted for as a new loan and is no longer reported as a TDR.
Loans Held-for-sale
Loans that are intended to be sold in the foreseeable future, including residential mortgages, loan syndications, and to a lesser degree, commercial real estate, consumer finance and other loans, are reported as LHFS and are carried at the lower of aggregate cost or fair value. The Corporation accounts for certain LHFS, including firstresidential mortgage LHFS, under the fair value option. Mortgage loanLoan origination costs related to LHFS that the Corporation accounts for under the fair value option are recognized in noninterest expense when incurred. Mortgage loanLoan origination costs for LHFS carried at the lower of cost or fair value are capitalized as part of the carrying value of the loans and recognized as a reduction of mortgage bankingnoninterest income (loss) upon the sale of such loans. LHFS that are on nonaccrual status and are reported as nonperforming, as defined in the policy herein, are reported separately from nonperforming loans and leases.
Premises and Equipment
Premises and equipment are carried at cost less accumulated depreciation and amortization. Depreciation and amortization are recognized using the straight-line method over the estimated useful lives of the assets. Estimated lives range up to 40 years for buildings, up to 12 years for furniture and equipment, and the shorter of lease term or estimated useful life for leasehold improvements.
The Corporation capitalizes the costs associated with certain computer hardware, software and internally developed software, and amortizes the costs over the expected useful life. Direct project costs of internally developed software are capitalized when it is probable that the project will be completed and the software will be used for its intended function.
Mortgage Servicing Rights
The Corporation accounts for consumer MSRs, including residential mortgage and home equity MSRs, at fair value with changes in fair value recorded in mortgage banking income (loss).income. To reduce the volatility of earnings related to interest rate and market value fluctuations, U.S. Treasury securities, mortgage-backed securities and derivatives such as options and interest rate swaps
may be used to hedge certain market risks of the MSRs. Such derivatives are not designated as qualifying accounting hedges. These instruments are carried at fair value with changes in fair value recognized in mortgage banking income (loss).income.
The Corporation estimates the fair value of consumer MSRs using a valuation model that calculates the present value of estimated future net servicing income and, when available, quoted prices from independent parties. The present value calculation is based on an option-adjusted spread (OAS) valuation approach that factors in prepayment risk. This approach consists of projecting servicing cash flows under multiple interest rate scenarios and discounting these cash flows using risk-adjusted discount rates. The key economic assumptions used in MSR valuations include weighted-average lives of the MSRs and the OAS levels. The OAS represents the spread that is added to the discount rate so that the sum of the discounted cash flows equals the market price; therefore, it is a measure of the extra yield over the reference discount factor that the Corporation expects to earn by holding the asset.
Goodwill and Intangible Assets
Goodwill is the purchase premium after adjusting for the fair value of net assets acquired. Goodwill is not amortized but is reviewed for potential impairment on an annual basis, or when events or circumstances indicate a potential impairment, at the reporting unit level. A reporting unit, as defined under applicable accounting guidance, is a business segment or one level below a business segment. The goodwill impairment analysis is a two-step test. The first step of the goodwill impairment test involves comparing the fair value of each reporting unit with its carrying value, including goodwill, as measured by allocated equity. In certain circumstances, the first step may be performed using a qualitative assessment. If the fair value of the reporting unit exceeds its carrying value, goodwill of the reporting unit is considered not impaired; however, if the carrying value of the reporting unit exceeds its fair value, the second step must be performed to measure potential impairment.
The second step involves calculating an implied fair value of goodwill for each reporting unit for which the first step indicated possible impairment. The implied fair value of goodwill is determined in the same manner as the amount of goodwill recognized in a business combination, which is the excess of the fair value of the reporting unit, as determined in the first step, over the aggregate fair values of the assets, liabilities and identifiable intangibles as if the reporting unit was being acquired in a business combination. Measurement of the fair values of the assets and liabilities of a reporting unit is consistent with the requirements of the fair value measurements accounting guidance, as described in Fair Value in this Note. The adjustments to measure the assets, liabilities and intangibles at fair value are for the purpose of measuring the implied fair value of goodwill and such adjustments are not reflected inon the Consolidated Balance Sheet. If the implied fair value of goodwill exceeds the goodwill assigned to the reporting unit, there is no impairment. If the goodwill assigned to a reporting unit exceeds the implied fair value of goodwill, an impairment charge is recorded for the excess. An impairment loss recognized cannot exceed the amount of goodwill assigned to a reporting unit. An impairment loss establishes a new basis in the goodwill and subsequent reversals of goodwill impairment losses are not permitted under applicable accounting guidance.
For intangible assets subject to amortization, an impairment loss is recognized if the carrying value of the intangible asset is not recoverable and exceeds fair value. The carrying value of the intangible asset is considered not recoverable if it exceeds the sum of the undiscounted cash flows expected to result from the use of the asset.
Variable Interest Entities
A VIE is an entity that lacks equity investors or whose equity investors do not have a controlling financial interest in the entity through their equity investments. The entity that has a controlling financial interest in a VIE is referred to as the primary beneficiary and consolidates the VIE. The Corporation is deemed to have a controlling financial interest and is the primary beneficiary of a VIE if it has both the power to direct the activities of the VIE that most significantly impact the VIE’s economic performance and an obligation to absorb losses or the right to receive benefits that could potentially be significant to the VIE. On a quarterly basis, the Corporation reassesses whether it has a controlling financial interest in and is the primary beneficiary of a VIE. The quarterly reassessment process considers whether the Corporation has
acquired or divested the power to direct the activities of the VIE through changes in governing documents or other circumstances. The reassessment also considers whether the Corporation has acquired or disposed of a financial interest that could be significant to the VIE, or whether an interest in the VIE has become significant or is no longer significant. The consolidation status of the VIEs with which the Corporation is involved may change as a result of such reassessments. Changes in consolidation status are applied prospectively, with assets and liabilities of a newly consolidated VIE initially recorded at fair value. A gain or loss may be recognized upon deconsolidation of a VIE depending on the carrying values of deconsolidated assets and liabilities compared to the fair value of retained interests and ongoing contractual arrangements.
The Corporation primarily uses VIEs for its securitization activities, in which the Corporation transfers whole loans or debt securities into a trust or other vehicle such that the assets are legally isolated from the creditors of the Corporation. Assets held in a trust can only be used to settle obligations of the trust. The creditors of these trusts typically have no recourse to the Corporation except in accordance with the Corporation’s obligations under standard representations and warranties.
When the Corporation is the servicer of whole loans held in a securitization trust, including non-agency residential mortgages, home equity loans, credit cards, automobile loans and student loans, the Corporation has the power to direct the most significant activities of the trust. The Corporation generally does not have the power to direct the most significant activities of a residential mortgage agency trust unlessexcept in certain circumstances in which the Corporation holds substantially all of the issued securities and has the unilateral right to liquidate the trust. The power to direct the most significant activities of a commercial mortgage securitization trust is typically held by the special servicer or by the party holding specific subordinate securities which embody certain controlling rights. The Corporation consolidates a whole-loan securitization trust if it has the power to direct the most significant activities and also holds securities issued by the trust or has other contractual arrangements, other than standard representations and warranties, that could potentially be significant to the trust.
The Corporation may also transfer trading account securities and AFS securities into municipal bond or resecuritization trusts. The Corporation consolidates a municipal bond or resecuritization trust if it has control over the ongoing activities of the trust such as the remarketing of the trust’s liabilities or, if there are no ongoing activities, sole discretion over the design of the trust, including the identification of securities to be transferred in and the structure of securities to be issued, and also retains securities or has liquidity or other commitments that could potentially be significant to the trust. The Corporation does not consolidate a municipal bond or resecuritization trust if one or a limited number of third-party investors share responsibility for the design of the trust or have control over the significant activities of the trust through liquidation or other substantive rights.
Other VIEs used by the Corporation include collateralized debt obligations (CDOs), investment vehicles created on behalf of customers and other investment vehicles. The Corporation does not routinely serve as collateral manager for CDOs and, therefore, does not typically have the power to direct the activities that most significantly impact the economic performance of a CDO. However, following an event of default, if the Corporation is a majority holder of senior securities issued by a CDO and acquires the power to manage the assets of the CDO, the Corporation consolidates the CDO.
The Corporation consolidates a customer or other investment vehicle if it has control over the initial design of the vehicle or manages the assets in the vehicle and also absorbs potentially significant gains or losses through an investment in the vehicle, derivative contracts or other arrangements. The Corporation does not consolidate an investment vehicle if a single investor controlled the initial design of the vehicle or manages the assets in the vehicles or if the Corporation does not have a variable interest that could potentially be significant to the vehicle.
Retained interests in securitized assets are initially recorded at fair value. In addition, the Corporation may invest in debt securities issued by unconsolidated VIEs. Fair values of these debt securities, which are AFSclassified as trading account assets, debt securities carried at fair value or trading account assets,held-to-maturity securities, are based primarily on quoted market prices in active or inactive markets. Generally, quoted market prices for retained residual interests are not available; therefore, the Corporation estimates fair values based on the present value of the associated expected future cash flows. This may require management to estimate credit losses, prepayment speeds, forward interest yield curves, discount rates and other factors that impact the value of retained interests. Retained residual interests in unconsolidated securitization trusts are classified in trading account assets or other assets with changes in fair value recorded in income.earnings. The Corporation may also enter into derivatives with unconsolidated VIEs, which are carried at fair value with changes in fair value recorded in income.earnings.
Fair Value
The Corporation measures the fair values of its financial instrumentsassets and liabilities, where applicable, in accordance with accounting guidance that requires an entity to base fair value on exit price. A three-level hierarchy, provided in the applicable accounting guidance, for inputs is utilized in measuring fair value which maximizes the use of observable inputs and minimizes the use of unobservable inputs by requiring that observable inputs be used to determine the exit price when available. Under applicable accounting guidance, the Corporation categorizes its financial
instruments, based on the priority of inputs to the valuation technique, into this three-level hierarchy, as described below. Trading account assets and liabilities, derivative assets and liabilities, AFS debt and equity securities, other debt securities carried at fair value, certainconsumer MSRs and certain other assets are carried at fair value in accordance with applicable accounting guidance. The Corporation has also elected to account for certain assets and liabilities under the fair value option, including certain commercial and consumer loans and loan commitments, LHFS, other short-term borrowings, securities financing agreements, asset-backed secured financings, long-term deposits and long-term debt. The following describes the three-level hierarchy.
| |
| Level 1 | Unadjusted quoted prices in active markets for identical assets or liabilities. Level 1 assets and liabilities include debt and equity securities and derivative contracts that are traded in an active exchange market, as well as certain U.S. Treasury securities that are highly liquid and are actively traded in OTC markets. |
| |
| Level 2 | Observable inputs other than Level 1 prices, such as quoted prices for similar assets or liabilities, quoted prices in markets that are not active, or other inputs that are observable or can be corroborated by observable market data for substantially the full term of the assets or liabilities. Level 2 assets and liabilities include debt securities with quoted prices that are traded less frequently than exchange-traded instruments and derivative contracts where fair value is determined using a pricing model with inputs that are observable in the market or can be derived principally from or corroborated by observable market data. This category generally includes U.S. government and agency mortgage-backed and asset-backed securities, corporate debt securities, derivative contracts, certain loans and LHFS. |
securities with quoted prices that are traded less frequently than exchange-traded instruments and derivative contracts where fair value is determined using a pricing model with inputs that are observable in the market or can be derived principally from or corroborated by observable market data. This category generally includes U.S. government and agency mortgage-backed debt securities, corporate debt securities, derivative contracts, residential mortgage loans and certain LHFS.
| |
| Level 3 | Unobservable inputs that are supported by little or no market activity and that are significant to the overall fair value of the assets or liabilities. Level 3 assets and liabilities include financial instruments for which the determination of fair value requires significant management judgment or estimation. The fair value for such assets and liabilities is generally determined using pricing models, market comparables, discounted cash flow methodologies or similar techniques that incorporate the assumptions a market participant would use in pricing the asset or liability. This category generally includes certain private equity investments and other principal investments, retained residual interests in securitizations, residentialconsumer MSRs, certain asset-backed securities, highly structured, complex or long-dated derivative contracts, certain loans and LHFS, IRLCs and certain CDOs where independent pricing information cannot be obtained for a significant portion of the underlying assets. |
Income Taxes
There are two components of income tax expense: current and deferred. Current income tax expense reflects taxes to be paid or refunded for the current period. Deferred income tax expense results from changes in deferred tax assets and liabilities between periods. These gross deferred tax assets and liabilities represent
decreases or increases in taxes expected to be paid in the future because of future reversals of temporary differences in the bases of assets and liabilities as measured by tax laws and their bases as reported in the financial statements. Deferred tax assets are also recognized for tax attributes such as net operating loss carryforwards and tax credit carryforwards. Valuation allowances are recorded to reduce deferred tax assets to the amounts management concludes are more-likely-than-not to be realized.
Income tax benefits are recognized and measured based upon a two-step model: first, a tax position must be more-likely-than-not to be sustained based solely on its technical merits in order to be recognized, and second, the benefit is measured as the largest dollar amount of that position that is more-likely-than-not to be sustained upon settlement. The difference between the benefit recognized and the tax benefit claimed on a tax return is referred to as an unrecognized tax benefit. The Corporation records income tax-related interest and penalties, if applicable, within income tax expense.
Retirement Benefits
The Corporation has retirement plans covering substantially all full-time and certain part-time employees. Pension expense under these plans is charged to current operations and consists of several components of net pension cost based on various actuarial assumptions regarding future experience under the plans.
In addition, the Corporation has unfunded supplemental benefit plans and supplemental executive retirement plans (SERPs) for
selected officers of the Corporation and its subsidiaries that provide benefits that cannot be paid from a qualified retirement plan due to Internal Revenue Code restrictions. The Corporation’s current executive officers do not earn additional retirement income under SERPs. These plans are nonqualified under the Internal Revenue Code and assets used to fund benefit payments are not segregated from other assets of the Corporation; therefore, in general, a participant’s or beneficiary’s claim to benefits under these plans is as a general creditor. In addition, the Corporation has several postretirement healthcare and life insurance benefit plans.
Accumulated Other Comprehensive Income
The Corporation records unrealized gains and losses on AFS debt and marketable equity securities, gains and losses on cash flow accounting hedges, certain employee benefit plan adjustments, foreign currency translation adjustments and related hedges of net investments in foreign operations, and the cumulative adjustment related to certain accounting changes in accumulated OCI, net-of-tax. Unrealized gains and losses on AFS debt and marketable equity securities are reclassified to earnings as the gains or losses are realized upon sale of the securities. Unrealized losses on AFS securities deemed to represent OTTI are reclassified to earnings at the time of the impairment charge. For AFS debt securities that the Corporation does not intend to sell or it is not more-likely-than-not that it will be required to sell, only the credit component of an unrealized loss is reclassified to earnings. Gains or losses on derivatives accounted for as cash flow hedges are reclassified to earnings when the hedged transaction affects earnings. Translation gains or losses on foreign currency translation adjustments are reclassified to earnings upon the substantial sale or liquidation of investments in foreign operations.
Revenue Recognition
The following summarizes the Corporation’s revenue recognition policies as they relate to certain noninterest income line items in the Consolidated Statement of Income.
Card income is derived from fees such as interchange, cash advance, annual, late, over-limit and other miscellaneous fees, which are recorded as revenue when earned, primarily on an accrual basis. Uncollected fees are included in the customer card receivables balances with an amount recorded in the allowance for loan and lease losses for estimated uncollectible card receivables. Uncollected fees are written off when a card receivable reaches 180 days past due.
Service charges include fees for insufficient funds, overdrafts and other banking services and are recorded as revenue when earned. Uncollected fees are included in outstanding loan balances with an amount recorded for estimated uncollectible service fees receivable. Uncollected fees are written off when a fee receivable reaches 60 days past due.
Investment and brokerage services revenue consists primarily of asset management fees and brokerage income that are recognized over the period the services are provided or when commissions are earned. Asset management fees consist primarily of fees for investment management and trust services and are generally based on the dollar amount of the assets being managed. Brokerage income is generally derived from commissions and fees earned on the sale of various financial products.
Investment banking income consists primarily of advisory and underwriting fees that are recognized in income as the services are provided and no contingencies exist. Revenues are generally recognized net of any direct expenses. Non-reimbursed expenses are recorded as noninterest expense.
Earnings Per Common Share
Earnings per common share (EPS) is computed by dividing net income (loss) allocated to common shareholders by the weighted-average common shares outstanding, except that it does not include unvested common shares subject to repurchase or cancellation. Net income (loss) allocated to common shareholders represents net income (loss) applicable to common shareholders which is net income (loss) adjusted for preferred stock dividends including dividends declared, accretion of discounts on preferred stock including accelerated accretion when preferred stock is repaid early, and cumulative dividends related to the current dividend period that have not been declared as of period end, less income allocated to participating securities (see below for more information). Diluted EPS is computed by dividing income (loss) allocated to common shareholders plus dividends on dilutive convertible preferred stock and preferred stock that can be tendered to exercise warrants, by the weighted-average common shares outstanding plus amounts representing the dilutive effect of stock options outstanding, restricted stock, restricted stock units, outstanding warrants and the dilution resulting from the conversion of convertible preferred stock, if applicable.
Unvested share-based payment awards that contain nonforfeitable rights to dividends are participating securities that are included in computing EPS using the two-class method. The two-class method is an earnings allocation formula under which
EPS is calculated for common stock and participating securities according to dividends declared and participating rights in undistributed earnings. Under this method, all earnings, distributed and undistributed, are allocated to participating securities and common shares based on their respective rights to receive dividends.
In an exchange of non-convertible preferred stock, income allocated to common shareholders is adjusted for the difference between the carrying value of the preferred stock and the fair value of the consideration exchanged. In an induced conversion of convertible preferred stock, income allocated to common shareholders is reduced by the excess of the fair value of the consideration exchanged over the fair value of the common stock that would have been issued under the original conversion terms.
Foreign Currency Translation
Assets, liabilities and operations of foreign branches and subsidiaries are recorded based on the functional currency of each entity. For certain of the foreign operations, the functional currency is the local currency, in which case the assets, liabilities and operations are translated, for consolidation purposes, from the local currency to the U.S. dollarDollar reporting currency at period-end rates for assets and liabilities and generally at average rates for results of operations. The resulting unrealized gains or losses, as well as gains and losses from certain hedges, are reported as a component of accumulated OCI, net-of-tax. When the foreign entity’s functional currency is determined to be the U.S. dollar,Dollar, the resulting remeasurement gains or losses on foreign currency-denominated assets or liabilities are included in earnings.
Credit Card and Deposit Arrangements
Endorsing Organization Agreements
The Corporation contracts with other organizations to obtain their endorsement of the Corporation’s loan and deposit products. This endorsement may provide to the Corporation exclusive rights to market to the organization’s members or to customers on behalf of the Corporation. These organizations endorse the Corporation’s loan and deposit products and provide the Corporation with their mailing lists and marketing activities. These agreements generally have terms that range from two to five years. The Corporation typically pays royalties in exchange for the endorsement. Compensation costs related to the credit card agreements are recorded as contra-revenue in card income.
Cardholder Reward Agreements
The Corporation offers reward programs that allow its cardholders to earn points that can be redeemed for a broad range of rewards including cash, travel and gift cards and discounted products.cards. The Corporation establishes a rewards liability based upon the points earned that are expected to be redeemed and the average cost per point redeemed. The points to be redeemed are estimated based on past redemption behavior, card product type, account transaction activity and other historical card performance. The liability is reduced as the points are redeemed. The estimated cost of the rewards programs is recorded as contra-revenue in card income.
Accounting Policies
All significant accounting policies are discussed either in this Note or included in the Notes herein listed below.
|
| |
| Page |
Note 2 – Derivatives | |
Note 3 – Securities | |
Note 4 – Outstanding Loans and Leases | |
Note 6 – Securitizations and Other Variable Interest Entities | |
Note 7 – Representations and Warranties Obligations and Corporate Guarantees | |
Note 12 – Commitments and Contingencies | |
Note 15 – Earnings Per Common Share | |
Note 17 – Employee Benefit Plans | |
Note 18 – Stock-based Compensation Plans | |
Note 19 – Income Taxes | |
Note 20 – Fair Value Measurements | |
Note 23 – Mortgage Servicing Rights | |
|
| | |
168159 Bank of America 20132014
| | |
NOTE 2 Derivatives
Derivative Balances
Derivatives are entered into on behalf of customers, for trading, or to support risk management activities. Derivatives used in risk management activities include derivatives that may or may not be designated in qualifying hedge accounting relationships. Derivatives that are not designated in qualifying hedge accounting relationships are referred to as other risk management derivatives. For more information on the Corporation’s derivatives and hedging
activities, see Note 1 – Summary of Significant Accounting Principles. The following tables present derivative instruments included on the Consolidated Balance Sheet in derivative assets and liabilities at December 31, 20132014 and 20122013. Balances are presented on a gross basis, prior to the application of counterparty and cash collateral netting. Total derivative assets and liabilities are adjusted on an aggregate basis to take into consideration the effects of legally enforceable master netting agreements and have been reduced by the cash collateral received or paid.
| | | | | | | | | | | | | | | | | | | | | | | | | | | | | |
| | | | December 31, 2013 | | | December 31, 2014 |
| | | | Gross Derivative Assets | | Gross Derivative Liabilities | | | Gross Derivative Assets | | Gross Derivative Liabilities |
| (Dollars in billions) | Contract/ Notional (1) | | Trading Derivatives and Other Risk Management Derivatives | | Qualifying
Accounting Hedges | | Total | | Trading Derivatives and Other Risk Management Derivatives | | Qualifying
Accounting Hedges | | Total | Contract/ Notional (1) | | Trading and Other Risk Management Derivatives | | Qualifying
Accounting Hedges | | Total | | Trading and Other Risk Management Derivatives | | Qualifying
Accounting Hedges | | Total |
| Interest rate contracts | |
| | |
| | |
| | |
| | |
| | |
| | |
| |
| | |
| | |
| | |
| | |
| | |
| | |
|
| Swaps | $ | 33,272.0 |
| | $ | 659.9 |
| | $ | 7.5 |
| | $ | 667.4 |
| | $ | 658.4 |
| | $ | 0.9 |
| | $ | 659.3 |
| $ | 29,445.4 |
| | $ | 658.5 |
| | $ | 8.5 |
| | $ | 667.0 |
| | $ | 658.2 |
| | $ | 0.5 |
| | $ | 658.7 |
|
| Futures and forwards | 8,217.6 |
| | 1.6 |
| | — |
| | 1.6 |
| | 1.5 |
| | — |
| | 1.5 |
| 10,159.4 |
| | 1.7 |
| | — |
| | 1.7 |
| | 2.0 |
| | — |
| | 2.0 |
|
| Written options | 2,065.4 |
| | — |
| | — |
| | — |
| | 64.4 |
| | — |
| | 64.4 |
| 1,725.2 |
| | — |
| | — |
| | — |
| | 85.4 |
| | — |
| | 85.4 |
|
| Purchased options | 2,028.3 |
| | 65.4 |
| | — |
| | 65.4 |
| | — |
| | — |
| | — |
| 1,739.8 |
| | 85.6 |
| | — |
| | 85.6 |
| | — |
| | — |
| | — |
|
| Foreign exchange contracts | |
| | |
| | |
| | |
| | |
| | |
| | |
| |
| | |
| | |
| | |
| | |
| | |
| | |
|
| Swaps | 2,284.1 |
| | 43.1 |
| | 1.0 |
| | 44.1 |
| | 42.7 |
| | 1.0 |
| | 43.7 |
| 2,159.1 |
| | 51.5 |
| | 0.8 |
| | 52.3 |
| | 54.6 |
| | 1.9 |
| | 56.5 |
|
| Spot, futures and forwards | 2,922.5 |
| | 32.5 |
| | 0.7 |
| | 33.2 |
| | 33.5 |
| | 1.1 |
| | 34.6 |
| 4,226.4 |
| | 68.9 |
| | 1.5 |
| | 70.4 |
| | 72.4 |
| | 0.2 |
| | 72.6 |
|
| Written options | 412.4 |
| | — |
| | — |
| | — |
| | 9.2 |
| | — |
| | 9.2 |
| 600.7 |
| | — |
| | — |
| | — |
| | 16.0 |
| | — |
| | 16.0 |
|
| Purchased options | 392.4 |
| | 8.8 |
| | — |
| | 8.8 |
| | — |
| | — |
| | — |
| 584.6 |
| | 15.1 |
| | — |
| | 15.1 |
| | — |
| | — |
| | — |
|
| Equity contracts | |
| | |
| | |
| | |
| | |
| | |
| | |
| |
| | |
| | |
| | |
| | |
| | |
| | |
|
| Swaps | 162.0 |
| | 3.6 |
| | — |
| | 3.6 |
| | 4.2 |
| | — |
| | 4.2 |
| 193.7 |
| | 3.2 |
| | — |
| | 3.2 |
| | 4.0 |
| | — |
| | 4.0 |
|
| Futures and forwards | 71.4 |
| | 1.1 |
| | — |
| | 1.1 |
| | 1.4 |
| | — |
| | 1.4 |
| 69.5 |
| | 2.1 |
| | — |
| | 2.1 |
| | 1.8 |
| | — |
| | 1.8 |
|
| Written options | 315.6 |
| | — |
| | — |
| | — |
| | 29.6 |
| | — |
| | 29.6 |
| 341.0 |
| | — |
| | — |
| | — |
| | 26.0 |
| | — |
| | 26.0 |
|
| Purchased options | 266.7 |
| | 30.4 |
| | — |
| | 30.4 |
| | — |
| | — |
| | — |
| 318.4 |
| | 27.9 |
| | — |
| | 27.9 |
| | — |
| | — |
| | — |
|
| Commodity contracts | |
| | |
| | |
| | |
| | |
| | |
| | |
| |
| | |
| | |
| | |
| | |
| | |
| | |
|
| Swaps | 73.1 |
| | 3.8 |
| | — |
| | 3.8 |
| | 5.7 |
| | — |
| | 5.7 |
| 74.3 |
| | 5.8 |
| | — |
| | 5.8 |
| | 8.5 |
| | — |
| | 8.5 |
|
| Futures and forwards | 454.4 |
| | 4.7 |
| | — |
| | 4.7 |
| | 2.5 |
| | — |
| | 2.5 |
| 376.5 |
| | 4.5 |
| | — |
| | 4.5 |
| | 1.8 |
| | — |
| | 1.8 |
|
| Written options | 157.3 |
| | — |
| | — |
| | — |
| | 5.0 |
| | — |
| | 5.0 |
| 129.5 |
| | — |
| | — |
| | — |
| | 11.5 |
| | — |
| | 11.5 |
|
| Purchased options | 164.0 |
| | 5.2 |
| | — |
| | 5.2 |
| | — |
| | — |
| | — |
| 141.3 |
| | 10.7 |
| | — |
| | 10.7 |
| | — |
| | — |
| | — |
|
| Credit derivatives | |
| | |
| | |
| | |
| | |
| | |
| | |
| |
| | |
| | |
| | |
| | |
| | |
| | |
|
| Purchased credit derivatives: | |
| | |
| | |
| | |
| | |
| | |
| | |
| |
| | |
| | |
| | |
| | |
| | |
| | |
|
| Credit default swaps | 1,305.1 |
| | 15.7 |
| | — |
| | 15.7 |
| | 28.1 |
| | — |
| | 28.1 |
| 1,094.8 |
| | 13.3 |
| | — |
| | 13.3 |
| | 23.4 |
| | — |
| | 23.4 |
|
| Total return swaps/other | 38.1 |
| | 2.0 |
| | — |
| | 2.0 |
| | 3.2 |
| | — |
| | 3.2 |
| 44.3 |
| | 0.2 |
| | — |
| | 0.2 |
| | 1.4 |
| | — |
| | 1.4 |
|
| Written credit derivatives: | |
| | |
| | |
| | |
| | |
| | |
| | |
| |
| | |
| | |
| | |
| | |
| | |
| | |
|
| Credit default swaps | 1,265.4 |
| | 29.3 |
| | — |
| | 29.3 |
| | 13.8 |
| | — |
| | 13.8 |
| 1,073.1 |
| | 24.5 |
| | — |
| | 24.5 |
| | 11.9 |
| | — |
| | 11.9 |
|
| Total return swaps/other | 63.4 |
| | 4.0 |
| | — |
| | 4.0 |
| | 0.2 |
| | — |
| | 0.2 |
| 61.0 |
| | 0.5 |
| | — |
| | 0.5 |
| | 0.3 |
| | — |
| | 0.3 |
|
| Gross derivative assets/liabilities | |
| | $ | 911.1 |
| | $ | 9.2 |
| | $ | 920.3 |
| | $ | 903.4 |
| | $ | 3.0 |
| | $ | 906.4 |
| |
| | $ | 974.0 |
| | $ | 10.8 |
| | $ | 984.8 |
| | $ | 979.2 |
| | $ | 2.6 |
| | $ | 981.8 |
|
| Less: Legally enforceable master netting agreements | |
| | |
| | |
| | (825.5 | ) | | |
| | |
| | (825.5 | ) | |
| | |
| | |
| | (884.8 | ) | | |
| | |
| | (884.8 | ) |
| Less: Cash collateral received/paid | |
| | |
| | |
| | (47.3 | ) | | |
| | |
| | (43.5 | ) | |
| | |
| | |
| | (47.3 | ) | | |
| | |
| | (50.1 | ) |
| Total derivative assets/liabilities | |
| | |
| | |
| | $ | 47.5 |
| | |
| | |
| | $ | 37.4 |
| |
| | |
| | |
| | $ | 52.7 |
| | |
| | |
| | $ | 46.9 |
|
| |
(1) | Represents the total contract/notional amount of derivative assets and liabilities outstanding. |
|
| | |
| | | Bank of America 20132014 169160 |
| | | | | | | | | | | | | | | | | | | | | | | | | | | | | |
| | | | December 31, 2012 | | | December 31, 2013 |
| | | | Gross Derivative Assets | | Gross Derivative Liabilities | | | Gross Derivative Assets | | Gross Derivative Liabilities |
| (Dollars in billions) | Contract/ Notional (1) | | Trading Derivatives and Other Risk Management Derivatives | | Qualifying
Accounting Hedges | | Total | | Trading Derivatives and Other Risk Management Derivatives | | Qualifying
Accounting Hedges | | Total | Contract/ Notional (1) | | Trading and Other Risk Management Derivatives | | Qualifying
Accounting Hedges | | Total | | Trading and Other Risk Management Derivatives | | Qualifying
Accounting Hedges | | Total |
| Interest rate contracts | |
| | |
| | |
| | |
| | |
| | |
| | |
| |
| | |
| | |
| | |
| | |
| | |
| | |
|
| Swaps | $ | 34,667.4 |
| | $ | 1,075.4 |
| | $ | 13.8 |
| | $ | 1,089.2 |
| | $ | 1,062.6 |
| | $ | 4.7 |
| | $ | 1,067.3 |
| $ | 33,272.0 |
| | $ | 659.9 |
| | $ | 7.5 |
| | $ | 667.4 |
| | $ | 658.4 |
| | $ | 0.9 |
| | $ | 659.3 |
|
| Futures and forwards | 11,950.5 |
| | 2.8 |
| | — |
| | 2.8 |
| | 2.7 |
| | — |
| | 2.7 |
| 8,217.6 |
| | 1.6 |
| | — |
| | 1.6 |
| | 1.5 |
| | — |
| | 1.5 |
|
| Written options | 2,343.5 |
| | — |
| | — |
| | — |
| | 106.0 |
| | — |
| | 106.0 |
| 2,065.4 |
| | — |
| | — |
| | — |
| | 64.4 |
| | — |
| | 64.4 |
|
| Purchased options | 2,162.6 |
| | 105.5 |
| | — |
| | 105.5 |
| | — |
| | — |
| | — |
| 2,028.3 |
| | 65.4 |
| | — |
| | 65.4 |
| | — |
| | — |
| | — |
|
| Foreign exchange contracts | |
| | |
| | |
| | |
| | |
| | |
| | |
| |
| | |
| | |
| | |
| | |
| | |
| | |
|
| Swaps | 2,489.0 |
| | 47.4 |
| | 1.4 |
| | 48.8 |
| | 53.2 |
| | 1.8 |
| | 55.0 |
| 2,284.1 |
| | 43.1 |
| | 1.0 |
| | 44.1 |
| | 42.7 |
| | 1.0 |
| | 43.7 |
|
| Spot, futures and forwards | 3,023.0 |
| | 31.5 |
| | 0.4 |
| | 31.9 |
| | 30.5 |
| | 0.8 |
| | 31.3 |
| 2,922.5 |
| | 32.5 |
| | 0.7 |
| | 33.2 |
| | 33.5 |
| | 1.1 |
| | 34.6 |
|
| Written options | 363.3 |
| | — |
| | — |
| | — |
| | 7.3 |
| | — |
| | 7.3 |
| 412.4 |
| | — |
| | — |
| | — |
| | 9.2 |
| | — |
| | 9.2 |
|
| Purchased options | 321.8 |
| | 6.5 |
| | — |
| | 6.5 |
| | — |
| | — |
| | — |
| 392.4 |
| | 8.8 |
| | — |
| | 8.8 |
| | — |
| | — |
| | — |
|
| Equity contracts | |
| | |
| | |
| | |
| | |
| | |
| | |
| |
| | |
| | |
| | |
| | |
| | |
| | |
|
| Swaps | 127.1 |
| | 1.6 |
| | — |
| | 1.6 |
| | 2.0 |
| | — |
| | 2.0 |
| 162.0 |
| | 3.6 |
| | — |
| | 3.6 |
| | 4.2 |
| | — |
| | 4.2 |
|
| Futures and forwards | 58.4 |
| | 1.0 |
| | — |
| | 1.0 |
| | 1.0 |
| | — |
| | 1.0 |
| 71.4 |
| | 1.1 |
| | — |
| | 1.1 |
| | 1.4 |
| | — |
| | 1.4 |
|
| Written options | 295.3 |
| | — |
| | — |
| | — |
| | 20.2 |
| | — |
| | 20.2 |
| 315.6 |
| | — |
| | — |
| | — |
| | 29.6 |
| | — |
| | 29.6 |
|
| Purchased options | 271.0 |
| | 20.4 |
| | — |
| | 20.4 |
| | — |
| | — |
| | — |
| 266.7 |
| | 30.4 |
| | — |
| | 30.4 |
| | — |
| | — |
| | — |
|
| Commodity contracts | |
| | |
| | |
| | |
| | |
| | |
| | |
| |
| | |
| | |
| | |
| | |
| | |
| | |
|
| Swaps | 60.5 |
| | 2.5 |
| | 0.1 |
| | 2.6 |
| | 4.0 |
| | — |
| | 4.0 |
| 73.1 |
| | 3.8 |
| | — |
| | 3.8 |
| | 5.7 |
| | — |
| | 5.7 |
|
| Futures and forwards | 498.9 |
| | 4.8 |
| | — |
| | 4.8 |
| | 2.7 |
| | — |
| | 2.7 |
| 454.4 |
| | 4.7 |
| | — |
| | 4.7 |
| | 2.5 |
| | — |
| | 2.5 |
|
| Written options | 166.4 |
| | — |
| | — |
| | — |
| | 7.4 |
| | — |
| | 7.4 |
| 157.3 |
| | — |
| | — |
| | — |
| | 5.0 |
| | — |
| | 5.0 |
|
| Purchased options | 168.2 |
| | 7.1 |
| | — |
| | 7.1 |
| | — |
| | — |
| | — |
| 164.0 |
| | 5.2 |
| | — |
| | 5.2 |
| | — |
| | — |
| | — |
|
| Credit derivatives | |
| | |
| | |
| | |
| | |
| | |
| | |
| |
| | |
| | |
| | |
| | |
| | |
| | |
|
| Purchased credit derivatives: | |
| | |
| | |
| | |
| | |
| | |
| | |
| |
| | |
| | |
| | |
| | |
| | |
| | |
|
| Credit default swaps | 1,559.5 |
| | 35.6 |
| | — |
| | 35.6 |
| | 22.1 |
| | — |
| | 22.1 |
| 1,305.1 |
| | 15.7 |
| | — |
| | 15.7 |
| | 28.1 |
| | — |
| | 28.1 |
|
| Total return swaps/other | 43.5 |
| | 2.5 |
| | — |
| | 2.5 |
| | 2.9 |
| | — |
| | 2.9 |
| 38.1 |
| | 2.0 |
| | — |
| | 2.0 |
| | 3.2 |
| | — |
| | 3.2 |
|
| Written credit derivatives: | |
| | |
| | |
| | |
| | |
| | |
| | |
| |
| | |
| | |
| | |
| | |
| | |
| | |
|
| Credit default swaps | 1,531.5 |
| | 23.0 |
| | — |
| | 23.0 |
| | 32.6 |
| | — |
| | 32.6 |
| 1,265.4 |
| | 29.3 |
| | — |
| | 29.3 |
| | 13.8 |
| | — |
| | 13.8 |
|
| Total return swaps/other | 68.8 |
| | 0.2 |
| | — |
| | 0.2 |
| | 0.3 |
| | — |
| | 0.3 |
| 63.4 |
| | 4.0 |
| | — |
| | 4.0 |
| | 0.2 |
| | — |
| | 0.2 |
|
| Gross derivative assets/liabilities | |
| | $ | 1,367.8 |
| | $ | 15.7 |
| | $ | 1,383.5 |
| | $ | 1,357.5 |
| | $ | 7.3 |
| | $ | 1,364.8 |
| |
| | $ | 911.1 |
| | $ | 9.2 |
| | $ | 920.3 |
| | $ | 903.4 |
| | $ | 3.0 |
| | $ | 906.4 |
|
| Less: Legally enforceable master netting agreements | |
| | |
| | |
| | (1,271.9 | ) | | |
| | |
| | (1,271.9 | ) | |
| | |
| | |
| | (825.5 | ) | | |
| | |
| | (825.5 | ) |
| Less: Cash collateral received/paid | |
| | |
| | |
| | (58.1 | ) | | |
| | |
| | (46.9 | ) | |
| | |
| | |
| | (47.3 | ) | | |
| | |
| | (43.5 | ) |
| Total derivative assets/liabilities | |
| | |
| | |
| | $ | 53.5 |
| | |
| | |
| | $ | 46.0 |
| |
| | |
| | |
| | $ | 47.5 |
| | |
| | |
| | $ | 37.4 |
|
| |
(1) | Represents the total contract/notional amount of derivative assets and liabilities outstanding. |
Offsetting of Derivatives
The Corporation enters into International Swaps and Derivatives Association, Inc. (ISDA) master netting agreements or similar agreements with substantially all of the Corporation’s derivative counterparties. Where legally enforceable, these master netting agreements give the Corporation, in the event of default by the counterparty, the right to liquidate securities held as collateral and to offset receivables and payables with the same counterparty. For purposes of the Consolidated Balance Sheet, the Corporation offsets derivative assets and liabilities and cash collateral held with the same counterparty where it has such a legally enforceable master netting agreement.
The Offsetting of Derivatives table below presents derivative instruments included in derivative assets and liabilities on the Consolidated Balance Sheet at December 31, 20132014 and 20122013 by primary risk (e.g., interest rate risk) and the platform, where applicable, on which these derivatives are transacted. Exchange-traded derivatives include listed options transacted on an exchange. Over-the-counter (OTC) derivatives include bilateral transactions between the Corporation and a particular counterparty. OTC clearedOTC-cleared derivatives include bilateral transactions between the Corporation and a counterparty where the transaction is cleared through a clearinghouse. Balances are
presented on a gross basis, prior to the application of counterparty and cash collateral netting. Total gross derivative assets and liabilities are adjusted on an aggregate basis to take into consideration the effects of legally enforceable master netting agreements which includes reducing the balance for counterparty netting and have been reduced by the cash collateral received or paid.
Other gross derivative assets and liabilities in the table represent derivatives entered into under master netting agreements where uncertainty exists as to the enforceability of these agreements under bankruptcy laws in some countries or industries and, accordingly, receivables and payables with counterparties in these countries or industries are reported on a gross basis.
Also included in the table is financial instrument collateral related to legally enforceable master netting agreements that represents securities collateral received or pledged and customer cash collateral held at third-party custodians. These amounts are not offset on the Consolidated Balance Sheet but are shown as a reduction to total derivative assets and liabilities in the table to derive net derivative assets and liabilities.
For more information on offsetting of securities financing agreements, see Note 10 – Federal Funds Sold or Purchased, Securities Financing Agreements and Short-term Borrowings.
|
| | |
170161 Bank of America 20132014
| | |
| | | | | | | | | | | | | | | | | |
| Offsetting of Derivatives | | | | | | | | | | | | | | |
| | | | | | | | | | | | | | | |
| | December 31, 2013 | | December 31, 2012 | December 31, 2014 | | December 31, 2013 |
| (Dollars in billions) | Derivative Assets | | Derivative Liabilities | | Derivative Assets | | Derivative Liabilities | Derivative Assets | | Derivative Liabilities | | Derivative Assets | | Derivative Liabilities |
| Interest rate contracts | |
| | |
| | |
| | |
| |
| | |
| | |
| | |
|
| Over-the-counter | $ | 381.7 |
| | $ | 365.9 |
| | $ | 646.7 |
| | $ | 623.4 |
| $ | 386.6 |
| | $ | 373.2 |
| | $ | 381.7 |
| | $ | 365.9 |
|
| Exchange-traded | 0.4 |
| | 0.3 |
| | — |
| | — |
| 0.1 |
| | 0.1 |
| | 0.4 |
| | 0.3 |
|
| Over-the-counter cleared | 351.2 |
| | 356.5 |
| | 539.5 |
| | 545.1 |
| 365.7 |
| | 368.7 |
| | 351.2 |
| | 356.5 |
|
| Foreign exchange contracts | | | | | | | | | | | | | | |
| Over-the-counter | 82.9 |
| | 83.9 |
| | 84.1 |
| | 88.7 |
| 133.0 |
| | 139.9 |
| | 82.9 |
| | 83.9 |
|
| Equity contracts | | | | | | | | | | | | | | |
| Over-the-counter | 20.3 |
| | 17.6 |
| | 15.2 |
| | 13.3 |
| 19.5 |
| | 16.7 |
| | 20.3 |
| | 17.6 |
|
| Exchange-traded | 8.4 |
| | 9.8 |
| | 4.8 |
| | 4.7 |
| 8.6 |
| | 7.8 |
| | 8.4 |
| | 9.8 |
|
| Commodity contracts | | | | | | | | | | | | | | |
| Over-the-counter | 6.3 |
| | 7.4 |
| | 6.9 |
| | 7.9 |
| 10.2 |
| | 11.9 |
| | 6.3 |
| | 7.4 |
|
| Exchange-traded | 3.3 |
| | 2.9 |
| | 3.4 |
| | 3.2 |
| 7.4 |
| | 7.7 |
| | 3.3 |
| | 2.9 |
|
| Over-the-counter cleared | | 0.1 |
| | 0.6 |
| | — |
| | — |
|
| Credit derivatives | | | | | | | | | | | | | | |
| Over-the-counter | 44.0 |
| | 38.9 |
| | 56.0 |
| | 53.9 |
| 30.8 |
| | 30.2 |
| | 44.0 |
| | 38.9 |
|
| Over-the-counter cleared | 5.8 |
| | 5.9 |
| | 3.8 |
| | 3.4 |
| 7.0 |
| | 6.8 |
| | 5.8 |
| | 5.9 |
|
| Total gross derivative assets/liabilities, before netting | | | | | | | | | | | | | | |
| Over-the-counter | 535.2 |
| | 513.7 |
| | 808.9 |
| | 787.2 |
| 580.1 |
| | 571.9 |
| | 535.2 |
| | 513.7 |
|
| Exchange-traded | 12.1 |
| | 13.0 |
| | 8.2 |
| | 7.9 |
| 16.1 |
| | 15.6 |
| | 12.1 |
| | 13.0 |
|
| Over-the-counter cleared | 357.0 |
| | 362.4 |
| | 543.3 |
| | 548.5 |
| 372.8 |
| | 376.1 |
| | 357.0 |
| | 362.4 |
|
| Less: Legally enforceable master netting agreements and cash collateral received/paid | | | | | | | | | | | | | | |
| Over-the-counter | (505.0 | ) | | (495.4 | ) | | (780.8 | ) | | (764.4 | ) | (545.7 | ) | | (545.5 | ) | | (505.0 | ) | | (495.4 | ) |
| Exchange-traded | (11.2 | ) | | (11.2 | ) | | (5.9 | ) | | (5.9 | ) | (13.9 | ) | | (13.9 | ) | | (11.2 | ) | | (11.2 | ) |
| Over-the-counter cleared | (356.6 | ) | | (362.4 | ) | | (543.3 | ) | | (548.5 | ) | (372.5 | ) | | (375.5 | ) | | (356.6 | ) | | (362.4 | ) |
| Derivative assets/liabilities, after netting | 31.5 |
| | 20.1 |
| | 30.4 |
| | 24.8 |
| 36.9 |
| | 28.7 |
| | 31.5 |
| | 20.1 |
|
| Other gross derivative assets/liabilities | 16.0 |
| | 17.3 |
| | 23.1 |
| | 21.2 |
| 15.8 |
| | 18.2 |
| | 16.0 |
| | 17.3 |
|
| Total derivative assets/liabilities | 47.5 |
| | 37.4 |
| | 53.5 |
| | 46.0 |
| 52.7 |
| | 46.9 |
| | 47.5 |
| | 37.4 |
|
Less: Financial instruments collateral (1) | (10.1 | ) | | (4.6 | ) | | (11.5 | ) | | (14.6 | ) | (13.3 | ) | | (8.9 | ) | | (10.1 | ) | | (4.6 | ) |
| Total net derivative assets/liabilities | $ | 37.4 |
| | $ | 32.8 |
| | $ | 42.0 |
| | $ | 31.4 |
| $ | 39.4 |
| | $ | 38.0 |
| | $ | 37.4 |
| | $ | 32.8 |
|
| |
(1) | These amounts are limited to the derivative asset/liability balance and, accordingly, do not include excess collateral received/pledged. |
ALM and Risk Management Derivatives
The Corporation’s asset and liability management (ALM) and risk management activities include the use of derivatives to mitigate risk to the Corporation including derivatives designated in qualifying hedge accounting relationships and derivatives used in other risk management activities. Interest rate, foreign exchange, equity, commodity and credit contracts are utilized in the Corporation’s ALM and risk management activities.
The Corporation maintains an overall interest rate risk management strategy that incorporates the use of interest rate contracts, which are generally non-leveraged generic interest rate and basis swaps, options, futures and forwards, to minimize significant fluctuations in earnings that are caused by interest rate volatility. The Corporation’s goal is to manage interest rate sensitivity and volatility so that movements in interest rates do not significantly adversely affect earnings or capital. As a result of interest rate fluctuations, hedged fixed-rate assets and liabilities appreciate or depreciate in fair value. Gains or losses on the derivative instruments that are linked to the hedged fixed-rate assets and liabilities are expected to substantially offset this unrealized appreciation or depreciation.
Market risk, including interest rate risk, can be substantial in the mortgage business. Market risk is the risk that values of mortgage assets or revenues will be adversely affected by changes in market conditions such as interest rate movements. To mitigate the interest rate risk in mortgage banking production income, the
Corporation utilizes forward loan sale commitments and other derivative instruments, including purchased options, and certain debt securities. The Corporation also utilizes derivatives such as interest rate options, interest rate swaps, forward settlement contracts and Eurodollareurodollar futures to hedge certain market risks of MSRs.mortgage servicing rights (MSRs). For more information on MSRs, see Note 23 – Mortgage Servicing Rights.
The Corporation uses foreign exchange contracts to manage the foreign exchange risk associated with certain foreign currency-denominated assets and liabilities, as well as the Corporation’s investments in non-U.S. subsidiaries. Foreign exchange contracts, which include spot and forward contracts, represent agreements to exchange the currency of one country for the currency of another country at an agreed-upon price on an agreed-upon settlement date. Exposure to loss on these contracts will increase or decrease over their respective lives as currency exchange and interest rates fluctuate.
The Corporation enters into derivative commodity contracts such as futures, swaps, options and forwards as well as non-derivative commodity contracts to provide price risk management services to customers or to manage price risk associated with its physical and financial commodity positions. The non-derivative commodity contracts and physical inventories of commodities expose the Corporation to earnings volatility. Cash flow and fair value accounting hedges provide a method to mitigate a portion of this earnings volatility.
The Corporation purchases credit derivatives to manage credit risk related to certain funded and unfunded credit exposures. Credit derivatives include credit default swaps (CDS), total return swaps and swaptions. These derivatives are recorded on the Consolidated Balance Sheet at fair value with changes in fair value recorded in other income (loss).
Derivatives Designated as Accounting Hedges
The Corporation uses various types of interest rate, commodity and foreign exchange derivative contracts to protect against changes in the fair value of its assets and liabilities due to fluctuations in interest rates, commodity prices and exchange rates (fair value hedges). The Corporation also uses these types
of contracts and equity derivatives to protect against changes in the cash flows of its assets and liabilities, and other forecasted transactions (cash flow hedges). The Corporation hedges its net investment in consolidated non-U.S. operations determined to
have functional currencies other than the U.S. dollarDollar using forward exchange contracts and cross-currency basis swaps, and by issuing foreign currency-denominated debt (net investment hedges).
Fair Value Hedges
The table below summarizes certain information related to fair value hedges for 20132014, 20122013 and 20112012, including hedges of interest rate risk on long-term debt that were acquired as part of a business combination and redesignated. At redesignation, the fair value of the derivatives was positive. As the derivatives mature, the fair value will approach zero. As a result, ineffectiveness will occur and the fair value changes in the derivatives and the long-term debt being hedged may be directionally the same in certain scenarios. Based on a regression analysis, the derivatives continue to be highly effective at offsetting changes in the fair value of the long-term debt attributable to interest rate risk.
| | | | | | | | | |
| Derivatives Designated as Fair Value Hedges | | | | | | | | | | |
| | | | | | | | | | | |
| Gains (Losses) | 2013 | 2014 |
| (Dollars in millions) | Derivative | | Hedged Item | | Hedge Ineffectiveness | Derivative | | Hedged Item | | Hedge Ineffectiveness |
Interest rate risk on long-term debt (1) | $ | (4,704 | ) | | $ | 3,925 |
| | $ | (779 | ) | $ | 2,144 |
| | $ | (2,935 | ) | | $ | (791 | ) |
Interest rate and foreign currency risk on long-term debt (1) | (1,291 | ) | | 1,085 |
| | (206 | ) | (2,212 | ) | | 2,120 |
| | (92 | ) |
Interest rate risk on available-for-sale securities (2) | 839 |
| | (840 | ) | | (1 | ) | (35 | ) | | 3 |
| | (32 | ) |
Price risk on commodity inventory (3) | (13 | ) | | 11 |
| | (2 | ) | 21 |
| | (15 | ) | | 6 |
|
| Total | $ | (5,169 | ) | | $ | 4,181 |
| | $ | (988 | ) | $ | (82 | ) | | $ | (827 | ) | | $ | (909 | ) |
| | | | | | | | | | | |
| | 2012 | 2013 |
Interest rate risk on long-term debt (1) | $ | (195 | ) | | $ | (770 | ) | | $ | (965 | ) | $ | (4,704 | ) | | $ | 3,925 |
| | $ | (779 | ) |
Interest rate and foreign currency risk on long-term debt (1) | (1,482 | ) | | 1,225 |
| | (257 | ) | (1,291 | ) | | 1,085 |
| | (206 | ) |
Interest rate risk on available-for-sale securities (2) | (4 | ) | | 91 |
| | 87 |
| 839 |
| | (840 | ) | | (1 | ) |
Price risk on commodity inventory (3) | (6 | ) | | 6 |
| | — |
| (13 | ) | | 11 |
| | (2 | ) |
| Total | $ | (1,687 | ) | | $ | 552 |
| | $ | (1,135 | ) | $ | (5,169 | ) | | $ | 4,181 |
| | $ | (988 | ) |
| | | | | | | | | | | |
| | 2011 | 2012 |
Interest rate risk on long-term debt (1) | $ | 4,384 |
| | $ | (4,969 | ) | | $ | (585 | ) | $ | (195 | ) | | $ | (770 | ) | | $ | (965 | ) |
Interest rate and foreign currency risk on long-term debt (1) | 780 |
| | (1,057 | ) | | (277 | ) | (1,482 | ) | | 1,225 |
| | (257 | ) |
Interest rate risk on available-for-sale securities (2) | (11,386 | ) | | 10,490 |
| | (896 | ) | (4 | ) | | 91 |
| | 87 |
|
Price risk on commodity inventory (3) | 16 |
| | (16 | ) | | — |
| (6 | ) | | 6 |
| | — |
|
| Total | $ | (6,206 | ) | | $ | 4,448 |
| | $ | (1,758 | ) | $ | (1,687 | ) | | $ | 552 |
| | $ | (1,135 | ) |
| |
(1) | Amounts are recorded in interest expense on long-term debt and in other income (loss). |
| |
(2) | Amounts are recorded in interest income on debt securities. Hedged AFS securities positions were sold during 2013 and the related hedges were terminated. |
| |
(3) | Amounts relating to commodity inventory are recorded in trading account profits. |
|
| | |
172163 Bank of America 20132014
| | |
Cash Flow and Net Investment Hedges
The table below summarizes certain information related to cash flow hedges and net investment hedges for 20132014, 20122013 and 20112012. DuringOf the next 12 months,$1.7 billion net lossesloss (after-tax) on derivatives in accumulated other comprehensive income (OCI) offor 2014, $784803 million ($494502 million after-tax) on derivative instruments that qualify as cash flow hedges areis expected to be reclassified into earnings.earnings in the
next 12 months. These net losses reclassified into earnings are expected to primarily reduce net interest income related to the respective hedged items. Amounts related to commodity price risk reclassified from accumulated OCI
are recorded in trading account profits with the underlying hedged item. Amounts related to price risk on restricted stock awards reclassified from accumulated OCI are recorded in personnel expense.
Amounts related to foreign exchange risk recognized in accumulated OCI on derivatives exclude pre-tax losses of $7 million and pre-tax gains of $82 million related to long-term debt designated as a net investment hedge for 2012 and 2011. There were no such hedges for 2013.
| | | | | | | | | | | | | |
| Derivatives Designated as Cash Flow and Net Investment Hedges | | | | | | | | | | |
| | | | | | | | | | | |
| | 2013 | 2014 |
| (Dollars in millions, amounts pre-tax) | Gains (Losses)
Recognized in
Accumulated OCI on Derivatives | | Gains (Losses)
in Income
Reclassified from Accumulated OCI | | Hedge
Ineffectiveness and
Amounts Excluded
from Effectiveness Testing (1) | |
| (Dollars in millions, amounts pretax) | | Gains (Losses)
Recognized in
Accumulated OCI on Derivatives | | Gains (Losses)
in Income
Reclassified from Accumulated OCI | | Hedge
Ineffectiveness and
Amounts Excluded
from Effectiveness Testing (1) |
| Cash flow hedges | |
| | |
| | |
| |
| | |
| | |
|
| Interest rate risk on variable-rate portfolios | $ | (321 | ) | | $ | (1,102 | ) | | $ | — |
| $ | 68 |
| | $ | (1,119 | ) | | $ | (4 | ) |
| Price risk on restricted stock awards | 477 |
| | 329 |
| | — |
| 127 |
| | 359 |
| | — |
|
| Total | $ | 156 |
| | $ | (773 | ) | | $ | — |
| $ | 195 |
| | $ | (760 | ) | | $ | (4 | ) |
| Net investment hedges | |
| | |
| | |
| |
| | |
| | |
|
| Foreign exchange risk | $ | 1,024 |
| | $ | (355 | ) | | $ | (134 | ) | $ | 3,021 |
| | $ | 21 |
| | $ | (503 | ) |
| | | | | | | | | | | |
| | 2012 | 2013 |
| Cash flow hedges | |
| | |
| | |
| |
| | |
| | |
|
| Interest rate risk on variable-rate portfolios | $ | 10 |
| | $ | (957 | ) | | $ | — |
| $ | (321 | ) | | $ | (1,102 | ) | | $ | — |
|
| Price risk on restricted stock awards | 420 |
| | (78 | ) | | — |
| 477 |
| | 329 |
| | — |
|
| Total | $ | 430 |
| | $ | (1,035 | ) | | $ | — |
| $ | 156 |
| | $ | (773 | ) | | $ | — |
|
| Net investment hedges | |
| | |
| | |
| |
| | |
| | |
|
| Foreign exchange risk | $ | (771 | ) | | $ | (26 | ) | | $ | (269 | ) | $ | 1,024 |
| | $ | (355 | ) | | $ | (134 | ) |
| | | | | | | | | | | |
| | 2011 | 2012 |
| Cash flow hedges | |
| | |
| | |
| |
| | |
| | |
|
| Interest rate risk on variable-rate portfolios | $ | (2,079 | ) | | $ | (1,392 | ) | | $ | (8 | ) | $ | 10 |
| | $ | (957 | ) | | $ | — |
|
| Commodity price risk on forecasted purchases and sales | (3 | ) | | 6 |
| | (3 | ) | |
| Price risk on restricted stock awards | (408 | ) | | (231 | ) | | — |
| 420 |
| | (78 | ) | | — |
|
| Total | $ | (2,490 | ) | | $ | (1,617 | ) | | $ | (11 | ) | $ | 430 |
| | $ | (1,035 | ) | | $ | — |
|
| Net investment hedges | |
| | |
| | |
| |
| | |
| | |
|
| Foreign exchange risk | $ | (1,055 | ) | | $ | 384 |
| | $ | (572 | ) | $ | (771 | ) | | $ | (26 | ) | | $ | (269 | ) |
| |
(1) | Amounts related to derivatives designated as cash flow hedges represent hedge ineffectiveness and amounts related to net investment hedges represent amounts excluded from effectiveness testing. |
|
| | |
| | | Bank of America 20132014 173164 |
Other Risk Management Derivatives
Other risk management derivatives are used by the Corporation to reduce certain risk exposures. These derivatives are not qualifying accounting hedges because either they did not qualify
for or were not designated as accounting hedges. The table below presents gains (losses) on these derivatives for 20132014, 20122013 and
20112012. These gains (losses) are largely offset by the income or expense that is recorded on the hedged item. The change in the impact of interest rate and foreign currency risk on ALM activities was primarily driven by decreasing interest rates and foreign currency weakening against the U.S. Dollar throughout 2014 compared to strengthening during 2013.
|
| | | | | | | | | | | |
| | | | | | |
| Other Risk Management Derivatives | | | | | |
| | | | | | |
| Gains (Losses) | | | | | |
| | | | | | |
| (Dollars in millions) | 2013 | | 2012 | | 2011 |
Price risk on mortgage banking production income (1, 2) | $ | 968 |
| | $ | 3,022 |
| | $ | 2,852 |
|
Market-related risk on mortgage banking servicing income (1) | (1,108 | ) | | 2,000 |
| | 3,612 |
|
Credit risk on loans (3) | (47 | ) | | (95 | ) | | 30 |
|
Interest rate and foreign currency risk on ALM activities (4) | 2,501 |
| | 424 |
| | (48 | ) |
Price risk on restricted stock awards (5) | 865 |
| | 1,008 |
| | (610 | ) |
| Other | (19 | ) | | 58 |
| | 281 |
|
| Total | $ | 3,160 |
| | $ | 6,417 |
| | $ | 6,117 |
|
|
| | | | | | | | | | | |
| | | | | | |
| Other Risk Management Derivatives | | | | | |
| | | | | | |
| Gains (Losses) | | | | | |
| | | | | | |
| (Dollars in millions) | 2014 | | 2013 | | 2012 |
Interest rate risk on mortgage banking income (1) | $ | 1,017 |
| | $ | (619 | ) | | $ | 1,324 |
|
Credit risk on loans (2) | 16 |
| | (47 | ) | | (95 | ) |
Interest rate and foreign currency risk on ALM activities (3) | (3,683 | ) | | 2,501 |
| | 424 |
|
Price risk on restricted stock awards (4) | 600 |
| | 865 |
| | 1,008 |
|
| Other | (9 | ) | | (19 | ) | | 58 |
|
| |
(1) | Net gains (losses) on these derivatives are recorded in mortgage banking income as they are used to mitigate the interest rate risk related to MSRs, interest rate lock commitments and mortgage loans held-for-sale, all of which are measured at fair value with changes in fair value recorded in mortgage banking income. |
| |
(2)
| Includes The net gains on interest rate lock commitments related to the origination of mortgage loans that are held-for-sale, which are not included in the table but are considered derivative instruments, ofwere $776 million, $927 million, and $3.0 billion and $3.8 billionfor 20132014, 20122013 and 20112012, respectively.
|
| |
(3)(2)
| Net gains (losses) on these derivatives are recorded in other income (loss). |
| |
(4)(3)
| The balance is primarilyPrimarily related to hedges of debt securities carried at fair value and hedges of foreign currency-denominated debt. Results fromGains (losses) on these derivatives and the related hedged items are recorded in other income (loss). The offsetting mark-to-market, while not included in the table above, is also recorded in other income (loss). |
| |
(5)(4)
| Gains (losses) on these derivatives are recorded in personnel expense. |
Sales and Trading Revenue
The Corporation enters into trading derivatives to facilitate client transactions and to manage risk exposures arising from trading account assets and liabilities. It is the Corporation’s policy to include these derivative instruments in its trading activities which include derivatives and non-derivative cash instruments. The resulting risk from these derivatives is managed on a portfolio basis as part of the Corporation’s Global Markets business segment. The related sales and trading revenue generated within Global Markets is recorded in various income statement line items including trading account profits and net interest income as well as other revenue categories. However, the majority of income related to derivative instruments is recorded in trading account profits.
Sales and trading revenue includes changes in the fair value and realized gains and losses on the sales of trading and other assets, net interest income, and fees primarily from commissions on equity securities. Revenue is generated by the difference in the client price for an instrument and the price at which the trading desk can execute the trade in the dealer market. For equity
securities, commissions related to purchases and sales are recorded in the “Other” column in the Sales and Trading Revenue table. Changes in the fair value of these securities are included in trading account profits. For debt securities, revenue, with the exception of interest associated with the debt securities, is typically included in trading account profits. Unlike commissions for equity securities, the initial revenue related to broker/dealerbroker-dealer services for debt securities is typically included in the pricing of the instrument rather than being charged through separate fee arrangements. Therefore, this revenue is recorded in trading account profits as part of the initial mark to fair value. For derivatives, allthe majority of revenue is included in trading account profits. In transactions where the Corporation acts as agent, which include exchange-traded futures and options, fees are recorded in other income (loss).
Gains (losses) on certain instruments, primarily loans, that the Global Markets business segment shares with Global Banking are not considered trading instruments and are excluded from sales and trading revenue in their entirety.
|
| | |
174165 Bank of America 20132014
| | |
The table below, which includes both derivatives and non-derivative cash instruments, identifies the amounts in the respective income statement line items attributable to the Corporation’s sales and trading revenue in Global Markets, categorized by primary risk, for 20132014, 20122013 and 20112012. The difference between total trading account profits in the table below
and in the Consolidated Statement of Income represents trading
activities in business segments other than Global Markets. This table includes debit valuation adjustment (DVA) gains (losses), net of hedges.hedges, and funding valuation adjustment (FVA) losses. Global Markets results in Note 24 – Business Segment Information are presented on a fully taxable-equivalent (FTE) basis. The table below is not presented on aan FTE basis.
| | | | | | | | | | | | | | | | | |
| Sales and Trading Revenue | | | �� | | | | | | | | | | | |
| | | | | | | | | | | | | | | |
| | 2013 | 2014 |
| (Dollars in millions) | Trading Account Profits | | Net Interest Income | | Other (1) | | Total | Trading Account Profits | | Net Interest Income | | Other (1) | | Total |
| Interest rate risk | $ | 1,120 |
| | $ | 1,104 |
| | $ | 83 |
| | $ | 2,307 |
| $ | 952 |
| | $ | 1,169 |
| | $ | 363 |
| | $ | 2,484 |
|
| Foreign exchange risk | 1,170 |
| | 4 |
| | (26 | ) | | 1,148 |
| 1,177 |
| | 8 |
| | (128 | ) | | 1,057 |
|
| Equity risk | 1,994 |
| | 112 |
| | 2,094 |
| | 4,200 |
| 1,954 |
| | (70 | ) | | 2,318 |
| | 4,202 |
|
| Credit risk | 2,075 |
| | 2,711 |
| | 88 |
| | 4,874 |
| 1,410 |
| | 2,682 |
| | 614 |
| | 4,706 |
|
| Other risk | 375 |
| | (203 | ) | | 202 |
| | 374 |
| 504 |
| | (319 | ) | | 106 |
| | 291 |
|
| Total sales and trading revenue | $ | 6,734 |
| | $ | 3,728 |
| | $ | 2,441 |
| | $ | 12,903 |
| $ | 5,997 |
| | $ | 3,470 |
| | $ | 3,273 |
| | $ | 12,740 |
|
| | | | | | | | | | | | | | | |
| | 2012 | 2013 |
| Interest rate risk | $ | 583 |
| | $ | 1,040 |
| | $ | (6 | ) | | $ | 1,617 |
| $ | 1,120 |
| | $ | 1,104 |
| | $ | (333 | ) | | $ | 1,891 |
|
| Foreign exchange risk | 909 |
| | 5 |
| | 6 |
| | 920 |
| 1,170 |
| | 5 |
| | (103 | ) | | 1,072 |
|
| Equity risk | 1,180 |
| | (57 | ) | | 1,891 |
| | 3,014 |
| 1,994 |
| | 111 |
| | 2,075 |
| | 4,180 |
|
| Credit risk | 2,522 |
| | 2,321 |
| | 961 |
| | 5,804 |
| 2,083 |
| | 2,710 |
| | 78 |
| | 4,871 |
|
| Other risk | 512 |
| | (219 | ) | | (42 | ) | | 251 |
| 367 |
| | (219 | ) | | 69 |
| | 217 |
|
| Total sales and trading revenue | $ | 5,706 |
| | $ | 3,090 |
| | $ | 2,810 |
| | $ | 11,606 |
| $ | 6,734 |
| | $ | 3,711 |
| | $ | 1,786 |
| | $ | 12,231 |
|
| | | | | | | | | | | | | | | |
| | 2011 | 2012 |
| Interest rate risk | $ | 2,148 |
| | $ | 923 |
| | $ | (63 | ) | | $ | 3,008 |
| $ | (2,875 | ) | | $ | 1,039 |
| | $ | (4 | ) | | $ | (1,840 | ) |
| Foreign exchange risk | 1,090 |
| | 8 |
| | (10 | ) | | 1,088 |
| 909 |
| | 5 |
| | 5 |
| | 919 |
|
| Equity risk | 1,482 |
| | 129 |
| | 2,347 |
| | 3,958 |
| 259 |
| | (57 | ) | | 1,891 |
| | 2,093 |
|
| Credit risk | 1,067 |
| | 2,605 |
| | 552 |
| | 4,224 |
| 2,514 |
| | 2,321 |
| | 961 |
| | 5,796 |
|
| Other risk | 630 |
| | (184 | ) | | (72 | ) | | 374 |
| 4,899 |
| | (227 | ) | | (5,148 | ) | | (476 | ) |
| Total sales and trading revenue | $ | 6,417 |
| | $ | 3,481 |
| | $ | 2,754 |
| | $ | 12,652 |
| $ | 5,706 |
| | $ | 3,081 |
| | $ | (2,295 | ) | | $ | 6,492 |
|
| |
(1) | Represents amounts in investment and brokerage services and other income (loss) that are recorded in Global Markets and included in the definition of sales and trading revenue. Includes investment and brokerage services revenue of $2.02.2 billion, $1.82.0 billion and $2.21.8 billion for 20132014, 20122013 and 20112012, respectively. |
Credit Derivatives
The Corporation enters into credit derivatives primarily to facilitate client transactions and to manage credit risk exposures. Credit derivatives derive value based on an underlying third-party referenced obligation or a portfolio of referenced obligations and generally require the Corporation, as the seller of credit protection, to make payments to a buyer upon the occurrence of a pre-defined credit event. Such credit events generally include bankruptcy of
the referenced credit entity and failure to pay under the obligation, as well as acceleration of indebtedness and payment repudiation or moratorium. For credit derivatives based on a portfolio of referenced credits or credit indices, the Corporation may not be required to make payment until a specified amount of loss has occurred and/or may only be required to make payment up to a specified amount.
|
| | |
| | | Bank of America 20132014 175166 |
Credit derivative instruments where the Corporation is the seller of credit protection and their expiration are summarized at December 31, 20132014 and 20122013 are summarized in the table below. These instruments are classified as investment and non-investment grade based on the credit quality of the underlying referenced
obligation. The Corporation considers ratings of BBB- or higher as investment grade. Non-investment grade includes non-rated credit derivative instruments. The Corporation discloses internal categorizations of investment grade and non-investment grade consistent with how risk is managed for these instruments.
| | | | | | | | | | | | | | | | | | | | | |
| Credit Derivative Instruments | | |
| | | |
| | December 31, 2013 | December 31, 2014 |
| | Carrying Value | Carrying Value |
| (Dollars in millions) | Less than One Year | | One to Three Years | | Three to Five Years | | Over Five Years | | Total | Less than One Year | | One to Three Years | | Three to Five Years | | Over Five Years | | Total |
| Credit default swaps: | |
| | |
| | |
| | |
| | |
| |
| | |
| | |
| | |
| | |
|
| Investment grade | $ | 2 |
| | $ | 220 |
| | $ | 974 |
| | $ | 1,134 |
| | $ | 2,330 |
| $ | 100 |
| | $ | 714 |
| | $ | 1,455 |
| | $ | 939 |
| | $ | 3,208 |
|
| Non-investment grade | 424 |
| | 1,924 |
| | 2,469 |
| | 6,667 |
| | 11,484 |
| 916 |
| | 2,107 |
| | 1,338 |
| | 4,301 |
| | 8,662 |
|
| Total | 426 |
| | 2,144 |
| | 3,443 |
| | 7,801 |
| | 13,814 |
| 1,016 |
| | 2,821 |
| | 2,793 |
| | 5,240 |
| | 11,870 |
|
| Total return swaps/other: | |
| | |
| | |
| | |
| | |
| |
| | |
| | |
| | |
| | |
|
| Investment grade | 22 |
| | — |
| | — |
| | — |
| | 22 |
| 24 |
| | — |
| | — |
| | — |
| | 24 |
|
| Non-investment grade | 29 |
| | 38 |
| | 2 |
| | 86 |
| | 155 |
| 64 |
| | 247 |
| | 2 |
| | — |
| | 313 |
|
| Total | 51 |
| | 38 |
| | 2 |
| | 86 |
| | 177 |
| 88 |
| | 247 |
| | 2 |
| | — |
| | 337 |
|
| Total credit derivatives | $ | 477 |
| | $ | 2,182 |
| | $ | 3,445 |
| | $ | 7,887 |
| | $ | 13,991 |
| $ | 1,104 |
| | $ | 3,068 |
| | $ | 2,795 |
| | $ | 5,240 |
| | $ | 12,207 |
|
Credit-related notes: (1) | |
| | |
| | |
| | |
| | |
| |
| | |
| | |
| | |
| | |
|
| Investment grade | $ | — |
| | $ | 278 |
| | $ | 595 |
| | $ | 4,457 |
| | $ | 5,330 |
| $ | 2 |
| | $ | 365 |
| | $ | 568 |
| | $ | 2,634 |
| | $ | 3,569 |
|
| Non-investment grade | 145 |
| | 107 |
| | 756 |
| | 946 |
| | 1,954 |
| 5 |
| | 141 |
| | 85 |
| | 1,443 |
| | 1,674 |
|
| Total credit-related notes | $ | 145 |
| | $ | 385 |
| | $ | 1,351 |
| | $ | 5,403 |
| | $ | 7,284 |
| $ | 7 |
| | $ | 506 |
| | $ | 653 |
| | $ | 4,077 |
| | $ | 5,243 |
|
| | Maximum Payout/Notional | Maximum Payout/Notional |
| Credit default swaps: | |
| | |
| | |
| | |
| | |
| |
| | |
| | |
| | |
| | |
|
| Investment grade | $ | 170,764 |
| | $ | 379,273 |
| | $ | 411,426 |
| | $ | 36,039 |
| | $ | 997,502 |
| $ | 132,974 |
| | $ | 342,914 |
| | $ | 242,728 |
| | $ | 28,982 |
| | $ | 747,598 |
|
| Non-investment grade | 53,316 |
| | 90,986 |
| | 95,319 |
| | 28,257 |
| | 267,878 |
| 54,326 |
| | 170,580 |
| | 80,011 |
| | 20,586 |
| | 325,503 |
|
| Total | 224,080 |
| | 470,259 |
| | 506,745 |
| | 64,296 |
| | 1,265,380 |
| 187,300 |
| | 513,494 |
| | 322,739 |
| | 49,568 |
| | 1,073,101 |
|
| Total return swaps/other: | |
| | |
| | |
| | |
| | |
| |
| | |
| | |
| | |
| | |
|
| Investment grade | 21,771 |
| | — |
| | — |
| | — |
| | 21,771 |
| 22,645 |
| | — |
| | — |
| | — |
| | 22,645 |
|
| Non-investment grade | 27,784 |
| | 8,150 |
| | 4,103 |
| | 1,599 |
| | 41,636 |
| 23,839 |
| | 10,792 |
| | 3,268 |
| | 487 |
| | 38,386 |
|
| Total | 49,555 |
| | 8,150 |
| | 4,103 |
| | 1,599 |
| | 63,407 |
| 46,484 |
| | 10,792 |
| | 3,268 |
| | 487 |
| | 61,031 |
|
| Total credit derivatives | $ | 273,635 |
| | $ | 478,409 |
| | $ | 510,848 |
| | $ | 65,895 |
| | $ | 1,328,787 |
| $ | 233,784 |
| | $ | 524,286 |
| | $ | 326,007 |
| | $ | 50,055 |
| | $ | 1,134,132 |
|
| | | | December 31, 2012 | December 31, 2013 |
| | Carrying Value | Carrying Value |
| Credit default swaps: | |
| | |
| | |
| | |
| | |
| |
| | |
| | |
| | |
| | |
|
| Investment grade | $ | 52 |
| | $ | 757 |
| | $ | 5,595 |
| | $ | 2,903 |
| | $ | 9,307 |
| $ | 2 |
| | $ | 220 |
| | $ | 974 |
| | $ | 1,134 |
| | $ | 2,330 |
|
| Non-investment grade | 923 |
| | 4,403 |
| | 7,030 |
| | 10,959 |
| | 23,315 |
| 424 |
| | 1,924 |
| | 2,469 |
| | 6,667 |
| | 11,484 |
|
| Total | 975 |
| | 5,160 |
| | 12,625 |
| | 13,862 |
| | 32,622 |
| 426 |
| | 2,144 |
| | 3,443 |
| | 7,801 |
| | 13,814 |
|
| Total return swaps/other: | |
| | |
| | |
| | |
| | |
| |
| | |
| | |
| | |
| | |
|
| Investment grade | 39 |
| | — |
| | — |
| | — |
| | 39 |
| 22 |
| | — |
| | — |
| | — |
| | 22 |
|
| Non-investment grade | 57 |
| | 104 |
| | 39 |
| | 37 |
| | 237 |
| 29 |
| | 38 |
| | 2 |
| | 86 |
| | 155 |
|
| Total | 96 |
| | 104 |
| | 39 |
| | 37 |
| | 276 |
| 51 |
| | 38 |
| | 2 |
| | 86 |
| | 177 |
|
| Total credit derivatives | $ | 1,071 |
| | $ | 5,264 |
| | $ | 12,664 |
| | $ | 13,899 |
| | $ | 32,898 |
| $ | 477 |
| | $ | 2,182 |
| | $ | 3,445 |
| | $ | 7,887 |
| | $ | 13,991 |
|
Credit-related notes: (1) | |
| | |
| | |
| | |
| | |
| |
| | |
| | |
| | |
| | |
|
| Investment grade | $ | 4 |
| | $ | 12 |
| | $ | 441 |
| | $ | 3,849 |
| | $ | 4,306 |
| $ | — |
| | $ | 278 |
| | $ | 595 |
| | $ | 4,457 |
| | $ | 5,330 |
|
| Non-investment grade | 116 |
| | 161 |
| | 314 |
| | 1,425 |
| | 2,016 |
| 145 |
| | 107 |
| | 756 |
| | 946 |
| | 1,954 |
|
| Total credit-related notes | $ | 120 |
| | $ | 173 |
| | $ | 755 |
| | $ | 5,274 |
| | $ | 6,322 |
| $ | 145 |
| | $ | 385 |
| | $ | 1,351 |
| | $ | 5,403 |
| | $ | 7,284 |
|
| | Maximum Payout/Notional | Maximum Payout/Notional |
| Credit default swaps: | |
| | |
| | |
| | |
| | |
| |
| | |
| | |
| | |
| | |
|
| Investment grade | $ | 260,177 |
| | $ | 349,125 |
| | $ | 500,038 |
| | $ | 90,453 |
| | $ | 1,199,793 |
| $ | 170,764 |
| | $ | 379,273 |
| | $ | 411,426 |
| | $ | 36,039 |
| | $ | 997,502 |
|
| Non-investment grade | 79,861 |
| | 99,043 |
| | 110,248 |
| | 42,559 |
| | 331,711 |
| 53,316 |
| | 90,986 |
| | 95,319 |
| | 28,257 |
| | 267,878 |
|
| Total | 340,038 |
| | 448,168 |
| | 610,286 |
| | 133,012 |
| | 1,531,504 |
| 224,080 |
| | 470,259 |
| | 506,745 |
| | 64,296 |
| | 1,265,380 |
|
| Total return swaps/other: | |
| | |
| | |
| | |
| | |
| |
| | |
| | |
| | |
| | |
|
| Investment grade | 43,536 |
| | 15 |
| | — |
| | — |
| | 43,551 |
| 21,771 |
| | — |
| | — |
| | — |
| | 21,771 |
|
| Non-investment grade | 5,566 |
| | 11,028 |
| | 7,631 |
| | 1,035 |
| | 25,260 |
| 27,784 |
| | 8,150 |
| | 4,103 |
| | 1,599 |
| | 41,636 |
|
| Total | 49,102 |
| | 11,043 |
| | 7,631 |
| | 1,035 |
| | 68,811 |
| 49,555 |
| | 8,150 |
| | 4,103 |
| | 1,599 |
| | 63,407 |
|
| Total credit derivatives | $ | 389,140 |
| | $ | 459,211 |
| | $ | 617,917 |
| | $ | 134,047 |
| | $ | 1,600,315 |
| $ | 273,635 |
| | $ | 478,409 |
| | $ | 510,848 |
| | $ | 65,895 |
| | $ | 1,328,787 |
|
| |
(1)
| For credit-related notes, maximum payout/notional is the same as carrying value. |
|
| | |
176167 Bank of America 20132014
| | |
The notional amount represents the maximum amount payable by the Corporation for most credit derivatives. However, the Corporation does not monitor its exposure to credit derivatives based solely on the notional amount because this measure does not take into consideration the probability of occurrence. As such, the notional amount is not a reliable indicator of the Corporation’s exposure to these contracts. Instead, a risk framework is used to define risk tolerances and establish limits to help ensure that certain credit risk-related losses occur within acceptable, predefined limits.
The Corporation manages its market risk exposure to credit derivatives by entering into a variety of offsetting derivative contracts and security positions. For example, in certain instances, the Corporation may purchase credit protection with identical underlying referenced names to offset its exposure. The carrying value and notional amount of written credit derivatives for which the Corporation held purchased credit derivatives with identical underlying referenced names and terms were $5.7 billion and $880.6 billion at December 31, 2014 and $8.1 billion and $1.0 trillion at December 31, 2013 and $20.7 billion and $1.1 trillion at December 31, 2012.
Credit-related notes in the table on page 176167 include investments in securities issued by collateralized debt obligation (CDO), collateralized loan obligation (CLO) and credit-linked note vehicles. These instruments are primarily classified as trading securities. The carrying value of these instruments equals the Corporation’s maximum exposure to loss. The Corporation is not obligated to make any payments to the entities under the terms of the securities owned.
Credit-related Contingent Features and Collateral
The Corporation executes the majority of its derivative contracts in the OTC market with large, international financial institutions, including broker/dealersbroker-dealers and, to a lesser degree, with a variety of non-financial companies. Substantially all of the derivative transactions are executed on a daily margin basis. Therefore, events such as a credit rating downgrade (depending on the ultimate rating level) or a breach of credit covenants would typically require an increase in the amount of collateral required of the counterparty, where applicable, and/or allow the Corporation to take additional protective measures such as early termination of all trades. Further, as previously discussed on page 169160, the Corporation enters into legally enforceable master netting agreements which reduce risk by permitting the closeout and netting of transactions with the same counterparty upon the occurrence of certain events.
A majority of the Corporation’s derivative contracts contain credit risk-related contingent features, primarily in the form of ISDA master netting agreements and credit support documentation that enhance the creditworthiness of these instruments compared to other obligations of the respective counterparty with whom the Corporation has transacted. These contingent features may be for the benefit of the Corporation as well as its counterparties with respect to changes in the Corporation’s creditworthiness and the mark-to-market exposure under the derivative transactions. At December 31, 20132014 and 20122013, the Corporation held cash and securities collateral of $74.482.0 billion and $85.674.4 billion, and posted
cash and securities collateral of $56.167.9 billion and $74.156.1 billion in the normal course of business under derivative agreements.
In connection with certain OTC derivative contracts and other trading agreements, the Corporation can be required to provide additional collateral or to terminate transactions with certain counterparties in the event of a downgrade of the senior debt ratings of the Corporation or certain subsidiaries. The amount of additional collateral required depends on the contract and is usually a fixed incremental amount and/or the market value of the exposure.
At December 31, 20132014, the amount of collateral, calculated based on the terms of the contracts, that the Corporation and certain subsidiaries could be required to post to counterparties but had not yet posted to counterparties was approximately $1.31.4 billion, including $700670 million for Bank of America, N.A. (BANA).
Some counterparties are currently able to unilaterally terminate certain contracts, or the Corporation or certain subsidiaries may be required to take other action such as find a suitable replacement or obtain a guarantee. At December 31, 20132014, the current liability recorded for these derivative contracts was $38584 million, against which the Corporation and certain subsidiaries had posted approximately $35054 million of collateral.
The table below presents the amount of additional collateral that would have been contractually required by derivative contracts and other trading agreements at December 31, 20132014 if the rating agencies had downgraded their long-term senior debt ratings for the Corporation or certain subsidiaries by one incremental notch and by an additional second incremental notch.
| | | | | |
Additional Collateral Required to be Posted Upon Downgrade | | | | |
| | December 31, 2013 | December 31, 2014 |
| (Dollars in millions) | One incremental notch | Second incremental notch | One incremental notch | Second incremental notch |
| Bank of America Corporation | $ | 1,302 |
| $ | 4,101 |
| $ | 1,402 |
| $ | 2,825 |
|
Bank of America, N.A. and subsidiaries (1) | 881 |
| 3,039 |
| 1,072 |
| 1,886 |
|
| |
(1) | Included in Bank of America Corporation collateral requirements in this table. |
The table below presents the derivative liabilityliabilities that would be subject to unilateral termination by counterparties and the amounts of collateral that would have been postedcontractually required at December 31, 20132014 if the rating agencies had downgraded their long-term senior debt ratings for the Corporation or certain subsidiaries had been lower by one incremental notch and by an additional second incremental notch.
| | | | | |
| Derivative Liability Subject to Unilateral Termination Upon Downgrade | |
| Derivative Liabilities Subject to Unilateral Termination Upon Downgrade | | Derivative Liabilities Subject to Unilateral Termination Upon Downgrade |
| | | |
| | December 31, 2013 | December 31, 2014 |
| (Dollars in millions) | One incremental notch | Second incremental notch | One incremental notch | Second incremental notch |
| Derivative liability | $ | 927 |
| $ | 1,878 |
| $ | 1,785 |
| $ | 3,850 |
|
| Collateral posted | 733 |
| 1,467 |
| 1,520 |
| 2,986 |
|
|
| | |
| | | Bank of America 20132014 177168 |
Valuation Adjustments on Derivatives
The Corporation records credit risk valuation adjustments on derivatives in order to properly reflect the credit quality of the counterparties and its own credit quality. The Corporation calculates valuation adjustments on derivatives based on a modeled expected exposure that incorporates current market risk factors. The exposure also takes into consideration credit mitigants such as enforceable master netting agreements and collateral. CDS spread data is used to estimate the default probabilities and severities that are applied to the exposures. Where no observable credit default data is available for counterparties, the Corporation uses proxies and other market data to estimate default probabilities and severity.
Valuation adjustments on derivatives are affected by changes in market spreads, non-credit relatednon-credit-related market factors such as interest rate and currency changes that affect the expected exposure, and other factors like changes in collateral arrangements and partial payments. Credit spreads and non-credit factors can move independently. For example, for an interest rate swap, changes in interest rates may increase the expected exposure, which would increase the counterparty credit valuation adjustment (CVA). Independently, counterparty credit spreads may tighten, which would result in an offsetting decrease to CVA.
The Corporation may enterenters into risk management activities to offset market driven exposures. The Corporation often hedges the counterparty spread risk in CVA with CDS and oftenCDS. The Corporation hedges the other market risks in both CVA and DVA primarily with currency and interest rate swaps. Since the components of the valuation adjustments on derivatives move independently and the Corporation may not hedge all of the market drivenmarket-driven exposures, the
effect of a hedge may increase the grossgains or losses relating to valuation adjustments on derivatives or may result in a gross positivegain from valuation adjustmentadjustments on derivatives becoming a negative adjustment (or the reverse).
In 2013,2014, the Corporation refined its methodology for calculating CVAadopted FVA into valuation estimates primarily to include funding costs on uncollateralized derivatives and DVA on a prospective basis,derivatives where the Corporation is not permitted to adjustuse the waycollateral it values mutual termination clauses in derivatives contracts and to more fully incorporate the potential for the counterparties to default prior to a change in their credit ratings. Thisreceives. The change in estimate increased CVA by $361 million and DVA by $433 million resultingresulted in a net positive earnings impactpretax FVA charge of $72$497 million at the timeincluding a charge of the change$632 million related to funding costs associated with derivative asset exposures, partially offset by a funding benefit of $135 million related to derivative liability exposures. The net FVA charge was recorded as a reduction to sales and is includedtrading revenue in the results for 2013Global Markets. The net CVACorporation calculated this valuation adjustment based on modeled expected exposure profiles discounted for the funding risk premium inherent in these derivatives. FVA related to derivative assets and DVA excludingliabilities is the impacteffect of funding costs on the fair value of these refinements was a gain of $265 million and a loss of $508 million for 2013.derivatives.
The table below presents CVA, DVA and DVAFVA gains (losses), on derivatives, which are recorded in trading account profits, on a gross and net of hedge basis.basis for 2014, 2013 and 2012. CVA gains reduce the cumulative CVA thereby increasing the derivative assets balance. DVA gains increase the cumulative DVA thereby decreasing the derivative liabilities balance. CVA and DVA losses have the opposite impact. FVA gains related to derivative assets reduce the cumulative FVA thereby increasing the derivative assets balance. FVA gains related to derivative liabilities increase the cumulative FVA thereby decreasing the derivative liabilities balance.
| | | | | | | | | | | | | |
Valuation Adjustments on Derivatives | | | | | | | | |
| Gains (Losses) | | | | | | |
| | 2013 | | 2012 | | 2011 | 2014 | | 2013 | | 2012 |
| (Dollars in millions) | Gross | Net | | Gross | Net | | Gross | Net | Gross | Net | | Gross | Net | | Gross | Net |
Derivative assets (CVA) (1) | $ | 738 |
| $ | (96 | ) | | $ | 1,022 |
| $ | 291 |
| | $ | (1,863 | ) | $ | (606 | ) | $ | (22 | ) | $ | 191 |
| | $ | 738 |
| $ | (96 | ) | | $ | 1,022 |
| $ | 291 |
|
Derivative liabilities (DVA) (2) | (39 | ) | (75 | ) | | (2,212 | ) | (2,477 | ) | | 1,385 |
| 1,000 |
| |
Derivative assets (FVA) (2) | | (632 | ) | (632 | ) | | n/a |
| n/a |
| | n/a |
| n/a |
|
Derivative liabilities (DVA) (3) | | (28 | ) | (150 | ) | | (39 | ) | (75 | ) | | (2,212 | ) | (2,477 | ) |
Derivative liabilities (FVA) (2) | | 135 |
| 135 |
| | n/a |
| n/a |
| | n/a |
| n/a |
|
| |
(1) | At December 31, 2014, 2013 2012 and 20112012, the cumulative CVA reduced the derivative assets balance by $1.6 billion, $2.41.6 billion and $2.82.4 billion, respectively. |
| |
(2) | FVA was adopted in 2014 and the cumulative FVA reduced the net derivatives balance by $497 million. |
| |
(3) | At December 31, 2014, 2013 2012 and 20112012, the cumulative DVA reduced the derivative liabilities balance by $803 million0.8 billion, $807 million0.8 billion and $2.40.8 billion, respectively. |
n/a = not applicable
|
| | |
178169 Bank of America 20132014
| | |
NOTE 3 Securities
The Corporation’s debt securities carried at fair value include debt securities purchased for longer term investment purposes and are used as part of ALM and other strategic activities. Generally, debt securities carried at fair value are accounted for as available-for-sale (AFS) debt securities with unrealized gains and losses reported in accumulated OCI. For certain other debt securities purchased for ALM and other strategic purposes, the Corporation has elected to report those securities at fair value with unrealized gains and losses reported in other income (loss) in the Consolidated Statement of Income.
As a result of growth in the portfolio of debt securities carried at fair value with unrealized gains and losses recorded in other income (loss) and to better reflect how such a portfolio is managed as part of the ALM activities, the Corporation changed the presentation of such securities in 2013 to combine debt securities
carried at fair value into one line item on the Consolidated Balance Sheet. Previously, the portfolio of debt securities carried at fair value with unrealized gains and losses recorded in other income (loss) was classified in other assets. The Corporation may hedge these debt securities with risk management derivatives with the unrealized gains and losses also reported in other income (loss). Certain debt securities are carried at fair value with unrealized gains and losses reported in other income (loss) to mitigate accounting asymmetry with the risk management derivatives and to achieve operational simplifications. Prior-period amounts have been reclassified to conform to the current period presentation.
The table below presents the amortized cost, gross unrealized gains and losses, and fair value of AFSavailable-for-sale (AFS) debt securities, other debt securities carried at fair value, held-to-maturity (HTM)HTM debt securities and AFS marketable equity securities at December 31, 20132014 and 2012.2013.
| | | | | | | | | | | | | | | | | |
| Debt Securities and Available-for-Sale Marketable Equity Securities | Debt Securities and Available-for-Sale Marketable Equity Securities | | | | | Debt Securities and Available-for-Sale Marketable Equity Securities | | | | |
| | | |
| | December 31, 2013 | December 31, 2014 |
| (Dollars in millions) | Amortized Cost | | Gross
Unrealized Gains | | Gross
Unrealized Losses | | Fair Value | Amortized Cost | | Gross
Unrealized Gains | | Gross
Unrealized Losses | | Fair Value |
| Available-for-sale debt securities | | | | | | | | | | | | | | |
| U.S. Treasury and agency securities | $ | 8,910 |
| | $ | 106 |
| | $ | (62 | ) | | $ | 8,954 |
| $ | 69,267 |
| | $ | 360 |
| | $ | (32 | ) | | $ | 69,595 |
|
| Mortgage-backed securities: | | | | | | | |
| | | | | | | |
|
| Agency | 170,112 |
| | 777 |
| | (5,954 | ) | | 164,935 |
| 163,592 |
| | 2,040 |
| | (593 | ) | | 165,039 |
|
| Agency-collateralized mortgage obligations | 22,731 |
| | 76 |
| | (315 | ) | | 22,492 |
| 14,175 |
| | 152 |
| | (79 | ) | | 14,248 |
|
Non-agency residential (1) | 6,124 |
| | 238 |
| | (123 | ) | | 6,239 |
| 4,244 |
| | 287 |
| | (77 | ) | | 4,454 |
|
| Commercial | 2,429 |
| | 63 |
| | (12 | ) | | 2,480 |
| 3,931 |
| | 69 |
| | — |
| | 4,000 |
|
| Non-U.S. securities | 7,207 |
| | 37 |
| | (24 | ) | | 7,220 |
| 6,208 |
| | 33 |
| | (11 | ) | | 6,230 |
|
| Corporate/Agency bonds | 860 |
| | 20 |
| | (7 | ) | | 873 |
| 361 |
| | 9 |
| | (2 | ) | | 368 |
|
| Other taxable securities, substantially all asset-backed securities | 16,805 |
| | 30 |
| | (5 | ) | | 16,830 |
| 10,774 |
| | 39 |
| | (22 | ) | | 10,791 |
|
| Total taxable securities | 235,178 |
| | 1,347 |
| | (6,502 | ) | | 230,023 |
| 272,552 |
| | 2,989 |
| | (816 | ) | | 274,725 |
|
| Tax-exempt securities | 5,967 |
| | 10 |
| | (49 | ) | | 5,928 |
| 9,556 |
| | 12 |
| | (19 | ) | | 9,549 |
|
| Total available-for-sale debt securities | 241,145 |
| | 1,357 |
| | (6,551 | ) | | 235,951 |
| 282,108 |
| | 3,001 |
| | (835 | ) | | 284,274 |
|
| Other debt securities carried at fair value | 34,145 |
| | 34 |
| | (1,335 | ) | | 32,844 |
| 36,524 |
| | 261 |
| | (364 | ) | | 36,421 |
|
| Total debt securities carried at fair value | 275,290 |
| | 1,391 |
| | (7,886 | ) | | 268,795 |
| 318,632 |
| | 3,262 |
| | (1,199 | ) | | 320,695 |
|
| Held-to-maturity debt securities, substantially all U.S. agency mortgage-backed securities | 55,150 |
| | 20 |
| | (2,740 | ) | | 52,430 |
| 59,766 |
| | 486 |
| | (611 | ) | | 59,641 |
|
| Total debt securities | $ | 330,440 |
| | $ | 1,411 |
| | $ | (10,626 | ) | | $ | 321,225 |
| $ | 378,398 |
| | $ | 3,748 |
| | $ | (1,810 | ) | | $ | 380,336 |
|
Available-for-sale marketable equity securities (2) | $ | 230 |
| | $ | — |
| | $ | (7 | ) | | $ | 223 |
| $ | 336 |
| | $ | 27 |
| | $ | — |
| | $ | 363 |
|
| | | | | | | | | | | | | | | |
| | December 31, 2012 | December 31, 2013 |
| Available-for-sale debt securities | | | | | | | | | | | | | | |
| U.S. Treasury and agency securities | $ | 24,232 |
| | $ | 324 |
| | $ | (84 | ) | | $ | 24,472 |
| $ | 8,910 |
| | $ | 106 |
| | $ | (62 | ) | | $ | 8,954 |
|
| Mortgage-backed securities: | |
| | |
| | |
| | |
| |
| | |
| | |
| | |
|
| Agency | 183,247 |
| | 5,048 |
| | (146 | ) | | 188,149 |
| 170,112 |
| | 777 |
| | (5,954 | ) | | 164,935 |
|
| Agency-collateralized mortgage obligations | 36,329 |
| | 1,427 |
| | (218 | ) | | 37,538 |
| 22,731 |
| | 76 |
| | (315 | ) | | 22,492 |
|
Non-agency residential (1) | 9,231 |
| | 391 |
| | (128 | ) | | 9,494 |
| 6,124 |
| | 238 |
| | (123 | ) | | 6,239 |
|
| Non-agency commercial | 3,576 |
| | 348 |
| | — |
| | 3,924 |
| |
| Commercial | | 2,429 |
| | 63 |
| | (12 | ) | | 2,480 |
|
| Non-U.S. securities | 5,574 |
| | 50 |
| | (6 | ) | | 5,618 |
| 7,207 |
| | 37 |
| | (24 | ) | | 7,220 |
|
| Corporate/Agency bonds | 1,415 |
| | 51 |
| | (16 | ) | | 1,450 |
| 860 |
| | 20 |
| | (7 | ) | | 873 |
|
| Other taxable securities, substantially all asset-backed securities | 12,089 |
| | 54 |
| | (15 | ) | | 12,128 |
| 16,805 |
| | 30 |
| | (5 | ) | | 16,830 |
|
| Total taxable securities | 275,693 |
| | 7,693 |
| | (613 | ) | | 282,773 |
| 235,178 |
| | 1,347 |
| | (6,502 | ) | | 230,023 |
|
| Tax-exempt securities | 4,167 |
| | 13 |
| | (47 | ) | | 4,133 |
| 5,967 |
| | 10 |
| | (49 | ) | | 5,928 |
|
| Total available-for-sale debt securities | 279,860 |
| | 7,706 |
| | (660 | ) | | 286,906 |
| 241,145 |
| | 1,357 |
| | (6,551 | ) | | 235,951 |
|
| Other debt securities carried at fair value | 23,927 |
| | 120 |
| | (103 | ) | | 23,944 |
| 34,145 |
| | 34 |
| | (1,335 | ) | | 32,844 |
|
| Total debt securities carried at fair value | 303,787 |
| | 7,826 |
| | (763 | ) | | 310,850 |
| 275,290 |
| | 1,391 |
| | (7,886 | ) | | 268,795 |
|
| Held-to-maturity debt securities, substantially all U.S. agency mortgage-backed securities | 49,481 |
| | 815 |
| | (26 | ) | | 50,270 |
| 55,150 |
| | 20 |
| | (2,740 | ) | | 52,430 |
|
| Total debt securities | $ | 353,268 |
| | $ | 8,641 |
| | $ | (789 | ) | | $ | 361,120 |
| $ | 330,440 |
| | $ | 1,411 |
| | $ | (10,626 | ) | | $ | 321,225 |
|
Available-for-sale marketable equity securities (2) | $ | 780 |
| | $ | 732 |
| | $ | — |
| | $ | 1,512 |
| $ | 230 |
| | $ | — |
| | $ | (7 | ) | | $ | 223 |
|
| |
(1) | At December 31, 20132014 and 20122013, the underlying collateral type included approximately 8976 percent and 9189 percent prime, seven14 percent and sixseven percent Alt-A, and four10 percent and threefour percent subprime. |
| |
(2) | Classified in other assets on the Consolidated Balance Sheet. |
At December 31, 2014, the accumulated net unrealized gain on AFS debt securities included in accumulated OCI was $1.3 billion, net of the related income taxes of $823 million. At December 31, 2014 and 2013, the Corporation had nonperforming AFS debt securities of $161 million and $103 million.
|
| | |
| | | Bank of America 20132014 179170 |
At December 31, 2013, the accumulated net unrealized loss on AFS debt securities included in accumulated OCI was $3.3 billion, net of the related income tax benefit of $1.9 billion. At December 31, 2013 and 2012, the Corporation had nonperforming AFS debt securities of $103 million and $91 million.
The following table below presents the components of other debt securities carried at fair value where the changes in fair value are reported in other income (loss) at December 31, 2013 and 2012.income. In 20132014, the Corporation recorded unrealized mark-to-market net lossesgains in other income (loss) of $1.31.2 billion and realized lossesgains of $1.0 billion275 million on other debt securities carried at fair value, which excludesexclude the benefitimpact of certain hedges, the results of which are also reported in other income, (loss). Amountscompared to unrealized mark-to-market net losses of $1.3 billion and realized losses of $963 million in 2012 were insignificant.2013.
| | | | | | | | | |
Other Debt Securities Carried at Fair Value | | | | | | | | |
| | December 31 | December 31 |
| (Dollars in millions) | 2013 | | 2012 | 2014 | | 2013 |
| U.S. Treasury and agency securities | $ | 4,062 |
| | $ | 491 |
| $ | 1,541 |
| | $ | 4,062 |
|
| Mortgage-backed securities: | | | | | | |
| Agency | 16,500 |
| | 13,073 |
| 15,704 |
| | 16,500 |
|
| Agency-collateralized mortgage obligations | 218 |
| | 929 |
| — |
| | 218 |
|
| Non-agency residential | | 3,745 |
| | — |
|
| Commercial | 749 |
| | — |
| — |
| | 749 |
|
Non-U.S. securities (1) | 11,315 |
| | 9,451 |
| 15,132 |
| | 11,315 |
|
| Other taxable securities, substantially all asset-backed securities | | 299 |
| | — |
|
| Total | $ | 32,844 |
| | $ | 23,944 |
| $ | 36,421 |
| | $ | 32,844 |
|
| |
(1) | These securities are primarily used to satisfy certain international regulatory liquidity requirements. |
The table below presents gross realized gains and losses on sales of AFS debt securities for 20132014, 20122013 and 20112012 are presented in the table below..
| | | | | | | | | | | | | |
Gains and Losses on Sales of AFS Debt Securities | | | | | | | | | | | | |
| (Dollars in millions) | 2013 | | 2012 | | 2011 | 2014 | | 2013 | | 2012 |
| Gross gains | $ | 1,302 |
| | $ | 2,128 |
| | $ | 3,685 |
| $ | 1,366 |
| | $ | 1,302 |
| | $ | 2,128 |
|
| Gross losses | (31 | ) | | (466 | ) | | (311 | ) | (12 | ) | | (31 | ) | | (466 | ) |
| Net gains on sales of AFS debt securities | $ | 1,271 |
| | $ | 1,662 |
| | $ | 3,374 |
| $ | 1,354 |
| | $ | 1,271 |
| | $ | 1,662 |
|
| Income tax expense attributable to realized net gains on sales of AFS debt securities | $ | 470 |
| | $ | 615 |
| | $ | 1,248 |
| $ | 515 |
| | $ | 470 |
| | $ | 615 |
|
The table below presents the amortized cost and fair value of the Corporation’s debt securities carried at fair value and HTM debt securities from Fannie Mae (FNMA), the Government National Mortgage Association (GNMA), U.S. Treasury and Freddie Mac (FHLMC), where the investment exceeded 10 percent of consolidated shareholders’ equity at December 31, 20132014 and 20122013, are presented in the table below..
| | | | | | | | | | | | | | | | | |
Selected Securities Exceeding 10 Percent of Shareholders’ Equity | | | | | | | | | | | | | | | | |
| | December 31 | December 31 |
| | 2013 | | 2012 | 2014 | | 2013 |
| (Dollars in millions) | Amortized Cost | | Fair Value | | Amortized Cost | | Fair Value | Amortized Cost | | Fair Value | | Amortized Cost | | Fair Value |
| Fannie Mae | $ | 123,813 |
| | $ | 118,708 |
| | $ | 121,522 |
| | $ | 123,933 |
| $ | 130,725 |
| | $ | 131,418 |
| | $ | 123,813 |
| | $ | 118,708 |
|
| Government National Mortgage Association | 118,700 |
| | 115,314 |
| | 124,348 |
| | 127,541 |
| 98,278 |
| | 98,633 |
| | 118,700 |
| | 115,314 |
|
| U.S. Treasury | | 68,481 |
| | 68,801 |
| | 10,533 |
| | 10,428 |
|
| Freddie Mac | 24,908 |
| | 24,075 |
| | 22,995 |
| | 23,502 |
| 28,288 |
| | 28,556 |
| | 24,908 |
| | 24,075 |
|
|
| | |
180171 Bank of America 20132014
| | |
The table below presents the fair value and the associated gross unrealized losses on AFS debt securities and whether these securities have had gross unrealized losses for less than 12 months or for 12 months or longer at December 31, 20132014 and 20122013.
| | | | | | | | | | | | | | | | | | | | | | | | | |
| Temporarily Impaired and Other-than-temporarily Impaired AFS Debt Securities | Temporarily Impaired and Other-than-temporarily Impaired AFS Debt Securities | | | | | | | Temporarily Impaired and Other-than-temporarily Impaired AFS Debt Securities | | | | | | |
| | | | | | | | | | | | | | | | | | | | | | | |
| | December 31, 2013 | December 31, 2014 |
| | Less than Twelve Months | | Twelve Months or Longer | | Total | Less than Twelve Months | | Twelve Months or Longer | | Total |
| (Dollars in millions) | Fair Value | | Gross Unrealized Losses | | Fair Value | | Gross Unrealized Losses | | Fair Value | | Gross Unrealized Losses | Fair Value | | Gross Unrealized Losses | | Fair Value | | Gross Unrealized Losses | | Fair Value | | Gross Unrealized Losses |
| Temporarily impaired available-for-sale debt securities | | |
| | |
| | |
| | |
| | |
| | |
|
| U.S. Treasury and agency securities | | $ | 10,121 |
| | $ | (22 | ) | | $ | 667 |
| | $ | (10 | ) | | $ | 10,788 |
| | $ | (32 | ) |
| Mortgage-backed securities: | | | | | | | | | | | | |
| Agency | | 1,366 |
| | (8 | ) | | 43,118 |
| | (585 | ) | | 44,484 |
| | (593 | ) |
| Agency-collateralized mortgage obligations | | 2,242 |
| | (19 | ) | | 3,075 |
| | (60 | ) | | 5,317 |
| | (79 | ) |
| Non-agency residential | | 307 |
| | (3 | ) | | 809 |
| | (41 | ) | | 1,116 |
| | (44 | ) |
| Non-U.S. securities | | 157 |
| | (9 | ) | | 32 |
| | (2 | ) | | 189 |
| | (11 | ) |
| Corporate/Agency bonds | | 43 |
| | (1 | ) | | 93 |
| | (1 | ) | | 136 |
| | (2 | ) |
| Other taxable securities, substantially all asset-backed securities | | 575 |
| | (3 | ) | | 1,080 |
| | (19 | ) | | 1,655 |
| | (22 | ) |
| Total taxable securities | | 14,811 |
| | (65 | ) | | 48,874 |
| | (718 | ) | | 63,685 |
| | (783 | ) |
| Tax-exempt securities | | 980 |
| | (1 | ) | | 680 |
| | (18 | ) | | 1,660 |
| | (19 | ) |
| Total temporarily impaired available-for-sale debt securities | | 15,791 |
| | (66 | ) | | 49,554 |
| | (736 | ) | | 65,345 |
| | (802 | ) |
Other-than-temporarily impaired available-for-sale debt securities (1) | | | | | | | | | | | | |
| Non-agency residential mortgage-backed securities | | 555 |
| | (33 | ) | | — |
| | — |
| | 555 |
| | (33 | ) |
Total temporarily impaired and other-than-temporarily impaired available-for-sale debt securities | | $ | 16,346 |
| | $ | (99 | ) | | $ | 49,554 |
| | $ | (736 | ) | | $ | 65,900 |
| | $ | (835 | ) |
| | | | | | | | | | | | | |
| | | December 31, 2013 |
| Temporarily impaired available-for-sale debt securities | |
| | |
| | |
| | |
| | |
| | |
| | | | | | | | | | | |
| U.S. Treasury and agency securities | $ | 5,770 |
| | $ | (61 | ) | | $ | 19 |
| | $ | (1 | ) | | $ | 5,789 |
| | $ | (62 | ) | $ | 5,770 |
| | $ | (61 | ) | | $ | 19 |
| | $ | (1 | ) | | $ | 5,789 |
| | $ | (62 | ) |
| Mortgage-backed securities: | | | | | | | | | | | | | | | | | | | | | | |
| Agency | 132,032 |
| | (5,457 | ) | | 9,324 |
| | (497 | ) | | 141,356 |
| | (5,954 | ) | 132,032 |
| | (5,457 | ) | | 9,324 |
| | (497 | ) | | 141,356 |
| | (5,954 | ) |
| Agency-collateralized mortgage obligations | 13,438 |
| | (210 | ) | | 2,661 |
| | (105 | ) | | 16,099 |
| | (315 | ) | 13,438 |
| | (210 | ) | | 2,661 |
| | (105 | ) | | 16,099 |
| | (315 | ) |
| Non-agency residential | 819 |
| | (15 | ) | | 1,237 |
| | (106 | ) | | 2,056 |
| | (121 | ) | 819 |
| | (15 | ) | | 1,237 |
| | (106 | ) | | 2,056 |
| | (121 | ) |
| Commercial | 286 |
| | (12 | ) | | — |
| | — |
| | 286 |
| | (12 | ) | 286 |
| | (12 | ) | | — |
| | — |
| | 286 |
| | (12 | ) |
| Non-U.S. securities | — |
| | — |
| | 45 |
| | (24 | ) | | 45 |
| | (24 | ) | — |
| | — |
| | 45 |
| | (24 | ) | | 45 |
| | (24 | ) |
| Corporate/Agency bonds | 106 |
| | (3 | ) | | 282 |
| | (4 | ) | | 388 |
| | (7 | ) | 106 |
| | (3 | ) | | 282 |
| | (4 | ) | | 388 |
| | (7 | ) |
| Other taxable securities, substantially all asset-backed securities | 116 |
| | (2 | ) | | 280 |
| | (3 | ) | | 396 |
| | (5 | ) | 116 |
| | (2 | ) | | 280 |
| | (3 | ) | | 396 |
| | (5 | ) |
| Total taxable securities | 152,567 |
| | (5,760 | ) | | 13,848 |
| | (740 | ) | | 166,415 |
| | (6,500 | ) | 152,567 |
| | (5,760 | ) | | 13,848 |
| | (740 | ) | | 166,415 |
| | (6,500 | ) |
| Tax-exempt securities | 1,789 |
| | (30 | ) | | 990 |
| | (19 | ) | | 2,779 |
| | (49 | ) | 1,789 |
| | (30 | ) | | 990 |
| | (19 | ) | | 2,779 |
| | (49 | ) |
| Total temporarily impaired available-for-sale debt securities | 154,356 |
| | (5,790 | ) | | 14,838 |
| | (759 | ) | | 169,194 |
| | (6,549 | ) | 154,356 |
| | (5,790 | ) | | 14,838 |
| | (759 | ) | | 169,194 |
| | (6,549 | ) |
Other-than-temporarily impaired available-for-sale debt securities (1) | | | | | | | | | | | | | | | | | | | | | | |
| Non-agency residential mortgage-backed securities | 2 |
| | (1 | ) | | 1 |
| | (1 | ) | | 3 |
| | (2 | ) | 2 |
| | (1 | ) | | 1 |
| | (1 | ) | | 3 |
| | (2 | ) |
Total temporarily impaired and other-than-temporarily impaired available-for-sale securities (2) | $ | 154,358 |
| | $ | (5,791 | ) | | $ | 14,839 |
| | $ | (760 | ) | | $ | 169,197 |
| | $ | (6,551 | ) | |
| | | | | | | | | | | | | |
| | December 31, 2012 | |
| Temporarily impaired available-for-sale debt securities | | | | | | | | | | | | |
| U.S. Treasury and agency securities | $ | — |
| | $ | — |
| | $ | 5,608 |
| | $ | (84 | ) | | $ | 5,608 |
| | $ | (84 | ) | |
| Mortgage-backed securities: | | | | | | | | | | | | |
| Agency | 15,593 |
| | (133 | ) | | 735 |
| | (13 | ) | | 16,328 |
| | (146 | ) | |
| Agency-collateralized mortgage obligations | 5,135 |
| | (121 | ) | | 4,994 |
| | (97 | ) | | 10,129 |
| | (218 | ) | |
| Non-agency residential | 592 |
| | (13 | ) | | 1,555 |
| | (110 | ) | | 2,147 |
| | (123 | ) | |
| Non-U.S. securities | 1,715 |
| | (1 | ) | | 563 |
| | (5 | ) | | 2,278 |
| | (6 | ) | |
| Corporate/Agency bonds | — |
| | — |
| | 277 |
| | (16 | ) | | 277 |
| | (16 | ) | |
| Other taxable securities, substantially all asset-backed securities | 1,678 |
| | (1 | ) | | 1,436 |
| | (14 | ) | | 3,114 |
| | (15 | ) | |
| Total taxable securities | 24,713 |
| | (269 | ) | | 15,168 |
| | (339 | ) | | 39,881 |
| | (608 | ) | |
| Tax-exempt securities | 1,609 |
| | (9 | ) | | 1,072 |
| | (38 | ) | | 2,681 |
| | (47 | ) | |
| Total temporarily impaired available-for-sale debt securities | 26,322 |
| | (278 | ) | | 16,240 |
| | (377 | ) | | 42,562 |
| | (655 | ) | |
Other-than-temporarily impaired available-for-sale debt securities (1) | | | | | | | | | | | | |
| Non-agency residential mortgage-backed securities | 14 |
| | (1 | ) | | 74 |
| | (4 | ) | | 88 |
| | (5 | ) | |
Total temporarily impaired and other-than-temporarily impaired available-for-sale securities (2) | $ | 26,336 |
| | $ | (279 | ) | | $ | 16,314 |
| | $ | (381 | ) | | $ | 42,650 |
| | $ | (660 | ) | |
Total temporarily impaired and other-than-temporarily impaired available-for-sale debt securities | | $ | 154,358 |
| | $ | (5,791 | ) | | $ | 14,839 |
| | $ | (760 | ) | | $ | 169,197 |
| | $ | (6,551 | ) |
| |
(1) | Includes other-than-temporarily impaired AFS debt securities on which an OTTI loss, primarily related to changes in interest rates, remains in accumulated OCI. |
| |
(2)
| At December 31, 2013 and 2012, the amortized cost of approximately 4,700 and 2,600 AFS debt securities exceeded their fair value by $6.6 billion and $660 million.
|
|
| | |
| | | Bank of America 20132014 181172 |
The Corporation recorded other-than-temporary impairment (OTTI) losses on AFS debt securities in 20132014, 20122013 and 20112012 as presented in the table below.Net Impairment Losses Recognized in Earnings table. Substantially all OTTI losses in 2014, 2013 and 2012 consisted of credit losses on non-agency residential mortgage-backed securities (RMBS) and were recorded in other income in the Consolidated Statement of Income. A debt security is impaired when its fair value is less than its amortized cost. If the Corporation intends or will more-likely-than-not be required to sell a debt security prior to recovery, the entire impairment loss is recorded in the Consolidated Statement of Income. For AFS debt securities the Corporation does not intend or will not more-likely-than-not be required to sell, an analysis is performed to determine if any of
the impairment is due to credit or whether it is due to other factors (e.g., interest rate). Credit losses are considered unrecoverable and are recorded in the Consolidated Statement of Income with the remaining unrealized losses recorded in accumulated OCI. In certain instances, the credit loss on a debt security may exceed the total
impairment, in which case, the portionexcess of the credit loss that exceedsover the total impairment is recorded as an unrealized gain in accumulated OCI.
| | | | | | | | | | | | | | | |
| Net Impairment Losses Recognized in Earnings | Net Impairment Losses Recognized in Earnings | | | | Net Impairment Losses Recognized in Earnings |
| | | | | | | | | | | | | |
| | 2013 | |
| (Dollars in millions) | Non-agency
Residential
MBS | | Non-agency
Commercial
MBS | | Other
Taxable
Securities | | Total | 2014 | | 2013 | | 2012 |
| Total OTTI losses (unrealized and realized) | $ | (21 | ) | | $ | — |
| | $ | — |
| | $ | (21 | ) | $ | (30 | ) | | $ | (21 | ) | | $ | (57 | ) |
| Unrealized OTTI losses recognized in accumulated OCI | 1 |
| | — |
| | — |
| | 1 |
| |
| Unrealized OTTI losses recognized in OCI | | 14 |
| | 1 |
| | 4 |
|
| Net impairment losses recognized in earnings | $ | (20 | ) | | $ | — |
| | $ | — |
| | $ | (20 | ) | $ | (16 | ) | | $ | (20 | ) | | $ | (53 | ) |
| | | | | | | | | |
| | 2012 | |
| Total OTTI losses (unrealized and realized) | $ | (50 | ) | | $ | (7 | ) | | $ | — |
| | $ | (57 | ) | |
| Unrealized OTTI losses recognized in accumulated OCI | 4 |
| | — |
| | — |
| | 4 |
| |
| Net impairment losses recognized in earnings | $ | (46 | ) | | $ | (7 | ) | | $ | — |
| | $ | (53 | ) | |
| | | | | | | | | |
| | 2011 | |
| Total OTTI losses (unrealized and realized) | $ | (348 | ) | | $ | (10 | ) | | $ | (2 | ) | | $ | (360 | ) | |
| Unrealized OTTI losses recognized in accumulated OCI | 61 |
| | — |
| | — |
| | 61 |
| |
| Net impairment losses recognized in earnings | $ | (287 | ) | | $ | (10 | ) | | $ | (2 | ) | | $ | (299 | ) | |
The Corporation’s net impairment losses recognized in earnings consist of credit losses in 2013, 2012 and 2011. Also included in 2011 were write-downs to fair value on AFS debt securities the Corporation had the intent to sell.
The table below presents a rollforward of the credit losses recognized in earnings in 20132014, 20122013 and 20112012 on AFS debt securities that the Corporation does not have the intent to sell or will not more-likely-than-not be required to sell.
| | | | | | | | | | | | | |
| Rollforward of Credit Losses Recognized | Rollforward of Credit Losses Recognized | | | | | Rollforward of Credit Losses Recognized | | | | |
| | | | | | | | | | | |
| (Dollars in millions) | 2013 | | 2012 | | 2011 |
| 2014 | | 2013 | | 2012 |
| Balance, January 1 | $ | 243 |
| | $ | 310 |
| | $ | 2,148 |
| $ | 184 |
| | $ | 243 |
| | $ | 310 |
|
| Additions for credit losses recognized on AFS debt securities that had no previous impairment losses | 6 |
| | 7 |
| | 72 |
| 14 |
| | 6 |
| | 7 |
|
| Additions for credit losses recognized on AFS debt securities that had previously incurred impairment losses | 14 |
| | 46 |
| | 149 |
| 2 |
| | 14 |
| | 46 |
|
| Reductions for AFS debt securities matured, sold or intended to be sold | (51 | ) | | (120 | ) | | (2,059 | ) | — |
| | (79 | ) | | (120 | ) |
| Balance, December 31 | $ | 212 |
| | $ | 243 |
| | $ | 310 |
| $ | 200 |
| | $ | 184 |
| | $ | 243 |
|
The Corporation estimates the portion of a loss on a security that is attributable to credit using a discounted cash flow model and estimates the expected cash flows of the underlying collateral using internal credit, interest rate and prepayment risk models that incorporate management’s best estimate of current key assumptions such as default rates, loss severity and prepayment rates. Assumptions used for the underlying loans that support the mortgage-backed securities (MBS) can vary widely from loan to loan and are influenced by such factors as loan interest rate, geographic location of the borrower, borrower characteristics and collateral type. Based on these assumptions, the Corporation then determines how the underlying collateral cash flows will be distributed to each MBS issued from the applicable special purpose entity. Expected principal and interest cash flows on an impaired AFS debt security are discounted using the effective yield of each individual impaired AFS debt security.
Significant assumptions used in estimating the expected cash flows for measuring credit losses on non-agency residential mortgage-backed securities (RMBS)RMBS were as follows at December 31, 20132014.
| | | | | | | | | | | | | |
Significant Assumptions | | | | | | | | | | | | |
| | | | Range (1) | | | Range (1) |
| | Weighted-
average | | 10th Percentile (2) | | 90th Percentile (2) | Weighted-
average | | 10th Percentile (2) | | 90th Percentile (2) |
| Prepayment speed | 11.6 | % | | 1.8 | % | | 23.6 | % | 15.3 | % | | 3.1 | % | | 29.9 | % |
| Loss severity | 41.3 |
| | 14.7 |
| | 52.1 |
| 35.2 |
| | 11.8 |
| | 44.7 |
|
| Life default rate | 39.4 |
| | 0.9 |
| | 99.6 |
| 39.6 |
| | 1.5 |
| | 98.6 |
|
| |
(1) | Represents the range of inputs/assumptions based upon the underlying collateral. |
| |
(2) | The value of a variable below which the indicated percentile of observations will fall. |
Annual constant prepayment speed and loss severity rates are projected considering collateral characteristics such as loan-to-value (LTV), creditworthiness of borrowers as measured using FICO scores, and geographic concentrations. The weighted-average severity by collateral type was 38.131.0 percent for prime, 42.034.1 percent for Alt-A and 49.945.0 percent for subprime at December 31, 2013.2014. Additionally, default rates are projected by considering collateral characteristics including, but not limited to, LTV, FICO and geographic concentration. Weighted-average life default rates by collateral type were 27.724.5 percent for prime, 49.142.4 percent for Alt-
AAlt-A and 34.142.0 percent for subprime at December 31, 2013.2014.
The expected maturity distribution of the Corporation’s MBS, the contractual maturity distribution of the Corporation’s other debt securities carried at fair value and HTM debt securities, and the yields on the Corporation’s debt securities carried at fair value and HTM debt securities at December 31, 20132014 are summarized in the table below. Actual maturities may differ from the contractual or expected maturities since borrowers may have the right to prepay obligations with or without prepayment penalties.
| | | | | | | | | | | | | | | | | | | | | | | | | | | | | | | | | | | | | | | | | |
Maturities of Debt Securities Carried at Fair Value and Held-to-maturity Debt Securities | | | | | | | | | | | | | | | | | | | | | | | | | | | | | | | | | | | | | | | | |
| | December 31, 2013 | December 31, 2014 |
| | Due in One Year or Less | | Due after One Year through Five Years | | Due after Five Years through Ten Years | | Due after Ten Years | | Total | Due in One Year or Less | | Due after One Year through Five Years | | Due after Five Years through Ten Years | | Due after Ten Years | | Total |
| (Dollars in millions) | Amount | | Yield (1) | | Amount | | Yield (1) | | Amount | | Yield (1) | | Amount | | Yield (1) | | Amount | | Yield (1) | Amount | | Yield (1) | | Amount | | Yield (1) | | Amount | | Yield (1) | | Amount | | Yield (1) | | Amount | | Yield (1) |
| Amortized cost of debt securities carried at fair value | |
| | |
| | |
| | |
| | |
| | |
| | |
| | |
| | |
| | |
| |
| | |
| | |
| | |
| | |
| | |
| | |
| | |
| | |
| | |
|
| U.S. Treasury and agency securities | $ | 535 |
| | 0.62 | % | | $ | 2,337 |
| | 1.71 | % | | $ | 8,844 |
| | 2.44 | % | | $ | 1,339 |
| | 3.84 | % | | $ | 13,055 |
| | 2.38 | % | $ | 577 |
| | 0.41 | % | | $ | 51,153 |
| | 1.60 | % | | $ | 17,535 |
| | 2.10 | % | | $ | 1,480 |
| | 3.00 | % | | $ | 70,745 |
| | 1.78 | % |
| Mortgage-backed securities: | |
| | |
| | |
| | |
| | |
| | |
| | |
| | |
| | |
| | |
| |
| | |
| | |
| | |
| | |
| | |
| | |
| | |
| | |
| | |
|
| Agency | 11 |
| | 4.44 |
| | 9,649 |
| | 2.93 |
| | 90,407 |
| | 3.10 |
| | 87,728 |
| | 2.96 |
| | 187,795 |
| | 3.03 |
| 28 |
| | 4.60 |
| | 24,283 |
| | 2.70 |
| | 152,950 |
| | 2.80 |
| | 2,175 |
| | 3.00 |
| | 179,436 |
| | 2.80 |
|
| Agency-collateralized mortgage obligations | 1,482 |
| | 0.01 |
| | 3,373 |
| | 2.09 |
| | 18,036 |
| | 2.96 |
| | 29 |
| | 0.93 |
| | 22,920 |
| | 2.63 |
| 794 |
| | 0.40 |
| | 2,874 |
| | 2.00 |
| | 10,488 |
| | 2.80 |
| | 19 |
| | 0.60 |
| | 14,175 |
| | 2.50 |
|
| Non-agency residential | 815 |
| | 4.10 |
| | 2,200 |
| | 4.06 |
| | 1,149 |
| | 3.13 |
| | 1,960 |
| | 2.59 |
| | 6,124 |
| | 3.42 |
| 517 |
| | 5.09 |
| | 1,834 |
| | 5.39 |
| | 1,236 |
| | 4.78 |
| | 4,443 |
| | 10.61 |
| | 8,030 |
| | 8.15 |
|
| Commercial | 1,683 |
| | 5.01 |
| | 466 |
| | 6.43 |
| | 1,089 |
| | 2.51 |
| | 7 |
| | 4.09 |
| | 3,245 |
| | 4.37 |
| 188 |
| | 9.69 |
| | 590 |
| | 2.32 |
| | 3,150 |
| | 2.80 |
| | 3 |
| | 2.83 |
| | 3,931 |
| | 3.07 |
|
| Non-U.S. securities | 16,288 |
| | 1.04 |
| | 2,074 |
| | 3.98 |
| | 149 |
| | 3.34 |
| | 8 |
| | 3.10 |
| | 18,519 |
| | 1.39 |
| 18,991 |
| | 0.98 |
| | 2,261 |
| | 3.83 |
| | 68 |
| | 6.23 |
| | — |
| | — |
| | 21,320 |
| | 1.30 |
|
| Corporate/Agency bonds | 395 |
| | 2.48 |
| | 206 |
| | 5.69 |
| | 112 |
| | 4.12 |
| | 147 |
| | 1.38 |
| | 860 |
| | 3.27 |
| 59 |
| | 1.79 |
| | 112 |
| | 3.77 |
| | 94 |
| | 3.74 |
| | 96 |
| | 0.63 |
| | 361 |
| | 2.43 |
|
| Other taxable securities, substantially all asset-backed securities | 6,655 |
| | 1.58 |
| | 7,274 |
| | 1.37 |
| | 2,105 |
| | 2.06 |
| | 771 |
| | 0.84 |
| | 16,805 |
| | 1.50 |
| 3,199 |
| | 1.34 |
| | 5,707 |
| | 1.22 |
| | 1,376 |
| | 1.81 |
| | 796 |
| | 4.36 |
| | 11,078 |
| | 1.59 |
|
| Total taxable securities | 27,864 |
| | 1.46 |
| | 27,579 |
| | 2.56 |
| | 121,891 |
| | 3.01 |
| | 91,989 |
| | 2.95 |
| | 269,323 |
| | 2.78 |
| 24,353 |
| | 1.16 |
| | 88,814 |
| | 2.07 |
| | 186,897 |
| | 2.80 |
| | 9,012 |
| | 6.86 |
| | 309,076 |
| | 2.56 |
|
| Tax-exempt securities | 195 |
| | 1.66 |
| | 2,324 |
| | 1.49 |
| | 2,429 |
| | 1.90 |
| | 1,019 |
| | 0.61 |
| | 5,967 |
| | 1.54 |
| 929 |
| | 0.97 |
| | 3,768 |
| | 1.13 |
| | 3,082 |
| | 1.15 |
| | 1,777 |
| | 0.86 |
| | 9,556 |
| | 1.14 |
|
| Total amortized cost of debt securities carried at fair value | $ | 28,059 |
| | 1.47 |
| | $ | 29,903 |
| | 2.46 |
| | $ | 124,320 |
| | 2.99 |
| | $ | 93,008 |
| | 2.92 |
| | $ | 275,290 |
| | 2.75 |
| $ | 25,282 |
| | 1.16 |
| | $ | 92,582 |
| | 2.03 |
| | $ | 189,979 |
| | 2.77 |
| | $ | 10,789 |
| | 5.87 |
| | $ | 318,632 |
| | 2.51 |
|
Amortized cost of held-to-maturity debt securities (2) | $ | — |
| | — |
| | $ | 125 |
| | 1.79 |
| | $ | 53,699 |
| | 2.60 |
| | $ | 1,326 |
| | 2.72 |
| | $ | 55,150 |
| | 2.61 |
| $ | 108 |
| | 0.84 |
| | $ | 19,513 |
| | 2.40 |
| | $ | 39,917 |
| | 2.30 |
| | $ | 228 |
| | 3.31 |
| | $ | 59,766 |
| | 2.40 |
|
| | | | | | | | | | | | | | | | | | | | | |
| Debt securities carried at fair value | |
| | |
| | |
| | |
| | |
| | |
| | |
| | |
| | |
| | |
| |
| | |
| | |
| | |
| | |
| | |
| | |
| | |
| | |
| | |
|
| U.S. Treasury and agency securities | $ | 537 |
| | |
| | $ | 2,333 |
| | |
| | $ | 8,831 |
| | |
| | $ | 1,315 |
| | |
| | $ | 13,016 |
| | |
| $ | 577 |
| | |
| | $ | 51,383 |
| | |
| | $ | 17,633 |
| | |
| | $ | 1,543 |
| | |
| | $ | 71,136 |
| | |
|
| Mortgage-backed securities: | |
| | |
| | |
| | |
| | |
| | |
| | |
| | |
| | |
| | |
| |
| | |
| | |
| | |
| | |
| | |
| | |
| | |
| | |
| | |
|
| Agency | 11 |
| | |
| | 9,708 |
| | |
| | 88,191 |
| | |
| | 83,525 |
| | |
| | 181,435 |
| | |
| 29 |
| | |
| | 24,859 |
| | |
| | 153,649 |
| | |
| | 2,206 |
| | |
| | 180,743 |
| | |
|
| Agency-collateralized mortgage obligations | 1,480 |
| | |
| | 3,284 |
| | |
| | 17,916 |
| | |
| | 30 |
| | |
| | 22,710 |
| | |
| 795 |
| | |
| | 2,838 |
| | |
| | 10,596 |
| | |
| | 19 |
| | |
| | 14,248 |
| | |
|
| Non-agency residential | 805 |
| | |
| | 2,236 |
| | |
| | 1,173 |
| | |
| | 2,025 |
| | |
| | 6,239 |
| | |
| 521 |
| | |
| | 1,849 |
| | |
| | 1,316 |
| | |
| | 4,513 |
| | |
| | 8,199 |
| | |
|
| Commercial | 1,715 |
| | |
| | 494 |
| | |
| | 1,013 |
| | |
| | 7 |
| | |
| | 3,229 |
| | |
| 191 |
| | |
| | 594 |
| | |
| | 3,212 |
| | |
| | 3 |
| | |
| | 4,000 |
| | |
|
| Non-U.S. securities | 16,273 |
| | |
| | 2,099 |
| | |
| | 155 |
| | |
| | 8 |
| | |
| | 18,535 |
| | |
| 18,982 |
| | |
| | 2,309 |
| | |
| | 71 |
| | |
| | — |
| | |
| | 21,362 |
| | |
|
| Corporate/Agency bonds | 395 |
| | |
| | 220 |
| | |
| | 116 |
| | |
| | 142 |
| | |
| | 873 |
| | |
| 60 |
| | |
| | 117 |
| | |
| | 96 |
| | |
| | 95 |
| | |
| | 368 |
| | |
|
| Other taxable securities, substantially all asset-backed securities | 6,656 |
| | |
| | 7,280 |
| | |
| | 2,120 |
| | |
| | 774 |
| | |
| | 16,830 |
| | |
| 3,202 |
| | |
| | 5,699 |
| | |
| | 1,399 |
| | |
| | 790 |
| | |
| | 11,090 |
| | |
|
| Total taxable securities | 27,872 |
| | |
| | 27,654 |
| | |
| | 119,515 |
| | |
| | 87,826 |
| | |
| | 262,867 |
| | |
| 24,357 |
| | |
| | 89,648 |
| | |
| | 187,972 |
| | |
| | 9,169 |
| | |
| | 311,146 |
| | |
|
| Tax-exempt securities | 194 |
| | |
| | 2,319 |
| | |
| | 2,409 |
| | |
| | 1,006 |
| | |
| | 5,928 |
| | |
| 929 |
| | |
| | 3,770 |
| | |
| | 3,078 |
| | |
| | 1,772 |
| | |
| | 9,549 |
| | |
|
| Total debt securities carried at fair value | $ | 28,066 |
| | |
| | $ | 29,973 |
| | |
| | $ | 121,924 |
| | |
| | $ | 88,832 |
| | |
| | $ | 268,795 |
| | |
| $ | 25,286 |
| | |
| | $ | 93,418 |
| | |
| | $ | 191,050 |
| | |
| | $ | 10,941 |
| | |
| | $ | 320,695 |
| | |
|
Fair value of held-to-maturity debt securities (2) | $ | — |
| | | | $ | 125 |
| | | | $ | 51,062 |
| | | | $ | 1,243 |
| | | | $ | 52,430 |
| | | $ | 108 |
| | | | $ | 19,762 |
| | | | $ | 39,538 |
| | | | $ | 233 |
| | | | $ | 59,641 |
| | |
| |
(1) | Average yield is computed using the effective yield of each security at the end of the period, weighted based on the amortized cost of each security. The effective yield considers the contractual coupon, amortization of premiums and accretion of discounts, and excludes the effect of related hedging derivatives. |
| |
(2) | Substantially all U.S. agency MBS. |
Certain Corporate and Strategic Investments
In 2013, the Corporation sold its remaining investment of 2.0 billion shares of China Construction Bank Corporation (CCB) and realized a pre-tax gain of $753 million reported in equity investment income in the Consolidated Statement of Income. At December 31, 2012, these shares, representing approximately one percent of CCB, were classified as AFS marketable equity securities and carried at fair value with the after-tax unrealized gain included in
accumulated OCI. The strategic assistance agreement between the Corporation and CCB, which includes cooperation in specific business areas, has been extended through 2016.
The Corporation’s 49 percent investment in a merchant services joint venture, which is recorded in other assets on the Consolidated Balance Sheet and in Consumer & Business Banking (CBB), had a carrying value of $3.23.1 billion and $3.33.2 billion at December 31, 20132014 and 20122013. For additional information, see Note 12 – Commitments and Contingencies.
In 2013, the Corporation sold its remaining investment in China Construction Bank Corporation (CCB) and realized a pretax gain of $753 million in All Other reported in equity investment income in the Consolidated Statement of Income. The strategic assistance agreement between the Corporation and CCB, which includes cooperation in specific business areas, extends through 2016.
|
| | |
| | | Bank of America 20132014 183174 |
NOTE 4 Outstanding Loans and Leases
The following tables present total outstanding loans and leases and an aging analysis for the Corporation’s Home Loans, Credit Card and Other Consumer, and Commercial portfolio segments, by class of financing receivables, at December 31, 20132014 and 20122013.
| | | | | | | | | | | | | | | | | | | | | | | | | | | | | | | | | |
| | December 31, 2013 | December 31, 2014 |
| (Dollars in millions) | 30-59 Days Past Due (1) | | 60-89 Days Past Due (1) | | 90 Days or
More Past Due (2) | | Total Past
Due 30 Days or More | | Total Current or Less Than 30 Days Past Due (3) | | Purchased
Credit-impaired (4) | | Loans Accounted for Under the Fair Value Option | | Total Outstandings | 30-59 Days Past Due (1) | | 60-89 Days Past Due (1) | | 90 Days or
More Past Due (2) | | Total Past
Due 30 Days or More | | Total Current or Less Than 30 Days Past Due (3) | | Purchased
Credit-impaired (4) | | Loans Accounted for Under the Fair Value Option | | Total Outstandings |
| Home loans | |
| | | | |
| | |
| | |
| | |
| | |
| | |
| |
| | | | |
| | |
| | |
| | |
| | |
| | |
|
| Core portfolio | | | | | | | | | | | | | | | | | | | | | | | | | | | | | | |
| Residential mortgage | $ | 2,151 |
| | $ | 754 |
| | $ | 7,188 |
| | $ | 10,093 |
| | $ | 167,243 |
| | | | | | $ | 177,336 |
| $ | 1,847 |
| | $ | 700 |
| | $ | 5,561 |
| | $ | 8,108 |
| | $ | 154,112 |
| | | | | | $ | 162,220 |
|
| Home equity | 243 |
| | 113 |
| | 693 |
| | 1,049 |
| | 53,450 |
| | | | | | 54,499 |
| 218 |
| | 105 |
| | 744 |
| | 1,067 |
| | 50,820 |
| | | | | | 51,887 |
|
| Legacy Assets & Servicing portfolio | | | | | | | | | | | | | | | | | | | | | | | | | | | | | | |
Residential mortgage (5) | 2,758 |
| | 1,412 |
| | 16,746 |
| | 20,916 |
| | 31,142 |
| | $ | 18,672 |
| | | | 70,730 |
| 2,008 |
| | 1,060 |
| | 10,513 |
| | 13,581 |
| | 25,244 |
| | $ | 15,152 |
| | | | 53,977 |
|
| Home equity | 444 |
| | 221 |
| | 1,292 |
| | 1,957 |
| | 30,623 |
| | 6,593 |
| | | | 39,173 |
| 374 |
| | 174 |
| | 1,166 |
| | 1,714 |
| | 26,507 |
| | 5,617 |
| | | | 33,838 |
|
| Credit card and other consumer | | | | | | | | | | | | | | | | | | | | | | | | | | | | | | |
| U.S. credit card | 598 |
| | 422 |
| | 1,053 |
| | 2,073 |
| | 90,265 |
| | | | | | 92,338 |
| 494 |
| | 341 |
| | 866 |
| | 1,701 |
| | 90,178 |
| | | | | | 91,879 |
|
| Non-U.S. credit card | 63 |
| | 54 |
| | 131 |
| | 248 |
| | 11,293 |
| | | | | | 11,541 |
| 49 |
| | 39 |
| | 95 |
| | 183 |
| | 10,282 |
| | | | | | 10,465 |
|
Direct/Indirect consumer (6) | 431 |
| | 175 |
| | 410 |
| | 1,016 |
| | 81,176 |
| | | | | | 82,192 |
| 245 |
| | 71 |
| | 65 |
| | 381 |
| | 80,000 |
| | | | | | 80,381 |
|
Other consumer (7) | 24 |
| | 8 |
| | 20 |
| | 52 |
| | 1,925 |
| | | | | | 1,977 |
| 11 |
| | 2 |
| | 2 |
| | 15 |
| | 1,831 |
| | | | | | 1,846 |
|
| Total consumer | 6,712 |
| | 3,159 |
| | 27,533 |
| | 37,404 |
| | 467,117 |
| | 25,265 |
| | | | 529,786 |
| 5,246 |
| | 2,492 |
| | 19,012 |
| | 26,750 |
| | 438,974 |
| | 20,769 |
| | | | 486,493 |
|
Consumer loans accounted for under the fair value option (8) | |
| | |
| | |
| | |
| | |
| | |
| | $ | 2,164 |
| | 2,164 |
| |
| | |
| | |
| | |
| | |
| | |
| | $ | 2,077 |
| | 2,077 |
|
| Total consumer loans and leases | 6,712 |
| | 3,159 |
| | 27,533 |
| | 37,404 |
| | 467,117 |
| | 25,265 |
| | 2,164 |
| | 531,950 |
| 5,246 |
| | 2,492 |
| | 19,012 |
| | 26,750 |
| | 438,974 |
| | 20,769 |
| | 2,077 |
| | 488,570 |
|
| Commercial | | | | | | | | | | | | | | | | | | | | | | | | | | | | | | |
| U.S. commercial | 363 |
| | 151 |
| | 309 |
| | 823 |
| | 211,734 |
| | | | | | 212,557 |
| 320 |
| | 151 |
| | 318 |
| | 789 |
| | 219,504 |
| | | | | | 220,293 |
|
Commercial real estate (9) | 30 |
| | 29 |
| | 243 |
| | 302 |
| | 47,591 |
| | | | | | 47,893 |
| 138 |
| | 16 |
| | 288 |
| | 442 |
| | 47,240 |
| | | | | | 47,682 |
|
| Commercial lease financing | 110 |
| | 37 |
| | 48 |
| | 195 |
| | 25,004 |
| | | | | | 25,199 |
| 121 |
| | 41 |
| | 42 |
| | 204 |
| | 24,662 |
| | | | | | 24,866 |
|
| Non-U.S. commercial | 103 |
| | 8 |
| | 17 |
| | 128 |
| | 89,334 |
| | | | | | 89,462 |
| 5 |
| | 4 |
| | — |
| | 9 |
| | 80,074 |
| | | | | | 80,083 |
|
| U.S. small business commercial | 87 |
| | 55 |
| | 113 |
| | 255 |
| | 13,039 |
| | | | | | 13,294 |
| 88 |
| | 45 |
| | 94 |
| | 227 |
| | 13,066 |
| | | | | | 13,293 |
|
| Total commercial | 693 |
| | 280 |
| | 730 |
| | 1,703 |
| | 386,702 |
| | | | | | 388,405 |
| 672 |
| | 257 |
| | 742 |
| | 1,671 |
| | 384,546 |
| | | | | | 386,217 |
|
Commercial loans accounted for under the fair value option (8) | |
| | |
| | |
| | |
| | |
| | |
| | 7,878 |
| | 7,878 |
| |
| | |
| | |
| | |
| | |
| | |
| | 6,604 |
| | 6,604 |
|
| Total commercial loans and leases | 693 |
| | 280 |
| | 730 |
| | 1,703 |
| | 386,702 |
| | | | 7,878 |
| | 396,283 |
| 672 |
| | 257 |
| | 742 |
| | 1,671 |
| | 384,546 |
| | | | 6,604 |
| | 392,821 |
|
| Total loans and leases | $ | 7,405 |
| | $ | 3,439 |
| | $ | 28,263 |
| | $ | 39,107 |
| | $ | 853,819 |
| | $ | 25,265 |
| | $ | 10,042 |
| | $ | 928,233 |
| $ | 5,918 |
| | $ | 2,749 |
| | $ | 19,754 |
| | $ | 28,421 |
| | $ | 823,520 |
| | $ | 20,769 |
| | $ | 8,681 |
| | $ | 881,391 |
|
| Percentage of outstandings | 0.80 | % | | 0.37 | % | | 3.04 | % | | 4.21 | % | | 91.99 | % | | 2.72 | % | | 1.08 | % | | |
| 0.67 | % | | 0.31 | % | | 2.24 | % | | 3.22 | % | | 93.44 | % | | 2.36 | % | | 0.98 | % | | 100.00 | % |
| |
(1) | Home loans 30-59 days past due includes fully-insured loans of $2.1 billion and nonperforming loans of $392 million. Home loans 60-89 days past due includes fully-insured loans of $1.1 billion and nonperforming loans of $332 million. |
| |
(2) | Home loans includes fully-insured loans of $11.4 billion. |
| |
(3) | Home loans includes $3.6 billion and direct/indirect consumer includes $27 million of nonperforming loans. |
| |
(4) | PCI loan amounts are shown gross of the valuation allowance. |
| |
(5) | Total outstandings includes pay option loans of $3.2 billion. The Corporation no longer originates this product. |
| |
(6) | Total outstandings includes dealer financial services loans of $37.7 billion, unsecured consumer lending loans of $1.5 billion, U.S. securities-based lending loans of $35.8 billion, non-U.S. consumer loans of $4.0 billion, student loans of $632 million and other consumer loans of $761 million. |
| |
(7) | Total outstandings includes consumer finance loans of $676 million, consumer leases of $1.0 billion, consumer overdrafts of $162 million and other non-U.S. consumer loans of $3 million. |
| |
(8) | Consumer loans accounted for under the fair value option were residential mortgage loans of $1.9 billion and home equity loans of $196 million. Commercial loans accounted for under the fair value option were U.S. commercial loans of $1.9 billion and non-U.S. commercial loans of $4.7 billion. For additional information, see Note 20 – Fair Value Measurements and Note 21 – Fair Value Option. |
| |
(9) | Total outstandings includes U.S. commercial real estate loans of $45.2 billion and non-U.S. commercial real estate loans of $2.5 billion. |
|
| | | | | | | | | | | | | | | | | | | | | | | | | | | | | | | |
| | | | | | | | | | | | | | | | |
| | December 31, 2013 |
| (Dollars in millions) | 30-59 Days
Past Due (1) | | 60-89 Days Past Due (1) | | 90 Days or
More
Past Due (2) | | Total Past
Due 30 Days
or More | | Total Current or Less Than 30 Days Past Due (3) | | Purchased
Credit-impaired (4) | | Loans Accounted for Under the Fair Value Option | | Total Outstandings |
| Home loans | |
| | | | |
| | |
| | |
| | |
| | |
| | |
|
| Core portfolio | | | | | | | | | | | | | | | |
| Residential mortgage | $ | 2,151 |
| | $ | 754 |
| | $ | 7,188 |
| | $ | 10,093 |
| | $ | 167,243 |
| | | | |
| | $ | 177,336 |
|
| Home equity | 243 |
| | 113 |
| | 693 |
| | 1,049 |
| | 53,450 |
| | | | |
| | 54,499 |
|
| Legacy Assets & Servicing portfolio | | | |
| | |
| | |
| | |
| | |
| | |
| | |
|
Residential mortgage (5) | 2,758 |
| | 1,412 |
| | 16,746 |
| | 20,916 |
| | 31,142 |
| | $ | 18,672 |
| | |
| | 70,730 |
|
| Home equity | 444 |
| | 221 |
| | 1,292 |
| | 1,957 |
| | 30,623 |
| | 6,593 |
| | |
| | 39,173 |
|
| Credit card and other consumer | | | |
| | |
| | |
| | |
| | |
| | |
| | |
|
| U.S. credit card | 598 |
| | 422 |
| | 1,053 |
| | 2,073 |
| | 90,265 |
| | | | |
| | 92,338 |
|
| Non-U.S. credit card | 63 |
| | 54 |
| | 131 |
| | 248 |
| | 11,293 |
| | | | |
| | 11,541 |
|
Direct/Indirect consumer (6) | 431 |
| | 175 |
| | 410 |
| | 1,016 |
| | 81,176 |
| | | | |
| | 82,192 |
|
Other consumer (7) | 24 |
| | 8 |
| | 20 |
| | 52 |
| | 1,925 |
| | | | |
| | 1,977 |
|
| Total consumer | 6,712 |
| | 3,159 |
| | 27,533 |
| | 37,404 |
| | 467,117 |
| | 25,265 |
| | |
| 529,786 |
|
Consumer loans accounted for under the fair value option (8) | | | | | | | | | | | | | $ | 2,164 |
|
| 2,164 |
|
| Total consumer loans and leases | 6,712 |
| | 3,159 |
| | 27,533 |
| | 37,404 |
| | 467,117 |
| | 25,265 |
| | 2,164 |
| | 531,950 |
|
| Commercial | | | |
| | |
| | |
| | |
| | |
| | |
| | |
|
| U.S. commercial | 363 |
| | 151 |
| | 309 |
| | 823 |
| | 211,734 |
| | | | |
| | 212,557 |
|
Commercial real estate (9) | 30 |
| | 29 |
| | 243 |
| | 302 |
| | 47,591 |
| | | | |
| | 47,893 |
|
| Commercial lease financing | 110 |
| | 37 |
| | 48 |
| | 195 |
| | 25,004 |
| | | | |
| | 25,199 |
|
| Non-U.S. commercial | 103 |
| | 8 |
| | 17 |
| | 128 |
| | 89,334 |
| | | | |
| | 89,462 |
|
| U.S. small business commercial | 87 |
| | 55 |
| | 113 |
| | 255 |
| | 13,039 |
| | | | |
| | 13,294 |
|
| Total commercial | 693 |
| | 280 |
| | 730 |
| | 1,703 |
| | 386,702 |
| | | | |
| | 388,405 |
|
Commercial loans accounted for under the fair value option (8) | | | | | | | | | | | | | 7,878 |
| | 7,878 |
|
| Total commercial loans and leases | 693 |
| | 280 |
| | 730 |
| | 1,703 |
| | 386,702 |
| | | | 7,878 |
| | 396,283 |
|
| Total loans and leases | $ | 7,405 |
| | $ | 3,439 |
| | $ | 28,263 |
| | $ | 39,107 |
| | $ | 853,819 |
| | $ | 25,265 |
| | $ | 10,042 |
| | $ | 928,233 |
|
| Percentage of outstandings | 0.80 | % | | 0.37 | % | | 3.04 | % | | 4.21 | % | | 91.99 | % | | 2.72 | % | | 1.08 | % | | 100.00 | % |
| |
(1) | Home loans 30-59 days past due includes fully-insured loans of $2.5 billion and nonperforming loans of $623 million. Home loans 60-89 days past due includes fully-insured loans of $1.2 billion and nonperforming loans of $410 million. |
| |
(2) | Home loans includes fully-insured loans of $17.0 billion. |
| |
(3) | Home loans includes $5.9 billion and direct/indirect consumer includes $33 million of nonperforming loans. |
| |
(4) | PCI loan amounts are shown gross of the valuation allowance. |
| |
(5) | Total outstandings includes pay option loans of $4.4 billion. The Corporation no longer originates this product. |
| |
(6) | Total outstandings includes dealer financial services loans of $38.5 billion, unsecured consumer lending loans of $2.7 billion, U.S. securities-based lending loans of $31.2 billion, non-U.S. consumer loans of $4.7 billion, student loans of $4.1 billion and other consumer loans of $1.0 billion. |
| |
(7) | Total outstandings includes consumer finance loans of $1.2 billion, consumer leases of $606 million, consumer overdrafts of $176 million and other non-U.S. consumer loans of $5 million. |
| |
(8) | Consumer loans accounted for under the fair value option were residential mortgage loans of $2.0 billion and home equity loans of $147 million. Commercial loans accounted for under the fair value option were U.S. commercial loans of $1.5 billion and non-U.S. commercial loans of $6.4 billion. For additional information, see Note 20 – Fair Value Measurements and Note 21 – Fair Value Option. |
| |
(9) | Total outstandings includes U.S. commercial real estate loans of $46.3 billion and non-U.S. commercial real estate loans of $1.6 billion. |
|
| | | | | | | | | | | | | | | | | | | | | | | | | | | | | | | |
| | | | | | | | | | | | | | | | |
| | December 31, 2012 |
| (Dollars in millions) | 30-59 Days
Past Due (1) | | 60-89 Days Past Due (1) | | 90 Days or
More
Past Due (2) | | Total Past
Due 30 Days
or More | | Total Current or Less Than 30 Days Past Due (3) | | Purchased
Credit-impaired (4) | | Loans Accounted for Under the Fair Value Option | | Total Outstandings |
| Home loans | |
| | | | |
| | |
| | |
| | |
| | |
| | |
|
| Core portfolio | | | | | | | | | | | | | | | |
Residential mortgage (5) | $ | 2,274 |
| | $ | 806 |
| | $ | 6,227 |
| | $ | 9,307 |
| | $ | 160,809 |
| | | | |
| | $ | 170,116 |
|
| Home equity | 273 |
| | 146 |
| | 591 |
| | 1,010 |
| | 59,841 |
| | | | |
| | 60,851 |
|
| Legacy Assets & Servicing portfolio | | | |
| | |
| | |
| | |
| | |
| | |
| | |
|
Residential mortgage (6) | 2,938 |
| | 1,714 |
| | 26,728 |
| | 31,380 |
| | 33,982 |
| | $ | 17,451 |
| | |
| | 82,813 |
|
| Home equity | 608 |
| | 357 |
| | 1,444 |
| | 2,409 |
| | 36,213 |
| | 8,667 |
| | |
| | 47,289 |
|
| Credit card and other consumer | | | |
| | |
| | |
| | |
| | |
| | |
| | |
|
| U.S. credit card | 729 |
| | 582 |
| | 1,437 |
| | 2,748 |
| | 92,087 |
| | | | |
| | 94,835 |
|
| Non-U.S. credit card | 106 |
| | 85 |
| | 212 |
| | 403 |
| | 11,294 |
| | | | |
| | 11,697 |
|
Direct/Indirect consumer (7) | 569 |
| | 239 |
| | 573 |
| | 1,381 |
| | 81,824 |
| | | | |
| | 83,205 |
|
Other consumer (8) | 48 |
| | 19 |
| | 4 |
| | 71 |
| | 1,557 |
| | | | |
| | 1,628 |
|
| Total consumer | 7,545 |
| | 3,948 |
| | 37,216 |
| | 48,709 |
| | 477,607 |
| | 26,118 |
| | |
| 552,434 |
|
Consumer loans accounted for under the fair value option (9) | | | | | | | | | | | | | $ | 1,005 |
|
| 1,005 |
|
| Total consumer loans and leases | 7,545 |
| | 3,948 |
| | 37,216 |
| | 48,709 |
| | 477,607 |
| | 26,118 |
| | 1,005 |
| | 553,439 |
|
| Commercial | | | |
| | |
| | |
| | |
| | |
| | |
| | |
|
| U.S. commercial | 323 |
| | 133 |
| | 639 |
| | 1,095 |
| | 196,031 |
| | | | |
| | 197,126 |
|
Commercial real estate (10) | 79 |
| | 144 |
| | 983 |
| | 1,206 |
| | 37,431 |
| | | | |
| | 38,637 |
|
| Commercial lease financing | 84 |
| | 79 |
| | 30 |
| | 193 |
| | 23,650 |
| | | | |
| | 23,843 |
|
| Non-U.S. commercial | 2 |
| | — |
| | — |
| | 2 |
| | 74,182 |
| | | | |
| | 74,184 |
|
| U.S. small business commercial | 101 |
| | 75 |
| | 168 |
| | 344 |
| | 12,249 |
| | | | |
| | 12,593 |
|
| Total commercial | 589 |
| | 431 |
| | 1,820 |
| | 2,840 |
| | 343,543 |
| | | | |
| | 346,383 |
|
Commercial loans accounted for under the fair value option (9) | | | | | | | | | | | | | 7,997 |
| | 7,997 |
|
| Total commercial loans and leases | 589 |
| | 431 |
| | 1,820 |
| | 2,840 |
| | 343,543 |
| | | | 7,997 |
| | 354,380 |
|
| Total loans and leases | $ | 8,134 |
| | $ | 4,379 |
| | $ | 39,036 |
| | $ | 51,549 |
| | $ | 821,150 |
| | $ | 26,118 |
| | $ | 9,002 |
| | $ | 907,819 |
|
| Percentage of outstandings | 0.90 | % | | 0.48 | % | | 4.30 | % | | 5.68 | % | | 90.45 | % | | 2.88 | % | | 0.99 | % | | |
|
| |
(1)
| Home loans 30-59 days past due includes fully-insured loans of $2.3 billion and nonperforming loans of $702 million. Home loans 60-89 days past due includes fully-insured loans of $1.3 billion and nonperforming loans of $558 million.
|
| |
(2)
| Home loans includes fully-insured loans of $22.2 billion.
|
| |
(3)
| Home loans includes $5.5 billion and direct/indirect consumer includes $63 million of nonperforming loans.
|
| |
(4)
| PCI loan amounts are shown gross of the valuation allowance. |
| |
(5)
| Total outstandings includes non-U.S. residential mortgage loans of $93 million.
|
| |
(6)
| Total outstandings includes pay option loans of $6.7 billion. The Corporation no longer originates this product.
|
| |
(7)
| Total outstandings includes dealer financial services loans of $35.9 billion, consumer lending loans of $4.7 billion, U.S. securities-based lending loans of $28.3 billion, non-U.S. consumer loans of $8.3 billion, student loans of $4.8 billion and other consumer loans of $1.2 billion.
|
| |
(8)
| Total outstandings includes consumer finance loans of $1.4 billion, consumer leases of $34 million, consumer overdrafts of $177 million and other non-U.S. consumer loans of $5 million.
|
| |
(9)
| Consumer loans accounted for under the fair value option were residential mortgage loans of $1.0 billion. Commercial loans accounted for under the fair value option were U.S. commercial loans of $2.3 billion and non-U.S. commercial loans of $5.7 billion. For additional information, see Note 20 – Fair Value Measurements and Note 21 – Fair Value Option.
|
| |
(10)
| Total outstandings includes U.S. commercial real estate loans of $37.2 billion and non-U.S. commercial real estate loans of $1.5 billion.
|
The Corporation mitigates a portion of its credit risk on the residential mortgage portfolio through the use of synthetic securitization vehicles. These vehicles issue long-term notes to investors, the proceeds of which are held as cash collateral. The Corporation pays a premium to the vehicles to purchase mezzanine loss protection on a portfolio of residential mortgage loans owned by the Corporation. Cash held in the vehicles is used to reimburse the Corporation in the event that losses on the mortgage portfolio exceed 10 basis points (bps) of the original pool balance, up to the remaining amount of purchased loss protection of $339 million and $500 million at December 31, 2013 and 2012. The vehicles from which the Corporation purchases credit protection are VIEs. The Corporation does not have a variable interest in these vehicles and, accordingly, these vehicles are not consolidated by the Corporation. Amounts due from the vehicles are recorded in other income (loss) in the Consolidated Statement of Income when the Corporation recognizes a reimbursable loss, as described above. Amounts are collected when reimbursable losses are realized through the sale of the underlying collateral. At December 31, 2013 and 2012, the Corporation had a receivable of $198 million and $305 million from these vehicles for reimbursement of losses, and principal of $12.5 billion and $17.6 billion of residential mortgage loans was referenced under these agreements. The Corporation records an allowance for credit losses on these loans without regard to the existence of the purchased loss protection as the protection does not represent a guarantee of individual loans.
In addition, the Corporation has entered into long-term credit protection agreements with FNMA and FHLMC on loans totaling $28.217.2 billion and $24.328.2 billion at December 31, 20132014 and 20122013, providing full credit protection on residential mortgage loans that become
severely delinquent. All of these loans are individually insured and therefore the Corporation does not record an allowance for credit losses related to these loans. For additional information, see Note 7 – Representations and Warranties Obligations and Corporate Guarantees.
Nonperforming Loans and Leases
The Corporation classifies junior-lien home equity loans as nonperforming when the first-lien loan becomes 90 days past due even if the junior-lien loan is performing. At December 31, 20132014 and 20122013, $1.2 billion800 million and $1.5$1.2 billion of such junior-lien home equity loans were included in nonperforming loans.
The Corporation classifies consumer real estate loans that have been discharged in Chapter 7 bankruptcy and not reaffirmed by the borrower as troubled debt restructurings (TDRs), irrespective of payment history or delinquency status, even if the repayment terms for the loan have not been otherwise modified. The
Corporation continues to have a lien on the underlying collateral. At December 31, 20132014, nonperforming loans discharged in Chapter 7 bankruptcy with no change in repayment terms at the time of discharge were $1.8$1.4 billion of which $1.1 billion$901 million were current on their contractual payments, while $642$395 million were 90 days or more past due. Of the contractually current nonperforming loans, nearlymore than 80 percent were discharged in Chapter 7 bankruptcy more than 12 months ago, and nearlymore than 5060 percent were discharged 24 months or more ago. As subsequent cash payments are received on the loans that are contractually current, the interest component of the payments is generally recorded as interest income on a cash basis and the principal component is recorded as a reduction in the carrying value of the loan.
Excluding purchased credit-impaired (PCI) loans, the Corporation sold nonperforming and other delinquent consumer loans with a carrying value, excluding the related allowance, of $4.8 billion and $2.0 billion, and recognized gains of $247 million and $58 million recorded in noninterest income, during 2014 and 2013.
|
| | |
| | 186Bank of America 20132014176
| | |
The table below presents the Corporation’s nonperforming loans and leases including nonperforming TDRs, and loans accruing past due 90 days or more at December 31, 20132014 and 20122013. Nonperforming loans held-for-sale (LHFS) are excluded from
nonperforming loans and leases as they are recorded at either fair value or the lower of cost or fair value. For more information on the criteria for classification as nonperforming, see Note 1 – Summary of Significant Accounting Principles.
| | | | | | | | | | | | | | | | | |
| Credit Quality | Credit Quality | | | Credit Quality | | |
| | | | | | | | | | | | | | | |
| | December 31 | December 31 |
| | Nonperforming Loans and Leases (1) | | Accruing Past Due 90 Days or More | Nonperforming Loans and Leases (1) | | Accruing Past Due 90 Days or More |
| (Dollars in millions) | 2013 | | 2012 | | 2013 | | 2012 | 2014 | | 2013 | | 2014 | | 2013 |
| Home loans | |
| | |
| | |
| | |
| |
| | |
| | |
| | |
|
| Core portfolio | | | | | | | | | | | | | | |
Residential mortgage (2) | $ | 3,316 |
| | $ | 3,193 |
| | $ | 5,137 |
| | $ | 3,984 |
| $ | 2,398 |
| | $ | 3,316 |
| | $ | 3,942 |
| | $ | 5,137 |
|
| Home equity | 1,431 |
| | 1,265 |
| | — |
| | — |
| 1,496 |
| | 1,431 |
| | — |
| | — |
|
| Legacy Assets & Servicing portfolio | |
| | |
| | |
| | | |
| | |
| | |
| | |
Residential mortgage (2) | 8,396 |
| | 11,862 |
| | 11,824 |
| | 18,173 |
| 4,491 |
| | 8,396 |
| | 7,465 |
| | 11,824 |
|
| Home equity | 2,644 |
| | 3,017 |
| | — |
| | — |
| 2,405 |
| | 2,644 |
| | — |
| | — |
|
| Credit card and other consumer | |
| | |
| | | | | |
| | |
| | | | |
| U.S. credit card | n/a |
| | n/a |
| | 1,053 |
| | 1,437 |
| n/a |
| | n/a |
| | 866 |
| | 1,053 |
|
| Non-U.S. credit card | n/a |
| | n/a |
| | 131 |
| | 212 |
| n/a |
| | n/a |
| | 95 |
| | 131 |
|
| Direct/Indirect consumer | 35 |
| | 92 |
| | 408 |
| | 545 |
| 28 |
| | 35 |
| | 64 |
| | 408 |
|
| Other consumer | 18 |
| | 2 |
| | 2 |
| | 2 |
| 1 |
| | 18 |
| | 1 |
| | 2 |
|
| Total consumer | 15,840 |
| | 19,431 |
| | 18,555 |
| | 24,353 |
| 10,819 |
| | 15,840 |
| | 12,433 |
| | 18,555 |
|
| Commercial | |
| | |
| | |
| | |
| |
| | |
| | |
| | |
|
| U.S. commercial | 819 |
| | 1,484 |
| | 47 |
| | 65 |
| 701 |
| | 819 |
| | 110 |
| | 47 |
|
| Commercial real estate | 322 |
| | 1,513 |
| | 21 |
| | 29 |
| 321 |
| | 322 |
| | 3 |
| | 21 |
|
| Commercial lease financing | 16 |
| | 44 |
| | 41 |
| | 15 |
| 3 |
| | 16 |
| | 41 |
| | 41 |
|
| Non-U.S. commercial | 64 |
| | 68 |
| | 17 |
| | — |
| 1 |
| | 64 |
| | — |
| | 17 |
|
| U.S. small business commercial | 88 |
| | 115 |
| | 78 |
| | 120 |
| 87 |
| | 88 |
| | 67 |
| | 78 |
|
| Total commercial | 1,309 |
| | 3,224 |
| | 204 |
| | 229 |
| 1,113 |
| | 1,309 |
| | 221 |
| | 204 |
|
| Total loans and leases | $ | 17,149 |
| | $ | 22,655 |
| | $ | 18,759 |
| | $ | 24,582 |
| $ | 11,932 |
| | $ | 17,149 |
| | $ | 12,654 |
| | $ | 18,759 |
|
| |
(1) | Nonperforming loan balances do not include nonaccruing TDRs removed from the PCI loan portfolio prior to January 1, 2010 of $260102 million and $521260 million at December 31, 20132014 and 20122013. |
| |
(2) | Residential mortgage loans in the Core and Legacy Assets & Servicing portfolios accruing past due 90 days or more are fully-insured loans. At December 31, 20132014 and 20122013, residential mortgage includes $13.07.3 billion and $17.813.0 billion of loans on which interest has been curtailed by the FHA, and therefore are no longer accruing interest, although principal is still insured, and $4.04.1 billion and $4.44.0 billion of loans on which interest is still accruing. |
n/a = not applicable
Credit Quality Indicators
The Corporation monitors credit quality within its Home Loans, Credit Card and Other Consumer, and Commercial portfolio segments based on primary credit quality indicators. For more information on the portfolio segments, see Note 1 – Summary of Significant Accounting Principles. Within the Home Loans portfolio segment, the primary credit quality indicators are refreshed LTV and refreshed FICO score. Refreshed LTV measures the carrying value of the loan as a percentage of the value of the property securing the loan, refreshed quarterly. Home equity loans are evaluated using combined loan-to-value (CLTV) which measures the carrying value of the combined loans that have liens against the property and the available line of credit as a percentage of the value of the property securing the loan, refreshed quarterly. FICO score measures the creditworthiness of the borrower based on the financial obligations of the borrower and the borrower’s credit
history. At a minimum, FICO scores are refreshed quarterly, and in many cases, more frequently. FICO scores are also a primary credit quality indicator for the Credit Card and Other Consumer portfolio segment and the business card portfolio within U.S. small business commercial. Within the Commercial portfolio segment, loans are evaluated using the internal classifications of pass rated or reservable criticized as the primary credit quality indicators. The term reservable criticized refers to those commercial loans that are internally classified or listed by the Corporation as Special Mention, Substandard or Doubtful, which are asset quality categories defined by regulatory authorities. These assets have an elevated level of risk and may have a high probability of default or total loss. Pass rated refers to all loans not considered reservable criticized. In addition to these primary credit quality indicators, the Corporation uses other credit quality indicators for certain types of loans.
|
| | |
| | 177Bank of America 20131872014 | | |
The following tables present certain credit quality indicators for the Corporation’s Home Loans, Credit Card and Other Consumer, and Commercial portfolio segments, by class of financing receivables, at December 31, 20132014 and 20122013.
| | | | | | | | | | | | | | | | | | | | | | | | | |
Home Loans – Credit Quality Indicators (1) | Home Loans – Credit Quality Indicators (1) | Home Loans – Credit Quality Indicators (1) |
| | | |
| | December 31, 2013 | December 31, 2014 |
| (Dollars in millions) | Core Portfolio Residential Mortgage (2) | | Legacy Assets & Servicing Residential
Mortgage (2) | | Residential Mortgage PCI (3) | | Core Portfolio Home Equity (2) | | Legacy Assets & Servicing Home Equity (2) | | Home Equity PCI | Core Portfolio Residential Mortgage (2) | | Legacy Assets & Servicing Residential
Mortgage (2) | | Residential Mortgage PCI (3) | | Core Portfolio Home Equity (2) | | Legacy Assets & Servicing Home Equity (2) | | Home Equity PCI |
Refreshed LTV (4) | |
| | |
| | |
| | |
| | | | | |
Refreshed LTV (4, 5) | | |
| | |
| | |
| | |
| | | | |
| Less than or equal to 90 percent | $ | 95,833 |
| | $ | 22,391 |
| | $ | 11,400 |
| | $ | 45,898 |
| | $ | 16,714 |
| | $ | 2,036 |
| $ | 100,255 |
| | $ | 18,499 |
| | $ | 9,972 |
| | $ | 45,414 |
| | $ | 17,453 |
| | $ | 2,046 |
|
| Greater than 90 percent but less than or equal to 100 percent | 5,541 |
| | 4,134 |
| | 2,653 |
| | 3,659 |
| | 4,233 |
| | 698 |
| 4,958 |
| | 3,081 |
| | 2,005 |
| | 2,442 |
| | 3,272 |
| | 1,048 |
|
| Greater than 100 percent | 6,250 |
| | 7,998 |
| | 4,619 |
| | 4,942 |
| | 11,633 |
| | 3,859 |
| 4,017 |
| | 5,265 |
| | 3,175 |
| | 4,031 |
| | 7,496 |
| | 2,523 |
|
Fully-insured loans (5) | 69,712 |
| | 17,535 |
| | — |
| | — |
| | — |
| | — |
| |
Fully-insured loans (6) | | 52,990 |
| | 11,980 |
| | — |
| | — |
| | — |
| | — |
|
| Total home loans | $ | 177,336 |
| | $ | 52,058 |
| | $ | 18,672 |
| | $ | 54,499 |
| | $ | 32,580 |
| | $ | 6,593 |
| $ | 162,220 |
| | $ | 38,825 |
| | $ | 15,152 |
| | $ | 51,887 |
| | $ | 28,221 |
| | $ | 5,617 |
|
| Refreshed FICO score | | | | | | | | | | | | | | | | | | | | | | |
| Less than 620 | $ | 5,924 |
| | $ | 10,391 |
| | $ | 9,792 |
| | $ | 2,343 |
| | $ | 4,229 |
| | $ | 1,072 |
| $ | 4,184 |
| | $ | 6,313 |
| | $ | 6,109 |
| �� | $ | 2,169 |
| | $ | 3,470 |
| | $ | 864 |
|
| Greater than or equal to 620 and less than 680 | 7,863 |
| | 5,452 |
| | 3,135 |
| | 4,057 |
| | 5,050 |
| | 1,165 |
| 6,272 |
| | 4,032 |
| | 3,014 |
| | 3,683 |
| | 4,529 |
| | 995 |
|
| Greater than or equal to 680 and less than 740 | 24,034 |
| | 7,791 |
| | 3,034 |
| | 11,276 |
| | 9,032 |
| | 1,935 |
| 21,946 |
| | 6,463 |
| | 3,310 |
| | 10,231 |
| | 7,905 |
| | 1,651 |
|
| Greater than or equal to 740 | 69,803 |
| | 10,889 |
| | 2,711 |
| | 36,823 |
| | 14,269 |
| | 2,421 |
| 76,828 |
| | 10,037 |
| | 2,719 |
| | 35,804 |
| | 12,317 |
| | 2,107 |
|
Fully-insured loans (5) | 69,712 |
| | 17,535 |
| | — |
| | — |
| | — |
| | — |
| |
Fully-insured loans (6) | | 52,990 |
| | 11,980 |
| | — |
| | — |
| | — |
| | — |
|
| Total home loans | $ | 177,336 |
| | $ | 52,058 |
| | $ | 18,672 |
| | $ | 54,499 |
| | $ | 32,580 |
| | $ | 6,593 |
| $ | 162,220 |
| | $ | 38,825 |
| | $ | 15,152 |
| | $ | 51,887 |
| | $ | 28,221 |
| | $ | 5,617 |
|
| |
(1) | Excludes $2.1 billion of loans accounted for under the fair value option. |
| |
(3) | Includes $2.8 billion of pay option loans. The Corporation no longer originates this product. |
| |
(4) | Refreshed LTV percentages for PCI loans are calculated using the carrying value net of the related valuation allowance. |
| |
(5) | Effective December 31, 2014, with the exception of high-value properties, underlying values for LTV ratios are primarily determined using automated valuation models. For high-value properties, generally with an original value of $1 million or more, estimated property values are determined using the CoreLogic Case-Shiller Index. Prior-period values have been updated to reflect this change. Previously reported values were primarily determined through an index-based approach. |
| |
(6) | Credit quality indicators are not reported for fully-insured loans as principal repayment is insured. |
|
| | | | | | | | | | | | | | | |
| | | | | | | | |
| Credit Card and Other Consumer – Credit Quality Indicators |
| | |
| | December 31, 2014 |
| (Dollars in millions) | U.S. Credit Card | | Non-U.S. Credit Card | | Direct/Indirect Consumer | | Other Consumer (1) |
| Refreshed FICO score | |
| | |
| | |
| | |
|
| Less than 620 | $ | 4,467 |
| | $ | — |
| | $ | 1,296 |
| | $ | 266 |
|
| Greater than or equal to 620 and less than 680 | 12,177 |
| | — |
| | 1,892 |
| | 227 |
|
| Greater than or equal to 680 and less than 740 | 34,986 |
| | — |
| | 10,749 |
| | 307 |
|
| Greater than or equal to 740 | 40,249 |
| | — |
| | 25,279 |
| | 881 |
|
Other internal credit metrics (2, 3, 4) | — |
| | 10,465 |
| | 41,165 |
| | 165 |
|
| Total credit card and other consumer | $ | 91,879 |
| | $ | 10,465 |
| | $ | 80,381 |
| | $ | 1,846 |
|
| |
(1) | Thirty-seven percent of the other consumer portfolio is associated with portfolios from certain consumer finance businesses that the Corporation previously exited. |
| |
(2) | Other internal credit metrics may include delinquency status, geography or other factors. |
| |
(3) | Direct/indirect consumer includes $39.7 billion of securities-based lending which is overcollateralized and therefore has minimal credit risk and $632 million of loans the Corporation no longer originates. |
| |
(4) | Non-U.S. credit card represents the U.K. credit card portfolio which is evaluated using internal credit metrics, including delinquency status. At December 31, 2014, 98 percent of this portfolio was current or less than 30 days past due, one percent was 30-89 days past due and one percent was 90 days or more past due. |
|
| | | | | | | | | | | | | | | | | | | |
| | | | | | | | | | |
Commercial – Credit Quality Indicators (1) |
| | |
| | December 31, 2014 |
| (Dollars in millions) | U.S. Commercial | | Commercial Real Estate | | Commercial
Lease Financing | | Non-U.S. Commercial | | U.S. Small
Business Commercial (2) |
| Risk ratings | |
| | |
| | |
| | |
| | |
|
| Pass rated | $ | 213,839 |
| | $ | 46,632 |
| | $ | 23,832 |
| | $ | 79,367 |
| | $ | 751 |
|
| Reservable criticized | 6,454 |
| | 1,050 |
| | 1,034 |
| | 716 |
| | 182 |
|
Refreshed FICO score (3) | | | | | | | | | |
|
| Less than 620 | |
| | |
| | |
| | |
| | 184 |
|
| Greater than or equal to 620 and less than 680 | | | | | | | | | 529 |
|
| Greater than or equal to 680 and less than 740 | | | | | | | | | 1,591 |
|
| Greater than or equal to 740 | | | | | | | | | 2,910 |
|
Other internal credit metrics (3, 4) | | | | | | | | | 7,146 |
|
| Total commercial | $ | 220,293 |
| | $ | 47,682 |
| | $ | 24,866 |
| | $ | 80,083 |
| | $ | 13,293 |
|
| |
(1) | Excludes $6.6 billion of loans accounted for under the fair value option. |
| |
(2) | U.S. small business commercial includes $762 million of criticized business card and small business loans which are evaluated using refreshed FICO scores or internal credit metrics, including delinquency status, rather than risk ratings. At December 31, 2014, 98 percent of the balances where internal credit metrics are used was current or less than 30 days past due. |
| |
(3) | Refreshed FICO score and other internal credit metrics are applicable only to the U.S. small business commercial portfolio. |
| |
(4) | Other internal credit metrics may include delinquency status, application scores, geography or other factors. |
|
| | | | | | | | | | | | | | | | | | | | | | | |
| | | | | | | | | | | | |
Home Loans – Credit Quality Indicators (1) |
| | |
| | December 31, 2013 |
| (Dollars in millions) | Core Portfolio Residential Mortgage (2) | | Legacy Assets & Servicing Residential
Mortgage (2) | | Residential Mortgage PCI (3) | | Core Portfolio Home Equity (2) | | Legacy Assets & Servicing Home Equity (2) | | Home Equity PCI |
Refreshed LTV (4, 5) | |
| | |
| | |
| | |
| | | | |
| Less than or equal to 90 percent | $ | 94,255 |
| | $ | 21,587 |
| | $ | 10,605 |
| | $ | 44,892 |
| | $ | 17,006 |
| | $ | 1,598 |
|
| Greater than 90 percent but less than or equal to 100 percent | 7,013 |
| | 4,216 |
| | 2,638 |
| | 3,178 |
| | 3,948 |
| | 1,121 |
|
| Greater than 100 percent | 6,356 |
| | 8,720 |
| | 5,429 |
| | 6,429 |
| | 11,626 |
| | 3,874 |
|
Fully-insured loans (6) | 69,712 |
| | 17,535 |
| | — |
| | — |
| | — |
| | — |
|
| Total home loans | $ | 177,336 |
| | $ | 52,058 |
| | $ | 18,672 |
| | $ | 54,499 |
| | $ | 32,580 |
| | $ | 6,593 |
|
| Refreshed FICO score | |
| | |
| | |
| | |
| | |
| | |
|
| Less than 620 | $ | 5,334 |
| | $ | 9,955 |
| | $ | 9,129 |
| | $ | 2,415 |
| | $ | 4,259 |
| | $ | 1,045 |
|
| Greater than or equal to 620 and less than 680 | 7,164 |
| | 5,276 |
| | 3,349 |
| | 4,211 |
| | 5,133 |
| | 1,172 |
|
| Greater than or equal to 680 and less than 740 | 22,617 |
| | 7,639 |
| | 3,211 |
| | 11,726 |
| | 9,143 |
| | 1,936 |
|
| Greater than or equal to 740 | 72,509 |
| | 11,653 |
| | 2,983 |
| | 36,147 |
| | 14,045 |
| | 2,440 |
|
Fully-insured loans (6) | 69,712 |
| | 17,535 |
| | — |
| | — |
| | — |
| | — |
|
| Total home loans | $ | 177,336 |
| | $ | 52,058 |
| | $ | 18,672 |
| | $ | 54,499 |
| | $ | 32,580 |
| | $ | 6,593 |
|
| |
(1) | Excludes $2.2 billion of loans accounted for under the fair value option. |
| |
(3) | Includes $4.0 billion of pay option loans. The Corporation no longer originates this product. |
| |
(4) | Refreshed LTV percentages for PCI loans are calculated using the carrying value net of the related valuation allowance. |
| |
(5) | Effective December 31, 2014, with the exception of high-value properties, underlying values for LTV ratios are primarily determined using automated valuation models. For high-value properties, generally with an original value of $1 million or more, estimated property values are determined using the CoreLogic Case-Shiller Index. Prior-period values have been updated to reflect this change. Previously reported values were primarily determined through an index-based approach. |
| |
(6) | Credit quality indicators are not reported for fully-insured loans as principal repayment is insured. |
|
| | | | | | | | | | | | | | | |
| | | | | | | | |
| Credit Card and Other Consumer – Credit Quality Indicators |
| | |
| | December 31, 2013 |
| (Dollars in millions) | U.S. Credit Card | | Non-U.S. Credit Card | | Direct/Indirect Consumer | | Other Consumer (1) |
| Refreshed FICO score | |
| | |
| | |
| | |
|
| Less than 620 | $ | 4,989 |
| | $ | — |
| | $ | 1,220 |
| | $ | 539 |
|
| Greater than or equal to 620 and less than 680 | 12,753 |
| | — |
| | 3,345 |
| | 264 |
|
| Greater than or equal to 680 and less than 740 | 35,413 |
| | — |
| | 9,887 |
| | 199 |
|
| Greater than or equal to 740 | 39,183 |
| | — |
| | 26,220 |
| | 188 |
|
Other internal credit metrics (2, 3, 4) | — |
| | 11,541 |
| | 41,520 |
| | 787 |
|
| Total credit card and other consumer | $ | 92,338 |
| | $ | 11,541 |
| | $ | 82,192 |
| | $ | 1,977 |
|
| |
(1) | 60Sixty percent of the other consumer portfolio is associated with portfolios from certain consumer finance businesses that the Corporation previously exited.
|
| |
(2) | Other internal credit metrics may include delinquency status, geography or other factors. |
| |
(3) | Direct/indirect consumer includes $35.8 billion of securities-based lending which is overcollateralized and therefore has minimal credit risk and $4.1 billion of loans the Corporation no longer originates. |
| |
(4) | Non-U.S. credit card represents the U.K. credit card portfolio which is evaluated using internal credit metrics, including delinquency status. At December 31, 2013, 98 percent of this portfolio was current or less than 30 days past due, one percent was 30-89 days past due and one percent was 90 days or more past due. |
|
| | | | | | | | | | | | | | | | | | | |
| | | | | | | | | | |
Commercial – Credit Quality Indicators (1) |
| | |
| | December 31, 2013 |
| (Dollars in millions) | U.S. Commercial | | Commercial Real Estate | | Commercial
Lease Financing | | Non-U.S. Commercial | | U.S. Small
Business Commercial (2) |
| Risk ratings | |
| | |
| | |
| | |
| | |
|
| Pass rated | $ | 205,416 |
| | $ | 46,507 |
| | $ | 24,211 |
| | $ | 88,138 |
| | $ | 1,191 |
|
| Reservable criticized | 7,141 |
| | 1,386 |
| | 988 |
| | 1,324 |
| | 346 |
|
Refreshed FICO score (3) | | | | | | | | | |
| Less than 620 | | | | | | | | | 224 |
|
| Greater than or equal to 620 and less than 680 | | | | | | | | | 534 |
|
| Greater than or equal to 680 and less than 740 | | | | | | | | | 1,567 |
|
| Greater than or equal to 740 | | | | | | | | | 2,779 |
|
Other internal credit metrics (3, 4) | | | | | | | | | 6,653 |
|
| Total commercial | $ | 212,557 |
| | $ | 47,893 |
| | $ | 25,199 |
| | $ | 89,462 |
| | $ | 13,294 |
|
| |
(1) | Excludes $7.9 billion of loans accounted for under the fair value option. |
| |
(2) | U.S. small business commercial includes $289 million of criticized business card and small business loans which are evaluated using refreshed FICO scores or internal credit metrics, including delinquency status, rather than risk ratings. At December 31, 2013, 99 percent of the balances where internal credit metrics are used was current or less than 30 days past due. |
| |
(3) | Refreshed FICO score and other internal credit metrics are applicable only to the U.S. small business commercial portfolio. |
| |
(4) | Other internal credit metrics may include delinquency status, application scores, geography or other factors. |
|
| | | | | | | | | | | | | | | | | | | | | | | |
| | | | | | | | | | | | |
Home Loans – Credit Quality Indicators (1) |
| | |
| | December 31, 2012 |
| (Dollars in millions) | Core Portfolio Residential Mortgage (2) | | Legacy Assets & Servicing Residential
Mortgage (2) | | Residential Mortgage PCI (3) | | Core Portfolio Home Equity (2) | | Legacy Assets & Servicing Home Equity (2) | | Home Equity PCI |
Refreshed LTV (4) | |
| | |
| | |
| | |
| | | | |
| Less than or equal to 90 percent | $ | 80,585 |
| | $ | 20,613 |
| | $ | 8,581 |
| | $ | 44,971 |
| | $ | 15,922 |
| | $ | 2,074 |
|
| Greater than 90 percent but less than or equal to 100 percent | 8,891 |
| | 5,097 |
| | 2,368 |
| | 5,825 |
| | 4,507 |
| | 805 |
|
| Greater than 100 percent | 12,984 |
| | 16,454 |
| | 6,502 |
| | 10,055 |
| | 18,193 |
| | 5,788 |
|
Fully-insured loans (5) | 67,656 |
| | 23,198 |
| | — |
| | — |
| | — |
| | — |
|
| Total home loans | $ | 170,116 |
| | $ | 65,362 |
| | $ | 17,451 |
| | $ | 60,851 |
| | $ | 38,622 |
| | $ | 8,667 |
|
| Refreshed FICO score | |
| | |
| | |
| | |
| | |
| | |
|
| Less than 620 | $ | 6,366 |
| | $ | 14,320 |
| | $ | 8,647 |
| | $ | 2,586 |
| | $ | 5,411 |
| | $ | 1,989 |
|
| Greater than or equal to 620 and less than 680 | 8,561 |
| | 6,157 |
| | 2,712 |
| | 4,500 |
| | 5,921 |
| | 1,529 |
|
| Greater than or equal to 680 and less than 740 | 25,141 |
| | 8,611 |
| | 2,976 |
| | 12,625 |
| | 10,395 |
| | 2,299 |
|
| Greater than or equal to 740 | 62,392 |
| | 13,076 |
| | 3,116 |
| | 41,140 |
| | 16,895 |
| | 2,850 |
|
Fully-insured loans (5) | 67,656 |
| | 23,198 |
| | — |
| | — |
| | — |
| | — |
|
| Total home loans | $ | 170,116 |
| | $ | 65,362 |
| | $ | 17,451 |
| | $ | 60,851 |
| | $ | 38,622 |
| | $ | 8,667 |
|
| |
(1)
| Excludes $1.0 billion of loans accounted for under the fair value option.
|
| |
(3)
| Includes $6.1 billion of pay option loans. The Corporation no longer originates this product.
|
| |
(4)
| Refreshed LTV percentages for PCI loans are calculated using the carrying value net of the related valuation allowance. |
| |
(5)
| Credit quality indicators are not reported for fully-insured loans as principal repayment is insured. |
|
| | | | | | | | | | | | | | | |
| | | | | | | | |
| Credit Card and Other Consumer – Credit Quality Indicators |
| | |
| | December 31, 2012 |
| (Dollars in millions) | U.S. Credit Card | | Non-U.S. Credit Card | | Direct/Indirect Consumer | | Other Consumer (1) |
| Refreshed FICO score | |
| | |
| | |
| | |
|
| Less than 620 | $ | 6,188 |
| | $ | — |
| | $ | 1,896 |
| | $ | 668 |
|
| Greater than or equal to 620 and less than 680 | 13,947 |
| | — |
| | 3,367 |
| | 301 |
|
| Greater than or equal to 680 and less than 740 | 37,167 |
| | — |
| | 9,592 |
| | 232 |
|
| Greater than or equal to 740 | 37,533 |
| | — |
| | 25,164 |
| | 212 |
|
Other internal credit metrics (2, 3, 4) | — |
| | 11,697 |
| | 43,186 |
| | 215 |
|
| Total credit card and other consumer | $ | 94,835 |
| | $ | 11,697 |
| | $ | 83,205 |
| | $ | 1,628 |
|
| |
(1)
| 87 percent of the other consumer portfolio is associated with portfolios from certain consumer finance businesses that the Corporation previously exited.
|
| |
(2)
| Other internal credit metrics may include delinquency status, geography or other factors. |
| |
(3)
| Direct/indirect consumer includes $36.5 billion of securities-based lending which is overcollateralized and therefore has minimal credit risk and $4.8 billion of loans the Corporation no longer originates.
|
| |
(4)
| Non-U.S. credit card represents the U.K. credit card portfolio which is evaluated using internal credit metrics, including delinquency status. At December 31, 2012, 97 percent of this portfolio was current or less than 30 days past due, one percent was 30-89 days past due and two percent was 90 days or more past due.
|
|
| | | | | | | | | | | | | | | | | | | |
| | | | | | | | | | |
Commercial – Credit Quality Indicators (1) |
| | |
| | December 31, 2012 |
| (Dollars in millions) | U.S. Commercial | | Commercial Real Estate | | Commercial
Lease Financing | | Non-U.S. Commercial | | U.S. Small
Business Commercial (2) |
| Risk ratings | |
| | |
| | |
| | |
| | |
|
| Pass rated | $ | 189,602 |
| | $ | 34,968 |
| | $ | 22,874 |
| | $ | 72,688 |
| | $ | 1,690 |
|
| Reservable criticized | 7,524 |
| | 3,669 |
| | 969 |
| | 1,496 |
| | 573 |
|
Refreshed FICO score (3) | | | | | | | | | |
| Less than 620 | | | | | | | | | 400 |
|
| Greater than or equal to 620 and less than 680 | | | | | | | | | 580 |
|
| Greater than or equal to 680 and less than 740 | | | | | | | | | 1,553 |
|
| Greater than or equal to 740 | | | | | | | | | 2,496 |
|
Other internal credit metrics (3, 4) | | | | | | | | | 5,301 |
|
| Total commercial | $ | 197,126 |
| | $ | 38,637 |
| | $ | 23,843 |
| | $ | 74,184 |
| | $ | 12,593 |
|
| |
(1)
| Excludes $8.0 billion of loans accounted for under the fair value option.
|
| |
(2)
| U.S. small business commercial includes $366 million of criticized business card and small business loans which are evaluated using refreshed FICO scores or internal credit metrics, including delinquency status, rather than risk ratings. At December 31, 2012, 98 percent of the balances where internal credit metrics are used was current or less than 30 days past due.
|
| |
(3)
| Refreshed FICO score and other internal credit metrics are applicable only to the U.S. small business commercial portfolio. |
| |
(4)
| Other internal credit metrics may include delinquency status, application scores, geography or other factors. |
|
| | |
| | 179Bank of America 20131892014 | | |
Impaired Loans and Troubled Debt Restructurings
A loan is considered impaired when, based on current information, it is probable that the Corporation will be unable to collect all amounts due from the borrower in accordance with the contractual terms of the loan. Impaired loans include nonperforming commercial loans and all consumer and commercial TDRs. For additional information, see Note 1 – Summary of Significant Accounting Principles. Impaired loans exclude nonperforming consumer loans and nonperforming commercial leases unless they are classified as TDRs. Loans accounted for under the fair value option are also excluded. Purchased credit-impaired (PCI)PCI loans are excluded and reported separately on page 198189. For additional information, see Note 1 – Summary of Significant Accounting Principles.
Home Loans
Impaired home loans within the Home Loans portfolio segment consist entirely of TDRs. Excluding PCI loans, most modifications of home loans meet the definition of TDRs when a binding offer is extended to a borrower. Modifications of home loans are done in accordance with the government’s Making Home Affordable Program (modifications under government programs) or the Corporation’s proprietary programs (modifications under proprietary programs). These modifications are considered to be TDRs if concessions have been granted to borrowers experiencing financial difficulties. Concessions may include reductions in interest rates, capitalization of past due amounts, principal and/or interest forbearance, payment extensions, principal and/or interest forgiveness, or combinations thereof. During 2013 and 2012, the Corporation implemented a borrower assistance program that provides forgiveness of principal balances in connection with the settlement agreement among the Corporation and certain of its affiliates and subsidiaries, together with the U.S. Department of Justice (DOJ), the U.S. Department of Housing and Urban Development (HUD) and other federal agencies, and 49 state Attorneys General concerning the terms of a global settlement resolving investigations into certain origination, servicing and foreclosure practices (National Mortgage Settlement). In addition, the Corporation also providesprovided interest rate modifications to qualified borrowers pursuant to the 2012 National Mortgage Settlement and these interest rate modifications are not considered to be TDRs.
Prior to permanently modifying a loan, the Corporation may enter into trial modifications with certain borrowers under both government and proprietary programs, including the borrower assistance program pursuant to the National Mortgage Settlement.programs. Trial modifications generally represent a three- to four-month period during which the borrower makes monthly payments under the anticipated modified payment terms. Upon successful completion of the trial period, the Corporation and the borrower enter into a permanent modification. Binding trial modifications are classified as TDRs when the trial offer is made and continue to be classified as TDRs regardless of whether the borrower enters into a permanent modification.
Home loans that have been discharged in Chapter 7 bankruptcy with no change in repayment terms at the time of discharge of $3.6$2.4 billion were included in TDRs at December 31, 20132014, of which $1.8$1.4 billion were classified as nonperforming and $1.8$1.0 billion were loans fully-insured by the Federal Housing Administration (FHA). Of the $3.6 billion of home loan TDRs, approximately 27 percent,
30 percent and 43 percent were discharged in Chapter 7 bankruptcy in 2013, 2012 and in years prior to 2012, respectively. For more information on loans discharged in Chapter 7 bankruptcy, see Nonperforming Loans and Leases in this Note.
A home loan, excluding PCI loans which are reported separately, is not classified as impaired unless it is a TDR. Once such a loan has been designated as a TDR, it is then individually assessed for
impairment. Home loan TDRs are measured primarily based on the net present value of the estimated cash flows discounted at the loan’s original effective interest rate, as discussed in the following paragraph. If the carrying value of a TDR exceeds this amount, a specific allowance is recorded as a component of the allowance for loan and lease losses. Alternatively, home loan TDRs that are considered to be dependent solely on the collateral for repayment (e.g., due to the lack of income verification or as a result of being discharged in Chapter 7 bankruptcy) are measured based on the estimated fair value of the collateral and a charge-off is recorded if the carrying value exceeds the fair value of the collateral. Home loans that reached 180 days past due prior to modification had been charged off to their net realizable value, less costs to sell, before they were modified as TDRs in accordance with established policy. Therefore, modifications of home loans that are 180 or more days past due as TDRs do not have an impact on the allowance for loan and lease losses nor are additional charge-offs required at the time of modification. Subsequent declines in the fair value of the collateral after a loan has reached 180 days past due are recorded as charge-offs. Fully-insured loans are protected against principal loss, and therefore, the Corporation does not record an allowance for loan and lease losses on the outstanding principal balance, even after they have been modified in a TDR.
The net present value of the estimated cash flows used to measure impairment is based on model-driven estimates of projected payments, prepayments, defaults and loss-given-default (LGD). Using statistical modeling methodologies, the Corporation estimates the probability that a loan will default prior to maturity based on the attributes of each loan. The factors that are most relevant to the probability of default are the refreshed LTV, or in the case of a subordinated lien, refreshed CLTV, borrower credit score, months since origination (i.e., vintage) and geography. Each of these factors is further broken down by present collection status (whether the loan is current, delinquent, in default or in bankruptcy). Severity (or LGD) is estimated based on the refreshed LTV for first mortgages or CLTV for subordinated liens. The estimates are based on the Corporation’s historical experience as adjusted to reflect an assessment of environmental factors that may not be reflected in the historical data, such as changes in real estate values, local and national economies, underwriting standards and the regulatory environment. The probability of default models also incorporate recent experience with modification programs including redefaults subsequent to modification, a loan’s default history prior to modification and the change in borrower payments post-modification.
At December 31, 20132014 and 20122013, remaining commitments to lend additional funds to debtors whose terms have been modified in a home loan TDR were immaterial. Home loan foreclosed properties totaled $533630 million and $650533 million at December 31, 20132014 and 20122013.
|
| | |
| | 190Bank of America 20132014180
| | |
The table below provides informationthe unpaid principal balance, carrying value and related allowance at December 31, 2014 and 2013, and the average carrying value and interest income recognized for 2014, 2013 and 2012 for impaired loans in the Corporation’s Home Loans portfolio segment at December 31, 2013 and 2012, and for 2013, 2012 and 2011, and includes primarily loans
managed by Legacy Assets & Servicing. Certain impaired home loans do not have a related allowance as the current valuation of these impaired loans exceeded the carrying value, which is net of previously recorded charge-offs.
| | | | | | | | | | | | | | | | | | | | | | | | | |
| Impaired Loans – Home Loans | Impaired Loans – Home Loans | | | Impaired Loans – Home Loans | | |
| | | | | | | | | | | |
| | December 31, 2013 | | December 31, 2012 | December 31, 2014 | | December 31, 2013 |
| (Dollars in millions) | Unpaid
Principal Balance | | Carrying Value | | Related Allowance | | Unpaid
Principal Balance | | Carrying Value | | Related Allowance | Unpaid
Principal Balance | | Carrying Value | | Related Allowance | | Unpaid
Principal Balance | | Carrying Value | | Related Allowance |
| With no recorded allowance | |
| | |
| | |
| | |
| | |
| | | |
| | |
| | |
| | |
| | |
| | |
| Residential mortgage | $ | 21,567 |
| | $ | 16,450 |
| | $ | — |
| | $ | 20,226 |
| | $ | 14,967 |
| | $ | — |
| $ | 19,710 |
| | $ | 15,605 |
| | $ | — |
| | $ | 21,567 |
| | $ | 16,450 |
| | $ | — |
|
| Home equity | 3,249 |
| | 1,385 |
| | — |
| | 2,624 |
| | 1,103 |
| | — |
| 3,540 |
| | 1,630 |
| | — |
| | 3,249 |
| | 1,385 |
| | — |
|
| With an allowance recorded | | | | | |
| | | | | | | | | | | |
| | | | | | |
| Residential mortgage | 13,341 |
| | 12,862 |
| | 991 |
| | 14,223 |
| | 13,158 |
| | 1,252 |
| $ | 7,861 |
| | $ | 7,665 |
| | $ | 531 |
| | $ | 13,341 |
| | $ | 12,862 |
| | $ | 991 |
|
| Home equity | 893 |
| | 761 |
| | 240 |
| | 1,256 |
| | 1,022 |
| | 448 |
| 852 |
| | 728 |
| | 196 |
| | 893 |
| | 761 |
| | 240 |
|
| Total | |
| | |
| | |
| | | | | | | |
| | |
| | |
| | | | | | |
| Residential mortgage | $ | 34,908 |
| | $ | 29,312 |
| | $ | 991 |
| | $ | 34,449 |
| | $ | 28,125 |
| | $ | 1,252 |
| $ | 27,571 |
| | $ | 23,270 |
| | $ | 531 |
| | $ | 34,908 |
| | $ | 29,312 |
| | $ | 991 |
|
| Home equity | 4,142 |
| | 2,146 |
| | 240 |
| | 3,880 |
| | 2,125 |
| | 448 |
| 4,392 |
| | 2,358 |
| | 196 |
| | 4,142 |
| | 2,146 |
| | 240 |
|
| | | | | | | | | | | | | | | | | | | | | | | |
| | 2013 | | 2012 | | 2011 | 2014 | | 2013 | | 2012 |
| | Average
Carrying
Value | | Interest
Income
Recognized (1) | | Average
Carrying
Value | | Interest
Income
Recognized (1) | | Average
Carrying
Value | | Interest
Income
Recognized (1) | Average
Carrying
Value | | Interest
Income
Recognized (1) | | Average
Carrying
Value | | Interest
Income
Recognized (1) | | Average
Carrying
Value | | Interest
Income
Recognized (1) |
| With no recorded allowance | |
| | |
| | | | | | | | | |
| | |
| | | | | | | | |
| Residential mortgage | $ | 16,625 |
| | $ | 621 |
| | $ | 10,937 |
| | $ | 366 |
| | $ | 6,507 |
| | $ | 241 |
| $ | 15,065 |
| | $ | 490 |
| | $ | 16,625 |
| | $ | 621 |
| | $ | 10,937 |
| | $ | 366 |
|
| Home equity | 1,245 |
| | 76 |
| | 734 |
| | 49 |
| | 442 |
| | 23 |
| 1,486 |
| | 87 |
| | 1,245 |
| | 76 |
| | 734 |
| | 49 |
|
| With an allowance recorded | | | | | | | | | | | | | | | | | | | | | | |
| Residential mortgage | 13,926 |
| | 616 |
| | 11,575 |
| | 423 |
| | 9,552 |
| | 325 |
| $ | 10,826 |
| | $ | 411 |
| | $ | 13,926 |
| | $ | 616 |
| | $ | 11,575 |
| | $ | 423 |
|
| Home equity | 912 |
| | 41 |
| | 1,145 |
| | 44 |
| | 1,357 |
| | 34 |
| 743 |
| | 25 |
| | 912 |
| | 41 |
| | 1,145 |
| | 44 |
|
| Total | |
| | |
| | | | | | | | | |
| | |
| | | | | | | | |
| Residential mortgage | $ | 30,551 |
| | $ | 1,237 |
| | $ | 22,512 |
| | $ | 789 |
| | $ | 16,059 |
| | $ | 566 |
| $ | 25,891 |
| | $ | 901 |
| | $ | 30,551 |
| | $ | 1,237 |
| | $ | 22,512 |
| | $ | 789 |
|
| Home equity | 2,157 |
| | 117 |
| | 1,879 |
| | 93 |
| | 1,799 |
| | 57 |
| 2,229 |
| | 112 |
| | 2,157 |
| | 117 |
| | 1,879 |
| | 93 |
|
| |
(1) | Interest income recognized includes interest accrued and collected on the outstanding balances of accruing impaired loans as well as interest cash collections on nonaccruing impaired loans for which the principal is considered collectible. |
The following table below presents the December 31, 2014, 2013 2012 and 20112012 unpaid principal balance, carrying value, and average pre- and post-modification interest rates ofon home loans that were modified in TDRs during 20132014, 20122013 and 2011,2012, and net charge-offs that were recorded during the period in which the modification occurred.
occurred. The following Home Loans portfolio segment tables include loans that were initially classified as TDRs during the period and also loans that had previously been classified as TDRs and were modified again during the period. These TDRs are primarily managed by Legacy Assets & Servicing.
| | | | | | | | | | | | | | | | | | | | | |
Home Loans – TDRs Entered into During 2013, 2012 and 2011 (1) | |
Home Loans – TDRs Entered into During 2014, 2013 and 2012 (1) | | Home Loans – TDRs Entered into During 2014, 2013 and 2012 (1) |
| | | |
| | December 31, 2013 | | 2013 | December 31, 2014 | | 2014 |
| (Dollars in millions) | Unpaid Principal Balance | | Carrying Value | | Pre-Modification Interest Rate | | Post-Modification Interest Rate | | Net Charge-offs (2) | Unpaid Principal Balance | | Carrying Value | | Pre-Modification Interest Rate | | Post-Modification Interest Rate (2) | | Net Charge-offs (3) |
| Residential mortgage | $ | 11,233 |
| | $ | 10,016 |
| | 5.30 | % | | 4.27 | % | | $ | 235 |
| $ | 5,940 |
| | $ | 5,120 |
| | 5.28 | % | | 4.93 | % | | $ | 72 |
|
| Home equity | 878 |
| | 521 |
| | 5.29 |
| | 3.92 |
| | 192 |
| 863 |
| | 592 |
| | 4.00 |
| | 3.33 |
| | 99 |
|
| Total | $ | 12,111 |
| | $ | 10,537 |
| | 5.30 |
| | 4.24 |
| | $ | 427 |
| $ | 6,803 |
| | $ | 5,712 |
| | 5.12 |
| | 4.73 |
| | $ | 171 |
|
| | | | | | | | | | | | | | | | | | | |
| | December 31, 2012 | | 2012 | December 31, 2013 | | 2013 |
| Residential mortgage | $ | 15,088 |
| | $ | 12,228 |
| | 5.52 | % | | 4.70 | % | | $ | 523 |
| $ | 11,233 |
| | $ | 10,016 |
| | 5.30 | % | | 4.27 | % | | $ | 235 |
|
| Home equity | 1,721 |
| | 858 |
| | 5.22 |
| | 4.39 |
| | 716 |
| 878 |
| | 521 |
| | 5.29 |
| | 3.92 |
| | 192 |
|
| Total | $ | 16,809 |
| | $ | 13,086 |
| | 5.49 |
| | 4.66 |
| | $ | 1,239 |
| $ | 12,111 |
| | $ | 10,537 |
| | 5.30 |
| | 4.24 |
| | $ | 427 |
|
| | | | | | | | | | | | | | | | | | | |
| | December 31, 2011 | | 2011 | December 31, 2012 | | 2012 |
| Residential mortgage | $ | 11,764 |
| | $ | 9,991 |
| | 5.94 | % | | 5.16 | % | | $ | 308 |
| $ | 15,088 |
| | $ | 12,228 |
| | 5.52 | % | | 4.70 | % | | $ | 523 |
|
| Home equity | 1,112 |
| | 556 |
| | 6.58 |
| | 5.25 |
| | 239 |
| 1,721 |
| | 858 |
| | 5.22 |
| | 4.39 |
| | 716 |
|
| Total | $ | 12,876 |
| | $ | 10,547 |
| | 6.01 |
| | 5.17 |
| | $ | 547 |
| $ | 16,809 |
| | $ | 13,086 |
| | 5.49 |
| | 4.66 |
| | $ | 1,239 |
|
| |
(1) | TDRs entered into during 2014 include modifications with principal forgiveness of $53 million related to residential mortgage and $1 million related to home equity. TDRs entered into during 2013 include residential mortgage modifications with principal forgiveness of $467 million. TDRs entered into during 2012 include residential mortgage modifications with principal forgiveness of $778 million related to residential mortgage and home equity modifications of $9 million. Prior related to 2012, the principal forgiveness amount was not significant.home equity. |
| |
(2) | The post-modification interest rate reflects the interest rate applicable only to permanently completed modifications, which exclude loans that are in a trial modification period. |
| |
(3) | Net charge-offs include amounts recorded on loans modified during the period that are no longer held by the Corporation at December 31, 2014, 2013 2012 and 20112012 due to sales and other dispositions. |
|
| | |
| | | Bank of America 20132014 191182 |
The table below presents the December 31, 2014, 2013 2012 and 20112012 carrying value for home loans that were modified in a TDR during 20132014, 20122013 and 20112012, by type of modification.
| | | | | | | | | | | | | |
Home Loans – Modification Programs | | | | |
| | TDRs Entered into During 2013 | TDRs Entered into During 2014 |
| (Dollars in millions) | Residential Mortgage | | Home Equity | | Total Carrying Value | Residential Mortgage | | Home Equity | | Total Carrying Value |
| Modifications under government programs | | | | | | | | | | |
| Contractual interest rate reduction | $ | 1,815 |
| | $ | 48 |
| | $ | 1,863 |
| $ | 643 |
| | $ | 56 |
| | $ | 699 |
|
| Principal and/or interest forbearance | 35 |
| | 24 |
| | 59 |
| 16 |
| | 18 |
| | 34 |
|
Other modifications (1) | 100 |
| | — |
| | 100 |
| 98 |
| | 1 |
| | 99 |
|
| Total modifications under government programs | 1,950 |
| | 72 |
| | 2,022 |
| 757 |
| | 75 |
| | 832 |
|
| Modifications under proprietary programs | | | | | | | | | | |
| Contractual interest rate reduction | 2,799 |
| | 40 |
| | 2,839 |
| 244 |
| | 22 |
| | 266 |
|
| Capitalization of past due amounts | 132 |
| | 2 |
| | 134 |
| 71 |
| | 2 |
| | 73 |
|
| Principal and/or interest forbearance | 469 |
| | 17 |
| | 486 |
| 66 |
| | 75 |
| | 141 |
|
Other modifications (1) | 105 |
| | 25 |
| | 130 |
| 40 |
| | 47 |
| | 87 |
|
| Total modifications under proprietary programs | 3,505 |
| | 84 |
| | 3,589 |
| 421 |
| | 146 |
| | 567 |
|
| Trial modifications | 3,410 |
| | 87 |
| | 3,497 |
| 3,421 |
| | 182 |
| | 3,603 |
|
Loans discharged in Chapter 7 bankruptcy (2) | 1,151 |
| | 278 |
| | 1,429 |
| 521 |
| | 189 |
| | 710 |
|
| Total modifications | $ | 10,016 |
| | $ | 521 |
| | $ | 10,537 |
| $ | 5,120 |
| | $ | 592 |
| | $ | 5,712 |
|
| | | | | | | | | | | |
| | TDRs Entered into During 2012 | TDRs Entered into During 2013 |
| Modifications under government programs | | | | | | | | | | |
| Contractual interest rate reduction | $ | 642 |
| | $ | 78 |
| | $ | 720 |
| $ | 1,815 |
| | $ | 48 |
| | $ | 1,863 |
|
| Principal and/or interest forbearance | 51 |
| | 31 |
| | 82 |
| 35 |
| | 24 |
| | 59 |
|
Other modifications (1) | 37 |
| | 1 |
| | 38 |
| 100 |
| | — |
| | 100 |
|
| Total modifications under government programs | 730 |
| | 110 |
| | 840 |
| 1,950 |
| | 72 |
| | 2,022 |
|
| Modifications under proprietary programs | | | | | | | | | | |
| Contractual interest rate reduction | 3,350 |
| | 44 |
| | 3,394 |
| 2,799 |
| | 40 |
| | 2,839 |
|
| Capitalization of past due amounts | 144 |
| | — |
| | 144 |
| 132 |
| | 2 |
| | 134 |
|
| Principal and/or interest forbearance | 424 |
| | 16 |
| | 440 |
| 469 |
| | 17 |
| | 486 |
|
Other modifications (1) | 97 |
| | 21 |
| | 118 |
| 105 |
| | 25 |
| | 130 |
|
| Total modifications under proprietary programs | 4,015 |
| | 81 |
| | 4,096 |
| 3,505 |
| | 84 |
| | 3,589 |
|
| Trial modifications | 4,547 |
| | 69 |
| | 4,616 |
| 3,410 |
| | 87 |
| | 3,497 |
|
Loans discharged in Chapter 7 bankruptcy (2) | 2,936 |
| | 598 |
| | 3,534 |
| 1,151 |
| | 278 |
| | 1,429 |
|
| Total modifications | $ | 12,228 |
| | $ | 858 |
| | $ | 13,086 |
| $ | 10,016 |
| | $ | 521 |
| | $ | 10,537 |
|
| | | | | | | | | | | |
| | TDRs Entered into During 2011 | TDRs Entered into During 2012 |
| Modifications under government programs | | | | | | | | | | |
| Contractual interest rate reduction | $ | 994 |
| | $ | 189 |
| | $ | 1,183 |
| $ | 642 |
| | $ | 78 |
| | $ | 720 |
|
| Principal and/or interest forbearance | 189 |
| | 36 |
| | 225 |
| 51 |
| | 31 |
| | 82 |
|
Other modifications (1) | 64 |
| | 5 |
| | 69 |
| 37 |
| | 1 |
| | 38 |
|
| Total modifications under government programs | 1,247 |
| | 230 |
| | 1,477 |
| 730 |
| | 110 |
| | 840 |
|
| Modifications under proprietary programs | | | | | | | | | | |
| Contractual interest rate reduction | 3,531 |
| | 101 |
| | 3,632 |
| 3,350 |
| | 44 |
| | 3,394 |
|
| Capitalization of past due amounts | 410 |
| | 1 |
| | 411 |
| 144 |
| | — |
| | 144 |
|
| Principal and/or interest forbearance | 946 |
| | 49 |
| | 995 |
| 424 |
| | 16 |
| | 440 |
|
Other modifications (1) | 441 |
| | 34 |
| | 475 |
| 97 |
| | 21 |
| | 118 |
|
| Total modifications under proprietary programs | 5,328 |
| | 185 |
| | 5,513 |
| 4,015 |
| | 81 |
| | 4,096 |
|
| Trial modifications | 3,416 |
| | 141 |
| | 3,557 |
| 4,547 |
| | 69 |
| | 4,616 |
|
Loans discharged in Chapter 7 bankruptcy (2) | | 2,936 |
| | 598 |
| | 3,534 |
|
| Total modifications | $ | 9,991 |
| | $ | 556 |
| | $ | 10,547 |
| $ | 12,228 |
| | $ | 858 |
| | $ | 13,086 |
|
| |
(1) | Includes other modifications such as term or payment extensions and repayment plans. |
| |
(2) | Includes loans discharged in Chapter 7 bankruptcy with no change in repayment terms that are classified as TDRs. The amount for 2012 represents the cumulative impact upon adoption of the regulatory guidance. During 2013, home loans of $587 million, or 41 percent of loans discharged in Chapter 7 bankruptcy were current or less than 60 days past due. |
|
| | |
192183 Bank of America 20132014
| | |
The table below presents the carrying value of loans that entered into payment default during 20132014, 20122013 and 20112012 that were modified in a TDR during the 12 months preceding payment default. Included in the table areTotal carrying value includes loans with a carrying value of $2.0 billion, $2.4 billion $667 million and $514$667 million that entered into payment default during 20132014, 20122013 and 20112012 but were no longer held by the Corporation as of December 31, 2014, 2013 2012 and 2011 due2012
due to sales and other dispositions. A payment default for home loan TDRs is recognized when a borrower has missed three monthly payments (not necessarily consecutively) since modification. Payment defaultdefaults on a trial modification where the borrower has not yet met the terms of the agreement are included in the table below if the borrower is 90 days or more past due three months after the offer to modify is made.
| | | | | | | | | | | | | |
Home Loans – TDRs Entering Payment Default That Were Modified During the Preceding 12 Months | | | | |
| | 2013 | 2014 |
| (Dollars in millions) | Residential Mortgage | | Home Equity | | Total Carrying Value (1) | Residential Mortgage | | Home Equity | | Total Carrying Value (1) |
| Modifications under government programs | $ | 454 |
| | $ | 2 |
| | $ | 456 |
| $ | 696 |
| | $ | 4 |
| | $ | 700 |
|
| Modifications under proprietary programs | 1,117 |
| | 4 |
| | 1,121 |
| 714 |
| | 12 |
| | 726 |
|
Loans discharged in Chapter 7 bankruptcy (2) | 964 |
| | 30 |
| | 994 |
| 481 |
| | 70 |
| | 551 |
|
| Trial modifications | 4,376 |
| | 14 |
| | 4,390 |
| 2,231 |
| | 56 |
| | 2,287 |
|
| Total modifications | $ | 6,911 |
| | $ | 50 |
| | $ | 6,961 |
| $ | 4,122 |
| | $ | 142 |
| | $ | 4,264 |
|
| | | | | | | | | | | |
| | 2012 | 2013 |
| Modifications under government programs | $ | 202 |
| | $ | 8 |
| | $ | 210 |
| $ | 454 |
| | $ | 2 |
| | $ | 456 |
|
| Modifications under proprietary programs | 942 |
| | 14 |
| | 956 |
| 1,117 |
| | 4 |
| | 1,121 |
|
Loans discharged in Chapter 7 bankruptcy (2) | 1,228 |
| | 53 |
| | 1,281 |
| 964 |
| | 30 |
| | 994 |
|
| Trial modifications | 2,351 |
| | 20 |
| | 2,371 |
| 4,376 |
| | 14 |
| | 4,390 |
|
| Total modifications | $ | 4,723 |
| | $ | 95 |
| | $ | 4,818 |
| $ | 6,911 |
| | $ | 50 |
| | $ | 6,961 |
|
| | | | | | | | | | | |
| | 2011 | 2012 |
| Modifications under government programs | $ | 352 |
| | $ | 2 |
| | $ | 354 |
| $ | 202 |
| | $ | 8 |
| | $ | 210 |
|
| Modifications under proprietary programs | 2,098 |
| | 42 |
| | 2,140 |
| 942 |
| | 14 |
| | 956 |
|
Loans discharged in Chapter 7 bankruptcy (2) | | 1,228 |
| | 53 |
| | 1,281 |
|
| Trial modifications | 1,101 |
| | 17 |
| | 1,118 |
| 2,351 |
| | 20 |
| | 2,371 |
|
| Total modifications | $ | 3,551 |
| | $ | 61 |
| | $ | 3,612 |
| $ | 4,723 |
| | $ | 95 |
| | $ | 4,818 |
|
| |
(1) | Total carrying value includes loans with a carrying value of $2.42.0 billion, $667 million2.4 billion and $514667 million that entered into payment default during 20132014, 20122013 and 20112012 but were no longer held by the Corporation as of December 31, 2014, 2013 2012 and 20112012 due to sales and other dispositions. |
| |
(2) | Includes loans discharged in Chapter 7 bankruptcy with no change in repayment terms that are classified as TDRs. |
Credit Card and Other Consumer
Impaired loans within the Credit Card and Other Consumer portfolio segment consist entirely of loans that have been modified in TDRs (the renegotiated credit card and other consumer TDR portfolio, collectively referred to as the renegotiated TDR portfolio). The Corporation seeks to assist customers that are experiencing financial difficulty by modifying loans while ensuring compliance with federal, local and international laws and guidelines. Credit card and other consumer loan modifications generally involve reducing the interest rate on the account and placing the customer on a fixed payment plan not exceeding 60 months, all of which are considered TDRs. In addition, the accounts of non-U.S. credit card modifications may involve reducing the interest rate on the account without placing the customer oncustomers who do not qualify for a fixed payment plan andmay have their interest rates reduced, as required by certain local jurisdictions. These modifications, which are also considered TDRs.TDRs, tend to experience higher payment default rates given that the borrowers may lack the ability to repay even with the interest rate reduction. In all cases, the customer’s available line of credit is canceled. The Corporation makes loan modifications directly with borrowers for debt held only by the Corporation (internal programs). Additionally, the Corporation makes loan modifications for borrowers working with third-party renegotiation agencies that provide solutions to customers’ entire unsecured debt structures (external programs). The Corporation classifies other secured
consumer loans that have been discharged in Chapter 7 bankruptcy as TDRs which are written
down to collateral value and placed on nonaccrual status no later than the time of discharge. For more information on the regulatory guidance on loans discharged in Chapter 7 bankruptcy, see Nonperforming Loans and Leases in this Note.
All credit card and substantially all other consumer loans that have been modified in TDRs remain on accrual status until the loan is either paid in full or charged off, which occurs no later than the end of the month in which the loan becomes 180 days past due or generally at 120 days past due for a loan that was placed on a fixed payment plan after July 1, 2012.
The allowance for impaired credit card and substantially all other consumer loans is based on the present value of projected cash flows, which incorporates the Corporation’s historical payment default and loss experience on modified loans, discounted using the portfolio’s average contractual interest rate, excluding promotionally priced loans, in effect prior to restructuring. Credit card and other consumer loans are included in homogeneous pools which are collectively evaluated for impairment. For these portfolios, loss forecast models are utilized that consider a variety of factors including, but not limited to, historical loss experience, delinquency status, economic trends and credit scores.
|
| | |
| | | Bank of America 20132014 193184 |
The table below provides informationthe unpaid principal balance, carrying value and related allowance at December 31, 2014 and 2013, and the average carrying value and interest income recognized for 2014, 2013 and 2012 on the Corporation’s renegotiated TDR portfolio in the Credit Card and Other Consumer portfolio segment at December 31, 2013 and 2012, and for 2013, 2012 and 2011.segment.
| | | | | | | | | | | | | | | | | | | | | | | | | |
| Impaired Loans – Credit Card and Other Consumer – Renegotiated TDRs | Impaired Loans – Credit Card and Other Consumer – Renegotiated TDRs | | | Impaired Loans – Credit Card and Other Consumer – Renegotiated TDRs | | |
| | | | | | | | | | | |
| | December 31, 2013 | | December 31, 2012 | December 31, 2014 | | December 31, 2013 |
| (Dollars in millions) | Unpaid
Principal Balance | | Carrying Value (1) | | Related Allowance | | Unpaid
Principal Balance | | Carrying Value (1) | | Related Allowance | Unpaid
Principal Balance | | Carrying Value (1) | | Related Allowance | | Unpaid
Principal Balance | | Carrying Value (1) | | Related Allowance |
| With no recorded allowance | | |
| | |
| | |
| | | | | | |
| Direct/Indirect consumer | | $ | 59 |
| | $ | 25 |
| | $ | — |
| | $ | 75 |
| | $ | 32 |
| | $ | — |
|
| Other consumer | | — |
| | — |
| | — |
| | 34 |
| | 34 |
| | — |
|
| With an allowance recorded | |
| | |
| | |
| | |
| | |
| | | |
| | |
| | |
| | |
| | |
| | |
| U.S. credit card | $ | 1,384 |
| | $ | 1,465 |
| | $ | 337 |
| | $ | 2,856 |
| | $ | 2,871 |
| | $ | 719 |
| $ | 804 |
| | $ | 856 |
| | $ | 207 |
| | $ | 1,384 |
| | $ | 1,465 |
| | $ | 337 |
|
| Non-U.S. credit card | 200 |
| | 240 |
| | 149 |
| | 311 |
| | 316 |
| | 198 |
| 132 |
| | 168 |
| | 108 |
| | 200 |
| | 240 |
| | 149 |
|
| Direct/Indirect consumer | 242 |
| | 282 |
| | 84 |
| | 633 |
| | 636 |
| | 210 |
| |
| Other consumer | 27 |
| | 26 |
| | 9 |
| | 30 |
| | 30 |
| | 12 |
| |
| With no recorded allowance | |
| | |
| | |
| | | | | | | |
| Direct/Indirect consumer | 75 |
| | 32 |
| | — |
| | 105 |
| | 58 |
| | — |
| 76 |
| | 92 |
| | 24 |
| | 242 |
| | 282 |
| | 84 |
|
| Other consumer | 34 |
| | 34 |
| | — |
| | 35 |
| | 35 |
| | — |
| — |
| | — |
| | — |
| | 27 |
| | 26 |
| | 9 |
|
| Total | |
| | |
| | |
| | | | | | | |
| | |
| | |
| | | | | | |
| U.S. credit card | $ | 1,384 |
| | $ | 1,465 |
| | $ | 337 |
| | $ | 2,856 |
| | $ | 2,871 |
| | $ | 719 |
| $ | 804 |
| | $ | 856 |
| | $ | 207 |
| | $ | 1,384 |
| | $ | 1,465 |
| | $ | 337 |
|
| Non-U.S. credit card | 200 |
| | 240 |
| | 149 |
| | 311 |
| | 316 |
| | 198 |
| 132 |
| | 168 |
| | 108 |
| | 200 |
| | 240 |
| | 149 |
|
| Direct/Indirect consumer | 317 |
| | 314 |
| | 84 |
| | 738 |
| | 694 |
| | 210 |
| 135 |
| | 117 |
| | 24 |
| | 317 |
| | 314 |
| | 84 |
|
| Other consumer | 61 |
| | 60 |
| | 9 |
| | 65 |
| | 65 |
| | 12 |
| — |
| | — |
| | — |
| | 61 |
| | 60 |
| | 9 |
|
| | | | | | | | | | | | | | | | | | | | | | | |
| | 2013 | | 2012 | | 2011 | 2014 | | 2013 | | 2012 |
| | Average
Carrying
Value | | Interest
Income
Recognized (2) | | Average
Carrying
Value | | Interest
Income
Recognized (2) | | Average
Carrying
Value | | Interest
Income
Recognized (2) | Average
Carrying
Value | | Interest
Income
Recognized (2) | | Average
Carrying
Value | | Interest
Income
Recognized (2) | | Average
Carrying
Value | | Interest
Income
Recognized (2) |
| With no recorded allowance | | | | | | | | | | | | |
| Direct/Indirect consumer | | $ | 27 |
| | $ | — |
| | $ | 42 |
| | $ | — |
| | $ | 58 |
| | $ | — |
|
| Other consumer | | 33 |
| | 2 |
| | 34 |
| | 2 |
| | 35 |
| | 2 |
|
| With an allowance recorded | |
| | |
| | | | | | | | | |
| | |
| | | | | | | | |
| U.S. credit card | $ | 2,144 |
| | $ | 134 |
| | $ | 4,085 |
| | $ | 253 |
| | $ | 7,211 |
| | $ | 433 |
| $ | 1,148 |
| | $ | 71 |
| | $ | 2,144 |
| | $ | 134 |
| | $ | 4,085 |
| | $ | 253 |
|
| Non-U.S. credit card | 266 |
| | 7 |
| | 464 |
| | 10 |
| | 759 |
| | 6 |
| 210 |
| | 6 |
| | 266 |
| | 7 |
| | 464 |
| | 10 |
|
| Direct/Indirect consumer | 456 |
| | 24 |
| | 929 |
| | 50 |
| | 1,582 |
| | 85 |
| |
| Other consumer | 28 |
| | 2 |
| | 29 |
| | 2 |
| | 30 |
| | 2 |
| |
| With no recorded allowance | |
| | |
| | | | | | | | | |
| Direct/Indirect consumer | 42 |
| | — |
| | 58 |
| | — |
| | — |
| | — |
| 180 |
| | 9 |
| | 456 |
| | 24 |
| | 929 |
| | 50 |
|
| Other consumer | 34 |
| | 2 |
| | 35 |
| | 2 |
| | 30 |
| | 2 |
| 23 |
| | 1 |
| | 28 |
| | 2 |
| | 29 |
| | 2 |
|
| Total | |
| | |
| | | | | | | | | |
| | |
| | | | | | | | |
| U.S. credit card | $ | 2,144 |
| | $ | 134 |
| | $ | 4,085 |
| | $ | 253 |
| | $ | 7,211 |
| | $ | 433 |
| $ | 1,148 |
| | $ | 71 |
| | $ | 2,144 |
| | $ | 134 |
| | $ | 4,085 |
| | $ | 253 |
|
| Non-U.S. credit card | 266 |
| | 7 |
| | 464 |
| | 10 |
| | 759 |
| | 6 |
| 210 |
| | 6 |
| | 266 |
| | 7 |
| | 464 |
| | 10 |
|
| Direct/Indirect consumer | 498 |
| | 24 |
| | 987 |
| | 50 |
| | 1,582 |
| | 85 |
| 207 |
| | 9 |
| | 498 |
| | 24 |
| | 987 |
| | 50 |
|
| Other consumer | 62 |
| | 4 |
| | 64 |
| | 4 |
| | 60 |
| | 4 |
| 56 |
| | 3 |
| | 62 |
| | 4 |
| | 64 |
| | 4 |
|
| |
(1) | Includes accrued interest and fees. |
| |
(2) | Interest income recognized includes interest accrued and collected on the outstanding balances of accruing impaired loans as well as interest cash collections on nonaccruing impaired loans for which the principal is considered collectible. |
The table below provides information on the Corporation’s primary modification programs for the renegotiated TDR portfolio at December 31, 20132014 and 20122013.
| | | | | | | | | | | | | | | | | | | | | | | | | | | | | | | | | | | | | | | | | |
Credit Card and Other Consumer – Renegotiated TDRs by Program Type | | | | | | | | | | | | | | | | | | | | |
| | December 31 | December 31 |
| | Internal Programs | | External Programs | | Other | | Total | | Percent of Balances Current or Less Than 30 Days Past Due | Internal Programs | | External Programs | | Other (1) | | Total | | Percent of Balances Current or Less Than 30 Days Past Due |
| (Dollars in millions) | 2013 | | 2012 | | 2013 | | 2012 | | 2013 | | 2012 | | 2013 | | 2012 | | 2013 | | 2012 | 2014 | | 2013 | | 2014 | | 2013 | | 2014 | | 2013 | | 2014 | | 2013 | | 2014 | | 2013 |
| U.S. credit card | $ | 842 |
| | $ | 1,887 |
| | $ | 607 |
| | $ | 953 |
| | $ | 16 |
| | $ | 31 |
| | $ | 1,465 |
| | $ | 2,871 |
| | 82.77 | % | | 81.48 | % | $ | 450 |
| | $ | 842 |
| | $ | 397 |
| | $ | 607 |
| | $ | 9 |
| | $ | 16 |
| | $ | 856 |
| | $ | 1,465 |
| | 84.99 | % | | 82.77 | % |
| Non-U.S. credit card | 71 |
| | 99 |
| | 26 |
| | 38 |
| | 143 |
| | 179 |
| | 240 |
| | 316 |
| | 49.01 |
| | 43.71 |
| 41 |
| | 71 |
| | 16 |
| | 26 |
| | 111 |
| | 143 |
| | 168 |
| | 240 |
| | 47.56 |
| | 49.01 |
|
| Direct/Indirect consumer | 170 |
| | 405 |
| | 106 |
| | 225 |
| | 38 |
| | 64 |
| | 314 |
| | 694 |
| | 84.29 |
| | 83.11 |
| 50 |
| | 170 |
| | 34 |
| | 106 |
| | 33 |
| | 38 |
| | 117 |
| | 314 |
| | 85.21 |
| | 84.29 |
|
| Other consumer | 60 |
| | 65 |
| | — |
| | — |
| | — |
| | — |
| | 60 |
| | 65 |
| | 71.08 |
| | 72.73 |
| — |
| | 60 |
| | — |
| | — |
| | — |
| | — |
| | — |
| | 60 |
| | — |
| | 71.08 |
|
| Total renegotiated TDRs | $ | 1,143 |
| | $ | 2,456 |
| | $ | 739 |
| | $ | 1,216 |
| | $ | 197 |
| | $ | 274 |
| | $ | 2,079 |
| | $ | 3,946 |
| | 78.77 |
| | 78.58 |
| $ | 541 |
| | $ | 1,143 |
| | $ | 447 |
| | $ | 739 |
| | $ | 153 |
| | $ | 197 |
| | $ | 1,141 |
| | $ | 2,079 |
| | 79.51 |
| | 78.77 |
|
| |
(1) | Other TDRs for non-U.S. credit card include modifications of accounts that are ineligible for a fixed payment plan. |
|
| | |
194185 Bank of America 20132014
| | |
The table below provides information on the Corporation’s renegotiated TDR portfolio including the December 31, 2014, 2013 2012 and 20112012 unpaid principal balance, carrying value and average pre- and post-modification interest rates of loans that were modified in TDRs during 20132014, 20122013 and 2011,2012, and net charge-offs that were recorded during the period in which the modification occurred.
| | | | | | | | | | | | | | | | | | | | | |
| Credit Card and Other Consumer – Renegotiated TDRs Entered into During 2013, 2012 and 2011 | |
| Credit Card and Other Consumer – Renegotiated TDRs Entered into During 2014, 2013 and 2012 | | Credit Card and Other Consumer – Renegotiated TDRs Entered into During 2014, 2013 and 2012 |
| | | |
| | December 31, 2013 | | 2013 | December 31, 2014 | | 2014 |
| (Dollars in millions) | Unpaid Principal Balance | | Carrying Value (1) | | Pre-Modification Interest Rate | | Post-Modification Interest Rate | | Net Charge-offs | Unpaid Principal Balance | | Carrying Value (1) | | Pre-Modification Interest Rate | | Post-Modification Interest Rate | | Net Charge-offs |
| U.S. credit card | $ | 299 |
| | $ | 329 |
| | 16.84 | % | | 5.84 | % | | $ | 30 |
| $ | 276 |
| | $ | 301 |
| | 16.64 | % | | 5.15 | % | | $ | 37 |
|
| Non-U.S. credit card | 134 |
| | 147 |
| | 25.90 |
| | 0.95 |
| | 138 |
| 91 |
| | 106 |
| | 24.90 |
| | 0.68 |
| | 91 |
|
| Direct/Indirect consumer | 47 |
| | 38 |
| | 11.53 |
| | 4.74 |
| | 15 |
| 27 |
| | 19 |
| | 8.66 |
| | 4.90 |
| | 14 |
|
| Other consumer | 8 |
| | 8 |
| | 9.28 |
| | 5.25 |
| | — |
| |
| Total | $ | 488 |
| | $ | 522 |
| | 18.89 |
| | 4.37 |
| | $ | 183 |
| $ | 394 |
| | $ | 426 |
| | 18.32 |
| | 4.03 |
| | $ | 142 |
|
| | | | | | | | | | | | | | | | | | | |
| | December 31, 2012 | | 2012 | December 31, 2013 | | 2013 |
| U.S. credit card | $ | 396 |
| | $ | 400 |
| | 17.59 | % | | 6.36 | % | | $ | 45 |
| $ | 299 |
| | $ | 329 |
| | 16.84 | % | | 5.84 | % | | $ | 30 |
|
| Non-U.S. credit card | 196 |
| | 206 |
| | 26.19 |
| | 1.15 |
| | 190 |
| 134 |
| | 147 |
| | 25.90 |
| | 0.95 |
| | 138 |
|
| Direct/Indirect consumer | 160 |
| | 113 |
| | 9.59 |
| | 5.72 |
| | 52 |
| 47 |
| | 38 |
| | 11.53 |
| | 4.74 |
| | 15 |
|
| Other consumer | 9 |
| | 9 |
| | 9.97 |
| | 6.44 |
| | — |
| 8 |
| | 8 |
| | 9.28 |
| | 5.25 |
| | — |
|
| Total | $ | 761 |
| | $ | 728 |
| | 18.68 |
| | 4.79 |
| | $ | 287 |
| $ | 488 |
| | $ | 522 |
| | 18.89 |
| | 4.37 |
| | $ | 183 |
|
| | | | | | | | | | | | | | | | | | | |
| | December 31, 2011 | | 2011 | December 31, 2012 | | 2012 |
| U.S. credit card | $ | 890 |
| | $ | 902 |
| | 19.04 | % | | 6.16 | % | | $ | 106 |
| $ | 396 |
| | $ | 400 |
| | 17.59 | % | | 6.36 | % | | $ | 45 |
|
| Non-U.S. credit card | 305 |
| | 322 |
| | 26.32 |
| | 1.04 |
| | 291 |
| 196 |
| | 206 |
| | 26.19 |
| | 1.15 |
| | 190 |
|
| Direct/Indirect consumer | 198 |
| | 199 |
| | 15.63 |
| | 5.22 |
| | 23 |
| 160 |
| | 113 |
| | 9.59 |
| | 5.72 |
| | 52 |
|
| Other consumer | 17 |
| | 17 |
| | 10.01 |
| | 6.53 |
| | — |
| 9 |
| | 9 |
| | 9.97 |
| | 6.44 |
| | — |
|
| Total | $ | 1,410 |
| | $ | 1,440 |
| | 20.09 |
| | 4.89 |
| | $ | 420 |
| $ | 761 |
| | $ | 728 |
| | 18.68 |
| | 4.79 |
| | $ | 287 |
|
| |
(1) | Includes accrued interest and fees. |
The table below provides information on the Corporation’s primary modification programs for the renegotiated TDR portfolio for loans that were modified in TDRs during 20132014, 20122013 and 2011.2012.
| | | | | | | | | | | | | | | | | |
Credit Card and Other Consumer – Renegotiated TDRs Entered into During the Period by Program Type | | | | |
| | 2013 | 2014 |
| (Dollars in millions) | Internal Programs | | External Programs | | Other | | Total | Internal Programs | | External Programs | | Other (1) | | Total |
| U.S. credit card | $ | 192 |
| | $ | 137 |
| | $ | — |
| | $ | 329 |
| $ | 196 |
| | $ | 105 |
| | $ | — |
| | $ | 301 |
|
| Non-U.S. credit card | 73 |
| | 74 |
| | — |
| | 147 |
| 6 |
| | 6 |
| | 94 |
| | 106 |
|
| Direct/Indirect consumer | 15 |
| | 8 |
| | 15 |
| | 38 |
| 4 |
| | 2 |
| | 13 |
| | 19 |
|
| Other consumer | 8 |
| | — |
| | — |
| | 8 |
| |
| Total renegotiated TDRs | $ | 288 |
| | $ | 219 |
| | $ | 15 |
| | $ | 522 |
| $ | 206 |
| | $ | 113 |
| | $ | 107 |
| | $ | 426 |
|
| | | | | | | | | | | | | | | |
| | 2012 | 2013 |
| U.S. credit card | $ | 248 |
| | $ | 152 |
| | $ | — |
| | $ | 400 |
| $ | 192 |
| | $ | 137 |
| | $ | — |
| | $ | 329 |
|
| Non-U.S. credit card | 112 |
| | 94 |
| | — |
| | 206 |
| 16 |
| | 9 |
| | 122 |
| | 147 |
|
| Direct/Indirect consumer | 36 |
| | 19 |
| | 58 |
| | 113 |
| 15 |
| | 8 |
| | 15 |
| | 38 |
|
| Other consumer | 9 |
| | — |
| | — |
| | 9 |
| 8 |
| | — |
| | — |
| | 8 |
|
| Total renegotiated TDRs | $ | 405 |
| | $ | 265 |
| | $ | 58 |
| | $ | 728 |
| $ | 231 |
| | $ | 154 |
| | $ | 137 |
| | $ | 522 |
|
| | | | | | | | | | | | | | | |
| | 2011 | 2012 |
| U.S. credit card | $ | 492 |
| | $ | 407 |
| | $ | 3 |
| | $ | 902 |
| $ | 248 |
| | $ | 152 |
| | $ | — |
| | $ | 400 |
|
| Non-U.S. credit card | 163 |
| | 158 |
| | 1 |
| | 322 |
| 38 |
| | 14 |
| | 154 |
| | 206 |
|
| Direct/Indirect consumer | 112 |
| | 87 |
| | — |
| | 199 |
| 36 |
| | 19 |
| | 58 |
| | 113 |
|
| Other consumer | 17 |
| | — |
| | — |
| | 17 |
| 9 |
| | — |
| | — |
| | 9 |
|
| Total renegotiated TDRs | $ | 784 |
| | $ | 652 |
| | $ | 4 |
| | $ | 1,440 |
| $ | 331 |
| | $ | 185 |
| | $ | 212 |
| | $ | 728 |
|
| |
(1) | Other TDRs for non-U.S. credit card include modifications of accounts that are ineligible for a fixed payment plan. |
|
| | |
| | | Bank of America 20132014 195186 |
Credit card and other consumer loans are deemed to be in payment default during the quarter in which a borrower misses the second of two consecutive payments. Payment defaults are one of the factors considered when projecting future cash flows in the calculation of the allowance for loan and lease losses for impaired credit card and other consumer loans. Based on historical experience, the Corporation estimates that 2114 percent of new U.S. credit card TDRs, 7081 percent of new non-U.S. credit card TDRs and 1312 percent of new direct/indirect consumer TDRs may be in payment default within 12 months after modification. Loans that entered into payment default during 20132014, 20122013 and 20112012 that had been modified in a TDR during the preceding 12 months were $56 million, $61 million $203 million and $863$203 million for U.S. credit card, $200 million, $236 million $298 million and $409$298 million for non-U.S. credit card, and $125 million, $3512 million and $180$35 million for direct/indirect consumer, respectively.
CommercialPurchased Credit-impaired Loans
ImpairedThe Corporation purchases loans with and without evidence of credit quality deterioration since origination. Evidence of credit quality deterioration as of the purchase date may include statistics such as past due status, refreshed borrower credit scores and refreshed loan-to-value (LTV) ratios, some of which are not immediately available as of the purchase date. Purchased loans with evidence of credit quality deterioration for which it is probable that the Corporation will not receive all contractually required payments receivable are accounted for as purchased credit- impaired (PCI) loans. The excess of the cash flows expected to be collected on PCI loans, measured as of the acquisition date, over the estimated fair value is referred to as the accretable yield and is recognized in interest income over the remaining life of the loan using a level yield methodology. The difference between contractually required payments as of the acquisition date and the cash flows expected to be collected is referred to as the nonaccretable difference. PCI loans that have similar risk characteristics, primarily credit risk, collateral type and interest rate risk, are pooled and accounted for as a single asset with a single composite interest rate and an aggregate expectation of cash flows. Once a pool is assembled, it is treated as if it was one loan for purposes of applying the accounting guidance for PCI loans. An individual loan is removed from a PCI loan pool if it is sold, foreclosed, forgiven or the expectation of any future proceeds is remote. When a loan is removed from a PCI loan pool and the foreclosure or recovery value of the loan is less than the loan’s carrying value, the difference is first applied against the PCI pool’s nonaccretable difference. If the nonaccretable difference has been fully utilized, only then is the PCI pool’s basis applicable to that loan written-off against its valuation reserve; however, the integrity of the pool is maintained and it continues to be accounted for as if it was one loan.
The Corporation continues to estimate cash flows expected to be collected over the life of the PCI loans using internal credit risk, interest rate and prepayment risk models that incorporate management’s best estimate of current key assumptions such as default rates, loss severity and prepayment speeds. If, upon subsequent evaluation, the Corporation determines it is probable that the present value of the expected cash flows has decreased, the PCI loan is considered to be further impaired resulting in a charge to the provision for credit losses and a corresponding increase to a valuation allowance included in the allowance for loan and lease losses. The present value of the expected cash flows is then recalculated each period, which may result in additional impairment or a reduction of the valuation allowance. If there is no valuation allowance and it is probable that there is a significant increase in the present value of the expected cash flows, the Corporation recalculates the amount of accretable yield as the excess of the revised expected cash flows over the current carrying value resulting in a reclassification from nonaccretable difference to accretable yield. Reclassifications from nonaccretable difference can also occur if there is a change in the expected lives of the loans. The present value of the expected cash flows is determined using the PCI loans’ effective interest rate, adjusted for changes in the PCI loans’ interest rate indices.
Leases
The Corporation provides equipment financing to its customers through a variety of lease arrangements. Direct financing leases are carried at the aggregate of lease payments receivable plus estimated residual value of the leased property less unearned income. Leveraged leases, which are a form of financing leases, are reported net of non-recourse debt. Unearned income on leveraged and direct financing leases is accreted to interest income over the lease terms using methods that approximate the interest method.
Allowance for Credit Losses
The allowance for credit losses, which includes the allowance for loan and lease losses and the reserve for unfunded lending commitments, represents management’s estimate of probable losses inherent in the Corporation’s lending activities. The allowance for loan and lease losses and the reserve for unfunded lending commitments exclude amounts for loans and unfunded lending commitments accounted for under the fair value option as the fair values of these instruments reflect a credit component. The allowance for loan and lease losses does not include amounts related to accrued interest receivable, other than billed interest and fees on credit card receivables, as accrued interest receivable is reversed when a loan is placed on nonaccrual status. The allowance for loan and lease losses represents the estimated probable credit losses on funded consumer and commercial loans and leases while the reserve for unfunded lending commitments, including standby letters of credit and binding unfunded loan commitments, represents estimated probable credit losses on these unfunded credit instruments based on utilization assumptions. Lending-related credit exposures deemed to be uncollectible, excluding loans carried at fair value, are charged off against these accounts. Write-offs on PCI loans on which there is a valuation allowance are written-off against the valuation allowance. For additional information, see Purchased Credit-impaired Loans in this Note. Cash recovered on previously charged-off amounts is recorded as a recovery to these accounts.
Management evaluates the adequacy of the allowance for credit losses based on the combined total of the allowance for loan and lease losses and the reserve for unfunded lending commitments.
The Corporation performs periodic and systematic detailed reviews of its lending portfolios to identify credit risks and to assess the overall collectability of those portfolios. The allowance on certain homogeneous consumer loan portfolios, which generally consist of consumer real estate within the Home Loans portfolio segment and credit card loans within the Credit Card and Other Consumer portfolio segment, is based on aggregated portfolio segment evaluations generally by product type. Loss forecast models are utilized for these portfolios which consider a variety of factors including, but not limited to, historical loss experience, estimated defaults or foreclosures based on portfolio trends, delinquencies, bankruptcies, economic conditions and credit scores.
The Corporation’s Home Loans portfolio segment is comprised primarily of large groups of homogeneous consumer loans secured by residential real estate. The amount of losses incurred in the homogeneous loan pools is estimated based on the number of loans that will default and the loss in the event of default. Using modeling methodologies, the Corporation estimates the number of homogeneous loans that will default based on the individual loans’ attributes aggregated into pools of homogeneous loans with similar attributes. The attributes that are most significant to the probability of default and are used to estimate defaults include refreshed LTV or, in the case of a subordinated lien, refreshed combined LTV, borrower credit score, months since origination (referred to as vintage) and geography, all of which are further broken down by present collection status (whether the loan is current, delinquent, in default or in bankruptcy). This estimate is based on the Corporation’s historical experience with the loan portfolio. The estimate is adjusted to reflect an assessment of environmental factors not yet reflected in the historical data underlying the loss estimates, such as changes in real estate values, local and national economies, underwriting standards and the regulatory environment. The probability of default on a loan is based on an analysis of the movement of loans with the measured attributes from either current or any of the delinquency categories to default over a 12-month period. On home equity loans where the Corporation holds only a second-lien position and foreclosure is not the best alternative, the loss severity is estimated at 100 percent.
The allowance on certain commercial loans (except business card and certain small business loans) is calculated using loss rates delineated by risk rating and product type. Factors considered when assessing loss rates include the value of the underlying collateral, if applicable, the industry of the obligor, and the obligor’s liquidity and other financial indicators along with certain qualitative factors. These statistical models are updated regularly for changes in economic and business conditions. Included in the analysis of consumer and commercial loan portfolios are reserves which are maintained to cover uncertainties that affect the Corporation’s estimate of probable losses including domestic and global economic uncertainty and large single-name defaults.
The remaining portfolios, including nonperforming commercial loans, as well as consumer and commercial loans modified in a troubled debt restructuring (TDR), are reviewed in accordance with applicable accounting guidance on impaired loans and TDRs (both performingTDRs. If necessary, a specific allowance is established for these loans if they are deemed to be impaired. A loan is considered impaired when, based on current information and nonperforming), are primarily measured basedevents, it is probable that
the Corporation will be unable to collect all amounts due, including principal and/or interest, in accordance with the contractual terms of the agreement, or the loan has been modified in a TDR. Once a loan has been identified as impaired, management measures impairment primarily based on the present value of payments expected to be received, discounted at the loan’sloans’ original effective contractual interest rate. Commercial impairedrates, or discounted at the portfolio average contractual annual percentage rate, excluding promotionally priced loans, in effect prior to restructuring. Impaired loans and TDRs may also be measured based on observable market prices, or for loans that are solely dependent on the collateral for repayment, the estimated fair value of the collateral less costs to sell. If the recorded investment in impaired loans exceeds this amount, a specific allowance is established as a component of the allowance for loan and lease losses unless these are secured consumer loans that are solely dependent on the collateral for repayment, in which case the amount that exceeds the fair value of the collateral is charged off.
Generally, when determining the fair value of the collateral securing consumer real estate-secured loans that are solely dependent on the collateral for repayment, prior to performing a detailed property valuation including a walk-through of a property, the Corporation initially estimates the fair value of the collateral securing these consumer loans using an automated valuation method (AVM). An AVM is a tool that estimates the value of a property by reference to market data including sales of comparable properties and price trends specific to the Metropolitan Statistical Area in which the property being valued is located. In the event that an AVM value is not available, the Corporation utilizes publicized indices or if these methods provide less reliable valuations, the Corporation uses appraisals or broker price opinions to estimate the fair value of the collateral. While there is inherent imprecision in these valuations, the Corporation believes that they are representative of the portfolio in the aggregate.
In addition to the allowance for loan and lease losses, the Corporation also estimates probable losses related to unfunded lending commitments, such as letters of credit and financial guarantees, and binding unfunded loan commitments. The reserve for unfunded lending commitments excludes commitments accounted for under the fair value option. Unfunded lending commitments are subject to individual reviews and are analyzed and segregated by risk according to the Corporation’s internal risk rating scale. These risk classifications, in conjunction with an analysis of historical loss experience, utilization assumptions, current economic conditions, performance trends within the portfolio and any other pertinent information, result in the estimation of the reserve for unfunded lending commitments.
The allowance for credit losses related to the loan and lease portfolio is reported separately on the Consolidated Balance Sheet whereas the reserve for unfunded lending commitments is reported on the Consolidated Balance Sheet in accrued expenses and other liabilities. The provision for credit losses related to the loan and lease portfolio and unfunded lending commitments is reported in the Consolidated Statement of Income.
Nonperforming Loans and Leases, Charge-offs and Delinquencies
Nonperforming loans and leases generally include loans and leases that have been placed on nonaccrual status, including nonaccruing loans whose contractual terms have been restructured in a manner that grants a concession to a borrower
experiencing financial difficulties. Loans accounted for under the fair value option, PCI loans and LHFS are not reported as nonperforming.
In accordance with the Corporation’s policies, consumer real estate-secured loans, including residential mortgages and home equity loans, are generally placed on nonaccrual status and classified as nonperforming at 90 days past due unless repayment of the loan is insured by the Federal Housing Administration or through individually insured long-term standby agreements with Fannie Mae or Freddie Mac (the fully-insured portfolio). Residential mortgage loans in the fully-insured portfolio are not placed on nonaccrual status and, therefore, are not reported as nonperforming. Junior-lien home equity loans are placed on nonaccrual status and classified as nonperforming when the underlying first-lien mortgage loan becomes 90 days past due even if the junior-lien loan is current. Accrued interest receivable is reversed when a consumer loan is placed on nonaccrual status. Interest collections on nonaccruing consumer loans for which the ultimate collectability of principal is uncertain are generally applied as principal reductions; otherwise, such collections are credited to interest income when received. These loans may be restored to accrual status when all principal and interest is current and full repayment of the remaining contractual principal and interest is expected, or when the loan otherwise becomes well-secured and is in the process of collection. The outstanding balance of real estate-secured loans that is in excess of the estimated property value less costs to sell is charged off no later than the end of the month in which the loan becomes 180 days past due unless the loan is fully insured. The estimated property value less costs to sell is determined using the same process as described for impaired loans in Allowance for Credit Losses in this Note.
Consumer loans secured by personal property, credit card loans and other unsecured consumer loans are not placed on nonaccrual status prior to charge-off and, therefore, are not reported as nonperforming loans, except for certain secured consumer loans, including those that have been modified in a TDR. Personal property-secured loans are charged off to collateral value no later than the end of the month in which the account becomes 120 days past due or, for loans in bankruptcy, 60 days past due. Credit card and other unsecured consumer loans are charged off no later than the end of the month in which the account becomes 180 days past due or within 60 days after receipt of notification of death or bankruptcy.
Commercial loans and leases, excluding business card loans, that are past due 90 days or more as to principal or interest, or where reasonable doubt exists as to timely collection, including loans that are individually identified as being impaired, are generally placed on nonaccrual status and classified as nonperforming unless well-secured and in the process of collection.
Accrued interest receivable is reversed when commercial loans and leases are placed on nonaccrual status. Interest collections on nonaccruing commercial loans and leases for which the ultimate collectability of principal is uncertain are applied as principal reductions; otherwise, such collections are credited to income when received. Commercial loans and leases may be restored to accrual status when all principal and interest is current and full repayment of the remaining contractual principal and interest is expected, or when the loan otherwise becomes well-secured and is in the process of collection. Business card loans are charged off no later than the end of the month in which the
account becomes 180 days past due or 60 days after receipt of notification of death or bankruptcy. These loans are not placed on nonaccrual status prior to charge-off and, therefore, are not reported as nonperforming loans. Other commercial loans and leases are generally charged off when all or a portion of the principal amount is determined to be uncollectible.
The entire balance of a consumer loan or commercial loan or lease is contractually delinquent if the minimum payment is not received by the specified due date on the customer’s billing statement. Interest and fees continue to accrue on past due loans and leases until the date the loan is placed on nonaccrual status, if applicable.
PCI loans are recorded at fair value at the acquisition date. Although the PCI loans may be contractually delinquent, the Corporation does not classify these loans as nonperforming as the loans were written down to fair value at the acquisition date and the accretable yield is recognized in interest income over the remaining life of the loan. In addition, reported net charge-offs exclude write-offs on PCI loans as the fair value already considers the estimated credit losses.
Troubled Debt Restructurings
Consumer loans and commercial loans and leases whose contractual terms have been restructured in a manner that grants a concession to a borrower experiencing financial difficulties are classified as TDRs. Concessions could include a reduction in the interest rate to a rate that is below market on the loan, payment extensions, forgiveness of principal, forbearance or other actions designed to maximize collections. Secured consumer loans that have been discharged in Chapter 7 bankruptcy and have not been reaffirmed by the borrower are classified as TDRs at the time of discharge. Consumer real estate-secured loans for which a binding offer to restructure has been extended are also classified as TDRs. Loans classified as TDRs are considered impaired loans. Loans that are carried at fair value, LHFS and PCI loans are not classified as TDRs.
Secured consumer loans whose contractual terms have been modified in a TDR and are current at the time of restructuring generally remain on accrual status if there is demonstrated performance prior to the restructuring and payment in full under the restructured terms is expected. Otherwise, the loans are placed on nonaccrual status and reported as nonperforming, except for the fully-insured loans, until there is sustained repayment performance for a reasonable period, generally six months. If accruing consumer TDRs cease to perform in accordance with their modified contractual terms, they are placed on nonaccrual status and reported as nonperforming TDRs. Consumer TDRs that bear a below-market rate of interest are generally reported as TDRs throughout their remaining lives. Secured consumer loans that have been discharged in Chapter 7 bankruptcy are placed on nonaccrual status and written down to the estimated collateral value less costs to sell no later than at the time of discharge. If these loans are contractually current, interest collections are generally recorded in interest income on a cash basis. Credit card and other unsecured consumer loans that have been renegotiated in a TDR are not placed on nonaccrual status. Credit card and other unsecured consumer loans that have been renegotiated and placed on a fixed payment plan after July 1, 2012 are generally charged off no later than the end of the month in which the account becomes 120 days past due.
Commercial loans and leases whose contractual terms have been modified in a TDR are typically placed on nonaccrual status and reported as nonperforming until the loans or leases have performed for an adequate period of time under the restructured agreement, generally six months. If the borrower had demonstrated performance under the previous terms and the underwriting process shows the capacity to continue to perform under the modified terms, the loan may remain on accrual status. Accruing commercial TDRs are reported as performing TDRs through the end of the calendar year in which the loans are returned to accrual status. In addition, if accruing commercial TDRs bear less than a market rate of interest at the time of modification, they are reported as performing TDRs throughout their remaining lives unless and until they cease to perform in accordance with their modified contractual terms, at which time they are placed on nonaccrual status and reported as nonperforming TDRs.
A loan that had previously been modified in a TDR and is subsequently refinanced under current underwriting standards at a market rate with no concessionary terms is accounted for as a new loan and is no longer reported as a TDR.
Loans Held-for-sale
Loans that are intended to be sold in the foreseeable future, including residential mortgages, loan syndications, and to a lesser degree, commercial real estate, consumer finance and other loans, are reported as LHFS and are carried at the lower of aggregate cost or fair value. The Corporation accounts for certain LHFS, including residential mortgage LHFS, under the fair value option. Loan origination costs related to LHFS that the Corporation accounts for under the fair value option are recognized in noninterest expense when incurred. Loan origination costs for LHFS carried at the lower of cost or fair value are capitalized as part of the carrying value of the loans and recognized as a reduction of noninterest income upon the sale of such loans. LHFS that are on nonaccrual status and are reported as nonperforming, as defined in the policy herein, are reported separately from nonperforming loans and leases.
Premises and Equipment
Premises and equipment are carried at cost less accumulated depreciation and amortization. Depreciation and amortization are recognized using the straight-line method over the estimated useful lives of the assets. Estimated lives range up to 40 years for buildings, up to 12 years for furniture and equipment, and the shorter of lease term or estimated useful life for leasehold improvements.
The Corporation capitalizes the costs associated with certain computer hardware, software and internally developed software, and amortizes the costs over the expected useful life. Direct project costs of internally developed software are capitalized when it is probable that the project will be completed and the software will be used for its intended function.
Mortgage Servicing Rights
The Corporation accounts for consumer MSRs, including residential mortgage and home equity MSRs, at fair value with changes in fair value recorded in mortgage banking income. To reduce the volatility of earnings related to interest rate and market value fluctuations, U.S. Treasury securities, mortgage-backed securities and derivatives such as options and interest rate swaps
may be used to hedge certain market risks of the MSRs. Such derivatives are not designated as qualifying accounting hedges. These instruments are carried at fair value with changes in fair value recognized in mortgage banking income.
The Corporation estimates the fair value of consumer MSRs using a valuation model that calculates the present value of estimated future net servicing income and, when available, quoted prices from independent parties. The present value calculation is based on an option-adjusted spread (OAS) valuation approach that factors in prepayment risk. This approach consists of projecting servicing cash flows under multiple interest rate scenarios and discounting these cash flows using risk-adjusted discount rates. The key economic assumptions used in MSR valuations include weighted-average lives of the MSRs and the OAS levels. The OAS represents the spread that is added to the discount rate so that the sum of the discounted cash flows equals the market price; therefore, it is a measure of the extra yield over the reference discount factor that the Corporation expects to earn by holding the asset.
Goodwill and Intangible Assets
Goodwill is the purchase premium after adjusting for the fair value of net assets acquired. Goodwill is not amortized but is reviewed for potential impairment on an annual basis, or when events or circumstances indicate a potential impairment, at the reporting unit level. A reporting unit, as defined under applicable accounting guidance, is a business segment or one level below a business segment. The goodwill impairment analysis is a two-step test. The first step of the goodwill impairment test involves comparing the fair value of each reporting unit with its carrying value, including goodwill, as measured by allocated equity. In certain circumstances, the first step may be performed using a qualitative assessment. If the fair value of the reporting unit exceeds its carrying value, goodwill of the reporting unit is considered not impaired; however, if the carrying value of the reporting unit exceeds its fair value, the second step must be performed to measure potential impairment.
The second step involves calculating an implied fair value of goodwill for each reporting unit for which the first step indicated possible impairment. The implied fair value of goodwill is determined in the same manner as the amount of goodwill recognized in a business combination, which is the excess of the fair value of the reporting unit, as determined in the first step, over the aggregate fair values of the assets, liabilities and identifiable intangibles as if the reporting unit was being acquired in a business combination. Measurement of the fair values of the assets and liabilities of a reporting unit is consistent with the requirements of the fair value measurements accounting guidance, as described in Fair Value in this Note. The adjustments to measure the assets, liabilities and intangibles at fair value are for the purpose of measuring the implied fair value of goodwill and such adjustments are not reflected on the Consolidated Balance Sheet. If the implied fair value of goodwill exceeds the goodwill assigned to the reporting unit, there is no impairment. If the goodwill assigned to a reporting unit exceeds the implied fair value of goodwill, an impairment charge is recorded for the excess. An impairment loss recognized cannot exceed the amount of goodwill assigned to a reporting unit. An impairment loss establishes a new basis in the goodwill and subsequent reversals of goodwill impairment losses are not permitted under applicable accounting guidance.
For intangible assets subject to amortization, an impairment loss is recognized if the carrying value of the intangible asset is not recoverable and exceeds fair value. The carrying value of the intangible asset is considered not recoverable if it exceeds the sum of the undiscounted cash flows expected to result from the use of the asset.
Variable Interest Entities
A VIE is an entity that lacks equity investors or whose equity investors do not have a controlling financial interest in the entity through their equity investments. The entity that has a controlling financial interest in a VIE is referred to as the primary beneficiary and consolidates the VIE. The Corporation is deemed to have a controlling financial interest and is the primary beneficiary of a VIE if it has both the power to direct the activities of the VIE that most significantly impact the VIE’s economic performance and an obligation to absorb losses or the right to receive benefits that could potentially be significant to the VIE. On a quarterly basis, the Corporation reassesses whether it has a controlling financial interest in and is the primary beneficiary of a VIE. The quarterly reassessment process considers whether the Corporation has acquired or divested the power to direct the activities of the VIE through changes in governing documents or other circumstances. The reassessment also considers whether the Corporation has acquired or disposed of a financial interest that could be significant to the VIE, or whether an interest in the VIE has become significant or is no longer significant. The consolidation status of the VIEs with which the Corporation is involved may change as a result of such reassessments. Changes in consolidation status are applied prospectively, with assets and liabilities of a newly consolidated VIE initially recorded at fair value. A gain or loss may be recognized upon deconsolidation of a VIE depending on the carrying values of deconsolidated assets and liabilities compared to the fair value of retained interests and ongoing contractual arrangements.
The Corporation primarily uses VIEs for its securitization activities, in which the Corporation transfers whole loans or debt securities into a trust or other vehicle such that the assets are legally isolated from the creditors of the Corporation. Assets held in a trust can only be used to settle obligations of the trust. The creditors of these trusts typically have no recourse to the Corporation except in accordance with the Corporation’s obligations under standard representations and warranties.
When the Corporation is the servicer of whole loans held in a securitization trust, including non-agency residential mortgages, home equity loans, credit cards, automobile loans and student loans, the Corporation has the power to direct the most significant activities of the trust. The Corporation generally does not have the power to direct the most significant activities of a residential mortgage agency trust except in certain circumstances in which the Corporation holds substantially all of the issued securities and has the unilateral right to liquidate the trust. The power to direct the most significant activities of a commercial mortgage securitization trust is typically held by the special servicer or by the party holding specific subordinate securities which embody certain controlling rights. The Corporation consolidates a whole-loan securitization trust if it has the power to direct the most significant activities and also holds securities issued by the trust or has other contractual arrangements, other than standard representations and warranties, that could potentially be significant to the trust.
The Corporation may also transfer trading account securities and AFS securities into municipal bond or resecuritization trusts. The Corporation consolidates a municipal bond or resecuritization trust if it has control over the ongoing activities of the trust such as the remarketing of the trust’s liabilities or, if there are no ongoing activities, sole discretion over the design of the trust, including the identification of securities to be transferred in and the structure of securities to be issued, and also retains securities or has liquidity or other commitments that could potentially be significant to the trust. The Corporation does not consolidate a municipal bond or resecuritization trust if one or a limited number of third-party investors share responsibility for the design of the trust or have control over the significant activities of the trust through liquidation or other substantive rights.
Other VIEs used by the Corporation include collateralized debt obligations (CDOs), investment vehicles created on behalf of customers and other investment vehicles. The Corporation does not routinely serve as collateral manager for CDOs and, therefore, does not typically have the power to direct the activities that most significantly impact the economic performance of a CDO. However, following an event of default, if the Corporation is a majority holder of senior securities issued by a CDO and acquires the power to manage the assets of the CDO, the Corporation consolidates the CDO.
The Corporation consolidates a customer or other investment vehicle if it has control over the initial design of the vehicle or manages the assets in the vehicle and also absorbs potentially significant gains or losses through an investment in the vehicle, derivative contracts or other arrangements. The Corporation does not consolidate an investment vehicle if a single investor controlled the initial design of the vehicle or manages the assets in the vehicles or if the Corporation does not have a variable interest that could potentially be significant to the vehicle.
Retained interests in securitized assets are initially recorded at fair value. In addition, the Corporation may invest in debt securities issued by unconsolidated VIEs. Fair values of these debt securities, which are classified as trading account assets, debt securities carried at fair value or held-to-maturity securities, are based primarily on quoted market prices in active or inactive markets. Generally, quoted market prices for retained residual interests are not available; therefore, the Corporation estimates fair values based on the present value of the associated expected future cash flows. This may require management to estimate credit losses, prepayment speeds, forward interest yield curves, discount rates and other factors that impact the value of retained interests. Retained residual interests in unconsolidated securitization trusts are classified in trading account assets or other assets with changes in fair value recorded in earnings. The Corporation may also enter into derivatives with unconsolidated VIEs, which are carried at fair value with changes in fair value recorded in earnings.
Fair Value
The Corporation measures the fair values of its assets and liabilities, where applicable, in accordance with accounting guidance that requires an entity to base fair value on exit price. A three-level hierarchy, provided in the applicable accounting guidance, for inputs is utilized in measuring fair value which maximizes the use of observable inputs and minimizes the use of unobservable inputs by requiring that observable inputs be used to determine the exit price when available. Under applicable accounting guidance, the Corporation categorizes its financial
instruments, based on the priority of inputs to the valuation technique, into this three-level hierarchy, as described below. Trading account assets and liabilities, derivative assets and liabilities, AFS debt and equity securities, other debt securities carried at fair value, consumer MSRs and certain other assets are carried at fair value in accordance with applicable accounting guidance. The Corporation has also elected to account for certain assets and liabilities under the fair value option, including certain commercial and consumer loans and loan commitments, LHFS, short-term borrowings, securities financing agreements, long-term deposits and long-term debt. The following describes the three-level hierarchy.
| |
| Level 1 | Unadjusted quoted prices in active markets for identical assets or liabilities. Level 1 assets and liabilities include debt and equity securities and derivative contracts that are traded in an active exchange market, as well as certain U.S. Treasury securities that are highly liquid and are actively traded in OTC markets. |
| |
| Level 2 | Observable inputs other than Level 1 prices, such as quoted prices for similar assets or liabilities, quoted prices in markets that are not active, or other inputs that are observable or can be corroborated by observable market data for substantially the full term of the assets or liabilities. Level 2 assets and liabilities include debt securities with quoted prices that are traded less frequently than exchange-traded instruments and derivative contracts where fair value is determined using a pricing model with inputs that are observable in the market or can be derived principally from or corroborated by observable market data. This category generally includes U.S. government and agency mortgage-backed and asset-backed securities, corporate debt securities, derivative contracts, certain loans and LHFS. |
| |
| Level 3 | Unobservable inputs that are supported by little or no market activity and that are significant to the overall fair value of the assets or liabilities. Level 3 assets and liabilities include financial instruments for which the determination of fair value requires significant management judgment or estimation. The fair value for such assets and liabilities is generally determined using pricing models, market comparables, discounted cash flow methodologies or similar techniques that incorporate the assumptions a market participant would use in pricing the asset or liability. This category generally includes certain private equity investments and other principal investments, retained residual interests in securitizations, consumer MSRs, certain asset-backed securities, highly structured, complex or long-dated derivative contracts, certain loans and LHFS, IRLCs and certain CDOs where independent pricing information cannot be obtained for a significant portion of the underlying assets. |
Income Taxes
There are two components of income tax expense: current and deferred. Current income tax expense reflects taxes to be paid or refunded for the current period. Deferred income tax expense results from changes in deferred tax assets and liabilities between periods. These gross deferred tax assets and liabilities represent
decreases or increases in taxes expected to be paid in the future because of future reversals of temporary differences in the bases of assets and liabilities as measured by tax laws and their bases as reported in the financial statements. Deferred tax assets are also recognized for tax attributes such as net operating loss carryforwards and tax credit carryforwards. Valuation allowances are recorded to reduce deferred tax assets to the amounts management concludes are more-likely-than-not to be realized.
Income tax benefits are recognized and measured based upon a two-step model: first, a tax position must be more-likely-than-not to be sustained based solely on its technical merits in order to be recognized, and second, the benefit is measured as the largest dollar amount of that position that is more-likely-than-not to be sustained upon settlement. The difference between the benefit recognized and the tax benefit claimed on a tax return is referred to as an unrecognized tax benefit. The Corporation records income tax-related interest and penalties, if applicable, within income tax expense.
Retirement Benefits
The Corporation has retirement plans covering substantially all full-time and certain part-time employees. Pension expense under these plans is charged to current operations and consists of several components of net pension cost based on various actuarial assumptions regarding future experience under the plans.
In addition, the Corporation has unfunded supplemental benefit plans and supplemental executive retirement plans (SERPs) for selected officers of the Corporation and its subsidiaries that provide benefits that cannot be paid from a qualified retirement plan due to Internal Revenue Code restrictions. The Corporation’s current executive officers do not earn additional retirement income under SERPs. These plans are nonqualified under the Internal Revenue Code and assets used to fund benefit payments are not segregated from other assets of the Corporation; therefore, in general, a participant’s or beneficiary’s claim to benefits under these plans is as a general creditor. In addition, the Corporation has several postretirement healthcare and life insurance benefit plans.
Accumulated Other Comprehensive Income
The Corporation records unrealized gains and losses on AFS debt and marketable equity securities, gains and losses on cash flow accounting hedges, certain employee benefit plan adjustments, foreign currency translation adjustments and related hedges of net investments in foreign operations, and the cumulative adjustment related to certain accounting changes in accumulated OCI, net-of-tax. Unrealized gains and losses on AFS debt and marketable equity securities are reclassified to earnings as the gains or losses are realized upon sale of the securities. Unrealized losses on AFS securities deemed to represent OTTI are reclassified to earnings at the time of the impairment charge. For AFS debt securities that the Corporation does not intend to sell or it is not more-likely-than-not that it will be required to sell, only the credit component of an unrealized loss is reclassified to earnings. Gains or losses on derivatives accounted for as cash flow hedges are reclassified to earnings when the hedged transaction affects earnings. Translation gains or losses on foreign currency translation adjustments are reclassified to earnings upon the substantial sale or liquidation of investments in foreign operations.
Revenue Recognition
The following summarizes the Corporation’s revenue recognition policies as they relate to certain noninterest income line items in the Consolidated Statement of Income.
Card income is derived from fees such as interchange, cash advance, annual, late, over-limit and other miscellaneous fees, which are recorded as revenue when earned, primarily on an accrual basis. Uncollected fees are included in the customer card receivables balances with an amount recorded in the allowance for loan and lease losses for estimated uncollectible card receivables. Uncollected fees are written off when a card receivable reaches 180 days past due.
Service charges include fees for insufficient funds, overdrafts and other banking services and are recorded as revenue when earned. Uncollected fees are included in outstanding loan balances with an amount recorded for estimated uncollectible service fees receivable. Uncollected fees are written off when a fee receivable reaches 60 days past due.
Investment and brokerage services revenue consists primarily of asset management fees and brokerage income that are recognized over the period the services are provided or when commissions are earned. Asset management fees consist primarily of fees for investment management and trust services and are generally based on the dollar amount of the assets being managed. Brokerage income is generally derived from commissions and fees earned on the sale of various financial products.
Investment banking income consists primarily of advisory and underwriting fees that are recognized in income as the services are provided and no contingencies exist. Revenues are generally recognized net of any direct expenses. Non-reimbursed expenses are recorded as noninterest expense.
Earnings Per Common Share
Earnings per common share (EPS) is computed by dividing net income (loss) allocated to common shareholders by the weighted-average common shares outstanding, except that it does not include unvested common shares subject to repurchase or cancellation. Net income (loss) allocated to common shareholders represents net income (loss) applicable to common shareholders which is net income (loss) adjusted for preferred stock dividends including dividends declared, accretion of discounts on preferred stock including accelerated accretion when preferred stock is repaid early, and cumulative dividends related to the current dividend period that have not been declared as of period end, less income allocated to participating securities (see below for more information). Diluted EPS is computed by dividing income (loss) allocated to common shareholders plus dividends on dilutive convertible preferred stock and preferred stock that can be tendered to exercise warrants, by the weighted-average common shares outstanding plus amounts representing the dilutive effect of stock options outstanding, restricted stock, restricted stock units, outstanding warrants and the dilution resulting from the conversion of convertible preferred stock, if applicable.
Unvested share-based payment awards that contain nonforfeitable rights to dividends are participating securities that are included in computing EPS using the two-class method. The two-class method is an earnings allocation formula under which
EPS is calculated for common stock and participating securities according to dividends declared and participating rights in undistributed earnings. Under this method, all earnings, distributed and undistributed, are allocated to participating securities and common shares based on their respective rights to receive dividends.
In an exchange of non-convertible preferred stock, income allocated to common shareholders is adjusted for the difference between the carrying value of the preferred stock and the fair value of the consideration exchanged. In an induced conversion of convertible preferred stock, income allocated to common shareholders is reduced by the excess of the fair value of the consideration exchanged over the fair value of the common stock that would have been issued under the original conversion terms.
Foreign Currency Translation
Assets, liabilities and operations of foreign branches and subsidiaries are recorded based on the functional currency of each entity. For certain of the foreign operations, the functional currency is the local currency, in which case the assets, liabilities and operations are translated, for consolidation purposes, from the local currency to the U.S. Dollar reporting currency at period-end rates for assets and liabilities and generally at average rates for results of operations. The resulting unrealized gains or losses, as well as gains and losses from certain hedges, are reported as a component of accumulated OCI, net-of-tax. When the foreign entity’s functional currency is determined to be the U.S. Dollar, the resulting remeasurement gains or losses on foreign currency-denominated assets or liabilities are included in earnings.
Credit Card and Deposit Arrangements
Endorsing Organization Agreements
The Corporation contracts with other organizations to obtain their endorsement of the Corporation’s loan and deposit products. This endorsement may provide to the Corporation exclusive rights to market to the organization’s members or to customers on behalf of the Corporation. These organizations endorse the Corporation’s loan and deposit products and provide the Corporation with their mailing lists and marketing activities. These agreements generally have terms that range from two to five years. The Corporation typically pays royalties in exchange for the endorsement. Compensation costs related to the credit card agreements are recorded as contra-revenue in card income.
Cardholder Reward Agreements
The Corporation offers reward programs that allow its cardholders to earn points that can be redeemed for a broad range of rewards including cash, travel and gift cards. The Corporation establishes a rewards liability based upon the points earned that are expected to be redeemed and the average cost per point redeemed. The points to be redeemed are estimated based on past redemption behavior, card product type, account transaction activity and other historical card performance. The liability is reduced as the points are redeemed. The estimated cost of the rewards programs is recorded as contra-revenue in card income.
NOTE 2 Derivatives
Derivative Balances
Derivatives are entered into on behalf of customers, for trading, or to support risk management activities. Derivatives used in risk management activities include derivatives that may or may not be designated in qualifying hedge accounting relationships. Derivatives that are not designated in qualifying hedge accounting relationships are referred to as other risk management derivatives. For more information on the Corporation’s derivatives and hedging
activities, see Note 1 – Summary of Significant Accounting Principles. The following tables present derivative instruments included on the Consolidated Balance Sheet in derivative assets and liabilities at December 31, 2014 and 2013. Balances are presented on a gross basis, prior to the application of counterparty and cash collateral netting. Total derivative assets and liabilities are adjusted on an aggregate basis to take into consideration the effects of legally enforceable master netting agreements and have been reduced by the cash collateral received or paid.
|
| | | | | | | | | | | | | | | | | | | | | | | | | | | |
| | | | | | | | | | | | | | |
| | | | December 31, 2014 |
| | | | Gross Derivative Assets | | Gross Derivative Liabilities |
| (Dollars in billions) | Contract/ Notional (1) | | Trading and Other Risk Management Derivatives | | Qualifying
Accounting Hedges | | Total | | Trading and Other Risk Management Derivatives | | Qualifying
Accounting Hedges | | Total |
| Interest rate contracts | |
| | |
| | |
| | |
| | |
| | |
| | |
|
| Swaps | $ | 29,445.4 |
| | $ | 658.5 |
| | $ | 8.5 |
| | $ | 667.0 |
| | $ | 658.2 |
| | $ | 0.5 |
| | $ | 658.7 |
|
| Futures and forwards | 10,159.4 |
| | 1.7 |
| | — |
| | 1.7 |
| | 2.0 |
| | — |
| | 2.0 |
|
| Written options | 1,725.2 |
| | — |
| | — |
| | — |
| | 85.4 |
| | — |
| | 85.4 |
|
| Purchased options | 1,739.8 |
| | 85.6 |
| | — |
| | 85.6 |
| | — |
| | — |
| | — |
|
| Foreign exchange contracts | |
| | |
| | |
| | |
| | |
| | |
| | |
|
| Swaps | 2,159.1 |
| | 51.5 |
| | 0.8 |
| | 52.3 |
| | 54.6 |
| | 1.9 |
| | 56.5 |
|
| Spot, futures and forwards | 4,226.4 |
| | 68.9 |
| | 1.5 |
| | 70.4 |
| | 72.4 |
| | 0.2 |
| | 72.6 |
|
| Written options | 600.7 |
| | — |
| | — |
| | — |
| | 16.0 |
| | — |
| | 16.0 |
|
| Purchased options | 584.6 |
| | 15.1 |
| | — |
| | 15.1 |
| | — |
| | — |
| | — |
|
| Equity contracts | |
| | |
| | |
| | |
| | |
| | |
| | |
|
| Swaps | 193.7 |
| | 3.2 |
| | — |
| | 3.2 |
| | 4.0 |
| | — |
| | 4.0 |
|
| Futures and forwards | 69.5 |
| | 2.1 |
| | — |
| | 2.1 |
| | 1.8 |
| | — |
| | 1.8 |
|
| Written options | 341.0 |
| | — |
| | — |
| | — |
| | 26.0 |
| | — |
| | 26.0 |
|
| Purchased options | 318.4 |
| | 27.9 |
| | — |
| | 27.9 |
| | — |
| | — |
| | — |
|
| Commodity contracts | |
| | |
| | |
| | |
| | |
| | |
| | |
|
| Swaps | 74.3 |
| | 5.8 |
| | — |
| | 5.8 |
| | 8.5 |
| | — |
| | 8.5 |
|
| Futures and forwards | 376.5 |
| | 4.5 |
| | — |
| | 4.5 |
| | 1.8 |
| | — |
| | 1.8 |
|
| Written options | 129.5 |
| | — |
| | — |
| | — |
| | 11.5 |
| | — |
| | 11.5 |
|
| Purchased options | 141.3 |
| | 10.7 |
| | — |
| | 10.7 |
| | — |
| | — |
| | — |
|
| Credit derivatives | |
| | |
| | |
| | |
| | |
| | |
| | |
|
| Purchased credit derivatives: | |
| | |
| | |
| | |
| | |
| | |
| | |
|
| Credit default swaps | 1,094.8 |
| | 13.3 |
| | — |
| | 13.3 |
| | 23.4 |
| | — |
| | 23.4 |
|
| Total return swaps/other | 44.3 |
| | 0.2 |
| | — |
| | 0.2 |
| | 1.4 |
| | — |
| | 1.4 |
|
| Written credit derivatives: | |
| | |
| | |
| | |
| | |
| | |
| | |
|
| Credit default swaps | 1,073.1 |
| | 24.5 |
| | — |
| | 24.5 |
| | 11.9 |
| | — |
| | 11.9 |
|
| Total return swaps/other | 61.0 |
| | 0.5 |
| | — |
| | 0.5 |
| | 0.3 |
| | — |
| | 0.3 |
|
| Gross derivative assets/liabilities | |
| | $ | 974.0 |
| | $ | 10.8 |
| | $ | 984.8 |
| | $ | 979.2 |
| | $ | 2.6 |
| | $ | 981.8 |
|
| Less: Legally enforceable master netting agreements | |
| | |
| | |
| | (884.8 | ) | | |
| | |
| | (884.8 | ) |
| Less: Cash collateral received/paid | |
| | |
| | |
| | (47.3 | ) | | |
| | |
| | (50.1 | ) |
| Total derivative assets/liabilities | |
| | |
| | |
| | $ | 52.7 |
| | |
| | |
| | $ | 46.9 |
|
| |
(1) | Represents the total contract/notional amount of derivative assets and liabilities outstanding. |
|
| | | | | | | | | | | | | | | | | | | | | | | | | | | |
| | | | | | | | | | | | | | |
| | | | December 31, 2013 |
| | | | Gross Derivative Assets | | Gross Derivative Liabilities |
| (Dollars in billions) | Contract/ Notional (1) | | Trading and Other Risk Management Derivatives | | Qualifying
Accounting Hedges | | Total | | Trading and Other Risk Management Derivatives | | Qualifying
Accounting Hedges | | Total |
| Interest rate contracts | |
| | |
| | |
| | |
| | |
| | |
| | |
|
| Swaps | $ | 33,272.0 |
| | $ | 659.9 |
| | $ | 7.5 |
| | $ | 667.4 |
| | $ | 658.4 |
| | $ | 0.9 |
| | $ | 659.3 |
|
| Futures and forwards | 8,217.6 |
| | 1.6 |
| | — |
| | 1.6 |
| | 1.5 |
| | — |
| | 1.5 |
|
| Written options | 2,065.4 |
| | — |
| | — |
| | — |
| | 64.4 |
| | — |
| | 64.4 |
|
| Purchased options | 2,028.3 |
| | 65.4 |
| | — |
| | 65.4 |
| | — |
| | — |
| | — |
|
| Foreign exchange contracts | |
| | |
| | |
| | |
| | |
| | |
| | |
|
| Swaps | 2,284.1 |
| | 43.1 |
| | 1.0 |
| | 44.1 |
| | 42.7 |
| | 1.0 |
| | 43.7 |
|
| Spot, futures and forwards | 2,922.5 |
| | 32.5 |
| | 0.7 |
| | 33.2 |
| | 33.5 |
| | 1.1 |
| | 34.6 |
|
| Written options | 412.4 |
| | — |
| | — |
| | — |
| | 9.2 |
| | — |
| | 9.2 |
|
| Purchased options | 392.4 |
| | 8.8 |
| | — |
| | 8.8 |
| | — |
| | — |
| | — |
|
| Equity contracts | |
| | |
| | |
| | |
| | |
| | |
| | |
|
| Swaps | 162.0 |
| | 3.6 |
| | — |
| | 3.6 |
| | 4.2 |
| | — |
| | 4.2 |
|
| Futures and forwards | 71.4 |
| | 1.1 |
| | — |
| | 1.1 |
| | 1.4 |
| | — |
| | 1.4 |
|
| Written options | 315.6 |
| | — |
| | — |
| | — |
| | 29.6 |
| | — |
| | 29.6 |
|
| Purchased options | 266.7 |
| | 30.4 |
| | — |
| | 30.4 |
| | — |
| | — |
| | — |
|
| Commodity contracts | |
| | |
| | |
| | |
| | |
| | |
| | |
|
| Swaps | 73.1 |
| | 3.8 |
| | — |
| | 3.8 |
| | 5.7 |
| | — |
| | 5.7 |
|
| Futures and forwards | 454.4 |
| | 4.7 |
| | — |
| | 4.7 |
| | 2.5 |
| | — |
| | 2.5 |
|
| Written options | 157.3 |
| | — |
| | — |
| | — |
| | 5.0 |
| | — |
| | 5.0 |
|
| Purchased options | 164.0 |
| | 5.2 |
| | — |
| | 5.2 |
| | — |
| | — |
| | — |
|
| Credit derivatives | |
| | |
| | |
| | |
| | |
| | |
| | |
|
| Purchased credit derivatives: | |
| | |
| | |
| | |
| | |
| | |
| | |
|
| Credit default swaps | 1,305.1 |
| | 15.7 |
| | — |
| | 15.7 |
| | 28.1 |
| | — |
| | 28.1 |
|
| Total return swaps/other | 38.1 |
| | 2.0 |
| | — |
| | 2.0 |
| | 3.2 |
| | — |
| | 3.2 |
|
| Written credit derivatives: | |
| | |
| | |
| | |
| | |
| | |
| | |
|
| Credit default swaps | 1,265.4 |
| | 29.3 |
| | — |
| | 29.3 |
| | 13.8 |
| | — |
| | 13.8 |
|
| Total return swaps/other | 63.4 |
| | 4.0 |
| | — |
| | 4.0 |
| | 0.2 |
| | — |
| | 0.2 |
|
| Gross derivative assets/liabilities | |
| | $ | 911.1 |
| | $ | 9.2 |
| | $ | 920.3 |
| | $ | 903.4 |
| | $ | 3.0 |
| | $ | 906.4 |
|
| Less: Legally enforceable master netting agreements | |
| | |
| | |
| | (825.5 | ) | | |
| | |
| | (825.5 | ) |
| Less: Cash collateral received/paid | |
| | |
| | |
| | (47.3 | ) | | |
| | |
| | (43.5 | ) |
| Total derivative assets/liabilities | |
| | |
| | |
| | $ | 47.5 |
| | |
| | |
| | $ | 37.4 |
|
| |
(1) | Represents the total contract/notional amount of derivative assets and liabilities outstanding. |
Offsetting of Derivatives
The Corporation enters into International Swaps and Derivatives Association, Inc. (ISDA) master netting agreements or similar agreements with substantially all of the Corporation’s derivative counterparties. Where legally enforceable, these master netting agreements give the Corporation, in the event of default by the counterparty, the right to liquidate securities held as collateral and to offset receivables and payables with the same counterparty. For purposes of the Consolidated Balance Sheet, the Corporation offsets derivative assets and liabilities and cash collateral held with the same counterparty where it has such a legally enforceable master netting agreement.
The Offsetting of Derivatives table presents derivative instruments included in derivative assets and liabilities on the Consolidated Balance Sheet at December 31, 2014 and 2013 by primary risk (e.g., interest rate risk) and the platform, where applicable, on which these derivatives are transacted. Exchange-traded derivatives include listed options transacted on an exchange. Over-the-counter (OTC) derivatives include bilateral transactions between the Corporation and a particular counterparty. OTC-cleared derivatives include bilateral transactions between the Corporation and a counterparty where the transaction is cleared through a clearinghouse. Balances are
presented on a gross basis, prior to the application of counterparty and cash collateral netting. Total gross derivative assets and liabilities are adjusted on an aggregate basis to take into consideration the effects of legally enforceable master netting agreements which includes reducing the balance for counterparty netting and cash collateral received or paid.
Other gross derivative assets and liabilities in the table represent derivatives entered into under master netting agreements where uncertainty exists as to the enforceability of these agreements under bankruptcy laws in some countries or industries and, accordingly, receivables and payables with counterparties in these countries or industries are reported on a gross basis.
Also included in the table is financial instrument collateral related to legally enforceable master netting agreements that represents securities collateral received or pledged and customer cash collateral held at third-party custodians. These amounts are not offset on the Consolidated Balance Sheet but are shown as a reduction to total derivative assets and liabilities in the table to derive net derivative assets and liabilities.
For more information on offsetting of securities financing agreements, see Note 10 – Federal Funds Sold or Purchased, Securities Financing Agreements and Short-term Borrowings.
|
| | | | | | | | | | | | | | | |
| | | | | | | | |
| Offsetting of Derivatives | | | | | | | |
| | | | | | | | |
| | December 31, 2014 | | December 31, 2013 |
| (Dollars in billions) | Derivative Assets | | Derivative Liabilities | | Derivative Assets | | Derivative Liabilities |
| Interest rate contracts | |
| | |
| | |
| | |
|
| Over-the-counter | $ | 386.6 |
| | $ | 373.2 |
| | $ | 381.7 |
| | $ | 365.9 |
|
| Exchange-traded | 0.1 |
| | 0.1 |
| | 0.4 |
| | 0.3 |
|
| Over-the-counter cleared | 365.7 |
| | 368.7 |
| | 351.2 |
| | 356.5 |
|
| Foreign exchange contracts | | | | | | | |
| Over-the-counter | 133.0 |
| | 139.9 |
| | 82.9 |
| | 83.9 |
|
| Equity contracts | | | | | | | |
| Over-the-counter | 19.5 |
| | 16.7 |
| | 20.3 |
| | 17.6 |
|
| Exchange-traded | 8.6 |
| | 7.8 |
| | 8.4 |
| | 9.8 |
|
| Commodity contracts | | | | | | | |
| Over-the-counter | 10.2 |
| | 11.9 |
| | 6.3 |
| | 7.4 |
|
| Exchange-traded | 7.4 |
| | 7.7 |
| | 3.3 |
| | 2.9 |
|
| Over-the-counter cleared | 0.1 |
| | 0.6 |
| | — |
| | — |
|
| Credit derivatives | | | | | | | |
| Over-the-counter | 30.8 |
| | 30.2 |
| | 44.0 |
| | 38.9 |
|
| Over-the-counter cleared | 7.0 |
| | 6.8 |
| | 5.8 |
| | 5.9 |
|
| Total gross derivative assets/liabilities, before netting | | | | | | | |
| Over-the-counter | 580.1 |
| | 571.9 |
| | 535.2 |
| | 513.7 |
|
| Exchange-traded | 16.1 |
| | 15.6 |
| | 12.1 |
| | 13.0 |
|
| Over-the-counter cleared | 372.8 |
| | 376.1 |
| | 357.0 |
| | 362.4 |
|
| Less: Legally enforceable master netting agreements and cash collateral received/paid | | | | | | | |
| Over-the-counter | (545.7 | ) | | (545.5 | ) | | (505.0 | ) | | (495.4 | ) |
| Exchange-traded | (13.9 | ) | | (13.9 | ) | | (11.2 | ) | | (11.2 | ) |
| Over-the-counter cleared | (372.5 | ) | | (375.5 | ) | | (356.6 | ) | | (362.4 | ) |
| Derivative assets/liabilities, after netting | 36.9 |
| | 28.7 |
| | 31.5 |
| | 20.1 |
|
| Other gross derivative assets/liabilities | 15.8 |
| | 18.2 |
| | 16.0 |
| | 17.3 |
|
| Total derivative assets/liabilities | 52.7 |
| | 46.9 |
| | 47.5 |
| | 37.4 |
|
Less: Financial instruments collateral (1) | (13.3 | ) | | (8.9 | ) | | (10.1 | ) | | (4.6 | ) |
| Total net derivative assets/liabilities | $ | 39.4 |
| | $ | 38.0 |
| | $ | 37.4 |
| | $ | 32.8 |
|
| |
(1) | These amounts are limited to the derivative asset/liability balance and, accordingly, do not include excess collateral received/pledged. |
ALM and Risk Management Derivatives
The Corporation’s asset and liability management (ALM) and risk management activities include the use of derivatives to mitigate risk to the Corporation including derivatives designated in qualifying hedge accounting relationships and derivatives used in other risk management activities. Interest rate, foreign exchange, equity, commodity and credit contracts are utilized in the Corporation’s ALM and risk management activities.
The Corporation maintains an overall interest rate risk management strategy that incorporates the use of interest rate contracts, which are generally non-leveraged generic interest rate and basis swaps, options, futures and forwards, to minimize significant fluctuations in earnings caused by interest rate volatility. The Corporation’s goal is to manage interest rate sensitivity and volatility so that movements in interest rates do not significantly adversely affect earnings or capital. As a result of interest rate fluctuations, hedged fixed-rate assets and liabilities appreciate or depreciate in fair value. Gains or losses on the derivative instruments that are linked to the hedged fixed-rate assets and liabilities are expected to substantially offset this unrealized appreciation or depreciation.
Market risk, including interest rate risk, can be substantial in the mortgage business. Market risk is the risk that values of mortgage assets or revenues will be adversely affected by changes in market conditions such as interest rate movements. To mitigate the interest rate risk in mortgage banking production income, the
Corporation utilizes forward loan sale commitments and other derivative instruments, including purchased options, and certain debt securities. The Corporation also utilizes derivatives such as interest rate options, interest rate swaps, forward settlement contracts and eurodollar futures to hedge certain market risks of mortgage servicing rights (MSRs). For more information on MSRs, see Note 23 – Mortgage Servicing Rights.
The Corporation uses foreign exchange contracts to manage the foreign exchange risk associated with certain foreign currency-denominated assets and liabilities, as well as the Corporation’s investments in non-U.S. subsidiaries. Foreign exchange contracts, which include spot and forward contracts, represent agreements to exchange the currency of one country for the currency of another country at an agreed-upon price on an agreed-upon settlement date. Exposure to loss on these contracts will increase or decrease over their respective lives as currency exchange and interest rates fluctuate.
The Corporation enters into derivative commodity contracts such as futures, swaps, options and forwards as well as non-derivative commodity contracts to provide price risk management services to customers or to manage price risk associated with its physical and financial commodity positions. The non-derivative commodity contracts and physical inventories of commodities expose the Corporation to earnings volatility. Cash flow and fair value accounting hedges provide a method to mitigate a portion of this earnings volatility.
The Corporation purchases credit derivatives to manage credit risk related to certain funded and unfunded credit exposures. Credit derivatives include credit default swaps (CDS), total return swaps and swaptions. These derivatives are recorded on the Consolidated Balance Sheet at fair value with changes in fair value recorded in other income (loss).
Derivatives Designated as Accounting Hedges
The Corporation uses various types of interest rate, commodity and foreign exchange derivative contracts to protect against changes in the fair value of its assets and liabilities due to fluctuations in interest rates, commodity prices and exchange rates (fair value hedges). The Corporation also uses these types of contracts and equity derivatives to protect against changes in the cash flows of its assets and liabilities, and other forecasted transactions (cash flow hedges). The Corporation hedges its net investment in consolidated non-U.S. operations determined to
have functional currencies other than the U.S. Dollar using forward exchange contracts and cross-currency basis swaps, and by issuing foreign currency-denominated debt (net investment hedges).
Fair Value Hedges
The table below summarizes information related to fair value hedges for 2014, 2013 and 2012, including hedges of interest rate risk on long-term debt that were acquired as part of a business combination and redesignated. At redesignation, the fair value of the derivatives was positive. As the derivatives mature, the fair value will approach zero. As a result, ineffectiveness will occur and the fair value changes in the derivatives and the long-term debt being hedged may be directionally the same in certain scenarios. Based on a regression analysis, the derivatives continue to be highly effective at offsetting changes in the fair value of the long-term debt attributable to interest rate risk.
|
| | | | | | | | | | | |
| | | |
| Derivatives Designated as Fair Value Hedges | | | | | |
| | | | | | |
| Gains (Losses) | 2014 |
| (Dollars in millions) | Derivative | | Hedged Item | | Hedge Ineffectiveness |
Interest rate risk on long-term debt (1) | $ | 2,144 |
| | $ | (2,935 | ) | | $ | (791 | ) |
Interest rate and foreign currency risk on long-term debt (1) | (2,212 | ) | | 2,120 |
| | (92 | ) |
Interest rate risk on available-for-sale securities (2) | (35 | ) | | 3 |
| | (32 | ) |
Price risk on commodity inventory (3) | 21 |
| | (15 | ) | | 6 |
|
| Total | $ | (82 | ) | | $ | (827 | ) | | $ | (909 | ) |
| | | | | | |
| | 2013 |
Interest rate risk on long-term debt (1) | $ | (4,704 | ) | | $ | 3,925 |
| | $ | (779 | ) |
Interest rate and foreign currency risk on long-term debt (1) | (1,291 | ) | | 1,085 |
| | (206 | ) |
Interest rate risk on available-for-sale securities (2) | 839 |
| | (840 | ) | | (1 | ) |
Price risk on commodity inventory (3) | (13 | ) | | 11 |
| | (2 | ) |
| Total | $ | (5,169 | ) | | $ | 4,181 |
| | $ | (988 | ) |
| | | | | | |
| | 2012 |
Interest rate risk on long-term debt (1) | $ | (195 | ) | | $ | (770 | ) | | $ | (965 | ) |
Interest rate and foreign currency risk on long-term debt (1) | (1,482 | ) | | 1,225 |
| | (257 | ) |
Interest rate risk on available-for-sale securities (2) | (4 | ) | | 91 |
| | 87 |
|
Price risk on commodity inventory (3) | (6 | ) | | 6 |
| | — |
|
| Total | $ | (1,687 | ) | | $ | 552 |
| | $ | (1,135 | ) |
| |
(1) | Amounts are recorded in interest expense on long-term debt and in other income (loss). |
| |
(2) | Amounts are recorded in interest income on debt securities. |
| |
(3) | Amounts relating to commodity inventory are recorded in trading account profits. |
Cash Flow and Net Investment Hedges
The table below summarizes certain information related to cash flow hedges and net investment hedges for 2014, 2013 and 2012. Of the $1.7 billion net loss (after-tax) on derivatives in accumulated other comprehensive income (OCI) for 2014, $803 million ($502 million after-tax) is expected to be reclassified into earnings in the
next 12 months. These net losses reclassified into earnings are expected to primarily reduce net interest income related to the respective hedged items. Amounts related to price risk on restricted stock awards reclassified from accumulated OCI are recorded in personnel expense.
|
| | | | | | | | | | | |
| | | | | | |
| Derivatives Designated as Cash Flow and Net Investment Hedges | | | | | |
| | | | | | |
| | 2014 |
| (Dollars in millions, amounts pretax) | Gains (Losses)
Recognized in
Accumulated OCI on Derivatives | | Gains (Losses)
in Income
Reclassified from Accumulated OCI | | Hedge
Ineffectiveness and
Amounts Excluded
from Effectiveness Testing (1) |
| Cash flow hedges | |
| | |
| | |
|
| Interest rate risk on variable-rate portfolios | $ | 68 |
| | $ | (1,119 | ) | | $ | (4 | ) |
| Price risk on restricted stock awards | 127 |
| | 359 |
| | — |
|
| Total | $ | 195 |
| | $ | (760 | ) | | $ | (4 | ) |
| Net investment hedges | |
| | |
| | |
|
| Foreign exchange risk | $ | 3,021 |
| | $ | 21 |
| | $ | (503 | ) |
| | | | | | |
| | 2013 |
| Cash flow hedges | |
| | |
| | |
|
| Interest rate risk on variable-rate portfolios | $ | (321 | ) | | $ | (1,102 | ) | | $ | — |
|
| Price risk on restricted stock awards | 477 |
| | 329 |
| | — |
|
| Total | $ | 156 |
| | $ | (773 | ) | | $ | — |
|
| Net investment hedges | |
| | |
| | |
|
| Foreign exchange risk | $ | 1,024 |
| | $ | (355 | ) | | $ | (134 | ) |
| | | | | | |
| | 2012 |
| Cash flow hedges | |
| | |
| | |
|
| Interest rate risk on variable-rate portfolios | $ | 10 |
| | $ | (957 | ) | | $ | — |
|
| Price risk on restricted stock awards | 420 |
| | (78 | ) | | — |
|
| Total | $ | 430 |
| | $ | (1,035 | ) | | $ | — |
|
| Net investment hedges | |
| | |
| | |
|
| Foreign exchange risk | $ | (771 | ) | | $ | (26 | ) | | $ | (269 | ) |
| |
(1) | Amounts related to derivatives designated as cash flow hedges represent hedge ineffectiveness and amounts related to net investment hedges represent amounts excluded from effectiveness testing. |
Other Risk Management Derivatives
Other risk management derivatives are used by the Corporation to reduce certain risk exposures. These derivatives are not qualifying accounting hedges because either they did not qualify for or were not designated as accounting hedges. The table below presents gains (losses) on these derivatives for 2014, 2013 and
2012. These gains (losses) are largely offset by the income or expense that is recorded on the hedged item. The change in the impact of interest rate and foreign currency risk on ALM activities was primarily driven by decreasing interest rates and foreign currency weakening against the U.S. Dollar throughout 2014 compared to strengthening during 2013.
|
| | | | | | | | | | | |
| | | | | | |
| Other Risk Management Derivatives | | | | | |
| | | | | | |
| Gains (Losses) | | | | | |
| | | | | | |
| (Dollars in millions) | 2014 | | 2013 | | 2012 |
Interest rate risk on mortgage banking income (1) | $ | 1,017 |
| | $ | (619 | ) | | $ | 1,324 |
|
Credit risk on loans (2) | 16 |
| | (47 | ) | | (95 | ) |
Interest rate and foreign currency risk on ALM activities (3) | (3,683 | ) | | 2,501 |
| | 424 |
|
Price risk on restricted stock awards (4) | 600 |
| | 865 |
| | 1,008 |
|
| Other | (9 | ) | | (19 | ) | | 58 |
|
| |
(1) | Net gains (losses) on these derivatives are recorded in mortgage banking income as they are used to mitigate the interest rate risk related to MSRs, interest rate lock commitments and mortgage loans held-for-sale, all of which are measured at fair value with changes in fair value recorded in mortgage banking income. The net gains on interest rate lock commitments related to the origination of mortgage loans that are held-for-sale, which are not included in the table but are considered derivative instruments, were $776 million, $927 million and $3.0 billion for 2014, 2013 and 2012, respectively. |
| |
(2) | Net gains (losses) on these derivatives are recorded in other income (loss). |
| |
(3) | Primarily related to hedges of debt securities carried at fair value and hedges of foreign currency-denominated debt. Gains (losses) on these derivatives and the related hedged items are recorded in other income (loss). |
| |
(4) | Gains (losses) on these derivatives are recorded in personnel expense. |
Sales and Trading Revenue
The Corporation enters into trading derivatives to facilitate client transactions and to manage risk exposures arising from trading account assets and liabilities. It is the Corporation’s policy to include these derivative instruments in its trading activities which include derivatives and non-derivative cash instruments. The resulting risk from these derivatives is managed on a portfolio basis as part of the Corporation’s Global Markets business segment. The related sales and trading revenue generated within Global Markets is recorded in various income statement line items including trading account profits and net interest income as well as other revenue categories. However, the majority of income related to derivative instruments is recorded in trading account profits.
Sales and trading revenue includes changes in the fair value and realized gains and losses on the sales of trading and other assets, net interest income, and fees primarily from commissions on equity securities. Revenue is generated by the difference in the client price for an instrument and the price at which the trading desk can execute the trade in the dealer market. For equity
securities, commissions related to purchases and sales are recorded in the “Other” column in the Sales and Trading Revenue table. Changes in the fair value of these securities are included in trading account profits. For debt securities, revenue, with the exception of interest associated with the debt securities, is typically included in trading account profits. Unlike commissions for equity securities, the initial revenue related to broker-dealer services for debt securities is typically included in the pricing of the instrument rather than being charged through separate fee arrangements. Therefore, this revenue is recorded in trading account profits as part of the initial mark to fair value. For derivatives, the majority of revenue is included in trading account profits. In transactions where the Corporation acts as agent, which include exchange-traded futures and options, fees are recorded in other income (loss).
Gains (losses) on certain instruments, primarily loans, that the Global Markets business segment shares with Global Banking are not considered trading instruments and are excluded from sales and trading revenue in their entirety.
The table below, which includes both derivatives and non-derivative cash instruments, identifies the amounts in the respective income statement line items attributable to the Corporation’s sales and trading revenue in Global Markets, categorized by primary risk, for 2014, 2013 and 2012. The difference between total trading account profits in the table below and in the Consolidated Statement of Income represents trading
activities in business segments other than Global Markets. This table includes debit valuation adjustment (DVA) gains (losses), net of hedges, and funding valuation adjustment (FVA) losses. Global Markets results inNote 24 – Business Segment Information are presented on a fully taxable-equivalent (FTE) basis. The table below is not presented on an FTE basis.
|
| | | | | | | | | | | | | | | |
| | | | | | | | |
| Sales and Trading Revenue | | | | | | | |
| | | | | | | | |
| | 2014 |
| (Dollars in millions) | Trading Account Profits | | Net Interest Income | | Other (1) | | Total |
| Interest rate risk | $ | 952 |
| | $ | 1,169 |
| | $ | 363 |
| | $ | 2,484 |
|
| Foreign exchange risk | 1,177 |
| | 8 |
| | (128 | ) | | 1,057 |
|
| Equity risk | 1,954 |
| | (70 | ) | | 2,318 |
| | 4,202 |
|
| Credit risk | 1,410 |
| | 2,682 |
| | 614 |
| | 4,706 |
|
| Other risk | 504 |
| | (319 | ) | | 106 |
| | 291 |
|
| Total sales and trading revenue | $ | 5,997 |
| | $ | 3,470 |
| | $ | 3,273 |
| | $ | 12,740 |
|
| | | | | | | | |
| | 2013 |
| Interest rate risk | $ | 1,120 |
| | $ | 1,104 |
| | $ | (333 | ) | | $ | 1,891 |
|
| Foreign exchange risk | 1,170 |
| | 5 |
| | (103 | ) | | 1,072 |
|
| Equity risk | 1,994 |
| | 111 |
| | 2,075 |
| | 4,180 |
|
| Credit risk | 2,083 |
| | 2,710 |
| | 78 |
| | 4,871 |
|
| Other risk | 367 |
| | (219 | ) | | 69 |
| | 217 |
|
| Total sales and trading revenue | $ | 6,734 |
| | $ | 3,711 |
| | $ | 1,786 |
| | $ | 12,231 |
|
| | | | | | | | |
| | 2012 |
| Interest rate risk | $ | (2,875 | ) | | $ | 1,039 |
| | $ | (4 | ) | | $ | (1,840 | ) |
| Foreign exchange risk | 909 |
| | 5 |
| | 5 |
| | 919 |
|
| Equity risk | 259 |
| | (57 | ) | | 1,891 |
| | 2,093 |
|
| Credit risk | 2,514 |
| | 2,321 |
| | 961 |
| | 5,796 |
|
| Other risk | 4,899 |
| | (227 | ) | | (5,148 | ) | | (476 | ) |
| Total sales and trading revenue | $ | 5,706 |
| | $ | 3,081 |
| | $ | (2,295 | ) | | $ | 6,492 |
|
| |
(1) | Represents amounts in investment and brokerage services and other income (loss) that are recorded in Global Markets and included in the definition of sales and trading revenue. Includes investment and brokerage services revenue of $2.2 billion, $2.0 billion and $1.8 billion for 2014, 2013 and 2012, respectively. |
Credit Derivatives
The Corporation enters into credit derivatives primarily to facilitate client transactions and to manage credit risk exposures. Credit derivatives derive value based on an underlying third-party referenced obligation or a portfolio of referenced obligations and generally require the Corporation, as the seller of credit protection, to make payments to a buyer upon the occurrence of a pre-defined credit event. Such credit events generally include bankruptcy of
the referenced credit entity and failure to pay under the obligation, as well as acceleration of indebtedness and payment repudiation or moratorium. For credit derivatives based on a portfolio of referenced credits or credit indices, the Corporation may not be required to make payment until a specified amount of loss has occurred and/or may only be required to make payment up to a specified amount.
Credit derivative instruments where the Corporation is the seller of credit protection and their expiration at December 31, 2014 and 2013 are summarized in the table below. These instruments are classified as investment and non-investment grade based on the credit quality of the underlying referenced
obligation. The Corporation considers ratings of BBB- or higher as investment grade. Non-investment grade includes non-rated credit derivative instruments. The Corporation discloses internal categorizations of investment grade and non-investment grade consistent with how risk is managed for these instruments.
|
| | | | | | | | | | | | | | | | | | | |
| | | | | | | | | | |
| Credit Derivative Instruments | |
| | |
| | December 31, 2014 |
| | Carrying Value |
| (Dollars in millions) | Less than One Year | | One to Three Years | | Three to Five Years | | Over Five Years | | Total |
| Credit default swaps: | |
| | |
| | |
| | |
| | |
|
| Investment grade | $ | 100 |
| | $ | 714 |
| | $ | 1,455 |
| | $ | 939 |
| | $ | 3,208 |
|
| Non-investment grade | 916 |
| | 2,107 |
| | 1,338 |
| | 4,301 |
| | 8,662 |
|
| Total | 1,016 |
| | 2,821 |
| | 2,793 |
| | 5,240 |
| | 11,870 |
|
| Total return swaps/other: | |
| | |
| | |
| | |
| | |
|
| Investment grade | 24 |
| | — |
| | — |
| | — |
| | 24 |
|
| Non-investment grade | 64 |
| | 247 |
| | 2 |
| | — |
| | 313 |
|
| Total | 88 |
| | 247 |
| | 2 |
| | — |
| | 337 |
|
| Total credit derivatives | $ | 1,104 |
| | $ | 3,068 |
| | $ | 2,795 |
| | $ | 5,240 |
| | $ | 12,207 |
|
| Credit-related notes: | |
| | |
| | |
| | |
| | |
|
| Investment grade | $ | 2 |
| | $ | 365 |
| | $ | 568 |
| | $ | 2,634 |
| | $ | 3,569 |
|
| Non-investment grade | 5 |
| | 141 |
| | 85 |
| | 1,443 |
| | 1,674 |
|
| Total credit-related notes | $ | 7 |
| | $ | 506 |
| | $ | 653 |
| | $ | 4,077 |
| | $ | 5,243 |
|
| | Maximum Payout/Notional |
| Credit default swaps: | |
| | |
| | |
| | |
| | |
|
| Investment grade | $ | 132,974 |
| | $ | 342,914 |
| | $ | 242,728 |
| | $ | 28,982 |
| | $ | 747,598 |
|
| Non-investment grade | 54,326 |
| | 170,580 |
| | 80,011 |
| | 20,586 |
| | 325,503 |
|
| Total | 187,300 |
| | 513,494 |
| | 322,739 |
| | 49,568 |
| | 1,073,101 |
|
| Total return swaps/other: | |
| | |
| | |
| | |
| | |
|
| Investment grade | 22,645 |
| | — |
| | — |
| | — |
| | 22,645 |
|
| Non-investment grade | 23,839 |
| | 10,792 |
| | 3,268 |
| | 487 |
| | 38,386 |
|
| Total | 46,484 |
| | 10,792 |
| | 3,268 |
| | 487 |
| | 61,031 |
|
| Total credit derivatives | $ | 233,784 |
| | $ | 524,286 |
| | $ | 326,007 |
| | $ | 50,055 |
| | $ | 1,134,132 |
|
|
| | | | | | | | | | | | | | | | | | | |
| | December 31, 2013 |
| | Carrying Value |
| Credit default swaps: | |
| | |
| | |
| | |
| | |
|
| Investment grade | $ | 2 |
| | $ | 220 |
| | $ | 974 |
| | $ | 1,134 |
| | $ | 2,330 |
|
| Non-investment grade | 424 |
| | 1,924 |
| | 2,469 |
| | 6,667 |
| | 11,484 |
|
| Total | 426 |
| | 2,144 |
| | 3,443 |
| | 7,801 |
| | 13,814 |
|
| Total return swaps/other: | |
| | |
| | |
| | |
| | |
|
| Investment grade | 22 |
| | — |
| | — |
| | — |
| | 22 |
|
| Non-investment grade | 29 |
| | 38 |
| | 2 |
| | 86 |
| | 155 |
|
| Total | 51 |
| | 38 |
| | 2 |
| | 86 |
| | 177 |
|
| Total credit derivatives | $ | 477 |
| | $ | 2,182 |
| | $ | 3,445 |
| | $ | 7,887 |
| | $ | 13,991 |
|
| Credit-related notes: | |
| | |
| | |
| | |
| | |
|
| Investment grade | $ | — |
| | $ | 278 |
| | $ | 595 |
| | $ | 4,457 |
| | $ | 5,330 |
|
| Non-investment grade | 145 |
| | 107 |
| | 756 |
| | 946 |
| | 1,954 |
|
| Total credit-related notes | $ | 145 |
| | $ | 385 |
| | $ | 1,351 |
| | $ | 5,403 |
| | $ | 7,284 |
|
| | Maximum Payout/Notional |
| Credit default swaps: | |
| | |
| | |
| | |
| | |
|
| Investment grade | $ | 170,764 |
| | $ | 379,273 |
| | $ | 411,426 |
| | $ | 36,039 |
| | $ | 997,502 |
|
| Non-investment grade | 53,316 |
| | 90,986 |
| | 95,319 |
| | 28,257 |
| | 267,878 |
|
| Total | 224,080 |
| | 470,259 |
| | 506,745 |
| | 64,296 |
| | 1,265,380 |
|
| Total return swaps/other: | |
| | |
| | |
| | |
| | |
|
| Investment grade | 21,771 |
| | — |
| | — |
| | — |
| | 21,771 |
|
| Non-investment grade | 27,784 |
| | 8,150 |
| | 4,103 |
| | 1,599 |
| | 41,636 |
|
| Total | 49,555 |
| | 8,150 |
| | 4,103 |
| | 1,599 |
| | 63,407 |
|
| Total credit derivatives | $ | 273,635 |
| | $ | 478,409 |
| | $ | 510,848 |
| | $ | 65,895 |
| | $ | 1,328,787 |
|
The notional amount represents the maximum amount payable by the Corporation for most credit derivatives. However, the Corporation does not monitor its exposure to credit derivatives based solely on the notional amount because this measure does not take into consideration the probability of occurrence. As such, the notional amount is not a reliable indicator of the Corporation’s exposure to these contracts. Instead, a risk framework is used to define risk tolerances and establish limits to help ensure that certain credit risk-related losses occur within acceptable, predefined limits.
The Corporation manages its market risk exposure to credit derivatives by entering into a variety of offsetting derivative contracts and security positions. For example, in certain instances, the Corporation may purchase credit protection with identical underlying referenced names to offset its exposure. The carrying value and notional amount of written credit derivatives for which the Corporation held purchased credit derivatives with identical underlying referenced names and terms were $5.7 billion and $880.6 billion at December 31, 2014 and $8.1 billion and $1.0 trillion at December 31, 2013.
Credit-related notes in the table on page 167 include investments in securities issued by collateralized debt obligation (CDO), collateralized loan obligation (CLO) and credit-linked note vehicles. These instruments are primarily classified as trading securities. The carrying value of these instruments equals the Corporation’s maximum exposure to loss. The Corporation is not obligated to make any payments to the entities under the terms of the securities owned.
Credit-related Contingent Features and Collateral
The Corporation executes the majority of its derivative contracts in the OTC market with large, international financial institutions, including broker-dealers and, to a lesser degree, with a variety of non-financial companies. Substantially all of the derivative transactions are executed on a daily margin basis. Therefore, events such as a credit rating downgrade (depending on the ultimate rating level) or a breach of credit covenants would typically require an increase in the amount of collateral required of the counterparty, where applicable, and/or allow the Corporation to take additional protective measures such as early termination of all trades. Further, as previously discussed on page 160, the Corporation enters into legally enforceable master netting agreements which reduce risk by permitting the closeout and netting of transactions with the same counterparty upon the occurrence of certain events.
A majority of the Corporation’s derivative contracts contain credit risk-related contingent features, primarily in the form of ISDA master netting agreements and credit support documentation that enhance the creditworthiness of these instruments compared to other obligations of the respective counterparty with whom the Corporation has transacted. These contingent features may be for the benefit of the Corporation as well as its counterparties with respect to changes in the Corporation’s creditworthiness and the mark-to-market exposure under the derivative transactions. At December 31, 2014 and 2013, the Corporation held cash and securities collateral of $82.0 billion and $74.4 billion, and posted
cash and securities collateral of $67.9 billion and $56.1 billion in the normal course of business under derivative agreements.
In connection with certain OTC derivative contracts and other trading agreements, the Corporation can be required to provide additional collateral or to terminate transactions with certain counterparties in the event of a downgrade of the senior debt ratings of the Corporation or certain subsidiaries. The amount of additional collateral required depends on the contract and is usually a fixed incremental amount and/or the market value of the exposure.
At December 31, 2014, the amount of collateral, calculated based on the terms of the contracts, that the Corporation and certain subsidiaries could be required to post to counterparties but had not yet posted to counterparties was approximately $1.4 billion, including $670 million for Bank of America, N.A. (BANA).
Some counterparties are currently able to unilaterally terminate certain contracts, or the Corporation or certain subsidiaries may be required to take other action such as find a suitable replacement or obtain a guarantee. At December 31, 2014, the current liability recorded for these derivative contracts was $84 million, against which the Corporation and certain subsidiaries had posted approximately $54 million of collateral.
The table below presents the amount of additional collateral that would have been contractually required by derivative contracts and other trading agreements at December 31, 2014if the rating agencies had downgraded their long-term senior debt ratings for the Corporation or certain subsidiaries by one incremental notch and by an additional second incremental notch.
|
| | | | | | |
| | | |
| Additional Collateral Required to be Posted Upon Downgrade |
| | | |
| | December 31, 2014 |
| (Dollars in millions) | One incremental notch | Second incremental notch |
| Bank of America Corporation | $ | 1,402 |
| $ | 2,825 |
|
Bank of America, N.A. and subsidiaries (1) | 1,072 |
| 1,886 |
|
| |
(1) | Included in Bank of America Corporation collateral requirements in this table. |
The table below presents the derivative liabilities that would be subject to unilateral termination by counterparties and the amounts of collateral that would have been contractually required at December 31, 2014if the long-term senior debt ratings for the Corporation or certain subsidiaries had been lower by one incremental notch and by an additional second incremental notch.
|
| | | | | | |
| | | |
| Derivative Liabilities Subject to Unilateral Termination Upon Downgrade |
| | | |
| | December 31, 2014 |
| (Dollars in millions) | One incremental notch | Second incremental notch |
| Derivative liability | $ | 1,785 |
| $ | 3,850 |
|
| Collateral posted | 1,520 |
| 2,986 |
|
Valuation Adjustments on Derivatives
The Corporation records credit risk valuation adjustments on derivatives in order to properly reflect the credit quality of the counterparties and its own credit quality. The Corporation calculates valuation adjustments on derivatives based on a modeled expected exposure that incorporates current market risk factors. The exposure also takes into consideration credit mitigants such as enforceable master netting agreements and collateral. CDS spread data is used to estimate the default probabilities and severities that are applied to the exposures. Where no observable credit default data is available for counterparties, the Corporation uses proxies and other market data to estimate default probabilities and severity.
Valuation adjustments on derivatives are affected by changes in market spreads, non-credit-related market factors such as interest rate and currency changes that affect the expected exposure, and other factors like changes in collateral arrangements and partial payments. Credit spreads and non-credit factors can move independently. For example, for an interest rate swap, changes in interest rates may increase the expected exposure, which would increase the counterparty credit valuation adjustment (CVA). Independently, counterparty credit spreads may tighten, which would result in an offsetting decrease to CVA.
The Corporation enters into risk management activities to offset market driven exposures. The Corporation often hedges the counterparty spread risk in CVA with CDS. The Corporation hedges other market risks in both CVA and DVA primarily with currency and interest rate swaps. Since the components of the valuation adjustments on derivatives move independently and the Corporation may not hedge all of the market-driven exposures, the
effect of a hedge may increase the gains or losses relating to valuation adjustments on derivatives or may result in a gross gain from valuation adjustments on derivatives becoming a negative adjustment (or the reverse).
In 2014, the Corporation adopted FVA into valuation estimates primarily to include funding costs on uncollateralized derivatives and derivatives where the Corporation is not permitted to use the collateral it receives. The change in estimate resulted in a net pretax FVA charge of $497 million including a charge of $632 million related to funding costs associated with derivative asset exposures, partially offset by a funding benefit of $135 million related to derivative liability exposures. The net FVA charge was recorded as a reduction to sales and trading revenue in Global Markets. The Corporation calculated this valuation adjustment based on modeled expected exposure profiles discounted for the funding risk premium inherent in these derivatives. FVA related to derivative assets and liabilities is the effect of funding costs on the fair value of these derivatives.
The table below presents CVA, DVA and FVA gains (losses) on derivatives, which are recorded in trading account profits, on a gross and net of hedge basis for 2014, 2013 and 2012. CVA gains reduce the cumulative CVA thereby increasing the derivative assets balance. DVA gains increase the cumulative DVA thereby decreasing the derivative liabilities balance. CVA and DVA losses have the opposite impact. FVA gains related to derivative assets reduce the cumulative FVA thereby increasing the derivative assets balance. FVA gains related to derivative liabilities increase the cumulative FVA thereby decreasing the derivative liabilities balance.
|
| | | | | | | | | | | | | | | | | | | | |
| | | | | | | | | |
| Valuation Adjustments on Derivatives |
| Gains (Losses) | | | | | | | | |
| | 2014 | | 2013 | | 2012 |
| (Dollars in millions) | Gross | Net | | Gross | Net | | Gross | Net |
Derivative assets (CVA) (1) | $ | (22 | ) | $ | 191 |
| | $ | 738 |
| $ | (96 | ) | | $ | 1,022 |
| $ | 291 |
|
Derivative assets (FVA) (2) | (632 | ) | (632 | ) | | n/a |
| n/a |
| | n/a |
| n/a |
|
Derivative liabilities (DVA) (3) | (28 | ) | (150 | ) | | (39 | ) | (75 | ) | | (2,212 | ) | (2,477 | ) |
Derivative liabilities (FVA) (2) | 135 |
| 135 |
| | n/a |
| n/a |
| | n/a |
| n/a |
|
| |
(1) | At December 31, 2014, 2013 and 2012, the cumulative CVA reduced the derivative assets balance by $1.6 billion, $1.6 billion and $2.4 billion, respectively. |
| |
(2) | FVA was adopted in 2014 and the cumulative FVA reduced the net derivatives balance by $497 million. |
| |
(3) | At December 31, 2014, 2013 and 2012, the cumulative DVA reduced the derivative liabilities balance by $0.8 billion, $0.8 billion and $0.8 billion, respectively. |
n/a = not applicable
The table below presents the amortized cost, gross unrealized gains and losses, and fair value of available-for-sale (AFS) debt securities, other debt securities carried at fair value, HTM debt securities and AFS marketable equity securities at December 31, 2014 and 2013.
|
| | | | | | | | | | | | | | | |
| | | | | | | | |
| Debt Securities and Available-for-Sale Marketable Equity Securities | | | | |
| | |
| | December 31, 2014 |
| (Dollars in millions) | Amortized Cost | | Gross
Unrealized Gains | | Gross
Unrealized Losses | | Fair Value |
| Available-for-sale debt securities | | | | | | | |
| U.S. Treasury and agency securities | $ | 69,267 |
| | $ | 360 |
| | $ | (32 | ) | | $ | 69,595 |
|
| Mortgage-backed securities: | | | | | | | |
|
| Agency | 163,592 |
| | 2,040 |
| | (593 | ) | | 165,039 |
|
| Agency-collateralized mortgage obligations | 14,175 |
| | 152 |
| | (79 | ) | | 14,248 |
|
Non-agency residential (1) | 4,244 |
| | 287 |
| | (77 | ) | | 4,454 |
|
| Commercial | 3,931 |
| | 69 |
| | — |
| | 4,000 |
|
| Non-U.S. securities | 6,208 |
| | 33 |
| | (11 | ) | | 6,230 |
|
| Corporate/Agency bonds | 361 |
| | 9 |
| | (2 | ) | | 368 |
|
| Other taxable securities, substantially all asset-backed securities | 10,774 |
| | 39 |
| | (22 | ) | | 10,791 |
|
| Total taxable securities | 272,552 |
| | 2,989 |
| | (816 | ) | | 274,725 |
|
| Tax-exempt securities | 9,556 |
| | 12 |
| | (19 | ) | | 9,549 |
|
| Total available-for-sale debt securities | 282,108 |
| | 3,001 |
| | (835 | ) | | 284,274 |
|
| Other debt securities carried at fair value | 36,524 |
| | 261 |
| | (364 | ) | | 36,421 |
|
| Total debt securities carried at fair value | 318,632 |
| | 3,262 |
| | (1,199 | ) | | 320,695 |
|
| Held-to-maturity debt securities, substantially all U.S. agency mortgage-backed securities | 59,766 |
| | 486 |
| | (611 | ) | | 59,641 |
|
| Total debt securities | $ | 378,398 |
| | $ | 3,748 |
| | $ | (1,810 | ) | | $ | 380,336 |
|
Available-for-sale marketable equity securities (2) | $ | 336 |
| | $ | 27 |
| | $ | — |
| | $ | 363 |
|
| | | | | | | | |
| | December 31, 2013 |
| Available-for-sale debt securities | | | | | | | |
| U.S. Treasury and agency securities | $ | 8,910 |
| | $ | 106 |
| | $ | (62 | ) | | $ | 8,954 |
|
| Mortgage-backed securities: | |
| | |
| | |
| | |
|
| Agency | 170,112 |
| | 777 |
| | (5,954 | ) | | 164,935 |
|
| Agency-collateralized mortgage obligations | 22,731 |
| | 76 |
| | (315 | ) | | 22,492 |
|
Non-agency residential (1) | 6,124 |
| | 238 |
| | (123 | ) | | 6,239 |
|
| Commercial | 2,429 |
| | 63 |
| | (12 | ) | | 2,480 |
|
| Non-U.S. securities | 7,207 |
| | 37 |
| | (24 | ) | | 7,220 |
|
| Corporate/Agency bonds | 860 |
| | 20 |
| | (7 | ) | | 873 |
|
| Other taxable securities, substantially all asset-backed securities | 16,805 |
| | 30 |
| | (5 | ) | | 16,830 |
|
| Total taxable securities | 235,178 |
| | 1,347 |
| | (6,502 | ) | | 230,023 |
|
| Tax-exempt securities | 5,967 |
| | 10 |
| | (49 | ) | | 5,928 |
|
| Total available-for-sale debt securities | 241,145 |
| | 1,357 |
| | (6,551 | ) | | 235,951 |
|
| Other debt securities carried at fair value | 34,145 |
| | 34 |
| | (1,335 | ) | | 32,844 |
|
| Total debt securities carried at fair value | 275,290 |
| | 1,391 |
| | (7,886 | ) | | 268,795 |
|
| Held-to-maturity debt securities, substantially all U.S. agency mortgage-backed securities | 55,150 |
| | 20 |
| | (2,740 | ) | | 52,430 |
|
| Total debt securities | $ | 330,440 |
| | $ | 1,411 |
| | $ | (10,626 | ) | | $ | 321,225 |
|
Available-for-sale marketable equity securities (2) | $ | 230 |
| | $ | — |
| | $ | (7 | ) | | $ | 223 |
|
| |
(1) | At December 31, 2014 and 2013, the underlying collateral type included approximately 76 percent and 89 percent prime, 14 percent and seven percent Alt-A, and 10 percent and four percent subprime. |
| |
(2) | Classified in other assets on the Consolidated Balance Sheet. |
At December 31, 2014, the accumulated net unrealized gain on AFS debt securities included in accumulated OCI was $1.3 billion, net of the related income taxes of $823 million. At December 31, 2014 and 2013, the Corporation had nonperforming AFS debt securities of $161 million and $103 million.
The table below presents the components of other debt securities carried at fair value where the changes in fair value are reported in other income. In 2014, the Corporation recorded unrealized mark-to-market net gains in other income of$1.2 billion and realized gains of $275 millionon other debt securities carried at fair value, which exclude the impact of certain hedges, the results of which are also reported in other income, compared to unrealized mark-to-market net losses of $1.3 billion and realized losses of $963 million in 2013.
|
| | | | | | | |
| | | | |
| Other Debt Securities Carried at Fair Value |
| | | | |
| | December 31 |
| (Dollars in millions) | 2014 | | 2013 |
| U.S. Treasury and agency securities | $ | 1,541 |
| | $ | 4,062 |
|
| Mortgage-backed securities: | | | |
| Agency | 15,704 |
| | 16,500 |
|
| Agency-collateralized mortgage obligations | — |
| | 218 |
|
| Non-agency residential | 3,745 |
| | — |
|
| Commercial | — |
| | 749 |
|
Non-U.S. securities (1) | 15,132 |
| | 11,315 |
|
| Other taxable securities, substantially all asset-backed securities | 299 |
| | — |
|
| Total | $ | 36,421 |
| | $ | 32,844 |
|
| |
(1) | These securities are primarily used to satisfy certain international regulatory liquidity requirements. |
The table below presents gross realized gains and losses on sales of AFS debt securities for 2014, 2013 and 2012.
|
| | | | | | | | | | | |
| | | | | | |
| Gains and Losses on Sales of AFS Debt Securities |
| | | | | | |
| (Dollars in millions) | 2014 | | 2013 | | 2012 |
| Gross gains | $ | 1,366 |
| | $ | 1,302 |
| | $ | 2,128 |
|
| Gross losses | (12 | ) | | (31 | ) | | (466 | ) |
| Net gains on sales of AFS debt securities | $ | 1,354 |
| | $ | 1,271 |
| | $ | 1,662 |
|
| Income tax expense attributable to realized net gains on sales of AFS debt securities | $ | 515 |
| | $ | 470 |
| | $ | 615 |
|
The table below presents the amortized cost and fair value of the Corporation’s debt securities carried at fair value and HTM debt securities from Fannie Mae (FNMA), the Government National Mortgage Association (GNMA), U.S. Treasury and Freddie Mac (FHLMC), where the investment exceeded 10 percent of consolidated shareholders’ equity at December 31, 2014 and 2013.
|
| | | | | | | | | | | | | | | |
| | | | | | | | |
| Selected Securities Exceeding 10 Percent of Shareholders’ Equity |
| | | | | | | | |
| | December 31 |
| | 2014 | | 2013 |
| (Dollars in millions) | Amortized Cost | | Fair Value | | Amortized Cost | | Fair Value |
| Fannie Mae | $ | 130,725 |
| | $ | 131,418 |
| | $ | 123,813 |
| | $ | 118,708 |
|
| Government National Mortgage Association | 98,278 |
| | 98,633 |
| | 118,700 |
| | 115,314 |
|
| U.S. Treasury | 68,481 |
| | 68,801 |
| | 10,533 |
| | 10,428 |
|
| Freddie Mac | 28,288 |
| | 28,556 |
| | 24,908 |
| | 24,075 |
|
The table below presents the fair value and the associated gross unrealized losses on AFS debt securities and whether these securities have had gross unrealized losses for less than 12 months or for 12 months or longer at December 31, 2014 and 2013.
|
| | | | | | | | | | | | | | | | | | | | | | | |
| | | | | | | | | | | | |
| Temporarily Impaired and Other-than-temporarily Impaired AFS Debt Securities | | | | | | |
| | | | | | | | | | | | |
| | December 31, 2014 |
| | Less than Twelve Months | | Twelve Months or Longer | | Total |
| (Dollars in millions) | Fair Value | | Gross Unrealized Losses | | Fair Value | | Gross Unrealized Losses | | Fair Value | | Gross Unrealized Losses |
| Temporarily impaired available-for-sale debt securities | |
| | |
| | |
| | |
| | |
| | |
|
| U.S. Treasury and agency securities | $ | 10,121 |
| | $ | (22 | ) | | $ | 667 |
| | $ | (10 | ) | | $ | 10,788 |
| | $ | (32 | ) |
| Mortgage-backed securities: | | | | | | | | | | | |
| Agency | 1,366 |
| | (8 | ) | | 43,118 |
| | (585 | ) | | 44,484 |
| | (593 | ) |
| Agency-collateralized mortgage obligations | 2,242 |
| | (19 | ) | | 3,075 |
| | (60 | ) | | 5,317 |
| | (79 | ) |
| Non-agency residential | 307 |
| | (3 | ) | | 809 |
| | (41 | ) | | 1,116 |
| | (44 | ) |
| Non-U.S. securities | 157 |
| | (9 | ) | | 32 |
| | (2 | ) | | 189 |
| | (11 | ) |
| Corporate/Agency bonds | 43 |
| | (1 | ) | | 93 |
| | (1 | ) | | 136 |
| | (2 | ) |
| Other taxable securities, substantially all asset-backed securities | 575 |
| | (3 | ) | | 1,080 |
| | (19 | ) | | 1,655 |
| | (22 | ) |
| Total taxable securities | 14,811 |
| | (65 | ) | | 48,874 |
| | (718 | ) | | 63,685 |
| | (783 | ) |
| Tax-exempt securities | 980 |
| | (1 | ) | | 680 |
| | (18 | ) | | 1,660 |
| | (19 | ) |
| Total temporarily impaired available-for-sale debt securities | 15,791 |
| | (66 | ) | | 49,554 |
| | (736 | ) | | 65,345 |
| | (802 | ) |
Other-than-temporarily impaired available-for-sale debt securities (1) | | | | | | | | | | | |
| Non-agency residential mortgage-backed securities | 555 |
| | (33 | ) | | — |
| | — |
| | 555 |
| | (33 | ) |
Total temporarily impaired and other-than-temporarily impaired available-for-sale debt securities | $ | 16,346 |
| | $ | (99 | ) | | $ | 49,554 |
| | $ | (736 | ) | | $ | 65,900 |
| | $ | (835 | ) |
| | | | | | | | | | | | |
| | December 31, 2013 |
| Temporarily impaired available-for-sale debt securities | | | | | | | | | | | |
| U.S. Treasury and agency securities | $ | 5,770 |
| | $ | (61 | ) | | $ | 19 |
| | $ | (1 | ) | | $ | 5,789 |
| | $ | (62 | ) |
| Mortgage-backed securities: | | | | | | | | | | | |
| Agency | 132,032 |
| | (5,457 | ) | | 9,324 |
| | (497 | ) | | 141,356 |
| | (5,954 | ) |
| Agency-collateralized mortgage obligations | 13,438 |
| | (210 | ) | | 2,661 |
| | (105 | ) | | 16,099 |
| | (315 | ) |
| Non-agency residential | 819 |
| | (15 | ) | | 1,237 |
| | (106 | ) | | 2,056 |
| | (121 | ) |
| Commercial | 286 |
| | (12 | ) | | — |
| | — |
| | 286 |
| | (12 | ) |
| Non-U.S. securities | — |
| | — |
| | 45 |
| | (24 | ) | | 45 |
| | (24 | ) |
| Corporate/Agency bonds | 106 |
| | (3 | ) | | 282 |
| | (4 | ) | | 388 |
| | (7 | ) |
| Other taxable securities, substantially all asset-backed securities | 116 |
| | (2 | ) | | 280 |
| | (3 | ) | | 396 |
| | (5 | ) |
| Total taxable securities | 152,567 |
| | (5,760 | ) | | 13,848 |
| | (740 | ) | | 166,415 |
| | (6,500 | ) |
| Tax-exempt securities | 1,789 |
| | (30 | ) | | 990 |
| | (19 | ) | | 2,779 |
| | (49 | ) |
| Total temporarily impaired available-for-sale debt securities | 154,356 |
| | (5,790 | ) | | 14,838 |
| | (759 | ) | | 169,194 |
| | (6,549 | ) |
Other-than-temporarily impaired available-for-sale debt securities (1) | | | | | | | | | | | |
| Non-agency residential mortgage-backed securities | 2 |
| | (1 | ) | | 1 |
| | (1 | ) | | 3 |
| | (2 | ) |
Total temporarily impaired and other-than-temporarily impaired available-for-sale debt securities | $ | 154,358 |
| | $ | (5,791 | ) | | $ | 14,839 |
| | $ | (760 | ) | | $ | 169,197 |
| | $ | (6,551 | ) |
| |
(1) | Includes other-than-temporarily impaired AFS debt securities on which an OTTI loss, primarily related to changes in interest rates, remains in accumulated OCI. |
The Corporation recorded other-than-temporary impairment (OTTI) losses on AFS debt securities in 2014, 2013 and 2012 as presented in the Net Impairment Losses Recognized in Earnings table. Substantially all OTTI losses in 2014, 2013 and 2012 consisted of credit losses on non-agency residential mortgage-backed securities (RMBS) and were recorded in other income in the Consolidated Statement of Income. A debt security is impaired when its fair value is less than its amortized cost. If the Corporation intends or will more-likely-than-not be required to sell a debt security prior to recovery, the entire impairment loss is recorded in the Consolidated Statement of Income. For AFS debt securities the Corporation does not intend or will not more-likely-than-not be required to sell, an analysis is performed to determine if any of the impairment is due to credit or whether it is due to other factors (e.g., interest rate). Credit losses are considered unrecoverable and are recorded in the Consolidated Statement of Income with the remaining unrealized losses recorded in OCI. In certain instances, the credit loss on a debt security may exceed the total
impairment, in which case, the excess of the credit loss over the total impairment is recorded as an unrealized gain in OCI.
|
| | | | | | | | | | | |
| | | | | | |
| Net Impairment Losses Recognized in Earnings |
| | | | | | |
| (Dollars in millions) | 2014 | | 2013 | | 2012 |
| Total OTTI losses (unrealized and realized) | $ | (30 | ) | | $ | (21 | ) | | $ | (57 | ) |
| Unrealized OTTI losses recognized in OCI | 14 |
| | 1 |
| | 4 |
|
| Net impairment losses recognized in earnings | $ | (16 | ) | | $ | (20 | ) | | $ | (53 | ) |
The table below presents a rollforward of the credit losses recognized in earnings in 2014, 2013 and 2012 on AFS debt securities that the Corporation does not have the intent to sell or will not more-likely-than-not be required to sell.
|
| | | | | | | | | | | |
| | | | | | |
| Rollforward of Credit Losses Recognized | | | | |
| | | | | | |
| (Dollars in millions) | 2014 | | 2013 | | 2012 |
| Balance, January 1 | $ | 184 |
| | $ | 243 |
| | $ | 310 |
|
| Additions for credit losses recognized on AFS debt securities that had no previous impairment losses | 14 |
| | 6 |
| | 7 |
|
| Additions for credit losses recognized on AFS debt securities that had previously incurred impairment losses | 2 |
| | 14 |
| | 46 |
|
| Reductions for AFS debt securities matured, sold or intended to be sold | — |
| | (79 | ) | | (120 | ) |
| Balance, December 31 | $ | 200 |
| | $ | 184 |
| | $ | 243 |
|
The Corporation estimates the portion of a loss on a security that is attributable to credit using a discounted cash flow model and estimates the expected cash flows of the underlying collateral using internal credit, interest rate and prepayment risk models that incorporate management’s best estimate of current key assumptions such as default rates, loss severity and prepayment rates. Assumptions used for the underlying loans that support the mortgage-backed securities (MBS) can vary widely from loan to loan and are influenced by such factors as loan interest rate, geographic location of the borrower, borrower characteristics and collateral type. Based on these assumptions, the Corporation then determines how the underlying collateral cash flows will be distributed to each MBS issued from the applicable special purpose entity. Expected principal and interest cash flows on an impaired AFS debt security are discounted using the effective yield of each individual impaired AFS debt security.
Significant assumptions used in estimating the expected cash flows for measuring credit losses on non-agency RMBS were as follows at December 31, 2014.
|
| | | | | | | | |
| | | | | | |
| Significant Assumptions |
| | | | | | |
| | | | Range (1) |
| | Weighted-
average | | 10th Percentile (2) | | 90th Percentile (2) |
| Prepayment speed | 15.3 | % | | 3.1 | % | | 29.9 | % |
| Loss severity | 35.2 |
| | 11.8 |
| | 44.7 |
|
| Life default rate | 39.6 |
| | 1.5 |
| | 98.6 |
|
| |
(1) | Represents the range of inputs/assumptions based upon the underlying collateral. |
| |
(2) | The value of a variable below which the indicated percentile of observations will fall. |
Annual constant prepayment speed and loss severity rates are projected considering collateral characteristics such as loan-to-value (LTV), creditworthiness of borrowers as measured using FICO scores, and geographic concentrations. The weighted-average severity by collateral type was 31.0 percent for prime, 34.1 percent for Alt-A and 45.0 percent for subprime at December 31, 2014. Additionally, default rates are projected by considering collateral characteristics including, but not limited to, LTV, FICO and geographic concentration. Weighted-average life default rates by collateral type were 24.5 percent for prime, 42.4 percent for Alt-A and 42.0 percent for subprime at December 31, 2014.
The expected maturity distribution of the Corporation’s MBS, the contractual maturity distribution of the Corporation’s other debt securities carried at fair value and HTM debt securities, and the yields on the Corporation’s debt securities carried at fair value and HTM debt securities at December 31, 2014 are summarized in the table below. Actual maturities may differ from the contractual or expected maturities since borrowers may have the right to prepay obligations with or without prepayment penalties.
|
| | | | | | | | | | | | | | | | | | | | | | | | | | | | | | | | | | |
| | | | | | | | | | | | | | | | | | | | |
| Maturities of Debt Securities Carried at Fair Value and Held-to-maturity Debt Securities |
| | | | | | | | | | | | | | | | | | | | |
| | December 31, 2014 |
| | Due in One Year or Less | | Due after One Year through Five Years | | Due after Five Years through Ten Years | | Due after Ten Years | | Total |
| (Dollars in millions) | Amount | | Yield (1) | | Amount | | Yield (1) | | Amount | | Yield (1) | | Amount | | Yield (1) | | Amount | | Yield (1) |
| Amortized cost of debt securities carried at fair value | |
| | |
| | |
| | |
| | |
| | |
| | |
| | |
| | |
| | |
|
| U.S. Treasury and agency securities | $ | 577 |
| | 0.41 | % | | $ | 51,153 |
| | 1.60 | % | | $ | 17,535 |
| | 2.10 | % | | $ | 1,480 |
| | 3.00 | % | | $ | 70,745 |
| | 1.78 | % |
| Mortgage-backed securities: | |
| | |
| | |
| | |
| | |
| | |
| | |
| | |
| | |
| | |
|
| Agency | 28 |
| | 4.60 |
| | 24,283 |
| | 2.70 |
| | 152,950 |
| | 2.80 |
| | 2,175 |
| | 3.00 |
| | 179,436 |
| | 2.80 |
|
| Agency-collateralized mortgage obligations | 794 |
| | 0.40 |
| | 2,874 |
| | 2.00 |
| | 10,488 |
| | 2.80 |
| | 19 |
| | 0.60 |
| | 14,175 |
| | 2.50 |
|
| Non-agency residential | 517 |
| | 5.09 |
| | 1,834 |
| | 5.39 |
| | 1,236 |
| | 4.78 |
| | 4,443 |
| | 10.61 |
| | 8,030 |
| | 8.15 |
|
| Commercial | 188 |
| | 9.69 |
| | 590 |
| | 2.32 |
| | 3,150 |
| | 2.80 |
| | 3 |
| | 2.83 |
| | 3,931 |
| | 3.07 |
|
| Non-U.S. securities | 18,991 |
| | 0.98 |
| | 2,261 |
| | 3.83 |
| | 68 |
| | 6.23 |
| | — |
| | — |
| | 21,320 |
| | 1.30 |
|
| Corporate/Agency bonds | 59 |
| | 1.79 |
| | 112 |
| | 3.77 |
| | 94 |
| | 3.74 |
| | 96 |
| | 0.63 |
| | 361 |
| | 2.43 |
|
| Other taxable securities, substantially all asset-backed securities | 3,199 |
| | 1.34 |
| | 5,707 |
| | 1.22 |
| | 1,376 |
| | 1.81 |
| | 796 |
| | 4.36 |
| | 11,078 |
| | 1.59 |
|
| Total taxable securities | 24,353 |
| | 1.16 |
| | 88,814 |
| | 2.07 |
| | 186,897 |
| | 2.80 |
| | 9,012 |
| | 6.86 |
| | 309,076 |
| | 2.56 |
|
| Tax-exempt securities | 929 |
| | 0.97 |
| | 3,768 |
| | 1.13 |
| | 3,082 |
| | 1.15 |
| | 1,777 |
| | 0.86 |
| | 9,556 |
| | 1.14 |
|
| Total amortized cost of debt securities carried at fair value | $ | 25,282 |
| | 1.16 |
| | $ | 92,582 |
| | 2.03 |
| | $ | 189,979 |
| | 2.77 |
| | $ | 10,789 |
| | 5.87 |
| | $ | 318,632 |
| | 2.51 |
|
Amortized cost of held-to-maturity debt securities (2) | $ | 108 |
| | 0.84 |
| | $ | 19,513 |
| | 2.40 |
| | $ | 39,917 |
| | 2.30 |
| | $ | 228 |
| | 3.31 |
| | $ | 59,766 |
| | 2.40 |
|
| | | | | | | | | | | | | | | | | | | | |
| Debt securities carried at fair value | |
| | |
| | |
| | |
| | |
| | |
| | |
| | |
| | |
| | |
|
| U.S. Treasury and agency securities | $ | 577 |
| | |
| | $ | 51,383 |
| | |
| | $ | 17,633 |
| | |
| | $ | 1,543 |
| | |
| | $ | 71,136 |
| | |
|
| Mortgage-backed securities: | |
| | |
| | |
| | |
| | |
| | |
| | |
| | |
| | |
| | |
|
| Agency | 29 |
| | |
| | 24,859 |
| | |
| | 153,649 |
| | |
| | 2,206 |
| | |
| | 180,743 |
| | |
|
| Agency-collateralized mortgage obligations | 795 |
| | |
| | 2,838 |
| | |
| | 10,596 |
| | |
| | 19 |
| | |
| | 14,248 |
| | |
|
| Non-agency residential | 521 |
| | |
| | 1,849 |
| | |
| | 1,316 |
| | |
| | 4,513 |
| | |
| | 8,199 |
| | |
|
| Commercial | 191 |
| | |
| | 594 |
| | |
| | 3,212 |
| | |
| | 3 |
| | |
| | 4,000 |
| | |
|
| Non-U.S. securities | 18,982 |
| | |
| | 2,309 |
| | |
| | 71 |
| | |
| | — |
| | |
| | 21,362 |
| | |
|
| Corporate/Agency bonds | 60 |
| | |
| | 117 |
| | |
| | 96 |
| | |
| | 95 |
| | |
| | 368 |
| | |
|
| Other taxable securities, substantially all asset-backed securities | 3,202 |
| | |
| | 5,699 |
| | |
| | 1,399 |
| | |
| | 790 |
| | |
| | 11,090 |
| | |
|
| Total taxable securities | 24,357 |
| | |
| | 89,648 |
| | |
| | 187,972 |
| | |
| | 9,169 |
| | |
| | 311,146 |
| | |
|
| Tax-exempt securities | 929 |
| | |
| | 3,770 |
| | |
| | 3,078 |
| | |
| | 1,772 |
| | |
| | 9,549 |
| | |
|
| Total debt securities carried at fair value | $ | 25,286 |
| | |
| | $ | 93,418 |
| | |
| | $ | 191,050 |
| | |
| | $ | 10,941 |
| | |
| | $ | 320,695 |
| | |
|
Fair value of held-to-maturity debt securities (2) | $ | 108 |
| | | | $ | 19,762 |
| | | | $ | 39,538 |
| | | | $ | 233 |
| | | | $ | 59,641 |
| | |
| |
(1) | Average yield is computed using the effective yield of each security at the end of the period, weighted based on the amortized cost of each security. The effective yield considers the contractual coupon, amortization of premiums and accretion of discounts, and excludes the effect of related hedging derivatives. |
| |
(2) | Substantially all U.S. agency MBS. |
Certain Corporate and Strategic Investments
The Corporation’s 49 percent investment in a merchant services joint venture, which is recorded in other assets on the Consolidated Balance Sheet and in Consumer & Business Banking, had a carrying value of $3.1 billion and $3.2 billion at December 31, 2014 and 2013. For additional information, see Note 12 – Commitments and Contingencies.
In 2013, the Corporation sold its remaining investment in China Construction Bank Corporation (CCB) and realized a pretax gain of $753 million in All Other reported in equity investment income in the Consolidated Statement of Income. The strategic assistance agreement between the Corporation and CCB, which includes cooperation in specific business areas, extends through 2016.
NOTE 4 Outstanding Loans and Leases
The following tables present total outstanding loans and leases and an aging analysis for the Corporation’s Home Loans, Credit Card and Other Consumer, and Commercial portfolio segments, by class of financing receivables, at December 31, 2014 and 2013.
|
| | | | | | | | | | | | | | | | | | | | | | | | | | | | | | | |
| | | | | | | | | | | | | | | | |
| | December 31, 2014 |
| (Dollars in millions) | 30-59 Days Past Due (1) | | 60-89 Days Past Due (1) | | 90 Days or
More Past Due (2) | | Total Past
Due 30 Days or More | | Total Current or Less Than 30 Days Past Due (3) | | Purchased
Credit-impaired (4) | | Loans Accounted for Under the Fair Value Option | | Total Outstandings |
| Home loans | |
| | | | |
| | |
| | |
| | |
| | |
| | |
|
| Core portfolio | | | | | | | | | | | | | | | |
| Residential mortgage | $ | 1,847 |
| | $ | 700 |
| | $ | 5,561 |
| | $ | 8,108 |
| | $ | 154,112 |
| | | | | | $ | 162,220 |
|
| Home equity | 218 |
| | 105 |
| | 744 |
| | 1,067 |
| | 50,820 |
| | | | | | 51,887 |
|
| Legacy Assets & Servicing portfolio | | | | | | | | | | | | | | | |
Residential mortgage (5) | 2,008 |
| | 1,060 |
| | 10,513 |
| | 13,581 |
| | 25,244 |
| | $ | 15,152 |
| | | | 53,977 |
|
| Home equity | 374 |
| | 174 |
| | 1,166 |
| | 1,714 |
| | 26,507 |
| | 5,617 |
| | | | 33,838 |
|
| Credit card and other consumer | | | | | | | | | | | | | | | |
| U.S. credit card | 494 |
| | 341 |
| | 866 |
| | 1,701 |
| | 90,178 |
| | | | | | 91,879 |
|
| Non-U.S. credit card | 49 |
| | 39 |
| | 95 |
| | 183 |
| | 10,282 |
| | | | | | 10,465 |
|
Direct/Indirect consumer (6) | 245 |
| | 71 |
| | 65 |
| | 381 |
| | 80,000 |
| | | | | | 80,381 |
|
Other consumer (7) | 11 |
| | 2 |
| | 2 |
| | 15 |
| | 1,831 |
| | | | | | 1,846 |
|
| Total consumer | 5,246 |
| | 2,492 |
| | 19,012 |
| | 26,750 |
| | 438,974 |
| | 20,769 |
| | | | 486,493 |
|
Consumer loans accounted for under the fair value option (8) | |
| | |
| | |
| | |
| | |
| | |
| | $ | 2,077 |
| | 2,077 |
|
| Total consumer loans and leases | 5,246 |
| | 2,492 |
| | 19,012 |
| | 26,750 |
| | 438,974 |
| | 20,769 |
| | 2,077 |
| | 488,570 |
|
| Commercial | | | | | | | | | | | | | | | |
| U.S. commercial | 320 |
| | 151 |
| | 318 |
| | 789 |
| | 219,504 |
| | | | | | 220,293 |
|
Commercial real estate (9) | 138 |
| | 16 |
| | 288 |
| | 442 |
| | 47,240 |
| | | | | | 47,682 |
|
| Commercial lease financing | 121 |
| | 41 |
| | 42 |
| | 204 |
| | 24,662 |
| | | | | | 24,866 |
|
| Non-U.S. commercial | 5 |
| | 4 |
| | — |
| | 9 |
| | 80,074 |
| | | | | | 80,083 |
|
| U.S. small business commercial | 88 |
| | 45 |
| | 94 |
| | 227 |
| | 13,066 |
| | | | | | 13,293 |
|
| Total commercial | 672 |
| | 257 |
| | 742 |
| | 1,671 |
| | 384,546 |
| | | | | | 386,217 |
|
Commercial loans accounted for under the fair value option (8) | |
| | |
| | |
| | |
| | |
| | |
| | 6,604 |
| | 6,604 |
|
| Total commercial loans and leases | 672 |
| | 257 |
| | 742 |
| | 1,671 |
| | 384,546 |
| | | | 6,604 |
| | 392,821 |
|
| Total loans and leases | $ | 5,918 |
| | $ | 2,749 |
| | $ | 19,754 |
| | $ | 28,421 |
| | $ | 823,520 |
| | $ | 20,769 |
| | $ | 8,681 |
| | $ | 881,391 |
|
| Percentage of outstandings | 0.67 | % | | 0.31 | % | | 2.24 | % | | 3.22 | % | | 93.44 | % | | 2.36 | % | | 0.98 | % | | 100.00 | % |
| |
(1) | Home loans 30-59 days past due includes fully-insured loans of $2.1 billion and nonperforming loans of $392 million. Home loans 60-89 days past due includes fully-insured loans of $1.1 billion and nonperforming loans of $332 million. |
| |
(2) | Home loans includes fully-insured loans of $11.4 billion. |
| |
(3) | Home loans includes $3.6 billion and direct/indirect consumer includes $27 million of nonperforming loans. |
| |
(4) | PCI loan amounts are shown gross of the valuation allowance. |
| |
(5) | Total outstandings includes pay option loans of $3.2 billion. The Corporation no longer originates this product. |
| |
(6) | Total outstandings includes dealer financial services loans of $37.7 billion, unsecured consumer lending loans of $1.5 billion, U.S. securities-based lending loans of $35.8 billion, non-U.S. consumer loans of $4.0 billion, student loans of $632 million and other consumer loans of $761 million. |
| |
(7) | Total outstandings includes consumer finance loans of $676 million, consumer leases of $1.0 billion, consumer overdrafts of $162 million and other non-U.S. consumer loans of $3 million. |
| |
(8) | Consumer loans accounted for under the fair value option were residential mortgage loans of $1.9 billion and home equity loans of $196 million. Commercial loans accounted for under the fair value option were U.S. commercial loans of $1.9 billion and non-U.S. commercial loans of $4.7 billion. For additional information, see Note 20 – Fair Value Measurements and Note 21 – Fair Value Option. |
| |
(9) | Total outstandings includes U.S. commercial real estate loans of $45.2 billion and non-U.S. commercial real estate loans of $2.5 billion. |
|
| | | | | | | | | | | | | | | | | | | | | | | | | | | | | | | |
| | | | | | | | | | | | | | | | |
| | December 31, 2013 |
| (Dollars in millions) | 30-59 Days
Past Due (1) | | 60-89 Days Past Due (1) | | 90 Days or
More
Past Due (2) | | Total Past
Due 30 Days
or More | | Total Current or Less Than 30 Days Past Due (3) | | Purchased
Credit-impaired (4) | | Loans Accounted for Under the Fair Value Option | | Total Outstandings |
| Home loans | |
| | | | |
| | |
| | |
| | |
| | |
| | |
|
| Core portfolio | | | | | | | | | | | | | | | |
| Residential mortgage | $ | 2,151 |
| | $ | 754 |
| | $ | 7,188 |
| | $ | 10,093 |
| | $ | 167,243 |
| | | | |
| | $ | 177,336 |
|
| Home equity | 243 |
| | 113 |
| | 693 |
| | 1,049 |
| | 53,450 |
| | | | |
| | 54,499 |
|
| Legacy Assets & Servicing portfolio | | | |
| | |
| | |
| | |
| | |
| | |
| | |
|
Residential mortgage (5) | 2,758 |
| | 1,412 |
| | 16,746 |
| | 20,916 |
| | 31,142 |
| | $ | 18,672 |
| | |
| | 70,730 |
|
| Home equity | 444 |
| | 221 |
| | 1,292 |
| | 1,957 |
| | 30,623 |
| | 6,593 |
| | |
| | 39,173 |
|
| Credit card and other consumer | | | |
| | |
| | |
| | |
| | |
| | |
| | |
|
| U.S. credit card | 598 |
| | 422 |
| | 1,053 |
| | 2,073 |
| | 90,265 |
| | | | |
| | 92,338 |
|
| Non-U.S. credit card | 63 |
| | 54 |
| | 131 |
| | 248 |
| | 11,293 |
| | | | |
| | 11,541 |
|
Direct/Indirect consumer (6) | 431 |
| | 175 |
| | 410 |
| | 1,016 |
| | 81,176 |
| | | | |
| | 82,192 |
|
Other consumer (7) | 24 |
| | 8 |
| | 20 |
| | 52 |
| | 1,925 |
| | | | |
| | 1,977 |
|
| Total consumer | 6,712 |
| | 3,159 |
| | 27,533 |
| | 37,404 |
| | 467,117 |
| | 25,265 |
| | |
| 529,786 |
|
Consumer loans accounted for under the fair value option (8) | | | | | | | | | | | | | $ | 2,164 |
|
| 2,164 |
|
| Total consumer loans and leases | 6,712 |
| | 3,159 |
| | 27,533 |
| | 37,404 |
| | 467,117 |
| | 25,265 |
| | 2,164 |
| | 531,950 |
|
| Commercial | | | |
| | |
| | |
| | |
| | |
| | |
| | |
|
| U.S. commercial | 363 |
| | 151 |
| | 309 |
| | 823 |
| | 211,734 |
| | | | |
| | 212,557 |
|
Commercial real estate (9) | 30 |
| | 29 |
| | 243 |
| | 302 |
| | 47,591 |
| | | | |
| | 47,893 |
|
| Commercial lease financing | 110 |
| | 37 |
| | 48 |
| | 195 |
| | 25,004 |
| | | | |
| | 25,199 |
|
| Non-U.S. commercial | 103 |
| | 8 |
| | 17 |
| | 128 |
| | 89,334 |
| | | | |
| | 89,462 |
|
| U.S. small business commercial | 87 |
| | 55 |
| | 113 |
| | 255 |
| | 13,039 |
| | | | |
| | 13,294 |
|
| Total commercial | 693 |
| | 280 |
| | 730 |
| | 1,703 |
| | 386,702 |
| | | | |
| | 388,405 |
|
Commercial loans accounted for under the fair value option (8) | | | | | | | | | | | | | 7,878 |
| | 7,878 |
|
| Total commercial loans and leases | 693 |
| | 280 |
| | 730 |
| | 1,703 |
| | 386,702 |
| | | | 7,878 |
| | 396,283 |
|
| Total loans and leases | $ | 7,405 |
| | $ | 3,439 |
| | $ | 28,263 |
| | $ | 39,107 |
| | $ | 853,819 |
| | $ | 25,265 |
| | $ | 10,042 |
| | $ | 928,233 |
|
| Percentage of outstandings | 0.80 | % | | 0.37 | % | | 3.04 | % | | 4.21 | % | | 91.99 | % | | 2.72 | % | | 1.08 | % | | 100.00 | % |
| |
(1) | Home loans 30-59 days past due includes fully-insured loans of $2.5 billion and nonperforming loans of $623 million. Home loans 60-89 days past due includes fully-insured loans of $1.2 billion and nonperforming loans of $410 million. |
| |
(2) | Home loans includes fully-insured loans of $17.0 billion. |
| |
(3) | Home loans includes $5.9 billion and direct/indirect consumer includes $33 million of nonperforming loans. |
| |
(4) | PCI loan amounts are shown gross of the valuation allowance. |
| |
(5) | Total outstandings includes pay option loans of $4.4 billion. The Corporation no longer originates this product. |
| |
(6) | Total outstandings includes dealer financial services loans of $38.5 billion, unsecured consumer lending loans of $2.7 billion, U.S. securities-based lending loans of $31.2 billion, non-U.S. consumer loans of $4.7 billion, student loans of $4.1 billion and other consumer loans of $1.0 billion. |
| |
(7) | Total outstandings includes consumer finance loans of $1.2 billion, consumer leases of $606 million, consumer overdrafts of $176 million and other non-U.S. consumer loans of $5 million. |
| |
(8) | Consumer loans accounted for under the fair value option were residential mortgage loans of $2.0 billion and home equity loans of $147 million. Commercial loans accounted for under the fair value option were U.S. commercial loans of $1.5 billion and non-U.S. commercial loans of $6.4 billion. For additional information, see Note 20 – Fair Value Measurements and Note 21 – Fair Value Option. |
| |
(9) | Total outstandings includes U.S. commercial real estate loans of $46.3 billion and non-U.S. commercial real estate loans of $1.6 billion. |
The Corporation has entered into long-term credit protection agreements with FNMA and FHLMC on loans totaling $17.2 billion and $28.2 billion at December 31, 2014 and 2013, providing full credit protection on residential mortgage loans that become severely delinquent. All of these loans are individually insured and therefore the Corporation does not record an allowance for credit losses related to these loans.
Nonperforming Loans and Leases
The Corporation classifies junior-lien home equity loans as nonperforming when the first-lien loan becomes 90 days past due even if the junior-lien loan is performing. At December 31, 2014 and 2013, $800 million and $1.2 billion of such junior-lien home equity loans were included in nonperforming loans.
The Corporation classifies consumer real estate loans that have been discharged in Chapter 7 bankruptcy and not reaffirmed by the borrower as troubled debt restructurings (TDRs), irrespective of payment history or delinquency status, even if the repayment terms for the loan have not been otherwise modified. The
Corporation continues to have a lien on the underlying collateral. At December 31, 2014, nonperforming loans discharged in Chapter 7 bankruptcy with no change in repayment terms were $1.4 billion of which $901 million were current on their contractual payments, while $395 million were 90 days or more past due. Of the contractually current nonperforming loans, more than 80 percent were discharged in Chapter 7 bankruptcy more than 12 months ago, and more than 60 percent were discharged 24 months or more ago. As subsequent cash payments are received on the loans that are contractually current, the interest component of the payments is generally recorded as interest income on a cash basis and the principal component is recorded as a reduction in the carrying value of the loan.
Excluding purchased credit-impaired (PCI) loans, the Corporation sold nonperforming and other delinquent consumer loans with a carrying value, excluding the related allowance, of $4.8 billion and $2.0 billion, and recognized gains of $247 million and $58 million recorded in noninterest income, during 2014 and 2013.
The table below presents the Corporation’s nonperforming loans and leases including nonperforming TDRs, and loans accruing past due 90 days or more at December 31, 2014 and 2013. Nonperforming loans held-for-sale (LHFS) are excluded from
nonperforming loans and leases as they are recorded at either fair value or the lower of cost or fair value. For more information on the criteria for classification as nonperforming, see Note 1 – Summary of Significant Accounting Principles.
|
| | | | | | | | | | | | | | | |
| | | | | | | | |
| Credit Quality | | |
| | | | | | | | |
| | December 31 |
| | Nonperforming Loans and Leases (1) | | Accruing Past Due 90 Days or More |
| (Dollars in millions) | 2014 | | 2013 | | 2014 | | 2013 |
| Home loans | |
| | |
| | |
| | |
|
| Core portfolio | | | | | | | |
Residential mortgage (2) | $ | 2,398 |
| | $ | 3,316 |
| | $ | 3,942 |
| | $ | 5,137 |
|
| Home equity | 1,496 |
| | 1,431 |
| | — |
| | — |
|
| Legacy Assets & Servicing portfolio | |
| | |
| | |
| | |
Residential mortgage (2) | 4,491 |
| | 8,396 |
| | 7,465 |
| | 11,824 |
|
| Home equity | 2,405 |
| | 2,644 |
| | — |
| | — |
|
| Credit card and other consumer | |
| | |
| | | | |
| U.S. credit card | n/a |
| | n/a |
| | 866 |
| | 1,053 |
|
| Non-U.S. credit card | n/a |
| | n/a |
| | 95 |
| | 131 |
|
| Direct/Indirect consumer | 28 |
| | 35 |
| | 64 |
| | 408 |
|
| Other consumer | 1 |
| | 18 |
| | 1 |
| | 2 |
|
| Total consumer | 10,819 |
| | 15,840 |
| | 12,433 |
| | 18,555 |
|
| Commercial | |
| | |
| | |
| | |
|
| U.S. commercial | 701 |
| | 819 |
| | 110 |
| | 47 |
|
| Commercial real estate | 321 |
| | 322 |
| | 3 |
| | 21 |
|
| Commercial lease financing | 3 |
| | 16 |
| | 41 |
| | 41 |
|
| Non-U.S. commercial | 1 |
| | 64 |
| | — |
| | 17 |
|
| U.S. small business commercial | 87 |
| | 88 |
| | 67 |
| | 78 |
|
| Total commercial | 1,113 |
| | 1,309 |
| | 221 |
| | 204 |
|
| Total loans and leases | $ | 11,932 |
| | $ | 17,149 |
| | $ | 12,654 |
| | $ | 18,759 |
|
| |
(1) | Nonperforming loan balances do not include nonaccruing TDRs removed from the PCI loan portfolio prior to January 1, 2010 of $102 million and $260 million at December 31, 2014 and 2013. |
| |
(2) | Residential mortgage loans in the Core and Legacy Assets & Servicing portfolios accruing past due 90 days or more are fully-insured loans. At December 31, 2014 and 2013, residential mortgage includes $7.3 billion and $13.0 billion of loans on which interest has been curtailed by the FHA, and therefore are no longer accruing interest, although principal is still insured, and $4.1 billion and $4.0 billion of loans on which interest is still accruing. |
n/a = not applicable
Credit Quality Indicators
The Corporation monitors credit quality within its Home Loans, Credit Card and Other Consumer, and Commercial portfolio segments based on primary credit quality indicators. For more information on the portfolio segments, see Note 1 – Summary of Significant Accounting Principles. Within the Home Loans portfolio segment, the primary credit quality indicators are refreshed LTV and refreshed FICO score. Refreshed LTV measures the carrying value of the loan as a percentage of the value of the property securing the loan, refreshed quarterly. Home equity loans are evaluated using combined loan-to-value (CLTV) which measures the carrying value of the combined loans that have liens against the property and the available line of credit as a percentage of the value of the property securing the loan, refreshed quarterly. FICO score measures the creditworthiness of the borrower based on the financial obligations of the borrower and the borrower’s credit
history. At a minimum, FICO scores are refreshed quarterly, and in many cases, more frequently. FICO scores are also a primary credit quality indicator for the Credit Card and Other Consumer portfolio segment and the business card portfolio within U.S. small business commercial. Within the Commercial portfolio segment, loans are evaluated using the internal classifications of pass rated or reservable criticized as the primary credit quality indicators. The term reservable criticized refers to those commercial loans that are internally classified or listed by the Corporation as Special Mention, Substandard or Doubtful, which are asset quality categories defined by regulatory authorities. These assets have an elevated level of risk and may have a high probability of default or total loss. Pass rated refers to all loans not considered reservable criticized. In addition to these primary credit quality indicators, the Corporation uses other credit quality indicators for certain types of loans.
The following tables present certain credit quality indicators for the Corporation’s Home Loans, Credit Card and Other Consumer, and Commercial portfolio segments, by class of financing receivables, at December 31, 2014 and 2013.
|
| | | | | | | | | | | | | | | | | | | | | | | |
| | | | | | | | | | | | |
Home Loans – Credit Quality Indicators (1) |
| | |
| | December 31, 2014 |
| (Dollars in millions) | Core Portfolio Residential Mortgage (2) | | Legacy Assets & Servicing Residential
Mortgage (2) | | Residential Mortgage PCI (3) | | Core Portfolio Home Equity (2) | | Legacy Assets & Servicing Home Equity (2) | | Home Equity PCI |
Refreshed LTV (4, 5) | |
| | |
| | |
| | |
| | | | |
| Less than or equal to 90 percent | $ | 100,255 |
| | $ | 18,499 |
| | $ | 9,972 |
| | $ | 45,414 |
| | $ | 17,453 |
| | $ | 2,046 |
|
| Greater than 90 percent but less than or equal to 100 percent | 4,958 |
| | 3,081 |
| | 2,005 |
| | 2,442 |
| | 3,272 |
| | 1,048 |
|
| Greater than 100 percent | 4,017 |
| | 5,265 |
| | 3,175 |
| | 4,031 |
| | 7,496 |
| | 2,523 |
|
Fully-insured loans (6) | 52,990 |
| | 11,980 |
| | — |
| | — |
| | — |
| | — |
|
| Total home loans | $ | 162,220 |
| | $ | 38,825 |
| | $ | 15,152 |
| | $ | 51,887 |
| | $ | 28,221 |
| | $ | 5,617 |
|
| Refreshed FICO score | | | | | | | | | | | |
| Less than 620 | $ | 4,184 |
| | $ | 6,313 |
| | $ | 6,109 |
| �� | $ | 2,169 |
| | $ | 3,470 |
| | $ | 864 |
|
| Greater than or equal to 620 and less than 680 | 6,272 |
| | 4,032 |
| | 3,014 |
| | 3,683 |
| | 4,529 |
| | 995 |
|
| Greater than or equal to 680 and less than 740 | 21,946 |
| | 6,463 |
| | 3,310 |
| | 10,231 |
| | 7,905 |
| | 1,651 |
|
| Greater than or equal to 740 | 76,828 |
| | 10,037 |
| | 2,719 |
| | 35,804 |
| | 12,317 |
| | 2,107 |
|
Fully-insured loans (6) | 52,990 |
| | 11,980 |
| | — |
| | — |
| | — |
| | — |
|
| Total home loans | $ | 162,220 |
| | $ | 38,825 |
| | $ | 15,152 |
| | $ | 51,887 |
| | $ | 28,221 |
| | $ | 5,617 |
|
| |
(1) | Excludes $2.1 billion of loans accounted for under the fair value option. |
| |
(3) | Includes $2.8 billion of pay option loans. The Corporation no longer originates this product. |
| |
(4) | Refreshed LTV percentages for PCI loans are calculated using the carrying value net of the related valuation allowance. |
| |
(5) | Effective December 31, 2014, with the exception of high-value properties, underlying values for LTV ratios are primarily determined using automated valuation models. For high-value properties, generally with an original value of $1 million or more, estimated property values are determined using the CoreLogic Case-Shiller Index. Prior-period values have been updated to reflect this change. Previously reported values were primarily determined through an index-based approach. |
| |
(6) | Credit quality indicators are not reported for fully-insured loans as principal repayment is insured. |
|
| | | | | | | | | | | | | | | |
| | | | | | | | |
| Credit Card and Other Consumer – Credit Quality Indicators |
| | |
| | December 31, 2014 |
| (Dollars in millions) | U.S. Credit Card | | Non-U.S. Credit Card | | Direct/Indirect Consumer | | Other Consumer (1) |
| Refreshed FICO score | |
| | |
| | |
| | |
|
| Less than 620 | $ | 4,467 |
| | $ | — |
| | $ | 1,296 |
| | $ | 266 |
|
| Greater than or equal to 620 and less than 680 | 12,177 |
| | — |
| | 1,892 |
| | 227 |
|
| Greater than or equal to 680 and less than 740 | 34,986 |
| | — |
| | 10,749 |
| | 307 |
|
| Greater than or equal to 740 | 40,249 |
| | — |
| | 25,279 |
| | 881 |
|
Other internal credit metrics (2, 3, 4) | — |
| | 10,465 |
| | 41,165 |
| | 165 |
|
| Total credit card and other consumer | $ | 91,879 |
| | $ | 10,465 |
| | $ | 80,381 |
| | $ | 1,846 |
|
| |
(1) | Thirty-seven percent of the other consumer portfolio is associated with portfolios from certain consumer finance businesses that the Corporation previously exited. |
| |
(2) | Other internal credit metrics may include delinquency status, geography or other factors. |
| |
(3) | Direct/indirect consumer includes $39.7 billion of securities-based lending which is overcollateralized and therefore has minimal credit risk and $632 million of loans the Corporation no longer originates. |
| |
(4) | Non-U.S. credit card represents the U.K. credit card portfolio which is evaluated using internal credit metrics, including delinquency status. At December 31, 2014, 98 percent of this portfolio was current or less than 30 days past due, one percent was 30-89 days past due and one percent was 90 days or more past due. |
|
| | | | | | | | | | | | | | | | | | | |
| | | | | | | | | | |
Commercial – Credit Quality Indicators (1) |
| | |
| | December 31, 2014 |
| (Dollars in millions) | U.S. Commercial | | Commercial Real Estate | | Commercial
Lease Financing | | Non-U.S. Commercial | | U.S. Small
Business Commercial (2) |
| Risk ratings | |
| | |
| | |
| | |
| | |
|
| Pass rated | $ | 213,839 |
| | $ | 46,632 |
| | $ | 23,832 |
| | $ | 79,367 |
| | $ | 751 |
|
| Reservable criticized | 6,454 |
| | 1,050 |
| | 1,034 |
| | 716 |
| | 182 |
|
Refreshed FICO score (3) | | | | | | | | | |
|
| Less than 620 | |
| | |
| | |
| | |
| | 184 |
|
| Greater than or equal to 620 and less than 680 | | | | | | | | | 529 |
|
| Greater than or equal to 680 and less than 740 | | | | | | | | | 1,591 |
|
| Greater than or equal to 740 | | | | | | | | | 2,910 |
|
Other internal credit metrics (3, 4) | | | | | | | | | 7,146 |
|
| Total commercial | $ | 220,293 |
| | $ | 47,682 |
| | $ | 24,866 |
| | $ | 80,083 |
| | $ | 13,293 |
|
| |
(1) | Excludes $6.6 billion of loans accounted for under the fair value option. |
| |
(2) | U.S. small business commercial includes $762 million of criticized business card and small business loans which are evaluated using refreshed FICO scores or internal credit metrics, including delinquency status, rather than risk ratings. At December 31, 2014, 98 percent of the balances where internal credit metrics are used was current or less than 30 days past due. |
| |
(3) | Refreshed FICO score and other internal credit metrics are applicable only to the U.S. small business commercial portfolio. |
| |
(4) | Other internal credit metrics may include delinquency status, application scores, geography or other factors. |
|
| | | | | | | | | | | | | | | | | | | | | | | |
| | | | | | | | | | | | |
Home Loans – Credit Quality Indicators (1) |
| | |
| | December 31, 2013 |
| (Dollars in millions) | Core Portfolio Residential Mortgage (2) | | Legacy Assets & Servicing Residential
Mortgage (2) | | Residential Mortgage PCI (3) | | Core Portfolio Home Equity (2) | | Legacy Assets & Servicing Home Equity (2) | | Home Equity PCI |
Refreshed LTV (4, 5) | |
| | |
| | |
| | |
| | | | |
| Less than or equal to 90 percent | $ | 94,255 |
| | $ | 21,587 |
| | $ | 10,605 |
| | $ | 44,892 |
| | $ | 17,006 |
| | $ | 1,598 |
|
| Greater than 90 percent but less than or equal to 100 percent | 7,013 |
| | 4,216 |
| | 2,638 |
| | 3,178 |
| | 3,948 |
| | 1,121 |
|
| Greater than 100 percent | 6,356 |
| | 8,720 |
| | 5,429 |
| | 6,429 |
| | 11,626 |
| | 3,874 |
|
Fully-insured loans (6) | 69,712 |
| | 17,535 |
| | — |
| | — |
| | — |
| | — |
|
| Total home loans | $ | 177,336 |
| | $ | 52,058 |
| | $ | 18,672 |
| | $ | 54,499 |
| | $ | 32,580 |
| | $ | 6,593 |
|
| Refreshed FICO score | |
| | |
| | |
| | |
| | |
| | |
|
| Less than 620 | $ | 5,334 |
| | $ | 9,955 |
| | $ | 9,129 |
| | $ | 2,415 |
| | $ | 4,259 |
| | $ | 1,045 |
|
| Greater than or equal to 620 and less than 680 | 7,164 |
| | 5,276 |
| | 3,349 |
| | 4,211 |
| | 5,133 |
| | 1,172 |
|
| Greater than or equal to 680 and less than 740 | 22,617 |
| | 7,639 |
| | 3,211 |
| | 11,726 |
| | 9,143 |
| | 1,936 |
|
| Greater than or equal to 740 | 72,509 |
| | 11,653 |
| | 2,983 |
| | 36,147 |
| | 14,045 |
| | 2,440 |
|
Fully-insured loans (6) | 69,712 |
| | 17,535 |
| | — |
| | — |
| | — |
| | — |
|
| Total home loans | $ | 177,336 |
| | $ | 52,058 |
| | $ | 18,672 |
| | $ | 54,499 |
| | $ | 32,580 |
| | $ | 6,593 |
|
| |
(1) | Excludes $2.2 billion of loans accounted for under the fair value option. |
| |
(3) | Includes $4.0 billion of pay option loans. The Corporation no longer originates this product. |
| |
(4) | Refreshed LTV percentages for PCI loans are calculated using the carrying value net of the related valuation allowance. |
| |
(5) | Effective December 31, 2014, with the exception of high-value properties, underlying values for LTV ratios are primarily determined using automated valuation models. For high-value properties, generally with an original value of $1 million or more, estimated property values are determined using the CoreLogic Case-Shiller Index. Prior-period values have been updated to reflect this change. Previously reported values were primarily determined through an index-based approach. |
| |
(6) | Credit quality indicators are not reported for fully-insured loans as principal repayment is insured. |
|
| | | | | | | | | | | | | | | |
| | | | | | | | |
| Credit Card and Other Consumer – Credit Quality Indicators |
| | |
| | December 31, 2013 |
| (Dollars in millions) | U.S. Credit Card | | Non-U.S. Credit Card | | Direct/Indirect Consumer | | Other Consumer (1) |
| Refreshed FICO score | |
| | |
| | |
| | |
|
| Less than 620 | $ | 4,989 |
| | $ | — |
| | $ | 1,220 |
| | $ | 539 |
|
| Greater than or equal to 620 and less than 680 | 12,753 |
| | — |
| | 3,345 |
| | 264 |
|
| Greater than or equal to 680 and less than 740 | 35,413 |
| | — |
| | 9,887 |
| | 199 |
|
| Greater than or equal to 740 | 39,183 |
| | — |
| | 26,220 |
| | 188 |
|
Other internal credit metrics (2, 3, 4) | — |
| | 11,541 |
| | 41,520 |
| | 787 |
|
| Total credit card and other consumer | $ | 92,338 |
| | $ | 11,541 |
| | $ | 82,192 |
| | $ | 1,977 |
|
| |
(1) | Sixty percent of the other consumer portfolio is associated with portfolios from certain consumer finance businesses that the Corporation previously exited. |
| |
(2) | Other internal credit metrics may include delinquency status, geography or other factors. |
| |
(3) | Direct/indirect consumer includes $35.8 billion of securities-based lending which is overcollateralized and therefore has minimal credit risk and $4.1 billion of loans the Corporation no longer originates. |
| |
(4) | Non-U.S. credit card represents the U.K. credit card portfolio which is evaluated using internal credit metrics, including delinquency status. At December 31, 2013, 98 percent of this portfolio was current or less than 30 days past due, one percent was 30-89 days past due and one percent was 90 days or more past due. |
|
| | | | | | | | | | | | | | | | | | | |
| | | | | | | | | | |
Commercial – Credit Quality Indicators (1) |
| | |
| | December 31, 2013 |
| (Dollars in millions) | U.S. Commercial | | Commercial Real Estate | | Commercial
Lease Financing | | Non-U.S. Commercial | | U.S. Small
Business Commercial (2) |
| Risk ratings | |
| | |
| | |
| | |
| | |
|
| Pass rated | $ | 205,416 |
| | $ | 46,507 |
| | $ | 24,211 |
| | $ | 88,138 |
| | $ | 1,191 |
|
| Reservable criticized | 7,141 |
| | 1,386 |
| | 988 |
| | 1,324 |
| | 346 |
|
Refreshed FICO score (3) | | | | | | | | | |
| Less than 620 | | | | | | | | | 224 |
|
| Greater than or equal to 620 and less than 680 | | | | | | | | | 534 |
|
| Greater than or equal to 680 and less than 740 | | | | | | | | | 1,567 |
|
| Greater than or equal to 740 | | | | | | | | | 2,779 |
|
Other internal credit metrics (3, 4) | | | | | | | | | 6,653 |
|
| Total commercial | $ | 212,557 |
| | $ | 47,893 |
| | $ | 25,199 |
| | $ | 89,462 |
| | $ | 13,294 |
|
| |
(1) | Excludes $7.9 billion of loans accounted for under the fair value option. |
| |
(2) | U.S. small business commercial includes $289 million of criticized business card and small business loans which are evaluated using refreshed FICO scores or internal credit metrics, including delinquency status, rather than risk ratings. At December 31, 2013, 99 percent of the balances where internal credit metrics are used was current or less than 30 days past due. |
| |
(3) | Refreshed FICO score and other internal credit metrics are applicable only to the U.S. small business commercial portfolio. |
| |
(4) | Other internal credit metrics may include delinquency status, application scores, geography or other factors. |
Impaired Loans and Troubled Debt Restructurings
A loan is considered impaired when, based on current information, it is probable that the Corporation will be unable to collect all amounts due from the borrower in accordance with the contractual terms of the loan. Impaired loans include nonperforming commercial loans and all consumer and commercial TDRs. Impaired loans exclude nonperforming consumer loans and nonperforming commercial leases unless they are classified as TDRs. Loans accounted for under the fair value option are also excluded. PCI loans are excluded and reported separately on page 189. For additional information, see Note 1 – Summary of Significant Accounting Principles.
Home Loans
Impaired home loans within the Home Loans portfolio segment consist entirely of TDRs. Excluding PCI loans, most modifications of home loans meet the definition of TDRs when a binding offer is extended to a borrower. Modifications of home loans are done in accordance with the government’s Making Home Affordable Program (modifications under government programs) or the Corporation’s proprietary programs (modifications under proprietary programs). These modifications are considered to be TDRs if concessions have been granted to borrowers experiencing financial difficulties. Concessions may include reductions in interest rates, capitalization of past due amounts, principal and/or interest forbearance, payment extensions, principal and/or interest forgiveness, or combinations thereof. During 2013 and 2012, the Corporation provided interest rate modifications to qualified borrowers pursuant to the 2012 National Mortgage Settlement and these interest rate modifications are not considered to be TDRs.
Prior to permanently modifying a loan, the Corporation may enter into trial modifications with certain borrowers under both government and proprietary programs. Trial modifications generally represent a three- to four-month period during which the borrower makes monthly payments under the anticipated modified payment terms. Upon successful completion of the trial period, the Corporation and the borrower enter into a permanent modification. Binding trial modifications are classified as TDRs when the trial offer is made and continue to be classified as TDRs regardless of whether the borrower enters into a permanent modification.
Home loans that have been discharged in Chapter 7 bankruptcy with no change in repayment terms of $2.4 billion were included in TDRs at December 31, 2014, of which $1.4 billion were classified as nonperforming and $1.0 billion were loans fully-insured by the Federal Housing Administration (FHA). For more information on loans discharged in Chapter 7 bankruptcy, see Nonperforming Loans and Leases in this Note.
A home loan, excluding PCI loans which are reported separately, is not classified as impaired unless it is a TDR. Once such a loan has been designated as a TDR, it is then individually assessed for
impairment. Home loan TDRs are measured primarily based on the net present value of the estimated cash flows discounted at the loan’s original effective interest rate, as discussed in the following paragraph. If the carrying value of a loanTDR exceeds this amount, a specific allowance is recorded as a component of the allowance for loan and lease losses.
Modifications of loans to commercial borrowers Alternatively, home loan TDRs that are experiencing financial difficultyconsidered to be dependent solely on the collateral for repayment (e.g., due to the lack of income verification or as a result of being discharged in Chapter 7 bankruptcy) are designed to reducemeasured based on the Corporation’s loss exposure while providing the borrower with an
opportunity to work through financial difficulties, often to avoid foreclosure or bankruptcy. Each modification is unique and reflects the individual circumstancesestimated fair value of the borrower. Modifications that result incollateral and a TDR may include extensions of maturity at a concessionary (below market) rate of interest, payment forbearances or other actions designed to benefitcharge-off is recorded if the customer while mitigatingcarrying value exceeds the Corporation’s risk exposure. Reductions in interest rates are rare. Instead, the interest rates are typically increased, although the increased rate may not represent a market rate of interest. Infrequently, concessions may also include principal forgiveness in connection with foreclosure, short sale or other settlement agreements leading to termination or salefair value of the loan.
At the timecollateral. Home loans that reached 180 days past due prior to modification had been charged off to their net realizable value, less costs to sell, before they were modified as TDRs in accordance with established policy. Therefore, modifications of restructuring, thehome loans that are remeasured to reflect the impact, if any, on projected cash flows resulting from the modified terms. If there was no forgiveness of principal and the interest rate was180 or more days past due as TDRs do not decreased, the modification may have little or noan impact on the allowance established for the loan. If a portion of the loan is deemed to be uncollectible, a charge-off may be recorded at the time of restructuring. Alternatively, a charge-off may have already been recorded in a previous period such that no charge-off isand lease losses nor are additional charge-offs required at the time of modification. For more informationSubsequent declines in the fair value of the collateral after a loan has reached 180 days past due are recorded as charge-offs. Fully-insured loans are protected against principal loss, and therefore, the Corporation does not record an allowance for loan and lease losses on modificationsthe outstanding principal balance, even after they have been modified in a TDR.
The net present value of the estimated cash flows used to measure impairment is based on model-driven estimates of projected payments, prepayments, defaults and loss-given-default (LGD). Using statistical modeling methodologies, the Corporation estimates the probability that a loan will default prior to maturity based on the attributes of each loan. The factors that are most relevant to the probability of default are the refreshed LTV, or in the case of a subordinated lien, refreshed CLTV, borrower credit score, months since origination (i.e., vintage) and geography. Each of these factors is further broken down by present collection status (whether the loan is current, delinquent, in default or in bankruptcy). Severity (or LGD) is estimated based on the refreshed LTV for first mortgages or CLTV for subordinated liens. The estimates are based on the U.S. small business commercial portfolio, see Credit CardCorporation’s historical experience as adjusted to reflect an assessment of environmental factors that may not be reflected in the historical data, such as changes in real estate values, local and Other Consumernational economies, underwriting standards and the regulatory environment. The probability of default models also incorporate recent experience with modification programs including redefaults subsequent to modification, a loan’s default history prior to modification and the change in this Note.borrower payments post-modification.
At December 31, 20132014 and 20122013, remaining commitments to lend additional funds to debtors whose terms have been modified in a commercialhome loan TDR were immaterial. CommercialHome loan foreclosed properties totaled $90630 million and $250533 million at December 31, 20132014 and 20122013.
|
| | |
| | 196Bank of America 20132014180
| | |
The table below provides informationthe unpaid principal balance, carrying value and related allowance at December 31, 2014 and 2013, and the average carrying value and interest income recognized for 2014, 2013 and 2012 for impaired loans in the Corporation’s Commercial loanHome Loans portfolio segment at December 31, 2013 and 2012includes primarily loans, and for 2013, 2012 and 2011.
managed by Legacy Assets & Servicing. Certain impaired commercialhome loans do not have a related allowance as the current valuation of these impaired loans exceeded the carrying value, which is net of previously recorded charge-offs.
|
| | | | | | | | | | | | | | | | | | | | | | | |
| | | | | | | | | | | | |
| Impaired Loans – Home Loans | | |
| | | | | | |
| | December 31, 2014 | | December 31, 2013 |
| (Dollars in millions) | Unpaid
Principal Balance | | Carrying Value | | Related Allowance | | Unpaid
Principal Balance | | Carrying Value | | Related Allowance |
| With no recorded allowance | |
| | |
| | |
| | |
| | |
| | |
| Residential mortgage | $ | 19,710 |
| | $ | 15,605 |
| | $ | — |
| | $ | 21,567 |
| | $ | 16,450 |
| | $ | — |
|
| Home equity | 3,540 |
| | 1,630 |
| | — |
| | 3,249 |
| | 1,385 |
| | — |
|
| With an allowance recorded | | | | | |
| | | | | | |
| Residential mortgage | $ | 7,861 |
| | $ | 7,665 |
| | $ | 531 |
| | $ | 13,341 |
| | $ | 12,862 |
| | $ | 991 |
|
| Home equity | 852 |
| | 728 |
| | 196 |
| | 893 |
| | 761 |
| | 240 |
|
| Total | |
| | |
| | |
| | | | | | |
| Residential mortgage | $ | 27,571 |
| | $ | 23,270 |
| | $ | 531 |
| | $ | 34,908 |
| | $ | 29,312 |
| | $ | 991 |
|
| Home equity | 4,392 |
| | 2,358 |
| | 196 |
| | 4,142 |
| | 2,146 |
| | 240 |
|
| | | | | | | | | | | | |
| | 2014 | | 2013 | | 2012 |
| | Average
Carrying
Value | | Interest
Income
Recognized (1) | | Average
Carrying
Value | | Interest
Income
Recognized (1) | | Average
Carrying
Value | | Interest
Income
Recognized (1) |
| With no recorded allowance | |
| | |
| | | | | | | | |
| Residential mortgage | $ | 15,065 |
| | $ | 490 |
| | $ | 16,625 |
| | $ | 621 |
| | $ | 10,937 |
| | $ | 366 |
|
| Home equity | 1,486 |
| | 87 |
| | 1,245 |
| | 76 |
| | 734 |
| | 49 |
|
| With an allowance recorded | | | | | | | | | | | |
| Residential mortgage | $ | 10,826 |
| | $ | 411 |
| | $ | 13,926 |
| | $ | 616 |
| | $ | 11,575 |
| | $ | 423 |
|
| Home equity | 743 |
| | 25 |
| | 912 |
| | 41 |
| | 1,145 |
| | 44 |
|
| Total | |
| | |
| | | | | | | | |
| Residential mortgage | $ | 25,891 |
| | $ | 901 |
| | $ | 30,551 |
| | $ | 1,237 |
| | $ | 22,512 |
| | $ | 789 |
|
| Home equity | 2,229 |
| | 112 |
| | 2,157 |
| | 117 |
| | 1,879 |
| | 93 |
|
| |
(1) | Interest income recognized includes interest accrued and collected on the outstanding balances of accruing impaired loans as well as interest cash collections on nonaccruing impaired loans for which the principal is considered collectible. |
The following table presents the December 31, 2014, 2013 and 2012 unpaid principal balance, carrying value, and average pre- and post-modification interest rates on home loans that were modified in TDRs during 2014, 2013 and 2012, and net charge-offs recorded during the period in which the modification occurred.
The following Home Loans portfolio segment tables include loans that were initially classified as TDRs during the period and also loans that had previously been classified as TDRs and were modified again during the period. These TDRs are primarily managed by Legacy Assets & Servicing.
|
| | | | | | | | | | | | | | | | | |
| | | | | | | | | | |
Home Loans – TDRs Entered into During 2014, 2013 and 2012 (1) |
| | |
| | December 31, 2014 | | 2014 |
| (Dollars in millions) | Unpaid Principal Balance | | Carrying Value | | Pre-Modification Interest Rate | | Post-Modification Interest Rate (2) | | Net Charge-offs (3) |
| Residential mortgage | $ | 5,940 |
| | $ | 5,120 |
| | 5.28 | % | | 4.93 | % | | $ | 72 |
|
| Home equity | 863 |
| | 592 |
| | 4.00 |
| | 3.33 |
| | 99 |
|
| Total | $ | 6,803 |
| | $ | 5,712 |
| | 5.12 |
| | 4.73 |
| | $ | 171 |
|
| | | | | | | | | | |
| | December 31, 2013 | | 2013 |
| Residential mortgage | $ | 11,233 |
| | $ | 10,016 |
| | 5.30 | % | | 4.27 | % | | $ | 235 |
|
| Home equity | 878 |
| | 521 |
| | 5.29 |
| | 3.92 |
| | 192 |
|
| Total | $ | 12,111 |
| | $ | 10,537 |
| | 5.30 |
| | 4.24 |
| | $ | 427 |
|
| | | | | | | | | | |
| | December 31, 2012 | | 2012 |
| Residential mortgage | $ | 15,088 |
| | $ | 12,228 |
| | 5.52 | % | | 4.70 | % | | $ | 523 |
|
| Home equity | 1,721 |
| | 858 |
| | 5.22 |
| | 4.39 |
| | 716 |
|
| Total | $ | 16,809 |
| | $ | 13,086 |
| | 5.49 |
| | 4.66 |
| | $ | 1,239 |
|
| |
(1) | TDRs entered into during 2014 include modifications with principal forgiveness of $53 million related to residential mortgage and $1 million related to home equity. TDRs entered into during 2013 include residential mortgage modifications with principal forgiveness of $467 million. TDRs entered into during 2012 include modifications with principal forgiveness of $778 million related to residential mortgage and $9 million related to home equity. |
| |
(2) | The post-modification interest rate reflects the interest rate applicable only to permanently completed modifications, which exclude loans that are in a trial modification period. |
| |
(3) | Net charge-offs include amounts recorded on loans modified during the period that are no longer held by the Corporation at December 31, 2014, 2013 and 2012 due to sales and other dispositions. |
The table below presents the December 31, 2014, 2013 and 2012 carrying value for home loans that were modified in a TDR during 2014, 2013 and 2012, by type of modification.
|
| | | | | | | | | | | | | | | | | | | | | | | |
| | | | | | | | | | | | |
| Impaired Loans – Commercial | | |
| | | | | | |
| | December 31, 2013 | | December 31, 2012 |
| (Dollars in millions) | Unpaid
Principal Balance | | Carrying Value | | Related Allowance | | Unpaid
Principal Balance | | Carrying Value | | Related Allowance |
| With no recorded allowance | |
| | |
| | |
| | |
| | |
| | |
| U.S. commercial | $ | 609 |
| | $ | 577 |
| | $ | — |
| | $ | 571 |
| | $ | 476 |
| | $ | — |
|
| Commercial real estate | 254 |
| | 228 |
| | — |
| | 370 |
| | 316 |
| | — |
|
| Non-U.S. commercial | 10 |
| | 10 |
| | — |
| | 155 |
| | 36 |
| | — |
|
| With an allowance recorded | | | | | | | | | | | |
|
| U.S. commercial | 1,581 |
| | 1,262 |
| | 164 |
| | 2,431 |
| | 1,771 |
| | 159 |
|
| Commercial real estate | 1,066 |
| | 731 |
| | 61 |
| | 2,920 |
| | 1,848 |
| | 201 |
|
| Non-U.S. commercial | 254 |
| | 64 |
| | 16 |
| | 365 |
| | 117 |
| | 18 |
|
U.S. small business commercial (1) | 186 |
| | 176 |
| | 36 |
| | 361 |
| | 317 |
| | 97 |
|
| Total | |
| | |
| | |
| | | | | | |
| U.S. commercial | $ | 2,190 |
| | $ | 1,839 |
| | $ | 164 |
| | $ | 3,002 |
| | $ | 2,247 |
| | $ | 159 |
|
| Commercial real estate | 1,320 |
| | 959 |
| | 61 |
| | 3,290 |
| | 2,164 |
| | 201 |
|
| Non-U.S. commercial | 264 |
| | 74 |
| | 16 |
| | 520 |
| | 153 |
| | 18 |
|
U.S. small business commercial (1) | 186 |
| | 176 |
| | 36 |
| | 361 |
| | 317 |
| | 97 |
|
| | | | | | | | | | | | |
| | 2013 | | 2012 | | 2011 |
| | Average
Carrying
Value | | Interest
Income
Recognized (2) | | Average
Carrying
Value | | Interest
Income
Recognized (2) | | Average
Carrying
Value | | Interest
Income
Recognized (2) |
| With no recorded allowance | |
| | |
| | | | | | | | |
| U.S. commercial | $ | 442 |
| | $ | 6 |
| | $ | 588 |
| | $ | 9 |
| | $ | 774 |
| | $ | 7 |
|
| Commercial real estate | 269 |
| | 3 |
| | 1,119 |
| | 3 |
| | 1,994 |
| | 7 |
|
| Non-U.S. commercial | 28 |
| | — |
| | 104 |
| | — |
| | 101 |
| | — |
|
| With an allowance recorded | | | | | | | | | | | |
| U.S. commercial | 1,553 |
| | 47 |
| | 2,104 |
| | 55 |
| | 2,422 |
| | 13 |
|
| Commercial real estate | 1,148 |
| | 28 |
| | 2,126 |
| | 29 |
| | 3,309 |
| | 19 |
|
| Non-U.S. commercial | 109 |
| | 5 |
| | 77 |
| | 4 |
| | 76 |
| | 3 |
|
U.S. small business commercial (1) | 236 |
| | 6 |
| | 409 |
| | 13 |
| | 666 |
| | 23 |
|
| Total | |
| | |
| | | | | | | | |
| U.S. commercial | $ | 1,995 |
| | $ | 53 |
| | $ | 2,692 |
| | $ | 64 |
| | $ | 3,196 |
| | $ | 20 |
|
| Commercial real estate | 1,417 |
| | 31 |
| | 3,245 |
| | 32 |
| | 5,303 |
| | 26 |
|
| Non-U.S. commercial | 137 |
| | 5 |
| | 181 |
| | 4 |
| | 177 |
| | 3 |
|
U.S. small business commercial (1) | 236 |
| | 6 |
| | 409 |
| | 13 |
| | 666 |
| | 23 |
|
|
| | | | | | | | | | | |
| | | | | | |
| Home Loans – Modification Programs |
| | |
| | TDRs Entered into During 2014 |
| (Dollars in millions) | Residential Mortgage | | Home Equity | | Total Carrying Value |
| Modifications under government programs | | | | | |
| Contractual interest rate reduction | $ | 643 |
| | $ | 56 |
| | $ | 699 |
|
| Principal and/or interest forbearance | 16 |
| | 18 |
| | 34 |
|
Other modifications (1) | 98 |
| | 1 |
| | 99 |
|
| Total modifications under government programs | 757 |
| | 75 |
| | 832 |
|
| Modifications under proprietary programs | | | | | |
| Contractual interest rate reduction | 244 |
| | 22 |
| | 266 |
|
| Capitalization of past due amounts | 71 |
| | 2 |
| | 73 |
|
| Principal and/or interest forbearance | 66 |
| | 75 |
| | 141 |
|
Other modifications (1) | 40 |
| | 47 |
| | 87 |
|
| Total modifications under proprietary programs | 421 |
| | 146 |
| | 567 |
|
| Trial modifications | 3,421 |
| | 182 |
| | 3,603 |
|
Loans discharged in Chapter 7 bankruptcy (2) | 521 |
| | 189 |
| | 710 |
|
| Total modifications | $ | 5,120 |
| | $ | 592 |
| | $ | 5,712 |
|
| | | | | | |
| | TDRs Entered into During 2013 |
| Modifications under government programs | | | | | |
| Contractual interest rate reduction | $ | 1,815 |
| | $ | 48 |
| | $ | 1,863 |
|
| Principal and/or interest forbearance | 35 |
| | 24 |
| | 59 |
|
Other modifications (1) | 100 |
| | — |
| | 100 |
|
| Total modifications under government programs | 1,950 |
| | 72 |
| | 2,022 |
|
| Modifications under proprietary programs | | | | | |
| Contractual interest rate reduction | 2,799 |
| | 40 |
| | 2,839 |
|
| Capitalization of past due amounts | 132 |
| | 2 |
| | 134 |
|
| Principal and/or interest forbearance | 469 |
| | 17 |
| | 486 |
|
Other modifications (1) | 105 |
| | 25 |
| | 130 |
|
| Total modifications under proprietary programs | 3,505 |
| | 84 |
| | 3,589 |
|
| Trial modifications | 3,410 |
| | 87 |
| | 3,497 |
|
Loans discharged in Chapter 7 bankruptcy (2) | 1,151 |
| | 278 |
| | 1,429 |
|
| Total modifications | $ | 10,016 |
| | $ | 521 |
| | $ | 10,537 |
|
| | | | | | |
| | TDRs Entered into During 2012 |
| Modifications under government programs | | | | | |
| Contractual interest rate reduction | $ | 642 |
| | $ | 78 |
| | $ | 720 |
|
| Principal and/or interest forbearance | 51 |
| | 31 |
| | 82 |
|
Other modifications (1) | 37 |
| | 1 |
| | 38 |
|
| Total modifications under government programs | 730 |
| | 110 |
| | 840 |
|
| Modifications under proprietary programs | | | | | |
| Contractual interest rate reduction | 3,350 |
| | 44 |
| | 3,394 |
|
| Capitalization of past due amounts | 144 |
| | — |
| | 144 |
|
| Principal and/or interest forbearance | 424 |
| | 16 |
| | 440 |
|
Other modifications (1) | 97 |
| | 21 |
| | 118 |
|
| Total modifications under proprietary programs | 4,015 |
| | 81 |
| | 4,096 |
|
| Trial modifications | 4,547 |
| | 69 |
| | 4,616 |
|
Loans discharged in Chapter 7 bankruptcy (2) | 2,936 |
| | 598 |
| | 3,534 |
|
| Total modifications | $ | 12,228 |
| | $ | 858 |
| | $ | 13,086 |
|
| |
(1) | Includes U.S. small business commercial renegotiated TDRother modifications such as term or payment extensions and repayment plans. |
| |
(2) | Includes loans discharged in Chapter 7 bankruptcy with no change in repayment terms that are classified as TDRs. |
The table below presents the carrying value of loans that entered into payment default during 2014, 2013 and 2012 that were modified in a TDR during the 12 months preceding payment default. Total carrying value includes loans with a carrying value of $2.0 billion, $2.4 billion and $667 million that entered into payment default during 2014, 2013 and 2012 but were no longer held by the Corporation as of December 31, 2014, 2013 and 2012
due to sales and other dispositions. A payment default for home loan TDRs is recognized when a borrower has missed three monthly payments (not necessarily consecutively) since modification. Payment defaults on a trial modification where the borrower has not yet met the terms of the agreement are included in the table below if the borrower is 90 days or more past due three months after the offer to modify is made.
|
| | | | | | | | | | | |
| | | | | | |
| Home Loans – TDRs Entering Payment Default That Were Modified During the Preceding 12 Months |
| | |
| | 2014 |
| (Dollars in millions) | Residential Mortgage | | Home Equity | | Total Carrying Value (1) |
| Modifications under government programs | $ | 696 |
| | $ | 4 |
| | $ | 700 |
|
| Modifications under proprietary programs | 714 |
| | 12 |
| | 726 |
|
Loans discharged in Chapter 7 bankruptcy (2) | 481 |
| | 70 |
| | 551 |
|
| Trial modifications | 2,231 |
| | 56 |
| | 2,287 |
|
| Total modifications | $ | 4,122 |
| | $ | 142 |
| | $ | 4,264 |
|
| | | | | | |
| | 2013 |
| Modifications under government programs | $ | 454 |
| | $ | 2 |
| | $ | 456 |
|
| Modifications under proprietary programs | 1,117 |
| | 4 |
| | 1,121 |
|
Loans discharged in Chapter 7 bankruptcy (2) | 964 |
| | 30 |
| | 994 |
|
| Trial modifications | 4,376 |
| | 14 |
| | 4,390 |
|
| Total modifications | $ | 6,911 |
| | $ | 50 |
| | $ | 6,961 |
|
| | | | | | |
| | 2012 |
| Modifications under government programs | $ | 202 |
| | $ | 8 |
| | $ | 210 |
|
| Modifications under proprietary programs | 942 |
| | 14 |
| | 956 |
|
Loans discharged in Chapter 7 bankruptcy (2) | 1,228 |
| | 53 |
| | 1,281 |
|
| Trial modifications | 2,351 |
| | 20 |
| | 2,371 |
|
| Total modifications | $ | 4,723 |
| | $ | 95 |
| | $ | 4,818 |
|
| |
(1) | Total carrying value includes loans with a carrying value of $2.0 billion, $2.4 billionand related allowance.$667 million that entered into payment default during 2014, 2013 and 2012 but were no longer held by the Corporation as of December 31, 2014, 2013 and 2012 due to sales and other dispositions. |
| |
(2) | Includes loans discharged in Chapter 7 bankruptcy with no change in repayment terms that are classified as TDRs. |
Credit Card and Other Consumer
Impaired loans within the Credit Card and Other Consumer portfolio segment consist entirely of loans that have been modified in TDRs (the renegotiated credit card and other consumer TDR portfolio, collectively referred to as the renegotiated TDR portfolio). The Corporation seeks to assist customers that are experiencing financial difficulty by modifying loans while ensuring compliance with federal, local and international laws and guidelines. Credit card and other consumer loan modifications generally involve reducing the interest rate on the account and placing the customer on a fixed payment plan not exceeding 60 months, all of which are considered TDRs. In addition, the accounts of non-U.S. credit card customers who do not qualify for a fixed payment plan may have their interest rates reduced, as required by certain local jurisdictions. These modifications, which are also TDRs, tend to experience higher payment default rates given that the borrowers may lack the ability to repay even with the interest rate reduction. In all cases, the customer’s available line of credit is canceled. The Corporation makes loan modifications directly with borrowers for debt held only by the Corporation (internal programs). Additionally, the Corporation makes loan modifications for borrowers working with third-party renegotiation agencies that provide solutions to customers’ entire unsecured debt structures (external programs). The Corporation classifies other secured
consumer loans that have been discharged in Chapter 7 bankruptcy as TDRs which are written down to collateral value and placed on nonaccrual status no later than the time of discharge. For more information on the regulatory guidance on loans discharged in Chapter 7 bankruptcy, see Nonperforming Loans and Leases in this Note.
All credit card and substantially all other consumer loans that have been modified in TDRs remain on accrual status until the loan is either paid in full or charged off, which occurs no later than the end of the month in which the loan becomes 180 days past due or generally at 120 days past due for a loan that was placed on a fixed payment plan after July 1, 2012.
The allowance for impaired credit card and substantially all other consumer loans is based on the present value of projected cash flows, which incorporates the Corporation’s historical payment default and loss experience on modified loans, discounted using the portfolio’s average contractual interest rate, excluding promotionally priced loans, in effect prior to restructuring. Credit card and other consumer loans are included in homogeneous pools which are collectively evaluated for impairment. For these portfolios, loss forecast models are utilized that consider a variety of factors including, but not limited to, historical loss experience, delinquency status, economic trends and credit scores.
The table below provides the unpaid principal balance, carrying value and related allowance at December 31, 2014 and 2013, and the average carrying value and interest income recognized for 2014, 2013 and 2012 on the Corporation’s renegotiated TDR portfolio in the Credit Card and Other Consumer portfolio segment.
|
| | | | | | | | | | | | | | | | | | | | | | | |
| | | | | | | | | | | | |
| Impaired Loans – Credit Card and Other Consumer – Renegotiated TDRs | | |
| | | | | | |
| | December 31, 2014 | | December 31, 2013 |
| (Dollars in millions) | Unpaid
Principal Balance | | Carrying Value (1) | | Related Allowance | | Unpaid
Principal Balance | | Carrying Value (1) | | Related Allowance |
| With no recorded allowance | |
| | |
| | |
| | | | | | |
| Direct/Indirect consumer | $ | 59 |
| | $ | 25 |
| | $ | — |
| | $ | 75 |
| | $ | 32 |
| | $ | — |
|
| Other consumer | — |
| | — |
| | — |
| | 34 |
| | 34 |
| | — |
|
| With an allowance recorded | |
| | |
| | |
| | |
| | |
| | |
| U.S. credit card | $ | 804 |
| | $ | 856 |
| | $ | 207 |
| | $ | 1,384 |
| | $ | 1,465 |
| | $ | 337 |
|
| Non-U.S. credit card | 132 |
| | 168 |
| | 108 |
| | 200 |
| | 240 |
| | 149 |
|
| Direct/Indirect consumer | 76 |
| | 92 |
| | 24 |
| | 242 |
| | 282 |
| | 84 |
|
| Other consumer | — |
| | — |
| | — |
| | 27 |
| | 26 |
| | 9 |
|
| Total | |
| | |
| | |
| | | | | | |
| U.S. credit card | $ | 804 |
| | $ | 856 |
| | $ | 207 |
| | $ | 1,384 |
| | $ | 1,465 |
| | $ | 337 |
|
| Non-U.S. credit card | 132 |
| | 168 |
| | 108 |
| | 200 |
| | 240 |
| | 149 |
|
| Direct/Indirect consumer | 135 |
| | 117 |
| | 24 |
| | 317 |
| | 314 |
| | 84 |
|
| Other consumer | — |
| | — |
| | — |
| | 61 |
| | 60 |
| | 9 |
|
| | | | | | | | | | | | |
| | 2014 | | 2013 | | 2012 |
| | Average
Carrying
Value | | Interest
Income
Recognized (2) | | Average
Carrying
Value | | Interest
Income
Recognized (2) | | Average
Carrying
Value | | Interest
Income
Recognized (2) |
| With no recorded allowance | | | | | | | | | | | |
| Direct/Indirect consumer | $ | 27 |
| | $ | — |
| | $ | 42 |
| | $ | — |
| | $ | 58 |
| | $ | — |
|
| Other consumer | 33 |
| | 2 |
| | 34 |
| | 2 |
| | 35 |
| | 2 |
|
| With an allowance recorded | |
| | |
| | | | | | | | |
| U.S. credit card | $ | 1,148 |
| | $ | 71 |
| | $ | 2,144 |
| | $ | 134 |
| | $ | 4,085 |
| | $ | 253 |
|
| Non-U.S. credit card | 210 |
| | 6 |
| | 266 |
| | 7 |
| | 464 |
| | 10 |
|
| Direct/Indirect consumer | 180 |
| | 9 |
| | 456 |
| | 24 |
| | 929 |
| | 50 |
|
| Other consumer | 23 |
| | 1 |
| | 28 |
| | 2 |
| | 29 |
| | 2 |
|
| Total | |
| | |
| | | | | | | | |
| U.S. credit card | $ | 1,148 |
| | $ | 71 |
| | $ | 2,144 |
| | $ | 134 |
| | $ | 4,085 |
| | $ | 253 |
|
| Non-U.S. credit card | 210 |
| | 6 |
| | 266 |
| | 7 |
| | 464 |
| | 10 |
|
| Direct/Indirect consumer | 207 |
| | 9 |
| | 498 |
| | 24 |
| | 987 |
| | 50 |
|
| Other consumer | 56 |
| | 3 |
| | 62 |
| | 4 |
| | 64 |
| | 4 |
|
| |
(1) | Includes accrued interest and fees. |
| |
(2) | Interest income recognized includes interest accrued and collected on the outstanding balances of accruing impaired loans as well as interest cash collections on nonaccruing impaired loans for which the principal is considered collectible. |
The table below provides information on the Corporation’s primary modification programs for the renegotiated TDR portfolio at December 31, 2014 and 2013.
|
| | | | | | | | | | | | | | | | | | | | | | | | | | | | | | | | | | | | | |
| | | | | | | | | | | | | | | | | | | | |
| Credit Card and Other Consumer – Renegotiated TDRs by Program Type |
| | | | | | | | | | |
| | December 31 |
| | Internal Programs | | External Programs | | Other (1) | | Total | | Percent of Balances Current or Less Than 30 Days Past Due |
| (Dollars in millions) | 2014 | | 2013 | | 2014 | | 2013 | | 2014 | | 2013 | | 2014 | | 2013 | | 2014 | | 2013 |
| U.S. credit card | $ | 450 |
| | $ | 842 |
| | $ | 397 |
| | $ | 607 |
| | $ | 9 |
| | $ | 16 |
| | $ | 856 |
| | $ | 1,465 |
| | 84.99 | % | | 82.77 | % |
| Non-U.S. credit card | 41 |
| | 71 |
| | 16 |
| | 26 |
| | 111 |
| | 143 |
| | 168 |
| | 240 |
| | 47.56 |
| | 49.01 |
|
| Direct/Indirect consumer | 50 |
| | 170 |
| | 34 |
| | 106 |
| | 33 |
| | 38 |
| | 117 |
| | 314 |
| | 85.21 |
| | 84.29 |
|
| Other consumer | — |
| | 60 |
| | — |
| | — |
| | — |
| | — |
| | — |
| | 60 |
| | — |
| | 71.08 |
|
| Total renegotiated TDRs | $ | 541 |
| | $ | 1,143 |
| | $ | 447 |
| | $ | 739 |
| | $ | 153 |
| | $ | 197 |
| | $ | 1,141 |
| | $ | 2,079 |
| | 79.51 |
| | 78.77 |
|
| |
(1) | Other TDRs for non-U.S. credit card include modifications of accounts that are ineligible for a fixed payment plan. |
The table below provides information on the Corporation’s renegotiated TDR portfolio including the December 31, 2014, 2013 and 2012 unpaid principal balance, carrying value and average pre- and post-modification interest rates of loans that were modified in TDRs during 2014, 2013 and 2012, and net charge-offs recorded during the period in which the modification occurred.
|
| | | | | | | | | | | | | | | | | |
| | | | | | | | | | |
| Credit Card and Other Consumer – Renegotiated TDRs Entered into During 2014, 2013 and 2012 |
| | |
| | December 31, 2014 | | 2014 |
| (Dollars in millions) | Unpaid Principal Balance | | Carrying Value (1) | | Pre-Modification Interest Rate | | Post-Modification Interest Rate | | Net Charge-offs |
| U.S. credit card | $ | 276 |
| | $ | 301 |
| | 16.64 | % | | 5.15 | % | | $ | 37 |
|
| Non-U.S. credit card | 91 |
| | 106 |
| | 24.90 |
| | 0.68 |
| | 91 |
|
| Direct/Indirect consumer | 27 |
| | 19 |
| | 8.66 |
| | 4.90 |
| | 14 |
|
| Total | $ | 394 |
| | $ | 426 |
| | 18.32 |
| | 4.03 |
| | $ | 142 |
|
| | | | | | | | | | |
| | December 31, 2013 | | 2013 |
| U.S. credit card | $ | 299 |
| | $ | 329 |
| | 16.84 | % | | 5.84 | % | | $ | 30 |
|
| Non-U.S. credit card | 134 |
| | 147 |
| | 25.90 |
| | 0.95 |
| | 138 |
|
| Direct/Indirect consumer | 47 |
| | 38 |
| | 11.53 |
| | 4.74 |
| | 15 |
|
| Other consumer | 8 |
| | 8 |
| | 9.28 |
| | 5.25 |
| | — |
|
| Total | $ | 488 |
| | $ | 522 |
| | 18.89 |
| | 4.37 |
| | $ | 183 |
|
| | | | | | | | | | |
| | December 31, 2012 | | 2012 |
| U.S. credit card | $ | 396 |
| | $ | 400 |
| | 17.59 | % | | 6.36 | % | | $ | 45 |
|
| Non-U.S. credit card | 196 |
| | 206 |
| | 26.19 |
| | 1.15 |
| | 190 |
|
| Direct/Indirect consumer | 160 |
| | 113 |
| | 9.59 |
| | 5.72 |
| | 52 |
|
| Other consumer | 9 |
| | 9 |
| | 9.97 |
| | 6.44 |
| | — |
|
| Total | $ | 761 |
| | $ | 728 |
| | 18.68 |
| | 4.79 |
| | $ | 287 |
|
| |
(1) | Includes accrued interest and fees. |
The table below provides information on the Corporation’s primary modification programs for the renegotiated TDR portfolio for loans that were modified in TDRs during 2014, 2013 and 2012.
|
| | | | | | | | | | | | | | | |
| | | | | | | | |
| Credit Card and Other Consumer – Renegotiated TDRs Entered into During the Period by Program Type |
| | |
| | 2014 |
| (Dollars in millions) | Internal Programs | | External Programs | | Other (1) | | Total |
| U.S. credit card | $ | 196 |
| | $ | 105 |
| | $ | — |
| | $ | 301 |
|
| Non-U.S. credit card | 6 |
| | 6 |
| | 94 |
| | 106 |
|
| Direct/Indirect consumer | 4 |
| | 2 |
| | 13 |
| | 19 |
|
| Total renegotiated TDRs | $ | 206 |
| | $ | 113 |
| | $ | 107 |
| | $ | 426 |
|
| | | | | | | | |
| | 2013 |
| U.S. credit card | $ | 192 |
| | $ | 137 |
| | $ | — |
| | $ | 329 |
|
| Non-U.S. credit card | 16 |
| | 9 |
| | 122 |
| | 147 |
|
| Direct/Indirect consumer | 15 |
| | 8 |
| | 15 |
| | 38 |
|
| Other consumer | 8 |
| | — |
| | — |
| | 8 |
|
| Total renegotiated TDRs | $ | 231 |
| | $ | 154 |
| | $ | 137 |
| | $ | 522 |
|
| | | | | | | | |
| | 2012 |
| U.S. credit card | $ | 248 |
| | $ | 152 |
| | $ | — |
| | $ | 400 |
|
| Non-U.S. credit card | 38 |
| | 14 |
| | 154 |
| | 206 |
|
| Direct/Indirect consumer | 36 |
| | 19 |
| | 58 |
| | 113 |
|
| Other consumer | 9 |
| | — |
| | — |
| | 9 |
|
| Total renegotiated TDRs | $ | 331 |
| | $ | 185 |
| | $ | 212 |
| | $ | 728 |
|
| |
(1) | Other TDRs for non-U.S. credit card include modifications of accounts that are ineligible for a fixed payment plan. |
|
| | |
| | | Bank of America 20132014 197186 |
The table below presents the December 31, 2013, 2012Credit card and 2011 unpaid principal balance and carrying value of commercialother consumer loans that were modified as TDRs during 2013, 2012 and 2011, and net charge-offs that were recorded during the period in which the modification occurred. The table below includes loans that were initially classified as TDRs during the period and, beginning in the first quarter of 2013, also loans that had previously been classified as TDRs and were modified again during the period.
|
| | | | | | | | | | | |
| | | | | | |
| Commercial – TDRs Entered into During 2013, 2012 and 2011 |
| | |
| | December 31, 2013 | | 2013 |
| (Dollars in millions) | Unpaid Principal Balance | | Carrying Value | | Net Charge-offs |
| U.S. commercial | $ | 926 |
| | $ | 910 |
| | $ | 33 |
|
| Commercial real estate | 483 |
| | 425 |
| | 3 |
|
| Non-U.S. commercial | 61 |
| | 44 |
| | 7 |
|
U.S. small business commercial (1) | 8 |
| | 9 |
| | 1 |
|
| Total | $ | 1,478 |
| | $ | 1,388 |
| | $ | 44 |
|
| | | | | | |
| | December 31, 2012 | | 2012 |
| U.S. commercial | $ | 590 |
| | $ | 558 |
| | $ | 34 |
|
| Commercial real estate | 793 |
| | 721 |
| | 20 |
|
| Non-U.S. commercial | 90 |
| | 89 |
| | 1 |
|
U.S. small business commercial (1) | 22 |
| | 22 |
| | 5 |
|
| Total | $ | 1,495 |
| | $ | 1,390 |
| | $ | 60 |
|
| | | | | | |
| | December 31, 2011 | | 2011 |
| U.S. commercial | $ | 1,381 |
| | $ | 1,211 |
| | $ | 74 |
|
| Commercial real estate | 1,604 |
| | 1,333 |
| | 152 |
|
| Non-U.S. commercial | 44 |
| | 44 |
| | — |
|
U.S. small business commercial (1) | 58 |
| | 59 |
| | 10 |
|
| Total | $ | 3,087 |
| | $ | 2,647 |
| | $ | 236 |
|
| |
(1)
| U.S. small business commercial TDRs are comprised of renegotiated small business card loans. |
A commercial TDR is generally deemed to be in payment default when the loan is 90 days or more past due, including delinquencies that were not resolved as part of the modification. U.S. small business commercial TDRs are deemed to be in payment default during the quarter in which a borrower misses the second of two consecutive payments. Payment defaults are one of the factors considered when projecting future cash flows along with observable market prices or fair valuein the calculation of collateral when measuring the allowance for loan losses.and lease losses for impaired credit card and other consumer loans. Based on historical experience, the Corporation estimates that 14 percent of new U.S. credit card TDRs, that were81 percent of new non-U.S. credit card TDRs and 12 percent of new direct/indirect consumer TDRs may be in payment default within 12 months after modification. Loans that entered into payment default during 2014, 2013 and 2012 that had been modified in a carrying value ofTDR during the preceding 12 months were $56 million, $61 million and $203 million for U.S. credit card, $200 million, $236 million and $298 million for non-U.S. credit card, and $555 million, $13012 million and $164$35 million for U.S. commercial, $128 million, $455 million and $446 million for commercial real estate, and $0, $18 million and $68 million for U.S. small business commercial at December 31, 2013, 2012 and 2011,direct/indirect consumer, respectively.
Purchased Credit-impaired Loans
The Corporation purchases loans with and without evidence of credit quality deterioration since origination. Evidence of credit quality deterioration as of the purchase date may include statistics such as past due status, refreshed borrower credit scores and refreshed loan-to-value (LTV) ratios, some of which are not immediately available as of the purchase date. Purchased loans with evidence of credit quality deterioration for which it is probable that the Corporation will not receive all contractually required payments receivable are accounted for as purchased credit- impaired (PCI) loans. The excess of the cash flows expected to be collected on PCI loans, measured as of the acquisition date, over the estimated fair value is referred to as the accretable yield and is recognized in interest income over the remaining life of the loan using a level yield methodology. The difference between contractually required payments as of the acquisition date and the cash flows expected to be collected is referred to as the nonaccretable difference. PCI loans that have similar risk characteristics, primarily credit risk, collateral type and interest rate risk, are pooled and accounted for as a single asset with a single composite interest rate and an aggregate expectation of cash flows. Once a pool is assembled, it is treated as if it was one loan for purposes of applying the accounting guidance for PCI loans. An individual loan is removed from a PCI loan pool if it is sold, foreclosed, forgiven or the expectation of any future proceeds is remote. When a loan is removed from a PCI loan pool and the foreclosure or recovery value of the loan is less than the loan’s carrying value, the difference is first applied against the PCI pool’s nonaccretable difference. If the nonaccretable difference has been fully utilized, only then is the PCI pool’s basis applicable to that loan written-off against its valuation reserve; however, the integrity of the pool is maintained and it continues to be accounted for as if it was one loan.
The Corporation continues to estimate cash flows expected to be collected over the life of the PCI loans using internal credit risk, interest rate and prepayment risk models that incorporate management’s best estimate of current key assumptions such as default rates, loss severity and prepayment speeds. If, upon subsequent evaluation, the Corporation determines it is probable that the present value of the expected cash flows has decreased, the PCI loan is considered to be further impaired resulting in a charge to the provision for credit losses and a corresponding increase to a valuation allowance included in the allowance for loan and lease losses. The present value of the expected cash flows is then recalculated each period, which may result in additional impairment or a reduction of the valuation allowance. If there is no valuation allowance and it is probable that there is a significant increase in the present value of the expected cash flows, the Corporation recalculates the amount of accretable yield as the excess of the revised expected cash flows over the current carrying value resulting in a reclassification from nonaccretable difference to accretable yield. Reclassifications from nonaccretable difference can also occur if there is a change in the expected lives of the loans. The present value of the expected cash flows is determined using the PCI loans’ effective interest rate, adjusted for changes in the PCI loans’ interest rate indices.
Leases
The Corporation provides equipment financing to its customers through a variety of lease arrangements. Direct financing leases are carried at the aggregate of lease payments receivable plus estimated residual value of the leased property less unearned income. Leveraged leases, which are a form of financing leases, are reported net of non-recourse debt. Unearned income on leveraged and direct financing leases is accreted to interest income over the lease terms using methods that approximate the interest method.
Allowance for Credit Losses
The allowance for credit losses, which includes the allowance for loan and lease losses and the reserve for unfunded lending commitments, represents management’s estimate of probable losses inherent in the Corporation’s lending activities. The allowance for loan and lease losses and the reserve for unfunded lending commitments exclude amounts for loans and unfunded lending commitments accounted for under the fair value option as the fair values of these instruments reflect a credit component. The allowance for loan and lease losses does not include amounts related to accrued interest receivable, other than billed interest and fees on credit card receivables, as accrued interest receivable is reversed when a loan is placed on nonaccrual status. The allowance for loan and lease losses represents the estimated probable credit losses on funded consumer and commercial loans and leases while the reserve for unfunded lending commitments, including standby letters of credit and binding unfunded loan commitments, represents estimated probable credit losses on these unfunded credit instruments based on utilization assumptions. Lending-related credit exposures deemed to be uncollectible, excluding loans carried at fair value, are charged off against these accounts. Write-offs on PCI loans on which there is a valuation allowance are written-off against the valuation allowance. For additional information, see Purchased Credit-impaired Loans in this Note. Cash recovered on previously charged-off amounts is recorded as a recovery to these accounts.
Management evaluates the adequacy of the allowance for credit losses based on the combined total of the allowance for loan and lease losses and the reserve for unfunded lending commitments.
The Corporation performs periodic and systematic detailed reviews of its lending portfolios to identify credit risks and to assess the overall collectability of those portfolios. The allowance on certain homogeneous consumer loan portfolios, which generally consist of consumer real estate within the Home Loans portfolio segment and credit card loans within the Credit Card and Other Consumer portfolio segment, is based on aggregated portfolio segment evaluations generally by product type. Loss forecast models are utilized for these portfolios which consider a variety of factors including, but not limited to, historical loss experience, estimated defaults or foreclosures based on portfolio trends, delinquencies, bankruptcies, economic conditions and credit scores.
The Corporation’s Home Loans portfolio segment is comprised primarily of large groups of homogeneous consumer loans secured by residential real estate. The amount of losses incurred in the homogeneous loan pools is estimated based on the number of loans that will default and the loss in the event of default. Using modeling methodologies, the Corporation estimates the number of homogeneous loans that will default based on the individual loans’ attributes aggregated into pools of homogeneous loans with similar attributes. The attributes that are most significant to the probability of default and are used to estimate defaults include refreshed LTV or, in the case of a subordinated lien, refreshed combined LTV, borrower credit score, months since origination (referred to as vintage) and geography, all of which are further broken down by present collection status (whether the loan is current, delinquent, in default or in bankruptcy). This estimate is based on the Corporation’s historical experience with the loan portfolio. The estimate is adjusted to reflect an assessment of environmental factors not yet reflected in the historical data underlying the loss estimates, such as changes in real estate values, local and national economies, underwriting standards and the regulatory environment. The probability of default on a loan is based on an analysis of the movement of loans with the measured attributes from either current or any of the delinquency categories to default over a 12-month period. On home equity loans where the Corporation holds only a second-lien position and foreclosure is not the best alternative, the loss severity is estimated at 100 percent.
The allowance on certain commercial loans (except business card and certain small business loans) is calculated using loss rates delineated by risk rating and product type. Factors considered when assessing loss rates include the value of the underlying collateral, if applicable, the industry of the obligor, and the obligor’s liquidity and other financial indicators along with certain qualitative factors. These statistical models are updated regularly for changes in economic and business conditions. Included in the analysis of consumer and commercial loan portfolios are reserves which are maintained to cover uncertainties that affect the Corporation’s estimate of probable losses including domestic and global economic uncertainty and large single-name defaults.
The remaining portfolios, including nonperforming commercial loans, as well as consumer and commercial loans modified in a troubled debt restructuring (TDR), are reviewed in accordance with applicable accounting guidance on impaired loans and TDRs. If necessary, a specific allowance is established for these loans if they are deemed to be impaired. A loan is considered impaired when, based on current information and events, it is probable that
the Corporation will be unable to collect all amounts due, including principal and/or interest, in accordance with the contractual terms of the agreement, or the loan has been modified in a TDR. Once a loan has been identified as impaired, management measures impairment primarily based on the present value of payments expected to be received, discounted at the loans’ original effective contractual interest rates, or discounted at the portfolio average contractual annual percentage rate, excluding promotionally priced loans, in effect prior to restructuring. Impaired loans and TDRs may also be measured based on observable market prices, or for loans that are solely dependent on the collateral for repayment, the estimated fair value of the collateral less costs to sell. If the recorded investment in impaired loans exceeds this amount, a specific allowance is established as a component of the allowance for loan and lease losses unless these are secured consumer loans that are solely dependent on the collateral for repayment, in which case the amount that exceeds the fair value of the collateral is charged off.
Generally, when determining the fair value of the collateral securing consumer real estate-secured loans that are solely dependent on the collateral for repayment, prior to performing a detailed property valuation including a walk-through of a property, the Corporation initially estimates the fair value of the collateral securing these consumer loans using an automated valuation method (AVM). An AVM is a tool that estimates the value of a property by reference to market data including sales of comparable properties and price trends specific to the Metropolitan Statistical Area in which the property being valued is located. In the event that an AVM value is not available, the Corporation utilizes publicized indices or if these methods provide less reliable valuations, the Corporation uses appraisals or broker price opinions to estimate the fair value of the collateral. While there is inherent imprecision in these valuations, the Corporation believes that they are representative of the portfolio in the aggregate.
In addition to the allowance for loan and lease losses, the Corporation also estimates probable losses related to unfunded lending commitments, such as letters of credit and financial guarantees, and binding unfunded loan commitments. The reserve for unfunded lending commitments excludes commitments accounted for under the fair value option. Unfunded lending commitments are subject to individual reviews and are analyzed and segregated by risk according to the Corporation’s internal risk rating scale. These risk classifications, in conjunction with an analysis of historical loss experience, utilization assumptions, current economic conditions, performance trends within the portfolio and any other pertinent information, result in the estimation of the reserve for unfunded lending commitments.
The allowance for credit losses related to the loan and lease portfolio is reported separately on the Consolidated Balance Sheet whereas the reserve for unfunded lending commitments is reported on the Consolidated Balance Sheet in accrued expenses and other liabilities. The provision for credit losses related to the loan and lease portfolio and unfunded lending commitments is reported in the Consolidated Statement of Income.
Nonperforming Loans and Leases, Charge-offs and Delinquencies
Nonperforming loans and leases generally include loans and leases that have been placed on nonaccrual status, including nonaccruing loans whose contractual terms have been restructured in a manner that grants a concession to a borrower
experiencing financial difficulties. Loans accounted for under the fair value option, PCI loans and LHFS are not reported as nonperforming.
In accordance with the Corporation’s policies, consumer real estate-secured loans, including residential mortgages and home equity loans, are generally placed on nonaccrual status and classified as nonperforming at 90 days past due unless repayment of the loan is insured by the Federal Housing Administration or through individually insured long-term standby agreements with Fannie Mae or Freddie Mac (the fully-insured portfolio). Residential mortgage loans in the fully-insured portfolio are not placed on nonaccrual status and, therefore, are not reported as nonperforming. Junior-lien home equity loans are placed on nonaccrual status and classified as nonperforming when the underlying first-lien mortgage loan becomes 90 days past due even if the junior-lien loan is current. Accrued interest receivable is reversed when a consumer loan is placed on nonaccrual status. Interest collections on nonaccruing consumer loans for which the ultimate collectability of principal is uncertain are generally applied as principal reductions; otherwise, such collections are credited to interest income when received. These loans may be restored to accrual status when all principal and interest is current and full repayment of the remaining contractual principal and interest is expected, or when the loan otherwise becomes well-secured and is in the process of collection. The outstanding balance of real estate-secured loans that is in excess of the estimated property value less costs to sell is charged off no later than the end of the month in which the loan becomes 180 days past due unless the loan is fully insured. The estimated property value less costs to sell is determined using the same process as described for impaired loans in Allowance for Credit Losses in this Note.
Consumer loans secured by personal property, credit card loans and other unsecured consumer loans are not placed on nonaccrual status prior to charge-off and, therefore, are not reported as nonperforming loans, except for certain secured consumer loans, including those that have been modified in a TDR. Personal property-secured loans are charged off to collateral value no later than the end of the month in which the account becomes 120 days past due or, for loans in bankruptcy, 60 days past due. Credit card and other unsecured consumer loans are charged off no later than the end of the month in which the account becomes 180 days past due or within 60 days after receipt of notification of death or bankruptcy.
Commercial loans and leases, excluding business card loans, that are past due 90 days or more as to principal or interest, or where reasonable doubt exists as to timely collection, including loans that are individually identified as being impaired, are generally placed on nonaccrual status and classified as nonperforming unless well-secured and in the process of collection.
Accrued interest receivable is reversed when commercial loans and leases are placed on nonaccrual status. Interest collections on nonaccruing commercial loans and leases for which the ultimate collectability of principal is uncertain are applied as principal reductions; otherwise, such collections are credited to income when received. Commercial loans and leases may be restored to accrual status when all principal and interest is current and full repayment of the remaining contractual principal and interest is expected, or when the loan otherwise becomes well-secured and is in the process of collection. Business card loans are charged off no later than the end of the month in which the
account becomes 180 days past due or 60 days after receipt of notification of death or bankruptcy. These loans are not placed on nonaccrual status prior to charge-off and, therefore, are not reported as nonperforming loans. Other commercial loans and leases are generally charged off when all or a portion of the principal amount is determined to be uncollectible.
The entire balance of a consumer loan or commercial loan or lease is contractually delinquent if the minimum payment is not received by the specified due date on the customer’s billing statement. Interest and fees continue to accrue on past due loans and leases until the date the loan is placed on nonaccrual status, if applicable.
PCI loans are recorded at fair value at the acquisition date. Although the PCI loans may be contractually delinquent, the Corporation does not classify these loans as nonperforming as the loans were written down to fair value at the acquisition date and the accretable yield is recognized in interest income over the remaining life of the loan. In addition, reported net charge-offs exclude write-offs on PCI loans as the fair value already considers the estimated credit losses.
Troubled Debt Restructurings
Consumer loans and commercial loans and leases whose contractual terms have been restructured in a manner that grants a concession to a borrower experiencing financial difficulties are classified as TDRs. Concessions could include a reduction in the interest rate to a rate that is below market on the loan, payment extensions, forgiveness of principal, forbearance or other actions designed to maximize collections. Secured consumer loans that have been discharged in Chapter 7 bankruptcy and have not been reaffirmed by the borrower are classified as TDRs at the time of discharge. Consumer real estate-secured loans for which a binding offer to restructure has been extended are also classified as TDRs. Loans classified as TDRs are considered impaired loans. Loans that are carried at fair value, LHFS and PCI loans are not classified as TDRs.
Secured consumer loans whose contractual terms have been modified in a TDR and are current at the time of restructuring generally remain on accrual status if there is demonstrated performance prior to the restructuring and payment in full under the restructured terms is expected. Otherwise, the loans are placed on nonaccrual status and reported as nonperforming, except for the fully-insured loans, until there is sustained repayment performance for a reasonable period, generally six months. If accruing consumer TDRs cease to perform in accordance with their modified contractual terms, they are placed on nonaccrual status and reported as nonperforming TDRs. Consumer TDRs that bear a below-market rate of interest are generally reported as TDRs throughout their remaining lives. Secured consumer loans that have been discharged in Chapter 7 bankruptcy are placed on nonaccrual status and written down to the estimated collateral value less costs to sell no later than at the time of discharge. If these loans are contractually current, interest collections are generally recorded in interest income on a cash basis. Credit card and other unsecured consumer loans that have been renegotiated in a TDR are not placed on nonaccrual status. Credit card and other unsecured consumer loans that have been renegotiated and placed on a fixed payment plan after July 1, 2012 are generally charged off no later than the end of the month in which the account becomes 120 days past due.
Commercial loans and leases whose contractual terms have been modified in a TDR are typically placed on nonaccrual status and reported as nonperforming until the loans or leases have performed for an adequate period of time under the restructured agreement, generally six months. If the borrower had demonstrated performance under the previous terms and the underwriting process shows the capacity to continue to perform under the modified terms, the loan may remain on accrual status. Accruing commercial TDRs are reported as performing TDRs through the end of the calendar year in which the loans are returned to accrual status. In addition, if accruing commercial TDRs bear less than a market rate of interest at the time of modification, they are reported as performing TDRs throughout their remaining lives unless and until they cease to perform in accordance with their modified contractual terms, at which time they are placed on nonaccrual status and reported as nonperforming TDRs.
A loan that had previously been modified in a TDR and is subsequently refinanced under current underwriting standards at a market rate with no concessionary terms is accounted for as a new loan and is no longer reported as a TDR.
Loans Held-for-sale
Loans that are intended to be sold in the foreseeable future, including residential mortgages, loan syndications, and to a lesser degree, commercial real estate, consumer finance and other loans, are reported as LHFS and are carried at the lower of aggregate cost or fair value. The Corporation accounts for certain LHFS, including residential mortgage LHFS, under the fair value option. Loan origination costs related to LHFS that the Corporation accounts for under the fair value option are recognized in noninterest expense when incurred. Loan origination costs for LHFS carried at the lower of cost or fair value are capitalized as part of the carrying value of the loans and recognized as a reduction of noninterest income upon the sale of such loans. LHFS that are on nonaccrual status and are reported as nonperforming, as defined in the policy herein, are reported separately from nonperforming loans and leases.
Premises and Equipment
Premises and equipment are carried at cost less accumulated depreciation and amortization. Depreciation and amortization are recognized using the straight-line method over the estimated useful lives of the assets. Estimated lives range up to 40 years for buildings, up to 12 years for furniture and equipment, and the shorter of lease term or estimated useful life for leasehold improvements.
The Corporation capitalizes the costs associated with certain computer hardware, software and internally developed software, and amortizes the costs over the expected useful life. Direct project costs of internally developed software are capitalized when it is probable that the project will be completed and the software will be used for its intended function.
Mortgage Servicing Rights
The Corporation accounts for consumer MSRs, including residential mortgage and home equity MSRs, at fair value with changes in fair value recorded in mortgage banking income. To reduce the volatility of earnings related to interest rate and market value fluctuations, U.S. Treasury securities, mortgage-backed securities and derivatives such as options and interest rate swaps
may be used to hedge certain market risks of the MSRs. Such derivatives are not designated as qualifying accounting hedges. These instruments are carried at fair value with changes in fair value recognized in mortgage banking income.
The Corporation estimates the fair value of consumer MSRs using a valuation model that calculates the present value of estimated future net servicing income and, when available, quoted prices from independent parties. The present value calculation is based on an option-adjusted spread (OAS) valuation approach that factors in prepayment risk. This approach consists of projecting servicing cash flows under multiple interest rate scenarios and discounting these cash flows using risk-adjusted discount rates. The key economic assumptions used in MSR valuations include weighted-average lives of the MSRs and the OAS levels. The OAS represents the spread that is added to the discount rate so that the sum of the discounted cash flows equals the market price; therefore, it is a measure of the extra yield over the reference discount factor that the Corporation expects to earn by holding the asset.
Goodwill and Intangible Assets
Goodwill is the purchase premium after adjusting for the fair value of net assets acquired. Goodwill is not amortized but is reviewed for potential impairment on an annual basis, or when events or circumstances indicate a potential impairment, at the reporting unit level. A reporting unit, as defined under applicable accounting guidance, is a business segment or one level below a business segment. The goodwill impairment analysis is a two-step test. The first step of the goodwill impairment test involves comparing the fair value of each reporting unit with its carrying value, including goodwill, as measured by allocated equity. In certain circumstances, the first step may be performed using a qualitative assessment. If the fair value of the reporting unit exceeds its carrying value, goodwill of the reporting unit is considered not impaired; however, if the carrying value of the reporting unit exceeds its fair value, the second step must be performed to measure potential impairment.
The second step involves calculating an implied fair value of goodwill for each reporting unit for which the first step indicated possible impairment. The implied fair value of goodwill is determined in the same manner as the amount of goodwill recognized in a business combination, which is the excess of the fair value of the reporting unit, as determined in the first step, over the aggregate fair values of the assets, liabilities and identifiable intangibles as if the reporting unit was being acquired in a business combination. Measurement of the fair values of the assets and liabilities of a reporting unit is consistent with the requirements of the fair value measurements accounting guidance, as described in Fair Value in this Note. The adjustments to measure the assets, liabilities and intangibles at fair value are for the purpose of measuring the implied fair value of goodwill and such adjustments are not reflected on the Consolidated Balance Sheet. If the implied fair value of goodwill exceeds the goodwill assigned to the reporting unit, there is no impairment. If the goodwill assigned to a reporting unit exceeds the implied fair value of goodwill, an impairment charge is recorded for the excess. An impairment loss recognized cannot exceed the amount of goodwill assigned to a reporting unit. An impairment loss establishes a new basis in the goodwill and subsequent reversals of goodwill impairment losses are not permitted under applicable accounting guidance.
For intangible assets subject to amortization, an impairment loss is recognized if the carrying value of the intangible asset is not recoverable and exceeds fair value. The carrying value of the intangible asset is considered not recoverable if it exceeds the sum of the undiscounted cash flows expected to result from the use of the asset.
Variable Interest Entities
A VIE is an entity that lacks equity investors or whose equity investors do not have a controlling financial interest in the entity through their equity investments. The entity that has a controlling financial interest in a VIE is referred to as the primary beneficiary and consolidates the VIE. The Corporation is deemed to have a controlling financial interest and is the primary beneficiary of a VIE if it has both the power to direct the activities of the VIE that most significantly impact the VIE’s economic performance and an obligation to absorb losses or the right to receive benefits that could potentially be significant to the VIE. On a quarterly basis, the Corporation reassesses whether it has a controlling financial interest in and is the primary beneficiary of a VIE. The quarterly reassessment process considers whether the Corporation has acquired or divested the power to direct the activities of the VIE through changes in governing documents or other circumstances. The reassessment also considers whether the Corporation has acquired or disposed of a financial interest that could be significant to the VIE, or whether an interest in the VIE has become significant or is no longer significant. The consolidation status of the VIEs with which the Corporation is involved may change as a result of such reassessments. Changes in consolidation status are applied prospectively, with assets and liabilities of a newly consolidated VIE initially recorded at fair value. A gain or loss may be recognized upon deconsolidation of a VIE depending on the carrying values of deconsolidated assets and liabilities compared to the fair value of retained interests and ongoing contractual arrangements.
The Corporation primarily uses VIEs for its securitization activities, in which the Corporation transfers whole loans or debt securities into a trust or other vehicle such that the assets are legally isolated from the creditors of the Corporation. Assets held in a trust can only be used to settle obligations of the trust. The creditors of these trusts typically have no recourse to the Corporation except in accordance with the Corporation’s obligations under standard representations and warranties.
When the Corporation is the servicer of whole loans held in a securitization trust, including non-agency residential mortgages, home equity loans, credit cards, automobile loans and student loans, the Corporation has the power to direct the most significant activities of the trust. The Corporation generally does not have the power to direct the most significant activities of a residential mortgage agency trust except in certain circumstances in which the Corporation holds substantially all of the issued securities and has the unilateral right to liquidate the trust. The power to direct the most significant activities of a commercial mortgage securitization trust is typically held by the special servicer or by the party holding specific subordinate securities which embody certain controlling rights. The Corporation consolidates a whole-loan securitization trust if it has the power to direct the most significant activities and also holds securities issued by the trust or has other contractual arrangements, other than standard representations and warranties, that could potentially be significant to the trust.
The Corporation may also transfer trading account securities and AFS securities into municipal bond or resecuritization trusts. The Corporation consolidates a municipal bond or resecuritization trust if it has control over the ongoing activities of the trust such as the remarketing of the trust’s liabilities or, if there are no ongoing activities, sole discretion over the design of the trust, including the identification of securities to be transferred in and the structure of securities to be issued, and also retains securities or has liquidity or other commitments that could potentially be significant to the trust. The Corporation does not consolidate a municipal bond or resecuritization trust if one or a limited number of third-party investors share responsibility for the design of the trust or have control over the significant activities of the trust through liquidation or other substantive rights.
Other VIEs used by the Corporation include collateralized debt obligations (CDOs), investment vehicles created on behalf of customers and other investment vehicles. The Corporation does not routinely serve as collateral manager for CDOs and, therefore, does not typically have the power to direct the activities that most significantly impact the economic performance of a CDO. However, following an event of default, if the Corporation is a majority holder of senior securities issued by a CDO and acquires the power to manage the assets of the CDO, the Corporation consolidates the CDO.
The Corporation consolidates a customer or other investment vehicle if it has control over the initial design of the vehicle or manages the assets in the vehicle and also absorbs potentially significant gains or losses through an investment in the vehicle, derivative contracts or other arrangements. The Corporation does not consolidate an investment vehicle if a single investor controlled the initial design of the vehicle or manages the assets in the vehicles or if the Corporation does not have a variable interest that could potentially be significant to the vehicle.
Retained interests in securitized assets are initially recorded at fair value. In addition, the Corporation may invest in debt securities issued by unconsolidated VIEs. Fair values of these debt securities, which are classified as trading account assets, debt securities carried at fair value or held-to-maturity securities, are based primarily on quoted market prices in active or inactive markets. Generally, quoted market prices for retained residual interests are not available; therefore, the Corporation estimates fair values based on the present value of the associated expected future cash flows. This may require management to estimate credit losses, prepayment speeds, forward interest yield curves, discount rates and other factors that impact the value of retained interests. Retained residual interests in unconsolidated securitization trusts are classified in trading account assets or other assets with changes in fair value recorded in earnings. The Corporation may also enter into derivatives with unconsolidated VIEs, which are carried at fair value with changes in fair value recorded in earnings.
Fair Value
The Corporation measures the fair values of its assets and liabilities, where applicable, in accordance with accounting guidance that requires an entity to base fair value on exit price. A three-level hierarchy, provided in the applicable accounting guidance, for inputs is utilized in measuring fair value which maximizes the use of observable inputs and minimizes the use of unobservable inputs by requiring that observable inputs be used to determine the exit price when available. Under applicable accounting guidance, the Corporation categorizes its financial
instruments, based on the priority of inputs to the valuation technique, into this three-level hierarchy, as described below. Trading account assets and liabilities, derivative assets and liabilities, AFS debt and equity securities, other debt securities carried at fair value, consumer MSRs and certain other assets are carried at fair value in accordance with applicable accounting guidance. The Corporation has also elected to account for certain assets and liabilities under the fair value option, including certain commercial and consumer loans and loan commitments, LHFS, short-term borrowings, securities financing agreements, long-term deposits and long-term debt. The following describes the three-level hierarchy.
| |
| Level 1 | Unadjusted quoted prices in active markets for identical assets or liabilities. Level 1 assets and liabilities include debt and equity securities and derivative contracts that are traded in an active exchange market, as well as certain U.S. Treasury securities that are highly liquid and are actively traded in OTC markets. |
| |
| Level 2 | Observable inputs other than Level 1 prices, such as quoted prices for similar assets or liabilities, quoted prices in markets that are not active, or other inputs that are observable or can be corroborated by observable market data for substantially the full term of the assets or liabilities. Level 2 assets and liabilities include debt securities with quoted prices that are traded less frequently than exchange-traded instruments and derivative contracts where fair value is determined using a pricing model with inputs that are observable in the market or can be derived principally from or corroborated by observable market data. This category generally includes U.S. government and agency mortgage-backed and asset-backed securities, corporate debt securities, derivative contracts, certain loans and LHFS. |
| |
| Level 3 | Unobservable inputs that are supported by little or no market activity and that are significant to the overall fair value of the assets or liabilities. Level 3 assets and liabilities include financial instruments for which the determination of fair value requires significant management judgment or estimation. The fair value for such assets and liabilities is generally determined using pricing models, market comparables, discounted cash flow methodologies or similar techniques that incorporate the assumptions a market participant would use in pricing the asset or liability. This category generally includes certain private equity investments and other principal investments, retained residual interests in securitizations, consumer MSRs, certain asset-backed securities, highly structured, complex or long-dated derivative contracts, certain loans and LHFS, IRLCs and certain CDOs where independent pricing information cannot be obtained for a significant portion of the underlying assets. |
Income Taxes
There are two components of income tax expense: current and deferred. Current income tax expense reflects taxes to be paid or refunded for the current period. Deferred income tax expense results from changes in deferred tax assets and liabilities between periods. These gross deferred tax assets and liabilities represent
decreases or increases in taxes expected to be paid in the future because of future reversals of temporary differences in the bases of assets and liabilities as measured by tax laws and their bases as reported in the financial statements. Deferred tax assets are also recognized for tax attributes such as net operating loss carryforwards and tax credit carryforwards. Valuation allowances are recorded to reduce deferred tax assets to the amounts management concludes are more-likely-than-not to be realized.
Income tax benefits are recognized and measured based upon a two-step model: first, a tax position must be more-likely-than-not to be sustained based solely on its technical merits in order to be recognized, and second, the benefit is measured as the largest dollar amount of that position that is more-likely-than-not to be sustained upon settlement. The difference between the benefit recognized and the tax benefit claimed on a tax return is referred to as an unrecognized tax benefit. The Corporation records income tax-related interest and penalties, if applicable, within income tax expense.
Retirement Benefits
The Corporation has retirement plans covering substantially all full-time and certain part-time employees. Pension expense under these plans is charged to current operations and consists of several components of net pension cost based on various actuarial assumptions regarding future experience under the plans.
In addition, the Corporation has unfunded supplemental benefit plans and supplemental executive retirement plans (SERPs) for selected officers of the Corporation and its subsidiaries that provide benefits that cannot be paid from a qualified retirement plan due to Internal Revenue Code restrictions. The Corporation’s current executive officers do not earn additional retirement income under SERPs. These plans are nonqualified under the Internal Revenue Code and assets used to fund benefit payments are not segregated from other assets of the Corporation; therefore, in general, a participant’s or beneficiary’s claim to benefits under these plans is as a general creditor. In addition, the Corporation has several postretirement healthcare and life insurance benefit plans.
Accumulated Other Comprehensive Income
The Corporation records unrealized gains and losses on AFS debt and marketable equity securities, gains and losses on cash flow accounting hedges, certain employee benefit plan adjustments, foreign currency translation adjustments and related hedges of net investments in foreign operations, and the cumulative adjustment related to certain accounting changes in accumulated OCI, net-of-tax. Unrealized gains and losses on AFS debt and marketable equity securities are reclassified to earnings as the gains or losses are realized upon sale of the securities. Unrealized losses on AFS securities deemed to represent OTTI are reclassified to earnings at the time of the impairment charge. For AFS debt securities that the Corporation does not intend to sell or it is not more-likely-than-not that it will be required to sell, only the credit component of an unrealized loss is reclassified to earnings. Gains or losses on derivatives accounted for as cash flow hedges are reclassified to earnings when the hedged transaction affects earnings. Translation gains or losses on foreign currency translation adjustments are reclassified to earnings upon the substantial sale or liquidation of investments in foreign operations.
Revenue Recognition
The following summarizes the Corporation’s revenue recognition policies as they relate to certain noninterest income line items in the Consolidated Statement of Income.
Card income is derived from fees such as interchange, cash advance, annual, late, over-limit and other miscellaneous fees, which are recorded as revenue when earned, primarily on an accrual basis. Uncollected fees are included in the customer card receivables balances with an amount recorded in the allowance for loan and lease losses for estimated uncollectible card receivables. Uncollected fees are written off when a card receivable reaches 180 days past due.
Service charges include fees for insufficient funds, overdrafts and other banking services and are recorded as revenue when earned. Uncollected fees are included in outstanding loan balances with an amount recorded for estimated uncollectible service fees receivable. Uncollected fees are written off when a fee receivable reaches 60 days past due.
Investment and brokerage services revenue consists primarily of asset management fees and brokerage income that are recognized over the period the services are provided or when commissions are earned. Asset management fees consist primarily of fees for investment management and trust services and are generally based on the dollar amount of the assets being managed. Brokerage income is generally derived from commissions and fees earned on the sale of various financial products.
Investment banking income consists primarily of advisory and underwriting fees that are recognized in income as the services are provided and no contingencies exist. Revenues are generally recognized net of any direct expenses. Non-reimbursed expenses are recorded as noninterest expense.
Earnings Per Common Share
Earnings per common share (EPS) is computed by dividing net income (loss) allocated to common shareholders by the weighted-average common shares outstanding, except that it does not include unvested common shares subject to repurchase or cancellation. Net income (loss) allocated to common shareholders represents net income (loss) applicable to common shareholders which is net income (loss) adjusted for preferred stock dividends including dividends declared, accretion of discounts on preferred stock including accelerated accretion when preferred stock is repaid early, and cumulative dividends related to the current dividend period that have not been declared as of period end, less income allocated to participating securities (see below for more information). Diluted EPS is computed by dividing income (loss) allocated to common shareholders plus dividends on dilutive convertible preferred stock and preferred stock that can be tendered to exercise warrants, by the weighted-average common shares outstanding plus amounts representing the dilutive effect of stock options outstanding, restricted stock, restricted stock units, outstanding warrants and the dilution resulting from the conversion of convertible preferred stock, if applicable.
Unvested share-based payment awards that contain nonforfeitable rights to dividends are participating securities that are included in computing EPS using the two-class method. The two-class method is an earnings allocation formula under which
EPS is calculated for common stock and participating securities according to dividends declared and participating rights in undistributed earnings. Under this method, all earnings, distributed and undistributed, are allocated to participating securities and common shares based on their respective rights to receive dividends.
In an exchange of non-convertible preferred stock, income allocated to common shareholders is adjusted for the difference between the carrying value of the preferred stock and the fair value of the consideration exchanged. In an induced conversion of convertible preferred stock, income allocated to common shareholders is reduced by the excess of the fair value of the consideration exchanged over the fair value of the common stock that would have been issued under the original conversion terms.
Foreign Currency Translation
Assets, liabilities and operations of foreign branches and subsidiaries are recorded based on the functional currency of each entity. For certain of the foreign operations, the functional currency is the local currency, in which case the assets, liabilities and operations are translated, for consolidation purposes, from the local currency to the U.S. Dollar reporting currency at period-end rates for assets and liabilities and generally at average rates for results of operations. The resulting unrealized gains or losses, as well as gains and losses from certain hedges, are reported as a component of accumulated OCI, net-of-tax. When the foreign entity’s functional currency is determined to be the U.S. Dollar, the resulting remeasurement gains or losses on foreign currency-denominated assets or liabilities are included in earnings.
Credit Card and Deposit Arrangements
Endorsing Organization Agreements
The Corporation contracts with other organizations to obtain their endorsement of the Corporation’s loan and deposit products. This endorsement may provide to the Corporation exclusive rights to market to the organization’s members or to customers on behalf of the Corporation. These organizations endorse the Corporation’s loan and deposit products and provide the Corporation with their mailing lists and marketing activities. These agreements generally have terms that range from two to five years. The Corporation typically pays royalties in exchange for the endorsement. Compensation costs related to the credit card agreements are recorded as contra-revenue in card income.
Cardholder Reward Agreements
The Corporation offers reward programs that allow its cardholders to earn points that can be redeemed for a broad range of rewards including cash, travel and gift cards. The Corporation establishes a rewards liability based upon the points earned that are expected to be redeemed and the average cost per point redeemed. The points to be redeemed are estimated based on past redemption behavior, card product type, account transaction activity and other historical card performance. The liability is reduced as the points are redeemed. The estimated cost of the rewards programs is recorded as contra-revenue in card income.
NOTE 2 Derivatives
Derivative Balances
Derivatives are entered into on behalf of customers, for trading, or to support risk management activities. Derivatives used in risk management activities include derivatives that may or may not be designated in qualifying hedge accounting relationships. Derivatives that are not designated in qualifying hedge accounting relationships are referred to as other risk management derivatives. For more information on the Corporation’s derivatives and hedging
activities, see Note 1 – Summary of Significant Accounting Principles. The following tables present derivative instruments included on the Consolidated Balance Sheet in derivative assets and liabilities at December 31, 2014 and 2013. Balances are presented on a gross basis, prior to the application of counterparty and cash collateral netting. Total derivative assets and liabilities are adjusted on an aggregate basis to take into consideration the effects of legally enforceable master netting agreements and have been reduced by the cash collateral received or paid.
|
| | | | | | | | | | | | | | | | | | | | | | | | | | | |
| | | | | | | | | | | | | | |
| | | | December 31, 2014 |
| | | | Gross Derivative Assets | | Gross Derivative Liabilities |
| (Dollars in billions) | Contract/ Notional (1) | | Trading and Other Risk Management Derivatives | | Qualifying
Accounting Hedges | | Total | | Trading and Other Risk Management Derivatives | | Qualifying
Accounting Hedges | | Total |
| Interest rate contracts | |
| | |
| | |
| | |
| | |
| | |
| | |
|
| Swaps | $ | 29,445.4 |
| | $ | 658.5 |
| | $ | 8.5 |
| | $ | 667.0 |
| | $ | 658.2 |
| | $ | 0.5 |
| | $ | 658.7 |
|
| Futures and forwards | 10,159.4 |
| | 1.7 |
| | — |
| | 1.7 |
| | 2.0 |
| | — |
| | 2.0 |
|
| Written options | 1,725.2 |
| | — |
| | — |
| | — |
| | 85.4 |
| | — |
| | 85.4 |
|
| Purchased options | 1,739.8 |
| | 85.6 |
| | — |
| | 85.6 |
| | — |
| | — |
| | — |
|
| Foreign exchange contracts | |
| | |
| | |
| | |
| | |
| | |
| | |
|
| Swaps | 2,159.1 |
| | 51.5 |
| | 0.8 |
| | 52.3 |
| | 54.6 |
| | 1.9 |
| | 56.5 |
|
| Spot, futures and forwards | 4,226.4 |
| | 68.9 |
| | 1.5 |
| | 70.4 |
| | 72.4 |
| | 0.2 |
| | 72.6 |
|
| Written options | 600.7 |
| | — |
| | — |
| | — |
| | 16.0 |
| | — |
| | 16.0 |
|
| Purchased options | 584.6 |
| | 15.1 |
| | — |
| | 15.1 |
| | — |
| | — |
| | — |
|
| Equity contracts | |
| | |
| | |
| | |
| | |
| | |
| | |
|
| Swaps | 193.7 |
| | 3.2 |
| | — |
| | 3.2 |
| | 4.0 |
| | — |
| | 4.0 |
|
| Futures and forwards | 69.5 |
| | 2.1 |
| | — |
| | 2.1 |
| | 1.8 |
| | — |
| | 1.8 |
|
| Written options | 341.0 |
| | — |
| | — |
| | — |
| | 26.0 |
| | — |
| | 26.0 |
|
| Purchased options | 318.4 |
| | 27.9 |
| | — |
| | 27.9 |
| | — |
| | — |
| | — |
|
| Commodity contracts | |
| | |
| | |
| | |
| | |
| | |
| | |
|
| Swaps | 74.3 |
| | 5.8 |
| | — |
| | 5.8 |
| | 8.5 |
| | — |
| | 8.5 |
|
| Futures and forwards | 376.5 |
| | 4.5 |
| | — |
| | 4.5 |
| | 1.8 |
| | — |
| | 1.8 |
|
| Written options | 129.5 |
| | — |
| | — |
| | — |
| | 11.5 |
| | — |
| | 11.5 |
|
| Purchased options | 141.3 |
| | 10.7 |
| | — |
| | 10.7 |
| | — |
| | — |
| | — |
|
| Credit derivatives | |
| | |
| | |
| | |
| | |
| | |
| | |
|
| Purchased credit derivatives: | |
| | |
| | |
| | |
| | |
| | |
| | |
|
| Credit default swaps | 1,094.8 |
| | 13.3 |
| | — |
| | 13.3 |
| | 23.4 |
| | — |
| | 23.4 |
|
| Total return swaps/other | 44.3 |
| | 0.2 |
| | — |
| | 0.2 |
| | 1.4 |
| | — |
| | 1.4 |
|
| Written credit derivatives: | |
| | |
| | |
| | |
| | |
| | |
| | |
|
| Credit default swaps | 1,073.1 |
| | 24.5 |
| | — |
| | 24.5 |
| | 11.9 |
| | — |
| | 11.9 |
|
| Total return swaps/other | 61.0 |
| | 0.5 |
| | — |
| | 0.5 |
| | 0.3 |
| | — |
| | 0.3 |
|
| Gross derivative assets/liabilities | |
| | $ | 974.0 |
| | $ | 10.8 |
| | $ | 984.8 |
| | $ | 979.2 |
| | $ | 2.6 |
| | $ | 981.8 |
|
| Less: Legally enforceable master netting agreements | |
| | |
| | |
| | (884.8 | ) | | |
| | |
| | (884.8 | ) |
| Less: Cash collateral received/paid | |
| | |
| | |
| | (47.3 | ) | | |
| | |
| | (50.1 | ) |
| Total derivative assets/liabilities | |
| | |
| | |
| | $ | 52.7 |
| | |
| | |
| | $ | 46.9 |
|
| |
(1) | Represents the total contract/notional amount of derivative assets and liabilities outstanding. |
|
| | | | | | | | | | | | | | | | | | | | | | | | | | | |
| | | | | | | | | | | | | | |
| | | | December 31, 2013 |
| | | | Gross Derivative Assets | | Gross Derivative Liabilities |
| (Dollars in billions) | Contract/ Notional (1) | | Trading and Other Risk Management Derivatives | | Qualifying
Accounting Hedges | | Total | | Trading and Other Risk Management Derivatives | | Qualifying
Accounting Hedges | | Total |
| Interest rate contracts | |
| | |
| | |
| | |
| | |
| | |
| | |
|
| Swaps | $ | 33,272.0 |
| | $ | 659.9 |
| | $ | 7.5 |
| | $ | 667.4 |
| | $ | 658.4 |
| | $ | 0.9 |
| | $ | 659.3 |
|
| Futures and forwards | 8,217.6 |
| | 1.6 |
| | — |
| | 1.6 |
| | 1.5 |
| | — |
| | 1.5 |
|
| Written options | 2,065.4 |
| | — |
| | — |
| | — |
| | 64.4 |
| | — |
| | 64.4 |
|
| Purchased options | 2,028.3 |
| | 65.4 |
| | — |
| | 65.4 |
| | — |
| | — |
| | — |
|
| Foreign exchange contracts | |
| | |
| | |
| | |
| | |
| | |
| | |
|
| Swaps | 2,284.1 |
| | 43.1 |
| | 1.0 |
| | 44.1 |
| | 42.7 |
| | 1.0 |
| | 43.7 |
|
| Spot, futures and forwards | 2,922.5 |
| | 32.5 |
| | 0.7 |
| | 33.2 |
| | 33.5 |
| | 1.1 |
| | 34.6 |
|
| Written options | 412.4 |
| | — |
| | — |
| | — |
| | 9.2 |
| | — |
| | 9.2 |
|
| Purchased options | 392.4 |
| | 8.8 |
| | — |
| | 8.8 |
| | — |
| | — |
| | — |
|
| Equity contracts | |
| | |
| | |
| | |
| | |
| | |
| | |
|
| Swaps | 162.0 |
| | 3.6 |
| | — |
| | 3.6 |
| | 4.2 |
| | — |
| | 4.2 |
|
| Futures and forwards | 71.4 |
| | 1.1 |
| | — |
| | 1.1 |
| | 1.4 |
| | — |
| | 1.4 |
|
| Written options | 315.6 |
| | — |
| | — |
| | — |
| | 29.6 |
| | — |
| | 29.6 |
|
| Purchased options | 266.7 |
| | 30.4 |
| | — |
| | 30.4 |
| | — |
| | — |
| | — |
|
| Commodity contracts | |
| | |
| | |
| | |
| | |
| | |
| | |
|
| Swaps | 73.1 |
| | 3.8 |
| | — |
| | 3.8 |
| | 5.7 |
| | — |
| | 5.7 |
|
| Futures and forwards | 454.4 |
| | 4.7 |
| | — |
| | 4.7 |
| | 2.5 |
| | — |
| | 2.5 |
|
| Written options | 157.3 |
| | — |
| | — |
| | — |
| | 5.0 |
| | — |
| | 5.0 |
|
| Purchased options | 164.0 |
| | 5.2 |
| | — |
| | 5.2 |
| | — |
| | — |
| | — |
|
| Credit derivatives | |
| | |
| | |
| | |
| | |
| | |
| | |
|
| Purchased credit derivatives: | |
| | |
| | |
| | |
| | |
| | |
| | |
|
| Credit default swaps | 1,305.1 |
| | 15.7 |
| | — |
| | 15.7 |
| | 28.1 |
| | — |
| | 28.1 |
|
| Total return swaps/other | 38.1 |
| | 2.0 |
| | — |
| | 2.0 |
| | 3.2 |
| | — |
| | 3.2 |
|
| Written credit derivatives: | |
| | |
| | |
| | |
| | |
| | |
| | |
|
| Credit default swaps | 1,265.4 |
| | 29.3 |
| | — |
| | 29.3 |
| | 13.8 |
| | — |
| | 13.8 |
|
| Total return swaps/other | 63.4 |
| | 4.0 |
| | — |
| | 4.0 |
| | 0.2 |
| | — |
| | 0.2 |
|
| Gross derivative assets/liabilities | |
| | $ | 911.1 |
| | $ | 9.2 |
| | $ | 920.3 |
| | $ | 903.4 |
| | $ | 3.0 |
| | $ | 906.4 |
|
| Less: Legally enforceable master netting agreements | |
| | |
| | |
| | (825.5 | ) | | |
| | |
| | (825.5 | ) |
| Less: Cash collateral received/paid | |
| | |
| | |
| | (47.3 | ) | | |
| | |
| | (43.5 | ) |
| Total derivative assets/liabilities | |
| | |
| | |
| | $ | 47.5 |
| | |
| | |
| | $ | 37.4 |
|
| |
(1) | Represents the total contract/notional amount of derivative assets and liabilities outstanding. |
Offsetting of Derivatives
The Corporation enters into International Swaps and Derivatives Association, Inc. (ISDA) master netting agreements or similar agreements with substantially all of the Corporation’s derivative counterparties. Where legally enforceable, these master netting agreements give the Corporation, in the event of default by the counterparty, the right to liquidate securities held as collateral and to offset receivables and payables with the same counterparty. For purposes of the Consolidated Balance Sheet, the Corporation offsets derivative assets and liabilities and cash collateral held with the same counterparty where it has such a legally enforceable master netting agreement.
The Offsetting of Derivatives table presents derivative instruments included in derivative assets and liabilities on the Consolidated Balance Sheet at December 31, 2014 and 2013 by primary risk (e.g., interest rate risk) and the platform, where applicable, on which these derivatives are transacted. Exchange-traded derivatives include listed options transacted on an exchange. Over-the-counter (OTC) derivatives include bilateral transactions between the Corporation and a particular counterparty. OTC-cleared derivatives include bilateral transactions between the Corporation and a counterparty where the transaction is cleared through a clearinghouse. Balances are
presented on a gross basis, prior to the application of counterparty and cash collateral netting. Total gross derivative assets and liabilities are adjusted on an aggregate basis to take into consideration the effects of legally enforceable master netting agreements which includes reducing the balance for counterparty netting and cash collateral received or paid.
Other gross derivative assets and liabilities in the table represent derivatives entered into under master netting agreements where uncertainty exists as to the enforceability of these agreements under bankruptcy laws in some countries or industries and, accordingly, receivables and payables with counterparties in these countries or industries are reported on a gross basis.
Also included in the table is financial instrument collateral related to legally enforceable master netting agreements that represents securities collateral received or pledged and customer cash collateral held at third-party custodians. These amounts are not offset on the Consolidated Balance Sheet but are shown as a reduction to total derivative assets and liabilities in the table to derive net derivative assets and liabilities.
For more information on offsetting of securities financing agreements, see Note 10 – Federal Funds Sold or Purchased, Securities Financing Agreements and Short-term Borrowings.
|
| | | | | | | | | | | | | | | |
| | | | | | | | |
| Offsetting of Derivatives | | | | | | | |
| | | | | | | | |
| | December 31, 2014 | | December 31, 2013 |
| (Dollars in billions) | Derivative Assets | | Derivative Liabilities | | Derivative Assets | | Derivative Liabilities |
| Interest rate contracts | |
| | |
| | |
| | |
|
| Over-the-counter | $ | 386.6 |
| | $ | 373.2 |
| | $ | 381.7 |
| | $ | 365.9 |
|
| Exchange-traded | 0.1 |
| | 0.1 |
| | 0.4 |
| | 0.3 |
|
| Over-the-counter cleared | 365.7 |
| | 368.7 |
| | 351.2 |
| | 356.5 |
|
| Foreign exchange contracts | | | | | | | |
| Over-the-counter | 133.0 |
| | 139.9 |
| | 82.9 |
| | 83.9 |
|
| Equity contracts | | | | | | | |
| Over-the-counter | 19.5 |
| | 16.7 |
| | 20.3 |
| | 17.6 |
|
| Exchange-traded | 8.6 |
| | 7.8 |
| | 8.4 |
| | 9.8 |
|
| Commodity contracts | | | | | | | |
| Over-the-counter | 10.2 |
| | 11.9 |
| | 6.3 |
| | 7.4 |
|
| Exchange-traded | 7.4 |
| | 7.7 |
| | 3.3 |
| | 2.9 |
|
| Over-the-counter cleared | 0.1 |
| | 0.6 |
| | — |
| | — |
|
| Credit derivatives | | | | | | | |
| Over-the-counter | 30.8 |
| | 30.2 |
| | 44.0 |
| | 38.9 |
|
| Over-the-counter cleared | 7.0 |
| | 6.8 |
| | 5.8 |
| | 5.9 |
|
| Total gross derivative assets/liabilities, before netting | | | | | | | |
| Over-the-counter | 580.1 |
| | 571.9 |
| | 535.2 |
| | 513.7 |
|
| Exchange-traded | 16.1 |
| | 15.6 |
| | 12.1 |
| | 13.0 |
|
| Over-the-counter cleared | 372.8 |
| | 376.1 |
| | 357.0 |
| | 362.4 |
|
| Less: Legally enforceable master netting agreements and cash collateral received/paid | | | | | | | |
| Over-the-counter | (545.7 | ) | | (545.5 | ) | | (505.0 | ) | | (495.4 | ) |
| Exchange-traded | (13.9 | ) | | (13.9 | ) | | (11.2 | ) | | (11.2 | ) |
| Over-the-counter cleared | (372.5 | ) | | (375.5 | ) | | (356.6 | ) | | (362.4 | ) |
| Derivative assets/liabilities, after netting | 36.9 |
| | 28.7 |
| | 31.5 |
| | 20.1 |
|
| Other gross derivative assets/liabilities | 15.8 |
| | 18.2 |
| | 16.0 |
| | 17.3 |
|
| Total derivative assets/liabilities | 52.7 |
| | 46.9 |
| | 47.5 |
| | 37.4 |
|
Less: Financial instruments collateral (1) | (13.3 | ) | | (8.9 | ) | | (10.1 | ) | | (4.6 | ) |
| Total net derivative assets/liabilities | $ | 39.4 |
| | $ | 38.0 |
| | $ | 37.4 |
| | $ | 32.8 |
|
| |
(1) | These amounts are limited to the derivative asset/liability balance and, accordingly, do not include excess collateral received/pledged. |
ALM and Risk Management Derivatives
The Corporation’s asset and liability management (ALM) and risk management activities include the use of derivatives to mitigate risk to the Corporation including derivatives designated in qualifying hedge accounting relationships and derivatives used in other risk management activities. Interest rate, foreign exchange, equity, commodity and credit contracts are utilized in the Corporation’s ALM and risk management activities.
The Corporation maintains an overall interest rate risk management strategy that incorporates the use of interest rate contracts, which are generally non-leveraged generic interest rate and basis swaps, options, futures and forwards, to minimize significant fluctuations in earnings caused by interest rate volatility. The Corporation’s goal is to manage interest rate sensitivity and volatility so that movements in interest rates do not significantly adversely affect earnings or capital. As a result of interest rate fluctuations, hedged fixed-rate assets and liabilities appreciate or depreciate in fair value. Gains or losses on the derivative instruments that are linked to the hedged fixed-rate assets and liabilities are expected to substantially offset this unrealized appreciation or depreciation.
Market risk, including interest rate risk, can be substantial in the mortgage business. Market risk is the risk that values of mortgage assets or revenues will be adversely affected by changes in market conditions such as interest rate movements. To mitigate the interest rate risk in mortgage banking production income, the
Corporation utilizes forward loan sale commitments and other derivative instruments, including purchased options, and certain debt securities. The Corporation also utilizes derivatives such as interest rate options, interest rate swaps, forward settlement contracts and eurodollar futures to hedge certain market risks of mortgage servicing rights (MSRs). For more information on MSRs, see Note 23 – Mortgage Servicing Rights.
The Corporation uses foreign exchange contracts to manage the foreign exchange risk associated with certain foreign currency-denominated assets and liabilities, as well as the Corporation’s investments in non-U.S. subsidiaries. Foreign exchange contracts, which include spot and forward contracts, represent agreements to exchange the currency of one country for the currency of another country at an agreed-upon price on an agreed-upon settlement date. Exposure to loss on these contracts will increase or decrease over their respective lives as currency exchange and interest rates fluctuate.
The Corporation enters into derivative commodity contracts such as futures, swaps, options and forwards as well as non-derivative commodity contracts to provide price risk management services to customers or to manage price risk associated with its physical and financial commodity positions. The non-derivative commodity contracts and physical inventories of commodities expose the Corporation to earnings volatility. Cash flow and fair value accounting hedges provide a method to mitigate a portion of this earnings volatility.
The Corporation purchases credit derivatives to manage credit risk related to certain funded and unfunded credit exposures. Credit derivatives include credit default swaps (CDS), total return swaps and swaptions. These derivatives are recorded on the Consolidated Balance Sheet at fair value with changes in fair value recorded in other income (loss).
Derivatives Designated as Accounting Hedges
The Corporation uses various types of interest rate, commodity and foreign exchange derivative contracts to protect against changes in the fair value of its assets and liabilities due to fluctuations in interest rates, commodity prices and exchange rates (fair value hedges). The Corporation also uses these types of contracts and equity derivatives to protect against changes in the cash flows of its assets and liabilities, and other forecasted transactions (cash flow hedges). The Corporation hedges its net investment in consolidated non-U.S. operations determined to
have functional currencies other than the U.S. Dollar using forward exchange contracts and cross-currency basis swaps, and by issuing foreign currency-denominated debt (net investment hedges).
Fair Value Hedges
The table below summarizes information related to fair value hedges for 2014, 2013 and 2012, including hedges of interest rate risk on long-term debt that were acquired as part of a business combination and redesignated. At redesignation, the fair value of the derivatives was positive. As the derivatives mature, the fair value will approach zero. As a result, ineffectiveness will occur and the fair value changes in the derivatives and the long-term debt being hedged may be directionally the same in certain scenarios. Based on a regression analysis, the derivatives continue to be highly effective at offsetting changes in the fair value of the long-term debt attributable to interest rate risk.
|
| | | | | | | | | | | |
| | | |
| Derivatives Designated as Fair Value Hedges | | | | | |
| | | | | | |
| Gains (Losses) | 2014 |
| (Dollars in millions) | Derivative | | Hedged Item | | Hedge Ineffectiveness |
Interest rate risk on long-term debt (1) | $ | 2,144 |
| | $ | (2,935 | ) | | $ | (791 | ) |
Interest rate and foreign currency risk on long-term debt (1) | (2,212 | ) | | 2,120 |
| | (92 | ) |
Interest rate risk on available-for-sale securities (2) | (35 | ) | | 3 |
| | (32 | ) |
Price risk on commodity inventory (3) | 21 |
| | (15 | ) | | 6 |
|
| Total | $ | (82 | ) | | $ | (827 | ) | | $ | (909 | ) |
| | | | | | |
| | 2013 |
Interest rate risk on long-term debt (1) | $ | (4,704 | ) | | $ | 3,925 |
| | $ | (779 | ) |
Interest rate and foreign currency risk on long-term debt (1) | (1,291 | ) | | 1,085 |
| | (206 | ) |
Interest rate risk on available-for-sale securities (2) | 839 |
| | (840 | ) | | (1 | ) |
Price risk on commodity inventory (3) | (13 | ) | | 11 |
| | (2 | ) |
| Total | $ | (5,169 | ) | | $ | 4,181 |
| | $ | (988 | ) |
| | | | | | |
| | 2012 |
Interest rate risk on long-term debt (1) | $ | (195 | ) | | $ | (770 | ) | | $ | (965 | ) |
Interest rate and foreign currency risk on long-term debt (1) | (1,482 | ) | | 1,225 |
| | (257 | ) |
Interest rate risk on available-for-sale securities (2) | (4 | ) | | 91 |
| | 87 |
|
Price risk on commodity inventory (3) | (6 | ) | | 6 |
| | — |
|
| Total | $ | (1,687 | ) | | $ | 552 |
| | $ | (1,135 | ) |
| |
(1) | Amounts are recorded in interest expense on long-term debt and in other income (loss). |
| |
(2) | Amounts are recorded in interest income on debt securities. |
| |
(3) | Amounts relating to commodity inventory are recorded in trading account profits. |
Cash Flow and Net Investment Hedges
The table below summarizes certain information related to cash flow hedges and net investment hedges for 2014, 2013 and 2012. Of the $1.7 billion net loss (after-tax) on derivatives in accumulated other comprehensive income (OCI) for 2014, $803 million ($502 million after-tax) is expected to be reclassified into earnings in the
next 12 months. These net losses reclassified into earnings are expected to primarily reduce net interest income related to the respective hedged items. Amounts related to price risk on restricted stock awards reclassified from accumulated OCI are recorded in personnel expense.
|
| | | | | | | | | | | |
| | | | | | |
| Derivatives Designated as Cash Flow and Net Investment Hedges | | | | | |
| | | | | | |
| | 2014 |
| (Dollars in millions, amounts pretax) | Gains (Losses)
Recognized in
Accumulated OCI on Derivatives | | Gains (Losses)
in Income
Reclassified from Accumulated OCI | | Hedge
Ineffectiveness and
Amounts Excluded
from Effectiveness Testing (1) |
| Cash flow hedges | |
| | |
| | |
|
| Interest rate risk on variable-rate portfolios | $ | 68 |
| | $ | (1,119 | ) | | $ | (4 | ) |
| Price risk on restricted stock awards | 127 |
| | 359 |
| | — |
|
| Total | $ | 195 |
| | $ | (760 | ) | | $ | (4 | ) |
| Net investment hedges | |
| | |
| | |
|
| Foreign exchange risk | $ | 3,021 |
| | $ | 21 |
| | $ | (503 | ) |
| | | | | | |
| | 2013 |
| Cash flow hedges | |
| | |
| | |
|
| Interest rate risk on variable-rate portfolios | $ | (321 | ) | | $ | (1,102 | ) | | $ | — |
|
| Price risk on restricted stock awards | 477 |
| | 329 |
| | — |
|
| Total | $ | 156 |
| | $ | (773 | ) | | $ | — |
|
| Net investment hedges | |
| | |
| | |
|
| Foreign exchange risk | $ | 1,024 |
| | $ | (355 | ) | | $ | (134 | ) |
| | | | | | |
| | 2012 |
| Cash flow hedges | |
| | |
| | |
|
| Interest rate risk on variable-rate portfolios | $ | 10 |
| | $ | (957 | ) | | $ | — |
|
| Price risk on restricted stock awards | 420 |
| | (78 | ) | | — |
|
| Total | $ | 430 |
| | $ | (1,035 | ) | | $ | — |
|
| Net investment hedges | |
| | |
| | |
|
| Foreign exchange risk | $ | (771 | ) | | $ | (26 | ) | | $ | (269 | ) |
| |
(1) | Amounts related to derivatives designated as cash flow hedges represent hedge ineffectiveness and amounts related to net investment hedges represent amounts excluded from effectiveness testing. |
Other Risk Management Derivatives
Other risk management derivatives are used by the Corporation to reduce certain risk exposures. These derivatives are not qualifying accounting hedges because either they did not qualify for or were not designated as accounting hedges. The table below presents gains (losses) on these derivatives for 2014, 2013 and
2012. These gains (losses) are largely offset by the income or expense that is recorded on the hedged item. The change in the impact of interest rate and foreign currency risk on ALM activities was primarily driven by decreasing interest rates and foreign currency weakening against the U.S. Dollar throughout 2014 compared to strengthening during 2013.
|
| | | | | | | | | | | |
| | | | | | |
| Other Risk Management Derivatives | | | | | |
| | | | | | |
| Gains (Losses) | | | | | |
| | | | | | |
| (Dollars in millions) | 2014 | | 2013 | | 2012 |
Interest rate risk on mortgage banking income (1) | $ | 1,017 |
| | $ | (619 | ) | | $ | 1,324 |
|
Credit risk on loans (2) | 16 |
| | (47 | ) | | (95 | ) |
Interest rate and foreign currency risk on ALM activities (3) | (3,683 | ) | | 2,501 |
| | 424 |
|
Price risk on restricted stock awards (4) | 600 |
| | 865 |
| | 1,008 |
|
| Other | (9 | ) | | (19 | ) | | 58 |
|
| |
(1) | Net gains (losses) on these derivatives are recorded in mortgage banking income as they are used to mitigate the interest rate risk related to MSRs, interest rate lock commitments and mortgage loans held-for-sale, all of which are measured at fair value with changes in fair value recorded in mortgage banking income. The net gains on interest rate lock commitments related to the origination of mortgage loans that are held-for-sale, which are not included in the table but are considered derivative instruments, were $776 million, $927 million and $3.0 billion for 2014, 2013 and 2012, respectively. |
| |
(2) | Net gains (losses) on these derivatives are recorded in other income (loss). |
| |
(3) | Primarily related to hedges of debt securities carried at fair value and hedges of foreign currency-denominated debt. Gains (losses) on these derivatives and the related hedged items are recorded in other income (loss). |
| |
(4) | Gains (losses) on these derivatives are recorded in personnel expense. |
Sales and Trading Revenue
The Corporation enters into trading derivatives to facilitate client transactions and to manage risk exposures arising from trading account assets and liabilities. It is the Corporation’s policy to include these derivative instruments in its trading activities which include derivatives and non-derivative cash instruments. The resulting risk from these derivatives is managed on a portfolio basis as part of the Corporation’s Global Markets business segment. The related sales and trading revenue generated within Global Markets is recorded in various income statement line items including trading account profits and net interest income as well as other revenue categories. However, the majority of income related to derivative instruments is recorded in trading account profits.
Sales and trading revenue includes changes in the fair value and realized gains and losses on the sales of trading and other assets, net interest income, and fees primarily from commissions on equity securities. Revenue is generated by the difference in the client price for an instrument and the price at which the trading desk can execute the trade in the dealer market. For equity
securities, commissions related to purchases and sales are recorded in the “Other” column in the Sales and Trading Revenue table. Changes in the fair value of these securities are included in trading account profits. For debt securities, revenue, with the exception of interest associated with the debt securities, is typically included in trading account profits. Unlike commissions for equity securities, the initial revenue related to broker-dealer services for debt securities is typically included in the pricing of the instrument rather than being charged through separate fee arrangements. Therefore, this revenue is recorded in trading account profits as part of the initial mark to fair value. For derivatives, the majority of revenue is included in trading account profits. In transactions where the Corporation acts as agent, which include exchange-traded futures and options, fees are recorded in other income (loss).
Gains (losses) on certain instruments, primarily loans, that the Global Markets business segment shares with Global Banking are not considered trading instruments and are excluded from sales and trading revenue in their entirety.
The table below, which includes both derivatives and non-derivative cash instruments, identifies the amounts in the respective income statement line items attributable to the Corporation’s sales and trading revenue in Global Markets, categorized by primary risk, for 2014, 2013 and 2012. The difference between total trading account profits in the table below and in the Consolidated Statement of Income represents trading
activities in business segments other than Global Markets. This table includes debit valuation adjustment (DVA) gains (losses), net of hedges, and funding valuation adjustment (FVA) losses. Global Markets results inNote 24 – Business Segment Information are presented on a fully taxable-equivalent (FTE) basis. The table below is not presented on an FTE basis.
|
| | | | | | | | | | | | | | | |
| | | | | | | | |
| Sales and Trading Revenue | | | | | | | |
| | | | | | | | |
| | 2014 |
| (Dollars in millions) | Trading Account Profits | | Net Interest Income | | Other (1) | | Total |
| Interest rate risk | $ | 952 |
| | $ | 1,169 |
| | $ | 363 |
| | $ | 2,484 |
|
| Foreign exchange risk | 1,177 |
| | 8 |
| | (128 | ) | | 1,057 |
|
| Equity risk | 1,954 |
| | (70 | ) | | 2,318 |
| | 4,202 |
|
| Credit risk | 1,410 |
| | 2,682 |
| | 614 |
| | 4,706 |
|
| Other risk | 504 |
| | (319 | ) | | 106 |
| | 291 |
|
| Total sales and trading revenue | $ | 5,997 |
| | $ | 3,470 |
| | $ | 3,273 |
| | $ | 12,740 |
|
| | | | | | | | |
| | 2013 |
| Interest rate risk | $ | 1,120 |
| | $ | 1,104 |
| | $ | (333 | ) | | $ | 1,891 |
|
| Foreign exchange risk | 1,170 |
| | 5 |
| | (103 | ) | | 1,072 |
|
| Equity risk | 1,994 |
| | 111 |
| | 2,075 |
| | 4,180 |
|
| Credit risk | 2,083 |
| | 2,710 |
| | 78 |
| | 4,871 |
|
| Other risk | 367 |
| | (219 | ) | | 69 |
| | 217 |
|
| Total sales and trading revenue | $ | 6,734 |
| | $ | 3,711 |
| | $ | 1,786 |
| | $ | 12,231 |
|
| | | | | | | | |
| | 2012 |
| Interest rate risk | $ | (2,875 | ) | | $ | 1,039 |
| | $ | (4 | ) | | $ | (1,840 | ) |
| Foreign exchange risk | 909 |
| | 5 |
| | 5 |
| | 919 |
|
| Equity risk | 259 |
| | (57 | ) | | 1,891 |
| | 2,093 |
|
| Credit risk | 2,514 |
| | 2,321 |
| | 961 |
| | 5,796 |
|
| Other risk | 4,899 |
| | (227 | ) | | (5,148 | ) | | (476 | ) |
| Total sales and trading revenue | $ | 5,706 |
| | $ | 3,081 |
| | $ | (2,295 | ) | | $ | 6,492 |
|
| |
(1) | Represents amounts in investment and brokerage services and other income (loss) that are recorded in Global Markets and included in the definition of sales and trading revenue. Includes investment and brokerage services revenue of $2.2 billion, $2.0 billion and $1.8 billion for 2014, 2013 and 2012, respectively. |
Credit Derivatives
The Corporation enters into credit derivatives primarily to facilitate client transactions and to manage credit risk exposures. Credit derivatives derive value based on an underlying third-party referenced obligation or a portfolio of referenced obligations and generally require the Corporation, as the seller of credit protection, to make payments to a buyer upon the occurrence of a pre-defined credit event. Such credit events generally include bankruptcy of
the referenced credit entity and failure to pay under the obligation, as well as acceleration of indebtedness and payment repudiation or moratorium. For credit derivatives based on a portfolio of referenced credits or credit indices, the Corporation may not be required to make payment until a specified amount of loss has occurred and/or may only be required to make payment up to a specified amount.
Credit derivative instruments where the Corporation is the seller of credit protection and their expiration at December 31, 2014 and 2013 are summarized in the table below. These instruments are classified as investment and non-investment grade based on the credit quality of the underlying referenced
obligation. The Corporation considers ratings of BBB- or higher as investment grade. Non-investment grade includes non-rated credit derivative instruments. The Corporation discloses internal categorizations of investment grade and non-investment grade consistent with how risk is managed for these instruments.
|
| | | | | | | | | | | | | | | | | | | |
| | | | | | | | | | |
| Credit Derivative Instruments | |
| | |
| | December 31, 2014 |
| | Carrying Value |
| (Dollars in millions) | Less than One Year | | One to Three Years | | Three to Five Years | | Over Five Years | | Total |
| Credit default swaps: | |
| | |
| | |
| | |
| | |
|
| Investment grade | $ | 100 |
| | $ | 714 |
| | $ | 1,455 |
| | $ | 939 |
| | $ | 3,208 |
|
| Non-investment grade | 916 |
| | 2,107 |
| | 1,338 |
| | 4,301 |
| | 8,662 |
|
| Total | 1,016 |
| | 2,821 |
| | 2,793 |
| | 5,240 |
| | 11,870 |
|
| Total return swaps/other: | |
| | |
| | |
| | |
| | |
|
| Investment grade | 24 |
| | — |
| | — |
| | — |
| | 24 |
|
| Non-investment grade | 64 |
| | 247 |
| | 2 |
| | — |
| | 313 |
|
| Total | 88 |
| | 247 |
| | 2 |
| | — |
| | 337 |
|
| Total credit derivatives | $ | 1,104 |
| | $ | 3,068 |
| | $ | 2,795 |
| | $ | 5,240 |
| | $ | 12,207 |
|
| Credit-related notes: | |
| | |
| | |
| | |
| | |
|
| Investment grade | $ | 2 |
| | $ | 365 |
| | $ | 568 |
| | $ | 2,634 |
| | $ | 3,569 |
|
| Non-investment grade | 5 |
| | 141 |
| | 85 |
| | 1,443 |
| | 1,674 |
|
| Total credit-related notes | $ | 7 |
| | $ | 506 |
| | $ | 653 |
| | $ | 4,077 |
| | $ | 5,243 |
|
| | Maximum Payout/Notional |
| Credit default swaps: | |
| | |
| | |
| | |
| | |
|
| Investment grade | $ | 132,974 |
| | $ | 342,914 |
| | $ | 242,728 |
| | $ | 28,982 |
| | $ | 747,598 |
|
| Non-investment grade | 54,326 |
| | 170,580 |
| | 80,011 |
| | 20,586 |
| | 325,503 |
|
| Total | 187,300 |
| | 513,494 |
| | 322,739 |
| | 49,568 |
| | 1,073,101 |
|
| Total return swaps/other: | |
| | |
| | |
| | |
| | |
|
| Investment grade | 22,645 |
| | — |
| | — |
| | — |
| | 22,645 |
|
| Non-investment grade | 23,839 |
| | 10,792 |
| | 3,268 |
| | 487 |
| | 38,386 |
|
| Total | 46,484 |
| | 10,792 |
| | 3,268 |
| | 487 |
| | 61,031 |
|
| Total credit derivatives | $ | 233,784 |
| | $ | 524,286 |
| | $ | 326,007 |
| | $ | 50,055 |
| | $ | 1,134,132 |
|
|
| | | | | | | | | | | | | | | | | | | |
| | December 31, 2013 |
| | Carrying Value |
| Credit default swaps: | |
| | |
| | |
| | |
| | |
|
| Investment grade | $ | 2 |
| | $ | 220 |
| | $ | 974 |
| | $ | 1,134 |
| | $ | 2,330 |
|
| Non-investment grade | 424 |
| | 1,924 |
| | 2,469 |
| | 6,667 |
| | 11,484 |
|
| Total | 426 |
| | 2,144 |
| | 3,443 |
| | 7,801 |
| | 13,814 |
|
| Total return swaps/other: | |
| | |
| | |
| | |
| | |
|
| Investment grade | 22 |
| | — |
| | — |
| | — |
| | 22 |
|
| Non-investment grade | 29 |
| | 38 |
| | 2 |
| | 86 |
| | 155 |
|
| Total | 51 |
| | 38 |
| | 2 |
| | 86 |
| | 177 |
|
| Total credit derivatives | $ | 477 |
| | $ | 2,182 |
| | $ | 3,445 |
| | $ | 7,887 |
| | $ | 13,991 |
|
| Credit-related notes: | |
| | |
| | |
| | |
| | |
|
| Investment grade | $ | — |
| | $ | 278 |
| | $ | 595 |
| | $ | 4,457 |
| | $ | 5,330 |
|
| Non-investment grade | 145 |
| | 107 |
| | 756 |
| | 946 |
| | 1,954 |
|
| Total credit-related notes | $ | 145 |
| | $ | 385 |
| | $ | 1,351 |
| | $ | 5,403 |
| | $ | 7,284 |
|
| | Maximum Payout/Notional |
| Credit default swaps: | |
| | |
| | |
| | |
| | |
|
| Investment grade | $ | 170,764 |
| | $ | 379,273 |
| | $ | 411,426 |
| | $ | 36,039 |
| | $ | 997,502 |
|
| Non-investment grade | 53,316 |
| | 90,986 |
| | 95,319 |
| | 28,257 |
| | 267,878 |
|
| Total | 224,080 |
| | 470,259 |
| | 506,745 |
| | 64,296 |
| | 1,265,380 |
|
| Total return swaps/other: | |
| | |
| | |
| | |
| | |
|
| Investment grade | 21,771 |
| | — |
| | — |
| | — |
| | 21,771 |
|
| Non-investment grade | 27,784 |
| | 8,150 |
| | 4,103 |
| | 1,599 |
| | 41,636 |
|
| Total | 49,555 |
| | 8,150 |
| | 4,103 |
| | 1,599 |
| | 63,407 |
|
| Total credit derivatives | $ | 273,635 |
| | $ | 478,409 |
| | $ | 510,848 |
| | $ | 65,895 |
| | $ | 1,328,787 |
|
The notional amount represents the maximum amount payable by the Corporation for most credit derivatives. However, the Corporation does not monitor its exposure to credit derivatives based solely on the notional amount because this measure does not take into consideration the probability of occurrence. As such, the notional amount is not a reliable indicator of the Corporation’s exposure to these contracts. Instead, a risk framework is used to define risk tolerances and establish limits to help ensure that certain credit risk-related losses occur within acceptable, predefined limits.
The Corporation manages its market risk exposure to credit derivatives by entering into a variety of offsetting derivative contracts and security positions. For example, in certain instances, the Corporation may purchase credit protection with identical underlying referenced names to offset its exposure. The carrying value and notional amount of written credit derivatives for which the Corporation held purchased credit derivatives with identical underlying referenced names and terms were $5.7 billion and $880.6 billion at December 31, 2014 and $8.1 billion and $1.0 trillion at December 31, 2013.
Credit-related notes in the table on page 167 include investments in securities issued by collateralized debt obligation (CDO), collateralized loan obligation (CLO) and credit-linked note vehicles. These instruments are primarily classified as trading securities. The carrying value of these instruments equals the Corporation’s maximum exposure to loss. The Corporation is not obligated to make any payments to the entities under the terms of the securities owned.
Credit-related Contingent Features and Collateral
The Corporation executes the majority of its derivative contracts in the OTC market with large, international financial institutions, including broker-dealers and, to a lesser degree, with a variety of non-financial companies. Substantially all of the derivative transactions are executed on a daily margin basis. Therefore, events such as a credit rating downgrade (depending on the ultimate rating level) or a breach of credit covenants would typically require an increase in the amount of collateral required of the counterparty, where applicable, and/or allow the Corporation to take additional protective measures such as early termination of all trades. Further, as previously discussed on page 160, the Corporation enters into legally enforceable master netting agreements which reduce risk by permitting the closeout and netting of transactions with the same counterparty upon the occurrence of certain events.
A majority of the Corporation’s derivative contracts contain credit risk-related contingent features, primarily in the form of ISDA master netting agreements and credit support documentation that enhance the creditworthiness of these instruments compared to other obligations of the respective counterparty with whom the Corporation has transacted. These contingent features may be for the benefit of the Corporation as well as its counterparties with respect to changes in the Corporation’s creditworthiness and the mark-to-market exposure under the derivative transactions. At December 31, 2014 and 2013, the Corporation held cash and securities collateral of $82.0 billion and $74.4 billion, and posted
cash and securities collateral of $67.9 billion and $56.1 billion in the normal course of business under derivative agreements.
In connection with certain OTC derivative contracts and other trading agreements, the Corporation can be required to provide additional collateral or to terminate transactions with certain counterparties in the event of a downgrade of the senior debt ratings of the Corporation or certain subsidiaries. The amount of additional collateral required depends on the contract and is usually a fixed incremental amount and/or the market value of the exposure.
At December 31, 2014, the amount of collateral, calculated based on the terms of the contracts, that the Corporation and certain subsidiaries could be required to post to counterparties but had not yet posted to counterparties was approximately $1.4 billion, including $670 million for Bank of America, N.A. (BANA).
Some counterparties are currently able to unilaterally terminate certain contracts, or the Corporation or certain subsidiaries may be required to take other action such as find a suitable replacement or obtain a guarantee. At December 31, 2014, the current liability recorded for these derivative contracts was $84 million, against which the Corporation and certain subsidiaries had posted approximately $54 million of collateral.
The table below presents the amount of additional collateral that would have been contractually required by derivative contracts and other trading agreements at December 31, 2014if the rating agencies had downgraded their long-term senior debt ratings for the Corporation or certain subsidiaries by one incremental notch and by an additional second incremental notch.
|
| | | | | | |
| | | |
| Additional Collateral Required to be Posted Upon Downgrade |
| | | |
| | December 31, 2014 |
| (Dollars in millions) | One incremental notch | Second incremental notch |
| Bank of America Corporation | $ | 1,402 |
| $ | 2,825 |
|
Bank of America, N.A. and subsidiaries (1) | 1,072 |
| 1,886 |
|
| |
(1) | Included in Bank of America Corporation collateral requirements in this table. |
The table below presents the derivative liabilities that would be subject to unilateral termination by counterparties and the amounts of collateral that would have been contractually required at December 31, 2014if the long-term senior debt ratings for the Corporation or certain subsidiaries had been lower by one incremental notch and by an additional second incremental notch.
|
| | | | | | |
| | | |
| Derivative Liabilities Subject to Unilateral Termination Upon Downgrade |
| | | |
| | December 31, 2014 |
| (Dollars in millions) | One incremental notch | Second incremental notch |
| Derivative liability | $ | 1,785 |
| $ | 3,850 |
|
| Collateral posted | 1,520 |
| 2,986 |
|
Valuation Adjustments on Derivatives
The Corporation records credit risk valuation adjustments on derivatives in order to properly reflect the credit quality of the counterparties and its own credit quality. The Corporation calculates valuation adjustments on derivatives based on a modeled expected exposure that incorporates current market risk factors. The exposure also takes into consideration credit mitigants such as enforceable master netting agreements and collateral. CDS spread data is used to estimate the default probabilities and severities that are applied to the exposures. Where no observable credit default data is available for counterparties, the Corporation uses proxies and other market data to estimate default probabilities and severity.
Valuation adjustments on derivatives are affected by changes in market spreads, non-credit-related market factors such as interest rate and currency changes that affect the expected exposure, and other factors like changes in collateral arrangements and partial payments. Credit spreads and non-credit factors can move independently. For example, for an interest rate swap, changes in interest rates may increase the expected exposure, which would increase the counterparty credit valuation adjustment (CVA). Independently, counterparty credit spreads may tighten, which would result in an offsetting decrease to CVA.
The Corporation enters into risk management activities to offset market driven exposures. The Corporation often hedges the counterparty spread risk in CVA with CDS. The Corporation hedges other market risks in both CVA and DVA primarily with currency and interest rate swaps. Since the components of the valuation adjustments on derivatives move independently and the Corporation may not hedge all of the market-driven exposures, the
effect of a hedge may increase the gains or losses relating to valuation adjustments on derivatives or may result in a gross gain from valuation adjustments on derivatives becoming a negative adjustment (or the reverse).
In 2014, the Corporation adopted FVA into valuation estimates primarily to include funding costs on uncollateralized derivatives and derivatives where the Corporation is not permitted to use the collateral it receives. The change in estimate resulted in a net pretax FVA charge of $497 million including a charge of $632 million related to funding costs associated with derivative asset exposures, partially offset by a funding benefit of $135 million related to derivative liability exposures. The net FVA charge was recorded as a reduction to sales and trading revenue in Global Markets. The Corporation calculated this valuation adjustment based on modeled expected exposure profiles discounted for the funding risk premium inherent in these derivatives. FVA related to derivative assets and liabilities is the effect of funding costs on the fair value of these derivatives.
The table below presents CVA, DVA and FVA gains (losses) on derivatives, which are recorded in trading account profits, on a gross and net of hedge basis for 2014, 2013 and 2012. CVA gains reduce the cumulative CVA thereby increasing the derivative assets balance. DVA gains increase the cumulative DVA thereby decreasing the derivative liabilities balance. CVA and DVA losses have the opposite impact. FVA gains related to derivative assets reduce the cumulative FVA thereby increasing the derivative assets balance. FVA gains related to derivative liabilities increase the cumulative FVA thereby decreasing the derivative liabilities balance.
|
| | | | | | | | | | | | | | | | | | | | |
| | | | | | | | | |
| Valuation Adjustments on Derivatives |
| Gains (Losses) | | | | | | | | |
| | 2014 | | 2013 | | 2012 |
| (Dollars in millions) | Gross | Net | | Gross | Net | | Gross | Net |
Derivative assets (CVA) (1) | $ | (22 | ) | $ | 191 |
| | $ | 738 |
| $ | (96 | ) | | $ | 1,022 |
| $ | 291 |
|
Derivative assets (FVA) (2) | (632 | ) | (632 | ) | | n/a |
| n/a |
| | n/a |
| n/a |
|
Derivative liabilities (DVA) (3) | (28 | ) | (150 | ) | | (39 | ) | (75 | ) | | (2,212 | ) | (2,477 | ) |
Derivative liabilities (FVA) (2) | 135 |
| 135 |
| | n/a |
| n/a |
| | n/a |
| n/a |
|
| |
(1) | At December 31, 2014, 2013 and 2012, the cumulative CVA reduced the derivative assets balance by $1.6 billion, $1.6 billion and $2.4 billion, respectively. |
| |
(2) | FVA was adopted in 2014 and the cumulative FVA reduced the net derivatives balance by $497 million. |
| |
(3) | At December 31, 2014, 2013 and 2012, the cumulative DVA reduced the derivative liabilities balance by $0.8 billion, $0.8 billion and $0.8 billion, respectively. |
n/a = not applicable
The table below presents the amortized cost, gross unrealized gains and losses, and fair value of available-for-sale (AFS) debt securities, other debt securities carried at fair value, HTM debt securities and AFS marketable equity securities at December 31, 2014 and 2013.
|
| | | | | | | | | | | | | | | |
| | | | | | | | |
| Debt Securities and Available-for-Sale Marketable Equity Securities | | | | |
| | |
| | December 31, 2014 |
| (Dollars in millions) | Amortized Cost | | Gross
Unrealized Gains | | Gross
Unrealized Losses | | Fair Value |
| Available-for-sale debt securities | | | | | | | |
| U.S. Treasury and agency securities | $ | 69,267 |
| | $ | 360 |
| | $ | (32 | ) | | $ | 69,595 |
|
| Mortgage-backed securities: | | | | | | | |
|
| Agency | 163,592 |
| | 2,040 |
| | (593 | ) | | 165,039 |
|
| Agency-collateralized mortgage obligations | 14,175 |
| | 152 |
| | (79 | ) | | 14,248 |
|
Non-agency residential (1) | 4,244 |
| | 287 |
| | (77 | ) | | 4,454 |
|
| Commercial | 3,931 |
| | 69 |
| | — |
| | 4,000 |
|
| Non-U.S. securities | 6,208 |
| | 33 |
| | (11 | ) | | 6,230 |
|
| Corporate/Agency bonds | 361 |
| | 9 |
| | (2 | ) | | 368 |
|
| Other taxable securities, substantially all asset-backed securities | 10,774 |
| | 39 |
| | (22 | ) | | 10,791 |
|
| Total taxable securities | 272,552 |
| | 2,989 |
| | (816 | ) | | 274,725 |
|
| Tax-exempt securities | 9,556 |
| | 12 |
| | (19 | ) | | 9,549 |
|
| Total available-for-sale debt securities | 282,108 |
| | 3,001 |
| | (835 | ) | | 284,274 |
|
| Other debt securities carried at fair value | 36,524 |
| | 261 |
| | (364 | ) | | 36,421 |
|
| Total debt securities carried at fair value | 318,632 |
| | 3,262 |
| | (1,199 | ) | | 320,695 |
|
| Held-to-maturity debt securities, substantially all U.S. agency mortgage-backed securities | 59,766 |
| | 486 |
| | (611 | ) | | 59,641 |
|
| Total debt securities | $ | 378,398 |
| | $ | 3,748 |
| | $ | (1,810 | ) | | $ | 380,336 |
|
Available-for-sale marketable equity securities (2) | $ | 336 |
| | $ | 27 |
| | $ | — |
| | $ | 363 |
|
| | | | | | | | |
| | December 31, 2013 |
| Available-for-sale debt securities | | | | | | | |
| U.S. Treasury and agency securities | $ | 8,910 |
| | $ | 106 |
| | $ | (62 | ) | | $ | 8,954 |
|
| Mortgage-backed securities: | |
| | |
| | |
| | |
|
| Agency | 170,112 |
| | 777 |
| | (5,954 | ) | | 164,935 |
|
| Agency-collateralized mortgage obligations | 22,731 |
| | 76 |
| | (315 | ) | | 22,492 |
|
Non-agency residential (1) | 6,124 |
| | 238 |
| | (123 | ) | | 6,239 |
|
| Commercial | 2,429 |
| | 63 |
| | (12 | ) | | 2,480 |
|
| Non-U.S. securities | 7,207 |
| | 37 |
| | (24 | ) | | 7,220 |
|
| Corporate/Agency bonds | 860 |
| | 20 |
| | (7 | ) | | 873 |
|
| Other taxable securities, substantially all asset-backed securities | 16,805 |
| | 30 |
| | (5 | ) | | 16,830 |
|
| Total taxable securities | 235,178 |
| | 1,347 |
| | (6,502 | ) | | 230,023 |
|
| Tax-exempt securities | 5,967 |
| | 10 |
| | (49 | ) | | 5,928 |
|
| Total available-for-sale debt securities | 241,145 |
| | 1,357 |
| | (6,551 | ) | | 235,951 |
|
| Other debt securities carried at fair value | 34,145 |
| | 34 |
| | (1,335 | ) | | 32,844 |
|
| Total debt securities carried at fair value | 275,290 |
| | 1,391 |
| | (7,886 | ) | | 268,795 |
|
| Held-to-maturity debt securities, substantially all U.S. agency mortgage-backed securities | 55,150 |
| | 20 |
| | (2,740 | ) | | 52,430 |
|
| Total debt securities | $ | 330,440 |
| | $ | 1,411 |
| | $ | (10,626 | ) | | $ | 321,225 |
|
Available-for-sale marketable equity securities (2) | $ | 230 |
| | $ | — |
| | $ | (7 | ) | | $ | 223 |
|
| |
(1) | At December 31, 2014 and 2013, the underlying collateral type included approximately 76 percent and 89 percent prime, 14 percent and seven percent Alt-A, and 10 percent and four percent subprime. |
| |
(2) | Classified in other assets on the Consolidated Balance Sheet. |
At December 31, 2014, the accumulated net unrealized gain on AFS debt securities included in accumulated OCI was $1.3 billion, net of the related income taxes of $823 million. At December 31, 2014 and 2013, the Corporation had nonperforming AFS debt securities of $161 million and $103 million.
The table below presents the components of other debt securities carried at fair value where the changes in fair value are reported in other income. In 2014, the Corporation recorded unrealized mark-to-market net gains in other income of$1.2 billion and realized gains of $275 millionon other debt securities carried at fair value, which exclude the impact of certain hedges, the results of which are also reported in other income, compared to unrealized mark-to-market net losses of $1.3 billion and realized losses of $963 million in 2013.
|
| | | | | | | |
| | | | |
| Other Debt Securities Carried at Fair Value |
| | | | |
| | December 31 |
| (Dollars in millions) | 2014 | | 2013 |
| U.S. Treasury and agency securities | $ | 1,541 |
| | $ | 4,062 |
|
| Mortgage-backed securities: | | | |
| Agency | 15,704 |
| | 16,500 |
|
| Agency-collateralized mortgage obligations | — |
| | 218 |
|
| Non-agency residential | 3,745 |
| | — |
|
| Commercial | — |
| | 749 |
|
Non-U.S. securities (1) | 15,132 |
| | 11,315 |
|
| Other taxable securities, substantially all asset-backed securities | 299 |
| | — |
|
| Total | $ | 36,421 |
| | $ | 32,844 |
|
| |
(1) | These securities are primarily used to satisfy certain international regulatory liquidity requirements. |
The table below presents gross realized gains and losses on sales of AFS debt securities for 2014, 2013 and 2012.
|
| | | | | | | | | | | |
| | | | | | |
| Gains and Losses on Sales of AFS Debt Securities |
| | | | | | |
| (Dollars in millions) | 2014 | | 2013 | | 2012 |
| Gross gains | $ | 1,366 |
| | $ | 1,302 |
| | $ | 2,128 |
|
| Gross losses | (12 | ) | | (31 | ) | | (466 | ) |
| Net gains on sales of AFS debt securities | $ | 1,354 |
| | $ | 1,271 |
| | $ | 1,662 |
|
| Income tax expense attributable to realized net gains on sales of AFS debt securities | $ | 515 |
| | $ | 470 |
| | $ | 615 |
|
The table below presents the amortized cost and fair value of the Corporation’s debt securities carried at fair value and HTM debt securities from Fannie Mae (FNMA), the Government National Mortgage Association (GNMA), U.S. Treasury and Freddie Mac (FHLMC), where the investment exceeded 10 percent of consolidated shareholders’ equity at December 31, 2014 and 2013.
|
| | | | | | | | | | | | | | | |
| | | | | | | | |
| Selected Securities Exceeding 10 Percent of Shareholders’ Equity |
| | | | | | | | |
| | December 31 |
| | 2014 | | 2013 |
| (Dollars in millions) | Amortized Cost | | Fair Value | | Amortized Cost | | Fair Value |
| Fannie Mae | $ | 130,725 |
| | $ | 131,418 |
| | $ | 123,813 |
| | $ | 118,708 |
|
| Government National Mortgage Association | 98,278 |
| | 98,633 |
| | 118,700 |
| | 115,314 |
|
| U.S. Treasury | 68,481 |
| | 68,801 |
| | 10,533 |
| | 10,428 |
|
| Freddie Mac | 28,288 |
| | 28,556 |
| | 24,908 |
| | 24,075 |
|
The table below presents the fair value and the associated gross unrealized losses on AFS debt securities and whether these securities have had gross unrealized losses for less than 12 months or for 12 months or longer at December 31, 2014 and 2013.
|
| | | | | | | | | | | | | | | | | | | | | | | |
| | | | | | | | | | | | |
| Temporarily Impaired and Other-than-temporarily Impaired AFS Debt Securities | | | | | | |
| | | | | | | | | | | | |
| | December 31, 2014 |
| | Less than Twelve Months | | Twelve Months or Longer | | Total |
| (Dollars in millions) | Fair Value | | Gross Unrealized Losses | | Fair Value | | Gross Unrealized Losses | | Fair Value | | Gross Unrealized Losses |
| Temporarily impaired available-for-sale debt securities | |
| | |
| | |
| | |
| | |
| | |
|
| U.S. Treasury and agency securities | $ | 10,121 |
| | $ | (22 | ) | | $ | 667 |
| | $ | (10 | ) | | $ | 10,788 |
| | $ | (32 | ) |
| Mortgage-backed securities: | | | | | | | | | | | |
| Agency | 1,366 |
| | (8 | ) | | 43,118 |
| | (585 | ) | | 44,484 |
| | (593 | ) |
| Agency-collateralized mortgage obligations | 2,242 |
| | (19 | ) | | 3,075 |
| | (60 | ) | | 5,317 |
| | (79 | ) |
| Non-agency residential | 307 |
| | (3 | ) | | 809 |
| | (41 | ) | | 1,116 |
| | (44 | ) |
| Non-U.S. securities | 157 |
| | (9 | ) | | 32 |
| | (2 | ) | | 189 |
| | (11 | ) |
| Corporate/Agency bonds | 43 |
| | (1 | ) | | 93 |
| | (1 | ) | | 136 |
| | (2 | ) |
| Other taxable securities, substantially all asset-backed securities | 575 |
| | (3 | ) | | 1,080 |
| | (19 | ) | | 1,655 |
| | (22 | ) |
| Total taxable securities | 14,811 |
| | (65 | ) | | 48,874 |
| | (718 | ) | | 63,685 |
| | (783 | ) |
| Tax-exempt securities | 980 |
| | (1 | ) | | 680 |
| | (18 | ) | | 1,660 |
| | (19 | ) |
| Total temporarily impaired available-for-sale debt securities | 15,791 |
| | (66 | ) | | 49,554 |
| | (736 | ) | | 65,345 |
| | (802 | ) |
Other-than-temporarily impaired available-for-sale debt securities (1) | | | | | | | | | | | |
| Non-agency residential mortgage-backed securities | 555 |
| | (33 | ) | | — |
| | — |
| | 555 |
| | (33 | ) |
Total temporarily impaired and other-than-temporarily impaired available-for-sale debt securities | $ | 16,346 |
| | $ | (99 | ) | | $ | 49,554 |
| | $ | (736 | ) | | $ | 65,900 |
| | $ | (835 | ) |
| | | | | | | | | | | | |
| | December 31, 2013 |
| Temporarily impaired available-for-sale debt securities | | | | | | | | | | | |
| U.S. Treasury and agency securities | $ | 5,770 |
| | $ | (61 | ) | | $ | 19 |
| | $ | (1 | ) | | $ | 5,789 |
| | $ | (62 | ) |
| Mortgage-backed securities: | | | | | | | | | | | |
| Agency | 132,032 |
| | (5,457 | ) | | 9,324 |
| | (497 | ) | | 141,356 |
| | (5,954 | ) |
| Agency-collateralized mortgage obligations | 13,438 |
| | (210 | ) | | 2,661 |
| | (105 | ) | | 16,099 |
| | (315 | ) |
| Non-agency residential | 819 |
| | (15 | ) | | 1,237 |
| | (106 | ) | | 2,056 |
| | (121 | ) |
| Commercial | 286 |
| | (12 | ) | | — |
| | — |
| | 286 |
| | (12 | ) |
| Non-U.S. securities | — |
| | — |
| | 45 |
| | (24 | ) | | 45 |
| | (24 | ) |
| Corporate/Agency bonds | 106 |
| | (3 | ) | | 282 |
| | (4 | ) | | 388 |
| | (7 | ) |
| Other taxable securities, substantially all asset-backed securities | 116 |
| | (2 | ) | | 280 |
| | (3 | ) | | 396 |
| | (5 | ) |
| Total taxable securities | 152,567 |
| | (5,760 | ) | | 13,848 |
| | (740 | ) | | 166,415 |
| | (6,500 | ) |
| Tax-exempt securities | 1,789 |
| | (30 | ) | | 990 |
| | (19 | ) | | 2,779 |
| | (49 | ) |
| Total temporarily impaired available-for-sale debt securities | 154,356 |
| | (5,790 | ) | | 14,838 |
| | (759 | ) | | 169,194 |
| | (6,549 | ) |
Other-than-temporarily impaired available-for-sale debt securities (1) | | | | | | | | | | | |
| Non-agency residential mortgage-backed securities | 2 |
| | (1 | ) | | 1 |
| | (1 | ) | | 3 |
| | (2 | ) |
Total temporarily impaired and other-than-temporarily impaired available-for-sale debt securities | $ | 154,358 |
| | $ | (5,791 | ) | | $ | 14,839 |
| | $ | (760 | ) | | $ | 169,197 |
| | $ | (6,551 | ) |
| |
(1) | Includes other-than-temporarily impaired AFS debt securities on which an OTTI loss, primarily related to changes in interest rates, remains in accumulated OCI. |
The Corporation recorded other-than-temporary impairment (OTTI) losses on AFS debt securities in 2014, 2013 and 2012 as presented in the Net Impairment Losses Recognized in Earnings table. Substantially all OTTI losses in 2014, 2013 and 2012 consisted of credit losses on non-agency residential mortgage-backed securities (RMBS) and were recorded in other income in the Consolidated Statement of Income. A debt security is impaired when its fair value is less than its amortized cost. If the Corporation intends or will more-likely-than-not be required to sell a debt security prior to recovery, the entire impairment loss is recorded in the Consolidated Statement of Income. For AFS debt securities the Corporation does not intend or will not more-likely-than-not be required to sell, an analysis is performed to determine if any of the impairment is due to credit or whether it is due to other factors (e.g., interest rate). Credit losses are considered unrecoverable and are recorded in the Consolidated Statement of Income with the remaining unrealized losses recorded in OCI. In certain instances, the credit loss on a debt security may exceed the total
impairment, in which case, the excess of the credit loss over the total impairment is recorded as an unrealized gain in OCI.
|
| | | | | | | | | | | |
| | | | | | |
| Net Impairment Losses Recognized in Earnings |
| | | | | | |
| (Dollars in millions) | 2014 | | 2013 | | 2012 |
| Total OTTI losses (unrealized and realized) | $ | (30 | ) | | $ | (21 | ) | | $ | (57 | ) |
| Unrealized OTTI losses recognized in OCI | 14 |
| | 1 |
| | 4 |
|
| Net impairment losses recognized in earnings | $ | (16 | ) | | $ | (20 | ) | | $ | (53 | ) |
The table below presents a rollforward of the credit losses recognized in earnings in 2014, 2013 and 2012 on AFS debt securities that the Corporation does not have the intent to sell or will not more-likely-than-not be required to sell.
|
| | | | | | | | | | | |
| | | | | | |
| Rollforward of Credit Losses Recognized | | | | |
| | | | | | |
| (Dollars in millions) | 2014 | | 2013 | | 2012 |
| Balance, January 1 | $ | 184 |
| | $ | 243 |
| | $ | 310 |
|
| Additions for credit losses recognized on AFS debt securities that had no previous impairment losses | 14 |
| | 6 |
| | 7 |
|
| Additions for credit losses recognized on AFS debt securities that had previously incurred impairment losses | 2 |
| | 14 |
| | 46 |
|
| Reductions for AFS debt securities matured, sold or intended to be sold | — |
| | (79 | ) | | (120 | ) |
| Balance, December 31 | $ | 200 |
| | $ | 184 |
| | $ | 243 |
|
The Corporation estimates the portion of a loss on a security that is attributable to credit using a discounted cash flow model and estimates the expected cash flows of the underlying collateral using internal credit, interest rate and prepayment risk models that incorporate management’s best estimate of current key assumptions such as default rates, loss severity and prepayment rates. Assumptions used for the underlying loans that support the mortgage-backed securities (MBS) can vary widely from loan to loan and are influenced by such factors as loan interest rate, geographic location of the borrower, borrower characteristics and collateral type. Based on these assumptions, the Corporation then determines how the underlying collateral cash flows will be distributed to each MBS issued from the applicable special purpose entity. Expected principal and interest cash flows on an impaired AFS debt security are discounted using the effective yield of each individual impaired AFS debt security.
Significant assumptions used in estimating the expected cash flows for measuring credit losses on non-agency RMBS were as follows at December 31, 2014.
|
| | | | | | | | |
| | | | | | |
| Significant Assumptions |
| | | | | | |
| | | | Range (1) |
| | Weighted-
average | | 10th Percentile (2) | | 90th Percentile (2) |
| Prepayment speed | 15.3 | % | | 3.1 | % | | 29.9 | % |
| Loss severity | 35.2 |
| | 11.8 |
| | 44.7 |
|
| Life default rate | 39.6 |
| | 1.5 |
| | 98.6 |
|
| |
(1) | Represents the range of inputs/assumptions based upon the underlying collateral. |
| |
(2) | The value of a variable below which the indicated percentile of observations will fall. |
Annual constant prepayment speed and loss severity rates are projected considering collateral characteristics such as loan-to-value (LTV), creditworthiness of borrowers as measured using FICO scores, and geographic concentrations. The weighted-average severity by collateral type was 31.0 percent for prime, 34.1 percent for Alt-A and 45.0 percent for subprime at December 31, 2014. Additionally, default rates are projected by considering collateral characteristics including, but not limited to, LTV, FICO and geographic concentration. Weighted-average life default rates by collateral type were 24.5 percent for prime, 42.4 percent for Alt-A and 42.0 percent for subprime at December 31, 2014.
The expected maturity distribution of the Corporation’s MBS, the contractual maturity distribution of the Corporation’s other debt securities carried at fair value and HTM debt securities, and the yields on the Corporation’s debt securities carried at fair value and HTM debt securities at December 31, 2014 are summarized in the table below. Actual maturities may differ from the contractual or expected maturities since borrowers may have the right to prepay obligations with or without prepayment penalties.
|
| | | | | | | | | | | | | | | | | | | | | | | | | | | | | | | | | | |
| | | | | | | | | | | | | | | | | | | | |
| Maturities of Debt Securities Carried at Fair Value and Held-to-maturity Debt Securities |
| | | | | | | | | | | | | | | | | | | | |
| | December 31, 2014 |
| | Due in One Year or Less | | Due after One Year through Five Years | | Due after Five Years through Ten Years | | Due after Ten Years | | Total |
| (Dollars in millions) | Amount | | Yield (1) | | Amount | | Yield (1) | | Amount | | Yield (1) | | Amount | | Yield (1) | | Amount | | Yield (1) |
| Amortized cost of debt securities carried at fair value | |
| | |
| | |
| | |
| | |
| | |
| | |
| | |
| | |
| | |
|
| U.S. Treasury and agency securities | $ | 577 |
| | 0.41 | % | | $ | 51,153 |
| | 1.60 | % | | $ | 17,535 |
| | 2.10 | % | | $ | 1,480 |
| | 3.00 | % | | $ | 70,745 |
| | 1.78 | % |
| Mortgage-backed securities: | |
| | |
| | |
| | |
| | |
| | |
| | |
| | |
| | |
| | |
|
| Agency | 28 |
| | 4.60 |
| | 24,283 |
| | 2.70 |
| | 152,950 |
| | 2.80 |
| | 2,175 |
| | 3.00 |
| | 179,436 |
| | 2.80 |
|
| Agency-collateralized mortgage obligations | 794 |
| | 0.40 |
| | 2,874 |
| | 2.00 |
| | 10,488 |
| | 2.80 |
| | 19 |
| | 0.60 |
| | 14,175 |
| | 2.50 |
|
| Non-agency residential | 517 |
| | 5.09 |
| | 1,834 |
| | 5.39 |
| | 1,236 |
| | 4.78 |
| | 4,443 |
| | 10.61 |
| | 8,030 |
| | 8.15 |
|
| Commercial | 188 |
| | 9.69 |
| | 590 |
| | 2.32 |
| | 3,150 |
| | 2.80 |
| | 3 |
| | 2.83 |
| | 3,931 |
| | 3.07 |
|
| Non-U.S. securities | 18,991 |
| | 0.98 |
| | 2,261 |
| | 3.83 |
| | 68 |
| | 6.23 |
| | — |
| | — |
| | 21,320 |
| | 1.30 |
|
| Corporate/Agency bonds | 59 |
| | 1.79 |
| | 112 |
| | 3.77 |
| | 94 |
| | 3.74 |
| | 96 |
| | 0.63 |
| | 361 |
| | 2.43 |
|
| Other taxable securities, substantially all asset-backed securities | 3,199 |
| | 1.34 |
| | 5,707 |
| | 1.22 |
| | 1,376 |
| | 1.81 |
| | 796 |
| | 4.36 |
| | 11,078 |
| | 1.59 |
|
| Total taxable securities | 24,353 |
| | 1.16 |
| | 88,814 |
| | 2.07 |
| | 186,897 |
| | 2.80 |
| | 9,012 |
| | 6.86 |
| | 309,076 |
| | 2.56 |
|
| Tax-exempt securities | 929 |
| | 0.97 |
| | 3,768 |
| | 1.13 |
| | 3,082 |
| | 1.15 |
| | 1,777 |
| | 0.86 |
| | 9,556 |
| | 1.14 |
|
| Total amortized cost of debt securities carried at fair value | $ | 25,282 |
| | 1.16 |
| | $ | 92,582 |
| | 2.03 |
| | $ | 189,979 |
| | 2.77 |
| | $ | 10,789 |
| | 5.87 |
| | $ | 318,632 |
| | 2.51 |
|
Amortized cost of held-to-maturity debt securities (2) | $ | 108 |
| | 0.84 |
| | $ | 19,513 |
| | 2.40 |
| | $ | 39,917 |
| | 2.30 |
| | $ | 228 |
| | 3.31 |
| | $ | 59,766 |
| | 2.40 |
|
| | | | | | | | | | | | | | | | | | | | |
| Debt securities carried at fair value | |
| | |
| | |
| | |
| | |
| | |
| | |
| | |
| | |
| | |
|
| U.S. Treasury and agency securities | $ | 577 |
| | |
| | $ | 51,383 |
| | |
| | $ | 17,633 |
| | |
| | $ | 1,543 |
| | |
| | $ | 71,136 |
| | |
|
| Mortgage-backed securities: | |
| | |
| | |
| | |
| | |
| | |
| | |
| | |
| | |
| | |
|
| Agency | 29 |
| | |
| | 24,859 |
| | |
| | 153,649 |
| | |
| | 2,206 |
| | |
| | 180,743 |
| | |
|
| Agency-collateralized mortgage obligations | 795 |
| | |
| | 2,838 |
| | |
| | 10,596 |
| | |
| | 19 |
| | |
| | 14,248 |
| | |
|
| Non-agency residential | 521 |
| | |
| | 1,849 |
| | |
| | 1,316 |
| | |
| | 4,513 |
| | |
| | 8,199 |
| | |
|
| Commercial | 191 |
| | |
| | 594 |
| | |
| | 3,212 |
| | |
| | 3 |
| | |
| | 4,000 |
| | |
|
| Non-U.S. securities | 18,982 |
| | |
| | 2,309 |
| | |
| | 71 |
| | |
| | — |
| | |
| | 21,362 |
| | |
|
| Corporate/Agency bonds | 60 |
| | |
| | 117 |
| | |
| | 96 |
| | |
| | 95 |
| | |
| | 368 |
| | |
|
| Other taxable securities, substantially all asset-backed securities | 3,202 |
| | |
| | 5,699 |
| | |
| | 1,399 |
| | |
| | 790 |
| | |
| | 11,090 |
| | |
|
| Total taxable securities | 24,357 |
| | |
| | 89,648 |
| | |
| | 187,972 |
| | |
| | 9,169 |
| | |
| | 311,146 |
| | |
|
| Tax-exempt securities | 929 |
| | |
| | 3,770 |
| | |
| | 3,078 |
| | |
| | 1,772 |
| | |
| | 9,549 |
| | |
|
| Total debt securities carried at fair value | $ | 25,286 |
| | |
| | $ | 93,418 |
| | |
| | $ | 191,050 |
| | |
| | $ | 10,941 |
| | |
| | $ | 320,695 |
| | |
|
Fair value of held-to-maturity debt securities (2) | $ | 108 |
| | | | $ | 19,762 |
| | | | $ | 39,538 |
| | | | $ | 233 |
| | | | $ | 59,641 |
| | |
| |
(1) | Average yield is computed using the effective yield of each security at the end of the period, weighted based on the amortized cost of each security. The effective yield considers the contractual coupon, amortization of premiums and accretion of discounts, and excludes the effect of related hedging derivatives. |
| |
(2) | Substantially all U.S. agency MBS. |
Certain Corporate and Strategic Investments
The Corporation’s 49 percent investment in a merchant services joint venture, which is recorded in other assets on the Consolidated Balance Sheet and in Consumer & Business Banking, had a carrying value of $3.1 billion and $3.2 billion at December 31, 2014 and 2013. For additional information, see Note 12 – Commitments and Contingencies.
In 2013, the Corporation sold its remaining investment in China Construction Bank Corporation (CCB) and realized a pretax gain of $753 million in All Other reported in equity investment income in the Consolidated Statement of Income. The strategic assistance agreement between the Corporation and CCB, which includes cooperation in specific business areas, extends through 2016.
NOTE 4 Outstanding Loans and Leases
The following tables present total outstanding loans and leases and an aging analysis for the Corporation’s Home Loans, Credit Card and Other Consumer, and Commercial portfolio segments, by class of financing receivables, at December 31, 2014 and 2013.
|
| | | | | | | | | | | | | | | | | | | | | | | | | | | | | | | |
| | | | | | | | | | | | | | | | |
| | December 31, 2014 |
| (Dollars in millions) | 30-59 Days Past Due (1) | | 60-89 Days Past Due (1) | | 90 Days or
More Past Due (2) | | Total Past
Due 30 Days or More | | Total Current or Less Than 30 Days Past Due (3) | | Purchased
Credit-impaired (4) | | Loans Accounted for Under the Fair Value Option | | Total Outstandings |
| Home loans | |
| | | | |
| | |
| | |
| | |
| | |
| | |
|
| Core portfolio | | | | | | | | | | | | | | | |
| Residential mortgage | $ | 1,847 |
| | $ | 700 |
| | $ | 5,561 |
| | $ | 8,108 |
| | $ | 154,112 |
| | | | | | $ | 162,220 |
|
| Home equity | 218 |
| | 105 |
| | 744 |
| | 1,067 |
| | 50,820 |
| | | | | | 51,887 |
|
| Legacy Assets & Servicing portfolio | | | | | | | | | | | | | | | |
Residential mortgage (5) | 2,008 |
| | 1,060 |
| | 10,513 |
| | 13,581 |
| | 25,244 |
| | $ | 15,152 |
| | | | 53,977 |
|
| Home equity | 374 |
| | 174 |
| | 1,166 |
| | 1,714 |
| | 26,507 |
| | 5,617 |
| | | | 33,838 |
|
| Credit card and other consumer | | | | | | | | | | | | | | | |
| U.S. credit card | 494 |
| | 341 |
| | 866 |
| | 1,701 |
| | 90,178 |
| | | | | | 91,879 |
|
| Non-U.S. credit card | 49 |
| | 39 |
| | 95 |
| | 183 |
| | 10,282 |
| | | | | | 10,465 |
|
Direct/Indirect consumer (6) | 245 |
| | 71 |
| | 65 |
| | 381 |
| | 80,000 |
| | | | | | 80,381 |
|
Other consumer (7) | 11 |
| | 2 |
| | 2 |
| | 15 |
| | 1,831 |
| | | | | | 1,846 |
|
| Total consumer | 5,246 |
| | 2,492 |
| | 19,012 |
| | 26,750 |
| | 438,974 |
| | 20,769 |
| | | | 486,493 |
|
Consumer loans accounted for under the fair value option (8) | |
| | |
| | |
| | |
| | |
| | |
| | $ | 2,077 |
| | 2,077 |
|
| Total consumer loans and leases | 5,246 |
| | 2,492 |
| | 19,012 |
| | 26,750 |
| | 438,974 |
| | 20,769 |
| | 2,077 |
| | 488,570 |
|
| Commercial | | | | | | | | | | | | | | | |
| U.S. commercial | 320 |
| | 151 |
| | 318 |
| | 789 |
| | 219,504 |
| | | | | | 220,293 |
|
Commercial real estate (9) | 138 |
| | 16 |
| | 288 |
| | 442 |
| | 47,240 |
| | | | | | 47,682 |
|
| Commercial lease financing | 121 |
| | 41 |
| | 42 |
| | 204 |
| | 24,662 |
| | | | | | 24,866 |
|
| Non-U.S. commercial | 5 |
| | 4 |
| | — |
| | 9 |
| | 80,074 |
| | | | | | 80,083 |
|
| U.S. small business commercial | 88 |
| | 45 |
| | 94 |
| | 227 |
| | 13,066 |
| | | | | | 13,293 |
|
| Total commercial | 672 |
| | 257 |
| | 742 |
| | 1,671 |
| | 384,546 |
| | | | | | 386,217 |
|
Commercial loans accounted for under the fair value option (8) | |
| | |
| | |
| | |
| | |
| | |
| | 6,604 |
| | 6,604 |
|
| Total commercial loans and leases | 672 |
| | 257 |
| | 742 |
| | 1,671 |
| | 384,546 |
| | | | 6,604 |
| | 392,821 |
|
| Total loans and leases | $ | 5,918 |
| | $ | 2,749 |
| | $ | 19,754 |
| | $ | 28,421 |
| | $ | 823,520 |
| | $ | 20,769 |
| | $ | 8,681 |
| | $ | 881,391 |
|
| Percentage of outstandings | 0.67 | % | | 0.31 | % | | 2.24 | % | | 3.22 | % | | 93.44 | % | | 2.36 | % | | 0.98 | % | | 100.00 | % |
| |
(1) | Home loans 30-59 days past due includes fully-insured loans of $2.1 billion and nonperforming loans of $392 million. Home loans 60-89 days past due includes fully-insured loans of $1.1 billion and nonperforming loans of $332 million. |
| |
(2) | Home loans includes fully-insured loans of $11.4 billion. |
| |
(3) | Home loans includes $3.6 billion and direct/indirect consumer includes $27 million of nonperforming loans. |
| |
(4) | PCI loan amounts are shown gross of the valuation allowance. |
| |
(5) | Total outstandings includes pay option loans of $3.2 billion. The Corporation no longer originates this product. |
| |
(6) | Total outstandings includes dealer financial services loans of $37.7 billion, unsecured consumer lending loans of $1.5 billion, U.S. securities-based lending loans of $35.8 billion, non-U.S. consumer loans of $4.0 billion, student loans of $632 million and other consumer loans of $761 million. |
| |
(7) | Total outstandings includes consumer finance loans of $676 million, consumer leases of $1.0 billion, consumer overdrafts of $162 million and other non-U.S. consumer loans of $3 million. |
| |
(8) | Consumer loans accounted for under the fair value option were residential mortgage loans of $1.9 billion and home equity loans of $196 million. Commercial loans accounted for under the fair value option were U.S. commercial loans of $1.9 billion and non-U.S. commercial loans of $4.7 billion. For additional information, see Note 20 – Fair Value Measurements and Note 21 – Fair Value Option. |
| |
(9) | Total outstandings includes U.S. commercial real estate loans of $45.2 billion and non-U.S. commercial real estate loans of $2.5 billion. |
|
| | | | | | | | | | | | | | | | | | | | | | | | | | | | | | | |
| | | | | | | | | | | | | | | | |
| | December 31, 2013 |
| (Dollars in millions) | 30-59 Days
Past Due (1) | | 60-89 Days Past Due (1) | | 90 Days or
More
Past Due (2) | | Total Past
Due 30 Days
or More | | Total Current or Less Than 30 Days Past Due (3) | | Purchased
Credit-impaired (4) | | Loans Accounted for Under the Fair Value Option | | Total Outstandings |
| Home loans | |
| | | | |
| | |
| | |
| | |
| | |
| | |
|
| Core portfolio | | | | | | | | | | | | | | | |
| Residential mortgage | $ | 2,151 |
| | $ | 754 |
| | $ | 7,188 |
| | $ | 10,093 |
| | $ | 167,243 |
| | | | |
| | $ | 177,336 |
|
| Home equity | 243 |
| | 113 |
| | 693 |
| | 1,049 |
| | 53,450 |
| | | | |
| | 54,499 |
|
| Legacy Assets & Servicing portfolio | | | |
| | |
| | |
| | |
| | |
| | |
| | |
|
Residential mortgage (5) | 2,758 |
| | 1,412 |
| | 16,746 |
| | 20,916 |
| | 31,142 |
| | $ | 18,672 |
| | |
| | 70,730 |
|
| Home equity | 444 |
| | 221 |
| | 1,292 |
| | 1,957 |
| | 30,623 |
| | 6,593 |
| | |
| | 39,173 |
|
| Credit card and other consumer | | | |
| | |
| | |
| | |
| | |
| | |
| | |
|
| U.S. credit card | 598 |
| | 422 |
| | 1,053 |
| | 2,073 |
| | 90,265 |
| | | | |
| | 92,338 |
|
| Non-U.S. credit card | 63 |
| | 54 |
| | 131 |
| | 248 |
| | 11,293 |
| | | | |
| | 11,541 |
|
Direct/Indirect consumer (6) | 431 |
| | 175 |
| | 410 |
| | 1,016 |
| | 81,176 |
| | | | |
| | 82,192 |
|
Other consumer (7) | 24 |
| | 8 |
| | 20 |
| | 52 |
| | 1,925 |
| | | | |
| | 1,977 |
|
| Total consumer | 6,712 |
| | 3,159 |
| | 27,533 |
| | 37,404 |
| | 467,117 |
| | 25,265 |
| | |
| 529,786 |
|
Consumer loans accounted for under the fair value option (8) | | | | | | | | | | | | | $ | 2,164 |
|
| 2,164 |
|
| Total consumer loans and leases | 6,712 |
| | 3,159 |
| | 27,533 |
| | 37,404 |
| | 467,117 |
| | 25,265 |
| | 2,164 |
| | 531,950 |
|
| Commercial | | | |
| | |
| | |
| | |
| | |
| | |
| | |
|
| U.S. commercial | 363 |
| | 151 |
| | 309 |
| | 823 |
| | 211,734 |
| | | | |
| | 212,557 |
|
Commercial real estate (9) | 30 |
| | 29 |
| | 243 |
| | 302 |
| | 47,591 |
| | | | |
| | 47,893 |
|
| Commercial lease financing | 110 |
| | 37 |
| | 48 |
| | 195 |
| | 25,004 |
| | | | |
| | 25,199 |
|
| Non-U.S. commercial | 103 |
| | 8 |
| | 17 |
| | 128 |
| | 89,334 |
| | | | |
| | 89,462 |
|
| U.S. small business commercial | 87 |
| | 55 |
| | 113 |
| | 255 |
| | 13,039 |
| | | | |
| | 13,294 |
|
| Total commercial | 693 |
| | 280 |
| | 730 |
| | 1,703 |
| | 386,702 |
| | | | |
| | 388,405 |
|
Commercial loans accounted for under the fair value option (8) | | | | | | | | | | | | | 7,878 |
| | 7,878 |
|
| Total commercial loans and leases | 693 |
| | 280 |
| | 730 |
| | 1,703 |
| | 386,702 |
| | | | 7,878 |
| | 396,283 |
|
| Total loans and leases | $ | 7,405 |
| | $ | 3,439 |
| | $ | 28,263 |
| | $ | 39,107 |
| | $ | 853,819 |
| | $ | 25,265 |
| | $ | 10,042 |
| | $ | 928,233 |
|
| Percentage of outstandings | 0.80 | % | | 0.37 | % | | 3.04 | % | | 4.21 | % | | 91.99 | % | | 2.72 | % | | 1.08 | % | | 100.00 | % |
| |
(1) | Home loans 30-59 days past due includes fully-insured loans of $2.5 billion and nonperforming loans of $623 million. Home loans 60-89 days past due includes fully-insured loans of $1.2 billion and nonperforming loans of $410 million. |
| |
(2) | Home loans includes fully-insured loans of $17.0 billion. |
| |
(3) | Home loans includes $5.9 billion and direct/indirect consumer includes $33 million of nonperforming loans. |
| |
(4) | PCI loan amounts are shown gross of the valuation allowance. |
| |
(5) | Total outstandings includes pay option loans of $4.4 billion. The Corporation no longer originates this product. |
| |
(6) | Total outstandings includes dealer financial services loans of $38.5 billion, unsecured consumer lending loans of $2.7 billion, U.S. securities-based lending loans of $31.2 billion, non-U.S. consumer loans of $4.7 billion, student loans of $4.1 billion and other consumer loans of $1.0 billion. |
| |
(7) | Total outstandings includes consumer finance loans of $1.2 billion, consumer leases of $606 million, consumer overdrafts of $176 million and other non-U.S. consumer loans of $5 million. |
| |
(8) | Consumer loans accounted for under the fair value option were residential mortgage loans of $2.0 billion and home equity loans of $147 million. Commercial loans accounted for under the fair value option were U.S. commercial loans of $1.5 billion and non-U.S. commercial loans of $6.4 billion. For additional information, see Note 20 – Fair Value Measurements and Note 21 – Fair Value Option. |
| |
(9) | Total outstandings includes U.S. commercial real estate loans of $46.3 billion and non-U.S. commercial real estate loans of $1.6 billion. |
The Corporation has entered into long-term credit protection agreements with FNMA and FHLMC on loans totaling $17.2 billion and $28.2 billion at December 31, 2014 and 2013, providing full credit protection on residential mortgage loans that become severely delinquent. All of these loans are individually insured and therefore the Corporation does not record an allowance for credit losses related to these loans.
Nonperforming Loans and Leases
The Corporation classifies junior-lien home equity loans as nonperforming when the first-lien loan becomes 90 days past due even if the junior-lien loan is performing. At December 31, 2014 and 2013, $800 million and $1.2 billion of such junior-lien home equity loans were included in nonperforming loans.
The Corporation classifies consumer real estate loans that have been discharged in Chapter 7 bankruptcy and not reaffirmed by the borrower as troubled debt restructurings (TDRs), irrespective of payment history or delinquency status, even if the repayment terms for the loan have not been otherwise modified. The
Corporation continues to have a lien on the underlying collateral. At December 31, 2014, nonperforming loans discharged in Chapter 7 bankruptcy with no change in repayment terms were $1.4 billion of which $901 million were current on their contractual payments, while $395 million were 90 days or more past due. Of the contractually current nonperforming loans, more than 80 percent were discharged in Chapter 7 bankruptcy more than 12 months ago, and more than 60 percent were discharged 24 months or more ago. As subsequent cash payments are received on the loans that are contractually current, the interest component of the payments is generally recorded as interest income on a cash basis and the principal component is recorded as a reduction in the carrying value of the loan.
Excluding purchased credit-impaired (PCI) loans, the Corporation sold nonperforming and other delinquent consumer loans with a carrying value, excluding the related allowance, of $4.8 billion and $2.0 billion, and recognized gains of $247 million and $58 million recorded in noninterest income, during 2014 and 2013.
The table below presents the Corporation’s nonperforming loans and leases including nonperforming TDRs, and loans accruing past due 90 days or more at December 31, 2014 and 2013. Nonperforming loans held-for-sale (LHFS) are excluded from
nonperforming loans and leases as they are recorded at either fair value or the lower of cost or fair value. For more information on the criteria for classification as nonperforming, see Note 1 – Summary of Significant Accounting Principles.
|
| | | | | | | | | | | | | | | |
| | | | | | | | |
| Credit Quality | | |
| | | | | | | | |
| | December 31 |
| | Nonperforming Loans and Leases (1) | | Accruing Past Due 90 Days or More |
| (Dollars in millions) | 2014 | | 2013 | | 2014 | | 2013 |
| Home loans | |
| | |
| | |
| | |
|
| Core portfolio | | | | | | | |
Residential mortgage (2) | $ | 2,398 |
| | $ | 3,316 |
| | $ | 3,942 |
| | $ | 5,137 |
|
| Home equity | 1,496 |
| | 1,431 |
| | — |
| | — |
|
| Legacy Assets & Servicing portfolio | |
| | |
| | |
| | |
Residential mortgage (2) | 4,491 |
| | 8,396 |
| | 7,465 |
| | 11,824 |
|
| Home equity | 2,405 |
| | 2,644 |
| | — |
| | — |
|
| Credit card and other consumer | |
| | |
| | | | |
| U.S. credit card | n/a |
| | n/a |
| | 866 |
| | 1,053 |
|
| Non-U.S. credit card | n/a |
| | n/a |
| | 95 |
| | 131 |
|
| Direct/Indirect consumer | 28 |
| | 35 |
| | 64 |
| | 408 |
|
| Other consumer | 1 |
| | 18 |
| | 1 |
| | 2 |
|
| Total consumer | 10,819 |
| | 15,840 |
| | 12,433 |
| | 18,555 |
|
| Commercial | |
| | |
| | |
| | |
|
| U.S. commercial | 701 |
| | 819 |
| | 110 |
| | 47 |
|
| Commercial real estate | 321 |
| | 322 |
| | 3 |
| | 21 |
|
| Commercial lease financing | 3 |
| | 16 |
| | 41 |
| | 41 |
|
| Non-U.S. commercial | 1 |
| | 64 |
| | — |
| | 17 |
|
| U.S. small business commercial | 87 |
| | 88 |
| | 67 |
| | 78 |
|
| Total commercial | 1,113 |
| | 1,309 |
| | 221 |
| | 204 |
|
| Total loans and leases | $ | 11,932 |
| | $ | 17,149 |
| | $ | 12,654 |
| | $ | 18,759 |
|
| |
(1) | Nonperforming loan balances do not include nonaccruing TDRs removed from the PCI loan portfolio prior to January 1, 2010 of $102 million and $260 million at December 31, 2014 and 2013. |
| |
(2) | Residential mortgage loans in the Core and Legacy Assets & Servicing portfolios accruing past due 90 days or more are fully-insured loans. At December 31, 2014 and 2013, residential mortgage includes $7.3 billion and $13.0 billion of loans on which interest has been curtailed by the FHA, and therefore are no longer accruing interest, although principal is still insured, and $4.1 billion and $4.0 billion of loans on which interest is still accruing. |
n/a = not applicable
Credit Quality Indicators
The Corporation monitors credit quality within its Home Loans, Credit Card and Other Consumer, and Commercial portfolio segments based on primary credit quality indicators. For more information on the portfolio segments, see Note 1 – Summary of Significant Accounting Principles. Within the Home Loans portfolio segment, the primary credit quality indicators are refreshed LTV and refreshed FICO score. Refreshed LTV measures the carrying value of the loan as a percentage of the value of the property securing the loan, refreshed quarterly. Home equity loans are evaluated using combined loan-to-value (CLTV) which measures the carrying value of the combined loans that have liens against the property and the available line of credit as a percentage of the value of the property securing the loan, refreshed quarterly. FICO score measures the creditworthiness of the borrower based on the financial obligations of the borrower and the borrower’s credit
history. At a minimum, FICO scores are refreshed quarterly, and in many cases, more frequently. FICO scores are also a primary credit quality indicator for the Credit Card and Other Consumer portfolio segment and the business card portfolio within U.S. small business commercial. Within the Commercial portfolio segment, loans are evaluated using the internal classifications of pass rated or reservable criticized as the primary credit quality indicators. The term reservable criticized refers to those commercial loans that are internally classified or listed by the Corporation as Special Mention, Substandard or Doubtful, which are asset quality categories defined by regulatory authorities. These assets have an elevated level of risk and may have a high probability of default or total loss. Pass rated refers to all loans not considered reservable criticized. In addition to these primary credit quality indicators, the Corporation uses other credit quality indicators for certain types of loans.
The following tables present certain credit quality indicators for the Corporation’s Home Loans, Credit Card and Other Consumer, and Commercial portfolio segments, by class of financing receivables, at December 31, 2014 and 2013.
|
| | | | | | | | | | | | | | | | | | | | | | | |
| | | | | | | | | | | | |
Home Loans – Credit Quality Indicators (1) |
| | |
| | December 31, 2014 |
| (Dollars in millions) | Core Portfolio Residential Mortgage (2) | | Legacy Assets & Servicing Residential
Mortgage (2) | | Residential Mortgage PCI (3) | | Core Portfolio Home Equity (2) | | Legacy Assets & Servicing Home Equity (2) | | Home Equity PCI |
Refreshed LTV (4, 5) | |
| | |
| | |
| | |
| | | | |
| Less than or equal to 90 percent | $ | 100,255 |
| | $ | 18,499 |
| | $ | 9,972 |
| | $ | 45,414 |
| | $ | 17,453 |
| | $ | 2,046 |
|
| Greater than 90 percent but less than or equal to 100 percent | 4,958 |
| | 3,081 |
| | 2,005 |
| | 2,442 |
| | 3,272 |
| | 1,048 |
|
| Greater than 100 percent | 4,017 |
| | 5,265 |
| | 3,175 |
| | 4,031 |
| | 7,496 |
| | 2,523 |
|
Fully-insured loans (6) | 52,990 |
| | 11,980 |
| | — |
| | — |
| | — |
| | — |
|
| Total home loans | $ | 162,220 |
| | $ | 38,825 |
| | $ | 15,152 |
| | $ | 51,887 |
| | $ | 28,221 |
| | $ | 5,617 |
|
| Refreshed FICO score | | | | | | | | | | | |
| Less than 620 | $ | 4,184 |
| | $ | 6,313 |
| | $ | 6,109 |
| �� | $ | 2,169 |
| | $ | 3,470 |
| | $ | 864 |
|
| Greater than or equal to 620 and less than 680 | 6,272 |
| | 4,032 |
| | 3,014 |
| | 3,683 |
| | 4,529 |
| | 995 |
|
| Greater than or equal to 680 and less than 740 | 21,946 |
| | 6,463 |
| | 3,310 |
| | 10,231 |
| | 7,905 |
| | 1,651 |
|
| Greater than or equal to 740 | 76,828 |
| | 10,037 |
| | 2,719 |
| | 35,804 |
| | 12,317 |
| | 2,107 |
|
Fully-insured loans (6) | 52,990 |
| | 11,980 |
| | — |
| | — |
| | — |
| | — |
|
| Total home loans | $ | 162,220 |
| | $ | 38,825 |
| | $ | 15,152 |
| | $ | 51,887 |
| | $ | 28,221 |
| | $ | 5,617 |
|
| |
(1) | Excludes $2.1 billion of loans accounted for under the fair value option. |
| |
(3) | Includes $2.8 billion of pay option loans. The Corporation no longer originates this product. |
| |
(4) | Refreshed LTV percentages for PCI loans are calculated using the carrying value net of the related valuation allowance. |
| |
(5) | Effective December 31, 2014, with the exception of high-value properties, underlying values for LTV ratios are primarily determined using automated valuation models. For high-value properties, generally with an original value of $1 million or more, estimated property values are determined using the CoreLogic Case-Shiller Index. Prior-period values have been updated to reflect this change. Previously reported values were primarily determined through an index-based approach. |
| |
(6) | Credit quality indicators are not reported for fully-insured loans as principal repayment is insured. |
|
| | | | | | | | | | | | | | | |
| | | | | | | | |
| Credit Card and Other Consumer – Credit Quality Indicators |
| | |
| | December 31, 2014 |
| (Dollars in millions) | U.S. Credit Card | | Non-U.S. Credit Card | | Direct/Indirect Consumer | | Other Consumer (1) |
| Refreshed FICO score | |
| | |
| | |
| | |
|
| Less than 620 | $ | 4,467 |
| | $ | — |
| | $ | 1,296 |
| | $ | 266 |
|
| Greater than or equal to 620 and less than 680 | 12,177 |
| | — |
| | 1,892 |
| | 227 |
|
| Greater than or equal to 680 and less than 740 | 34,986 |
| | — |
| | 10,749 |
| | 307 |
|
| Greater than or equal to 740 | 40,249 |
| | — |
| | 25,279 |
| | 881 |
|
Other internal credit metrics (2, 3, 4) | — |
| | 10,465 |
| | 41,165 |
| | 165 |
|
| Total credit card and other consumer | $ | 91,879 |
| | $ | 10,465 |
| | $ | 80,381 |
| | $ | 1,846 |
|
| |
(1) | Thirty-seven percent of the other consumer portfolio is associated with portfolios from certain consumer finance businesses that the Corporation previously exited. |
| |
(2) | Other internal credit metrics may include delinquency status, geography or other factors. |
| |
(3) | Direct/indirect consumer includes $39.7 billion of securities-based lending which is overcollateralized and therefore has minimal credit risk and $632 million of loans the Corporation no longer originates. |
| |
(4) | Non-U.S. credit card represents the U.K. credit card portfolio which is evaluated using internal credit metrics, including delinquency status. At December 31, 2014, 98 percent of this portfolio was current or less than 30 days past due, one percent was 30-89 days past due and one percent was 90 days or more past due. |
|
| | | | | | | | | | | | | | | | | | | |
| | | | | | | | | | |
Commercial – Credit Quality Indicators (1) |
| | |
| | December 31, 2014 |
| (Dollars in millions) | U.S. Commercial | | Commercial Real Estate | | Commercial
Lease Financing | | Non-U.S. Commercial | | U.S. Small
Business Commercial (2) |
| Risk ratings | |
| | |
| | |
| | |
| | |
|
| Pass rated | $ | 213,839 |
| | $ | 46,632 |
| | $ | 23,832 |
| | $ | 79,367 |
| | $ | 751 |
|
| Reservable criticized | 6,454 |
| | 1,050 |
| | 1,034 |
| | 716 |
| | 182 |
|
Refreshed FICO score (3) | | | | | | | | | |
|
| Less than 620 | |
| | |
| | |
| | |
| | 184 |
|
| Greater than or equal to 620 and less than 680 | | | | | | | | | 529 |
|
| Greater than or equal to 680 and less than 740 | | | | | | | | | 1,591 |
|
| Greater than or equal to 740 | | | | | | | | | 2,910 |
|
Other internal credit metrics (3, 4) | | | | | | | | | 7,146 |
|
| Total commercial | $ | 220,293 |
| | $ | 47,682 |
| | $ | 24,866 |
| | $ | 80,083 |
| | $ | 13,293 |
|
| |
(1) | Excludes $6.6 billion of loans accounted for under the fair value option. |
| |
(2) | U.S. small business commercial includes $762 million of criticized business card and small business loans which are evaluated using refreshed FICO scores or internal credit metrics, including delinquency status, rather than risk ratings. At December 31, 2014, 98 percent of the balances where internal credit metrics are used was current or less than 30 days past due. |
| |
(3) | Refreshed FICO score and other internal credit metrics are applicable only to the U.S. small business commercial portfolio. |
| |
(4) | Other internal credit metrics may include delinquency status, application scores, geography or other factors. |
|
| | | | | | | | | | | | | | | | | | | | | | | |
| | | | | | | | | | | | |
Home Loans – Credit Quality Indicators (1) |
| | |
| | December 31, 2013 |
| (Dollars in millions) | Core Portfolio Residential Mortgage (2) | | Legacy Assets & Servicing Residential
Mortgage (2) | | Residential Mortgage PCI (3) | | Core Portfolio Home Equity (2) | | Legacy Assets & Servicing Home Equity (2) | | Home Equity PCI |
Refreshed LTV (4, 5) | |
| | |
| | |
| | |
| | | | |
| Less than or equal to 90 percent | $ | 94,255 |
| | $ | 21,587 |
| | $ | 10,605 |
| | $ | 44,892 |
| | $ | 17,006 |
| | $ | 1,598 |
|
| Greater than 90 percent but less than or equal to 100 percent | 7,013 |
| | 4,216 |
| | 2,638 |
| | 3,178 |
| | 3,948 |
| | 1,121 |
|
| Greater than 100 percent | 6,356 |
| | 8,720 |
| | 5,429 |
| | 6,429 |
| | 11,626 |
| | 3,874 |
|
Fully-insured loans (6) | 69,712 |
| | 17,535 |
| | — |
| | — |
| | — |
| | — |
|
| Total home loans | $ | 177,336 |
| | $ | 52,058 |
| | $ | 18,672 |
| | $ | 54,499 |
| | $ | 32,580 |
| | $ | 6,593 |
|
| Refreshed FICO score | |
| | |
| | |
| | |
| | |
| | |
|
| Less than 620 | $ | 5,334 |
| | $ | 9,955 |
| | $ | 9,129 |
| | $ | 2,415 |
| | $ | 4,259 |
| | $ | 1,045 |
|
| Greater than or equal to 620 and less than 680 | 7,164 |
| | 5,276 |
| | 3,349 |
| | 4,211 |
| | 5,133 |
| | 1,172 |
|
| Greater than or equal to 680 and less than 740 | 22,617 |
| | 7,639 |
| | 3,211 |
| | 11,726 |
| | 9,143 |
| | 1,936 |
|
| Greater than or equal to 740 | 72,509 |
| | 11,653 |
| | 2,983 |
| | 36,147 |
| | 14,045 |
| | 2,440 |
|
Fully-insured loans (6) | 69,712 |
| | 17,535 |
| | — |
| | — |
| | — |
| | — |
|
| Total home loans | $ | 177,336 |
| | $ | 52,058 |
| | $ | 18,672 |
| | $ | 54,499 |
| | $ | 32,580 |
| | $ | 6,593 |
|
| |
(1) | Excludes $2.2 billion of loans accounted for under the fair value option. |
| |
(3) | Includes $4.0 billion of pay option loans. The Corporation no longer originates this product. |
| |
(4) | Refreshed LTV percentages for PCI loans are calculated using the carrying value net of the related valuation allowance. |
| |
(5) | Effective December 31, 2014, with the exception of high-value properties, underlying values for LTV ratios are primarily determined using automated valuation models. For high-value properties, generally with an original value of $1 million or more, estimated property values are determined using the CoreLogic Case-Shiller Index. Prior-period values have been updated to reflect this change. Previously reported values were primarily determined through an index-based approach. |
| |
(6) | Credit quality indicators are not reported for fully-insured loans as principal repayment is insured. |
|
| | | | | | | | | | | | | | | |
| | | | | | | | |
| Credit Card and Other Consumer – Credit Quality Indicators |
| | |
| | December 31, 2013 |
| (Dollars in millions) | U.S. Credit Card | | Non-U.S. Credit Card | | Direct/Indirect Consumer | | Other Consumer (1) |
| Refreshed FICO score | |
| | |
| | |
| | |
|
| Less than 620 | $ | 4,989 |
| | $ | — |
| | $ | 1,220 |
| | $ | 539 |
|
| Greater than or equal to 620 and less than 680 | 12,753 |
| | — |
| | 3,345 |
| | 264 |
|
| Greater than or equal to 680 and less than 740 | 35,413 |
| | — |
| | 9,887 |
| | 199 |
|
| Greater than or equal to 740 | 39,183 |
| | — |
| | 26,220 |
| | 188 |
|
Other internal credit metrics (2, 3, 4) | — |
| | 11,541 |
| | 41,520 |
| | 787 |
|
| Total credit card and other consumer | $ | 92,338 |
| | $ | 11,541 |
| | $ | 82,192 |
| | $ | 1,977 |
|
| |
(1) | Sixty percent of the other consumer portfolio is associated with portfolios from certain consumer finance businesses that the Corporation previously exited. |
| |
(2) | Other internal credit metrics may include delinquency status, geography or other factors. |
| |
(3) | Direct/indirect consumer includes $35.8 billion of securities-based lending which is overcollateralized and therefore has minimal credit risk and $4.1 billion of loans the Corporation no longer originates. |
| |
(4) | Non-U.S. credit card represents the U.K. credit card portfolio which is evaluated using internal credit metrics, including delinquency status. At December 31, 2013, 98 percent of this portfolio was current or less than 30 days past due, one percent was 30-89 days past due and one percent was 90 days or more past due. |
|
| | | | | | | | | | | | | | | | | | | |
| | | | | | | | | | |
Commercial – Credit Quality Indicators (1) |
| | |
| | December 31, 2013 |
| (Dollars in millions) | U.S. Commercial | | Commercial Real Estate | | Commercial
Lease Financing | | Non-U.S. Commercial | | U.S. Small
Business Commercial (2) |
| Risk ratings | |
| | |
| | |
| | |
| | |
|
| Pass rated | $ | 205,416 |
| | $ | 46,507 |
| | $ | 24,211 |
| | $ | 88,138 |
| | $ | 1,191 |
|
| Reservable criticized | 7,141 |
| | 1,386 |
| | 988 |
| | 1,324 |
| | 346 |
|
Refreshed FICO score (3) | | | | | | | | | |
| Less than 620 | | | | | | | | | 224 |
|
| Greater than or equal to 620 and less than 680 | | | | | | | | | 534 |
|
| Greater than or equal to 680 and less than 740 | | | | | | | | | 1,567 |
|
| Greater than or equal to 740 | | | | | | | | | 2,779 |
|
Other internal credit metrics (3, 4) | | | | | | | | | 6,653 |
|
| Total commercial | $ | 212,557 |
| | $ | 47,893 |
| | $ | 25,199 |
| | $ | 89,462 |
| | $ | 13,294 |
|
| |
(1) | Excludes $7.9 billion of loans accounted for under the fair value option. |
| |
(2) | U.S. small business commercial includes $289 million of criticized business card and small business loans which are evaluated using refreshed FICO scores or internal credit metrics, including delinquency status, rather than risk ratings. At December 31, 2013, 99 percent of the balances where internal credit metrics are used was current or less than 30 days past due. |
| |
(3) | Refreshed FICO score and other internal credit metrics are applicable only to the U.S. small business commercial portfolio. |
| |
(4) | Other internal credit metrics may include delinquency status, application scores, geography or other factors. |
Impaired Loans and Troubled Debt Restructurings
A loan is considered impaired when, based on current information, it is probable that the Corporation will be unable to collect all amounts due from the borrower in accordance with the contractual terms of the loan. Impaired loans include nonperforming commercial loans and all consumer and commercial TDRs. Impaired loans exclude nonperforming consumer loans and nonperforming commercial leases unless they are classified as TDRs. Loans accounted for under the fair value option are also excluded. PCI loans are excluded and reported separately on page 189. For additional information, see Note 1 – Summary of Significant Accounting Principles.
Home Loans
Impaired home loans within the Home Loans portfolio segment consist entirely of TDRs. Excluding PCI loans, most modifications of home loans meet the definition of TDRs when a binding offer is extended to a borrower. Modifications of home loans are done in accordance with the government’s Making Home Affordable Program (modifications under government programs) or the Corporation’s proprietary programs (modifications under proprietary programs). These modifications are considered to be TDRs if concessions have been granted to borrowers experiencing financial difficulties. Concessions may include reductions in interest rates, capitalization of past due amounts, principal and/or interest forbearance, payment extensions, principal and/or interest forgiveness, or combinations thereof. During 2013 and 2012, the Corporation provided interest rate modifications to qualified borrowers pursuant to the 2012 National Mortgage Settlement and these interest rate modifications are not considered to be TDRs.
Prior to permanently modifying a loan, the Corporation may enter into trial modifications with certain borrowers under both government and proprietary programs. Trial modifications generally represent a three- to four-month period during which the borrower makes monthly payments under the anticipated modified payment terms. Upon successful completion of the trial period, the Corporation and the borrower enter into a permanent modification. Binding trial modifications are classified as TDRs when the trial offer is made and continue to be classified as TDRs regardless of whether the borrower enters into a permanent modification.
Home loans that have been discharged in Chapter 7 bankruptcy with no change in repayment terms of $2.4 billion were included in TDRs at December 31, 2014, of which $1.4 billion were classified as nonperforming and $1.0 billion were loans fully-insured by the Federal Housing Administration (FHA). For more information on loans discharged in Chapter 7 bankruptcy, see Nonperforming Loans and Leases in this Note.
A home loan, excluding PCI loans which are reported separately, is not classified as impaired unless it is a TDR. Once such a loan has been designated as a TDR, it is then individually assessed for
impairment. Home loan TDRs are measured primarily based on the net present value of the estimated cash flows discounted at the loan’s original effective interest rate, as discussed in the following paragraph. If the carrying value of a TDR exceeds this amount, a specific allowance is recorded as a component of the allowance for loan and lease losses. Alternatively, home loan TDRs that are considered to be dependent solely on the collateral for repayment (e.g., due to the lack of income verification or as a result of being discharged in Chapter 7 bankruptcy) are measured based on the estimated fair value of the collateral and a charge-off is recorded if the carrying value exceeds the fair value of the collateral. Home loans that reached 180 days past due prior to modification had been charged off to their net realizable value, less costs to sell, before they were modified as TDRs in accordance with established policy. Therefore, modifications of home loans that are 180 or more days past due as TDRs do not have an impact on the allowance for loan and lease losses nor are additional charge-offs required at the time of modification. Subsequent declines in the fair value of the collateral after a loan has reached 180 days past due are recorded as charge-offs. Fully-insured loans are protected against principal loss, and therefore, the Corporation does not record an allowance for loan and lease losses on the outstanding principal balance, even after they have been modified in a TDR.
The net present value of the estimated cash flows used to measure impairment is based on model-driven estimates of projected payments, prepayments, defaults and loss-given-default (LGD). Using statistical modeling methodologies, the Corporation estimates the probability that a loan will default prior to maturity based on the attributes of each loan. The factors that are most relevant to the probability of default are the refreshed LTV, or in the case of a subordinated lien, refreshed CLTV, borrower credit score, months since origination (i.e., vintage) and geography. Each of these factors is further broken down by present collection status (whether the loan is current, delinquent, in default or in bankruptcy). Severity (or LGD) is estimated based on the refreshed LTV for first mortgages or CLTV for subordinated liens. The estimates are based on the Corporation’s historical experience as adjusted to reflect an assessment of environmental factors that may not be reflected in the historical data, such as changes in real estate values, local and national economies, underwriting standards and the regulatory environment. The probability of default models also incorporate recent experience with modification programs including redefaults subsequent to modification, a loan’s default history prior to modification and the change in borrower payments post-modification.
At December 31, 2014 and 2013, remaining commitments to lend additional funds to debtors whose terms have been modified in a home loan TDR were immaterial. Home loan foreclosed properties totaled $630 million and $533 million at December 31, 2014 and 2013.
The table below provides the unpaid principal balance, carrying value and related allowance at December 31, 2014 and 2013, and the average carrying value and interest income recognized for 2014, 2013 and 2012 for impaired loans in the Corporation’s Home Loans portfolio segment and includes primarily loans
managed by Legacy Assets & Servicing. Certain impaired home loans do not have a related allowance as the current valuation of these impaired loans exceeded the carrying value, which is net of previously recorded charge-offs.
|
| | | | | | | | | | | | | | | | | | | | | | | |
| | | | | | | | | | | | |
| Impaired Loans – Home Loans | | |
| | | | | | |
| | December 31, 2014 | | December 31, 2013 |
| (Dollars in millions) | Unpaid
Principal Balance | | Carrying Value | | Related Allowance | | Unpaid
Principal Balance | | Carrying Value | | Related Allowance |
| With no recorded allowance | |
| | |
| | |
| | |
| | |
| | |
| Residential mortgage | $ | 19,710 |
| | $ | 15,605 |
| | $ | — |
| | $ | 21,567 |
| | $ | 16,450 |
| | $ | — |
|
| Home equity | 3,540 |
| | 1,630 |
| | — |
| | 3,249 |
| | 1,385 |
| | — |
|
| With an allowance recorded | | | | | |
| | | | | | |
| Residential mortgage | $ | 7,861 |
| | $ | 7,665 |
| | $ | 531 |
| | $ | 13,341 |
| | $ | 12,862 |
| | $ | 991 |
|
| Home equity | 852 |
| | 728 |
| | 196 |
| | 893 |
| | 761 |
| | 240 |
|
| Total | |
| | |
| | |
| | | | | | |
| Residential mortgage | $ | 27,571 |
| | $ | 23,270 |
| | $ | 531 |
| | $ | 34,908 |
| | $ | 29,312 |
| | $ | 991 |
|
| Home equity | 4,392 |
| | 2,358 |
| | 196 |
| | 4,142 |
| | 2,146 |
| | 240 |
|
| | | | | | | | | | | | |
| | 2014 | | 2013 | | 2012 |
| | Average
Carrying
Value | | Interest
Income
Recognized (1) | | Average
Carrying
Value | | Interest
Income
Recognized (1) | | Average
Carrying
Value | | Interest
Income
Recognized (1) |
| With no recorded allowance | |
| | |
| | | | | | | | |
| Residential mortgage | $ | 15,065 |
| | $ | 490 |
| | $ | 16,625 |
| | $ | 621 |
| | $ | 10,937 |
| | $ | 366 |
|
| Home equity | 1,486 |
| | 87 |
| | 1,245 |
| | 76 |
| | 734 |
| | 49 |
|
| With an allowance recorded | | | | | | | | | | | |
| Residential mortgage | $ | 10,826 |
| | $ | 411 |
| | $ | 13,926 |
| | $ | 616 |
| | $ | 11,575 |
| | $ | 423 |
|
| Home equity | 743 |
| | 25 |
| | 912 |
| | 41 |
| | 1,145 |
| | 44 |
|
| Total | |
| | |
| | | | | | | | |
| Residential mortgage | $ | 25,891 |
| | $ | 901 |
| | $ | 30,551 |
| | $ | 1,237 |
| | $ | 22,512 |
| | $ | 789 |
|
| Home equity | 2,229 |
| | 112 |
| | 2,157 |
| | 117 |
| | 1,879 |
| | 93 |
|
| |
(1) | Interest income recognized includes interest accrued and collected on the outstanding balances of accruing impaired loans as well as interest cash collections on nonaccruing impaired loans for which the principal is considered collectible. |
The following table presents the December 31, 2014, 2013 and 2012 unpaid principal balance, carrying value, and average pre- and post-modification interest rates on home loans that were modified in TDRs during 2014, 2013 and 2012, and net charge-offs recorded during the period in which the modification occurred.
The following Home Loans portfolio segment tables include loans that were initially classified as TDRs during the period and also loans that had previously been classified as TDRs and were modified again during the period. These TDRs are primarily managed by Legacy Assets & Servicing.
|
| | | | | | | | | | | | | | | | | |
| | | | | | | | | | |
Home Loans – TDRs Entered into During 2014, 2013 and 2012 (1) |
| | |
| | December 31, 2014 | | 2014 |
| (Dollars in millions) | Unpaid Principal Balance | | Carrying Value | | Pre-Modification Interest Rate | | Post-Modification Interest Rate (2) | | Net Charge-offs (3) |
| Residential mortgage | $ | 5,940 |
| | $ | 5,120 |
| | 5.28 | % | | 4.93 | % | | $ | 72 |
|
| Home equity | 863 |
| | 592 |
| | 4.00 |
| | 3.33 |
| | 99 |
|
| Total | $ | 6,803 |
| | $ | 5,712 |
| | 5.12 |
| | 4.73 |
| | $ | 171 |
|
| | | | | | | | | | |
| | December 31, 2013 | | 2013 |
| Residential mortgage | $ | 11,233 |
| | $ | 10,016 |
| | 5.30 | % | | 4.27 | % | | $ | 235 |
|
| Home equity | 878 |
| | 521 |
| | 5.29 |
| | 3.92 |
| | 192 |
|
| Total | $ | 12,111 |
| | $ | 10,537 |
| | 5.30 |
| | 4.24 |
| | $ | 427 |
|
| | | | | | | | | | |
| | December 31, 2012 | | 2012 |
| Residential mortgage | $ | 15,088 |
| | $ | 12,228 |
| | 5.52 | % | | 4.70 | % | | $ | 523 |
|
| Home equity | 1,721 |
| | 858 |
| | 5.22 |
| | 4.39 |
| | 716 |
|
| Total | $ | 16,809 |
| | $ | 13,086 |
| | 5.49 |
| | 4.66 |
| | $ | 1,239 |
|
| |
(1) | TDRs entered into during 2014 include modifications with principal forgiveness of $53 million related to residential mortgage and $1 million related to home equity. TDRs entered into during 2013 include residential mortgage modifications with principal forgiveness of $467 million. TDRs entered into during 2012 include modifications with principal forgiveness of $778 million related to residential mortgage and $9 million related to home equity. |
| |
(2) | The post-modification interest rate reflects the interest rate applicable only to permanently completed modifications, which exclude loans that are in a trial modification period. |
| |
(3) | Net charge-offs include amounts recorded on loans modified during the period that are no longer held by the Corporation at December 31, 2014, 2013 and 2012 due to sales and other dispositions. |
The table below presents the December 31, 2014, 2013 and 2012 carrying value for home loans that were modified in a TDR during 2014, 2013 and 2012, by type of modification.
|
| | | | | | | | | | | |
| | | | | | |
| Home Loans – Modification Programs |
| | |
| | TDRs Entered into During 2014 |
| (Dollars in millions) | Residential Mortgage | | Home Equity | | Total Carrying Value |
| Modifications under government programs | | | | | |
| Contractual interest rate reduction | $ | 643 |
| | $ | 56 |
| | $ | 699 |
|
| Principal and/or interest forbearance | 16 |
| | 18 |
| | 34 |
|
Other modifications (1) | 98 |
| | 1 |
| | 99 |
|
| Total modifications under government programs | 757 |
| | 75 |
| | 832 |
|
| Modifications under proprietary programs | | | | | |
| Contractual interest rate reduction | 244 |
| | 22 |
| | 266 |
|
| Capitalization of past due amounts | 71 |
| | 2 |
| | 73 |
|
| Principal and/or interest forbearance | 66 |
| | 75 |
| | 141 |
|
Other modifications (1) | 40 |
| | 47 |
| | 87 |
|
| Total modifications under proprietary programs | 421 |
| | 146 |
| | 567 |
|
| Trial modifications | 3,421 |
| | 182 |
| | 3,603 |
|
Loans discharged in Chapter 7 bankruptcy (2) | 521 |
| | 189 |
| | 710 |
|
| Total modifications | $ | 5,120 |
| | $ | 592 |
| | $ | 5,712 |
|
| | | | | | |
| | TDRs Entered into During 2013 |
| Modifications under government programs | | | | | |
| Contractual interest rate reduction | $ | 1,815 |
| | $ | 48 |
| | $ | 1,863 |
|
| Principal and/or interest forbearance | 35 |
| | 24 |
| | 59 |
|
Other modifications (1) | 100 |
| | — |
| | 100 |
|
| Total modifications under government programs | 1,950 |
| | 72 |
| | 2,022 |
|
| Modifications under proprietary programs | | | | | |
| Contractual interest rate reduction | 2,799 |
| | 40 |
| | 2,839 |
|
| Capitalization of past due amounts | 132 |
| | 2 |
| | 134 |
|
| Principal and/or interest forbearance | 469 |
| | 17 |
| | 486 |
|
Other modifications (1) | 105 |
| | 25 |
| | 130 |
|
| Total modifications under proprietary programs | 3,505 |
| | 84 |
| | 3,589 |
|
| Trial modifications | 3,410 |
| | 87 |
| | 3,497 |
|
Loans discharged in Chapter 7 bankruptcy (2) | 1,151 |
| | 278 |
| | 1,429 |
|
| Total modifications | $ | 10,016 |
| | $ | 521 |
| | $ | 10,537 |
|
| | | | | | |
| | TDRs Entered into During 2012 |
| Modifications under government programs | | | | | |
| Contractual interest rate reduction | $ | 642 |
| | $ | 78 |
| | $ | 720 |
|
| Principal and/or interest forbearance | 51 |
| | 31 |
| | 82 |
|
Other modifications (1) | 37 |
| | 1 |
| | 38 |
|
| Total modifications under government programs | 730 |
| | 110 |
| | 840 |
|
| Modifications under proprietary programs | | | | | |
| Contractual interest rate reduction | 3,350 |
| | 44 |
| | 3,394 |
|
| Capitalization of past due amounts | 144 |
| | — |
| | 144 |
|
| Principal and/or interest forbearance | 424 |
| | 16 |
| | 440 |
|
Other modifications (1) | 97 |
| | 21 |
| | 118 |
|
| Total modifications under proprietary programs | 4,015 |
| | 81 |
| | 4,096 |
|
| Trial modifications | 4,547 |
| | 69 |
| | 4,616 |
|
Loans discharged in Chapter 7 bankruptcy (2) | 2,936 |
| | 598 |
| | 3,534 |
|
| Total modifications | $ | 12,228 |
| | $ | 858 |
| | $ | 13,086 |
|
| |
(1) | Includes other modifications such as term or payment extensions and repayment plans. |
| |
(2) | Includes loans discharged in Chapter 7 bankruptcy with no change in repayment terms that are classified as TDRs. |
The table below presents the carrying value of loans that entered into payment default during 2014, 2013 and 2012 that were modified in a TDR during the 12 months preceding payment default. Total carrying value includes loans with a carrying value of $2.0 billion, $2.4 billion and $667 million that entered into payment default during 2014, 2013 and 2012 but were no longer held by the Corporation as of December 31, 2014, 2013 and 2012
due to sales and other dispositions. A payment default for home loan TDRs is recognized when a borrower has missed three monthly payments (not necessarily consecutively) since modification. Payment defaults on a trial modification where the borrower has not yet met the terms of the agreement are included in the table below if the borrower is 90 days or more past due three months after the offer to modify is made.
|
| | | | | | | | | | | |
| | | | | | |
| Home Loans – TDRs Entering Payment Default That Were Modified During the Preceding 12 Months |
| | |
| | 2014 |
| (Dollars in millions) | Residential Mortgage | | Home Equity | | Total Carrying Value (1) |
| Modifications under government programs | $ | 696 |
| | $ | 4 |
| | $ | 700 |
|
| Modifications under proprietary programs | 714 |
| | 12 |
| | 726 |
|
Loans discharged in Chapter 7 bankruptcy (2) | 481 |
| | 70 |
| | 551 |
|
| Trial modifications | 2,231 |
| | 56 |
| | 2,287 |
|
| Total modifications | $ | 4,122 |
| | $ | 142 |
| | $ | 4,264 |
|
| | | | | | |
| | 2013 |
| Modifications under government programs | $ | 454 |
| | $ | 2 |
| | $ | 456 |
|
| Modifications under proprietary programs | 1,117 |
| | 4 |
| | 1,121 |
|
Loans discharged in Chapter 7 bankruptcy (2) | 964 |
| | 30 |
| | 994 |
|
| Trial modifications | 4,376 |
| | 14 |
| | 4,390 |
|
| Total modifications | $ | 6,911 |
| | $ | 50 |
| | $ | 6,961 |
|
| | | | | | |
| | 2012 |
| Modifications under government programs | $ | 202 |
| | $ | 8 |
| | $ | 210 |
|
| Modifications under proprietary programs | 942 |
| | 14 |
| | 956 |
|
Loans discharged in Chapter 7 bankruptcy (2) | 1,228 |
| | 53 |
| | 1,281 |
|
| Trial modifications | 2,351 |
| | 20 |
| | 2,371 |
|
| Total modifications | $ | 4,723 |
| | $ | 95 |
| | $ | 4,818 |
|
| |
(1) | Total carrying value includes loans with a carrying value of $2.0 billion, $2.4 billion and $667 million that entered into payment default during 2014, 2013 and 2012 but were no longer held by the Corporation as of December 31, 2014, 2013 and 2012 due to sales and other dispositions. |
| |
(2) | Includes loans discharged in Chapter 7 bankruptcy with no change in repayment terms that are classified as TDRs. |
Credit Card and Other Consumer
Impaired loans within the Credit Card and Other Consumer portfolio segment consist entirely of loans that have been modified in TDRs (the renegotiated credit card and other consumer TDR portfolio, collectively referred to as the renegotiated TDR portfolio). The Corporation seeks to assist customers that are experiencing financial difficulty by modifying loans while ensuring compliance with federal, local and international laws and guidelines. Credit card and other consumer loan modifications generally involve reducing the interest rate on the account and placing the customer on a fixed payment plan not exceeding 60 months, all of which are considered TDRs. In addition, the accounts of non-U.S. credit card customers who do not qualify for a fixed payment plan may have their interest rates reduced, as required by certain local jurisdictions. These modifications, which are also TDRs, tend to experience higher payment default rates given that the borrowers may lack the ability to repay even with the interest rate reduction. In all cases, the customer’s available line of credit is canceled. The Corporation makes loan modifications directly with borrowers for debt held only by the Corporation (internal programs). Additionally, the Corporation makes loan modifications for borrowers working with third-party renegotiation agencies that provide solutions to customers’ entire unsecured debt structures (external programs). The Corporation classifies other secured
consumer loans that have been discharged in Chapter 7 bankruptcy as TDRs which are written down to collateral value and placed on nonaccrual status no later than the time of discharge. For more information on the regulatory guidance on loans discharged in Chapter 7 bankruptcy, see Nonperforming Loans and Leases in this Note.
All credit card and substantially all other consumer loans that have been modified in TDRs remain on accrual status until the loan is either paid in full or charged off, which occurs no later than the end of the month in which the loan becomes 180 days past due or generally at 120 days past due for a loan that was placed on a fixed payment plan after July 1, 2012.
The allowance for impaired credit card and substantially all other consumer loans is based on the present value of projected cash flows, which incorporates the Corporation’s historical payment default and loss experience on modified loans, discounted using the portfolio’s average contractual interest rate, excluding promotionally priced loans, in effect prior to restructuring. Credit card and other consumer loans are included in homogeneous pools which are collectively evaluated for impairment. For these portfolios, loss forecast models are utilized that consider a variety of factors including, but not limited to, historical loss experience, delinquency status, economic trends and credit scores.
The table below provides the unpaid principal balance, carrying value and related allowance at December 31, 2014 and 2013, and the average carrying value and interest income recognized for 2014, 2013 and 2012 on the Corporation’s renegotiated TDR portfolio in the Credit Card and Other Consumer portfolio segment.
|
| | | | | | | | | | | | | | | | | | | | | | | |
| | | | | | | | | | | | |
| Impaired Loans – Credit Card and Other Consumer – Renegotiated TDRs | | |
| | | | | | |
| | December 31, 2014 | | December 31, 2013 |
| (Dollars in millions) | Unpaid
Principal Balance | | Carrying Value (1) | | Related Allowance | | Unpaid
Principal Balance | | Carrying Value (1) | | Related Allowance |
| With no recorded allowance | |
| | |
| | |
| | | | | | |
| Direct/Indirect consumer | $ | 59 |
| | $ | 25 |
| | $ | — |
| | $ | 75 |
| | $ | 32 |
| | $ | — |
|
| Other consumer | — |
| | — |
| | — |
| | 34 |
| | 34 |
| | — |
|
| With an allowance recorded | |
| | |
| | |
| | |
| | |
| | |
| U.S. credit card | $ | 804 |
| | $ | 856 |
| | $ | 207 |
| | $ | 1,384 |
| | $ | 1,465 |
| | $ | 337 |
|
| Non-U.S. credit card | 132 |
| | 168 |
| | 108 |
| | 200 |
| | 240 |
| | 149 |
|
| Direct/Indirect consumer | 76 |
| | 92 |
| | 24 |
| | 242 |
| | 282 |
| | 84 |
|
| Other consumer | — |
| | — |
| | — |
| | 27 |
| | 26 |
| | 9 |
|
| Total | |
| | |
| | |
| | | | | | |
| U.S. credit card | $ | 804 |
| | $ | 856 |
| | $ | 207 |
| | $ | 1,384 |
| | $ | 1,465 |
| | $ | 337 |
|
| Non-U.S. credit card | 132 |
| | 168 |
| | 108 |
| | 200 |
| | 240 |
| | 149 |
|
| Direct/Indirect consumer | 135 |
| | 117 |
| | 24 |
| | 317 |
| | 314 |
| | 84 |
|
| Other consumer | — |
| | — |
| | — |
| | 61 |
| | 60 |
| | 9 |
|
| | | | | | | | | | | | |
| | 2014 | | 2013 | | 2012 |
| | Average
Carrying
Value | | Interest
Income
Recognized (2) | | Average
Carrying
Value | | Interest
Income
Recognized (2) | | Average
Carrying
Value | | Interest
Income
Recognized (2) |
| With no recorded allowance | | | | | | | | | | | |
| Direct/Indirect consumer | $ | 27 |
| | $ | — |
| | $ | 42 |
| | $ | — |
| | $ | 58 |
| | $ | — |
|
| Other consumer | 33 |
| | 2 |
| | 34 |
| | 2 |
| | 35 |
| | 2 |
|
| With an allowance recorded | |
| | |
| | | | | | | | |
| U.S. credit card | $ | 1,148 |
| | $ | 71 |
| | $ | 2,144 |
| | $ | 134 |
| | $ | 4,085 |
| | $ | 253 |
|
| Non-U.S. credit card | 210 |
| | 6 |
| | 266 |
| | 7 |
| | 464 |
| | 10 |
|
| Direct/Indirect consumer | 180 |
| | 9 |
| | 456 |
| | 24 |
| | 929 |
| | 50 |
|
| Other consumer | 23 |
| | 1 |
| | 28 |
| | 2 |
| | 29 |
| | 2 |
|
| Total | |
| | |
| | | | | | | | |
| U.S. credit card | $ | 1,148 |
| | $ | 71 |
| | $ | 2,144 |
| | $ | 134 |
| | $ | 4,085 |
| | $ | 253 |
|
| Non-U.S. credit card | 210 |
| | 6 |
| | 266 |
| | 7 |
| | 464 |
| | 10 |
|
| Direct/Indirect consumer | 207 |
| | 9 |
| | 498 |
| | 24 |
| | 987 |
| | 50 |
|
| Other consumer | 56 |
| | 3 |
| | 62 |
| | 4 |
| | 64 |
| | 4 |
|
| |
(1) | Includes accrued interest and fees. |
| |
(2) | Interest income recognized includes interest accrued and collected on the outstanding balances of accruing impaired loans as well as interest cash collections on nonaccruing impaired loans for which the principal is considered collectible. |
The table below provides information on the Corporation’s primary modification programs for the renegotiated TDR portfolio at December 31, 2014 and 2013.
|
| | | | | | | | | | | | | | | | | | | | | | | | | | | | | | | | | | | | | |
| | | | | | | | | | | | | | | | | | | | |
| Credit Card and Other Consumer – Renegotiated TDRs by Program Type |
| | | | | | | | | | |
| | December 31 |
| | Internal Programs | | External Programs | | Other (1) | | Total | | Percent of Balances Current or Less Than 30 Days Past Due |
| (Dollars in millions) | 2014 | | 2013 | | 2014 | | 2013 | | 2014 | | 2013 | | 2014 | | 2013 | | 2014 | | 2013 |
| U.S. credit card | $ | 450 |
| | $ | 842 |
| | $ | 397 |
| | $ | 607 |
| | $ | 9 |
| | $ | 16 |
| | $ | 856 |
| | $ | 1,465 |
| | 84.99 | % | | 82.77 | % |
| Non-U.S. credit card | 41 |
| | 71 |
| | 16 |
| | 26 |
| | 111 |
| | 143 |
| | 168 |
| | 240 |
| | 47.56 |
| | 49.01 |
|
| Direct/Indirect consumer | 50 |
| | 170 |
| | 34 |
| | 106 |
| | 33 |
| | 38 |
| | 117 |
| | 314 |
| | 85.21 |
| | 84.29 |
|
| Other consumer | — |
| | 60 |
| | — |
| | — |
| | — |
| | — |
| | — |
| | 60 |
| | — |
| | 71.08 |
|
| Total renegotiated TDRs | $ | 541 |
| | $ | 1,143 |
| | $ | 447 |
| | $ | 739 |
| | $ | 153 |
| | $ | 197 |
| | $ | 1,141 |
| | $ | 2,079 |
| | 79.51 |
| | 78.77 |
|
| |
(1) | Other TDRs for non-U.S. credit card include modifications of accounts that are ineligible for a fixed payment plan. |
The table below provides information on the Corporation’s renegotiated TDR portfolio including the December 31, 2014, 2013 and 2012 unpaid principal balance, carrying value and average pre- and post-modification interest rates of loans that were modified in TDRs during 2014, 2013 and 2012, and net charge-offs recorded during the period in which the modification occurred.
|
| | | | | | | | | | | | | | | | | |
| | | | | | | | | | |
| Credit Card and Other Consumer – Renegotiated TDRs Entered into During 2014, 2013 and 2012 |
| | |
| | December 31, 2014 | | 2014 |
| (Dollars in millions) | Unpaid Principal Balance | | Carrying Value (1) | | Pre-Modification Interest Rate | | Post-Modification Interest Rate | | Net Charge-offs |
| U.S. credit card | $ | 276 |
| | $ | 301 |
| | 16.64 | % | | 5.15 | % | | $ | 37 |
|
| Non-U.S. credit card | 91 |
| | 106 |
| | 24.90 |
| | 0.68 |
| | 91 |
|
| Direct/Indirect consumer | 27 |
| | 19 |
| | 8.66 |
| | 4.90 |
| | 14 |
|
| Total | $ | 394 |
| | $ | 426 |
| | 18.32 |
| | 4.03 |
| | $ | 142 |
|
| | | | | | | | | | |
| | December 31, 2013 | | 2013 |
| U.S. credit card | $ | 299 |
| | $ | 329 |
| | 16.84 | % | | 5.84 | % | | $ | 30 |
|
| Non-U.S. credit card | 134 |
| | 147 |
| | 25.90 |
| | 0.95 |
| | 138 |
|
| Direct/Indirect consumer | 47 |
| | 38 |
| | 11.53 |
| | 4.74 |
| | 15 |
|
| Other consumer | 8 |
| | 8 |
| | 9.28 |
| | 5.25 |
| | — |
|
| Total | $ | 488 |
| | $ | 522 |
| | 18.89 |
| | 4.37 |
| | $ | 183 |
|
| | | | | | | | | | |
| | December 31, 2012 | | 2012 |
| U.S. credit card | $ | 396 |
| | $ | 400 |
| | 17.59 | % | | 6.36 | % | | $ | 45 |
|
| Non-U.S. credit card | 196 |
| | 206 |
| | 26.19 |
| | 1.15 |
| | 190 |
|
| Direct/Indirect consumer | 160 |
| | 113 |
| | 9.59 |
| | 5.72 |
| | 52 |
|
| Other consumer | 9 |
| | 9 |
| | 9.97 |
| | 6.44 |
| | — |
|
| Total | $ | 761 |
| | $ | 728 |
| | 18.68 |
| | 4.79 |
| | $ | 287 |
|
| |
(1) | Includes accrued interest and fees. |
The table below provides information on the Corporation’s primary modification programs for the renegotiated TDR portfolio for loans that were modified in TDRs during 2014, 2013 and 2012.
|
| | | | | | | | | | | | | | | |
| | | | | | | | |
| Credit Card and Other Consumer – Renegotiated TDRs Entered into During the Period by Program Type |
| | |
| | 2014 |
| (Dollars in millions) | Internal Programs | | External Programs | | Other (1) | | Total |
| U.S. credit card | $ | 196 |
| | $ | 105 |
| | $ | — |
| | $ | 301 |
|
| Non-U.S. credit card | 6 |
| | 6 |
| | 94 |
| | 106 |
|
| Direct/Indirect consumer | 4 |
| | 2 |
| | 13 |
| | 19 |
|
| Total renegotiated TDRs | $ | 206 |
| | $ | 113 |
| | $ | 107 |
| | $ | 426 |
|
| | | | | | | | |
| | 2013 |
| U.S. credit card | $ | 192 |
| | $ | 137 |
| | $ | — |
| | $ | 329 |
|
| Non-U.S. credit card | 16 |
| | 9 |
| | 122 |
| | 147 |
|
| Direct/Indirect consumer | 15 |
| | 8 |
| | 15 |
| | 38 |
|
| Other consumer | 8 |
| | — |
| | — |
| | 8 |
|
| Total renegotiated TDRs | $ | 231 |
| | $ | 154 |
| | $ | 137 |
| | $ | 522 |
|
| | | | | | | | |
| | 2012 |
| U.S. credit card | $ | 248 |
| | $ | 152 |
| | $ | — |
| | $ | 400 |
|
| Non-U.S. credit card | 38 |
| | 14 |
| | 154 |
| | 206 |
|
| Direct/Indirect consumer | 36 |
| | 19 |
| | 58 |
| | 113 |
|
| Other consumer | 9 |
| | — |
| | — |
| | 9 |
|
| Total renegotiated TDRs | $ | 331 |
| | $ | 185 |
| | $ | 212 |
| | $ | 728 |
|
| |
(1) | Other TDRs for non-U.S. credit card include modifications of accounts that are ineligible for a fixed payment plan. |
Credit card and other consumer loans are deemed to be in payment default during the quarter in which a borrower misses the second of two consecutive payments. Payment defaults are one of the factors considered when projecting future cash flows in the calculation of the allowance for loan and lease losses for impaired credit card and other consumer loans. Based on historical experience, the Corporation estimates that 14 percent of new U.S. credit card TDRs, 81 percent of new non-U.S. credit card TDRs and 12 percent of new direct/indirect consumer TDRs may be in payment default within 12 months after modification. Loans that entered into payment default during 2014, 2013 and 2012 that had been modified in a TDR during the preceding 12 months were $56 million, $61 million and $203 million for U.S. credit card, $200 million, $236 million and $298 million for non-U.S. credit card, and $5 million, $12 million and $35 million for direct/indirect consumer, respectively.
Commercial Loans
Impaired commercial loans, which include nonperforming loans and TDRs (both performing and nonperforming), are primarily measured based on the present value of payments expected to be received, discounted at the loan’s original effective interest rate. Commercial impaired loans may also be measured based on observable market prices or, for loans that are solely dependent on the collateral for repayment, the estimated fair value of collateral, less costs to sell. If the carrying value of a loan exceeds this amount, a specific allowance is recorded as a component of the allowance for loan and lease losses.
Modifications of loans to commercial borrowers that are experiencing financial difficulty are designed to reduce the Corporation’s loss exposure while providing the borrower with an
opportunity to work through financial difficulties, often to avoid foreclosure or bankruptcy. Each modification is unique and reflects the individual circumstances of the borrower. Modifications that result in a TDR may include extensions of maturity at a concessionary (below market) rate of interest, payment forbearances or other actions designed to benefit the customer while mitigating the Corporation’s risk exposure. Reductions in interest rates are rare. Instead, the interest rates are typically increased, although the increased rate may not represent a market rate of interest. Infrequently, concessions may also include principal forgiveness in connection with foreclosure, short sale or other settlement agreements leading to termination or sale of the loan.
At the time of restructuring, the loans are remeasured to reflect the impact, if any, on projected cash flows resulting from the modified terms. If there was no forgiveness of principal and the interest rate was not decreased, the modification may have little or no impact on the allowance established for the loan. If a portion of the loan is deemed to be uncollectible, a charge-off may be recorded at the time of restructuring. Alternatively, a charge-off may have already been recorded in a previous period such that no charge-off is required at the time of modification. For more information on modifications for the U.S. small business commercial portfolio, see Credit Card and Other Consumer in this Note.
At December 31, 2014 and 2013, remaining commitments to lend additional funds to debtors whose terms have been modified in a commercial loan TDR were immaterial. Commercial foreclosed properties totaled $67 million and $90 million at December 31, 2014 and 2013.
The table below provides the unpaid principal balance, carrying value and related allowance at December 31, 2014 and 2013, and the average carrying value and interest income recognized for 2014, 2013 and 2012 for impaired loans in the Corporation’s Commercial loan portfolio segment. Certain impaired commercial loans do not have a related allowance as the valuation of these impaired loans exceeded the carrying value, which is net of previously recorded charge-offs.
|
| | | | | | | | | | | | | | | | | | | | | | | |
| | | | | | | | | | | | |
| Impaired Loans – Commercial | | |
| | | | | | |
| | December 31, 2014 | | December 31, 2013 |
| (Dollars in millions) | Unpaid
Principal Balance | | Carrying Value | | Related Allowance | | Unpaid
Principal Balance | | Carrying Value | | Related Allowance |
| With no recorded allowance | |
| | |
| | |
| | |
| | |
| | |
| U.S. commercial | $ | 668 |
| | $ | 650 |
| | $ | — |
| | $ | 609 |
| | $ | 577 |
| | $ | — |
|
| Commercial real estate | 60 |
| | 48 |
| | — |
| | 254 |
| | 228 |
| | — |
|
| Non-U.S. commercial | — |
| | — |
| | — |
| | 10 |
| | 10 |
| | — |
|
| With an allowance recorded | | | | | | | | | | | |
|
| U.S. commercial | $ | 1,139 |
| | $ | 839 |
| | $ | 75 |
| | $ | 1,581 |
| | $ | 1,262 |
| | $ | 164 |
|
| Commercial real estate | 678 |
| | 495 |
| | 48 |
| | 1,066 |
| | 731 |
| | 61 |
|
| Non-U.S. commercial | 47 |
| | 44 |
| | 1 |
| | 254 |
| | 64 |
| | 16 |
|
U.S. small business commercial (1) | 133 |
| | 122 |
| | 35 |
| | 186 |
| | 176 |
| | 36 |
|
| Total | |
| | |
| | |
| | | | | | |
| U.S. commercial | $ | 1,807 |
| | $ | 1,489 |
| | $ | 75 |
| | $ | 2,190 |
| | $ | 1,839 |
| | $ | 164 |
|
| Commercial real estate | 738 |
| | 543 |
| | 48 |
| | 1,320 |
| | 959 |
| | 61 |
|
| Non-U.S. commercial | 47 |
| | 44 |
| | 1 |
| | 264 |
| | 74 |
| | 16 |
|
U.S. small business commercial (1) | 133 |
| | 122 |
| | 35 |
| | 186 |
| | 176 |
| | 36 |
|
| | | | | | | | | | | | |
| | 2014 | | 2013 | | 2012 |
| | Average
Carrying
Value | | Interest
Income
Recognized (2) | | Average
Carrying
Value | | Interest
Income
Recognized (2) | | Average
Carrying
Value | | Interest
Income
Recognized (2) |
| With no recorded allowance | |
| | |
| | | | | | | | |
| U.S. commercial | $ | 546 |
| | $ | 12 |
| | $ | 442 |
| | $ | 6 |
| | $ | 588 |
| | $ | 9 |
|
| Commercial real estate | 166 |
| | 3 |
| | 269 |
| | 3 |
| | 1,119 |
| | 3 |
|
| Non-U.S. commercial | 15 |
| | — |
| | 28 |
| | — |
| | 104 |
| | — |
|
| With an allowance recorded | | | | | | | | | | | |
| U.S. commercial | $ | 1,198 |
| | $ | 51 |
| | $ | 1,553 |
| | $ | 47 |
| | $ | 2,104 |
| | $ | 55 |
|
| Commercial real estate | 632 |
| | 16 |
| | 1,148 |
| | 28 |
| | 2,126 |
| | 29 |
|
| Non-U.S. commercial | 52 |
| | 3 |
| | 109 |
| | 5 |
| | 77 |
| | 4 |
|
U.S. small business commercial (1) | 151 |
| | 3 |
| | 236 |
| | 6 |
| | 409 |
| | 13 |
|
| Total | |
| | |
| | | | | | | | |
| U.S. commercial | $ | 1,744 |
| | $ | 63 |
| | $ | 1,995 |
| | $ | 53 |
| | $ | 2,692 |
| | $ | 64 |
|
| Commercial real estate | 798 |
| | 19 |
| | 1,417 |
| | 31 |
| | 3,245 |
| | 32 |
|
| Non-U.S. commercial | 67 |
| | 3 |
| | 137 |
| | 5 |
| | 181 |
| | 4 |
|
U.S. small business commercial (1) | 151 |
| | 3 |
| | 236 |
| | 6 |
| | 409 |
| | 13 |
|
| |
(1) | Includes U.S. small business commercial renegotiated TDR loans and related allowance. |
| |
(2) | Interest income recognized includes interest accrued and collected on the outstanding balances of accruing impaired loans as well as interest cash collections on nonaccruing impaired loans for which the principal is considered collectible. |
The table below presents the December 31, 2014, 2013 and 2012 unpaid principal balance and carrying value of commercial loans that were modified as TDRs during 2014, 2013 and 2012, and net charge-offs recorded during the period in which the modification occurred. The table below includes loans that were initially classified as TDRs during the period and also loans that had previously been classified as TDRs and were modified again during the period.
|
| | | | | | | | | | | |
| | | | | | |
| Commercial – TDRs Entered into During 2014, 2013 and 2012 |
| | |
| | December 31, 2014 | | 2014 |
| (Dollars in millions) | Unpaid Principal Balance | | Carrying Value | | Net Charge-offs |
| U.S. commercial | $ | 818 |
| | $ | 785 |
| | $ | 49 |
|
| Commercial real estate | 346 |
| | 346 |
| | 8 |
|
| Non-U.S. commercial | 44 |
| | 43 |
| | — |
|
U.S. small business commercial (1) | 3 |
| | 3 |
| | — |
|
| Total | $ | 1,211 |
| | $ | 1,177 |
| | $ | 57 |
|
| | | | | | |
| | December 31, 2013 | | 2013 |
| U.S. commercial | $ | 926 |
| | $ | 910 |
| | $ | 33 |
|
| Commercial real estate | 483 |
| | 425 |
| | 3 |
|
| Non-U.S. commercial | 61 |
| | 44 |
| | 7 |
|
U.S. small business commercial (1) | 8 |
| | 9 |
| | 1 |
|
| Total | $ | 1,478 |
| | $ | 1,388 |
| | $ | 44 |
|
| | | | | | |
| | December 31, 2012 | | 2012 |
| U.S. commercial | $ | 590 |
| | $ | 558 |
| | $ | 34 |
|
| Commercial real estate | 793 |
| | 721 |
| | 20 |
|
| Non-U.S. commercial | 90 |
| | 89 |
| | 1 |
|
U.S. small business commercial (1) | 22 |
| | 22 |
| | 5 |
|
| Total | $ | 1,495 |
| | $ | 1,390 |
| | $ | 60 |
|
| |
(1) | U.S. small business commercial TDRs are comprised of renegotiated small business card loans. |
A commercial TDR is generally deemed to be in payment default when the loan is 90 days or more past due, including delinquencies that were not resolved as part of the modification. U.S. small business commercial TDRs are deemed to be in payment default during the quarter in which a borrower misses the second of two consecutive payments. Payment defaults are one of the factors considered when projecting future cash flows, along with observable market prices or fair value of collateral when measuring the allowance for loan and lease losses. TDRs that were in payment default had a carrying value of $103 million, $55 million and $130 million for U.S. commercial and $211 million, $128 million and $455 million for commercial real estate at December 31, 2014, 2013 and 2012, respectively.
Purchased Credit-impaired Loans
PCI loans are acquired loans with evidence of credit quality deterioration since origination for which it is probable at purchase date that the Corporation will be unable to collect all contractually required payments. The following table provides details onpresents PCI loans acquired in connection with the January 6, 2013 settlement with FNMA (the FNMA Settlement).FNMA.
|
| | | |
| | |
| Purchased Loans at Acquisition Date | |
| | |
| (Dollars in millions) | |
| Contractually required payments including interest | $ | 8,274 |
|
| Less: Nonaccretable difference | 2,159 |
|
Cash flows expected to be collected (1) | 6,115 |
|
| Less: Accretable yield | 1,125 |
|
| Fair value of loans acquired | $ | 4,990 |
|
| |
(1) | Represents undiscounted expected principal and interest cash flows at acquisition. |
The table below shows activity for the accretable yield on PCI loans, which includes the Countrywide Financial Corporation (Countrywide) portfolio and loans repurchased in connection with the FNMA Settlement.settlement with FNMA. For more information on the settlement with FNMA, Settlement, see Note 7 – Representations and Warranties Obligations and Corporate Guarantees. The amount of accretable yield is affected by changes in credit outlooks, including metrics such as default rates and loss severities, prepaymentsprepayment speeds, which can change the amount and period of time over which interest payments are expected to be received, and the interest rates on variable rate loans. The reclassifications from nonaccretable difference during 2014 and 2013 were due to increases in expected cash flows driven by improved home prices and lower expected defaults, along withloss rates and a decrease in forecasted prepayment speeds as a result of rising interest rates.speeds. Changes in the prepayment assumption affect the expected remaining life of the portfolio which results in a change to the amount of future interest cash flows.
| | | | |
| |
|
| Rollforward of Accretable Yield | | |
| | | |
| (Dollars in millions) | |
| |
|
| Accretable yield, January 1, 2012 | $ | 4,990 |
| |
| Accretable yield, January 1, 2013 | | $ | 4,644 |
|
| Accretion | | (1,194 | ) |
| Loans Purchased | | 1,125 |
|
| Disposals/transfers | | (361 | ) |
| Reclassifications from nonaccretable difference | | 2,480 |
|
| Accretable yield, December 31, 2013 | | 6,694 |
|
| Accretion | (1,034 | ) | (1,061 | ) |
| Disposals/transfers | (109 | ) | (506 | ) |
| Reclassifications from nonaccretable difference | 797 |
| 481 |
|
| Accretable yield, December 31, 2012 | 4,644 |
| |
| Accretion | (1,194 | ) | |
| Loans purchased | 1,125 |
| |
| Disposals/transfers | (361 | ) | |
| Reclassifications from nonaccretable difference | 2,480 |
| |
| Accretable yield, December 31, 2013 | $ | 6,694 |
| |
| Accretable yield, December 31, 2014 | | $ | 5,608 |
|
During 2014, the Corporation sold PCI loans with a carrying value of $1.9 billion, which excludes the related allowance of $317 million. For more information on PCI loans, see Note 1 – Summary of Significant Accounting Principles, and for the carrying value and valuation allowance for PCI loans, see Note 5 – Allowance for Credit Losses.
Loans Held-for-sale
The Corporation had LHFS of $11.412.8 billion and $19.411.4 billion at December 31, 20132014 and 20122013. Proceeds, including cashCash and securities,non-cash proceeds from sales securitizations and paydowns of loans originally classified as LHFS were$40.1 billion, $81.0 billion, and $58.0 billion and $142.4 billionfor 20132014, 20122013 and 20112012, respectively. AmountsCash used for originations and purchases of LHFS weretotaled $40.1 billion, $65.7 billion $59.5 billion and $118.2$59.5 billion for 20132014, 20122013 and 20112012, respectively.
|
| | |
198189 Bank of America 20132014
| | |
NOTE 5 Allowance for Credit Losses
The table below summarizes the changes in the allowance for credit losses by portfolio segment for 20132014, 20122013 and 20112012.
| | | | | | | | | | | | | | | | | |
| | 2013 | 2014 |
| (Dollars in millions) | Home Loans | | Credit Card and Other Consumer | | Commercial | | Total Allowance | Home Loans | | Credit Card and Other Consumer | | Commercial | | Total Allowance |
| Allowance for loan and lease losses, January 1 | $ | 14,933 |
| | $ | 6,140 |
| | $ | 3,106 |
| | $ | 24,179 |
| $ | 8,518 |
| | $ | 4,905 |
| | $ | 4,005 |
| | $ | 17,428 |
|
| Loans and leases charged off | (3,766 | ) | | (5,495 | ) | | (1,108 | ) | | (10,369 | ) | (2,219 | ) | | (4,149 | ) | | (658 | ) | | (7,026 | ) |
| Recoveries of loans and leases previously charged off | 879 |
| | 1,141 |
| | 452 |
| | 2,472 |
| 1,426 |
| | 871 |
| | 346 |
| | 2,643 |
|
| Net charge-offs | (2,887 | ) | | (4,354 | ) | | (656 | ) | | (7,897 | ) | (793 | ) | | (3,278 | ) | | (312 | ) | | (4,383 | ) |
| Write-offs of PCI loans | (2,336 | ) | | — |
| | — |
| | (2,336 | ) | (810 | ) | | — |
| | — |
| | (810 | ) |
| Provision for loan and lease losses | (1,124 | ) | | 3,139 |
| | 1,559 |
| | 3,574 |
| (976 | ) | | 2,458 |
| | 749 |
| | 2,231 |
|
| Other | (68 | ) | | (20 | ) | | (4 | ) | | (92 | ) | |
Other (1) | | (4 | ) | | (38 | ) | | (5 | ) | | (47 | ) |
| Allowance for loan and lease losses, December 31 | 8,518 |
| | 4,905 |
| | 4,005 |
| | 17,428 |
| 5,935 |
| | 4,047 |
| | 4,437 |
| | 14,419 |
|
| Reserve for unfunded lending commitments, January 1 | — |
| | — |
| | 513 |
| | 513 |
| — |
| | — |
| | 484 |
| | 484 |
|
| Provision for unfunded lending commitments | — |
| | — |
| | (18 | ) | | (18 | ) | — |
| | — |
| | 44 |
| | 44 |
|
| Other | — |
| | — |
| | (11 | ) | | (11 | ) | |
| Reserve for unfunded lending commitments, December 31 | — |
| | — |
| | 484 |
| | 484 |
| — |
| | — |
| | 528 |
| | 528 |
|
| Allowance for credit losses, December 31 | $ | 8,518 |
| | $ | 4,905 |
| | $ | 4,489 |
| | $ | 17,912 |
| $ | 5,935 |
| | $ | 4,047 |
| | $ | 4,965 |
| | $ | 14,947 |
|
| | | | 2012 | 2013 |
| Allowance for loan and lease losses, January 1 | $ | 21,079 |
| | $ | 8,569 |
| | $ | 4,135 |
| | $ | 33,783 |
| $ | 14,933 |
| | $ | 6,140 |
| | $ | 3,106 |
| | $ | 24,179 |
|
| Loans and leases charged off | (7,849 | ) | | (7,727 | ) | | (2,096 | ) | | (17,672 | ) | (3,766 | ) | | (5,495 | ) | | (1,108 | ) | | (10,369 | ) |
| Recoveries of loans and leases previously charged off | 496 |
| | 1,519 |
| | 749 |
| | 2,764 |
| 879 |
| | 1,141 |
| | 452 |
| | 2,472 |
|
| Net charge-offs | (7,353 | ) | | (6,208 | ) | | (1,347 | ) | | (14,908 | ) | (2,887 | ) | | (4,354 | ) | | (656 | ) | | (7,897 | ) |
| Write-offs of PCI loans | (2,820 | ) | | — |
| | — |
| | (2,820 | ) | (2,336 | ) | | — |
| | — |
| | (2,336 | ) |
| Provision for loan and lease losses | 4,073 |
| | 3,899 |
| | 338 |
| | 8,310 |
| (1,124 | ) | | 3,139 |
| | 1,559 |
| | 3,574 |
|
Other | (46 | ) | | (120 | ) | | (20 | ) | | (186 | ) | (68 | ) | | (20 | ) | | (4 | ) | | (92 | ) |
| Allowance for loan and lease losses, December 31 | 14,933 |
| | 6,140 |
| | 3,106 |
| | 24,179 |
| 8,518 |
| | 4,905 |
| | 4,005 |
| | 17,428 |
|
| Reserve for unfunded lending commitments, January 1 | — |
| | — |
| | 714 |
| | 714 |
| — |
| | — |
| | 513 |
| | 513 |
|
| Provision for unfunded lending commitments | — |
| | — |
| | (141 | ) | | (141 | ) | — |
| | — |
| | (18 | ) | | (18 | ) |
| Other | — |
| | — |
| | (60 | ) | | (60 | ) | — |
| | — |
| | (11 | ) | | (11 | ) |
| Reserve for unfunded lending commitments, December 31 | — |
| | — |
| | 513 |
| | 513 |
| — |
| | — |
| | 484 |
| | 484 |
|
| Allowance for credit losses, December 31 | $ | 14,933 |
| | $ | 6,140 |
| | $ | 3,619 |
| | $ | 24,692 |
| $ | 8,518 |
| | $ | 4,905 |
| | $ | 4,489 |
| | $ | 17,912 |
|
| | | | 2011 | 2012 |
| Allowance for loan and lease losses, January 1 | $ | 19,252 |
| | $ | 15,463 |
| | $ | 7,170 |
| | $ | 41,885 |
| $ | 21,079 |
| | $ | 8,569 |
| | $ | 4,135 |
| | $ | 33,783 |
|
| Loans and leases charged off | (9,291 | ) | | (12,247 | ) | | (3,204 | ) | | (24,742 | ) | (7,849 | ) | | (7,727 | ) | | (2,096 | ) | | (17,672 | ) |
| Recoveries of loans and leases previously charged off | 894 |
| | 2,124 |
| | 891 |
| | 3,909 |
| 496 |
| | 1,519 |
| | 749 |
| | 2,764 |
|
| Net charge-offs | (8,397 | ) | | (10,123 | ) | | (2,313 | ) | | (20,833 | ) | (7,353 | ) | | (6,208 | ) | | (1,347 | ) | | (14,908 | ) |
| Write-offs of PCI loans | | (2,820 | ) | | — |
| | — |
| | (2,820 | ) |
| Provision for loan and lease losses | 10,300 |
| | 4,025 |
| | (696 | ) | | 13,629 |
| 4,073 |
| | 3,899 |
| | 338 |
| | 8,310 |
|
| Other | (76 | ) | | (796 | ) | | (26 | ) | | (898 | ) | |
Other (1) | | (46 | ) | | (120 | ) | | (20 | ) | | (186 | ) |
| Allowance for loan and lease losses, December 31 | 21,079 |
| | 8,569 |
| | 4,135 |
| | 33,783 |
| 14,933 |
| | 6,140 |
| | 3,106 |
| | 24,179 |
|
| Reserve for unfunded lending commitments, January 1 | — |
| | — |
| | 1,188 |
| | 1,188 |
| — |
| | — |
| | 714 |
| | 714 |
|
| Provision for unfunded lending commitments | — |
| | — |
| | (219 | ) | | (219 | ) | — |
| | — |
| | (141 | ) | | (141 | ) |
| Other | — |
| | — |
| | (255 | ) | | (255 | ) | — |
| | — |
| | (60 | ) | | (60 | ) |
| Reserve for unfunded lending commitments, December 31 | — |
| | — |
| | 714 |
| | 714 |
| — |
| | — |
| | 513 |
| | 513 |
|
| Allowance for credit losses, December 31 | $ | 21,079 |
| | $ | 8,569 |
| | $ | 4,849 |
| | $ | 34,497 |
| $ | 14,933 |
| | $ | 6,140 |
| | $ | 3,619 |
| | $ | 24,692 |
|
| |
(1) | Primarily represents the net impact of portfolio sales, consolidations and deconsolidations, and foreign currency translation adjustments. |
In 2014, 2013, and 2012, for the PCI loan portfolio, the Corporation recorded a benefit of $707$31 million, $707 million and $103 million, respectively in the provision for credit losses with a corresponding decrease in the valuation allowance included as part of the allowance for loan and lease losses. This compared to a benefit of $103 million in 2012 and expense of $2.2 billion in 2011. Write-offs in the PCI loan portfolio totaled $2.3$810 million, $2.3 billion and $2.8$2.8 billion with a corresponding decrease in the PCI valuation allowance during 2014, 2013 and 2012. There were no write-offs in the PCI loan portfolio in 2011., respectively. Write-offs in 2013
included certain PCI loans that were ineligible for the National Mortgage Settlement, but had characteristics similar to the eligible loans and the expectation of future cash proceeds was considered remote. Write-offs of PCI loans in 2012 primarily related to the National Mortgage
Settlement. The valuation allowance associated with the PCI loan portfolio was $2.51.7 billion, $5.52.5 billion and $8.55.5 billion at December 31, 20132014, 20122013 and 20112012, respectively.
The “Other” amount under allowance for loan and lease losses primarily represents the net impact of portfolio sales, consolidations and deconsolidations, and foreign currency translation adjustments. The 2011 amount also includes a $449 million reduction in the allowance for loan and lease losses related to Canadian consumer card loans that were transferred to LHFS.
The “Other” amount under the reserve for unfunded lending commitments primarily represents accretion of the Merrill Lynch & Co., Inc. (Merrill Lynch) purchase accounting adjustment.
|
| | |
| | | Bank of America 20132014 199190 |
The table below presents the allowance and the carrying value of outstanding loans and leases by portfolio segment at December 31, 20132014 and 20122013.
| | | | | | | | | | | | | | | | | |
| Allowance and Carrying Value by Portfolio Segment | | | | | | | | | | | | | | |
| | | | | | | | | | | | | | | |
| | December 31, 2013 | December 31, 2014 |
| (Dollars in millions) | Home Loans | | Credit Card
and Other Consumer | | Commercial | | Total | Home Loans | | Credit Card
and Other Consumer | | Commercial | | Total |
Impaired loans and troubled debt restructurings (1) | |
| | |
| | |
| | |
| |
| | |
| | |
| | |
|
Allowance for loan and lease losses (2) | $ | 1,231 |
| | $ | 579 |
| | $ | 277 |
| | $ | 2,087 |
| $ | 727 |
| | $ | 339 |
| | $ | 159 |
| | $ | 1,225 |
|
Carrying value (3) | 31,458 |
| | 2,079 |
| | 3,048 |
| | 36,585 |
| 25,628 |
| | 1,141 |
| | 2,198 |
| | 28,967 |
|
| Allowance as a percentage of carrying value | 3.91 | % | | 27.85 | % | | 9.09 | % | | 5.70 | % | 2.84 | % | | 29.71 | % | | 7.23 | % | | 4.23 | % |
| Loans collectively evaluated for impairment | |
| | |
| | |
| | |
| |
| | |
| | |
| | |
|
| Allowance for loan and lease losses | $ | 4,794 |
| | $ | 4,326 |
| | $ | 3,728 |
| | $ | 12,848 |
| $ | 3,556 |
| | $ | 3,708 |
| | $ | 4,278 |
| | $ | 11,542 |
|
Carrying value (3, 4) | 285,015 |
| | 185,969 |
| | 385,357 |
| | 856,341 |
| 255,525 |
| | 183,430 |
| | 384,019 |
| | 822,974 |
|
Allowance as a percentage of carrying value (4) | 1.68 | % | | 2.33 | % | | 0.97 | % | | 1.50 | % | 1.39 | % | | 2.02 | % | | 1.11 | % | | 1.40 | % |
| Purchased credit-impaired loans | |
| | | | |
| | |
| |
| | | | |
| | |
|
| Valuation allowance | $ | 2,493 |
| | n/a |
| | n/a |
| | $ | 2,493 |
| $ | 1,652 |
| | n/a |
| | n/a |
| | $ | 1,652 |
|
| Carrying value gross of valuation allowance | 25,265 |
| | n/a |
| | n/a |
| | 25,265 |
| 20,769 |
| | n/a |
| | n/a |
| | 20,769 |
|
| Valuation allowance as a percentage of carrying value | 9.87 | % | | n/a |
| | n/a |
| | 9.87 | % | 7.95 | % | | n/a |
| | n/a |
| | 7.95 | % |
| Total | |
| | |
| | |
| | |
| |
| | |
| | |
| | |
|
| Allowance for loan and lease losses | $ | 8,518 |
| | $ | 4,905 |
| | $ | 4,005 |
| | $ | 17,428 |
| $ | 5,935 |
| | $ | 4,047 |
| | $ | 4,437 |
| | $ | 14,419 |
|
Carrying value (3, 4) | 341,738 |
| | 188,048 |
| | 388,405 |
| | 918,191 |
| 301,922 |
| | 184,571 |
| | 386,217 |
| | 872,710 |
|
Allowance as a percentage of carrying value (4) | 2.49 | % | | 2.61 | % | | 1.03 | % | | 1.90 | % | 1.97 | % | | 2.19 | % | | 1.15 | % | | 1.65 | % |
| | | | December 31, 2012 | December 31, 2013 |
Impaired loans and troubled debt restructurings (1) | |
| | |
| | |
| | |
| |
| | |
| | |
| | |
|
Allowance for loan and lease losses (2) | $ | 1,700 |
| | $ | 1,139 |
| | $ | 475 |
| | $ | 3,314 |
| $ | 1,231 |
| | $ | 579 |
| | $ | 277 |
| | $ | 2,087 |
|
Carrying value (3) | 30,250 |
| | 3,946 |
| | 4,881 |
| | 39,077 |
| 31,458 |
| | 2,079 |
| | 3,048 |
| | 36,585 |
|
| Allowance as a percentage of carrying value | 5.62 | % | | 28.86 | % | | 9.73 | % | | 8.48 | % | 3.91 | % | | 27.85 | % | | 9.09 | % | | 5.70 | % |
| Loans collectively evaluated for impairment | |
| | |
| | |
| | | |
| | |
| | |
| | |
| Allowance for loan and lease losses | $ | 7,697 |
| | $ | 5,001 |
| | $ | 2,631 |
| | $ | 15,329 |
| $ | 4,794 |
| | $ | 4,326 |
| | $ | 3,728 |
| | $ | 12,848 |
|
Carrying value (3, 4) | 304,701 |
| | 187,419 |
| | 341,502 |
| | 833,622 |
| 285,015 |
| | 185,969 |
| | 385,357 |
| | 856,341 |
|
Allowance as a percentage of carrying value (4) | 2.53 | % | | 2.67 | % | | 0.77 | % | | 1.84 | % | 1.68 | % | | 2.33 | % | | 0.97 | % | | 1.50 | % |
| Purchased credit-impaired loans | |
| | |
| | |
| | | |
| | |
| | |
| | |
| Valuation allowance | $ | 5,536 |
| | n/a |
| | n/a |
| | $ | 5,536 |
| $ | 2,493 |
| | n/a |
| | n/a |
| | $ | 2,493 |
|
| Carrying value gross of valuation allowance | 26,118 |
| | n/a |
| | n/a |
| | 26,118 |
| 25,265 |
| | n/a |
| | n/a |
| | 25,265 |
|
| Valuation allowance as a percentage of carrying value | 21.20 | % | | n/a |
| | n/a |
| | 21.20 | % | 9.87 | % | | n/a |
| | n/a |
| | 9.87 | % |
| Total | |
| | |
| | |
| | | |
| | |
| | |
| | |
| Allowance for loan and lease losses | $ | 14,933 |
| | $ | 6,140 |
| | $ | 3,106 |
| | $ | 24,179 |
| $ | 8,518 |
| | $ | 4,905 |
| | $ | 4,005 |
| | $ | 17,428 |
|
Carrying value (3, 4) | 361,069 |
| | 191,365 |
| | 346,383 |
| | 898,817 |
| 341,738 |
| | 188,048 |
| | 388,405 |
| | 918,191 |
|
Allowance as a percentage of carrying value (4) | 4.14 | % | | 3.21 | % | | 0.90 | % | | 2.69 | % | 2.49 | % | | 2.61 | % | | 1.03 | % | | 1.90 | % |
| |
(1) | Impaired loans include nonperforming commercial loans and all TDRs, including both commercial and consumer TDRs. Impaired loans exclude nonperforming consumer loans unless they are TDRs, and all consumer and commercial loans accounted for under the fair value option. |
| |
(2) | Allowance for loan and lease losses includes $3635 million and $9736 million related to impaired U.S. small business commercial loans at December 31, 20132014 and 20122013. |
| |
(3) | Amounts are presented gross of the allowance for loan and lease losses. |
| |
(4) | Outstanding loan and lease balances and ratios do not include loans accounted for under the fair value option of $10.08.7 billion and $9.010.0 billion at December 31, 20132014 and 20122013. |
n/a = not applicable
|
| | |
200191 Bank of America 20132014
| | |
NOTE 6 Securitizations and Other Variable Interest Entities
The Corporation utilizes variable interest entities (VIEs) in the ordinary course of business to support its own and its customers’ financing and investing needs. The Corporation routinely securitizes loans and debt securities using VIEs as a source of funding for the Corporation and as a means of transferring the economic risk of the loans or debt securities to third parties. The assets are transferred into a trust or other securitization vehicle such that the assets are legally isolated from the creditors of the Corporation and are not available to satisfy its obligations. These assets can only be used to settle obligations of the trust or other securitization vehicle. The Corporation also administers, structures or invests in other VIEs including CDOs, investment vehicles and other entities. For more information on the Corporation’s utilization of VIEs, see Note 1 – Summary of Significant Accounting Principles.
The tables withinin this Note present the assets and liabilities of consolidated and unconsolidated VIEs at December 31, 20132014 and 20122013, in situations where the Corporation has continuing involvement with transferred assets or if the Corporation otherwise has a variable interest in the VIE. The tables also present the Corporation’s maximum loss exposure at December 31, 20132014 and 20122013 resulting from its involvement with consolidated VIEs and unconsolidated VIEs in which the Corporation holds a variable interest. The Corporation’s maximum loss exposure is based on the unlikely event that all of the assets in the VIEs become worthless and incorporates not only potential losses associated with assets recorded on the Consolidated Balance Sheet but also potential losses associated with off-balance sheet commitments such as unfunded liquidity commitments and other contractual arrangements. The Corporation’s maximum loss exposure does not include losses previously recognized through write-downs of assets.
The Corporation invests in asset-backed securities (ABS) issued by third-party VIEs with which it has no other form of involvement. These securities are included in Note 203 – Fair Value MeasurementsSecurities and Note 320 – Securities.Fair Value Measurements. In addition, the Corporation
Corporation uses VIEs such as trust preferred securities trusts in connection with its funding activities. For additional information, see Note 11 – Long-term Debt. The Corporation also uses VIEs in the form of synthetic securitization vehicles to mitigate a portion of the credit risk on its residential mortgage loan portfolio, as described in Note 4 – Outstanding Loans and Leases. The Corporation uses VIEs, such as cash funds managed within Global Wealth & Investment Management (GWIM), to provide investment opportunities for clients. These VIEs, which are not consolidated by the Corporation, are not included in the tables withinin this Note.
Except as described below, the Corporation did not provide financial support to consolidated or unconsolidated VIEs during 20132014 or 20122013 that it was not previously contractually required to provide, nor does it intend to do so.
Mortgage-related Securitizations
First-lien Mortgages
As part of its mortgage banking activities, the Corporation securitizes a portion of the first-lien residential mortgage loans it originates or purchases from third parties, generally in the form of MBSRMBS guaranteed by government-sponsored enterprises, FNMA and FHLMC (collectively the GSEs), or GNMA primarily in the case of FHA-insured and U.S. Department of Veterans Affairs (VA)-guaranteed mortgage loans. Securitization usually occurs in conjunction with or shortly after origination or purchase. In addition, the Corporation may, from time to time, securitize commercial mortgages it originates or purchases from other entities. The Corporation typically services the loans it securitizes. Further, the Corporation may retain beneficial interests in the securitization trusts including senior and subordinate securities and equity tranches issued by the trusts. Except as described below and in Note 7 – Representations and Warranties Obligations and Corporate Guarantees, the Corporation does not provide guarantees or recourse to the securitization trusts other than standard representations and warranties.
The table below summarizes select information related to first-lien mortgage securitizations for 20132014 and 20122013.
| | | | | | | | | | | |
| First-lien Mortgage Securitizations | First-lien Mortgage Securitizations | | First-lien Mortgage Securitizations | | | |
| | | | | | | | | |
| | Residential Mortgage - Agency | | Commercial Mortgage | Residential Mortgage | | |
| | | Agency | | Non-agency - Subprime | | Commercial Mortgage |
| (Dollars in millions) | 2013 | 2012 | | 2013 | 2012 | 2014 | 2013 | | 2014 | 2013 | | 2014 | 2013 |
Cash proceeds from new securitizations (1) | $ | 49,888 |
| $ | 39,526 |
| | $ | 5,326 |
| $ | 2,664 |
| $ | 36,905 |
| $ | 49,888 |
| | $ | 809 |
| $ | — |
| | $ | 5,710 |
| $ | 5,326 |
|
Gain (loss) on securitizations (2) | 81 |
| (212 | ) | | 119 |
| 65 |
| |
Gain on securitizations (2) | | 371 |
| 81 |
| | 49 |
| — |
| | 68 |
| 119 |
|
| |
(1) | The Corporation sellstransfers residential mortgage loans to securitizations sponsored by the GSEs or GNMA in the normal course of business and receives MBSRMBS in exchange which may then be sold into the market to third-party investors for cash proceeds. |
| |
(2) | Substantially all of the first-lien residential and commercial mortgage loans securitized are initially classified as LHFS and accounted for under the fair value option. As such, gains are recognized on these LHFS prior to securitization. The Corporation recognized $715 million and $2.0 billion of gains, net of hedges, on loans securitized during both 20132014 and 20122013. |
In addition to cash proceeds as reported in the table above, the Corporation received securities with an initial fair value of $3.35.4 billion and $3.23.3 billion in connection with first-lien mortgage securitizations in 20132014 and 20122013. All of these securities were initially classified as Level 2 assets within the fair value hierarchy. During 20132014 and 20122013, there were no changes to the initial classification.
The Corporation recognizes consumer MSRs from the sale or securitization of first-lien mortgage loans. Servicing fee and ancillary fee income on consumer mortgage loans serviced, including securitizations where the Corporation has continuing involvement, were $2.91.8 billion and $4.72.9 billion in 20132014 and 20122013.
Servicing advances on consumer mortgage loans, including securitizations where the Corporation has continuing involvement, were $14.110.4 billion and $23.214.1 billion at December 31, 20132014 and 20122013. The Corporation may have the option to repurchase delinquent loans out of securitization trusts, which reduces the amount of servicing advances it is required to make. During 20132014 and 20122013, $10.85.2 billion and $9.210.8 billion of loans were repurchased from first-lien securitization trusts primarily as a result of loan delinquencies or to perform modifications. The majority of these loans repurchased were FHA-insured mortgages collateralizing GNMA securities. For more information on MSRs, see Note 23 – Mortgage Servicing Rights.
|
| | |
| | | Bank of America 20132014 201192 |
The table below summarizes select information related to first-lien mortgage securitization trusts in which the Corporation held a variable interest at December 31, 20132014 and 20122013.
| | | | | | | | | | | | | | | | | | | | | |
| First-lien Mortgage VIEs | First-lien Mortgage VIEs | | | | | | | | First-lien Mortgage VIEs | | | | | | | |
| | | | | | | | | | | | | | | | | | | |
| | Residential Mortgage | | |
| |
| Residential Mortgage | | |
| |
|
| | |
| |
| | Non-agency | | |
| |
| |
| |
| | Non-agency | | |
| |
|
| | Agency | | Prime | | Subprime | | Alt-A | | Commercial Mortgage | Agency | | Prime | | Subprime | | Alt-A | | Commercial Mortgage |
| | December 31 | | December 31 | | December 31 | December 31 | | December 31 | | December 31 |
| (Dollars in millions) | 2013 | 2012 | | 2013 | 2012 | | 2013 | 2012 | | 2013 | 2012 | | 2013 | 2012 | 2014 | 2013 | | 2014 | 2013 | | 2014 | 2013 | | 2014 | 2013 | | 2014 | 2013 |
| Unconsolidated VIEs | |
| |
| | |
| |
| | |
| |
| | |
| |
| | |
| |
| |
| |
| | |
| |
| | |
| |
| | |
| |
| | |
| |
|
Maximum loss exposure (1) | $ | 21,140 |
| $ | 28,591 |
| | $ | 1,527 |
| $ | 2,038 |
| | $ | 406 |
| $ | 410 |
| | $ | 437 |
| $ | 367 |
| | $ | 432 |
| $ | 702 |
| $ | 14,918 |
| $ | 21,140 |
| | $ | 1,288 |
| $ | 1,527 |
| | $ | 3,167 |
| $ | 591 |
| | $ | 710 |
| $ | 437 |
| | $ | 352 |
| $ | 432 |
|
| On-balance sheet assets | |
| |
| | |
| |
| | |
| |
| | |
| |
| | |
| |
| |
| |
| | |
| |
| | |
| |
| | |
| |
| | |
| |
|
Senior securities held (2): | |
| |
| | |
| |
| | |
| |
| | |
| |
| | |
| |
| |
| |
| | |
| |
| | |
| |
| | |
| |
| | |
| |
|
| Trading account assets | $ | 650 |
| $ | 619 |
| | $ | — |
| $ | 16 |
| | $ | 1 |
| $ | 14 |
| | $ | 3 |
| $ | — |
| | $ | 14 |
| $ | 12 |
| $ | 584 |
| $ | 650 |
| | $ | 3 |
| $ | — |
| | $ | 14 |
| $ | 1 |
| | $ | 81 |
| $ | 3 |
| | $ | 54 |
| $ | 14 |
|
| Debt securities carried at fair value | 19,451 |
| 26,421 |
| | 988 |
| 1,388 |
| | 220 |
| 210 |
| | 109 |
| 128 |
| | 306 |
| 581 |
| 13,473 |
| 19,451 |
| | 816 |
| 988 |
| | 2,811 |
| 220 |
| | 383 |
| 109 |
| | 76 |
| 306 |
|
| Held-to-maturity securities | | 837 |
| 1,012 |
| | — |
| — |
| | — |
| — |
| | — |
| — |
| | 42 |
| — |
|
Subordinate securities held (2): | |
| |
| | |
| |
| | |
| |
| | |
| |
| | |
| |
| |
| |
| | |
| |
| | |
| |
| | |
| |
| | |
| |
|
| Trading account assets | — |
| — |
| | — |
| — |
| | 8 |
| 3 |
| | — |
| — |
| | 13 |
| 13 |
| — |
| — |
| | — |
| — |
| | — |
| 8 |
| | 1 |
| — |
| | 58 |
| 13 |
|
| Debt securities carried at fair value | — |
| — |
| | 15 |
| 21 |
| | 6 |
| 9 |
| | — |
| — |
| | 53 |
| — |
| — |
| — |
| | 12 |
| 15 |
| | 5 |
| 6 |
| | — |
| — |
| | 58 |
| 53 |
|
| Held-to-maturity securities | | — |
| — |
| | — |
| — |
| | — |
| — |
| | — |
| — |
| | 15 |
| — |
|
| Residual interests held | — |
| — |
| | 13 |
| 18 |
| | — |
| 9 |
| | — |
| — |
| | 16 |
| 40 |
| — |
| — |
| | 10 |
| 13 |
| | — |
| — |
| | — |
| — |
| | 22 |
| 16 |
|
All other assets (3) | 1,039 |
| 1,551 |
| | 71 |
| 64 |
| | 1 |
| 1 |
| | 325 |
| 239 |
| | — |
| — |
| 24 |
| 27 |
| | 56 |
| 71 |
| | 1 |
| 1 |
| | 245 |
| 325 |
| | — |
| — |
|
| Total retained positions | $ | 21,140 |
| $ | 28,591 |
| | $ | 1,087 |
| $ | 1,507 |
| | $ | 236 |
| $ | 246 |
| | $ | 437 |
| $ | 367 |
| | $ | 402 |
| $ | 646 |
| $ | 14,918 |
| $ | 21,140 |
| | $ | 897 |
| $ | 1,087 |
| | $ | 2,831 |
| $ | 236 |
| | $ | 710 |
| $ | 437 |
| | $ | 325 |
| $ | 402 |
|
Principal balance outstanding (4) | $ | 437,765 |
| $ | 780,202 |
| | $ | 25,104 |
| $ | 47,348 |
| | $ | 36,854 |
| $ | 63,813 |
| | $ | 56,454 |
| $ | 80,860 |
| | $ | 19,730 |
| $ | 56,733 |
| $ | 397,055 |
| $ | 437,765 |
| | $ | 20,167 |
| $ | 25,104 |
| | $ | 32,592 |
| $ | 36,854 |
| | $ | 50,054 |
| $ | 56,454 |
| | $ | 20,593 |
| $ | 19,730 |
|
| | | | | | | | | | | | | | | | | | | |
| Consolidated VIEs | |
| |
| | |
| |
| | |
| |
| | |
| |
| | |
| |
| |
| |
| | |
| |
| | |
| |
| | |
| |
| | |
| |
|
Maximum loss exposure (1) | $ | 42,420 |
| $ | 46,959 |
| | $ | 79 |
| $ | 104 |
| | $ | 368 |
| $ | 390 |
| | $ | — |
| $ | — |
| | $ | — |
| $ | — |
| $ | 38,345 |
| $ | 42,420 |
| | $ | 77 |
| $ | 79 |
| | $ | 206 |
| $ | 183 |
| | $ | — |
| $ | — |
| | $ | — |
| $ | — |
|
| On-balance sheet assets | |
| |
| | |
| |
| | |
| |
| | |
| |
| | |
| |
| |
| |
| | |
| |
| | |
| |
| | |
| |
| | |
| |
|
| Trading account assets | $ | 1,640 |
| $ | — |
| | $ | — |
| $ | — |
| | $ | — |
| $ | — |
| | $ | — |
| $ | — |
| | $ | — |
| $ | — |
| $ | 1,538 |
| $ | 1,640 |
| | $ | — |
| $ | — |
| | $ | 30 |
| $ | — |
| | $ | — |
| $ | — |
| | $ | — |
| $ | — |
|
| Loans and leases | 40,316 |
| 45,991 |
| | 140 |
| 283 |
| | 803 |
| 722 |
| | — |
| — |
| | — |
| — |
| 36,187 |
| 40,316 |
| | 130 |
| 140 |
| | 768 |
| 803 |
| | — |
| — |
| | — |
| — |
|
| Allowance for loan and lease losses | (3 | ) | (4 | ) | | — |
| — |
| | — |
| — |
| | — |
| — |
| | — |
| — |
| (2 | ) | (3 | ) | | — |
| — |
| | — |
| — |
| | — |
| — |
| | — |
| — |
|
| Loans held-for-sale | — |
| — |
| | — |
| — |
| | — |
| 914 |
| | — |
| — |
| | — |
| — |
| |
| All other assets | 474 |
| 972 |
| | — |
| 10 |
| | 7 |
| 91 |
| | — |
| — |
| | — |
| — |
| 623 |
| 474 |
| | 6 |
| — |
| | 15 |
| 7 |
| | — |
| — |
| | — |
| — |
|
| Total assets | $ | 42,427 |
| $ | 46,959 |
| | $ | 140 |
| $ | 293 |
| | $ | 810 |
| $ | 1,727 |
| | $ | — |
| $ | — |
| | $ | — |
| $ | — |
| $ | 38,346 |
| $ | 42,427 |
| | $ | 136 |
| $ | 140 |
| | $ | 813 |
| $ | 810 |
| | $ | — |
| $ | — |
| | $ | — |
| $ | — |
|
| On-balance sheet liabilities | |
| |
| | |
| |
| | |
| |
| | |
| |
| | |
| |
| |
| |
| | |
| |
| | |
| |
| | |
| |
| | |
| |
|
| Short-term borrowings | $ | — |
| $ | — |
| | $ | — |
| $ | — |
| | $ | — |
| $ | 741 |
| | $ | — |
| $ | — |
| | $ | — |
| $ | — |
| |
| Long-term debt | 7 |
| — |
| | 61 |
| 212 |
| | 803 |
| 941 |
| | — |
| — |
| | — |
| — |
| $ | 1 |
| $ | 7 |
| | $ | 56 |
| $ | 61 |
| | $ | 770 |
| $ | 803 |
| | $ | — |
| $ | — |
| | $ | — |
| $ | — |
|
| All other liabilities | — |
| — |
| | — |
| — |
| | 7 |
| — |
| | — |
| — |
| | — |
| — |
| — |
| — |
| | 3 |
| — |
| | 13 |
| 7 |
| | — |
| — |
| | — |
| — |
|
| Total liabilities | $ | 7 |
| $ | — |
| | $ | 61 |
| $ | 212 |
| | $ | 810 |
| $ | 1,682 |
| | $ | — |
| $ | — |
| | $ | — |
| $ | — |
| $ | 1 |
| $ | 7 |
| | $ | 59 |
| $ | 61 |
| | $ | 783 |
| $ | 810 |
| | $ | — |
| $ | — |
| | $ | — |
| $ | — |
|
| |
(1) | Maximum loss exposure excludes the liability for representations and warranties obligations and corporate guarantees and also excludes servicing advances and MSRs.other servicing rights and obligations. For additional information, see Note 7 – Representations and Warranties Obligations and Corporate Guarantees and Note 23 – Mortgage Servicing Rights. |
| |
(2) | As a holder of these securities, the Corporation receives scheduled principal and interest payments. During 20132014 and 20122013, there were no OTTI losses recorded on those securities classified as AFS debt securities. |
| |
(3) | Not included in the table above are all other assets of $1.6 billion635 million and $12.11.6 billion, representing the unpaid principal balance of mortgage loans eligible for repurchase from unconsolidated residential mortgage securitization vehicles, principally guaranteed by GNMA, and all other liabilities of $1.6 billion635 million and $12.11.6 billion, representing the principal amount that would be payable to the securitization vehicles if the Corporation werewas to exercise the repurchase option, at December 31, 20132014 and 20122013. |
| |
(4) | Principal balance outstanding includes loans the Corporation transferred with which the Corporationit has continuing involvement, which may include servicing the loans. |
During 2013 and 2012, the Corporation deconsolidated several non-agency residential mortgage trusts with total assets of $871 million and $1.2 billion following the sale of retained interests or the transfer of servicing to a third party.
Home Equity Loans
The Corporation retains interests in home equity securitization trusts to which it transferred home equity loans. These retained interests include senior and subordinate securities and residual interests. In addition, the Corporation may be obligated to provide
subordinate funding to the trusts during a rapid amortization event. The Corporation alsotypically services the loans in the trusts. Except
as described below and in Note 7 – Representations and Warranties Obligations and Corporate Guarantees, the Corporation does not provide guarantees or recourse to the securitization trusts other than standard representations and warranties. There were no securitizations of home equity loans during 20132014 and 20122013, and all of the home equity trusts that hold revolving home equity lines of credit (HELOCs) have entered the rapid amortization phase.
|
| | |
202193 Bank of America 20132014
| | |
The table below summarizes select information related to home equity loan securitization trusts in which the Corporation held a variable interest at December 31, 20132014 and 20122013.
| | | | | | | | | | | | | | | | | | | | | | | | | |
| Home Equity Loan VIEs | Home Equity Loan VIEs | | | | | | | | | Home Equity Loan VIEs | | | | | | | | |
| | | | | | | | | | | | | | | | | | | | | | | |
| | December 31 | December 31 |
| | 2013 | | 2012 | 2014 | | 2013 |
| (Dollars in millions) | Consolidated VIEs | | Unconsolidated VIEs | | Total | | Consolidated VIEs | | Unconsolidated VIEs | | Total | Consolidated VIEs | | Unconsolidated VIEs | | Total | | Consolidated VIEs | | Unconsolidated VIEs | | Total |
Maximum loss exposure (1) | $ | 1,269 |
| | $ | 6,217 |
| | $ | 7,486 |
| | $ | 2,004 |
| | $ | 6,707 |
| | $ | 8,711 |
| $ | 991 |
| | $ | 5,224 |
| | $ | 6,215 |
| | $ | 1,269 |
| | $ | 6,217 |
| | $ | 7,486 |
|
| On-balance sheet assets | |
| | |
| | |
| | |
| | |
| | |
| |
| | |
| | |
| | |
| | |
| | |
|
| Trading account assets | $ | — |
| | $ | 12 |
| | $ | 12 |
| | $ | — |
| | $ | 8 |
| | $ | 8 |
| $ | — |
| | $ | 14 |
| | $ | 14 |
| | $ | — |
| | $ | 12 |
| | $ | 12 |
|
| Debt securities carried at fair value | — |
| | 25 |
| | 25 |
| | — |
| | 14 |
| | 14 |
| — |
| | 39 |
| | 39 |
| | — |
| | 25 |
| | 25 |
|
| Loans and leases | 1,329 |
| | — |
| | 1,329 |
| | 2,197 |
| | — |
| | 2,197 |
| 1,014 |
| | — |
| | 1,014 |
| | 1,329 |
| | — |
| | 1,329 |
|
| Allowance for loan and lease losses | (80 | ) | | — |
| | (80 | ) | | (193 | ) | | — |
| | (193 | ) | (56 | ) | | — |
| | (56 | ) | | (80 | ) | | — |
| | (80 | ) |
| All other assets | 20 |
| | — |
| | 20 |
| | — |
| | — |
| | — |
| 33 |
| | — |
| | 33 |
| | 20 |
| | — |
| | 20 |
|
| Total | $ | 1,269 |
| | $ | 37 |
| | $ | 1,306 |
| | $ | 2,004 |
| | $ | 22 |
| | $ | 2,026 |
| $ | 991 |
| | $ | 53 |
| | $ | 1,044 |
| | $ | 1,269 |
| | $ | 37 |
| | $ | 1,306 |
|
| On-balance sheet liabilities | |
| | |
| | |
| | |
| | |
| | |
| |
| | |
| | |
| | |
| | |
| | |
|
| Long-term debt | $ | 1,450 |
| | $ | — |
| | $ | 1,450 |
| | $ | 2,331 |
| | $ | — |
| | $ | 2,331 |
| $ | 1,076 |
| | $ | — |
| | $ | 1,076 |
| | $ | 1,450 |
| | $ | — |
| | $ | 1,450 |
|
| All other liabilities | 90 |
| | — |
| | 90 |
| | 92 |
| | — |
| | 92 |
| — |
| | — |
| | — |
| | 90 |
| | — |
| | 90 |
|
| Total | $ | 1,540 |
| | $ | — |
| | $ | 1,540 |
| | $ | 2,423 |
| | $ | — |
| | $ | 2,423 |
| $ | 1,076 |
| | $ | — |
| | $ | 1,076 |
| | $ | 1,540 |
| | $ | — |
| | $ | 1,540 |
|
| Principal balance outstanding | $ | 1,329 |
| | $ | 7,542 |
| | $ | 8,871 |
| | $ | 2,197 |
| | $ | 12,644 |
| | $ | 14,841 |
| $ | 1,014 |
| | $ | 6,362 |
| | $ | 7,376 |
| | $ | 1,329 |
| | $ | 7,542 |
| | $ | 8,871 |
|
| |
(1) | For unconsolidated VIEs, the maximum loss exposure includes outstanding trust certificates issued by trusts in rapid amortization, net of recorded reserves, and excludes the liability for representations and warranties obligations and corporate guarantees. |
The maximum loss exposure in the table above includes the Corporation’s obligation to provide subordinated funding to certainthe consolidated and unconsolidated home equity loan securitizations that have entered a rapid amortization period. During this period, cash payments from borrowers are accumulated to repay outstanding debt securities and the Corporation continues to make advances to borrowers when they draw on their lines of credit. At December 31, 20132014 and 20122013, home equity loan securitizations in rapid amortization for which the Corporation has a subordinated funding obligation, including both consolidated and unconsolidated trusts, had $7.66.3 billion and $9.07.6 billion of trust certificates outstanding. This amount is significantly greater than the amount the Corporation expects to fund. The charges that will
ultimately be recorded as a result of the rapid amortization events depend on the undrawn available credit on the home equity lines, which totaled $8239 million and $19682 million at December 31, 20132014 and 20122013, as well as performance of the loans, the amount of subsequent draws and the timing of related cash flows. At
December 31, 2013 and 2012, the reserve for losses on expected future draw obligations on the home equity loan securitizations in rapid amortization for which the Corporation has a subordinated funding obligation was $12 million and $51 million.
The Corporation has consumer MSRs from the sale or securitization of home equity loans. The Corporation recorded $47 million and $59 million of servicing fee income related to home equity loan securitizations during 2013 and 2012. The Corporation repurchased $287 million and $87 million of loans from home equity securitization trusts during 2013 and 2012 to perform modifications.
During 2013, the Corporation transferred servicing for consolidated home equity securitization trusts with total assets of $475$475 million and total liabilities of $616$616 million to a third party. As the Corporation no longer services the underlying loans, these trusts were deconsolidated, resulting in a gain of $141$141 million that was recorded in other income (loss) in the Consolidated Statement of Income.
|
| | |
| | | Bank of America 20132014 203194 |
Credit Card Securitizations
The Corporation securitizes originated and purchased credit card loans. The Corporation’s continuing involvement with the U.S. securitization truststrust includes servicing the receivables, retaining an undivided interest (seller’s interest) in the receivables, and holding certain retained interests including senior and subordinate securities, discount receivables, subordinate interests in accrued interest and fees on the securitized receivables, and cash reserve accounts. The
accounts. The seller’s interest in the trusts,U.S. trust, which is pari passu to the investors’ interest, and the discount receivables areis classified in loans and leases. All debt issued from the U.K. securitization trust has matured and the credit card receivables were reconveyed to the Corporation during 2014.
The table below summarizes select information related to consolidated credit card securitization trusts in which the Corporation held a variable interest at December 31, 20132014 and 20122013.
| | | | | | | | | |
Credit Card VIEs | | | | |
| | December 31 | December 31 |
| (Dollars in millions) | 2013 | | 2012 | 2014 | | 2013 |
| Consolidated VIEs | | | | | | |
| Maximum loss exposure | $ | 49,621 |
| | $ | 42,487 |
| $ | 43,139 |
| | $ | 49,621 |
|
| On-balance sheet assets | |
| | |
| |
| | |
|
| Derivative assets | $ | 182 |
| | $ | 323 |
| $ | 1 |
| | $ | 182 |
|
Loans and leases (1) | 61,241 |
| | 66,427 |
| 53,068 |
| | 61,241 |
|
| Allowance for loan and lease losses | (2,585 | ) | | (3,445 | ) | (1,904 | ) | | (2,585 | ) |
| Loans held-for-sale | 386 |
| | — |
| — |
| | 386 |
|
All other assets (2) | 2,281 |
| | 1,567 |
| 391 |
| | 2,281 |
|
| Total | $ | 61,505 |
| | $ | 64,872 |
| $ | 51,556 |
| | $ | 61,505 |
|
| On-balance sheet liabilities | |
| | |
| |
| | |
|
| Long-term debt | $ | 11,822 |
| | $ | 22,291 |
| $ | 8,401 |
| | $ | 11,822 |
|
| All other liabilities | 62 |
| | 94 |
| 16 |
| | 62 |
|
| Total | $ | 11,884 |
| | $ | 22,385 |
| $ | 8,417 |
| | $ | 11,884 |
|
| |
(1) | At December 31, 20132014 and 20122013, loans and leases included $41.236.9 billion and $33.541.2 billion of seller’s interest and $14 million and $124 million of discount receivables.interest. |
| |
(2) | At December 31, 20132014 and 20122013, all other assets included restricted cash, andcertain short-term investment accountsinvestments, and unbilled accrued interest and fees. |
During 2014, $4.1 billion of new senior debt securities were issued to third-party investors from the U.S. credit card securitization trust and none were issued during 2013.
The Corporation holdsheld subordinate securities issued by credit card securitization trusts with a notional principal amount of $7.9 7.4
billion and $10.17.9 billion at December 31, 20132014 and 20122013,. These securities serve as a form of credit enhancement to the senior debt securities and have a stated interest rate of zero percent issued by certain credit card securitization trusts. In addition, during 2010 and 2009, the Corporation elected to designate a specified percentage of new receivables transferred to the trusts as “discount receivables” such that principal collections thereon are added to finance charges which increases the yield in the trust. Through the designation of newly transferred receivables as discount receivables, the Corporation subordinated a portion of
its seller’s interest to the investors’ interest. These actions. There were taken to address the decline in the excess spread of the U.S. and U.K. credit card securitization trusts at that time.
During 2012, the Corporation transferred $553$662 million of credit card receivables to a third-party sponsored securitization vehicle. The Corporation no longer services the credit card receivables and does not consolidate the vehicle. Atthese subordinate securities issued during December 31, 20132014 and none issued during 20122013, the Corporation held a senior interest of $272 million and $309 million in these receivables, classified in loans and leases, that is not included in the table above..
|
| | |
204195 Bank of America 20132014
| | |
Other Asset-backed Securitizations
Other asset-backed securitizations include resecuritization trusts, municipal bond trusts, and automobile and other securitization trusts. The table below summarizes select information related to other asset-backed securitizations in which the Corporation held a variable interest at December 31, 20132014 and 20122013.
| | | | | | | | | | | | | | | | | | | | | | | | | |
| Other Asset-backed VIEs | Other Asset-backed VIEs | | | | | | | | | Other Asset-backed VIEs | | | | | | | | |
| | | | | | | | | | | | | | | | | | | | | | | |
| | Resecuritization Trusts | | Municipal Bond Trusts | | Automobile and Other Securitization Trusts | Resecuritization Trusts | | Municipal Bond Trusts | | Automobile and Other Securitization Trusts |
| | December 31 | | December 31 | | December 31 | December 31 | | December 31 | | December 31 |
| (Dollars in millions) | 2013 | | 2012 | | 2013 | | 2012 | | 2013 | | 2012 | 2014 | | 2013 | | 2014 | | 2013 | | 2014 | | 2013 |
| Unconsolidated VIEs | |
| | |
| | |
| | |
| | |
| | |
| |
| | |
| | |
| | |
| | |
| | |
|
| Maximum loss exposure | $ | 11,913 |
| | $ | 20,715 |
| | $ | 2,192 |
| | $ | 3,341 |
| | $ | 81 |
| | $ | 122 |
| $ | 8,569 |
| | $ | 11,913 |
| | $ | 2,100 |
| | $ | 2,192 |
| | $ | 77 |
| | $ | 81 |
|
| On-balance sheet assets | |
| | |
| | |
| | |
| | |
| | |
| |
| | |
| | |
| | |
| | |
| | |
|
Senior securities held (1, 2): | |
| | |
| | |
| | |
| | |
| | |
| |
| | |
| | |
| | |
| | |
| | |
|
| Trading account assets | $ | 971 |
| | $ | 1,281 |
| | $ | 53 |
| | $ | 12 |
| | $ | 1 |
| | $ | 37 |
| $ | 767 |
| | $ | 971 |
| | $ | 25 |
| | $ | 53 |
| | $ | 6 |
| | $ | 1 |
|
| Debt securities carried at fair value | 10,866 |
| | 19,343 |
| | — |
| | 540 |
| | 70 |
| | 74 |
| 6,945 |
| | 10,866 |
| | — |
| | — |
| | 61 |
| | 70 |
|
| Held-to-maturity securities | | 740 |
| | — |
| | — |
| | — |
| | — |
| | — |
|
Subordinate securities held (1, 2): | |
| | |
| | |
| | |
| | |
| | |
| |
| | |
| | |
| | |
| | |
| | |
|
| Trading account assets | | 37 |
| | — |
| | — |
| | — |
| | — |
| | — |
|
| Debt securities carried at fair value | 71 |
| | 75 |
| | — |
| | — |
| | — |
| | — |
| 73 |
| | 71 |
| | — |
| | — |
| | — |
| | — |
|
Residual interests held (3) | 5 |
| | 16 |
| | — |
| | — |
| | — |
| | — |
| 7 |
| | 5 |
| | — |
| | — |
| | — |
| | — |
|
| All other assets | — |
| | — |
| | — |
| | — |
| | 10 |
| | 11 |
| — |
| | — |
| | — |
| | — |
| | 10 |
| | 10 |
|
| Total retained positions | $ | 11,913 |
| | $ | 20,715 |
| | $ | 53 |
| | $ | 552 |
| | $ | 81 |
| | $ | 122 |
| $ | 8,569 |
| | $ | 11,913 |
| | $ | 25 |
| | $ | 53 |
| | $ | 77 |
| | $ | 81 |
|
Total assets of VIEs (4) | $ | 40,924 |
| | $ | 42,818 |
| | $ | 3,643 |
| | $ | 4,980 |
| | $ | 1,788 |
| | $ | 1,890 |
| $ | 28,065 |
| | $ | 40,924 |
| | $ | 3,314 |
| | $ | 3,643 |
| | $ | 1,276 |
| | $ | 1,788 |
|
| | | | | | | | | | | | | | | | | | | | | | | |
| Consolidated VIEs | |
| | |
| | |
| | |
| | |
| | |
| |
| | |
| | |
| | |
| | |
| | |
|
| Maximum loss exposure | $ | 164 |
| | $ | 126 |
| | $ | 2,667 |
| | $ | 2,505 |
| | $ | 94 |
| | $ | 1,255 |
| $ | 654 |
| | $ | 164 |
| | $ | 2,440 |
| | $ | 2,667 |
| | $ | 92 |
| | $ | 94 |
|
| On-balance sheet assets | |
| | |
| | |
| | |
| | |
| | |
| |
| | |
| | |
| | |
| | |
| | |
|
| Trading account assets | $ | 319 |
| | $ | 220 |
| | $ | 2,684 |
| | $ | 2,505 |
| | $ | — |
| | $ | — |
| $ | 1,295 |
| | $ | 319 |
| | $ | 2,452 |
| | $ | 2,684 |
| | $ | — |
| | $ | — |
|
| Loans and leases | — |
| | — |
| | — |
| | — |
| | 680 |
| | 2,523 |
| — |
| | — |
| | — |
| | — |
| | — |
| | 680 |
|
| Allowance for loan and lease losses | — |
| | — |
| | — |
| | — |
| | — |
| | (2 | ) | |
| Loans held-for-sale | | — |
| | — |
| | — |
| | — |
| | 555 |
| | — |
|
| All other assets | — |
| | — |
| | — |
| | — |
| | 61 |
| | 250 |
| — |
| | — |
| | — |
| | — |
| | 54 |
| | 61 |
|
| Total assets | $ | 319 |
| | $ | 220 |
| | $ | 2,684 |
| | $ | 2,505 |
| | $ | 741 |
| | $ | 2,771 |
| $ | 1,295 |
| | $ | 319 |
| | $ | 2,452 |
| | $ | 2,684 |
| | $ | 609 |
| | $ | 741 |
|
| On-balance sheet liabilities | |
| | |
| | |
| | |
| | |
| | |
| |
| | |
| | |
| | |
| | |
| | |
|
| Short-term borrowings | $ | — |
| | $ | — |
| | $ | 1,073 |
| | $ | 2,859 |
| | $ | — |
| | $ | — |
| $ | — |
| | $ | — |
| | $ | 1,032 |
| | $ | 1,073 |
| | $ | — |
| | $ | — |
|
| Long-term debt | 155 |
| | 94 |
| | 17 |
| | — |
| | 646 |
| | 1,513 |
| 641 |
| | 155 |
| | 12 |
| | 17 |
| | 516 |
| | 646 |
|
| All other liabilities | — |
| | — |
| | — |
| | — |
| | 1 |
| | 82 |
| — |
| | — |
| | — |
| | — |
| | 1 |
| | 1 |
|
| Total liabilities | $ | 155 |
| | $ | 94 |
| | $ | 1,090 |
| | $ | 2,859 |
| | $ | 647 |
| | $ | 1,595 |
| $ | 641 |
| | $ | 155 |
| | $ | 1,044 |
| | $ | 1,090 |
| | $ | 517 |
| | $ | 647 |
|
| |
(1) | As a holder of these securities, the Corporation receives scheduled principal and interest payments. During 20132014 and 20122013, there were no OTTI losses recorded on those securities classified as AFS debt securities. |
| |
(2) | The retained senior and subordinate securities were valued using quoted market prices or observable market inputs (Level 2 of the fair value hierarchy). |
| |
(3) | The retained residual interests are carried at fair value which was derived using model valuations (Level 2 of the fair value hierarchy). |
| |
(4) | Total assets include loans the Corporation transferred with which the Corporation has continuing involvement, which may include servicing the loan. |
Resecuritization Trusts
The Corporation transfers existing securities, typically MBS, into resecuritization vehicles at the request of customers seeking securities with specific characteristics. The Corporation may also resecuritize securities within its investment portfolio for purposes of improving liquidity and capital, and managing credit or interest rate risk. Generally, there are no significant ongoing activities performed in a resecuritization trust and no single investor has the unilateral ability to liquidate the trust.
The Corporation resecuritized $22.214.4 billion and $26.5 billion of securities in 20132014 and $37.4 billion2013. Resecuritizations in 20122014. All included $1.5 billion of theAFS securities, and gains on sale of $71 million were recorded. Other securities transferred into resecuritization vehicles during 20132014 and 20122013 were classified as trading account assets. As such, changes in fair value were recorded in trading account profits prior to the resecuritization and no gain or loss on sale was recorded.
Municipal Bond Trusts
The Corporation administers municipal bond trusts that hold highly-rated, long-term, fixed-rate municipal bonds. The trusts obtain financing by issuing floating-rate trust certificates that reprice on
a weekly or other short-term basis to third-party investors. The Corporation may transfer assets into the trusts and may also serve as remarketing agent and/or liquidity provider for the trusts. The floating-rate investors have the right to tender the certificates at specified dates. Should the Corporation be unable to remarket the tendered certificates, it may be obligated to purchase them at par under standby liquidity facilities. The Corporation also provides credit enhancement to investors in certain municipal bond trusts whereby the Corporation guarantees the payment of interest and principal on floating-rate certificates issued by these trusts in the event of default by the issuer of the underlying municipal bond.
During 2013 and 2012, the Corporation was the transferor of assets into unconsolidated municipal bond trusts and received cash proceeds from new securitizations of $188 million and $879 million. The securities transferred into municipal bond trusts during 2013 and 2012 were primarily classified as trading account assets. As such, changes in fair value were recorded in trading account profits prior to the transfer and no gain or loss on sale was recorded.
|
| | |
| | | Bank of America 20132014 205196 |
The Corporation’s liquidity commitments to unconsolidated municipal bond trusts, including those for which the Corporation was transferor, totaled $2.1 billion and $2.8 billionat both December 31, 20132014 and 20122013. The weighted-average remaining life of bonds held in the trusts at December 31, 20132014 was 8.27.2 years. There were no material write-downs or downgrades of assets or issuers during 20132014 and 20122013.
Automobile and Other Securitization Trusts
The Corporation transfers automobile and other loans into securitization trusts, typically to improve liquidity or manage credit risk. DuringAt 2012December 31, 2014 and 2013, the Corporation transferred automobile loans into an unconsolidated automobile trust, receiving cash proceedsserviced
of $2.4 billion and recording a loss on sale of $7 million. At December 31, 2013 and 2012, the Corporation serviced assets or otherwise had continuing involvement with automobile and other securitization trusts with outstanding balances of $2.51.9 billion and $4.72.5 billion, including trusts collateralized by automobile loans of $877400 million and $3.5 billion877 million, student loans of $741609 million and $897741 million, and other loans of $911876 million and $290911 million.
Other Variable Interest Entities
The table below summarizes select information related to other VIEs in which the Corporation held a variable interest at December 31, 20132014 and 20122013.
| | | | | | | | | | | | | | | | | | | | | | | | | |
| Other VIEs | Other VIEs | | | | | | | | | Other VIEs | | | | | | | | |
| | | | | | | | | | | | | | | | | | | | | | | |
| | December 31 | December 31 |
| | 2013 | | 2012 | 2014 | | 2013 |
| (Dollars in millions) | Consolidated | | Unconsolidated | | Total | | Consolidated | | Unconsolidated | | Total | Consolidated | | Unconsolidated | | Total | | Consolidated | | Unconsolidated | | Total |
| Maximum loss exposure | $ | 9,716 |
| | $ | 12,523 |
| | $ | 22,239 |
| | $ | 10,803 |
| | $ | 9,269 |
| | $ | 20,072 |
| $ | 7,981 |
| | $ | 12,391 |
| | $ | 20,372 |
| | $ | 9,716 |
| | $ | 12,523 |
| | $ | 22,239 |
|
| On-balance sheet assets | |
| | |
| | |
| | |
| | |
| | |
| |
| | |
| | |
| | |
| | |
| | |
|
| Trading account assets | $ | 3,769 |
| | $ | 1,420 |
| | $ | 5,189 |
| | $ | 5,181 |
| | $ | 356 |
| | $ | 5,537 |
| $ | 1,575 |
| | $ | 355 |
| | $ | 1,930 |
| | $ | 3,769 |
| | $ | 1,420 |
| | $ | 5,189 |
|
| Derivative assets | 3 |
| | 739 |
| | 742 |
| | 10 |
| | 1,277 |
| | 1,287 |
| 5 |
| | 284 |
| | 289 |
| | 3 |
| | 739 |
| | 742 |
|
| Debt securities carried at fair value | — |
| | 1,944 |
| | 1,944 |
| | — |
| | 39 |
| | 39 |
| — |
| | 483 |
| | 483 |
| | — |
| | 1,944 |
| | 1,944 |
|
| Loans and leases | 4,609 |
| | 270 |
| | 4,879 |
| | 5,084 |
| | 67 |
| | 5,151 |
| 4,020 |
| | 2,693 |
| | 6,713 |
| | 4,609 |
| | 270 |
| | 4,879 |
|
| Allowance for loan and lease losses | (6 | ) | | — |
| | (6 | ) | | (14 | ) | | — |
| | (14 | ) | (6 | ) | | — |
| | (6 | ) | | (6 | ) | | — |
| | (6 | ) |
| Loans held-for-sale | 998 |
| | 85 |
| | 1,083 |
| | 1,055 |
| | 157 |
| | 1,212 |
| 1,267 |
| | 814 |
| | 2,081 |
| | 998 |
| | 85 |
| | 1,083 |
|
| All other assets | 1,734 |
| | 6,167 |
| | 7,901 |
| | 1,764 |
| | 5,844 |
| | 7,608 |
| 1,641 |
| | 6,374 |
| | 8,015 |
| | 1,734 |
| | 6,167 |
| | 7,901 |
|
| Total | $ | 11,107 |
| | $ | 10,625 |
| | $ | 21,732 |
| | $ | 13,080 |
| | $ | 7,740 |
| | $ | 20,820 |
| $ | 8,502 |
| | $ | 11,003 |
| | $ | 19,505 |
| | $ | 11,107 |
| | $ | 10,625 |
| | $ | 21,732 |
|
| On-balance sheet liabilities | |
| | |
| | |
| | |
| | |
| | |
| |
| | |
| | |
| | |
| | |
| | |
|
| Short-term borrowings | $ | 77 |
| | $ | — |
| | $ | 77 |
| | $ | 131 |
| | $ | — |
| | $ | 131 |
| $ | — |
| | $ | — |
| | $ | — |
| | $ | 77 |
| | $ | — |
| | $ | 77 |
|
Long-term debt (1) | 4,487 |
| | — |
| | 4,487 |
| | 6,874 |
| | — |
| | 6,874 |
| 1,834 |
| | — |
| | 1,834 |
| | 4,487 |
| | — |
| | 4,487 |
|
| All other liabilities | 93 |
| | 2,538 |
| | 2,631 |
| | 92 |
| | 2,092 |
| | 2,184 |
| 105 |
| | 2,643 |
| | 2,748 |
| | 93 |
| | 2,538 |
| | 2,631 |
|
| Total | $ | 4,657 |
| | $ | 2,538 |
| | $ | 7,195 |
| | $ | 7,097 |
| | $ | 2,092 |
| | $ | 9,189 |
| $ | 1,939 |
| | $ | 2,643 |
| | $ | 4,582 |
| | $ | 4,657 |
| | $ | 2,538 |
| | $ | 7,195 |
|
| Total assets of VIEs | $ | 11,107 |
| | $ | 38,505 |
| | $ | 49,612 |
| | $ | 13,080 |
| | $ | 39,700 |
| | $ | 52,780 |
| $ | 8,502 |
| | $ | 41,467 |
| | $ | 49,969 |
| | $ | 11,107 |
| | $ | 38,505 |
| | $ | 49,612 |
|
| |
(1) | Includes $1.3584 million, $0 and $780 million of long-term debt at December 31, 2014 and $1.2 billion, $1.21.3 billion and $780 million of long-term debt at December 31, 2013 and $2.8 billion, $1.2 billion and $780 million of long-term debt at December 31, 2012issued by consolidated CDOcustomer vehicles, customerCDO vehicles and investment vehicles, respectively, which has recourse to the general credit of the Corporation. |
Customer Vehicles
Customer vehicles include credit-linked, equity-linked and commodity-linked note vehicles, repackaging vehicles, and asset acquisition vehicles, which are typically created on behalf of customers who wish to obtain market or credit exposure to a specific company, index, commodity price or financial instrument. The Corporation may transfer assets to and invest in securities issued by these vehicles. The Corporation typically enters into credit, equity, interest rate, commodity or foreign currency derivatives to synthetically create or alter the investment profile of the issued securities.
The Corporation’s maximum loss exposure to consolidated and unconsolidated customer vehicles totaled $5.9$4.7 billion and $4.4$5.9 billion at December 31, 20132014 and 20122013, including the notional amount of derivatives to which the Corporation is a counterparty, net of losses previously recorded, and the Corporation’s investment, if any, in securities issued by the vehicles. The maximum loss exposure has not been reduced to reflect the benefit of offsetting swaps with the customers or collateral arrangements. The Corporation also had liquidity commitments, including written
put options and collateral value guarantees, with certain unconsolidated vehicles of $748658 million and $742748 million at December 31, 20132014 and 20122013, that are included in the table above.
Collateralized Debt Obligation Vehicles
The Corporation receives fees for structuring CDO vehicles, which hold diversified pools of fixed-income securities, typically corporate debt or ABS, which they fund by issuing multiple tranches of debt and equity securities. Synthetic CDOs enter into a portfolio of CDS to synthetically create exposure to fixed-income securities. CLOs, which are a subset of CDOs, hold pools of loans, typically corporate loans or commercial mortgages.loans. CDOs are typically managed by third-party portfolio managers. The Corporation typically transfers assets to these CDOs, holds securities issued by the CDOs and may be a derivative counterparty to the CDOs, including a CDS counterparty for synthetic CDOs. The Corporation has also entered into total return swaps with certain CDOs whereby the Corporation absorbs the economic returns generated by specified assets held by the CDO.
|
| | |
206197 Bank of America 20132014
| | |
The Corporation’s maximum loss exposure to consolidated and unconsolidated CDOs totaled $2.1 billion$780 million and $3.6$2.1 billion at December 31, 20132014 and 20122013. This exposure is calculated on a gross basis and does not reflect any benefit from insurance purchased from third parties.
At December 31, 20132014, the Corporation had $1.31.2 billion of aggregate liquidity exposure, included in the Other VIEs table net of previously recorded losses, to unconsolidated CDOs which hold senior CDO debt securities or other debt securities on the Corporation’s behalf. For additional information, see Note 12 – Commitments and Contingencies.
Investment Vehicles
The Corporation sponsors, invests in or provides financing, which may be in connection with the sale of assets, to a variety of investment vehicles that hold loans, real estate, debt securities or other financial instruments and are designed to provide the desired investment profile to investors or the Corporation. At December 31, 20132014 and 20122013, the Corporation’s consolidated investment vehicles had total assets of $1.21.1 billion and $1.31.2 billion. The Corporation also held investments in unconsolidated vehicles with total assets of $5.511.2 billion and $3.05.5 billion at December 31, 20132014 and 20122013. The Corporation’s maximum loss exposure associated with both consolidated and unconsolidated investment vehicles totaled $4.25.1 billion and $2.14.2 billion at December 31, 20132014 and 20122013 comprised primarily of on-balance sheet assets less non-recourse liabilities.
During 2013, theThe Corporation transferred servicing advance receivables to independent third parties in connection with the sale of MSRs. Portions of the receivables were transferred into unconsolidated securitization trusts. The Corporation retained senior interests in such receivables with a maximum loss exposure and funding obligation of $2.5660 million and $2.5 billion,, including a funded balance of $1.9431 million and $1.9 billion at December 31, 2014 and 2013, which waswere classified in other debt securities carried at fair value.
Leveraged Lease Trusts
The Corporation’s net investment in consolidated leveraged lease trusts totaled $3.83.3 billion and $4.43.8 billion at December 31, 20132014 and 20122013. The trusts hold long-lived equipment such as rail cars, power generation and distribution equipment, and commercial aircraft. The Corporation structures the trusts and holds a significant residual interest. The net investment represents the Corporation’s maximum loss exposure to the trusts in the unlikely event that the leveraged lease investments become worthless. Debt issued by the leveraged lease trusts is non-recourse to the Corporation.
Real Estate Vehicles
The Corporation held investments in unconsolidated real estate vehicles of $5.86.2 billion and $5.4$5.8 billion at December 31, 20132014 and 20122013, which primarily consisted of investments in unconsolidated limited partnerships that finance the construction and rehabilitation of affordable rental housing and commercial real estate. An unrelated third party is typically the general partner and has control over the significant activities of the partnership. The Corporation earns a return primarily through the receipt of tax credits allocated to the real estate projects. The Corporation’s risk of loss is mitigated by policies requiring that the project qualify for the expected tax credits prior to making its investment. The
Corporation may from time to time be asked to invest additional
amounts to support a troubled project. Such additional investments have not been and are not expected to be significant.
Other Asset-backed Financing Arrangements
The Corporation transferred pools of securitiesfinancial assets to certain independent third parties and provided financing for up to 75 percent of the purchase price under asset-backed financing arrangements. At December 31, 20132014 and 20122013, the Corporation’s maximum loss exposure under these financing arrangements was $1.1 billion77 million and $2.51.1 billion, substantially all of which is classified in loans and leases. All principal and interest payments have been received when due in accordance with their contractual terms. These arrangements are not included in the Other VIEs table because the purchasers are not VIEs.
NOTE 7 Representations and Warranties Obligations and Corporate Guarantees
Background
The Corporation securitizes first-lien residential mortgage loans generally in the form of MBSRMBS guaranteed by the GSEs or by GNMA in the case of FHA-insured, VA-guaranteed and Rural Housing Service-guaranteed mortgage loans, and sells pools of first-lien residential mortgage loans in the form of whole loans. In addition, in prior years, legacy companies and certain subsidiaries sold pools of first-lien residential mortgage loans and home equity loans as private-label securitizations (in certain of these securitizations, monolinesmonoline insurers or other financial guarantee providers insured all or some of the securities) or in the form of whole loans. In connection with these transactions, the Corporation or certain of its subsidiaries or legacy companies make or have made various representations and warranties. These representations and warranties, as set forth in the agreements, related to, among other things, the ownership of the loan, the validity of the lien securing the loan, the absence of delinquent taxes or liens against the property securing the loan, the process used to select the loan for inclusion in a transaction, the loan’s compliance with any applicable loan criteria, including underwriting standards, and the loan’s compliance with applicable federal, state and local laws. Breaches of these representations and warranties have resulted in and may continue to result in the requirement to repurchase mortgage loans or to otherwise make whole or provide other remedies to the GSEs, HUDU.S. Department of Housing and Urban Development (HUD) with respect to FHA-insured loans, VA, whole-loan investors, securitization trusts, monoline insurers or other financial guarantors (collectively, repurchases). In all such cases, subsequent to repurchasing the loan, the Corporation would be exposed to any credit loss on the repurchased mortgage loans after accounting for any mortgage insurance (MI) or mortgage guarantee payments that it may receive.
Subject to the requirements and limitations of the applicable sales and securitization agreements, these representations and warranties can be enforced by the GSEs, HUD, VA, the whole-loan investor, the securitization trustee or others as governed by the applicable agreement or, in certain first-lien and home equity securitizations where monoline insurers or other financial guarantee providers have insured all or some of the securities issued, by the monoline insurer or other financial guarantor, where the contract so provides. In the case of private-label securitizations, the applicable agreements may permit investors,
which may include the GSEs, with contractually sufficient holdings to direct or influence action by the securitization trustee. In the case of loans sold to parties other than the GSEs or GNMA, the Corporation believes the contractual liability to repurchase typically arises only if there is a
breach of the representations and warranties that materially and adversely affects the interest of the investor, or investors, or of the monoline insurer or other financial guarantor (as applicable) in the loan. Contracts with the GSEs do not contain equivalent language. GenerallyCurrently, the volume of unresolved repurchase claims from the FHA and VA for loans in GNMA-guaranteed securities is not significant because the requests are limited in number andclaims are typically resolved promptly. The Corporation believes that the longer a loan performs prior to default, the less likely it is that an alleged underwriting breach of representations and warranties would have a material impact on the loan’s performance.
The estimate of the liability for representations and warranties exposures and the corresponding estimated range of possible loss is based upon currently available information, significant judgment, and a number of factors and assumptions, including those discussed in Liability for Representations and Warranties and Corporate Guarantees in this Note, that are subject to change. Changes to any one of these factors could significantly impact the estimate of the liability and could have a material adverse impact on the Corporation’s results of operations for any particular period. Given that these factors vary by counterparty, the Corporation analyzes representations and warranties obligations based on the specific counterparty, or type of counterparty, with whom the sale was made.
Settlement Actions
The Corporation has vigorously contested any request for repurchase when it concludes that a valid basis for repurchase does not exist and will continue to do so in the future. However, in an effort to resolve these legacy mortgage-related issues, the Corporation has reached bulk settlements, or agreements for bulkincluding various settlements with the GSEs, including settlement amounts which have been significant, with counterparties in lieu of a loan-by-loan review process. The Corporation may reach other settlements in the future if opportunities arise on terms it believes to be advantageous. However, there can be no assurance that the Corporation will reach future settlements or, if it does, that the terms of past settlements can be relied upon to predict the terms of future settlements. These bulk settlements generally did not cover all transactions with the relevant counterparties or all potential claims that may arise, including in some instances securities law, fraud and servicing claims. The Corporation’s liability in connection with the transactions and claims not covered by these settlements could be material to the Corporation’s results of operations or cash flows for any particular reporting period. The following provides a summary of the larger bulk settlement actions during the past few years.
FHFA Settlement
On March 25, 2014, the Corporation entered into a settlement with the Federal Housing Finance Agency (FHFA) as conservator of FNMA and Freddie Mac (FHLMC) to resolve (1) all outstanding RMBS litigation between FHFA, FNMA and FHLMC, and the Corporation and its affiliates, and (2) other legacy contract claims related to representations and warranties (collectively, the FHFA Settlement). In connection with the FHFA Settlement, on April 1, 2014, the Corporation paid FNMA and FHLMC, collectively $9.5
billion and received from them RMBS with a fair market value of approximately $3.2 billion, for a net cost of $6.3 billion.
Freddie Mac Settlement
On November 27, 2013, the Corporation entered into an agreement with Freddie Mac (FHLMC)FHLMC under which the Corporation paid FHLMC a total of $404$391 million (less credits of $13 million) to resolve all outstanding and potential mortgage repurchase and make-whole claims arising out of any alleged breach of selling representations and warranties related to loans that had been sold directly to FHLMC by entities related to Bank of America, N.A. from January 1, 2000 to December 31, 2009, subject to certain exceptions which the Corporation does not expect to be material, and to compensate FHLMC for certain past losses and potential future losses relating to denials, rescissions and cancellations of mortgage insurance.
In 2010, the Corporation had entered into an agreement with FHLMC to resolve all outstanding and potential representations and warranties claims related to loans sold by Countrywide to FHLMC through 2008.
With these agreements, combined with prior settlements with Fannie Mae (FNMA), the Corporation has resolved substantially all outstanding and potential representations and warranties claims on whole loans sold by legacy Bank of America and Countrywide to FNMA and FHLMC through 2008 and 2009, respectively, subject
to certain exceptions which the Corporation does not believe are material. For further discussion of the settlements with the GSEs, see Fannie Mae Settlement and Government-sponsored Enterprises Experience in this Note.MI.
Fannie Mae Settlement
On January 6, 2013, the Corporation entered into an agreement with FNMA to resolve substantially all outstanding and potential repurchase and certain other claims relatingrelated to the origination, sale and delivery of residential mortgage loans originated from January 1, 2000 through December 31, 2008 and sold directly to FNMA by entities related to Countrywide and BANA.
This agreement covers loans with an aggregate original principal balance of approximately $1.4 trillion and an aggregate outstanding principal balance of approximately $300 billion. Unresolved repurchase claims submitted by FNMA for alleged breaches of selling representations and warranties with respect to these loans totaled $12.2 billion of unpaid principal balance at December 31, 2012. This agreement extinguished substantially all of those unresolved repurchase claims, as well as any future representations and warranties repurchase claims associated with such loans, subject to certain exceptions which the Corporation does not expect to be material.
In January 2013, the Corporation made a cash payment to FNMA of $3.6 billion and also repurchased for $6.6 billion certain residential mortgage loans that had previously been sold to FNMA, which the Corporation has valued at less than the purchase price.
This agreement also clarified the parties’ obligations with respect to MI including establishing timeframes for certain payments and other actions, setting parameters for potential bulk settlements and providing for cooperation in future dealings with mortgage insurers. For additional information, see Open Mortgage Insurance Rescission Notices in this Note.
In addition, pursuant to a separate agreement, the Corporation settled substantially all of FNMA’s outstanding and future claims for compensatory fees arising out of foreclosure delays through December 31, 2012.
Collectively, these agreements are referred to herein as the FNMA Settlement.
Monoline Settlements
FGIC Settlement
On April 7, 2014, the Corporation entered into a settlement with Financial Guaranty Insurance Company (FGIC) for certain second-lien RMBS trusts for which FGIC provided financial guarantee insurance. In addition, on April 11, 2014, separate settlements were entered into with the Bank of New York Mellon (BNY Mellon) as trustee with respect to seven of those trusts; settlements on two additional trusts with BNY Mellon as trustee were entered into on May 15, 2014 and May 28, 2014. The agreements resolved
all outstanding litigation between FGIC and the Corporation, as well as outstanding and potential claims by FGIC and the trustee related to alleged representations and warranties breaches and other claims involving certain second-lien RMBS trusts for which FGIC provided financial guarantee insurance. The Corporation was fully reserved at December 31, 2012 formade payments totaling $950 million under the FNMA Settlement.
Monoline SettlementsFGIC and trust settlements.
MBIA Settlement
On May 7, 2013, the Corporation entered into a comprehensive settlement with MBIA Inc. and certain of its affiliates (the MBIA Settlement) which resolved all outstanding litigation between the parties, as well as other claims between the parties, including outstanding and potential claims from MBIA related to alleged representations and warranties breaches and other claims involving certain first- and second-lien RMBS trusts for which MBIA provided financial guarantee insurance, certain of which claims were the subject of litigation. At the time of the settlement, the mortgages (first- and second-lien) in RMBS trusts covered by the MBIA Settlement had an original principal balance of $54.8 billion and an unpaid principal balance of $19.1 billion.
Under the MBIA Settlement, all pending litigation between the parties was dismissed and each party received a global release of those claims. The Corporation made a settlement payment to MBIA of $1.6 billion in cash and transferred to MBIA approximately $95 million in fair market value of notes issued by MBIA and previously held by the Corporation. In addition, MBIA issued to the
Corporation warrants to purchase up to approximately 4.9 percent of MBIA’s currently outstanding common stock, at an exercise price of $9.59 per share, which may be exercised at any time prior to May 2018. In addition, the Corporation provided a senior secured $500 million credit facility to an affiliate of MBIA, which has since been closed.repaid and terminated.
The parties also terminated various CDS transactions entered into between the Corporation and aan MBIA-affiliate, LaCrosse Financial Products, LLC, and guaranteed by MBIA, which constituted all of the outstanding CDS protection agreements purchased by the Corporation from MBIA on commercial mortgage-backed securities (CMBS).securities. Collectively, those CDS transactions had a notional amount of $7.4 billion and a fair value of $813 million as of March 31, 2013. The parties also terminated certain other trades in order to close out positions between the parties. The termination of these trades did not have a material impact on the Corporation’s financial statements.
Syncora Settlement
On July 17, 2012, the Corporation entered into a settlement with a monoline insurer, Syncora Guarantee Inc. and Syncora Holdings, Ltd. (Syncora), to resolve all of Syncora’s outstanding and potential claims related to alleged representations and warranties breaches involving eight first- and six second-lien private-label securitization trusts where it provided financial guarantee insurance. The settlement coverscovered private-label securitization trusts that had an original principal balance of first-lien mortgages of approximately $9.6 billion and second-lien mortgages of approximately $7.7 billion. The settlement provided for a cash payment of $375 million to Syncora and other transactions to terminate certain other relationships among the parties.
Assured Guaranty Settlement
On April 14, 2011, the Corporation, including its Countrywide affiliates, entered into a settlement with Assured Guaranty to resolve all of Assured Guaranty’s outstanding and potential repurchase claims related to alleged representations and warranties breaches involving 21 first- and eight second-lien RMBS trusts where Assured Guaranty provided financial guarantee insurance. The settlement resolves historical loan servicing issues and other potential liabilities with respect to those trusts. The settlement covers RMBS trusts that had an original principal balance of approximately $35.8 billion and total unpaid principal balance of approximately $20.2 billion as of April 14, 2011. The settlement provided for cash payments totaling approximately $1.1 billion to Assured Guaranty, a loss-sharing reinsurance arrangement with an expected value of approximately $470 million at the time of the settlement and other terms, including termination of certain derivative contracts.
Settlement with the Bank of New York Mellon, as Trustee
On June 28, 2011, the Corporation, BAC Home Loans Servicing, LP (BAC HLS, which was subsequently merged with and into BANA in July 2011), and its Countrywide affiliates entered into a settlement agreement with Bank of New YorkBNY Mellon (BNY Mellon) as trustee (the Trustee), to resolve all outstanding and potential claims related to alleged representations and warranties breaches (including repurchase claims), substantially all historical loan servicing claims and certain other historical claims with respect to 525 Countrywide first-lien and five second-lien non-GSE residential mortgage-backed securitization trusts (the Covered
Trusts) containing loans principally originated between 2004 and 2008 for which BNY Mellon acts as trustee or indenture trustee (BNY Mellon Settlement). The Covered Trusts had an original principal balance of approximately $424 billion, of which $409 billion was originated between 2004 and 2008, and total outstanding principal and unpaid principal balance of loans that had defaulted (collectively, unpaid principal balance) of approximately $220 billion at June 28, 2011, of which $217 billion was originated between 2004 and 2008. The BNY Mellon Settlement is supported by a group of 22 institutional investors (the Investor Group) and is subject to final court approval and certain other conditions.
The BNY Mellon Settlement provides for a cash payment of $8.5 billion (the Settlement Payment) to the Trustee for distribution to the Covered Trusts after final court approval of the BNY Mellon Settlement. In addition to the Settlement Payment, the Corporation is obligated to pay attorneys’ fees and costs to the Investor Group’s counsel as well as all fees and expenses incurred by the Trustee related to obtaining final court approval of the BNY Mellon Settlement and certain tax rulings.
The BNY Mellon Settlement does not cover a small number of Countrywide-issued first-lien non-GSE RMBS transactions with loans originated principally between 2004 and 2008 for various reasons, including for example, six Countrywide-issued first-lien non-GSE RMBS transactions in which BNY Mellon is not the trustee. The BNY Mellon Settlement also does not cover Countrywide-issued second-lien securitization transactions in which a monoline insurer or other financial guarantor provides financial guaranty insurance. In addition, because the settlement is with the Trustee on behalf of the Covered Trusts and releases rights under the governing agreements for the Covered Trusts, the settlement does not release investors’ securities law or fraud claims based upon disclosures made in connection with their decision to purchase, sell or hold securities issued by the Covered Trusts. To date, various investors are pursuing securities law or fraud claims related to one or more of the Covered Trusts. The Corporation is not able to determine whether any additional securities law or fraud claims will be made by investors in the Covered Trusts. For information about mortgage-related securities law or fraud claims, see Litigation and Regulatory Matters in Note 12 – Commitments and Contingencies. For those Covered Trusts where a monoline insurer or other financial guarantor has an independent right to assert repurchase claims directly, the BNY Mellon Settlement does not release such insurer’s or guarantor’s repurchase claims.
Under an order entered by the court in connection with the BNY Mellon Settlement, potentially interested persons had the opportunity to give notice of intent to object to the settlement (including on the basis that more information was needed) until August 30, 2011. Approximately 44 groups or entities appeared prior to the deadline. Certain of these groups or entities filed notices of intent to object, made motions to intervene, or both. On May 3, 2013, pursuant to the court-ordered schedule for filing objections, 13 groups or entities filed five briefs formally objecting to the BNY Mellon Settlement. Several former intervenor-objectors either expressly withdrew from the proceeding or elected not to file an objection at the objection deadline, including the Attorneys General of New York and Delaware, the Federal Deposit Insurance Corporation (FDIC) and the Federal Housing Finance Agency (FHFA). After additional withdrawals, 11 objectors remained in the proceeding at the conclusion of the court approval hearing.
|
| | |
| | | Bank of America 20132014 209200 |
The BNY Mellon Settlement remains subject to final court approval and certain other conditions. It is not currently possible to predict the ultimate outcome or timing of the court approval process, which can include appeals and could take a substantial period of time. The court approval hearing began in the New York Supreme Court, New York County, on June 3, 2013 and concluded on November 21, 2013. On January 31, 2014, the court issued a decision, order and judgment approving the BNY Mellon Settlement. The court overruled the objections to the settlement, holding that the Trustee, BNY Mellon, acted in good faith, within its discretion and within the bounds of reasonableness in determining that the settlement agreement was in the best interests of the covered trusts. The court declined to approve the Trustee’s conduct only with respect to the Trustee’s consideration of a potential claim that a loan must be repurchased if the servicer modifies its terms. On February 4, 2014, one of the objectors filed a motion to stay entry of judgment and to hold additional proceedings in the trial court on issues it alleged had not been litigated or decided by the court in its January 31, 2014 decision, order and judgment. On February 18, 2014, the same objector also filed a motion for reargument of the trial court’s January 31, 2014 decision. The court held a hearing on the motion to stay on February 19, 2014, and rejected the application for stay and for further proceedings in the trial court. The court also ruled it would not hold oral argument on the objector’s motion for reargument before April 2014. On February 21, 2014, final judgment was entered and the Trustee filed a notice of appeal regarding the court’s ruling on loan modification claims in the settlement. Certain objectors to the settlement filed cross-appeals appealing the court’s approval of the settlement, some of whom subsequently withdrew their objections. All appeals were fully briefed by September 22, 2014, and oral argument was held on October 23, 2014. The court’s January 31, 2014 decision, order and judgment remain subject to appeal and the motion to reargue,these appeals and it is not possible at this time to predict the timetable for appeals or when the court approval process will be completed.
Although the Corporation is not a party to the proceeding, certain of its rights and obligations under the settlement agreement are conditioned on final court approval of the settlement. There can be no assurance final court approval will be obtained, that all conditions to the BNY Mellon Settlement will be satisfied, or if certain conditions to the BNY Mellon Settlement permitting withdrawal are met, that the Corporation and Countrywide will not withdraw from the settlement.
If final court approval is not obtained by December 31, 2015, the Corporation and Countrywide may withdraw from the BNY Mellon Settlement, if the Trustee consents. The BNY Mellon Settlement also provides that if Covered Trusts holding loans with an unpaid principal balance exceeding a specified amount are excluded from the final BNY Mellon Settlement, based on investor objections or otherwise, the Corporation and Countrywide have the option to withdraw from the BNY Mellon Settlement pursuant to the terms of the BNY Mellon Settlement agreement.
There can be no assurance that final court approval of the settlement will be obtained, that all conditions to the BNY Mellon Settlement will be satisfied or, if certain conditions to the BNY Mellon Settlement permitting withdrawal are met, that the Corporation and Countrywide will not withdraw from the settlement. If final court approval is not obtained or if the Corporation and Countrywide withdraw from the BNY Mellon Settlement in accordance with its terms, the Corporation’s future representations and warranties losses could be substantially different from existing accruals and the estimated range of possible loss over existing accruals described under Private-label Securitizations and Whole-loan Sales and Private-label Securitizations Experience in this Note.
Unresolved Repurchase Claims
Unresolved representations and warranties repurchase claims represent the notional amount of repurchase claims made by counterparties, typically the outstanding principal balance or the unpaid principal balance at the time of default. In the case of first-lien mortgages, the claim amount is often significantly greater than the expected loss amount due to the benefit of collateral and, in
some cases, MI or mortgage guarantee payments. Claims received from a counterparty remain outstanding until the underlying loan is repurchased, the claim is rescinded by the counterparty or the claim is otherwise resolved.representations and warranties claims with respect to the applicable trust are settled, and fully and finally released. When a claim is denied and the Corporation does not receive a response from the counterparty, the claim remains in the unresolved repurchase claims balance until resolution. Certain of the claims the Corporation receives are duplicate claims which represent more than one claim outstanding related to a particular loan,
typically as the result of bulk claims submitted without individual file reviews.
The table below presents unresolved repurchase claims at December 31, 20132014 and 20122013. The unresolved repurchase claims include only claims where the Corporation believes that the counterparty has the contractual right to submit claims. For additional information, see Private-label Securitizations and Whole-loan Sales and Private-label Securitizations Experience in this Note and Note 12 – Commitments and Contingencies. These repurchase claims do not include any repurchase claims related to the BNY Mellon Settlement regarding the Covered Trusts.
| | | | | | | | | |
Unresolved Repurchase Claims by Counterparty and Product Type (1, 2) | |
| Unresolved Repurchase Claims by Counterparty and Product Type | | Unresolved Repurchase Claims by Counterparty and Product Type |
| | | | | | | |
| | December 31 | December 31 |
| (Dollars in millions) | 2013 | | 2012 | 2014 | | 2013 |
| By counterparty | |
| | |
| |
| | |
|
Private-label securitization trustees, whole-loan investors, including third-party securitization sponsors and other (3) | $ | 17,953 |
| | $ | 12,222 |
| |
Private-label securitization trustees, whole-loan investors, including third-party securitization sponsors and other (1, 2) | | $ | 24,489 |
| | $ | 17,953 |
|
Monolines | 1,532 |
| | 2,442 |
| 1,087 |
| | 1,532 |
|
| GSEs | 170 |
| | 13,437 |
| 59 |
| | 170 |
|
Total unresolved repurchase claims by counterparty (3) | $ | 19,655 |
| | $ | 28,101 |
| |
| Total gross claims | | 25,635 |
| | 19,655 |
|
Duplicate claims (4) | | (3,213 | ) | | (961 | ) |
Total unresolved repurchase claims by counterparty, net of duplicate claims (2) | | $ | 22,422 |
| | $ | 18,694 |
|
| By product type | |
| | |
| |
| | |
|
| Prime loans | $ | 623 |
| | $ | 8,724 |
| $ | 587 |
| | $ | 623 |
|
| Alt-A | 1,536 |
| | 5,422 |
| 2,397 |
| | 2,259 |
|
| Home equity | 1,889 |
| | 2,390 |
| 2,221 |
| | 1,905 |
|
| Pay option | 5,776 |
| | 5,877 |
| 6,294 |
| | 5,780 |
|
| Subprime | 7,502 |
| | 4,227 |
| 13,928 |
| | 8,928 |
|
| Other | 2,329 |
| | 1,461 |
| 208 |
| | 160 |
|
Total unresolved repurchase claims by product type (3) | $ | 19,655 |
| | $ | 28,101 |
| |
| Total | | 25,635 |
| | 19,655 |
|
Duplicate claims (4) | | (3,213 | ) | | (961 | ) |
Total unresolved repurchase claims by product type, net of duplicate claims (2) | | $ | 22,422 |
| | $ | 18,694 |
|
| |
(1) | The total notional amount of unresolved repurchase claims does not include any repurchase claims related to the trusts covered by the BNY Mellon Settlement. |
| |
(2) | AtIncludes December 31, 2013 and 2012, unresolved repurchase claims did not include repurchase demands of $1.214.1 billion and $1.613.8 billion where the Corporation believes the claimants have not satisfied the contractual thresholds as notedof claims based on pageindividual file reviews and 210$10.4 billion and $4.1 billion of claims submitted without individual file reviews at December 31, 2014 and 2013.
|
| |
(3) | IncludesAt $13.8 billionDecember 31, 2014, substantially all of the unresolved monoline claims pertain to second-lien loans and are currently the subject of litigation with a single monoline insurer.
|
| |
(4) | Represents more than one and $11.7 billionclaim outstanding related to a particular loan, typically as the result of claims based on individual file reviews and $4.1 billion and $519 million ofbulk claims submitted without individual file reviews atreviews. The December 31, 2013 and 20122014. amount includes approximately $2.9 billion of duplicate claims related to private-label investors submitted without individual loan file reviews. |
The notional amount of unresolved repurchase claims from private-label securitization trustees, whole-loan investors, including third-party securitization sponsors, and others totaled $18.0 billion at December 31, 2013 compared to $12.2 billion at December 31, 2012, including $13.8 billion and $11.7 billion of claims based on individual file reviews and $4.1 billion and $519 million of claims submitted without individual file reviews. The increase in the notional amount of unresolved repurchase claims during 2013 is primarily due to continued submission of claims by private-label securitization trustees; the level of detail, support and analysis accompanying such claims, which impacts overall claim quality and, therefore, claims resolution; and the lack of an established process to resolve disputes related to these claims. For example, claims submitted without individual file reviews lack the level of detail and analysis of individual loans found in other claims that is necessary for the Corporation to respond to the claim. The Corporation expects unresolved repurchase claims related to private-label securitizations to increase as claims continue to be submitted by private-label securitization trustees
and there is not an established process for the ultimate resolution of claims on which there is a disagreement. For further discussion of the Corporation’s experience with whole loans and private-label securitizations, see Whole-loan Sales and Private-label Securitizations Experience in this Note.
The notional amount of unresolved monoline repurchase claims totaled $1.5 billion at December 31, 2013 compared to $2.4 billion at December 31, 2012. As a result of the MBIA Settlement, $945 million of monoline repurchase claims outstanding at December 31, 2012 were resolved in May 2013. Substantially all of the unresolved monoline claims pertain to second-lien loans and are currently the subject of litigation. As a result, the Corporation has had limited loan-level repurchase claims experience with the remaining monoline insurers. In the Corporation’s experience, the monolines have been generally unwilling to withdraw repurchase claims, regardless of whether and what evidence was offered to refute a claim. For further discussion of the Corporation’s practices regarding litigation accruals and estimated range of possible loss for litigation and regulatory matters, which includes the status of its monoline litigation, see Estimated Range of Possible Loss in this Note and Litigation and Regulatory Matters in Note 12 – Commitments and Contingencies.
The notional amount of unresolved GSE repurchase claims totaled $170 million at December 31, 2013 compared to $13.4 billion at December 31, 2012. As of December 31, 2013, the Corporation has resolved substantially all GSE-related claims due primarily to the settlements with FHLMC and FNMA. As a result of the FNMA Settlement, $12.2 billion of GSE repurchase claims outstanding at December 31, 2012 were resolved in January 2013. As a result of the FHLMC Settlement, $646 million of claims were resolved at the time of the settlement, of which $322 million were outstanding at December 31, 2012. For further discussion of the Corporation’s experience with the GSEs, see Government-sponsored Enterprises Experience in this Note.
In addition to, and not included in, the total unresolved repurchase claims of $19.7 billion at December 31, 2013, the Corporation has received repurchase demands from private-label securitization investors and a master servicer where it believes the claimants have not satisfied the contractual thresholds to direct the securitization trustee to take action and/or that these demands are otherwise procedurally or substantively invalid. The total amount outstanding of such demands was $1.2 billion, comprised of $945 million of demands received during 2012 and $273 million of demands related to trusts covered by the BNY Mellon Settlement at December 31, 2013 compared to $1.6 billion at December 31, 2012. The Corporation does not believe that the $1.2 billion of demands outstanding at December 31, 2013 are valid repurchase claims and, therefore, it is not possible to predict the resolution with respect to such demands.
During 2013,2014, the Corporation received $8.47.6 billion in new repurchase claims, including $6.3 billion of claims submitted without individual loan file reviews and $6.3 billion730 million of claims based on individual loan file reviews submitted by private-label securitization trustees and a financial guarantee provider, $1.8
billion347 million submitted by the GSEs for both Countrywide and legacy Bank of America originations not covered by the bulk settlements with the GSEs, $222and $265 million submitted by whole-loan investors and $50 million submitted by monoline insurers.investors. During 20132014, $16.72.0 billion in claims were resolved, primarily with the GSEs and through the MBIA Settlement.resolved. Of the remaining claims thatresolved, $856 million were resolved $1.7 billionthrough settlement, $535 million were resolved through rescissions and $1.2 billion$594 million were resolved through mortgage repurchases and make-whole payments to GSEs, private-label securitization trusts and whole-loan investors.
The continued increase in the notional amount of unresolved repurchase claims during 2014 is primarily due to: (1) continued submission of claims by private-label securitization trustees, (2) the level of detail, support and analysis accompanying such claims, which impacts overall claim quality and, therefore, claims
resolution, (3) the lack of an established process to resolve disputes related to these claims, (4) the submission of claims where the Corporation believes the statute of limitations has expired under current law and (5) the submission of duplicate claims, often in multiple submissions, on the same loan. For example, claims submitted without individual file reviews generally lack the level of detail and analysis of individual loans found in other claims that is necessary to support a claim. Absent any settlements, the Corporation expects unresolved repurchase claims related to private-label securitizations to increase as such claims continue to be submitted and there is not an established process for the ultimate resolution of such claims on which there is a disagreement.
In addition to the unresolved repurchase claims in the Unresolved Repurchase Claims by Counterparty and Product Type table, the Corporation has received notifications pertaining to loans for which the Corporation has not received a repurchase request from sponsors of third-party securitizations with whom the Corporation engaged in whole-loan transactions and that the Corporation may owe indemnity obligations. These notifications totaled $2.0 billion and $737 million at December 31, 2014 and 2013.
The Corporation also from time to time receives correspondence purporting to raise representations and warranties breach issues from entities that do not have contractual standing or ability to bring such claims. The Corporation believes such communications to be procedurally and/or substantively invalid, and generally does not respond to such correspondence.
The presence of repurchase claims on a given trust, receipt of notices of indemnification obligations and other communication, as discussed above, are all factors that inform the Corporation’s estimated liability for obligations under representations and warranties and the corresponding estimated range of possible loss.
Legacy companies sold $184.5 billion of loans originated between 2004 and 2008 into monoline-insured securitizations. At December 31, 2014 and 2013, for loans originated between 2004 and 2008, the unpaid principal balance of loans related to unresolved monoline repurchase claims was $1.1 billion and $1.5 billion. Substantially all of the remaining unresolved monoline claims pertain to second-lien loans and are currently the subject of litigation with a single monoline insurer. There may be additional claims or file requests in the future.
As a result of various settlements with the GSEs.GSEs, the Corporation has resolved substantially all outstanding and potential representations and warranties repurchase claims on whole loans sold by legacy Bank of America and Countrywide to FNMA and FHLMC through June 30, 2012 and December 31, 2009, respectively. After these settlements, the Corporation’s exposure to representations and warranties liability for loans originated prior to 2009 and sold to the GSEs is limited to loans with an original principal balance of $18.3 billion and loans with certain defects excluded from the settlements that the Corporation does not believe will be material, such as certain specified violations of the GSEs’ charters, fraud and title defects. As of December 31, 2014, of the $18.3 billion, approximately $15.8 billion in principal has been paid and $956 million in principal has defaulted or was severely delinquent. The notional amount of unresolved repurchase claims submitted by the GSEs was $48 million related to these vintages.
Liability for Representations and Warranties and Corporate Guarantees
The liability for representations and warranties and corporate guarantees is included in accrued expenses and other liabilities on the Consolidated Balance Sheet and the related provision is included in mortgage banking income (loss) in the Consolidated Statement of Income. The liability for representations and warranties is established when those obligations are both probable and reasonably estimable.
The Corporation’s estimated liability at December 31, 20132014 for obligations under representations and warranties given to the GSEs and the corresponding estimated range of possible loss considers, and is necessarily dependent on, and limited by, a number of factors, including the Corporation’s experience related to actual defaults, projected future defaults, historical loss experience, estimated home prices and other economic conditions. The methodology also considers such factors as the number of payments made by the borrower prior to default as well as certain other assumptions and judgmental factors.
The Corporation’s estimate of the non-GSE representations and warranties liability and the corresponding estimated range of possible loss at December 31, 20132014 considers, among other things, implied repurchase experience based on the BNY Mellon Settlement, adjusted to reflect differences between the Covered Trusts and the remainder of the population of private-label securitizations, and assumes that the conditions to the BNY Mellon Settlement will be met. Since the non-GSE securitization trusts that were included in the BNY Mellon Settlement differ from those that were not included in the BNY Mellon Settlement, the Corporation adjusted the repurchase experience implied in the settlement in order to determine the estimated non-GSE representations and warranties liability and the corresponding estimated range of possible loss. The judgmental adjustments made include consideration of the differences in the mix of products in the subject securitizations, loan originator, likelihood of claims expected, the differences in the number of payments that the borrower has made prior to default and the sponsor of the securitizations. Where relevant, the Corporation also takes into account more recent experience, such as increased claim activity, notification of potential indemnification obligations, its experience with various counterparties, recent court decisions related to the statute of limitations as summarized below and other facts
and circumstances, such as bulk settlements, as the Corporation believes appropriate.
Additional factorsA factor that impactimpacts the non-GSE representations and warranties liability and the portion of the estimated range of possible loss corresponding to non-GSE representations and warranties exposures include: (1)is the likelihood that claims will be presented, which is impacted by a number of factors, including contractual material adverse effect requirements, (2) the representations and warranties provided, and (3) the requirement toprovisions that investors meet certain presentation thresholds. The first factor is based on the Corporation’s belief that a non-GSE contractual liability to repurchase a loan generally arises only if the counterparties prove there is a breach of representations and warranties that materially and adversely affects the interest of the investor or all investors, or of the monoline insurer or other financial guarantor (as applicable), in a securitization trust and, accordingly, the Corporation believes that the repurchase claimants must prove that the alleged representations and warranties breach was the cause of the loss. The second factor is based on the differences in the types of representations and warranties given in non-GSE securitizations from those provided to the GSEs. The Corporation believesthresholds under the non-GSE securitizations’ representations and warranties are less rigorous and actionable than the explicit provisions of comparable agreements with the GSEs without regard to any variations that may have arisen as a result of dealings with the GSEs. The third factor is related to certain presentation thresholds that need to be met in order for any repurchase claim to be asserted on the initiative of investors under the non-GSEsecuritization agreements. A securitization trustee may investigate or demand repurchase on its own action, and most agreements contain a presentation threshold, for example 25 percent of the voting rights per trust, that allows investors to declare a servicing event of default under certain circumstances or to request certain action, such as requesting loan files, that the trustee may choose to accept and follow, exempt from liability, provided the trustee is acting in good faith. If there is an uncured servicing event of default and the trustee fails to bring suit during a 60-day period, then, under most agreements, investors may file suit. In addition to this, most agreements also allow investors to direct the securitization trustee to
investigate loan files or demand the repurchase of loans if security holders hold a specified percentage, for example, 25 percent, of the voting rights of each tranche of the outstanding securities. AlthoughHowever, in certain circumstances the Corporation continuesbelieves that trustees have presented repurchase claims without requiring investors to believe that presentation thresholds are a factor in the determination of probable loss, given the BNY Mellon Settlement, the estimated range of possible loss assumes that the presentation threshold can be met for all of the non-GSE securitization transactions.meet contractual voting rights thresholds. The population of private-label securitizations included in the BNY Mellon Settlement encompasses almost all Countrywide first-lien
private-label securitizations including loans originated principally between 2004 and 2008. For the remainder of the population of private-label securitizations, other claimants have come forward on certain securitizations and the Corporation believes it is probable that other claimants in certain types of securitizations may continue to come forward with claims that meet the contractual requirements of other securitizations. Although the termsCorporation has not recorded any representations and warranties liability for certain potential private-label securitization and whole-loan exposures where the Corporation has had little to no claim activity, or where the applicable statute of limitations has expired, these exposures are included in the securitizations. See Estimated Rangeestimated range of Possible Loss in this Note for additional discussion ofpossible loss. For more information on the representations and warranties liability and the corresponding estimated range of possible loss.loss, see Estimated Range of Possible Loss in this Note.
The table below presents a rollforward of the liability for representations and warranties and corporate guarantees.
|
| | | | | | | |
| | | | |
| Representations and Warranties and Corporate Guarantees |
| | | | |
| (Dollars in millions) | 2013 | | 2012 |
| Liability for representations and warranties and corporate guarantees, January 1 | $ | 19,021 |
| | $ | 15,858 |
|
| Additions for new sales | 36 |
| | 28 |
|
| Net reductions | (6,615 | ) | | (804 | ) |
| Provision | 840 |
| | 3,939 |
|
| Liability for representations and warranties and corporate guarantees, December 31 | $ | 13,282 |
| | $ | 19,021 |
|
For 2013, the provision for representations and warranties and corporate guarantees was $840 million compared to $3.9 billion for 2012. The provision in 2012 included $2.5 billion in provision related to the FNMA Settlement and $500 million for obligations to FNMA related to MI rescissions. |
| | | | | | | |
| | | | |
| Representations and Warranties and Corporate Guarantees |
| | | | |
| (Dollars in millions) | 2014 | | 2013 |
| Liability for representations and warranties and corporate guarantees, January 1 | $ | 13,282 |
| | $ | 19,021 |
|
| Additions for new sales | 8 |
| | 36 |
|
| Net reductions | (1,892 | ) | | (6,615 | ) |
| Provision | 683 |
| | 840 |
|
| Liability for representations and warranties and corporate guarantees, December 31 | $ | 12,081 |
| | $ | 13,282 |
|
The representations and warranties liability represents the Corporation’s best estimate of probable incurred losses as of December 31, 20132014. However, it is reasonably possible that future representations and warranties losses may occur in excess of the amounts recorded for these exposures. Although the Corporation has not recorded any representations and warranties liability for certain potential private-label securitization and whole-loan exposures where it has had little to no claim activity or where the applicable statute of limitations has expired, these exposures are included in the estimated range of possible loss.
Government-sponsored Enterprises Experience
The various settlementsSettlements with the GSEs have resolved substantially all outstanding and potential mortgage repurchase and make-whole claims relating to the origination, sale and delivery of residential mortgage loans that were sold directly to FNMA through December 31, 2008June 30, 2012 and to FHLMC through December 31, 2009,
subject to certain exclusions, which the Corporation does not believe areexpect will be material.
Private-label Securitizations and Whole-loan Sales Experience
In private-label securitizations, the applicable contracts contain provisions that investors meet certain presentation thresholds need to be met in order for investors to direct a trustee to assert repurchase claims. However, in certain circumstances, the Corporation believes that trustees have presented repurchase claims without requiring investors to meet contractual voting rights thresholds. Continued high levels of new private-label claims are primarily related tothe result of repurchase requests received from trustees and third-party sponsors for private-label securitization transactions not included in the BNY Mellon Settlement, including claims related to first-lien third-party sponsored securitizations that include monoline insurance. Over time, there has been an increase in requests for loan files from certain private-label securitization trustees, as well as requests for tolling agreements to toll the applicable statute of limitations relating to representations and warranties repurchase claims and the Corporation believes it is likely that these requests will lead to an increase in repurchase claims for private-label securitization trustees with standing to bring such claims. In addition, private-label securitization trustees may have obtained loan files through other means, including litigation and administrative subpoenas, which may increase the Corporation’s total exposure. Settlement.
A recentDecember 2013 decision by the New York intermediate appellate court held that, under New York law, which governs many RMBS trusts, the six-year statute of limitations starts to run at the time the representations and warranties are made, (i.e.,not the date the transaction closed and not when the repurchase demand was denied). If upheld,denied. That decision has been applied by the state and federal courts in several RMBS lawsuits in which the Corporation is not a party, resulting in the dismissal as untimely of claims involving representations and warranties made more than six years prior to the initiation of the lawsuit. Unless overturned by New York’s highest appellate court, which has taken the case for review, this decision may impactwould apply to representations and warranties claims and lawsuits brought against the timelinessCorporation where New York law governs. A significant amount of representations and warranties claims and/or lawsuits the Corporation has received or may receive involve representations and warranties claims where these claims havethe statute of limitations has expired under this ruling and has not already been tolled by agreement.agreement and which the Corporation therefore believes would be untimely. The Corporation believes this ruling may lead tohave had an increase ininfluence on requests for tolling agreements as well as an increase inand the pace of representations and warranties claims and/or the filing of lawsuits filed by private-label securitization trustees prior to the expiration of the statute of limitations.
The In addition, it is possible that in response to the statute of limitations rulings, parties seeking to pursue representations and warranties as governed byclaims and/or lawsuits with respect to trusts where the statute of limitations for representations and warranties claims against the sponsor and/or issuer has run, may pursue alternate legal theories of recovery and/or assert claims against other contractual parties. For example, in 2014, institutional investors filed lawsuits against trustees alleging failure to pursue representations and warranties claims and servicer defaults based upon alleged contractual, statutory and tort theories of liability. The impact on the Corporation, if any, of such alternative legal theories or assertions is unclear.
The private-label securitization agreements generally require that counterparties have the ability to both assert a representations and warranties claim and to actually prove that a loan has an actionable defect under the applicable contracts. While the Corporation believes the agreements for private-label securitizations generally contain less rigorous representations and warranties and place higher burdens on claimants seeking repurchases than the express provisions of comparable agreements with the GSEs, without regard to any variations that may have arisen as a result of dealings with the GSEs, the agreements generally include a representation that underwriting practices were prudent and customary. In the case of private-label securitization trustees and third-party sponsors, there is currently no established process in place for the parties to reach a conclusion on an individual loan if there is a disagreement on the resolution of the claim. Private-label securitization investors generally do not have the contractual right to demand repurchase
of loans directly or the right to access loan files directly. For more information on repurchase demands, see Unresolved Repurchase Claims in this Note.
Certain whole-loan investors have engaged with the Corporation in a consistent repurchase process and the Corporation has used that and other experience to record a liability related to existing and future claims from such counterparties. The BNY Mellon Settlement and subsequent activity with certain counterparties led to the determination that the Corporation had sufficient experience to record a liability related to its exposure on certain private-label securitizations, including certain private-label securitizations sponsored by third-party whole-loan investors, however, it did not provide sufficient experience to record a liability related to other private-label securitizations sponsored by third-party whole-loan investors. As it relates to the other private-label securitizations sponsored by third-party whole-loan investors and certain other whole-loan sales, as well as certain private-label securitizations impacted by recent court rulings on the statute of limitations, it is not possible to determine whether a loss has occurred or is probable and, therefore, no representations and warranties liability has been recorded in connection with these transactions. The Corporation’s estimated range of possible loss related to representations and warranties exposures as of December 31, 2014 included possible losses related to these whole-loan sales and private-label securitizations.
The majority of the repurchase claims that the Corporation has received and resolved outside of those from the GSEs and monolines are from third-party whole-loan investors. The Corporation provided representations and warranties in connection with the sale of whole loans and the whole-loan investors may retain those rightsthe right to make repurchase claims even when the loans were aggregated with other collateral into private-label securitizations sponsored by the whole-loan investors.investors; in other third-party securitizations, the whole-loan investor’s rights to enforce the representations and warranties were transferred to the securitization trustees. The Corporation reviews properly presented repurchase claims for these whole loans on a loan-by-loan basis. If, after the Corporation’s review, it does not believe a claim is valid, it will deny
the claim and generally indicate a reason for the denial. When the whole-loan investor agrees with the Corporation’s denial of the claim, the whole-loan investor may rescind the claim. When there is disagreement as to the resolution of the claim, meaningful dialogue and negotiation between the parties are generally necessary to reach a resolution on an individual claim. Generally, a whole-loan investor is engaged in the repurchase process and the Corporation and the whole-loan investor reach resolution, either through loan-by-loan negotiation or at times, through a bulk settlement. As of December 31, 2013, 16 percent of the whole-loan claims that the Corporation initially denied have subsequently been resolved through repurchase or make-whole payments and 44 percent have been resolved through rescission or repayment in full by the borrower. Although the timeline for resolution varies, once an actionableif the Corporation agrees that there is a breach is identified on a given loan, settlementthat meets contractual requirements for repurchase, the claim is generally reached as to that loan within 60 days.resolved promptly. When a claim has been denied and the Corporation does not have communication withhear from the counterparty for six months, the Corporation views these claims as inactive; however, they remain in the outstanding claims balance until resolution.
At December 31, 20132014, for loans originated between 2004 and 2008, the notional amount of unresolved repurchase claims submitted by private-label securitization trustees, a financial guarantee provider and whole-loan investors, including third-party securitization sponsors, and others was $24.5 billion, including $3.2 billion of duplicate claims primarily submitted without a loan file review. These repurchase claims include claims in the amount of $4.7 billion, net of duplicate claims, where the Corporation believes the statute of limitations$17.9 billion.
has expired under current law. The Corporation has performed an initial review with respect to $14.6 billionsubstantially all of these claims and although the Corporation does not believe a valid basis for repurchase has been established by the claimant, and is stillit considers claims activity in the processcomputation of reviewing the remaining $3.3 billion of these claims.its liability for representations and warranties.
Monoline Insurers Experience
TheDuring 2014, the Corporation has had limited loan-level representations and warranties repurchase claims experience with the monoline insurers due to settlements with several monoline insurers and ongoing litigation against Countrywide and/or Bank of America.with a single monoline insurer. To the extent the Corporation received repurchase claims from the monolines that arewere properly presented, it generally reviewsreviewed them on a loan-by-loan basis. Where the Corporation agrees that there has been a breach of representations and warranties given by the Corporation or subsidiaries or legacy companies is confirmed on a given loan,that meets contractual requirements for repurchase, settlement is generally reached as to that loan within 60 to 90 days. For more information related to the monolines, see Note 12 – Commitments and Contingencies.
The MBIA Settlement resolved outstanding and potential claims between the parties to the settlement involving 31 first- and 17 second-lien RMBS trusts for which MBIA provided financial guarantee insurance, including $945 million of monoline repurchase claims outstanding at December 31, 2012. The first- and second-lien mortgages in the covered RMBS trusts had an original principal balance of $29.3 billion and $25.5 billion, and an unpaid principal balance of $9.8 billion and $9.3 billion at the time of the settlement.
During 2013, there was minimal loan-level repurchase claim activity with the monolines and the monolines did not request any loan files for review through the representations and warranties process.
Open Mortgage Insurance Rescission Notices
In addition to repurchase claims, the Corporation receives notices from mortgage insurance companies of claim denials, cancellations or coverage rescission (collectively, MI rescission notices). Although the number of such open notices has remained elevated, they have decreased over the last several quarters as
the resolution of open notices exceeded new notices. By way of background, MI compensates lenders or investors for certain losses resulting from borrower default on a mortgage loan. When there is disagreement with the mortgage insurer as to the resolution of a MI rescission notice, meaningful dialogue and negotiation between the mortgage insurance company and the Corporation are generally necessary to reach a resolution on an individual notice. The level of engagement of the mortgage insurance companies varies and ongoing litigation involving some of the mortgage insurance companies over individual and bulk rescissions or claims for rescission limits the ability of the Corporation to engage in constructive dialogue leading to resolution.
For loans sold to the GSEs or private-label securitization trusts (including those wrapped by the monoline bond insurers), when the Corporation receives a MI rescission notice from a mortgage insurance company, itnotices may give rise to a claim for breach of the applicable representations and warranties, from the GSEs or private-label securitization trusts, depending on the terms of governing sales contracts and on whether the loan in question is subject to a settlement. In those cases wherecontracts. If the governing contract contains MI-related representations and warranties, which upon rescission requires the Corporation to repurchase the affected loan or indemnify the investor for the related loss due to MI rescissions, the Corporation realizesmay realize the loss without the benefit of MI. See below for a discussion of the impact of the FNMA and FHLMC Settlements. In addition, mortgage insurance companies have in some cases asserted the ability to curtail MI payments as a result of alleged foreclosure delays which if successful, would reducethus reducing the MI proceeds available to reduceoffset the loss on the loan.
In certain settlements with the GSEs, the Corporation has generally agreed to pay the amount of MI coverage to the GSEs for loans that are the subject of MI rescission notices. Depending on the terms of settlement agreements or lack thereof with the mortgage insurance companies, the Corporation may collect only a portion of the amounts paid to the GSEs from the mortgage insurance companies.
At December 31, 2013, theThe Corporation had approximately 101,00065,000 open MI rescission notices compared to 110,000at December 31, 20122014. compared to 101,000 at December 31, 2013. The decline results primarily from settlements with certain MI companies that have been approved by the GSEs. Open MI rescission notices at December 31, 20132014 included 39,000approximately 17,000 pertaining principally to first-lien mortgages serviced for others,sold to the GSEs and other investors as well as loans held-for-investment. At 10,000December 31, 2014 pertaining to loans held-for-investment and 52,000 pertaining to ongoing litigation for second-lien mortgages. Approximately 28,000 of, the Corporation also had approximately 48,000 open MI rescission notices pertaining to first-liensecond-lien mortgages serviced for otherswhich are related to loans sold to the GSEs. As of December 31, 2013, 43 percent of the MI rescission notices received have been resolved. Of those resolved, 16 percent were resolved through the Corporation’s acceptance of the MI rescission, 59 percent were resolved through reinstatement of coverage or payment of the claim by theimplicated in ongoing litigation with a mortgage insurance company and 25 percent were resolved on an aggregate basis through settlement, policy commutation or similar arrangement. As of December 31, 2013, 57 percent of the MI rescission notices the Corporation has received have not yet been resolved. Of those not yet resolved, 52 percent are implicated by ongoing litigation where no loan-level review is currently contemplated nor required to preserve the Corporation’s legal rights. In this litigation, the litigating mortgage insurance companies arecompany is also seeking bulk rescission of certain policies, separate and apart from loan-by-loan denials or rescissions. The Corporation is in the process of reviewing eight percent of the remaining open MI rescission notices, and it has reviewed and is contesting the MI rescission with respect to 92 percent of these remaining open MI rescission notices. Of the remaining open MI rescission notices, 42 percent are also the subject of ongoing litigation; although, at present, these MI rescissions are being processed in a manner generally consistent
with those not affected by litigation.
Although the GSE settlements did not resolve underlying MI rescission notices, the FNMA Settlement clarified the parties’ obligations with respect to MI rescission notices pertaining to loans covered by the settlement, including establishing timeframes for certain payments and other actions, setting parameters for potential bulk settlements and providing for cooperation in future dealings with mortgage insurers while the FHLMC Settlement clarified the requirements of their guidelines. As a result, the Corporation is required to pay or has paid the amount of MI coverage to the GSEs for 26,200 MI claims rescissions pertaining to loans covered by the settlements, which are included in the 28,000 open MI rescission notices referenced in the paragraph above, in advance of collection from the mortgage insurance companies. In certain cases, the Corporation may not ultimately collect all such amounts from the mortgage insurance companies.
Estimated Range of Possible Loss
The Corporation currently estimates that the range of possible loss for representations and warranties exposures could be up to $4 billion over existing accruals at December 31, 20132014. The estimated range of possible loss reflects principally non-GSE exposures. It represents a reasonably possible loss, but does not represent a probable loss, and is based on currently available information, significant judgment and a number of assumptions that are subject to change.
The liability for representations and warranties exposures and the corresponding estimated range of possible loss do not consider any losses related to litigation matters, including RMBS litigation or litigation brought by monoline insurers, nor do they include any separate foreclosure costs and related costs, assessments and compensatory fees or any other possible losses related to potential claims for breaches of performance of servicing obligations except(except as such losses are included as potential costs of the BNY Mellon Settlement, potentialSettlement), including foreclosure and related costs, fraud, indemnity, or claims (including for RMBS) related to securities law or fraud claims or potential indemnity or other claims against the Corporation, including claims related to loans insured by the FHA. The Corporation is not able to reasonably estimate the amount of any possible lossmonoline insurance litigations. Losses with respect to any such servicing, securities law, fraudone or other claims against the Corporation, exceptmore of these matters could be material to the extent reflected in existing accrualsCorporation’s results of operations or the estimated range of possible losscash flows for litigation and regulatory matters disclosed in Note 12 – Commitments and Contingencies; however, such loss could be material.any particular reporting period.
Future provisions and/or ranges of possible loss for representations and warranties may be significantly impacted if actual experiences are different from the Corporation’s assumptions in its predictive models, including, without limitation, ultimate resolution of the BNY Mellon Settlement, estimated repurchase rates, estimated MI rescission rates, economic conditions, estimated home prices, consumer and counterparty behavior, the applicable statute of limitations and a variety of other judgmental factors. Adverse developments with respect to one or more of the assumptions underlying the liability for representations and warranties and the corresponding estimated range of possible loss could result in significant increases to future provisions and/or the estimated range of possible loss. For example, an appellate court, in the context of claims brought by a monoline insurer, disagreed with the Corporation’s interpretation that a loan must be in default in order to satisfy the underlying agreements’ requirement that a breach have a material and adverse effect. If that decision is
extended to non-monoline contexts, it could significantly impact the Corporation’s provision and/or the estimated range of possible loss. Additionally, if court rulings, including one related to the Corporation, that have allowed sampling of loan files instead of requiring a loan-by-loan review to determine if a representations and warranties breach has occurred, are followed generally by the courts, private-label securitization counterparties may view litigation as a more attractive alternative compared to a loan-by-loan review. Finally, although the Corporation believes that the representations and warranties
typically given in non-GSE transactions are less rigorous and actionable than those given in GSE transactions, the Corporation does not have significant experience resolving loan-level claims in non-GSE transactions to measure the impact of these differences on the probability that a loan will be required to be repurchased.
Cash Payments
The Loan Repurchases and Indemnification Payments table below presents first-lien and home equity loan repurchases and indemnification payments for 2013 and 2012. During 2013 and 2012,made by the Corporation paid $1.2 billion and $1.8 billionto resolve $1.5 billion and $2.1 billion of repurchase claims through repurchase or reimbursement toreimburse the investor or securitization trust for losses they incurred, resulting in a loss on the related loans at the time ofand to resolve repurchase or reimbursement of $609 million and $847 million.claims. Cash paid for loan repurchases includes the unpaid principal balance of the loan plus past due
interest. The amount of loss for loan repurchases is reduced by the fair value of the underlying loan collateral. The repurchase of loans and indemnification payments related to first-lien and home equity repurchase claims generally resulted from material breaches of representations and warranties related to the loans’ material compliance with the applicable underwriting standards, including borrower misrepresentation, credit exceptions without sufficient compensating factors and non-compliance with underwriting procedures. The actual representations and warranties made in a sales transaction and the resulting repurchase and indemnification activity can vary by transaction or investor. A direct relationship between the type of defect that causes the breach of representations and warranties and the severity of the realized loss has not been observed. Transactions to repurchase loansLoan repurchases or make indemnification payments related to first-lien residential mortgages primarily involved the GSEs while transactions to repurchase loansrepurchases or make indemnification payments forrelated to home equity loans primarily involved the monoline insurers.
|
| | | | | | | | | | | | | | | | | | | | | | | |
| | | | | | | | | | | | |
| Loan Repurchases and Indemnification Payments (excluding cash payments for settlements) |
| | | | | | | | | | | | |
| | December 31 |
| | 2014 | | 2013 |
| (Dollars in millions) | Unpaid
Principal
Balance | | Cash Paid for
Repurchases | | Loss | | Unpaid
Principal
Balance | | Cash Paid for
Repurchases | | Loss |
| First-lien | |
| | |
| | |
| | |
| | |
| | |
|
| Repurchases | $ | 211 |
| | $ | 241 |
| | $ | 79 |
| | $ | 746 |
| | $ | 784 |
| | $ | 149 |
|
| Indemnification payments | 624 |
| | 233 |
| | 233 |
| | 661 |
| | 383 |
| | 383 |
|
| Total first-lien | 835 |
| | 474 |
| | 312 |
| | 1,407 |
| | 1,167 |
| | 532 |
|
| Home equity, indemnification payments | 22 |
| | 22 |
| | 22 |
| | 74 |
| | 77 |
| | 77 |
|
| Total first-lien and home equity | $ | 857 |
| | $ | 496 |
| | $ | 334 |
| | $ | 1,481 |
| | $ | 1,244 |
| | $ | 609 |
|
The amounts in the table belowabove exclude a cash payment of $391 million paid to FHLMC for the FHLMC Settlement. The amounts in the table also exclude a cash payment of $3.6 billionpayments made in connection with the FHFA Settlement, the 2013 tosettlements with FHLMC and FNMA, and the repurchase for $6.6 billion of certain residential mortgage loans which the Corporation valued at less than the purchase price, both of which were part of the FNMA Settlement. Additionally, the amounts shown in the table below exclude $1.8 billion and $669 million paid in monoline settlements
during 2014 and 2013, and 2012.including payments made directly to securitization trusts.
|
| | | | | | | | | | | | | | | | | | | | | | | |
| | | | | | | | | | | | |
| Loan Repurchases and Indemnification Payments |
| | | | | | | | | | | | |
| | December 31 |
| | 2013 | | 2012 |
| (Dollars in millions) | Unpaid
Principal
Balance | | Cash Paid for
Repurchases | | Loss | | Unpaid
Principal
Balance | | Cash Paid for
Repurchases | | Loss |
| First-lien | |
| | |
| | |
| | |
| | |
| | |
|
| Repurchases | $ | 746 |
| | $ | 784 |
| | $ | 149 |
| | $ | 1,184 |
| | $ | 1,273 |
| | $ | 389 |
|
| Indemnification payments | 661 |
| | 383 |
| | 383 |
| | 831 |
| | 425 |
| | 425 |
|
| Total first-lien | 1,407 |
| | 1,167 |
| | 532 |
| | 2,015 |
| | 1,698 |
| | 814 |
|
| Home equity | |
| | |
| | |
| | |
| | |
| | |
|
| Repurchases | — |
| | — |
| | — |
| | 24 |
| | 24 |
| | — |
|
| Indemnification payments | 74 |
| | 77 |
| | 77 |
| | 36 |
| | 33 |
| | 33 |
|
| Total home equity | 74 |
| | 77 |
| | 77 |
| | 60 |
| | 57 |
| | 33 |
|
| Total first-lien and home equity | $ | 1,481 |
| | $ | 1,244 |
| | $ | 609 |
| | $ | 2,075 |
| | $ | 1,755 |
| | $ | 847 |
|
|
| | |
| | 205Bank of America 20132152014 | | |
NOTE 8 Goodwill and Intangible Assets
Goodwill
The table below presents goodwill balances by business segment at December 31, 20132014 and 20122013. The reporting units utilized for goodwill impairment testing are the operating segments or one level below.
| | | | | | | | | |
| Goodwill | | | | | | |
| | | | | | | |
| | December 31 | December 31 |
| (Dollars in millions) | 2013 | | 2012 | 2014 | | 2013 |
| Consumer & Business Banking | $ | 31,681 |
| | $ | 31,681 |
| $ | 31,681 |
| | $ | 31,681 |
|
| Global Wealth & Investment Management | 9,698 |
| | 9,698 |
| 9,698 |
| | 9,698 |
|
| Global Banking | 22,377 |
| | 22,377 |
| 22,377 |
| | 22,377 |
|
| Global Markets | 5,197 |
| | 5,181 |
| 5,197 |
| | 5,197 |
|
| All Other | 891 |
| | 1,039 |
| 824 |
| | 891 |
|
| Total goodwill | $ | 69,844 |
| | $ | 69,976 |
| $ | 69,777 |
| | $ | 69,844 |
|
Effective January 1, 2013, on a prospective basis, the Corporation adjusted the amount of capital being allocated to the business segments. The adjustment reflects a refinement to the prior-year methodology (economic capital), which focused solely on internal risk-based economic capital models. The refined methodology (allocated capital) now also considers the effect of regulatory capital requirements in addition to internal risk-based economic capital models. For purposes of goodwill impairment testing, the Corporation utilizes allocated equity as a proxy for the carrying value of its reporting units. Allocated equity in the reporting units is comprised of allocated capital plus capital for
the portion of goodwill and intangibles specifically assigned to the reporting unit. The goodwill impairment test involves comparing the fair value of each reporting unit with its carrying value, including goodwill, as measured by allocated equity. During 2014, the Corporation made refinements to the amount of capital allocated to each of its businesses based
on multiple considerations that included, but were not limited to, risk-weighted assets measured under the Basel 3 Standardized and Advanced approaches, business segment exposures and risk profile, and strategic plans. As a result of this process, in 2014, the Corporation adjusted the amount of capital being allocated to its business segments. This change resulted in a reduction of the unallocated capital, which is reflected in All Other, and an aggregate increase to the amount of capital being allocated to the business segments. An increase in allocated capital in the business segments generally results in a reduction of the excess of the fair value over the carrying value and a reduction to the estimated fair value as a percentage of allocated carrying value for an individual reporting unit.
There was no goodwill in Consumer Real Estate Services (CRES) at December 31, 20132014 and 20122013.
In 2013, the consumer Dealer Financial Services (DFS) business, including $1.7 billion of goodwill, was moved from Global Banking to CBB in order to align this business more closely with the Corporation’s consumer lending activity and better serve the needs of its customers. In 2012, the International Wealth Management businesses within GWIM, including $230 million of goodwill, were moved to All Other in connection with the Corporation’s agreement to sell these businesses in a series of transactions. Certain of the sales transactions were completed in 2013 and most of the remaining sales transactions are expected to close over the next year. The decrease in goodwill in 2013 was related to the completed sales transactions. Prior periods were reclassified to conform to current period presentation.
Annual Impairment Tests
During the three months ended September 30, 20132014 and 20122013, the Corporation completed its annual goodwill impairment test as of June 30 for all applicable reporting units. Based on the results of the annual goodwill impairment test, the Corporation determined there was no impairment.
Intangible Assets
The table below presents the gross carrying value and accumulated amortization for intangible assets at December 31, 20132014 and 20122013.
| | | | | | | | | | | | | | | | | | | | | | | | | |
Intangible Assets (1) | | | | | | | | | | | | |
Intangible Assets (1, 2) | | | | | | | | | | | | |
| | | | | | | | | | | | | | | | | | | | | | | |
| | December 31 | December 31 |
| | 2013 | | 2012 | 2014 | | 2013 |
| (Dollars in millions) | Gross Carrying Value | | Accumulated Amortization | | Net
Carrying Value | | Gross Carrying Value | | Accumulated Amortization | | Net
Carrying Value | Gross Carrying Value | | Accumulated Amortization | | Net
Carrying Value | | Gross Carrying Value | | Accumulated Amortization | | Net
Carrying Value |
| Purchased credit card relationships | $ | 6,160 |
| | $ | 4,849 |
| | $ | 1,311 |
| | $ | 6,184 |
| | $ | 4,494 |
| | $ | 1,690 |
| $ | 5,504 |
| | $ | 4,527 |
| | $ | 977 |
| | $ | 6,160 |
| | $ | 4,849 |
| | $ | 1,311 |
|
| Core deposit intangibles | 3,592 |
| | 3,055 |
| | 537 |
| | 3,592 |
| | 2,858 |
| | 734 |
| 1,779 |
| | 1,382 |
| | 397 |
| | 3,592 |
| | 3,055 |
| | 537 |
|
| Customer relationships | 4,025 |
| | 2,281 |
| | 1,744 |
| | 4,025 |
| | 1,884 |
| | 2,141 |
| 4,025 |
| | 2,648 |
| | 1,377 |
| | 4,025 |
| | 2,281 |
| | 1,744 |
|
| Affinity relationships | 1,575 |
| | 1,197 |
| | 378 |
| | 1,572 |
| | 1,087 |
| | 485 |
| 1,565 |
| | 1,283 |
| | 282 |
| | 1,575 |
| | 1,197 |
| | 378 |
|
| Other intangibles | 2,045 |
| | 441 |
| | 1,604 |
| | 2,139 |
| | 505 |
| | 1,634 |
| 2,045 |
| | 466 |
| | 1,579 |
| | 2,045 |
| | 441 |
| | 1,604 |
|
| Total intangible assets | $ | 17,397 |
| | $ | 11,823 |
| | $ | 5,574 |
| | $ | 17,512 |
| | $ | 10,828 |
| | $ | 6,684 |
| $ | 14,918 |
| | $ | 10,306 |
| | $ | 4,612 |
| | $ | 17,397 |
| | $ | 11,823 |
| | $ | 5,574 |
|
| |
(1) | Excludes fully amortized intangible assets. |
| |
(2) | At December 31, 2014 and 2013, none of the intangible assets were impaired. |
The table below presents intangible asset amortization expense for 2014, 2013 and 2012, none of the intangible assets were impaired. Amortization of intangibles expense was $1.1 billion, $1.3 billion and $1.5 billion in 2013, 2012 and 2011, respectively.2012.
|
| | | | | | | | | | | |
| | | | | | |
| Amortization Expense | | | | | |
| | | | | | |
| (Dollars in millions) | 2014 | | 2013 | | 2012 |
| Purchased credit card and Affinity relationships | $ | 415 |
| | $ | 475 |
| | $ | 556 |
|
| Core deposit intangibles | 140 |
| | 197 |
| | 254 |
|
| Customer relationships | 355 |
| | 371 |
| | 391 |
|
| Other intangibles | 26 |
| | 43 |
| | 63 |
|
| Total amortization expense | $ | 936 |
| | $ | 1,086 |
| | $ | 1,264 |
|
The Corporation estimates aggregate amortization expense will be $938 million, $836 million, $739 million, $647 million and $567 million for 2014 through 2018, respectively.
|
| | |
| | 216Bank of America 20132014206
| | |
The table below presents estimated future intangible asset amortization expense at December 31, 2014.
|
| | | | | | | | | | | | | | | | | | | |
| | | | | | | | | | |
| Estimated Future Amortization Expense | | | | | | | | | |
| | | | | | | | | | |
| (Dollars in millions) | 2015 | | 2016 | | 2017 | | 2018 | | 2019 |
| Purchased credit card and Affinity relationships | $ | 358 |
| | $ | 299 |
| | $ | 239 |
| | $ | 180 |
| | $ | 121 |
|
| Core deposit intangibles | 122 |
| | 105 |
| | 91 |
| | 80 |
| | 7 |
|
| Customer relationships | 340 |
| | 325 |
| | 310 |
| | 302 |
| | 286 |
|
| Other intangibles | 16 |
| | 9 |
| | 6 |
| | 3 |
| | 1 |
|
| Total estimated future amortization expense | $ | 836 |
| | $ | 738 |
| | $ | 646 |
| | $ | 565 |
| | $ | 415 |
|
NOTE 9 Deposits
The Corporation had U.S. certificates of deposit and other U.S. time deposits of $100 thousand or more totaling $38.332.4 billion and $41.938.3 billion at December 31, 20132014 and 20122013. Non-U.S. certificates of deposit and other non-U.S. time deposits of $100 thousand or more totaled $26.214.0 billion and $29.126.2 billion at December 31, 20132014 and 20122013. The table below presents the contractual maturities for time deposits of $100 thousand or more at December 31, 20132014.
| | | | | | | | | | | | | | | | | |
| Time Deposits of $100 Thousand or More | | | | | | | | | | | | | | |
| | | | | | | | | | | | | | | |
| (Dollars in millions) | Three Months or Less | | Over Three
Months to Twelve Months | | Thereafter | | Total | Three Months or Less | | Over Three
Months to Twelve Months | | Thereafter | | Total |
| U.S. certificates of deposit and other time deposits | $ | 16,246 |
| | $ | 17,943 |
| | $ | 4,155 |
| | $ | 38,344 |
| $ | 15,327 |
| | $ | 14,134 |
| | $ | 2,948 |
| | $ | 32,409 |
|
| Non-U.S. certificates of deposit and other time deposits | 23,726 |
| | 1,983 |
| | 481 |
| | 26,190 |
| 12,446 |
| | 1,308 |
| | 253 |
| | 14,007 |
|
The scheduled contractual maturities for total time deposits at December 31, 20132014 are presented in the table below.
| | | | | | | | | | | | | |
| Contractual Maturities of Total Time Deposits | | | | | | | | | | |
| | | | | | | | | | | |
| (Dollars in millions) | U.S. | | Non-U.S. | | Total | U.S. | | Non-U.S. | | Total |
| Due in 2014 | $ | 71,895 |
| | $ | 26,306 |
| | $ | 98,201 |
| |
| Due in 2015 | 6,523 |
| | 227 |
| | 6,750 |
| $ | 61,439 |
| | $ | 14,165 |
| | $ | 75,604 |
|
| Due in 2016 | 1,719 |
| | 315 |
| | 2,034 |
| 4,119 |
| | 176 |
| | 4,295 |
|
| Due in 2017 | 1,308 |
| | 14 |
| | 1,322 |
| 1,532 |
| | 38 |
| | 1,570 |
|
| Due in 2018 | 649 |
| | 1 |
| | 650 |
| 775 |
| | — |
| | 775 |
|
| Due in 2019 | | 830 |
| | 35 |
| | 865 |
|
| Thereafter | 2,274 |
| | 4 |
| | 2,278 |
| 1,734 |
| | — |
| | 1,734 |
|
| Total time deposits | $ | 84,368 |
| | $ | 26,867 |
| | $ | 111,235 |
| $ | 70,429 |
| | $ | 14,414 |
| | $ | 84,843 |
|
NOTE 10 Federal Funds Sold or Purchased, Securities Financing Agreements and Short-term Borrowings
The table below presents federal funds sold or purchased, securities financing agreements, which include securities borrowed or purchased under agreements to resell and securities loaned or sold under agreements to repurchase, and short-term borrowings.
| | | | | | | | | | | | | | | | | | | | | | | | | |
| | 2013 | | 2012 | | 2011 | 2014 | | 2013 | | 2012 |
| (Dollars in millions) | Amount | | Rate | | Amount | | Rate | | Amount | | Rate | Amount | | Rate | | Amount | | Rate | | Amount | | Rate |
| Federal funds sold | |
| | |
| | |
| | |
| | |
| | |
| |
| | |
| | |
| | |
| | |
| | |
|
| At December 31 | $ | — |
| | — | % | | $ | 600 |
| | 0.54 | % | | $ | 100 |
| | 0.71 | % | $ | — |
| | — | % | | $ | — |
| | — | % | | $ | 600 |
| | 0.54 | % |
| Average during year | 7 |
| | 0.69 |
| | 351 |
| | 0.43 |
| | 273 |
| | 0.39 |
| 3 |
| | 0.90 |
| | 7 |
| | 0.69 |
| | 351 |
| | 0.43 |
|
| Maximum month-end balance during year | 550 |
| | n/a |
| | 600 |
| | n/a |
| | 782 |
| | n/a |
| 12 |
| | n/a |
| | 35 |
| | n/a |
| | 600 |
| | n/a |
|
| Securities borrowed or purchased under agreements to resell | | | | | | | | | | | | | | | | | | | | | | |
| At December 31 | 190,328 |
| | 0.60 |
| | 219,324 |
| | 0.92 |
| | 211,083 |
| | 0.76 |
| 191,823 |
| | 0.47 |
| | 190,328 |
| | 0.60 |
| | 219,324 |
| | 0.92 |
|
| Average during year | 224,324 |
| | 0.55 |
| | 235,691 |
| | 0.64 |
| | 244,796 |
| | 0.88 |
| 222,480 |
| | 0.47 |
| | 224,324 |
| | 0.55 |
| | 235,691 |
| | 0.64 |
|
| Maximum month-end balance during year | 249,791 |
| | n/a |
| | 252,985 |
| | n/a |
| | 270,201 |
| | n/a |
| 240,110 |
| | n/a |
| | 249,791 |
| | n/a |
| | 252,985 |
| | n/a |
|
| Federal funds purchased | |
| | |
| | |
| | |
| | |
| | |
| |
| | |
| | |
| | |
| | |
| | |
|
| At December 31 | 186 |
| | — |
| | 1,151 |
| | 0.17 |
| | 243 |
| | 0.06 |
| 14 |
| | — |
| | 186 |
| | — |
| | 1,151 |
| | 0.17 |
|
| Average during year | 192 |
| | 0.06 |
| | 384 |
| | 0.11 |
| | 1,658 |
| | 0.08 |
| 147 |
| | 0.05 |
| | 191 |
| | 0.06 |
| | 384 |
| | 0.11 |
|
| Maximum month-end balance during year | 1,272 |
| | n/a |
| | 1,211 |
| | n/a |
| | 4,133 |
| | n/a |
| 213 |
| | n/a |
| | 195 |
| | n/a |
| | 1,211 |
| | n/a |
|
| Securities loaned or sold under agreements to repurchase | |
| | |
| | |
| | |
| | |
| | |
| |
| | |
| | |
| | |
| | |
| | |
|
| At December 31 | 197,920 |
| | 0.92 |
| | 292,108 |
| | 1.11 |
| | 214,621 |
| | 1.08 |
| 201,263 |
| | 0.98 |
| | 197,920 |
| | 0.92 |
| | 292,108 |
| | 1.11 |
|
| Average during year | 257,409 |
| | 0.81 |
| | 281,516 |
| | 0.98 |
| | 270,718 |
| | 1.31 |
| 215,645 |
| | 0.99 |
| | 257,409 |
| | 0.81 |
| | 281,516 |
| | 0.98 |
|
| Maximum month-end balance during year | 319,608 |
| | n/a |
| | 319,401 |
| | n/a |
| | 293,519 |
| | n/a |
| 239,984 |
| | n/a |
| | 319,608 |
| | n/a |
| | 319,401 |
| | n/a |
|
| Short-term borrowings | |
| | |
| | |
| | |
| | |
| | |
| |
| | |
| | |
| | |
| | |
| | |
|
| At December 31 | 45,999 |
| | 1.55 |
| | 30,731 |
| | 3.08 |
| | 35,698 |
| | 2.36 |
| 31,172 |
| | 1.47 |
| | 45,999 |
| | 1.55 |
| | 30,731 |
| | 3.08 |
|
| Average during year | 43,816 |
| | 1.89 |
| | 36,500 |
| | 2.22 |
| | 51,893 |
| | 2.00 |
| 41,886 |
| | 1.08 |
| | 43,816 |
| | 1.89 |
| | 36,500 |
| | 2.22 |
|
| Maximum month-end balance during year | 48,387 |
| | n/a |
| | 40,129 |
| | n/a |
| | 62,621 |
| | n/a |
| 51,409 |
| | n/a |
| | 48,387 |
| | n/a |
| | 40,129 |
| | n/a |
|
n/a = not applicable
Bank of America, N.A. maintains a global program to offer up to a maximum of $75 billion outstanding at any one time, of bank notes with fixed or floating rates and maturities of at least seven days from the date of issue. Short-term bank notes outstanding under this program totaled $15.114.6 billion and $3.915.1 billion at December 31, 20132014 and 2012.2013. These short-term bank notes,
along with Federal Home Loan Bank (FHLB) advances, U.S. Treasury tax and loan notes, and term federal funds purchased, are included in short-term borrowings on the Consolidated Balance Sheet. For information regarding the long-term notes that have been issued under the $75 billion bank note program, see Note 11 – Long-term Debt.
Offsetting of Securities Financing Agreements
Substantially all of the Corporation’s repurchase and resale activities are transacted under legally enforceable master repurchase agreements that give the Corporation, in the event of default by the counterparty, the right to liquidate securities held and to offset receivables and payables with the same counterparty. The Corporation offsets repurchase and resale transactions with the same counterparty on the Consolidated Balance Sheet where it has such a legally enforceable master netting agreement and the transactions have the same maturity date.
Substantially all securities borrowing and lending activities are transacted under legally enforceable master securities lending agreements that give the Corporation, in the event of default by the counterparty, the right to liquidate securities held and to offset receivables and payables with the same counterparty. The Corporation offsets securities borrowing and lending transactions
with the same counterparty on the Consolidated Balance Sheet where it has such a legally enforceable master netting agreement and the transactions have the same maturity date.
The Securities Financing Agreements table presents securities financing agreements included on the Consolidated Balance Sheet in federal funds sold and securities borrowed or purchased under agreements to resell, and in federal funds purchased and securities loaned or sold under agreements to repurchase at December 31, 20132014 and 2012.2013. Balances are presented on a gross basis, prior to the application of counterparty netting. Gross assets
and liabilities are adjusted on an aggregate basis to take into consideration the effects of legally enforceable master netting agreements. For more information on the offsetting of derivatives, see Note 2 – Derivatives.
The “Other” amount in the Securities Financing Agreements table, which is included on the Consolidated Balance Sheet in accrued expenses and other liabilities, relates to transactions where the Corporation acts as the lender in a securities lending agreement and receives securities that can be pledged or sold as collateral. In these transactions, the Corporation recognizes an asset at fair value, representing the securities received, and a liability, for the same amount, representing the obligation to return those securities. The “other” amount is included on the Consolidated Balance Sheet in other assets and in accrued expenses and other liabilities.
Gross assets and liabilities in the table include activity where uncertainty exists as to the enforceability of certain master netting agreements under bankruptcy laws in some countries or industries and, accordingly, these are reported on a gross basis.
The column titled “Financial Instruments” in the Securities Financing Agreements table includes securities collateral received or pledged under repurchase or securities lending agreements where there is a legally enforceable master netting agreement. These amounts are not offset on the Consolidated Balance Sheet, but are shown as a reduction to the
net balance sheet amount in thethis table to derive a net asset or liability. Securities collateral received or pledged where the legal enforceability of the master netting agreements is not certain is not included.
| | | | | | | | | | | | | | | | | | | | | |
| Securities Financing Agreements | | | | | | | | | | | | | | | | | | |
| | | | | | | | | | | | | | | | | | | |
| | December 31, 2013 | December 31, 2014 |
| (Dollars in millions) | Gross Assets/Liabilities | | Amounts Offset | | Net Balance Sheet Amount | | Financial Instruments | | Net Assets/Liabilities | Gross Assets/Liabilities | | Amounts Offset | | Net Balance Sheet Amount | | Financial Instruments | | Net Assets/Liabilities |
| Securities borrowed or purchased under agreements to resell | $ | 272,296 |
| | $ | (81,968 | ) | | $ | 190,328 |
| | $ | (157,132 | ) | | $ | 33,196 |
| |
Securities borrowed or purchased under agreements to resell (1) | | $ | 316,567 |
| | $ | (124,744 | ) | | $ | 191,823 |
| | $ | (145,573 | ) | | $ | 46,250 |
|
| | | | | | | | | | | | | | | | | | | |
| Securities loaned or sold under agreements to repurchase | $ | 279,888 |
| | $ | (81,968 | ) | | $ | 197,920 |
| | $ | (160,111 | ) | | $ | 37,809 |
| $ | 326,007 |
| | $ | (124,744 | ) | | $ | 201,263 |
| | $ | (164,306 | ) | | $ | 36,957 |
|
| Other | 10,871 |
| | — |
| | 10,871 |
| | (10,871 | ) | | — |
| 11,641 |
| | — |
| | 11,641 |
| | (11,641 | ) | | — |
|
| Total | $ | 290,759 |
| | $ | (81,968 | ) | | $ | 208,791 |
| | $ | (170,982 | ) | | $ | 37,809 |
| $ | 337,648 |
| | $ | (124,744 | ) | | $ | 212,904 |
| | $ | (175,947 | ) | | $ | 36,957 |
|
| | | | | | | | | | | | | | | | | | | |
| | December 31, 2012 | December 31, 2013 |
| Securities borrowed or purchased under agreements to resell | $ | 366,238 |
| | $ | (146,914 | ) | | $ | 219,324 |
| | $ | (173,593 | ) | | $ | 45,731 |
| |
Securities borrowed or purchased under agreements to resell (1) | | $ | 272,296 |
| | $ | (81,968 | ) | | $ | 190,328 |
| | $ | (157,132 | ) | | $ | 33,196 |
|
| | | | | | | | | | | | | | | | | | | |
| Securities loaned or sold under agreements to repurchase | $ | 439,022 |
| | $ | (146,914 | ) | | $ | 292,108 |
| | $ | (217,817 | ) | | $ | 74,291 |
| $ | 279,888 |
| | $ | (81,968 | ) | | $ | 197,920 |
| | $ | (160,111 | ) | | $ | 37,809 |
|
| Other | 12,306 |
| | — |
| | 12,306 |
| | (12,302 | ) | | 4 |
| 10,871 |
| | — |
| | 10,871 |
| | (10,871 | ) | | — |
|
| Total | $ | 451,328 |
| | $ | (146,914 | ) | | $ | 304,414 |
| | $ | (230,119 | ) | | $ | 74,295 |
| $ | 290,759 |
| | $ | (81,968 | ) | | $ | 208,791 |
| | $ | (170,982 | ) | | $ | 37,809 |
|
| |
(1) | Excludes repurchase activity of $5.6 billion and $4.1 billion reported in Loans and leases at December 31, 2014 and 2013. |
|
| | |
218209 Bank of America 20132014
| | |
NOTE 11 Long-term Debt
Long-term debt consists of borrowings having an original maturity of one year or more. The table below presents the balance of long-term debt at December 31, 20132014 and 2012,2013, and the related contractual rates and maturity dates as of December 31, 20132014.
| | | | | | | | | |
| | December 31 | December 31 |
| (Dollars in millions) | 2013 | | 2012 | 2014 | | 2013 |
Notes issued by Bank of America Corporation (1) | |
| | |
| |
| | |
|
| Senior notes: | |
| | |
| |
| | |
|
| Fixed, with a weighted-average rate of 4.99%, ranging from 1.25% to 8.83%, due 2014 to 2042 | $ | 109,845 |
| | $ | 114,493 |
| |
| Floating, with a weighted-average rate of 0.99%, ranging from 0.05% to 4.99%, due 2014 to 2044 | 22,268 |
| | 24,698 |
| |
| Fixed, with a weighted-average rate of 4.67%, ranging from 1.25% to 8.83%, due 2015 to 2044 | | $ | 113,069 |
| | $ | 109,845 |
|
| Floating, with a weighted-average rate of 1.32%, ranging from 0.09% to 4.98%, due 2015 to 2044 | | 14,559 |
| | 22,268 |
|
| Senior structured notes | 30,575 |
| | 33,962 |
| 22,168 |
| | 30,575 |
|
| Subordinated notes: | |
| | |
| |
| | |
|
| Fixed, with a weighted-average rate of 5.83%, ranging from 2.40% to 10.20%, due 2014 to 2038 | 22,379 |
| | 24,118 |
| |
| Floating, with a weighted-average rate of 1.13%, ranging from 0.57% to 2.97%, due 2016 to 2026 | 1,798 |
| | 1,767 |
| |
| Fixed, with a weighted-average rate of 4.91%, ranging from 0.80% to 10.20%, due 2015 to 2038 | | 26,995 |
| | 22,379 |
|
| Floating, with a weighted-average rate of 0.97%, ranging from 0.01% to 3.16%, due 2016 to 2026 | | 1,705 |
| | 1,798 |
|
| Junior subordinated notes (related to trust preferred securities): | |
| | |
| |
| | |
|
| Fixed, with a weighted-average rate of 6.84%, ranging from 5.25% to 8.05%, due 2027 to perpetual | 6,685 |
| | 6,655 |
| |
| Floating, with a weighted-average rate of 0.92%, ranging from 0.79% to 1.24%, due 2027 to 2056 | 553 |
| | 567 |
| |
| Fixed, with a weighted-average rate of 6.78%, ranging from 5.25% to 8.05%, due 2027 to perpetual | | 6,722 |
| | 6,685 |
|
| Floating, with a weighted-average rate of 0.92%, ranging from 0.78% to 1.24%, due 2027 to 2056 | | 553 |
| | 553 |
|
| Total notes issued by Bank of America Corporation | 194,103 |
| | 206,260 |
| 185,771 |
| | 194,103 |
|
Notes issued by Bank of America, N.A. | |
| | |
| |
| | |
|
| Senior notes: | |
| | |
| |
| | |
|
| Fixed, with a weighted-average rate of 2.97%, ranging from 0.07% to 7.72%, due 2014 to 2187 | 1,670 |
| | 181 |
| |
| Floating, with a weighted-average rate of 0.70%, ranging from 0.35% to 0.75%, due 2016 to 2041 | 3,684 |
| | 2,686 |
| |
| Fixed, with a weighted-average rate of 1.98%, ranging from 0.08% to 7.72%, due 2015 to 2187 | | 2,893 |
| | 1,670 |
|
| Floating, with a weighted-average rate of 0.60%, ranging from 0.36% to 0.70%, due 2015 to 2041 | | 5,686 |
| | 3,684 |
|
| Subordinated notes: | |
| | |
| |
| | |
|
| Fixed, with a weighted-average rate of 5.68%, ranging from 5.30% to 6.10%, due 2016 to 2036 | 4,876 |
| | 5,230 |
| 4,921 |
| | 4,876 |
|
| Floating, with a weighted-average rate of 0.53%, ranging from 0.25% to 0.54%, due 2016 to 2019 | 1,401 |
| | 1,401 |
| |
| Floating, with a weighted-average rate of 0.53%, ranging from 0.26% to 0.54%, due 2016 to 2019 | | 1,401 |
| | 1,401 |
|
| Advances from Federal Home Loan Banks: | | | | | | |
| Fixed, with a weighted-average rate of 4.91%, ranging from 0.01% to 7.72%, due 2014 to 2034 | 1,441 |
| | 6,225 |
| |
| Floating, with a weighted-average rate of 0.28%, ranging from 0.27% to 0.29%, due 2015 to 2016 | 3,001 |
| | — |
| |
| Fixed, with a weighted-average rate of 5.34%, ranging from 0.01% to 7.72%, due 2015 to 2034 | | 183 |
| | 1,441 |
|
| Floating, with a weighted-average rate of 0.26%, ranging from 0.24% to 0.30%, due 2015 to 2016 | | 10,500 |
| | 3,001 |
|
| Securitizations and other BANA VIEs | | 9,882 |
| | 13,367 |
|
| Total notes issued by Bank of America, N.A. | 16,073 |
| | 15,723 |
| 35,466 |
| | 29,440 |
|
| Other debt | |
| | |
| |
| | |
|
| Senior notes: | | | | | | |
| Fixed, with a weighted-average rate of 5.01%, ranging from 4.00% to 5.50%, due 2014 to 2021 | 194 |
| | 262 |
| |
| Floating, with a weighted-average rate of 2.55%, ranging from 1.93% to 2.71%, due 2014 to 2015 | 115 |
| | 705 |
| |
| Fixed, with a rate of 5.50%, due 2017 to 2021 | | 1 |
| | 194 |
|
| Floating, with a rate of 1.88%, due 2015 | | 21 |
| | 115 |
|
| Structured liabilities | 16,913 |
| | 16,127 |
| 15,971 |
| | 16,913 |
|
| Junior subordinated notes (related to trust preferred securities): | | | | | | |
| Fixed, with a weighted-average rate of 7.14%, ranging from 7.00% to 7.28%, perpetual | 340 |
| | 340 |
| 339 |
| | 340 |
|
| Floating, with a weighted-average rate of 0.87%, due 2027 | 66 |
| | 979 |
| |
| Floating, with a rate of 0.86%, due 2027 | | 66 |
| | 66 |
|
| Nonbank VIEs | | 3,425 |
| | 6,081 |
|
| Other | 2,422 |
| | 933 |
| 2,079 |
| | 2,422 |
|
| Total other debt | 20,050 |
| | 19,346 |
| 21,902 |
| | 26,131 |
|
| Total long-term debt excluding consolidated VIEs | 230,226 |
| | 241,329 |
| |
| Long-term debt of consolidated VIEs | 19,448 |
| | 34,256 |
| |
| Total long-term debt | $ | 249,674 |
| | $ | 275,585 |
| $ | 243,139 |
| | $ | 249,674 |
|
| |
(1) | On October 1, 2013, the merger of Merrill Lynch & Co., Inc.2014, FIA Card Services, N.A. was merged into Bank of America, Corporation was completed. Effective with this merger, Bank of America Corporation assumed outstanding Merrill Lynch & Co., Inc. debt including trust preferred securities.N.A. |
Bank of America Corporation and Bank of America, N.A. maintain various U.S. and non-U.S. debt programs to offer both senior and subordinated notes. The notes may be denominated in U.S. dollarsDollars or foreign currencies. At December 31, 20132014 and 20122013, the amount of foreign currency-denominated debt translated into U.S. dollarsDollars included in total long-term debt was $73.451.9 billion and $95.373.4 billion. Foreign currency contracts may be used to convert certain foreign currency-denominated debt into U.S. dollars.Dollars.
At December 31, 20132014, long-term debt of consolidated VIEs in the table above included debt of credit card, home equity and all other VIEs of $11.88.4 billion, $1.51.1 billion and $6.23.8 billion, respectively. Long-term debt of VIEs is collateralized by the assets of the VIEs. For additional information, see Note 6 – Securitizations and Other Variable Interest Entities.
At December 31, 2013 and 2012, Bank of America Corporation had approximately $131.3 billion and $154.9 billion of authorized, but unissued corporate debt and other securities under its existing U.S. shelf registration statements. At December 31, 2013 and
2012, Bank of America, N.A. had $51.8 billion and $65.5 billion of authorized, but unissued bank notes under its existing $75 billion bank note program. Long-term bank notes issued and outstanding under the program totaled $8.1 billion and $5.6 billion at December 31, 2013 and 2012. At both December 31, 2013 and 2012, Bank of America, N.A. had $20.6 billion of authorized, but unissued mortgage notes under its $30 billion mortgage bond program.
The weighted-average effective interest rates for total long-term debt (excluding senior structured notes), total fixed-rate debt and total floating-rate debt were 4.06 percent, 4.65 percent and 0.84 percent, respectively, at December 31, 2014 and 4.37 percent, 5.14 percent and 0.92 percent, respectively, at December 31,
2013 and 4.71 percent, 5.52 percent and 0.93 percent, respectively, at December 31, 2012. The Corporation’s ALM activities maintain an overall interest rate risk management strategy that incorporates the use of interest rate contracts to manage fluctuations in earnings that are caused by interest rate volatility. The Corporation’s goal is to manage interest rate sensitivity so that movements in interest rates do not significantly adversely affect earnings and capital.
The weighted-average rates are the contractual interest rates on the debt and do not reflect the impacts of derivative transactions.
Certain senior structured notes are accounted for under the fair value option. For more information on these senior structured notes, see Note 21 – Fair Value Option.
The table below shows the carrying value for aggregate annual contractual maturities of long-term debt as of December 31, 20132014. Included in the table are certain structured notes issued by the Corporation that contain provisions whereby the borrowings are redeemable at the option of the holder (put options) at specified dates prior to maturity. Other structured notes have coupon or repayment terms linked to the performance of debt or equity securities, indices, currencies or commodities, and the maturity may be accelerated based on the value of a referenced index or
security. In both cases, the Corporation or a subsidiary may be required to settle the obligation for cash or other securities prior to the contractual maturity date. These borrowings are reflected in the table as maturing at their contractual maturity date.
During 2014, the Corporation had total long-term debt maturities and purchases of $53.7 billion consisting of $33.9 billion for Bank of America Corporation, $8.9 billion for Bank of America, N.A. and $10.9 billion of other debt. During 2013, the
Corporation had total long-term debt maturities and purchases of $65.6 billion consisting of $39.3 billion for Bank of America Corporation, $16.0 billion for Bank of America, N.A. and $10.3 billion of other debt. In 2013 and 2012, in a combination of tender offers, calls and open-market transactions, the Corporation purchased senior and subordinated long-term debt with a carrying value of $9.2 billion and $12.4 billion, and recorded net losses of $59$59 million and net gains of $1.3 billion in connection with these transactions. During 2013, the Corporation had total long-term debt maturities and purchases of $65.6 billion consisting of $39.3 billion for Bank of America Corporation, $4.8 billion for Bank of America, N.A., $7.0 billion of other debt and $14.5 billion for consolidated VIEs.
| | | | | | | | | | | | | | | | | | | | | | | | | | | | | |
| Long-term Debt by Maturity | | | | | | | | | | | | | | | | | | | | | | | | | | |
| | | | | | | | | | | | | | | | | | | | | | | | | | | |
| (Dollars in millions) | 2014 | | 2015 | | 2016 | | 2017 | | 2018 | | Thereafter | | Total | 2015 | | 2016 | | 2017 | | 2018 | | 2019 | | Thereafter | | Total |
Bank of America Corporation (1) | | | | | | | | | | | | | | | | | | | | | | | | | | |
| Senior notes | $ | 24,820 |
| | $ | 15,365 |
| | $ | 18,164 |
| | $ | 18,273 |
| | $ | 20,311 |
| | $ | 35,180 |
| | $ | 132,113 |
| $ | 14,905 |
| | $ | 17,373 |
| | $ | 18,935 |
| | $ | 20,006 |
| | $ | 16,206 |
| | $ | 40,203 |
| | $ | 127,628 |
|
| Senior structured notes | 6,360 |
| | 5,561 |
| | 3,429 |
| | 1,421 |
| | 1,989 |
| | 11,815 |
| | 30,575 |
| 5,558 |
| | 2,825 |
| | 1,791 |
| | 1,885 |
| | 1,526 |
| | 8,583 |
| | 22,168 |
|
| Subordinated notes | 4 |
| | 1,263 |
| | 5,247 |
| | 5,676 |
| | 3,312 |
| | 8,675 |
| | 24,177 |
| 1,221 |
| | 5,074 |
| | 5,219 |
| | 2,951 |
| | 1,580 |
| | 12,655 |
| | 28,700 |
|
| Junior subordinated notes | — |
| | — |
| | — |
| | — |
| | — |
| | 7,238 |
| | 7,238 |
| — |
| | — |
| | — |
| | — |
| | — |
| | 7,275 |
| | 7,275 |
|
| Total Bank of America Corporation | 31,184 |
| | 22,189 |
| | 26,840 |
| | 25,370 |
| | 25,612 |
| | 62,908 |
| | 194,103 |
| 21,684 |
| | 25,272 |
| | 25,945 |
| | 24,842 |
| | 19,312 |
| | 68,716 |
| | 185,771 |
|
Bank of America, N.A. | | | | | | | | | | | | | | | | | | | | | | | | | | |
| Senior notes | 19 |
| | — |
| | 2,492 |
| | 2,664 |
| | — |
| | 179 |
| | 5,354 |
| 777 |
| | 2,498 |
| | 5,162 |
| | — |
| | 19 |
| | 123 |
| | 8,579 |
|
| Subordinated notes | — |
| | — |
| | 1,082 |
| | 3,664 |
| | — |
| | 1,531 |
| | 6,277 |
| — |
| | 1,069 |
| | 3,553 |
| | — |
| | 1 |
| | 1,699 |
| | 6,322 |
|
| Advances from Federal Home Loan Banks | 1,263 |
| | 1,503 |
| | 1,504 |
| | 11 |
| | 11 |
| | 150 |
| | 4,442 |
| 4,503 |
| | 6,003 |
| | 10 |
| | 10 |
| | 16 |
| | 141 |
| | 10,683 |
|
Securitizations and other Bank VIEs (2) | | 1,151 |
| | 1,298 |
| | 3,554 |
| | — |
| | 2,450 |
| | 1,429 |
| | 9,882 |
|
| Total Bank of America, N.A. | 1,282 |
| | 1,503 |
| | 5,078 |
| | 6,339 |
| | 11 |
| | 1,860 |
| | 16,073 |
| 6,431 |
| | 10,868 |
| | 12,279 |
| | 10 |
| | 2,486 |
| | 3,392 |
| | 35,466 |
|
| Other debt | | | | | | | | | | | | | | | | | | | | | | | | | | |
| Senior notes | 284 |
| | 24 |
| | — |
| | 1 |
| | — |
| | — |
| | 309 |
| 21 |
| | — |
| | 1 |
| | — |
| | — |
| | — |
| | 22 |
|
| Structured liabilities | 3,614 |
| | 2,049 |
| | 1,520 |
| | 1,723 |
| | 1,281 |
| | 6,726 |
| | 16,913 |
| 2,314 |
| | 2,133 |
| | 2,296 |
| | 1,281 |
| | 1,027 |
| | 6,920 |
| | 15,971 |
|
| Junior subordinated notes | — |
| | — |
| | — |
| | — |
| | — |
| | 406 |
| | 406 |
| — |
| | — |
| | — |
| | — |
| | — |
| | 405 |
| | 405 |
|
Nonbank VIEs (2) | | 20 |
| | 348 |
| | 255 |
| | 102 |
| | 27 |
| | 2,673 |
| | 3,425 |
|
| Other | 200 |
| | 56 |
| | 930 |
| | 743 |
| | 37 |
| | 456 |
| | 2,422 |
| 254 |
| | 927 |
| | 429 |
| | 45 |
| | 4 |
| | 420 |
| | 2,079 |
|
| Total other debt | 4,098 |
| | 2,129 |
| | 2,450 |
| | 2,467 |
| | 1,318 |
| | 7,588 |
| | 20,050 |
| 2,609 |
| | 3,408 |
| | 2,981 |
| | 1,428 |
| | 1,058 |
| | 10,418 |
| | 21,902 |
|
| Total long-term debt excluding consolidated VIEs | 36,564 |
| | 25,821 |
| | 34,368 |
| | 34,176 |
| | 26,941 |
| | 72,356 |
| | 230,226 |
| |
| Long-term debt of consolidated VIEs | 9,512 |
| | 1,255 |
| | 1,797 |
| | 1,522 |
| | 191 |
| | 5,171 |
| | 19,448 |
| |
| Total long-term debt | $ | 46,076 |
| | $ | 27,076 |
| | $ | 36,165 |
| | $ | 35,698 |
| | $ | 27,132 |
| | $ | 77,527 |
| | $ | 249,674 |
| $ | 30,724 |
| | $ | 39,548 |
| | $ | 41,205 |
| | $ | 26,280 |
| | $ | 22,856 |
| | $ | 82,526 |
| | $ | 243,139 |
|
| |
(1) | On October 1, 2013, the merger of Merrill Lynch & Co., Inc.2014, FIA Card Services, N.A. was merged into Bank of America, Corporation was completed. Effective with this merger, BankN.A. |
| |
(2) | Represents the total long-term debt included in the liabilities of America Corporation assumed outstanding Merrill Lynch & Co., Inc. debt including trust preferred securities.consolidated VIEs on the Consolidated Balance Sheet. |
Trust Preferred and Hybrid Securities
Trust preferred securities (Trust Securities) are primarily issued by trust companies (the Trusts) that are not consolidated. These Trust Securities are mandatorily redeemable preferred security obligations of the Trusts. The sole assets of the Trusts generally are junior subordinated deferrable interest notes of the Corporation or its subsidiaries (the Notes). The Trusts generally are 100 percent-owned finance subsidiaries of the Corporation. Obligations associated with the Notes are included in the long-term debt table on page 219210.
Certain of the Trust Securities were issued at a discount and may be redeemed prior to maturity at the option of the Corporation. The Trusts generally have invested the proceeds of such Trust Securities in the Notes. Each issue of the Notes has an interest rate equal to the corresponding Trust Securities distribution rate. The Corporation has the right to defer payment of interest on the Notes at any time or from time to time for a period not exceeding five years provided that no extension period may extend beyond the stated maturity of the relevant Notes. During any such
extension period, distributions on the Trust Securities will also be deferred and the Corporation’s ability to pay dividends on its common and preferred stock will be restricted.
The Trust Securities generally are subject to mandatory redemption upon repayment of the related Notes at their stated maturity dates or their earlier redemption at a redemption price equal to their liquidation amount plus accrued distributions to the date fixed for redemption and the premium, if any, paid by the Corporation upon concurrent repayment of the related Notes.
Periodic cash payments and payments upon liquidation or redemption with respect to Trust Securities are guaranteed by the Corporation or its subsidiaries to the extent of funds held by the Trusts (the Preferred Securities Guarantee). The Preferred Securities Guarantee, when taken together with the Corporation’s other obligations including its obligations under the Notes, generally will constitute a full and unconditional guarantee, on a subordinated basis, by the Corporation of payments due on the Trust Securities.
In 2013, the Corporation entered into various agreements with certain Trust Securities holders pursuant to which the Corporation paid $933$933 million in cash in exchange for $934$934 million aggregate liquidation amount of previously issued Trust Securities. Upon the exchange, the Corporation immediately surrendered the Trust Securities to the unconsolidated Trusts for cancellation, resulting in the cancellation of an equal amount of junior subordinated notes that had a carrying value of $934$934 million,, resulting in an insignificant gain.
In 2012, as described in Note 13 – Shareholders’ Equity, the Corporation entered into separate agreements with certain Trust Securities holders pursuant to which the Corporation issued 19 million shares of common stock valued at $159 million and paid $9.4 billion in cash in exchange for $9.8 billion aggregate liquidation amount of previously issued Trust Securities. Upon the exchange, the Corporation immediately surrendered the Trust Securities to the unconsolidated Trusts for cancellation, resulting in the cancellation of an equal amount of junior subordinated notes that had a carrying value of $9.9 billion, resulting in a gain on extinguishment of debt of $282 million.
During 2012, the Corporation remarketed the remaining outstanding $141 million in aggregate principal amount of its BAC Capital Trust XIII Floating-Rate Preferred Hybrid Income Term Securities (HITS) and the remaining outstanding $493 million in aggregate principal amount of its BAC Capital Trust XIV Fixed-to-Floating Rate Preferred HITS. The Corporation repurchased and retired all of the remarketable notes in the remarketings. The net proceeds from the remarketing of the BAC Capital Trust XIII Floating-Rate Preferred HITS were used to satisfy the obligations of Trust XIII under a stock purchase contract agreement, pursuant to which Trust XIII was obligated to purchase, and the Corporation was obligated to sell, 1,409 shares of the Corporation’s Series F
Floating Rate Non-Cumulative Preferred Stock (Series F Preferred Stock). The net proceeds from the remarketing of the BAC Capital Trust XIV Fixed-to-Floating Rate Preferred HITS were used to satisfy the obligations of Trust XIV under a stock purchase contract agreement, pursuant to which Trust XIV was obligated to purchase, and the Corporation was obligated to sell, 4,926 shares of the Corporation’s Series G Adjustable Rate Non-Cumulative Preferred Stock (Series G Preferred Stock). Following the remarketing of the notes and the subsequent purchase of the Corporation’s preferred stock under the stock purchase contracts, the preferred stock constitutes the sole asset of the applicable trust.
On May 25, 2012, the Corporation completed the repurchase of $134 million aggregate liquidation amount of capital securities of BAC Capital Trust VI, pursuant to a previously announced tender offer for such securities, and the related cancellation and retirement of the underlying 5.625% Junior Subordinated Notes, due 2035 of the Corporation issued to and held by BAC Capital Trust VI. As a result of this repurchase of capital securities and the related cancellation and retirement of the underlying 5.625% Junior Subordinated Notes, the series of covered debt benefiting from the Corporation’s replacement capital covenant,executed February 16, 2007 in connection with the issuance by BAC Capital Trust XIV of its 5.63% Fixed-to-Floating Rate Preferred Hybrid Income Term Securities (the Replacement Capital Covenant), was redesignated. Effective as of May 25, 2012, the 5.625% JuniorSubordinated Notes ceased being the covered debt under the Replacement Capital Covenant. Also effective as of May 25, 2012, theCorporation’s 6.875% Junior Subordinated Notes, due 2055 underlying the capital securities of BAC CapitalTrust XII, became the covered debt with respect to and in accordance with the terms of the ReplacementCapital Covenant.
|
| | |
| | 211Bank of America 20132212014 | | |
The Trust Securities Summary table details the outstanding Trust Securities and the related Notes previously issued which remained outstanding at December 31, 20132014. For more information on Trust Securities for regulatory capital purposes, see Note 16 – Regulatory Requirements and Restrictions.
| | | | | | | | | | | | | | | | | |
| Trust Securities Summary | Trust Securities Summary | | | | | | Trust Securities Summary | | | | | |
| (Dollars in millions) | | | | | | | | |
| | | | | | | | | | | December 31, 2014 | | | | |
| (Dollars in millions) | | | December 31, 2013 | | | | | |
| Issuer | Issuance Date | | Aggregate
Principal
Amount of Trust Securities | | Aggregate
Principal
Amount of the Notes | Stated Maturity of the Trust Securities | Per Annum Interest Rate of the Notes | | Interest Payment Dates | | Redemption Period | Issuance Date | | Aggregate
Principal
Amount of Trust Securities | | Aggregate
Principal
Amount of the Notes | Stated Maturity of the Trust Securities | Per Annum Interest Rate of the Notes | | Interest Payment Dates | | Redemption Period |
| Bank of America | | | |
| | |
| | |
| | | | | | | |
| | |
| | |
| | | | |
| Capital Trust VI | March 2005 | | $ | 36 |
| | $ | 37 |
| March 2035 | 5.63 | % | | Semi-Annual | | Any time | March 2005 | | $ | 36 |
| | $ | 37 |
| March 2035 | 5.63 | % | | Semi-Annual | | Any time |
Capital Trust VII (1) | August 2005 | | 7 |
| | 7 |
| August 2035 | 5.25 |
| | Semi-Annual | | Any time | August 2005 | | 7 |
| | 7 |
| August 2035 | 5.25 |
| | Semi-Annual | | Any time |
| Capital Trust VIII | August 2005 | | 524 |
| | 540 |
| August 2035 | 6.00 |
| | Quarterly | | On or after 8/25/10 | August 2005 | | 524 |
| | 540 |
| August 2035 | 6.00 |
| | Quarterly | | On or after 8/25/10 |
| Capital Trust XI | May 2006 | | 658 |
| | 678 |
| May 2036 | 6.63 |
| | Semi-Annual | | Any time | May 2006 | | 658 |
| | 678 |
| May 2036 | 6.63 |
| | Semi-Annual | | Any time |
| Capital Trust XV | May 2007 | | 2 |
| | 2 |
| June 2056 | 3-mo. LIBOR +80 bps |
| | Quarterly | | On or after 6/01/37 | May 2007 | | 1 |
| | 1 |
| June 2056 | 3-mo. LIBOR +80 bps |
| | Quarterly | | On or after 6/01/37 |
| NationsBank | | | |
| | |
| | |
| | | | | | | |
| | |
| | |
| | | | |
| Capital Trust III | February 1997 | | 131 |
| | 136 |
| January 2027 | 3-mo. LIBOR +55 bps |
| | Quarterly | | On or after 1/15/07 | February 1997 | | 131 |
| | 136 |
| January 2027 | 3-mo. LIBOR +55 bps |
| | Quarterly | | On or after 1/15/07 |
| BankAmerica | | | |
| | |
| | |
| | | | | | | |
| | |
| | |
| | | | |
| Capital III | January 1997 | | 103 |
| | 106 |
| January 2027 | 3-mo. LIBOR +57 bps |
| | Quarterly | | On or after 1/15/02 | January 1997 | | 103 |
| | 106 |
| January 2027 | 3-mo. LIBOR +57 bps |
| | Quarterly | | On or after 1/15/02 |
| Barnett | | | |
| | |
| | |
| | | | | | | |
| | |
| | |
| | | | |
| Capital III | January 1997 | | 64 |
| | 66 |
| February 2027 | 3-mo. LIBOR +62.5 bps |
| | Quarterly | | On or after 2/01/07 | January 1997 | | 64 |
| | 66 |
| February 2027 | 3-mo. LIBOR +62.5 bps |
| | Quarterly | | On or after 2/01/07 |
| Fleet | | | |
| | |
| | |
| | | | | | | |
| | |
| | |
| | | | |
| Capital Trust V | December 1998 | | 79 |
| | 82 |
| December 2028 | 3-mo. LIBOR +100 bps |
| | Quarterly | | On or after 12/18/03 | December 1998 | | 79 |
| | 82 |
| December 2028 | 3-mo. LIBOR +100 bps |
| | Quarterly | | On or after 12/18/03 |
| BankBoston | | | |
| | |
| | |
| | | | | | | |
| | |
| | |
| | | | |
| Capital Trust III | June 1997 | | 53 |
| | 55 |
| June 2027 | 3-mo. LIBOR +75 bps |
| | Quarterly | | On or after 6/15/07 | June 1997 | | 53 |
| | 55 |
| June 2027 | 3-mo. LIBOR +75 bps |
| | Quarterly | | On or after 6/15/07 |
| Capital Trust IV | June 1998 | | 102 |
| | 106 |
| June 2028 | 3-mo. LIBOR +60 bps |
| | Quarterly | | On or after 6/08/03 | June 1998 | | 102 |
| | 106 |
| June 2028 | 3-mo. LIBOR +60 bps |
| | Quarterly | | On or after 6/08/03 |
| MBNA | | | |
| | |
| | |
| | | | | | | |
| | |
| | |
| | | | |
| Capital Trust B | January 1997 | | 70 |
| | 73 |
| February 2027 | 3-mo. LIBOR +80 bps |
| | Quarterly | | On or after 2/01/07 | January 1997 | | 70 |
| | 73 |
| February 2027 | 3-mo. LIBOR +80 bps |
| | Quarterly | | On or after 2/01/07 |
| Countrywide | | | |
| | |
| | |
| | | | | | | |
| | |
| | |
| | | | |
| Capital III | June 1997 | | 200 |
| | 206 |
| June 2027 | 8.05 |
| | Semi-Annual | | Only under special event | June 1997 | | 200 |
| | 206 |
| June 2027 | 8.05 |
| | Semi-Annual | | Only under special event |
| Capital IV | April 2003 | | 500 |
| | 515 |
| April 2033 | 6.75 |
| | Quarterly | | On or after 4/11/08 | April 2003 | | 500 |
| | 515 |
| April 2033 | 6.75 |
| | Quarterly | | On or after 4/11/08 |
| Capital V | November 2006 | | 1,495 |
| | 1,496 |
| November 2036 | 7.00 |
| | Quarterly | | On or after 11/01/11 | November 2006 | | 1,495 |
| | 1,496 |
| November 2036 | 7.00 |
| | Quarterly | | On or after 11/01/11 |
| Merrill Lynch | | | |
| | |
| | |
| | | | | | | |
| | |
| | |
| | | | |
| Preferred Capital Trust III | January 1998 | | 750 |
| | 901 |
| Perpetual | 7.00 |
| | Quarterly | | On or after 3/08 | January 1998 | | 750 |
| | 901 |
| Perpetual | 7.00 |
| | Quarterly | | On or after 3/08 |
| Preferred Capital Trust IV | June 1998 | | 400 |
| | 480 |
| Perpetual | 7.12 |
| | Quarterly | | On or after 6/08 | June 1998 | | 400 |
| | 480 |
| Perpetual | 7.12 |
| | Quarterly | | On or after 6/08 |
| Preferred Capital Trust V | November 1998 | | 850 |
| | 1,021 |
| Perpetual | 7.28 |
| | Quarterly | | On or after 9/08 | November 1998 | | 850 |
| | 1,021 |
| Perpetual | 7.28 |
| | Quarterly | | On or after 9/08 |
| Capital Trust I | December 2006 | | 1,050 |
| | 1,051 |
| December 2066 | 6.45 |
| | Quarterly | | On or after 12/11 | December 2006 | | 1,050 |
| | 1,051 |
| December 2066 | 6.45 |
| | Quarterly | | On or after 12/11 |
| Capital Trust II | May 2007 | | 950 |
| | 951 |
| June 2067 | 6.45 |
| | Quarterly | | On or after 6/12 | May 2007 | | 950 |
| | 951 |
| June 2067 | 6.45 |
| | Quarterly | | On or after 6/12 |
| Capital Trust III | August 2007 | | 750 |
| | 751 |
| September 2067 | 7.375 |
| | Quarterly | | On or after 9/12 | August 2007 | | 750 |
| | 751 |
| September 2067 | 7.375 |
| | Quarterly | | On or after 9/12 |
| Total | | | $ | 8,774 |
| | $ | 9,260 |
| | |
| | | | | | | $ | 8,773 |
| | $ | 9,259 |
| | |
| | | | |
| |
(1) | Notes are denominated in British Pound. Presentation currency is U.S. Dollar. |
|
| | |
| | 222Bank of America 20132014212
| | |
NOTE 12 Commitments and Contingencies
In the normal course of business, the Corporation enters into a number of off-balance sheet commitments. These commitments expose the Corporation to varying degrees of credit and market risk and are subject to the same credit and market risk limitation reviews as those instruments recorded on the Consolidated Balance Sheet.
Credit Extension Commitments
The Corporation enters into commitments to extend credit such as loan commitments, standby letters of credit (SBLCs) and commercial letters of credit to meet the financing needs of its customers. The table below includes the notional amount of unfunded legally binding lending commitments net of amounts distributed (e.g., syndicated) to other financial institutions of $21.915.7 billion and $23.921.9 billion at December 31, 20132014 and 20122013.
At December 31, 20132014, the carrying value of these commitments,
excluding commitments accounted for under the fair value option, was $503546 million, including deferred revenue of $1918 million and a reserve for unfunded lending commitments of $484528 million. At December 31, 20122013, the comparable amounts were $534503 million, $2119 million and $513484 million, respectively. The carrying value of these commitments is classified in accrued expenses and other liabilities on the Consolidated Balance Sheet.
The table below also includes the notional amount of commitments of $13.09.9 billion and $18.313.0 billion at December 31, 20132014 and 20122013 that are accounted for under the fair value option. However, the table below excludes cumulative net fair value adjustments of $354405 million and $528354 million on these commitments, which are classified in accrued expenses and other liabilities. For more information regarding the Corporation’s loan commitments accounted for under the fair value option, see Note 21 – Fair Value Option.
| | | | | | | | | | | | | | | | | | | | | |
| Credit Extension Commitments | Credit Extension Commitments | | | | | Credit Extension Commitments | | | | |
| | | | | | | | | | | | | | | | | | | |
| | December 31, 2013 | December 31, 2014 |
| (Dollars in millions) | Expire in One
Year or Less | | Expire After One
Year Through
Three Years | | Expire After Three
Years Through
Five Years | | Expire After Five
Years | | Total | Expire in One
Year or Less | | Expire After One
Year Through
Three Years | | Expire After Three
Years Through
Five Years | | Expire After Five
Years | | Total |
| Notional amount of credit extension commitments | |
| | |
| | |
| | |
| | |
| |
| | |
| | |
| | |
| | |
|
| Loan commitments | $ | 80,799 |
| | $ | 105,175 |
| | $ | 133,290 |
| | $ | 21,864 |
| | $ | 341,128 |
| $ | 79,897 |
| | $ | 97,583 |
| | $ | 146,743 |
| | $ | 18,942 |
| | $ | 343,165 |
|
| Home equity lines of credit | 4,580 |
| | 16,855 |
| | 21,074 |
| | 14,301 |
| | 56,810 |
| 6,292 |
| | 19,679 |
| | 12,319 |
| | 15,417 |
| | 53,707 |
|
Standby letters of credit and financial guarantees (1) | 21,994 |
| | 8,843 |
| | 2,876 |
| | 3,967 |
| | 37,680 |
| 19,259 |
| | 9,106 |
| | 4,519 |
| | 1,807 |
| | 34,691 |
|
| Letters of credit | 1,263 |
| | 899 |
| | 4 |
| | 403 |
| | 2,569 |
| 1,883 |
| | 157 |
| | 35 |
| | 88 |
| | 2,163 |
|
| Legally binding commitments | 108,636 |
| | 131,772 |
| | 157,244 |
| | 40,535 |
| | 438,187 |
| 107,331 |
| | 126,525 |
| | 163,616 |
| | 36,254 |
| | 433,726 |
|
Credit card lines (2) | 377,846 |
| | — |
| | — |
| | — |
| | 377,846 |
| 363,989 |
| | — |
| | — |
| | — |
| | 363,989 |
|
| Total credit extension commitments | $ | 486,482 |
| | $ | 131,772 |
| | $ | 157,244 |
| | $ | 40,535 |
| | $ | 816,033 |
| $ | 471,320 |
| | $ | 126,525 |
| | $ | 163,616 |
| | $ | 36,254 |
| | $ | 797,715 |
|
| | | | | | | | | | | | | | | | | | | |
| | December 31, 2012 | December 31, 2013 |
| Notional amount of credit extension commitments | |
| | |
| | |
| | |
| | |
| |
| | |
| | |
| | |
| | |
|
| Loan commitments | $ | 103,791 |
| | $ | 83,885 |
| | $ | 130,805 |
| | $ | 19,942 |
| | $ | 338,423 |
| $ | 80,799 |
| | $ | 105,175 |
| | $ | 133,290 |
| | $ | 21,864 |
| | $ | 341,128 |
|
| Home equity lines of credit | 2,134 |
| | 13,584 |
| | 23,344 |
| | 21,856 |
| | 60,918 |
| 4,580 |
| | 16,855 |
| | 21,074 |
| | 14,301 |
| | 56,810 |
|
Standby letters of credit and financial guarantees (1) | 24,593 |
| | 11,387 |
| | 3,094 |
| | 4,751 |
| | 43,825 |
| 21,994 |
| | 8,843 |
| | 2,876 |
| | 3,967 |
| | 37,680 |
|
| Letters of credit | 2,003 |
| | 70 |
| | 10 |
| | 546 |
| | 2,629 |
| 1,263 |
| | 899 |
| | 4 |
| | 403 |
| | 2,569 |
|
| Legally binding commitments | 132,521 |
| | 108,926 |
| | 157,253 |
| | 47,095 |
| | 445,795 |
| 108,636 |
| | 131,772 |
| | 157,244 |
| | 40,535 |
| | 438,187 |
|
Credit card lines (2) | 397,862 |
| | — |
| | — |
| | — |
| | 397,862 |
| 377,846 |
| | — |
| | — |
| | — |
| | 377,846 |
|
| Total credit extension commitments | $ | 530,383 |
| | $ | 108,926 |
| | $ | 157,253 |
| | $ | 47,095 |
| | $ | 843,657 |
| $ | 486,482 |
| | $ | 131,772 |
| | $ | 157,244 |
| | $ | 40,535 |
| | $ | 816,033 |
|
| |
(1) | The notional amounts of SBLCs and financial guarantees classified as investment grade and non-investment grade based on the credit quality of the underlying reference name within the instrument were $26.1 billion and $8.2 billion at December 31, 2014, and $27.6 billion and $9.6 billion at December 31, 2013, and $31.5 billion and $11.6 billion at December 31, 2012. Amounts include consumer SBLCs of $453396 million and $669453 million at December 31, 20132014 and 20122013. |
| |
(2) | Includes business card unused lines of credit. |
Legally binding commitments to extend credit generally have specified rates and maturities. Certain of these commitments have adverse change clauses that help to protect the Corporation against deterioration in the borrower’s ability to pay.
Other Commitments
At December 31, 20132014 and 2012, the Corporation had unfunded equity investment commitments of $195 million and $307 million. At December 31, 2013, the Corporation had a commitment to purchase $1.4 billion of equity securities and, in the event the commitment is funded, intends to sell the underlying securities purchased under this commitment.
At December 31, 2013 and 2012, the Corporation had commitments to purchase loans (e.g., residential mortgage and
commercial real estate) of $1.51.8 billion and $1.31.5 billion, which upon settlement will be included in loans or LHFS.
At December 31, 20132014 and 20122013, the Corporation had commitments to enter into forward-dated resale and securities
borrowing agreements of $75.573.2 billion and $67.375.5 billion, and commitments to enter into forward-dated repurchase and securities lending agreements of $38.355.8 billion and $42.338.3 billion. These commitments expire within the next 12 months.
The Corporation is a party to operating leases for certain of its premises and equipment. Commitments under these leases are approximately $2.82.6 billion, $2.42.3 billion, $2.11.9 billion, $1.71.5 billion and $1.31.2 billion for 20142015 through 20182019, respectively, and $5.74.9 billion in the aggregate for all years thereafter.
At December 31, 2014 and 2013, the Corporation had unfunded equity investment commitments of $57 million and $195 million.
|
| | |
| | 213Bank of America 20132232014 | | |
Other Guarantees
Bank-owned Life Insurance Book Value Protection
The Corporation sells products that offer book value protection to insurance carriers who offer group life insurance policies to corporations, primarily banks. The book value protection is provided on portfolios of intermediate investment-grade fixed-income securities and is intended to cover any shortfall in the event that policyholders surrender their policies and market value is below book value. These guarantees are recorded as derivatives and carried at fair value in the trading portfolio. At both December 31, 20132014 and 20122013, the notional amount of these guarantees totaled $13.413.6 billion and $13.4 billion and the Corporation’s maximum exposure related to these guarantees totaled $3.03.1 billion and $3.0 billion with estimated maturity dates between 20302031 and 2045.2039. The net fair value including the fee receivable associated with these guarantees was $3925 million and $5239 million at December 31, 20132014 and 20122013, and reflects the probability of surrender as well as the multiple structural protection features in the contracts.
Employee Retirement Protection
The Corporation sells products that offer book value protection primarily to plan sponsors of the Employee Retirement Income Security Act of 1974 (ERISA) governed pension plans, such as 401(k) plans and 457 plans. The book value protection is provided on portfolios of intermediate/short-term investment-grade fixed-income securities and is intended to cover any shortfall in the event that plan participants continue to make qualified withdrawals after all securities have been liquidated and there is remaining book value. The Corporation retains the option to exit the contract at any time. If the Corporation exercises its option, the investment manager will either terminate the contract or convert the portfolio into a high-quality fixed-income portfolio, typically all government or government-backed agency securities, with the proceeds of the liquidated assets to assure the return of principal. To manage its exposure, the Corporation imposes restrictions and constraints on the timing of the withdrawals, the manner in which the portfolio is liquidated and the funds are accessed, and the investment parameters of the underlying portfolio. These constraints, combined with significant structural protections, are designed to provide adequate buffers and guard against payments even under extreme stress scenarios. These guarantees are recorded as derivatives and carried in the trading portfolio at fair value, in the trading portfolio.which was insignificant at December 31, 2014. At December 31, 20132014 and 20122013, the notional amount of these guarantees totaled $4.6 billion500 million and $18.44.6 billion with estimated maturity dates up to 20172019 if the exit option is exercised on all deals. The decline in notional amount in 20132014 was primarily the result of plan sponsors terminating contracts pursuant to exit options. As of December 31, 20132014, the Corporation had not made a payment under these products.
Indemnifications
In the ordinary course of business, the Corporation enters into various agreements that contain indemnifications, such as tax indemnifications, whereupon payment may become due if certain external events occur, such as a change in tax law. The indemnification clauses are often standard contractual terms and were entered into in the normal course of business based on an assessment that the risk of loss would be remote. These agreements typically contain an early termination clause that
permits the Corporation to exit the agreement upon these events.
The maximum potential future payment under indemnification agreements is difficult to assess for several reasons, including the occurrence of an external event, the inability to predict future changes in tax and other laws, the difficulty in determining how such laws would apply to parties in contracts, the absence of exposure limits contained in standard contract language and the timing of the early termination clause. Historically, any payments made under these guarantees have been de minimis. The Corporation has assessed the probability of making such payments in the future as remote.
Merchant Services
In accordance with credit and debit card association rules, the Corporation sponsors merchant processing servicers that process credit and debit card transactions on behalf of various merchants. In connection with these services, a liability may arise in the event of a billing dispute between the merchant and a cardholder that is ultimately resolved in the cardholder’s favor. If the merchant defaults on its obligation to reimburse the cardholder, the cardholder, through its issuing bank, generally has until six months after the date of the transaction to present a chargeback to the merchant processor, which is primarily liable for any losses on covered transactions. However, if the merchant processor fails to meet its obligation to reimburse the cardholder for disputed transactions, then the Corporation, as the sponsor, could be held liable for the disputed amount. In 20132014 and 20122013, the sponsored entities processed and settled $623.7647.1 billion and $604.2623.7 billion of transactions and recorded losses of $1516 million and $1015 million. A significant portion of this activity was processed by a joint venture in which the Corporation holds a 49 percent ownership. At December 31, 20132014 and 20122013, the sponsored merchant processing servicers held as collateral $203130 million and $202203 million of merchant escrow deposits which may be used to offset amounts due from the individual merchants.
The Corporation believes the maximum potential exposure for chargebacks would not exceed the total amount of merchant transactions processed through Visa and MasterCard for the last six months, which represents the claim period for the cardholder, plus any outstanding delayed-delivery transactions. As of December 31, 20132014 and 20122013, the maximum potential exposure for sponsored transactions totaled $258.5269.3 billion and $263.9258.5 billion. However, the Corporation believes that the maximum potential exposure is not representative of the actual potential loss exposure and does not expect to make material payments in connection with these guarantees.
Exchange and Clearing House Member Guarantees
The Corporation is a member of various securities and derivative exchanges and clearinghouses, both in the U.S. and other countries. As a member, the Corporation may be required to pay a pro-rata share of the losses incurred by some of these organizations as a result of another member default and under other loss scenarios. The Corporation’s potential obligations may be limited to its membership interests in such exchanges and clearinghouses, to the amount (or multiple) of the Corporation’s contribution to the guarantee fund or, in limited instances, to the full pro-rata share of the residual losses after applying the guarantee fund. The Corporation’s maximum potential exposure under these membership agreements is difficult to estimate;
however, the potential for the Corporation to be required to make these payments is remote.
Prime Brokerage and Securities Clearing Services
In connection with its prime brokerage and clearing businesses, the Corporation performs securities clearance and settlement services on behalf of its clients with other brokerage firms and clearinghouses. Under these arrangements, the Corporation stands ready to meet the obligations of its clients with respect to securities transactions. The Corporation’s obligations in this respect are secured by the assets in the clients’ accounts and the accounts of their customers as well as by any proceeds received from the transactions cleared and settled by the firm on behalf of clients or their customers. The Corporation’s maximum potential exposure under these arrangements is difficult to estimate; however, the potential for the Corporation to incur material losses pursuant to these arrangements is remote.
Other Derivative Contracts
The Corporation funds selected assets, including securities issued by CDOs and CLOs, through derivative contracts, typically total return swaps, with third parties and VIEs that are not consolidated by the Corporation. The total notional amount of these derivative contracts was $1.8 billion527 million and $2.91.8 billion with commercial banks and $1.31.2 billion and $1.41.3 billion with VIEs at December 31, 20132014 and 20122013. The underlying securities are senior securities and substantially all of the Corporation’s exposures are insured. Accordingly, the Corporation’s exposure to loss consists principally of counterparty risk to the insurers. In certain circumstances, generally as a result of ratings downgrades, the Corporation may be required to purchase the underlying assets, which would not result in additional gain or loss to the Corporation as such exposure is already reflected in the fair value of the derivative contracts.
Other Guarantees
The Corporation has entered into additional guarantee agreements and commitments, including sold risk participation swaps, liquidity facilities, lease-end obligation agreements, partial credit guarantees on certain leases, real estate joint venture guarantees, sold risk participation swaps, divested business commitments and sold put options that require gross settlement. The maximum potential future payment under these agreements was approximately $6.96.2 billion and $6.86.9 billion at December 31, 20132014 and 20122013. The estimated maturity dates of these obligations extend up to 2033. The Corporation has made no material payments under these guarantees.
In the normal course of business, the Corporation periodically guarantees the obligations of its affiliates in a variety of transactions including ISDA-related transactions and non-ISDA related transactions such as commodities trading, repurchase agreements, prime brokerage agreements and other transactions.
Payment Protection Insurance Claims Matter
In the U.K., the Corporation previously sold payment protection insurance (PPI) through its international card services business to credit card customers and consumer loan customers. PPI covers a consumer’s loan or debt repayment if certain events occur such as loss of job or illness. In response to an elevated level of customer complaints across the industry, heightened media coverage and pressure from consumer advocacy groups, the U.K. Financial Services Authority, which has subsequently been replaced by the Prudential RegulatoryRegulation Authority (PRA) and the
Financial Conduct Authority (FCA), investigated and raised concerns about the way some companies have handled complaints related to the sale of these insurance policies. In connection with this matter, the Corporation established a reserve for PPI. The reserve was $381378 million and $510381 million at December 31, 20132014 and 20122013. The Corporation recorded expense of $258621 million and $692258 million in 20132014 and 20122013. The increase in the provision was due primarily to the volume of new complaints not decreasing as expected. It is reasonably possible that the Corporation will incur additional expense related to PPI claims; however, the amount of such additional expense cannot be reasonably estimated.
Litigation and Regulatory Matters
In the ordinary course of business, the Corporation and its subsidiaries are routinely defendants in or parties to many pending and threatened legal actions and proceedings, including actions brought on behalf of various classes of claimants. These actions and proceedings are generally based on alleged violations of consumer protection, securities, environmental, banking, employment, contract and other laws. In some of these actions and proceedings, claims for substantial monetary damages are asserted against the Corporation and its subsidiaries.
In the ordinary course of business, the Corporation and its subsidiaries are also subject to regulatory and governmental examinations, information gathering requests, inquiries, investigations, and threatened legal actions and proceedings. CertainFor example, certain subsidiaries of the Corporation are registered broker/dealersbroker-dealers or investment advisors and are subject to regulation by the SEC, the Financial Industry Regulatory Authority, the European Commission, the PRA, the FCA and other international, federal and state securities regulators. In connection with formal and informal inquiries, by those agencies, suchthe Corporation and its subsidiaries receive numerous requests, subpoenas and orders for documents, testimony and information in connection with various aspects of theirthe Corporation’s regulated activities.
In view of the inherent difficulty of predicting the outcome of such litigation, regulatory and governmental matters, particularly where the claimants seek very large or indeterminate damages or where the matters present novel legal theories or involve a large number of parties, the Corporation generally cannot predict what the eventual outcome of the pending matters will be, what the timing of the ultimate resolution of these matters will be, or what the eventual loss, fines or penalties related to each pending matter may be.
In accordance with applicable accounting guidance, the Corporation establishes an accrued liability for litigation, regulatory and governmental matters when those matters present loss contingencies that are both probable and estimable. In such cases, there may be an exposure to loss in excess of any amounts accrued. As a litigation, regulatory or governmental matter develops, the Corporation, in conjunction with any outside counsel handling the matter, evaluates on an ongoing basis whether such matter presents a loss contingency that is probable and estimable. When a loss contingency is not both probable and estimable, the Corporation does not establish an accrued liability. If, at the time of evaluation, the loss contingency related to a litigation, regulatory or governmental matter is not both probable and estimable, the matter will continue to be monitored for further developments that would make such loss contingency both probable and estimable. Once the loss contingency related to a litigation, regulatory or governmental matter is deemed to be both probable and
estimable, the Corporation will establish an accrued liability with respect to such loss contingency and record a corresponding amount of litigation-related expense. The Corporation continues to monitor the matter for further developments that could affect the amount of the accrued liability that has been previously established. Excluding expenses of internal or external legal service providers, litigation-related expense of $6.116.4 billion was recognized for 20132014 compared to $4.26.1 billion for 20122013.
For a limited number of the matters disclosed in this Note for which a loss, whether in excess of a related accrued liability or where there is no accrued liability, is reasonably possible in future periods, the Corporation is able to estimate a range of possible loss. In determining whether it is possible to estimate a range of possible loss, the Corporation reviews and evaluates its material litigation, regulatory and governmental matters on an ongoing basis, in conjunction with any outside counsel handling the matter, in light of potentially relevant factual and legal developments. These may include information learned through the discovery process, rulings on dispositive motions, settlement discussions, and other rulings by courts, arbitrators or others. In cases in which the Corporation possesses sufficient appropriate information to estimate a range of possible loss, that estimate is aggregated and disclosed below. There may be other disclosed matters for which a loss is probable or reasonably possible but such an estimate of the range of possible loss may not be possible. For those matters where an estimate of the range of possible loss is possible, management currently estimates the aggregate range of possible loss is $0 to $6.12.7 billion in excess of the accrued liability (if any) related to those matters. This estimated range of possible loss is based upon currently available information and is subject to significant judgment and a variety of assumptions, and known and unknown uncertainties. The matters underlying the estimated range will change from time to time, and actual results may vary significantly from the current estimate. Those matters for which an estimate is not possible are not included within this estimated range. Therefore, this estimated range of possible loss represents
what the Corporation believes to be an estimate of possible loss only for certain matters meeting these criteria. It does not represent the Corporation’s maximum loss exposure.
Information is provided below regarding the nature of all of these contingencies and, where specified, the amount of the claim associated with these loss contingencies. Based on current knowledge, management does not believe that loss contingencies arising from pending matters, including the matters described herein, will have a material adverse effect on the consolidated financial position or liquidity of the Corporation. However, in light of the inherent uncertainties involved in these matters, some of which are beyond the Corporation’s control, and the very large or indeterminate damages sought in some of these matters, an adverse outcome in one or more of these matters could be material to the Corporation’s results of operations or cash flows for any particular reporting period.
Bond Insurance Litigation
Ambac Countrywide Litigation
The Corporation, Countrywide and other Countrywide entities are named as defendants in an action filed on September 29, 2010 and as amended on May 28, 2013, by Ambac Assurance Corporation and the Segregated Account of Ambac Assurance Corporation (together, Ambac), entitled Ambac Assurance
Corporation and The Segregated Account of Ambac Assurance Corporation v. Countrywide Home Loans, Inc., et al. This action, currently pending in New York Supreme Court, New York County, relates to bond insurance policies provided by Ambac on certain securitized pools of second-lien (and in one pool, first-lien) home equity lines of credit (HELOCs),HELOCs, first-lien subprime home equity loans and fixed-rate second-lien mortgage loans. Plaintiffs allege that they have paid claims as a result of defaults in the underlying loans and assert that the Countrywide defendants misrepresented the characteristics of the underlying loans and breached certain contractual representations and warranties regarding the underwriting and servicing of the loans. Plaintiffs also allege that the Corporation is liable based on successor liability theories. Damages claimed by Ambac are in excess of $2.5$2.2 billion and include the amount of payments for current and future claims it has paid or claims it will be obligated to pay under the policies, increasing over time as it pays claims under relevant policies, plus unspecified punitive damages.
On December 30, 2014, Ambac filed a second complaint in the same court against the same defendants, claiming fraudulent inducement against Countrywide and successor and vicarious liability against the Corporation relating to eight partially Ambac-insured RMBS transactions that closed between 2005 and 2007, all backed by negative amortization pay option adjustable-rate mortgage (ARM) loans that were originated in whole or in part by Countrywide. Seven of the eight securitizations were issued and underwritten by non-parties to the litigation. Ambac claims damages in excess of $600 million consisting of all alleged past and future claims against its policies, plus other unspecified compensatory and punitive damages.
Also on December 30, 2014, Ambac filed a third action in Wisconsin Circuit Court, Dane County, against Countrywide Home Loans, Inc., claiming that it was fraudulently induced to insure portions of five securitizations issued and underwritten in 2005 by a non-party that included Countrywide originated first-lien negative amortization pay option ARM loans. The complaint claims damages in excess of $350 million for all alleged past and future Ambac insured claims payment obligations plus other unspecified compensatory and punitive damages.
Ambac First Franklin Litigation
On April 16, 2012, Ambac sued First Franklin Financial Corp., BANA, Merrill Lynch, Pierce, Fenner & Smith (MLPF&S),MLPF&S, Merrill Lynch Mortgage Lending, Inc. (MLML), and Merrill Lynch Mortgage Investors, Inc. in New York Supreme Court, New York County. Plaintiffs’ claims relate to guaranty insurance Ambac provided on a First Franklin securitization (Franklin Mortgage Loan Trust, Series 2007-FFC). The securitization was sponsored by MLML, and certain certificates in the securitization were insured by Ambac. The complaint alleges that defendants breached representations and warranties concerning the origination of the underlying mortgage loans and asserts claims for fraudulent inducement, breach of contract and indemnification. Plaintiffs also assert breach of contract claims against BANA based upon its servicing of the loans in the securitization. The complaint does not specifyalleges that Ambac has paid hundreds of millions of dollars in claims and has accrued and continues to accrue tens of millions of dollars in additional claims, and Ambac seeks as damages the amounttotal claims it has paid and its projected claims payment obligations, as well as specific performance of damages sought.defendants’ contractual repurchase obligations.
On July 19, 2013, the court denied defendants’ motion to dismiss Ambac’s contract and fraud causes of action but granted dismissal of Ambac’s indemnification cause of action. In addition, the court denied defendants’ motion to dismiss Ambac’s claims for attorneys’ fees and punitive damages.
FGIC
The Corporation, Countrywide and other Countrywide entities are named as defendants in an action filed on December 11, 2009 by Financial Guaranty Insurance Company (FGIC) entitled Financial Guaranty Insurance Co. v. Countrywide Home Loans, Inc., et al. This action, currently pending in New York Supreme Court, New York County, relates to bond insurance policies provided by FGIC on securitized pools of HELOCs and fixed-rate second-lien mortgage loans. Plaintiff alleges that it has paid claims as a result of defaults in the underlying loans and asserts that the Countrywide defendants misrepresented the characteristics of the underlying loans and breached certain contractual representations and warranties regarding the underwriting and servicing of the loans. Plaintiffs also allege that the Corporation is liable based on successor liability theories. Damages claimed by FGIC are in excess of $1.8 billion and include the amount of payments for current and future claims it has paid or claims it will be obligated to pay under the policies, increasing over time as it pays claims under relevant policies, plus unspecified punitive damages.
Credit Card Debt Cancellation and Identity Theft Protection Products
FIA has received inquiries from and has been in discussions with regulatory authorities to address concerns regarding the sale and marketing of certain optional credit card debt cancellation products. The Corporation may be subject to a regulatory enforcement action and will be required to pay restitution or provide other relief to customers, and pay penalties to one or more regulators.
In addition, BANA and FIA have been in discussions with regulatory authorities to address concerns that some customers may have paid for but did not receive certain benefits of optional identity theft protection services from third-party vendors of BANA and FIA, including whether appropriate oversight of such vendors existed. The Corporation has issued and will continue to issue refund checks to impacted customers and may be subject to regulatory enforcement actions and penalties.
European Commission – Credit Default Swaps Antitrust Investigation
On July 1, 2013, the European Commission (Commission) announced that it had addressed a Statement of Objections (SO) to the Corporation, BANA and Banc of America Securities LLC (together, the Bank of America Entities);, a number of other financial institutions;institutions, Markit Group Limited;Limited, and the International Swaps and Derivatives Association (together, the Parties). The SO sets forth the Commission’s preliminary conclusion that the Parties infringed European Union competition law by participating in alleged collusion to prevent exchange trading of CDS and futures. According to the SO, the conduct of the Bank of America Entities took place between August 2007 and April 2009. As part of the Commission’s procedures, the Parties have been given the opportunity to reviewreviewed the evidence in the investigative file, respondresponded to the Commission’s preliminary conclusions and requestattended a hearing before the Commission. If the Commission is satisfied
that its preliminary conclusions are proved, the Commission has stated that it intends to impose a fine and require appropriate remedial measures.
Fontainebleau Las Vegas Litigation
On June 9, 2009,Avenue CLO Fund Ltd., et al. v. Bank of America, N.A., Merrill Lynch Capital Corporation, et al. was filed in the U.S. District Court for the District of Nevada by certain Fontainebleau Las Vegas, LLC (FBLV) project lenders. Plaintiffs alleged that, among other things, BANA breached its duties as disbursement agent under the agreement governing the disbursement of loaned funds to FBLV, then a Chapter 11 debtor-in-possession. Plaintiffs seek monetary damages of more than $700 million, plus interest. This action was subsequently transferred by the U.S. Judicial Panel on Multidistrict Litigation (JPML) to the U.S. District Court for the Southern District of Florida.
On March 19, 2012, the district court granted BANA’s motion for summary judgment on all causes of action against it in its capacity as disbursement agent and denied plaintiffs’ motion for summary judgment on those claims. On July 26, 2013, the U.S. Court of Appeals for the Eleventh Circuit affirmed in part and reversed in part the district court’s dismissal of the disbursement agent claims against BANA, holding that there were factual disputes that could not be resolved on a summary judgment motion, and remanded the case to the district court for further proceedings.
Dismissal of the other claims was affirmed on a separate appeal. On December 13, 2013, the JPML remanded the action to the District of Nevada for trial.
The parties have settled the action for $300 million, an amount that was fully accrued as of December 31, 2014. Pursuant to the settlement, plaintiffs have stipulated to the voluntary dismissal of their remaining claims with prejudice.
In re Bank of America Securities, Derivative and Employee Retirement Income Security Act (ERISA) Litigation
Beginning in January 2009, the Corporation, as well as certain current and former officers and directors, among others, were named as defendants in a variety of actions filed in state and federal courts. The actions generally concern alleged material misrepresentations and/or omissions with respect to certain securities filings by the Corporation. The securities filings contained information with respect to events that took place from September 2008 through January 2009 contemporaneous with the Corporation’s acquisition of Merrill Lynch.Lynch & Co., Inc. (Merrill Lynch). Certain federal court actions were consolidated and/or coordinated in the U.S. District Court for the Southern District of New York (the District Court) under the caption In re Bank of America Securities, Derivative and Employee Retirement Income Security Act (ERISA) Litigation.
Securities Actions
Plaintiffs in the consolidated securities class action (the Consolidated Securities Class Action) asserted claims under Sections 14(a), 10(b) and 20(a) of the Securities Exchange Act of 1934, and Sections 11, 12(a)(2) and 15 of the Securities Act of 1933 and asserted damages based on the drop in the stock price upon subsequent disclosures.
On April 5, 2013, the U.S. District Court for the Southern District of New York granted final approval toof the settlement of the Consolidated Securities Class Action. Certain class members have appealed the district court’s final approval of the settlement toOn November 5, 2014, the U.S. Court of Appeals for the Second Circuit.Circuit affirmed the final approval of the settlement of the Consolidated Securities Class Action. On February 3, 2015, the deadline for filing a petition for writ of certiorari with the U.S. Supreme Court elapsed without any objector filing a petition.
Certain shareholders opted to pursue their claims apart from the Consolidated Securities Class Action. These individual plaintiffs asserted substantially the same facts and claims as the class action plaintiffs. Following settlements in an aggregate amount that was fully accrued as of December 31, 2013, the court hasDistrict Court dismissed the claims of these plaintiffs with prejudice.
New York Attorney General (NYAG)In addition, on January 11, 2013, the District Court approved the settlement of claims filed by plaintiffs in a derivative action in the Consolidated Securities Class Action, which also resolved a consolidated derivative action filed in the Delaware Court of Chancery.
On February 4,In addition, the District Court dismissed a complaint filed by plaintiffs in the ERISA actions in the Consolidated Securities Class Action on August 27, 2010, and the NYAG filed a civil complaint in New York Supreme Court, New York County, entitled Peopleparties stipulated to the withdrawal of the Stateappeal of New York v. Bank of America, et al. The complaint named as defendants the Corporation and the Corporation’s former CEO and CFO, and alleges violations of Sections 352, 352-c(1)(a), 352-c(1)(c) and 353 of the Martin Act, and Section 63(12) of the New York Executive Law. The complaint sought an unspecified amount in disgorgement, penalties, restitution, and damages and other equitable relief. The NYAG has stated publicly that it has withdrawn its demand for damages, but continues to pursue other relief under the Martin Act and New York Executive Law.decision on January 14, 2013.
Interchange and Related Litigation
In 2005, a group of merchants filed a series of putative class actions and individual actions directed at interchange fees associated with Visa and MasterCard payment card transactions. These actions, which were consolidated in the U.S. District Court for the Eastern District of New York under the caption In Re Payment Card Interchange Fee and Merchant Discount Anti-Trust Litigation (Interchange), named Visa, MasterCard and several banks and bank holding companies (BHCs), including the Corporation, as defendants. Plaintiffs allege that defendants conspired to fix the level of default interchange rates which represent the fee an issuing bank charges an acquiring bank on every transaction. Plaintiffs also challenged as unreasonable restraints of trade under Section 1 of the Sherman Act,and that certain rules of Visa and MasterCard related to merchant acceptance of payment cards at the point of sale.sale were unreasonable restraints of trade. Plaintiffs sought unspecified damages and injunctive relief based on their assertion that interchange would be lower or eliminated absent the alleged conduct.relief.
In addition, plaintiffs filed supplemental complaints against certain defendants, including the Corporation, relating to initial public offerings (IPOs) of MasterCard and Visa. Plaintiffs alleged that the IPOs violated Section 7 of the Clayton Act and Section 1 of the Sherman Act. Plaintiffs also asserted that the MasterCard IPO was a fraudulent conveyance. Plaintiffs sought unspecified damages and to undo the IPOs.
On October 19, 2012, defendants entered an agreement to settlesettled the class plaintiffs’ claims. The defendants also separately agreed to resolve the claims brought by a group of individual retailers that opted out of the class to pursue independent litigation.matter. The settlement agreements provideprovides for, among other things, (i) payments by defendants to the class and individual plaintiffs totaling approximately $6.6$6.6 billion,, allocated proportionately to each defendant based upon various loss-sharing agreements; (ii) distribution to class merchants of an amount equal to 10 bps of default interchange across all Visa and MasterCard credit card transactions for a period of eight consecutive months, to begin by July 29, 2013, which otherwise would have been paid to issuers and which effectively reduces credit interchange for that period of time; and (iii) modifications to certain Visa and MasterCard rules regarding merchant point of sale practices.
The court granted final approval of the class settlement agreement on December 13, 2013. Several class members have appealed to the U.S. Court of Appeals for the Second Circuit. In addition, a number of class members opted out of the settlement of their past damages claims. The cash portion of the settlement will bewas adjusted downward as a result of these opt outs, subject to certain conditions.outs.
Twenty-seven actions have been filed by merchant class members who opted outThe Corporation is named in three of the settlement. The Corporation has been named as a defendant in two of these opt outopt-out suits, including one brought by cardholders, and, as a result of various sharing agreements from the main Interchange litigation, the Corporation remains liable for any settlement or judgment in opt outopt-out suits where it is not named as a defendant. All but one of the opt-out suits filed to date have been consolidated in the U.S. District Court for the Eastern District of New York. On July 18, 2014, the court denied defendants’ motion to dismiss opt-out complaints filed by merchants, and on November 26, 2014, the court granted defendants’ motion to dismiss the Sherman Act claim in the cardholder complaint.
LIBOR, Other Reference Rate and Foreign Exchange (FX) Inquiries and Litigation
The Corporation has received subpoenas and information requests from government authorities in North America, Europe and the Asia Pacific region, including the DOJ,DoJ, the U.S. Commodity Futures Trading Commission (CFTC) and the U.K. Financial Conduct Authority,FCA, concerning submissions made by panel banks in connection with the setting of London interbank offered rates (LIBOR)LIBOR and other reference rates. The Corporation is cooperating with these inquiries.
Government authorities in North America, Europe and Asia are conducting investigations and making inquiries of a significant number of FX market participants, including the Corporation, regarding conduct and practices in certain FX markets over multiple years. The Corporation is cooperating with these investigations and inquiries.
In addition, the Corporation and BANA have been named as defendants along with most of the other LIBOR panel banks in a series of individual and class actions in various U.S. federal and state courts relating to defendants’ LIBOR contributions. All cases naming the Corporation have been or are in the process of being consolidated for pre-trial purposes in the U.S. District Court for the Southern District of New York by the JPML. The Corporation expects that any future cases naming the Corporationit will similarly be consolidated for pre-trial purposes. Plaintiffs allege that they held or transacted in U.S. dollarDollar LIBOR-based derivatives or other financial instruments and sustained losses as a result of collusion or manipulation by defendants regarding the setting of U.S. dollarDollar LIBOR. Plaintiffs assert a variety of claims, including antitrust and Racketeer Influenced and Corrupt Organizations (RICO), common law fraud, and breach of contract claims, and seek compensatory, treble and punitive damages, and injunctive relief.
On March 29, 2013,In a series of rulings, the court dismissed the antitrust, RICO and relatedcertain state law claims, while permitting the Commodity Exchange Act and other state law claims to proceed. As a result of a procedural ruling by the Supreme Court, plaintiffs are pursuing an immediate appeal of the dismissal of their antitrust claims. Further, based on the statute of limitations, the court has substantially
limited the time period for which manipulation claims under the CommoditiesCommodity Exchange Act that are allowed to proceed. The court’s rulings willmay be applicable to later filed actionspursued. As to the extent they assert similar claims. TheCorporation and BANA, the court has also dismissed manipulation claims based on alleged trader conduct, and certain common law claims by plaintiffs who alleged no direct dealings with the Corporation or BANA. Other claims against the Corporation and BANA remain pending, however, and the court is continuing to consider motions regarding them, including the remaining claims.applicability of its prior rulings to subsequently filed actions.
Certain regulatory and government authorities in North America, Europe and the Asia Pacific region are conducting investigations and making inquiries of a significant number of FX market participants, including the Corporation, regarding FX market participants’ conduct and systems and controls over multiple years. The Corporation is cooperating with these investigations and inquiries, some of which are likely to lead to regulatory or legal proceedings and expose the Corporation to material penalties, fines or losses, and could adversely affect its reputation.
In particular, in November 2014, the Corporation resolved a matter with the Office of the Comptroller of the Currency (OCC) by agreeing to the imposition of mandatory remedial measures and payment of $250 million in civil penalties associated with the Corporation’s FX business and its systems and controls.
The Corporation is in separate advanced discussions to resolve the regulatory matters of concern to another U.S. banking regulator involving the Corporation’s FX business and its systems and controls. There can be no assurances that these discussions will lead to a resolution, or of the amount or timing of any such resolution.
In addition, in a consolidated amended complaint filed on March 31, 2014, the Corporation and BANA were named as defendants along with other FX market participants in a putative class action filed in the U.S. District Court for the Southern District of New York on behalf of plaintiffs and a putative class who allegedly transacted in FX and are domiciled in the U.S. or transacted in FX in the U.S. (the U.S. Action). On April 30, 2014, a substantively similar class action was filed against the Corporation and other FX market participants on behalf of a plaintiff and putative class allegedly located in Norway (the Foreign Action). The complaints allege that class members transacted with defendants at or around the time of the fixing of the WM/Reuters Closing Spot Rates or entered into transactions that settled in whole or in part based on the WM/Reuters Closing Spot Rates and that they sustained losses as a result of the defendants’ alleged conspiracy to manipulate the WM/Reuters Closing Spot Rates. Plaintiffs in the U.S. Action assert a single claim for violations of Sections 1 and 3 of the Sherman Act, and plaintiff in the Foreign Action asserts claims for violations of the Sherman Act, as well as certain claims under New York statutory and common law. Plaintiffs seek compensatory and treble damages, and declaratory and injunctive relief.
On June 14, 2013,January 28, 2015, the Monetary Authoritycourt denied defendants’ motion to dismiss the U.S. Action, finding that plaintiffs had sufficiently pleaded the elements of Singapore (MAS) announcedan antitrust claim. In the results of its review ofsame decision, the submission processes of panel banks, including BANA (Singapore Branch), relatingcourt granted with prejudice defendants’ motion to reference rates setdismiss the Foreign Action, finding that the Sherman Act does not apply extraterritorially, except in Singapore, includinglimited circumstances not present in the Singapore Interbank Offered Rates (SIBOR), Swap Offered Rates (SOR)case, and reference rates usedthat plaintiff had failed to settle non-deliverable forward contracts. All of the banks, including BANA (Singapore Branch), were found to have deficiencies in governance, risk management, internal controlsplead an actionable state law claim.
and surveillance systems from 2007 to 2011 related to their submission processes. All of the banks, including BANA (Singapore Branch), were required to adopt measures to address these deficiencies, report their progress in addressing these deficiencies on a quarterly basis, and conduct independent reviews to ensure the robustness of their remedial measures. Nineteen of the 20 banks were also required to deposit increased statutory reserves with the MAS at zero percent interest for one year; BANA (Singapore Branch) was required to deposit 700 million Singapore Dollars (approximately $551 million U.S. dollars).
Montgomery
The Corporation, several current and former officers and directors, Banc of America Securities LLC (BAS), MLPF&S and other unaffiliated underwriters have been named as defendants in a putative class action filed in the U.S. District Court for the Southern District of New York entitled Montgomery v. Bank of America, et al. Plaintiff filed an amended complaint on January 14, 2011. Plaintiff seeks to sue on behalf of all persons who acquired certain series of preferred stock offered by the Corporation pursuant to a shelf registration statement dated May 5, 2006. Plaintiff’s claims arise from three offerings dated January 24, 2008, January 28, 2008 and May 20, 2008, from which the Corporation allegedly received proceeds of $15.8 billion.$15.8 billion. The amended complaint asserts claims under Sections 11, 12(a)(2) and 15 of the Securities Act of 1933, and alleges that the prospectus supplements associated with the offerings: (i) failed to disclose that the Corporation’s loans, leases, CDOs and commercial MBS were impaired to a greater extent than disclosed; (ii) misrepresented the extent of the impaired assets by failing to establish adequate reserves or properly record losses for its impaired assets; (iii) misrepresented the adequacy of the Corporation’s internal controls in light of the alleged impairment of its assets; (iv) misrepresented the Corporation’s capital base and Tier 1 leverage ratio for risk-based capital in light of the allegedly impaired assets; and (v) misrepresented the thoroughness and adequacy of the Corporation’s due diligence in connection with its acquisition of Countrywide. The amended complaint seeks rescission, compensatory and other damages. On March 16, 2012, the district court granted defendants’ motion to dismiss the first amended complaint. On December 3, 2013, the district court denied plaintiffs’ motion to file a second amended complaint. On February 6, 2014, plaintiffs filed a noticeappealed the denial of appealtheir motion to amend to the U.S. Court of Appeals for the Second Circuit as to the district court’s denial of their motion to amend.Circuit.
Mortgage-backed Securities Litigation and Other Government Mortgage Origination Investigations
The Corporation and its affiliates, Countrywide entities and their affiliates, and Merrill Lynch entities and their affiliates have been named as defendants in a number of cases relating to their various roles as issuer, originator, seller, depositor, sponsor, underwriter and/or controlling entity in MBS offerings, pursuant to which the MBS investors were entitled to a portion of the cash flow from the underlying pools of mortgages. These cases generally include purported class action suits and actions by individual MBS purchasers and governmental actions.purchasers. Although the allegations vary by lawsuit, these cases generally allege that the registration statements, prospectuses and prospectus supplements for securities issued by securitization trusts contained material misrepresentations and omissions, in violation of the Securities Act of 1933 the Financial Institutions Reform, Recovery, and Enforcement Act of 1989
(FIRREA) and/or state securities laws and other state statutory and common laws.
These cases generally involve allegations of false and misleading statements regarding: (i) the process by which the properties that served as collateral for the mortgage loans underlying the MBS were appraised; (ii) the percentage of equity that mortgage borrowers had in their homes; (iii) the borrowers’ ability to repay their mortgage loans; (iv) the underwriting practices by which those mortgage loans were originated; (v) the ratings given to the different tranches of MBS by rating agencies; and (vi) the validity of each issuing trust’s title to the mortgage loans comprising the pool for that securitization (collectively, MBS Claims). Plaintiffs in these cases generally seek unspecified compensatory damages, unspecified costs and legal fees and, in some instances, seek rescission. A number of other entities have threatened legal actions against the Corporation and its affiliates, Countrywide entities and their affiliates, and Merrill Lynch entities and their affiliates concerning MBS offerings.
The Corporation, Countrywide, Merrill Lynch and/or their affiliates may have claims for and/or may be subject to claims for contractual indemnification in connection with their various roles in regard to MBS.
On August 15, 2011, the JPML ordered multiple federal court cases involving Countrywide MBS consolidated for pretrial purposes in the U.S. District Court for the Central District of California in a multi-district litigation entitled In re Countrywide Financial Corp. Mortgage-Backed Securities Litigation (the Countrywide RMBS MDL).
AIG Litigation
On August 8, 2011, American International Group, Inc. and certain of its affiliates (collectively, AIG) filed a complaint in New York Supreme Court, New York County, in a case entitled American International Group, Inc., et al. v. Bank of America Corporation, et al. AIG has named the Corporation, Merrill Lynch, Countrywide Home loans, Inc. (CHL) and a number of related entities as defendants. AIG’s complaint asserts certain MBS Claims pertaining to 347 MBS offerings and two private placements in which it alleges that it purchased securities between 2005 and 2007. AIG seeks rescission of its purchases or a rescissory measure of damages or, in the alternative, compensatory damages of no less than $10 billion, punitive damages and other unspecified relief. Defendants removed the case to the U.S. District Court for the Southern District of New York and the district court denied AIG’s motion to remand. On April 19, 2013, the U.S. Court of Appeals for the Second Circuit issued a decision vacating the order denying AIG’s motion to remand, and remanded the case to the district court for further proceedings concerning whether the court will exercise its jurisdiction on other grounds.
On December 21, 2011, the JPML transferred the Countrywide MBS claims to the Countrywide RMBS MDL in the Central District of California. The non-Countrywide MBS claims remain in the U.S. District Court for the Southern District of New York.
On May 23, 2012, the district court in the Central District of California dismissed with prejudice plaintiffs’ federal securities claims and certain of the state law common law claims. On August 31, 2012, AIG filed an amended complaint, which among other things, added claims against the Corporation and certain related entities for constructive fraudulent conveyance and intentional fraudulent conveyance. On May 6, 2013, the district court dismissed the fraudulent conveyance and successor liability claims against the Corporation and related entities. On October
10, 2013, AIG filed a Third Amended Complaint, which is limited to the claims transferred to the Countrywide RMBS MDL. It concerns 159 offerings and asserts damages of approximately $5 billion only with respect to the RMBS at issue in the Countrywide RMBS MDL.
Civil RMBS Matters Filed by the DOJ and the SEC
On August 6, 2013, the DOJ and the SEC filed separate civil actions in the U.S. District Court for the Western District of North Carolina against MLPF&S, BANA and Banc of America Mortgage Securities, Inc. (and, in the DOJ case, the Corporation). Both cases allege generally that the offering materials for a single 2008 RMBS offering contained material misstatements and omissions regarding, inter alia, the concentration of loans originated in the wholesale loan channel. The DOJ case asserts violations of FIRREA and the SEC case asserts claims under Sections 17(a)(2) and (3) and Section 5(b)(1) of the Securities Act of 1933. The complaints demand unspecified damages and other relief. Defendants moved to dismiss both complaints on November 8, 2013.
FHFA Litigation
FHFA, as conservator for FNMA and FHLMC, filed an action on September 2, 2011 against the Corporation and related entities, Countrywide and related entities, certain former officers of these entities, and NB Holdings Corporation in New York Supreme Court, New York County, entitled Federal Housing Finance Agency v. Countrywide Financial Corporation, et al. (the FHFA Countrywide Litigation). FHFA’s complaint asserts certain MBS Claims in connection with allegations that FNMA and FHLMC purchased MBS issued by Countrywide-related entities in 86 MBS offerings between 2005 and 2008. FHFA seeks, among other relief, rescission of the consideration paid for the securities or, in the alternative, unspecified compensatory damages allegedly incurred by FNMA and FHLMC, including consequential damages. FHFA also seeks recovery of punitive damages.
On September 30, 2011, Countrywide removed the FHFA Countrywide Litigation from New York Supreme Court to the U.S. District Court for the Southern District of New York. On February 7, 2012, the JPML transferred the matter to the Countrywide RMBS MDL. On October 18, 2012, the court dismissed as untimely FHFA’s Section 11 claims as to 24 of the 86 MBS allegedly purchased by FNMA and FHLMC, but otherwise denied the motion to dismiss on statute of limitations and statute of repose grounds. On February 6, 2013, FHFA agreed to voluntarily dismiss certain of its Virginia blue sky claims. On March 15, 2013, the court dismissed the negligent misrepresentation and aiding and abetting claims as to all defendants, and the Securities Act of 1933 and Washington, D.C. blue sky claims as to certain defendants. The court also dismissed FHFA’s successor liability claims but permitted FHFA leave to amend its fraudulent conveyance claims. The court otherwise denied defendants’ motions to dismiss. On June 7, 2013, the court denied with prejudice FHFA’s motion for leave to amend its successor liability claims, based upon fraudulent conveyance theories, against the Corporation.
Also on September 2, 2011, FHFA, as conservator for FNMA and FHLMC, filed complaints in the U.S. District Court for the Southern District of New York against the Corporation and Merrill Lynch-related entities, and certain current and former officers and directors of these entities. The actions are entitled Federal Housing Finance Agency v. Bank of America Corporation, et al. (the FHFA Bank of America Litigation) and Federal Housing Finance Agency v.
Merrill Lynch & Co., Inc., et al. (the FHFA Merrill Lynch Litigation). The complaints assert certain MBS Claims relating to MBS issued and/or underwritten by the Corporation, Merrill Lynch and related entities in 23 MBS offerings and in 72 MBS offerings, respectively, between 2005 and 2008 and allegedly purchased by either FNMA or FHLMC in their investment portfolio. FHFA seeks, among other relief, rescission of the consideration paid for the securities or alternatively damages allegedly incurred by FNMA and FHLMC, including consequential damages. FHFA also seeks recovery of punitive damages in the FHFA Merrill Lynch Litigation.
On November 8, 2012 and November 28, 2012, the court denied motions to dismiss in the FHFA Merrill Lynch Litigation and the FHFA Bank of America Litigation, respectively.
On December 16, 2013, the district court granted FHFA’s motion for partial summary judgment, ruling that loss causation is not an element of, or a defense to, FHFA’s claims under Virginia or Washington, D.C. blue sky laws. The FHFA Merrill LynchLitigation is set for trial in June 2014; the FHFA Bank of AmericaLitigation is set for trial in January 2015.
Federal Home Loan Bank Litigation
On January 18, 2011, the Federal Home Loan Bank of Atlanta (FHLB Atlanta) filed a complaint asserting certain MBS Claims against the Corporation, Countrywide and other Countrywide entities in Georgia State Court, Fulton County, entitled Federal Home Loan Bank of Atlanta v. Countrywide Financial Corporation, et al. FHLB Atlanta sought rescission of its purchases or a rescissory measure of damages, unspecified punitive damages and other unspecified relief in connection with its alleged purchase of 16 MBS offerings issued and/or underwritten by Countrywide-related entities between 2004 and 2007. Pursuant to a settlement that was fully accrued as of December 31, 2013 and is not material to the Corporation’s results of operations, FHLB Atlanta voluntarily dismissed its claims with prejudice on December 9, 2013.
On March 15, 2010, the Federal Home Loan Bank of San Francisco (FHLB San Francisco) filed an action in California Superior Court, San Francisco County, entitledFederal Home Loan Bank of San Francisco v. Credit Suisse Securities (USA) LLC, et al.al. FHLB San Francisco’s complaint asserts certain MBS Claims against BAS, Countrywide and several related entities in connection with its alleged purchase of 51 MBS offerings and one private placement issued and/or underwritten by those defendants between 2004 and 2007 and seeks rescission and unspecified damages. FHLB San Francisco dismissed the federal claims with prejudice on August 11, 2011. On September 8, 2011, the court denied defendants’ motions to dismiss the state law claims. On December 20, 2013, FHLB San Francisco voluntarily dismissed its negligent misrepresentation claims with prejudice. On October 15, 2014, the court denied the parties’ cross-motions for summary judgment with respect to two Countrywide trusts that were to be part of a bellwether trial.
The parties have settled the action and other related actions for $420 million, as well as with respect to certain claims, additional consideration; all amounts were fully accrued as of December 31, 2014. Pursuant to the settlement, FHLB San Francisco has voluntarily dismissed its remaining claims with prejudice.
Luther Class Action Litigation and Related Actions
Beginning in 2007, a number of pension funds and other investors filed putative class action lawsuits alleging certain MBS Claims against Countrywide, several of its affiliates, MLPF&S, the Corporation, NB Holdings Corporation and certain other defendants. Those class action lawsuits concerned a total of 429 MBS offerings involving over $350 billion in securities issued by subsidiaries of Countrywide between 2005 and 2007. The actions, entitledLuther v. Countrywide Financial Corporation, et al., Maine State Retirement System v. Countrywide Financial Corporation, et
al.,Western Conference of Teamsters Pension Trust Fund v. Countrywide Financial Corporation, et al., andPutnam Bank v. Countrywide Financial Corporation, et al., were all eventually assigned to the Countrywide RMBS MDL court. On December 6, 2013, the court granted final approval to a settlement of these actions in the amount of $500 million. Beginning on January 14, 2014, a number of class members filed notices of appeal inappealed to the U.S. Court of Appeals for the Ninth Circuit.
Prudential Insurance Litigation
On March 14, 2013, The Prudential Insurance Company of America and certain of its affiliates (collectively Prudential) filed a complaint in the U.S. District Court for the District of New Jersey, in a case entitled Prudential Insurance Company of America, et al. v. Bank of America, N.A., et al. Prudential has named the Corporation, Merrill
Lynch and a number of related entities as defendants. Prudential’s complaintPrudential asserts certain MBS Claims pertaining to 54 MBS offerings infrom which Prudential alleges that it purchased securities between 2004 and 2007. Prudential seeks, among other relief, compensatory damages, rescission or a rescissory measure of damages, treble damages, punitive damages and other unspecified relief.
Regulatory On April 17, 2014, the court granted in part and Governmental Investigations
The Corporation has received a number of subpoenas and other requests for information from regulators and governmental authorities regarding MBS and other mortgage-related matters, including inquiries, investigations and potential proceedings relateddenied in part defendants’ motion to a number of transactions involvingdismiss the underwriting and issuance of MBS by the Corporation (including legacy entities the Corporation acquired) and participation in certain CDO and structured investment vehicle offerings. These inquiries and investigations include, among others, investigations by the RMBS Working Group of the Financial Fraud Enforcement Task Force, including the DOJ and state Attorneys General, concerning the purchase, securitization and underwriting of mortgage loans and RMBS. The Corporation has provided documents and testimony, and continues to cooperate fully with these inquiries and investigations.
The staff of the NYAG has advised that they intend to recommendcomplaint. Prudential thereafter split its claims into two separate complaints, filing an amended complaint in the original action against MLPF&S asand a resultcomplaint in a separate action entitled Prudential Portfolios 2, et al. v. Bank of their RMBS investigation. In addition, the staff of a U.S. Attorney’s office advised that they intend to recommend that the DOJ file a civil action against affiliates of the Corporation related to the securitization of RMBS.
The Civil Division ofAmerica, N.A., et al. Both cases are pending in the U.S. Attorney’s officeDistrict Court for the Eastern District of New York is conducting an investigation concerningJersey. On February 5, 2015, the Corporation's compliance with the requirements of the Federal Housing Administration’s Direct Endorsement Program. The Corporation is cooperating with this investigation.
On December 12, 2013, the SECcourt granted in part and MLPF&S resolved the SEC’s investigation relateddenied in part defendants’ motion to risk control, valuation, structuring, marketing and purchase of CDOs by MLPF&S. Without admitting or denying the SEC’s allegationsdismiss those complaints, granting plaintiff leave to replead in the settlement order, MLPF&S agreed to pay disgorgement, prejudgment interest and a civil penalty totaling approximately $132 million relating to MLPF&S’s role in the structuring and marketing of three CDOs that closed in late 2006 and early 2007.
|
| | |
230 Bank of America 2013certain respects.
| | |
Mortgage Repurchase Litigation
U.S. Bank Litigation
On August 29, 2011, U.S. Bank, National Association (U.S. Bank), as trustee for the HarborView Mortgage Loan Trust 2005-10 (the Trust), a mortgage pool backed by loans originated by CHL,Countrywide Home Loans, Inc. (CHL), filed a complaint in New York Supreme Court, New York County, in a case entitledU.S. Bank National Association, as Trustee for HarborView Mortgage Loan Trust, Series 2005-10 v. Countrywide Home Loans, Inc. (dba Bank of America Home Loans), Bank of America Corporation, Countrywide Financial Corporation, Bank of America, N.A. and NB Holdings Corporation.U.S. Bank asserts that, as a result of alleged misrepresentations by CHL in connection with its sale of the loans, defendants must repurchase all the loans in the pool, or in the alternative that it must repurchase a subset of those loans as to which U.S. Bank alleges that defendants have refused specific repurchase demands. U.S. Bank asserts claims for breach of contract and seeks specific performance of defendants’ alleged obligation to repurchase the entire pool of loans (alleged to have an original aggregate principal balance of $1.75 billion)$1.75 billion) or alternatively the aforementioned subset (alleged to have an aggregate principal balance of “over $100 million”), together with reimbursement of costs and expenses and other unspecified relief. On May 29, 2013, the New York Supreme Court dismissed U.S. Bank’s claim for repurchase of all the mortgage loans in the Trust. The court granted U.S. Bank leave to amend this claim. The court denied defendants’ motion to dismiss U.S. Bank’s claim that CHL allegedly refused to repurchase specific mortgage loans which were the subject of prior repurchase demands. On June 18, 2013, U.S. Bank filed its second amended complaint seeking to replead its claim for repurchase of all loans in the Trust. By order datedOn February 13, 2014, the court granted defendants’ motion to dismiss the repleaded claim seeking repurchase of all mortgage loans in the Trust; plaintiff has appealed that order.
On November 13, 2014, the same order denied plaintiff’scourt granted U.S. Bank’s motion for “resettlement and/or clarification” seeking permissionleave to pursue, underamend the complaint; defendants have appealed that order. The amended complaint alleges breach of contract based upon defendants’ failure to repurchase loans that were the subject of specific repurchase demands and also alleges breach of contract based upon defendants’ discovery, during origination and servicing, of loans with material breaches of representations and warranties.
U.S. Bank Summonses with Notice
On August 29, 2014, U.S. Bank, solely in its alternative claim, a remedycapacity as Trustee for seven securitization trusts (the Trusts), served seven summonses with notice commencing potential actions against First Franklin Financial Corporation, Merrill Lynch Mortgage
Lending, Inc., Merrill Lynch Mortgage Investors, Inc., and Ownit Mortgage Solutions Inc. in New York Supreme Court, New York County. The summonses indicate that defendants may be subject to breach of contract claims alleging that they breached representations and warranties related to loans securitized in the Trusts. The summonses allege that defendants failed to repurchase breaching mortgage loans from the Trusts. The summonses seek specific performance of defendants’ alleged obligation to repurchase breaching loans, declaratory judgment, compensatory, rescissory and other damages, and indemnity. On February 5, 2015, defendants demanded complaints on three of the Trusts. Defendants currently have until March 3, 2015 to demand the complaint with respect to mortgage loans beyondone of the subset identified inremaining Trusts, and until July 15, 2015 to demand complaints on the complaint.
Ocala Litigationfinal three Trusts.
Ocala Investor ActionsLitigation
On November 25, 2009, BNP Paribas Mortgage Corporation (BNP) and Deutsche Bank AG each filed claims (the 2009 Actions) against BANA in the U.S. District Court for the Southern District of New York entitled BNP Paribas Mortgage Corporation v. Bank of America, N.A andDeutsche Bank AG v. Bank of America, N.A. Plaintiffs allege that BANA failed to properly perform its duties as indenture trustee, collateral agent, custodian and depositary for Ocala Funding, LLC (Ocala), a home mortgage warehousing facility, resulting in the loss of plaintiffs’ investment in Ocala. Ocala was a wholly-owned subsidiary of Taylor, Bean & Whitaker Mortgage Corp. (TBW), a home mortgage originator and servicer which is alleged to have committed fraud that led to its eventual bankruptcy. Ocala provided funding for TBW’s mortgage origination activities by issuing notes, the proceeds of which were to be used by TBW to originate home mortgages. Such mortgages and other Ocala assets in turn were pledged to BANA, as collateral agent, to secure the notes. Plaintiffs lost most or all of their investment in Ocala when, as the result of the alleged fraud committed by TBW, Ocala was unable to repay the notes purchased by plaintiffs and there was insufficient collateral to satisfy Ocala’s debt obligations. Plaintiffs allege that BANA breached its contractual, fiduciary and other duties to Ocala,
thereby permitting TBW’s alleged fraud to go undetected. Plaintiffs seek compensatory damages and other relief from BANA, including interest and attorneys’ fees, in an unspecified amount, but which plaintiffs allege exceeds $1.6 billion.$1.6 billion.
On March 23, 2011, the court issued an order grantinggranted in part and denyingdenied in part BANA’s motions to dismiss the 2009 Actions.
Plaintiffs filed amended complaints on October 1, 2012 that included additional contractual, tort and equitable claims. On June 6, 2013, the court issued an order grantinggranted BANA’s motion to dismiss plaintiffs’ claims for failure to sue, negligence, negligent misrepresentation and equitable relief. On December 9, 2013, the court issued an order denying plaintiffs’ motion for leave to amend to include additional failure to sue claims.
In connection with the Ocala bankruptcy proceeding, the bankruptcy trustee is pursuing litigation against third parties to mitigate the investor losses at issue in the 2009 Actions.
FDIC Action
On October 1, 2010, BANA filed suit in the U.S. District Court for the District of Columbia against the FDIC as receiver of Colonial Bank, TBW’s primary bank, and Platinum Community Bank (Platinum, a wholly-owned subsidiary of TBW) entitled Bank of America, National Association as indenture trustee, custodian and collateral agent for Ocala Funding, LLC v. Federal Deposit Insurance Corporation (the FDIC Action). The suit seeks judicial review of the FDIC’s denial of the administrative claims brought by BANA in the FDIC’s Colonial and Platinum receivership proceedings. BANA’s claims allege that Ocala’s losses were in whole or in part the result of Colonial and Platinum’s participation in TBW’s alleged fraud. BANA seeks a court order requiring the FDIC to allow BANA’s claims in an amount equal to Ocala’s losses and, accordingly, to permit BANA, as trustee, collateral agent, custodian and depositary for Ocala, to share appropriately in distributions of any receivership assets that the FDIC makes to creditors of the two failed banks.
On August 5, 2011, the FDIC answered and moved to dismiss the amended complaint, and asserted counterclaims against BANA in BANA’s individual capacity seeking approximately $900 million in damages. The counterclaims allege that Colonial sent 4,808 loans to BANA as bailee, that BANA converted the loans into Ocala collateral without first ensuring that Colonial was paid, and that Colonial was never paid for these loans.
On December 10, 2012, the U.S. District CourtNovember 24, 2014, BANA moved for the District of Columbia granted in partsummary judgment and denied in part the FDIC’s motion to dismiss BANA’s amended complaint. The court dismissed BANA’s claims to the extent they were brought on behalf of Ocala, holding that those claims were not administratively exhausted, and also dismissed three equitable claims, but allowed BANA to continue to pursue claims in its individual capacity and on behalf of Ocala’s secured parties, principally plaintiffs in the 2009 Actions. The court also granted in part and denied in part BANA’s motion to dismiss the FDIC’s counterclaims, allowing all but one of the FDIC’s 16 counterclaims to go forward.moved for partial summary judgment.
On February 5, 2013,19, 2015, BANA and BNP reached an agreement in principle to settle the 2009 actions for an amount not material to the Corporation’s results of operations, subject to the execution of a final settlement agreement.
O’Donnell Litigation
On February 24, 2012, Edward O’Donnell filed a motion for clarificationsealed qui tam complaint under the Financial Institutions Reform, Recovery and Enforcement Act of 1989 (FIRREA) and the court’s December 10, 2012 ruling on BANA’s motionFalse Claims Act against the Corporation, individually, and as successor to dismiss the FDIC’s counterclaims. On March 6, 2013, the court ruled that certain language in the custodial agreement between BANA and Colonial Bank purporting to limit BANA’s liability is unenforceable due to ambiguity, and that BANA is foreclosed from introducing extrinsic evidence to resolve the ambiguity. On June 17, 2013, the court denied BANA’s motion seeking certification for interlocutory appeal of the court’s December 10, 2012 ruling as so clarified. On February 5, 2014, the U.S. Court of Appeals for the District ofCountrywide,
|
| | |
| | | Bank of America 20132014 231220 |
Columbia Circuit denied BANA’s petition for writ of mandamus that sought to vacate the December 10, 2012 and March 6, 2013 rulings.
On May 3, 2013, the FDIC filed a motion to dismiss BANA’s claims against the FDIC in its capacity as receiver for Colonial Bank, citing a Notice of No Value Determination, dated April 15, 2013, published by the FDIC in the Federal Register, 78 Fed. Reg. 76, 23565 (the No Value Determination). On July 22, 2013, BANA filed a complaint against the FDIC in the U.S. District Court for the District of Columbia entitled Bank of America, N.A. v. Federal Deposit Insurance Corporation, challenging the FDIC’s No Value Determination pursuant to the Administrative Procedure Act (the APA Action). On August 26, 2013, the U.S. District Court for the District of Columbia granted the FDIC’s motion to dismiss BANA’s claims against the FDIC in its capacity as receiver for Colonial Bank. The court ruled that the order of judgment would be held in abeyance pending resolution of the APA Action.
O’Donnell Litigation
On February 24, 2012, Edward O’Donnell filed a sealed qui tam complaint against the Corporation, individually, and as successor to Countrywide, CHL and a Countrywide business division known as Full Spectrum Lending. On October 24, 2012, the DOJDoJ filed a complaint-in-intervention to join the matter, adding BANA, Countrywide and CHL as defendants. The action is entitledUnited States of America, ex rel, Edward O’Donnell, appearing Qui Tam v. Bank of America Corp,Corp., et al., and was filed in the U.S. District Court for the Southern District of New York. The complaint-in-intervention assertsasserted certain fraud claims in connection with the sale of loans to FNMA and FHLMC by Full Spectrum Lending and by the Corporation and BANA from 2006 continuing through 2009 and also asserts successor liability against the Corporation and BANA. Plaintiff originally sought treble damages pursuant to the False Claims Act and civil penalties pursuant to FIRREA. On January 11, 2013, the government filed an amended complaint which added Countrywide Bank, FSB (CFSB) and a former officer of the Corporation as defendants. The court dismissed the False Claims Act counts on May 8, 2013. On September 6, 2013, the government filed a second amended complaint alleging claims under FIRREA concerning allegedly fraudulent loan sales to the GSEs between August 2007 and May 2008. On September 24, 2013, the government dismissed the Corporation as a defendant.
Following a trial, on October 23, 2013, a verdict of liability was returned against CHL, CFSB and BANA. On July 30, 2014, the court imposed a civil penalty of $1.3 billion on BANA. On February 3, 2015, the court denied the Corporation’s motions for judgment as a matter of law, or in the alternative, a new trial. The court may impose civil monetary penalties under FIRREA.Corporation will appeal the verdict and judgment.
Pennsylvania Public School Employees’ Retirement System
The Corporation and several current and former officers were named as defendants in a putative class action filed in the U.S. District Court for the Southern District of New York entitled Pennsylvania Public School Employees’ Retirement System v. Bank of America, et al.
Following the filing of a complaint on February 2, 2011, plaintiff subsequently filed an amended complaint on September 23, 2011 in which plaintiff sought to sue on behalf of all persons who acquired the Corporation’s common stock between February 27, 2009 and October 19, 2010 and “Common Equivalent Securities”Securities” sold in a December 2009 offering. The amended complaint asserted claims under Sections 10(b) and 20(a) of the Securities Exchange Act of 1934 and Sections 11 and 15 of the Securities Act of 1933, and alleged that the Corporation’s public statements: (i) concealed problems in the Corporation’s mortgage servicing business resulting from the widespread use of the Mortgage Electronic Recording System; (ii) failed to disclose the Corporation’s exposure to mortgage repurchase claims; (iii) misrepresented the adequacy of internal controls; and (iv) violated certain Generally Accepted Accounting Principles. The amended complaint sought unspecified damages.
On July 11, 2012, the court granted in part and denied in part defendants’ motions to dismiss the amended complaint. All claims under the Securities Act were dismissed against all defendants, with prejudice. The motion to dismiss the claim against the Corporation under Section 10(b) of the Exchange Act was denied. All claims under the Exchange Act against the officers were dismissed, with leave to replead. Defendants moved to dismiss a second amended complaint in which plaintiff sought to replead claims against certain current and former officers under Sections 10(b) and 20(a). On April 17, 2013, the court granted in part and denied in part the motion to dismiss, sustaining Sections 10(b) and 20(a) claims against the current and former officers.
Policemen’s Annuity Litigation
On April 11, 2012, the Policemen’s Annuity & Benefit Fund of the City of Chicago, on its own behalf and on behalf of a proposed class of purchasers of 41 RMBS trusts collateralized mostly by Washington Mutual-originated (WaMu) mortgages, filed a proposed class action complaint against BANA and other unrelated parties in the United StatesU.S. District Court for the Southern District of New York, entitledPolicemen’s Annuity and Benefit Fund of the City of Chicago v. Bank of America, N.A. and U.S. Bank National Association. BANA and U.S. Bank are named as defendants in their capacities as trustees, with BANA (formerly LaSalle Bank National Association) having served as the original trustee and U.S. Bank having replaced BANA as trustee. Plaintiff asserted claims under the federal Trust Indenture Act as well as state common law claims. Plaintiff alleged that, in light of the performance of the RMBS at issue, and in the wake of publicly-available information about the quality of loans originated by WaMu, the trustees were required to take certain steps to protect plaintiff’s interest in the value of the securities, and that plaintiff was damaged by defendants’ failures to notify it of deficiencies in the loans and of defaults under the relevant agreements, to ensure that the underlying mortgages could properly be foreclosed, and to enforce remedies available for loans that contained breaches of representations and warranties. Plaintiff sought unspecified compensatory damages and/or equitable relief, and costs and expenses. On December 7, 2012, theThe court granted in part and denied in part defendants’ motion to dismiss, and granted plaintiff leave to repleaddismissed some of the dismissed claims. The court ruled, among other things, that plaintiff had standingcommon law claims, but allowed the Trust Indenture Act claim and a claim for breach of contract to pursue claimsproceed. After the filing of two amended complaints and the consolidation of the case with a related matter filed on behalf of purchasers of certificates in certain tranches of five trusts, but not on behalf of
purchasers of certificates in the other 36 trusts, in which plaintiff had not invested. Plaintiffs filed a second amended complaint on January 13, 2013, which added plaintiffs and asserted claims concerning 19 trusts in which at least one named plaintiff had invested. On May 6, 2013, the court denied defendants’ motion to dismiss the second amended complaint.
On August 23, 2013, the Vermont Pension Investment Committee and the Washington State Investment Board brought a new putative class action against BANA and other unrelated parties in the U.S. District Court for the Southern District of New York entitledVermont Pension Investment Committee and the Washington State Investment Board v. Bank of America, N.A. and U.S. Bank National Association (Vermont Pension). The Vermont Pension action was based, 10 named plaintiffs filed a third amended complaint on similar factual allegations and the same claims and legal theories as thePolicemen’s Annuity action, but concerned six different RMBSOctober 31, 2013, on behalf of two proposed classes of purchasers of 35 trusts collateralized mostly by WaMu-originated mortgages (later reduced to 34 trusts).
On June 5, 2014, the parties informed the court that they had reached an agreement in principle to settle the case for which BANA is the former trustee and U.S. Bank is the current trustee. As in Policemen’s Annuity, plaintiffs sought unspecified compensatory damages and/or equitable relief, and costs and expenses. The case was marked as related to Policemen’s Annuity and assignedan amount not material to the same judge.Corporation’s results of operations, subject to approval of plaintiffs’ boards. The settlement remains subject to final court approval and various conditions. On November 10, 2014, the court preliminarily approved the proposed settlement, and scheduled a final approval hearing for March 12, 2015.
Takefuji Litigation
In April 2010, Takefuji Corporation (Takefuji) filed a claim against Merrill Lynch International and Merrill Lynch Japan Securities (MLJS) in Tokyo District Court. The claim concerns Takefuji’s purchase in 2007 of credit-linked notes structured and sold by defendants that resulted in a loss to Takefuji of approximately JPY29.0 billion (approximately $270 million) following an event of default. Takefuji alleges that defendants failed to meet certain disclosure obligations concerning the notes.
On October 21,July 19, 2013, the court consolidatedTokyo District Court issued a judgment in defendants’ favor, a decision that Takefuji subsequently appealed to the two cases through summary judgment.Tokyo High Court. On October 31, 2013, plaintiffsAugust 27, 2014, the Tokyo High Court vacated the decision of the District Court and issued a judgment awarding Takefuji JPY14.5 billion (approximately $135 million) in damages, plus interest at a rate of five percent from March 18, 2008. On September 10, 2014, defendants filed a consolidated Third Amended Complaint, which asserted materially identical claims concerningan appeal with the 25 trusts previously at issue in the two consolidated cases, as well as 10 new trusts (also mostly collateralized by WaMu-originated mortgages), bringing the total number of trusts at issue to 35. The new complaint also added four new plaintiffs, bringing the total number of named plaintiffs to 10.Japanese Supreme Court.
|
| | |
| | 221Bank of America 20132332014 | | |
NOTE 13 Shareholders’ Equity
Common Stock
|
| | | | | | | | |
| | | | | | | |
| Declared Quarterly Cash Dividends on Common Stock |
| | | | | | | |
| Declaration Date | | Record Date | | Payment Date | | Dividend Per Share |
| | | |
| February 11, 2014 | | March 7, 2014 | | March 28, 2014 | | $ | 0.01 |
|
| October 24, 2013 | | December 6, 2013 | | December 27, 2013 | | 0.01 |
|
| July 24, 2013 | | September 6, 2013 | | September 27, 2013 | | 0.01 |
|
| April 30, 2013 | | June 7, 2013 | | June 28, 2013 | | 0.01 |
|
| January 23, 2013 | | March 1, 2013 | | March 22, 2013 | | 0.01 |
|
|
| | | | | | | | |
| | | | | | | |
Declared Quarterly Cash Dividends on Common Stock (1) |
| | | | | | | |
| Declaration Date | | Record Date | | Payment Date | | Dividend Per Share |
| | | |
| February 10, 2015 | | March 6, 2015 | | March 27, 2015 | | $ | 0.05 |
|
| October 23, 2014 | | December 5, 2014 | | December 26, 2014 | | 0.05 |
|
| August 6, 2014 | | September 5, 2014 | | September 26, 2014 | | 0.05 |
|
| June 18, 2014 | | June 24, 2014 | | June 30, 2014 | | 0.01 |
|
| February 11, 2014 | | March 7, 2014 | | March 28, 2014 | | 0.01 |
|
| |
(1) | In 2014 and through February 25, 2015. |
On March 14, 2013, the Corporation announced that its Board of Directors (Board) authorized the repurchase of up to $5.0 billion of common stock over four quarters beginning in the second quarter of 2013. The timing and amount of common stock repurchases have been and will continue to be consistent with the Corporation’s 2013 capital plan and will be subject to various factors, including the Corporation’s capital position, liquidity, applicable legal considerations, financial performance and alternative uses of capital, stock trading price, and general market conditions, and may be suspended at any time. The remaining common stock repurchases may be effected through open market purchases or privately negotiated transactions, including repurchase plans that satisfy the conditions of Rule 10b5-1 of the Securities Exchange Act of 1934.
In 2013, the Corporation repurchased and retired 101.1 million and 231.7 million shares of common stock, which reduced shareholders’ equity by $1.7 billion and $3.2 billion.
Inbillion in 20122014 and 20112013. In 2012, in connection with the exchanges described in Preferred Stock in this Note, the Corporation issued 50 million and 400 million shares of its common stock.
On September 1, 2011, the Corporation closed the sale to Berkshire Hathaway, Inc. (Berkshire) of 50,000 shares of the Corporation’s 6% Cumulative Perpetual Preferred Stock, Series T (Series T Preferred Stock) and a warrant (the Warrant) to purchase 700 million shares of the Corporation’s common stock for an aggregate purchase price of $5.0 billion in cash. Of the $5.0 billion in cash proceeds, $2.9 billion was allocated to preferred stock and $2.1 billion to the Warrant on a relative fair value basis. The discount on the Series T Preferred Stock is not subject to accretion. The portion of proceeds allocated to the Warrant was recorded as additional paid-in capital. The Warrant is exercisable at the holder’s option at any time, in whole or in part, until September 1, 2021, at an exercise price of $7.142857 per share of common stock. The Warrant may be settled in cash or by exchanging all or a portion of the Series T Preferred Stock. For more information on the Berkshire investment and Series T Preferred Stock, see Preferred Stock in this Note.
At December 31, 2013,2014, the Corporation had warrants outstanding and exercisable to purchase 121.8 million shares of common stock at an exercise price of $30.79 per share expiring on October 28, 2018, and warrants outstanding and exercisable to purchase 150.4 million shares of common stock at an exercise price of $13.30$13.24 per share expiring on January 16, 2019. These warrants were originally issued in connection with preferred stock issuances to the U.S. Department of the Treasury in 20102009 and 2008, and are listed on the New York Stock Exchange. The terms of the warrants expiring on January 16, 2019 include a provision that requires an adjustment to the exercise price when the Corporation declares quarterly dividends at a level greater than $0.01 per common share. As a result of the Corporation’s third- and fourth-quarter 2014 dividends of $0.05 per common share, the exercise price of the warrants expiring on January 16, 2019 was adjusted from $13.30 to $13.24. The exercise price of these warrants is subject to continued adjustment each time the quarterly cash dividend is in excess of $0.01 per common share to compensate the shareholder for dilution resulting from an increased dividend, including as a result of the declaration of a quarterly common stock dividend of $0.05 per common share to be paid on March 27, 2015 to shareholders of record on March 6, 2015. The warrants expiring on October 18, 2018 also contain this anti-dilution provision except the adjustment is triggered only when the Corporation declares quarterly dividends at a level greater than $0.32 per common share.
In connection with the issuance of the Corporation’s 6% Cumulative Perpetual Preferred Stock, Series T (the Series T Preferred Stock), the Corporation issued a warrant to purchase 700 million shares of the Corporation’s common stock. The warrant is exercisable at the holder’s option at any time, in whole or in part, until September 1, 2021, at an exercise price of $7.142857 per share of common stock. The warrant may be settled in cash or by exchanging all or a portion of the Series T Preferred Stock. For more information on the Series T Preferred Stock, see Preferred Stock in this Note.
In connection with employee stock plans, in 20132014, the Corporation issued approximately 7443 million shares and repurchased approximately 2917 million shares of its common stock to satisfy tax withholding obligations. At December 31, 20132014, the Corporation had reserved 1.8 billion unissued shares of common
stock for future issuances under employee stock plans, common stock warrants, convertible notes and preferred stock.
Preferred Stock
The cash dividends declared on preferred stock were $1.0 billion, $1.2 billion $1.5 billion and $1.3$1.5 billion for 20132014, 20122013 and 20112012.
On January 27, 2015, the Corporation issued 44,000 shares of its 6.500% Non-Cumulative Preferred Stock, Series Y for $1.1 billion. Dividends are paid quarterly commencing on April 27, 2015. Series Y Preferred Stock has a liquidation preference of $25,000 per share and is subject to certain restrictions in the event that the Corporation fails to declare and pay full dividends.
At the Corporation’s annual meeting of stockholders on May 7, 2014, the stockholders approved an amendment to the Series T Preferred Stock such that it qualifies as Tier 1 capital, and the amendment became effective in the three months ended June 30, 2014. The more significant changes to the terms of the Series T Preferred Stock in the amendment were: (1) dividends are no longer cumulative; (2) the dividend rate is fixed at 6%; and (3) the Corporation may redeem the Series T Preferred Stock only after the fifth anniversary of the effective date of the amendment.
In 2014, the Corporation issued $6.0 billion of its Preferred Stock, Series V, X, W and Z. On June 17, 2014, the Corporation issued 60,000 shares of its Fixed-to-Floating Rate Non-Cumulative Preferred Stock, Series V for $1.5 billion. Dividends are paid semi-annually commencing on December 17, 2014. On September 5, 2014, the Corporation issued 80,000 shares of its Fixed-to-Floating Rate Non-Cumulative Preferred Stock, Series X for $2.0 billion. Dividends are paid semi-annually commencing on March 5, 2015. On September 9, 2014, the Corporation issued 44,000 shares of its 6.625% Non-Cumulative Preferred Stock, Series W for $1.1 billion. Dividends are paid quarterly commencing on December 9, 2014. On October 23, 2014, the Corporation issued 56,000 shares of its Fixed-to-Floating Rate Non-Cumulative Preferred Stock, Series Z for $1.4 billion. Dividends are paid semi-annually commencing on April 23, 2015. Series V, X, W and Z preferred stock have a liquidation preference of $25,000 per share and are subject to certain restrictions in the event that the Corporation fails to declare and pay full dividends.
In 2013, the Corporation redeemed for $6.6 billion its Non-Cumulative Preferred Stock, Series H, J, 6, 7 and 8. The $100$100 million difference between the carrying value of $6.5 billion and the redemption price of the preferred stock was recorded as a preferred stock dividend. In addition, the Corporation issued $1.0 billion of its Fixed-to-Floating Rate Semi-annual Non-Cumulative Preferred Stock, Series U.
In 2012, the Corporation entered into various agreements with certain preferred stock and Trust Securities holders pursuant to which the Corporation and the holders of these securities agreed to exchange shares of various series of non-convertible preferred stock with a carrying value of $296 million and Trust Securities with a carrying value of $760 million for 50 million shares of the Corporation’s common stock with a fair value of $412 million, and $398 million in cash. The $246 million difference between the carrying value of the preferred stock and Trust Securities retired and the fair value of consideration issued was a $44 million reduction to preferred stock dividends recorded in retained earnings and a $202 million gain recorded in noninterest income. In 2012, the Corporation issued shares of the Corporation’s Series F Preferred Stock and Series G Preferred Stock for $633 million under stock purchase contracts. For additional information, see the Preferred Stock Summary table in this Note and Note 11 – Long-term Debt.
In 2011, the Corporation entered into separate agreements with certain institutional preferred stock and Trust Securities holders (the Exchange Agreements) pursuant to which the Corporation and the holders of these securities agreed to exchange shares, or depository shares representing fractional interests in shares, of various series of the Corporation’s preferred stock, par value $0.01 per share, or Trust Securities for an aggregate of 400 million shares of the Corporation’s common stock valued at $2.2 billion and $2.3 billion aggregate principal amount of senior notes. The Exchange Agreements related to Trust Securities are described in Note 11 – Long-term Debt and the Exchange Agreements related to preferred stock are described below.
As part of the Exchange Agreements, the Corporation exchanged non-convertible preferred stock, with an aggregate liquidation preference of $815 million and carrying value of $814 million, for 72 million shares of common stock valued at $399 million and senior notes valued at $231 million. The $184 million difference between the carrying value of the non-convertible preferred stock and the fair value of the consideration issued to the holders of the non-convertible preferred stock was recorded in retained earnings as a non-cash reduction to preferred stock dividends.
Additionally, as a part of the Exchange Agreements, a portion of the Series L 7.25% Non-Cumulative Perpetual Convertible Preferred Stock (Series L Preferred Stock) with an aggregate liquidation preference and carrying value of $269 million was exchanged for 20 million shares of the Corporation’s common stock valued at $123 million and senior notes valued at $129 million. The $17 million difference between the carrying value of the Series L Preferred Stock and the fair value of the consideration issued to holders of the Series L Preferred Stock was reclassified from preferred stock to common stock and additional paid-in capital. Because the number of common shares issued to the Series L Preferred Stock holders was in excess of the number of common shares issuable pursuant to the original conversion terms, the $220 million fair value of consideration transferred to the Series L Preferred Stock holders in excess of the $32 million fair value of securities issuable pursuant to the original conversion terms was recorded as a non-cash preferred stock dividend. The dividend did not impact total shareholders’ equity since it reduced retained earnings and increased common stock and additional paid-in capital by the same amount.
The Series T Preferred Stock issued as part of the Berkshire investment has a liquidation value of $100,000 per share and dividends on the Series T Preferred Stock accrue on the liquidation value at a rate per annum of six percent but will be paid only when and if declared by the Board out of legally available funds. Subject to the approval of the Board of Governors of the Federal Reserve System (Federal Reserve), the Series T Preferred Stock may be redeemed by the Corporation at any time at a redemption price of $105,000 per share plus any accrued, unpaid dividends. The Series T Preferred Stock has no maturity date and ranks senior to the outstanding common stock with respect to the payment of dividends and distributions in liquidation. At any time when dividends on the Series T Preferred Stock have not been paid in full, the unpaid amounts will accrue dividends at a rate per annum of eight percent and the Corporation will not be permitted to pay dividends or other distributions on, or to repurchase, any outstanding common stock or any of the Corporation’s outstanding preferred stock of any series. Following payment in full of accrued but unpaid dividends on the Series T Preferred Stock, the dividend rate remains at eight percent per annum.Note.
|
| | |
| | | Bank of America 20132014 235222 |
The table below presents a summary of perpetual preferred stock previously issued by the Corporation and outstanding at December 31, 20132014.
| | | | | | | | | | | | | | | | | | | | | |
| Preferred Stock Summary | Preferred Stock Summary | | | | | | | | | | Preferred Stock Summary | | | | | | | | | |
| | | | | | | | | | | | | | | | | | | |
| (Dollars in millions, except as noted) | (Dollars in millions, except as noted) | | | | | | | | | | | (Dollars in millions, except as noted) | | | | | | | | | | |
| Series | Description | | Initial Issuance Date | | Total Shares Outstanding | | Liquidation
Preference per Share (in dollars) | | Carrying Value (1) | | Per Annum Dividend Rate | | Redemption Period | Description | | Initial Issuance Date | | Total Shares Outstanding | | Liquidation
Preference per Share (in dollars) | | Carrying Value (1) | | Per Annum Dividend Rate | | Redemption Period |
Series B (2) | 7% Cumulative Redeemable | | June
1997 | | 7,571 |
| | $ | 100 |
| | $ | 1 |
| | 7.00 | % | | n/a | 7% Cumulative Redeemable | | June
1997 | | 7,571 |
| | $ | 100 |
| | $ | 1 |
| | 7.00 | % | | n/a |
Series D (3, 4) | 6.204% Non-Cumulative | | September
2006 | | 26,174 |
| | 25,000 |
| | 654 |
| | 6.204 | % | | On or after
September 14, 2011 | 6.204% Non-Cumulative | | September
2006 | | 26,174 |
| | 25,000 |
| | 654 |
| | 6.204 | % | | On or after
September 14, 2011 |
Series E (3, 4) | Floating Rate Non-Cumulative | | November
2006 | | 12,691 |
| | 25,000 |
| | 317 |
| | 3-mo. LIBOR + 35 bps (5) |
| | On or after
November 15, 2011 | Floating Rate Non-Cumulative | | November
2006 | | 12,691 |
| | 25,000 |
| | 317 |
| | 3-mo. LIBOR + 35 bps (5) |
| | On or after
November 15, 2011 |
Series F (3, 4) | Floating Rate Non-Cumulative | | March
2012 | | 1,409 |
| | 100,000 |
| | 141 |
| | 3-mo. LIBOR + 40 bps (5) |
| | On or after
March 15, 2012 | |
Series G (3, 4) | Adjustable Rate Non-Cumulative | | March
2012 | | 4,926 |
| | 100,000 |
| | 493 |
| | 3-mo. LIBOR + 40 bps (5) |
| | On or after
March 15, 2012 | |
Series F (3) | | Floating Rate Non-Cumulative | | March
2012 | | 1,409 |
| | 100,000 |
| | 141 |
| | 3-mo. LIBOR + 40 bps (5) |
| | On or after
March 15, 2012 |
Series G (3) | | Adjustable Rate Non-Cumulative | | March
2012 | | 4,926 |
| | 100,000 |
| | 493 |
| | 3-mo. LIBOR + 40 bps (5) |
| | On or after
March 15, 2012 |
Series I (3, 4) | 6.625% Non-Cumulative | | September
2007 | | 14,584 |
| | 25,000 |
| | 365 |
| | 6.625 | % | | On or after
October 1, 2017 | 6.625% Non-Cumulative | | September
2007 | | 14,584 |
| | 25,000 |
| | 365 |
| | 6.625 | % | | On or after
October 1, 2017 |
Series K (3, 6) | Fixed-to-Floating Rate Non-Cumulative | | January
2008 | | 61,773 |
| | 25,000 |
| | 1,544 |
| | 8.00% through 1/29/18; 3-mo. LIBOR + 363 bps thereafter |
| | On or after
January 30, 2018 | Fixed-to-Floating Rate Non-Cumulative | | January
2008 | | 61,773 |
| | 25,000 |
| | 1,544 |
| | 8.00% through 1/29/18; 3-mo. LIBOR + 363 bps thereafter |
| | On or after
January 30, 2018 |
| Series L | 7.25% Non-Cumulative Perpetual Convertible | | January
2008 | | 3,080,182 |
| | 1,000 |
| | 3,080 |
| | 7.25 | % | | n/a | 7.25% Non-Cumulative Perpetual Convertible | | January
2008 | | 3,080,182 |
| | 1,000 |
| | 3,080 |
| | 7.25 | % | | n/a |
Series M (3, 6) | Fixed-to-Floating Rate Non-Cumulative | | April
2008 | | 52,399 |
| | 25,000 |
| | 1,310 |
| | 8.125% through 5/14/18;
3-mo. LIBOR + 364 bps thereafter |
| | On or after
May 15, 2018 | Fixed-to-Floating Rate Non-Cumulative | | April
2008 | | 52,399 |
| | 25,000 |
| | 1,310 |
| | 8.125% through 5/14/18;
3-mo. LIBOR + 364 bps thereafter |
| | On or after
May 15, 2018 |
| Series T | 6% Cumulative | | September
2011 | | 50,000 |
| | 100,000 |
| | 2,918 |
| | 6.00 | % | | See description in Preferred Stock in this Note | 6% Non-Cumulative | | September
2011 | | 50,000 |
| | 100,000 |
| | 2,918 |
| | 6.00 | % | | See description in Preferred Stock in
this Note |
Series U | Fixed-to-Floating Rate Non-Cumulative | | May
2013 | | 40,000 |
| | 25,000 |
| | 1,000 |
| | 5.2% through 6/1/23;
3-mo. LIBOR + 313.5 bps thereafter |
| | On or after
June 1, 2023 | Fixed-to-Floating Rate Non-Cumulative | | May
2013 | | 40,000 |
| | 25,000 |
| | 1,000 |
| | 5.2% through 6/1/23;
3-mo. LIBOR + 313.5 bps thereafter |
| | On or after
June 1, 2023 |
Series V (6) | | Fixed-to-Floating Rate Non-Cumulative | | June
2014 | | 60,000 |
| | 25,000 |
| | 1,500 |
| | 5.125% through 6/17/19;
3-mo. LIBOR + 338.7 bps thereafter |
| | On or after
June 17, 2019 |
Series W (4) | | 6.625% Non-Cumulative | | September 2014 | | 44,000 |
| | 25,000 |
| | 1,100 |
| | 6.625 | % | | On or after
September 9, 2019 |
Series X (6) | | Fixed-to-Floating Rate Non-Cumulative | | September 2014 | | 80,000 |
| | 25,000 |
| | 2,000 |
| | 6.250% through 9/5/2024;
3-mo. LIBOR + 370.5 bps thereafter |
| | On or after
September 5, 2024 |
Series Z (6) | | Fixed-to-Floating Rate Non-Cumulative | | October 2014 | | 56,000 |
| | 25,000 |
| | 1,400 |
| | 6.500% through 10/23/24;
3-mo. LIBOR + 417.4 bps thereafter |
| | On or after
October 23, 2024 |
Series 1 (3, 7) | Floating Rate Non-Cumulative | | November
2004 | | 3,275 |
| | 30,000 |
| | 98 |
| | 3-mo. LIBOR + 75 bps (8) |
| | On or after
November 28, 2009 | Floating Rate Non-Cumulative | | November
2004 | | 3,275 |
| | 30,000 |
| | 98 |
| | 3-mo. LIBOR + 75 bps (8) |
| | On or after
November 28, 2009 |
Series 2 (3, 7) | Floating Rate Non-Cumulative | | March
2005 | | 9,967 |
| | 30,000 |
| | 299 |
| | 3-mo. LIBOR + 65 bps (8) |
| | On or after
November 28, 2009 | Floating Rate Non-Cumulative | | March
2005 | | 9,967 |
| | 30,000 |
| | 299 |
| | 3-mo. LIBOR + 65 bps (8) |
| | On or after
November 28, 2009 |
Series 3 (3, 7) | 6.375% Non-Cumulative | | November
2005 | | 21,773 |
| | 30,000 |
| | 653 |
| | 6.375 | % | | On or after
November 28, 2010 | 6.375% Non-Cumulative | | November
2005 | | 21,773 |
| | 30,000 |
| | 653 |
| | 6.375 | % | | On or after
November 28, 2010 |
Series 4 (3, 7) | Floating Rate Non-Cumulative | | November
2005 | | 7,010 |
| | 30,000 |
| | 210 |
| | 3-mo. LIBOR + 75 bps (5) |
| | On or after
November 28, 2010 | Floating Rate Non-Cumulative | | November
2005 | | 7,010 |
| | 30,000 |
| | 210 |
| | 3-mo. LIBOR + 75 bps (5) |
| | On or after
November 28, 2010 |
Series 5 (3, 7) | Floating Rate Non-Cumulative | | March
2007 | | 14,056 |
| | 30,000 |
| | 422 |
| | 3-mo. LIBOR + 50 bps (5) |
| | On or after
May 21, 2012 | Floating Rate Non-Cumulative | | March
2007 | | 14,056 |
| | 30,000 |
| | 422 |
| | 3-mo. LIBOR + 50 bps (5) |
| | On or after
May 21, 2012 |
| Total | | | | | 3,407,790 |
| | |
| | $ | 13,505 |
| | |
| | | | | | | 3,647,790 |
| | |
| | $ | 19,505 |
| | |
| | |
| |
(1) | Amounts shown are before third-party issuance costs and certain GAAPpurchase accounting adjustments of $153196 million. |
| |
(2) | Series B Preferred Stock does not have early redemption/call rights. |
| |
(3) | The Corporation may redeem series of preferred stock on or after the redemption date, in whole or in part, at its option, at the liquidation preference plus declared and unpaid dividends. |
| |
(4) | Ownership is held in the form of depositary shares, each representing a 1/1,000th interest in a share of preferred stock, paying a quarterly cash dividend, if and when declared. |
| |
(5) | Subject to 4.00% minimum rate per annum. |
| |
(6) | Ownership is held in the form of depositary shares, each representing a 1/25th interest in a share of preferred stock, paying a semi-annual cash dividend, if and when declared, until the redemption date at which time, it adjusts to a quarterly cash dividend, if and when declared, thereafter. |
| |
(7) | Ownership is held in the form of depositary shares, each representing a 1/1,200th interest in a share of preferred stock, paying a quarterly cash dividend, if and when declared. |
| |
(8) | Subject to 3.00% minimum rate per annum. |
n/a = not applicable
|
| | |
236223 Bank of America 20132014
| | |
Series L 7.25% Non-Cumulative Perpetual Convertible Preferred Stock (Series L Preferred Stock) listed in the Preferred Stock Summary table does not have early redemption/call rights. Each share of the Series L Preferred Stock may be converted at any time, at the option of the holder, into 20 shares of the Corporation’s common stock plus cash in lieu of fractional shares. The Corporation may cause some or all of the Series L Preferred Stock, at its option, at any time or from time to time, to be converted into shares of common stock at the then-applicable conversion rate if, for 20 trading days during any period of 30 consecutive trading days, the closing price of common stock exceeds 130 percent of the then-applicable conversion price of the Series L Preferred Stock. If a conversion of Series L Preferred Stock occurs subsequent to a dividend record date but prior to the dividend payment date, the Corporation will still pay any accrued dividends payable.
All series of preferred stock in the Preferred Stock Summary table have a par value of $0.01 per share, are not subject to the operation of a sinking fund, have no participation rights, and with the exception of the Series L Preferred Stock, are not convertible.
The holders of the Series B Preferred Stock and Series 1 through
5 Preferred Stock have general voting rights, and the holders of the other series included in the table have no general voting rights. All outstanding series of preferred stock of the Corporation have preference over the Corporation’s common stock with respect to the payment of dividends and distribution of the Corporation’s assets in the event of a liquidation or dissolution. With the exception of the Series T Preferred Stock, if any dividend payable on these series is in arrears for three or more semi-annual or six or more quarterly dividend periods, as applicable (whether consecutive or not), the holders of these series and any other class or series of preferred stock ranking equally as to payment of dividends and upon which equivalent voting rights have been conferred and are exercisable (voting as a single class) will be entitled to vote for the election of two additional directors. These voting rights terminate when the Corporation has paid in full dividends on these series for at least two semi-annual or four quarterly dividend periods, as applicable, following the dividend arrearage.
|
| | |
| | | Bank of America 20132014 237224 |
NOTE 14 Accumulated Other Comprehensive Income (Loss)
The table below presents the changes in accumulated OCI after-tax for 20112012, 20122013 and 20132014.
| | | | | | | | | | | | | | | | | | | | | | | | | |
| (Dollars in millions) | Available-for-
Sale Debt Securities | | Available-for-
Sale Marketable Equity Securities | | Derivatives | | Employee Benefit Plans (1) | | Foreign Currency (2) | | Total | Available-for-
Sale Debt Securities | | Available-for-
Sale Marketable Equity Securities | | Derivatives | | Employee Benefit Plans | | Foreign Currency (1) | | Total |
| Balance, December 31, 2010 | $ | 714 |
| | $ | 6,659 |
| | $ | (3,236 | ) | | $ | (3,947 | ) | | $ | (256 | ) | | $ | (66 | ) | |
| Net change | 2,386 |
| | (6,656 | ) | | (549 | ) | | (444 | ) | | (108 | ) | | (5,371 | ) | |
| Balance, December 31, 2011 | $ | 3,100 |
| | $ | 3 |
| | $ | (3,785 | ) | | $ | (4,391 | ) | | $ | (364 | ) | | $ | (5,437 | ) | $ | 3,100 |
| | $ | 3 |
| | $ | (3,785 | ) | | $ | (4,391 | ) | | $ | (364 | ) | | $ | (5,437 | ) |
| Net change | 1,343 |
| | 459 |
| | 916 |
| | (65 | ) | | (13 | ) | | 2,640 |
| 1,343 |
| | 459 |
| | 916 |
| | (65 | ) | | (13 | ) | | 2,640 |
|
| Balance, December 31, 2012 | $ | 4,443 |
| | $ | 462 |
| | $ | (2,869 | ) | | $ | (4,456 | ) | | $ | (377 | ) | | $ | (2,797 | ) | $ | 4,443 |
| | $ | 462 |
| | $ | (2,869 | ) | | $ | (4,456 | ) | | $ | (377 | ) | | $ | (2,797 | ) |
| Net change | (7,700 | ) | | (466 | ) | | 592 |
| | 2,049 |
| | (135 | ) | | (5,660 | ) | (7,700 | ) | | (466 | ) | | 592 |
| | 2,049 |
| | (135 | ) | | (5,660 | ) |
| Balance, December 31, 2013 | $ | (3,257 | ) | | $ | (4 | ) | | $ | (2,277 | ) | | $ | (2,407 | ) | | $ | (512 | ) | | $ | (8,457 | ) | $ | (3,257 | ) | | $ | (4 | ) | | $ | (2,277 | ) | | $ | (2,407 | ) | | $ | (512 | ) | | $ | (8,457 | ) |
| Net change | | 4,600 |
| | 21 |
| | 616 |
| | (943 | ) | | (157 | ) | | 4,137 |
|
| Balance, December 31, 2014 | | $ | 1,343 |
| | $ | 17 |
| | $ | (1,661 | ) | | $ | (3,350 | ) | | $ | (669 | ) | | $ | (4,320 | ) |
| |
(1) | During 2013, the Corporation merged certain pension plans into one plan. For more information on employee benefit plans, see Note 17 – Employee Benefit Plans.
|
| |
(2)
| The net change in fair value represents the impact of changes in spot foreign exchange rates on the Corporation’s net investment in non-U.S. operations, and related hedges. |
The table below presents the net change in fair value recorded in accumulated OCI, net realized gains and losses reclassified into earnings and other changes for each component of OCI before- and after-tax for 20132014, 20122013 and 20112012.
| | | | | | | | | | | | | | | | | | | | | | | | | | | | | | | | | | | | | |
| Changes in OCI Components Before- and After-tax | Changes in OCI Components Before- and After-tax | | | | | | | | | | | | | | | Changes in OCI Components Before- and After-tax | | | | | | | | | | | | | | |
| | | | | | | | | | | | | | | | | | | | | | | | | | | |
| | 2013 | | 2012 | | 2011 | 2014 | | 2013 | | 2012 |
| (Dollars in millions) | Before-tax | | Tax effect | | After-tax | | Before-tax | | Tax effect | | After-tax | | Before-tax | | Tax effect | | After-tax | Before-tax | | Tax effect | | After-tax | | Before-tax | | Tax effect | | After-tax | | Before-tax | | Tax effect | | After-tax |
| Available-for-sale debt securities: | | | | | | | | | | | | | | | | | | | | | | | | | | | | | | | | | | |
| Net change in fair value | $ | (10,989 | ) | | $ | 4,077 |
| | $ | (6,912 | ) | | $ | 3,676 |
| | $ | (1,319 | ) | | $ | 2,357 |
| | $ | 6,913 |
| | $ | (2,590 | ) | | $ | 4,323 |
| |
| Net increase (decrease) in fair value | | $ | 8,698 |
| | $ | (3,268 | ) | | $ | 5,430 |
| | $ | (10,989 | ) | | $ | 4,077 |
| | $ | (6,912 | ) | | $ | 3,676 |
| | $ | (1,319 | ) | | $ | 2,357 |
|
| Net realized gains reclassified into earnings | (1,251 | ) | | 463 |
| | (788 | ) | | (1,609 | ) | | 595 |
| | (1,014 | ) | | (3,075 | ) | | 1,138 |
| | (1,937 | ) | (1,338 | ) | | 508 |
| | (830 | ) | | (1,251 | ) | | 463 |
| | (788 | ) | | (1,609 | ) | | 595 |
| | (1,014 | ) |
| Net change | (12,240 | ) | | 4,540 |
| | (7,700 | ) | | 2,067 |
| | (724 | ) | | 1,343 |
| | 3,838 |
| | (1,452 | ) | | 2,386 |
| 7,360 |
| | (2,760 | ) | | 4,600 |
| | (12,240 | ) | | 4,540 |
| | (7,700 | ) | | 2,067 |
| | (724 | ) | | 1,343 |
|
| Available-for-sale marketable equity securities: | | | | | | | | | | | | | | | | | | | | | | | | | | | | | | | | | | |
| Net change in fair value | 32 |
| | (12 | ) | | 20 |
| | 748 |
| | (277 | ) | | 471 |
| | (4,114 | ) | | 1,575 |
| | (2,539 | ) | |
| Net increase in fair value | | 34 |
| | (13 | ) | | 21 |
| | 32 |
| | (12 | ) | | 20 |
| | 748 |
| | (277 | ) | | 471 |
|
| Net realized gains reclassified into earnings | (771 | ) | | 285 |
| | (486 | ) | | (19 | ) | | 7 |
| | (12 | ) | | (6,501 | ) | | 2,384 |
| | (4,117 | ) | — |
| | — |
| | — |
| | (771 | ) | | 285 |
| | (486 | ) | | (19 | ) | | 7 |
| | (12 | ) |
| Net change | (739 | ) | | 273 |
| | (466 | ) | | 729 |
| | (270 | ) | | 459 |
| | (10,615 | ) | | 3,959 |
| | (6,656 | ) | 34 |
| | (13 | ) | | 21 |
| | (739 | ) | | 273 |
| | (466 | ) | | 729 |
| | (270 | ) | | 459 |
|
| Derivatives: | | | | | | | | | | | | | | | | | | | | | | | | | | | | | | | | | | |
| Net change in fair value | 156 |
| | (51 | ) | | 105 |
| | 430 |
| | (166 | ) | | 264 |
| | (2,490 | ) | | 923 |
| | (1,567 | ) | |
| Net increase in fair value | | 195 |
| | (54 | ) | | 141 |
| | 156 |
| | (51 | ) | | 105 |
| | 430 |
| | (166 | ) | | 264 |
|
| Net realized losses reclassified into earnings | 773 |
| | (286 | ) | | 487 |
| | 1,035 |
| | (383 | ) | | 652 |
| | 1,617 |
| | (599 | ) | | 1,018 |
| 760 |
| | (285 | ) | | 475 |
| | 773 |
| | (286 | ) | | 487 |
| | 1,035 |
| | (383 | ) | | 652 |
|
| Net change | 929 |
| | (337 | ) | | 592 |
| | 1,465 |
| | (549 | ) | | 916 |
| | (873 | ) | | 324 |
| | (549 | ) | 955 |
| | (339 | ) | | 616 |
| | 929 |
| | (337 | ) | | 592 |
| | 1,465 |
| | (549 | ) | | 916 |
|
| Employee benefit plans: | | | | | | | | | | | | | | | | | | | | | | | | | | | | | | | | | | |
| Net change in fair value | 2,985 |
| | (1,128 | ) | | 1,857 |
| | (1,891 | ) | | 660 |
| | (1,231 | ) | | (1,171 | ) | | 457 |
| | (714 | ) | |
| Net increase (decrease) in fair value | | (1,629 | ) | | 614 |
| | (1,015 | ) | | 2,985 |
| | (1,128 | ) | | 1,857 |
| | (1,891 | ) | | 660 |
| | (1,231 | ) |
| Net realized losses reclassified into earnings | 237 |
| | (79 | ) | | 158 |
| | 490 |
| | (192 | ) | | 298 |
| | 437 |
| | (167 | ) | | 270 |
| 55 |
| | (23 | ) | | 32 |
| | 237 |
| | (79 | ) | | 158 |
| | 490 |
| | (192 | ) | | 298 |
|
| Settlements and curtailments | 46 |
| | (12 | ) | | 34 |
| | 1,378 |
| | (510 | ) | | 868 |
| | — |
| | — |
| | — |
| |
| Settlements, curtailments and other | | (1 | ) | | 41 |
| | 40 |
| | 46 |
| | (12 | ) | | 34 |
| | 1,378 |
| | (510 | ) | | 868 |
|
| Net change | 3,268 |
| | (1,219 | ) | | 2,049 |
| | (23 | ) | | (42 | ) | | (65 | ) | | (734 | ) | | 290 |
| | (444 | ) | (1,575 | ) | | 632 |
| | (943 | ) | | 3,268 |
| | (1,219 | ) | | 2,049 |
| | (23 | ) | | (42 | ) | | (65 | ) |
| Foreign currency: | | | | | | | | | | | | | | | | | | | | | | | | | | | | | | | | | | |
| Net change in fair value | 244 |
| | (384 | ) | | (140 | ) | | (226 | ) | | 233 |
| | 7 |
| | 145 |
| | (179 | ) | | (34 | ) | |
| Net increase (decrease) in fair value | | 714 |
| | (879 | ) | | (165 | ) | | 244 |
| | (384 | ) | | (140 | ) | | (226 | ) | | 233 |
| | 7 |
|
| Net realized (gains) losses reclassified into earnings | 138 |
| | (133 | ) | | 5 |
| | (30 | ) | | 10 |
| | (20 | ) | | (65 | ) | | (9 | ) | | (74 | ) | 20 |
| | (12 | ) | | 8 |
| | 138 |
| | (133 | ) | | 5 |
| | (30 | ) | | 10 |
| | (20 | ) |
| Net change | 382 |
| | (517 | ) | | (135 | ) | | (256 | ) | | 243 |
| | (13 | ) | | 80 |
| | (188 | ) | | (108 | ) | 734 |
| | (891 | ) | | (157 | ) | | 382 |
| | (517 | ) | | (135 | ) | | (256 | ) | | 243 |
| | (13 | ) |
| Total other comprehensive income (loss) | $ | (8,400 | ) | | $ | 2,740 |
| | $ | (5,660 | ) | | $ | 3,982 |
| | $ | (1,342 | ) | | $ | 2,640 |
| | $ | (8,304 | ) | | $ | 2,933 |
| | $ | (5,371 | ) | $ | 7,508 |
| | $ | (3,371 | ) | | $ | 4,137 |
| | $ | (8,400 | ) | | $ | 2,740 |
| | $ | (5,660 | ) | | $ | 3,982 |
| | $ | (1,342 | ) | | $ | 2,640 |
|
|
| | |
238225 Bank of America 20132014
| | |
The table below presents impacts on net income of significant amounts reclassified out of each component of accumulated OCI before- and after-tax for 20132014, 20122013 and 20112012.
| | | | | | | | | | | | | | | |
| Reclassifications Out of Accumulated OCI | Reclassifications Out of Accumulated OCI | | | | Reclassifications Out of Accumulated OCI | | | |
| | | | | | | | | | | | | |
| (Dollars in millions) | | | | | | | | | | | | |
| Accumulated OCI Components | Income Statement Line Item Impacted | 2013 | | 2012 | | 2011 | Income Statement Line Item Impacted | 2014 | | 2013 | | 2012 |
| Available-for-sale debt securities: | | | | | | | | | | | | |
| | Gains on sales of debt securities | $ | 1,271 |
| | $ | 1,662 |
| | $ | 3,374 |
| Gains on sales of debt securities | $ | 1,354 |
| | $ | 1,271 |
| | $ | 1,662 |
|
| | Other-than-temporary impairment | (20 | ) | | (53 | ) | | (299 | ) | Other income (loss) | (16 | ) | | (20 | ) | | (53 | ) |
| | Income before income taxes | 1,251 |
| | 1,609 |
| | 3,075 |
| Income before income taxes | 1,338 |
| | 1,251 |
| | 1,609 |
|
| | Income tax expense | 463 |
| | 595 |
| | 1,138 |
| Income tax expense | 508 |
| | 463 |
| | 595 |
|
| | Reclassification to net income | 788 |
| | 1,014 |
| | 1,937 |
| Reclassification to net income | 830 |
| | 788 |
| | 1,014 |
|
| Available-for-sale marketable equity securities: | | | | | | | | | | | | |
| | Equity investment income | 771 |
| | 19 |
| | 6,501 |
| Equity investment income | — |
| | 771 |
| | 19 |
|
| | Income before income taxes | 771 |
| | 19 |
| | 6,501 |
| Income before income taxes | — |
| | 771 |
| | 19 |
|
| | Income tax expense | 285 |
| | 7 |
| | 2,384 |
| Income tax expense | — |
| | 285 |
| | 7 |
|
| | Reclassification to net income | 486 |
| | 12 |
| | 4,117 |
| Reclassification to net income | — |
| | 486 |
| | 12 |
|
| Derivatives: | | | | | | | | | | | | |
| Interest rate contracts | Net interest income | (1,119 | ) | | (956 | ) | | (1,393 | ) | Net interest income | (1,119 | ) | | (1,119 | ) | | (956 | ) |
| Commodity contracts | Trading account profits | (1 | ) | | (1 | ) | | 7 |
| Trading account profits | — |
| | (1 | ) | | (1 | ) |
| Interest rate contracts | Other income | 18 |
| | — |
| | — |
| Other income | — |
| | 18 |
| | — |
|
| Equity compensation contracts | Personnel | 329 |
| | (78 | ) | | (231 | ) | Personnel | 359 |
| | 329 |
| | (78 | ) |
| | Loss before income taxes | (773 | ) | | (1,035 | ) | | (1,617 | ) | Loss before income taxes | (760 | ) | | (773 | ) | | (1,035 | ) |
| | Income tax benefit | (286 | ) | | (383 | ) | | (599 | ) | Income tax benefit | (285 | ) | | (286 | ) | | (383 | ) |
| | Reclassification to net income | (487 | ) | | (652 | ) | | (1,018 | ) | Reclassification to net income | (475 | ) | | (487 | ) | | (652 | ) |
| Employee benefit plans: | | | | | | | | | | | | |
| Prior service cost | Personnel | (4 | ) | | (6 | ) | | (16 | ) | Personnel | (5 | ) | | (4 | ) | | (6 | ) |
| Transition obligation | Personnel | — |
| | (32 | ) | | (31 | ) | Personnel | — |
| | — |
| | (32 | ) |
| Net actuarial losses | Personnel | (225 | ) | | (443 | ) | | (387 | ) | Personnel | (50 | ) | | (225 | ) | | (443 | ) |
| Settlements and curtailments | Personnel | (8 | ) | | (58 | ) | | (3 | ) | Personnel | — |
| | (8 | ) | | (58 | ) |
| | Loss before income taxes | (237 | ) | | (539 | ) | | (437 | ) | Loss before income taxes | (55 | ) | | (237 | ) | | (539 | ) |
| | Income tax benefit | (79 | ) | | (212 | ) | | (167 | ) | Income tax benefit | (23 | ) | | (79 | ) | | (212 | ) |
| | Reclassification to net income | (158 | ) | | (327 | ) | | (270 | ) | Reclassification to net income | (32 | ) | | (158 | ) | | (327 | ) |
| Foreign currency: | | | | | | | | | | | | |
| | Other income (loss) | (138 | ) | | 30 |
| | 65 |
| |
| Insignificant items | | Other income (loss) | (20 | ) | | (138 | ) | | 30 |
|
| | Income (loss) before income taxes | (138 | ) | | 30 |
| | 65 |
| Income (loss) before income taxes | (20 | ) | | (138 | ) | | 30 |
|
| | Income tax expense (benefit) | (133 | ) | | 10 |
| | (9 | ) | Income tax expense (benefit) | (12 | ) | | (133 | ) | | 10 |
|
| | Reclassification to net Income | (5 | ) | | 20 |
| | 74 |
| Reclassification to net income | (8 | ) | | (5 | ) | | 20 |
|
| Total reclassification adjustments | | $ | 624 |
| | $ | 67 |
| | $ | 4,840 |
| | $ | 315 |
| | $ | 624 |
| | $ | 67 |
|
|
| | |
| | | Bank of America 20132014 239226 |
NOTE 15 Earnings Per Common Share
The calculation of earnings per common share (EPS) and diluted EPS for 20132014, 20122013 and 20112012 is presented below. For more information on the calculation of EPS, see Note 1 – Summary of Significant Accounting Principles.
| | | | | | | | | | | | | |
| (Dollars in millions, except per share information; shares in thousands) | 2013 | | 2012 | | 2011 | 2014 | | 2013 | | 2012 |
| Earnings per common share | |
| | |
| | |
| |
| | |
| | |
|
| Net income | $ | 11,431 |
| | $ | 4,188 |
| | $ | 1,446 |
| $ | 4,833 |
| | $ | 11,431 |
| | $ | 4,188 |
|
| Preferred stock dividends | (1,349 | ) | | (1,428 | ) | | (1,361 | ) | (1,044 | ) | | (1,349 | ) | | (1,428 | ) |
| Net income applicable to common shareholders | 10,082 |
| | 2,760 |
| | 85 |
| 3,789 |
| | 10,082 |
| | 2,760 |
|
| Dividends and undistributed earnings allocated to participating securities | (2 | ) | | (2 | ) | | (1 | ) | — |
| | (2 | ) | | (2 | ) |
| Net income allocated to common shareholders | $ | 10,080 |
| | $ | 2,758 |
| | $ | 84 |
| $ | 3,789 |
| | $ | 10,080 |
| | $ | 2,758 |
|
| Average common shares issued and outstanding | 10,731,165 |
| | 10,746,028 |
| | 10,142,625 |
| 10,527,818 |
| | 10,731,165 |
| | 10,746,028 |
|
| Earnings per common share | $ | 0.94 |
| | $ | 0.26 |
| | $ | 0.01 |
| $ | 0.36 |
| | $ | 0.94 |
| | $ | 0.26 |
|
| | | | | | | | | | | |
| Diluted earnings per common share | |
| | |
| | |
| |
| | |
| | |
|
| Net income applicable to common shareholders | $ | 10,082 |
| | $ | 2,760 |
| | $ | 85 |
| $ | 3,789 |
| | $ | 10,082 |
| | $ | 2,760 |
|
| Add preferred stock dividends due to assumed conversions | 300 |
| | — |
| | — |
| — |
| | 300 |
| | — |
|
| Dividends and undistributed earnings allocated to participating securities | (2 | ) | | (2 | ) | | (1 | ) | — |
| | (2 | ) | | (2 | ) |
| Net income allocated to common shareholders | $ | 10,380 |
| | $ | 2,758 |
| | $ | 84 |
| $ | 3,789 |
| | $ | 10,380 |
| | $ | 2,758 |
|
| Average common shares issued and outstanding | 10,731,165 |
| | 10,746,028 |
| | 10,142,625 |
| 10,527,818 |
| | 10,731,165 |
| | 10,746,028 |
|
Dilutive potential common shares (1) | 760,253 |
| | 94,826 |
| | 112,199 |
| 56,717 |
| | 760,253 |
| | 94,826 |
|
| Total diluted average common shares issued and outstanding | 11,491,418 |
| | 10,840,854 |
| | 10,254,824 |
| 10,584,535 |
| | 11,491,418 |
| | 10,840,854 |
|
| Diluted earnings per common share | $ | 0.90 |
| | $ | 0.25 |
| | $ | 0.01 |
| $ | 0.36 |
| | $ | 0.90 |
| | $ | 0.25 |
|
| |
(1) | Includes incremental dilutive shares from restricted stock units, restricted stock, stock options and warrants. |
The Corporation previously issued a warrant to purchase 700 million shares of the Corporation’s common stock to the holder of the Series T Preferred Stock. For 2013, 700 million average dilutive potential common shares associated withThe warrant may be exercised, at the option of the holder, through tendering the Series T Preferred Stock were included in the diluted share count under the “if-converted” method.or paying cash. For 20122014 and 20112012, 700 million and 234 million average dilutive potential common shares associated with the Series T Preferred Stock were not included in the diluted share count because the result would have been antidilutive under the “if-converted” method. For 2013, 700 million average dilutive potential common shares associated with the Series T Preferred Stock were included in the diluted share count under the “if-converted” method. For additional information, see Note 13 – Shareholders’ Equity.
For both2014, 2013 and 2012, 62 million average dilutive potential common shares associated with the Series L Preferred Stock were not included in the diluted share count because the result would have been antidilutive under the “if-converted” method compared to 66 million for 2011.method. For 20132014, 20122013 and 20112012, average options to purchase 91 million, 126
to purchase 126 million, 163 million and 217163 million shares of common stock, respectively, were outstanding but not included in the computation of EPS because the result would have been antidilutive under the treasury stock method. For 2013, 2012 and 20112014, average warrants to purchase 272122 million shares of common stock were outstanding but not included in the computation of EPS because the result would have been antidilutive under the treasury stock method compared to 272 million shares for both 2013 and 2012. For 2014, average warrants to purchase 150 million shares of common stock were included in the diluted EPS calculation under the treasury stock method.
In connection with the preferred stock actions described in Note 13 – Shareholders’ Equity, the Corporation recorded a $100 million non-cash preferred stock dividend in 2013, and a $44 million reduction to preferred stock dividends in 2012 and a net $36 million non-cash preferred stock dividend in 2011, all, both of which are included in the calculation of net income allocated to common shareholders.
|
| | |
240227 Bank of America 20132014
| | |
NOTE 16 Regulatory Requirements and Restrictions
The Corporation manages its regulatory capital to adhere tocomply with internal capital guidelines and regulatory standards of capital adequacy based on its current understanding of the rules and the application of such ruleshow they should be applied to its business as currently conducted.
The Federal Reserve, Office of the Comptroller of the Currency (OCC)OCC and FDICFederal Deposit Insurance Corporation (collectively, joint agencies) establish regulatory capital guidelines for U.S. banking organizations. The regulatoryRegulatory capital guidelines measurerequire that capital be measured in relation to the credit and market risks of both on- and off-balance sheet items using various risk weights. On January 1, 2014, the Basel 3 rules became effective and include transition provisions through January 1, 2019. Under the current regulatory capital guidelines,Basel 3, Total capital consists of threetwo tiers of capital.capital, Tier 1 and Tier 2. Tier 1 capital includes the sumis further composed of “coreCommon equity tier 1 capital elements,” the principal components of which areand additional tier 1 capital.
Common equity tier 1 capital primarily includes qualifying common shareholders’ equity, retained earnings, accumulated other comprehensive income and certain minority interests. Goodwill, disallowed intangible assets and certain disallowed deferred tax assets are excluded from Common equity tier 1 capital.
Additional tier 1 capital primarily includes qualifying non-cumulative perpetual preferred stock. Also included in Tier 1 capital are qualifyingstock, trust preferred securities (Trust Securities), hybrid securities and qualifying noncontrolling interests in subsidiaries which are subject to the rules governing “restricted core capital elements.” Goodwill, other disallowed intangible assets, disallowedphase-out and certain minority interests. Certain deferred tax assets and the cumulative changes in fair value of all financial liabilities accounted for under the fair value option that are included in retained earnings and are attributable to changes in the company’s own creditworthiness are excluded from the sum of core capital elements. also excluded.
Tier 2 capital primarily consists of qualifying subordinated debt, a limited portion of the allowance for loan and lease losses, a portion of net unrealized gains on AFS marketable equity securitiesTrust Securities subject to phase-out and other adjustments.reserves for unfunded lending commitments. The Corporation’s totalTotal capital is the totalsum of Tier 1 capital plus supplementary Tier 2 capital. Tier 3 capital includes subordinated debt that is unsecured, fully paid, has an original maturity of at least two years, is not redeemable before maturity without prior approval by the Federal Reserve and includes a lock-in clause precluding payment of either interest or principal if the payment would cause the issuing bank’s risk-based capital ratio to fall or remain below the required minimum. Tier 3 capital can only be used to satisfy the Corporation’s market risk capital requirement and may not be used to support its credit risk requirement. At
December 31, 2013 and 2012, the Corporation had no subordinated debt that qualified as Tier 3 capital.
To meet minimum, adequately capitalized regulatory requirements, an institution must maintain a Tier 1 capital ratio of four4.0 percent and a Total capital ratio of eight8.0 percent. A “well-capitalized” institution must generally maintain capital ratios 200 bps higher than the minimum guidelines. The risk-based capital rules have been further supplemented by a Tier 1 leverage ratio, defined as Tier 1 capital divided by quarterly average total assets, after certain adjustments. Bank holding companies (BHCs)BHCs must have a minimum Tier 1 leverage ratio of at least four4.0 percent. National banks must maintain a Tier 1 leverage ratio of at least five5.0 percent to be classified as “well-capitalized.“well capitalized.” Failure to meet the capital requirements established by the joint agencies can lead to certain mandatory and discretionary actions by regulators that could have a material adverse effect on the Corporation’s financial position. At December 31, 20132014, the Corporation’s Tier 1 capital, Total capital and Tier 1 leverage ratios were 12.4413.4 percent, 15.4416.5 percent and 7.868.2 percent, respectively. Effective January 1, 2015, to meet adequately capitalized regulatory requirements, the Tier 1 capital ratio increases from 4.0 percent to 6.0 percent. This increase reflects a transfer of 2.0 percent from Tier 2 capital to Tier 1 capital, as less Tier 2 capital is permitted and more Tier 1 capital is required. The minimum Total capital ratio of 8.0 percent remains unchanged.
Current guidelines restrict certain coreThe table below presents capital elements to 15 percent of total core capital elements for internationally active BHCs. Internationally active BHCs are those that have significant activitiesratios and related information in non-U.S. marketsaccordance with consolidated assets greater than $250 billion or on-balance sheet non-U.S. exposure greater than $10 billion, which includes the Corporation. In addition, the Federal Reserve revised the qualitative standards for capital instruments included in regulatory capital. AtBasel 3 – Standardized Transition as measured at December 31, 20132014, the Corporation’s restricted core capital elements comprised 3.3 percent of total core capital elements. The Corporation is in compliance with the revised guidelines.
Tier 1 common capital is not an official regulatory ratio, but was introduced by the Federal Reserve during the Supervisory Capital Assessment Program in 2009. Tier 1 common capital is Tier 1 capital less preferred stock, Trust Securities, hybrid securities and qualifying noncontrolling interests in subsidiaries. The Corporation’s Tier 1 common capital was $145.2 billion and the TierBasel 1 common capital ratio was 11.19 percent– 2013 Rules at December 31, 2013. Prior to October 1, 2014, the Corporation operated its banking activities primarily under two charters: BANA and, to a lesser extent, FIA. On October 1, 2014, FIA was merged into BANA.
|
| | | | | | | | | | | | | | | | | | | |
| | | | | | | | | | | | |
| Regulatory Capital | | | | | | | | |
| | | | | | | | | | | | |
| | December 31 |
| | 2014 | | 2013 |
| | Basel 3 Transition | | Basel 1 |
| (Dollars in millions) | Ratio | | Amount | | Minimum Required (1) | | Ratio | | Amount | | Minimum Required (1) |
| Common equity tier 1 capital | | | | | | | | | | | |
| Bank of America Corporation | 12.3 | % | | $ | 155,361 |
| | 4.0 | % | | n/a |
| | n/a |
| | n/a |
|
| Bank of America, N.A. | 13.1 |
| | 145,150 |
| | 4.0 |
| | n/a |
| | n/a |
| | n/a |
|
| Tier 1 common capital | |
| | |
| | |
| | |
| | |
| | |
|
| Bank of America Corporation | n/a |
| | n/a |
| | n/a |
| | 10.9 | % | | $ | 141,522 |
| | n/a |
|
| Tier 1 capital | |
| | |
| | |
| | |
| | |
| | |
|
| Bank of America Corporation | 13.4 |
| | 168,973 |
| | 6.0 |
| | 12.2 |
| | 157,742 |
| | 6.0 | % |
| Bank of America, N.A. | 13.1 |
| | 145,150 |
| | 6.0 |
| | 12.3 |
| | 125,886 |
| | 6.0 |
|
| Total capital | |
| | |
| | |
| | |
| | |
| | |
|
| Bank of America Corporation | 16.5 |
| | 208,670 |
| | 10.0 |
| | 15.1 |
| | 196,567 |
| | 10.0 |
|
| Bank of America, N.A. | 14.6 |
| | 161,623 |
| | 10.0 |
| | 13.8 |
| | 141,232 |
| | 10.0 |
|
| Tier 1 leverage | |
| | |
| | |
| | |
| | |
| | |
|
| Bank of America Corporation | 8.2 |
| | 168,973 |
| | 5.0 |
| | 7.7 |
| | 157,742 |
| | 5.0 |
|
| Bank of America, N.A. | 9.6 |
| | 145,150 |
| | 5.0 |
| | 9.2 |
| | 125,886 |
| | 5.0 |
|
| Risk-weighted assets (in billions) | | | | | | | | | | | |
| Bank of America Corporation | n/a |
| | 1,262 |
| | n/a |
| | n/a |
| | 1,298 |
| | n/a |
|
| Bank of America, N.A. | n/a |
| | 1,105 |
| | n/a |
| | n/a |
| | 1,020 |
| | n/a |
|
Adjusted quarterly average total assets (in billions) (2) | | | | | | | | | | | |
| Bank of America Corporation | n/a |
| | 2,060 |
| | n/a |
| | n/a |
| | 2,052 |
| | n/a |
|
| Bank of America, N.A. | n/a |
| | 1,509 |
| | n/a |
| | n/a |
| | 1,368 |
| | n/a |
|
| |
(1) | Percent required to meet guidelines to be considered "well capitalized" under the Prompt Corrective Action framework, except for Common equity tier 1 capital which reflects capital adequacy minimum requirements as an advanced approaches bank under Basel 3 during a transition period in 2014. |
| |
(2) | Reflects adjusted average total assets for the three months ended December 31, 2014 and 2013. |
n/a = not applicable
|
| | |
| | | Bank of America 20132014 241228 |
The table below presents actual and minimum requiredRegulatory Capital
As a financial services holding company, the Corporation is subject to regulatory capital amounts at rules issued by U.S. banking regulators. On January 1, 2014, the Corporation became subject to the Basel 3 rules, which include certain transition provisions through 2018. Basel 3 generally continues to be subject to interpretation and clarification by U.S. banking regulators. Through December 31, 2013 and 2012.
|
| | | | | | | | | | | | | | | | | | | | | |
| | | | | | | | | | | | |
| Regulatory Capital | | | | | | | | |
| | | | | | | | | | | | |
| | December 31 |
| | 2013 | | 2012 |
| | Actual | | | | Actual | | |
| (Dollars in millions) | Ratio | | Amount | | Minimum Required (1) | | Ratio | | Amount | | Minimum Required (1) |
| Risk-based capital | |
| | |
| | |
| | |
| | |
| | |
|
| Tier 1 common capital | |
| | |
| | |
| | |
| | |
| | |
|
| Bank of America Corporation | 11.19 | % | | $ | 145,235 |
| | n/a |
| | 11.06 | % | | $ | 133,403 |
| | n/a |
|
| Tier 1 capital | |
| | |
| | |
| | |
| | |
| | |
|
| Bank of America Corporation | 12.44 |
| | 161,456 |
| | $ | 77,852 |
| | 12.89 |
| | 155,461 |
| | $ | 72,359 |
|
| Bank of America, N.A. | 12.34 |
| | 125,886 |
| | 61,208 |
| | 12.44 |
| | 118,431 |
| | 57,099 |
|
| FIA Card Services, N.A. | 16.83 |
| | 20,135 |
| | 7,177 |
| | 17.34 |
| | 22,061 |
| | 7,632 |
|
| Total capital | |
| | |
| | |
| | |
| | |
| | |
|
| Bank of America Corporation | 15.44 |
| | 200,281 |
| | 129,753 |
| | 16.31 |
| | 196,680 |
| | 120,598 |
|
| Bank of America, N.A. | 13.84 |
| | 141,232 |
| | 102,013 |
| | 14.76 |
| | 140,434 |
| | 95,165 |
|
| FIA Card Services, N.A. | 18.12 |
| | 21,672 |
| | 11,962 |
| | 18.64 |
| | 23,707 |
| | 12,719 |
|
| Tier 1 leverage | |
| | |
| | |
| | |
| | |
| | |
|
| Bank of America Corporation | 7.86 |
| | 161,456 |
| | 82,125 |
| | 7.37 |
| | 155,461 |
| | 84,429 |
|
| Bank of America, N.A. | 9.21 |
| | 125,886 |
| | 68,379 |
| | 8.59 |
| | 118,431 |
| | 68,957 |
|
| FIA Card Services, N.A. | 12.91 |
| | 20,135 |
| | 7,801 |
| | 13.67 |
| | 22,061 |
| | 8,067 |
|
| |
(1)
| Dollar amount required to meet guidelines to be considered well-capitalized. |
n/a = not applicable
The Federal Reserve requires BHCs to submit a capital plan and requests for capital actions on an annual basis, consistent with the rules governing the Comprehensive Capital Analysis and Review (CCAR). The CCAR is the central element of the Federal Reserve’s approach to ensure that large BHCs have adequate capital and robust processes for managing their capital. In January 2013, the Corporation submitted its 2013 capital plan and the Federal Reserve did not objectwas subject to the Corporation’s 2013 capital plan. In January 2014, the Corporation submitted its 2014 CCAR plan and related supervisory stress tests to the Federal Reserve. The Federal Reserve announced that it will release summary results, including supervisory projections of capital ratios, losses and revenues under stress scenarios, and publish the results of stress tests conducted under the supervisory adverse scenario in March 2014.
Regulatory Capital Developments
Market Risk Final Rule
Effective January 1, 2013, Basel 1 was amended by the Market Risk Final Rule, and is referred to herein as the Basel 1 – 2013 Rules. At December 31, 2013, the Corporation measured and reported itsgeneral risk-based capital ratios and related information in accordance with the Basel 1 – 2013 Rules,rules which introducedincluded new measures of market risk including a charge related to stressed Value-at-Risk (VaR), an incremental risk charge and the comprehensive risk measure (CRM), as well as other technical modifications all of which were effective Januaryto Basel 1 2013. The CRM is used to determine the risk-weighted assets for correlation trading positions. With approval from U.S. banking regulators, but not sooner than one year following compliance with the Market Risk Final Rule, the Corporation may remove a surcharge applicable to the CRM.
In December 2013, U.S. banking regulators issued an amendment to the Market Risk Final Rule, effective on April 1, 2014, to reflect certain aspects of the final Basel 3 Regulatory Capital rules (Basel 3). Revisions were made to the treatment of sovereign exposures and certain traded securitization positions as well as clarification as to the timing of required disclosures.
Basel 3 Regulatory Capital Rules
The final Basel 3 regulatory capital rules (Basel 3) became effective on January 1, 2014. Various aspects of Basel 3 will be subject to multi-year transition periods ending December 31, 2018 and Basel 3 generally continues to be subject to interpretation by the U.S. banking regulators. Basel 3 will materially change the Corporation’s Tier 1 common, Tier 1 and Total capital calculations. Basel 3 introduces new minimum capital ratios and buffer requirements and a supplementary leverage ratio; changes the composition of regulatory capital; revises the adequately capitalized minimum requirements under the Prompt Corrective Action framework; expands and modifies the calculation of risk-weighted assets for credit and market risk (the Advanced approach); and introduces a Standardized approach for the calculation of risk-weighted assets. This will replace the Basel 1 – 2013 Rules effective January 1, 2015.
Under Basel 3, the Corporation is required to calculate regulatory capital ratios and risk-weighted assets under both the Standardized approach and, upon notification of approval by U.S. banking regulators anytime on or after January 1, 2014, the Advanced approach. For 2014, the Standardized approach uses risk-weighted assets as measured under the Basel 1 – 2013 Rules and Basel 3 capital in the determination of the Basel 3 Standardized approach capital ratios. The approach that yields the lower ratio is to be used to assess capital adequacy including under the Prompt Corrective Action framework. Prior to receipt of notification of approval, the Corporation is required to assess its capital adequacy under the Standardized approach only. The Prompt Corrective Action framework establishes categories of capitalization, including “well capitalized,” based on regulatory ratio requirements. U.S. banking regulators are required to take certain mandatory actions depending on the category of capitalization, with no mandatory actions required for “well-capitalized” banking entities.
In November 2011, the Basel Committee on Banking Supervision (Basel Committee) published a methodology to identify global systematically important banks (G-SIBs) and impose an additional loss absorbency requirement through the introduction of a buffer of up to 3.5 percent for systemically
important financial institutions (SIFIs)Rules). The assessment methodology relies on an indicator-based measurement approach to determine a score relative to the global banking industry. The chosen indicators are size, complexity, cross-jurisdictional activity, interconnectedness and substitutability/financial institution infrastructure. Institutions with the highest scores are designated as G-SIBs and are assigned to one of four loss absorbency buckets from one percent to 2.5 percent, in 0.5 percent increments based on each institution’s relative score and supervisory judgment. The fifth loss absorbency bucket of 3.5 percent is currently empty and serves to discourage banks from becoming more systemically important.
In July 2013, the Basel Committee updated the November 2011 methodology to recalibrate the substitutability/financial institution infrastructure indicator by introducing a cap on the weighting of that component, and require the annual publication by the Financial Stability Board (FSB) of key information necessary to permit each G-SIB to calculate its score and observe its position within the buckets and relative to the industry total for each indicator. Every three years, beginning on January 1, 2016, the Basel Committee will reconsider and recalibrate the bucket thresholds. The Basel Committee and FSB expect banks to change their behavior in response to the incentives of the G-SIB framework, as well as other aspects of Basel 3 and jurisdiction-specific regulations.
The SIFI buffer requirement will begin to phase in effective January 2016, with full implementation in January 2019. Data from 2013, measured as of December 31, 2013, will be used to determine the SIFI buffer that will be effective for the Corporation in 2016. U.S. banking regulators have not yet issued proposed or final rules related to the SIFI buffer or disclosure requirements.
Regulatory Capital TransitionsComposition – Transition
Important differences in determining the composition of regulatory capital between the Basel 1 – 2013 Rules and Basel 3 include changes in capital deductions related to the Corporation’s MSRs, deferred tax assets and defined benefit pension assets, and the inclusion of unrealized gains and losses on AFS debt and certain marketable equity securities recorded in accumulated OCI, each of whichOCI. These changes will be impacted by, among other things, future changes in interest rates, overall earnings performance or otherand corporate actions.
Changes to the composition of regulatory capital under Basel 3, such as recognizingcompared to the impact of unrealized gains or losses on AFS debt securities in TierBasel 1 common capital,– 2013 Rules, are subject to a transition period where the impact is recognized in 20 percent annual increments. These regulatory capital adjustmentsincrements, and deductions will be fully implemented in 2018. The phase-in period for the new minimum capital ratio requirements and related buffers under Basel 3 is fromrecognized as of January 1, 2014 through December 31, 2018. When presented on a fully phased-in basis, capital, risk-weighted assets and the capital ratios assume all regulatory capital adjustments and deductions are fully recognized.
In addition,Additionally, Basel 3 revised the regulatory capital treatment for Trust Securities, requiring them to be partially transitioned from Tier 1 capital into Tier 2 capital in 2014 and 2015, until fully excluded from Tier 1 capital in 2016, and partially transitioned and excluded from Tier 2 capital beginning in 2016. The exclusion from Tier 2 capital starts at 40 percent on January 1, 2016 increasing 10 percent each year untilwith the full amount is excluded from Tier 2 capital beginning on January 1,in 2022.
Standardized Approach
The Basel 3 Standardized approach measures risk-weighted assets primarily for market risk and credit risk exposures. Exposures subject to market risk, as defined under the rules, are measured on the same basis as the Market Risk Final Rule, described previously. Credit risk exposures are measured by applying fixed risk weights to the exposure, determined based on the characteristics of the exposure, such as type of obligor, Organization for Economic Cooperation and Development (OECD) country risk code and maturity, among others. Under the Standardized approach, no distinction is made for variations in credit quality for corporate exposures, and the economic benefit of collateral is restricted to a limited list of eligible securities and cash. Some key differences between the Standardized and Advanced approaches are that the Advanced approach includes a measure of operational risk and a credit valuation adjustment capital charge in credit risk and relies on internal analytical models to measure credit risk-weighted assets, as more fully described below.
Advanced Approach
Under the Basel 3 Advanced approach, risk-weighted assets are determined primarily for market risk, credit risk and operational risk. Market risk capital measurements are consistent with the Standardized approach, except for securitization exposures, where the Supervisory Formula Approach is also permitted, and certain differences arising from the inclusion of the CVA capital charge in the credit risk capital measurement. Credit risk exposures are measured using advanced internal ratings-based models to determine the applicable risk weight by estimating the probability of default, LGD and, in certain instances, exposure at default. The analytical models primarily rely on internal historical default and loss experience. Operational risk is measured using advanced internal models which rely on both internal and external operational loss experience and data. The Basel 3 Advanced approach requires approval by the U.S. regulatory agencies of the Corporation’s internal analytical models used to calculate risk-weighted assets.
Supplementary Leverage Ratio
Basel 3 also will require the Corporation to calculate a supplementary leverage ratio, determined by dividing Tier 1 capital by total leverage exposure for each month-end during a fiscal quarter, and then calculating the simple average. Total leverage exposure is comprised of all on-balance sheet assets, plus a measure of certain off-balance sheet exposures, including, among others, lending commitments, letters of credit, over-the-counter (OTC) derivatives, repo-style transactions and margin loan commitments. The minimum supplementary leverage ratio requirement of three percent is not effective until January 1, 2018. The Corporation will be required to disclose its supplementary leverage ratio effective January 1, 2015.
In July 2013, U.S. banking regulators issued a notice of proposed rulemaking to modify the supplementary leverage ratio minimum requirements under Basel 3 effective in 2018. This proposal would only apply to BHCs with more than $700 billion in total assets or more than $10 trillion in total assets under custody. If adopted, it would require the Corporation to maintain a minimum supplementary leverage ratio of three percent, plus a supplementary leverage buffer of two percent, for a total of five percent. If the Corporation’s supplementary leverage buffer is not greater than or equal to two percent, then the Corporation would be subject to mandatory limits on its ability to make distributions of capital to shareholders, whether through dividends, stock repurchases or otherwise. In addition, the insured depository institutions of such BHCs, which for the Corporation would include primarily BANA and FIA, would be required to maintain a minimum six percent leverage ratio to be considered “well capitalized.” The proposal is not yet final and, when finalized, could have provisions significantly different from those currently proposed.
On January 12, 2014, the Basel Committee issued final guidance introducing changes to the method of calculating total leverage exposure under the international Basel 3 framework. The total leverage exposure was revised to measure derivatives on a gross basis with cash variation margin reducing the exposure if certain conditions are met, include off-balance sheet commitments measured using the notional amount multiplied by conversion factors between 10 percent and 100 percent consistent with the general risk-based capital rules and a change to measure written credit derivatives using a notional-based approach capped at the maximum loss with limited netting permitted. U.S. banking regulators may consider the Basel Committee’s final guidance in connection with the July 2013 NPR.
Basel 3 Liquidity Standards
The Basel Committee has issued two liquidity risk-related standards that are considered part of the Basel 3 liquidity standards: the Liquidity Coverage Ratio (LCR) and the Net Stable Funding Ratio (NSFR). The LCR is calculated as the amount of a financial institution’s unencumbered, high-quality, liquid assets relative to the net cash outflows the institution could encounter under a 30-day period of significant liquidity stress, expressed as a percentage. The Basel Committee’s liquidity risk-related standards do not directly apply to U.S. financial institutions currently, and would only apply once U.S. rules are finalized by the U.S. banking regulators.
On October 24, 2013, the U.S. banking regulators jointly proposed regulations that would implement LCR requirements for the largest U.S. financial institutions on a consolidated basis and for their subsidiary depository institutions with total assets greater than $10 billion. Under the proposal, an initial minimum LCR of 80 percent would be required in January 2015, and would thereafter increase in 10 percentage point increments annually through January 2017. These minimum requirements would be
applicable to the Corporation on a consolidated basis and at its insured depository institutions, including BANA, FIA and Bank of America California, N.A.
On January 12, 2014, the Basel Committee issued for comment a revised NSFR, the standard that is intended to reduce funding risk over a longer time horizon. The NSFR is designed to ensure an appropriate amount of stable funding, generally capital and liabilities maturing beyond one year, given the mix of assets and off-balance sheet items. The revised proposal would align the NSFR to some of the 2013 revisions to the LCR and give more credit to a wider range of funding. The proposal also includes adjustments to the stable funding required for certain types of assets, some of which reduce the stable funding requirement and some of which increase it. The Basel Committee expects to complete the NSFR recalibration in 2014 and expects the minimum standard to be in place by 2018.
Other Regulatory Matters
On February 18, 2014, the Federal Reserve approved a final rule implementing certain enhanced supervisory and prudential
requirements established under the Dodd-Frank Wall Street Reform and Consumer Protection Act. The final rule formalizes risk management requirements primarily related to governance and liquidity risk management and reiterates the provisions of previously issued final rules related to risk-based and leverage capital and stress test requirements. Also, a debt-to-equity limit may be enacted for an individual BHC if it is determined to pose a grave threat to the financial stability of the U.S., Such limit is at the discretion of the Financial Stability Oversight Council (FSOC) or the Federal Reserve on behalf of the FSOC.
The Federal Reserve requires the Corporation’s banking subsidiaries to maintain reserve balances based on a percentage of certain deposits. Average daily reserve balance requirements for the Corporation by the Federal Reserve were $16.618.2 billion and $16.316.6 billion for 20132014 and 20122013. Currency and coin residing in branches and cash vaults (vault cash) are used to partially satisfy the reserve requirement. The average daily reserve balances, in excess of vault cash, held with the Federal Reserve amounted to $7.89.1 billion and $7.97.8 billion for 20132014 and 20122013. As of December 31, 20132014 and 20122013, the Corporation had cash in the amount of $6.04.5 billion and $8.5$6.0 billion, and securities with a fair value of $8.413.1 billion and $5.9$8.4 billion that were segregated in compliance with securities regulations or deposited with clearing organizations.
The primary sources of funds for cash distributions by the Corporation to its shareholders are capital distributions received from its banking subsidiaries, BANA and FIA.subsidiary, BANA. In 20132014, the Corporation received $8.512.4 billion in dividends from BANA. Prior to its merger with BANA, and FIA returned capital of $8.74.2 billion to the Corporation in 20132014. In 20142015, BANA can declare and pay dividends of $8.0$16.9 billion to the Corporation plus an additional amount equal to its retained net profits for 20142015 up to the date of any such dividend declaration. The other subsidiary national banks returned capital of $1.4 billion to the Corporation in 2013. Bank of America California, N.A. can pay dividends of $396924 million in 20142015 plus an additional amount equal to its retained net profits for 20142015 up to the date of any such dividend declaration. The amount of dividends that each subsidiary bank may declare in a calendar year is the subsidiary bank’s net profits for that year combined with its retained net profits for the preceding two years. Retained net profits, as defined by the OCC, consist of net income less dividends declared during the period.
|
| | |
244229 Bank of America 20132014
| | |
NOTE 17 Employee Benefit Plans
Pension and Postretirement Plans
The Corporation sponsors noncontributory trusteed pension plans, a number of noncontributory nonqualified pension plans, and postretirement health and life plans that cover eligible employees. As discussed below, certain of the pension plans were amended, effective June 30, 2012, to freeze benefits earned. The pension plans provide defined benefits based on an employee’s compensation and years of service. The Bank of America Pension Plan (the Pension Plan) provides participants with compensation credits, generally based on years of service. In 2013, the Corporation merged a defined benefit pension plan, which covered eligible employees of certain legacy companies, into the Bank of America Pension Plan. This plan is referred to as the Qualified Pension Plan (Qualified Pension Plans prior to this merger). For account balances based on compensation credits prior to January 1, 2008, the Pension Plan allows participants to select from various earnings measures, which are based on the returns of certain funds or common stock of the Corporation. The participant-selected earnings measures determine the earnings rate on the individual participant account balances in the Pension Plan. Participants may elect to modify earnings measure allocations on a periodic basis subject to the provisions of the Pension Plan. For account balances based on compensation credits subsequent to December 31, 2007, the account balance earnings rate is based on a benchmark rate. For eligible employees in the Pension Plan on or after January 1, 2008, the benefits become vested upon completion of three years of service. It is the policy of the Corporation to fund no less than the minimum funding amount required by ERISA.
The Pension Plan has a balance guarantee feature for account balances with participant-selected earnings, applied at the time a benefit payment is made from the plan that effectively provides principal protection for participant balances transferred and certain compensation credits. The Corporation is responsible for funding any shortfall on the guarantee feature.
As a result of acquisitions, the Corporation assumed the obligations related to the pension plans of certain legacy companies. The benefit structures under these acquired plans have not changed and remain intact in the merged plan. Certain benefit structures are substantially similar to the Pension Plan discussed above; however, certain of these structures do not allow participants to select various earnings measures; rather the earnings rate is based on a benchmark rate. In addition, these structures include participants with benefits determined under formulas based on average or career compensation and years of service rather than by reference to a pension account. Certain of the other structures provide a participant’s retirement benefits based on the number of years of benefit service and a percentage of the participant’s average annual compensation during the five highest paid consecutive years of the last 10 years of employment.
The 2013 merger of the defined benefit pension plan into the Qualified Pension Plan required a remeasurement of the qualified pension obligations and plan assets at fair value as of the merger date in addition to the required December 31 remeasurement. The 2013 remeasurements resulted in an increase in accumulated OCI of $2.0 billion, net-of-tax.
In 2012, in connection with a redesign of the Corporation’s retirement plans, the Compensation and Benefits Committee of the Corporation’s Board of Directors approved amendments to freeze benefits earned in the Qualified Pension Plans effective
June 30, 2012. As a result of
freezing the Qualified Pension Plans, a curtailment was triggered and a remeasurement of the qualified pension obligations and plan assets occurred. As of the remeasurement date, the plan assets had increased in value from the prior measurement date resulting in an increase in the funded status of the plan and the curtailment impact reduced the projected benefit obligation. The combined impact resulted in a $1.3 billion increase to the net pension assets recognized in other assets and a corresponding increase in accumulated OCI of $832 million, net-of-tax. The impact of the immediate recognition of the prior service cost of $58 million was recorded in personnel expense as a curtailment loss in 2012. All economic assumptions were consistent with the prior year end including the weighted-average discount rate of 4.95 percent used for remeasurement of the Qualified Pension Plans.2012.
As a result of freezing the Qualified Pension Plans, the amortization period for actuarial gains and losses was changed from the average working life to the estimated average lifetime of benefits being paid. In addition, in 2014, the long-term expected return on assets assumption for the Qualified Pension Plan was reduced to 6.0 percent from 6.5 percent in 2013 and 8.0 percent in 2012 to reflect current market conditions and long-term financial goals.
The Corporation assumed the obligations related to the plans of Merrill Lynch. These plans include a terminated U.S. pension plan (the Other Pension Plan), non-U.S. pension plans, nonqualified pension plans and postretirement plans. The non-U.S. pension plans vary based on the country and local practices.
The Corporation has an annuity contract, previously purchased by Merrill Lynch, that guarantees the payment of benefits vested under the Other Pension Plan. The Corporation, under a supplemental agreement, may be responsible for, or benefit from actual experience and investment performance of the annuity assets. The Corporation made no contribution under this agreement in 20132014 or 20122013. Contributions may be required in the future under this agreement.
The Corporation sponsors a number of noncontributory, nonqualified pension plans (the Nonqualified Pension Plans). As a result of acquisitions, the Corporation assumed the obligations related to the noncontributory, nonqualified pension plans of certain legacy companies including Merrill Lynch. These plans, which are unfunded, provide defined pension benefits to certain employees.
In addition to retirement pension benefits, full-time, salaried employees and certain part-time employees may become eligible to continue participation as retirees in health care and/or life insurance plans sponsored by the Corporation. Based on the other provisions of the individual plans, certain retirees may also have the cost of these benefits partially paid by the Corporation. The obligations assumed as a result of acquisitions are substantially similar to the Corporation’s postretirement health and life plans, except for Countrywide which did not have a postretirement health and life plan. Collectively, these plans are referred to as the Postretirement Health and Life Plans.
The Pension and Postretirement Plans table summarizes the changes in the fair value of plan assets, changes in the projected benefit obligation (PBO), the funded status of both the accumulated benefit obligation (ABO) and the PBO, and the weighted-average assumptions used to determine benefit obligations for the pension plans and postretirement plans at December 31, 20132014 and 20122013. Amounts recognized at December 31, 20132014 and 20122013 are reflected in other assets, and in accrued expenses and other liabilities on the Consolidated Balance Sheet. The estimation of the Corporation’s PBO associated with these plans considers various actuarial assumptions, including assumptions for mortality rates and discount rates. As of December 31, 2014, the Corporation adopted mortality assumptions published by the Society of Actuaries in October 2014, adjusted to reflect observed and anticipated future mortality
|
| | |
| | | Bank of America 20132014 245230 |
experience of the participants in the Corporation’s U.S. plans. The adoption of the new mortality assumptions resulted in an increase to the PBO of approximately $580 million at December 31, 2014. The discount rate assumption is based onassumptions are derived from a cash flow matching technique and is subject to change each year. This techniquethat utilizes yield curvesrates that are based on Aa-rated corporate bonds with cash flows that match estimated benefit payments of each of the plansplans. The decrease in weighted-average discount rates in 2014 resulted in an increase to produce the discount rate assumptions. The asset valuation method for the Qualified Pension Plan recognizes 60 percentPBO of the prior year’s market gains or losses at the next measurement date with the remaining 40 percent spread equally over the subsequent four years.
approximately $1.9 billion at December 31, 2014.
The Corporation’s best estimate of its contributions to be made
to the Non-U.S. Pension Plans, Nonqualified and Other Pension Plans, and Postretirement Health and Life Plans in 20142015 is $83$56 million,, $103 $101 million and $106$87 million,, respectively. The Corporation does not expect to make a contribution to the Qualified Pension Plan in 2014.
2015.
| | | | | | | | | | | | | | | | | |
| Pension and Postretirement Plans | | | | | | | | | | | | | | |
| | | | | | | | | | | | | | | |
| | Qualified Pension Plan (1) | | Non-U.S. Pension Plans (1) | | Nonqualified and Other Pension Plans (1) | | Postretirement Health and Life Plans (1) | Qualified Pension Plan (1) | | Non-U.S. Pension Plans (1) | | Nonqualified and Other Pension Plans (1) | | Postretirement Health and Life Plans (1) |
| (Dollars in millions) | 2013 | | 2012 | | 2013 | | 2012 | | 2013 | | 2012 | | 2013 | | 2012 | 2014 | | 2013 | | 2014 | | 2013 | | 2014 | | 2013 | | 2014 | | 2013 |
| Change in fair value of plan assets | |
| | |
| | |
| | |
| | |
| | |
| | |
| | |
| |
| | |
| | |
| | |
| | |
| | |
| | |
| | |
|
| Fair value, January 1 | $ | 16,274 |
| | $ | 15,070 |
| | $ | 2,306 |
| | $ | 2,022 |
| | $ | 3,063 |
| | $ | 3,061 |
| | $ | 86 |
| | $ | 91 |
| $ | 18,276 |
| | $ | 16,274 |
| | $ | 2,457 |
| | $ | 2,306 |
| | $ | 2,720 |
| | $ | 3,063 |
| | $ | 72 |
| | $ | 86 |
|
| Actual return on plan assets | 2,873 |
| | 2,020 |
| | 146 |
| | 115 |
| | (217 | ) | | 126 |
| | 9 |
| | 10 |
| 1,261 |
| | 2,873 |
| | 256 |
| | 146 |
| | 336 |
| | (217 | ) | | 6 |
| | 9 |
|
| Company contributions | — |
| | — |
| | 131 |
| | 152 |
| | 98 |
| | 112 |
| | 61 |
| | 117 |
| — |
| | — |
| | 84 |
| | 131 |
| | 97 |
| | 98 |
| | 53 |
| | 61 |
|
| Plan participant contributions | — |
| | — |
| | 1 |
| | 3 |
| | — |
| | — |
| | 138 |
| | 139 |
| — |
| | — |
| | 1 |
| | 1 |
| | — |
| | — |
| | 129 |
| | 138 |
|
| Settlements and curtailments | — |
| | — |
| | (80 | ) | | — |
| | (7 | ) | | — |
| | — |
| | — |
| — |
| | — |
| | (5 | ) | | (80 | ) | | — |
| | (7 | ) | | — |
| | — |
|
| Benefits paid | (871 | ) | | (816 | ) | | (80 | ) | | (77 | ) | | (217 | ) | | (236 | ) | | (237 | ) | | (290 | ) | (923 | ) | | (871 | ) | | (68 | ) | | (80 | ) | | (226 | ) | | (217 | ) | | (248 | ) | | (237 | ) |
| Federal subsidy on benefits paid | n/a |
| | n/a |
| | n/a |
| | n/a |
| | n/a |
| | n/a |
| | 15 |
| | 19 |
| n/a |
| | n/a |
| | n/a |
| | n/a |
| | n/a |
| | n/a |
| | 16 |
| | 15 |
|
| Foreign currency exchange rate changes | n/a |
| | n/a |
| | 33 |
| | 91 |
| | n/a |
| | n/a |
| | n/a |
| | n/a |
| n/a |
| | n/a |
| | (161 | ) | | 33 |
| | n/a |
| | n/a |
| | n/a |
| | n/a |
|
| Fair value, December 31 | $ | 18,276 |
| | $ | 16,274 |
| | $ | 2,457 |
| | $ | 2,306 |
| | $ | 2,720 |
| | $ | 3,063 |
| | $ | 72 |
| | $ | 86 |
| $ | 18,614 |
| | $ | 18,276 |
| | $ | 2,564 |
| | $ | 2,457 |
| | $ | 2,927 |
| | $ | 2,720 |
| | $ | 28 |
| | $ | 72 |
|
| Change in projected benefit obligation | |
| | |
| | |
| | |
| | |
| | |
| | |
| | |
| |
| | |
| | |
| | |
| | |
| | |
| | |
| | |
|
| Projected benefit obligation, January 1 | $ | 15,655 |
| | $ | 14,891 |
| | $ | 2,460 |
| | $ | 1,984 |
| | $ | 3,334 |
| | $ | 3,137 |
| | $ | 1,574 |
| | $ | 1,619 |
| $ | 14,145 |
| | $ | 15,655 |
| | $ | 2,580 |
| | $ | 2,460 |
| | $ | 3,070 |
| | $ | 3,334 |
| | $ | 1,356 |
| | $ | 1,574 |
|
| Service cost | — |
| | 236 |
| | 32 |
| | 40 |
| | 1 |
| | 1 |
| | 9 |
| | 13 |
| — |
| | — |
| | 29 |
| | 32 |
| | 1 |
| | 1 |
| | 8 |
| | 9 |
|
| Interest cost | 623 |
| | 681 |
| | 98 |
| | 97 |
| | 120 |
| | 138 |
| | 54 |
| | 71 |
| 665 |
| | 623 |
| | 109 |
| | 98 |
| | 133 |
| | 120 |
| | 58 |
| | 54 |
|
| Plan participant contributions | — |
| | — |
| | 1 |
| | 3 |
| | — |
| | — |
| | 138 |
| | 139 |
| — |
| | — |
| | 1 |
| | 1 |
| | — |
| | — |
| | 129 |
| | 138 |
|
| Plan amendments | — |
| | — |
| | 2 |
| | 2 |
| | — |
| | — |
| | — |
| | — |
| — |
| | — |
| | 1 |
| | 2 |
| | — |
| | — |
| | — |
| | — |
|
| Settlements and curtailments | 17 |
| | (889 | ) | | (116 | ) | | — |
| | (7 | ) | | — |
| | — |
| | — |
| — |
| | 17 |
| | (6 | ) | | (116 | ) | | — |
| | (7 | ) | | — |
| | — |
|
| Actuarial loss (gain) | (1,279 | ) | | 1,552 |
| | 156 |
| | 328 |
| | (161 | ) | | 294 |
| | (197 | ) | | (4 | ) | 1,621 |
| | (1,279 | ) | | 208 |
| | 156 |
| | 351 |
| | (161 | ) | | 29 |
| | (197 | ) |
| Benefits paid | (871 | ) | | (816 | ) | | (80 | ) | | (77 | ) | | (217 | ) | | (236 | ) | | (237 | ) | | (290 | ) | (923 | ) | | (871 | ) | | (68 | ) | | (80 | ) | | (226 | ) | | (217 | ) | | (248 | ) | | (237 | ) |
| Federal subsidy on benefits paid | n/a |
| | n/a |
| | n/a |
| | n/a |
| | n/a |
| | n/a |
| | 15 |
| | 19 |
| n/a |
| | n/a |
| | n/a |
| | n/a |
| | n/a |
| | n/a |
| | 16 |
| | 15 |
|
| Foreign currency exchange rate changes | n/a |
| | n/a |
| | 27 |
| | 83 |
| | n/a |
| | n/a |
| | — |
| | 7 |
| n/a |
| | n/a |
| | (166 | ) | | 27 |
| | n/a |
| | n/a |
| | (2 | ) | | — |
|
| Projected benefit obligation, December 31 | $ | 14,145 |
| | $ | 15,655 |
| | $ | 2,580 |
| | $ | 2,460 |
| | $ | 3,070 |
| | $ | 3,334 |
| | $ | 1,356 |
| | $ | 1,574 |
| $ | 15,508 |
| | $ | 14,145 |
| | $ | 2,688 |
| | $ | 2,580 |
| | $ | 3,329 |
| | $ | 3,070 |
| | $ | 1,346 |
| | $ | 1,356 |
|
| Amount recognized, December 31 | $ | 4,131 |
| | $ | 619 |
| | $ | (123 | ) | | $ | (154 | ) | | $ | (350 | ) | | $ | (271 | ) | | $ | (1,284 | ) | | $ | (1,488 | ) | $ | 3,106 |
| | $ | 4,131 |
| | $ | (124 | ) | | $ | (123 | ) | | $ | (402 | ) | | $ | (350 | ) | | $ | (1,318 | ) | | $ | (1,284 | ) |
| Funded status, December 31 | |
| | |
| | |
| | |
| | |
| | |
| | |
| | |
| |
| | |
| | |
| | |
| | |
| | |
| | |
| | |
|
| Accumulated benefit obligation | $ | 14,145 |
| | $ | 15,655 |
| | $ | 2,463 |
| | $ | 2,345 |
| | $ | 3,067 |
| | $ | 3,334 |
| | n/a |
| | n/a |
| $ | 15,508 |
| | $ | 14,145 |
| | $ | 2,582 |
| | $ | 2,463 |
| | $ | 3,329 |
| | $ | 3,067 |
| | n/a |
| | n/a |
|
| Overfunded (unfunded) status of ABO | 4,131 |
| | 619 |
| | (6 | ) | | (39 | ) | | (347 | ) | | (271 | ) | | n/a |
| | n/a |
| 3,106 |
| | 4,131 |
| | (18 | ) | | (6 | ) | | (402 | ) | | (347 | ) | | n/a |
| | n/a |
|
| Provision for future salaries | — |
| | — |
| | 117 |
| | 115 |
| | 3 |
| | — |
| | n/a |
| | n/a |
| — |
| | — |
| | 106 |
| | 117 |
| | — |
| | 3 |
| | n/a |
| | n/a |
|
| Projected benefit obligation | 14,145 |
| | 15,655 |
| | 2,580 |
| | 2,460 |
| | 3,070 |
| | 3,334 |
| | $ | 1,356 |
| | $ | 1,574 |
| 15,508 |
| | 14,145 |
| | 2,688 |
| | 2,580 |
| | 3,329 |
| | 3,070 |
| | $ | 1,346 |
| | $ | 1,356 |
|
| Weighted-average assumptions, December 31 | |
| | |
| | |
| | |
| | |
| | |
| | |
| | |
| |
| | |
| | |
| | |
| | |
| | |
| | |
| | |
|
| Discount rate | 4.85 | % | | 4.00 | % | | 4.30 | % | | 4.23 | % | | 4.55 | % | | 3.65 | % | | 4.50 | % | | 3.65 | % | 4.12 | % | | 4.85 | % | | 3.56 | % | | 4.30 | % | | 3.80 | % | | 4.55 | % | | 3.75 | % | | 4.50 | % |
| Rate of compensation increase | n/a |
| | n/a |
| | 3.40 |
| | 4.37 |
| | 4.00 |
| | 4.00 |
| | n/a |
| | n/a |
| n/a |
| | n/a |
| | 4.70 |
| | 4.91 |
| | 4.00 |
| | 4.00 |
| | n/a |
| | n/a |
|
| |
(1) | The measurement date for the Qualified Pension Plan, Non-U.S. Pension Plans, Nonqualified and Other Pension Plans, and Postretirement Health and Life Plans was December 31 of each year reported. |
n/a = not applicable
Amounts recognized on the Consolidated Balance Sheet at December 31, 20132014 and 20122013 are presented in the table below.
| | | | | | | | | | | | | | | | | |
| Amounts Recognized on Consolidated Balance Sheet | Amounts Recognized on Consolidated Balance Sheet | | | | | | | | | Amounts Recognized on Consolidated Balance Sheet | | | | | | | | |
| | | | | | | | | | | | | | | |
| | Qualified Pension Plan | | Non-U.S. Pension Plans | | Nonqualified and Other Pension Plans | | Postretirement Health and Life Plans | Qualified Pension Plan | | Non-U.S. Pension Plans | | Nonqualified and Other Pension Plans | | Postretirement Health and Life Plans |
| (Dollars in millions) | 2013 | | 2012 | | 2013 | | 2012 | | 2013 | | 2012 | | 2013 | | 2012 | 2014 | | 2013 | | 2014 | | 2013 | | 2014 | | 2013 | | 2014 | | 2013 |
| Other assets | $ | 4,131 |
| | $ | 676 |
| | $ | 205 |
| | $ | 220 |
| | $ | 777 |
| | $ | 908 |
| | $ | — |
| | $ | — |
| $ | 3,106 |
| | $ | 4,131 |
| | $ | 252 |
| | $ | 205 |
| | $ | 786 |
| | $ | 777 |
| | $ | — |
| | $ | — |
|
| Accrued expenses and other liabilities | — |
| | (57 | ) | | (328 | ) | | (374 | ) | | (1,127 | ) | | (1,179 | ) | | (1,284 | ) | | (1,488 | ) | — |
| | — |
| | (376 | ) | | (328 | ) | | (1,188 | ) | | (1,127 | ) | | (1,318 | ) | | (1,284 | ) |
| Net amount recognized at December 31 | $ | 4,131 |
| | $ | 619 |
| | $ | (123 | ) | | $ | (154 | ) | | $ | (350 | ) | | $ | (271 | ) | | $ | (1,284 | ) | | $ | (1,488 | ) | $ | 3,106 |
| | $ | 4,131 |
| | $ | (124 | ) | | $ | (123 | ) | | $ | (402 | ) | | $ | (350 | ) | | $ | (1,318 | ) | | $ | (1,284 | ) |
|
| | |
246231 Bank of America 20132014
| | |
Pension Plans with ABO and PBO in excess of plan assets as of December 31, 20132014 and 20122013 are presented in the table below. For the non-qualified plans not subject to ERISA or non-U.S. pension plans, funding strategies vary due to legal requirements and local practices.
|
| | | | | | | | | | | | | | | | | | | | | |
| | | | | | | | | | | | |
| Plans with ABO and PBO in Excess of Plan Assets | | | | | | | | | | | |
| | | | | | | | | | | | |
| | Qualified Pension Plan | | Non-U.S. Pension Plans | | Nonqualified and Other Pension Plans |
| (Dollars in millions) | 2013 | | 2012 | | 2013 | | 2012 | | 2013 | | 2012 |
| Plans with ABO in excess of plan assets | | | | | |
| | |
| | | | |
|
| PBO | n/a | | $ | 7,171 |
| | $ | 617 |
| | $ | 883 |
| | $ | 1,129 |
| | $ | 1,182 |
|
| ABO | n/a | | 7,171 |
| | 606 |
| | 843 |
| | 1,126 |
| | 1,181 |
|
| Fair value of plan assets | n/a | | 7,114 |
| | 290 |
| | 510 |
| | 2 |
| | 2 |
|
| Plans with PBO in excess of plan assets | | | | | | | |
| | | | |
|
| PBO | n/a | | $ | 7,171 |
| | $ | 720 |
| | $ | 896 |
| | $ | 1,129 |
| | $ | 1,182 |
|
| Fair value of plan assets | n/a | | 7,114 |
| | 392 |
| | 522 |
| | 2 |
| | 2 |
|
n/a = not applicable |
| | | | | | | | | | | | | | | |
| | | | | | | | |
| Plans with ABO and PBO in Excess of Plan Assets | | | | | | | |
| | | | | | | | |
| | Non-U.S. Pension Plans | | Nonqualified and Other Pension Plans |
| (Dollars in millions) | 2014 | | 2013 | | 2014 | | 2013 |
| Plans with ABO in excess of plan assets | |
| | |
| | | | |
|
| PBO | $ | 583 |
| | $ | 617 |
| | $ | 1,190 |
| | $ | 1,129 |
|
| ABO | 563 |
| | 606 |
| | 1,190 |
| | 1,126 |
|
| Fair value of plan assets | 206 |
| | 290 |
| | 2 |
| | 2 |
|
| Plans with PBO in excess of plan assets | | | |
| | | | |
|
| PBO | $ | 583 |
| | $ | 720 |
| | $ | 1,190 |
| | $ | 1,129 |
|
| Fair value of plan assets | 206 |
| | 392 |
| | 2 |
| | 2 |
|
Net periodic benefit cost of the Corporation’s plans for 20132014, 20122013 and 20112012 included the following components.
| | | | | | | | | | | | | | | | | | | | | | | | | |
| Components of Net Periodic Benefit Cost | | | | | | | | | | | | | | | | | | | | | | |
| | | | | | | | | | | | | | | | | | | | | | | |
| | Qualified Pension Plan | | Non-U.S. Pension Plans | Qualified Pension Plan | | Non-U.S. Pension Plans |
| (Dollars in millions) | 2013 | | 2012 | | 2011 | | 2013 | | 2012 | | 2011 | 2014 | | 2013 | | 2012 | | 2014 | | 2013 | | 2012 |
| Components of net periodic benefit cost | |
| | |
| | |
| | |
| | |
| | |
| |
| | |
| | |
| | |
| | |
| | |
|
| Service cost | $ | — |
| | $ | 236 |
| | $ | 423 |
| | $ | 32 |
| | $ | 40 |
| | $ | 43 |
| $ | — |
| | $ | — |
| | $ | 236 |
| | $ | 29 |
| | $ | 32 |
| | $ | 40 |
|
| Interest cost | 623 |
| | 681 |
| | 746 |
| | 98 |
| | 97 |
| | 99 |
| 665 |
| | 623 |
| | 681 |
| | 109 |
| | 98 |
| | 97 |
|
| Expected return on plan assets | (1,024 | ) | | (1,246 | ) | | (1,296 | ) | | (121 | ) | | (137 | ) | | (115 | ) | (1,018 | ) | | (1,024 | ) | | (1,246 | ) | | (137 | ) | | (121 | ) | | (137 | ) |
| Amortization of prior service cost | — |
| | 9 |
| | 20 |
| | — |
| | — |
| | — |
| — |
| | — |
| | 9 |
| | 1 |
| | — |
| | — |
|
| Amortization of net actuarial loss (gain) | 242 |
| | 469 |
| | 387 |
| | 2 |
| | (9 | ) | | — |
| 111 |
| | 242 |
| | 469 |
| | 3 |
| | 2 |
| | (9 | ) |
| Recognized loss (gain) due to settlements and curtailments | 17 |
| | 58 |
| | — |
| | (7 | ) | | — |
| | — |
| — |
| | 17 |
| | 58 |
| | 2 |
| | (7 | ) | | — |
|
| Net periodic benefit cost (income) | $ | (142 | ) | | $ | 207 |
| | $ | 280 |
| | $ | 4 |
| | $ | (9 | ) | | $ | 27 |
| $ | (242 | ) | | $ | (142 | ) | | $ | 207 |
| | $ | 7 |
| | $ | 4 |
| | $ | (9 | ) |
| Weighted-average assumptions used to determine net cost for years ended December 31 | |
| | |
| | |
| | |
| | |
| | |
| |
| | |
| | |
| | |
| | |
| | |
|
| Discount rate | 4.00 | % | | 4.95 | % | | 5.45 | % | | 4.23 | % | | 4.87 | % | | 5.32 | % | 4.85 | % | | 4.00 | % | | 4.95 | % | | 4.30 | % | | 4.23 | % | | 4.87 | % |
| Expected return on plan assets | 6.50 |
| | 8.00 |
| | 8.00 |
| | 5.50 |
| | 6.65 |
| | 6.58 |
| 6.00 |
| | 6.50 |
| | 8.00 |
| | 5.52 |
| | 5.50 |
| | 6.65 |
|
| Rate of compensation increase | n/a |
| | 4.00 |
| | 4.00 |
| | 4.37 |
| | 4.42 |
| | 4.85 |
| n/a |
| | n/a |
| | 4.00 |
| | 4.91 |
| | 4.37 |
| | 4.42 |
|
| | | | | | | | | | | | | | | | | | | | | | | |
| | Nonqualified and
Other Pension Plans | | Postretirement Health
and Life Plans | Nonqualified and
Other Pension Plans | | Postretirement Health
and Life Plans |
| (Dollars in millions) | 2013 | | 2012 | | 2011 | | 2013 | | 2012 | | 2011 | 2014 | | 2013 | | 2012 | | 2014 | | 2013 | | 2012 |
| Components of net periodic benefit cost | |
| | |
| | |
| | |
| | |
| | |
| |
| | |
| | |
| | |
| | |
| | |
|
| Service cost | $ | 1 |
| | $ | 1 |
| | $ | 3 |
| | $ | 9 |
| | $ | 13 |
| | $ | 15 |
| $ | 1 |
| | $ | 1 |
| | $ | 1 |
| | $ | 8 |
| | $ | 9 |
| | $ | 13 |
|
| Interest cost | 120 |
| | 138 |
| | 152 |
| | 54 |
| | 71 |
| | 80 |
| 133 |
| | 120 |
| | 138 |
| | 58 |
| | 54 |
| | 71 |
|
| Expected return on plan assets | (109 | ) | | (152 | ) | | (141 | ) | | (5 | ) | | (8 | ) | | (9 | ) | (124 | ) | | (109 | ) | | (152 | ) | | (4 | ) | | (5 | ) | | (8 | ) |
| Amortization of transition obligation | — |
| | — |
| | — |
| | — |
| | 32 |
| | 31 |
| — |
| | — |
| | — |
| | — |
| | — |
| | 32 |
|
| Amortization of prior service cost (credits) | — |
| | (3 | ) | | (8 | ) | | 4 |
| | 4 |
| | 4 |
| — |
| | — |
| | (3 | ) | | 4 |
| | 4 |
| | 4 |
|
| Amortization of net actuarial loss (gain) | 25 |
| | 8 |
| | 16 |
| | (42 | ) | | (38 | ) | | (17 | ) | 25 |
| | 25 |
| | 8 |
| | (89 | ) | | (42 | ) | | (38 | ) |
| Recognized loss due to settlements and curtailments | 2 |
| | — |
| | 3 |
| | 6 |
| | — |
| | — |
| — |
| | 2 |
| | — |
| | — |
| | 6 |
| | — |
|
| Net periodic benefit cost (income) | $ | 39 |
| | $ | (8 | ) | | $ | 25 |
| | $ | 26 |
| | $ | 74 |
| | $ | 104 |
| $ | 35 |
| | $ | 39 |
| | $ | (8 | ) | | $ | (23 | ) | | $ | 26 |
| | $ | 74 |
|
| Weighted-average assumptions used to determine net cost for years ended December 31 | |
| | |
| | |
| | |
| | |
| | |
| |
| | |
| | |
| | |
| | |
| | |
|
| Discount rate | 3.65 | % | | 4.65 | % | | 5.20 | % | | 3.65 | % | | 4.65 | % | | 5.10 | % | 4.55 | % | | 3.65 | % | | 4.65 | % | | 4.50 | % | | 3.65 | % | | 4.65 | % |
| Expected return on plan assets | 3.75 |
| | 5.25 |
| | 5.25 |
| | 6.50 |
| | 8.00 |
| | 8.00 |
| 4.60 |
| | 3.75 |
| | 5.25 |
| | 6.00 |
| | 6.50 |
| | 8.00 |
|
| Rate of compensation increase | 4.00 |
| | 4.00 |
| | 4.00 |
| | n/a |
| | n/a |
| | n/a |
| 4.00 |
| | 4.00 |
| | 4.00 |
| | n/a |
| | n/a |
| | n/a |
|
n/a = not applicable
The asset valuation method used to calculate the expected return on plan assets component of net period benefit cost for the Qualified Pension Plan recognizes 60 percent of the prior year’s market gains or losses at the next measurement date with the remaining 40 percent spread equally over the subsequent four years.
Net periodic postretirement health and life expense was determined using the “projected unit credit” actuarial method. Gains and losses for all benefit plans except postretirement health
care are recognized in accordance with the standard amortization provisions of the applicable accounting guidance. For the Postretirement Health Care Plans, 50 percent of the unrecognized gain or loss at the beginning of the fiscal year (or at subsequent remeasurement) is recognized on a level basis during the year.
The discount rate and expected return on plan assets impact the net periodic benefit cost (income) recorded for the plans. With all other assumptions held constant, a 25 bps decline in the discount rate would result in an increase of approximately $7 million, while a 25 bps decline in the expected return on plan assets would result in an increase of approximately $41 million for the Qualified Pension Plan. For the Postretirement Health and Life Plans, the 25 bps decline in the discount rate would result in
an increase of approximately $9 million. For the Non-U.S. Pension Plans and the Nonqualified and Other Pension Plans, the 25 bps decline in rates would not have a significant impact.
Assumed health care cost trend rates affect the postretirement benefit obligation and benefit cost reported for the Postretirement Health and Life Plans. The assumed health care cost trend rate used to measure the expected cost of benefits covered by the
Postretirement Health and Life Plans is 7.00 percent for 20142015, and 2016, reducing in steps to 5.00 percent in 20192021 and later years. A one-
percentage-pointone-percentage-point increase in assumed health care cost trend rates would have increased the service and interest costs, and the benefit obligation by $2 million and $5447 million in 20132014. A one-percentage-point decrease in assumed health care cost trend rates would have lowered the service and interest costs, and the benefit obligation by $2 million and $4741 million in 20132014.
The Corporation’s net periodic benefit cost (income) recognized for the plans is sensitive to the discount rate and expected return on plan assets. With all other assumptions held constant, a 25 basis point (bp) decline in the discount rate and expected return on plan asset assumptions would have resulted in an increase in the net periodic benefit cost for the Qualified Pension Plan
recognized in 2014 of approximately $7 million and $43 million, and to be recognized in 2015 of approximately $9 million and $44 million. For the Postretirement Health and Life Plans, a 25 bp decline in the discount rate would have resulted in an increase in the net periodic benefit cost recognized in 2014 of approximately $9 million, and to be recognized in 2015 of approximately $10 million. For the Non-U.S. Pension Plans and the Nonqualified and Other Pension Plans, a 25 bp decline in discount rates would not have a significant impact on the net periodic benefit cost for 2014 and 2015.
Pre-taxPretax amounts included in accumulated OCI for employee benefit plans at December 31, 20132014 and 20122013 are presented in the table below.
| | | | | | | | | | | | | | | | | | | | | | | | | | | | | | | | | | | | | | | | | |
| Pre-tax Amounts included in Accumulated OCI | | | | | | | | | | | | | | | | | |
| Pretax Amounts included in Accumulated OCI | | Pretax Amounts included in Accumulated OCI | | | | | | | | | | | | | | | | |
| | | | | | | | | | | | | | | | | | | | | | | | | | | | | | | | | | | | | | | |
| | Qualified Pension Plan | | Non-U.S. Pension Plans | | Nonqualified and Other Pension Plans | | Postretirement Health and Life Plans | | Total | Qualified Pension Plan | | Non-U.S. Pension Plans | | Nonqualified and Other Pension Plans | | Postretirement Health and Life Plans | | Total |
| (Dollars in millions) | 2013 | | 2012 | | 2013 | | 2012 | | 2013 | | 2012 | | 2013 | | 2012 | | 2013 | | 2012 | 2014 | | 2013 | | 2014 | | 2013 | | 2014 | | 2013 | | 2014 | | 2013 | | 2014 | | 2013 |
| Net actuarial loss (gain) | $ | 2,794 |
| | $ | 6,164 |
| | $ | 271 |
| | $ | 144 |
| | $ | 855 |
| | $ | 718 |
| | $ | (171 | ) | | $ | (28 | ) | | $ | 3,749 |
| | $ | 6,998 |
| $ | 4,061 |
| | $ | 2,794 |
| | $ | 355 |
| | $ | 271 |
| | $ | 968 |
| | $ | 855 |
| | $ | (56 | ) | | $ | (171 | ) | | $ | 5,328 |
| | $ | 3,749 |
|
| Prior service cost (credits) | — |
| | — |
| | (9 | ) | | 5 |
| | — |
| | — |
| | 24 |
| | 29 |
| | 15 |
| | 34 |
| — |
| | — |
| | (9 | ) | | (9 | ) | | — |
| | — |
| | 20 |
| | 24 |
| | 11 |
| | 15 |
|
| Amounts recognized in accumulated OCI | $ | 2,794 |
| | $ | 6,164 |
| | $ | 262 |
| | $ | 149 |
| | $ | 855 |
| | $ | 718 |
| | $ | (147 | ) | | $ | 1 |
| | $ | 3,764 |
| | $ | 7,032 |
| $ | 4,061 |
| | $ | 2,794 |
| | $ | 346 |
| | $ | 262 |
| | $ | 968 |
| | $ | 855 |
| | $ | (36 | ) | | $ | (147 | ) | | $ | 5,339 |
| | $ | 3,764 |
|
Pre-taxPretax amounts recognized in OCI for employee benefit plans in 20132014 included the following components.
| | | | | | | | | | | | | | | | | | | | | |
| Pre-tax Amounts Recognized in OCI in 2013 | | | | | | | |
| Pretax Amounts Recognized in OCI in 2014 | | Pretax Amounts Recognized in OCI in 2014 | | | | | | |
| | | | | | | | | | | | | | | | | | | |
| (Dollars in millions) | Qualified Pension Plan | | Non-U.S. Pension Plans | | Nonqualified
and Other Pension Plans | | Postretirement
Health and Life Plans | | Total | Qualified Pension Plan | | Non-U.S. Pension Plans | | Nonqualified
and Other Pension Plans | | Postretirement
Health and Life Plans | | Total |
| Current year actuarial loss (gain) | $ | (3,128 | ) | | $ | 113 |
| | $ | 164 |
| | $ | (180 | ) | | $ | (3,031 | ) | |
| Current year actuarial loss | | $ | 1,378 |
| | $ | 87 |
| | $ | 138 |
| | $ | 26 |
| | $ | 1,629 |
|
| Amortization of actuarial gain (loss) | (242 | ) | | (2 | ) | | (27 | ) | | 36 |
| | (235 | ) | (111 | ) | | (3 | ) | | (25 | ) | | 89 |
| | (50 | ) |
| Current year prior service cost | — |
| | 2 |
| | — |
| | — |
| | 2 |
| — |
| | 1 |
| | — |
| | — |
| | 1 |
|
| Amortization of prior service cost | — |
| | — |
| | — |
| | (4 | ) | | (4 | ) | — |
| | (1 | ) | | — |
| | (4 | ) | | (5 | ) |
| Amounts recognized in OCI | $ | (3,370 | ) | | $ | 113 |
| | $ | 137 |
| | $ | (148 | ) | | $ | (3,268 | ) | $ | 1,267 |
| | $ | 84 |
| | $ | 113 |
| | $ | 111 |
| | $ | 1,575 |
|
The estimated pre-taxpretax amounts that will be amortized from accumulated OCI into expense in 20142015 are presented in the table below.
| | | | | | | | | | | | | | | | | | | | | |
| Estimated Pre-tax Amounts Amortized from Accumulated OCI into Period Cost in 2014 | |
| Estimated Pretax Amounts Amortized from Accumulated OCI into Period Cost in 2015 | | Estimated Pretax Amounts Amortized from Accumulated OCI into Period Cost in 2015 |
| | | | | | | | | | | | | | | | | | | |
| (Dollars in millions) | Qualified Pension Plan | | Non-U.S. Pension Plans | | Nonqualified
and Other Pension Plans | | Postretirement
Health and Life Plans | | Total | Qualified Pension Plan | | Non-U.S. Pension Plans | | Nonqualified
and Other Pension Plans | | Postretirement
Health and Life Plans | | Total |
| Net actuarial loss (gain) | $ | 108 |
| | $ | 3 |
| | $ | 25 |
| | $ | (85 | ) | | $ | 51 |
| $ | 166 |
| | $ | 6 |
| | $ | 34 |
| | $ | (34 | ) | | $ | 172 |
|
| Prior service cost | — |
| | 1 |
| | — |
| | 4 |
| | 5 |
| — |
| | 1 |
| | — |
| | 4 |
| | 5 |
|
| Total amounts amortized from accumulated OCI | $ | 108 |
| | $ | 4 |
| | $ | 25 |
| | $ | (81 | ) | | $ | 56 |
| $ | 166 |
| | $ | 7 |
| | $ | 34 |
| | $ | (30 | ) | | $ | 177 |
|
|
| | |
248233 Bank of America 20132014
| | |
Plan Assets
The Qualified Pension Plan has been established as a retirement vehicle for participants, and trusts have been established to secure benefits promised under the Qualified Pension Plan. The Corporation’s policy is to invest the trust assets in a prudent manner for the exclusive purpose of providing benefits to participants and defraying reasonable expenses of administration. The Corporation’s investment strategy is designed to provide a total return that, over the long term, increases the ratio of assets to liabilities. The strategy attempts to maximize the investment return on assets at a level of risk deemed appropriate by the Corporation while complying with ERISA and any applicable regulations and laws. The investment strategy utilizes asset allocation as a principal determinant for establishing the risk/return profile of the assets. Asset allocation ranges are established, periodically reviewed and adjusted as funding levels and liability characteristics change. Active and passive investment managers are employed to help enhance the risk/return profile of the assets. An additional aspect of the investment strategy used to minimize risk (part of the asset allocation plan) includes matching the equity exposure of participant-selected earnings measures. For example, the common stock of the Corporation held in the trust is maintained as an offset to the exposure related to participants who elected to receive an earnings measure based on the return performance of common stock of the Corporation. No plan assets are expected to be returned to the Corporation during 20142015.
The assets of the Non-U.S. Pension Plans are primarily attributable to a U.K. pension plan. This U.K. pension plan’s assets
are invested prudently so that the benefits promised to members are provided with consideration given to the nature and the duration of the plan’s liabilities. The current investment strategy was set following an asset-liability study and advice from the trustee’s investment advisors. The selected asset allocation strategy is designed to achieve a higher return than the lowest risk strategy while maintaining a prudent approach to meeting the plan’s liabilities.
The expected return on asset assumption was developed through analysis of historical market returns, historical asset class volatility and correlations, current market conditions, anticipated future asset allocations, the funds’ past experience, and expectations on potential future market returns. The expected return on assetassets assumption is determined using the calculated market-related value for the Qualified Pension Plan and the Other Pension Plan and the fair value for the Non-U.S. Pension Plans and Postretirement Health and Life Plans. The expected return on assetassets assumption represents a long-term average view of the performance of the assets in the Qualified Pension Plan, the Non-U.S. Pension Plans, the Other Pension Plan, and Postretirement Health and Life Plans, a return that may or may not be achieved during any one calendar year. The terminated Other U.S. Pension Plan is invested solely in an annuity contract which is primarily invested in fixed-income securities structured such that asset maturities match the duration of the plan’s obligations.
The target allocations for 20142015 by asset category for the Qualified Pension Plan, Non-U.S. Pension Plans, Nonqualified and Other Pension Plans, and Postretirement Health and Life Plans are presented in the table below.
|
| | | | |
| | | | | |
20142015 Target Allocation |
| | | | | |
| | Percentage |
| Asset Category | Qualified Pension Plan | Non-U.S. Pension Plans | Nonqualified and Other Pension Plans | Postretirement Health and Life Plans |
| Equity securities | 30 - 60 | 10 - 35 | 0 - 5 | 200 - 5020 |
| Debt securities | 40 - 70 | 40 - 80 | 95 - 100 | 5070 - 80100 |
| Real estate | 0 - 10 | 0 - 15 | 0 - 5 | 0 - 5 |
| Other | 0 - 5 | 0 - 15 | 0 - 5 | 0 - 5 |
Equity securities for the Qualified Pension Plan include common stock of the Corporation in the amounts of $215 million (1.15 percent of total plan assets) and $200 million (1.10 percent of total plan assets) and $156 million (0.96 percent of total plan assets) at December 31, 20132014 and 20122013.
|
| | |
| | | Bank of America 20132014 249234 |
Fair Value Measurements
For information on fair value measurements, including descriptions of Level 1, 2 and 3 of the fair value hierarchy and the valuation methods employed by the Corporation, see Note 1 – Summary of Significant Accounting Principles and Note 20 – Fair Value Measurements.
Combined plan investment assets measured at fair value by level and in total at December 31, 20132014 and 20122013 are summarized in the Fair Value Measurements table.
| | | | | | | | | | | | | | | | | |
| Fair Value Measurements | | | | | | | | | | | | | | |
| | | | | | | | | | | | | | | |
| | December 31, 2013 | December 31, 2014 |
| (Dollars in millions) | Level 1 | | Level 2 | | Level 3 | | Total | Level 1 | | Level 2 | | Level 3 | | Total |
| Cash and short-term investments | |
| | |
| | |
| | |
| |
| | |
| | |
| | |
|
| Money market and interest-bearing cash | $ | 2,586 |
| | $ | — |
| | $ | — |
| | $ | 2,586 |
| $ | 3,814 |
| | $ | — |
| | $ | — |
| | $ | 3,814 |
|
| Cash and cash equivalent commingled/mutual funds | — |
| | 223 |
| | — |
| | 223 |
| — |
| | 4 |
| | — |
| | 4 |
|
| Fixed income | |
| | |
| | |
| | |
| |
| | |
| | |
| | |
|
| U.S. government and government agency securities | 1,590 |
| | 2,245 |
| | 12 |
| | 3,847 |
| 2,004 |
| | 2,151 |
| | 11 |
| | 4,166 |
|
| Corporate debt securities | — |
| | 1,233 |
| | — |
| | 1,233 |
| — |
| | 1,454 |
| | — |
| | 1,454 |
|
| Asset-backed securities | — |
| | 1,455 |
| | — |
| | 1,455 |
| — |
| | 1,930 |
| | — |
| | 1,930 |
|
| Non-U.S. debt securities | 547 |
| | 502 |
| | 6 |
| | 1,055 |
| 627 |
| | 487 |
| | — |
| | 1,114 |
|
| Fixed income commingled/mutual funds | 89 |
| | 1,279 |
| | — |
| | 1,368 |
| 101 |
| | 1,397 |
| | — |
| | 1,498 |
|
| Equity | |
| | |
| | |
| | |
| |
| | |
| | |
| | |
|
| Common and preferred equity securities | 7,463 |
| | — |
| | — |
| | 7,463 |
| 6,628 |
| | — |
| | — |
| | 6,628 |
|
| Equity commingled/mutual funds | 213 |
| | 2,308 |
| | — |
| | 2,521 |
| 16 |
| | 1,817 |
| | — |
| | 1,833 |
|
| Public real estate investment trusts | 127 |
| | — |
| | — |
| | 127 |
| 124 |
| | — |
| | — |
| | 124 |
|
| Real estate | |
| | |
| | |
| | |
| |
| | |
| | |
| | |
|
| Private real estate | — |
| | — |
| | 119 |
| | 119 |
| — |
| | — |
| | 127 |
| | 127 |
|
| Real estate commingled/mutual funds | — |
| | 7 |
| | 462 |
| | 469 |
| — |
| | 4 |
| | 632 |
| | 636 |
|
| Limited partnerships | — |
| | 117 |
| | 145 |
| | 262 |
| — |
| | 122 |
| | 65 |
| | 187 |
|
Other investments (1) | — |
| | 662 |
| | 135 |
| | 797 |
| 1 |
| | 490 |
| | 127 |
| | 618 |
|
| Total plan investment assets, at fair value | $ | 12,615 |
| | $ | 10,031 |
| | $ | 879 |
| | $ | 23,525 |
| $ | 13,315 |
| | $ | 9,856 |
| | $ | 962 |
| | $ | 24,133 |
|
| | | | | | | | | | | | | | | |
| | December 31, 2012 | December 31, 2013 |
| Cash and short-term investments | |
| | |
| | |
| | |
| |
| | |
| | |
| | |
|
| Money market and interest-bearing cash | $ | 1,404 |
| | $ | — |
| | $ | — |
| | $ | 1,404 |
| $ | 2,586 |
| | $ | — |
| | $ | — |
| | $ | 2,586 |
|
| Cash and cash equivalent commingled/mutual funds | — |
| | 96 |
| | — |
| | 96 |
| — |
| | 223 |
| | — |
| | 223 |
|
| Fixed income | |
| | |
| | |
| | |
| |
| | |
| | |
| | |
|
| U.S. government and government agency securities | 1,317 |
| | 2,829 |
| | 13 |
| | 4,159 |
| 1,590 |
| | 2,245 |
| | 12 |
| | 3,847 |
|
| Corporate debt securities | — |
| | 1,062 |
| | — |
| | 1,062 |
| — |
| | 1,233 |
| | — |
| | 1,233 |
|
| Asset-backed securities | — |
| | 1,109 |
| | — |
| | 1,109 |
| — |
| | 1,455 |
| | — |
| | 1,455 |
|
| Non-U.S. debt securities | 70 |
| | 535 |
| | 10 |
| | 615 |
| 547 |
| | 502 |
| | 6 |
| | 1,055 |
|
| Fixed income commingled/mutual funds | 99 |
| | 1,432 |
| | — |
| | 1,531 |
| 89 |
| | 1,279 |
| | — |
| | 1,368 |
|
| Equity | |
| | |
| | |
| | |
| |
| | |
| | |
| | |
|
| Common and preferred equity securities | 7,432 |
| | — |
| | — |
| | 7,432 |
| 7,463 |
| | — |
| | — |
| | 7,463 |
|
| Equity commingled/mutual funds | 290 |
| | 2,316 |
| | — |
| | 2,606 |
| 213 |
| | 2,308 |
| | — |
| | 2,521 |
|
| Public real estate investment trusts | 236 |
| | — |
| | — |
| | 236 |
| 127 |
| | — |
| | — |
| | 127 |
|
| Real estate | |
| | |
| | |
| | |
| |
| | |
| | |
| | |
|
| Private real estate | — |
| | — |
| | 110 |
| | 110 |
| — |
| | — |
| | 119 |
| | 119 |
|
| Real estate commingled/mutual funds | — |
| | 10 |
| | 324 |
| | 334 |
| — |
| | 7 |
| | 462 |
| | 469 |
|
| Limited partnerships | — |
| | 110 |
| | 231 |
| | 341 |
| — |
| | 117 |
| | 145 |
| | 262 |
|
Other investments (1) | 22 |
| | 543 |
| | 129 |
| | 694 |
| — |
| | 662 |
| | 135 |
| | 797 |
|
| Total plan investment assets, at fair value | $ | 10,870 |
| | $ | 10,042 |
| | $ | 817 |
| | $ | 21,729 |
| $ | 12,615 |
| | $ | 10,031 |
| | $ | 879 |
| | $ | 23,525 |
|
| |
(1) | Other investments include interest rate swaps of $435297 million and $311435 million, participant loans of $8778 million and $7687 million, commodity and balanced funds of $229178 million and $239229 million and other various investments of $4665 million and $6846 million at December 31, 20132014 and 20122013. |
|
| | |
250235 Bank of America 20132014
| | |
The Level 3 Fair Value Measurements table presents a reconciliation of all plan investment assets measured at fair value using significant unobservable inputs (Level 3) during 20132014, 20122013 and 20112012.
| | | | | | | | | | | | | | | | | | | | | | | | | |
| Level 3 Fair Value Measurements | Level 3 Fair Value Measurements | | | | | | | Level 3 Fair Value Measurements | | | | | | |
| | | | | | | | | | | | | | | | | | | | | | | |
| | 2013 | 2014 |
| (Dollars in millions) | Balance January 1 | | Actual Return on
Plan Assets Still
Held at the Reporting Date | | Purchases | | Sales and Settlements | | Transfers into/ (out of) Level 3 | | Balance December 31 | Balance January 1 | | Actual Return on
Plan Assets Still
Held at the Reporting Date | | Purchases | | Sales and Settlements | | Transfers into/ (out of) Level 3 | | Balance December 31 |
| Fixed income | |
| | |
| | |
| | | | |
| | |
| |
| | |
| | |
| | | | |
| | |
|
| U.S. government and government agency securities | $ | 13 |
| | $ | — |
| | $ | — |
| | $ | (1 | ) | | $ | — |
| | $ | 12 |
| $ | 12 |
| | $ | — |
| | $ | — |
| | $ | (1 | ) | | $ | — |
| | $ | 11 |
|
| Non-U.S. debt securities | 10 |
| | (2 | ) | | — |
| | (2 | ) | | — |
| | 6 |
| 6 |
| | — |
| | — |
| | (2 | ) | | (4 | ) | | — |
|
| Real estate | |
| | |
| | | | |
| | |
| | |
| |
| | |
| | | | |
| | |
| | |
|
| Private real estate | 110 |
| | 4 |
| | 7 |
| | (2 | ) | | — |
| | 119 |
| 119 |
| | 5 |
| | 5 |
| | (2 | ) | | — |
| | 127 |
|
| Real estate commingled/mutual funds | 324 |
| | 15 |
| | 123 |
| | — |
| | — |
| | 462 |
| 462 |
| | 20 |
| | 150 |
| | — |
| | — |
| | 632 |
|
| Limited partnerships | 231 |
| | 8 |
| | 23 |
| | (89 | ) | | (28 | ) | | 145 |
| 145 |
| | 5 |
| | 3 |
| | (88 | ) | | — |
| | 65 |
|
| Other investments | 129 |
| | (6 | ) | | 13 |
| | (1 | ) | | — |
| | 135 |
| 135 |
| | 1 |
| | 1 |
| | (10 | ) | | — |
| | 127 |
|
| Total | $ | 817 |
| | $ | 19 |
| | $ | 166 |
| | $ | (95 | ) | | $ | (28 | ) | | $ | 879 |
| $ | 879 |
| | $ | 31 |
| | $ | 159 |
| | $ | (103 | ) | | $ | (4 | ) | | $ | 962 |
|
| | | | | | | | | | | | | | | | | | | | | | | |
| | 2012 | 2013 |
| Fixed income | |
| | |
| | |
| | | | |
| | |
| |
| | |
| | |
| | | | |
| | |
|
| U.S. government and government agency securities | $ | 13 |
| | $ | — |
| | $ | — |
| | $ | — |
| | $ | — |
| | $ | 13 |
| $ | 13 |
| | $ | — |
| | $ | — |
| | $ | (1 | ) | | $ | — |
| | $ | 12 |
|
| Non-U.S. debt securities | 10 |
| | (1 | ) | | 1 |
| | (1 | ) | | 1 |
| | 10 |
| 10 |
| | (2 | ) | | — |
| | (2 | ) | | — |
| | 6 |
|
| Real estate | |
| | |
| | | | |
| | |
| | |
| |
| | |
| | | | |
| | |
| | |
|
| Private real estate | 113 |
| | (2 | ) | | 2 |
| | (3 | ) | | — |
| | 110 |
| 110 |
| | 4 |
| | 7 |
| | (2 | ) | | — |
| | 119 |
|
| Real estate commingled/mutual funds | 249 |
| | 13 |
| | 62 |
| | — |
| | — |
| | 324 |
| 324 |
| | 15 |
| | 123 |
| | — |
| | — |
| | 462 |
|
| Limited partnerships | 232 |
| | 8 |
| | 11 |
| | (20 | ) | | — |
| | 231 |
| 231 |
| | 8 |
| | 23 |
| | (89 | ) | | (28 | ) | | 145 |
|
| Other investments | 122 |
| | 7 |
| | 4 |
| | (4 | ) | | — |
| | 129 |
| 129 |
| | (6 | ) | | 13 |
| | (1 | ) | | — |
| | 135 |
|
| Total | $ | 739 |
| | $ | 25 |
| | $ | 80 |
| | $ | (28 | ) | | $ | 1 |
| | $ | 817 |
| $ | 817 |
| | $ | 19 |
| | $ | 166 |
| | $ | (95 | ) | | $ | (28 | ) | | $ | 879 |
|
| | | | | | | | | | | | | | | | | | | | | | | |
| | 2011 | 2012 |
| Fixed income | | | | | | | | | | | | | | | | | | | | | | |
| U.S. government and government agency securities | $ | 14 |
| | $ | (1 | ) | | $ | — |
| | $ | — |
| | $ | — |
| | $ | 13 |
| $ | 13 |
| | $ | — |
| | $ | — |
| | $ | — |
| | $ | — |
| | $ | 13 |
|
| Non-U.S. debt securities | 9 |
| | — |
| | 3 |
| | (2 | ) | | — |
| | 10 |
| 10 |
| | (1 | ) | | 1 |
| | (1 | ) | | 1 |
| | 10 |
|
| Real estate | | | | | | | | | | | |
| | | | | | | | | | | |
|
| Private real estate | 110 |
| | — |
| | 3 |
| | — |
| | — |
| | 113 |
| 113 |
| | (2 | ) | | 2 |
| | (3 | ) | | — |
| | 110 |
|
| Real estate commingled/mutual funds | 215 |
| | 26 |
| | 9 |
| | (1 | ) | | — |
| | 249 |
| 249 |
| | 13 |
| | 62 |
| | — |
| | — |
| | 324 |
|
| Limited partnerships | 230 |
| | (6 | ) | | 13 |
| | (5 | ) | | — |
| | 232 |
| 232 |
| | 8 |
| | 11 |
| | (20 | ) | | — |
| | 231 |
|
| Other investments | 94 |
| | 1 |
| | 26 |
| | — |
| | 1 |
| | 122 |
| 122 |
| | 7 |
| | 4 |
| | (4 | ) | | — |
| | 129 |
|
| Total | $ | 672 |
| | $ | 20 |
| | $ | 54 |
| | $ | (8 | ) | | $ | 1 |
| | $ | 739 |
| $ | 739 |
| | $ | 25 |
| | $ | 80 |
| | $ | (28 | ) | | $ | 1 |
| | $ | 817 |
|
Projected Benefit Payments
Benefit payments projected to be made from the Qualified Pension Plan, Non-U.S. Pension Plans, Nonqualified and Other Pension Plans, and Postretirement Health and Life Plans are presented in the table below.
| | | | | | | | | | | | | | | | | | | | | |
| Projected Benefit Payments | Projected Benefit Payments | | | | | Projected Benefit Payments | | | | |
| | | | | | | | | | | | | | | | | | | |
| | | | | | | | Postretirement Health and Life Plans | | | | | | | Postretirement Health and Life Plans |
| (Dollars in millions) | Qualified Pension Plan (1) | | Non-U.S. Pension Plans (2) | | Nonqualified and Other Pension Plans (2) | | Net Payments (3) | | Medicare Subsidy | Qualified Pension Plan (1) | | Non-U.S. Pension Plans (2) | | Nonqualified and Other Pension Plans (2) | | Net Payments (3) | | Medicare Subsidy |
| 2014 | $ | 927 |
| | $ | 60 |
| | $ | 243 |
| | $ | 142 |
| | $ | 17 |
| |
| 2015 | 920 |
| | 61 |
| | 245 |
| | 140 |
| | 17 |
| $ | 921 |
| | $ | 55 |
| | $ | 244 |
| | $ | 130 |
| | $ | 14 |
|
| 2016 | 910 |
| | 64 |
| | 242 |
| | 137 |
| | 17 |
| 908 |
| | 58 |
| | 241 |
| | 126 |
| | 14 |
|
| 2017 | 903 |
| | 69 |
| | 239 |
| | 132 |
| | 17 |
| 900 |
| | 62 |
| | 242 |
| | 122 |
| | 14 |
|
| 2018 | 894 |
| | 71 |
| | 235 |
| | 127 |
| | 17 |
| 899 |
| | 65 |
| | 239 |
| | 117 |
| | 13 |
|
| 2019 – 2023 | 4,399 |
| | 428 |
| | 1,132 |
| | 558 |
| | 76 |
| |
| 2019 | | 895 |
| | 72 |
| | 236 |
| | 111 |
| | 13 |
|
| 2020 – 2024 | | 4,407 |
| | 449 |
| | 1,136 |
| | 495 |
| | 58 |
|
| |
(1) | Benefit payments expected to be made from the plan’s assets. |
| |
(2) | Benefit payments expected to be made from a combination of the plans’ and the Corporation’s assets. |
| |
(3) | Benefit payments (net of retiree contributions) expected to be made from a combination of the plans’ and the Corporation’s assets. |
|
| | |
| | | Bank of America 20132014 251236 |
Defined Contribution Plans
The Corporation maintains qualified defined contribution retirement plans and nonqualified defined contribution retirement plans. As a result of the Merrill Lynch acquisition, the Corporation also maintains the Merrill Lynch 401(k) Savings & Investment Plan, which is closed to new participants, with certain exceptions. The Corporation contributed $1.11.0 billion, $886 million1.1 billion and $723886 million in 20132014, 20122013 and 20112012, respectively, to the qualified defined contribution plans. In connection with the 2012 redesign of the Corporation’s retirement plans, an additional contribution is being made annually to certain of these plans. The expense in 2013 and 2012 related to the additional annual contribution was $410 million and $174 million. At December 31, 20132014 and 20122013, 238 million and 235 million shares of the Corporation’s common stock were held by these plans. Payments to the plans for dividends on common stock were $1029 million, $10 million and $910 million in 20132014, 20122013 and 20112012, respectively.
Certain non-U.S. employees are covered under defined contribution pension plans that are separately administered in accordance with local laws.
NOTE 18 Stock-based Compensation Plans
The Corporation administers a number of equity compensation plans, includingwith awards being granted predominantly from the Corporation’s Key Associate Stock Plan. Under the Key Associate Stock Plan, and the Merrill Lynch Employee Stock Compensation Plan. Descriptions of the significant features of the equity compensation plans are below. Under these plans, the Corporation grants stock-based awards, including stock options, restricted stock and restricted stock units (RSUs). Grants in 20132014 includeincluded RSUs which generally vest in three equal annual installments beginning one year from the grant date, and awards which will vest subject to the attainment of specified performance goals.
For most awards, expense is generally recognized ratably over the vesting period net of estimated forfeitures, unless the employee meets certain retirement eligibility criteria. For awards to employees that meet retirement eligibility criteria, the Corporation records the expense upon grant. For employees that become retirement eligible during the vesting period, the Corporation recognizes expense from the grant date to the date on which the employee becomes retirement eligible, net of estimated forfeitures. The compensation cost for the stock-based plans was $2.32.30 billion, $2.28 billion and $2.27 billion in $2.3 billion2014, 2013 and $2.6 billion in 2013, 2012 and 2011, respectively. The related income tax benefit was $842854 million, $839842 million and $969839 million for 20132014, 20122013 and 20112012, respectively.
Key Associate Stock Plan
The Key Associate Stock Plan became effective January 1, 2003. It provides for different types of awards, including stock options, restricted stock and RSUs. As of December 31, 20132014, the shareholders had authorized approximately 1.1 billion shares for grant under this plan. Additionally, any shares covered by awards under certain legacy plans that cancel, terminate, expire, lapse or settle in cash after a specified date may be re-granted under the Key Associate Stock Plan.
During 20132014, the Corporation issued 183133 million RSUs to certain employees under the Key Associate Stock Plan. Certain awards are earned based on the achievement of specified
performance criteria. RSUs may be settled in cash or in shares of
common stock depending on the terms of the applicable award. In 20132014, two million of these RSUs were authorized to be settled in shares of common stock with the remainder in cash. Certain awards contain clawback provisions which permit the Corporation to cancel all or a portion of the award under specified circumstances. The compensation cost for cash-settled awards and awards subject to certain clawback provisions, which in the aggregate representrepresented substantially all of the awards in 20132014, is accrued over the vesting period and adjusted to fair value based upon changes in the share price of the Corporation’s common stock.
From time to time, the Corporation enters into equity total return swaps to hedge a portion of RSUs granted to certain employees as part of their compensation in prior periods to minimize the change in the expense to the Corporation driven by fluctuations in the fair value of the RSUs. Certain of these derivatives are designated as cash flow hedges of unrecognized unvested awards with the changes in fair value of the hedge recorded in accumulated OCI and reclassified into earnings in the same period as the RSUs affect earnings. The remaining derivatives are used to hedge the price risk of cash-settled awards with changes in fair value recorded in personnel expense.
At For information on amounts recognized on equity total return swaps used to hedge the Corporation’s outstanding RSUs, see December 31, 2013, approximately 108 million options were outstanding under this plan. There were no options granted under this plan during 2013, 2012 or 2011.Note 2 – Derivatives.
Other Stock Plans
The Corporation assumed the Merrill Lynch Employee Stock Compensation Planobligations of certain stock compensation plans with the acquisition of Merrill Lynch. Approximately eight million RSUsThese plans are no longer active and no awards were granted in 20112014 which generally vest in three equal annual installments beginning one year from the grant date. There were no shares granted under this plan during, 2013 or 2012. At December 31, 20132014, there were approximately twofive million unvested shares outstanding. The Corporation also assumed, with the acquisition of Merrill Lynch, the obligations ofRSUs remained outstanding awards granted under the Merrill Lynch Financial Advisor Capital Accumulation Award Plan (FACAAP). The FACAAP is no longer an active plan and noPlan. These awards were granted in 2013, 2012 or 2011. Awards still outstanding which were granted in 2003 and thereafter and are generally payable eight years from the grant date in a fixed number of the Corporation’s common shares. At December 31, 2013, there were seven million shares outstanding under this plan.
Restricted Stock/Units
The table below presents the status at December 31, 20132014 of the share-settled restricted stock/units and changes during 20132014.
| | | | | | | | | |
Stock-settled Restricted Stock/Units | | | | | | | | |
| | Shares/Units | | Weighted- average Grant Date Fair Value | Shares/Units | | Weighted- average Grant Date Fair Value |
| Outstanding at January 1, 2013 | 147,570,397 |
| | $ | 13.18 |
| |
| Outstanding at January 1, 2014 | | 71,202,751 |
| | $ | 12.05 |
|
| Granted | 2,405,568 |
| | 11.80 |
| 2,064,195 |
| | 16.63 |
|
| Vested | (75,422,919 | ) | | 14.24 |
| (42,209,408 | ) | | 14.27 |
|
| Canceled | (3,350,295 | ) | | 12.22 |
| (1,174,769 | ) | | 10.45 |
|
| Outstanding at December 31, 2013 | 71,202,751 |
| | $ | 12.05 |
| |
| Outstanding at December 31, 2014 | | 29,882,769 |
| | $ | 9.30 |
|
|
| | |
252237 Bank of America 20132014
| | |
The table below presents the status at December 31, 20132014 of the cash-settled RSUs granted under the Key Associate Stock Plan and changes during 20132014.
|
| | |
| | |
| Cash-settled Restricted Units | |
| | |
| | Units |
Outstanding at January 1, 20132014 | 329,556,468359,928,869 |
|
| Granted | 181,166,560130,956,173 |
|
| Vested | (137,125,114162,061,256 | ) |
| Canceled | (13,669,04511,867,351 | ) |
Outstanding at December 31, 20132014 | 359,928,869316,956,435 |
|
At December 31, 20132014, there was an estimated $1.91.5 billion of total unrecognized compensation cost related to certain share-based compensation awards that is expected to be recognized over a period of up to four years, with a weighted-average period of 1.31.6 years. The total fair value of restricted stock vested in 20132014, 20122013 and 20112012 was $1.0 billion576 million, $2.91.0 billion and $1.72.9 billion, respectively. In 20132014, 20122013 and 20112012, the amount of cash paid to settle equity-based awards for all equity compensation plans was $1.41.7 billion, $779 million1.4 billion and $489779 million, respectively.
Stock Options
The table below presents the status of all option plans at December 31, 20132014 and changes during 20132014.
|
| | | | | | |
| | | | |
| Stock Options |
| | | | |
| | Options | | Weighted- average Exercise Price |
| Outstanding at January 1, 2014 | 122,168,691 |
| | $ | 48.23 |
|
| Forfeited | (34,081,637 | ) | | 46.32 |
|
| Outstanding at December 31, 2014 | 88,087,054 |
| | 48.96 |
|
| Options vested and exercisable at December 31, 2014 | 88,087,054 |
| | 48.96 |
|
Outstanding options at December 31, 20132014 includeincluded 10879 million options under the Key Associate Stock Plan and 14nine million options to employees of predecessor company plans assumed in mergers.
|
| | | | | | |
| | | | |
| Stock Options |
| | | | |
| | Options | | Weighted- average Exercise Price |
| Outstanding at January 1, 2013 | 154,923,623 |
| | $ | 46.22 |
|
| Forfeited | (32,754,932 | ) | | 38.73 |
|
| Outstanding at December 31, 2013 | 122,168,691 |
| | 48.23 |
|
| Options vested and exercisable at December 31, 2013 | 122,168,691 |
| | 48.23 |
|
At All options outstanding as of December 31, 20132014, there was were vested and exercisable with a weighted-average remaining contractual term of 1.6 years and have no aggregate intrinsic value ofvalue. No options outstanding, vested and exercisable. The weighted-average remaining contractual term of options outstanding, vested and exercisable was 1.9 years at December 31, 2013. These remaining contractual terms are the same because options have not been granted since 2008 and they generally vest over three years.2008.
NOTE 19 Income Taxes
The components of income tax expense (benefit) for 20132014, 20122013 and 20112012 are presented in the table below.
| | | | | | | | | | | | | |
| Income Tax Expense (Benefit) | Income Tax Expense (Benefit) | | | | | Income Tax Expense (Benefit) | | | | |
| | | | | | | | | | | |
| (Dollars in millions) | 2013 | | 2012 | | 2011 | 2014 | | 2013 | | 2012 |
| Current income tax expense (benefit) | |
| | |
| | |
| |
| Current income tax expense | | |
| | |
| | |
|
| U.S. federal | $ | 180 |
| | $ | 458 |
| | $ | (733 | ) | $ | 443 |
| | $ | 180 |
| | $ | 458 |
|
| U.S. state and local | 786 |
| | 592 |
| | 393 |
| 340 |
| | 786 |
| | 592 |
|
| Non-U.S. | 513 |
| | 569 |
| | 613 |
| 513 |
| | 513 |
| | 569 |
|
| Total current expense | 1,479 |
| | 1,619 |
| | 273 |
| 1,296 |
| | 1,479 |
| | 1,619 |
|
| Deferred income tax expense (benefit) | |
| | |
| | |
| |
| | |
| | |
|
| U.S. federal | 2,056 |
| | (3,433 | ) | | (2,673 | ) | 583 |
| | 2,056 |
| | (3,433 | ) |
| U.S. state and local | (94 | ) | | (55 | ) | | (584 | ) | 85 |
| | (94 | ) | | (55 | ) |
| Non-U.S. | 1,300 |
| | 753 |
| | 1,308 |
| 58 |
| | 1,300 |
| | 753 |
|
| Total deferred expense (benefit) | 3,262 |
| | (2,735 | ) | | (1,949 | ) | 726 |
| | 3,262 |
| | (2,735 | ) |
| Total income tax expense (benefit) | $ | 4,741 |
| | $ | (1,116 | ) | | $ | (1,676 | ) | $ | 2,022 |
| | $ | 4,741 |
| | $ | (1,116 | ) |
Total income tax expense (benefit) does not reflect the deferred tax effects of unrealized gains and losses on AFS debt and marketable equity securities, foreign currency translation adjustments, derivatives and employee benefit plan adjustments that are included in accumulated OCI. These tax effects resulted in a benefitan expense of $2.7 billion and $2.93.4 billion in 20132014 and2011, respectively, and an expense of $1.3 billion in 2012, and a benefit of $2.7 billion in 2013, recorded in accumulated OCI. In addition, total income tax expense (benefit) does not reflect tax effects associated with the Corporation’s employee stock plans which decreased common stock and additional paid-in capital $35 million, $128 million and $277 million in $277 million2014 in, 2013 and 2012, and increased common stock and additional paid-in capital $19 million in 2011.respectively.
|
| | |
| | | Bank of America 20132014 253238 |
Income tax expense (benefit) for 20132014, 20122013 and 20112012 varied from the amount computed by applying the statutory income tax rate to income (loss) before income taxes. A reconciliation of the expected U.S. federal income tax expense, is calculated by applying the federal statutory tax rate of 35 percent, to the Corporation’s actual income tax expense (benefit), and the effective tax rates for 20132014, 20122013 and 20112012 are presented in the table below.
| | | | | | | | | | | | | | | | | | | | | | | | | |
| Reconciliation of Income Tax Expense (Benefit) | Reconciliation of Income Tax Expense (Benefit) | | | | | | | | | | | Reconciliation of Income Tax Expense (Benefit) | | | | | | | | | | |
| | | | | | | | | | | | | | | | | | | | | | | |
| | 2013 | | 2012 | | 2011 | 2014 | | 2013 | | 2012 |
| (Dollars in millions) | Amount |
| Percent |
| Amount |
| Percent |
| Amount |
| Percent | Amount |
| Percent |
| Amount |
| Percent |
| Amount |
| Percent |
| Expected U.S. federal income tax expense (benefit) | $ | 5,660 |
| | 35.0 | % | | $ | 1,075 |
| | 35.0 | % | | $ | (81 | ) | | 35.0 | % | |
| Expected U.S. federal income tax expense | | $ | 2,399 |
| | 35.0 | % | | $ | 5,660 |
| | 35.0 | % | | $ | 1,075 |
| | 35.0 | % |
| Increase (decrease) in taxes resulting from: | |
| | (0.001 | )% | | |
| | (0.001 | )% | | |
| | (0.001 | )% | |
| | (0.001 | )% | | |
| | (0.001 | )% | | |
| | (0.001 | )% |
| State tax expense (benefit), net of federal effect | 450 |
| | 2.8 |
| | 349 |
| | 11.4 |
| | (124 | ) | |
|
| |
Non-U.S. tax differential (1) | (940 | ) | | (5.8 | ) | | (1,968 | ) | | (64.1 | ) | | (383 | ) | |
|
| |
| State tax expense, net of federal benefit | | 276 |
| | 4.0 |
| | 450 |
| | 2.8 |
| | 349 |
| | 11.4 |
|
| Affordable housing credits/other credits | (863 | ) | | (5.3 | ) | | (783 | ) | | (25.5 | ) | | (800 | ) | |
|
| (950 | ) | | (13.8 | ) | | (863 | ) | | (5.3 | ) | | (783 | ) | | (25.5 | ) |
| Changes in prior period UTBs, including interest | | (741 | ) | | (10.8 | ) | | (255 | ) | | (1.6 | ) | | (198 | ) | | (6.4 | ) |
| Tax-exempt income, including dividends | (524 | ) | | (3.2 | ) | | (576 | ) | | (18.8 | ) | | (614 | ) | |
|
| (533 | ) | | (7.8 | ) | | (524 | ) | | (3.2 | ) | | (576 | ) | | (18.8 | ) |
| Changes in prior period UTBs, including interest | (255 | ) | | (1.6 | ) | | (198 | ) | | (6.4 | ) | | (239 | ) | |
|
| |
Non-U.S. tax rate differential (1) | | (507 | ) | | (7.4 | ) | | (940 | ) | | (5.8 | ) | | (1,968 | ) | | (64.1 | ) |
| Nondeductible expenses | | 1,982 |
| | 28.9 |
| | 104 |
| | 0.6 |
| | 231 |
| | 7.5 |
|
| Leveraged lease tax differential | | 53 |
| | 0.8 |
| | 26 |
| | 0.2 |
| | 83 |
| | 2.7 |
|
| Non-U.S. statutory rate reductions | 1,133 |
| | 7.0 |
| | 788 |
| | 25.7 |
| | 860 |
| |
|
| — |
| | — |
| | 1,133 |
| | 7.0 |
| | 788 |
| | 25.7 |
|
| Nondeductible expenses | 52 |
| | 0.3 |
| | 231 |
| | 7.5 |
| | 119 |
| |
|
| |
| Goodwill – impairment and other goodwill impacts | 52 |
| | 0.3 |
| | — |
| | — |
| | 1,420 |
| |
|
| |
| Change in federal and non-U.S. valuation allowances | 26 |
| | 0.2 |
| | 41 |
| | 1.3 |
| | (1,102 | ) | |
|
| |
| Leveraged lease tax differential | 26 |
| | 0.2 |
| | 83 |
| | 2.7 |
| | 121 |
| |
|
| |
| Subsidiary sales and liquidations | — |
| | — |
| | — |
| | — |
| | (823 | ) | |
|
| |
| Other | (76 | ) | | (0.6 | ) | | (158 | ) | | (5.1 | ) | | (30 | ) | |
|
| 43 |
| | 0.6 |
| | (50 | ) | | (0.4 | ) | | (117 | ) | | (3.8 | ) |
| Total income tax expense (benefit) | $ | 4,741 |
| | 29.3 | % | | $ | (1,116 | ) | | (36.3 | )% | | $ | (1,676 | ) | | n/m |
| $ | 2,022 |
| | 29.5 | % | | $ | 4,741 |
| | 29.3 | % | | $ | (1,116 | ) | | (36.3 | )% |
| |
(1) | Includes in 2012, a $1.7 billion income tax benefit attributable to the excess of foreign tax credits recognized in the U.S. upon repatriation of the earnings of certain non-U.S. subsidiaries over the related U.S. tax liability. |
n/m = not meaningful
The reconciliation of the beginning unrecognized tax benefits (UTB) balance to the ending balance is presented in the table below.
| | | | | | | | | | | | | |
Reconciliation of the Change in Unrecognized Tax Benefits | | | | | | | | | | | | |
| (Dollars in millions) | 2013 | | 2012 | | 2011 | 2014 | | 2013 | | 2012 |
| Balance, January 1 | $ | 3,677 |
| | $ | 4,203 |
| | $ | 5,169 |
| $ | 3,068 |
| | $ | 3,677 |
| | $ | 4,203 |
|
| Increases related to positions taken during the current year | 98 |
| | 352 |
| | 219 |
| 75 |
| | 98 |
| | 352 |
|
Increases related to positions taken during prior years (1) | 254 |
| | 142 |
| | 879 |
| 519 |
| | 254 |
| | 142 |
|
Decreases related to positions taken during prior years (1) | (508 | ) | | (711 | ) | | (1,669 | ) | (973 | ) | | (508 | ) | | (711 | ) |
| Settlements | (448 | ) | | (205 | ) | | (277 | ) | (1,594 | ) | | (448 | ) | | (205 | ) |
| Expiration of statute of limitations | (5 | ) | | (104 | ) | | (118 | ) | (27 | ) | | (5 | ) | | (104 | ) |
| Balance, December 31 | $ | 3,068 |
| | $ | 3,677 |
| | $ | 4,203 |
| $ | 1,068 |
| | $ | 3,068 |
| | $ | 3,677 |
|
| |
(1) | The sum per year of positions taken during prior years differs from the $255741 million, $198255 million and $239198 million in the Reconciliation of Income Tax Expense (Benefit) table due to temporary items, state items and jurisdictional offsets, as well as the inclusion of interest in the Reconciliation of Income Tax Expense (Benefit) table. |
At December 31, 2014, 2013 2012 and 2011,2012, the balance of the Corporation’s UTBs which would, if recognized, affect the Corporation’s effective tax rate was $2.50.7 billion, $3.12.5 billion and $3.33.1 billion, respectively. Included in the UTB balance are some items the recognition of which would not affect the effective tax rate, such as the tax effect of certain temporary differences, the portion of gross state UTBs that would be offset by the tax benefit of the associated federal deduction and the portion of gross non-U.S. UTBs that would be offset by tax reductions in other jurisdictions.
The Corporation files income tax returns in more than 100 state and non-U.S. jurisdictions each year. The IRS and other tax authorities in countries and states in which the Corporation has significant business operations examine tax returns periodically (continuously in some jurisdictions). The Tax Examination Status table summarizes the status of significant examinations (U.S. federal unless otherwise noted) for the Corporation and various subsidiaries as of December 31, 20132014.
|
| | | |
| | | | |
| Tax Examination Status | | | |
| | | | |
| | Years under Examination | | Status at December 31 20132014 |
Bank of America Corporation – U.S. | 2005 – 2009 | | See below |
Bank of America Corporation – U.S.(1) | 2010 – 2011 | | Field examinationIRS Appeals |
Bank of America CorporationU.S.
| 2012 – New York (1) | 2004 – 20082013 | | Field examination |
Merrill LynchNew York | 2008 – U.S. | 2004 – 20082012 | | See belowField examination |
Various – U.K. | 2012 | | Field examination |
| |
(1) | All tax years subsequentField examination completed during 2014. The Corporation filed a protest related to certain adjustments with the years shown remain open to examination.IRS administrative appeals division. |
During 2013,2014, the Corporation settled and effectively resolved the IRS arrived at final resolution of the Bank of America Corporation 2001 through 2004 taxfederal examinations related to years and continued to make progress toward resolving all federal income tax examinations2005 through 2009 includingand all open Merrill Lynch. While subject to final agreement, including review by the Joint Committee on Taxation of the U.S. CongressLynch years through 2008, as well as various state and local examinations for certain years, the Corporation believes that these examinations may be concluded during 2014.multiple years.
|
| | |
254239 Bank of America 20132014
| | |
Considering all examinations, itIt is reasonably possible that the UTB balance may decrease by as much as $2.10.4 billion during the next 12 months, since resolved items will be removed from the balance whether their resolution results in payment or recognition. If such decrease were to occur, it likely would primarily result from outcomes consistent with management expectations.
During2014, 2013 and 2012, the Corporation recognized a benefit of $196 million and expense of $127 million and $99$99 million, of expense and, in 2011, a benefit of $168 million respectively, for interest and penalties, net-of-tax, in income tax expense (benefit).expense. At December 31, 20132014 and 2012,2013, the Corporation’s accrual for interest and penalties that related to income taxes, net of taxes and remittances, was $888455 million and $775888 million.
Significant components of the Corporation’s net deferred tax assets and liabilities at December 31, 20132014 and 20122013 are presented in the table below.
| | | | | | | | | |
| Deferred Tax Assets and Liabilities | | | | | | |
| | | | | | | |
| | December 31 | December 31 |
| (Dollars in millions) | 2013 | | 2012 | 2014 | | 2013 |
| Deferred tax assets | |
| | |
| |
| | |
|
| Net operating loss carryforwards | $ | 10,967 |
| | $ | 13,863 |
| $ | 9,787 |
| | $ | 10,967 |
|
| Accrued expenses | | 5,916 |
| | 6,749 |
|
| Tax credit carryforwards | 9,689 |
| | 9,529 |
| 5,614 |
| | 9,689 |
|
| Accrued expenses | 6,749 |
| | 8,099 |
| |
| Security, loan and debt valuations | | 5,190 |
| | 4,264 |
|
| Allowance for credit losses | 6,100 |
| | 8,463 |
| 5,047 |
| | 6,100 |
|
| Security, loan and debt valuations | 4,264 |
| | 2,712 |
| |
| Employee compensation and retirement benefits | 2,729 |
| | 4,612 |
| 3,665 |
| | 2,729 |
|
| State income taxes | 2,643 |
| | 2,766 |
| 2,034 |
| | 2,643 |
|
| Available-for-sale securities | 1,918 |
| | — |
| — |
| | 1,918 |
|
| Other | 722 |
| | 725 |
| 1,688 |
| | 722 |
|
| Gross deferred tax assets | 45,781 |
| | 50,769 |
| 38,941 |
| | 45,781 |
|
| Valuation allowance | (1,940 | ) | | (2,211 | ) | (1,111 | ) | | (1,940 | ) |
| Total deferred tax assets, net of valuation allowance | 43,841 |
| | 48,558 |
| 37,830 |
| | 43,841 |
|
| | | | | | | |
| Deferred tax liabilities | |
| | |
| |
| | |
|
| Equipment lease financing | 3,106 |
| | 3,371 |
| 2,880 |
| | 3,106 |
|
| Intangibles | | 1,349 |
| | 1,529 |
|
| Mortgage servicing rights | | 1,041 |
| | 1,547 |
|
| Available-for-sale securities | | 828 |
| | — |
|
| Fee income | | 816 |
| | 798 |
|
| Long-term borrowings | 3,033 |
| | 3,215 |
| 587 |
| | 3,033 |
|
| Mortgage servicing rights | 1,547 |
| | 1,986 |
| |
| Intangibles | 1,529 |
| | 1,708 |
| |
| Fee income | 798 |
| | 901 |
| |
| Available-for-sale securities | — |
| | 2,877 |
| |
| Other | 1,472 |
| | 1,462 |
| 2,075 |
| | 1,472 |
|
| Gross deferred tax liabilities | 11,485 |
| | 15,520 |
| 9,576 |
| | 11,485 |
|
| Net deferred tax assets | $ | 32,356 |
| | $ | 33,038 |
| $ | 28,254 |
| | $ | 32,356 |
|
The table below summarizes the deferred tax assets and related valuation allowances recognized for the net operating loss (NOL) and tax credit carryforwards at December 31, 20132014.
| | | | | | | | | | | | | | | |
| Net Operating Loss and Tax Credit Carryforwards | |
| Net Operating Loss and Tax Credit Carryforward Deferred Tax Assets | | Net Operating Loss and Tax Credit Carryforward Deferred Tax Assets |
| | | | | | | | | | | | | |
| (Dollars in millions) | Deferred Tax Asset | | Valuation Allowance | | Net
Deferred Tax Asset | | First Year Expiring | Deferred Tax Asset | | Valuation Allowance | | Net
Deferred Tax Asset | | First Year Expiring |
| Net operating losses – U.S. | $ | 3,061 |
| | $ | — |
| | $ | 3,061 |
| | After 2027 | $ | 3,065 |
| | $ | — |
| | $ | 3,065 |
| | After 2027 |
| Net operating losses – U.K. | 7,417 |
| | — |
| | 7,417 |
| | None (1) | 6,276 |
| | — |
| | 6,276 |
| | None (1) |
| Net operating losses – other non-U.S. | 489 |
| | (366 | ) | | 123 |
| | Various | 446 |
| | (316 | ) | | 130 |
| | Various |
Net operating losses – U.S. states (2) | 2,039 |
| | (1,025 | ) | | 1,014 |
| | Various | 1,168 |
| | (460 | ) | | 708 |
| | Various |
| General business credits | 4,034 |
| | — |
| | 4,034 |
| | After 2027 | 3,383 |
| | — |
| | 3,383 |
| | After 2029 |
| Foreign tax credits | 5,655 |
| | (271 | ) | | 5,384 |
| | After 2017 | 2,231 |
| | (68 | ) | | 2,163 |
| | After 2022 |
| |
(1) | The U.K. net operating losses may be carried forward indefinitely. |
| |
(2) | The net operating losses and related valuation allowances for U.S. states before considering the benefit of federal deductions were $3.11.8 billion and $1.6 billion708 million. |
Management concluded that no valuation allowance was necessary to reduce the U.K. NOL carryforwards and U.S. NOL and general business credit carryforwards since estimated future taxable income will be sufficient to utilize these assets prior to their expiration. The majority of the Corporation’s U.K. net deferred tax assets, which consist primarily of NOLs, are expected to be realized by certain subsidiaries over an extended number of years. Management’s conclusion is supported by recent financial results and forecasts, the reorganization of certain business activities and the indefinite period to carry forward NOLs. However, significant changes to those estimates, such as changes that would be caused by a substantial and prolonged worsening of the condition of Europe’s capital markets, or a change in applicable laws, could lead management to reassess its U.K. valuation allowance conclusions.
At December 31, 20132014, U.S. federal income taxes had not been provided on $17.017.2 billion of undistributed earnings of non-U.S. subsidiaries that management has determined have been reinvested for an indefinite period of time. If the Corporation were to record a deferred tax liability associated with these undistributed earnings, the amount would be approximately $4.34.5 billion at December 31, 20132014.
|
| | |
| | | Bank of America 20132014 255240 |
NOTE 20 Fair Value Measurements
Under applicable accounting guidance, fair value is defined as the exchange price that would be received for an asset or paid to transfer a liability (an exit price) in the principal or most advantageous market for the asset or liability in an orderly transaction between market participants on the measurement date. The Corporation determines the fair values of its financial instruments based on the fair value hierarchy established under applicable accounting guidance which requires an entity to maximize the use of observable inputs and minimize the use of unobservable inputs when measuring fair value. There are three levels of inputs used to measure fair value. The Corporation conducts a review of its fair value hierarchy classifications on a quarterly basis. Transfers into or out of fair value hierarchy classifications are made if the significant inputs used in the financial models measuring the fair values of the assets and liabilities became unobservable or observable, respectively, in the current marketplace. These transfers are considered to be effective as of the beginning of the quarter in which they occur. For more information regarding the fair value hierarchy and how the Corporation measures fair value, see Note 1 – Summary of Significant Accounting Principles. The Corporation accounts for certain financial instruments under the fair value option. For additional information, see Note 21 – Fair Value Option.
Valuation Processes and Techniques
The Corporation has various processes and controls in place to ensure that fair value is reasonably estimated. A model validation policy governs the use and control of valuation models used to estimate fair value. This policy requires review and approval of models by personnel who are independent of the front office, and periodic reassessments of models to ensure that they are continuing to perform as designed. In addition, detailed reviews of trading gains and losses are conducted on a daily basis by personnel who are independent of the front office. A price verification group, which is also independent of the front office, utilizes available market information including executed trades, market prices and market-observable valuation model inputs to ensure that fair values are reasonably estimated. The Corporation performs due diligence procedures over third-party pricing service providers in order to support their use in the valuation process. Where market information is not available to support internal valuations, independent reviews of the valuations are performed and any material exposures are escalated through a management review process.
While the Corporation believes its valuation methods are appropriate and consistent with other market participants, the use of different methodologies or assumptions to determine the fair value of certain financial instruments could result in a different estimate of fair value at the reporting date.
During 2013,2014, except for the adoption of FVA, there were no changes to the valuation techniques that had, or are expected to have, a material impact on the Corporation’s consolidated financial position or results of operations.
Level 1, 2 and 3 Valuation Techniques
Financial instruments are considered Level 1 when the valuation is based on quoted prices in active markets for identical assets or liabilities. Level 2 financial instruments are valued using quoted prices for similar assets or liabilities, quoted prices in markets that are not active, or models using inputs that are observable or
can be corroborated by observable market data for substantially the full term of the assets or liabilities. Financial instruments are considered Level 3 when their values are determined using pricing models, discounted cash flow methodologies or similar techniques, and at least one significant model assumption or input is unobservable and when determination of the fair value requires significant management judgment or estimation.
Trading Account Assets and Liabilities and Debt Securities
The fair values of trading account assets and liabilities are primarily based on actively traded markets where prices are based on either direct market quotes or observed transactions. The fair values of debt securities are generally based on quoted market prices or market prices for similar assets. Liquidity is a significant factor in the determination of the fair values of trading account assets and liabilities and debt securities. Market price quotes may not be readily available for some positions, or positions within a market sector where trading activity has slowed significantly or ceased. Some of these instruments are valued using a discounted cash flow model, which estimates the fair value of the securities using internal credit risk, interest rate and prepayment risk models that incorporate management’s best estimate of current key assumptions such as default rates, loss severity and prepayment rates. Principal and interest cash flows are discounted using an observable discount rate for similar instruments with adjustments that management believes a market participant would consider in determining fair value for the specific security. Other instruments are valued using a net asset value approach which considers the value of the underlying securities. Underlying assets are valued using external pricing services, where available, or matrix pricing based on the vintages and ratings. Situations of illiquidity generally are triggered by the market’s perception of credit uncertainty regarding a single company or a specific market sector. In these instances, fair value is determined based on limited available market information and other factors, principally from reviewing the issuer’s financial statements and changes in credit ratings made by one or more rating agencies.
Derivative Assets and Liabilities
The fair values of derivative assets and liabilities traded in the OTC market are determined using quantitative models that utilize multiple market inputs including interest rates, prices and indices to generate continuous yield or pricing curves and volatility factors to value the position. The majority of market inputs are actively quoted and can be validated through external sources, including brokers, market transactions and third-party pricing services. When third-party pricing services are used, the methods and assumptions are reviewed by the Corporation. Estimation risk is greater for derivative asset and liability positions that are either option-based or have longer maturity dates where observable market inputs are less readily available, or are unobservable, in which case, quantitative-based extrapolations of rate, price or index scenarios are used in determining fair values. The fair values of derivative assets and liabilities include adjustments for market liquidity, counterparty credit quality and other instrument-specific factors, where appropriate. In addition, the Corporation incorporates within its fair value measurements of OTC derivatives a valuation adjustment to reflect the credit risk associated with the net position. Positions are netted by counterparty, and fair value for net long exposures is adjusted for counterparty credit risk while the fair value for net short exposures is adjusted for the
|
| | |
256241 Bank of America 20132014
| | |
Corporation’s own credit risk. The Corporation also incorporates FVA within its fair value measurements to include funding costs on uncollateralized derivatives and derivatives where the Corporation is not permitted to use the collateral it receives. An estimate of severity of loss is also used in the determination of fair value, primarily based on market data.
Loans and Loan Commitments
The fair values of loans and loan commitments are based on market prices, where available, or discounted cash flow analyses using market-based credit spreads of comparable debt instruments or credit derivatives of the specific borrower or comparable borrowers. Results of discounted cash flow analyses may be adjusted, as appropriate, to reflect other market conditions or the perceived credit risk of the borrower.
Mortgage Servicing Rights
The fair values of MSRs are determined using models that rely on estimates of prepayment rates, the resultant weighted-average lives of the MSRs and the option-adjusted spread (OAS) levels. For more information on MSRs, see Note 23 – Mortgage Servicing Rights.
Loans Held-for-sale
The fair values of LHFS are based on quoted market prices, where available, or are determined by discounting estimated cash flows using interest rates approximating the Corporation’s current origination rates for similar loans adjusted to reflect the inherent credit risk. The borrower-specific credit risk is embedded within the quoted market prices or is implied by considering loan performance when selecting comparables.
Private Equity Investments
Private equity investments consist of direct investments and fund investments which are initially valued at their transaction price. Thereafter, the fair value of direct investments is based on an assessment of each individual investment using methodologies that include publicly-traded comparables derived by multiplying a key performance metric (e.g., earnings before interest, taxes, depreciation and amortization) of the portfolio company by the relevant valuation multiple observed for comparable companies, acquisition comparables, entry level multiples and discounted cash flow analyses, and are subject to appropriate discounts for lack of liquidity or marketability. After initial recognition, the fair value of fund investments is based on the Corporation’s proportionate interest in the fund’s capital as reported by the respective fund managers.
Securities Financing Agreements
The fair values of certain reverse repurchase agreements, repurchase agreements and securities borrowed transactions are determined using quantitative models, including discounted cash flow models that require the use of multiple market inputs including interest rates and spreads to generate continuous yield or pricing curves, and volatility factors. The majority of market inputs are actively quoted and can be validated through external sources, including brokers, market transactions and third-party pricing services.
Deposits
The fair value of deposits are determined using quantitative models, including discounted cash flow models that require the use of multiple market inputs including interest rates and spreads to generate continuous yield or pricing curves, and volatility factors. The majority of market inputs are actively quoted and can be validated through external sources, including brokers, market transactions and third-party pricing services. The Corporation considers the impact of its own credit spreads in the valuation of these liabilities. The credit risk is determined by reference to observable credit spreads in the secondary cash market.
Short-term Borrowings and Long-term Debt
The Corporation issues structured liabilities that have coupons or repayment terms linked to the performance of debt or equity securities, indices, currencies or commodities. The fair values of these structured liabilities are estimated using quantitative models for the combined derivative and debt portions of the notes. These models incorporate observable and, in some instances, unobservable inputs including security prices, interest rate yield curves, option volatility, currency, commodity or equity rates and correlations among these inputs. The Corporation also considers the impact of its own credit spreads in determining the discount rate used to value these liabilities. The credit spread is determined by reference to observable spreads in the secondary bond market.
Securities Financing Agreements
The fair values of certain reverse repurchase agreements, repurchase agreements and securities borrowed transactions are determined using quantitative models, including discounted cash flow models that require the use of multiple market inputs including interest rates and spreads to generate continuous yield or pricing curves, and volatility factors. The majority of market inputs are actively quoted and can be validated through external sources, including brokers, market transactions and third-party pricing services.
Deposits
The fair values of deposits are determined using quantitative models, including discounted cash flow models that require the use of multiple market inputs including interest rates and spreads to generate continuous yield or pricing curves, and volatility factors. The majority of market inputs are actively quoted and can be validated through external sources, including brokers, market transactions and third-party pricing services. The Corporation considers the impact of its own credit spreads in the valuation of these liabilities. The credit risk is determined by reference to observable credit spreads in the secondary cash market.
Asset-backed Secured Financings
The fair values of asset-backed secured financings are based on external broker bids, where available, or are determined by discounting estimated cash flows using interest rates approximating the Corporation’s current origination rates for similar loans adjusted to reflect the inherent credit risk.
|
| | |
| | | Bank of America 20132014 257242 |
Recurring Fair Value
Assets and liabilities carried at fair value on a recurring basis at December 31, 20132014 and 20122013, including financial instruments which the Corporation accounts for under the fair value option, are summarized in the following tables.
| | | | | | | | | | | | | | | | | | | | | |
| | December 31, 2013 | December 31, 2014 |
| | Fair Value Measurements | | | | | Fair Value Measurements | | | | �� |
| (Dollars in millions) | Level 1 (1) | | Level 2 (1) | | Level 3 | | Netting Adjustments (2) | | Assets/Liabilities at Fair Value | Level 1 | | Level 2 | | Level 3 | | Netting Adjustments (1) | | Assets/Liabilities at Fair Value |
| Assets | |
| | |
| | |
| | |
| | |
| |
| | |
| | |
| | |
| | |
|
| Federal funds sold and securities borrowed or purchased under agreements to resell | $ | — |
| | $ | 75,614 |
| | $ | — |
| | $ | — |
| | $ | 75,614 |
| $ | — |
| | $ | 62,182 |
| | $ | — |
| | $ | — |
| | $ | 62,182 |
|
| Trading account assets: | |
| | |
| | |
| | |
| | |
| |
| | |
| | |
| | |
| | |
|
U.S. government and agency securities (3)(2) | 34,222 |
| | 14,625 |
| | — |
| | — |
| | 48,847 |
| 33,470 |
| | 17,549 |
| | — |
| | — |
| | 51,019 |
|
| Corporate securities, trading loans and other | 1,147 |
| | 27,746 |
| | 3,559 |
| | — |
| | 32,452 |
| 243 |
| | 31,699 |
| | 3,270 |
| | — |
| | 35,212 |
|
| Equity securities | 41,324 |
| | 22,741 |
| | 386 |
| | — |
| | 64,451 |
| 33,518 |
| | 22,488 |
| | 352 |
| | — |
| | 56,358 |
|
| Non-U.S. sovereign debt | 24,357 |
| | 12,399 |
| | 468 |
| | — |
| | 37,224 |
| 20,348 |
| | 15,332 |
| | 574 |
| | — |
| | 36,254 |
|
| Mortgage trading loans and ABS | — |
| | 13,388 |
| | 4,631 |
| | — |
| | 18,019 |
| — |
| | 10,879 |
| | 2,063 |
| | — |
| | 12,942 |
|
| Total trading account assets | 101,050 |
| | 90,899 |
| | 9,044 |
| | — |
| | 200,993 |
| 87,579 |
| | 97,947 |
| | 6,259 |
| | — |
| | 191,785 |
|
Derivative assets (4)(3) | 2,374 |
| | 910,602 |
| | 7,277 |
| | (872,758 | ) | | 47,495 |
| 4,957 |
| | 972,977 |
| | 6,851 |
| | (932,103 | ) | | 52,682 |
|
| AFS debt securities: | |
| | |
| | |
| | |
| | |
| |
| | |
| | |
| | |
| | |
|
| U.S. Treasury and agency securities | 6,591 |
| | 2,363 |
| | — |
| | — |
| | 8,954 |
| 67,413 |
| | 2,182 |
| | — |
| | — |
| | 69,595 |
|
| Mortgage-backed securities: | |
| | |
| | |
| | |
| | |
| |
| | |
| | |
| | |
| | |
|
| Agency | — |
| | 164,935 |
| | — |
| | — |
| | 164,935 |
| — |
| | 165,039 |
| | — |
| | — |
| | 165,039 |
|
| Agency-collateralized mortgage obligations | — |
| | 22,492 |
| | — |
| | — |
| | 22,492 |
| — |
| | 14,248 |
| | — |
| | — |
| | 14,248 |
|
| Non-agency residential | — |
| | 6,239 |
| | — |
| | — |
| | 6,239 |
| — |
| | 4,175 |
| | 279 |
| | — |
| | 4,454 |
|
| Commercial | — |
| | 2,480 |
| | — |
| | — |
| | 2,480 |
| — |
| | 4,000 |
| | — |
| | — |
| | 4,000 |
|
| Non-U.S. securities | 3,698 |
| | 3,415 |
| | 107 |
| | — |
| | 7,220 |
| 3,191 |
| | 3,029 |
| | 10 |
| | — |
| | 6,230 |
|
| Corporate/Agency bonds | — |
| | 873 |
| | — |
| | — |
| | 873 |
| — |
| | 368 |
| | — |
| | — |
| | 368 |
|
| Other taxable securities | 20 |
| | 12,963 |
| | 3,847 |
| | — |
| | 16,830 |
| 20 |
| | 9,104 |
| | 1,667 |
| | — |
| | 10,791 |
|
| Tax-exempt securities | — |
| | 5,122 |
| | 806 |
| | — |
| | 5,928 |
| — |
| | 8,950 |
| | 599 |
| | — |
| | 9,549 |
|
| Total AFS debt securities | 10,309 |
| | 220,882 |
| | 4,760 |
| | — |
| | 235,951 |
| 70,624 |
| | 211,095 |
| | 2,555 |
| | — |
| | 284,274 |
|
| Other debt securities carried at fair value: | | | | | | | | | | | | | | | | | | |
| U.S. Treasury and agency securities | 4,062 |
| | — |
| | — |
| | — |
| | 4,062 |
| 1,541 |
| | — |
| | — |
| | — |
| | 1,541 |
|
| Mortgage-backed securities: | | | | | | | | | | | | | | | | | | |
| Agency | — |
| | 16,500 |
| | — |
| | — |
| | 16,500 |
| — |
| | 15,704 |
| | — |
| | — |
| | 15,704 |
|
| Agency-collateralized mortgage obligations | — |
| | 218 |
| | — |
| | — |
| | 218 |
| |
| Commercial | — |
| | 749 |
| | — |
| | — |
| | 749 |
| |
| Non-agency residential | | — |
| | 3,745 |
| | — |
| | — |
| | 3,745 |
|
| Non-U.S. securities | 7,457 |
| | 3,858 |
| | — |
| | — |
| | 11,315 |
| 13,270 |
| | 1,862 |
| | — |
| | — |
| | 15,132 |
|
| Other taxable securities | | — |
| | 299 |
| | — |
| | — |
| | 299 |
|
| Total other debt securities carried at fair value | 11,519 |
| | 21,325 |
| | — |
| | — |
| | 32,844 |
| 14,811 |
| | 21,610 |
| | — |
| | — |
| | 36,421 |
|
| Loans and leases | — |
| | 6,985 |
| | 3,057 |
| | — |
| | 10,042 |
| — |
| | 6,698 |
| | 1,983 |
| | — |
| | 8,681 |
|
| Mortgage servicing rights | — |
| | — |
| | 5,042 |
| | — |
| | 5,042 |
| — |
| | — |
| | 3,530 |
| | — |
| | 3,530 |
|
| Loans held-for-sale | — |
| | 5,727 |
| | 929 |
| | — |
| | 6,656 |
| — |
| | 6,628 |
| | 173 |
| | — |
| | 6,801 |
|
| Other assets | 14,474 |
| | 1,912 |
| | 1,669 |
| | — |
| | 18,055 |
| 11,581 |
| | 1,381 |
| | 911 |
| | — |
| | 13,873 |
|
Total assets | $ | 139,726 |
| | $ | 1,333,946 |
| | $ | 31,778 |
| | $ | (872,758 | ) | | $ | 632,692 |
| $ | 189,552 |
| | $ | 1,380,518 |
| | $ | 22,262 |
| | $ | (932,103 | ) | | $ | 660,229 |
|
| Liabilities | |
| | |
| | |
| | |
| | |
| |
| | |
| | |
| | |
| | |
|
| Interest-bearing deposits in U.S. offices | $ | — |
| | $ | 1,899 |
| | $ | — |
| | $ | — |
| | $ | 1,899 |
| $ | — |
| | $ | 1,469 |
| | $ | — |
| | $ | — |
| | $ | 1,469 |
|
| Federal funds purchased and securities loaned or sold under agreements to repurchase | — |
| | 33,684 |
| | — |
| | — |
| | 33,684 |
| — |
| | 35,357 |
| | — |
| | — |
| | 35,357 |
|
| Trading account liabilities: | |
| | |
| | |
| | |
| | | |
| | |
| | |
| | |
| | |
| U.S. government and agency securities | 26,915 |
| | 348 |
| | — |
| | — |
| | 27,263 |
| 18,514 |
| | 446 |
| | — |
| | — |
| | 18,960 |
|
| Equity securities | 23,874 |
| | 3,711 |
| | — |
| | — |
| | 27,585 |
| 24,679 |
| | 3,670 |
| | — |
| | — |
| | 28,349 |
|
| Non-U.S. sovereign debt | 20,755 |
| | 1,387 |
| | — |
| | — |
| | 22,142 |
| 16,089 |
| | 3,625 |
| | — |
| | — |
| | 19,714 |
|
| Corporate securities and other | 518 |
| | 5,926 |
| | 35 |
| | — |
| | 6,479 |
| 189 |
| | 6,944 |
| | 36 |
| | — |
| | 7,169 |
|
| Total trading account liabilities | 72,062 |
| | 11,372 |
| | 35 |
| | — |
| | 83,469 |
| 59,471 |
| | 14,685 |
| | 36 |
| | — |
| | 74,192 |
|
Derivative liabilities (4)(3) | 1,968 |
| | 897,107 |
| | 7,301 |
| | (868,969 | ) | | 37,407 |
| 4,493 |
| | 969,502 |
| | 7,771 |
| | (934,857 | ) | | 46,909 |
|
| Short-term borrowings | — |
| | 1,520 |
| | — |
| | — |
| | 1,520 |
| — |
| | 2,697 |
| | — |
| | — |
| | 2,697 |
|
| Accrued expenses and other liabilities | 10,130 |
| | 1,093 |
| | 10 |
| | — |
| | 11,233 |
| 10,795 |
| | 1,250 |
| | 10 |
| | — |
| | 12,055 |
|
| Long-term debt | — |
| | 45,045 |
| | 1,990 |
| | — |
| | 47,035 |
| — |
| | 34,042 |
| | 2,362 |
| | — |
| | 36,404 |
|
Total liabilities | $ | 84,160 |
| | $ | 991,720 |
| | $ | 9,336 |
| | $ | (868,969 | ) | | $ | 216,247 |
| $ | 74,759 |
| | $ | 1,059,002 |
| | $ | 10,179 |
| | $ | (934,857 | ) | | $ | 209,083 |
|
| |
(1) | Amounts represent the impact of legally enforceable master netting agreements and also cash collateral held or placed with the same counterparties. |
| |
(2) | Includes $17.2 billion of government-sponsored enterprise obligations. |
| |
(3) | For further disaggregation of derivative assets and liabilities, see Note 2 – Derivatives. |
| |
(4) | During 2014, the Corporation reclassified certain assets and liabilities within its fair value hierarchy based on a review of its inputs used to measure fair value. Accordingly, approximately $4.1 billion of assets related to U.S. government and agency securities, non-U.S. government securities and equity derivatives, and $570 million of liabilities related to equity derivatives were transferred from Level 1 to Level 2. |
|
| | | | | | | | | | | | | | | | | | | |
| | | | | | | | | | |
| | December 31, 2013 |
| | Fair Value Measurements | | | | |
| (Dollars in millions) | Level 1 | | Level 2 | | Level 3 | | Netting Adjustments (1) | | Assets/Liabilities at Fair Value |
| Assets | |
| | |
| | |
| | |
| | |
|
| Federal funds sold and securities borrowed or purchased under agreements to resell | $ | — |
| | $ | 68,656 |
| | $ | — |
| | $ | — |
| | $ | 68,656 |
|
| Trading account assets: | |
| | |
| | |
| | |
| | |
|
U.S. government and agency securities (2) | 34,222 |
| | 14,625 |
| | — |
| | — |
| | 48,847 |
|
| Corporate securities, trading loans and other | 1,147 |
| | 27,746 |
| | 3,559 |
| | — |
| | 32,452 |
|
| Equity securities | 41,324 |
| | 22,741 |
| | 386 |
| | — |
| | 64,451 |
|
| Non-U.S. sovereign debt | 24,357 |
| | 12,399 |
| | 468 |
| | — |
| | 37,224 |
|
| Mortgage trading loans and ABS | — |
| | 13,388 |
| | 4,631 |
| | — |
| | 18,019 |
|
| Total trading account assets | 101,050 |
| | 90,899 |
| | 9,044 |
| | — |
| | 200,993 |
|
Derivative assets (3) | 2,374 |
| | 910,602 |
| | 7,277 |
| | (872,758 | ) | | 47,495 |
|
| AFS debt securities: | |
| | |
| | |
| | |
| | |
|
| U.S. Treasury and agency securities | 6,591 |
| | 2,363 |
| | — |
| | — |
| | 8,954 |
|
| Mortgage-backed securities: | |
| | |
| | |
| | |
| | |
|
| Agency | — |
| | 164,935 |
| | — |
| | — |
| | 164,935 |
|
| Agency-collateralized mortgage obligations | — |
| | 22,492 |
| | — |
| | — |
| | 22,492 |
|
| Non-agency residential | — |
| | 6,239 |
| | — |
| | — |
| | 6,239 |
|
| Commercial | — |
| | 2,480 |
| | — |
| | — |
| | 2,480 |
|
| Non-U.S. securities | 3,698 |
| | 3,415 |
| | 107 |
| | — |
| | 7,220 |
|
| Corporate/Agency bonds | — |
| | 873 |
| | — |
| | — |
| | 873 |
|
| Other taxable securities | 20 |
| | 12,963 |
| | 3,847 |
| | — |
| | 16,830 |
|
| Tax-exempt securities | — |
| | 5,122 |
| | 806 |
| | — |
| | 5,928 |
|
| Total AFS debt securities | 10,309 |
| | 220,882 |
| | 4,760 |
| | — |
| | 235,951 |
|
| Other debt securities carried at fair value: | | | | | | | | | |
| U.S. Treasury and agency securities | 4,062 |
| | — |
| | — |
| | — |
| | 4,062 |
|
| Mortgage-backed securities: | | | | | | | | | |
| Agency | — |
| | 16,500 |
| | — |
| | — |
| | 16,500 |
|
| Agency-collateralized mortgage obligations | — |
| | 218 |
| | — |
| | — |
| | 218 |
|
| Commercial | — |
| | 749 |
| | — |
| | — |
| | 749 |
|
| Non-U.S. securities | 7,457 |
| | 3,858 |
| | — |
| | — |
| | 11,315 |
|
| Total other debt securities carried at fair value | 11,519 |
| | 21,325 |
| | — |
| | — |
| | 32,844 |
|
| Loans and leases | — |
| | 6,985 |
| | 3,057 |
| | — |
| | 10,042 |
|
| Mortgage servicing rights | — |
| | — |
| | 5,042 |
| | — |
| | 5,042 |
|
| Loans held-for-sale | — |
| | 5,727 |
| | 929 |
| | — |
| | 6,656 |
|
| Other assets | 14,474 |
| | 1,912 |
| | 1,669 |
| | — |
| | 18,055 |
|
Total assets (4) | $ | 139,726 |
| | $ | 1,326,988 |
| | $ | 31,778 |
| | $ | (872,758 | ) | | $ | 625,734 |
|
| Liabilities | |
| | |
| | |
| | |
| | |
|
| Interest-bearing deposits in U.S. offices | $ | — |
| | $ | 1,899 |
| | $ | — |
| | $ | — |
| | $ | 1,899 |
|
| Federal funds purchased and securities loaned or sold under agreements to repurchase | — |
| | 26,500 |
| | — |
| | — |
| | 26,500 |
|
| Trading account liabilities: | |
| | |
| | |
| | |
| | |
| U.S. government and agency securities | 26,915 |
| | 348 |
| | — |
| | — |
| | 27,263 |
|
| Equity securities | 23,874 |
| | 3,711 |
| | — |
| | — |
| | 27,585 |
|
| Non-U.S. sovereign debt | 20,755 |
| | 1,387 |
| | — |
| | — |
| | 22,142 |
|
| Corporate securities and other | 518 |
| | 5,926 |
| | 35 |
| | — |
| | 6,479 |
|
| Total trading account liabilities | 72,062 |
| | 11,372 |
| | 35 |
| | — |
| | 83,469 |
|
Derivative liabilities (3) | 1,968 |
| | 896,907 |
| | 7,501 |
| | (868,969 | ) | | 37,407 |
|
| Short-term borrowings | — |
| | 1,520 |
| | — |
| | — |
| | 1,520 |
|
| Accrued expenses and other liabilities | 10,130 |
| | 1,093 |
| | 10 |
| | — |
| | 11,233 |
|
| Long-term debt | — |
| | 45,045 |
| | 1,990 |
| | — |
| | 47,035 |
|
Total liabilities (4) | $ | 84,160 |
| | $ | 984,336 |
| | $ | 9,536 |
| | $ | (868,969 | ) | | $ | 209,063 |
|
| |
(1) | Amounts represent the impact of legally enforceable master netting agreements and also cash collateral held or placed with the same counterparties. |
| |
(2) | Includes $15.6 billion of government-sponsored enterprise obligations. |
| |
(3) | For further disaggregation of derivative assets and liabilities, see Note 2 – Derivatives. |
| |
(4) | During 2013, $500 million of other assets were transferred from Level 1 to Level 2 primarily due to a restriction that became effective for a private equity investment that was subsequently sold once the restriction was lifted. |
| |
(2)
| Amounts represent the impact of legally enforceable master netting agreements and also cash collateral held or placed with the same counterparties. |
| |
(3)
| Includes $17.2 billion of government-sponsored enterprise obligations.
|
| |
(4)
| For further disaggregation of derivative assets and liabilities, see Note 2 – Derivatives.
|
|
| | | | | | | | | | | | | | | | | | | |
| | | | | | | | | | |
| | December 31, 2012 |
| | Fair Value Measurements | | | | |
| (Dollars in millions) | Level 1 (1) | | Level 2 (1) | | Level 3 | | Netting Adjustments (2) | | Assets/Liabilities at Fair Value |
| Assets | |
| | |
| | |
| | |
| | |
|
| Federal funds sold and securities borrowed or purchased under agreements to resell | $ | — |
| | $ | 98,670 |
| | $ | — |
| | $ | — |
| | $ | 98,670 |
|
| Trading account assets: | |
| | |
| | |
| | |
| | |
|
U.S. government and agency securities (3) | 57,655 |
| | 29,319 |
| | — |
| | — |
| | 86,974 |
|
| Corporate securities, trading loans and other | 1,292 |
| | 32,882 |
| | 3,726 |
| | — |
| | 37,900 |
|
| Equity securities | 28,144 |
| | 14,626 |
| | 545 |
| | — |
| | 43,315 |
|
| Non-U.S. sovereign debt | 29,254 |
| | 13,139 |
| | 353 |
| | — |
| | 42,746 |
|
| Mortgage trading loans and ABS | — |
| | 11,905 |
| | 4,935 |
| | — |
| | 16,840 |
|
| Total trading account assets | 116,345 |
| | 101,871 |
| | 9,559 |
| | — |
| | 227,775 |
|
Derivative assets (4) | 2,997 |
| | 1,372,398 |
| | 8,073 |
| | (1,329,971 | ) | | 53,497 |
|
| AFS debt securities: | |
| | |
| | |
| | |
| | |
|
| U.S. Treasury and agency securities | 21,514 |
| | 2,958 |
| | — |
| | — |
| | 24,472 |
|
| Mortgage-backed securities: | |
| | |
| | |
| | |
| | |
|
| Agency | — |
| | 188,149 |
| | — |
| | — |
| | 188,149 |
|
| Agency-collateralized mortgage obligations | — |
| | 37,538 |
| | — |
| | — |
| | 37,538 |
|
| Non-agency residential | — |
| | 9,494 |
| | — |
| | — |
| | 9,494 |
|
| Non-agency commercial | — |
| | 3,914 |
| | 10 |
| | — |
| | 3,924 |
|
| Non-U.S. securities | 2,637 |
| | 2,981 |
| | — |
| | — |
| | 5,618 |
|
| Corporate/Agency bonds | — |
| | 1,358 |
| | 92 |
| | — |
| | 1,450 |
|
| Other taxable securities | 20 |
| | 8,180 |
| | 3,928 |
| | — |
| | 12,128 |
|
| Tax-exempt securities | — |
| | 3,072 |
| | 1,061 |
| | — |
| | 4,133 |
|
| Total AFS debt securities | 24,171 |
| | 257,644 |
| | 5,091 |
| | — |
| | 286,906 |
|
| Other debt securities carried at fair value: | | | | | | | | | |
| U.S. Treasury and agency securities | 491 |
| | — |
| | — |
| | — |
| | 491 |
|
| Mortgage-backed securities: | | | | | | | | | |
| Agency | — |
| | 13,073 |
| | — |
| | — |
| | 13,073 |
|
| Agency-collateralized mortgage obligations | — |
| | 929 |
| | — |
| | — |
| | 929 |
|
| Non-U.S. securities | 9,151 |
| | 300 |
| | — |
| | — |
| | 9,451 |
|
| Total other debt securities carried at fair value | 9,642 |
| | 14,302 |
| | — |
| | — |
| | 23,944 |
|
| Loans and leases | — |
| | 6,715 |
| | 2,287 |
| | — |
| | 9,002 |
|
| Mortgage servicing rights | — |
| | — |
| | 5,716 |
| | — |
| | 5,716 |
|
| Loans held-for-sale | — |
| | 8,926 |
| | 2,733 |
| | — |
| | 11,659 |
|
| Other assets | 18,535 |
| | 4,826 |
| | 3,129 |
| | — |
| | 26,490 |
|
| Total assets | $ | 171,690 |
| | $ | 1,865,352 |
| | $ | 36,588 |
| | $ | (1,329,971 | ) | | $ | 743,659 |
|
| Liabilities | |
| | |
| | |
| | |
| | |
|
| Interest-bearing deposits in U.S. offices | $ | — |
| | $ | 2,262 |
| | $ | — |
| | $ | — |
| | $ | 2,262 |
|
| Federal funds purchased and securities loaned or sold under agreements to repurchase | — |
| | 42,639 |
| | — |
| | — |
| | 42,639 |
|
| Trading account liabilities: | |
| | |
| | |
| | |
| | |
| U.S. government and agency securities | 22,351 |
| | 1,079 |
| | — |
| | — |
| | 23,430 |
|
| Equity securities | 19,852 |
| | 2,640 |
| | — |
| | — |
| | 22,492 |
|
| Non-U.S. sovereign debt | 18,875 |
| | 1,369 |
| | — |
| | — |
| | 20,244 |
|
| Corporate securities and other | 487 |
| | 6,870 |
| | 64 |
| | — |
| | 7,421 |
|
| Total trading account liabilities | 61,565 |
| | 11,958 |
| | 64 |
| | — |
| | 73,587 |
|
Derivative liabilities (4) | 2,859 |
| | 1,355,309 |
| | 6,605 |
| | (1,318,757 | ) | | 46,016 |
|
| Short-term borrowings | — |
| | 4,074 |
| | — |
| | — |
| | 4,074 |
|
| Accrued expenses and other liabilities | 15,457 |
| | 1,122 |
| | 15 |
| | — |
| | 16,594 |
|
| Long-term debt | — |
| | 46,860 |
| | 2,301 |
| | — |
| | 49,161 |
|
| Total liabilities | $ | 79,881 |
| | $ | 1,464,224 |
| | $ | 8,985 |
| | $ | (1,318,757 | ) | | $ | 234,333 |
|
| |
(1)
| During 2012, $2.0 billion and $350 million of assets and liabilities were transferred from Level 1 to Level 2, and $785 million and $40 million of assets and liabilities were transferred from Level 2 to Level 1. Of the asset transfers from Level 1 to Level 2, $940 million was due to a restriction that became effective for a private equity investment during 2012, while $535 million of the transfers from Level 2 to Level 1 was due to the lapse of this restriction during 2012. The remaining transfers were the result of additional information associated with certain equities, derivative contracts and private equity investments.
|
| |
(2)
| Amounts represent the impact of legally enforceable master netting agreements and also cash collateral held or placed with the same counterparties. |
| |
(3)
| Includes $30.6 billion of government-sponsored enterprise obligations.
|
| |
(4)
| For further disaggregation of derivative assets and liabilities, see Note 2 – Derivatives.
|
|
| | |
| | | Bank of America 20132014 259244 |
The following tables present a reconciliation of all assets and liabilities measured at fair value on a recurring basis using significant unobservable inputs (Level 3) during 20132014, 20122013 and 20112012, including net realized and unrealized gains (losses) included in earnings and accumulated OCI.
| | | | | |
Level 3 – Fair Value Measurements (1) | Level 3 – Fair Value Measurements (1) | | Level 3 – Fair Value Measurements (1) | |
| | | |
| | 2013 | 2014 |
| | | Gross | | | Gross | |
| (Dollars in millions) | Balance
January 1 2013 | Gains
(Losses)
in Earnings | Gains
(Losses)
in OCI | Purchases | Sales | Issuances | Settlements | Gross
Transfers
into Level 3 | Gross
Transfers
out of Level 3 | Balance December 31 2013 | Balance January 1 2014 | Gains
(Losses)
in Earnings | Gains
(Losses)
in OCI | Purchases | Sales | Issuances | Settlements | Gross
Transfers
into Level 3 | Gross
Transfers
out of Level 3 | Balance
December 31
2014 |
| Trading account assets: | |
| |
| |
| |
| | |
| |
| |
| |
| |
| |
| |
| | |
| |
| |
|
| U.S. government and agency securities | | $ | — |
| $ | — |
| $ | — |
| $ | 87 |
| $ | (87 | ) | $ | — |
| $ | — |
| $ | — |
| $ | — |
| $ | — |
|
| Corporate securities, trading loans and other | $ | 3,726 |
| $ | 242 |
| $ | — |
| $ | 3,848 |
| $ | (3,110 | ) | $ | 59 |
| $ | (651 | ) | $ | 890 |
| $ | (1,445 | ) | $ | 3,559 |
| 3,559 |
| 180 |
| — |
| 1,675 |
| (857 | ) | — |
| (938 | ) | 1,275 |
| (1,624 | ) | 3,270 |
|
| Equity securities | 545 |
| 74 |
| — |
| 96 |
| (175 | ) | — |
| (100 | ) | 70 |
| (124 | ) | 386 |
| 386 |
| — |
| — |
| 104 |
| (86 | ) | — |
| (16 | ) | 146 |
| (182 | ) | 352 |
|
| Non-U.S. sovereign debt | 353 |
| 50 |
| — |
| 122 |
| (18 | ) | — |
| (36 | ) | 2 |
| (5 | ) | 468 |
| 468 |
| 30 |
| — |
| 120 |
| (34 | ) | — |
| (19 | ) | 11 |
| (2 | ) | 574 |
|
| Mortgage trading loans and ABS | 4,935 |
| 53 |
| — |
| 2,514 |
| (1,993 | ) | — |
| (868 | ) | 20 |
| (30 | ) | 4,631 |
| 4,631 |
| 199 |
| — |
| 1,643 |
| (1,259 | ) | — |
| (585 | ) | 39 |
| (2,605 | ) | 2,063 |
|
| Total trading account assets | 9,559 |
| 419 |
| — |
| 6,580 |
| (5,296 | ) | 59 |
| (1,655 | ) | 982 |
| (1,604 | ) | 9,044 |
| 9,044 |
| 409 |
| — |
| 3,629 |
| (2,323 | ) | — |
| (1,558 | ) | 1,471 |
| (4,413 | ) | 6,259 |
|
Net derivative assets (2) | 1,468 |
| (297 | ) | — |
| 824 |
| (1,274 | ) | — |
| (1,362 | ) | (10 | ) | 627 |
| (24 | ) | (224 | ) | 463 |
| — |
| 823 |
| (1,738 | ) | — |
| (432 | ) | 28 |
| 160 |
| (920 | ) |
| AFS debt securities: | |
| |
| |
| |
| |
| |
| |
| |
| |
| |
| |
| |
| |
| |
| |
| |
| |
| |
| |
| |
|
| Commercial MBS | 10 |
| — |
| — |
| — |
| — |
| — |
| (10 | ) | — |
| — |
| — |
| |
| Non-agency residential MBS | | — |
| (2 | ) | — |
| 11 |
| — |
| — |
| — |
| 270 |
| — |
| 279 |
|
| Non-U.S. securities | — |
| 5 |
| 2 |
| 1 |
| (1 | ) | — |
| — |
| 100 |
| — |
| 107 |
| 107 |
| (7 | ) | (11 | ) | 241 |
| — |
| — |
| (147 | ) | — |
| (173 | ) | 10 |
|
| Corporate/Agency bonds | 92 |
| — |
| 4 |
| — |
| — |
| — |
| — |
| — |
| (96 | ) | — |
| — |
| — |
| — |
| — |
| — |
| — |
| — |
| 93 |
| (93 | ) | — |
|
| Other taxable securities | 3,928 |
| 9 |
| 15 |
| 1,055 |
| — |
| — |
| (1,155 | ) | — |
| (5 | ) | 3,847 |
| 3,847 |
| 9 |
| (8 | ) | 154 |
| — |
| — |
| (1,381 | ) | — |
| (954 | ) | 1,667 |
|
| Tax-exempt securities | 1,061 |
| 3 |
| 19 |
| — |
| — |
| — |
| (109 | ) | — |
| (168 | ) | 806 |
| 806 |
| 8 |
| — |
| — |
| (16 | ) | — |
| (235 | ) | 36 |
| — |
| 599 |
|
| Total AFS debt securities | 5,091 |
| 17 |
| 40 |
| 1,056 |
| (1 | ) | — |
| (1,274 | ) | 100 |
| (269 | ) | 4,760 |
| 4,760 |
| 8 |
| (19 | ) | 406 |
| (16 | ) | — |
| (1,763 | ) | 399 |
| (1,220 | ) | 2,555 |
|
Loans and leases (3, 4) | 2,287 |
| 98 |
| — |
| 310 |
| (128 | ) | 1,252 |
| (757 | ) | 19 |
| (24 | ) | 3,057 |
| 3,057 |
| 69 |
| — |
| — |
| (3 | ) | 699 |
| (1,591 | ) | 25 |
| (273 | ) | 1,983 |
|
Mortgage servicing rights (4) | 5,716 |
| 1,941 |
| — |
| — |
| (2,044 | ) | 472 |
| (1,043 | ) | — |
| — |
| 5,042 |
| 5,042 |
| (1,231 | ) | — |
| — |
| (61 | ) | 707 |
| (927 | ) | — |
| — |
| 3,530 |
|
Loans held-for-sale (3) | 2,733 |
| 62 |
| — |
| 8 |
| (402 | ) | 4 |
| (1,507 | ) | 34 |
| (3 | ) | 929 |
| 929 |
| 45 |
| — |
| 59 |
| (725 | ) | 23 |
| (216 | ) | 83 |
| (25 | ) | 173 |
|
Other assets (5) | 3,129 |
| (288 | ) | — |
| 46 |
| (383 | ) | — |
| (1,019 | ) | 239 |
| (55 | ) | 1,669 |
| 1,669 |
| (98 | ) | — |
| — |
| (430 | ) | — |
| (245 | ) | 39 |
| (24 | ) | 911 |
|
| Trading account liabilities – Corporate securities and other | (64 | ) | 10 |
| — |
| 43 |
| (54 | ) | (5 | ) | — |
| (9 | ) | 44 |
| (35 | ) | (35 | ) | 1 |
| — |
| 10 |
| (13 | ) | — |
| — |
| (9 | ) | 10 |
| (36 | ) |
Accrued expenses and other liabilities (3) | (15 | ) | 30 |
| — |
| — |
| — |
| (751 | ) | 724 |
| (1 | ) | 3 |
| (10 | ) | (10 | ) | 2 |
| — |
| — |
| — |
| (3 | ) | — |
| — |
| 1 |
| (10 | ) |
Long-term debt (3) | (2,301 | ) | 13 |
| — |
| 358 |
| (4 | ) | (172 | ) | 258 |
| (1,331 | ) | 1,189 |
| (1,990 | ) | (1,990 | ) | 49 |
| — |
| 169 |
| — |
| (615 | ) | 540 |
| (1,581 | ) | 1,066 |
| (2,362 | ) |
| |
(1) | Assets (liabilities). For assets, increase (decrease) to Level 3 and for liabilities, (increase) decrease to Level 3. |
| |
(2) | Net derivatives include derivative assets of $6.9 billion and derivative liabilities of $7.8 billion. |
| |
(3) | Amounts represent instruments that are accounted for under the fair value option. |
| |
(4) | Issuances represent loan originations and mortgage servicing rights retained following securitizations or whole-loan sales. |
| |
(5) | Other assets is primarily comprised of private equity investments and certain long-term fixed-rate margin loans that are accounted for under the fair value option. |
During 2014, the transfers into Level 3 included $1.5 billion of trading account assets, $399 million of AFS debt securities and $1.6 billion of long-term debt. Transfers into Level 3 for trading account assets were primarily the result of decreased availability of third-party prices for certain corporate loans and securities. Transfers into Level 3 for AFS debt securities were primarily due to decreased price observability related to municipal auction rate securities (ARS). Transfers into Level 3 for long-term debt were primarily due to changes in the impact of unobservable inputs on the value of certain structured liabilities. Transfers occur on a regular basis for these long-term debt instruments due to changes in the impact of unobservable inputs on the value of the embedded derivative in relation to the instrument as a whole.
During 2014, the transfers out of Level 3 included $4.4 billion of trading account assets, $160 million of net derivative assets, $1.2 billion of AFS debt securities, $273 million of loans and leases and $1.1 billion of long-term debt. Transfers out of Level 3 for trading account assets were primarily the result of increased market liquidity and price observability on certain CLOs. Transfers out of Level 3 for net derivative assets were primarily due to increased price observability for certain equity derivatives. Transfers out of Level 3 for AFS debt securities were primarily due to increased price observability on certain CLOs. Transfers out of Level 3 for loans and leases were primarily due to increased price observability. Transfers out of Level 3 for long-term debt were primarily due to changes in the impact of unobservable inputs on the value of certain structured liabilities.
|
| | | | | | | | | | | | | | | | | | | | | | | | | | | | | | |
| | | | | | | | | | | |
Level 3 – Fair Value Measurements (1) | | | | | | | |
| | | | | | | | | | | |
| | 2013 |
| | | | | Gross | | | |
| (Dollars in millions) | Balance
January 1 2013 | Gains
(Losses)
in Earnings | Gains
(Losses)
in OCI | Purchases | Sales | Issuances | Settlements | Gross
Transfers
into Level 3 | Gross
Transfers
out of Level 3 | Balance
December 31 2013 |
| Trading account assets: | |
| |
| |
| | | | |
| | |
| |
|
| Corporate securities, trading loans and other | $ | 3,726 |
| $ | 242 |
| $ | — |
| $ | 3,848 |
| $ | (3,110 | ) | $ | 59 |
| $ | (651 | ) | $ | 890 |
| $ | (1,445 | ) | $ | 3,559 |
|
| Equity securities | 545 |
| 74 |
| — |
| 96 |
| (175 | ) | — |
| (100 | ) | 70 |
| (124 | ) | 386 |
|
| Non-U.S. sovereign debt | 353 |
| 50 |
| — |
| 122 |
| (18 | ) | — |
| (36 | ) | 2 |
| (5 | ) | 468 |
|
| Mortgage trading loans and ABS | 4,935 |
| 53 |
| — |
| 2,514 |
| (1,993 | ) | — |
| (868 | ) | 20 |
| (30 | ) | 4,631 |
|
| Total trading account assets | 9,559 |
| 419 |
| — |
| 6,580 |
| (5,296 | ) | 59 |
| (1,655 | ) | 982 |
| (1,604 | ) | 9,044 |
|
Net derivative assets (2) | 1,468 |
| (304 | ) | — |
| 824 |
| (1,467 | ) | — |
| (1,362 | ) | (10 | ) | 627 |
| (224 | ) |
| AFS debt securities: | |
| |
| |
| | | | |
| |
| |
| |
|
| Commercial MBS | 10 |
| — |
| — |
| — |
| — |
| — |
| (10 | ) | — |
| — |
| — |
|
| Non-U.S. securities | — |
| 5 |
| 2 |
| 1 |
| (1 | ) | — |
| — |
| 100 |
| — |
| 107 |
|
| Corporate/Agency bonds | 92 |
| — |
| 4 |
| — |
| — |
| — |
| — |
| — |
| (96 | ) | — |
|
| Other taxable securities | 3,928 |
| 9 |
| 15 |
| 1,055 |
| — |
| — |
| (1,155 | ) | — |
| (5 | ) | 3,847 |
|
| Tax-exempt securities | 1,061 |
| 3 |
| 19 |
| — |
| — |
| — |
| (109 | ) | — |
| (168 | ) | 806 |
|
| Total AFS debt securities | 5,091 |
| 17 |
| 40 |
| 1,056 |
| (1 | ) | — |
| (1,274 | ) | 100 |
| (269 | ) | 4,760 |
|
Loans and leases (3, 4) | 2,287 |
| 98 |
| — |
| 310 |
| (128 | ) | 1,252 |
| (757 | ) | 19 |
| (24 | ) | 3,057 |
|
Mortgage servicing rights (4) | 5,716 |
| 1,941 |
| — |
| — |
| (2,044 | ) | 472 |
| (1,043 | ) | — |
| — |
| 5,042 |
|
Loans held-for-sale (3) | 2,733 |
| 62 |
| — |
| 8 |
| (402 | ) | 4 |
| (1,507 | ) | 34 |
| (3 | ) | 929 |
|
Other assets (5) | 3,129 |
| (288 | ) | — |
| 46 |
| (383 | ) | — |
| (1,019 | ) | 239 |
| (55 | ) | 1,669 |
|
| Trading account liabilities – Corporate securities and other | (64 | ) | 10 |
| — |
| 43 |
| (54 | ) | (5 | ) | — |
| (9 | ) | 44 |
| (35 | ) |
Accrued expenses and other liabilities (3) | (15 | ) | 30 |
| — |
| — |
| — |
| (751 | ) | 724 |
| (1 | ) | 3 |
| (10 | ) |
Long-term debt (3) | (2,301 | ) | 13 |
| — |
| 358 |
| (4 | ) | (172 | ) | 258 |
| (1,331 | ) | 1,189 |
| (1,990 | ) |
| |
(1) | Assets (liabilities). For assets, increase (decrease) to Level 3 and for liabilities, (increase) decrease to Level 3. |
| |
(2) | Net derivatives include derivative assets of $7.3 billion and derivative liabilities of $7.37.5 billion. |
| |
(3) | Amounts represent instruments that are accounted for under the fair value option. |
| |
(4) | Issuances represent loan originations and mortgage servicing rights retained following securitizations or whole-loan sales. |
| |
(5) | Other assets is primarily comprised of private equity investments and certain long-term fixed-rate margin loans that are accounted for under the fair value option. |
During 2013, the transfers into Level 3 included $982$982 million of trading account assets, $100 million of AFS debt securities, $239 million of other assets and $1.3$1.3 billion of long-term debt. Transfers into Level 3 for trading account assets were primarily the result of decreased third-party prices available for certain corporate loans and securities. Transfers into Level 3 for AFS debt securities were primarily due to decreased price observability. Transfers into Level 3 for other assets were primarily due to a lack of independent pricing data for certain receivables. Transfers into Level 3 for long-term debt were primarily due to changes in the impact of unobservable inputs on the value of certain structured liabilities. Transfers occur on a regular basis for these long-term debt instruments due to changes in the impact of unobservable inputs on the value of the embedded derivative in relation to the instrument as a whole.
During 2013, the transfers out of Level 3 included $1.6 billion of trading account assets, $627$627 million of net derivative assets, $269 million forof AFS debt securities and $1.2 billion of long-term debt. Transfers out of Level 3 for trading account assets were primarily the result of increased market liquidity and third-party prices available for certain corporate loans and securities. Transfers out of Level 3 for net derivative assets were primarily due to increased price observability (i.e., market comparables for the referenced instruments) for certain options. Transfers out of Level 3 for AFS debt securities were primarily due to increased market liquidity. Transfers out of Level 3 for long-term debt were primarily due to changes in the impact of unobservable inputs on the value of certain structured liabilities.
|
| | |
| | 260Bank of America 20132014246
| | |
| | | | | |
Level 3 – Fair Value Measurements (1) | Level 3 – Fair Value Measurements (1) | | Level 3 – Fair Value Measurements (1) | |
| | | |
| | 2012 | 2012 |
| | | Gross | | | Gross | |
| (Dollars in millions) | Balance
January 1 2012 | Gains
(Losses)
in Earnings | Gains
(Losses)
in OCI | Purchases | Sales | Issuances | Settlements | Gross
Transfers
into Level 3 | Gross
Transfers
out of Level 3 | Balance
December 31 2012 | Balance
January 1 2012 | Gains
(Losses) in Earnings | Gains
(Losses) in OCI | Purchases | Sales | Issuances | Settlements | Gross Transfers into Level 3 | Gross Transfers
out of Level 3 | Balance
December 31 2012 |
| Trading account assets: | |
| |
| |
| | |
| | |
| |
| |
Corporate securities, trading loans and other (2) | $ | 6,880 |
| $ | 195 |
| $ | — |
| $ | 2,798 |
| $ | (4,556 | ) | $ | — |
| $ | (1,077 | ) | $ | 436 |
| $ | (950 | ) | $ | 3,726 |
| $ | 6,880 |
| $ | 195 |
| $ | — |
| $ | 2,798 |
| $ | (4,556 | ) | $ | — |
| $ | (1,077 | ) | $ | 436 |
| $ | (950 | ) | $ | 3,726 |
|
| Equity securities | 544 |
| 31 |
| — |
| 201 |
| (271 | ) | — |
| 27 |
| 90 |
| (77 | ) | 545 |
| 544 |
| 31 |
| — |
| 201 |
| (271 | ) | — |
| 27 |
| 90 |
| (77 | ) | 545 |
|
| Non-U.S. sovereign debt | 342 |
| 8 |
| — |
| 388 |
| (359 | ) | — |
| (5 | ) | — |
| (21 | ) | 353 |
| 342 |
| 8 |
| — |
| 388 |
| (359 | ) | — |
| (5 | ) | — |
| (21 | ) | 353 |
|
Mortgage trading loans and ABS (2) | 3,689 |
| 215 |
| — |
| 2,574 |
| (1,536 | ) | — |
| (678 | ) | 844 |
| (173 | ) | 4,935 |
| 3,689 |
| 215 |
| — |
| 2,574 |
| (1,536 | ) | — |
| (678 | ) | 844 |
| (173 | ) | 4,935 |
|
| Total trading account assets | 11,455 |
| 449 |
| — |
| 5,961 |
| (6,722 | ) | — |
| (1,733 | ) | 1,370 |
| (1,221 | ) | 9,559 |
| 11,455 |
| 449 |
| — |
| 5,961 |
| (6,722 | ) | — |
| (1,733 | ) | 1,370 |
| (1,221 | ) | 9,559 |
|
Net derivative assets (3) | 5,866 |
| (221 | ) | — |
| 893 |
| (1,012 | ) | — |
| (3,328 | ) | (269 | ) | (461 | ) | 1,468 |
| 5,866 |
| (221 | ) | — |
| 893 |
| (1,012 | ) | — |
| (3,328 | ) | (269 | ) | (461 | ) | 1,468 |
|
| AFS debt securities: | |
| |
| |
| | |
| |
| |
| |
| |
| |
| |
| |
| | |
|
| Mortgage-backed securities: | | |
| |
| |
| |
| | |
| |
|
| Agency | 37 |
| — |
| — |
| — |
| — |
| — |
| (4 | ) | — |
| (33 | ) | — |
| 37 |
| — |
| — |
| — |
| — |
| — |
| (4 | ) | — |
| (33 | ) | — |
|
| Non-agency residential | 860 |
| (69 | ) | 19 |
| — |
| (306 | ) | — |
| (2 | ) | — |
| (502 | ) | — |
| 860 |
| (69 | ) | 19 |
| — |
| (306 | ) | — |
| (2 | ) | — |
| (502 | ) | — |
|
| Non-agency commercial | 40 |
| — |
| — |
| — |
| (24 | ) | — |
| (6 | ) | — |
| — |
| 10 |
| 40 |
| — |
| — |
| — |
| (24 | ) | — |
| (6 | ) | — |
| — |
| 10 |
|
| Corporate/Agency bonds | 162 |
| (2 | ) | — |
| (2 | ) | — |
| — |
| (39 | ) | — |
| (27 | ) | 92 |
| 162 |
| (2 | ) | — |
| (2 | ) | — |
| — |
| (39 | ) | — |
| (27 | ) | 92 |
|
| Other taxable securities | 4,265 |
| 23 |
| 26 |
| 3,196 |
| (28 | ) | — |
| (3,345 | ) | — |
| (209 | ) | 3,928 |
| 4,265 |
| 23 |
| 26 |
| 3,196 |
| (28 | ) | — |
| (3,345 | ) | — |
| (209 | ) | 3,928 |
|
| Tax-exempt securities | 2,648 |
| 61 |
| 20 |
| — |
| (133 | ) | — |
| (1,535 | ) | — |
| — |
| 1,061 |
| 2,648 |
| 61 |
| 20 |
| — |
| (133 | ) | — |
| (1,535 | ) | — |
| — |
| 1,061 |
|
| Total AFS debt securities | 8,012 |
| 13 |
| 65 |
| 3,194 |
| (491 | ) | — |
| (4,931 | ) | — |
| (771 | ) | 5,091 |
| 8,012 |
| 13 |
| 65 |
| 3,194 |
| (491 | ) | — |
| (4,931 | ) | — |
| (771 | ) | 5,091 |
|
Loans and leases (4, 5) | 2,744 |
| 334 |
| — |
| 564 |
| (1,520 | ) | — |
| (274 | ) | 450 |
| (11 | ) | 2,287 |
| 2,744 |
| 334 |
| — |
| 564 |
| (1,520 | ) | — |
| (274 | ) | 450 |
| (11 | ) | 2,287 |
|
Mortgage servicing rights (5) | 7,378 |
| (430 | ) | — |
| — |
| (122 | ) | 374 |
| (1,484 | ) | — |
| — |
| 5,716 |
| 7,378 |
| (430 | ) | — |
| — |
| (122 | ) | 374 |
| (1,484 | ) | — |
| — |
| 5,716 |
|
Loans held-for-sale (4) | 3,387 |
| 352 |
| — |
| 794 |
| (834 | ) | — |
| (414 | ) | 80 |
| (632 | ) | 2,733 |
| 3,387 |
| 352 |
| — |
| 794 |
| (834 | ) | — |
| (414 | ) | 80 |
| (632 | ) | 2,733 |
|
Other assets (6) | 4,235 |
| (54 | ) | — |
| 109 |
| (1,039 | ) | 270 |
| (381 | ) | — |
| (11 | ) | 3,129 |
| 4,235 |
| (54 | ) | — |
| 109 |
| (1,039 | ) | 270 |
| (381 | ) | — |
| (11 | ) | 3,129 |
|
| Trading account liabilities – Corporate securities and other | (114 | ) | 4 |
| — |
| 116 |
| (136 | ) | — |
| 80 |
| (68 | ) | 54 |
| (64 | ) | (114 | ) | 4 |
| — |
| 116 |
| (136 | ) | — |
| 80 |
| (68 | ) | 54 |
| (64 | ) |
Short-term borrowings (4) | — |
| — |
| — |
| — |
| — |
| (232 | ) | 232 |
| — |
| — |
| — |
| — |
| — |
| — |
| — |
| — |
| (232 | ) | 232 |
| — |
| — |
| — |
|
Accrued expenses and other liabilities (4) | (14 | ) | (4 | ) | — |
| 8 |
| — |
| (9 | ) | — |
| — |
| 4 |
| (15 | ) | (14 | ) | (4 | ) | — |
| 8 |
| — |
| (9 | ) | — |
| — |
| 4 |
| (15 | ) |
Long-term debt (4) | (2,943 | ) | (307 | ) | — |
| 290 |
| (33 | ) | (259 | ) | 1,239 |
| (2,040 | ) | 1,752 |
| (2,301 | ) | (2,943 | ) | (307 | ) | — |
| 290 |
| (33 | ) | (259 | ) | 1,239 |
| (2,040 | ) | 1,752 |
| (2,301 | ) |
| |
(1) | Assets (liabilities). For assets, increase (decrease) to Level 3 and for liabilities, (increase) decrease to Level 3. |
| |
(2) | During 2012, approximately $900 million was reclassified from Trading account assets – Corporate securities, trading loans and other to Trading account assets – Mortgage trading loans and ABS. In the table above, this reclassification is presented as a sale of Trading account assets – Corporate securities, trading loans and other and as a purchase of Trading account assets – Mortgage trading loans and ABS. |
| |
(3) | Net derivatives include derivative assets of $8.1 billion and derivative liabilities of $6.6 billion. |
| |
(4) | Amounts represent instruments that are accounted for under the fair value option. |
| |
(5) | Issuances represent loan originations and mortgage servicing rights retained following securitizations or whole-loan sales. |
| |
(6) | Other assets is primarily comprised of net monoline exposure to a single counterparty and private equity investments. |
During 2012, the transfers into Level 3 included $1.4 billion of trading account assets, $269 million of net derivative assets, $450 million of loans and leases and $2.0 billion of long-term debt. Transfers into Level 3 for trading account assets were primarily the result of decreased market liquidity for certain corporate loans and updated information related to certain CLOs. Transfers into Level 3 for net derivative assets were primarily related to decreased price observability for certain long-dated equity derivative liabilities due to a lack of independent pricing. Transfers into Level 3 for loans and leases were due to updated information related to certain commercial loans. Transfers into Level 3 for long-term debt were primarily due to changes in the impact of unobservable inputs on the value of certain structured liabilities. Transfers occur on a regular basis for these long-term debt instruments due to changes in the impact of unobservable inputs on the value of the embedded derivative in relation to the instrument as a whole.
During 2012, the transfers out of Level 3 included $1.2 billion of trading account assets, $461 million of net derivative assets, $771 million of AFS debt securities, $632$632 million of LHFS and $1.8 billion of long-term debt. Transfers out of Level 3 for trading account assets were primarily related to increased market liquidity for certain corporate and commercial real estate loans. Transfers out of Level 3 for net derivative assets were primarily related to increased price observability (i.e., market comparables for the referenced instruments) for certain total return swaps and foreign exchange swaps. Transfers out of Level 3 for AFS debt securities were primarily related to increased price observability for certain non-agency RMBS and ABS. Transfers out of Level 3 for LHFS were primarily related to increased observable inputs, primarily liquid comparables. Transfers out of Level 3 for long-term debt were primarily due to changes in the impact of unobservable inputs on the value of certain structured liabilities.
|
| | | | | | | | | | | | | | | | | | | | | | | | | | | | | | | | | |
| | | | | | | | | | | | |
Level 3 – Fair Value Measurements (1) | | | | | | | | |
| | | | | | | | | | | | |
| | 2011 |
| | | | | | Gross | | | |
| (Dollars in millions) | Balance
January 1 2011 | Consolidation of VIEs | Gains
(Losses) in Earnings | Gains
(Losses) in OCI | Purchases | Sales | Issuances | Settlements | Gross Transfers into Level 3 | Gross Transfers
out of Level 3 | Balance
December 31 2011 |
| Trading account assets: | | | | | | | | | | | |
| Corporate securities, trading loans and other | $ | 7,751 |
| $ | — |
| $ | 490 |
| $ | — |
| $ | 5,683 |
| $ | (6,664 | ) | $ | — |
| $ | (1,362 | ) | $ | 1,695 |
| $ | (713 | ) | $ | 6,880 |
|
| Equity securities | 557 |
| — |
| 49 |
| — |
| 335 |
| (362 | ) | — |
| (140 | ) | 132 |
| (27 | ) | 544 |
|
| Non-U.S. sovereign debt | 243 |
| — |
| 87 |
| — |
| 188 |
| (137 | ) | — |
| (3 | ) | 8 |
| (44 | ) | 342 |
|
| Mortgage trading loans and ABS | 6,908 |
| — |
| 442 |
| — |
| 2,222 |
| (4,713 | ) | — |
| (440 | ) | 75 |
| (805 | ) | 3,689 |
|
| Total trading account assets | 15,459 |
| — |
| 1,068 |
| — |
| 8,428 |
| (11,876 | ) | — |
| (1,945 | ) | 1,910 |
| (1,589 | ) | 11,455 |
|
Net derivative assets (2) | 7,745 |
| — |
| 5,199 |
| — |
| 1,235 |
| (1,553 | ) | — |
| (7,779 | ) | 1,199 |
| (180 | ) | 5,866 |
|
| AFS debt securities: | |
| |
| |
| |
| |
| | | | | | |
|
| Mortgage-backed securities: | |
| |
| |
| |
| |
| | | | | |
| |
|
| Agency | 4 |
| — |
| — |
| — |
| 14 |
| (11 | ) | — |
| — |
| 34 |
| (4 | ) | 37 |
|
| Agency collateralized-mortgage obligations | — |
| — |
| — |
| — |
| 56 |
| (56 | ) | — |
| — |
| — |
| — |
| — |
|
| Non-agency residential | 1,468 |
| — |
| (158 | ) | 41 |
| 11 |
| (307 | ) | — |
| (568 | ) | 373 |
| — |
| 860 |
|
| Non-agency commercial | 19 |
| — |
| — |
| — |
| 15 |
| — |
| — |
| — |
| 6 |
| — |
| 40 |
|
| Non-U.S. securities | 3 |
| — |
| — |
| — |
| — |
| — |
| — |
| — |
| 88 |
| (91 | ) | — |
|
| Corporate/Agency bonds | 137 |
| — |
| (12 | ) | (8 | ) | 304 |
| (17 | ) | — |
| — |
| 7 |
| (249 | ) | 162 |
|
| Other taxable securities | 13,018 |
| — |
| 26 |
| 21 |
| 3,876 |
| (2,245 | ) | — |
| (5,112 | ) | 2 |
| (5,321 | ) | 4,265 |
|
| Tax-exempt securities | 1,224 |
| — |
| 21 |
| (35 | ) | 2,862 |
| (92 | ) | — |
| (697 | ) | 38 |
| (673 | ) | 2,648 |
|
| Total AFS debt securities | 15,873 |
| — |
| (123 | ) | 19 |
| 7,138 |
| (2,728 | ) | — |
| (6,377 | ) | 548 |
| (6,338 | ) | 8,012 |
|
Loans and leases (3, 4) | 3,321 |
| 5,194 |
| (55 | ) | — |
| 21 |
| (2,644 | ) | 3,118 |
| (1,830 | ) | 5 |
| (4,386 | ) | 2,744 |
|
Mortgage servicing rights (4) | 14,900 |
| — |
| (5,661 | ) | — |
| — |
| (896 | ) | 1,656 |
| (2,621 | ) | — |
| — |
| 7,378 |
|
Loans held-for-sale (3) | 4,140 |
| — |
| 36 |
| — |
| 157 |
| (483 | ) | — |
| (961 | ) | 565 |
| (67 | ) | 3,387 |
|
Other assets (5) | 6,922 |
| — |
| 140 |
| — |
| 1,932 |
| (2,391 | ) | — |
| (768 | ) | 375 |
| (1,975 | ) | 4,235 |
|
| Trading account liabilities – Corporate securities and other | (7 | ) | — |
| 4 |
| — |
| 133 |
| (189 | ) | — |
| — |
| (65 | ) | 10 |
| (114 | ) |
Short-term borrowings (3) | (706 | ) | — |
| (30 | ) | — |
| — |
| — |
| — |
| 86 |
| — |
| 650 |
| — |
|
Accrued expenses and other liabilities (3) | (828 | ) | — |
| 61 |
| — |
| — |
| (2 | ) | (9 | ) | 3 |
| — |
| 761 |
| (14 | ) |
Long-term debt (3) | (2,986 | ) | — |
| (188 | ) | — |
| 520 |
| (72 | ) | (520 | ) | 838 |
| (2,111 | ) | 1,576 |
| (2,943 | ) |
| |
(1)
| Assets (liabilities). For assets, increase (decrease) to Level 3 and for liabilities, (increase) decrease to Level 3. |
| |
(2)
| Net derivatives include derivative assets of $14.4 billion and derivative liabilities of $8.5 billion.
|
| |
(3)
| Amounts represent instruments that are accounted for under the fair value option. |
| |
(4)
| Issuances represent loan originations and mortgage servicing rights retained following securitizations or whole-loan sales. |
| |
(5)
| Other assets is primarily comprised of net monoline exposure to a single counterparty and private equity investments. |
During 2011, the transfers into Level 3 included $1.9 billion of trading account assets, $1.2 billion of net derivative assets and $2.1 billion of long-term debt. Transfers into Level 3 for trading account assets were primarily certain CLOs, corporate loans and bonds that were transferred due to decreased market activity. Transfers into Level 3 for net derivative assets were the result of changes in the valuation methodology for certain total return swaps, in addition to increases in certain equity derivatives with significant unobservable inputs. Transfers into Level 3 for long-term debt were primarily due to changes in the impact of unobservable inputs on the value of certain structured liabilities. Transfers occur on a regular basis for these long-term debt instruments due to changes in the impact of unobservable inputs on the value of the embedded derivative in relation to the instrument as a whole.
During 2011, the transfers out of Level 3 included $1.6 billion of trading account assets, $6.3 billion of AFS debt securities, $4.4 billion of loans and leases, $2.0 billion of other assets and $1.6 billion of long-term debt. Transfers out of Level 3 for trading account assets were primarily due to increased price observability on certain RMBS, CMBS and consumer ABS portfolios, as well as certain corporate bond positions due to increased trading volume. Transfers out of Level 3 for AFS debt securities primarily related to auto, credit card and student loan ABS portfolios due to increased trading volume in the secondary market for similar securities. Transfers out of Level 3 for loans and leases were due to increased observable inputs, primarily liquid comparables, for certain corporate loans. Transfers out of Level 3 for other assets were primarily the result of an IPO of an equity investment. Transfers out of Level 3 for long-term debt were primarily due to changes in the impact of unobservable inputs on the value of certain structured liabilities.
|
| | |
262247 Bank of America 20132014
| | |
The following tables summarize gains (losses) due to changes in fair value, including both realized and unrealized gains (losses), recorded in earnings for Level 3 assets and liabilities during 20132014, 20122013 and 20112012. These amounts include gains (losses) on loans, LHFS, loan commitments and structured liabilities that are accounted for under the fair value option.
| | | | | | | | | | | | | | | | | |
Level 3 – Total Realized and Unrealized Gains (Losses) Included in Earnings | | | | | | | | | | | | | | | | |
| | 2013 | 2014 |
| (Dollars in millions) | Trading
Account
Profits (Losses) | | Mortgage
Banking
Income (Loss) (1) | | Other (2) | | Total | Trading
Account
Profits (Losses) | | Mortgage
Banking
Income (Loss) (1) | | Other (2) | | Total |
| Trading account assets: | |
| | |
| | |
| | |
| |
| | |
| | |
| | |
|
| Corporate securities, trading loans and other | $ | 242 |
| | $ | — |
| | $ | — |
| | $ | 242 |
| $ | 180 |
| | $ | — |
| | $ | — |
| | $ | 180 |
|
| Equity securities | 74 |
| | — |
| | — |
| | 74 |
| |
| Non-U.S. sovereign debt | 50 |
| | — |
| | — |
| | 50 |
| 30 |
| | — |
| | — |
| | 30 |
|
| Mortgage trading loans and ABS | 53 |
| | — |
| | — |
| | 53 |
| 199 |
| | — |
| | — |
| | 199 |
|
| Total trading account assets | 419 |
| | — |
| | — |
| | 419 |
| 409 |
| | — |
| | — |
| | 409 |
|
| Net derivative assets | (1,224 | ) | | 927 |
| | — |
| | (297 | ) | (475 | ) | | 834 |
| | 104 |
| | 463 |
|
| AFS debt securities: | |
| | |
| | |
| | |
| |
| | |
| | |
| | |
|
| Non-agency residential MBS | | — |
| | — |
| | (2 | ) | | (2 | ) |
| Non-U.S. securities | — |
| | — |
| | 5 |
| | 5 |
| — |
| | — |
| | (7 | ) | | (7 | ) |
| Other taxable securities | — |
| | — |
| | 9 |
| | 9 |
| — |
| | — |
| | 9 |
| | 9 |
|
| Tax-exempt securities | — |
| | — |
| | 3 |
| | 3 |
| — |
| | — |
| | 8 |
| | 8 |
|
| Total AFS debt securities | — |
| | — |
| | 17 |
| | 17 |
| — |
| | — |
| | 8 |
| | 8 |
|
Loans and leases (3) | — |
| | (38 | ) | | 136 |
| | 98 |
| — |
| | — |
| | 69 |
| | 69 |
|
| Mortgage servicing rights | — |
| | 1,941 |
| | — |
| | 1,941 |
| (6 | ) | | (1,225 | ) | | — |
| | (1,231 | ) |
Loans held-for-sale (3) | — |
| | 2 |
| | 60 |
| | 62 |
| (14 | ) | | — |
| | 59 |
| | 45 |
|
| Other assets | — |
| | 122 |
| | (410 | ) | | (288 | ) | — |
| | (79 | ) | | (19 | ) | | (98 | ) |
| Trading account liabilities – Corporate securities and other | 10 |
| | — |
| | — |
| | 10 |
| 1 |
| | — |
| | — |
| | 1 |
|
Accrued expenses and other liabilities (3) | — |
| | 30 |
| | — |
| | 30 |
| — |
| | — |
| | 2 |
| | 2 |
|
Long-term debt (3) | 45 |
| | — |
| | (32 | ) | | 13 |
| 78 |
| | — |
| | (29 | ) | | 49 |
|
| Total | $ | (750 | ) | | $ | 2,984 |
| | $ | (229 | ) | | $ | 2,005 |
| $ | (7 | ) | | $ | (470 | ) | | $ | 194 |
| | $ | (283 | ) |
| | | | | | | | | | | | | | | |
| | 2012 | 2013 |
| Trading account assets: | |
| | |
| | |
| | |
| |
| | |
| | |
| | |
|
| Corporate securities, trading loans and other | $ | 195 |
| | $ | — |
| | $ | — |
| | $ | 195 |
| $ | 242 |
| | $ | — |
| | $ | — |
| | $ | 242 |
|
| Equity securities | 31 |
| | — |
| | — |
| | 31 |
| 74 |
| | — |
| | — |
| | 74 |
|
| Non-U.S. sovereign debt | 8 |
| | — |
| | — |
| | 8 |
| 50 |
| | — |
| | — |
| | 50 |
|
| Mortgage trading loans and ABS | 215 |
| | — |
| | — |
| | 215 |
| 53 |
| | — |
| | — |
| | 53 |
|
| Total trading account assets | 449 |
| | — |
| | — |
| | 449 |
| 419 |
| | — |
| | — |
| | 419 |
|
| Net derivative assets | (3,208 | ) | | 2,987 |
| | — |
| | (221 | ) | (1,224 | ) | | 927 |
| | (7 | ) | | (304 | ) |
| AFS debt securities: | |
| | |
| | |
| | |
| |
| | |
| | |
| | |
|
| Non-agency residential MBS | — |
| | — |
| | (69 | ) | | (69 | ) | |
| Corporate/Agency bonds | — |
| | — |
| | (2 | ) | | (2 | ) | |
| Non-U.S. securities | | — |
| | — |
| | 5 |
| | 5 |
|
| Other taxable securities | 2 |
| | — |
| | 21 |
| | 23 |
| — |
| | — |
| | 9 |
| | 9 |
|
| Tax-exempt securities | — |
| | — |
| | 61 |
| | 61 |
| — |
| | — |
| | 3 |
| | 3 |
|
| Total AFS debt securities | 2 |
| | — |
| | 11 |
| | 13 |
| — |
| | — |
| | 17 |
| | 17 |
|
Loans and leases (3) | — |
| | — |
| | 334 |
| | 334 |
| — |
| | (38 | ) | | 136 |
| | 98 |
|
| Mortgage servicing rights | — |
| | (430 | ) | | — |
| | (430 | ) | — |
| | 1,941 |
| | — |
| | 1,941 |
|
Loans held-for-sale (3) | — |
| | 148 |
| | 204 |
| | 352 |
| — |
| | 2 |
| | 60 |
| | 62 |
|
| Other assets | — |
| | (74 | ) | | 20 |
| | (54 | ) | — |
| | 122 |
| | (410 | ) | | (288 | ) |
| Trading account liabilities – Corporate securities and other | 4 |
| | — |
| | — |
| | 4 |
| 10 |
| | — |
| | — |
| | 10 |
|
Accrued expenses and other liabilities (3) | — |
| | — |
| | (4 | ) | | (4 | ) | — |
| | 30 |
| | — |
| | 30 |
|
Long-term debt (3) | (133 | ) | | — |
| | (174 | ) | | (307 | ) | 45 |
| | — |
| | (32 | ) | | 13 |
|
| Total | $ | (2,886 | ) | | $ | 2,631 |
| | $ | 391 |
| | $ | 136 |
| $ | (750 | ) | | $ | 2,984 |
| | $ | (236 | ) | | $ | 1,998 |
|
| |
(1) | Mortgage banking income (loss) does not reflect the impact of Level 1 and Level 2 hedges on MSRs. |
| |
(2) | Amounts included are primarily recorded in other income (loss). Equity investment gains of $8486 million and $9777 million recorded on net derivative assets and other assets were also included for 20132014 and 20122013. |
| |
(3) | Amounts represent instruments that are accounted for under the fair value option. |
|
| | |
| | | Bank of America 20132014 263248 |
| | | | | | | | | | | | | | | | | |
Level 3 – Total Realized and Unrealized Gains (Losses) Included in Earnings (continued) | | | | | | | | | | | | | | | | |
| | 2011 | 2012 |
| (Dollars in millions) | Trading
Account
Profits (Losses) | | Mortgage
Banking
Income (Loss) (1) | | Other (2) | | Total | Trading
Account
Profits (Losses) | | Mortgage
Banking
Income (Loss) (1) | | Other (2) | | Total |
| Trading account assets: | |
| | |
| | |
| | |
| |
| | |
| | |
| | |
|
| Corporate securities, trading loans and other | $ | 490 |
| | $ | — |
| | $ | — |
| | $ | 490 |
| $ | 195 |
| | $ | — |
| | $ | — |
| | $ | 195 |
|
| Equity securities | 49 |
| | — |
| | — |
| | 49 |
| 31 |
| | — |
| | — |
| | 31 |
|
| Non-U.S. sovereign debt | 87 |
| | — |
| | — |
| | 87 |
| 8 |
| | — |
| | — |
| | 8 |
|
| Mortgage trading loans and ABS | 442 |
| | — |
| | — |
| | 442 |
| 215 |
| | — |
| | — |
| | 215 |
|
| Total trading account assets | 1,068 |
| | — |
| | — |
| | 1,068 |
| 449 |
| | — |
| | — |
| | 449 |
|
| Net derivative assets | 1,516 |
| | 3,683 |
| | — |
| | 5,199 |
| (3,208 | ) | | 2,987 |
| | — |
| | (221 | ) |
| AFS debt securities: | |
| | |
| | |
| | |
| |
| | |
| | |
| | |
|
| Non-agency residential MBS | — |
| | — |
| | (158 | ) | | (158 | ) | — |
| | — |
| | (69 | ) | | (69 | ) |
| Corporate/Agency bonds | — |
| | — |
| | (12 | ) | | (12 | ) | — |
| | — |
| | (2 | ) | | (2 | ) |
| Other taxable securities | 16 |
| | — |
| | 10 |
| | 26 |
| 2 |
| | — |
| | 21 |
| | 23 |
|
| Tax-exempt securities | (3 | ) | | — |
| | 24 |
| | 21 |
| — |
| | — |
| | 61 |
| | 61 |
|
| Total AFS debt securities | 13 |
| | — |
| | (136 | ) | | (123 | ) | 2 |
| | — |
| | 11 |
| | 13 |
|
Loans and leases (3) | — |
| | (13 | ) | | (42 | ) | | (55 | ) | — |
| | — |
| | 334 |
| | 334 |
|
| Mortgage servicing rights | — |
| | (5,661 | ) | | — |
| | (5,661 | ) | — |
| | (430 | ) | | — |
| | (430 | ) |
Loans held-for-sale (3) | — |
| | (108 | ) | | 144 |
| | 36 |
| — |
| | 148 |
| | 204 |
| | 352 |
|
| Other assets | — |
| | (51 | ) | | 191 |
| | 140 |
| — |
| | (74 | ) | | 20 |
| | (54 | ) |
| Trading account liabilities – Corporate securities and other | 4 |
| | — |
| | — |
| | 4 |
| 4 |
| | — |
| | — |
| | 4 |
|
Short-term borrowings (3) | — |
| | (30 | ) | | — |
| | (30 | ) | |
Accrued expenses and other liabilities (3) | (10 | ) | | 71 |
| | — |
| | 61 |
| — |
| | — |
| | (4 | ) | | (4 | ) |
Long-term debt (3) | (106 | ) | | — |
| | (82 | ) | | (188 | ) | (133 | ) | | — |
| | (174 | ) | | (307 | ) |
| Total | $ | 2,485 |
| | $ | (2,109 | ) | | $ | 75 |
| | $ | 451 |
| $ | (2,886 | ) | | $ | 2,631 |
| | $ | 391 |
| | $ | 136 |
|
| |
(1) | Mortgage banking income (loss) does not reflect the impact of Level 1 and Level 2 hedges on MSRs. |
| |
(2) | Amounts included are primarily recorded in other income (loss). Equity investment gains of $24297 million recorded on other assets were also included for 20112012. |
| |
(3) | Amounts represent instruments that are accounted for under the fair value option. |
|
| | |
264249 Bank of America 20132014
| | |
The table below summarizes changes in unrealized gains (losses) recorded in earnings during 20132014, 20122013 and 20112012 for Level 3 assets and liabilities that were still held at December 31, 20132014, 20122013 and 20112012. These amounts include changes in fair value on loans, LHFS, loan commitments and structured liabilities that are accounted for under the fair value option.
| | | | | | | | | | | | | | | | | |
Level 3 – Changes in Unrealized Gains (Losses) Relating to Assets and Liabilities Still Held at Reporting Date | | | | | | | | | | | | | | | | |
| | 2013 | 2014 |
| (Dollars in millions) | Trading
Account
Profits (Losses) | | Mortgage
Banking
Income (Loss) (1) | | Other (2) | | Total | Trading
Account
Profits (Losses) | | Mortgage
Banking
Income (Loss) (1) | | Other (2) | | Total |
| Trading account assets: | | |
| | |
| | |
| | |
|
| Corporate securities, trading loans and other | | $ | 69 |
| | $ | — |
| | $ | — |
| | $ | 69 |
|
| Equity securities | | (8 | ) | | — |
| | — |
| | (8 | ) |
| Non-U.S. sovereign debt | | 31 |
| | — |
| | — |
| | 31 |
|
| Mortgage trading loans and ABS | | 79 |
| | — |
| | — |
| | 79 |
|
| Total trading account assets | | 171 |
| | — |
| | — |
| | 171 |
|
| Net derivative assets | | (276 | ) | | 85 |
| | 104 |
| | (87 | ) |
Loans and leases (3) | | — |
| | — |
| | 76 |
| | 76 |
|
| Mortgage servicing rights | | (6 | ) | | (1,747 | ) | | — |
| | (1,753 | ) |
Loans held-for-sale (3) | | (14 | ) | | — |
| | 10 |
| | (4 | ) |
| Other assets | | — |
| | (50 | ) | | 102 |
| | 52 |
|
| Trading account liabilities – Corporate securities and other | | 1 |
| | — |
| | — |
| | 1 |
|
Accrued expenses and other liabilities (3) | | — |
| | — |
| | 1 |
| | 1 |
|
Long-term debt (3) | | 29 |
| | — |
| | (37 | ) | | (8 | ) |
| Total | | $ | (95 | ) | | $ | (1,712 | ) | | $ | 256 |
| | $ | (1,551 | ) |
| | | | | | | | | |
| | | 2013 |
| Trading account assets: | |
| | |
| | |
| | |
| |
| | |
| | |
| | |
|
| Corporate securities, trading loans and other | $ | (130 | ) | | $ | — |
| | $ | — |
| | $ | (130 | ) | $ | (130 | ) | | $ | — |
| | $ | — |
| | $ | (130 | ) |
| Equity securities | 40 |
| | — |
| | — |
| | 40 |
| 40 |
| | — |
| | — |
| | 40 |
|
| Non-U.S. sovereign debt | 80 |
| | — |
| | — |
| | 80 |
| 80 |
| | — |
| | — |
| | 80 |
|
| Mortgage trading loans and ABS | (174 | ) | | — |
| | — |
| | (174 | ) | (174 | ) | | — |
| | — |
| | (174 | ) |
| Total trading account assets | (184 | ) | | — |
| | — |
| | (184 | ) | (184 | ) | | — |
| | — |
| | (184 | ) |
| Net derivative assets | (1,375 | ) | | 42 |
| | — |
| | (1,333 | ) | (1,375 | ) | | 42 |
| | (7 | ) | | (1,340 | ) |
Loans and leases (3) | — |
| | (34 | ) | | 152 |
| | 118 |
| — |
| | (34 | ) | | 152 |
| | 118 |
|
| Mortgage servicing rights | — |
| | 1,541 |
| | — |
| | 1,541 |
| — |
| | 1,541 |
| | — |
| | 1,541 |
|
Loans held-for-sale (3) | — |
| | 6 |
| | 57 |
| | 63 |
| — |
| | 6 |
| | 57 |
| | 63 |
|
| Other assets | — |
| | 166 |
| | 14 |
| | 180 |
| — |
| | 166 |
| | 14 |
| | 180 |
|
Long-term debt (3) | (4 | ) | | — |
| | (32 | ) | | (36 | ) | (4 | ) | | — |
| | (32 | ) | | (36 | ) |
| Total | $ | (1,563 | ) | | $ | 1,721 |
| | $ | 191 |
| | $ | 349 |
| $ | (1,563 | ) | | $ | 1,721 |
| | $ | 184 |
| | $ | 342 |
|
| | | | | | | | | | | | | | | |
| | 2012 | 2012 |
| Trading account assets: | |
| | |
| | |
| | |
| | | | | | | |
| Corporate securities, trading loans and other | $ | (19 | ) | | $ | — |
| | $ | — |
| | $ | (19 | ) | $ | (19 | ) | | $ | — |
| | $ | — |
| | $ | (19 | ) |
| Equity securities | 17 |
| | — |
| | — |
| | 17 |
| 17 |
| | — |
| | — |
| | 17 |
|
| Non-U.S. sovereign debt | 20 |
| | — |
| | — |
| | 20 |
| 20 |
| | — |
| | — |
| | 20 |
|
| Mortgage trading loans and ABS | 36 |
| | — |
| | — |
| | 36 |
| 36 |
| | — |
| | — |
| | 36 |
|
| Total trading account assets | 54 |
| | — |
| | — |
| | 54 |
| 54 |
| | — |
| | — |
| | 54 |
|
| Net derivative assets | (2,782 | ) | | 456 |
| | — |
| | (2,326 | ) | (2,782 | ) | | 456 |
| | — |
| | (2,326 | ) |
| AFS debt securities – Other taxable securities | 2 |
| | — |
| | — |
| | 2 |
| 2 |
| | — |
| | — |
| | 2 |
|
Loans and leases (3) | — |
| | — |
| | 214 |
| | 214 |
| — |
| | — |
| | 214 |
| | 214 |
|
| Mortgage servicing rights | — |
| | (1,100 | ) | | — |
| | (1,100 | ) | — |
| | (1,100 | ) | | — |
| | (1,100 | ) |
Loans held-for-sale (3) | — |
| | 112 |
| | 168 |
| | 280 |
| — |
| | 112 |
| | 168 |
| | 280 |
|
| Other assets | — |
| | (71 | ) | | 50 |
| | (21 | ) | — |
| | (71 | ) | | 50 |
| | (21 | ) |
| Trading account liabilities – Corporate securities and other | 4 |
| | — |
| | — |
| | 4 |
| 4 |
| | — |
| | — |
| | 4 |
|
Accrued expenses and other liabilities (3) | — |
| | — |
| | (2 | ) | | (2 | ) | — |
| | — |
| | (2 | ) | | (2 | ) |
Long-term debt (3) | (136 | ) | | — |
| | (173 | ) | | (309 | ) | (136 | ) | | — |
| | (173 | ) | | (309 | ) |
| Total | $ | (2,858 | ) | | $ | (603 | ) | | $ | 257 |
| | $ | (3,204 | ) | $ | (2,858 | ) | | $ | (603 | ) | | $ | 257 |
| | $ | (3,204 | ) |
| | | | | | | | | |
| | 2011 | |
| Trading account assets: | | | | | | | | |
| Corporate securities, trading loans and other | $ | (86 | ) | | $ | — |
| | $ | — |
| | $ | (86 | ) | |
| Equity securities | (60 | ) | | — |
| | — |
| | (60 | ) | |
| Non-U.S. sovereign debt | 101 |
| | — |
| | — |
| | 101 |
| |
| Mortgage trading loans and ABS | 30 |
| | — |
| | — |
| | 30 |
| |
| Total trading account assets | (15 | ) | | — |
| | — |
| | (15 | ) | |
| Net derivative assets | 1,430 |
| | 133 |
| | — |
| | 1,563 |
| |
| AFS debt securities: | |
| | |
| | |
| | |
| |
| Non-agency residential MBS | — |
| | — |
| | (195 | ) | | (195 | ) | |
| Corporate/Agency bonds | — |
| | — |
| | (14 | ) | | (14 | ) | |
| Other taxable securities | — |
| | — |
| | 13 |
| | 13 |
| |
| Total AFS debt securities | — |
| | — |
| | (196 | ) | | (196 | ) | |
Loans and leases (3) | — |
| | — |
| | 94 |
| | 94 |
| |
| Mortgage servicing rights | — |
| | (6,958 | ) | | — |
| | (6,958 | ) | |
Loans held-for-sale (3) | — |
| | (87 | ) | | 5 |
| | (82 | ) | |
| Other assets | — |
| | (53 | ) | | (772 | ) | | (825 | ) | |
| Trading account liabilities – Corporate securities and other | 3 |
| | — |
| | — |
| | 3 |
| |
Long-term debt (3) | (107 | ) | | — |
| | (94 | ) | | (201 | ) | |
| Total | $ | 1,311 |
| | $ | (6,965 | ) | | $ | (963 | ) | | $ | (6,617 | ) | |
| |
(1) | Mortgage banking income (loss) does not reflect the impact of Level 1 and Level 2 hedges on MSRs. |
| |
(2) | Amounts included are primarily recorded in other income (loss). Equity investment gains of $60170 million and $14153 million recorded on net derivative assets and other assets were included for 2014 and 2013, and lossesgains of $309141 million recorded on other assets were also included for 2013, 2012 and 2011, respectively.. |
| |
(3) | Amounts represent instruments that are accounted for under the fair value option. |
|
| | |
| | | Bank of America 20132014 265250 |
The following tables present information about significant unobservable inputs related to the Corporation’s material categories of Level 3 financial assets and liabilities at December 31, 20132014 and 2012.2013.
| | | | | | | | | |
| Quantitative Information about Level 3 Fair Value Measurements at December 31, 2013 | | |
| Quantitative Information about Level 3 Fair Value Measurements at December 31, 2014 | | Quantitative Information about Level 3 Fair Value Measurements at December 31, 2014 | |
| | | | | | | | |
| (Dollars in millions) | | | Inputs | | | Inputs |
| Financial Instrument | Fair Value | Valuation Technique | Significant Unobservable Inputs | Ranges of Inputs | Weighted Average | Fair Value | Valuation Technique | Significant Unobservable Inputs | Ranges of Inputs | Weighted Average |
Loans and Securities (1) | | | | | | | | | | |
| Instruments backed by residential real estate assets | $ | 3,443 |
| Discounted cash flow, Market comparables | Yield | 2% to 25% | 6 | % | $ | 2,030 |
| Discounted cash flow, Market comparables | Yield | 0% to 25% |
| 6 | % |
| Trading account assets – Mortgage trading loans and ABS | 363 |
| Prepayment speed | 0% to 35% CPR | 9 | % | 483 |
| Prepayment speed | 0% to 35% CPR |
| 14 | % |
| Loans and leases | 2,151 |
| Default rate | 1% to 20% CDR | 6 | % | 1,374 |
| Default rate | 2% to 15% CDR |
| 7 | % |
| Loans held-for-sale | 929 |
| Loss severity | 21% to 80% | 35 | % | 173 |
| Loss severity | 26% to 100% |
| 34 | % |
| Commercial loans, debt securities and other | $ | 12,135 |
| Discounted cash flow, Market comparables | Yield | 0% to 45% | 5 | % | $ | 7,203 |
| Discounted cash flow, Market comparables | Yield | 0% to 40% |
| 9 | % |
| Trading account assets – Corporate securities, trading loans and other | 3,462 |
| Enterprise value/EBITDA multiple | 0x to 24x | 7 | x | 3,224 |
| Enterprise value/EBITDA multiple | 0x to 30x |
| 6x |
|
| Trading account assets – Non-U.S. sovereign debt | 468 |
| Prepayment speed | 5% to 40% | 19 | % | 574 |
| Prepayment speed | 1% to 30% |
| 12 | % |
| Trading account assets – Mortgage trading loans and ABS | 4,268 |
| Default rate | 1% to 5% | 4 | % | 1,580 |
| Default rate | 1% to 5% |
| 4 | % |
| AFS debt securities – Other taxable securities | 3,031 |
| Loss severity | 25% to 42% | 36 | % | 1,216 |
| Loss severity | 25% to 40% |
| 38 | % |
| Loans and leases | 906 |
| Duration | 1 year to 5 years | 4 years |
| 609 |
| Duration | 0 years to 5 years |
| 3 years |
|
| | | | Price | $0 to td07 |
| $76 |
| Auction rate securities | $ | 1,719 |
| Discounted cash flow, Market comparables | Projected tender price/Refinancing level | 60% to 100% | 96 | % | $ | 1,096 |
| Discounted cash flow, Market comparables | Price | $60 to td00 |
| $95 |
| Trading account assets – Corporate securities, trading loans and other | 97 |
| | | 46 |
| | |
| AFS debt securities – Other taxable securities | 816 |
| | | | 451 |
| | |
| AFS debt securities – Tax-exempt securities | 806 |
| | | | 599 |
| | |
| Structured liabilities | | | | | | | | | | |
| Long-term debt | $ | (1,990 | ) | Industry standard derivative pricing (2, 3) | Equity correlation | 18% to 98% | 70 | % | $ | (2,362 | ) | Industry standard derivative pricing (2, 3) | Equity correlation | 20% to 98% |
| 65 | % |
| | | Long-dated volatilities | 4% to 63% | 27 | % | | Long-dated equity volatilities | 6% to 69% |
| 24 | % |
| | | Correlation (IR/IR) | 24% to 99% | 60 | % | | Long-dated volatilities (IR) | 0% to 2% |
| 1 | % |
| | | Long-dated inflation rates | 0% to 3% | 2 | % | |
| | | Long-dated inflation volatilities | 0% to 2% | 1 | % | |
| Net derivatives assets | | | | | | |
| Net derivative assets | | | | | | |
| Credit derivatives | $ | 1,008 |
| Discounted cash flow, Stochastic recovery correlation model | Yield | 3% to 25% | 14 | % | $ | 22 |
| Discounted cash flow, Stochastic recovery correlation model | Yield | 0% to 25% |
| 14 | % |
| | | Upfront points | 0 points to 100 points | 63 points |
| | Upfront points | 0 points to 100 points |
| 65 points |
|
| | | Spread to index | -1,407 bps to 1,741 bps | 91 bps |
| | Spread to index | 25 bps to 450 bps |
| 119 bps |
|
| | | Credit correlation | 14% to 99% | 47 | % | | Credit correlation | 24% to 99% |
| 51 | % |
| | | Prepayment speed | 3% to 40% CPR | 13 | % | | Prepayment speed | 3% to 20% CPR |
| 11 | % |
| | | Default rate | 1% to 5% CDR | 3 | % | | Default rate | 4% CDR |
| n/a |
|
| | | Loss severity | 20% to 42% | 35 | % | | Loss severity | 35 | % | n/a |
|
| Equity derivatives | $ | (1,596 | ) | Industry standard derivative pricing (2) | Equity correlation | 18% to 98% | 70 | % | $ | (1,560 | ) | Industry standard derivative pricing (2) | Equity correlation | 20% to 98% |
| 65 | % |
| | | Long-dated volatilities | 4% to 63% | 27 | % | | Long-dated equity volatilities | 6% to 69% |
| 24 | % |
| Commodity derivatives | $ | 6 |
| Discounted cash flow, Industry standard derivative pricing (2) | Natural gas forward price | $3/MMBtu to td1/MMBtu | $6/MMBtu |
| $ | 141 |
| Discounted cash flow, Industry standard derivative pricing (2) | Natural gas forward price | td/MMBtu to $7/MMBtu |
| $5/MMBtu |
|
| | | Correlation | 47% to 89% | 81 | % | | Correlation | 82% to 93% |
| 90 | % |
| | | Volatilities | 9% to 109% | 30 | % | | Volatilities | 16% to 98% |
| 35 | % |
| Interest rate derivatives | $ | 558 |
| Industry standard derivative pricing (3) | Correlation (IR/IR) | 24% to 99% | 60 | % | $ | 477 |
| Industry standard derivative pricing (3) | Correlation (IR/IR) | 11% to 99% |
| 55 | % |
| | | Correlation (FX/IR) | -30% to 40% | -4 | % | | Correlation (FX/IR) | -48% to 40% |
| -5 | % |
| | | Long-dated inflation rates | 0% to 3% | 2 | % | | Long-dated inflation rates | 0% to 3% |
| 1 | % |
| | | Long-dated inflation volatilities | 0% to 2% | 1 | % | | Long-dated inflation volatilities | 0% to 2% |
| 1 | % |
| | | Long-dated volatilities (FX) | 0% to 70% | 10 | % | |
| Total net derivative assets | $ | (24 | ) | | | | | $ | (920 | ) | | | | |
| |
(1) | The categories are aggregated based upon product type which differs from financial statement classification. The following is a reconciliation to the line items in the table on page 260:245: Trading account assets – Corporate securities, trading loans and other of $3.3 billion, Trading account assets – Non-U.S. sovereign debt of $574 million, Trading account assets – Mortgage trading loans and ABS of $2.1 billion, AFS debt securities – Other taxable securities of $1.7 billion, AFS debt securities – Tax-exempt securities of $599 million, Loans and leases of $2.0 billion and LHFS of $173 million. |
| |
(2) | Includes models such as Monte Carlo simulation and Black-Scholes. |
| |
(3) | Includes models such as Monte Carlo simulation, Black-Scholes and other methods that model the joint dynamics of interest, inflation and foreign exchange rates. |
CPR = Constant Prepayment Rate
CDR = Constant Default Rate
EBITDA = Earnings before interest, taxes, depreciation and amortization
MMBtu = Million British thermal units
IR = Interest Rate
FX = Foreign Exchange
n/a = not applicable
|
| | | | | | | | |
| | | | | | |
| Quantitative Information about Level 3 Fair Value Measurements at December 31, 2013 |
| | | | | |
| (Dollars in millions) | | | Inputs |
| Financial Instrument | Fair
Value | Valuation
Technique | Significant Unobservable
Inputs | Ranges of
Inputs | Weighted Average |
Loans and Securities (1) | | | | | |
| Instruments backed by residential real estate assets | $ | 3,443 |
| Discounted cash flow, Market comparables | Yield | 2% to 25% | 6 | % |
| Trading account assets – Mortgage trading loans and ABS | 363 |
| Prepayment speed | 0% to 35% CPR | 9 | % |
| Loans and leases | 2,151 |
| Default rate | 1% to 20% CDR | 6 | % |
| Loans held-for-sale | 929 |
| Loss severity | 21% to 80% | 35 | % |
| Commercial loans, debt securities and other | $ | 12,135 |
| Discounted cash flow, Market comparables | Yield | 0% to 45% | 5 | % |
| Trading account assets – Corporate securities, trading loans and other | 3,462 |
| Enterprise value/EBITDA multiple | 0x to 24x | 7x |
|
| Trading account assets – Non-U.S. sovereign debt | 468 |
| Prepayment speed | 5% to 40% | 19 | % |
| Trading account assets – Mortgage trading loans and ABS | 4,268 |
| Default rate | 1% to 5% | 4 | % |
| AFS debt securities – Other taxable securities | 3,031 |
| Loss severity | 25% to 42% | 36 | % |
| Loans and leases | 906 |
| Duration | 1 year to 5 years | 4 years |
|
| Auction rate securities | $ | 1,719 |
| Discounted cash flow, Market comparables | Projected tender price/Refinancing level | 60% to 100% | 96 | % |
| Trading account assets – Corporate securities, trading loans and other | 97 |
| | |
| AFS debt securities – Other taxable securities | 816 |
| | | |
| AFS debt securities – Tax-exempt securities | 806 |
| | | |
| Structured liabilities | | | | | |
| Long-term debt | $ | (1,990 | ) | Industry standard derivative pricing (2, 3) | Equity correlation | 18% to 98% | 70 | % |
| | | Long-dated equity volatilities | 4% to 63% | 27 | % |
| | | Long-dated volatilities (IR) | 0% to 2% | 1 | % |
| Net derivative assets | | | | | |
| Credit derivatives | $ | 808 |
| Discounted cash flow, Stochastic recovery correlation model | Yield | 3% to 25% | 14 | % |
| | | Upfront points | 0 points to 100 points | 63 points |
|
| | | Spread to index | -1,407 bps to 1,741 bps | 91 bps |
|
| | | Credit correlation | 14% to 99% | 47 | % |
| | | Prepayment speed | 3% to 40% CPR | 13 | % |
| | | Default rate | 1% to 5% CDR | 3 | % |
| | | Loss severity | 20% to 42% | 35 | % |
| Equity derivatives | $ | (1,596 | ) | Industry standard derivative pricing (2) | Equity correlation | 18% to 98% | 70 | % |
| | | Long-dated equity volatilities | 4% to 63% | 27 | % |
| Commodity derivatives | $ | 6 |
| Discounted cash flow, Industry standard derivative pricing (2) | Natural gas forward price | $3/MMBtu to $11/MMBtu | $6/MMBtu |
|
| | | Correlation | 47% to 89% | 81 | % |
| | | Volatilities | 9% to 109% | 30 | % |
| Interest rate derivatives | $ | 558 |
| Industry standard derivative pricing (3) | Correlation (IR/IR) | 24% to 99% | 60 | % |
| | | Correlation (FX/IR) | -30% to 40% | -4 | % |
| | | Long-dated inflation rates | 0% to 3% | 2 | % |
| | | Long-dated inflation volatilities | 0% to 2% | 1 | % |
| Total net derivative assets | $ | (224 | ) | | | | |
| |
(1) | The categories are aggregated based upon product type which differs from financial statement classification. The following is a reconciliation to the line items in the table on page 246: Trading account assets – Corporate securities, trading loans and other of $3.6 billion, Trading account assets – Non-U.S. sovereign debt of $468 million, Trading account assets – Mortgage trading loans and ABS of $4.6 billion, AFS debt securities – Other taxable securities of $3.8 billion, AFS debt securities – Tax-exempt securities of $806 million, Loans and leases of $3.1 billion and LHFS of $929 million. |
| |
(2) | Includes models such as Monte Carlo simulation and Black-Scholes. |
| |
(3) | Includes models such as Monte Carlo simulation, Black-Scholes and other methods that model the joint dynamics of interest, inflation and foreign exchange rates. |
CPR = Constant Prepayment Rate
CDR = Constant Default Rate
EBITDA = Earnings before interest, taxes, depreciation and amortization
MMBtu = Million British thermal units
IR = Interest Rate
FX = Foreign Exchange
|
| | | | | | | | |
| | | | | | |
| Quantitative Information about Level 3 Fair Value Measurements for Loans, Securities and Structured Liabilities at December 31, 2012 |
| | | | | |
| (Dollars in millions) | | | Inputs (1) |
| Financial Instrument | Fair
Value | Valuation
Technique | Significant Unobservable
Inputs | Ranges of
Inputs | Weighted Average |
Loans and Securities (2) | | | | | |
| Instruments backed by residential real estate assets | $ | 4,478 |
| Discounted cash flow, Market comparables | Yield | 2% to 25% | 6 | % |
| Trading account assets – Mortgage trading loans and ABS | 459 |
| Prepayment speed | 1% to 30% CPR | 10 | % |
| Loans and leases | 1,286 |
| Default rate | 0% to 44% CDR | 6 | % |
| Loans held-for-sale | 2,733 |
| Loss severity | 6% to 85% | 43 | % |
| Instruments backed by commercial real estate assets | $ | 1,910 |
| Discounted cash flow | Yield | 5% | n/a |
|
| Other assets | 1,910 |
| Loss severity | 51% to 100% | 88 | % |
| Commercial loans, debt securities and other | $ | 10,778 |
| Discounted cash flow, Market comparables | Yield | 0% to 25% | 4 | % |
| Trading account assets – Corporate securities, trading loans and other | 2,289 |
| Enterprise value/EBITDA multiple | 2x to 11x | 5 | x |
| Trading account assets – Mortgage trading loans and ABS | 4,476 |
| Prepayment speed | 5% to 30% | 20 | % |
| AFS debt securities – Other taxable securities | 3,012 |
| Default rate | 1% to 5% | 4 | % |
| Loans and leases | 1,001 |
| Loss severity | 25% to 40% | 35 | % |
| Auction rate securities | $ | 3,414 |
| Discounted cash flow, Market comparables | Discount rate | 4% to 5% | 4 | % |
| Trading account assets – Corporate securities, trading loans and other | 1,437 |
| Projected tender price/Refinancing level | 50% to 100% | 92 | % |
| AFS debt securities – Other taxable securities | 916 |
| | |
| AFS debt securities – Tax-exempt securities | 1,061 |
| | | |
| Structured liabilities | | | | | |
| Long-term debt | $ | (2,301 | ) | Industry standard derivative pricing (3) | Equity correlation | 30% to 97% | n/m |
|
| | | Long-dated volatilities | 20% to 70% | n/m |
|
|
| | | | | | |
| | | | | |
| Quantitative Information about Level 3 Fair Value Measurements for Net Derivative Assets at December 31, 2012 |
| | | | |
| (Dollars in millions) | | | Inputs (1) |
| Financial Instrument | Fair
Value | Valuation
Technique | Significant Unobservable
Inputs | Ranges of
Inputs |
| Net derivatives assets | | | | |
| Credit derivatives | $ | 2,327 |
| Discounted cash flow, Stochastic recovery correlation model | Yield | 2% to 25% |
| | | Credit spreads | 58 bps to 615 bps |
| | | Upfront points | 25 points to 99 points |
| | | Spread to index | -2,080 bps to 1,972 bps |
| | | Credit correlation | 19% to 75% |
| | | Prepayment speed | 3% to 30% CPR |
| | | Default rate | 0% to 8% CDR |
| | | Loss severity | 25% to 42% |
| Equity derivatives | $ | (1,295 | ) | Industry standard derivative pricing (3) | Equity correlation | 30% to 97% |
| | | Long-dated volatilities | 20% to 70% |
| Commodity derivatives | $ | (5 | ) | Discounted cash flow | Natural gas forward price | $3/MMBtu to $12/MMBtu |
| Interest rate derivatives | $ | 441 |
| Industry standard derivative pricing (4) | Correlation (IR/IR) | 15% to 99% |
| | | Correlation (FX/IR) | -65% to 50% |
| | | Long-dated inflation rates | 2% to 3% |
| | | Long--dated inflation volatilities | 0% to 1% |
| | | Long-dated volatilities (FX) | 5% to 36% |
| | | Long-dated swap rates | 8% to 10% |
| Total net derivative assets | $ | 1,468 |
| | | |
| |
(1)
| At December 31, 2012, weighted averages were disclosed for all loans and securities. For more information on the ranges of inputs for significant unobservable inputs for structured liabilities and net derivative assets, see the qualitative discussion on page 268. |
| |
(2)
| The categories are aggregated based upon product type which differs from financial statement classification. The following is a reconciliation to the line items in the table on page 261: Trading account assets – Corporate securities, trading loans and other of $3.7 billion, Trading account assets – Mortgage trading loans and ABS of $4.9 billion, AFS debt securities – Other taxable securities of $3.9 billion, AFS debt securities – Tax-exempt securities of $1.1 billion, Loans and leases of $2.3 billion, LHFS of $2.7 billion and Other assets of $1.9 billion. |
| |
(3)
| Includes models such as Monte Carlo simulation and Black-Scholes. |
| |
(4)
| Includes models such as Monte Carlo simulation, Black-Scholes and other methods that model the joint dynamics of interest, inflation and foreign exchange rates. |
n/a = not applicable
n/m = not meaningful
CPR = Constant Prepayment Rate
CDR = Constant Default Rate
EBITDA = Earnings before interest, taxes, depreciation and amortization
MMBtu = Million British thermal units
IR = Interest Rate
FX = Foreign Exchange
|
| | |
| | | Bank of America 20132014 267252 |
In the tables above, instruments backed by residential and commercial real estate assets include RMBS, CMBS, whole loans and mortgage CDOs and net monoline exposure.CDOs. Commercial loans, debt securities and other includesinclude corporate CLOs and CDOs, commercial loans and bonds, and securities backed by non-real estate assets. Structured liabilities primarily include equity-linked notes that are accounted for under the fair value option.
In addition to the instruments in the tables above, the Corporation held $767$347 million and $1.2 billion$767 million of instruments at December 31, 20132014 and 20122013 consisting primarily of certain direct private equity investments and private equity funds that were classified as Level 3 and reported within other assets. Valuations of direct private equity investments are based on the most recent company financial information. Inputs generally include market and acquisition comparables, entry level multiples, as well as other variables. The Corporation selects a valuation methodology (e.g., market comparables) for each investment and, in certain instances, multiple inputs are weighted to derive the most representative value. Discounts are applied as appropriate to consider the lack of liquidity and marketability versus publicly-traded companies. For private equity funds, fair value is determined using the net asset value as provided by the individual fund’s general partner.
The Corporation uses multiple market approaches in valuing certain of its Level 3 financial instruments. For example, market comparables and discounted cash flows are used together. For a given product, such as corporate debt securities, market comparables may be used to estimate some of the unobservable inputs and then these inputs are incorporated into a discounted cash flow model. Therefore, the balances disclosed encompass both of these techniques.
The level of aggregation and diversity within the products disclosed in the tables result in certain ranges of inputs being wide and unevenly distributed across asset and liability categories. At December 31, 2014 and 2013, weighted averages are disclosed for all loans, securities, structured liabilities and net derivative assets. At December 31, 2012, weighted averages were disclosed for all loans and securities.
For credit derivatives, the range of credit spreads represented positions with varying levels of default risk to the underlying instruments. The lower end of the credit spread range typically
represented shorter-dated instruments and those with better perceived credit risk. The higher end of the range represented longer-dated instruments and those referencing debt issuances that were more likely to be impaired or nonperforming. At December 31, 2012, the majority of inputs were concentrated in the lower end of the range. Similarly, the spread to index could vary significantly based on the risk of the instrument. The spread will be positive for instruments that have a higher risk of default than the index (which is based on a weighted average of its components) and negative for instruments that have a lower risk of default than the index. At December 31, 2012, inputs were distributed evenly throughout the range for spread to index. In addition, for yield and credit correlation, the majority of the inputs were concentrated in the center of the range. Inputs were concentrated in the middle to lower end of the range for upfront points. The range for loss severity reflected exposures that were concentrated in the middle to upper end of the range while the ranges for prepayment speed and default rates reflected exposures that were concentrated in the lower end of the range.
For equity derivatives at December 31, 2012, including those embedded in long-term debt, the range for equity correlation represented exposure primarily concentrated toward the upper end of the range. The range for long-dated volatilities represented exposure primarily concentrated toward the lower end of the range.
For interest rate derivatives, the diversity in the portfolio was reflected in wide ranges of inputs because the variety of currencies and tenors of the transactions required the use of numerous foreign exchange and interest rate curves. Since foreign exchange and interest rate correlations were measured between curves and across the various tenors on the same curve, the range of potential values could include both negative and positive values. For the correlation (IR/IR) range, the exposure represented the valuation of interest rate correlations on less liquid pairings and was concentrated at the upper end of the range at December 31, 2012. For the correlation (FX/IR) range, the exposure was the sensitivity to a broad mix of interest rate and foreign exchange correlations and was distributed evenly throughout the range at December 31, 2012. For long-dated inflation rates and volatilities as well as long-dated volatilities (FX), the inputs were concentrated in the middle of the range.
For more information on the inputs and techniques used in the valuation of MSRs, see Note 23 – Mortgage Servicing Rights.
Sensitivity of Fair Value Measurements to Changes in Unobservable Inputs
Loans and Securities
For instruments backed by residential real estate assets commercial real estate assets, and commercial loans, debt securities and other, a significant increase
in market yields, default rates, loss severities or duration would result in a significantly lower fair value for long positions. Short positions would be impacted in a directionally opposite way. The impact of changes in prepayment speeds would have differing impacts depending on the seniority of the instrument and, in the case of CLOs, whether prepayments can be reinvested.
For closed-end auction rate securities, (ARS), a significant increase in discount rates would result in a significantly lower fair value. For student loan and municipal ARS, a significant increase inprice and/or projected tender price/refinancing levels would result in a significantly higher fair value.
Loans and Loan Commitments
The fair values of loans and loan commitments are based on market prices, where available, or discounted cash flow analyses using market-based credit spreads of comparable debt instruments or credit derivatives of the specific borrower or comparable borrowers. Results of discounted cash flow analyses may be adjusted, as appropriate, to reflect other market conditions or the perceived credit risk of the borrower.
Mortgage Servicing Rights
The fair values of MSRs are determined using models that rely on estimates of prepayment rates, the resultant weighted-average lives of the MSRs and the option-adjusted spread levels. For more information on MSRs, see Note 23 – Mortgage Servicing Rights.
Loans Held-for-sale
The fair values of LHFS are based on quoted market prices, where available, or are determined by discounting estimated cash flows using interest rates approximating the Corporation’s current origination rates for similar loans adjusted to reflect the inherent credit risk. The borrower-specific credit risk is embedded within the quoted market prices or is implied by considering loan performance when selecting comparables.
Private Equity Investments
Private equity investments consist of direct investments and fund investments which are initially valued at their transaction price. Thereafter, the fair value of direct investments is based on an assessment of each individual investment using methodologies that include publicly-traded comparables derived by multiplying a key performance metric (e.g., earnings before interest, taxes, depreciation and amortization) of the portfolio company by the relevant valuation multiple observed for comparable companies, acquisition comparables, entry level multiples and discounted cash flow analyses, and are subject to appropriate discounts for lack of liquidity or marketability. After initial recognition, the fair value of fund investments is based on the Corporation’s proportionate interest in the fund’s capital as reported by the respective fund managers.
Short-term Borrowings and Long-term Debt
The Corporation issues structured liabilities that have coupons or repayment terms linked to the performance of debt or equity securities, indices, currencies or commodities. The fair values of these structured liabilities are estimated using quantitative models for the combined derivative and debt portions of the notes. These models incorporate observable and, in some instances, unobservable inputs including security prices, interest rate yield curves, option volatility, currency, commodity or equity rates and correlations among these inputs. The Corporation also considers the impact of its own credit spreads in determining the discount rate used to value these liabilities. The credit spread is determined by reference to observable spreads in the secondary bond market.
Securities Financing Agreements
The fair values of certain reverse repurchase agreements, repurchase agreements and securities borrowed transactions are determined using quantitative models, including discounted cash flow models that require the use of multiple market inputs including interest rates and spreads to generate continuous yield or pricing curves, and volatility factors. The majority of market inputs are actively quoted and can be validated through external sources, including brokers, market transactions and third-party pricing services.
Deposits
The fair values of deposits are determined using quantitative models, including discounted cash flow models that require the use of multiple market inputs including interest rates and spreads to generate continuous yield or pricing curves, and volatility factors. The majority of market inputs are actively quoted and can be validated through external sources, including brokers, market transactions and third-party pricing services. The Corporation considers the impact of its own credit spreads in the valuation of these liabilities. The credit risk is determined by reference to observable credit spreads in the secondary cash market.
Asset-backed Secured Financings
The fair values of asset-backed secured financings are based on external broker bids, where available, or are determined by discounting estimated cash flows using interest rates approximating the Corporation’s current origination rates for similar loans adjusted to reflect the inherent credit risk.
Recurring Fair Value
Assets and liabilities carried at fair value on a recurring basis at December 31, 2014 and 2013, including financial instruments which the Corporation accounts for under the fair value option, are summarized in the following tables.
|
| | | | | | | | | | | | | | | | | | | |
| | | | | | | | | | |
| | December 31, 2014 |
| | Fair Value Measurements | | | | �� |
| (Dollars in millions) | Level 1 | | Level 2 | | Level 3 | | Netting Adjustments (1) | | Assets/Liabilities at Fair Value |
| Assets | |
| | |
| | |
| | |
| | |
|
| Federal funds sold and securities borrowed or purchased under agreements to resell | $ | — |
| | $ | 62,182 |
| | $ | — |
| | $ | — |
| | $ | 62,182 |
|
| Trading account assets: | |
| | |
| | |
| | |
| | |
|
U.S. government and agency securities (2) | 33,470 |
| | 17,549 |
| | — |
| | — |
| | 51,019 |
|
| Corporate securities, trading loans and other | 243 |
| | 31,699 |
| | 3,270 |
| | — |
| | 35,212 |
|
| Equity securities | 33,518 |
| | 22,488 |
| | 352 |
| | — |
| | 56,358 |
|
| Non-U.S. sovereign debt | 20,348 |
| | 15,332 |
| | 574 |
| | — |
| | 36,254 |
|
| Mortgage trading loans and ABS | — |
| | 10,879 |
| | 2,063 |
| | — |
| | 12,942 |
|
| Total trading account assets | 87,579 |
| | 97,947 |
| | 6,259 |
| | — |
| | 191,785 |
|
Derivative assets (3) | 4,957 |
| | 972,977 |
| | 6,851 |
| | (932,103 | ) | | 52,682 |
|
| AFS debt securities: | |
| | |
| | |
| | |
| | |
|
| U.S. Treasury and agency securities | 67,413 |
| | 2,182 |
| | — |
| | — |
| | 69,595 |
|
| Mortgage-backed securities: | |
| | |
| | |
| | |
| | |
|
| Agency | — |
| | 165,039 |
| | — |
| | — |
| | 165,039 |
|
| Agency-collateralized mortgage obligations | — |
| | 14,248 |
| | — |
| | — |
| | 14,248 |
|
| Non-agency residential | — |
| | 4,175 |
| | 279 |
| | — |
| | 4,454 |
|
| Commercial | — |
| | 4,000 |
| | — |
| | — |
| | 4,000 |
|
| Non-U.S. securities | 3,191 |
| | 3,029 |
| | 10 |
| | — |
| | 6,230 |
|
| Corporate/Agency bonds | — |
| | 368 |
| | — |
| | — |
| | 368 |
|
| Other taxable securities | 20 |
| | 9,104 |
| | 1,667 |
| | — |
| | 10,791 |
|
| Tax-exempt securities | — |
| | 8,950 |
| | 599 |
| | — |
| | 9,549 |
|
| Total AFS debt securities | 70,624 |
| | 211,095 |
| | 2,555 |
| | — |
| | 284,274 |
|
| Other debt securities carried at fair value: | | | | | | | | | |
| U.S. Treasury and agency securities | 1,541 |
| | — |
| | — |
| | — |
| | 1,541 |
|
| Mortgage-backed securities: | | | | | | | | | |
| Agency | — |
| | 15,704 |
| | — |
| | — |
| | 15,704 |
|
| Non-agency residential | — |
| | 3,745 |
| | — |
| | — |
| | 3,745 |
|
| Non-U.S. securities | 13,270 |
| | 1,862 |
| | — |
| | — |
| | 15,132 |
|
| Other taxable securities | — |
| | 299 |
| | — |
| | — |
| | 299 |
|
| Total other debt securities carried at fair value | 14,811 |
| | 21,610 |
| | — |
| | — |
| | 36,421 |
|
| Loans and leases | — |
| | 6,698 |
| | 1,983 |
| | — |
| | 8,681 |
|
| Mortgage servicing rights | — |
| | — |
| | 3,530 |
| | — |
| | 3,530 |
|
| Loans held-for-sale | — |
| | 6,628 |
| | 173 |
| | — |
| | 6,801 |
|
| Other assets | 11,581 |
| | 1,381 |
| | 911 |
| | — |
| | 13,873 |
|
Total assets (4) | $ | 189,552 |
| | $ | 1,380,518 |
| | $ | 22,262 |
| | $ | (932,103 | ) | | $ | 660,229 |
|
| Liabilities | |
| | |
| | |
| | |
| | |
|
| Interest-bearing deposits in U.S. offices | $ | — |
| | $ | 1,469 |
| | $ | — |
| | $ | — |
| | $ | 1,469 |
|
| Federal funds purchased and securities loaned or sold under agreements to repurchase | — |
| | 35,357 |
| | — |
| | — |
| | 35,357 |
|
| Trading account liabilities: | |
| | |
| | |
| | |
| | |
| U.S. government and agency securities | 18,514 |
| | 446 |
| | — |
| | — |
| | 18,960 |
|
| Equity securities | 24,679 |
| | 3,670 |
| | — |
| | — |
| | 28,349 |
|
| Non-U.S. sovereign debt | 16,089 |
| | 3,625 |
| | — |
| | — |
| | 19,714 |
|
| Corporate securities and other | 189 |
| | 6,944 |
| | 36 |
| | — |
| | 7,169 |
|
| Total trading account liabilities | 59,471 |
| | 14,685 |
| | 36 |
| | — |
| | 74,192 |
|
Derivative liabilities (3) | 4,493 |
| | 969,502 |
| | 7,771 |
| | (934,857 | ) | | 46,909 |
|
| Short-term borrowings | — |
| | 2,697 |
| | — |
| | — |
| | 2,697 |
|
| Accrued expenses and other liabilities | 10,795 |
| | 1,250 |
| | 10 |
| | — |
| | 12,055 |
|
| Long-term debt | — |
| | 34,042 |
| | 2,362 |
| | — |
| | 36,404 |
|
Total liabilities (4) | $ | 74,759 |
| | $ | 1,059,002 |
| | $ | 10,179 |
| | $ | (934,857 | ) | | $ | 209,083 |
|
| |
(1) | Amounts represent the impact of legally enforceable master netting agreements and also cash collateral held or placed with the same counterparties. |
| |
(2) | Includes $17.2 billion of government-sponsored enterprise obligations. |
| |
(3) | For further disaggregation of derivative assets and liabilities, see Note 2 – Derivatives. |
| |
(4) | During 2014, the Corporation reclassified certain assets and liabilities within its fair value hierarchy based on a review of its inputs used to measure fair value. Accordingly, approximately $4.1 billion of assets related to U.S. government and agency securities, non-U.S. government securities and equity derivatives, and $570 million of liabilities related to equity derivatives were transferred from Level 1 to Level 2. |
|
| | | | | | | | | | | | | | | | | | | |
| | | | | | | | | | |
| | December 31, 2013 |
| | Fair Value Measurements | | | | |
| (Dollars in millions) | Level 1 | | Level 2 | | Level 3 | | Netting Adjustments (1) | | Assets/Liabilities at Fair Value |
| Assets | |
| | |
| | |
| | |
| | |
|
| Federal funds sold and securities borrowed or purchased under agreements to resell | $ | — |
| | $ | 68,656 |
| | $ | — |
| | $ | — |
| | $ | 68,656 |
|
| Trading account assets: | |
| | |
| | |
| | |
| | |
|
U.S. government and agency securities (2) | 34,222 |
| | 14,625 |
| | — |
| | — |
| | 48,847 |
|
| Corporate securities, trading loans and other | 1,147 |
| | 27,746 |
| | 3,559 |
| | — |
| | 32,452 |
|
| Equity securities | 41,324 |
| | 22,741 |
| | 386 |
| | — |
| | 64,451 |
|
| Non-U.S. sovereign debt | 24,357 |
| | 12,399 |
| | 468 |
| | — |
| | 37,224 |
|
| Mortgage trading loans and ABS | — |
| | 13,388 |
| | 4,631 |
| | — |
| | 18,019 |
|
| Total trading account assets | 101,050 |
| | 90,899 |
| | 9,044 |
| | — |
| | 200,993 |
|
Derivative assets (3) | 2,374 |
| | 910,602 |
| | 7,277 |
| | (872,758 | ) | | 47,495 |
|
| AFS debt securities: | |
| | |
| | |
| | |
| | |
|
| U.S. Treasury and agency securities | 6,591 |
| | 2,363 |
| | — |
| | — |
| | 8,954 |
|
| Mortgage-backed securities: | |
| | |
| | |
| | |
| | |
|
| Agency | — |
| | 164,935 |
| | — |
| | — |
| | 164,935 |
|
| Agency-collateralized mortgage obligations | — |
| | 22,492 |
| | — |
| | — |
| | 22,492 |
|
| Non-agency residential | — |
| | 6,239 |
| | — |
| | — |
| | 6,239 |
|
| Commercial | — |
| | 2,480 |
| | — |
| | — |
| | 2,480 |
|
| Non-U.S. securities | 3,698 |
| | 3,415 |
| | 107 |
| | — |
| | 7,220 |
|
| Corporate/Agency bonds | — |
| | 873 |
| | — |
| | — |
| | 873 |
|
| Other taxable securities | 20 |
| | 12,963 |
| | 3,847 |
| | — |
| | 16,830 |
|
| Tax-exempt securities | — |
| | 5,122 |
| | 806 |
| | — |
| | 5,928 |
|
| Total AFS debt securities | 10,309 |
| | 220,882 |
| | 4,760 |
| | — |
| | 235,951 |
|
| Other debt securities carried at fair value: | | | | | | | | | |
| U.S. Treasury and agency securities | 4,062 |
| | — |
| | — |
| | — |
| | 4,062 |
|
| Mortgage-backed securities: | | | | | | | | | |
| Agency | — |
| | 16,500 |
| | — |
| | — |
| | 16,500 |
|
| Agency-collateralized mortgage obligations | — |
| | 218 |
| | — |
| | — |
| | 218 |
|
| Commercial | — |
| | 749 |
| | — |
| | — |
| | 749 |
|
| Non-U.S. securities | 7,457 |
| | 3,858 |
| | — |
| | — |
| | 11,315 |
|
| Total other debt securities carried at fair value | 11,519 |
| | 21,325 |
| | — |
| | — |
| | 32,844 |
|
| Loans and leases | — |
| | 6,985 |
| | 3,057 |
| | — |
| | 10,042 |
|
| Mortgage servicing rights | — |
| | — |
| | 5,042 |
| | — |
| | 5,042 |
|
| Loans held-for-sale | — |
| | 5,727 |
| | 929 |
| | — |
| | 6,656 |
|
| Other assets | 14,474 |
| | 1,912 |
| | 1,669 |
| | — |
| | 18,055 |
|
Total assets (4) | $ | 139,726 |
| | $ | 1,326,988 |
| | $ | 31,778 |
| | $ | (872,758 | ) | | $ | 625,734 |
|
| Liabilities | |
| | |
| | |
| | |
| | |
|
| Interest-bearing deposits in U.S. offices | $ | — |
| | $ | 1,899 |
| | $ | — |
| | $ | — |
| | $ | 1,899 |
|
| Federal funds purchased and securities loaned or sold under agreements to repurchase | — |
| | 26,500 |
| | — |
| | — |
| | 26,500 |
|
| Trading account liabilities: | |
| | |
| | |
| | |
| | |
| U.S. government and agency securities | 26,915 |
| | 348 |
| | — |
| | — |
| | 27,263 |
|
| Equity securities | 23,874 |
| | 3,711 |
| | — |
| | — |
| | 27,585 |
|
| Non-U.S. sovereign debt | 20,755 |
| | 1,387 |
| | — |
| | — |
| | 22,142 |
|
| Corporate securities and other | 518 |
| | 5,926 |
| | 35 |
| | — |
| | 6,479 |
|
| Total trading account liabilities | 72,062 |
| | 11,372 |
| | 35 |
| | — |
| | 83,469 |
|
Derivative liabilities (3) | 1,968 |
| | 896,907 |
| | 7,501 |
| | (868,969 | ) | | 37,407 |
|
| Short-term borrowings | — |
| | 1,520 |
| | — |
| | — |
| | 1,520 |
|
| Accrued expenses and other liabilities | 10,130 |
| | 1,093 |
| | 10 |
| | — |
| | 11,233 |
|
| Long-term debt | — |
| | 45,045 |
| | 1,990 |
| | — |
| | 47,035 |
|
Total liabilities (4) | $ | 84,160 |
| | $ | 984,336 |
| | $ | 9,536 |
| | $ | (868,969 | ) | | $ | 209,063 |
|
| |
(1) | Amounts represent the impact of legally enforceable master netting agreements and also cash collateral held or placed with the same counterparties. |
| |
(2) | Includes $15.6 billion of government-sponsored enterprise obligations. |
| |
(3) | For further disaggregation of derivative assets and liabilities, see Note 2 – Derivatives. |
| |
(4) | During 2013, $500 million of other assets were transferred from Level 1 to Level 2 primarily due to a restriction that became effective for a private equity investment that was subsequently sold once the restriction was lifted. |
The following tables present a reconciliation of all assets and liabilities measured at fair value on a recurring basis using significant unobservable inputs (Level 3) during 2014, 2013 and 2012, including net realized and unrealized gains (losses) included in earnings and accumulated OCI.
|
| | | | | | | | | | | | | | | | | | | | | | | | | | | | | | |
| | | | | | | | | | | |
Level 3 – Fair Value Measurements (1) | | | | | | | |
| | | | | | | | | | | |
| | 2014 |
| | | | | Gross | | | |
| (Dollars in millions) | Balance January 1 2014 | Gains
(Losses)
in Earnings | Gains
(Losses)
in OCI | Purchases | Sales | Issuances | Settlements | Gross
Transfers
into Level 3 | Gross
Transfers
out of Level 3 | Balance
December 31
2014 |
| Trading account assets: | |
| |
| |
| |
| | | | |
| |
| |
|
| U.S. government and agency securities | $ | — |
| $ | — |
| $ | — |
| $ | 87 |
| $ | (87 | ) | $ | — |
| $ | — |
| $ | — |
| $ | — |
| $ | — |
|
| Corporate securities, trading loans and other | 3,559 |
| 180 |
| — |
| 1,675 |
| (857 | ) | — |
| (938 | ) | 1,275 |
| (1,624 | ) | 3,270 |
|
| Equity securities | 386 |
| — |
| — |
| 104 |
| (86 | ) | — |
| (16 | ) | 146 |
| (182 | ) | 352 |
|
| Non-U.S. sovereign debt | 468 |
| 30 |
| — |
| 120 |
| (34 | ) | — |
| (19 | ) | 11 |
| (2 | ) | 574 |
|
| Mortgage trading loans and ABS | 4,631 |
| 199 |
| — |
| 1,643 |
| (1,259 | ) | — |
| (585 | ) | 39 |
| (2,605 | ) | 2,063 |
|
| Total trading account assets | 9,044 |
| 409 |
| — |
| 3,629 |
| (2,323 | ) | — |
| (1,558 | ) | 1,471 |
| (4,413 | ) | 6,259 |
|
Net derivative assets (2) | (224 | ) | 463 |
| — |
| 823 |
| (1,738 | ) | — |
| (432 | ) | 28 |
| 160 |
| (920 | ) |
| AFS debt securities: | |
| |
| |
| |
| |
| |
| |
| |
| |
| |
|
| Non-agency residential MBS | — |
| (2 | ) | — |
| 11 |
| — |
| — |
| — |
| 270 |
| — |
| 279 |
|
| Non-U.S. securities | 107 |
| (7 | ) | (11 | ) | 241 |
| — |
| — |
| (147 | ) | — |
| (173 | ) | 10 |
|
| Corporate/Agency bonds | — |
| — |
| — |
| — |
| — |
| — |
| — |
| 93 |
| (93 | ) | — |
|
| Other taxable securities | 3,847 |
| 9 |
| (8 | ) | 154 |
| — |
| — |
| (1,381 | ) | — |
| (954 | ) | 1,667 |
|
| Tax-exempt securities | 806 |
| 8 |
| — |
| — |
| (16 | ) | — |
| (235 | ) | 36 |
| — |
| 599 |
|
| Total AFS debt securities | 4,760 |
| 8 |
| (19 | ) | 406 |
| (16 | ) | — |
| (1,763 | ) | 399 |
| (1,220 | ) | 2,555 |
|
Loans and leases (3, 4) | 3,057 |
| 69 |
| — |
| — |
| (3 | ) | 699 |
| (1,591 | ) | 25 |
| (273 | ) | 1,983 |
|
Mortgage servicing rights (4) | 5,042 |
| (1,231 | ) | — |
| — |
| (61 | ) | 707 |
| (927 | ) | — |
| — |
| 3,530 |
|
Loans held-for-sale (3) | 929 |
| 45 |
| — |
| 59 |
| (725 | ) | 23 |
| (216 | ) | 83 |
| (25 | ) | 173 |
|
Other assets (5) | 1,669 |
| (98 | ) | — |
| — |
| (430 | ) | — |
| (245 | ) | 39 |
| (24 | ) | 911 |
|
| Trading account liabilities – Corporate securities and other | (35 | ) | 1 |
| — |
| 10 |
| (13 | ) | — |
| — |
| (9 | ) | 10 |
| (36 | ) |
Accrued expenses and other liabilities (3) | (10 | ) | 2 |
| — |
| — |
| — |
| (3 | ) | — |
| — |
| 1 |
| (10 | ) |
Long-term debt (3) | (1,990 | ) | 49 |
| — |
| 169 |
| — |
| (615 | ) | 540 |
| (1,581 | ) | 1,066 |
| (2,362 | ) |
| |
(1) | Assets (liabilities). For assets, increase (decrease) to Level 3 and for liabilities, (increase) decrease to Level 3. |
| |
(2) | Net derivatives include derivative assets of $6.9 billion and derivative liabilities of $7.8 billion. |
| |
(3) | Amounts represent instruments that are accounted for under the fair value option. |
| |
(4) | Issuances represent loan originations and mortgage servicing rights retained following securitizations or whole-loan sales. |
| |
(5) | Other assets is primarily comprised of private equity investments and certain long-term fixed-rate margin loans that are accounted for under the fair value option. |
During 2014, the transfers into Level 3 included $1.5 billion of trading account assets, $399 million of AFS debt securities and $1.6 billion of long-term debt. Transfers into Level 3 for trading account assets were primarily the result of decreased availability of third-party prices for certain corporate loans and securities. Transfers into Level 3 for AFS debt securities were primarily due to decreased price observability related to municipal auction rate securities (ARS). Transfers into Level 3 for long-term debt were primarily due to changes in the impact of unobservable inputs on the value of certain structured liabilities. Transfers occur on a regular basis for these long-term debt instruments due to changes in the impact of unobservable inputs on the value of the embedded derivative in relation to the instrument as a whole.
During 2014, the transfers out of Level 3 included $4.4 billion of trading account assets, $160 million of net derivative assets, $1.2 billion of AFS debt securities, $273 million of loans and leases and $1.1 billion of long-term debt. Transfers out of Level 3 for trading account assets were primarily the result of increased market liquidity and price observability on certain CLOs. Transfers out of Level 3 for net derivative assets were primarily due to increased price observability for certain equity derivatives. Transfers out of Level 3 for AFS debt securities were primarily due to increased price observability on certain CLOs. Transfers out of Level 3 for loans and leases were primarily due to increased price observability. Transfers out of Level 3 for long-term debt were primarily due to changes in the impact of unobservable inputs on the value of certain structured liabilities.
|
| | | | | | | | | | | | | | | | | | | | | | | | | | | | | | |
| | | | | | | | | | | |
Level 3 – Fair Value Measurements (1) | | | | | | | |
| | | | | | | | | | | |
| | 2013 |
| | | | | Gross | | | |
| (Dollars in millions) | Balance
January 1 2013 | Gains
(Losses)
in Earnings | Gains
(Losses)
in OCI | Purchases | Sales | Issuances | Settlements | Gross
Transfers
into Level 3 | Gross
Transfers
out of Level 3 | Balance
December 31 2013 |
| Trading account assets: | |
| |
| |
| | | | |
| | |
| |
|
| Corporate securities, trading loans and other | $ | 3,726 |
| $ | 242 |
| $ | — |
| $ | 3,848 |
| $ | (3,110 | ) | $ | 59 |
| $ | (651 | ) | $ | 890 |
| $ | (1,445 | ) | $ | 3,559 |
|
| Equity securities | 545 |
| 74 |
| — |
| 96 |
| (175 | ) | — |
| (100 | ) | 70 |
| (124 | ) | 386 |
|
| Non-U.S. sovereign debt | 353 |
| 50 |
| — |
| 122 |
| (18 | ) | — |
| (36 | ) | 2 |
| (5 | ) | 468 |
|
| Mortgage trading loans and ABS | 4,935 |
| 53 |
| — |
| 2,514 |
| (1,993 | ) | — |
| (868 | ) | 20 |
| (30 | ) | 4,631 |
|
| Total trading account assets | 9,559 |
| 419 |
| — |
| 6,580 |
| (5,296 | ) | 59 |
| (1,655 | ) | 982 |
| (1,604 | ) | 9,044 |
|
Net derivative assets (2) | 1,468 |
| (304 | ) | — |
| 824 |
| (1,467 | ) | — |
| (1,362 | ) | (10 | ) | 627 |
| (224 | ) |
| AFS debt securities: | |
| |
| |
| | | | |
| |
| |
| |
|
| Commercial MBS | 10 |
| — |
| — |
| — |
| — |
| — |
| (10 | ) | — |
| — |
| — |
|
| Non-U.S. securities | — |
| 5 |
| 2 |
| 1 |
| (1 | ) | — |
| — |
| 100 |
| — |
| 107 |
|
| Corporate/Agency bonds | 92 |
| — |
| 4 |
| — |
| — |
| — |
| — |
| — |
| (96 | ) | — |
|
| Other taxable securities | 3,928 |
| 9 |
| 15 |
| 1,055 |
| — |
| — |
| (1,155 | ) | — |
| (5 | ) | 3,847 |
|
| Tax-exempt securities | 1,061 |
| 3 |
| 19 |
| — |
| — |
| — |
| (109 | ) | — |
| (168 | ) | 806 |
|
| Total AFS debt securities | 5,091 |
| 17 |
| 40 |
| 1,056 |
| (1 | ) | — |
| (1,274 | ) | 100 |
| (269 | ) | 4,760 |
|
Loans and leases (3, 4) | 2,287 |
| 98 |
| — |
| 310 |
| (128 | ) | 1,252 |
| (757 | ) | 19 |
| (24 | ) | 3,057 |
|
Mortgage servicing rights (4) | 5,716 |
| 1,941 |
| — |
| — |
| (2,044 | ) | 472 |
| (1,043 | ) | — |
| — |
| 5,042 |
|
Loans held-for-sale (3) | 2,733 |
| 62 |
| — |
| 8 |
| (402 | ) | 4 |
| (1,507 | ) | 34 |
| (3 | ) | 929 |
|
Other assets (5) | 3,129 |
| (288 | ) | — |
| 46 |
| (383 | ) | — |
| (1,019 | ) | 239 |
| (55 | ) | 1,669 |
|
| Trading account liabilities – Corporate securities and other | (64 | ) | 10 |
| — |
| 43 |
| (54 | ) | (5 | ) | — |
| (9 | ) | 44 |
| (35 | ) |
Accrued expenses and other liabilities (3) | (15 | ) | 30 |
| — |
| — |
| — |
| (751 | ) | 724 |
| (1 | ) | 3 |
| (10 | ) |
Long-term debt (3) | (2,301 | ) | 13 |
| — |
| 358 |
| (4 | ) | (172 | ) | 258 |
| (1,331 | ) | 1,189 |
| (1,990 | ) |
| |
(1) | Assets (liabilities). For assets, increase (decrease) to Level 3 and for liabilities, (increase) decrease to Level 3. |
| |
(2) | Net derivatives include derivative assets of $7.3 billion and derivative liabilities of $7.5 billion. |
| |
(3) | Amounts represent instruments that are accounted for under the fair value option. |
| |
(4) | Issuances represent loan originations and mortgage servicing rights retained following securitizations or whole-loan sales. |
| |
(5) | Other assets is primarily comprised of private equity investments and certain long-term fixed-rate margin loans that are accounted for under the fair value option. |
During 2013, the transfers into Level 3 included $982 million of trading account assets, $100 million of AFS debt securities, $239 million of other assets and $1.3 billion of long-term debt. Transfers into Level 3 for trading account assets were primarily the result of decreased third-party prices available for certain corporate loans and securities. Transfers into Level 3 for AFS debt securities were primarily due to decreased price observability. Transfers into Level 3 for other assets were primarily due to a lack of independent pricing data for certain receivables. Transfers into Level 3 for long-term debt were primarily due to changes in the impact of unobservable inputs on the value of certain structured liabilities. Transfers occur on a regular basis for these long-term debt instruments due to changes in the impact of unobservable inputs on the value of the embedded derivative in relation to the instrument as a whole.
During 2013, the transfers out of Level 3 included $1.6 billion of trading account assets, $627 million of net derivative assets, $269 million of AFS debt securities and $1.2 billion of long-term debt. Transfers out of Level 3 for trading account assets were primarily the result of increased market liquidity and third-party prices available for certain corporate loans and securities. Transfers out of Level 3 for net derivative assets were primarily due to increased price observability (i.e., market comparables for the referenced instruments) for certain options. Transfers out of Level 3 for AFS debt securities were primarily due to increased market liquidity. Transfers out of Level 3 for long-term debt were primarily due to changes in the impact of unobservable inputs on the value of certain structured liabilities.
|
| | | | | | | | | | | | | | | | | | | | | | | | | | | | | | |
| | | | | | | | | | | |
Level 3 – Fair Value Measurements (1) | | | | | | | | |
| | | | | | | | | | | |
| | 2012 |
| | | | | Gross | | | |
| (Dollars in millions) | Balance
January 1 2012 | Gains
(Losses) in Earnings | Gains
(Losses) in OCI | Purchases | Sales | Issuances | Settlements | Gross Transfers into Level 3 | Gross Transfers
out of Level 3 | Balance
December 31 2012 |
| Trading account assets: | | | | | | | | | | |
Corporate securities, trading loans and other (2) | $ | 6,880 |
| $ | 195 |
| $ | — |
| $ | 2,798 |
| $ | (4,556 | ) | $ | — |
| $ | (1,077 | ) | $ | 436 |
| $ | (950 | ) | $ | 3,726 |
|
| Equity securities | 544 |
| 31 |
| — |
| 201 |
| (271 | ) | — |
| 27 |
| 90 |
| (77 | ) | 545 |
|
| Non-U.S. sovereign debt | 342 |
| 8 |
| — |
| 388 |
| (359 | ) | — |
| (5 | ) | — |
| (21 | ) | 353 |
|
Mortgage trading loans and ABS (2) | 3,689 |
| 215 |
| — |
| 2,574 |
| (1,536 | ) | — |
| (678 | ) | 844 |
| (173 | ) | 4,935 |
|
| Total trading account assets | 11,455 |
| 449 |
| — |
| 5,961 |
| (6,722 | ) | — |
| (1,733 | ) | 1,370 |
| (1,221 | ) | 9,559 |
|
Net derivative assets (3) | 5,866 |
| (221 | ) | — |
| 893 |
| (1,012 | ) | — |
| (3,328 | ) | (269 | ) | (461 | ) | 1,468 |
|
| AFS debt securities: | |
| |
| |
| |
| | | | | | |
|
| Mortgage-backed securities: | |
| |
| |
| |
| | | | | |
| |
|
| Agency | 37 |
| — |
| — |
| — |
| — |
| — |
| (4 | ) | — |
| (33 | ) | — |
|
| Non-agency residential | 860 |
| (69 | ) | 19 |
| — |
| (306 | ) | — |
| (2 | ) | — |
| (502 | ) | — |
|
| Non-agency commercial | 40 |
| — |
| — |
| — |
| (24 | ) | — |
| (6 | ) | — |
| — |
| 10 |
|
| Corporate/Agency bonds | 162 |
| (2 | ) | — |
| (2 | ) | — |
| — |
| (39 | ) | — |
| (27 | ) | 92 |
|
| Other taxable securities | 4,265 |
| 23 |
| 26 |
| 3,196 |
| (28 | ) | — |
| (3,345 | ) | — |
| (209 | ) | 3,928 |
|
| Tax-exempt securities | 2,648 |
| 61 |
| 20 |
| — |
| (133 | ) | — |
| (1,535 | ) | — |
| — |
| 1,061 |
|
| Total AFS debt securities | 8,012 |
| 13 |
| 65 |
| 3,194 |
| (491 | ) | — |
| (4,931 | ) | — |
| (771 | ) | 5,091 |
|
Loans and leases (4, 5) | 2,744 |
| 334 |
| — |
| 564 |
| (1,520 | ) | — |
| (274 | ) | 450 |
| (11 | ) | 2,287 |
|
Mortgage servicing rights (5) | 7,378 |
| (430 | ) | — |
| — |
| (122 | ) | 374 |
| (1,484 | ) | — |
| — |
| 5,716 |
|
Loans held-for-sale (4) | 3,387 |
| 352 |
| — |
| 794 |
| (834 | ) | — |
| (414 | ) | 80 |
| (632 | ) | 2,733 |
|
Other assets (6) | 4,235 |
| (54 | ) | — |
| 109 |
| (1,039 | ) | 270 |
| (381 | ) | — |
| (11 | ) | 3,129 |
|
| Trading account liabilities – Corporate securities and other | (114 | ) | 4 |
| — |
| 116 |
| (136 | ) | — |
| 80 |
| (68 | ) | 54 |
| (64 | ) |
Short-term borrowings (4) | — |
| — |
| — |
| — |
| — |
| (232 | ) | 232 |
| — |
| — |
| — |
|
Accrued expenses and other liabilities (4) | (14 | ) | (4 | ) | — |
| 8 |
| — |
| (9 | ) | — |
| — |
| 4 |
| (15 | ) |
Long-term debt (4) | (2,943 | ) | (307 | ) | — |
| 290 |
| (33 | ) | (259 | ) | 1,239 |
| (2,040 | ) | 1,752 |
| (2,301 | ) |
| |
(1) | Assets (liabilities). For assets, increase (decrease) to Level 3 and for liabilities, (increase) decrease to Level 3. |
| |
(2) | During 2012, approximately $900 million was reclassified from Trading account assets – Corporate securities, trading loans and other to Trading account assets – Mortgage trading loans and ABS. In the table above, this reclassification is presented as a sale of Trading account assets – Corporate securities, trading loans and other and as a purchase of Trading account assets – Mortgage trading loans and ABS. |
| |
(3) | Net derivatives include derivative assets of $8.1 billion and derivative liabilities of $6.6 billion. |
| |
(4) | Amounts represent instruments that are accounted for under the fair value option. |
| |
(5) | Issuances represent loan originations and mortgage servicing rights retained following securitizations or whole-loan sales. |
| |
(6) | Other assets is primarily comprised of net monoline exposure to a single counterparty and private equity investments. |
During 2012, the transfers into Level 3 included $1.4 billion of trading account assets, $269 million of net derivative assets, $450 million of loans and leases and $2.0 billion of long-term debt. Transfers into Level 3 for trading account assets were primarily the result of decreased market liquidity for certain corporate loans and updated information related to certain CLOs. Transfers into Level 3 for net derivative assets were primarily related to decreased price observability for certain long-dated equity derivative liabilities due to a lack of independent pricing. Transfers into Level 3 for loans and leases were due to updated information related to certain commercial loans. Transfers into Level 3 for long-term debt were primarily due to changes in the impact of unobservable inputs on the value of certain structured liabilities. Transfers occur on a regular basis for these long-term debt instruments due to changes in the impact of unobservable inputs on the value of the embedded derivative in relation to the instrument as a whole.
During 2012, the transfers out of Level 3 included $1.2 billion of trading account assets, $461 million of net derivative assets, $771 million of AFS debt securities, $632 million of LHFS and $1.8 billion of long-term debt. Transfers out of Level 3 for trading account assets were primarily related to increased market liquidity for certain corporate and commercial real estate loans. Transfers out of Level 3 for net derivative assets were primarily related to increased price observability (i.e., market comparables for the referenced instruments) for certain total return swaps and foreign exchange swaps. Transfers out of Level 3 for AFS debt securities were primarily related to increased price observability for certain non-agency RMBS and ABS. Transfers out of Level 3 for LHFS were primarily related to increased observable inputs, primarily liquid comparables. Transfers out of Level 3 for long-term debt were primarily due to changes in the impact of unobservable inputs on the value of certain structured liabilities.
The following tables summarize gains (losses) due to changes in fair value, including both realized and unrealized gains (losses), recorded in earnings for Level 3 assets and liabilities during 2014, 2013 and 2012. These amounts include gains (losses) on loans, LHFS, loan commitments and structured liabilities that are accounted for under the fair value option.
|
| | | | | | | | | | | | | | | |
| | | | | | | | |
| Level 3 – Total Realized and Unrealized Gains (Losses) Included in Earnings |
| | | | | | | | |
| | 2014 |
| (Dollars in millions) | Trading
Account
Profits (Losses) | | Mortgage
Banking
Income (Loss) (1) | | Other (2) | | Total |
| Trading account assets: | |
| | |
| | |
| | |
|
| Corporate securities, trading loans and other | $ | 180 |
| | $ | — |
| | $ | — |
| | $ | 180 |
|
| Non-U.S. sovereign debt | 30 |
| | — |
| | — |
| | 30 |
|
| Mortgage trading loans and ABS | 199 |
| | — |
| | — |
| | 199 |
|
| Total trading account assets | 409 |
| | — |
| | — |
| | 409 |
|
| Net derivative assets | (475 | ) | | 834 |
| | 104 |
| | 463 |
|
| AFS debt securities: | |
| | |
| | |
| | |
|
| Non-agency residential MBS | — |
| | — |
| | (2 | ) | | (2 | ) |
| Non-U.S. securities | — |
| | — |
| | (7 | ) | | (7 | ) |
| Other taxable securities | — |
| | — |
| | 9 |
| | 9 |
|
| Tax-exempt securities | — |
| | — |
| | 8 |
| | 8 |
|
| Total AFS debt securities | — |
| | — |
| | 8 |
| | 8 |
|
Loans and leases (3) | — |
| | — |
| | 69 |
| | 69 |
|
| Mortgage servicing rights | (6 | ) | | (1,225 | ) | | — |
| | (1,231 | ) |
Loans held-for-sale (3) | (14 | ) | | — |
| | 59 |
| | 45 |
|
| Other assets | — |
| | (79 | ) | | (19 | ) | | (98 | ) |
| Trading account liabilities – Corporate securities and other | 1 |
| | — |
| | — |
| | 1 |
|
Accrued expenses and other liabilities (3) | — |
| | — |
| | 2 |
| | 2 |
|
Long-term debt (3) | 78 |
| | — |
| | (29 | ) | | 49 |
|
| Total | $ | (7 | ) | | $ | (470 | ) | | $ | 194 |
| | $ | (283 | ) |
| | | | | | | | |
| | 2013 |
| Trading account assets: | |
| | |
| | |
| | |
|
| Corporate securities, trading loans and other | $ | 242 |
| | $ | — |
| | $ | — |
| | $ | 242 |
|
| Equity securities | 74 |
| | — |
| | — |
| | 74 |
|
| Non-U.S. sovereign debt | 50 |
| | — |
| | — |
| | 50 |
|
| Mortgage trading loans and ABS | 53 |
| | — |
| | — |
| | 53 |
|
| Total trading account assets | 419 |
| | — |
| | — |
| | 419 |
|
| Net derivative assets | (1,224 | ) | | 927 |
| | (7 | ) | | (304 | ) |
| AFS debt securities: | |
| | |
| | |
| | |
|
| Non-U.S. securities | — |
| | — |
| | 5 |
| | 5 |
|
| Other taxable securities | — |
| | — |
| | 9 |
| | 9 |
|
| Tax-exempt securities | — |
| | — |
| | 3 |
| | 3 |
|
| Total AFS debt securities | — |
| | — |
| | 17 |
| | 17 |
|
Loans and leases (3) | — |
| | (38 | ) | | 136 |
| | 98 |
|
| Mortgage servicing rights | — |
| | 1,941 |
| | — |
| | 1,941 |
|
Loans held-for-sale (3) | — |
| | 2 |
| | 60 |
| | 62 |
|
| Other assets | — |
| | 122 |
| | (410 | ) | | (288 | ) |
| Trading account liabilities – Corporate securities and other | 10 |
| | — |
| | — |
| | 10 |
|
Accrued expenses and other liabilities (3) | — |
| | 30 |
| | — |
| | 30 |
|
Long-term debt (3) | 45 |
| | — |
| | (32 | ) | | 13 |
|
| Total | $ | (750 | ) | | $ | 2,984 |
| | $ | (236 | ) | | $ | 1,998 |
|
| |
(1) | Mortgage banking income (loss) does not reflect the impact of Level 1 and Level 2 hedges on MSRs. |
| |
(2) | Amounts included are primarily recorded in other income (loss). Equity investment gains of $86 million and $77 million recorded on net derivative assets and other assets were also included for 2014 and 2013. |
| |
(3) | Amounts represent instruments that are accounted for under the fair value option. |
|
| | | | | | | | | | | | | | | |
| | | | | | | | |
| Level 3 – Total Realized and Unrealized Gains (Losses) Included in Earnings (continued) |
| | | | | | | | |
| | 2012 |
| (Dollars in millions) | Trading
Account
Profits (Losses) | | Mortgage
Banking
Income (Loss) (1) | | Other (2) | | Total |
| Trading account assets: | |
| | |
| | |
| | |
|
| Corporate securities, trading loans and other | $ | 195 |
| | $ | — |
| | $ | — |
| | $ | 195 |
|
| Equity securities | 31 |
| | — |
| | — |
| | 31 |
|
| Non-U.S. sovereign debt | 8 |
| | — |
| | — |
| | 8 |
|
| Mortgage trading loans and ABS | 215 |
| | — |
| | — |
| | 215 |
|
| Total trading account assets | 449 |
| | — |
| | — |
| | 449 |
|
| Net derivative assets | (3,208 | ) | | 2,987 |
| | — |
| | (221 | ) |
| AFS debt securities: | |
| | |
| | |
| | |
|
| Non-agency residential MBS | — |
| | — |
| | (69 | ) | | (69 | ) |
| Corporate/Agency bonds | — |
| | — |
| | (2 | ) | | (2 | ) |
| Other taxable securities | 2 |
| | — |
| | 21 |
| | 23 |
|
| Tax-exempt securities | — |
| | — |
| | 61 |
| | 61 |
|
| Total AFS debt securities | 2 |
| | — |
| | 11 |
| | 13 |
|
Loans and leases (3) | — |
| | — |
| | 334 |
| | 334 |
|
| Mortgage servicing rights | — |
| | (430 | ) | | — |
| | (430 | ) |
Loans held-for-sale (3) | — |
| | 148 |
| | 204 |
| | 352 |
|
| Other assets | — |
| | (74 | ) | | 20 |
| | (54 | ) |
| Trading account liabilities – Corporate securities and other | 4 |
| | — |
| | — |
| | 4 |
|
Accrued expenses and other liabilities (3) | — |
| | — |
| | (4 | ) | | (4 | ) |
Long-term debt (3) | (133 | ) | | — |
| | (174 | ) | | (307 | ) |
| Total | $ | (2,886 | ) | | $ | 2,631 |
| | $ | 391 |
| | $ | 136 |
|
| |
(1) | Mortgage banking income (loss) does not reflect the impact of Level 1 and Level 2 hedges on MSRs. |
| |
(2) | Amounts included are primarily recorded in other income (loss). Equity investment gains of $97 million recorded on other assets were also included for 2012. |
| |
(3) | Amounts represent instruments that are accounted for under the fair value option. |
The table below summarizes changes in unrealized gains (losses) recorded in earnings during 2014, 2013 and 2012 for Level 3 assets and liabilities that were still held at December 31, 2014, 2013 and 2012. These amounts include changes in fair value on loans, LHFS, loan commitments and structured liabilities that are accounted for under the fair value option.
|
| | | | | | | | | | | | | | | |
| | | | | | | | |
| Level 3 – Changes in Unrealized Gains (Losses) Relating to Assets and Liabilities Still Held at Reporting Date |
| | | | | | | | |
| | 2014 |
| (Dollars in millions) | Trading
Account
Profits (Losses) | | Mortgage
Banking
Income (Loss) (1) | | Other (2) | | Total |
| Trading account assets: | |
| | |
| | |
| | |
|
| Corporate securities, trading loans and other | $ | 69 |
| | $ | — |
| | $ | — |
| | $ | 69 |
|
| Equity securities | (8 | ) | | — |
| | — |
| | (8 | ) |
| Non-U.S. sovereign debt | 31 |
| | — |
| | — |
| | 31 |
|
| Mortgage trading loans and ABS | 79 |
| | — |
| | — |
| | 79 |
|
| Total trading account assets | 171 |
| | — |
| | — |
| | 171 |
|
| Net derivative assets | (276 | ) | | 85 |
| | 104 |
| | (87 | ) |
Loans and leases (3) | — |
| | — |
| | 76 |
| | 76 |
|
| Mortgage servicing rights | (6 | ) | | (1,747 | ) | | — |
| | (1,753 | ) |
Loans held-for-sale (3) | (14 | ) | | — |
| | 10 |
| | (4 | ) |
| Other assets | — |
| | (50 | ) | | 102 |
| | 52 |
|
| Trading account liabilities – Corporate securities and other | 1 |
| | — |
| | — |
| | 1 |
|
Accrued expenses and other liabilities (3) | — |
| | — |
| | 1 |
| | 1 |
|
Long-term debt (3) | 29 |
| | — |
| | (37 | ) | | (8 | ) |
| Total | $ | (95 | ) | | $ | (1,712 | ) | | $ | 256 |
| | $ | (1,551 | ) |
| | | | | | | | |
| | 2013 |
| Trading account assets: | |
| | |
| | |
| | |
|
| Corporate securities, trading loans and other | $ | (130 | ) | | $ | — |
| | $ | — |
| | $ | (130 | ) |
| Equity securities | 40 |
| | — |
| | — |
| | 40 |
|
| Non-U.S. sovereign debt | 80 |
| | — |
| | — |
| | 80 |
|
| Mortgage trading loans and ABS | (174 | ) | | — |
| | — |
| | (174 | ) |
| Total trading account assets | (184 | ) | | — |
| | — |
| | (184 | ) |
| Net derivative assets | (1,375 | ) | | 42 |
| | (7 | ) | | (1,340 | ) |
Loans and leases (3) | — |
| | (34 | ) | | 152 |
| | 118 |
|
| Mortgage servicing rights | — |
| | 1,541 |
| | — |
| | 1,541 |
|
Loans held-for-sale (3) | — |
| | 6 |
| | 57 |
| | 63 |
|
| Other assets | — |
| | 166 |
| | 14 |
| | 180 |
|
Long-term debt (3) | (4 | ) | | — |
| | (32 | ) | | (36 | ) |
| Total | $ | (1,563 | ) | | $ | 1,721 |
| | $ | 184 |
| | $ | 342 |
|
| | | | | | | | |
| | 2012 |
| Trading account assets: | | | | | | | |
| Corporate securities, trading loans and other | $ | (19 | ) | | $ | — |
| | $ | — |
| | $ | (19 | ) |
| Equity securities | 17 |
| | — |
| | — |
| | 17 |
|
| Non-U.S. sovereign debt | 20 |
| | — |
| | — |
| | 20 |
|
| Mortgage trading loans and ABS | 36 |
| | — |
| | — |
| | 36 |
|
| Total trading account assets | 54 |
| | — |
| | — |
| | 54 |
|
| Net derivative assets | (2,782 | ) | | 456 |
| | — |
| | (2,326 | ) |
| AFS debt securities – Other taxable securities | 2 |
| | — |
| | — |
| | 2 |
|
Loans and leases (3) | — |
| | — |
| | 214 |
| | 214 |
|
| Mortgage servicing rights | — |
| | (1,100 | ) | | — |
| | (1,100 | ) |
Loans held-for-sale (3) | — |
| | 112 |
| | 168 |
| | 280 |
|
| Other assets | — |
| | (71 | ) | | 50 |
| | (21 | ) |
| Trading account liabilities – Corporate securities and other | 4 |
| | — |
| | — |
| | 4 |
|
Accrued expenses and other liabilities (3) | — |
| | — |
| | (2 | ) | | (2 | ) |
Long-term debt (3) | (136 | ) | | — |
| | (173 | ) | | (309 | ) |
| Total | $ | (2,858 | ) | | $ | (603 | ) | | $ | 257 |
| | $ | (3,204 | ) |
| |
(1) | Mortgage banking income (loss) does not reflect the impact of Level 1 and Level 2 hedges on MSRs. |
| |
(2) | Amounts included are primarily recorded in other income (loss). Equity investment gains of $170 million and $53 million recorded on net derivative assets and other assets were included for 2014 and 2013, and gains of $141 million recorded on other assets were included for 2012. |
| |
(3) | Amounts represent instruments that are accounted for under the fair value option. |
The following tables present information about significant unobservable inputs related to the Corporation’s material categories of Level 3 financial assets and liabilities at December 31, 2014 and 2013.
|
| | | | | | | | | |
| | | | | | |
| Quantitative Information about Level 3 Fair Value Measurements at December 31, 2014 | |
| | | | | |
| (Dollars in millions) | | | Inputs |
| Financial Instrument | Fair Value | Valuation Technique | Significant Unobservable Inputs | Ranges of Inputs | Weighted Average |
Loans and Securities (1) | | | | | |
| Instruments backed by residential real estate assets | $ | 2,030 |
| Discounted cash flow, Market comparables | Yield | 0% to 25% |
| 6 | % |
| Trading account assets – Mortgage trading loans and ABS | 483 |
| Prepayment speed | 0% to 35% CPR |
| 14 | % |
| Loans and leases | 1,374 |
| Default rate | 2% to 15% CDR |
| 7 | % |
| Loans held-for-sale | 173 |
| Loss severity | 26% to 100% |
| 34 | % |
| Commercial loans, debt securities and other | $ | 7,203 |
| Discounted cash flow, Market comparables | Yield | 0% to 40% |
| 9 | % |
| Trading account assets – Corporate securities, trading loans and other | 3,224 |
| Enterprise value/EBITDA multiple | 0x to 30x |
| 6x |
|
| Trading account assets – Non-U.S. sovereign debt | 574 |
| Prepayment speed | 1% to 30% |
| 12 | % |
| Trading account assets – Mortgage trading loans and ABS | 1,580 |
| Default rate | 1% to 5% |
| 4 | % |
| AFS debt securities – Other taxable securities | 1,216 |
| Loss severity | 25% to 40% |
| 38 | % |
| Loans and leases | 609 |
| Duration | 0 years to 5 years |
| 3 years |
|
| | | Price | $0 to $107 |
| $76 |
| Auction rate securities | $ | 1,096 |
| Discounted cash flow, Market comparables | Price | $60 to $100 |
| $95 |
| Trading account assets – Corporate securities, trading loans and other | 46 |
| | | |
| AFS debt securities – Other taxable securities | 451 |
| | | |
| AFS debt securities – Tax-exempt securities | 599 |
| | | |
| Structured liabilities | | | | | |
| Long-term debt | $ | (2,362 | ) | Industry standard derivative pricing (2, 3) | Equity correlation | 20% to 98% |
| 65 | % |
| | | Long-dated equity volatilities | 6% to 69% |
| 24 | % |
| | | Long-dated volatilities (IR) | 0% to 2% |
| 1 | % |
| Net derivative assets | | | | | |
| Credit derivatives | $ | 22 |
| Discounted cash flow, Stochastic recovery correlation model | Yield | 0% to 25% |
| 14 | % |
| | | Upfront points | 0 points to 100 points |
| 65 points |
|
| | | Spread to index | 25 bps to 450 bps |
| 119 bps |
|
| | | Credit correlation | 24% to 99% |
| 51 | % |
| | | Prepayment speed | 3% to 20% CPR |
| 11 | % |
| | | Default rate | 4% CDR |
| n/a |
|
| | | Loss severity | 35 | % | n/a |
|
| Equity derivatives | $ | (1,560 | ) | Industry standard derivative pricing (2) | Equity correlation | 20% to 98% |
| 65 | % |
| | | Long-dated equity volatilities | 6% to 69% |
| 24 | % |
| Commodity derivatives | $ | 141 |
| Discounted cash flow, Industry standard derivative pricing (2) | Natural gas forward price | $2/MMBtu to $7/MMBtu |
| $5/MMBtu |
|
| | | Correlation | 82% to 93% |
| 90 | % |
| | | Volatilities | 16% to 98% |
| 35 | % |
| Interest rate derivatives | $ | 477 |
| Industry standard derivative pricing (3) | Correlation (IR/IR) | 11% to 99% |
| 55 | % |
| | | Correlation (FX/IR) | -48% to 40% |
| -5 | % |
| | | Long-dated inflation rates | 0% to 3% |
| 1 | % |
| | | Long-dated inflation volatilities | 0% to 2% |
| 1 | % |
| Total net derivative assets | $ | (920 | ) | | | | |
| |
(1) | The categories are aggregated based upon product type which differs from financial statement classification. The following is a reconciliation to the line items in the table on page 245: Trading account assets – Corporate securities, trading loans and other of $3.3 billion, Trading account assets – Non-U.S. sovereign debt of $574 million, Trading account assets – Mortgage trading loans and ABS of $2.1 billion, AFS debt securities – Other taxable securities of $1.7 billion, AFS debt securities – Tax-exempt securities of $599 million, Loans and leases of $2.0 billion and LHFS of $173 million. |
| |
(2) | Includes models such as Monte Carlo simulation and Black-Scholes. |
| |
(3) | Includes models such as Monte Carlo simulation, Black-Scholes and other methods that model the joint dynamics of interest, inflation and foreign exchange rates. |
CPR = Constant Prepayment Rate
CDR = Constant Default Rate
EBITDA = Earnings before interest, taxes, depreciation and amortization
MMBtu = Million British thermal units
IR = Interest Rate
FX = Foreign Exchange
n/a = not applicable
|
| | | | | | | | |
| | | | | | |
| Quantitative Information about Level 3 Fair Value Measurements at December 31, 2013 |
| | | | | |
| (Dollars in millions) | | | Inputs |
| Financial Instrument | Fair
Value | Valuation
Technique | Significant Unobservable
Inputs | Ranges of
Inputs | Weighted Average |
Loans and Securities (1) | | | | | |
| Instruments backed by residential real estate assets | $ | 3,443 |
| Discounted cash flow, Market comparables | Yield | 2% to 25% | 6 | % |
| Trading account assets – Mortgage trading loans and ABS | 363 |
| Prepayment speed | 0% to 35% CPR | 9 | % |
| Loans and leases | 2,151 |
| Default rate | 1% to 20% CDR | 6 | % |
| Loans held-for-sale | 929 |
| Loss severity | 21% to 80% | 35 | % |
| Commercial loans, debt securities and other | $ | 12,135 |
| Discounted cash flow, Market comparables | Yield | 0% to 45% | 5 | % |
| Trading account assets – Corporate securities, trading loans and other | 3,462 |
| Enterprise value/EBITDA multiple | 0x to 24x | 7x |
|
| Trading account assets – Non-U.S. sovereign debt | 468 |
| Prepayment speed | 5% to 40% | 19 | % |
| Trading account assets – Mortgage trading loans and ABS | 4,268 |
| Default rate | 1% to 5% | 4 | % |
| AFS debt securities – Other taxable securities | 3,031 |
| Loss severity | 25% to 42% | 36 | % |
| Loans and leases | 906 |
| Duration | 1 year to 5 years | 4 years |
|
| Auction rate securities | $ | 1,719 |
| Discounted cash flow, Market comparables | Projected tender price/Refinancing level | 60% to 100% | 96 | % |
| Trading account assets – Corporate securities, trading loans and other | 97 |
| | |
| AFS debt securities – Other taxable securities | 816 |
| | | |
| AFS debt securities – Tax-exempt securities | 806 |
| | | |
| Structured liabilities | | | | | |
| Long-term debt | $ | (1,990 | ) | Industry standard derivative pricing (2, 3) | Equity correlation | 18% to 98% | 70 | % |
| | | Long-dated equity volatilities | 4% to 63% | 27 | % |
| | | Long-dated volatilities (IR) | 0% to 2% | 1 | % |
| Net derivative assets | | | | | |
| Credit derivatives | $ | 808 |
| Discounted cash flow, Stochastic recovery correlation model | Yield | 3% to 25% | 14 | % |
| | | Upfront points | 0 points to 100 points | 63 points |
|
| | | Spread to index | -1,407 bps to 1,741 bps | 91 bps |
|
| | | Credit correlation | 14% to 99% | 47 | % |
| | | Prepayment speed | 3% to 40% CPR | 13 | % |
| | | Default rate | 1% to 5% CDR | 3 | % |
| | | Loss severity | 20% to 42% | 35 | % |
| Equity derivatives | $ | (1,596 | ) | Industry standard derivative pricing (2) | Equity correlation | 18% to 98% | 70 | % |
| | | Long-dated equity volatilities | 4% to 63% | 27 | % |
| Commodity derivatives | $ | 6 |
| Discounted cash flow, Industry standard derivative pricing (2) | Natural gas forward price | $3/MMBtu to $11/MMBtu | $6/MMBtu |
|
| | | Correlation | 47% to 89% | 81 | % |
| | | Volatilities | 9% to 109% | 30 | % |
| Interest rate derivatives | $ | 558 |
| Industry standard derivative pricing (3) | Correlation (IR/IR) | 24% to 99% | 60 | % |
| | | Correlation (FX/IR) | -30% to 40% | -4 | % |
| | | Long-dated inflation rates | 0% to 3% | 2 | % |
| | | Long-dated inflation volatilities | 0% to 2% | 1 | % |
| Total net derivative assets | $ | (224 | ) | | | | |
| |
(1) | The categories are aggregated based upon product type which differs from financial statement classification. The following is a reconciliation to the line items in the table on page 246: Trading account assets – Corporate securities, trading loans and other of $3.6 billion, Trading account assets – Non-U.S. sovereign debt of $468 million, Trading account assets – Mortgage trading loans and ABS of $4.6 billion, AFS debt securities – Other taxable securities of $3.8 billion, AFS debt securities – Tax-exempt securities of $806 million, Loans and leases of $3.1 billion and LHFS of $929 million. |
| |
(2) | Includes models such as Monte Carlo simulation and Black-Scholes. |
| |
(3) | Includes models such as Monte Carlo simulation, Black-Scholes and other methods that model the joint dynamics of interest, inflation and foreign exchange rates. |
CPR = Constant Prepayment Rate
CDR = Constant Default Rate
EBITDA = Earnings before interest, taxes, depreciation and amortization
MMBtu = Million British thermal units
IR = Interest Rate
FX = Foreign Exchange
In the tables above, instruments backed by residential real estate assets include RMBS, whole loans and mortgage CDOs. Commercial loans, debt securities and other include corporate CLOs and CDOs, commercial loans and bonds, and securities backed by non-real estate assets. Structured Liabilitiesliabilities primarily include equity-linked notes that are accounted for under the fair value option.
In addition to the instruments in the tables above, the Corporation held $347 million and Derivatives$767 million of instruments at December 31, 2014 and 2013 consisting primarily of certain direct private equity investments and private equity funds that were classified as Level 3 and reported within other assets. Valuations of direct private equity investments are based on the most recent company financial information. Inputs generally include market and acquisition comparables, entry level multiples, as well as other variables. The Corporation selects a valuation methodology (e.g., market comparables) for each investment and, in certain instances, multiple inputs are weighted to derive the most representative value. Discounts are applied as appropriate to consider the lack of liquidity and marketability versus publicly-traded companies. For private equity funds, fair value is determined using the net asset value as provided by the individual fund’s general partner.
The Corporation uses multiple market approaches in valuing certain of its Level 3 financial instruments. For example, market comparables and discounted cash flows are used together. For a given product, such as corporate debt securities, market comparables may be used to estimate some of the unobservable inputs and then these inputs are incorporated into a discounted cash flow model. Therefore, the balances disclosed encompass both of these techniques.
The level of aggregation and diversity within the products disclosed in the tables result in certain ranges of inputs being wide and unevenly distributed across asset and liability categories. At December 31, 2014 and 2013, weighted averages are disclosed for all loans, securities, structured liabilities and net derivative assets.
For more information on the inputs and techniques used in the valuation of MSRs, see Note 23 – Mortgage Servicing Rights.
Sensitivity of Fair Value Measurements to Changes in Unobservable Inputs
Loans and Securities
For credit derivatives,instruments backed by residential real estate assets and commercial loans, debt securities and other, a significant increase
in market yield, including spreads to indices, upfront points (i.e., a single upfront payment made by a protection buyer at inception), credit spreads,yields, default rates, or loss severities or duration would result in a significantly lower fair value for protection sellers and higher fair value for protection buyers.long positions. Short positions would be impacted in a directionally opposite way. The impact of changes in prepayment speeds would have differing impacts depending on the seniority of the instrument and, in the case of CLOs, whether prepayments can be reinvested.
Structured credit derivatives, which include tranched portfolio CDS and derivatives with derivative product company (DPC) and monoline counterparties, are impacted by credit correlation,
including default and wrong-way correlation. Default correlation is a parameter that describes the degree of dependence among credit default rates within a credit portfolio that underlies a credit derivative instrument. The sensitivity of this input on the fair value varies depending on the level of subordination of the tranche. For senior tranches that are net purchases of protection,auction rate securities, a significant increase in default correlationprice and/or projected tender price/refinancing levels would result in a significantly higher fair value. Net short protection positions would be impacted in a directionally opposite way. Wrong-way correlation is a parameter that describes the probability that, as exposure to a counterparty increases, the credit quality of the counterparty decreases. A significantly higher degree of wrong-way correlation between a DPC counterparty and underlying derivative exposure would result in a significantly lower fair value.
For equity derivatives, interest rate derivatives and structured liabilities, a significant change in long-dated rates and volatilities and correlation inputs (e.g., the degree of correlation between an equity security and an index, between two different interest rates, or between interest rates and foreign exchange rates) would result in a significant impact to the fair value; however, the magnitude and direction of the impact depends on whether the Corporation is long or short the exposure.
Nonrecurring Fair Value
The Corporation holds certain assets that are measured at fair value, but only in certain situations (e.g., impairment) and these measurements are referred to herein as nonrecurring. These assets primarily include LHFS, certain loans and leases, and foreclosed properties. The amounts below represent only balances measured at fair value during 2013, 2012 and 2011, and still held as of the reporting date.
|
| | | | | | | | | | | | | | | |
| | | | | | | | |
| Assets Measured at Fair Value on a Nonrecurring Basis |
| | | | | | | | |
| | December 31 |
| | 2013 | | 2012 |
| (Dollars in millions) | Level 2 | | Level 3 | | Level 2 | | Level 3 |
| Assets | |
| | |
| | | | |
|
| Loans held-for-sale | $ | 2,138 |
| | $ | 115 |
| | $ | 5,692 |
| | $ | 1,136 |
|
| Loans and leases | 18 |
| | 5,240 |
| | 21 |
| | 9,184 |
|
Foreclosed properties (1) | 12 |
| | 1,258 |
| | 33 |
| | 1,918 |
|
| Other assets | 88 |
| | — |
| | 36 |
| | 12 |
|
| | | | | | | | |
| | | | Gains (Losses) |
| | | | 2013 | | 2012 | | 2011 |
| Assets | | | |
| | |
| | |
|
| Loans held-for-sale | | | $ | (71 | ) | | $ | (24 | ) | | $ | (188 | ) |
Loans and leases (2) | | | (1,104 | ) | | (3,116 | ) | | (4,813 | ) |
Foreclosed properties (1) | | | (39 | ) | | (47 | ) | | (167 | ) |
| Other assets | | | (20 | ) | | (16 | ) | | — |
|
| |
(1)
| Amounts are included in other assets on the Consolidated Balance Sheet and represent fair value of, and related losses on, foreclosed properties that were written down subsequent to their initial classification as foreclosed properties. |
| |
(2)
| Losses represent charge-offs on real estate-secured loans. |
The table below presents information about significant unobservable inputs related to the Corporation’s nonrecurring Level 3 financial assets and liabilities at December 31, 2013 and 2012.
|
| | | | | | | | | |
| | | | | | |
| Quantitative Information about Nonrecurring Level 3 Fair Value Measurements |
| | | | | | |
| | December 31, 2013 |
| (Dollars in millions) | | | Inputs |
| Financial Instrument | Fair Value | Valuation Technique | Significant Unobservable Inputs | Ranges of Inputs | Weighted Average |
| Instruments backed by residential real estate assets | $ | 5,240 |
| Market comparables | OREO discount | 0% to 19% |
| 8 | % |
| Loans and leases | 5,240 |
| Cost to sell | 8 | % | n/a |
|
|
| | | | | | | | | |
| | December 31, 2012 |
| Instruments backed by residential real estate assets | $ | 9,932 |
| Discounted cash flow, Market comparables | Yield | 3% to 5% |
| 3 | % |
| Loans held-for-sale | 748 |
| Prepayment speed | 3% to 30% |
| 15 | % |
| Loans and leases | 9,184 |
| Default rate | 0% to 55% |
| 7 | % |
| | | Loss severity | 6% to 66% |
| 48 | % |
| | | OREO discount | 0% to 28% |
| 15 | % |
| | | Cost to sell | 8 | % | n/a |
|
| Instruments backed by commercial real estate assets | $ | 388 |
| Discounted cash flow | Yield | 4% to 13% |
| 6 | % |
| Loans held-for-sale | 388 |
| Loss severity | 24% to 88% |
| 53 | % |
n/a = not applicable
Instruments backed by residential real estate assets represent residential mortgages where the loan has been written down to the fair value of the underlying collateral or, in the case of LHFS, are carried at the lower of cost or fair value. In addition to the instruments disclosed in the table above, the Corporation holds foreclosed residential properties where the fair value is based on unadjusted third-party appraisals or broker price opinions. Appraisals are generally conducted every 90 days. Factors considered in determining the fair value include geographic sales trends, the value of comparable surrounding properties as well as the condition of the property.
NOTE 21 Fair Value Option
Loans and Loan Commitments
The fair values of loans and loan commitments are based on market prices, where available, or discounted cash flow analyses using market-based credit spreads of comparable debt instruments or credit derivatives of the specific borrower or comparable borrowers. Results of discounted cash flow analyses may be adjusted, as appropriate, to reflect other market conditions or the perceived credit risk of the borrower.
Mortgage Servicing Rights
The fair values of MSRs are determined using models that rely on estimates of prepayment rates, the resultant weighted-average lives of the MSRs and the option-adjusted spread levels. For more information on MSRs, see Note 23 – Mortgage Servicing Rights.
Loans Held-for-sale
The fair values of LHFS are based on quoted market prices, where available, or are determined by discounting estimated cash flows using interest rates approximating the Corporation’s current origination rates for similar loans adjusted to reflect the inherent credit risk. The borrower-specific credit risk is embedded within the quoted market prices or is implied by considering loan performance when selecting comparables.
Private Equity Investments
Private equity investments consist of direct investments and fund investments which are initially valued at their transaction price. Thereafter, the fair value of direct investments is based on an assessment of each individual investment using methodologies that include publicly-traded comparables derived by multiplying a key performance metric (e.g., earnings before interest, taxes, depreciation and amortization) of the portfolio company by the relevant valuation multiple observed for comparable companies, acquisition comparables, entry level multiples and discounted cash flow analyses, and are subject to appropriate discounts for lack of liquidity or marketability. After initial recognition, the fair value of fund investments is based on the Corporation’s proportionate interest in the fund’s capital as reported by the respective fund managers.
Short-term Borrowings and Long-term Debt
The Corporation issues structured liabilities that have coupons or repayment terms linked to the performance of debt or equity securities, indices, currencies or commodities. The fair values of these structured liabilities are estimated using quantitative models for the combined derivative and debt portions of the notes. These models incorporate observable and, in some instances, unobservable inputs including security prices, interest rate yield curves, option volatility, currency, commodity or equity rates and correlations among these inputs. The Corporation also considers the impact of its own credit spreads in determining the discount rate used to value these liabilities. The credit spread is determined by reference to observable spreads in the secondary bond market.
Securities Financing Agreements
The fair values of certain reverse repurchase agreements, repurchase agreements and securities borrowed transactions are determined using quantitative models, including discounted cash flow models that require the use of multiple market inputs including interest rates and spreads to generate continuous yield or pricing curves, and volatility factors. The majority of market inputs are actively quoted and can be validated through external sources, including brokers, market transactions and third-party pricing services.
Deposits
The fair values of deposits are determined using quantitative models, including discounted cash flow models that require the use of multiple market inputs including interest rates and spreads to generate continuous yield or pricing curves, and volatility factors. The majority of market inputs are actively quoted and can be validated through external sources, including brokers, market transactions and third-party pricing services. The Corporation considers the impact of its own credit spreads in the valuation of these liabilities. The credit risk is determined by reference to observable credit spreads in the secondary cash market.
Asset-backed Secured Financings
The fair values of asset-backed secured financings are based on external broker bids, where available, or are determined by discounting estimated cash flows using interest rates approximating the Corporation’s current origination rates for similar loans adjusted to reflect the inherent credit risk.
Recurring Fair Value
Assets and liabilities carried at fair value on a recurring basis at December 31, 2014 and 2013, including financial instruments which the Corporation accounts for under the fair value option, are summarized in the following tables.
|
| | | | | | | | | | | | | | | | | | | |
| | | | | | | | | | |
| | December 31, 2014 |
| | Fair Value Measurements | | | | �� |
| (Dollars in millions) | Level 1 | | Level 2 | | Level 3 | | Netting Adjustments (1) | | Assets/Liabilities at Fair Value |
| Assets | |
| | |
| | |
| | |
| | |
|
| Federal funds sold and securities borrowed or purchased under agreements to resell | $ | — |
| | $ | 62,182 |
| | $ | — |
| | $ | — |
| | $ | 62,182 |
|
| Trading account assets: | |
| | |
| | |
| | |
| | |
|
U.S. government and agency securities (2) | 33,470 |
| | 17,549 |
| | — |
| | — |
| | 51,019 |
|
| Corporate securities, trading loans and other | 243 |
| | 31,699 |
| | 3,270 |
| | — |
| | 35,212 |
|
| Equity securities | 33,518 |
| | 22,488 |
| | 352 |
| | — |
| | 56,358 |
|
| Non-U.S. sovereign debt | 20,348 |
| | 15,332 |
| | 574 |
| | — |
| | 36,254 |
|
| Mortgage trading loans and ABS | — |
| | 10,879 |
| | 2,063 |
| | — |
| | 12,942 |
|
| Total trading account assets | 87,579 |
| | 97,947 |
| | 6,259 |
| | — |
| | 191,785 |
|
Derivative assets (3) | 4,957 |
| | 972,977 |
| | 6,851 |
| | (932,103 | ) | | 52,682 |
|
| AFS debt securities: | |
| | |
| | |
| | |
| | |
|
| U.S. Treasury and agency securities | 67,413 |
| | 2,182 |
| | — |
| | — |
| | 69,595 |
|
| Mortgage-backed securities: | |
| | |
| | |
| | |
| | |
|
| Agency | — |
| | 165,039 |
| | — |
| | — |
| | 165,039 |
|
| Agency-collateralized mortgage obligations | — |
| | 14,248 |
| | — |
| | — |
| | 14,248 |
|
| Non-agency residential | — |
| | 4,175 |
| | 279 |
| | — |
| | 4,454 |
|
| Commercial | — |
| | 4,000 |
| | — |
| | — |
| | 4,000 |
|
| Non-U.S. securities | 3,191 |
| | 3,029 |
| | 10 |
| | — |
| | 6,230 |
|
| Corporate/Agency bonds | — |
| | 368 |
| | — |
| | — |
| | 368 |
|
| Other taxable securities | 20 |
| | 9,104 |
| | 1,667 |
| | — |
| | 10,791 |
|
| Tax-exempt securities | — |
| | 8,950 |
| | 599 |
| | — |
| | 9,549 |
|
| Total AFS debt securities | 70,624 |
| | 211,095 |
| | 2,555 |
| | — |
| | 284,274 |
|
| Other debt securities carried at fair value: | | | | | | | | | |
| U.S. Treasury and agency securities | 1,541 |
| | — |
| | — |
| | — |
| | 1,541 |
|
| Mortgage-backed securities: | | | | | | | | | |
| Agency | — |
| | 15,704 |
| | — |
| | — |
| | 15,704 |
|
| Non-agency residential | — |
| | 3,745 |
| | — |
| | — |
| | 3,745 |
|
| Non-U.S. securities | 13,270 |
| | 1,862 |
| | — |
| | — |
| | 15,132 |
|
| Other taxable securities | — |
| | 299 |
| | — |
| | — |
| | 299 |
|
| Total other debt securities carried at fair value | 14,811 |
| | 21,610 |
| | — |
| | — |
| | 36,421 |
|
| Loans and leases | — |
| | 6,698 |
| | 1,983 |
| | — |
| | 8,681 |
|
| Mortgage servicing rights | — |
| | — |
| | 3,530 |
| | — |
| | 3,530 |
|
| Loans held-for-sale | — |
| | 6,628 |
| | 173 |
| | — |
| | 6,801 |
|
| Other assets | 11,581 |
| | 1,381 |
| | 911 |
| | — |
| | 13,873 |
|
Total assets (4) | $ | 189,552 |
| | $ | 1,380,518 |
| | $ | 22,262 |
| | $ | (932,103 | ) | | $ | 660,229 |
|
| Liabilities | |
| | |
| | |
| | |
| | |
|
| Interest-bearing deposits in U.S. offices | $ | — |
| | $ | 1,469 |
| | $ | — |
| | $ | — |
| | $ | 1,469 |
|
| Federal funds purchased and securities loaned or sold under agreements to repurchase | — |
| | 35,357 |
| | — |
| | — |
| | 35,357 |
|
| Trading account liabilities: | |
| | |
| | |
| | |
| | |
| U.S. government and agency securities | 18,514 |
| | 446 |
| | — |
| | — |
| | 18,960 |
|
| Equity securities | 24,679 |
| | 3,670 |
| | — |
| | — |
| | 28,349 |
|
| Non-U.S. sovereign debt | 16,089 |
| | 3,625 |
| | — |
| | — |
| | 19,714 |
|
| Corporate securities and other | 189 |
| | 6,944 |
| | 36 |
| | — |
| | 7,169 |
|
| Total trading account liabilities | 59,471 |
| | 14,685 |
| | 36 |
| | — |
| | 74,192 |
|
Derivative liabilities (3) | 4,493 |
| | 969,502 |
| | 7,771 |
| | (934,857 | ) | | 46,909 |
|
| Short-term borrowings | — |
| | 2,697 |
| | — |
| | — |
| | 2,697 |
|
| Accrued expenses and other liabilities | 10,795 |
| | 1,250 |
| | 10 |
| | — |
| | 12,055 |
|
| Long-term debt | — |
| | 34,042 |
| | 2,362 |
| | — |
| | 36,404 |
|
Total liabilities (4) | $ | 74,759 |
| | $ | 1,059,002 |
| | $ | 10,179 |
| | $ | (934,857 | ) | | $ | 209,083 |
|
| |
(1) | Amounts represent the impact of legally enforceable master netting agreements and also cash collateral held or placed with the same counterparties. |
| |
(2) | Includes $17.2 billion of government-sponsored enterprise obligations. |
| |
(3) | For further disaggregation of derivative assets and liabilities, see Note 2 – Derivatives. |
| |
(4) | During 2014, the Corporation reclassified certain assets and liabilities within its fair value hierarchy based on a review of its inputs used to measure fair value. Accordingly, approximately $4.1 billion of assets related to U.S. government and agency securities, non-U.S. government securities and equity derivatives, and $570 million of liabilities related to equity derivatives were transferred from Level 1 to Level 2. |
|
| | | | | | | | | | | | | | | | | | | |
| | | | | | | | | | |
| | December 31, 2013 |
| | Fair Value Measurements | | | | |
| (Dollars in millions) | Level 1 | | Level 2 | | Level 3 | | Netting Adjustments (1) | | Assets/Liabilities at Fair Value |
| Assets | |
| | |
| | |
| | |
| | |
|
| Federal funds sold and securities borrowed or purchased under agreements to resell | $ | — |
| | $ | 68,656 |
| | $ | — |
| | $ | — |
| | $ | 68,656 |
|
| Trading account assets: | |
| | |
| | |
| | |
| | |
|
U.S. government and agency securities (2) | 34,222 |
| | 14,625 |
| | — |
| | — |
| | 48,847 |
|
| Corporate securities, trading loans and other | 1,147 |
| | 27,746 |
| | 3,559 |
| | — |
| | 32,452 |
|
| Equity securities | 41,324 |
| | 22,741 |
| | 386 |
| | — |
| | 64,451 |
|
| Non-U.S. sovereign debt | 24,357 |
| | 12,399 |
| | 468 |
| | — |
| | 37,224 |
|
| Mortgage trading loans and ABS | — |
| | 13,388 |
| | 4,631 |
| | — |
| | 18,019 |
|
| Total trading account assets | 101,050 |
| | 90,899 |
| | 9,044 |
| | — |
| | 200,993 |
|
Derivative assets (3) | 2,374 |
| | 910,602 |
| | 7,277 |
| | (872,758 | ) | | 47,495 |
|
| AFS debt securities: | |
| | |
| | |
| | |
| | |
|
| U.S. Treasury and agency securities | 6,591 |
| | 2,363 |
| | — |
| | — |
| | 8,954 |
|
| Mortgage-backed securities: | |
| | |
| | |
| | |
| | |
|
| Agency | — |
| | 164,935 |
| | — |
| | — |
| | 164,935 |
|
| Agency-collateralized mortgage obligations | — |
| | 22,492 |
| | — |
| | — |
| | 22,492 |
|
| Non-agency residential | — |
| | 6,239 |
| | — |
| | — |
| | 6,239 |
|
| Commercial | — |
| | 2,480 |
| | — |
| | — |
| | 2,480 |
|
| Non-U.S. securities | 3,698 |
| | 3,415 |
| | 107 |
| | — |
| | 7,220 |
|
| Corporate/Agency bonds | — |
| | 873 |
| | — |
| | — |
| | 873 |
|
| Other taxable securities | 20 |
| | 12,963 |
| | 3,847 |
| | — |
| | 16,830 |
|
| Tax-exempt securities | — |
| | 5,122 |
| | 806 |
| | — |
| | 5,928 |
|
| Total AFS debt securities | 10,309 |
| | 220,882 |
| | 4,760 |
| | — |
| | 235,951 |
|
| Other debt securities carried at fair value: | | | | | | | | | |
| U.S. Treasury and agency securities | 4,062 |
| | — |
| | — |
| | — |
| | 4,062 |
|
| Mortgage-backed securities: | | | | | | | | | |
| Agency | — |
| | 16,500 |
| | — |
| | — |
| | 16,500 |
|
| Agency-collateralized mortgage obligations | — |
| | 218 |
| | — |
| | — |
| | 218 |
|
| Commercial | — |
| | 749 |
| | — |
| | — |
| | 749 |
|
| Non-U.S. securities | 7,457 |
| | 3,858 |
| | — |
| | — |
| | 11,315 |
|
| Total other debt securities carried at fair value | 11,519 |
| | 21,325 |
| | — |
| | — |
| | 32,844 |
|
| Loans and leases | — |
| | 6,985 |
| | 3,057 |
| | — |
| | 10,042 |
|
| Mortgage servicing rights | — |
| | — |
| | 5,042 |
| | — |
| | 5,042 |
|
| Loans held-for-sale | — |
| | 5,727 |
| | 929 |
| | — |
| | 6,656 |
|
| Other assets | 14,474 |
| | 1,912 |
| | 1,669 |
| | — |
| | 18,055 |
|
Total assets (4) | $ | 139,726 |
| | $ | 1,326,988 |
| | $ | 31,778 |
| | $ | (872,758 | ) | | $ | 625,734 |
|
| Liabilities | |
| | |
| | |
| | |
| | |
|
| Interest-bearing deposits in U.S. offices | $ | — |
| | $ | 1,899 |
| | $ | — |
| | $ | — |
| | $ | 1,899 |
|
| Federal funds purchased and securities loaned or sold under agreements to repurchase | — |
| | 26,500 |
| | — |
| | — |
| | 26,500 |
|
| Trading account liabilities: | |
| | |
| | |
| | |
| | |
| U.S. government and agency securities | 26,915 |
| | 348 |
| | — |
| | — |
| | 27,263 |
|
| Equity securities | 23,874 |
| | 3,711 |
| | — |
| | — |
| | 27,585 |
|
| Non-U.S. sovereign debt | 20,755 |
| | 1,387 |
| | — |
| | — |
| | 22,142 |
|
| Corporate securities and other | 518 |
| | 5,926 |
| | 35 |
| | — |
| | 6,479 |
|
| Total trading account liabilities | 72,062 |
| | 11,372 |
| | 35 |
| | — |
| | 83,469 |
|
Derivative liabilities (3) | 1,968 |
| | 896,907 |
| | 7,501 |
| | (868,969 | ) | | 37,407 |
|
| Short-term borrowings | — |
| | 1,520 |
| | — |
| | — |
| | 1,520 |
|
| Accrued expenses and other liabilities | 10,130 |
| | 1,093 |
| | 10 |
| | — |
| | 11,233 |
|
| Long-term debt | — |
| | 45,045 |
| | 1,990 |
| | — |
| | 47,035 |
|
Total liabilities (4) | $ | 84,160 |
| | $ | 984,336 |
| | $ | 9,536 |
| | $ | (868,969 | ) | | $ | 209,063 |
|
| |
(1) | Amounts represent the impact of legally enforceable master netting agreements and also cash collateral held or placed with the same counterparties. |
| |
(2) | Includes $15.6 billion of government-sponsored enterprise obligations. |
| |
(3) | For further disaggregation of derivative assets and liabilities, see Note 2 – Derivatives. |
| |
(4) | During 2013, $500 million of other assets were transferred from Level 1 to Level 2 primarily due to a restriction that became effective for a private equity investment that was subsequently sold once the restriction was lifted. |
The following tables present a reconciliation of all assets and liabilities measured at fair value on a recurring basis using significant unobservable inputs (Level 3) during 2014, 2013 and 2012, including net realized and unrealized gains (losses) included in earnings and accumulated OCI.
|
| | | | | | | | | | | | | | | | | | | | | | | | | | | | | | |
| | | | | | | | | | | |
Level 3 – Fair Value Measurements (1) | | | | | | | |
| | | | | | | | | | | |
| | 2014 |
| | | | | Gross | | | |
| (Dollars in millions) | Balance January 1 2014 | Gains
(Losses)
in Earnings | Gains
(Losses)
in OCI | Purchases | Sales | Issuances | Settlements | Gross
Transfers
into Level 3 | Gross
Transfers
out of Level 3 | Balance
December 31
2014 |
| Trading account assets: | |
| |
| |
| |
| | | | |
| |
| |
|
| U.S. government and agency securities | $ | — |
| $ | — |
| $ | — |
| $ | 87 |
| $ | (87 | ) | $ | — |
| $ | — |
| $ | — |
| $ | — |
| $ | — |
|
| Corporate securities, trading loans and other | 3,559 |
| 180 |
| — |
| 1,675 |
| (857 | ) | — |
| (938 | ) | 1,275 |
| (1,624 | ) | 3,270 |
|
| Equity securities | 386 |
| — |
| — |
| 104 |
| (86 | ) | — |
| (16 | ) | 146 |
| (182 | ) | 352 |
|
| Non-U.S. sovereign debt | 468 |
| 30 |
| — |
| 120 |
| (34 | ) | — |
| (19 | ) | 11 |
| (2 | ) | 574 |
|
| Mortgage trading loans and ABS | 4,631 |
| 199 |
| — |
| 1,643 |
| (1,259 | ) | — |
| (585 | ) | 39 |
| (2,605 | ) | 2,063 |
|
| Total trading account assets | 9,044 |
| 409 |
| — |
| 3,629 |
| (2,323 | ) | — |
| (1,558 | ) | 1,471 |
| (4,413 | ) | 6,259 |
|
Net derivative assets (2) | (224 | ) | 463 |
| — |
| 823 |
| (1,738 | ) | — |
| (432 | ) | 28 |
| 160 |
| (920 | ) |
| AFS debt securities: | |
| |
| |
| |
| |
| |
| |
| |
| |
| |
|
| Non-agency residential MBS | — |
| (2 | ) | — |
| 11 |
| — |
| — |
| — |
| 270 |
| — |
| 279 |
|
| Non-U.S. securities | 107 |
| (7 | ) | (11 | ) | 241 |
| — |
| — |
| (147 | ) | — |
| (173 | ) | 10 |
|
| Corporate/Agency bonds | — |
| — |
| — |
| — |
| — |
| — |
| — |
| 93 |
| (93 | ) | — |
|
| Other taxable securities | 3,847 |
| 9 |
| (8 | ) | 154 |
| — |
| — |
| (1,381 | ) | — |
| (954 | ) | 1,667 |
|
| Tax-exempt securities | 806 |
| 8 |
| — |
| — |
| (16 | ) | — |
| (235 | ) | 36 |
| — |
| 599 |
|
| Total AFS debt securities | 4,760 |
| 8 |
| (19 | ) | 406 |
| (16 | ) | — |
| (1,763 | ) | 399 |
| (1,220 | ) | 2,555 |
|
Loans and leases (3, 4) | 3,057 |
| 69 |
| — |
| — |
| (3 | ) | 699 |
| (1,591 | ) | 25 |
| (273 | ) | 1,983 |
|
Mortgage servicing rights (4) | 5,042 |
| (1,231 | ) | — |
| — |
| (61 | ) | 707 |
| (927 | ) | — |
| — |
| 3,530 |
|
Loans held-for-sale (3) | 929 |
| 45 |
| — |
| 59 |
| (725 | ) | 23 |
| (216 | ) | 83 |
| (25 | ) | 173 |
|
Other assets (5) | 1,669 |
| (98 | ) | — |
| — |
| (430 | ) | — |
| (245 | ) | 39 |
| (24 | ) | 911 |
|
| Trading account liabilities – Corporate securities and other | (35 | ) | 1 |
| — |
| 10 |
| (13 | ) | — |
| — |
| (9 | ) | 10 |
| (36 | ) |
Accrued expenses and other liabilities (3) | (10 | ) | 2 |
| — |
| — |
| — |
| (3 | ) | — |
| — |
| 1 |
| (10 | ) |
Long-term debt (3) | (1,990 | ) | 49 |
| — |
| 169 |
| — |
| (615 | ) | 540 |
| (1,581 | ) | 1,066 |
| (2,362 | ) |
| |
(1) | Assets (liabilities). For assets, increase (decrease) to Level 3 and for liabilities, (increase) decrease to Level 3. |
| |
(2) | Net derivatives include derivative assets of $6.9 billion and derivative liabilities of $7.8 billion. |
| |
(3) | Amounts represent instruments that are accounted for under the fair value option. |
| |
(4) | Issuances represent loan originations and mortgage servicing rights retained following securitizations or whole-loan sales. |
| |
(5) | Other assets is primarily comprised of private equity investments and certain long-term fixed-rate margin loans that are accounted for under the fair value option. |
During 2014, the transfers into Level 3 included $1.5 billion of trading account assets, $399 million of AFS debt securities and $1.6 billion of long-term debt. Transfers into Level 3 for trading account assets were primarily the result of decreased availability of third-party prices for certain corporate loans and securities. Transfers into Level 3 for AFS debt securities were primarily due to decreased price observability related to municipal auction rate securities (ARS). Transfers into Level 3 for long-term debt were primarily due to changes in the impact of unobservable inputs on the value of certain structured liabilities. Transfers occur on a regular basis for these long-term debt instruments due to changes in the impact of unobservable inputs on the value of the embedded derivative in relation to the instrument as a whole.
During 2014, the transfers out of Level 3 included $4.4 billion of trading account assets, $160 million of net derivative assets, $1.2 billion of AFS debt securities, $273 million of loans and leases and $1.1 billion of long-term debt. Transfers out of Level 3 for trading account assets were primarily the result of increased market liquidity and price observability on certain CLOs. Transfers out of Level 3 for net derivative assets were primarily due to increased price observability for certain equity derivatives. Transfers out of Level 3 for AFS debt securities were primarily due to increased price observability on certain CLOs. Transfers out of Level 3 for loans and leases were primarily due to increased price observability. Transfers out of Level 3 for long-term debt were primarily due to changes in the impact of unobservable inputs on the value of certain structured liabilities.
|
| | | | | | | | | | | | | | | | | | | | | | | | | | | | | | |
| | | | | | | | | | | |
Level 3 – Fair Value Measurements (1) | | | | | | | |
| | | | | | | | | | | |
| | 2013 |
| | | | | Gross | | | |
| (Dollars in millions) | Balance
January 1 2013 | Gains
(Losses)
in Earnings | Gains
(Losses)
in OCI | Purchases | Sales | Issuances | Settlements | Gross
Transfers
into Level 3 | Gross
Transfers
out of Level 3 | Balance
December 31 2013 |
| Trading account assets: | |
| |
| |
| | | | |
| | |
| |
|
| Corporate securities, trading loans and other | $ | 3,726 |
| $ | 242 |
| $ | — |
| $ | 3,848 |
| $ | (3,110 | ) | $ | 59 |
| $ | (651 | ) | $ | 890 |
| $ | (1,445 | ) | $ | 3,559 |
|
| Equity securities | 545 |
| 74 |
| — |
| 96 |
| (175 | ) | — |
| (100 | ) | 70 |
| (124 | ) | 386 |
|
| Non-U.S. sovereign debt | 353 |
| 50 |
| — |
| 122 |
| (18 | ) | — |
| (36 | ) | 2 |
| (5 | ) | 468 |
|
| Mortgage trading loans and ABS | 4,935 |
| 53 |
| — |
| 2,514 |
| (1,993 | ) | — |
| (868 | ) | 20 |
| (30 | ) | 4,631 |
|
| Total trading account assets | 9,559 |
| 419 |
| — |
| 6,580 |
| (5,296 | ) | 59 |
| (1,655 | ) | 982 |
| (1,604 | ) | 9,044 |
|
Net derivative assets (2) | 1,468 |
| (304 | ) | — |
| 824 |
| (1,467 | ) | — |
| (1,362 | ) | (10 | ) | 627 |
| (224 | ) |
| AFS debt securities: | |
| |
| |
| | | | |
| |
| |
| |
|
| Commercial MBS | 10 |
| — |
| — |
| — |
| — |
| — |
| (10 | ) | — |
| — |
| — |
|
| Non-U.S. securities | — |
| 5 |
| 2 |
| 1 |
| (1 | ) | — |
| — |
| 100 |
| — |
| 107 |
|
| Corporate/Agency bonds | 92 |
| — |
| 4 |
| — |
| — |
| — |
| — |
| — |
| (96 | ) | — |
|
| Other taxable securities | 3,928 |
| 9 |
| 15 |
| 1,055 |
| — |
| — |
| (1,155 | ) | — |
| (5 | ) | 3,847 |
|
| Tax-exempt securities | 1,061 |
| 3 |
| 19 |
| — |
| — |
| — |
| (109 | ) | — |
| (168 | ) | 806 |
|
| Total AFS debt securities | 5,091 |
| 17 |
| 40 |
| 1,056 |
| (1 | ) | — |
| (1,274 | ) | 100 |
| (269 | ) | 4,760 |
|
Loans and leases (3, 4) | 2,287 |
| 98 |
| — |
| 310 |
| (128 | ) | 1,252 |
| (757 | ) | 19 |
| (24 | ) | 3,057 |
|
Mortgage servicing rights (4) | 5,716 |
| 1,941 |
| — |
| — |
| (2,044 | ) | 472 |
| (1,043 | ) | — |
| — |
| 5,042 |
|
Loans held-for-sale (3) | 2,733 |
| 62 |
| — |
| 8 |
| (402 | ) | 4 |
| (1,507 | ) | 34 |
| (3 | ) | 929 |
|
Other assets (5) | 3,129 |
| (288 | ) | — |
| 46 |
| (383 | ) | — |
| (1,019 | ) | 239 |
| (55 | ) | 1,669 |
|
| Trading account liabilities – Corporate securities and other | (64 | ) | 10 |
| — |
| 43 |
| (54 | ) | (5 | ) | — |
| (9 | ) | 44 |
| (35 | ) |
Accrued expenses and other liabilities (3) | (15 | ) | 30 |
| — |
| — |
| — |
| (751 | ) | 724 |
| (1 | ) | 3 |
| (10 | ) |
Long-term debt (3) | (2,301 | ) | 13 |
| — |
| 358 |
| (4 | ) | (172 | ) | 258 |
| (1,331 | ) | 1,189 |
| (1,990 | ) |
| |
(1) | Assets (liabilities). For assets, increase (decrease) to Level 3 and for liabilities, (increase) decrease to Level 3. |
| |
(2) | Net derivatives include derivative assets of $7.3 billion and derivative liabilities of $7.5 billion. |
| |
(3) | Amounts represent instruments that are accounted for under the fair value option. |
| |
(4) | Issuances represent loan originations and mortgage servicing rights retained following securitizations or whole-loan sales. |
| |
(5) | Other assets is primarily comprised of private equity investments and certain long-term fixed-rate margin loans that are accounted for under the fair value option. |
During 2013, the transfers into Level 3 included $982 million of trading account assets, $100 million of AFS debt securities, $239 million of other assets and $1.3 billion of long-term debt. Transfers into Level 3 for trading account assets were primarily the result of decreased third-party prices available for certain corporate loans and securities. Transfers into Level 3 for AFS debt securities were primarily due to decreased price observability. Transfers into Level 3 for other assets were primarily due to a lack of independent pricing data for certain receivables. Transfers into Level 3 for long-term debt were primarily due to changes in the impact of unobservable inputs on the value of certain structured liabilities. Transfers occur on a regular basis for these long-term debt instruments due to changes in the impact of unobservable inputs on the value of the embedded derivative in relation to the instrument as a whole.
During 2013, the transfers out of Level 3 included $1.6 billion of trading account assets, $627 million of net derivative assets, $269 million of AFS debt securities and $1.2 billion of long-term debt. Transfers out of Level 3 for trading account assets were primarily the result of increased market liquidity and third-party prices available for certain corporate loans and securities. Transfers out of Level 3 for net derivative assets were primarily due to increased price observability (i.e., market comparables for the referenced instruments) for certain options. Transfers out of Level 3 for AFS debt securities were primarily due to increased market liquidity. Transfers out of Level 3 for long-term debt were primarily due to changes in the impact of unobservable inputs on the value of certain structured liabilities.
|
| | | | | | | | | | | | | | | | | | | | | | | | | | | | | | |
| | | | | | | | | | | |
Level 3 – Fair Value Measurements (1) | | | | | | | | |
| | | | | | | | | | | |
| | 2012 |
| | | | | Gross | | | |
| (Dollars in millions) | Balance
January 1 2012 | Gains
(Losses) in Earnings | Gains
(Losses) in OCI | Purchases | Sales | Issuances | Settlements | Gross Transfers into Level 3 | Gross Transfers
out of Level 3 | Balance
December 31 2012 |
| Trading account assets: | | | | | | | | | | |
Corporate securities, trading loans and other (2) | $ | 6,880 |
| $ | 195 |
| $ | — |
| $ | 2,798 |
| $ | (4,556 | ) | $ | — |
| $ | (1,077 | ) | $ | 436 |
| $ | (950 | ) | $ | 3,726 |
|
| Equity securities | 544 |
| 31 |
| — |
| 201 |
| (271 | ) | — |
| 27 |
| 90 |
| (77 | ) | 545 |
|
| Non-U.S. sovereign debt | 342 |
| 8 |
| — |
| 388 |
| (359 | ) | — |
| (5 | ) | — |
| (21 | ) | 353 |
|
Mortgage trading loans and ABS (2) | 3,689 |
| 215 |
| — |
| 2,574 |
| (1,536 | ) | — |
| (678 | ) | 844 |
| (173 | ) | 4,935 |
|
| Total trading account assets | 11,455 |
| 449 |
| — |
| 5,961 |
| (6,722 | ) | — |
| (1,733 | ) | 1,370 |
| (1,221 | ) | 9,559 |
|
Net derivative assets (3) | 5,866 |
| (221 | ) | — |
| 893 |
| (1,012 | ) | — |
| (3,328 | ) | (269 | ) | (461 | ) | 1,468 |
|
| AFS debt securities: | |
| |
| |
| |
| | | | | | |
|
| Mortgage-backed securities: | |
| |
| |
| |
| | | | | |
| |
|
| Agency | 37 |
| — |
| — |
| — |
| — |
| — |
| (4 | ) | — |
| (33 | ) | — |
|
| Non-agency residential | 860 |
| (69 | ) | 19 |
| — |
| (306 | ) | — |
| (2 | ) | — |
| (502 | ) | — |
|
| Non-agency commercial | 40 |
| — |
| — |
| — |
| (24 | ) | — |
| (6 | ) | — |
| — |
| 10 |
|
| Corporate/Agency bonds | 162 |
| (2 | ) | — |
| (2 | ) | — |
| — |
| (39 | ) | — |
| (27 | ) | 92 |
|
| Other taxable securities | 4,265 |
| 23 |
| 26 |
| 3,196 |
| (28 | ) | — |
| (3,345 | ) | — |
| (209 | ) | 3,928 |
|
| Tax-exempt securities | 2,648 |
| 61 |
| 20 |
| — |
| (133 | ) | — |
| (1,535 | ) | — |
| — |
| 1,061 |
|
| Total AFS debt securities | 8,012 |
| 13 |
| 65 |
| 3,194 |
| (491 | ) | — |
| (4,931 | ) | — |
| (771 | ) | 5,091 |
|
Loans and leases (4, 5) | 2,744 |
| 334 |
| — |
| 564 |
| (1,520 | ) | — |
| (274 | ) | 450 |
| (11 | ) | 2,287 |
|
Mortgage servicing rights (5) | 7,378 |
| (430 | ) | — |
| — |
| (122 | ) | 374 |
| (1,484 | ) | — |
| — |
| 5,716 |
|
Loans held-for-sale (4) | 3,387 |
| 352 |
| — |
| 794 |
| (834 | ) | — |
| (414 | ) | 80 |
| (632 | ) | 2,733 |
|
Other assets (6) | 4,235 |
| (54 | ) | — |
| 109 |
| (1,039 | ) | 270 |
| (381 | ) | — |
| (11 | ) | 3,129 |
|
| Trading account liabilities – Corporate securities and other | (114 | ) | 4 |
| — |
| 116 |
| (136 | ) | — |
| 80 |
| (68 | ) | 54 |
| (64 | ) |
Short-term borrowings (4) | — |
| — |
| — |
| — |
| — |
| (232 | ) | 232 |
| — |
| — |
| — |
|
Accrued expenses and other liabilities (4) | (14 | ) | (4 | ) | — |
| 8 |
| — |
| (9 | ) | — |
| — |
| 4 |
| (15 | ) |
Long-term debt (4) | (2,943 | ) | (307 | ) | — |
| 290 |
| (33 | ) | (259 | ) | 1,239 |
| (2,040 | ) | 1,752 |
| (2,301 | ) |
| |
(1) | Assets (liabilities). For assets, increase (decrease) to Level 3 and for liabilities, (increase) decrease to Level 3. |
| |
(2) | During 2012, approximately $900 million was reclassified from Trading account assets – Corporate securities, trading loans and other to Trading account assets – Mortgage trading loans and ABS. In the table above, this reclassification is presented as a sale of Trading account assets – Corporate securities, trading loans and other and as a purchase of Trading account assets – Mortgage trading loans and ABS. |
| |
(3) | Net derivatives include derivative assets of $8.1 billion and derivative liabilities of $6.6 billion. |
| |
(4) | Amounts represent instruments that are accounted for under the fair value option. |
| |
(5) | Issuances represent loan originations and mortgage servicing rights retained following securitizations or whole-loan sales. |
| |
(6) | Other assets is primarily comprised of net monoline exposure to a single counterparty and private equity investments. |
During 2012, the transfers into Level 3 included $1.4 billion of trading account assets, $269 million of net derivative assets, $450 million of loans and leases and $2.0 billion of long-term debt. Transfers into Level 3 for trading account assets were primarily the result of decreased market liquidity for certain corporate loans and updated information related to certain CLOs. Transfers into Level 3 for net derivative assets were primarily related to decreased price observability for certain long-dated equity derivative liabilities due to a lack of independent pricing. Transfers into Level 3 for loans and leases were due to updated information related to certain commercial loans. Transfers into Level 3 for long-term debt were primarily due to changes in the impact of unobservable inputs on the value of certain structured liabilities. Transfers occur on a regular basis for these long-term debt instruments due to changes in the impact of unobservable inputs on the value of the embedded derivative in relation to the instrument as a whole.
During 2012, the transfers out of Level 3 included $1.2 billion of trading account assets, $461 million of net derivative assets, $771 million of AFS debt securities, $632 million of LHFS and $1.8 billion of long-term debt. Transfers out of Level 3 for trading account assets were primarily related to increased market liquidity for certain corporate and commercial real estate loans. Transfers out of Level 3 for net derivative assets were primarily related to increased price observability (i.e., market comparables for the referenced instruments) for certain total return swaps and foreign exchange swaps. Transfers out of Level 3 for AFS debt securities were primarily related to increased price observability for certain non-agency RMBS and ABS. Transfers out of Level 3 for LHFS were primarily related to increased observable inputs, primarily liquid comparables. Transfers out of Level 3 for long-term debt were primarily due to changes in the impact of unobservable inputs on the value of certain structured liabilities.
The following tables summarize gains (losses) due to changes in fair value, including both realized and unrealized gains (losses), recorded in earnings for Level 3 assets and liabilities during 2014, 2013 and 2012. These amounts include gains (losses) on loans, LHFS, loan commitments and structured liabilities that are accounted for under the fair value option.
|
| | | | | | | | | | | | | | | |
| | | | | | | | |
| Level 3 – Total Realized and Unrealized Gains (Losses) Included in Earnings |
| | | | | | | | |
| | 2014 |
| (Dollars in millions) | Trading
Account
Profits (Losses) | | Mortgage
Banking
Income (Loss) (1) | | Other (2) | | Total |
| Trading account assets: | |
| | |
| | |
| | |
|
| Corporate securities, trading loans and other | $ | 180 |
| | $ | — |
| | $ | — |
| | $ | 180 |
|
| Non-U.S. sovereign debt | 30 |
| | — |
| | — |
| | 30 |
|
| Mortgage trading loans and ABS | 199 |
| | — |
| | — |
| | 199 |
|
| Total trading account assets | 409 |
| | — |
| | — |
| | 409 |
|
| Net derivative assets | (475 | ) | | 834 |
| | 104 |
| | 463 |
|
| AFS debt securities: | |
| | |
| | |
| | |
|
| Non-agency residential MBS | — |
| | — |
| | (2 | ) | | (2 | ) |
| Non-U.S. securities | — |
| | — |
| | (7 | ) | | (7 | ) |
| Other taxable securities | — |
| | — |
| | 9 |
| | 9 |
|
| Tax-exempt securities | — |
| | — |
| | 8 |
| | 8 |
|
| Total AFS debt securities | — |
| | — |
| | 8 |
| | 8 |
|
Loans and leases (3) | — |
| | — |
| | 69 |
| | 69 |
|
| Mortgage servicing rights | (6 | ) | | (1,225 | ) | | — |
| | (1,231 | ) |
Loans held-for-sale (3) | (14 | ) | | — |
| | 59 |
| | 45 |
|
| Other assets | — |
| | (79 | ) | | (19 | ) | | (98 | ) |
| Trading account liabilities – Corporate securities and other | 1 |
| | — |
| | — |
| | 1 |
|
Accrued expenses and other liabilities (3) | — |
| | — |
| | 2 |
| | 2 |
|
Long-term debt (3) | 78 |
| | — |
| | (29 | ) | | 49 |
|
| Total | $ | (7 | ) | | $ | (470 | ) | | $ | 194 |
| | $ | (283 | ) |
| | | | | | | | |
| | 2013 |
| Trading account assets: | |
| | |
| | |
| | |
|
| Corporate securities, trading loans and other | $ | 242 |
| | $ | — |
| | $ | — |
| | $ | 242 |
|
| Equity securities | 74 |
| | — |
| | — |
| | 74 |
|
| Non-U.S. sovereign debt | 50 |
| | — |
| | — |
| | 50 |
|
| Mortgage trading loans and ABS | 53 |
| | — |
| | — |
| | 53 |
|
| Total trading account assets | 419 |
| | — |
| | — |
| | 419 |
|
| Net derivative assets | (1,224 | ) | | 927 |
| | (7 | ) | | (304 | ) |
| AFS debt securities: | |
| | |
| | |
| | |
|
| Non-U.S. securities | — |
| | — |
| | 5 |
| | 5 |
|
| Other taxable securities | — |
| | — |
| | 9 |
| | 9 |
|
| Tax-exempt securities | — |
| | — |
| | 3 |
| | 3 |
|
| Total AFS debt securities | — |
| | — |
| | 17 |
| | 17 |
|
Loans and leases (3) | — |
| | (38 | ) | | 136 |
| | 98 |
|
| Mortgage servicing rights | — |
| | 1,941 |
| | — |
| | 1,941 |
|
Loans held-for-sale (3) | — |
| | 2 |
| | 60 |
| | 62 |
|
| Other assets | — |
| | 122 |
| | (410 | ) | | (288 | ) |
| Trading account liabilities – Corporate securities and other | 10 |
| | — |
| | — |
| | 10 |
|
Accrued expenses and other liabilities (3) | — |
| | 30 |
| | — |
| | 30 |
|
Long-term debt (3) | 45 |
| | — |
| | (32 | ) | | 13 |
|
| Total | $ | (750 | ) | | $ | 2,984 |
| | $ | (236 | ) | | $ | 1,998 |
|
| |
(1) | Mortgage banking income (loss) does not reflect the impact of Level 1 and Level 2 hedges on MSRs. |
| |
(2) | Amounts included are primarily recorded in other income (loss). Equity investment gains of $86 million and $77 million recorded on net derivative assets and other assets were also included for 2014 and 2013. |
| |
(3) | Amounts represent instruments that are accounted for under the fair value option. |
|
| | | | | | | | | | | | | | | |
| | | | | | | | |
| Level 3 – Total Realized and Unrealized Gains (Losses) Included in Earnings (continued) |
| | | | | | | | |
| | 2012 |
| (Dollars in millions) | Trading
Account
Profits (Losses) | | Mortgage
Banking
Income (Loss) (1) | | Other (2) | | Total |
| Trading account assets: | |
| | |
| | |
| | |
|
| Corporate securities, trading loans and other | $ | 195 |
| | $ | — |
| | $ | — |
| | $ | 195 |
|
| Equity securities | 31 |
| | — |
| | — |
| | 31 |
|
| Non-U.S. sovereign debt | 8 |
| | — |
| | — |
| | 8 |
|
| Mortgage trading loans and ABS | 215 |
| | — |
| | — |
| | 215 |
|
| Total trading account assets | 449 |
| | — |
| | — |
| | 449 |
|
| Net derivative assets | (3,208 | ) | | 2,987 |
| | — |
| | (221 | ) |
| AFS debt securities: | |
| | |
| | |
| | |
|
| Non-agency residential MBS | — |
| | — |
| | (69 | ) | | (69 | ) |
| Corporate/Agency bonds | — |
| | — |
| | (2 | ) | | (2 | ) |
| Other taxable securities | 2 |
| | — |
| | 21 |
| | 23 |
|
| Tax-exempt securities | — |
| | — |
| | 61 |
| | 61 |
|
| Total AFS debt securities | 2 |
| | — |
| | 11 |
| | 13 |
|
Loans and leases (3) | — |
| | — |
| | 334 |
| | 334 |
|
| Mortgage servicing rights | — |
| | (430 | ) | | — |
| | (430 | ) |
Loans held-for-sale (3) | — |
| | 148 |
| | 204 |
| | 352 |
|
| Other assets | — |
| | (74 | ) | | 20 |
| | (54 | ) |
| Trading account liabilities – Corporate securities and other | 4 |
| | — |
| | — |
| | 4 |
|
Accrued expenses and other liabilities (3) | — |
| | — |
| | (4 | ) | | (4 | ) |
Long-term debt (3) | (133 | ) | | — |
| | (174 | ) | | (307 | ) |
| Total | $ | (2,886 | ) | | $ | 2,631 |
| | $ | 391 |
| | $ | 136 |
|
| |
(1) | Mortgage banking income (loss) does not reflect the impact of Level 1 and Level 2 hedges on MSRs. |
| |
(2) | Amounts included are primarily recorded in other income (loss). Equity investment gains of $97 million recorded on other assets were also included for 2012. |
| |
(3) | Amounts represent instruments that are accounted for under the fair value option. |
The table below summarizes changes in unrealized gains (losses) recorded in earnings during 2014, 2013 and 2012 for Level 3 assets and liabilities that were still held at December 31, 2014, 2013 and 2012. These amounts include changes in fair value on loans, LHFS, loan commitments and structured liabilities that are accounted for under the fair value option.
|
| | | | | | | | | | | | | | | |
| | | | | | | | |
| Level 3 – Changes in Unrealized Gains (Losses) Relating to Assets and Liabilities Still Held at Reporting Date |
| | | | | | | | |
| | 2014 |
| (Dollars in millions) | Trading
Account
Profits (Losses) | | Mortgage
Banking
Income (Loss) (1) | | Other (2) | | Total |
| Trading account assets: | |
| | |
| | |
| | |
|
| Corporate securities, trading loans and other | $ | 69 |
| | $ | — |
| | $ | — |
| | $ | 69 |
|
| Equity securities | (8 | ) | | — |
| | — |
| | (8 | ) |
| Non-U.S. sovereign debt | 31 |
| | — |
| | — |
| | 31 |
|
| Mortgage trading loans and ABS | 79 |
| | — |
| | — |
| | 79 |
|
| Total trading account assets | 171 |
| | — |
| | — |
| | 171 |
|
| Net derivative assets | (276 | ) | | 85 |
| | 104 |
| | (87 | ) |
Loans and leases (3) | — |
| | — |
| | 76 |
| | 76 |
|
| Mortgage servicing rights | (6 | ) | | (1,747 | ) | | — |
| | (1,753 | ) |
Loans held-for-sale (3) | (14 | ) | | — |
| | 10 |
| | (4 | ) |
| Other assets | — |
| | (50 | ) | | 102 |
| | 52 |
|
| Trading account liabilities – Corporate securities and other | 1 |
| | — |
| | — |
| | 1 |
|
Accrued expenses and other liabilities (3) | — |
| | — |
| | 1 |
| | 1 |
|
Long-term debt (3) | 29 |
| | — |
| | (37 | ) | | (8 | ) |
| Total | $ | (95 | ) | | $ | (1,712 | ) | | $ | 256 |
| | $ | (1,551 | ) |
| | | | | | | | |
| | 2013 |
| Trading account assets: | |
| | |
| | |
| | |
|
| Corporate securities, trading loans and other | $ | (130 | ) | | $ | — |
| | $ | — |
| | $ | (130 | ) |
| Equity securities | 40 |
| | — |
| | — |
| | 40 |
|
| Non-U.S. sovereign debt | 80 |
| | — |
| | — |
| | 80 |
|
| Mortgage trading loans and ABS | (174 | ) | | — |
| | — |
| | (174 | ) |
| Total trading account assets | (184 | ) | | — |
| | — |
| | (184 | ) |
| Net derivative assets | (1,375 | ) | | 42 |
| | (7 | ) | | (1,340 | ) |
Loans and leases (3) | — |
| | (34 | ) | | 152 |
| | 118 |
|
| Mortgage servicing rights | — |
| | 1,541 |
| | — |
| | 1,541 |
|
Loans held-for-sale (3) | — |
| | 6 |
| | 57 |
| | 63 |
|
| Other assets | — |
| | 166 |
| | 14 |
| | 180 |
|
Long-term debt (3) | (4 | ) | | — |
| | (32 | ) | | (36 | ) |
| Total | $ | (1,563 | ) | | $ | 1,721 |
| | $ | 184 |
| | $ | 342 |
|
| | | | | | | | |
| | 2012 |
| Trading account assets: | | | | | | | |
| Corporate securities, trading loans and other | $ | (19 | ) | | $ | — |
| | $ | — |
| | $ | (19 | ) |
| Equity securities | 17 |
| | — |
| | — |
| | 17 |
|
| Non-U.S. sovereign debt | 20 |
| | — |
| | — |
| | 20 |
|
| Mortgage trading loans and ABS | 36 |
| | — |
| | — |
| | 36 |
|
| Total trading account assets | 54 |
| | — |
| | — |
| | 54 |
|
| Net derivative assets | (2,782 | ) | | 456 |
| | — |
| | (2,326 | ) |
| AFS debt securities – Other taxable securities | 2 |
| | — |
| | — |
| | 2 |
|
Loans and leases (3) | — |
| | — |
| | 214 |
| | 214 |
|
| Mortgage servicing rights | — |
| | (1,100 | ) | | — |
| | (1,100 | ) |
Loans held-for-sale (3) | — |
| | 112 |
| | 168 |
| | 280 |
|
| Other assets | — |
| | (71 | ) | | 50 |
| | (21 | ) |
| Trading account liabilities – Corporate securities and other | 4 |
| | — |
| | — |
| | 4 |
|
Accrued expenses and other liabilities (3) | — |
| | — |
| | (2 | ) | | (2 | ) |
Long-term debt (3) | (136 | ) | | — |
| | (173 | ) | | (309 | ) |
| Total | $ | (2,858 | ) | | $ | (603 | ) | | $ | 257 |
| | $ | (3,204 | ) |
| |
(1) | Mortgage banking income (loss) does not reflect the impact of Level 1 and Level 2 hedges on MSRs. |
| |
(2) | Amounts included are primarily recorded in other income (loss). Equity investment gains of $170 million and $53 million recorded on net derivative assets and other assets were included for 2014 and 2013, and gains of $141 million recorded on other assets were included for 2012. |
| |
(3) | Amounts represent instruments that are accounted for under the fair value option. |
The following tables present information about significant unobservable inputs related to the Corporation’s material categories of Level 3 financial assets and liabilities at December 31, 2014 and 2013.
|
| | | | | | | | | |
| | | | | | |
| Quantitative Information about Level 3 Fair Value Measurements at December 31, 2014 | |
| | | | | |
| (Dollars in millions) | | | Inputs |
| Financial Instrument | Fair Value | Valuation Technique | Significant Unobservable Inputs | Ranges of Inputs | Weighted Average |
Loans and Securities (1) | | | | | |
| Instruments backed by residential real estate assets | $ | 2,030 |
| Discounted cash flow, Market comparables | Yield | 0% to 25% |
| 6 | % |
| Trading account assets – Mortgage trading loans and ABS | 483 |
| Prepayment speed | 0% to 35% CPR |
| 14 | % |
| Loans and leases | 1,374 |
| Default rate | 2% to 15% CDR |
| 7 | % |
| Loans held-for-sale | 173 |
| Loss severity | 26% to 100% |
| 34 | % |
| Commercial loans, debt securities and other | $ | 7,203 |
| Discounted cash flow, Market comparables | Yield | 0% to 40% |
| 9 | % |
| Trading account assets – Corporate securities, trading loans and other | 3,224 |
| Enterprise value/EBITDA multiple | 0x to 30x |
| 6x |
|
| Trading account assets – Non-U.S. sovereign debt | 574 |
| Prepayment speed | 1% to 30% |
| 12 | % |
| Trading account assets – Mortgage trading loans and ABS | 1,580 |
| Default rate | 1% to 5% |
| 4 | % |
| AFS debt securities – Other taxable securities | 1,216 |
| Loss severity | 25% to 40% |
| 38 | % |
| Loans and leases | 609 |
| Duration | 0 years to 5 years |
| 3 years |
|
| | | Price | $0 to $107 |
| $76 |
| Auction rate securities | $ | 1,096 |
| Discounted cash flow, Market comparables | Price | $60 to $100 |
| $95 |
| Trading account assets – Corporate securities, trading loans and other | 46 |
| | | |
| AFS debt securities – Other taxable securities | 451 |
| | | |
| AFS debt securities – Tax-exempt securities | 599 |
| | | |
| Structured liabilities | | | | | |
| Long-term debt | $ | (2,362 | ) | Industry standard derivative pricing (2, 3) | Equity correlation | 20% to 98% |
| 65 | % |
| | | Long-dated equity volatilities | 6% to 69% |
| 24 | % |
| | | Long-dated volatilities (IR) | 0% to 2% |
| 1 | % |
| Net derivative assets | | | | | |
| Credit derivatives | $ | 22 |
| Discounted cash flow, Stochastic recovery correlation model | Yield | 0% to 25% |
| 14 | % |
| | | Upfront points | 0 points to 100 points |
| 65 points |
|
| | | Spread to index | 25 bps to 450 bps |
| 119 bps |
|
| | | Credit correlation | 24% to 99% |
| 51 | % |
| | | Prepayment speed | 3% to 20% CPR |
| 11 | % |
| | | Default rate | 4% CDR |
| n/a |
|
| | | Loss severity | 35 | % | n/a |
|
| Equity derivatives | $ | (1,560 | ) | Industry standard derivative pricing (2) | Equity correlation | 20% to 98% |
| 65 | % |
| | | Long-dated equity volatilities | 6% to 69% |
| 24 | % |
| Commodity derivatives | $ | 141 |
| Discounted cash flow, Industry standard derivative pricing (2) | Natural gas forward price | $2/MMBtu to $7/MMBtu |
| $5/MMBtu |
|
| | | Correlation | 82% to 93% |
| 90 | % |
| | | Volatilities | 16% to 98% |
| 35 | % |
| Interest rate derivatives | $ | 477 |
| Industry standard derivative pricing (3) | Correlation (IR/IR) | 11% to 99% |
| 55 | % |
| | | Correlation (FX/IR) | -48% to 40% |
| -5 | % |
| | | Long-dated inflation rates | 0% to 3% |
| 1 | % |
| | | Long-dated inflation volatilities | 0% to 2% |
| 1 | % |
| Total net derivative assets | $ | (920 | ) | | | | |
| |
(1) | The categories are aggregated based upon product type which differs from financial statement classification. The following is a reconciliation to the line items in the table on page 245: Trading account assets – Corporate securities, trading loans and other of $3.3 billion, Trading account assets – Non-U.S. sovereign debt of $574 million, Trading account assets – Mortgage trading loans and ABS of $2.1 billion, AFS debt securities – Other taxable securities of $1.7 billion, AFS debt securities – Tax-exempt securities of $599 million, Loans and leases of $2.0 billion and LHFS of $173 million. |
| |
(2) | Includes models such as Monte Carlo simulation and Black-Scholes. |
| |
(3) | Includes models such as Monte Carlo simulation, Black-Scholes and other methods that model the joint dynamics of interest, inflation and foreign exchange rates. |
CPR = Constant Prepayment Rate
CDR = Constant Default Rate
EBITDA = Earnings before interest, taxes, depreciation and amortization
MMBtu = Million British thermal units
IR = Interest Rate
FX = Foreign Exchange
n/a = not applicable
|
| | | | | | | | |
| | | | | | |
| Quantitative Information about Level 3 Fair Value Measurements at December 31, 2013 |
| | | | | |
| (Dollars in millions) | | | Inputs |
| Financial Instrument | Fair
Value | Valuation
Technique | Significant Unobservable
Inputs | Ranges of
Inputs | Weighted Average |
Loans and Securities (1) | | | | | |
| Instruments backed by residential real estate assets | $ | 3,443 |
| Discounted cash flow, Market comparables | Yield | 2% to 25% | 6 | % |
| Trading account assets – Mortgage trading loans and ABS | 363 |
| Prepayment speed | 0% to 35% CPR | 9 | % |
| Loans and leases | 2,151 |
| Default rate | 1% to 20% CDR | 6 | % |
| Loans held-for-sale | 929 |
| Loss severity | 21% to 80% | 35 | % |
| Commercial loans, debt securities and other | $ | 12,135 |
| Discounted cash flow, Market comparables | Yield | 0% to 45% | 5 | % |
| Trading account assets – Corporate securities, trading loans and other | 3,462 |
| Enterprise value/EBITDA multiple | 0x to 24x | 7x |
|
| Trading account assets – Non-U.S. sovereign debt | 468 |
| Prepayment speed | 5% to 40% | 19 | % |
| Trading account assets – Mortgage trading loans and ABS | 4,268 |
| Default rate | 1% to 5% | 4 | % |
| AFS debt securities – Other taxable securities | 3,031 |
| Loss severity | 25% to 42% | 36 | % |
| Loans and leases | 906 |
| Duration | 1 year to 5 years | 4 years |
|
| Auction rate securities | $ | 1,719 |
| Discounted cash flow, Market comparables | Projected tender price/Refinancing level | 60% to 100% | 96 | % |
| Trading account assets – Corporate securities, trading loans and other | 97 |
| | |
| AFS debt securities – Other taxable securities | 816 |
| | | |
| AFS debt securities – Tax-exempt securities | 806 |
| | | |
| Structured liabilities | | | | | |
| Long-term debt | $ | (1,990 | ) | Industry standard derivative pricing (2, 3) | Equity correlation | 18% to 98% | 70 | % |
| | | Long-dated equity volatilities | 4% to 63% | 27 | % |
| | | Long-dated volatilities (IR) | 0% to 2% | 1 | % |
| Net derivative assets | | | | | |
| Credit derivatives | $ | 808 |
| Discounted cash flow, Stochastic recovery correlation model | Yield | 3% to 25% | 14 | % |
| | | Upfront points | 0 points to 100 points | 63 points |
|
| | | Spread to index | -1,407 bps to 1,741 bps | 91 bps |
|
| | | Credit correlation | 14% to 99% | 47 | % |
| | | Prepayment speed | 3% to 40% CPR | 13 | % |
| | | Default rate | 1% to 5% CDR | 3 | % |
| | | Loss severity | 20% to 42% | 35 | % |
| Equity derivatives | $ | (1,596 | ) | Industry standard derivative pricing (2) | Equity correlation | 18% to 98% | 70 | % |
| | | Long-dated equity volatilities | 4% to 63% | 27 | % |
| Commodity derivatives | $ | 6 |
| Discounted cash flow, Industry standard derivative pricing (2) | Natural gas forward price | $3/MMBtu to $11/MMBtu | $6/MMBtu |
|
| | | Correlation | 47% to 89% | 81 | % |
| | | Volatilities | 9% to 109% | 30 | % |
| Interest rate derivatives | $ | 558 |
| Industry standard derivative pricing (3) | Correlation (IR/IR) | 24% to 99% | 60 | % |
| | | Correlation (FX/IR) | -30% to 40% | -4 | % |
| | | Long-dated inflation rates | 0% to 3% | 2 | % |
| | | Long-dated inflation volatilities | 0% to 2% | 1 | % |
| Total net derivative assets | $ | (224 | ) | | | | |
| |
(1) | The categories are aggregated based upon product type which differs from financial statement classification. The following is a reconciliation to the line items in the table on page 246: Trading account assets – Corporate securities, trading loans and other of $3.6 billion, Trading account assets – Non-U.S. sovereign debt of $468 million, Trading account assets – Mortgage trading loans and ABS of $4.6 billion, AFS debt securities – Other taxable securities of $3.8 billion, AFS debt securities – Tax-exempt securities of $806 million, Loans and leases of $3.1 billion and LHFS of $929 million. |
| |
(2) | Includes models such as Monte Carlo simulation and Black-Scholes. |
| |
(3) | Includes models such as Monte Carlo simulation, Black-Scholes and other methods that model the joint dynamics of interest, inflation and foreign exchange rates. |
CPR = Constant Prepayment Rate
CDR = Constant Default Rate
EBITDA = Earnings before interest, taxes, depreciation and amortization
MMBtu = Million British thermal units
IR = Interest Rate
FX = Foreign Exchange
In the tables above, instruments backed by residential real estate assets include RMBS, whole loans and mortgage CDOs. Commercial loans, debt securities and other include corporate CLOs and CDOs, commercial loans and bonds, and securities backed by non-real estate assets. Structured liabilities primarily include equity-linked notes that are accounted for under the fair value option.
In addition to the instruments in the tables above, the Corporation held $347 million and $767 million of instruments at December 31, 2014 and 2013 consisting primarily of certain direct private equity investments and private equity funds that were classified as Level 3 and reported within other assets. Valuations of direct private equity investments are based on the most recent company financial information. Inputs generally include market and acquisition comparables, entry level multiples, as well as other variables. The Corporation selects a valuation methodology (e.g., market comparables) for each investment and, in certain instances, multiple inputs are weighted to derive the most representative value. Discounts are applied as appropriate to consider the lack of liquidity and marketability versus publicly-traded companies. For private equity funds, fair value is determined using the net asset value as provided by the individual fund’s general partner.
The Corporation uses multiple market approaches in valuing certain of its Level 3 financial instruments. For example, market comparables and discounted cash flows are used together. For a given product, such as corporate debt securities, market comparables may be used to estimate some of the unobservable inputs and then these inputs are incorporated into a discounted cash flow model. Therefore, the balances disclosed encompass both of these techniques.
The level of aggregation and diversity within the products disclosed in the tables result in certain ranges of inputs being wide and unevenly distributed across asset and liability categories. At December 31, 2014 and 2013, weighted averages are disclosed for all loans, securities, structured liabilities and net derivative assets.
For more information on the inputs and techniques used in the valuation of MSRs, see Note 23 – Mortgage Servicing Rights.
Sensitivity of Fair Value Measurements to Changes in Unobservable Inputs
Loans and Securities
For instruments backed by residential real estate assets and commercial loans, debt securities and other, a significant increase
in market yields, default rates, loss severities or duration would result in a significantly lower fair value for long positions. Short positions would be impacted in a directionally opposite way. The impact of changes in prepayment speeds would have differing impacts depending on the seniority of the instrument and, in the case of CLOs, whether prepayments can be reinvested.
For auction rate securities, a significant increase in price and/or projected tender price/refinancing levels would result in a significantly higher fair value.
Structured Liabilities and Derivatives
For credit derivatives, a significant increase in market yield, including spreads to indices, upfront points (i.e., a single upfront payment made by a protection buyer at inception), default rates or loss severities would result in a significantly lower fair value for protection sellers and higher fair value for protection buyers. The impact of changes in prepayment speeds would have differing impacts depending on the seniority of the instrument and, in the case of CLOs, whether prepayments can be reinvested.
Structured credit derivatives, which include tranched portfolio CDS and derivatives with derivative product company (DPC) and monoline counterparties, are impacted by credit correlation, including default and wrong-way correlation. Default correlation is a parameter that describes the degree of dependence among credit default rates within a credit portfolio that underlies a credit derivative instrument. The sensitivity of this input on the fair value varies depending on the level of subordination of the tranche. For senior tranches that are net purchases of protection, a significant increase in default correlation would result in a significantly higher fair value. Net short protection positions would be impacted in a directionally opposite way. Wrong-way correlation is a parameter that describes the probability that as exposure to a counterparty increases, the credit quality of the counterparty decreases. A significantly higher degree of wrong-way correlation between a DPC counterparty and underlying derivative exposure would result in a significantly lower fair value.
For equity derivatives, interest rate derivatives and structured liabilities, a significant change in long-dated rates and volatilities and correlation inputs (e.g., the degree of correlation between an equity security and an index, between two different interest rates, or between interest rates and foreign exchange rates) would result in a significant impact to the fair value; however, the magnitude and direction of the impact depends on whether the Corporation is long or short the exposure.
Nonrecurring Fair Value
The Corporation holds certain assets that are measured at fair value, but only in certain situations (e.g., impairment) and these measurements are referred to herein as nonrecurring. These assets primarily include LHFS, certain loans and leases, and foreclosed properties. The amounts below represent only balances measured at fair value during 2014, 2013 and 2012, and still held as of the reporting date.
|
| | | | | | | | | | | | | | | |
| | | | | | | | |
| Assets Measured at Fair Value on a Nonrecurring Basis |
| | | | | | | | |
| | December 31 |
| | 2014 | | 2013 |
| (Dollars in millions) | Level 2 | | Level 3 | | Level 2 | | Level 3 |
| Assets | |
| | |
| | | | |
|
| Loans held-for-sale | $ | 156 |
| | $ | 30 |
| | $ | 2,138 |
| | $ | 115 |
|
| Loans and leases | 5 |
| | 4,636 |
| | 18 |
| | 5,240 |
|
Foreclosed properties (1) | — |
| | 1,197 |
| | 12 |
| | 1,258 |
|
| Other assets | 13 |
| | — |
| | 88 |
| | — |
|
| | | | | | | | |
| | | | Gains (Losses) |
| | | | 2014 | | 2013 | | 2012 |
| Assets | | | |
| | |
| | |
|
| Loans held-for-sale | | | $ | (19 | ) | | $ | (71 | ) | | $ | (24 | ) |
| Loans and leases | | | (1,132 | ) | | (1,104 | ) | | (3,116 | ) |
Foreclosed properties (1) | | | (40 | ) | | (39 | ) | | (47 | ) |
| Other assets | | | (6 | ) | | (20 | ) | | (16 | ) |
| |
(1) | Amounts are included in other assets on the Consolidated Balance Sheet and represent fair value of, and related losses on, foreclosed properties that were written down subsequent to their initial classification as foreclosed properties. |
The table below presents information about significant unobservable inputs related to the Corporation’s nonrecurring Level 3 financial assets and liabilities at December 31, 2014 and 2013.
|
| | | | | | | | |
| | | | | | |
| Quantitative Information about Nonrecurring Level 3 Fair Value Measurements |
| | | | | | |
| | December 31, 2014 |
| (Dollars in millions) | | | Inputs |
| Financial Instrument | Fair Value | Valuation Technique | Significant Unobservable Inputs | Ranges of Inputs | Weighted Average |
| Instruments backed by residential real estate assets | $ | 4,636 |
| Market comparables | OREO discount | 0% to 28% | 8 | % |
| Loans and leases | 4,636 |
| Cost to sell | 7% to 14% | 8 | % |
|
| | | | | | | | | |
| | December 31, 2013 |
| Instruments backed by residential real estate assets | $ | 5,240 |
| Market comparables | OREO discount | 0% to 19% |
| 8 | % |
| Loans and leases | 5,240 |
| Cost to sell | 8 | % | n/a |
|
n/a = not applicable
Instruments backed by residential real estate assets represent residential mortgages where the loan has been written down to the fair value of the underlying collateral. In addition to the instruments disclosed in the table above, the Corporation holds foreclosed residential properties where the fair value is based on
unadjusted third-party appraisals or broker price opinions. Appraisals are generally conducted every 90 days. Factors considered in determining the fair value include geographic sales trends, the value of comparable surrounding properties as well as the condition of the property.
NOTE 21 Fair Value Option
Loans and Loan Commitments
The Corporation elects to account for certain commercial loans and loan commitments that exceed the Corporation’s single name credit risk concentration guidelines under the fair value option. Lending commitments, both funded and unfunded, are actively managed and monitored and, as appropriate, credit risk for these lending relationships may be mitigated through the use of credit derivatives, with the Corporation’s public side credit view and market perspectives determining the size and timing of the hedging activity. These credit derivatives do not meet the requirements for designation as accounting hedges and therefore are carried at fair value with changes in fair value recorded in other income (loss). Electing the fair value option allows the Corporation to carry these loans and loan commitments at fair value, which is more consistent with management’s view of the underlying economics and the manner in which they are managed. In addition, election of the fair value option allows the Corporation to reduce the accounting volatility that would otherwise result from the asymmetry created by accounting for the financial instruments at historical cost and the credit derivatives at fair value. The Corporation also elected the fair value option for certain residential mortgage loans that
were classified as held-for-sale and certain loans held in consolidated VIEs. Of the changes in fair value of these loans, gains of $31532 million, $148 million and $1.2 billion$527 million were attributable to changes in borrower-specific credit risk in2014, 2013 and 2012.
Loans Held-for-sale
The Corporation elects to account for residential mortgage LHFS, commercial mortgage LHFS and certain other LHFS under the fair value option with interest income on these LHFS recorded in other interest income. These loans are actively managed and monitored and, as appropriate, certain market risks of the loans may be mitigated through the use of derivatives. The Corporation has elected not to designate the derivatives as qualifying accounting hedges and therefore they are carried at fair value with changes in fair value recorded in other income (loss). The changes in fair value of the loans are largely offset by changes in the fair value of the derivatives. Of the changes in fair value of these loans, gains of $22584 million, $225 million and $425 million were attributable to changes in borrower-specific credit risk in2014, 2013 and 2012. Election of the fair value option allows the Corporation to reduce the accounting volatility that would otherwise result from the asymmetry created by accounting for the financial instruments at the lower of cost or fair value and the derivatives at fair value. The Corporation has not elected to account for certain other LHFS under the fair value option primarily because these loans are floating-rate loans that are not hedged using derivative instruments.
Loans Reported as Trading Account Assets
The Corporation elects to account for certain loans that are held for the purpose of trading and risk-managed on a fair value basis under the fair value option. Of the changes in fair value of these loans, gains of $28 million and $56 million were attributable to changes in borrower-specific credit risk in 2014 and 2013. An immaterial portion of the changes in fair value of these loans was attributable to changes in borrower-specific credit risk in 2013 and 2012.
Other Assets
The Corporation elects to account for certain private equity investments that are not in an investment company under the fair value option as this measurement basis is consistent with applicable accounting guidance for similar investments that are in an investment company. The Corporation also elects to account for certain long-term fixed-rate margin loans that are hedged with derivatives under the fair value option. Election of the fair value option allows the Corporation to reduce the accounting volatility that would otherwise result from the asymmetry created by accounting for the financial instruments at historical cost and the derivatives at fair value.
Securities Financing Agreements
The Corporation elects to account for certain securities financing agreements, including resale and repurchase agreements, under the fair value option based on the tenor of the agreements, which reflects the magnitude of the interest rate risk. The majority of securities financing agreements collateralized by U.S. government securities are not accounted for under the fair value option as these contracts are generally short-dated and therefore the interest rate risk is not significant.
Long-term Deposits
The Corporation elects to account for certain long-term fixed-rate and rate-linked deposits that are hedged with derivatives that do not qualify for hedge accounting under the fair value option. Election of the fair value option allows the Corporation to reduce the accounting volatility that would otherwise result from the
asymmetry created by accounting for the financial instruments at historical cost and the derivatives at fair value. The Corporation did not elect to carry other long-term deposits at fair value because they were not hedged using derivatives.
Short-term Borrowings
The Corporation elects to account for certain short-term borrowings, primarily short-term structured liabilities, under the fair value option because this debt is risk-managed on a fair value basis.
The Corporation elects to account for certain asset-backed secured financings, which are also classified in short-term borrowings, under the fair value option. Election of the fair value option allows the Corporation to reduce the accounting volatility that would otherwise result from the asymmetry created by accounting for the asset-backed secured financings at historical cost and the corresponding mortgage LHFS securing these financings at fair value.
Long-term Debt
The Corporation elects to account for certain long-term debt, primarily structured liabilities, under the fair value option. This long-term debt is either risk-managed on a fair value basis or the related hedges do not qualify for hedge accounting.
The table below provides information about the fair value carrying amount and the contractual principal outstanding of assets and liabilities accounted for under the fair value option at December 31, 20132014 and 2012.2013.
| | | | | | | | | | | | | | | | | | | | | | | | | |
| Fair Value Option Elections | | | | | | | | | | | | | | | | | | | | | | |
| | | | | | | | | | | | | | | | | | | | | | | |
| | December 31 | December 31 |
| | 2013 | | 2012 | 2014 | | 2013 |
| (Dollars in millions) | Fair Value Carrying Amount | | Contractual Principal Outstanding | | Fair Value Carrying Amount Less Unpaid Principal | | Fair Value Carrying Amount | | Contractual Principal Outstanding | | Fair Value Carrying Amount Less Unpaid Principal | Fair Value Carrying Amount | | Contractual Principal Outstanding | | Fair Value Carrying Amount Less Unpaid Principal | | Fair Value Carrying Amount | | Contractual Principal Outstanding | | Fair Value Carrying Amount Less Unpaid Principal |
Loans reported as trading account assets (1) | $ | 2,200 |
| | $ | 4,315 |
| | $ | (2,115 | ) | | $ | 1,663 |
| | $ | 2,879 |
| | $ | (1,216 | ) | $ | 4,607 |
| | $ | 8,487 |
| | $ | (3,880 | ) | | $ | 2,406 |
| | $ | 4,541 |
| | $ | (2,135 | ) |
| Trading inventory - other | 5,475 |
| | n/a |
| | n/a |
| | 2,170 |
| | n/a |
| | n/a |
| |
Trading inventory – other | | 6,865 |
| | n/a |
| | n/a |
| | 5,475 |
| | n/a |
| | n/a |
|
| Consumer and commercial loans | 10,042 |
| | 10,423 |
| | (381 | ) | | 9,002 |
| | 9,576 |
| | (574 | ) | 8,681 |
| | 8,925 |
| | (244 | ) | | 10,042 |
| | 10,423 |
| | (381 | ) |
| Loans held-for-sale | 6,656 |
| | 6,996 |
| | (340 | ) | | 11,659 |
| | 12,676 |
| | (1,017 | ) | 6,801 |
| | 6,920 |
| | (119 | ) | | 6,656 |
| | 6,996 |
| | (340 | ) |
| Securities financing agreements | 109,298 |
| | 109,032 |
| | 266 |
| | 141,309 |
| | 140,791 |
| | 518 |
| 97,539 |
| | 97,234 |
| | 305 |
| | 95,156 |
| | 94,890 |
| | 266 |
|
| Other assets | 278 |
| | 270 |
| | 8 |
| | 453 |
| | 270 |
| | 183 |
| 253 |
| | 270 |
| | (17 | ) | | 278 |
| | 270 |
| | 8 |
|
| Long-term deposits | 1,899 |
| | 2,115 |
| | (216 | ) | | 2,262 |
| | 2,046 |
| | 216 |
| 1,469 |
| | 1,361 |
| | 108 |
| | 1,899 |
| | 1,797 |
| | 102 |
|
| Asset-backed secured financings | — |
| | — |
| | — |
| | 741 |
| | 1,176 |
| | (435 | ) | |
| Unfunded loan commitments | 354 |
| | n/a |
| | n/a |
| | 528 |
| | n/a |
| | n/a |
| 405 |
| | n/a |
| | n/a |
| | 354 |
| | n/a |
| | n/a |
|
| Short-term borrowings | 1,520 |
| | 1,520 |
| | — |
| | 3,333 |
| | 3,333 |
| | — |
| 2,697 |
| | 2,697 |
| | — |
| | 1,520 |
| | 1,520 |
| | — |
|
Long-term debt (2, 3) | 47,035 |
| | 46,669 |
| | 366 |
| | 49,161 |
| | 50,792 |
| | (1,631 | ) | |
Long-term debt (2) | | 36,404 |
| | 35,815 |
| | 589 |
| | 47,035 |
| | 46,669 |
| | 366 |
|
| |
(1) | A significant portion of the loans reported as trading account assets are distressed loans which trade and were purchased at a deep discount to par, and the remainder are loans with a fair value near contractual principal outstanding. |
| |
(2) | The majority of the difference between the fair value carrying amount and contractual principal outstanding at December 31, 2013 and 2012 relates to the impact of the Corporation’s credit spreads as well as the fair value of the embedded derivative, where applicable.
|
| |
(3)
| Includes structured liabilities with a fair value of $40.735.3 billion and contractual principal outstanding of$34.6 billion at December 31, 2014 compared to $40.7 billion and $39.7 billion at December 31, 2013 compared to $39.3 billion and $39.9 billion at December 31, 2012. |
n/a = not applicable
|
| | |
| | 255Bank of America 20132712014 | | |
The table below provides information about where changes in the fair value of assets and liabilities accounted for under the fair value option are included in the Consolidated Statement of Income for 20132014, 20122013 and 20112012.
| | | | | | | | | | | | | | | | | |
Gains (Losses) Relating to Assets and Liabilities Accounted for Under the Fair Value Option | | | | | | | | | | | | | | | | |
| | 2013 | 2014 |
| (Dollars in millions) | Trading Account Profits (Losses) | | Mortgage Banking Income (Loss) | | Other Income (Loss) | | Total | Trading Account Profits (Losses) | | Mortgage Banking Income (Loss) | | Other Income (Loss) | | Total |
| Loans reported as trading account assets | $ | 83 |
| | $ | — |
| | $ | — |
| | $ | 83 |
| $ | (87 | ) | | $ | — |
| | $ | — |
| | $ | (87 | ) |
Trading inventory - other (1) | 1,355 |
| | — |
| | — |
| | 1,355 |
| |
Trading inventory – other (1) | | 1,091 |
| | — |
| | — |
| | 1,091 |
|
| Consumer and commercial loans | | (24 | ) | | — |
| | 69 |
| | 45 |
|
Loans held-for-sale (2) | | (56 | ) | | 798 |
| | 83 |
| | 825 |
|
| Securities financing agreements | | (110 | ) | | — |
| | — |
| | (110 | ) |
| Long-term deposits | | 23 |
| | — |
| | (26 | ) | | (3 | ) |
| Unfunded loan commitments | | — |
| | — |
| | (64 | ) | | (64 | ) |
| Short-term borrowings | | 52 |
| | — |
| | — |
| | 52 |
|
Long-term debt (3) | | 239 |
| | — |
| | 407 |
| | 646 |
|
| Total | | $ | 1,128 |
| | $ | 798 |
| | $ | 469 |
| | $ | 2,395 |
|
| | | | | | | | | |
| | | 2013 |
| Loans reported as trading account assets | | $ | 83 |
| | $ | — |
| | $ | — |
| | $ | 83 |
|
Trading inventory – other (1) | | 1,355 |
| | — |
| | — |
| | 1,355 |
|
| Consumer and commercial loans | (28 | ) | | (38 | ) | | 240 |
| | 174 |
| (28 | ) | | (38 | ) | | 240 |
| | 174 |
|
Loans held-for-sale (2) | 7 |
| | 966 |
| | 75 |
| | 1,048 |
| 7 |
| | 966 |
| | 75 |
| | 1,048 |
|
| Securities financing agreements | (80 | ) | | — |
| | — |
| | (80 | ) | (80 | ) | | — |
| | — |
| | (80 | ) |
| Other assets | — |
| | — |
| | (77 | ) | | (77 | ) | — |
| | — |
| | (77 | ) | | (77 | ) |
| Long-term deposits | 30 |
| | — |
| | 84 |
| | 114 |
| 30 |
| | — |
| | 84 |
| | 114 |
|
| Asset-backed secured financings | — |
| | (91 | ) | | — |
| | (91 | ) | — |
| | (91 | ) | | — |
| | (91 | ) |
| Unfunded loan commitments | — |
| | — |
| | 180 |
| | 180 |
| — |
| | — |
| | 180 |
| | 180 |
|
| Short-term borrowings | (70 | ) | | — |
| | — |
| | (70 | ) | (70 | ) | | — |
| | — |
| | (70 | ) |
Long-term debt (3) | (602 | ) | | — |
| | (649 | ) | | (1,251 | ) | (602 | ) | | — |
| | (649 | ) | | (1,251 | ) |
| Total | $ | 695 |
| | $ | 837 |
| | $ | (147 | ) | | $ | 1,385 |
| $ | 695 |
| | $ | 837 |
| | $ | (147 | ) | | $ | 1,385 |
|
| | | | | | | | | | | | | | | |
| | 2012 | 2012 |
| Loans reported as trading account assets | $ | 232 |
| | $ | — |
| | $ | — |
| | $ | 232 |
| $ | 232 |
| | $ | — |
| | $ | — |
| | $ | 232 |
|
Trading inventory - other (1) | 659 |
| | — |
| | — |
| | 659 |
| |
Trading inventory – other (1) | | 659 |
| | — |
| | — |
| | 659 |
|
| Consumer and commercial loans | 17 |
| | — |
| | 542 |
| | 559 |
| 17 |
| | — |
| | 542 |
| | 559 |
|
Loans held-for-sale (2) | 75 |
| | 3,048 |
| | 190 |
| | 3,313 |
| 75 |
| | 3,048 |
| | 190 |
| | 3,313 |
|
| Securities financing agreements | (90 | ) | | — |
| | — |
| | (90 | ) | (90 | ) | | — |
| | — |
| | (90 | ) |
| Other assets | — |
| | — |
| | 12 |
| | 12 |
| — |
| | — |
| | 12 |
| | 12 |
|
| Long-term deposits | — |
| | — |
| | 29 |
| | 29 |
| — |
| | — |
| | 29 |
| | 29 |
|
| Asset-backed secured financings | — |
| | (180 | ) | | — |
| | (180 | ) | — |
| | (180 | ) | | — |
| | (180 | ) |
| Unfunded loan commitments | — |
| | — |
| | 704 |
| | 704 |
| — |
| | — |
| | 704 |
| | 704 |
|
| Short-term borrowings | 1 |
| | — |
| | — |
| | 1 |
| 1 |
| | — |
| | — |
| | 1 |
|
Long-term debt (3) | (1,888 | ) | | — |
| | (5,107 | ) | | (6,995 | ) | (1,888 | ) | | — |
| | (5,107 | ) | | (6,995 | ) |
| Total | $ | (994 | ) | | $ | 2,868 |
| | $ | (3,630 | ) | | $ | (1,756 | ) | $ | (994 | ) | | $ | 2,868 |
| | $ | (3,630 | ) | | $ | (1,756 | ) |
| | | | | | | | | |
| | 2011 | |
| Loans reported as trading account assets | $ | 73 |
| | $ | — |
| | $ | — |
| | $ | 73 |
| |
| Consumer and commercial loans | 15 |
| | — |
| | (275 | ) | | (260 | ) | |
Loans held-for-sale (2) | (20 | ) | | 4,535 |
| | 148 |
| | 4,663 |
| |
| Securities financing agreements | 127 |
| | — |
| | — |
| | 127 |
| |
| Other assets | — |
| | — |
| | 196 |
| | 196 |
| |
| Long-term deposits | — |
| | — |
| | (77 | ) | | (77 | ) | |
| Asset-backed secured financings | — |
| | (30 | ) | | — |
| | (30 | ) | |
| Unfunded loan commitments | — |
| | — |
| | (429 | ) | | (429 | ) | |
| Short-term borrowings | 261 |
| | — |
| | — |
| | 261 |
| |
Long-term debt (3) | 2,149 |
| | — |
| | 3,320 |
| | 5,469 |
| |
| Total | $ | 2,605 |
| | $ | 4,505 |
| | $ | 2,883 |
| | $ | 9,993 |
| |
| |
(1) | The gains (losses) in trading account profits (losses) are primarily offset by lossesgains (losses) on trading liabilities that hedge these assets. |
| |
(2) | Includes the value of interest rate lock commitments on loans funded, including those already sold during the period. |
| |
(3) | The majority of the net gains (losses) in trading account profits (losses) relate to the embedded derivative in structured liabilities and are offset by gains (losses) on derivatives and securities that hedge these liabilities. The net gains (losses) in other income (loss) relate to the impact on structured liabilities of changes in the Corporation’s credit spreads. |
NOTE 22 Fair Value of Financial Instruments
The fair values of financial instruments and their classifications within the fair value hierarchy have been derived using methodologies described in Note 20 – Fair Value Measurements. The following disclosures include financial instruments where only a portion of the ending balance at December 31, 20132014 and 20122013 was carried at fair value on the Consolidated Balance Sheet.
Short-term Financial Instruments
The carrying value of short-term financial instruments, including cash and cash equivalents, time deposits placed and other short-term investments, federal funds sold and purchased, certain
resale and repurchase agreements, customer and other receivables, customer payables (within accrued expenses and other liabilities on the Consolidated Balance Sheet), and short-term borrowings approximates the fair value of these instruments. These financial instruments generally expose the Corporation to limited credit risk and have no stated maturities or have short-term maturities and carry interest rates that approximate market. The Corporation elected to account for certain resale and repurchase agreements under the fair value option.
Under the fair value hierarchy, cash and cash equivalents are classified as Level 1. Time deposits placed and other short-term investments, such as U.S. government securities and short-term commercial paper, are classified as Level 1 and Level 2. Federal
|
| | |
| | 272Bank of America 20132014256
| | |
commercial paper, are classified as Level 1 and Level 2. Federal funds sold and purchased are classified as Level 2. Resale and repurchase agreements are classified as Level 2 because they are generally short-dated and/or variable-rate instruments collateralized by U.S. government or agency securities. Customer and other receivables primarily consist of margin loans, servicing advances and other accounts receivable and are classified as Level 2 and Level 3. Customer payables and short-term borrowings are classified as Level 2.
Held-to-maturity Debt Securities
HTM debt securities, which consist primarily of U.S. agency debt securities, are classified as Level 2 using the same methodologies as AFS U.S. agency debt securities. For more information on HTM debt securities, see Note 3 – Securities.
Loans
The fair values for commercial and consumer loans are generally determined by discounting both principal and interest cash flows expected to be collected using a discount rate for similar instruments with adjustments that the Corporation believes a market participant would consider in determining fair value. The Corporation estimates the cash flows expected to be collected using internal credit risk, interest rate and prepayment risk models that incorporate the Corporation’s best estimate of current key assumptions, such as default rates, loss severity and prepayment speeds for the life of the loan. The carrying value of loans is presented net of the applicable allowance for loan losses and excludes leases. The Corporation elected to accountaccounts for certain commercial loans and residential mortgage loans under the fair value option.
Deposits
The fair value for certain deposits with stated maturities was determined by discounting contractual cash flows using current market rates for instruments with similar maturities. The carrying value of non-U.S. time deposits approximates fair value. For deposits with no stated maturities, the carrying value was considered to approximate fair value and does not take into account the significant value of the cost advantage and stability of the Corporation’s long-term relationships with depositors. The Corporation accounts for certain long-term fixed-rate deposits under the fair value option.
Long-term Debt
The Corporation uses quoted market prices, when available, to estimate fair value for its long-term debt. When quoted market prices are not available, fair value is estimated based on current
market interest rates and credit spreads for debt with similar terms
and maturities. The Corporation accounts for certain structured liabilities under the fair value option.
Fair Value of Financial Instruments
The carrying values and fair values by fair value hierarchy of certain financial instruments where only a portion of the ending balance was carried at fair value at December 31, 20132014 and 20122013 are presented in the table below.
| | | | | | | | | | | | | | | | | |
Fair Value of Financial Instruments | | | | | | | | | | | | | | | | |
| | December 31, 2013 | December 31, 2014 |
| | | | Fair Value | | | Fair Value |
| (Dollars in millions) | Carrying Value | | Level 2 | | Level 3 | | Total | Carrying Value | | Level 2 | | Level 3 | | Total |
| Financial assets | | | | | | | | | | | | | | |
| Loans | $ | 885,724 |
| | $ | 102,564 |
| | $ | 789,273 |
| | $ | 891,837 |
| $ | 842,259 |
| | $ | 87,174 |
| | $ | 776,370 |
| | $ | 863,544 |
|
| Loans held-for-sale | 11,362 |
| | 8,872 |
| | 2,613 |
| | 11,485 |
| 12,836 |
| | 12,236 |
| | 618 |
| | 12,854 |
|
| Financial liabilities | | | | | | | | | | | | | | |
| Deposits | 1,119,271 |
| | 1,119,512 |
| | — |
| | 1,119,512 |
| 1,118,936 |
| | 1,119,427 |
| | — |
| | 1,119,427 |
|
| Long-term debt | 249,674 |
| �� | 257,402 |
| | 1,990 |
| | 259,392 |
| 243,139 |
| | 249,692 |
| | 2,362 |
| | 252,054 |
|
| | | | | | | | | | | | | | | |
| | December 31, 2012 | December 31, 2013 |
| Financial assets | | | | | | | | | | | | | | |
| Loans | $ | 859,875 |
| | $ | 105,119 |
| | $ | 772,761 |
| | $ | 877,880 |
| $ | 885,724 |
| | $ | 102,564 |
| | $ | 789,273 |
| | $ | 891,837 |
|
| Loans held-for-sale | 19,413 |
| | 15,087 |
| | 4,321 |
| | 19,408 |
| 11,362 |
| | 8,872 |
| | 2,613 |
| | 11,485 |
|
| Financial liabilities | |
| | | | | | |
| |
| | | | | | |
|
| Deposits | 1,105,261 |
| | 1,105,669 |
| | — |
| | 1,105,669 |
| 1,119,271 |
| | 1,119,512 |
| | — |
| | 1,119,512 |
|
| Long-term debt | 275,585 |
| | 281,173 |
| | 2,301 |
| | 283,474 |
| 249,674 |
| | 257,402 |
| | 1,990 |
| | 259,392 |
|
Commercial Unfunded Lending Commitments
Fair values were generally determined using a discounted cash flow valuation approach which is applied using market-based CDS or internally developed benchmark credit curves. The Corporation accounts for certain loan commitments under the fair value option.
The carrying values and fair values of the Corporation’s commercial unfunded lending commitments were $932 million and $3.8 billion at December 31, 2014, and $830 million and $3.7 billion at December 31, 2013, and $1.0 billion and $4.5 billion at December 31, 2012. Commercial unfunded lending commitments are primarily classified as Level 3. The carrying value of these commitments is classified in accrued expenses and other liabilities.
The Corporation does not estimate the fair values of consumer unfunded lending commitments because, in many instances, the Corporation can reduce or cancel these commitments by providing notice to the borrower. For more information on commitments, see Note 12 – Commitments and Contingencies.
|
| | |
| | 257Bank of America 20132732014 | | |
NOTE 23 Mortgage Servicing Rights
The Corporation accounts for consumer MSRs at fair value with changes in fair value recorded in mortgage banking income (loss) in the Consolidated Statement of Income. The Corporation manages the risk in these MSRs with securities including MBS and U.S. Treasuries,Treasury securities, as well as certain derivatives such as options and interest rate swaps, which are not designated as accounting hedges. The securities used to manage the risk in the MSRs are classified in other assets with changes in the fair value of the securities and the related interest income recorded in mortgage banking income (loss).income.
The table below presents activity for residential mortgage and home equity MSRs for 20132014 and 2012. Commercial and residential2013. Residential reverse mortgage MSRs, which are carried at the lower of cost or marketfair value and accounted for using the amortization method, totaled $10$10 million and $135 million at December 31, 2013, and 2012, and are not included in the tables in this Note.below.
| | | | | | | | | |
Rollforward of Mortgage Servicing Rights | | | | | | | | |
| (Dollars in millions) | 2013 | | 2012 | 2014 | | 2013 |
| Balance, January 1 | $ | 5,716 |
| | $ | 7,378 |
| $ | 5,042 |
| | $ | 5,716 |
|
| Additions | 472 |
| | 374 |
| 707 |
| | 472 |
|
| Sales | (2,044 | ) | | (122 | ) | (61 | ) | | (2,044 | ) |
Amortization of expected cash flows (1) | (1,043 | ) | | (1,484 | ) | (927 | ) | | (1,043 | ) |
Impact of changes in interest rates and other market factors (2) | 1,524 |
| | (867 | ) | (1,191 | ) | | 1,524 |
|
Model and other cash flow assumption changes: (3) | |
| | |
| |
| | |
|
| Projected cash flows, primarily due to (increases) decreases in costs to service loans | (27 | ) | | 443 |
| |
| Projected cash flows, including changes in costs to service loans | | (163 | ) | | (27 | ) |
| Impact of changes in the Home Price Index | (398 | ) | | (112 | ) | (25 | ) | | (398 | ) |
| Impact of changes to the prepayment model | 609 |
| | 435 |
| 243 |
| | 609 |
|
Other model changes (4) | 233 |
| | (329 | ) | (95 | ) | | 233 |
|
Balance, December 31 | $ | 5,042 |
| | $ | 5,716 |
| $ | 3,530 |
| | $ | 5,042 |
|
| Mortgage loans serviced for investors (in billions) | $ | 550 |
| | $ | 1,045 |
| $ | 490 |
| | $ | 550 |
|
| |
(1) | Represents the net change in fair value of the MSR asset due to the recognition of modeled cash flows. |
| |
(2) | These amounts reflect the changes in modeled MSR fair value primarily due to observed changes in interest rates, volatility, spreads and the shape of the forward swap curve. |
| |
(3) | These amounts reflect periodic adjustments to the valuation model to reflect changes in the modeled relationship between inputs and their impact on projected cash flows as well as changes in certain cash flow assumptions such as cost to service and ancillary income per loan. |
| |
(4) | These amounts include the impact of periodic recalibrations of the model to reflect changes in the relationship between market interest rate spreads and projected cash flows. Also included is a decrease of $497127 million for 20122014 due to changes in OASoption-adjusted spread rate inputs.assumptions. |
| |
(5) | At December 31, 2014, includes $3.3 billion of U.S. and $259 million of non-U.S. consumer MSR balances. |
The Corporation primarily uses an OASoption-adjusted spread (OAS) valuation approach which factors in prepayment risk to determine the fair value of MSRs. This approach consists of projecting servicing cash flows under multiple interest rate scenarios and discounting these cash flows using risk-adjusted discount rates. In addition to updating the valuation model for interest, discount and prepayment rates, periodic adjustments are made to recalibrate the valuation model for factors used to project cash flows. The changes to the factors capture the effect of variances related to actual versus estimated servicing proceeds.
The $2.0 billion of MSR sales during 2013 primarily relate to transfers completed under definitive agreements the Corporation entered into during the year to sell certain MSRs. The transfers
of the MSRs occurred in stages throughout 2013, and all of the servicing encompassed by these agreements had been transferred as of December 31, 2013.
Significant economic assumptions in estimating the fair value of MSRs at December 31, 20132014 and 20122013 are presented below. The change in fair value as a result of changes in OAS rates is included within “Model and other cash flow assumption changes” in the Rollforward of Mortgage Servicing Rights table. The weighted-average life is not an input in the valuation model but is a product of both changes in market rates of interest and changes in model and other cash flow assumptions. The weighted-average life represents the average period of time that the MSRs’ cash flows are expected to be received. Absent other changes, an increase (decrease) to the weighted-average life would generally result in an increase (decrease) in the fair value of the MSRs.
| | | | | | | | | | | | | | | | | |
Significant Economic Assumptions | | | | | | | | | | | | | | | | |
| | December 31 | December 31 |
| | 2013 | | 2012 | 2014 | | 2013 |
| | Fixed | | Adjustable | | Fixed | | Adjustable | Fixed | | Adjustable | | Fixed | | Adjustable |
| Weighted-average OAS | 3.97 | % | | 7.61 | % | | 4.00 | % | | 6.63 | % | 4.52 | % | | 7.61 | % | | 3.97 | % | | 7.61 | % |
| Weighted-average life, in years | 5.70 |
| | 2.86 |
| | 3.65 |
| | 2.10 |
| 4.53 |
| | 2.95 |
| | 5.70 |
| | 2.86 |
|
The table below presents the sensitivity of the weighted-average lives and fair value of MSRs to changes in modeled assumptions. These sensitivities are hypothetical and should be used with caution. As the amounts indicate, changes in fair value based on variations in assumptions generally cannot be extrapolated because the relationship of the change in assumption to the change in fair value may not be linear. Also, the effect of a variation in a particular assumption on the fair value of MSRs that continue to be held by the Corporation is calculated without changing any other assumption. In reality, changes in one factor may result in changes in another, which might magnify or counteract the sensitivities. The below sensitivities do not reflect any hedge strategies that may be undertaken to mitigate such risk.
| | | | | | | | | | | | | |
Sensitivity Impacts | | | | | | | | | | | | |
| | December 31, 2013 | December 31, 2014 |
| | Change in Weighted-average Lives | | | Change in Weighted-average Lives | | |
| (Dollars in millions) | Fixed | | Adjustable | | Change in Fair Value | Fixed | | Adjustable | | Change in Fair Value |
| Prepayment rates | |
| | |
| | |
| |
| | |
| | |
|
| Impact of 10% decrease | 0.24 |
| years | | 0.20 |
| years | | $ | 266 |
| 0.23 |
| years | | 0.19 |
| years | | $ | 232 |
|
| Impact of 20% decrease | 0.51 |
| | | 0.42 |
| | | 558 |
| 0.50 |
| | | 0.40 |
| | | 494 |
|
| Impact of 10% increase | (0.22 | ) | | (0.17 | ) | | (244 | ) | (0.21 | ) | | (0.16 | ) | | (208 | ) |
| Impact of 20% increase | (0.42 | ) | | (0.32 | ) | | (469 | ) | (0.39 | ) | | (0.31 | ) | | (395 | ) |
| OAS level | |
| | | |
| | | |
| |
| | | |
| | | |
|
| Impact of 100 bps decrease | | | | | | $ | 268 |
| | | | | | $ | 158 |
|
| Impact of 200 bps decrease | | | | | | 561 |
| | | | | | 329 |
|
| Impact of 100 bps increase | | | | | | (247 | ) | | | | | | (146 | ) |
| Impact of 200 bps increase | | | | | | (474 | ) | | | | | | (281 | ) |
|
| | |
| | 274Bank of America 20132014258
| | |
NOTE 24 Business Segment Information
The Corporation reports the results of its operations through five business segments: Consumer & Business Banking (CBB), Consumer Real Estate Services (CRES), Global Wealth & Investment Management (GWIM), Global Banking and Global Markets, with the remaining operations recorded in All Other. Effective January 1, 2015, to align the segments with how the Corporation manages the businesses in 2015, the Corporation changed its basis of segment presentation as follows: the Home Loans subsegment within CRES was moved to CBB, and Legacy Assets & Servicing became a separate segment. Also, a portion of the Business Banking business, based on the size of the client relationship, was moved from CBB to Global Banking. Prior periods will be restated to conform to the new segment alignment.
Consumer & Business Banking
CBB offers a diversified range of credit, banking and investment products and services to consumers and businesses. CBB product offerings include traditional savings accounts, money market savings accounts, CDs and IRAs, noninterest- and interest-bearing checking accounts, investment accounts and products, as well as credit and debit cards in the U.S. to consumers and small businesses.businesses in the U.S. Customers and clients have access to a franchise network that stretches coast to coast through 3132 states and the District of Columbia. The franchise network includes approximately 5,1004,800 banking centers, 16,30015,800 ATMs, nationwide call centers, and online and mobile platforms. CBB also offers a wide range of lending-related products and services, integrated working capital management and treasury solutions to clients through a network of offices and client relationship teams along with various product partners to U.S.-based companies generally with annual sales of $1 million to $50 million. During 2013, consumer DFS results were moved to CBB from Global Banking to align this business more closely with the Corporation’s consumer lending activity and better serve the needs of its customers. Prior periods were reclassified to conform to current period presentation.
Consumer Real Estate Services
CRES provides an extensive line of consumer real estate products and services to customers nationwide. CRES products include fixed- and adjustable-rate first-lien mortgage loans for home purchase and refinancing needs, HELOCshome equity lines of credit (HELOCs) and home equity loans. First mortgage products are generally either sold into the secondary mortgage market to investors, while retaining MSRs and the Bank of America customer relationships, or are held on the balance sheet in Home Loans or in All Other for ALM purposes. Newly originated HELOCs and home equity loans are retained on the CRES balance sheet. CRES services mortgage loans, including those loans it owns, loans owned by other business segments and All Other, and loans owned by outside investors.
The financial results of the on-balance sheet loans are reported in the business segment that owns the loans or in All Other. CRES is not impacted by the Corporation’s first mortgage production retention decisions as CRES is compensated for loans held for ALM purposes on a management accounting basis, with a corresponding offset recorded in All Other, and for servicing loans owned by other business segments and All Other.
Global Wealth & Investment Management
GWIM provides comprehensive wealth management solutions to a broad base of clients from emerging affluent to ultra high net-worth.net worth. These services include investment and brokerage services, estate and financial planning, fiduciary portfolio management, cash and liability management, and specialty asset management. GWIM also provides retirement and benefit plan services, philanthropic management and asset management to individual and institutional clients.
Global Banking
Global Banking provides a wide range of lending-related products and services, integrated working capital management and treasury solutions to clients, and underwriting and advisory services through the Corporation’s network of offices and client relationship teams. Global Banking’s lending products and services include commercial loans, leases, commitment facilities, trade finance, real estate lending and asset-based lending. Global Banking’s treasury solutions business includes treasury management, foreign exchange and short-term investing options. Global Banking also works with clients to provideprovides investment banking products to clients such as debt and equity underwriting and distribution, and merger-related and other advisory services. The economics of most investment banking and underwriting activities are shared primarily between Global Banking and Global Markets based on the activities performed by each segment. Global Banking clients generally include middle-market companies, commercial real estate firms, auto dealerships, not-for-profit companies, large global corporations, financial institutions and leasing clients. During 2013, the results of consumer DFS, previously reported in Global Banking, were moved into CBB and prior periods have been reclassified to conform to current period presentation.
Global Markets
Global Markets offers sales and trading services, including research, to institutional clients across fixed-income, credit, currency, commodity and equity businesses. Global Markets product coverage includes securities and derivative products in both the primary and secondary markets. Global Markets provides market-making, financing, securities clearing, settlement and custody services globally to institutional investor clients in support of their investing and trading activities. Global Markets also works with commercial and corporate clients to provide risk management products using interest rate, equity, credit, currency and commodity derivatives, foreign exchange, fixed-income and mortgage-related products. As a result of market-making activities in these products, Global Markets may be required to manage risk in a broad range of financial products including government securities, equity and equity-linked securities, high-grade and high-yield corporate debt securities, syndicated loans, MBS, commodities and ABS. TheIn addition, the economics of most investment banking and underwriting activities are shared primarily between Global Markets and Global Banking based on the activities performed by each segment.
All Other
All Other consists of ALM activities, equity investments, the international consumer card business, liquidating businesses, residual expense allocations and other. ALM activities encompass the whole-loan residential mortgage portfolio and investment securities, interest rate and foreign currency risk management activities including the residual net interest income allocation, gains/losses on structured liabilities, the impact of certain allocation methodologies and accounting hedge ineffectiveness. Additionally, certain residential mortgage loans that are managed by CRES are held in All Other. The results of certain ALM activities are allocated to the business segments. Additionally, certain residential mortgage loans that are managed byCRES are held in All Other.
Basis of Presentation
The management accounting and reporting process derives segment and business results by utilizing allocation methodologies for revenue and expense. The net income derived for the businesses is dependent upon revenue and cost allocations using an activity-based costing model, funds transfer pricing, and other methodologies and assumptions management believes are appropriate to reflect the results of the business.
Total revenue, net of interest expense, includes net interest income on aan FTE basis and noninterest income. The adjustment of net interest income to aan FTE basis results in a corresponding increase in income tax expense. The segment results also reflect certain revenue and expense methodologies that are utilized to determine net income. The net interest income of the businesses includes the results of a funds transfer pricing process that matches assets and liabilities with similar interest rate sensitivity and maturity characteristics. For presentation purposes, inIn segments where the total of liabilities and equity exceeds assets, which are generally deposit-taking segments, the Corporation allocates assets to match
liabilities. Net interest income of the business segments also includes an allocation of net interest income generated by certain of the Corporation’s ALM activities. In addition, the business segments are impacted by the migration of customers and clients and their deposit, loan and loanbrokerage balances between client-managed businesses, primarily CBB, CRES and GWIM.businesses. Subsequent to the date of migration, the associated net
interest income, noninterest income and noninterest expense are recorded in the business to which the customers or clients migrated.
The Corporation’s ALM activities include an overall interest rate risk management strategy that incorporates the use of various derivatives and cash instruments to manage fluctuations in earnings and capital that are caused by interest rate volatility. The Corporation’s goal is to manage interest rate sensitivity so that movements in interest rates do not significantly adversely affect earnings and capital. The results of a majority of the Corporation’s ALM activities are allocated to the business segments and fluctuate based on the performance of the ALM activities. ALM activities include external product pricing decisions including deposit pricing strategies, the effects of the Corporation’s internal funds transfer pricing process and the net effects of other ALM activities.
Certain expenses not directly attributable to a specific business segment are allocated to the segments. The most significant of these expenses include data and item processing costs and certain centralized or shared functions. Data processing costs are allocated to the segments based on equipment usage. Item processing costs are allocated to the segments based on the volume of items processed for each segment. The costs of certain other centralized or shared functions are allocated based on methodologies that reflect utilization.
The following tables present net income and the components thereto (with net interest income on a FTE basis) for 2013, 2012 and 2011, and total assets at December 31, 2013 and 2012 for each business segment, as well as All Other.
|
| | | | | | | | | | | | | | | | | | | | | | | | | | | | | |
| | | | | | | | | | | | |
| Business Segments | | | | | | | | | | | |
| | | | | | | | | | | | |
| At and for the Year Ended December 31 | Total Corporation (1) | | Consumer & Business Banking | | Consumer Real Estate Services |
| (Dollars in millions) | 2013 | 2012 | 2011 | | 2013 | 2012 | 2011 | | 2013 | 2012 | 2011 |
| Net interest income (FTE basis) | $ | 43,124 |
| $ | 41,557 |
| $ | 45,588 |
| | $ | 20,051 |
| $ | 19,853 |
| $ | 22,249 |
| | $ | 2,890 |
| $ | 2,930 |
| $ | 3,209 |
|
| Noninterest income (loss) | 46,677 |
| 42,678 |
| 48,838 |
| | 9,816 |
| 9,937 |
| 11,572 |
| | 4,826 |
| 5,821 |
| (6,310 | ) |
| Total revenue, net of interest expense (FTE basis) | 89,801 |
| 84,235 |
| 94,426 |
| | 29,867 |
| 29,790 |
| 33,821 |
| | 7,716 |
| 8,751 |
| (3,101 | ) |
| Provision for credit losses | 3,556 |
| 8,169 |
| 13,410 |
| | 3,107 |
| 4,148 |
| 3,677 |
| | (156 | ) | 1,442 |
| 4,523 |
|
| Amortization of intangibles | 1,086 |
| 1,264 |
| 1,509 |
| | 505 |
| 626 |
| 759 |
| | — |
| — |
| 11 |
|
| Goodwill impairment | — |
| — |
| 3,184 |
| | — |
| — |
| — |
| | — |
| — |
| 2,603 |
|
| Other noninterest expense | 68,128 |
| 70,829 |
| 75,581 |
| | 15,852 |
| 16,369 |
| 17,153 |
| | 16,013 |
| 17,190 |
| 19,055 |
|
| Income (loss) before income taxes | 17,031 |
| 3,973 |
| 742 |
| | 10,403 |
| 8,647 |
| 12,232 |
| | (8,141 | ) | (9,881 | ) | (29,293 | ) |
| Income tax expense (benefit) (FTE basis) | 5,600 |
| (215 | ) | (704 | ) | | 3,815 |
| 3,101 |
| 4,431 |
| | (2,986 | ) | (3,442 | ) | (9,939 | ) |
| Net income (loss) | $ | 11,431 |
| $ | 4,188 |
| $ | 1,446 |
| | $ | 6,588 |
| $ | 5,546 |
| $ | 7,801 |
| | $ | (5,155 | ) | $ | (6,439 | ) | $ | (19,354 | ) |
| Year-end total assets | $ | 2,102,273 |
| $ | 2,209,974 |
| |
| | $ | 592,978 |
| $ | 554,915 |
| |
| | $ | 113,386 |
| $ | 131,059 |
| |
|
| | | | | | | | | | | | |
| | | | Global Wealth &
Investment Management | | Global Banking |
| | | | | | 2013 | 2012 | 2011 | | 2013 | 2012 | 2011 |
| Net interest income (FTE basis) | | | | | $ | 6,064 |
| $ | 5,827 |
| $ | 5,885 |
| | $ | 8,914 |
| $ | 8,135 |
| $ | 8,233 |
|
| Noninterest income | | | | | 11,726 |
| 10,691 |
| 10,610 |
| | 7,567 |
| 7,539 |
| 7,361 |
|
| Total revenue, net of interest expense (FTE basis) | | | | | 17,790 |
| 16,518 |
| 16,495 |
| | 16,481 |
| 15,674 |
| 15,594 |
|
| Provision for credit losses | | | | | 56 |
| 266 |
| 398 |
| | 1,075 |
| (342 | ) | (1,308 | ) |
| Amortization of intangibles | | | | | 387 |
| 410 |
| 437 |
| | 62 |
| 79 |
| 101 |
|
| Other noninterest expense | | | | | 12,651 |
| 12,311 |
| 12,899 |
| | 7,490 |
| 7,540 |
| 7,928 |
|
| Income before income taxes | | | | | 4,696 |
| 3,531 |
| 2,761 |
| | 7,854 |
| 8,397 |
| 8,873 |
|
| Income tax expense (FTE basis) | | | | | 1,722 |
| 1,286 |
| 1,014 |
| | 2,880 |
| 3,053 |
| 3,251 |
|
| Net income | | | | | $ | 2,974 |
| $ | 2,245 |
| $ | 1,747 |
| | $ | 4,974 |
| $ | 5,344 |
| $ | 5,622 |
|
| Year-end total assets | | | | | $ | 274,112 |
| $ | 297,326 |
| |
| | $ | 379,207 |
| $ | 331,611 |
| |
|
| | | | | | | | | | | | |
| | | | Global Markets | | All Other |
| | | | | | 2013 | 2012 | 2011 | | 2013 | 2012 | 2011 |
| Net interest income (FTE basis) | | | | | $ | 4,239 |
| $ | 3,672 |
| $ | 4,068 |
| | $ | 966 |
| $ | 1,140 |
| $ | 1,944 |
|
| Noninterest income (loss) | | | | | 11,819 |
| 10,612 |
| 11,507 |
| | 923 |
| (1,922 | ) | 14,098 |
|
| Total revenue, net of interest expense (FTE basis) | | | | | 16,058 |
| 14,284 |
| 15,575 |
| | 1,889 |
| (782 | ) | 16,042 |
|
| Provision for credit losses | | | | | 140 |
| 34 |
| (53 | ) | | (666 | ) | 2,621 |
| 6,173 |
|
| Amortization of intangibles | | | | | 65 |
| 64 |
| 66 |
| | 67 |
| 85 |
| 135 |
|
| Goodwill impairment | | | | | — |
| — |
| — |
| | — |
| — |
| 581 |
|
| Other noninterest expense | | | | | 11,948 |
| 11,231 |
| 12,824 |
| | 4,174 |
| 6,188 |
| 5,722 |
|
| Income (loss) before income taxes | | | | | 3,905 |
| 2,955 |
| 2,738 |
| | (1,686 | ) | (9,676 | ) | 3,431 |
|
| Income tax expense (benefit) (FTE basis) | | | | | 2,342 |
| 1,726 |
| 1,669 |
| | (2,173 | ) | (5,939 | ) | (1,130 | ) |
| Net income (loss) | | | | | $ | 1,563 |
| $ | 1,229 |
| $ | 1,069 |
| | $ | 487 |
| $ | (3,737 | ) | $ | 4,561 |
|
| Year-end total assets | | | | | $ | 575,709 |
| $ | 632,263 |
| |
| | $ | 166,881 |
| $ | 262,800 |
| |
|
| |
(1)
| There were no material intersegment revenues. |
|
| | |
| | | Bank of America 20132014 277260 |
The table below presents net income (loss) and the components thereto (with net interest income on an FTE basis) for 2014, 2013 and 2012, and total assets at December 31, 2014 and 2013 for each business segment, as well as All Other.
|
| | | | | | | | | | | | | | | | | | | | | | | | | | | | | |
| | | | | | | | | | | | |
| Business Segments | | | | | | | | | | | |
| | | | | | | | | | | | |
| At and for the Year Ended December 31 | Total Corporation (1) | | Consumer & Business Banking | | Consumer Real Estate Services |
| (Dollars in millions) | 2014 | 2013 | 2012 | | 2014 | 2013 | 2012 | | 2014 | 2013 | 2012 |
| Net interest income (FTE basis) | $ | 40,821 |
| $ | 43,124 |
| $ | 41,557 |
| | $ | 19,685 |
| $ | 20,050 |
| $ | 19,853 |
| | $ | 2,831 |
| $ | 2,890 |
| $ | 2,928 |
|
| Noninterest income | 44,295 |
| 46,677 |
| 42,678 |
| | 10,177 |
| 9,814 |
| 9,932 |
| | 2,017 |
| 4,825 |
| 5,821 |
|
| Total revenue, net of interest expense (FTE basis) | 85,116 |
| 89,801 |
| 84,235 |
| | 29,862 |
| 29,864 |
| 29,785 |
| | 4,848 |
| 7,715 |
| 8,749 |
|
| Provision for credit losses | 2,275 |
| 3,556 |
| 8,169 |
| | 2,633 |
| 3,107 |
| 4,148 |
| | 160 |
| (156 | ) | 1,442 |
|
| Amortization of intangibles | 936 |
| 1,086 |
| 1,264 |
| | 398 |
| 505 |
| 626 |
| | — |
| — |
| — |
|
| Other noninterest expense | 74,181 |
| 68,128 |
| 70,829 |
| | 15,513 |
| 15,755 |
| 16,295 |
| | 23,226 |
| 15,815 |
| 16,968 |
|
| Income (loss) before income taxes (FTE basis) | 7,724 |
| 17,031 |
| 3,973 |
| | 11,318 |
| 10,497 |
| 8,716 |
| | (18,538 | ) | (7,944 | ) | (9,661 | ) |
| Income tax expense (benefit) (FTE basis) | 2,891 |
| 5,600 |
| (215 | ) | | 4,222 |
| 3,850 |
| 3,126 |
| | (5,143 | ) | (2,913 | ) | (3,360 | ) |
| Net income (loss) | $ | 4,833 |
| $ | 11,431 |
| $ | 4,188 |
| | $ | 7,096 |
| $ | 6,647 |
| $ | 5,590 |
| | $ | (13,395 | ) | $ | (5,031 | ) | $ | (6,301 | ) |
| Year-end total assets | $ | 2,104,534 |
| $ | 2,102,273 |
| |
| | $ | 622,378 |
| $ | 593,014 |
| |
| | $ | 103,730 |
| $ | 113,391 |
| |
|
| | | | | | | | | | | | |
| | | | Global Wealth &
Investment Management | | Global Banking |
| | | | | | 2014 | 2013 | 2012 | | 2014 | 2013 | 2012 |
| Net interest income (FTE basis) | | | | | $ | 5,836 |
| $ | 6,064 |
| $ | 5,827 |
| | $ | 8,999 |
| $ | 8,914 |
| $ | 8,131 |
|
| Noninterest income | | | | | 12,568 |
| 11,726 |
| 10,691 |
| | 7,599 |
| 7,565 |
| 7,538 |
|
| Total revenue, net of interest expense (FTE basis) | | | | | 18,404 |
| 17,790 |
| 16,518 |
| | 16,598 |
| 16,479 |
| 15,669 |
|
| Provision for credit losses | | | | | 14 |
| 56 |
| 266 |
| | 336 |
| 1,075 |
| (342 | ) |
| Amortization of intangibles | | | | | 367 |
| 387 |
| 410 |
| | 45 |
| 62 |
| 79 |
|
| Other noninterest expense | | | | | 13,280 |
| 12,646 |
| 12,312 |
| | 7,636 |
| 7,489 |
| 7,538 |
|
| Income before income taxes (FTE basis) | | | | | 4,743 |
| 4,701 |
| 3,530 |
| | 8,581 |
| 7,853 |
| 8,394 |
|
| Income tax expense (FTE basis) | | | | | 1,769 |
| 1,724 |
| 1,286 |
| | 3,146 |
| 2,880 |
| 3,052 |
|
| Net income | | | | | $ | 2,974 |
| $ | 2,977 |
| $ | 2,244 |
| | $ | 5,435 |
| $ | 4,973 |
| $ | 5,342 |
|
| Year-end total assets | | | | | $ | 276,587 |
| $ | 274,113 |
| |
| | $ | 379,513 |
| $ | 378,659 |
| |
|
| | | | | | | | | | | | |
| | | | Global Markets | | All Other |
| | | | | | 2014 | 2013 | 2012 | | 2014 | 2013 | 2012 |
| Net interest income (FTE basis) | | | | | $ | 3,986 |
| $ | 4,224 |
| $ | 3,667 |
| | $ | (516 | ) | $ | 982 |
| $ | 1,151 |
|
| Noninterest income | | | | | 12,133 |
| 11,166 |
| 5,507 |
| | (199 | ) | 1,581 |
| 3,189 |
|
| Total revenue, net of interest expense (FTE basis) | | | | | 16,119 |
| 15,390 |
| 9,174 |
| | (715 | ) | 2,563 |
| 4,340 |
|
| Provision for credit losses | | | | | 110 |
| 140 |
| 34 |
| | (978 | ) | (666 | ) | 2,621 |
|
| Amortization of intangibles | | | | | 65 |
| 65 |
| 64 |
| | 61 |
| 67 |
| 85 |
|
| Other noninterest expense | | | | | 11,706 |
| 11,931 |
| 11,221 |
| | 2,820 |
| 4,492 |
| 6,495 |
|
| Income (loss) before income taxes (FTE basis) | | | | | 4,238 |
| 3,254 |
| (2,145 | ) | | (2,618 | ) | (1,330 | ) | (4,861 | ) |
| Income tax expense (benefit) (FTE basis) | | | | | 1,519 |
| 2,101 |
| (161 | ) | | (2,622 | ) | (2,042 | ) | (4,158 | ) |
| Net income (loss) | | | | | $ | 2,719 |
| $ | 1,153 |
| $ | (1,984 | ) | | $ | 4 |
| $ | 712 |
| $ | (703 | ) |
| Year-end total assets | | | | | $ | 579,514 |
| $ | 575,472 |
| |
| | $ | 142,812 |
| $ | 167,624 |
| |
|
| |
(1) | There were no material intersegment revenues. |
The table below presents a reconciliation of the five business segments’ total revenue, net of interest expense, on aan FTE basis, and net income to the Consolidated Statement of Income, and total assets to the Consolidated Balance Sheet. The adjustments presented in the table below include consolidated income, expense and asset amounts not specifically allocated to individual business segments.
|
| | | | | | | | | | | |
| | | | | | |
| Business Segment Reconciliations | | | | | |
| | | | | | |
| (Dollars in millions) | 2013 | | 2012 | | 2011 |
| Segments’ total revenue, net of interest expense (FTE basis) | $ | 87,912 |
| | $ | 85,017 |
| | $ | 78,384 |
|
| Adjustments: | |
| | |
| | |
|
ALM activities (1) | (986 | ) | | (2,412 | ) | | 7,576 |
|
| Equity investment income | 2,610 |
| | 1,135 |
| | 7,105 |
|
| Liquidating businesses and other | 265 |
| | 495 |
| | 1,361 |
|
| FTE basis adjustment | (859 | ) | | (901 | ) | | (972 | ) |
| Consolidated revenue, net of interest expense | $ | 88,942 |
| | $ | 83,334 |
| | $ | 93,454 |
|
| Segments’ net income (loss) | $ | 10,944 |
| | $ | 7,925 |
| | $ | (3,115 | ) |
| Adjustments, net of taxes: | |
| | |
| | |
|
| ALM activities | (1,207 | ) | | (4,087 | ) | | 513 |
|
| Equity investment income | 1,644 |
| | 715 |
| | 4,476 |
|
| Liquidating businesses and other | 50 |
| | (365 | ) | | (26 | ) |
| Merger and restructuring charges | — |
| | — |
| | (402 | ) |
| Consolidated net income | $ | 11,431 |
| | $ | 4,188 |
| | $ | 1,446 |
|
| | | | | | |
| | | | December 31 |
| | | | 2013 | | 2012 |
| Segments’ total assets | | | $ | 1,935,392 |
| | $ | 1,947,174 |
|
| Adjustments: | | | |
| | |
|
| ALM activities, including securities portfolio | | | 664,302 |
| | 655,915 |
|
| Equity investments | | | 2,411 |
| | 5,508 |
|
| Liquidating businesses and other | | | 70,435 |
| | 138,974 |
|
| Elimination of segment asset allocations to match liabilities | | | (570,267 | ) | | (537,597 | ) |
| Consolidated total assets | | | $ | 2,102,273 |
| | $ | 2,209,974 |
|
| |
(1)
| Includes negative fair value adjustments on structured liabilities related to changes in the Corporation’s credit spreads of $649 million and $5.1 billion in 2013 and 2012 compared to positive adjustments of $3.3 billion in 2011.
|
|
| | | | | | | | | | | |
| | | | | | |
| Business Segment Reconciliations | | | | | |
| | | | | | |
| (Dollars in millions) | 2014 | | 2013 | | 2012 |
| Segments’ total revenue, net of interest expense (FTE basis) | $ | 85,831 |
| | $ | 87,238 |
| | $ | 79,895 |
|
| Adjustments: | |
| | |
| | |
|
| ALM activities | (804 | ) | | (545 | ) | | 2,266 |
|
| Equity investment income | 601 |
| | 2,610 |
| | 1,136 |
|
| Liquidating businesses and other | (512 | ) | | 498 |
| | 938 |
|
| FTE basis adjustment | (869 | ) | | (859 | ) | | (901 | ) |
| Consolidated revenue, net of interest expense | $ | 84,247 |
| | $ | 88,942 |
| | $ | 83,334 |
|
| Segments’ total net income | $ | 4,829 |
| | $ | 10,719 |
| | $ | 4,891 |
|
| Adjustments, net of taxes: | |
| | |
| | |
|
| ALM activities | (343 | ) | | (929 | ) | | (1,144 | ) |
| Equity investment income | 376 |
| | 1,644 |
| | 716 |
|
| Liquidating businesses and other | (29 | ) | | (3 | ) | | (275 | ) |
| Consolidated net income | $ | 4,833 |
| | $ | 11,431 |
| | $ | 4,188 |
|
| | | | | | |
| | | | December 31 |
| | | | 2014 | | 2013 |
| Segments’ total assets | | | $ | 1,961,722 |
| | $ | 1,934,649 |
|
| Adjustments: | | | |
| | |
|
| ALM activities, including securities portfolio | | | 658,319 |
| | 664,530 |
|
| Equity investments | | | 1,770 |
| | 2,426 |
|
| Liquidating businesses and other | | | 72,638 |
| | 70,470 |
|
| Elimination of segment asset allocations to match liabilities | | | (589,915 | ) | | (569,802 | ) |
| Consolidated total assets | | | $ | 2,104,534 |
| | $ | 2,102,273 |
|
NOTE 25 Parent Company Information
The following tables present the Parent Company-only financial information. On October 1, 2013, the merger of Merrill Lynch & Co., Inc. into Bank of America Corporation was completed; however, the Parent Company-only financial information is presented in accordance with bank regulatory reporting requirements and as such prior periods have not been restated.
|
| | | | | | | | | | | |
| | | | | | |
| Condensed Statement of Income | | | | | |
| | | | | | |
| (Dollars in millions) | 2013 | | 2012 | | 2011 |
| Income | |
| | |
| | |
|
| Dividends from subsidiaries: | |
| | |
| | |
|
| Bank holding companies and related subsidiaries | $ | 8,532 |
| | $ | 16,213 |
| | $ | 10,277 |
|
| Nonbank companies and related subsidiaries | 357 |
| | 542 |
| | 553 |
|
| Interest from subsidiaries | 2,087 |
| | 627 |
| | 869 |
|
Other income (loss) (1) | 233 |
| | (304 | ) | | 10,603 |
|
| Total income | 11,209 |
| | 17,078 |
| | 22,302 |
|
| Expense | |
| | |
| | |
|
| Interest on borrowed funds | 6,379 |
| | 5,376 |
| | 6,234 |
|
Noninterest expense (2) | 12,668 |
| | 11,643 |
| | 11,861 |
|
| Total expense | 19,047 |
| | 17,019 |
| | 18,095 |
|
| Income (loss) before income taxes and equity in undistributed earnings of subsidiaries | (7,838 | ) | | 59 |
| | 4,207 |
|
| Income tax benefit | (7,227 | ) | | (5,883 | ) | | (2,783 | ) |
| Income (loss) before equity in undistributed earnings of subsidiaries | (611 | ) | | 5,942 |
| | 6,990 |
|
| Equity in undistributed earnings (losses) of subsidiaries: | |
| | |
| | |
|
| Bank holding companies and related subsidiaries | 14,150 |
| | 1,072 |
| | 6,650 |
|
| Nonbank companies and related subsidiaries | (2,108 | ) | | (2,826 | ) | | (12,194 | ) |
| Total equity in undistributed earnings (losses) of subsidiaries | 12,042 |
| | (1,754 | ) | | (5,544 | ) |
| Net income | $ | 11,431 |
| | $ | 4,188 |
| | $ | 1,446 |
|
| Net income applicable to common shareholders | $ | 10,082 |
| | $ | 2,760 |
| | $ | 85 |
|
| |
(1)
| Includes $753 million and $6.5 billion of gains related to the sale of the Corporation’s investment in CCB in 2013 and 2011.
|
| |
(2)
| Includes, in aggregate, $1.3 billion, $4.1 billion and $6.9 billion in 2013, 2012 and 2011 of representations and warranties provision, which is presented as a component of mortgage banking income on the Consolidated Statement of Income, litigation expense and in 2012 an expense related to an agreement with the Federal Reserve and the OCC to cease the Independent Foreclosure Review and replace it with an accelerated remediation process.
|
|
| | | | | | | |
| | | | |
| Condensed Balance Sheet | | | |
| | | | |
| | December 31 |
| (Dollars in millions) | 2013 | | 2012 |
| Assets | |
| | |
|
| Cash held at bank subsidiaries | $ | 98,679 |
| | $ | 101,831 |
|
| Securities | 747 |
| | 1,959 |
|
| Receivables from subsidiaries: | | | |
|
| Bank holding companies and related subsidiaries | 23,558 |
| | 33,481 |
|
| Banks and related subsidiaries | 1,682 |
| | — |
|
| Nonbank companies and related subsidiaries | 46,577 |
| | 3,861 |
|
| Investments in subsidiaries: | |
| | |
|
| Bank holding companies and related subsidiaries | 268,234 |
| | 185,803 |
|
| Nonbank companies and related subsidiaries | 1,818 |
| | 65,300 |
|
| Other assets | 19,073 |
| | 15,208 |
|
| Total assets | $ | 460,368 |
| | $ | 407,443 |
|
| Liabilities and shareholders’ equity | |
| | |
|
| Short-term borrowings | $ | 181 |
| | $ | 100 |
|
| Accrued expenses and other liabilities | 15,428 |
| | 34,364 |
|
| Payables to subsidiaries: | |
| | |
|
| Bank holding companies and related subsidiaries | — |
| | 1,396 |
|
| Banks and related subsidiaries | 1,991 |
| | — |
|
| Nonbank companies and related subsidiaries | 15,980 |
| | 688 |
|
| Long-term debt | 194,103 |
| | 133,939 |
|
| Total liabilities | 227,683 |
| | 170,487 |
|
| Shareholders’ equity | 232,685 |
| | 236,956 |
|
| Total liabilities and shareholders’ equity | $ | 460,368 |
| | $ | 407,443 |
|
|
| | |
| | | Bank of America 20132014 279262 |
NOTE 25 Parent Company Information
The following tables present the Parent Company-only financial information. This financial information is presented in accordance with bank regulatory reporting requirements and, accordingly, the information for 2012 has not been restated for the 2013 merger of Merrill Lynch & Co., Inc. into Bank of America Corporation.
|
| | | | | | | | | | | |
| | | | | | |
| Condensed Statement of Income | | | | | |
| | | | | | |
| (Dollars in millions) | 2014 | | 2013 | | 2012 |
| Income | |
| | |
| | |
|
| Dividends from subsidiaries: | |
| | |
| | |
|
| Bank holding companies and related subsidiaries | $ | 12,400 |
| | $ | 8,532 |
| | $ | 16,213 |
|
| Nonbank companies and related subsidiaries | 149 |
| | 357 |
| | 542 |
|
| Interest from subsidiaries | 1,836 |
| | 2,087 |
| | 627 |
|
| Other income (loss) | 72 |
| | 233 |
| | (304 | ) |
| Total income | 14,457 |
| | 11,209 |
| | 17,078 |
|
| Expense | |
| | |
| | |
|
| Interest on borrowed funds | 7,213 |
| | 8,109 |
| | 6,147 |
|
| Noninterest expense | 4,471 |
| | 10,938 |
| | 10,872 |
|
| Total expense | 11,684 |
| | 19,047 |
| | 17,019 |
|
| Income (loss) before income taxes and equity in undistributed earnings of subsidiaries | 2,773 |
| | (7,838 | ) | | 59 |
|
| Income tax benefit | (4,079 | ) | | (7,227 | ) | | (5,883 | ) |
| Income (loss) before equity in undistributed earnings of subsidiaries | 6,852 |
| | (611 | ) | | 5,942 |
|
| Equity in undistributed earnings (losses) of subsidiaries: | |
| | |
| | |
|
| Bank holding companies and related subsidiaries | 3,613 |
| | 14,150 |
| | 1,072 |
|
| Nonbank companies and related subsidiaries | (5,632 | ) | | (2,108 | ) | | (2,826 | ) |
| Total equity in undistributed earnings (losses) of subsidiaries | (2,019 | ) | | 12,042 |
| | (1,754 | ) |
| Net income | $ | 4,833 |
| | $ | 11,431 |
| | $ | 4,188 |
|
| Net income applicable to common shareholders | $ | 3,789 |
| | $ | 10,082 |
| | $ | 2,760 |
|
|
| | | | | | | |
| | | | |
| Condensed Balance Sheet | | | |
| | | | |
| | December 31 |
| (Dollars in millions) | 2014 | | 2013 |
| Assets | |
| | |
|
Cash held at bank subsidiaries (1) | $ | 100,304 |
| | $ | 98,679 |
|
| Securities | 932 |
| | 747 |
|
| Receivables from subsidiaries: | | | |
|
| Bank holding companies and related subsidiaries | 23,356 |
| | 23,558 |
|
| Banks and related subsidiaries | 2,395 |
| | 1,682 |
|
| Nonbank companies and related subsidiaries | 52,251 |
| | 46,577 |
|
| Investments in subsidiaries: | |
| | |
|
| Bank holding companies and related subsidiaries | 270,441 |
| | 268,234 |
|
| Nonbank companies and related subsidiaries | 2,139 |
| | 1,818 |
|
| Other assets | 14,599 |
| | 19,073 |
|
| Total assets | $ | 466,417 |
| | $ | 460,368 |
|
| Liabilities and shareholders’ equity | |
| | |
|
| Short-term borrowings | $ | 46 |
| | $ | 181 |
|
| Accrued expenses and other liabilities | 16,872 |
| | 15,428 |
|
| Payables to subsidiaries: | |
| | |
|
| Banks and related subsidiaries | 2,559 |
| | 1,991 |
|
| Nonbank companies and related subsidiaries | 17,698 |
| | 15,980 |
|
| Long-term debt | 185,771 |
| | 194,103 |
|
| Total liabilities | 222,946 |
| | 227,683 |
|
| Shareholders’ equity | 243,471 |
| | 232,685 |
|
| Total liabilities and shareholders’ equity | $ | 466,417 |
| | $ | 460,368 |
|
| |
(1) | Balance includes third-party cash held of $29 million and $33 million at December 31, 2014 and 2013. |
| | | | | | | | | | | | | |
| Condensed Statement of Cash Flows | | | | | | | | | | |
| | | | | | | | | | | |
| (Dollars in millions) | 2013 | | 2012 | | 2011 | 2014 | | 2013 | | 2012 |
| Operating activities | |
| | |
| | |
| |
| | |
| | |
|
| Net income | $ | 11,431 |
| | $ | 4,188 |
| | $ | 1,446 |
| $ | 4,833 |
| | $ | 11,431 |
| | $ | 4,188 |
|
| Reconciliation of net income to net cash provided by (used in) operating activities: | |
| | |
| | |
| |
| | |
| | |
|
| Equity in undistributed (earnings) losses of subsidiaries | (12,042 | ) | | 1,754 |
| | 5,544 |
| 2,019 |
| | (12,042 | ) | | 1,754 |
|
| Other operating activities, net | (10,422 | ) | | (3,432 | ) | | 6,716 |
| 2,143 |
| | (10,422 | ) | | (3,432 | ) |
| Net cash provided by (used in) operating activities | (11,033 | ) | | 2,510 |
| | 13,706 |
| 8,995 |
| | (11,033 | ) | | 2,510 |
|
| Investing activities | |
| | |
| | |
| |
| | |
| | |
|
| Net sales of securities | 459 |
| | 13 |
| | 8,444 |
| |
| Net payments from subsidiaries | 39,336 |
| | 12,973 |
| | 5,780 |
| |
| Net sales (purchases) of securities | | (142 | ) | | 459 |
| | 13 |
|
| Net payments from (to) subsidiaries | | (5,902 | ) | | 39,336 |
| | 12,973 |
|
| Other investing activities, net | 3 |
| | 445 |
| | (8 | ) | 19 |
| | 3 |
| | 445 |
|
| Net cash provided by investing activities | 39,798 |
| | 13,431 |
| | 14,216 |
| |
| Net cash provided by (used in) investing activities | | (6,025 | ) | | 39,798 |
| | 13,431 |
|
| Financing activities | |
| | |
| | |
| |
| | |
| | |
|
| Net increase (decrease) in short-term borrowings | 178 |
| | (616 | ) | | (13,172 | ) | (55 | ) | | 178 |
| | (616 | ) |
| Net increase (decrease) in other advances | (14,378 | ) | | 10,100 |
| | (4,449 | ) | 1,264 |
| | (14,378 | ) | | 10,100 |
|
| Proceeds from issuance of long-term debt | 30,966 |
| | 17,176 |
| | 16,047 |
| 29,324 |
| | 30,966 |
| | 17,176 |
|
| Retirement of long-term debt | (39,320 | ) | | (63,851 | ) | | (21,742 | ) | (33,854 | ) | | (39,320 | ) | | (63,851 | ) |
| Proceeds from issuance of preferred stock and warrants | 1,008 |
| | 667 |
| | 5,000 |
| |
| Proceeds from issuance of preferred stock | | 5,957 |
| | 1,008 |
| | 667 |
|
| Redemption of preferred stock | (6,461 | ) | | — |
| | — |
| — |
| | (6,461 | ) | | — |
|
| Common stock repurchased | (3,220 | ) | | — |
| | — |
| (1,675 | ) | | (3,220 | ) | | — |
|
| Cash dividends paid | (1,677 | ) | | (1,909 | ) | | (1,738 | ) | (2,306 | ) | | (1,677 | ) | | (1,909 | ) |
| Other financing activities, net | — |
| | (668 | ) | | (1 | ) | — |
| | — |
| | (668 | ) |
| Net cash used in financing activities | (32,904 | ) | | (39,101 | ) | | (20,055 | ) | (1,345 | ) | | (32,904 | ) | | (39,101 | ) |
| Net increase (decrease) in cash held at bank subsidiaries | (4,139 | ) | | (23,160 | ) | | 7,867 |
| 1,625 |
| | (4,139 | ) | | (23,160 | ) |
| Cash held at bank subsidiaries at January 1 | 102,818 |
| | 124,991 |
| | 117,124 |
| 98,679 |
| | 102,818 |
| | 124,991 |
|
| Cash held at bank subsidiaries at December 31 | $ | 98,679 |
| | $ | 101,831 |
| | $ | 124,991 |
| $ | 100,304 |
| | $ | 98,679 |
| | $ | 101,831 |
|
NOTE 26 Performance by Geographical Area
Since the Corporation’s operations are highly integrated, certain asset, liability, income and expense amounts must be allocated to arrive at total assets, total revenue, net of interest expense, income (loss) before income taxes and net income (loss) by geographic area. The Corporation identifies its geographic performance based on the business unit structure used to manage the capital or expense deployed in the region as applicable. This requires certain judgments related to the allocation of revenue so that revenue can be appropriately matched with the related capital or expense deployed in the region.
| | | | | | | | | | | | | | | | | | | |
| | | | December 31 | | Year Ended December 31 | | | December 31 | | Year Ended December 31 |
| (Dollars in millions) | Year | | Total Assets (1) | | Total Revenue, Net of Interest Expense (2) | | Income (Loss) Before Income Taxes | | Net Income (Loss) | Year | | Total Assets (1) | | Total Revenue, Net of Interest Expense (2) | | Income Before Income Taxes | | Net Income (Loss) |
U.S. (3) | 2013 | | $ | 1,803,243 |
| | $ | 76,612 |
| | $ | 13,221 |
| | $ | 10,588 |
| 2014 | | $ | 1,792,719 |
| | $ | 72,960 |
| | $ | 4,643 |
| | $ | 3,305 |
|
| | 2012 | | 1,902,946 |
| | 72,175 |
| | 1,867 |
| | 4,116 |
| 2013 | | 1,803,243 |
| | 76,612 |
| | 13,221 |
| | 10,588 |
|
| | 2011 | | |
| | 73,613 |
| | (9,261 | ) | | (3,471 | ) | 2012 | | |
| | 72,175 |
| | 1,867 |
| | 4,116 |
|
Asia (4) | 2013 | | 98,605 |
| | 4,442 |
| | 1,382 |
| | 887 |
| 2014 | | 92,005 |
| | 3,605 |
| | 759 |
| | 473 |
|
| | 2012 | | 102,492 |
| | 3,478 |
| | 353 |
| | 282 |
| 2013 | | 98,605 |
| | 4,442 |
| | 1,382 |
| | 887 |
|
| | 2011 | | |
| | 10,890 |
| | 7,598 |
| | 4,787 |
| 2012 | | |
| | 3,478 |
| | 353 |
| | 282 |
|
| Europe, Middle East and Africa | 2013 | | 169,708 |
| | 6,353 |
| | 1,003 |
| | (403 | ) | 2014 | | 190,365 |
| | 6,409 |
| | 1,098 |
| | 813 |
|
| | 2012 | | 171,209 |
| | 6,011 |
| | 323 |
| | (543 | ) | 2013 | | 169,708 |
| | 6,353 |
| | 1,003 |
| | (403 | ) |
| | 2011 | | |
| | 7,320 |
| | 1,009 |
| | (137 | ) | 2012 | | |
| | 6,011 |
| | 323 |
| | (543 | ) |
| Latin America and the Caribbean | 2013 | | 30,717 |
| | 1,535 |
| | 566 |
| | 359 |
| 2014 | | 29,445 |
| | 1,273 |
| | 355 |
| | 242 |
|
| | 2012 | | 33,327 |
| | 1,670 |
| | 529 |
| | 333 |
| 2013 | | 30,717 |
| | 1,535 |
| | 566 |
| | 359 |
|
| | 2011 | | |
| | 1,631 |
| | 424 |
| | 267 |
| 2012 | | |
| | 1,670 |
| | 529 |
| | 333 |
|
| Total Non-U.S. | 2013 | | 299,030 |
| | 12,330 |
| | 2,951 |
| | 843 |
| 2014 | | 311,815 |
| | 11,287 |
| | 2,212 |
| | 1,528 |
|
| | 2012 | | 307,028 |
| | 11,159 |
| | 1,205 |
| | 72 |
| 2013 | | 299,030 |
| | 12,330 |
| | 2,951 |
| | 843 |
|
| | 2011 | | |
| | 19,841 |
| | 9,031 |
| | 4,917 |
| 2012 | | |
| | 11,159 |
| | 1,205 |
| | 72 |
|
| Total Consolidated | 2013 | | $ | 2,102,273 |
| | $ | 88,942 |
| | $ | 16,172 |
| | $ | 11,431 |
| 2014 | | $ | 2,104,534 |
| | $ | 84,247 |
| | $ | 6,855 |
| | $ | 4,833 |
|
| | 2012 | | 2,209,974 |
| | 83,334 |
| | 3,072 |
| | 4,188 |
| 2013 | | 2,102,273 |
| | 88,942 |
| | 16,172 |
| | 11,431 |
|
| | 2011 | | |
| | 93,454 |
| | (230 | ) | | 1,446 |
| 2012 | | |
| | 83,334 |
| | 3,072 |
| | 4,188 |
|
| |
(1) | Total assets include long-lived assets, which are primarily located in the U.S. |
| |
(2) | There were no material intercompany revenues between geographic regions for any of the periods presented. |
| |
(3) | IncludesSubstantially reflects the Corporation’s Canadian operations, which had total assets of $9.6 billion and $8.3 billion at December 31, 2013 and 2012; total revenue, net of interest expense of $364 million, $317 million and $1.3 billion; income before income taxes of $258 million, $202 million and $621 million; and net income of $199 million, $141 million and $528 million for 2013, 2012 and 2011, respectively.
U.S. |
| |
(4) | Amounts include pre-taxpretax gains of $753 million and $6.5 billion($474 million and $4.1 billion net-of-tax) on the sale of common shares of CCB during 2013 and 2011.2013. |
|
| | |
| | 280Bank of America 20132014264
| | |
Item 9. Changes in and Disagreements with Accountants on Accounting and Financial Disclosure
None
Item 9A. Controls and Procedures
Disclosure Controls and Procedures
As of the end of the period covered by this report and pursuant to Rule 13a-15 of the Securities Exchange Act of 1934 (Exchange Act), Bank of America’s management, including the Chief Executive
Officer and Chief Financial Officer, conducted an evaluation of the effectiveness and design of our disclosure controls and procedures (as that term is defined in Rule 13a-15(e) of the Exchange Act). Based upon that evaluation, Bank of America’s Chief Executive Officer and Chief Financial Officer concluded that Bank of America’s disclosure controls and procedures were effective, as of the end of the period covered by this report, in recording, processing, summarizing and reporting information required to be disclosed by the Corporation in reports that it files or submits under the Exchange Act, within the time periods specified in the Securities and Exchange Commission’s rules and forms.
|
| | |
| | 265Bank of America 20132812014 | | |
Report of Independent Registered Public Accounting Firm
To the Board of Directors of Bank of America Corporation:
We have examined, based on criteria established in Internal Control – Integrated Framework (1992)(2013) issued by the Committee of Sponsoring Organizations of the Treadway Commission, Bank of America Corporation’s (the “Corporation”) assertion, included under Item 9A, that the Corporation’s disclosure controls and procedures were effective as of December 31, 20132014 (“Management’s Assertion”). Disclosure controls and procedures mean controls and other procedures of an issuer that are designed to ensure that information required to be disclosed by an issuer in reports that it files or submits under the Securities Exchange Act of 1934 is recorded, processed, summarized, and reported within the time periods specified in the Securities and Exchange Commission’s rules and forms, and that information required to be disclosed by an issuer in reports that it files or submits under the Securities Exchange Act of 1934 is accumulated and communicated to the issuer’s management, including its principal executive and principal financial officer, or persons performing similar functions, as appropriate, to allow timely decisions regarding required disclosure. The Corporation’s management is responsible for maintaining effective disclosure controls and procedures and for Management’s Assertion of the effectiveness of its disclosure controls and procedures. Our responsibility is to express an opinion on Management’s Assertion based on our examination.
There are inherent limitations to disclosure controls and procedures. Because of these inherent limitations, effective disclosure controls and procedures can only provide reasonable assurance of achieving the intended objectives. Disclosure controls and procedures may not prevent, or detect and correct, material misstatements, and they may not identify all information relating to the Corporation to be accumulated and communicated to the Corporation’s management to allow timely decisions regarding required disclosures. Also, projections of any evaluation
of effectiveness to future periods are subject to the risk that disclosure controls and procedures may become inadequate because of changes in conditions, or that the degree of compliance with the policies or procedures may deteriorate.
We conducted our examination in accordance with attestation standards established by the Public Company Accounting Oversight Board (United States). Those standards require that we plan and perform the examination to obtain reasonable assurance about whether effective disclosure controls and procedures were maintained in all material respects. Our examination included obtaining an understanding of the Corporation’s disclosure controls and procedures and testing and evaluating the design and operating effectiveness of the Corporation’s disclosure controls and procedures based on the assessed risk. Our examination also included performing such other procedures as we considered necessary in the circumstances. We believe that our examination provides a reasonable basis for our opinion. Our examination was not conducted for the purpose of expressing an opinion, and accordingly we express no opinion, on the accuracy or completeness of the Corporation’s disclosures in its reports, or whether such disclosures comply with the rules and regulations adopted by the Securities and Exchange Commission.
In our opinion, Management’s Assertion that the Corporation’s disclosure controls and procedures were effective as of December 31, 20132014 is fairly stated, in all material respects, based on criteria established in Internal Control – Integrated Framework (1992)(2013) issued by the Committee of Sponsoring Organizations of the Treadway Commission.
Charlotte, North Carolina
February 25, 2014
2015
|
| | |
| | 282Bank of America 20132014266
| | |
Report of Management on Internal Control Over Financial Reporting
The Report of Management on Internal Control over Financial Reporting is set forth on page 150141 and incorporated herein by reference. The Report of Independent Registered Public Accounting Firm with respect to the Corporation’s internal control over financial reporting is set forth on page 151142 and incorporated herein by reference.
Changes in Internal Control Over Financial Reporting
There have been no changes in our internal control over financial reporting (as defined in Rule 13a-15(f) of the Exchange Act) during the quarter ended December 31, 20132014, that materially affected, or are reasonably likely to materially affect, our internal control over financial reporting.
Item 9B. Other Information
None
|
| | |
| | 267Bank of America 20132832014 | | |
Part III
Bank of America Corporation and Subsidiaries
Item 10. Directors, Executive Officers and Corporate Governance
Executive Officers of The Registrant
The name, age, position and office, and business experience during the last five years of our current executive officers are:
Dean C. Athanasia (48)President, Preferred & Small Business Banking,and Co-Head - Consumer Banking since September 2014; Preferred and Small Business Banking Executive from April 2011 to September 2014; and Head of Global Banking and Merrill Edge from April 2009 to April 2011.
David C. Darnell (61) Co-chief Operating Officer(62) Vice Chairman, Global Wealth & Investment Management since September 2011;2014; Co-chief Operating Officer from September 2011 to September 2014; and President, Global Commercial Banking from July 2005 to September 2011. Mr. Darnell joined the Corporation in 1979 and served in a number of senior leadership roles prior to July 2005.
Terrence P. Laughlin (59) Geoffrey S. Greener (50)Chief Risk Officer since April 2014; Head of Enterprise Capital Management from April 2011 to April 2014; Head of Global Markets Portfolio Management, Chair of Global Markets Capital Committee and Global Markets Regulatory Reform Executive Committee from April 2010 to March 2011; and Head of Structured Portfolios Group from March 2009 to April 2010.
Terry Laughlin (60) President of Strategic Initiatives since April 2014;Chief Risk Officer from August 2011;2011 to April 2014; Legacy Asset Servicing Executive from February 2011 to August 2011; Credit Loss Mitigation Strategies & Secondary Markets Executive from August 2010 to February 2011; and Chief Executive Officer and President of OneWestOne West Bank, FSB from March 2009 to July 2010.
Gary G. Lynch (63)(64) Global General Counsel andsince September 2012; Head of Compliance and Regulatory Relations sincefrom September 2012;2012 to February 2015; Global Chief of Legal, Compliance and Regulatory Relationsfrom July 2011 to September 2012; Vice Chairman of Morgan Stanley from May 2009 to July 2011; and Chief Legal Officer of Morgan Stanley from October 2005 to September 2010.
Thomas K. Montag (57)(58) Chief Operating Officersince September 2014; Co-chief Operating OfficersincefromSeptember2011to September 2011;2014; and President, Global Banking and Markets from August 2009 to September 2011; and President, Global Markets from January 2009 to August 2009.2011.
Brian T. Moynihan (54)(55) Chairman of the Boardsince October 2014 and President and Chief Executive Officer and member of the Board of Directors since January 2010.
Thong M. Nguyen (56)President, Retail Banking, and Co-Head – Consumer Banking since January 2010; President, ConsumerSeptember 2014; Retail Banking Executive from April 2014 to September 2014; Retail Strategy, Operations & Digital Banking Executive from September 2012 to April 2014; Global Corporate Strategy, Planning and SmallDevelopment Executive from November 2011 to September 2012; West Division Executive for U.S. Trust from February 2010 to November 2011; and GCIB Business BankingTransformation Executive from August 2009 to December 2009; President, Global Banking and Wealth Management from January 2009 to August 2009; and General Counsel from December 2008 to January 2009.February 2010.
Bruce R. Thompson (49)(50) Chief Financial Officer since June 2011; and Chief Risk Officer from January 2010 to June 2011; and Head of Global Capital Markets from July 2008 to January 2010.2011.
Information included under the following captions in the Corporation’s proxy statement relating to its 20142015 annual meeting of stockholders, scheduled to be held on May 7, 20146, 2015 (the 20142015 Proxy Statement), is incorporated herein by reference:
| |
| Ÿ | “Proposal 1: Election ofElecting Directors – The Nominees;” |
| |
| Ÿ | “Corporate Governance – Section 16(a) Beneficial Ownership Reporting Compliance;” |
| |
| Ÿ | “Corporate Governance – Additional Corporate Governance Information Available”Information” and |
| |
| Ÿ | “– Board Meetings, Committee Membership and Attendance.” |
Item 11. Executive Compensation
Information included under the following captions in the 20142015 Proxy Statement is incorporated herein by reference:
| |
| Ÿ | “Proposal 2: An Advisory (Non-Binding) Resolution to ApproveApproving our Executive Compensation (Say(an advisory, non-binding "Say on Pay) Pay" resolution) – Compensation Discussion and Analysis;” |
| |
| Ÿ | “– Compensation and Benefits Committee Report;” |
| |
| Ÿ | “– Compensation Discussion and Analysis;” |
| |
Ÿ | “– Executive Compensation;” and |
| |
| Ÿ | “Corporate Governance – Director“Compensation Governance and Risk Management;” and – “Director Compensation.” |
|
| | |
| | 284Bank of America 20132014268
| | |
Item 12. Security Ownership of Certain Beneficial Owners and Management and Related Stockholder Matters
Information included under the following caption in the 20142015 Proxy Statement is incorporated herein by reference:
| |
| Ÿ | “Corporate Governance – Stock Ownership of Directors, Executive Officers and Certain Beneficial Owners.” |
The table below presents information on equity compensation plans at December 31, 20132014:
| | | | | | | | | | | | | |
Plan Category (1, 2) | Number of Shares to
be Issued Under
Outstanding Options and Rights | | Weighted-average
Exercise Price of
Outstanding Options (3) | | Number of Shares Remaining for Future Issuance Under Equity Compensation Plans (4) | Number of Shares to
be Issued Under
Outstanding Options and Rights | | Weighted-average
Exercise Price of
Outstanding Options (3) | | Number of Shares Remaining for Future Issuance Under Equity Compensation Plans (4) |
Plans approved by shareholders (5) | 168,980,799 |
| | $ | 45.90 |
| | 297,559,506 |
| 103,496,664 |
| | $ | 47.66 |
| | 325,450,174 |
|
Plans not approved by shareholders (6) | 2,481,761 |
| | — |
| | — |
| — |
| | — |
| | — |
|
| Total | 171,462,560 |
| | $ | 45.90 |
| | 297,559,506 |
| 103,496,664 |
| | $ | 47.66 |
| | 325,450,174 |
|
| |
(1) | This table does not include outstanding options to purchase 8,843,2783,573,160 shares of the Corporation’s common stock that were assumed by the Corporation in connection with prior acquisitions, under whose plans the options were originally granted. The weighted-average optionexercise price of these assumed options was $77.55$82.50 at December 31, 20132014. Also, at December 31, 20132014, there were 122,57696,699 vested restricted stock units associated with these plans. No additional awards were granted under these plans following the respective dates of acquisition. |
| |
(2) | This table does not include outstanding options to purchase 5,510,2015,328,026 shares of the Corporation’s common stock that were assumed by the Corporation in connection with the Merrill Lynch acquisition, which were originally issued under certain Merrill Lynch plans. The weighted-average optionexercise price of these assumed options was $46.61$45.82 at December 31, 20132014. Also, at December 31, 20132014, there were 7,443,1495,481,907 outstanding restricted stock units and 1,257,5641,073,175 vested restricted stock units and stock option gain deferrals associated with such plans. These Merrill Lynch plans were frozen at the time of the acquisition and no additional awards may be granted under these plans. However, as previously approved by the Corporation’s shareholders, if any of the outstanding awards under these frozen plans subsequently are canceled, forfeited or settled in cash, the shares relating to such awards thereafter will be available for future awards issued under the Corporation’s Key Associate Stock Plan (KASP). |
| |
(3) | Does not reflect restricted stock units included in the first column, which do not have an exercise price. |
| |
(4) | Plans approved by shareholders includes 297,160,101include 325,123,558 shares of common stock available for future issuance under the KASP (including 29,294,52529,795,525 shares originally subject to awards outstanding under frozen Merrill Lynch plans at the time of the acquisition which subsequently have been canceled, forfeited or settled in cash and become available for issuance under the KASP, as described in footnote (2) above) and 399,405326,616 shares of common stock which are available for future issuance under the Corporation’s Directors’ Stock Plan. |
| |
(5) | Includes 61,165,58724,310,796 outstanding restricted stock units. |
| |
| Represents restricted stock units that were outstanding under the Merrill Lynch Employee Stock Compensation Plan (ESCP) at December 31, 2013. In connection with the Merrill Lynch acquisition, the Corporation assumed and continued to issue awards under the ESCP in accordance with applicable NYSE listing standards until the expiration of the ESCP on February 24, 2013. The ESCP was approved by Merrill Lynch’s shareholders prior to the acquisition but was not approved by the Corporation’s shareholders. Under the ESCP, the Corporation could award restricted shares, restricted units, incentive stock options, nonqualified stock options and stock appreciation rights to employees who were salaried key employees of Merrill Lynch or its subsidiaries immediately prior to the effective date of the acquisition, other than executive officers. Shares that were canceled, forfeited or settled in cash from an additional frozen Merrill Lynch plan also became available for grant under the ESCP prior to its expiration. As of February 15, 2014, all restricted stock units outstanding under the ESCP had vested or expired, and no additional awards may be granted thereunder. |
Item 13. Certain Relationships and Related Transactions, and Director Independence
Information included under the following captions in the 20142015 Proxy Statement is incorporated herein by reference:
| |
| Ÿ | “Corporate Governance – Related Person and Certain Other Transactions;” and |
| |
| Ÿ | “Corporate Governance – Director Independence.” |
Item 14. Principal Accounting Fees and Services
Information included under the following captions in the 20142015 Proxy Statement is incorporated herein by reference:
| |
| Ÿ | “Proposal 3: Ratification of theRatifying Appointment of theour Registered Independent Public Accounting Firm for 20142015 – PwC’s 2014 and 2013 and 2012 Fees;” and “Audit |
| |
| Ÿ | “– Audit Committee Pre-Approval Policies and Procedures.” |
|
| | |
| | 269Bank of America 20132852014 | | |
Part IV
Bank of America Corporation and Subsidiaries
Item 15. Exhibits, Financial Statement Schedules
The following documents are filed as part of this report:
(1) Financial Statements:
Report of Independent Registered Public Accounting Firm
Consolidated Statement of Income for the years ended December 31, 20132014, 20122013 and 20112012
Consolidated Statement of Comprehensive Income for the years ended December 31, 20132014, 20122013 and 20112012
Consolidated Balance Sheet at December 31, 20132014 and 20122013
Consolidated Statement of Changes in Shareholders’ Equity for the years ended December 31, 20132014, 20122013 and 20112012
Consolidated Statement of Cash Flows for the years ended December 31, 20132014, 20122013 and 20112012
Notes to Consolidated Financial Statements
(2) Schedules:
None
(3) The exhibits filed as part of this report and exhibits incorporated herein by reference to other documents are listed in the Index to Exhibits to this Annual Report on Form 10-K (pages E-1 through E-4).
With the exception of the information expressly incorporated herein by reference, the 20142015 Proxy Statement shall not be deemed filed as part of this Annual Report on Form 10-K.
|
| | |
| | 286Bank of America 20132014270
| | |
Signatures
Pursuant to the requirements of Section 13 of the Securities Exchange Act of 1934, the registrant has duly caused this report to be signed on its behalf by the undersigned, thereunto duly authorized.
Date: February 25, 20142015
|
| |
| Bank of America Corporation |
| | |
| By: | /s/ Brian T. Moynihan |
| | Brian T. Moynihan |
| | Chief Executive Officer and President |
Pursuant to the requirements of the Securities Exchange Act of 1934, this report has been signed below by the following persons on behalf of the registrant and in the capacities and on the dates indicated.
|
| | | | | |
| | Signature | | Title | | Date |
| | | | | | |
| | /s/ Brian T. Moynihan | | Chief Executive Officer, PresidentChairman and Director (Principal Executive Officer) | | February 25, 20142015 |
| | Brian T. Moynihan | | |
| | | | | | |
| | */s/ Bruce R. Thompson | | Chief Financial Officer (Principal Financial Officer) | | February 25, 20142015 |
| | Bruce R. Thompson | | |
| | | | | | |
| | */s/ Neil A. Cotty | | Chief Accounting Officer (Principal Accounting Officer) | | February 25, 20142015 |
| | Neil A. Cotty | | |
| | | | | | |
| | */s/ Sharon L. Allen | | Director | | February 25, 20142015 |
| | Sharon L. Allen | | |
| | | | | | |
| | */s/ Susan S. Bies | | Director | | February 25, 20142015 |
| | Susan S. Bies | | |
| | | | | | |
| | */s/ Jack O. Bovender, Jr. | | Director | | February 25, 20142015 |
| | Jack O. Bovender, Jr. | | |
| | | | | | |
| | */s/ Frank P. Bramble, Sr. | | Director | | February 25, 20142015 |
| | Frank P. Bramble, Sr. | | |
| | | | | | |
| | */s/ Pierre de Weck | | Director | | February 25, 20142015 |
| | Pierre de Weck | | |
| | | | | | |
| | */s/ Arnold W. Donald | | Director | | February 25, 20142015 |
| | Arnold W. Donald | | |
| | | | | | |
| | */s/ Charles K. Gifford | | Director | | February 25, 20142015 |
| | Charles K. Gifford | | |
| | | | | | |
| | */s/ Charles O. Holliday, Jr. | | Director | | February 25, 20142015 |
| | Charles O. Holliday, Jr. | | |
| | | | | | |
|
| | |
| | 271Bank of America 20132872014 | | |
|
| | | | | |
| | Signature | | Title | | Date |
| | | | | | |
| | */s/ Linda P. Hudson | | Director | | February 25, 20142015 |
| | Linda P. Hudson | | |
| | | | | | |
| | */s/ Monica C. Lozano | | Director | | February 25, 20142015 |
| | Monica C. Lozano | | |
| | | | | | |
| | */s/ Thomas J. May | | Director | | February 25, 20142015 |
| | Thomas J. May | | |
| | | | | | |
| | */s/ Lionel L. Nowell, III | | Director | | February 25, 20142015 |
| | Lionel L. Nowell, III | | |
| | | | | | |
| | */s/ Clayton S. Rose | | Director | | February 25, 20142015 |
| | Clayton S. Rose | | |
| | | | | | |
| | */s/ R. David Yost | | Director | | February 25, 20142015 |
| | R. David Yost | | |
| | | | | | |
| *By | /s/ Ross E. Jeffries, Jr. | | | | |
| | Ross E. Jeffries, Jr. Attorney-in-Fact | | | | |
|
| | |
| | 288Bank of America 20132014272
| | |
Index to Exhibits
|
| | |
| Exhibit No. | | Description |
| 3(a) | | Amended and Restated Certificate of Incorporation of registrant,the Corporation, as in effect on the date hereof, incorporated by reference to Exhibit 3(a)4.1 of registrant’s Quarterly Reportthe post-effective amendment to the Corporation’s Registration Statement on Form 10-QS-3ASR (File No. 1-6523) for the quarterly period ended June 30, 2013333-180488) filed on August 1, 2013.February 23, 2015. |
| (b) | | Amended and Restated Bylaws of registrant,the Corporation, as in effect on the date hereof, incorporated by reference to Exhibit 3.1 of registrant’sthe Corporation’s Current Report on Form 8-K (File No. 1-6523) filed on August 22, 2013.October 1, 2014. |
| 4(a) | | Indenture dated as of January 1, 1995 between registrant (successor to NationsBank Corporation) and BankAmerica National Trust Company incorporated by reference to Exhibit 4.1 of registrant’s Registration Statement on Form S-3 (Registration No. 33-57533) filed on February 1, 1995; First Supplemental Indenture thereto dated as of September 18, 1998 between registrant and U.S. Bank Trust National Association (successor to BankAmerica National Trust Company), incorporated by reference to Exhibit 4.3 of registrant’s Current Report on Form 8-K (File No. 1-6523) filed on November 18, 1998; Second Supplemental Indenture thereto dated as of May 7, 2001 between registrant, U.S. Bank Trust National Association, as Prior Trustee, and The Bank of New York, as Successor Trustee, incorporated by reference to Exhibit 4.4 of registrant’s Current Report on Form 8-K (File No. 1-6523) filed on June 14, 2001; Third Supplemental Indenture thereto dated as of July 28, 2004 between registrant and The Bank of New York, incorporated by reference to Exhibit 4.2 of registrant’s Current Report on Form 8-K (File No. 1-6523) filed on August 27, 2004; Fourth Supplemental Indenture thereto dated as of April 28, 2006 between the registrant and The Bank of New York, incorporated by reference to Exhibit 4.6 of registrant’s Registration Statement on Form S-3 (Registration No. 333-133852) filed on May 5, 2006; Fifth Supplemental Indenture thereto dated as of December 1, 2008 between registrant and The Bank of New York Mellon Trust Company, N.A. (successor to The Bank of New York), incorporated by reference to Exhibit 4.1 of registrant’s Current Report on Form 8-K (File No. 1-6523) filed on December 5, 2008; and Sixth Supplemental Indenture thereto dated as of February 23, 2011 between registrant and The Bank of New York Mellon Trust Company, N.A., incorporated by reference to Exhibit 4(ee) of registrant’s 2010 Annual Report on Form 10-K (File No. 1-6523) filed on February 20, 2011 (the “2010 10-K”). |
| (b) | | Successor Trustee Agreement effective December 15, 1995 between registrant (successor to NationsBank Corporation) and First Trust of New York, National Association, as successor trustee to BankAmerica National Trust Company, incorporated by reference to Exhibit 4.2 of registrant’s Registration Statement on Form S-3 (Registration No. 333-07229) filed on June 28, 1996. |
| (c) | | Agreement of Appointment and Acceptance dated as of December 29, 2006 between registrant and The Bank of New York Trust Company, N.A., incorporated by reference to Exhibit 4(aaa) of registrant’s 2006 Annual Report on Form 10-K (File No. 1-6523) filed on February 28, 2007 (the “2006 10-K”). |
| (d) | | Form of Senior Registered Note, incorporated by reference to Exhibit 4.7 of registrant’s Registration Statement on Form S-3 (Registration No. 333-133852) filed on May 5, 2006. |
| (e) | | Form of Global Senior Medium-Term Note, Series L, incorporated by reference to Exhibit 4.13 of registrant’s Registration Statement on Form S-3 (Registration No. 333-180488) filed on March 30, 2012. |
| (f) | | Form of Master Global Senior Medium-Term Note, Series L, incorporated by reference to Exhibit 4.14 of registrant’s Registration Statement on Form S-3 (Registration No. 333-180488) filed on March 30, 2012. |
| | | Registrant and its subsidiaries have other long-term debt agreements, but these are omitted pursuant to Item 601(b)(4)(iii) of Regulation S-K. Copies of these agreements will be furnished to the Commission on request. |
10(a)
| | Bank of America Pension Restoration Plan, as amended and restated effective January 1, 2009, incorporated by reference to Exhibit 10(c) of registrant’s 2008 Annual Report on Form 10-K (File No. 1-6523) filed on February 27, 2009 (the “2008 10-K”); Amendment thereto dated December 18, 2009, incorporated by reference to Exhibit 10(c) of registrant’s 2009 Annual Report on Form 10-K (File No. 1-6523) filed on February 26, 2010 (the “2009 10-K”); Amendment thereto dated December 16, 2010, incorporated by reference to Exhibit 10(c) of the 2010 10-K; and Amendment thereto dated June 29, 2012, incorporated by reference to Exhibit 10(a) of registrant’s 2012 Annual Report on Form 10-K (File No. 1-6523) filed FebruraryFebruary 28, 2013 (the “2012 10-K”).* |
| (b) | | NationsBank Corporation Benefit Security Trust dated as of June 27, 1990, incorporated by reference to Exhibit 10(t) of registrant’s 1990 Annual Report on Form 10-K (File No. 1-6523); First Supplement thereto dated as of November 30, 1992, incorporated by reference to Exhibit 10(v) of registrant’s 1992 Annual Report on Form 10-K (File No. 1-6523); Trustee Removal/Appointment Agreement dated as of December 19, 1995, incorporated by reference to Exhibit 10(o) of registrant’s 1995 Annual Report on Form 10-K (File No. 1-6523) filed on March 29, 1996.* |
| (c) | | Bank of America 401(k) Restoration Plan, as amended and restated effective January 1, 2013, incorporated by reference to Exhibit 10(c) of the 2012 10-K.2015, filed herewith.* |
| (d) | | Bank of America Executive Incentive Compensation Plan, as amended and restated effective December 10, 2002, incorporated by reference to Exhibit 10(g) of registrant’s 2002 Annual Report on Form 10-K (File No. 1-6523) filed on March 3, 2003; and Amendment thereto dated January 23, 2013, incorporated by reference to Exhibit 10(d) of the 2012 10-K.* |
| (e) | | Bank of America Director Deferral Plan, as amended and restated effective January 1, 2005, incorporated by reference to Exhibit 10(g) of the 2006 10-K.* |
| (f) | | Bank of America Corporation Directors’ Stock Plan as amended and restated effective April 26, 2006, incorporated by reference to Exhibit 10.2 to the registrant’s Current Report on Form 8-K filed on December 14, 2005* and the following termsforms of award agreements: |
| | | •Form of Restricted Stock Award Agreement, incorporated by reference to Exhibit 10(h) of registrant’s 2004 Annual Report on Form 10-K (File No. 1-6523) filed on March 1, 2005 (the “2004 10-K”);* •Form of Directors Stock Plan Restricted Stock Award Agreement for Non-Employee Chairman, incorporated by reference to Exhibit 10(b) of registrant’s Quarterly Report on Form 10-Q (File No. 1-6523) for the quarterly period ended September 30, 2009 filed on November 6, 2009;* •Form of Directors’ Stock Plan Restricted Stock Award Agreement for Non-U.S. Director, incorporated by reference to Exhibit 10(a) of registrant’s Quarterly Report on Form 10-Q (File No. 1-6523) for the quarterly period ended March 31, 2011 filed on May 5, 2011;* and •Form of Directors’ Stock Plan Conditional Restricted Stock Award Agreement for Non-U.S. Director, incorporated by reference to Exhibit 10(a) of registrant’s Quarterly Report on Form 10-Q (File No. 1-6523) for the quarterly period ended June 30, 2011 filed on August 4, 2011.* |
|
| | |
| | E-1Bank of America 2013E-12014 | | |
|
| | |
| Exhibit No. | | Description |
| (g) | | Bank of America Corporation Key Associate Stock Plan, as amended and restated effective April 28, 2010, incorporated by reference to Exhibit 10.2 of registrant’s Current Report on Form 8-K (File No. 1-6523) filed on May 3, 2010* and the following forms of award agreement under the plan: |
| | | • Form of Stock Option Award Agreement (February 2007 grant), incorporated by reference to Exhibit 10(i) of registrant’s 2007 Annual Report on Form 10-K (File No. 1-6523) filed on February 28, 2008;* • Form of Stock Option Award Agreement for non-executives (February 2008 grant), incorporated by reference to Exhibit 10(i) of the 2009 10-K;* • Form of Restricted Stock Units Award Agreement for executives (February 2010 grant), incorporated by reference to Exhibit 10(i) of the 2010 10-K;* • Form of Performance Contingent Restricted Stock Units Award Agreement, incorporated by reference to Exhibit 10.3 of registrant’s Current Report on Form 8-K (File No. 1-6523) filed on January 31, 2011;* • Form of Performance Contingent Restricted Stock Units Award Agreement (February 2011 grant), incorporated by reference to Exhibit 10(i) of the 2010 10-K;* • Form of Restricted Stock Units Award Agreement for non-executives (February 2011 grant), incorporated by reference to Exhibit 10(i) of the 2010 10-K;* • Form of Restricted Stock Units Award Agreement (February 2012 grant), incorporated by reference to Exhibit 10(i) of registrant’s 2011 Annual Report on Form 10-K (File No. 1-6523) filed on February 25, 2012 (the “2011 10-K”);* •Form of Performance Contingent Restricted Stock Units Award Agreement (February 2012 grant), incorporated by reference to Exhibit 10(i) of the 2011 10-K;* • Restricted Stock Units Award Agreement for Gary G. Lynch dated July 12, 2011, incorporated by reference to Exhibit 10(a) of registrant’s Quarterly Report on Form 10-Q (File No. 1-6523) for the quarterly period ended March 31, 2012 (the “1Q 2012 10-Q”) filed on May 3, 2012;* • Form of Restricted Stock Units Award Agreement (February 2013 and subsequent grants), including grants to named executive officers, incorporated by reference to Exhibit 10(a) of registrant’s Quarterly Report on Form 10-Q (File No. 1-6523) for the quarterly period ended March 31, 2013 filed on May 5, 2013 (the “1Q2013“1Q 2013 10-Q”);* and • Form of Performance Restricted Stock Units Award Agreement (February 2013 and subsequent grants), including grants to named executive officers incorporated by reference to Exhibit 10(b) of the 1Q20131Q 2013 10-Q.* and • Form of Performance Restricted Stock Units Award Agreement (February 2014 and subsequent grants), including grants to named executive officers, incorporated by reference to Exhibit 10(a) of registrant's Quarterly Report on Form 10-Q (File No. 1-6523) for the quarterly period ended March 31, 2014 filed on May 1, 2014.* |
| (h) | | Amendment to various plans in connection with FleetBoston Financial Corporation merger, incorporated by reference to Exhibit 10(v) of registrant’s 2003 Annual Report on Form 10-K (File No. 1-6523) filed on March 1, 2004.* |
| (i) | | FleetBoston Supplemental Executive Retirement Plan, as amended by Amendment One thereto effective January 1, 1997, Amendment Two thereto effective October 15, 1997, Amendment Three thereto effective July 1, 1998, Amendment Four thereto effective August 15, 1999, Amendment Five thereto effective January 1, 2000, Amendment Six thereto effective October 10, 2001, Amendment Seven thereto effective February 19, 2002, Amendment Eight thereto effective October 15, 2002, Amendment Nine thereto effective January 1, 2003, Amendment Ten thereto effective October 21, 2003, and Amendment Eleven thereto effective December 31, 2004, incorporated by reference to Exhibit 10(r) of the 2004 10-K.* |
| (j) | | FleetBoston Executive Deferred Compensation Plan No. 2, as amended by Amendment One thereto effective February 1, 1999, Amendment Two thereto effective January 1, 2000, Amendment Three thereto effective January 1, 2002, Amendment Four thereto effective October 15, 2002, Amendment Five thereto effective January 1, 2003, and Amendment Six thereto effective December 16, 2003, incorporated by reference to Exhibit 10(u) of the 2004 10-K.* |
| (k) | | FleetBoston Executive Supplemental Plan, as amended by Amendment One thereto effective January 1, 2000, Amendment Two thereto effective January 1, 2002, Amendment Three thereto effective January 1, 2003, Amendment Four thereto effective January 1, 2003, and Amendment Five thereto effective December 31, 2004, incorporated by reference to Exhibit 10(v) of the 2004 10-K.* |
| (l) | | Retirement Income Assurance Plan for Legacy Fleet, as amended and restated effective January 1, 2009, incorporated by reference to Exhibit 10(p) of the 2009 10-K; Amendment thereto dated December 16, 2010, incorporated by reference to Exhibit 10(c) of the 2010 10-K; and Amendment thereto dated June 29, 2012, incorporated by reference to Exhibit 10(l) of the 2012 10-K.* |
| (m) | | Trust Agreement for the FleetBoston Executive Deferred Compensation Plans No. 1 and 2, incorporated by reference to Exhibit 10(x) of the 2004 10-K.* |
| (n) | | Trust Agreement for the FleetBoston Executive Supplemental Plan, incorporated by reference to Exhibit 10(y) of the 2004 10-K.* |
| (o) | | Trust Agreement for the FleetBoston Retirement Income Assurance Plan and the FleetBoston Supplemental Executive Retirement Plan, incorporated by reference to Exhibit 10(z) of the 2004 10-K.* |
| (p) | | FleetBoston Directors Deferred Compensation and Stock Unit Plan, as amended by an amendment thereto effective as of July 1, 2000, a Second Amendment thereto effective as of January 1, 2003, a Third Amendment thereto dated April 14, 2003, and a Fourth Amendment thereto effective January 1, 2004, incorporated by reference to Exhibit 10(aa) of the 2004 10-K.* |
| (q) | | BankBoston Corporation and its Subsidiaries Deferred Compensation Plan, as amended by a First Amendment thereto, a Second Amendment thereto, a Third Amendment thereto, an Instrument thereto (providing for the cessation of accruals effective December 31, 2000) and an Amendment thereto dated December 24, 2001, incorporated by reference to Exhibit 10(cc) of the 2004 10-K.* |
| (r) | | BankBoston, N.A. Bonus Supplemental Employee Retirement Plan, as amended by a First Amendment thereto, a Second Amendment thereto, a Third Amendment thereto and a Fourth Amendment thereto, incorporated by reference to Exhibit 10(dd) of the 2004 10-K.* |
| (s) | | Description of BankBoston Supplemental Life Insurance Plan, incorporated by reference to Exhibit 10(ee) of the 2004 10-K.* |
| (t) | | BankBoston, N.A. Excess Benefit Supplemental Employee Retirement Plan, as amended by a First Amendment thereto, a Second Amendment thereto, a Third Amendment thereto (assumed by FleetBoston on October 1, 1999) and an Instrument thereto, incorporated by reference to Exhibit 10(ff) of the 2004 10-K.* |
| (u) | | Description of BankBoston Supplemental Long-Term Disability Plan, incorporated by reference to Exhibit 10(gg) of the 2004 10-K.* |
| (v) | | BankBoston Director Stock Award Plan, incorporated by reference to Exhibit 10(hh) of the 2004 10-K.* |
| (w) | | BankBoston Corporation Directors’ Deferred Compensation Plan, as amended by a First Amendment thereto and a Second Amendment thereto, incorporated by reference to Exhibit 10(ii) of the 2004 10-K.* |
| (x) | | BankBoston, N.A. Directors’ Deferred Compensation Plan, as amended by a First Amendment thereto and a Second Amendment thereto, incorporated by reference to Exhibit 10(jj) of the 2004 10-K.* |
| (y) | | BankBoston 1997 Stock Option Plan for Non-Employee Directors, as amended by an amendment thereto dated as of October 16, 2001, incorporated by reference to Exhibit 10(kk) of the 2004 10-K.* |
| (z) | | Description of BankBoston Director Retirement Benefits Exchange Program, incorporated by reference to Exhibit 10(ll) of the 2004 10-K.* |
| (aa) | | Employment Agreement, dated as of March 14, 1999, between FleetBoston and Charles K. Gifford, as amended by an amendment thereto effective as of February 7, 2000, a Second Amendment thereto effective as of April 22, 2002, and a Third Amendment thereto effective as of October 1, 2002, incorporated by reference to Exhibit 10(mm) of the 2004 10-K.* |
| (bb) | | Form of Change in Control Agreement entered into with Charles K. Gifford, incorporated by reference to Exhibit 10(nn) of the 2004 10-K.* |
|
| | |
| | E-2Bank of America 20132014E-2
| | |
|
| | |
| Exhibit No. | | Description |
| (cc) | | Global amendment to definition of “change in control” or “change of control,” together with a list of plans affected by such amendment, incorporated by reference to Exhibit 10(oo) of the 2004 10-K.* |
| (dd) | | Retirement Agreement dated January 26, 2005 between registrant and Charles K. Gifford, incorporated by reference to Exhibit 10.1 of registrant’s Current Report on Form 8-K (File No. 1-6523) filed on January 26, 2005.* |
| (ee) | | Employment Agreement dated October 27, 2003 between registrant and Brian T. Moynihan, incorporated by reference to Exhibit 10(d) of registrant’s Registration Statement on Form S-4 (Registration No. 333-110924) filed on December 4, 2003.* |
| (ff) | | Cancellation Agreement dated October 26, 2005 between registrant and Brian T. Moynihan, incorporated by reference to Exhibit 10.1 of registrant’s Current Report on Form 8-K (File No. 1-6523) filed on October 26, 2005.* |
| (gg) | | Agreement Regarding Participation in the Fleet Boston Supplemental Executive Retirement Plan dated October 26, 2005 between registrant and Brian T. Moynihan, incorporated by reference to Exhibit 10.2 of registrant’s Current Report on Form 8-K (File No. 1-6523) filed on October 26, 2005.* |
| (hh) | | Forms of Stock Unit Agreements for salary stock units awarded to certain executive officers in connection with registrant’s participation in the U.S. Department of Treasury’s Troubled Asset Relief Program, incorporated by reference to Exhibit 10(uu) of the 2009 10-K.* |
| (ii) | | Bank of America Corporation Equity Incentive Plan amended and restated effective as of January 1, 2008, incorporated by reference to Exhibit 10(zz) of the 2009 10-K.* |
| (jj) | | Merrill Lynch & Co., Inc. Long-Term Incentive Compensation Plan amended as of January 1, 2009 and 2008 Restricted Units/Stock Option Grant Document for Thomas K. Montag, incorporated by reference to Exhibit 10(aaa) of the 2009 10-K.* |
| (kk) | | Employment Letter dated May 1, 2008 between Merrill Lynch & Co., Inc. and Thomas K. Montag and Summary of Agreement with respect to Post-Employment Medical Coverage, incorporated by reference to Exhibit 10(bbb) of the 2009 10-K.* |
| (ll) | | Form of Warrant to purchase common stock (expiring October 28, 2018), incorporated by reference to Exhibit 4.2 of registrant’s Registration Statement on Form 8-A (File No. 1-6523) filed on March 4, 2010. |
| (mm) | | Form of Warrant to purchase common stock (expiring January 16, 2019), incorporated by reference to Exhibit 4.2 of registrant’s Registration Statement on Form 8-A (File No. 1-6523) filed on March 4, 2010. |
| (nn) | | Retention Award Letter Agreement with Bruce R. Thompson dated January 26, 2009, incorporated by reference to Exhibit 10(ddd) of the 2010 10-K.* |
| (oo) | | Aircraft Time Sharing Agreement (Multiple Aircraft) dated February 24, 2011 between Bank of America, N. A. and Brian T. Moynihan, incorporated by reference to Exhibit 10(jjj) of the 2010 10-K.* |
| (pp) | | Bank of America Corporation and Designated Subsidiaries Supplemental Executive Retirement Plan for Senior Management Employees effective as of January 1, 1989, reflecting the following amendments: Amendments thereto dated as of June 28, 1989, June 27, 1990, July 21, 1991, December 3, 1992, December 15, 1992, September 28, 1994, March 27, 1996, June 25, 1997, April 10, 1998, June 24, 1998, October 1, 1998, December 14, 1999, and March 28, 2001; and Amendment thereto dated December 10, 2002, incorporated by reference to Exhibit 10(jjj) of the 2011 10-K.* |
| (qq) | | Settlement Agreement dated as of June 28, 2011, among The Bank of New York Mellon, registrant, BAC Home Loans Servicing, LP, Countrywide Financial Corporation, and Countrywide Home Loans, Inc., incorporated by reference to Exhibit 99.2 of registrant’s Current Report on Form 8-K (File No. 1-6523) filed on June 29, 2011. |
| (rr) | | Institutional Investor Agreement dated as of June 28, 2011, among The Bank of New York Mellon, registrant, BAC Home Loans Servicing, LP, Countrywide Financial Corporation, Countrywide Home Loans, Inc. and the other parties thereto, incorporated by reference to Exhibit 99.3 of registrant’s Current Report on Form 8-K (File No. 1-6523) filed on June 29, 2011. |
| (ss) | | Securities Purchase Agreement dated August 25, 2011 between registrant and Berkshire Hathaway Inc. (including forms of the Certificate of Designations, Warrant and Registration Rights Agreement), incorporated by reference to Exhibit 1.1 of registrant’s Current Report on Form 8-K (File No. 1-6523) filed on August 25, 2011. |
| (tt) | | Long-Term Cash Award Agreement for Gary G. Lynch dated July 12, 2011, incorporated by reference to Exhibit 10(b) of the 1Q 2012 10-Q.* |
| (uu) | | Offer Letter between registrant and Gary G. Lynch dated April 14, 2011, incorporated by reference to Exhibit 10(c) of the 1Q 2012 10-Q.* |
| 12 | | Ratio of Earnings to Fixed Charges, filed herewith. Ratio of Earnings to Fixed Charges and Preferred Dividends, filed herewith. |
| 21 | | List of Subsidiaries, filed herewith. |
| 23(a) | | Consent of PricewaterhouseCoopers LLP, filed herewith. |
| (b) | | Consent of PricewaterhouseCoopers LLP, filed herewith. |
| 24 | | Power of Attorney, filed herewith. |
| 31(a) | | Certification of the Chief Executive Officer pursuant to Section 302 of the Sarbanes-Oxley Act of 2002, filed herewith. |
| (b) | | Certification of the Chief Financial Officer pursuant to Section 302 of the Sarbanes-Oxley Act of 2002, filed herewith. |
| 32(a) | | Certification of the Chief Executive Officer pursuant to 18 U.S.C. Section 1350, as adopted pursuant to Section 906 of the Sarbanes-Oxley Act of 2002, filed herewith. |
| (b) | | Certification of the Chief Financial Officer pursuant to 18 U.S.C. Section 1350, as adopted pursuant to Section 906 of the Sarbanes-Oxley Act of 2002, filed herewith. |
99(a) | | Resolution Agreement dated as of January 6, 2013 by and among Fannie Mae, Bank of America, National Association and Countrywide Home Loans, Inc., incorporated by reference to Exhibit 99(a) of the 2012 10-K.** |
| Exhibit 101.INS | | XBRL Instance Document, filed herewith. |
| Exhibit 101.SCH | | XBRL Taxonomy Extension Schema Document, filed herewith. |
| Exhibit 101.CAL | | XBRL Taxonomy Extension Calculation Linkbase Document, filed herewith. |
| Exhibit 101.LAB | | XBRL Taxonomy Extension Label Linkbase Document, filed herewith. |
| Exhibit 101.PRE | | XBRL Taxonomy Extension Presentation Linkbase Document, filed herewith. |
|
| | |
| | E-3Bank of America 2013E-32014 | | |
|
| | |
| Exhibit No. | | Description |
| Exhibit 101.DEF | | XBRL Taxonomy Extension Definitions Linkbase Document, filed herewith. |
___________________________
| |
* | Exhibit is a management contract or a compensatory plan or arrangement. |
| |
** | The registrant has received confidential treatment with respect to portions of this exhibit. Those portions have been omitted from this exhibit and filed separately with the U.S. Securities and Exchange Commission. |
|
| | |
| | E-4Bank of America 20132014E-4
| | |