UNITED STATES
SECURITIES AND EXCHANGE COMMISSION
Washington, D.C. 20549
FORM 10-K
☒ ANNUAL REPORT PURSUANT TO SECTION 13 OR 15(d) OF THE SECURITIES EXCHANGE ACT OF 1934
For the fiscal year ended December 31, 20212023
or
☐ TRANSITION REPORT PURSUANT TO SECTION 13 OR 15(d) OF THE SECURITIES EXCHANGE ACT OF 1934
For the transition period from __________ to __________
Commission File Number: 001-02960
Newpark Resources, Inc.
(Exact name of registrant as specified in its charter)
| | | | | | | | |
| Delaware | 72-1123385 |
| (State or other jurisdiction of incorporation or organization) | (I.R.S. Employer Identification No.) |
| | | |
| 9320 Lakeside Boulevard, | Suite 100 | |
| The Woodlands, | Texas | 77381 |
| (Address of principal executive offices) | (Zip Code) |
Registrant’s telephone number, including area code: (281) 362-6800
Securities registered pursuant to Section 12(b) of the Act:
| | | | | | | | |
| Title of each class | Trading Symbol(s) | Name of each exchange on which registered |
| Common Stock, $0.01 par value | NR | New York Stock Exchange |
Securities registered pursuant to Section 12(g) of the Act: None
Indicate by check mark if the registrant is a well-known seasoned issuer, as defined in Rule 405 of the Securities Act.
Yes ☐ No ☑
Indicate by check mark if the registrant is not required to file reports pursuant to Section 13 or Section 15(d) of the Act.
Yes ☐ No ☑
Indicate by check mark whether the registrant (1) has filed all reports required to be filed by Section 13 or 15(d) of the Securities Exchange Act of 1934 during the preceding 12 months (or for such shorter period that the registrant was required to file such reports), and (2) has been subject to such filing requirements for the past 90 days.
Yes ☑ No ☐
Indicate by check mark whether the registrant has submitted electronically every Interactive Data File required to be submitted pursuant to Rule 405 of Regulation S-T (§ 232.405 of this chapter) during the preceding 12 months (or for such shorter period that the registrant was required to submit such files).
Yes ☑ No ☐
Indicate by check mark whether the registrant is a large accelerated filer, an accelerated filer, a non-accelerated filer, a smaller reporting company, or an emerging growth company. See the definitions of “large accelerated filer,” “accelerated filer,” “smaller reporting company,” and “emerging growth company” in Rule 12b-2 of the Exchange Act.
| | | | | | | | | | | | | | |
| Large accelerated filer | ☐ | | Accelerated filer | ☑ |
| Non-accelerated filer | ☐ | | Smaller reporting company | ☐ |
| | | Emerging growth company | ☐ |
If an emerging growth company, indicate by check mark if the registrant has elected not to use the extended transition period for complying with any new or revised financial accounting standards provided pursuant to Section 13(a) of the Exchange Act.☐
☐
Indicate by check mark whether the registrant has filed a report on and attestation to its management’s assessment of the effectiveness of its internal control over financial reporting under Section 404(b) of the Sarbanes-Oxley Act (15 U.S.C. 7262(b)) by the registered public accounting firm that prepared or issued its audit report.
☑
If securities are registered pursuant to Section 12(b) of the Act, indicate by check mark whether the financial statements of the registrant included in the filing reflect the correction of an error to previously issued financial statements.
☐
Indicate by check mark whether any of those error corrections are restatements that required a recovery analysis of incentive-based compensation received by any of the registrant’s executive officers during the relevant recovery period pursuant to §240.10D-1(b).
☐
Indicate by check mark whether the registrant is a shell company (as defined in Rule 12b-2 of the Act).
Yes ☐ No ☑
The aggregate market value of the voting and non-voting common equity held by non-affiliates of the registrant, computed by reference to the price at which the common equity was last sold as of June 30, 2021,2023, was $307.7$453.3 million. The aggregate market value has been computed by reference to the closing sales price on such date, as reported by The New York Stock Exchange.
As of February 18, 2022,16, 2024, a total of 92,353,10485,201,652 shares of common stock, $0.01 par value per share, were outstanding.
Documents Incorporated by Reference:
Pursuant to General Instruction G(3) to this Form 10-K, the information required by Items 10, 11, 12, 13 and 14 of Part III hereof is incorporated by reference from the registrant’s definitive Proxy Statement for its 20222024 Annual Meeting of Stockholders.
NEWPARK RESOURCES, INC.
INDEX TO ANNUAL REPORT ON FORM 10-K
FOR THE YEAR ENDED DECEMBER 31, 20212023
CAUTIONARY STATEMENT CONCERNING FORWARD-LOOKING STATEMENTS
This Annual Report on Form 10-K contains “forward-looking statements” within the meaning of Section 27A of the Securities Act of 1933, as amended, Section 21E of the Securities Exchange Act of 1934, as amended, and the Private Securities Litigation Reform Act of 1995, as amended. We also may provide oral or written forward-looking statements in other materials we release to the public. Words such as “will,” “may,” “could,” “would,” “should,” “anticipates,” “believes,” “estimates,” “expects,” “plans,” “intends,” and similar expressions are intended to identify these forward-looking statements but are not the exclusive means of identifying them. These forward-looking statements reflect the current views of our management;management as of the filing date of this Annual Report on Form 10-K; however, various risks, uncertainties, contingencies, and other factors, some of which are beyond our control, are difficult to predict and could cause our actual results, performance, or achievements to differ materially from those expressed in, or implied by, these statements.
We assume no obligation to update, amend, or clarify publicly any forward-looking statements, whether as a result of new information, future events, or otherwise, except as required by securities laws. In light of these risks, uncertainties, and assumptions, the forward-looking events discussed in this Annual Report on Form 10-K might not occur.
For furtheradditional information regarding these and other factors, risks, and uncertainties that could cause actual results to differ, we refer you to the risk factors set forth in Item 1A "Risk Factors"“Risk Factors” in this Annual Report on Form 10-K.
PART I
ITEM 1. Business
General
Newpark Resources, Inc. is a geographically diversified supplier providing environmentally-sensitive products, as well as rentals and services to customers across multiple industries. We currently operate our business through two reportable segments: Industrial Solutions and Fluids Systems. Systems, as described further below. In addition, we had a third reportable segment, Industrial Blending, which was exited in 2022.
Our Industrial Solutions segment includes our Site and Access Solutions business, along with our Industrial Blending operations. Site and Access Solutions provides temporary worksite access solutions, including the rental of our manufactured recyclable composite matting systems, along with related site construction and services to customers in various markets including power transmission, oil and natural gas exploration and production (“E&P”), pipeline, renewable energy, petrochemical, construction and other industries, primarily in the United States and Europe.United Kingdom. We also sell our manufactured recyclable composite mats to customers around the world, with power transmission being the primary end-market.
Our Fluids Systems segment provides customized drilling completion, and stimulationcompletion fluids products and related technical services to E&P customers for oil, natural gas, and geothermal projects primarily in North America and Europe, the Middle East and Africa (“EMEA”), as well as certain countries in Asia PacificPacific. Over the past few years, our primary focus within Fluids Systems has been the transformation into a more agile and Latin America. We also have industrialsimplified business focused on key markets, while monetizing assets in underperforming or sub-scale markets and reducing our invested capital, particularly in the U.S.
In the fourth quarter of 2022, we exited two of our Fluids Systems business units, including our U.S.-based mineral grinding business as well as our Gulf of Mexico fluids operations. In 2023, we exited our stimulation chemicals product line, certain operations for barite,offshore Australia, and our Latin America operations in Chile. In June 2023, we initiated a critical raw materialreview of strategic alternatives for the long-term positioning of the Fluids Systems division, and in drilling fluids systems, which serve to support our activitiesSeptember 2023, we launched a formal sale process for substantially all the Fluids Systems business as part of this strategic review. While the sale process is ongoing, we anticipate substantially completing the process in mid-2024, although it is not certain regions within the U.S. drilling fluids market and also sell the products to third party users, including other drilling fluids companies. In addition, we sell a variety of other minerals, principally to third-party industrial (non-oil and natural gas) markets.that any such transaction will be consummated on that timeline or at all.
Newpark Resources, Inc. was organized in 1932 as a Nevada corporation. In 1991, we changed our state of incorporation to Delaware. Our principal executive offices are located at 9320 Lakeside Boulevard, Suite 100, The Woodlands, Texas 77381. Our telephone number is (281) 362-6800. You can find more information about us on our website located at www.newpark.com. We file or furnish annual, quarterly and current reports, proxy statements and other documents with the Securities and Exchange Commission (“SEC”). Our Annual Report on Form 10-K, our Quarterly Reports on Form 10-Q, our Current Reports on Form 8-K and any amendments to those reports are available free of charge through our website. These reports are available as soon as reasonably practicable after we electronically file these materials with, or furnish them to, the SEC. Our Code of Ethics, our Corporate Governance Guidelines, our Audit Committee Charter, our Compensation Committee Charter, and our Environmental, Social and Governance Committee Charter are also posted to the corporate governance section of our website. We make our website content available for informational purposes only. It should not be relied upon for investment purposes, nor is itany information contained on our website incorporated by reference in this Form 10-K. The SEC also maintains a website at www.sec.gov that contains reports, proxy and information statements, and other information regarding issuers that file electronically with the SEC, including us.
When referring to Newpark Resources, Inc. (“Newpark,” the “Company,” “we,” “our,” or “us”), the intent is to refer to Newpark Resources, Inc. and its subsidiaries as a whole or on a segment basis, depending on the context in which the statements are made. The reference to a “Note” herein refers to the accompanying Notes to Consolidated Financial Statements contained in Item 8 “Financial Statements and Supplementary Data.”
Industry Fundamentals
Our Industrial Solutions segment, serves a varietywhich has been our primary source of industries, providingoperating income and cash generation in recent years, provides temporary worksite access products and services to thevarious markets including power transmission, E&P, pipeline, renewable energy, petrochemical, construction and other industries. The demand for our products and services from customers in these industries is driven, in part, by infrastructure construction and maintenance activity levels in these industries within the United States and the United Kingdom, including required infrastructure investments to support energy transition efforts. During 2020, our business was impacted by the COVID-19 pandemic, as customers delayed purchases and planned projects citing COVID-related market uncertainty, permitting delays, and logistical restrictions. Product sales revenues largely reflect sales to power transmission customers and other industrial markets, and typically fluctuate based on the timing of customer projects and orders. WeThe power transmission sector contributes the majority of our Industrial Solutions segment revenues, and we expect customer activity particularly in the power transmissionthis sector will remain robust ingrow over the comingnext several years, driven in part by the impacts of the U.S. energy transition and the increasing investment in grid reliance initiatives.
Our Fluids Systems segment operating results remain dependent on oil and natural gas drilling activity levels in the markets we serve and the nature of the drilling operations, (including the depth and whether the wells are drilled vertically or horizontally), which governs the revenue potential of each well. Drilling activity
levels in turn, depend on a variety of factors, including oil and natural gas commodity pricing, inventory levels, product demand, and regulatory restrictions. Oil and natural gas prices and activity are cyclical and volatile, and this market volatility has a significant impact on our operating results. In the transition to clean-renewable energy sources, we see an expanding role for geothermal in the coming years, although this application remains a small portion of the global energy market today.
While our Fluids Systems revenue potential is driven by a number of factors including those described above, rigsegment operating results.
Rig count data remains the most widely accepted indicator of drilling activity. The average Baker Hughes Company North
American Rig Count was 1,077 in 2019, declining to 522 in 2020, then increasing to 606 in 2021. During 2019, U.S. rig count steadily declined, exiting the year at 805 active rigs, a 26% decline from the end of 2018. During March 2020, oil prices collapsed due to geopolitical events along with the worldwide effects of the COVID-19 pandemic. As a result, U.S. rig count declined significantly beginning in March 2020 before reaching a low of 244 in August 2020. During 2021, oil prices rebounded, and the average U.S. rig count gradually increased, resultingsteadily improved in a 10% year-over-year improvement in U.S. rig count. We anticipate that market activity will continue to improve in 2022, although the ongoing impactswake of the COVID-19 variants, an uncertainpandemic, and during 2022, oil prices and rig counts further increased due in part to global economic environment, including widespread supply chain disruptions, as well as enactedrecovery and proposed legislative changesgeopolitical events. In 2023, market activity in the U.S. impactingsteadily declined, ending the year at 622 active rigs, down 20% from the end of 2022. With recent instability in oil prices, the 2024 outlook for U.S. market activity generally remains below the 2023 average level, as many of our customers maintain strong capital discipline and natural gas industry, make the timing and pace of recovery difficult to predict.prioritize cash flow generation over growth.
Outside of North America, land markets, drilling activity is generally more stable as this drilling activity is based on longer-term economic projections and multi-year drilling programs, which typically reduces the impact of short-term changes in commodity prices on overall drilling activity. However, operationsOperations in several countries in the EMEA region experienced activity disruptions and project delays beginning in early 2020 and continuing through 2021, driven by government-imposed restrictions on movements of personnel, quarantines of staffing, and logistical limitations as a result of the COVID-19 pandemic. Revenues and profitability from ourDrilling activity within international Fluids Systems business havemarkets gradually recovered in 2021 with revenues forand 2022, though the fourth quarter 2021 approaching pre-COVID levels. Althoughcombination of increasing activity levels combined with the impacts of COVID-19global supply chain disruptions caused significant cost inflation to many hydrocarbon-based products and chemicals used in our fluids systems. While we worked with customers to mitigate the inflationary impact, in some cases, we were unable to adjust our customer pricing on certain international contracts due to the long-term contracts in place negatively impacting the profitability of our international operations has significantly declined in 2022 and into 2023. In recent months, we expect some level of operational disruption and project delays will continueyears, geopolitical events have caused several markets to impact internationalincrease drilling activity levels, to help ensure reliable energy supply in the near-term,coming years, while reducing their dependency on Russia-sourced oil and natural gas. Consequently, the outlook for several markets within the EMEA region remains strong, with growth in activity expected over the impact from the duration and magnitude of the pandemic and related government responses very difficult to predict.next few years.
Strategy
Our long-term strategy includes key foundational elements that are intended to enhance long-term shareholder value creation:
•End-market diversificationSimplify our business model and accelerate Industrial Solutions growth – To help reduce our dependency on customersWe have prioritized investment capital in the volatile E&P industry, improve the stability in cash flow generation and returns on invested capital, and provide growth opportunities into new markets, we have focused our efforts over the past several years on diversifying our presence outside of our historical E&P customer base. These efforts have been primarily focused within our Site and AccessIndustrial Solutions business, wherewhich has been our primary source of operating income and cash generation in recent years, the majority of which has been derived from the utilities and other industrial end-markets. In addition, we have prioritized growthdivested certain underperforming business units in power transmission, pipeline, renewable energy,2022 and construction markets. The continued expansion of revenues in industrial markets, and particularly end-markets that are likely to benefit from ongoing energy transition efforts around the world, such as power transmission, renewable energy, and geothermal, remains a strategic priority going forward, and we anticipate that our capital investments will primarily focus on supporting this objective.
•Provide products that enhance environmental sustainability – Our Company has a long history of providing environmentally-sensitive technologies to our customers. In the Industrial Solutions segment, we believe the lightweight design of our fully recyclable DURA-BASE® matting system provides a distinct environmental advantage for our customers as compared to alternative wood mat products in the market, by eliminating deforestation required to produce wood mat products while also reducing CO2 emissions associated with product transportation. In2023 within our Fluids Systems segment, our family of high-performance water-based fluids systems, whichand in September 2023, we market as Evolution® and DeepDrill® systems, are designed to enhance drilling performance while also providinglaunched a variety of environmental benefits relative to traditional oil-based fluids. More recently, ourformal sale process for substantially all the Fluids Systems segment has also developed the TerraThermdivision.
•TMDrive operational excellence through all aspects of our business water-based fluids system designed specifically for clean-energy geothermal drilling, as well as the TransitionTM family– As our business transforms, we are enhancing our focus on efficiency improvements and operating cost optimization across every aspect of brine-tolerant stimulation chemicals, which reduce the freshwater required for well stimulation applications. The continued advancement of technology that provides our customers with economic benefits, while also enhancing their environmentalglobal footprint. With our simplified business model and safety programs, remains a priority for our research and development efforts.
With ongoing support from outside financial and other advisors,enhanced focus on balance sheet optimization, we have continuously reviewed our portfolio during the oil and natural gas cycle of the last couple of years. These reviews have focused on evaluating changes in the outlook for our served markets and customer priorities, while identifying opportunities for value-creating options in our portfolio, as well as placing investment emphasis in markets where we generate strongseek to improve returns and where we see greater long-term viability and stability. While we have taken certain actionsconsistency in cash flow generation.
•Focus on value creation, balancing growth with return of capital to reduceshareholders – We are committed to a disciplined growth strategy, balancing our workforce and cost structure, ourinvestments in high-returning business contains high levelsactivities with the return of fixed costs, including significant facility and personnel expense. In February 2022, our management recommended and our Board of Directors approvedcapital through a plan to wind down our Industrial Blending operations and pursue the sale of the industrial blending and warehouse facility and related equipment, and our Board of Directors also approved management’s plan to explore strategic options for our U.S. mineral grinding business. We continue to evaluate other under-performing areas of our business, particularly within the U.S. and Gulf of Mexico oil and natural gas markets, which necessitates consideration of broader structural changes to transform this business for the new market realities. In the absence of a longer-term increase inshare repurchase program.
activity levels, we may incur future charges related to these efforts or potential asset impairments, which may negatively impact our future results.
Reportable SegmentsSegment Overview
Industrial Solutions
Our Industrial Solutions segment provides temporary worksite access solutions, including the rental of our manufactured recyclable composite matting systems, along with related site construction and services to customers in various markets including power transmission, E&P, pipeline, renewable energy, petrochemical, construction and other industries, primarily in the United States and Europe.United Kingdom (72% of 2023 segment revenues represented rental and service). We also manufacture and sell our recyclable DURA-BASE® Advanced Composite Matscomposite mats to customers around the world, with power transmission being the primary end-market.
We have also developed system enhancements, including the EPZ Grounding System™ for enhanced safety and efficiency for workers on power line maintenance and construction projects. We continue to make investments in matting and component innovation to deliver further differentiation and enhanced environmental benefits.
In addition, we began leveraging our capacity and technical expertise in chemical blending into industrial blending operations, and in response to the increasing market demand for cleaning products resulting from the COVID-19 pandemic, began producing disinfectants and industrial cleaning products in 2020. The scale-upend-market (28% of production was completed by the end of the third quarter of 2020, which effectively repositioned our chemical blending operation located in Conroe, Texas to support industrial end-markets. Beginning prospectively in the fourth quarter of 2020, the assets and operating results associated with these industrial blending operations are included in the Industrial Solutions2023 segment while the historical results from earlier in 2020, which were immaterial, are included in the Fluids Systems segment. As noted above, in February 2022, our management recommended and our Board of Directors approved a plan to wind down our Industrial Blending operations and pursue the sale of the industrial blending and warehouse facility and related equipment located in Conroe, Texas.revenues represented product sales).
Raw Materials — The resins, chemicals, and other materials used to manufacture our recyclable composite mats are widely available. Resin is the largest material component in the manufacturing of our recyclable composite mat products. We believe that our sources of supply for materials used in our business are adequate for our needs. We are not dependent upon any one supplier, and we have encountered no significant shortages or delays in obtaining any raw materials. In recent years, we have also expanded the use of alternative materials, including recycled materials in our manufacturing process, which we believe provides further protection against potential shortages of virgin raw materials. During 2023, our manufacturing operations consumed over 750,000 pounds of recycled resin.
Technology — We have obtained patents related to the design and manufacturing of our recyclable DURA-BASEDURA-BASE® mats and several of the components, as well as other products and systems related to these mats (including the connecting pins and the EPZ Grounding System™), although certain key patents have since expired.expired in 2020. Using proprietary technology and systems is an important aspect of our business strategy. In 2023, we launched our newest generation matting system, the DURA-BASE 800 seriesTM, which fully integrates into our DURABASE® format and offers a nearly 15% reduction in weight. We believe the lightweight design of our recyclable matting system provides a distinct environmental benefit for our customers as compared to alternative wood mat products in the market, by eliminating deforestation required to produce wood mat products and also reducing CO2 emissions associated with product transportation. While we continue to enhance the performance, environmental, and safety benefits of our products and add to our patent portfolio, we believe that our scale, andresponsiveness to customers, reputation in the industry the range of services we offer, ongoingwith respect to our technical development and know-how, responsiveness to customers, and understanding of regulatory requirements, and our ability to deliver superior worksite access solutions also have competitive significance in the markets we serve.
Competition — OurThe rental and services market is fragmented and competitive, with many competitors providing various forms of site preparationworksite access products and services. Wood mats and stone continue to be the primary solutions utilized for temporary worksite access across industries, though composite matting solutions continue to gain market share. The competitive landscape for composite mat sales component of our business is not asless fragmented as thethan rental and services, components with only a few competitors providing various alternatives to our DURA-BASEDURA-BASE® composite mat products, such asincluding Signature Systems Group and Spartan Mat. This is due to many factors, including large capital start-up costs and proprietary technology associated with these products. We believe that the principal competitive factors in our businesses include reputation, product capabilities, price, innovation through R&D, and reliability, and that our competitive position is enhanced by our proprietary products, manufacturing expertise, services, and experience.
Customers — Our customers are principally utility companies, infrastructure construction companies, and oil and natural gas E&P companies operating in the markets that we serve. Wood mats and stone continue to be the primary solutions utilized for temporary worksite access across industries, though composite matting solutions continue to gain market share. During 2021,2023, approximately 61%67% of our segment revenues were derived from theour 20 largest segment customers, of which our largestcustomers. No single customer representedaccounted for more than 10% of our segment revenues. The segment also generated 90%93% of its revenues domestically during 2021.2023. Typically, we perform services either under short-term contracts or rental service agreements. As most agreements with our customers are cancelablecancellable upon short notice, our backlog is not significant. We do not derive a significant portion of our revenues from government contracts.
Fluids Systems
Our Fluids Systems segment provides drilling completion, and stimulationcompletion fluids products and related technical services to customers for oil, natural gas, and geothermal projects primarily in North America (52% of 2023 segment revenues) and EMEA (44% of 2023 segment revenues), as well as certain countries in Asia Pacific and Latin America.Pacific. We offer customized solutions for complex subsurface conditions such as horizontal, directional, geologically deep, or drilling in deep water. These projects require high levels of monitoring and technical support of the fluids system during the drilling process.
We also have industrial mineral grinding operations Over the past few years, our primary focus within Fluids Systems has been the transformation into a more agile and simplified business focused on key markets, while monetizing assets in underperforming or sub-scale markets and reducing our invested capital, particularly in the U.S. (see Note 2 for barite, a critical raw material in drilling fluids systems, which serve to support our activities in certain regionsadditional information). As of December 31, 2023, the net working capital of the U.S. drilling fluids market. We grind barite and other industrial minerals at four facilities, including locations in Texas, Louisiana, and Tennessee, and use the resulting products in our drilling fluids systems and also sell the products to third party users, including other drilling fluids companies. In addition, we sellFluids Systems segment was $171 million, which reflects a variety of other minerals, principally to third-party industrial (non-oil and natural gas) markets. As noted above, in February 2022, our Board of Directors approved management’s plan to explore strategic options for our U.S. mineral grinding business.$69 million reduction from December 31, 2022.
Raw Materials — We believe that our sources of supply for materials and equipment used in our fluids business are adequate for our needs. Our specialtyIn connection with the sale of our U.S.-based mineral grinding business isin November 2022 (see Note 2), we entered into a four-year barite supply agreement for certain regions of our primary supplier of barite used in our North AmericanU.S. drilling fluids business. Our millsWe also obtain raw barite ore under supply agreements from foreign sources, primarily China and India. We obtain other materials used in the fluids business from various third-party suppliers. We have encountered noIn 2022, as a result of the global supply chain disruptions, including the effect of the ongoing conflict between Russia and Ukraine, we experienced shortages and significant cost increases associated with many of our raw materials, however, none of the product shortages or delays in obtaining these raw materials.materially impacted our operations.
Technology — Proprietary technology and systems are an important aspect of our business strategy.strategy, though we believe that our reputation in the industry, the range of services we offer, ongoing technical development and know-how, and responsiveness to customers, are of equal or greater competitive significance than our existing proprietary rights. We seek patents and licenses on new developments whenever we believe it creates a competitive advantage in the marketplace. We own patent rights in a family of high-performance water-based fluids systems, which we market as Evolution® and DeepDrill® systems, which are designed to enhance drilling performance while also providing a variety of environmental benefits relative to traditional oil-based fluids. In addition, we have developed the TerraThermTM water-based fluids system designed specifically for clean-energy geothermal drilling, as well as the TransitionTM family of brine-tolerant stimulation chemicals, which reduce the freshwater required for well stimulation applications.drilling. We also rely on a variety of unpatented proprietary technologies and know-how in many of our applications. We believe that our reputation in the industry, the range of services we offer, ongoing technical development and know-how, responsiveness to customers, and understanding of regulatory requirements are of equal or greater competitive significance than our existing proprietary rights.
Competition — WeGlobally, we face competition from larger companies, including Halliburton, Schlumberger,SLB, and Baker Hughes, which compete vigorously on fluids performance and/or price. In addition,Moreover, these companies have broad product and service offerings in addition to their fluids systems. We also haveWithin North America, the drilling fluids market is more fragmented, with many smaller regional competitors competing with us primarily on price and local relationships. We believe that the principal competitive factors in our businesses include a combination of technical proficiency, reputation, price, reliability, quality, breadth of services offered, and experience, and that our competitive position is enhanced by our best-in-class customer experience and value enhancing products and services.
Customers — Our customers are principally major integrated and independent oil and natural gas E&P companies operating in the markets that we serve. During 2021,2023, approximately 48%52% of segment revenues were derived from theour 20 largest segment customers. No singlecustomers, of which our largest customer accounted for more than 10%represented 11% of our segment revenues. The segment also generated 54%40% of its revenues domestically during 2021.2023. In North America, we primarily perform services either under short-term standard contracts or under “master” service agreements. Internationally, some customers issue multi-year contracts, but many are on a well-by-well or project basis. As most agreements with our customers can be terminated upon short notice, our backlog is not significant. We do not derive a significant portion of our revenues from government contracts.
Industrial Blending
Our Industrial Blending segment began operations in 2020 and supported industrial end-markets, including the production of disinfectants and industrial cleaning products. We completed the wind down of the Industrial Blending business in the first quarter of 2022 and the sale of the industrial blending assets in the fourth quarter of 2022 (see Note 2 for additional information).
Human Capital
We are committed to providing a diverse and inclusive environment for all employees and for those with whom we conduct business. We recognize our greatest assets are our people, and our long-term sustainability depends on our ability to attract, motivate, and retain the highly talented individuals that make up the Newpark team, while protecting each other like family and sustaining the environment in which we work. We appreciate our people and their achievements as we recognize they are integral to fully implementing our business strategy, which directly translates to improving our long-term profitability and increasing shareholder value.
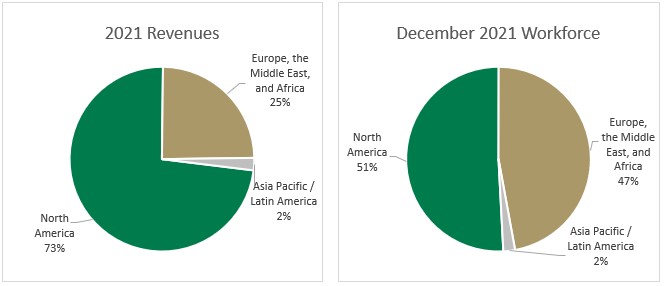
As a global company, the Newpark team supporting our customers spans more than 20 countries, and more than half of our employees reside outside of the United States. Our global footprint provides natural diversity within our organization and serves as a foundation to support an inclusive approach to everything that we do. At December 31, 2021,2023, we employed approximately 1,5651,550 full and part-time personnel, none of which are represented by labor unions. We consider our relations with our employees to be satisfactory and through various company-culture initiatives, strive to reinforce our commitment to our Core Values of safety, integrity, respect, excellence, and accountability. The following charts present the geographic composition of our revenues and workforce.
Governmental Regulations
Our business exposes us to regulatory risks associated with the various industries that we serve, including governmental regulations relating to the oil and natural gas industry in general, as well as environmental, health, and safety regulations that have specific application to our business. Our activities are impacted by various federal, state, local, and foreign laws, regulations, and policies related to pollution control, health, and safety programs that are administered and enforced by regulatory agencies.
We have implemented various procedures designed to ensure compliance with applicable regulations and reduce the risk of damage or loss. These include specified handling procedures and guidelines for waste, ongoing employee training, and monitoring, as well as maintaining insurance coverage. We also utilize a corporate-widecompany-wide health, safety, and environmental management systemsystems (“HSEMS”). The HSEMS is designed to capture information related to the planning, decision-making, and general operations of environmental regulatory activities within our operations. We also use the HSEMS to capture the information generated by regularly scheduled independent audits that are performed to validate the findings of our internal monitoring and auditing procedures.
ITEM 1A. Risk Factors
The following summarizes the most significant risks to our business. In addition to these risks, we are subject to a variety of risks that affect many other companies generally, as well as other risks and uncertainties that are not known to us as of the date of this Annual Report. Our success will depend, in part, on our ability to anticipate and effectively manage these and other risks. Any of these risk factors, either individually or in combination, could have a material adverse effect on our results of operations or financial condition, or prevent us from meeting our profitability or growth objectives. If you hold our securities or are considering an investment in our securities, you should carefully consider the following risks, together with the other information contained in this Annual Report.
Risks in this section are grouped in the following categories: (1) Business and Industry Risks; (2) Indebtedness Risks; (3) Legal and Regulatory Risks; (4) Financial Risks; and (5) General Risks. Many risks affect more than one category, and the risks are not in order of significance or probability of occurrence because they have been grouped by categories.
Business and Industry Risks
Risks Related to our Exploration of Strategic Alternatives for the COVID-19 PandemicLong-Term Positioning of our Fluids Systems Division
TheIn June 2023, we announced that we initiated a review of strategic alternatives for the long-term positioning of the Fluids Systems division in June 2023. In September 2023, we launched a formal sale process for substantially all the Fluids Systems business as part of this strategic review. While the sale process is ongoing, we anticipate substantially completing the process in mid-2024, although it is not certain that any such transaction will be consummated on that timeline or at all. We do not intend to disclose developments with respect to the progress of our evaluation of any strategic options until such time as our Board of Directors has approved a specific transaction or we otherwise deem disclosure is required or appropriate.
We may also incur significant costs and management’s attention may be diverted in connection with the pursuit of strategic alternatives which are not ultimately consummated. There are risks inherent with the consummation of any such transaction, such as the risks that the anticipated benefits of such transaction may not be realized, that unexpected liabilities may result from such transaction and that the process of consummating or the effects of consummating such a transaction may cause interruption of or slow down the COVID-19 pandemic,operations of our existing or continuing businesses.
Risks Related to Divestitures
Any divestitures made as part of the Fluids Systems sale process or otherwise could impact us in several ways, including actions taken by businesses(i) impacting relationships with our customers and governments, resulted invendors, (ii) restricting our operations due to certain specified terms of the agreements, and (iii) diminishing our ability to retain or attract employees due to concerns over future job security or responsibilities.
As a significantresult of any such divestitures, we may incur or experience (i) greater costs or realize fewer benefits than anticipated under the agreements, (ii) operational or commercial difficulties segregating the divested assets from our retained assets, (iii) disputes with the purchasers regarding the nature and swift reduction in U.S. and international economic activity. These effects adversely affectedsufficiency of the demand for and price of oil and natural gas, as well as the demand for our products and services. The collapse in the demand for oil caused by this unprecedented global health and economic crisis, coupled with oil oversupply, has had, and may continue to have, an adverse impact on our customers’ demand for the products andtransition services we provide which in turnor the terms and conditions of our commercial agreements with the purchasers, (iv) higher vendor costs due to reduced economies of scale or operational dis-synergies, or (v) losses or increased inefficiencies from stranded or underutilized assets. Any of these risks could have a material and adverse impacteffect on our business, financial condition, results of operations, and cash flows.
In responseaddition, any divestitures we make could reduce our future cash flows. If our remaining businesses fail to the reduced demand for our products and servicesperform as a resultexpected, such divestitures could exacerbate certain of the declineother risks specified in oil prices and the COVID-19 pandemic, we took a number of actions during 2020 and continuing into 2021 aimed at protecting our liquidity and reshaping the business for the new market realities, including reducing our workforce and cost structure. However, our business contains high levels of fixed costs, including significant facility and personnel expenses, which limits the effectiveness of such actions.
We continue to monitor the effects of COVID-19this Annual Report on commodity demands, our customers and suppliers activities, as well as our operations and employees. These effects have included, and may continue to include, adverse revenue and profitability effects, delays in planned customer projects, and disruptions to our operations and supply chain.
The extent to which our operating and financial results are affected by the continuing impacts of COVID-19 will depend on various factors beyond our control, such as the duration and scope of the pandemic, including any resurgences and the emergence and spread of COVID-19 variants; additional actions by businesses and governments in response to the pandemic; and the speed and effectiveness of responses to combat the virus, including the availability and public acceptance of effective treatments or vaccines, and how quickly and to what extent normal economic activity can resume, all of which are highly uncertain and cannot be predicted. COVID-19, and the volatile regional and global economic conditions stemming from the pandemic could also give rise to or aggravate other risk factors that we have identified below. Additionally, vaccine mandates that may be announced in jurisdictions in which our business operates could result in disruptions to our current and potential future workforce and may result in increased attrition, as well as increased costs in connection with retaining our workforce. COVID-19 could also materially and adversely impact our operating and financial results in a manner that is not currently known to us or that we do not currently consider as presenting material risks to our operations.Form 10-K.
Risks Related to the Worldwide Oil and Natural Gas Industry
Although we continue to diversify our operations and expand into a variety of end-markets, we derive a significant portion of our revenues from customers in the worldwide oil and natural gas industry; therefore, our risk factors include those factors that impact the demand for oil and natural gas. Spending by our customers for exploration, development, and production of oil and natural gas is based on a number of factors, including expectations of future hydrocarbon demand, energy prices, the risks associated with developing reserves, our customers’ ability to finance exploration and development of reserves, regulatory developments, and the future value of the reserves. Reductions in customer spending levels adversely affect the demand for our products and services, and consequently, our revenues and operating results. The key risk factors that we believe influence the worldwide oil and natural gas markets are discussed below.
Demand for oil and natural gas is subject to factors beyond our control
Demand for oil and natural gas, and consequently the demand for our products and services, is highly correlated with global economic growth and in particular by the economic growth of countries such as the U.S., India, China, and developing countries in Asia and the Middle East. Weakness in global economic activity, as well as the global energy transition, could
reduce demand for oil and natural gas and result in lower oil and natural gas prices. In addition,For example, demand for oil and natural gas has been and could continue to be impacted by, among other things, the effects of global health epidemicscrises, geopolitical issues, supply chain disruptions and concerns (such as the COVID-19 pandemic). Our customers in the oil and natural gas industry have been significantly and adversely impacted by the COVID-19
pandemic, which has adversely affected the demand for and price of oil and natural gas. The pace of demand recovery from the COVID-19 pandemic disruption is unknown, and there isinflation. There remains significant uncertainty regarding the long-term impact to global oil demand, which will ultimately depend on various factors and consequences beyond our control. Continued weakness or deterioration of the global economy could further reduce our customers’ spending levels and could reduce our revenues and operating results.
Regulatory agencies and environmental advocacy groups in the European Union, the U.S. and other regions or countries have been focusing considerable attention on the emissions of carbon dioxide, methane and other greenhouse gases and their role in climate change. There is also increased focus, including by governments and our customers, investors and other stakeholders, on these and other sustainability and energy transition matters. Existing or future legislation and regulations related to greenhouse gas emissions and climate change, as well as initiatives by governments, nongovernmental organizations, and companies to conserve energy or promote the use of alternative energy sources, and negative attitudes toward or perceptions of fossil fuel products and their relationship to the environment, may significantly curtail demand for and production of oil and gas in areas of the world where our customers operate, and thus reduce future demand for our products and services. This may, in turn, have a material adverse effect on our business, financial condition, results of operations, and cash flows.
Supply of oil and natural gas is subject to factors beyond our control
Supply of oil and natural gas can be affected by the availability of quality drilling prospects, exploration success, and the number and productivity of new wells drilled and completed, as well as the rate of production and resulting depletion of existing wells. Oil and natural gas storage inventory levels are indicators of the relative balance between supply and demand. In recent years, advancements in drilling and completion methods and technologies have contributed to a significant increase in oil production, particularly in the U.S. market. Supply can also be impacted by the degree to which individual Organization of Petroleum Exporting Countries (“OPEC”) nations and other large oil and natural gas producing countries are willing and able to control production and exports of hydrocarbons, to decrease or increase supply, and to support their targeted oil price or meet market share objectives. Any of these factors could affect the supply of oil and natural gas and could have a material effect on our results of operations.
Volatility of oil and natural gas prices can adversely affect demand for our products and services
Volatility of oil and natural gas prices can also impact our customers’ activity levels and spending for our products and services. The level of energy prices is important to the cash flow for our customers and their ability to fund exploration and development activities. Expectations about future commodity prices and price volatility are important for determining future spending levels. Our customers also take into accountconsider the volatility of energy prices and other risk factors by requiring higher returns for individual projects if there is higher perceived risk.
Our customers’ activity levels, spending for our products and services, and ability to pay amounts owed us could be impacted by the ability of our customers to access equity or credit markets
Our customers’ activity levels are dependent on their ability to access the funds necessary to develop oil and natural gas prospects and their ability to generate sufficient returns on investments. In recent years, limited access to external sources of funding, including the impacts of the global energy transition and pressures from their investors to generate consistent cash flow has, at times, caused customers in the oil and natural gas industry to reduce their capital spending plans. In addition, a reduction of cash flow to our customers resulting from declines in commodity prices or the lack of available debt or equity financing may impact the ability of our customers to pay amounts owed to us.
A heightened focus by our customers on cost-saving measures rather than the quality of products and services could reduce the demand for our products and services
Our customers are continually seeking to implement measures aimed at greater cost savings, which may include the acceptance of lesser quality products and services in order to improve short term cost efficiencies as opposed to total cost efficiencies. The continued implementation of these kinds of cost saving measures could reduce the demand or pricing for our products and services and have a material adverse effect on our business, financial condition, and results of operations.
Risks Related to Our Ability to Generate Internal Growth
Our ability to generate internal growth may be affected by, among other factors, our ability to:
•attract new customers;
•increase the number of projects performed for existing customers;
•successfully bid for new projects;
•hire and retain qualified personnel;
•obtain necessary levels of equipment; and
•adapt the range of products and services we offer to address our customers’ evolving needs.
In addition, our customers may reduce the number or size of projects available to us due to their inability to obtain capital or in response to economic conditions.
Furthermore, the growth of our Industrial Solutions segment is heavily dependent upon the production of our recyclable composite mat products, which in turn is dependent on the operations and capacity of our manufacturing facilities in Carencro, Louisiana.
Many of the factors affecting our ability to generate internal growth may be beyond our control, and we cannot be certain that our strategies will be successful or that we will be able to generate cash flow sufficient to fund our operations and to support internal growth. If we are unsuccessful, we may not be able to achieve internal growth, expand our operations or grow our business.
Risks Related to Economic and Market Conditions that May Impact Our Customers’ Future Spending
A substantial portion of our operating income, cash flows, and financial returns is generated from construction projects, the awarding of which we do not directly control. The construction industry historically has experienced cyclical fluctuations in financial results due to economic recessions, downturns in business cycles of our customers, material shortages, price increases by subcontractors, interest rate fluctuations and other economic factors beyond our control. When the general level of economic activity deteriorates, our customers may delay, or cancel upgrades, expansions, and/or maintenance and repairs to their systems. Many factors, including the financial condition of the industry, could adversely affect our customers and their willingness to fund capital expenditures in the future.
In addition, economic, regulatory and market conditions affecting our specific end markets may adversely impact the demand for our services, resulting in the delay, reduction or cancellation of certain projects and these conditions may continue to adversely affect us in the future.
Risks Related to Customer Concentration and Reliance on the U.S. E&P Market
In 2021,2023, approximately 39%42% of our consolidated revenues were derived from our 20 largest customers, although no customer accounted for more than 10% of our consolidated revenues. While we are not dependent on any one customer or group of customers, the loss of one or more of our significant customers could have an adverse effect on our results of operations and cash flows. In addition, approximately 65%55% of our consolidated revenues in 20212023 were derived from our U.S. operations, including approximately $250$270 million from the exploration and production market.
Over the past fiveseveral years, the North AmericaU.S. oil and natural gas market has experienced periods of significant declines which reduced the demand for our services and negatively impacted customer pricing in our North AmericanU.S. operations. Due in part to these changes, our quarterly and annual operating results have fluctuated significantly and may continue to fluctuate in future periods. Because our business has substantial fixed costs, including significant facility and personnel expenses, downtime or low productivity due to reduced demand could have a material adverse effect on our business, financial condition, and results of operations.
While our continued expansion intoWe have engaged in a varietynumber of non-E&P markets, as well as geographic diversification into select foreign E&P markets, isactivities intended over the long term to grow the business and reduce our dependency on the cyclical North AmericanU.S. oil and natural gas market, including the 2022 divestitures of the Excalibar U.S. mineral grinding business and Gulf of Mexico drilling fluids operations, the geographic diversification in select foreign E&P markets, and the review of strategic alternatives for Fluids Systems. However, these efforts may not be successful or sufficient to offset this volatility.any volatility in our U.S. operating results.
Risks Related to International Operations
We haveOur Fluids Systems business has significant operations outside of the U.S., including Canada and certain areas of Europe, the Middle East and Africa. In 2021,2023, our international operations generated approximately 35%45% of consolidated revenues. Substantially all of our cash balance at December 31, 20212023 resides within our international subsidiaries.subsidiaries, including Congo (31%), Romania (11%), and Algeria (10%). Algeria represented our largest international market outside of North America, with our Algerian operations representing 7%8% of our consolidated revenues for 20212023 and 6%8% of our total assets at December 31, 2021, including 13% of our total cash balance at December 31, 2021.2023.
In addition, we may seek to expand to other areas outside the U.S. in the future. International operations are subject to a number of risks and uncertainties which could negatively impact our results from operations, including:
▪difficulties and cost associated with complying with a wide variety of complex foreign laws, treaties, and regulations;
▪uncertainties in or unexpected changes in regulatory environments or tax laws, including with respect to climate change;
▪legal uncertainties, timing delays, and expenses associated with tariffs, export licenses, and other trade barriers;
▪difficulties enforcing agreements and collecting receivables through foreign legal systems;
▪risks associated with failing to comply with the U.S. Foreign Corrupt Practices Act, the U.K. Bribery Act, export laws, and other similar laws applicable to our operations in international markets;
▪exchange controls or other limitations on international currency movements, including restrictions on the repatriation of funds to the U.S. from certain countries;
▪sanctions imposed by the U.S. government that prevent us from engaging in business in certain countries or with certain counter-parties;
▪expropriation or nationalization of assets;
▪inability to obtain or preserve certain intellectual property rights in the foreign countries in which we operate;
▪our inexperience in certain international markets;
▪health emergencies or pandemics (such as the COVID-19 pandemic);pandemics;
▪fluctuations in foreign currency exchange rates;
▪political and economic instability; and
▪acts of terrorism.
In addition, several North African markets in which we operate, including Algeria, Tunisia, Egypt, Libya, and AlgeriaLibya have experienced social and political unrest in past years, which, when they occur, negatively impact our operating results and can include the temporary suspension of our operations.
Risks Related to the Ongoing Conflicts in Europe and the Middle East
Given the nature of our business and our global operations, the current conflicts in Europe and the Middle East may adversely affect our business and results of operations. Although we do not have any operations in Russia, Ukraine, the Gaza Strip or Israel, the broader consequences of these conflicts, which may include sanctions, embargoes, supply chain disruptions, regional instability, and geopolitical shifts, and the extent of the conflicts’ effect on our business and results of operations as well as the global economy, cannot be predicted.
The ongoing conflicts may also have the effect of heightening many of the other risks specified in our risk factors or disclosed in our public filings, any of which could materially and adversely affect our business and results of operations. Such risks include, but are not limited to, the volatility of oil and natural gas prices that can adversely affect demand for our products and services; our customers’ activity levels, spending for our products and services, and their ability to pay amounts owed us that could be impacted by the ability of our customers to access equity or credit markets; the price and availability of raw materials; the cost and continued availability of borrowed funds; and cybersecurity incidents or business system disruptions.
Risks Related to Operating Hazards Present in the Oil and Natural Gas Industryand Utilities Industries and Substantial Liability Claims, Including Catastrophic Well Incidents
We are exposed to significant health, safety, and environmental risks. Our operations are subject to hazards present in the oil and natural gas industry, such as fires, explosions, blowouts, oil spills, and leaks or spills of hazardous materials (both onshore and offshore), as well as hazards in the electrical utility industry, such as exposure to wildfires, high voltage electrocution, among other risks. These incidents as well as accidents or problems in normal operations can cause personal injury or death and damage to property or the environment. From time to time, customers seek recovery for damage to their equipment or property that occurred during the course of our service obligations. Damage to our customers’ property and any related spills of hazardous materials could be extensive if a major problem occurs.
Generally, we rely on contractual indemnities, releases, limitations on liability with our customers, and insurance to protect us from potential liability related to such events. However, our insurance and contractual indemnification may not be sufficient or effective to protect us under all circumstances or against all risks. In addition, our customers’ changing views on
risk allocation together with deteriorating market conditions could force us to accept greater risks to obtain new business or retain renewing business and could result in us losing business if we are not prepared to take such risks. Moreover, we may not be able to maintain insurance at levels of risk coverage or policy limits that we deem adequate. Any damages caused by our services or products that are not covered by insurance or contractual indemnification, or are in excess of policy limits or subject to substantial deductibles, could adversely affect our financial condition, results of operations, and cash flows. See “Risks Related to the Inherent Limitations of Insurance Coverage” below for additional information.
Risks Related to Contracts that Can Be Terminated or Downsized by Our Customers Without Penalty
Many of our fixed-term contracts contain provisions permitting early termination by the customer at their convenience, generally without penalty, and with limited notice requirements. In addition, many of our contracts permit our customers to decrease the products or services without penalty, which could result in a decrease in our revenues and
profitability. As a result, you should not place undue reliance on the strength of our customer contracts or the terms of those contracts.
Risks Related to Product Offering and Market Expansion
As a key component of our long-term strategy to diversify our revenue streams, generated from both operating segments, we seek to continue to expand our product and service offerings and enter new customer markets with our existing products. As with any market expansion effort, new customer and product markets require additional capital investment and include inherent uncertainties regarding customer expectations, industry-specific regulatory requirements, product performance, and customer-specific risk profiles. In addition, we likely will not have the same level of operational experience with respect to the new customer and product markets as will our competitors. As such, new market entry is subject to a number of risks and uncertainties, which could have an adverse effect on our business, financial condition, or results of operations.
Risks Related to Our Ability to Attract, Retain, and Develop Qualified Leaders, Key Employees, and Skilled Personnel
Our failure to attract, retain, and develop qualified leaders and key employees at our corporate, divisional, or regional headquarters could have a material adverse effect on our business. In addition, all of ourOur businesses are highly dependent on our ability to attract and retain highly-skilled product specialists, technical sales personnel, and service personnel. The market for qualified employees is extremely competitive. If we cannot attract and retain qualified personnel, our ability to compete effectively and grow our business will be severely limited. Also, a significant increase in wages paid by competing employers could result in a reduction in our skilled labor force or an increase in our operating costs.
We have experienced, and expect to continue to experience, a shortage of labor for certain functions, including due to concerns around COVID-19 and other factors, which has increased our labor costs and negatively impacted our profitability. The extent and duration of the effect of these labor market challenges are subject to numerous factors, including the continuing effect of the COVID-19 pandemic, vaccine mandates that may be announced in jurisdictions in which our businesses operate, availability of qualified persons in the markets where we and our contracted service providers operate and unemployment levels within these markets, behavioral changes, prevailing wage rates and other benefits, inflation, adoption of new or revised employment and labor laws and regulations (including increased minimum wage requirements) or government programs, safety levels of our operations, and our reputation within the labor market.
Risks Related to Expanding Our Services in the Utilities Sector, Which May Require Unionized Labor
Although none of our employees are currently represented by labor unions, we may expand our services offered in the utilities sector, the customers of which may require unionized labor. If we, a subsidiary, or a business partner were to have a unionized workforce, we may be subject to strikes or work stoppages, wage and hour regulations, or other regulations associated with a collective bargaining agreement, which could adversely impact our relationships with our customers and cause us to lose business, and could result in an increase in our operating costs.
Risks Related to the Price and Availability of Raw Materials
Our ability to provide products and services to our customers is dependent upon our ability to obtain raw materials necessary to operate our business. Certain of the raw materials essential to our business are sourced globally and require various freight services to transport the materials to our jobsites.job sites. These services may be impacted by currentperiodic supply chain disruptions and, particularly during times of high demand, may cause delays in the arrival of or otherwise constrain our supply of raw materials. These constraints could have a material adverse effect on our business and consolidated results of operations. In addition, price increases, whether as a result of inflation, geopolitical issues, or otherwise, imposed by our vendors for raw materials used in our business and the inability to pass these increases through to our customers could have a material adverse effect on our business and results of operations.
Our Industrial Solutions business is highly dependent on the availability of high-density polyethylene (“HDPE”), which is the primary raw material used in the manufacture of our recyclable composite mats. The cost of HDPE increased significantly in 2021, but returned to more historical levels in 2022 and our2023. Our costs can vary based on the energy costs of the producers of HDPE, demand for this material, and the capacity or operations of the plants used to make HDPE. We may not be able to increase our customer pricing to cover the cost increases that we have experienced, which could result in a reduction in future profitability.
In addition, ourOur Fluids Systems business is highly dependent on the availability of barite, which is a naturally occurring mineral that constitutes a significant portion of our fluids systems. We currently secureIn connection with the majoritysale of our U.S.-based mineral grinding business in the fourth quarter of 2022, we entered a four-year barite oresupply agreement for certain regions of our U.S. drilling fluids business. We also obtain barite and other materials used in the fluids business from foreign sources, primarily China and India.various third-party suppliers. The availability and cost of barite ore is dependent on factors beyond our
control, including transportation, political priorities, U.S. tariffs, and government-imposed export fees in the exporting countries, as well as the impact of weather and natural disasters.
The future supply of barite ore from existing sources may be inadequate to meet the market demand, particularly during periods of increasing world-wide demand, which could ultimately restrict industry activity or our ability to meet our customers’ needs.
Risks Related to Inflation
Increases in the cost of wages, materials, equipment and other operational components has the potential to adversely affect our results of operations, cash flows and financial position by increasing our overall cost structure, particularly if we are unable to achieve commensurate increases in the prices we charge our customers for our products and services. In addition, inflation has also resulted in higher interest rates, which could cause an increase in the cost of debt borrowing in the future, as well as supply chain shortages, an increase in the costs of labor, currency fluctuations and other similar effects.
Risks Related to Capital Investments and Business Acquisitions and Capital Investments
Our ability to successfully execute our business strategy will depend, among other things, on our ability to make capital investments and complete acquisitions which provide us with financial benefits. These acquisitionsinvestments and investmentsacquisitions are subject to a number of risks and uncertainties, including:
▪incorrect assumptions regarding business activity levels or results from our capital investments, acquired operations, or assets;
▪insufficient revenues to offset liabilities assumed;
▪potential loss of significant revenue and income streams;
▪increased or unexpected expenses;
▪inadequate return of capital;
▪regulatory or compliance issues;
▪potential loss of key employees, customers, or suppliers of the acquired company;
▪the triggering of certain covenants in our debt agreements (including accelerated repayment);
▪unidentified issues not discovered in due diligence;
▪failure to complete a planned acquisition transaction or to successfully integrate the operations or management of any acquired businesses or assets in a timely manner;
▪diversion of management’s attention from existing operations or other priorities;
▪unanticipated disruptions to our business associated with the implementation of our enterprise-wide operational and financial system; and
▪delays in completion and cost overruns associated with large capital investments.
Any of the factors above could have an adverse effect on our business, financial condition, or results of operations. Additionally, the anticipated benefits of a capital investment or acquisition may not be realized fully or at all, or may take longer to realize than expected.
Risks Related to Market Competition
We face competition and compete vigorously on product performance and/or price. Our competition in the North America Fluids Systems business fromand U.S. Industrial Solutions business is fragmented. The smaller regional competitors compete with us mainly on price and local relationships. Our competition in the international Fluids Systems business includes larger companies, includingsuch as Halliburton, Schlumberger,SLB, and Baker Hughes, which compete vigorously on fluids performance and/or price. In addition, theseHughes. These larger companies have broad product and service offerings in addition to their drilling and completion fluids. Atfluids, and at times, these larger companies attempt to compete by offering discounts to customers to use multiple products and services, some of which we do not offer. We also have smaller regional competitors competing with us mainly on price and local relationships.
Our competition inIn the Industrial Solutions business, is fragmented, with many competitors providingprovide various forms of worksite access products and services. More recently, several competitors have begun marketing composite products to compete with our DURA-BASEDURA-BASE® matting system. While we believe the design and manufacturing quality of our products provide a differentiated value to our customers, many of our competitors seek to compete on pricing. In addition, certain patents related to our DURA-BASEDURA-BASE® matting system have expired, and competitors may begin offering mats that include features described in those patents. We have filed additional patent applications on improvements to the structure of, features of, and uses of the DURA-BASEDURA-BASE® matting system, but there is no assurance that our competitors will not be able to offer products that are similar to these improvements, features, or uses of the DURA-BASEDURA-BASE® matting system.
In addition, certain customer contracts are awarded through a competitive bidding process. The strong competition in our markets requires maintaining skilled personnel and investing in technology, and also puts pressure on profit margins. We do not obtain contracts from all of our bids and our inability to win bids at acceptable profit margins would adversely affect our business and results of operations.
Risks Related to Technological Developments and Intellectual Property in Our Industry
The market for our products and services is characterized by continualrequires technological developments that generate substantial improvements in product performance or service delivery. If we are not successful in continuing to develop new products, enhancements, or improved service delivery that are accepted in the marketplace or that comply with industry standards, we could lose market share to competitors, which could have a material adverse effect on our results of operations and financial condition.
Our success can be affected by our development and implementation of new product designs and improvements, or software developments, and by our ability to protect and maintain critical intellectual property assets related to these developments. Although in many cases our products are not protected by any registered intellectual property rights, in other cases we rely on a combination of patents and trade secret laws to establish and protect this proprietary technology. While
patent rights give the owner of a patent the right to exclude third parties from making, using, selling, and offering for sale the inventions claimed in the patents, they do not necessarily grant the owner of a patent the right to practice the invention claimed in a patent. It may also be possible for a third party to design around our patents. We do not have patents in every country in which we conduct business and our patent portfolio will not protect all aspects of our business. When patent rights expire, competitors are generally free to offer the technology and products that were covered by the patents. Additionally, the trade secret laws of some foreign countries may not protect our proprietary technology in the same manner as the laws of the United States.
We also protect our trade secrets by customarily entering into confidentiality and/or license agreements with our employees, customers and potential customers, and suppliers. Our rights in our confidential information, trade secrets, and confidential know-how will not prevent third parties from independently developing similar information. Publicly available information (such as information in expired patents, published patent applications, and scientific literature) can also be used by third parties to independently develop technology. We cannot provide assurance that this independently developed technology will not be equivalent or superior to our proprietary technology.
We may from time to time engage in expensive and time-consuming litigation to determine the enforceability, scope, and validity of our patent rights. In addition, we can seek to enforce our rights in trade secrets, or “know-how,” and other proprietary information and technology in the conduct of our business. However, it is possible that our competitors may infringe upon, misappropriate, violate or challenge the validity or enforceability of our intellectual property, and we may not be able to adequately protect or enforce our intellectual property rights in the future.
The tools, techniques, methodologies, programs, and components we use to provide our services may infringe upon the intellectual property rights of others. Infringement claims generally result in significant legal and other costs, and may distract management from running our business. Royalty payments under licenses from third parties, if applicable, could increase our costs. Additionally, developing non-infringing technologies could increase our costs. If a license were not available, we might not be able to continue providing a particular service or product, which could adversely affect our financial condition, results of operations and cash flows.
Risks Related to Severe Weather, Natural Disasters, and Seasonality
We have significant operations located in market areas around the world that are negatively impacted by severe adverse weather events or natural disasters, such as hurricanes in the U.S. Gulf of Mexico, fires and typhoons in Australia, droughts across the U.S. and excessive rains outside ofparticularly the U.S. A potential result of climate change is more frequent or more severe weather events or natural disasters. To the extent such weather events or natural disasters become more frequent or severe, disruptions to our business and costs to repair damaged facilities could increase. For example,
These severe weather events or natural disasters, such as excessive rains, hurricanes, fires, or droughts, could disrupt our operations and result in August 2021, Hurricane Ida caused damage to our properties, including the manufacturing facilities and technology center for our Industrial Solutions business located in Carencro, Louisiana, or our leased fluids industrial space in Fourchon, Louisiana Fluids Systems operating base. While this event is covered by our property and business interruption insurance programs, these programs contain self-insured retentions, which remain our financial obligations, resulting in $2.6 million of charges for 2021.Louisiana. Additionally, there are market areas around the world in which our operations are subject to seasonality such as Canada where the Spring “break-up” (an industry term used to describe the time of year when the frost comes out of the ground causing the earth to become soft and muddy and strict weight restrictions are implemented by the government to prevent potholes forming on roads) results in a significant slowdown in the oil and natural gas industry and our fluids business each year. Such adverseyear, or in the summer in the U.S., where utility companies typically reduce maintenance project activity on the transmission grid due to elevated consumer electricity demand.
Severe weather, eventsnatural disasters, and seasonality can disruptcould adversely affect our or our customers’ financial condition, results of operations and cash flows.
Risks Related to Public Health Crises, Epidemics, and Pandemics
The effects of public health crises, epidemics, and pandemics have resulted and may in the future result in damage to our properties,a significant and swift reduction in U.S. and international economic activity, including adversely affecting the demand for and price of oil and natural gas, as well as negatively impact the activitydemand for our products and services. In response to reduced demand for our
products and services, we would take (and have in the past taken) actions aimed at protecting our liquidity and reshaping the business for the new market realities, including reducing our workforce and cost structure. However, our business contains high levels of fixed costs, including significant facility and personnel expenses, which limits the effectiveness of such actions. The extent to which our operating and financial conditionresults are affected by a public health crisis, epidemic or pandemic will depend on various factors beyond our control, such as the duration and scope of such event, including any resurgences and the emergence and spread of a subject pathogen; actions taken by businesses and governments in response to such event; and the speed and effectiveness of responses to combat the subject pathogen, including the availability and public acceptance of effective treatments or vaccines, and how quickly and to what extent normal economic activity can resume, all of which are highly uncertain and cannot be predicted. Any such public health crisis, epidemic or pandemic could also materially and adversely impact our customers.operating and financial results in a manner that is not currently known to us or that we do not currently consider as presenting material risks to our operations.
Indebtedness Risks
Risks Related to the Cost and Continued Availability of Borrowed Funds, including Risks of Noncompliance with Debt Covenants
We use borrowed funds as an integral part of our long-term capital structure and our future success is dependent upon continued access to borrowed funds to support our operations. The availability of borrowed funds on reasonable terms is dependent on the condition of credit markets and financial institutions from which these funds are obtained. Adverse events in the financial markets, or restrictions on lenders ability or willingness to lend to companies that have significant exposure to customers in the oil and natural gas industry, may significantly reduce the availability of funds, which may have an adverse effect on our cost of borrowings and our ability to fund our business strategy. Our ability to meet our debt service requirements and the continued availability of funds under our existing or future loan agreements is dependent upon our ability to generate operating income and generate sufficient cash flow to remain in compliance with the covenants in our debt agreements. This, in turn, is subject to the volatile nature of the oil and natural gas industry, and to competitive, economic, financial, and other factors that are beyond our control.
We primarily fund our ongoing operational needs through a $200$175 million asset-based revolving credit agreement (as amended, the “ABL(the “Amended ABL Facility”). The Amended ABL Facility terminates in March 2024.May 2027. Borrowing availability under the Amended ABL Facility is
calculated based on eligible U.S. accounts receivable, inventory and subject to satisfaction of certain financial covenants as described below, composite mats included in the rental fleet, net of reserves and subject to limits on suchcertain of the assets included in the borrowing base calculation. To the extent pledged by us,the borrowers, the borrowing base calculation also includes the amount of eligible pledged cash. The lenderadministrative agent may establish such reserves in accordance with the Amended ABL Facility, in part based on appraisals of the asset base, and other limits atin its discretion, which could reduce the amounts otherwise available under the Amended ABL Facility. Availability associated with eligible rental mats will also be subject to maintaining a minimum consolidated fixed charge coverage ratio of 1.5 to 1.0 and at least $1.0 million of operating income for the Site and Access Solutions business, each calculated based on a trailing twelve-month period.
The Amended ABL Facility is a senior secured obligation of the Company and certain of our U.S. subsidiaries constituting borrowers thereunder, secured by a first lienspriority lien on substantially all of our U.S. tangiblethe personal property and intangible assets, and a portioncertain real property of the capital stockborrowers, including a first priority lien on certain equity interests of our non-U.S.direct or indirect domestic subsidiaries has also been pledged as collateral.of the borrowers and certain equity interests issued by certain foreign subsidiaries of the borrowers. The Amended ABL Facility contains certain financial covenants, customary operatingrepresentations, warranties and covenants and certain restrictions including,that, among other things, those relatingand subject to certain specified circumstances and exceptions, restrict or limit the incurrenceability of additional debt,the borrowers and certain of their subsidiaries to incur indebtedness (including guarantees), grant liens, make investments, pay dividends asset sales, investments, mergers, acquisitions, affiliate transactions,or distributions with respect to capital stock repurchases and make other restricted payments. The ABL Facility also requires a minimum consolidated fixed charge coverage ratio of 1.0 to 1.0 calculated basedpayments, make prepayments on a trailing twelve-month period if availability under the ABL Facility falls below $22.5 million. In addition, the ABL Facility contains customary events of default, including, without limitation, a failure to make payments under the facility, acceleration of more than $25.0 million of othercertain indebtedness, certain bankruptcy events, and certain change of control events.
If we are unable to make required payments under the ABL Facilityengage in mergers or other indebtednessfundamental changes, dispose of more than $25.0 million, or ifproperty, and change the nature of their business.
If we fail to comply with the various covenants and other requirements of the Amended ABL Facility, we would be in default thereunder, which would permit the holders of the indebtedness to accelerate the maturity thereof and proceed against their collateral. The acceleration of any of our indebtedness and the election to exercise any remedies could have a material adverse effect on our business and financial condition and we may not be able to make all of the required payments or borrow sufficient funds to refinance such indebtedness.
If we are unable to generate sufficient cash flows to repay our indebtedness when due or to fund our other liquidity needs, we may be required to adopt one or more alternatives, such as selling assets, restructuring debt or obtaining additional financing. Our ability to refinance our indebtedness will depend on the capital markets and our financial condition at such time. We may not be able to engage in any of these activities or engage in these activities on desirable terms, which could result in a default on our debt obligations and could have a material adverse effect on our business and financial condition.
Legal and Regulatory Risks
Risks Related to Environmental Laws and Regulations
We are responsible for complying with numerous federal, state, local, and foreign laws, regulations and policies that govern environmental protection, zoning and other matters applicable to our current and past business activities, including the activities of our former subsidiaries. Failure to remain compliant with these laws, regulations and policies may result in, among other things, fines, penalties, costs, investigation and/or cleanup of contaminated sites and site closure obligations, costs of remedying noncompliance, termination or suspension of certain operations, or other expenditures. We could be exposed to strict, joint and several liability for cleanup costs, natural resource damages and other damages as a result of our conduct that was lawful at the time it occurred or the conduct of, or conditions caused by, prior operators or other third parties. Private parties may also pursue legal actions against us based on alleged non-compliance with or liability under certain of these laws, rules and regulations. Further, any changes in the current legal and regulatory environment could impact industry activity and the demands for our products and services, the scope of products and services that we provide, or our cost structure required to provide our products and services, or the costs incurred by our customers.
Many of the markets for our products and services are dependent on the continued exploration for and production of fossil fuels (predominantly oil and natural gas). In recent years, the topic of climate change has received increased attention worldwide. Many scientists, legislators and others attribute climate change to increased levels of greenhouse gases, including carbon dioxide attributed to the use of fossil fuels, which has led to significant legislative and regulatory efforts to limit greenhouse gas emissions. The Environmental Protection Agency (the “EPA”) and other domestic and foreign regulatory agencies have adopted regulations that potentially limit greenhouse gas emissions and impose reporting obligations on large greenhouse gas emission sources. In addition, the EPA has adopted rules that could require the reduction of certain air emissions during exploration and production of oil and natural gas. President Biden’s administration officially reentered the U.S. into the Paris Agreement in February 2021 and committed the U.S. to reducing its greenhouse gas emissions by 50-52% from 2005 levels by 2030. In November 2021, the U.S. and other countries entered into the Glasgow Climate Pact, which includes a range of measures designed to address climate change, including but not limited to the phase-out of fossil fuel subsidies, reducing methane emissions 30% by 2030, and cooperating toward the advancement of the development of clean energy. In August 2022, President Biden also signed into law the Inflation Reduction Act, which contains tax inducements and other provisions that incentivize investment, development, and deployment of alternative energy sources and technologies and created a methane emissions reduction program, which provided significant funding to reduce emissions of methane from the oil and gas sector and requires the EPA to impose a charge on certain oil and gas sources. The implementation of the Inflation Reduction Act could increase operating costs within the oil and gas industry and accelerate the transition away from fossil fuels. To the extent that laws and regulations enacted as part of climate change legislation increase the costs of drilling for or producing such fossil fuels, limit or restrict oil and natural gas exploration and production, or reduce the demand for fossil fuels, such legislation could have a material adverse effect on our operations and profitability. In addition, there
The continued expansion of revenues in industrial markets, and particularly end-markets that are likely to benefit from ongoing energy transition efforts around the world, such as power transmission, renewable energy, and geothermal, remains a strategic priority going forward, and we anticipate that our capital investments will primarily focus on supporting this objective. However, it is unclear whether these initiatives, when implemented, will create sufficient incentives for projects or result in increased demand for our services.
There have also been
efforts in recent years to influence the investment community, including investment advisors and certain sovereign wealth, pension and endowment funds, promoting divestment of fossil fuel equities and pressuring lenders to limit funding to companies engaged in the extraction of fossil fuel reserves. Such environmental activism and initiatives aimed at limiting climate change and reducing air pollution could interfere with our business activities, operations, and ability to access capital. Furthermore, members of the investment community are increasing their focus on Environmental, Social, and Governance (“ESG”) practices and disclosures by public companies. Concerns over climate change have resulted in, and are expected to continue to result in, the adoption of regulatory requirements for climate-related disclosures, which could increase our compliance burden and costs. As a result, we may continue to face increasing pressure regarding our ESG disclosures and practices. We have published and may continue to publish a Sustainability Report, which outlines our progress and ongoing efforts to advance our ESG initiatives. Our disclosures on these matters rely on management’s expectations as of the date the statements are first made, as well as standards for measuring progress that are still in development, and may change or fail to be realized. These expectations and standards may continue to evolve. If our ESG disclosures and practices do not meet regulatory, investor or other stakeholder expectations and standards, which continue to evolve, it could have a material adverse effect on our business or demand for our services.
HydraulicIn addition, hydraulic fracturing is a common practice used by E&P operators to stimulate production of hydrocarbons, particularly from shale oil and natural gas formations in the U.S. The process of hydraulic fracturing, which involves the injection of sand (or other forms of proppants) laden fluids into oil and natural gas bearing zones, has come under
increased scrutiny from a variety of regulatory agencies, including the EPA and various state authorities. Several states have adopted regulations requiring operators to identify the chemicals used in fracturing operations, others have adopted moratoriums on the use of fracturing, and the State of New York has banned the practice altogether. In addition, concerns have been raised about whether injection of waste associated with hydraulic fracturing operations, or from the fracturing operations themselves, may cause or increase the impact of earthquakes. Although we do not provide hydraulic fracturing services, we offerhave offered stimulation chemicals used in the hydraulic fracturing process. Regulations which have the effect of prohibiting, limiting the use, or significantly increasing the costs of hydraulic fracturing could have a material adverse effect on both the drilling and stimulation activity levels of our customers, and, therefore, the demand for our products and services.
Risks Related to Legal Compliance
As a global business, we are subject to complex laws and regulations in the U.S., the U.K. and other countries in which we operate. These laws and regulations relate to a number of aspects of our business, including anti-bribery and anti-corruption laws, sanctions against business dealings with certain countries and third parties, the payment of taxes, employment and labor relations, immigration, fair competition, data privacy protections, securities regulation, and other regulatory requirements affecting trade and investment. The application of these laws and regulations to our business is often unclear and may sometimes conflict. Compliance with these laws and regulations may involve significant costs or require changes in our business practices that could result in reduced revenue and profitability. Non-compliance could also result in significant fines, damages, and other criminal sanctions against us, our officers or our employees, prohibitions or additional requirements on the conduct of our business and damage our reputation. Certain violations of law could also result in suspension or debarment from government contracts. We also incur additional legal compliance costs associated with global regulations. In some foreign countries, particularly those with developing economies, it may be customary for others to engage in business practices that are prohibited by laws such as the U.S. Foreign Corrupt Practices Act, the U.K. Bribery Act, the Italian Criminal Code in Italy, Brazil’s Clean Companies Act, India’s Prevention of Corruption Act and The Companies Act, and Mexico’s Anti-Corruption Law. Although we implement policies and procedures designed to ensure compliance with these laws, there can be no assurance that all of our employees, contractors, agents, and business partners will not take action in violation with our internal policies. In the U.S., there have been increasing instances of opioid and other illicit drug usage as well as illegal immigration in certain of the regions in which we operate. While we have taken steps we believe appropriate to ensure that our employees comply with our internal drug and alcohol policy as well as all applicable immigration laws, we cannot assure you there will not be violations in the future. Any such violation of our internal policies or the law could have a material adverse effect on our reputation, business, financial condition, or results of operations.
Financial Risks
Risks Related to the Inherent Limitations of Insurance Coverage
While we maintain liability insurance, this insurance is subject to coverage limitations. Specific risks and limitations of our insurance coverage include the following:
▪self-insured retention limits on each claim, which are our responsibility;
▪exclusions for certain types of liabilities and limitations on coverage for damages resulting from pollution;
▪coverage limits of the policies, and the risk that claims will exceed policy limits; and
▪the financial strength and ability of our insurance carriers to meet their obligations under the policies.
In addition, our ability to continue to obtain insurance coverage on commercially reasonable terms is dependent upon a variety of factors impacting the insurance industry in general, which are outside our control. Any of the issues noted above, including insurance cost increases, uninsured or underinsured claims, or the inability of an insurance carrier to meet their financial obligations could have a material adverse effect on our business.
Risks Related to Income Taxes
Our future effective tax rates could be adversely affected by changes in tax laws, both domestically and internationally, or the interpretation or application thereof. From time to time, U.S. and foreign tax authorities, including state and local governments, consider legislation that could increase our effective tax rate. For example, effective for costs paid or incurred in tax years beginning after December 31, 2021, the 2017 U.S. Tax Cuts and Jobs Act enacted legislation that requires certain research and development expenditures to be capitalized and amortized over five years, rather than being deducted as incurred. While the Ways and Means Committee of the U.S. Congress has advancedHouse of Representatives recently passed a varietybill that, if enacted, would allow for the continued immediate deduction of research and development expenditures incurred in tax years beginning after December 31, 2021, and before January 1, 2026, there can be no assurance that this proposed legislation proposals, and while the final form of any legislation is uncertain, the current proposals, if
enacted, could have a material effect on the Company’s effective tax rate.will be enacted. Additionally, longstanding international tax norms that determine each country’s jurisdiction to tax cross-border international trade are subject to potential evolution. For example, the Organization for Economic Co-operation and Development (“OECD”), a global coalition of member countries, proposed a two-pillar plan to reform international taxation. The proposals
aim to ensure a fairer distribution of profits among countries and to impose a floor on tax competition through the introduction of a global minimum tax. WeWhile the European Union agreed in December 2022 to implement the global minimum tax on larger companies in 2024, and other countries are actively considering changes to their tax laws to adopt certain parts of the OECD’s proposals, we cannot determine whether, or in what form, such legislation will be implemented or ultimately be enacted or what the impact of any such legislation could have on our profitability. If such changes to tax laws are enacted, our profitability could be negatively impacted.
Our future effective tax rates could also be adversely affected by changes in the valuation of our deferred tax assets and liabilities, changes in the mix of earnings in countries with differing statutory tax rates, or by changes in tax treaties, regulations, accounting principles or interpretations thereof in one or more countries in which we operate. In addition, we are subject to the potential examination of our income tax returns by the U.S. Internal Revenue Service and by other tax authorities in jurisdictions where we file tax returns. We regularly assess the likelihood of adverse outcomes resulting from these examinations to determine the adequacy of our provision for income taxes. There can be no assurance that such examinations will not have a material adverse effect on our business, financial condition, or results of operations.
General Risks
Risks Related to Cybersecurity BreachesIncidents or Business System Disruptions
We utilize various management information systems and information technology infrastructure to manage or support a variety of our business operations, and to maintain various records, which may include confidential business or proprietary information as well as information regarding our customers, business partners, employees or other third parties. We also utilize third-party vendors and their systems and technology to support our business activities, including secure processing of confidential, sensitive, proprietary and other types of information. Failures of or interference with access to these systems, such as communication disruptions, could have an adverse effect on our ability to conduct operations or directly impact consolidated financial reporting. In addition, our information systems and information technology infrastructure are subject to security threats and sophisticated cyber-based attacks, including, but not limited to, denial-of-service attacks, hacking, “phishing” attacks, computer viruses, ransomware, malware, employee or insider error, malfeasance, social engineering, or physical breaches, that can cause deliberate or unintentional damage, destruction or misuse, manipulation, denial of access to or disclosure of confidential or important information or intellectual property. A failure of or breach in our information systems and information technology infrastructure, or those of our third-party vendors, could expose us and our employees, customers, and suppliers to risks of misuse of information or systems, transaction errors, the compromise of confidential information, manipulation and destruction of data, the loss of sales and customers and operations disruptions. There can be no assurance that security incidents will not occur. In addition, there can be no assurance that the policies and procedures we or these third partiesour third-party vendors have in place, including system monitoring and data back-up processes, to prevent or mitigate the effects of these potential disruptions or breachesincidents will be sufficient to prevent, detect and limit the impact of disruptions or breaches.incidents. We do not carry insurance against these risks, although we do invest in security technology, perform penetration tests from time to time, and design our business processes to attempt to mitigate the risk of such breaches. However, there can be no assurance that security breaches will not occur.
Additionally, the development and maintenance of these measures requiresincidents. Our processes require continuous monitoring as technologies change and efforts to overcome security measures evolve.
We have experienced cybersecurity threats and incidents involving our systems and third-party systems and expect these incidents to continue. While none of the cybersecurity events have been material to date, a successful breach or attack could have a material negative impact on our operations or business reputation, harm our reputation and relationships with our customers, business partners, employees or other third parties, and subject us to consequences such as litigation and direct costs associated with incident response. In addition, theseThese risks could have a material adverse effect on our business, results of operations, and financial condition.
Risks Related to Restructuring Activities
With ongoing support from outside financial and other advisors, we have continuously reviewed our portfolio during the oil and natural gas cycle of the last couple of years. These reviews have focused on evaluating changes in the outlook for our served markets and customer priorities, while identifying opportunities for value-creating options in our portfolio, as well as placing investment emphasis in markets where we generate strong returns and where we see greater long-term viability and stability. While we have taken certain actions to reduce our workforce and cost structure, our business contains high levels of fixed costs, including significant facility and personnel expense. In February 2022, our management recommended and our Board of Directors approved a plan to wind down our Industrial Blending operations and pursue the sale of the industrial blending and warehouse facility and related equipment, and our Board of Directors also approved management’s plan to explore strategic options for our U.S. mineral grinding business. We continue to evaluate other under-performing areas of our business, particularly within the U.S. and Gulf of Mexico oil and natural gas markets, which necessitates consideration of broader structural changes to transform this business for the new market realities. There is no assurance that our restructuring plans will be successful and achieve the expected results. In addition, we may incur future charges related to these efforts or
potential asset impairments, which may have a material adverse effect on our business, financial condition, results of operations, and cash flows.
Risks Related to Activist Stockholders that May Attempt to Effect Changes at Our Company or Acquire Control Over Our Company
We have been the subject of campaigns by activist stockholders and may continue to be so in the future. Such activist stockholders may engage in proxy solicitations, advance stockholder proposals, or otherwise attempt to affect changes or acquire control over our company. Campaigns by stockholders to effect changes at publicly traded companies are sometimes led by investors seeking to increase short-term stockholder value through actions such as financial restructuring, increased debt, special dividends, stock repurchases or sales of assets or the entire company. Responding to proxy contests and other actions by activist stockholders can be costly and time-consuming and could divert the attention of our Board of Directors and senior management from the management of our operations and the pursuit of our business strategies. As a result, stockholder campaigns could adversely affect our results of operations and financial condition.
Risks Related to Compliance with the New York Stock Exchange’s Requirements for the Continued ListingShare Repurchases
The amount and timing of Our Common Stock
We are listed on the New York Stock Exchange (the “NYSE”) and are required to meet the NYSE’s continued listing standards, including a requirement that the average closing priceall future purchases of shares of our common stock notpursuant to our securities repurchase program, if any, are subject to the discretion of the Board of Directors and will depend upon business conditions, results of
operations, financial condition and other factors. Our Board of Directors may, without advance notice, suspend or terminate our repurchase program. There can be below $1.00 per share over any consecutive thirty trading-day period. During 2020, the priceno assurance that we will make repurchases of shares of our common stock had at times closed below $1.00 per share, and we received notice from the NYSE that we were not in compliance with the continued listing standards. Though we regained compliance with the NYSE continued listing standards in December 2020, we cannot assure you that the average closing price of our common stock over a consecutive thirty trading-day period will not fall below $1.00 per share in the future.
If we are unable Share repurchases under our repurchase program could diminish our available liquidity, which may impact our ability to meet these listing standardsfinance future growth and are unable to curepursue possible future strategic growth projects. In addition, any such non-compliance withinelimination of, or downward revision in, our repurchase program could have an adverse effect on the applicable cure period provided by the NYSE, the NYSE could delist our common stock. A delisting of our common stock could negatively impact us by, among other things, reducing the liquidity and market price of our common stock; reducing the number of investors willing to hold or acquire our common stock, which could negatively impact our ability to raise equity financing; limiting our ability to issue additional securities or obtain additional financing in the future; decreasing the amount of news and analyst coverage of us; and causing us reputational harm with investors, our employees, and parties conducting business with us.stock.
Risks Related to Our Amended and Restated Bylaws, Which Designate the Court of Chancery of the State of Delaware as the Sole and Exclusive Forum for Certain Types of Actions and Proceedings that May Be Initiated by Our Stockholders, and the U.S. Federal District Courts in Wilmington County, Delaware as the Exclusive Forum for Securities Act Claims, Which Could Limit Our Stockholders’ Ability to Obtain What Such Stockholders Believe To Be a Favorable Judicial Forum for Disputes with Us or Our Directors, Officers or Other Employees
Our amended and restated bylaws provide that, unless we consent in writing to the selection of an alternative forum, (i) the Delaware Court of Chancery or, if such court lacks subject matter jurisdiction, another state or federal court located within the State of Delaware, will be the sole and exclusive forum with respect to (a) any derivative action or proceeding brought on our behalf, (b) any action asserting a claim of breach of a fiduciary duty owed by any of our current or former directors, officers, stockholders, employees or agents to us or our stockholders, including a claim alleging the aiding and abetting of such a breach of fiduciary duty, (c) any action asserting a claim against us or any of our current or former directors, officers, stockholders, employees or agents arising out of or relating to any provision of the Delaware General Corporation Law (“DGCL”), our certificate of incorporation or its amended and restated bylaws, (d) any action asserting a claim related to or involving us or any of our directors, officers, stockholders, employees or agents that is governed by the internal affairs doctrine of the State of Delaware, or (e) any action asserting an “internal corporate claim” as that term is defined in Section 115 of the DGCL, and (ii) the U.S. Federal District Court in Wilmington County, Delaware will be the sole and exclusive forum for any action arising under the Securities Act. Our choice-of-forum provision will not apply to suits brought to enforce any liability or duty created by the Exchange Act, and investors cannot waive compliance with the federal securities laws and the rules and regulations thereunder.
Any person or entity purchasing or otherwise acquiring an interest in any shares of our capital stock shall be deemed to have notice of and to have consented to the forum provisions in our amended and restated bylaws. These choice-of-forum provisions may limit a stockholder’s ability to bring a claim in a judicial forum that he, she or it believes to be favorable for disputes with us or our directors, officers or other employees, which may discourage such lawsuits. Alternatively, if a court were to find these provisions of our amended and restated bylaws inapplicable or unenforceable with respect to one or more of the specified types of actions or proceedings, we may incur additional costs associated with resolving such matters in other jurisdictions, which could materially adversely affect our business, financial condition and results of operations and result in a diversion of the time and resources of our management and our Board of Directors.
ITEM 1B. Unresolved Staff Comments
None.
ITEM 1C. Cybersecurity
We believe that cybersecurity is a critical component of our enterprise risk management process, and as such, we have implemented a cybersecurity program to assess, identify, and manage risks from cybersecurity threats that may result in adverse effects on the confidentiality, integrity, and availability of our information systems.
Our Board of Directors oversees management’s enterprise risk management process, including cybersecurity risks, to help align our risk exposure with our strategic objectives. Senior leadership, including our Chief Information Officer (CIO), regularly briefs the Board of Directors on our cybersecurity and information security, and we have processes by which certain cybersecurity incidents are escalated to the Board of Directors.
Our CIO, who reports to our Senior VP & Chief Financial Officer, oversees our cybersecurity function. The Cybersecurity Manager reports to the CIO, and the CIO and Cybersecurity Manager are responsible for assessing and managing risks from cybersecurity threats, as well as our overall information security strategy, policy, security engineering, operations, and cybersecurity threat detection and response, and reporting on cybersecurity matters to the Board and executive management.
Our CIO has a Master of Science in Information Systems and has served in various roles in information technology for over 25 years. Our Cybersecurity Manager has served in various roles in information technology and information security for over 25 years, with 10 of those years as the leader responsible for enterprise cybersecurity, including serving as the Information Security Officer at another larger publicly traded company.
Our CIO receives reports on cybersecurity threats from experienced information security personnel and third-party consultants and resources, and regularly reviews risk management measures implemented by the Company to identify and
mitigate data protection and cybersecurity risks. Our processes and systems include automated tools and technical safeguards managed and monitored by our cybersecurity team. Additionally, we have a set of Company-wide policies and procedures regarding cybersecurity matters, which include an Information Security best practices intranet site, as well as other policies that directly or indirectly relate to cybersecurity, such as policies related to email usage, remote network access, internet usage, passphrase usage, information technology acceptable use, data governance and privacy, and information security. These policies go through an internal review process and are approved by appropriate members of management. We periodically conduct penetration and vulnerability testing, data recovery testing, and security audits. We also conduct regular employee training on cybersecurity. With respect to our incident response, we have adopted a plan that applies in the event of a cybersecurity threat or incident to provide a framework for responding to such threats and incidents. Our plan sets out a coordinated approach to investigating, containing, documenting, and mitigating incidents, including reporting findings and keeping senior management and other key stakeholders informed and involved as appropriate. We also employ processes designed to oversee and identify risks from cybersecurity threats associated with our use of third-party service providers.
Risks from cybersecurity threats, including as a result of any previous cybersecurity incidents, have not materially affected us, including our business strategy, results of operations, or financial condition, but we face certain ongoing risks from cybersecurity threats that, if realized, are reasonably likely to have such an affect.
ITEM 2. Properties
We lease office space to support our operating segments, as well as our corporate offices.
Fluids Systems. We also own a facility containing approximately 103,000108,000 square feet of office space (approximately 21,000 square feet of which is currently being leased to third parties) on approximately 11 acres of land in Katy, Texas, which houses our division headquarters and general and administrative support personnel for both operating segments, the divisional headquarterslaboratory and technology center for this segment.the Fluids Systems segment, as well as administrative offices for third-party lessees.
Fluids Systems. We lease approximately 11 acres of industrial space in Fourchon, Louisiana which houses drilling and completion fluids blending, storage, and transfer stations to serve the deepwater Gulf of Mexico market. We also operate four specialty mineral grinding facilities on owned or leased land in the U.S. Additionally, we own or lease various facilities and warehouses throughout the world to support our operations. Some of these warehouses include blending facilities. We also lease approximately nine acres of industrial space in Fourchon, Louisiana which houses a drilling fluids shorebase and blending facility for the deepwater Gulf of Mexico market. During the fourth quarter of 2022, we entered a seven-year sublease of this property as we exited our Gulf of Mexico fluids operations.
Industrial Solutions. We own a facility containing approximately 93,000 square feet of officeindustrial and industrialoffice space on approximately 34 acres of land in Carencro, Louisiana, which houses our manufacturing facilities and technology center for this segment. We also own or lease various facilities and warehouses throughout the U.S., as well as facilities in the United Kingdom,U.K., to support our field operations. Additionally, we own an industrial blending facility and distribution warehouse containing approximately 65,000 square feet of office and industrial space on approximately 21 acres of land in Conroe, Texas.
ITEM 3. Legal Proceedings
In the ordinary course of conducting our business, we become involved in litigation and other claims from private party actions, as well as judicial and administrative proceedings involving governmental authorities at the federal, state, and local levels. While the outcome of litigation or other proceedings against us cannot be predicted with certainty, management does not expect that any loss resulting from such litigation or other proceedings, in excess of any amounts accrued or covered by insurance, will have a material adverse impact on our consolidated financial statements.
ITEM 4. Mine Safety Disclosures
The information concerning mine safety violations and other regulatory matters required by Section 1503(a) of the Dodd-Frank Wall Street Reform and Consumer Protection Act and Item 104 of Regulation S-K is included in Exhibit 95.1 of this Annual Report on Form 10-K, which is incorporated by reference.Not applicable.
PART II
ITEM 5. Market for Registrant’s Common Equity, Related Stockholder Matters and Issuer Purchases of Equity Securities
Our common stock is traded on the New York Stock Exchange under the symbol “NR.”
As of February 1, 2022,2024, we had 1,1551,072 stockholders of record as determined by our transfer agent.
We have not paid any dividends during the three most recent fiscal years or any subsequent interim period, and we do not intend to pay any cash dividends in the foreseeable future. In addition, our Amended ABL Facility contains covenants which limit the payment of dividends on our common stock. See Item 7. “Management’s Discussion and Analysis of Financial Condition and Results of Operations - Liquidity and Capital Resources - Asset-Based Loan Facility.”
Stock Performance Graph
The following graph reflects a comparison of the cumulative total stockholder return of our common stock from January 1, 20172019 through December 31, 2021,2023, with the New York Stock Exchange Market Value Index, a broad equity market index, and the Philadelphia Oil Service Sector Index. The graph assumes the investment of $100 on January 1, 20172019 in our common stock and each index and the reinvestment of all dividends, if any. This information shall be deemed furnished but not filed in this Form 10-K, and shall not be deemed incorporated by reference into any filing under the Securities Act of 1933, or the Securities Exchange Act of 1934, except to the extent we specifically incorporate it by reference.
NOTE: Prepared by Zacks Investment Research, Inc. Used with permission. All rights reserved. Copyright 1980-2022.1980-2024.
Issuer Purchases of Equity Securities
The following table details our repurchases of shares of our common stock for the three months ended December 31, 2021:2023:
| | | | | | | | | | | | | | | | | | | | | | | | | | |
| Period | | Total Number of Shares Purchased | | Average Price Paid Per Share | | Total Number of Shares Purchased as Part of Publicly Announced Plans or Programs | | Maximum Approximate Dollar Value of Shares that May Yet be Purchased Under Plans or Programs ($ in Millions) |
| October 2021 | | — | | | $ | — | | | — | | | $ | 23.8 | |
| November 2021 | | 3,043 | | | $ | 2.72 | | | — | | | $ | 23.8 | |
| December 2021 | | 1,424 | | | $ | 2.70 | | | — | | | $ | 23.8 | |
| Total | | 4,467 | | | | | — | | | |
| | | | | | | | | | | | | | | | | | | | | | | | | | |
| Period | | Total Number of Shares Purchased | | Average Price Paid Per Share | | Total Number of Shares Purchased as Part of Publicly Announced Plans or Programs | | Maximum Approximate Dollar Value of Shares that May Yet be Purchased Under Plans or Programs ($ in Millions) |
| October 2023 | | 878,923 | | | $ | 6.85 | | | 878,923 | | | $ | 18.1 | |
| November 2023 | | 3,043 | | | $ | 7.19 | | | — | | | $ | 18.1 | |
| December 2023 | | — | | | $ | — | | | — | | | $ | 18.1 | |
| Total | | 881,966 | | | | | 878,923 | | | |
During the three months ended December 31, 2021,2023, we purchased an aggregate of 4,4673,043 shares surrendered in lieu of taxes under vesting of restricted stock awards. During 2021,2023, we purchased an aggregate of 419,114576,967 shares surrendered in lieu of taxes under vesting of restricted stock awards. These shares were not acquired pursuant to our securities repurchase program described below. All of the shares purchased are held as treasury stock.
In November 2018, our Board of Directors authorized changes to oura securities repurchase program. These changes increased the authorized amount under the repurchase program to $100.0 million, available for repurchases of any combination of our common stock and our Convertible Notes.unsecured convertible senior notes, which matured in December 2021. In February 2023, our Board of Directors approved certain changes to the repurchase program as well as additional capacity to increase the total authorization then available to $50.0 million. During the three months ended December 31, 2023, we repurchased 878,923 shares of our common stock under our repurchase program for a total cost of $6.0 million. During 2023, we repurchased 6,522,797 shares of our common stock under our repurchase program for a total cost of $31.9 million.
As of December 31, 2023, we had $18.1 million remaining under the program. In February 2024, our Board of Directors replaced the existing program with a new repurchase program for repurchases of common stock up to $50.0 million.
Our repurchase program authorizes usis available to purchase outstanding shares of our common stock or Convertible Notes in the open market or as otherwise determined by management, subject to certain limitations under the Amended ABL Facility and other factors. The repurchase program has no specific term. RepurchasesFuture repurchases are expected to be funded from operating cash flows, available cash on hand, and borrowings under our Amended ABL Facility. As part of the share repurchase program, our management has been authorized to establish trading plans under Rule 10b5-1 of the Securities Exchange Act of 1934. As of December 31, 2021, we had $23.8 million remaining under the program.
There were no Convertible Notes and no shares of common stock repurchased under the repurchase program during the three months ended December 31, 2021. During 2021, we repurchased $28.3 million of our Convertible Notes in the open market for a total cost of $28.1 million.
ITEM 6. [Reserved]
ITEM 7. Management’s Discussion and Analysis of Financial Condition and Results of Operations
The following discussion of our financial condition, results of operations, liquidity, and capital resources should be read in conjunction with the consolidated financial statements and notes thereto included in Item 8 “Financial Statements and Supplementary Data.”
Overview
We are a geographically diversified supplier providing environmentally-sensitive products, as well as rentals and services to customers across multiple industries. We currently operate our business through two reportable segments: Industrial Solutions which serves various markets including power transmission, oil and natural gas exploration and production (“E&P”), pipeline, renewable energy, petrochemical, construction and other industries, and Fluids Systems, as described further below. In addition, we had a third reportable segment, Industrial Blending, which was exited in 2022. We have reflected these three reportable segments for all periods presented in this Annual Report on Form 10-K.
Over much of the past decade, while the Fluids Systems segment has been the primary driver of revenues, the Industrial Solutions segment has been the primary driver of operating income, cash flows, and financial returns. Consequently, our growth investments in recent years have been heavily concentrated in the Industrial Solutions segment. For 2023, the relative revenues, operating income, and capital expenditures for the Industrial Solutions and Fluids Systems segments for 2023 are as follows (amounts in millions):
* Fluids Systems segment operating income for 2023 includes $12.7 million in total charges for certain impairments, facility exit, severance costs, and transaction related expenses for the ongoing Fluids Systems segment sale process as described further below.
In June 2023, we announced that we initiated a review of strategic alternatives for the long-term positioning of the Fluids Systems division. We have retained Lazard to serve as our exclusive financial advisor in connection with the strategic review. In September 2023, we launched a formal sale process for substantially all the Fluids Systems business as part of this strategic review. While the sale process is ongoing, we anticipate substantially completing the process in mid-2024, although it is not certain that any such transaction will be consummated on that timeline or at all. As part of the strategic review, we will continue to evaluate under-performing areas within our business and anticipate additional actions may be necessary to optimize our operational footprint and invested capital within the Fluids Systems segment. If we successfully complete the process to substantially exit the Fluids Systems segment, our remaining operations will primarily serves E&P customers.reflect a specialty rental and service business, serving the utilities sector and other critical infrastructure markets. See further information below.
2023 Priorities
The following summarizes our performance against key priorities established for 2023:
•Accelerate Industrial Solutions Growth – We continued to prioritize investment capital in the growth of our Industrial Solutions business, where over the past several years, we have seen the strong market adoption of our specialty rental products and differentiated service offering. For 2023, 90% of our capital expenditures were directed to the Industrial Solutions segment. Industrial Solutions segment revenues were $207.6 million in 2023, reflecting an 8% increase from 2022, including a 12% increase in rental and services, with higher revenues seen broadly across all major industries served.
•Operational Excellence – We increased our focus on efficiency improvements and operating cost optimization across every aspect of our global footprint. With our simplified business model and enhanced focus on balance sheet optimization, we seek to improve returns and consistency in cash flow generation. During 2023, we generated $100.0 million of operating cash flow, which was partially driven by the effects of the 2022 divestitures and ongoing efforts to restructure or reduce the level of invested capital in underperforming business activities within the Fluids Systems segment. In addition, we have continually evaluated and executed actions intended to streamline the organization and our cost structure, driving reductions in overhead costs and improvements in profitability.
•Prioritize Return of Capital – We are committed to maintaining a strong balance sheet, using excess cash generation to reduce our debt and return value to our shareholders. During 2023, we utilized $47 million of cash generation for debt repayments and another $32 million to repurchase 6.5 million (7%) of our outstanding shares under our repurchase program.
Segment Overview
Industrial Solutions -– Our Industrial Solutions segment, which generated 32%28% of our consolidated revenues and $40$53.0 million of operating income for 2021,2023, provides temporary worksite access solutions, including the rental of our manufactured recyclable composite matting systems, along with related site construction and services to customers in various markets including power transmission, E&P, pipeline, renewable energy, petrochemical, construction and other industries, primarily in the United States and Europe.United Kingdom. We also sell our manufactured recyclable composite mats to customers around the world, with power transmission being the primary end-market. For the Industrial Solutions segment, approximately 75% of 2023 revenues were derived from power transmission and other industrial markets.
Our Industrial Solutions segment has been aour primary source of operating income and cash generation for us in recent years.years, and has also been the primary focus for growth investments. The expansiongrowth of our Industrial Solutions segment intobusiness in the power transmission and other industrial markets remains a strategic priority for us due to such markets’the relative stability of such markets compared to E&P, as well as the magnitude of growth opportunity in these markets, including the potential positive impact from the energy transition. In 2021, approximately 80% of our total capital expenditures were directedtransition and future legislation and regulations related to the Industrial Solutions segment in support of this growth strategy.
During 2020, our business was impacted by the COVID-19 pandemic, as customers delayed purchasesgreenhouse gas emissions and planned projects citing COVID-related market uncertainty, permitting delays, and logistical restrictions. In addition, our rental and service business has been impacted by the downturn in the U.S. oil and natural gas industry, as further discussed below. As compared to 2019, segment revenues from E&P customers decreased by $53 million (59%) to $37 million in 2021. During this same period, segment revenues from power transmission and other industrial markets increased by $47 million (43%) to $157 million in 2021.climate change. We expect customer activity, particularly in the power transmission sector, will remain robust in the coming years, driven in part by the impacts of the U.S. energy transition and the increasing investment in grid reliance initiatives.
In 2020, we began leveraging our chemical blending capacity and technical expertise into industrial blending operations, and in response to the increasing market demand for cleaning products resulting from the COVID-19 pandemic, began producing disinfectants and industrial cleaning products in 2020. The scale-up of production was completed by the end of the third quarter of 2020, which effectively repositioned our chemical blending operation located in Conroe, Texas to support industrial end-markets. Beginning prospectively in the fourth quarter of 2020, the assets and operating results associated with these industrial blending operations are included in the Industrial Solutions segment, while the historical results from earlier in 2020, which were immaterial, are included in the Fluids Systems segment. Despite our initial success, a key blue-chip customer experienced a significant decline in product demand and cancelled all orders of disinfectants and cleaning products in the third quarter of 2021. In February 2022, in consideration of broader strategic priorities and the timeline and efforts required to further develop the industrial blending business, our management recommended and our Board of Directors approved a plan to exit our Industrial Blending operations. As part of the exit plan, we expect to complete the wind down of the Industrial Blending business by the end of the second quarter 2022 and pursue the sale of the industrial blending and warehouse facility located in Conroe, Texas, as well as the sale or other disposal of the blending and packaging equipment and other related assets currently used in these operations. The Industrial Blending business contributed $9 million of revenues in 2021 and incurred an operating loss of $2 million. As of December 31, 2021, the carrying value of the long-lived assets associated with the Industrial Blending business was $20 million. As a result of the plan to exit and dispose of the assets used in the Industrial Blending business, we may incur pre-tax charges in the range of approximately $4 million to $8 million primarily related to the non-cash impairment of long-lived assets, which we expect to recognize in the first quarter of 2022.
Fluids Systems -– Our Fluids Systems segment, which generated 68%72% of our consolidated revenues and incurred a $19$11.9 million of operating lossincome for 2021,2023 (including $12.7 million in total charges for certain impairments, facility exit, severance costs, and transaction related expenses for the ongoing Fluids Systems segment sale process), provides drilling completion, and stimulationcompletion fluids products and related technical services to customers for oil, natural gas, and geothermal projects primarily in North America and Europe, the Middle East and Africa (“EMEA”),EMEA, as well as certain countries in Asia PacificPacific. Over the past few years, our primary focus within Fluids Systems has been the transformation into a more agile and Latin America. simplified business focused on key markets, while monetizing assets in underperforming or sub-scale markets and reducing our invested capital to drive improvements in segment profitability and returns. As of December 31, 2023, the net working capital of the Fluids Systems segment was $171 million, which reflects a $69 million reduction from December 31, 2022.
Our Fluids Systems operating results remain dependent on oil and natural gas drilling activity levels in the markets we serve and the nature of the drilling operations, (including the depth and whether the wells are drilled vertically or horizontally), which governs the revenue potential of each well. Drilling activity levels in turn, depend on a variety of factors, including oil and natural gas commodity pricing, inventory
levels, product demand, and regulatory restrictions. Oil and natural gas prices and activity are cyclical and volatile, and this market volatility has a significant impact on our Fluids Systems operating results.
While our Fluids Systems revenue potential is driven by a number of factors including those described above, rigRig count data remains the most widely accepted indicator of drilling activity. Average North American rig count data for the last three years is as follows:
| | | | | Year Ended December 31, | | 2021 vs 2020 | | 2020 vs 2019 | | | Year Ended December 31, | | 2023 vs 2022 | | 2022 vs 2021 |
| | | | 2021 | | 2020 | | 2019 | | Count | | % | | Count | | % | | | 2023 | | 2022 | | 2021 | | Count | | % | | Count | | % |
| U.S. Rig Count | U.S. Rig Count | | 475 | | | 433 | | | 943 | | | 42 | | | 10 | % | | (510) | | | (54) | % | U.S. Rig Count | | 687 | | | 723 | | 723 | | | 475 | | 475 | | | (36) | | (36) | | | (5) | | (5) | % | | 248 | | | 52 | | 52 | % |
| Canada Rig Count | Canada Rig Count | | 131 | | | 89 | | | 134 | | | 42 | | | 47 | % | | (45) | | | (34) | % | Canada Rig Count | | 177 | | | 175 | | 175 | | | 131 | | 131 | | | 2 | | 2 | | | 1 | | 1 | % | | 44 | | | 34 | | 34 | % |
| North America Rig Count | North America Rig Count | | 606 | | | 522 | | | 1,077 | | | 84 | | | 16 | % | | (555) | | | (52) | % | North America Rig Count | | 864 | | | 898 | | 898 | | | 606 | | 606 | | | (34) | | (34) | | | (4) | | (4) | % | | 292 | | | 48 | | 48 | % |
Source: Baker Hughes Company
During 2019, U.S. rig count steadily declined, exiting the year at 805 active rigs, a 26% decline from the end of 2018. The decline in market activity contributed to a significant decline in segment revenues and operating income. During March 2020, oil prices collapsed due to geopolitical events along with the worldwide effects of the COVID-19 pandemic. As a result, U.S. rig count declined significantly beginning in March 2020 before reaching a low of 244 in August 2020. During 2021, oil prices rebounded, and the average U.S. rig count graduallysteadily improved in the wake of COVID-19, and during 2022, oil prices and rig counts further increased due in part to global economic recovery and geopolitical events. In 2023, market activity in the U.S. steadily declined, ending the year at 586622 active rigs, 38% lower thandown 20% from the 2019 average. We anticipate thatend of 2022. With recent instability in oil prices, the 2024 outlook for U.S. market activity will continue to improve in 2022, although U.S. activity is expected to remain wellgenerally remains below 2019 levelsthe 2023 average level, as many of our customers remain focused on cost-saving measuresmaintain strong capital discipline and generating sufficientprioritize cash flows. Further, the ongoing impacts of the COVID-19 variants, an uncertain economic environment, including widespread supply chain disruptions, as well as enacted and proposed legislative changes in the U.S. impacting the oil and natural gas industry, make the timing and pace of recovery difficult to predict.flow generation over growth.
Outside of North America, land markets, drilling activity is generally more stable as this drilling activity is based on longer-term economic projections and multi-year drilling programs, which typically reduces the impact of short-term changes in commodity prices on overall drilling activity. However, operationsFurther, geopolitical events in recent years are causing several countriesmarkets to increase drilling activity levels, to help ensure reliable energy supply in the coming years, while reducing their dependency on Russia-sourced oil and natural gas. Consequently, the outlook for several markets within the EMEA region experiencedremains strong, with growth in activity disruptions and project delays beginning in early 2020 and continuing through 2021, driven by government-imposed restrictions on movements of personnel, quarantines of staffing, and logistical limitations as a result ofexpected over the COVID-19 pandemic. Revenues and profitability from our international Fluids Systems business have gradually recovered in 2021, with revenues for the fourth quarter 2021 approaching pre-COVID levels. Although the impacts of COVID-19 on our international operations has significantly declined in recent months, we expect some level of operational disruption and project delays will continue to impact international activity levels in the near-term, with the impact from the duration and magnitude of the pandemic and related government responses very difficult to predict.
In response to the 2020 market changes and reduced demand for our products and services as a result of the decline in oil prices and the COVID-19 pandemic, we took a number of actions during 2020 and continuing into 2021 aimed at conserving cash and protecting our liquidity, including:
•The implementation of cost reduction programs, including workforce reductions, employee furloughs, the suspension of the Company’s matching contributions to its U.S. defined contribution plan, and temporary salary reductions effective April 1, 2020 for a significant portion of U.S. employees, including a 15% cut to the salaries paid to executive officers and the annual cash retainers paid to all non-employee members of the Board of Directors (compensation and matching contributions to the U.S. defined contribution plan were restored by the third quarter of 2021);
•The initiation of additional actions to further reduce the operational footprint of the Fluids Systems business in the U.S., to better align our cost structure with the lower market activity levels; and
•The elimination of all non-critical capital investments.
As part of the cost reduction programs, we reduced our global employee base by approximately 650 (30%) in 2020.
Industrial Blending – Our Industrial Blending segment began operations in 2020 and supported industrial end-markets, including the production of disinfectants and industrial cleaning products. In 2020,the first quarter of 2022, we recognized $29.2 millioncompleted the wind down of total charges, including $28.6 millionthe Industrial Blending business, and in November 2022 we completed the sale of the industrial blending assets.
2023 Strategic Actions
The following strategic actions were taken in 2023.
Review of Strategic Alternatives for Fluids Systems consistingBusiness
As described above, we initiated a review of $11.7 millionstrategic alternatives for the recognition of cumulative foreign currency translation losses related to our exit from Brazil, $10.3 million for inventory write-downs, $3.5 million for severance and other costs, and $3.0 million in fixed asset impairments.
In 2021, we recognized $5.5 million of total charges, primarily related to self-insured costs associated with Hurricane Ida damage to our Fourchon, Louisiana Fluids Systems operating base, facility exit, and severance costs. We have continued to take cost actions throughout 2021 to further reduce the operational footprintlong-term positioning of the Fluids Systems division in June 2023, and in September 2023, we launched a formal sale process for substantially all the Fluids Systems business as part of this strategic review. While the sale process is ongoing, we anticipate substantially completing the process in mid-2024, although it is not certain that any such transaction will be consummated on that timeline or at all. As part of this review, in the U.S., to better align our cost structure with the lower market activity levels.
Additionally, with ongoing support from outside financialfourth quarter of 2023 we recognized a $2.5 million impairment charge (included in impairments and other advisors, we have continuously reviewed our portfolio during the oil and natural gas cycle of the last couple of years. These reviews have focused on evaluating changes in the outlook for our served markets and customer priorities, while identifying opportunities for value-creating optionscharges) related to certain long-lived assets utilized in our portfolio, as well as placing investment emphasisU.S. operations. We also incurred $1.2 million and $0.6 million of transaction related costs in markets where we generate strong returns2023 included in Corporate Office expenses and where we see greater long-term viability and stability. While we have taken certain actions to reduce our workforce and cost structure, our business contains high levels of fixed costs, including significant facility and personnel expense. In February 2022, our Board of Directors approved management’s plan to explore strategic options for our U.S. mineral grinding business, which contributed total third-party revenues of $36 million in 2021 yielding approximately break-evenFluids Systems segment operating income, and endedrespectively. As of December 31, 2023, the year with $47Fluids Systems business had approximately $227 million of net capital employed,assets, including approximately $25$38 million in cash, $13 million of debt, and $171 million of net working capital. We
As we continue to evaluate other under-performing areas ofstrategic alternatives for our business, particularly within the U.S. and Gulf of Mexico oil and natural gas markets, which necessitates consideration of broader structural changes to transform this business for the new market realities. In the absence of a longer-term increase in activity levels,Fluids Systems portfolio, we may incur future charges related to these efforts or potential asset impairments, which may negatively impact our future results.
Exit of Stimulation Chemicals Product Line
In 2023, we made the decision to exit the stimulation chemicals product line. The Fluids Systems segment operating results for 2023 includes $1.6 million of total charges (included in impairments and other charges) for inventory write-downs to reduce the carrying values of certain inventory related to the exit of our stimulation chemicals product line to their net realizable value. As of December 31, 2023, we had $2.1 million of inventory remaining related to the stimulation chemicals product line.
Exit of Offshore Australia Operations
In 2023, we made the decision to exit our offshore Australia operations. The Fluids Systems segment operating results for 2023 includes $1.5 million of total charges (included in impairments and other charges) for inventory write-downs to reduce the carrying values of certain inventory related to the exit of our offshore Australia operations to their net realizable value as well as impairments related to the long-lived assets previously used in the now exited business. We expect to incur certain exit related costs of approximately $1 million from the exit of our offshore Australia operations in 2024.
Exit of Chile Operations
In 2023, we completed our customer contract in Chile, and during the fourth quarter of 2023, we completed the substantial liquidation of our Chile subsidiary and recognized an $0.8 million non-cash charge (included in impairments and other charges) for the reclassification of cumulative foreign currency translation losses related to our subsidiary in Chile.
2022 Strategic Actions
The following strategic actions were taken in 2022.
Exit of Industrial Blending Segment and Sale of Conroe, Texas Blending Facility
In the first quarter of 2022, we exited our Industrial Blending operations. In November 2022, we completed the sale of the industrial blending assets for cash proceeds of approximately $14 million. In connection with this divestiture, we recognized a $7.9 million impairment charge related to these long-lived assets in the second quarter of 2022 (included in impairments and other charges), and subsequently recognized a gain of $2.6 million upon the eventual sale in the fourth quarter of 2022.
Sale of Excalibar U.S. Mineral Grinding Business
In November 2022, we completed the sale of substantially all the long-lived assets, inventory, and operations of our Excalibar U.S. mineral grinding business (“Excalibar”), which was reported within our Fluids Systems segment, to Cimbar Resources, INC. (“Cimbar”), for cash proceeds (after purchase price adjustments) of approximately $51 million and recognized a gain of $1.0 million. The Company retained certain assets and liabilities, including accounts receivable and accounts payable, the wind down of which was substantially completed in the first quarter of 2023. Such working capital provided approximately $10 million of cash generation in the fourth quarter of 2022 and approximately $6 million of additional cash generation in the
first quarter of 2023. In connection with the sale, the Company and Cimbar entered into a long-term barite supply agreement for certain regions of our U.S. drilling fluids business, with an initial term of four years following the closing of the transaction.
Exit of Gulf of Mexico Operations
In December 2022, we completed the sale of substantially all assets associated with our Gulf of Mexico completion fluids operations. Separately, we entered into a seven-year arrangement to sublease our Fourchon, LA drilling fluids shorebase and blending facility to a leading global energy services provider. As part of this arrangement, substantially all of our Gulf of Mexico drilling fluids inventory has been sold to the lessee as consumed. These transactions provided cash generation of approximately $6 million in the fourth quarter of 2022 and approximately $28 million in 2023. Fluids Systems segment operating income for 2023 includes $4.8 million in charges related to the exit of our Gulf of Mexico operations, which was substantially completed during the second quarter of 2023.
As a result of the plan to exit the Gulf of Mexico operations as described above, we considered the third quarter 2022 developments to be a potential indicator of impairment that required us to complete an impairment evaluation. Accordingly, we estimated the fair value for our Gulf of Mexico assets as of September 30, 2022 based on the expected cash flows to be generated from the anticipated transactions and determined that a $21.5 million impairment charge was required related to the long-lived assets. We also recognized an $8.0 million charge to reduce the carrying value of inventory to their net realizable value primarily based on the anticipated transactions. The total charges of $29.4 million were recorded to impairments and other charges in the third quarter of 2022.
Total impairments and other charges are shown in the following table:
| | | | | | | | | | | |
| | Year Ended December 31, |
| (In thousands) | 2023 | | 2022 |
| Fluids U.S. Land - Long-lived assets impairment | 2,485 | | | — | |
| Stimulation chemicals product line - Inventory write-downs | 1,576 | | | — | |
| Australia - Inventory write-downs | 1,058 | | | — | |
| Australia - Long-lived assets impairment | 439 | | | — | |
| Chile exit - Recognition of cumulative foreign currency translation losses | 798 | | | — | |
| Industrial Blending - Long-lived assets impairment | — | | | 7,905 | |
| Gulf of Mexico - Long-lived assets impairment | — | | | 21,461 | |
| Gulf of Mexico - Inventory write-downs | — | | | 7,956 | |
| Total impairments and other charges | $ | 6,356 | | | $ | 37,322 | |
Summarized operating results of the business units exited in 2022 (including impairments and other charges described above) are shown in the following table:
| | | | | | | | | | | | | | | | | |
| | Year Ended December 31, |
| (In thousands) | 2023 | | 2022 | | 2021 |
| Revenues | | | | | |
| Industrial Blending | $ | — | | | $ | — | | | $ | 8,821 | |
| Excalibar | — | | | 55,990 | | | 36,396 | |
| Gulf of Mexico | — | | | 26,708 | | | 25,366 | |
| Total revenues | $ | — | | | $ | 82,698 | | | $ | 70,583 | |
| | | | | |
| Operating income (loss) | | | | | |
| Industrial Blending | $ | — | | | $ | (8,002) | | | $ | (2,384) | |
| Excalibar | — | | | 3,665 | | | (277) | |
| Gulf of Mexico | (4,776) | | | (43,215) | | | (6,753) | |
| Total Operating income (loss) | $ | (4,776) | | | $ | (47,552) | | | $ | (9,414) | |
Summarized net assets related to the business units exited in 2022 are shown in the following table:
| | | | | |
| (In thousands) | December 31, 2022 |
| Receivables, net | $ | 27,798 | |
| Inventories | 5,805 | |
| Accounts payable | (2,060) | |
| Accrued liabilities | (311) | |
| Total net assets | $ | 31,232 | |
The net assets remaining as of December 31, 2022 related to the retained working capital from the Excalibar sale and the remaining Gulf of Mexico net assets. During 2023, we substantially settled the above net assets related to the now exited Excalibar business and Gulf of Mexico operations.
Year Ended December 31, 20212023 Compared to Year Ended December 31, 20202022
Consolidated Results of Operations
Summarized results of operations for 20212023 compared to 20202022 are as follows:
| | | | Year Ended December 31, | | 2021 vs 2020 | | Year Ended December 31, | | 2023 vs 2022 |
| (In thousands) | (In thousands) | 2021 | | 2020 | | $ | | % | (In thousands) | 2023 | | 2022 | | $ | | % |
| Revenues | Revenues | $ | 614,781 | | | $ | 492,625 | | | $ | 122,156 | | | 25 | % | Revenues | $ | 749,600 | | | $ | | $ | 815,594 | | | $ | | $ | (65,994) | | | (8) | | (8) | % |
| Cost of revenues | Cost of revenues | 529,552 | | | 473,258 | | | 56,294 | | | 12 | % | Cost of revenues | 611,061 | | | 694,058 | | 694,058 | | | (82,997) | | (82,997) | | | (12) | | (12) | % |
| Selling, general and administrative expenses | Selling, general and administrative expenses | 94,445 | | | 86,604 | | | 7,841 | | | 9 | % | Selling, general and administrative expenses | 101,136 | | | 97,618 | | 97,618 | | | 3,518 | | 3,518 | | | 4 | | 4 | % |
| Other operating income, net | Other operating income, net | (391) | | | (3,330) | | | 2,939 | | | NM | Other operating income, net | (2,583) | | | (4,370) | | (4,370) | | | 1,787 | | 1,787 | | | NM | | NM |
| Impairments and other charges | Impairments and other charges | — | | | 14,727 | | | (14,727) | | | NM | Impairments and other charges | 6,356 | | | 37,322 | | 37,322 | | | (30,966) | | (30,966) | | | NM | | NM |
| Operating loss | (8,825) | | | (78,634) | | | 69,809 | | | 89 | % |
| Operating income (loss) | | Operating income (loss) | 33,630 | | | (9,034) | | | 42,664 | | | NM |
| | Foreign currency exchange (gain) loss | (397) | | | 3,378 | | | (3,775) | | | NM |
| Foreign currency exchange loss | |
| Foreign currency exchange loss | |
| Foreign currency exchange loss | | 267 | | | 389 | | | (122) | | | NM |
| Interest expense, net | Interest expense, net | 8,805 | | | 10,986 | | | (2,181) | | | (20) | % | Interest expense, net | 8,181 | | | 7,040 | | 7,040 | | | 1,141 | | 1,141 | | | 16 | | 16 | % |
| (Gain) loss on extinguishment of debt | 1,000 | | | (419) | | | 1,419 | | | NM |
| Loss before income taxes | (18,233) | | | (92,579) | | | 74,346 | | | 80 | % |
| Income (loss) before income taxes | | Income (loss) before income taxes | 25,182 | | | (16,463) | | | 41,645 | | | NM |
| | Provision (benefit) for income taxes | 7,293 | | | (11,883) | | | 19,176 | | | NM |
| Net loss | $ | (25,526) | | | $ | (80,696) | | | $ | 55,170 | | | 68 | % |
| Provision for income taxes | |
| Provision for income taxes | |
| Provision for income taxes | | 10,666 | | | 4,371 | | | 6,295 | | | NM |
| Net income (loss) | | Net income (loss) | $ | 14,516 | | | $ | (20,834) | | | $ | 35,350 | | | 170 | % |
Revenues
Revenues increased 25%decreased 8% to $614.8$749.6 million for 2021,2023, compared to $492.6$815.6 million for 2020.2022. This $122.2$66.0 million increasedecrease includes a $97.9$118.8 million (28%(20%) increase in revenuesdecrease in North America, comprised of a $49.4$133.0 million decrease in the Fluids Systems segment partially offset by a $14.2 million increase in the Industrial Solutions segment and a $48.5 million increase in thesegment. In our Fluids Systems segment. Revenuessegment, revenues from North America operations decreased primarily due to a $82.7 million impact from the divested business units, as well as the effect of lower market share and reduced U.S. market activity. In our Industrial Solutions segment, revenues from North America operations increased primarily due to the significant growthan increase in power transmissionrental and other industrial markets, which impacts our Industrial Solutions segment, as well as the improvement in North America rig count, which favorably impacted our Fluids Systems segment.services revenues. Revenues from our international operations increased by $24.3$52.8 million (17%(24%) but continued to be unfavorably impacted by activity disruptions and project delays resulting from the COVID-19 pandemic. Additional information regarding the change in revenues is provided within the operating segment results below.
Cost of revenues
Cost of revenues increased 12% to $529.6 million for 2021, compared to $473.3 million for 2020. Fluids Systems segment cost of revenues for 2021 includes $3.0 million of charges primarily related to facility exit and severance costs, and 2020 included a total of $14.1 million of charges related to inventory write-downs, severance costs, and facility exit costs. The remaining increase was primarily, driven by the 25% increase in revenues described above, partially offset by the benefit of cost reduction programs implemented in 2020 and 2021.
Selling, general and administrative expenses
Selling, general and administrative expenses increased $7.8 million to $94.4 million for 2021, compared to $86.6 million for 2020. This increase was primarily driven by higher performance-based incentive and stock-based compensation expense, as well as higher personnel costs in 2021, partially offset by the benefit of cost reduction programs implemented in 2020 and 2021, and lower severance charges. Selling, general and administrative expenses as a percentage of revenues was 15.4% for 2021 compared to 17.6% for 2020.
Other operating income, net
In August 2021, Hurricane Ida caused damage to our Fourchon, Louisiana Fluids Systems operating base. While this event is covered by our property and business interruption insurance programs, these programs contain self-insured retentions, which remain our financial obligations, resulting in $2.6 million of charges for 2021. In addition, 2021 includes a $0.8 million gain related to the final insurance settlement associated with the July 2018 fire at our Kenedy, Texas drilling fluids facility, and a $1.0 million gain related to a legal settlement in the Industrial Solutions segment, as well as gains on sales of assets. Other operating income for 2020 primarily relates to gains on sales of assets, including a $1.3 million gain related to our exit from Brazil.
Impairments and other charges
Fluids Systems segment included non-cash charges for 2020 consisting of $11.7 million for the recognition of cumulative foreign currency translation losses related to the substantial liquidation of our subsidiary in Brazil, as well as $3.0 million attributable to the abandonment of certain property, plant and equipment.
Foreign currency exchange
Foreign currency exchange was a $0.4 million gain for 2021 compared to a $3.4 million loss for 2020 and reflects the impact of currency translation on assets and liabilities (including intercompany balances) that are denominated in currencies other than functional currencies.
Interest expense, net
Interest expense was $8.8 million for 2021 compared to $11.0 million for 2020. Interest expense for 2021 and 2020 includes $3.7 million and $5.2 million, respectively, in noncash amortization of original issue discount and debt issuance costs. The decrease in cash interest expense is primarily due to lower debt balances.
(Gain) loss on extinguishment of debt
In 2021 and 2020, we repurchased $28.3 million and $33.1 million, respectively, of our Convertible Notes in the open market for $28.1 million and $29.1 million, respectively. The $1.0 million loss and $0.4 million gain for 2021 and 2020, respectively, reflects the difference in the amount paid and the net carrying value of the extinguished debt, including original issue discount and debt issuance costs.
Provision (benefit) for income taxes
The provision for income taxes was $7.3 million for 2021, despite reporting a pretax loss for the period, primarily reflecting the impact of the geographic composition of our pretax loss. The tax expense primarily relates to earnings from our international operations since we are currently unable to recognize the tax benefit from our U.S. losses as they may not be realized. The benefit for income taxes was $11.9 million for 2020, reflecting an effective tax benefit rate of 13%. This result primarily reflects the impact of the $11.7 million non-cash recognition of cumulative foreign currency translation losses related to the substantial liquidation of our subsidiary in Brazil and other nondeductible expenses, as well as the impact of the geographic composition of our pretax loss, where the tax benefit from losses in the U.S was partially offset by the tax expense related to earnings from our international operations.
Operating Segment Results
Summarized financial information for our reportable segments is shown in the following table (net of inter-segment transfers):
| | | | | | | | | | | | | | | | | | | | | | | |
| | Year Ended December 31, | | 2021 vs 2020 |
| (In thousands) | 2021 | | 2020 | | $ | | % |
| Revenues | | | | | | | |
| Fluids Systems | $ | 420,789 | | | $ | 354,608 | | | $ | 66,181 | | | 19 | % |
| Industrial Solutions | 193,992 | | | 138,017 | | | 55,975 | | | 41 | % |
| Total revenues | $ | 614,781 | | | $ | 492,625 | | | $ | 122,156 | | | 25 | % |
| | | | | | | |
| Operating income (loss) | | | | | | | |
| Fluids Systems | $ | (19,012) | | | $ | (66,403) | | | $ | 47,391 | | | |
| Industrial Solutions | 39,733 | | | 13,459 | | | 26,274 | | | |
| Corporate office | (29,546) | | | (25,690) | | | (3,856) | | | |
| Total operating loss | $ | (8,825) | | | $ | (78,634) | | | $ | 69,809 | | | |
| | | | | | | |
| Segment operating margin | | | | | | | |
| Fluids Systems | (4.5) | % | | (18.7) | % | | | | |
| Industrial Solutions | 20.5 | % | | 9.8 | % | | | | |
Fluids Systems
Revenues
Total revenues for this segment consisted of the following:
| | | | | | | | | | | | | | | | | | | | | | | |
| | Year Ended December 31, | | 2021 vs 2020 |
| (In thousands) | 2021 | | 2020 | | $ | | % |
| United States | $ | 227,261 | | | $ | 202,052 | | | $ | 25,209 | | | 12 | % |
| Canada | 48,007 | | | 24,762 | | | 23,245 | | | 94 | % |
| Total North America | 275,268 | | | 226,814 | | | 48,454 | | | 21 | % |
| | | | | | | |
| EMEA | 132,221 | | | 115,891 | | | 16,330 | | | 14 | % |
| Other | 13,300 | | | 11,903 | | | 1,397 | | | 12 | % |
| Total International | 145,521 | | | 127,794 | | | 17,727 | | | 14 | % |
| | | | | | | |
| Total Fluids Systems revenues | $ | 420,789 | | | $ | 354,608 | | | $ | 66,181 | | | 19 | % |
North America revenues increased 21% to $275.3 million for 2021, compared to $226.8 million for 2020. This increase was primarily attributable to a $51.7 million increase from U.S. land markets driven primarily by the 10% increase in U.S. rig count and an increase in market share, partially offset by a $23.2 million decrease from offshore Gulf of Mexico driven primarily by changes in customer drilling and completion activity levels. In addition, Canada increased $23.2 million driven primarily by the 47% increase in Canada rig count and an increase in market share. For 2021, U.S. revenues include $201.9 million from land markets and $25.4 million from offshore Gulf of Mexico.
Internationally, revenues increased 14% to $145.5 million for 2021, compared to $127.8 million for 2020. The increase was primarily driven by higher activity in Europe and Asia Pacific regions following significant impact of the COVID-19 pandemic, as described above.
Operating loss
The Fluids Systems segment incurred an operating loss of $19.0 million for 2021, reflecting a $47.4 million improvement from the $66.4 million operating loss incurred in 2020. The Fluids Systems segment operating loss for 2021 includes $5.5 million of charges primarily related to self-insured costs associated with Hurricane Ida damage to our Fourchon, Louisiana Fluids Systems operating base, facility exit, and severance costs, and the operating loss for 2020 included $28.6 million of charges, consisting of $11.7 million for the recognition of cumulative foreign currency translation losses related to the substantial liquidation of our subsidiary in Brazil and $16.9 million of total charges associated with inventory write-downs, severance costs, fixed asset impairments, and facility exit costs. The remaining improvement in the operating loss includes a $20.1 million benefit from North America operations and a $4.2 million benefit from international operations, reflecting the impact of the revenue improvement described above along with the benefit of cost reduction programs implemented in 2020 and 2021.
Industrial Solutions
Revenues
Total revenues for this segment consisted of the following:
| | | | | | | | | | | | | | | | | | | | | | | |
| | Year Ended December 31, | | 2021 vs 2020 |
| (In thousands) | 2021 | | 2020 | | $ | | % |
| Product sales revenues | $ | 66,796 | | | $ | 29,170 | | | $ | 37,626 | | | 129 | % |
| Rental and service revenues | 118,375 | | | 101,299 | | | 17,076 | | | 17 | % |
| Industrial blending revenues | 8,821 | | | 7,548 | | | 1,273 | | | 17 | % |
| Total Industrial Solutions revenues | $ | 193,992 | | | $ | 138,017 | | | $ | 55,975 | | | 41 | % |
In 2020, customer activity across most end-markets was unfavorably impacted by the COVID-19 pandemic and the related operational restrictions and market uncertainty, causing delays in purchases and project execution. As a result, revenues from product sales, which typically fluctuate based on the timing of mat orders from customers, increased by $37.6 million in 2021, including a favorable impact from pent-up demand following the COVID-19 pandemic as well as our expanding power transmission customer base.
Rental and service revenues increased by $17.1 million in 2021, as delayed purchases and projects resumed, including a $16.4 million increase from power transmission and other industrial markets. The increase from industrial customers reflects our continued expansion into these markets, both in the U.S. and U.K., including an approximately 22% increase in revenues from the power transmission sector.
Operating income
The Industrial Solutions segment generated operating income of $39.7 million for 2021 compared to $13.5 million for 2020, the increase being primarily attributable to the changes in revenues as described above.
Corporate Office
Corporate office expenses increased $3.9 million to $29.5 million for 2021, compared to $25.7 million for 2020. This increase was primarily driven by higher performance-based incentive and stock-based compensation expense, as well as the restoration of certain U.S. salary and retirement benefits, and higher mergers and acquisitions and other legal and professional costs, partially offset by the benefit of cost reduction programs implemented in 2020 and 2021.
Year Ended December 31, 2020 Compared to Year Ended December 31, 2019
Consolidated Results of Operations
Summarized results of operations for 2020 compared to 2019 are as follows:
| | | | | | | | | | | | | | | | | | | | | | | |
| | Year Ended December 31, | | 2020 vs 2019 |
| (In thousands) | 2020 | | 2019 | | $ | | % |
| Revenues | $ | 492,625 | | | $ | 820,119 | | | $ | (327,494) | | | (40) | % |
| Cost of revenues | 473,258 | | | 684,738 | | | (211,480) | | | (31) | % |
| Selling, general and administrative expenses | 86,604 | | | 113,394 | | | (26,790) | | | (24) | % |
| Other operating (income) loss, net | (3,330) | | | 170 | | | (3,500) | | | NM |
| Impairments and other charges | 14,727 | | | 11,422 | | | 3,305 | | | NM |
| Operating income (loss) | (78,634) | | | 10,395 | | | (89,029) | | | NM |
| | | | | | | |
| Foreign currency exchange (gain) loss | 3,378 | | | (816) | | | 4,194 | | | NM |
| Interest expense, net | 10,986 | | | 14,369 | | | (3,383) | | | (24) | % |
| Gain on extinguishment of debt | (419) | | | — | | | (419) | | | NM |
| Income (loss) before income taxes | (92,579) | | | (3,158) | | | (89,421) | | | NM |
| | | | | | | |
| Provision (benefit) for income taxes | (11,883) | | | 9,788 | | | (21,671) | | | NM |
| Net loss | $ | (80,696) | | | $ | (12,946) | | | $ | (67,750) | | | NM |
Revenues
Revenues decreased 40% to $492.6 million for 2020, compared to $820.1 million for 2019. This $327.5 million decrease includes a $263.8 million (43%) decrease in revenues in North America, comprised of a $200.4 million decrease in the Fluids Systems segment and a $63.4 million decrease in the Industrial Solutions segment. Revenues from our North America operations decreased primarily due to the 52% reduction in North American rig count. Revenues from our international operations decreased by $63.7 million (31%), primarily driven by activity disruptions and project delays resulting from the COVID-19 pandemic as well as lower oil prices.Africa. Additional information regarding the change in revenues is provided within the operating segment results below.
Cost of revenues
Cost of revenues decreased 31%12% to $473.3$611.1 million for 2020,2023, compared to $684.7$694.1 million for 2019.2022 which included $90.7 million of cost of revenues from divested business units. This $211.5$83.0 million decrease in cost of revenues was primarily driven by the 40%8% decrease in revenues described above. Fluids Systemsabove, as well as the impact of segment costrevenue mix, with Industrial Solutions representing a higher proportion of revenues for 2020 and 2019 includes $14.1 million and $6.8 million, respectively, of total charges related2023, as compared to inventory write-downs, severance costs, and facility exit costs.the prior year.
Selling, general and administrative expenses
Selling, general and administrative expenses decreased $26.8increased $3.5 million to $86.6$101.1 million for 2020,2023, compared to $113.4$97.6 million for 2019. The 2019 expenses included a $4.0 million charge for stock-based compensation expense associated with the February 2019 retirement policy modification and $3.9 million in professional fees related to our long-term strategic planning project and the Cleansorb acquisition. The remaining decrease of $18.9 million2022. This increase was primarily driven by reduced personnela $1.9 million increase in severance costs and lower spendinga $1.4 million increase in expenses related to legal matters in 2020.strategic planning projects. Selling, general and administrative expenses as a percentage of revenues was 17.6%13.5% for 20202023 compared to 13.8%12.0% for 2019.2022. Selling, general and administrative expenses in 2022 included $1.8 million of costs within divested business units.
Other operating (income) loss,income, net
Other operating income, net for 20202023 primarily relates toreflects gains on salesand losses associated with the sale of assets, including a $1.3assets previously used in divested businesses, as well as lease income on office space from third-party lessees. Other operating income, net for 2022 includes $3.6 million gain related to our exit from Brazil.of total gains on divestitures, including $2.6 million in the Industrial Blending segment for the sale of the Conroe, Texas blending facility and $1.0 million in the Fluids Systems segment for the Excalibar sale. See Note 2 for additional details.
Impairments and other charges
For 2023, the Fluids Systems segment includes $5.6 million of non-cash charges for 2020 consisting of $11.7long-lived asset impairments and inventory write-downs, as well as an $0.8 million non-cash charge for the recognitionreclassification of cumulative foreign currency translation losses related to the substantial liquidation of our subsidiary in Brazil, as well as $3.0 million attributable toChile.
For 2022, the abandonment of certain property, plant and equipment. Fluids Systems segment for 2019 includes an $11.4included $29.4 million of total non-cash impairment charges related to the long-lived assets and inventory associated with the exit of our Gulf of Mexico operations. In addition, the Industrial Blending segment included a $7.9 million non-cash impairment charge to write-off the goodwill related to the process to sell the assets previously used in this now exited business.
Foreign currency exchange
Foreign currency exchange was a $3.4$0.3 million loss for 20202023 compared to a $0.8$0.4 million gainloss for 20192022, and reflects the impact of currency translation onfor assets and liabilities (including intercompany balances) that are denominated in currencies other than functional currencies.
Interest expense, net
Interest expense was $11.0$8.2 million for 20202023 compared to $14.4$7.0 million for 2019. Interest expense for 2020 and 2019 includes $5.2 million and $6.2 million, respectively, in noncash amortization of original issue discount and debt issuance costs.2022. The decreaseincrease in interest expense is primarily due to lower debt balances as well asan increase in benchmark borrowing rates partially offset by a decrease in interest rates on the ABL Facility.
Gain on extinguishment ofaverage debt
The $0.4 million gain for 2020 reflects the difference in the amount paid and the net carrying value of the extinguished debt, including original issue discount and debt issuance costs, related to the repurchase of $33.1 million of our Convertible Notes in the open market for $29.1 million. outstanding.
Provision (benefit) for income taxes
The benefitprovision for income taxes was $11.9$10.7 million for 2020,2023, reflecting an effective tax benefit rate of 13%42%. This resultThe 2023 provision primarily reflects income taxes associated with our international operations, including the impact of the $11.7 million non-cash recognition of cumulative foreign currency translation losses related to the substantial liquidation of our subsidiary in Brazil and other nondeductible expenses, as well as the impact offrom the geographic composition of our pretax loss, where theearnings, and was unfavorably impacted by losses in certain international jurisdictions in which we are unable to recognize a related tax benefit, from losses in the U.S was partially offset by the tax expense relatedbenefit associated with a partial valuation allowance release to earnings from our international operations. For 2019, therecognize a portion of previously unbenefited U.S. net operating losses. The provision for income taxes was $9.8$4.4 million despite reporting a small pretax loss for 2022, which included an income tax benefit of $3.1 million related to the year. This resultrestructuring of certain subsidiary legal entities within Europe, as the undistributed earnings for an international subsidiary are no longer subject to certain taxes upon future distribution. The 2022 provision for income taxes primarily reflects the impact of the $11.4 million non-deductible goodwill impairment and other nondeductible expenses, as well as the impact offrom the geographic composition of our pretax loss, whereearnings and was unfavorably impacted as we are unable to recognize a tax expensebenefit related to earnings from our international operations is only partially offset by the tax benefit from losses$37.3 million in the U.S.
Operating Segment Results
Summarized financial information for our reportable segments is shown in the following table (net of inter-segment transfers):
| | | | Year Ended December 31, | | 2020 vs 2019 | | Year Ended December 31, | | 2023 vs 2022 |
| (In thousands) | (In thousands) | 2020 | | 2019 | | $ | | % | (In thousands) | 2023 | | 2022 | | $ | | % |
| Revenues | Revenues | | | | | | | | Revenues | | | | | | | |
| Fluids Systems | Fluids Systems | $ | 354,608 | | | $ | 620,317 | | | $ | (265,709) | | | (43) | % | Fluids Systems | $ | 541,952 | | | $ | | $ | 622,601 | | | $ | | $ | (80,649) | | | (13) | | (13) | % |
| Industrial Solutions | Industrial Solutions | 138,017 | | | 199,802 | | | (61,785) | | | (31) | % | Industrial Solutions | 207,648 | | | 192,993 | | 192,993 | | | 14,655 | | 14,655 | | | 8 | | 8 | % |
| Industrial Blending | | Industrial Blending | — | | | — | | | — | | | — | % |
| Total revenues | Total revenues | $ | 492,625 | | | $ | 820,119 | | | $ | (327,494) | | | (40) | % | Total revenues | $ | 749,600 | | | $ | | $ | 815,594 | | | $ | | $ | (65,994) | | | (8) | | (8) | % |
| | Operating income (loss) | Operating income (loss) | | | | | | | |
| Operating income (loss) | |
| Operating income (loss) | | | | | | |
| Fluids Systems | Fluids Systems | $ | (66,403) | | | $ | 3,814 | | | $ | (70,217) | | | | Fluids Systems | $ | 11,857 | | | $ | | $ | (15,566) | | | $ | | $ | 27,423 | | | | | |
| Industrial Solutions | Industrial Solutions | 13,459 | | | 47,466 | | | (34,007) | | | | Industrial Solutions | 53,008 | | | 43,899 | | 43,899 | | | 9,109 | | 9,109 | | | | | |
| Industrial Blending | |
| Corporate office | |
| Corporate office | |
| Corporate office | Corporate office | (25,690) | | | (40,885) | | | 15,195 | | | | (31,235) | | | (29,365) | | (29,365) | | | (1,870) | | (1,870) | | | | | |
| Total operating income (loss) | Total operating income (loss) | $ | (78,634) | | | $ | 10,395 | | | $ | (89,029) | | | | Total operating income (loss) | $ | 33,630 | | | $ | | $ | (9,034) | | | $ | | $ | 42,664 | | | | | |
| | Segment operating margin | Segment operating margin | | | | | | | |
| Segment operating margin | |
| Segment operating margin | | | | |
| Fluids Systems | Fluids Systems | (18.7) | % | | 0.6 | % | | | | | Fluids Systems | 2.2 | % | | (2.5) | % | | |
| Industrial Solutions | Industrial Solutions | 9.8 | % | | 23.8 | % | | | | | Industrial Solutions | 25.5 | % | | 22.7 | % | | |
Fluids Systems
Revenues
Total revenues for this segment consisted of the following:
| | | | | | | | | | | | | | | | | | | | | | | |
| | Year Ended December 31, | | 2023 vs 2022 |
| (In thousands) | 2023 | | 2022 | | $ | | % |
| United States | $ | 215,410 | | | $ | 355,435 | | | $ | (140,025) | | | (39) | % |
| Canada | 68,143 | | | 61,069 | | | 7,074 | | | 12 | % |
| Total North America | 283,553 | | | 416,504 | | | (132,951) | | | (32) | % |
| | | | | | | |
| EMEA | 238,479 | | | 185,298 | | | 53,181 | | | 29 | % |
| Other | 19,920 | | | 20,799 | | | (879) | | | (4) | % |
| Total International | 258,399 | | | 206,097 | | | 52,302 | | | 25 | % |
| | | | | | | |
| Total Fluids Systems revenues | $ | 541,952 | | | $ | 622,601 | | | $ | (80,649) | | | (13) | % |
North America revenues decreased 32% to $283.6 million for 2023, compared to $416.5 million for 2022, primarily related to the divested business units as well as a decline in U.S. land activity. For 2022, U.S. revenues included $56.0 million from the U.S. mineral grinding business and $26.7 million from offshore Gulf of Mexico, which were exited in 2022. Revenues from U.S. land decreased $57.3 million, primarily as a result of lower market share and reduced market activity. In addition, Canada revenues increased $7.1 million driven primarily by elevated product consumption per rig partially offset by a slight decline in market share, which typically fluctuates based on customer mix and timing of projects.
International revenues increased 25% to $258.4 million for 2023, compared to $206.1 million for 2022. The increase was primarily driven by higher customer activity and elevated product consumption per rig in Europe and Africa.
Operating income (loss)
The Fluids Systems segment generated operating income of $11.9 million for 2023 compared to an operating loss of $15.6 million incurred for 2022. The Fluids Systems segment operating income for 2023 includes $12.7 million in total charges for certain impairments, facility exit, severance costs, and transaction related expenses for the ongoing Fluids Systems segment sale process. The Fluids Systems segment operating loss for 2022 included $29.4 million of total non-cash impairment charges, as well as operating losses of $10.1 million related to the divested business units. Excluding these items, the $0.7 million improvement in operating income primarily reflects the impact of the increase in revenues in EMEA and benefits of strategic actions and cost reduction efforts in the U.S., substantially offset by the decrease in U.S. revenues.
Industrial Solutions
Revenues
Total revenues for this segment consisted of the following:
| | | | | | | | | | | | | | | | | | | | | | | |
| | Year Ended December 31, | | 2023 vs 2022 |
| (In thousands) | 2023 | | 2022 | | $ | | % |
| Rental and service revenues | $ | 149,954 | | | $ | 134,301 | | | $ | 15,653 | | | 12 | % |
| Product sales revenues | 57,694 | | | 58,692 | | | (998) | | | (2) | % |
| Total Industrial Solutions revenues | $ | 207,648 | | | $ | 192,993 | | | $ | 14,655 | | | 8 | % |
Rental and service revenues increased by 12% for 2023, primarily reflecting increases in rental volume and service revenues, and was driven by our continued market penetration across all major industries served in the U.S. Product sales revenues decreased slightly for 2023, with continued strong demand across sectors, including utilities. Product sales typically fluctuate based on the timing of customer projects and orders.
Operating income
The Industrial Solutions segment generated operating income of $53.0 million for 2023 compared to $43.9 million for 2022, the increase being primarily attributable to incremental profitability associated with revenue growth, including the effects of improved operating cost leverage from increased manufacturing, rental, and service activity.
Industrial Blending
As described above, the Industrial Blending operating loss for 2022 included a $7.9 million non-cash charge for the impairment of the long-lived assets as well as exit and other costs related to the process to sell these assets, partially offset by a $2.6 million gain subsequently recognized upon the eventual sale in the fourth quarter of 2022.
Corporate Office
Corporate office expenses increased to $31.2 million for 2023, compared to $29.4 million for 2022. Corporate office expenses for 2023 includes approximately $2.9 million of expenses related to strategic planning projects, including $1.2 million of transaction related expenses for the ongoing Fluids Systems segment sale process, as well as $1.2 million of severance costs, while 2022 included $1.1 million associated with shareholder matters and acquisition and divestiture efforts.
Year Ended December 31, 2022 Compared to Year Ended December 31, 2021
Consolidated Results of Operations
Summarized results of operations for 2022 compared to 2021 are as follows:
| | | | | | | | | | | | | | | | | | | | | | | |
| | Year Ended December 31, | | 2022 vs 2021 |
| (In thousands) | 2022 | | 2021 | | $ | | % |
| Revenues | $ | 815,594 | | | $ | 614,781 | | | $ | 200,813 | | | 33 | % |
| Cost of revenues | 694,058 | | | 529,552 | | | 164,506 | | | 31 | % |
| Selling, general and administrative expenses | 97,618 | | | 94,445 | | | 3,173 | | | 3 | % |
| Other operating income, net | (4,370) | | | (391) | | | (3,979) | | | NM |
| Impairments and other charges | 37,322 | | | — | | | 37,322 | | | NM |
| Operating loss | (9,034) | | | (8,825) | | | (209) | | | (2) | % |
| | | | | | | |
| Foreign currency exchange (gain) loss | 389 | | | (397) | | | 786 | | | NM |
| Interest expense, net | 7,040 | | | 8,805 | | | (1,765) | | | (20) | % |
| Loss on extinguishment of debt | — | | | 1,000 | | | (1,000) | | | NM |
| Loss before income taxes | (16,463) | | | (18,233) | | | 1,770 | | | 10 | % |
| | | | | | | |
| Provision for income taxes | 4,371 | | | 7,293 | | | (2,922) | | | NM |
| Net loss | $ | (20,834) | | | $ | (25,526) | | | $ | 4,692 | | | 18 | % |
Revenues
Revenues increased 33% to $815.6 million for 2022, compared to $614.8 million for 2021. This $200.8 million increase includes a $146.2 million (32%) increase in revenues in North America, comprised of a $141.2 million increase in the Fluids Systems segment and a $13.7 million increase in the Industrial Solutions segment, partially offset by a $8.8 million decrease in the Industrial Blending segment, which we exited in 2022. Revenues from our North America operations increased primarily due to the improvement in North America rig count, which favorably impacted our Fluids Systems segment, and an increase in rental and service revenues in our Industrial Solutions segment. Revenues from our international operations increased by $54.7 million (33%), as the prior year was unfavorably impacted by activity disruptions and project delays resulting from the COVID-19 pandemic, partially offset by a $20.8 million decrease in revenues from currency exchange rate changes resulting from the strengthening U.S. dollar. Consolidated revenues included $82.7 million of revenues from divested business units for 2022, compared to $70.6 million for 2021. Additional information regarding the change in revenues is provided within the Operating Segment Results below.
Cost of revenues
Cost of revenues increased 31% to $694.1 million for 2022, compared to $529.6 million for 2021. This $164.5 million increase was primarily driven by the 33% increase in revenues described above. Consolidated cost of revenues included $90.7 million of cost of revenues from divested business units for 2022, compared to $73.1 million for 2021.
Selling, general and administrative expenses
Selling, general and administrative expenses increased $3.2 million to $97.6 million for 2022, compared to $94.4 million for 2021. This increase was primarily driven by higher personnel expense, as well as higher legal and professional expenses. Selling, general and administrative expenses as a percentage of revenues was 12.0% for 2022 compared to 15.4% for 2021. Consolidated selling, general and administrative expenses included $1.8 million of costs related to divested business units for 2022, compared to $2.1 million for 2021.
Other operating income, net
Other operating income, net for 2022 includes $3.6 million of total gains on divestitures, including $2.6 million in the Industrial Blending segment for the sale of the Conroe, Texas blending facility and $1.0 million in the Fluids Systems segment for the Excalibar sale. See Note 2 for additional details. Other operating income, net for 2021 included gains associated with sales of assets, along with insurance and a legal settlement in the Industrial Solutions segment, largely offset by a $2.6 million charge associated with Hurricane Ida in August 2021 that caused damage to our Fourchon, Louisiana Fluids Systems operating base.
Impairments and other charges
As described above, 2022 includes $29.4 million of total non-cash impairment charges related to the long-lived assets and inventory associated with the exit of our Fluids Systems Gulf of Mexico operations, as well as a $7.9 million non-cash impairment charge related to the exit of our Industrial Blending operations.
Foreign currency exchange
Foreign currency exchange was a $0.4 million loss for 2022 compared to a $0.4 million gain for 2021 and reflects the impact of currency translation for assets and liabilities (including intercompany balances) that are denominated in currencies other than functional currencies.
Interest expense, net
Interest expense was $7.0 million for 2022 compared to $8.8 million for 2021. Interest expense for 2022 and 2021 included $0.9 million and $3.7 million, respectively, in non-cash amortization of original issue discount and debt issuance costs. The decrease in interest expense is primarily due to the 2021 repayment of our Convertible Notes using borrowings under the ABL Facility, partially offset by the increase in benchmark borrowing rates as well as an increase in average debt outstanding during 2022, in support of the higher working capital associated with the 33% revenue growth.
Loss on extinguishment of debt
In 2021, we repurchased $28.3 million, respectively, of our Convertible Notes in the open market for $28.1 million. The $1.0 million loss for 2021 reflects the difference in the amount paid and the net carrying value of the extinguished debt, including original issue discount and debt issuance costs.
Provision for income taxes
The provision for income taxes was $4.4 million for 2022, which includes an income tax benefit of $3.1 million related to the restructuring of certain subsidiary legal entities within Europe, as the undistributed earnings for an international subsidiary are no longer subject to certain taxes upon future distribution. The provision for income taxes in 2022 was unfavorably impacted as we are unable to recognize a tax benefit related to the $37.3 million in total impairment charges. The provision for income taxes was $7.3 million for 2021 despite reporting a pretax loss for the period. In both years, income tax expense primarily reflects earnings from our international operations since we are unable to recognize the tax benefit from our U.S. losses as they may not be realized.
Operating Segment Results
Summarized financial information for our reportable segments is shown in the following table (net of inter-segment transfers):
| | | | | | | | | | | | | | | | | | | | | | | |
| | Year Ended December 31, | | 2022 vs 2021 |
| (In thousands) | 2022 | | 2021 | | $ | | % |
| Revenues | | | | | | | |
| Fluids Systems | $ | 622,601 | | | $ | 420,789 | | | $ | 201,812 | | | 48 | % |
| Industrial Solutions | 192,993 | | | 185,171 | | | 7,822 | | | 4 | % |
| Industrial Blending | — | | | 8,821 | | | (8,821) | | | (100) | % |
| Total revenues | $ | 815,594 | | | $ | 614,781 | | | $ | 200,813 | | | 33 | % |
| | | | | | | |
| Operating income (loss) | | | | | | | |
| Fluids Systems | $ | (15,566) | | | $ | (19,012) | | | $ | 3,446 | | | |
| Industrial Solutions | 43,899 | | | 42,117 | | | 1,782 | | | |
| Industrial Blending | (8,002) | | | (2,384) | | | (5,618) | | | |
| Corporate office | (29,365) | | | (29,546) | | | 181 | | | |
| Total operating loss | $ | (9,034) | | | $ | (8,825) | | | $ | (209) | | | |
| | | | | | | |
| Segment operating margin | | | | | | | |
| Fluids Systems | (2.5) | % | | (4.5) | % | | | | |
| Industrial Solutions | 22.7 | % | | 22.7 | % | | | | |
| Industrial Blending | NM | | (27.0) | % | | | | |
Fluids Systems
Revenues
Total revenues for this segment consisted of the following:
| | | | Year Ended December 31, | | 2020 vs 2019 | | Year Ended December 31, | | 2022 vs 2021 |
| (In thousands) | (In thousands) | 2020 | | 2019 | | $ | | % | (In thousands) | 2022 | | 2021 | | $ | | % |
| United States | United States | $ | 202,052 | | | $ | 395,618 | | | $ | (193,566) | | | (49) | % | United States | $ | 355,435 | | | $ | | $ | 227,261 | | | $ | | $ | 128,174 | | | 56 | | 56 | % |
| Canada | Canada | 24,762 | | | 31,635 | | | (6,873) | | | (22) | % | Canada | 61,069 | | | 48,007 | | 48,007 | | | 13,062 | | 13,062 | | | 27 | | 27 | % |
| Total North America | Total North America | 226,814 | | | 427,253 | | | (200,439) | | | (47) | % | Total North America | 416,504 | | | 275,268 | | 275,268 | | | 141,236 | | 141,236 | | | 51 | | 51 | % |
| | EMEA | EMEA | 115,891 | | | 172,263 | | | (56,372) | | | (33) | % |
| EMEA | |
| EMEA | | 185,298 | | | 132,221 | | | 53,077 | | | 40 | % |
| Other | Other | 11,903 | | | 20,801 | | | (8,898) | | | (43) | % | Other | 20,799 | | | 13,300 | | 13,300 | | | 7,499 | | 7,499 | | | 56 | | 56 | % |
| Total International | Total International | 127,794 | | | 193,064 | | | (65,270) | | | (34) | % | Total International | 206,097 | | | 145,521 | | 145,521 | | | 60,576 | | 60,576 | | | 42 | | 42 | % |
| | Total Fluids Systems revenues | Total Fluids Systems revenues | $ | 354,608 | | | $ | 620,317 | | | $ | (265,709) | | | (43) | % |
| Total Fluids Systems revenues | |
| Total Fluids Systems revenues | | $ | 622,601 | | | $ | 420,789 | | | $ | 201,812 | | | 48 | % |
North America revenues decreasedincreased 47%51% to $226.8$416.5 million for 2020,2022, compared to $427.3$275.3 million for 2019. This decrease was primarily attributable to2021. The increase includes a $200.3$126.7 million decreaseincrease from U.S. land markets driven primarily by the 54% decline52% increase in U.S. rig count, partially offset by a $4.0lower market share, while offshore Gulf of Mexico increased $1.3 million. In addition, Canada revenues increased $13.1 million driven primarily by the 34% increase in Canada rig count. For 2022, U.S. revenues included $328.4 million from land markets, including $56.0 million from the Excalibar business, and $26.7 million from offshore Gulf of Mexico, which benefited from our completion fluids product line extension.Mexico. For 2020,2021, U.S. revenues included $150.2$201.9 million from land markets, including $36.4 million from the Excalibar business, and $48.5$25.4 million from offshore Gulf of Mexico.
Internationally, revenues decreased 34%increased 42% to $127.8$206.1 million for 2020,2022, compared to $193.1$145.5 million for 2019.2021. The decrease in EMEAincrease was primarily driven by lowerhigher activity primarily attributable to COVID-19 disruptionsin Europe, Africa, and the Asia Pacific region following a significant impact of lower oil prices in Algeria, Romania, and various other countries,2021 from the COVID-19 pandemic, as described above, partially offset by the October 2019 acquisition of Cleansorb. Thea $19.3 million decrease in other international was primarily attributable to lower activity in Australia, including the completion of the Baker Hughes Greater Enfield project in the third quarter of 2019.revenues from currency exchange rate changes.
Operating income (loss)loss
The Fluids Systems segment incurred an operating loss of $66.4$15.6 million for 2020, reflecting a $70.2 million change from the $3.82022, which includes $29.4 million of total non-cash impairment charges, compared to a $19.0 million operating income generatedloss incurred in 2021. The Fluids Systems segment operating loss for 2019.2022 includes $1.4 million of charges primarily related to facility exit and severance costs, and the operating loss for 2021 included $5.5 million of charges primarily related to self-insured costs associated with Hurricane Ida damage to our Fourchon, Louisiana Fluids Systems operating base, facility exit, and severance costs. The decreasechange in operating incomeloss includes a $41.6$33.3 million declineimprovement from North American operations andAmerica land markets (reflecting an incremental margin of 24%) along with a $18.8$6.9 million declineimprovement from international operations which are(reflecting an incremental margin of 11%), driven primarily attributable toby the changes in revenuesrevenue improvement described above, partially offset by the benefit of cost reduction programs implemented
in 2020. The Fluids Systems operating loss for 2020 also includes $28.6a $36.5 million of charges, consisting of $11.7 milliondecline for the recognitionGulf of cumulative foreign currency translation losses related toMexico (including impairments). The international operating results reflect the substantial liquidationimpact of our subsidiaryinflationary cost pressures from certain international contracts in Brazil and $16.9 million of total charges associated with inventory write-downs, severance costs, fixed asset impairments, and facility exit costs. The Fluids Systems operating loss for 2019 included $18.8 million of charges, consisting of an $11.4 million non-cash impairment of goodwill and $7.4 million of total charges associated with facility closures and related exit costs, inventory write-downs, and severance costs, as well as the modification of the Company’s retirement policy.which customer pricing is fixed.
Industrial Solutions
Revenues
Total revenues for this segment consisted of the following:
| | | | Year Ended December 31, | | 2020 vs 2019 | | Year Ended December 31, | | 2022 vs 2021 |
| (In thousands) | (In thousands) | 2020 | | 2019 | | $ | | % | (In thousands) | 2022 | | 2021 | | $ | | % |
| Product sales revenues | Product sales revenues | $ | 29,170 | | | $ | 56,465 | | | $ | (27,295) | | | (48) | % | Product sales revenues | $ | 58,692 | | | $ | | $ | 66,796 | | | $ | | $ | (8,104) | | | (12) | | (12) | % |
| Rental and service revenues | Rental and service revenues | 101,299 | | | 143,337 | | | (42,038) | | | (29) | % | Rental and service revenues | 134,301 | | | 118,375 | | 118,375 | | | 15,926 | | 15,926 | | | 13 | | 13 | % |
| Industrial blending revenues | 7,548 | | | — | | | 7,548 | | | NM |
| Total Industrial Solutions revenues | Total Industrial Solutions revenues | $ | 138,017 | | | $ | 199,802 | | | $ | (61,785) | | | (31) | % | Total Industrial Solutions revenues | $ | 192,993 | | | $ | | $ | 185,171 | | | $ | | $ | 7,822 | | | 4 | | 4 | % |
TheRevenues from product sales decreased by $8.1 million from 2021, as 2021 was favorably impacted by pent-up customer demand following the delays in purchases and project execution associated with the COVID-19 pandemic resulted in delays to planned projects across customer industries in 2020.pandemic. Rental and service revenues decreased 29% to $101.3 million for 2020, which includes a $43.6 million decreaseincreased by 13% from E&P customers, primarily resulting from lower2021, as continued market penetration of the power transmission sector in the U.S. activity caused by the decline in oil and natural gas prices. This decline was partially offset by a $1.6 million increase from our continued expansion into non-E&P markets, including a 9% increaselower activity in revenues from the electrical utility sector, which benefited from increased demand to support repairs of hurricane-damaged utility infrastructure along the U.S. Gulf Coast region. Revenues from product sales, which typically fluctuate based on the timing of mat orders from customers, was negatively impacted in 2020 as certain customers delayed orders due to the uncertainty related to the COVID-19 pandemic.U.K.
Operating income
The Industrial Solutions segment generated operating income of $13.5$43.9 million for 20202022 compared to $47.5$42.1 million for 2019, the decrease being2021. The 2021 operating results included a $1.0 million gain associated with a legal settlement. The remaining $2.8 million increase is primarily attributable to the changegrowth in revenues described above, partially offset by the effects of lower average pricing associated with large scale rental projects.
Industrial Blending
We completed the wind down of the Industrial Blending business and the sale of the associated warehouse facility and related equipment in 2022, as described above. The operating loss for 2022 includes a $7.9 million non-cash charge for the impairment of the long-lived assets as well as exit and other costs related to the process to sell these assets, partially offset by a $2.6 million gain subsequently recognized upon the eventual sale in the fourth quarter of 2022.
Corporate Office
Corporate office expenses decreased $15.2 millionslightly to $25.7$29.4 million for 20202022 compared to $40.9$29.5 million for 2019. The 2019 expenses included a $3.4 million charge for2021. This decrease was primarily driven by lower stock-based compensation expense associated with the February 2019 retirement policy modificationpartially offset by higher performance-based incentives and $3.9 million in professional fees related to our long-term strategic planning project and the Cleansorb acquisition. The remaining decrease of $7.9 million is primarily driven by reduced personnel costs and lower spending related to legal matters in 2020.expense.
Liquidity and Capital Resources
Net cash provided by operating activities was $100.0 million for 2023 compared to net cash used in operating activities was $3.0of $25.0 million for 2021 compared to $55.8 million of2022. During 2023, net cash provided by operating activities for 2020. Net lossincome adjusted for non-cash items provided cash of $20.8$57.2 million for 2021, reflecting a $43.7 million improvement from 2020 which was more than offset by a net increase in working capital. In 2020,and changes in working capital provided cash of $78.7 million, including $71.0 million$42.8 million. The cash provided by reductions in work working capital was primarily driven by Fluids Systems segment reductions in U.S. land, along with the wind down of retained working capital associated with a decrease in receivables attributable to the decline in revenues. In 2021, changes in working capital used cash of $23.8 million, including a $61.3 million increase in receivables, attributable to the increase in revenues.fourth quarter 2022 divestiture transactions.
Net cash used in investing activities was $17.5$5.7 million for 2021,2023, including $29.2 million in capital expenditures partially offset by $19.8 million in proceeds received related to our fourth quarter of $21.8 million and $13.4 million associated with the Lentzcaping acquisition2022 divestitures (see Note 2 for additional information), partially offset by $16.0as well as $3.7 million in proceeds from the sale of assets. The majority of the proceeds fromassets, which includes the sale of assets reflect used mats from our Industrial Solutions rental fleet, which are a part of the commercial offering of our Site and Access Solutions business. Nearly allfleet. The substantial majority of our capital expenditures during 2021 were directed to supportingexpanding our Industrial Solutions segment including $14.3 million of investments in the mat rental fleet, replacing mats sold from the fleet and supporting our strategic growth in the power transmission sector.fleet. Net cash used inprovided by investing activities was $3.4$46.2 million for 2020, including capital expenditures of $15.82022, which included $71.3 million partially offset by $12.4in proceeds from 2022 divestitures as well as $3.2 million in proceeds from the sale of assets. Capitalassets, partially offset by capital expenditures during 2020 included $7.8 million for the Industrial Solutions segment, including investments in the mat rental fleet as well as new products, and $6.2 million for the Fluids Systems segment.of $28.3 million.
Net cash provided byused in financing activities was $21.4$81.0 million for 2021,2023, which primarily includes $77.6$47.4 million ofin net borrowingsrepayments on our Amended ABL Facility and foreign lines of credit, $8.1 million of net proceeds from a U.K. term loan facility, and $7.9 million of net proceeds from sale-leaseback transactions accounted for asother financing arrangements partially offset by $66.7and $32.0 million in share purchases under our repurchase program. Net cash used in financing activities was $24.9 million for repurchases and repayment of2022, which included $17.6 million in share purchases under our Convertible Notes. We repaid the Convertible Notes at maturity in December 2021 with borrowings under the ABL Facility.repurchase program.
Substantially all our $24.1$38.6 million of cash on hand at December 31, 20212023 resides in our international subsidiaries. Subject to maintaining sufficientWe primarily manage our liquidity utilizing availability under our Amended ABL Facility and other existing financing arrangements. Under our Amended ABL Facility, we manage daily cash requirements by utilizing borrowings or repayments under this revolving credit facility, while maintaining minimal cash on hand in the U.S. As of February 22, 2024, our total borrowing availability under the Amended ABL Facility was $116.8 million, of which $45.6 million was drawn and $4.0 million was used for outstanding letters of credit, resulting in remaining availability of $67.2 million.
We expect total availability under the Amended ABL Facility to supportfluctuate directionally based on the strategic objectiveslevel of theseeligible U.S. accounts receivable, inventory, and composite mats included in the rental fleet. We expect the projected availability under our Amended ABL Facility and other existing financing arrangements, cash generated by operations, and available cash on-hand in our international subsidiaries and complying with applicable exchange or cash controls, we expect to continuebe adequate to repatriate available cash from these international subsidiaries. fund our current operations during the next 12 months.
We anticipate that futureour near-term working capital requirements for our operations will generally fluctuate directionally with revenues. We expect capital expenditures in 2024 will remain fairly in line with 2023 levels, with spending heavily focused on industrial end-market opportunities, primarily reflectingthe expansion of our mat rental fleet to further support our growth in the utilities market.
Availability under our ABL Facility also provides additional liquidity as discussed further below. Total availability under the ABL Facility will fluctuate directionally based on the level of eligible U.S. accounts receivable, inventory, and, subject to satisfaction of certain financial covenants as described below, composite mats included in the rental fleet. We also expect to return value to our availableshareholders, utilizing excess cash generation to fund additional share repurchases. In addition, if we are successful in completing the process to substantially exit the Fluids Systems business, we anticipate the proceeds to be used to repay a substantial portion of our existing outstanding debt and increase our cash on-hand, cash generated by operations, and the expected availability under our ABL Facility and other existing financing arrangements to be adequateproviding additional liquidity to fund our current operations duringlong-term strategic initiatives.
Our capitalization is as follows:
| | | | | | | | | | | |
| (In thousands) | December 31, 2023 | | December 31, 2022 |
| Amended ABL Facility | $ | 45,000 | | | $ | 80,300 | |
| Other debt | 30,093 | | | 33,949 | |
| Unamortized discount and debt issuance costs | (60) | | | (134) | |
| Total debt | $ | 75,033 | | | $ | 114,115 | |
| | | |
| Stockholders’ equity | 415,364 | | | 423,028 | |
| Total capitalization | $ | 490,397 | | | $ | 537,143 | |
| | | |
| Total debt to capitalization | 15.3 | % | | 21.2 | % |
Asset-Based Loan Facility. In October 2017, we entered into a U.S. asset-based revolving credit agreement, which was amended in March 2019 and amended and restated in May 2022 (the “Amended ABL Facility”). The Amended ABL Facility provides financing of up to $175.0 million available for borrowings (inclusive of letters of credit), which can be increased up to $250.0 million, subject to certain conditions. The Amended ABL Facility has a five-year term expiring May 2027, is based on a Bloomberg Short-Term Bank Yield Index (“BSBY”) pricing grid, and includes a mechanism to incorporate a sustainability-linked pricing framework with the next 12 months.
In February 2022, we initiated a plan to wind down our Industrial Blending operations and pursue the saleconsent of the industrial blending and warehouse facility and related equipment, and also maderequired lenders (as defined in the decision to explore strategic options for our U.S. mineral grinding business. Although the timing of any such transactions is not determinable, we expect to use any proceeds for general corporate purposes in support of our strategic initiatives. We also continue to evaluate additional sources of liquidity to support our longer-term needs.
Our capitalization is as follows:
| | | | | | | | | | | |
| (In thousands) | December 31, 2021 | | December 31, 2020 |
| Convertible Notes | $ | — | | | $ | 66,912 | |
| ABL Facility | 86,500 | | | 19,100 | |
| Other debt | 28,491 | | | 5,371 | |
| Unamortized discount and debt issuance costs | (188) | | | (4,221) | |
| Total debt | $ | 114,803 | | | $ | 87,162 | |
| | | |
| Stockholders’ equity | 462,386 | | | 488,032 | |
| Total capitalization | $ | 577,189 | | | $ | 575,194 | |
| | | |
| Total debt to capitalization | 19.9 | % | | 15.2 | % |
Asset-Based Loan Facility. In May 2016, we entered into an asset-based revolving credit agreement, which was amended in October 2017 and in March 2019 (as amended, the “ABL Facility”). The ABL Facility provides financing of up to $200.0 million available for borrowings (inclusive of letters of credit) and can be increased up to a maximum capacity of $275.0 million, subject to certain conditions. The ABL Facility terminates in March 2024.
As of December 31, 2021,2023, our total availability under the Amended ABL Facility was $116.3$109.2 million, of which $86.5$45.0 million was drawn and $1.1$4.0 million was used for outstanding letters of credit, resulting in remaining availability of $28.7 million. As of February 24, 2022, our total availability under the ABL Facility was $124.7 million, of which $83.7 million was drawn and $1.1 million was used for outstanding letters of credit, resulting in remaining availability of $39.9$60.2 million.
Borrowing availability under the Amended ABL Facility is calculated based on eligible U.S. accounts receivable, inventory and subject to satisfaction of certain financial covenants as described below, composite mats included in the rental fleet, net of reserves and subject to limits on suchcertain of the assets included in the borrowing base calculation. To the extent pledged by us,the borrowers, the borrowing base calculation also includes the amount of eligible pledged cash. The lenderadministrative agent may establish such reserves in accordance with the Amended ABL Facility, in part based on appraisals of the asset base, and other limits atin its discretion, which could reduce the amounts otherwise available under the Amended ABL Facility. Availability associated with eligible rental mats will also be subject to maintaining a minimum consolidated fixed charge coverage ratio of 1.5 to 1.0 and at least $1.0 million of operating income for the Site and Access Solutions business, each calculated based on a trailing twelve-month period.
Under the terms of the Amended ABL Facility, we may elect to borrow at a variable interest rate based on either, (1) LIBOR subjectthe BSBY rate (subject to a floor of zerozero) or (2) athe base rate (subject to a floor of zero), equal to the highest of:of (a) the federal funds rate plus 50 basis points,0.50%, (b) the prime rate of Bank of America, N.A., and (c) LIBOR, subject toBSBY for a floor of zero,one-month interest period plus 100 basis points,1.00%, plus, in each case, an applicable margin per annum. The applicable margin ranges from 1501.50% to 200 basis points2.00% per annum for LIBORBSBY borrowings, and 500.50% to 100 basis points1.00% per annum for base rate borrowings, based on the consolidated fixed charge coverageleverage ratio as(as defined in the Amended ABL Facility. Facility) as of the last day of the most recent fiscal quarter. We are also required to pay a commitment fee equal to (i) 0.375% per annum at any time the average daily unused portion of the commitments is greater than 50% and (ii) 0.25% per annum at any time the average daily unused portion of the commitments is less than 50%.
As of December 31, 2021,2023, the applicable margin for borrowings under ourthe Amended ABL Facility was 150 basis points1.50% with respect to LIBORBSBY borrowings and 50 basis points0.50% with respect to base rate borrowings. TheAs of December 31, 2023, the weighted average interest rate for outstanding borrowings under the Amended ABL Facility was 1.6% at December 31, 2021. In addition, we are required to pay a6.9% and the applicable commitment fee on the unused portion of the Amended ABL Facility ranging from 25 to 37.5 basis points, based on the level of outstanding borrowings, as defined in the ABL Facility. As of December 31, 2021, the applicable commitment fee was 37.5 basis points.0.375% per annum.
The Amended ABL Facility is a senior secured obligation of the Company and certain of our U.S. subsidiaries constituting borrowers thereunder, secured by a first lienspriority lien on substantially all of our U.S. tangiblethe personal property and intangible assets, and a portioncertain real property of the capital stockborrowers, including a first priority lien on certain equity interests of our non-U.S.direct or indirect domestic subsidiaries has also been pledged as collateral. of the borrowers and certain equity interests issued by certain foreign subsidiaries of the borrowers.
The Amended ABL Facility contains customary operatingrepresentations, warranties and covenants and certain restrictions including,that, among other things, those relatingand subject to certain specified circumstances and exceptions, restrict or limit the incurrenceability of additional debt,the borrowers and certain of their subsidiaries to incur indebtedness (including guarantees), grant liens, make investments, pay dividends asset sales, investments, mergers, acquisitions, affiliate transactions,or distributions with respect to capital stock repurchases and make other restricted payments. payments, make prepayments on certain indebtedness, engage in mergers or other fundamental changes, dispose of property, and change the nature of their business.
The Amended ABL Facility also requires compliance with the following financial covenants: (i) a minimum consolidated fixed charge coverage ratio of 1.01.00 to 1.0 calculated based on1.00 for the most recently completed four fiscal quarters and (ii) while a trailing twelve-monthleverage covenant trigger period if availability under(as defined in the Amended ABL Facility) is in effect, a maximum consolidated leverage ratio of 4.00 to 1.00 as of the last day of the most recently completed fiscal quarter.
The Amended ABL Facility falls below $22.5 million. In addition, the ABL Facility containsincludes customary events of default including without limitation, a failurenon-payment of principal, interest or fees, violation of covenants, inaccuracy of representations or warranties, cross-default to make payments under the facility, accelerationother material indebtedness, bankruptcy and insolvency events, invalidity or impairment of more than $25.0 millionsecurity interests or invalidity of other indebtedness,loan documents, certain bankruptcyERISA events, unsatisfied or unstayed judgments and certain change of control events.control.
Other Debt.Financing Arrangements. Certain of our foreign subsidiaries maintain local credit arrangements consisting primarily of lines of credit or overdraft facilities which are generally renewed on an annual basis. We utilize local financing arrangements in our foreign operations in order to provide short-term local liquidity needs. In addition, in April 2022, a U.K. subsidiary entered a £7.0 million term loan and a £2.0 million revolving credit facility. Both the term loan and revolving credit facility mature in April 2025 and bear interest at a rate of Sterling Overnight Index Average plus a margin of 3.25% per year. As of December 31, 2023, the interest rate for the U.K. facilities was 8.7%. The term loan is payable in quarterly installments of £350,000 plus interest beginning June 2022 and a £2.8 million payment due at maturity. We also maintain finance leases primarily related to transportation equipment.
In August 2021, we completed sale-leaseback transactions related to certain vehicles and other equipment for net proceeds of approximately $7.9 million. The transactions have been accounted for as financing arrangements as they did not qualify for sale accounting. As a result, the vehicles and other equipment continue to be reflected on our balance sheet in property, plant and equipment, net. The financing arrangements have a weighted average annual interest rate of 5.4% and are payable in monthly installments with varying maturities through October 2025. We had $6.7 million in financing obligations outstanding under these arrangements at December 31, 2021.
In February 2021, a U.K. subsidiary entered a £6.0 million (approximately $8.3 million) term loan facility that matures in February 2024. The term loan bears interest at a rate of LIBOR plus a margin of 3.4% per year, payable in quarterly installments of £375,000 plus interest beginning March 2021 and a £1.5 million payment due at maturity. Effective January 1, 2022, the term loan bears interest at a rate of SONIA plus a margin of 3.5% per year. We had $6.1 million outstanding under this arrangement at December 31, 2021.
Certain of our foreign subsidiaries maintain local credit arrangements consisting primarily of lines of credit or overdraft facilities which are generally renewed on an annual basis. We utilize local financing arrangements in our foreign operations in order to provide short-term local liquidity needs. We had $11.8 million and $3.5 million outstanding under these arrangements at December 31, 2021 and 2020, respectively.
Off-Balance Sheet Arrangements
We do not have any special purpose entities. At December 31, 2021,2023, we had $45.3$39.8 million in outstanding letters of credit, performance bonds, and other guarantees for which certain of the letters of credit are collateralized by $5.4$0.3 million in restricted cash. We also enter into normal short-term operating leases for office and warehouse space, as well as rolling stock and other pieces ofcertain operating equipment. None of these off-balance sheet arrangements either has, or is expected to have, a material effect on our financial statements.
Contractual Obligations
A summary of our outstanding contractual and other obligations and commitments at December 31, 20212023 is as follows:
| | (In thousands) | (In thousands) | 2022 | | 2023 | | 2024 | | 2025 | | 2026 | | Thereafter | | Total | (In thousands) | 2024 | | 2025 | | 2026 | | 2027 | | 2028 | | Thereafter | | Total |
| ABL Facility | $ | — | | | $ | — | | | $ | 86,500 | | | $ | — | | | $ | — | | | $ | — | | | $ | 86,500 | |
| Amended ABL Facility | |
| Other debt | Other debt | 15,334 | | | 2,031 | | | 2,715 | | | — | | | — | | | — | | | 20,080 | |
Financing obligation (1) | Financing obligation (1) | 3,436 | | | 2,359 | | | 1,090 | | | 169 | | | — | | | — | | | 7,054 | |
Finance lease liabilities (1) | Finance lease liabilities (1) | 722 | | | 587 | | | 325 | | | 156 | | | 2 | | | — | | | 1,792 | |
Operating lease liabilities (1) | Operating lease liabilities (1) | 7,678 | | | 5,066 | | | 3,629 | | | 2,999 | | | 2,951 | | | 11,763 | | | 34,086 | |
Trade accounts payable and accrued liabilities (2) | Trade accounts payable and accrued liabilities (2) | 124,688 | | | — | | | — | | | — | | | — | | | — | | | 124,688 | |
Other long-term liabilities (3) | Other long-term liabilities (3) | — | | | 1,680 | | | 1,651 | | | — | | | — | | | 7,013 | | | 10,344 | |
| Performance bond obligations | Performance bond obligations | 9,356 | | | 7,754 | | | 16,941 | | | 566 | | | — | | | 1,727 | | | 36,344 | |
| Letter of credit commitments | Letter of credit commitments | 7,060 | | | 91 | | | 157 | | | 1,383 | | | — | | | 235 | | | 8,926 | |
| Total contractual obligations | Total contractual obligations | $ | 168,274 | | | $ | 19,568 | | | $ | 113,008 | | | $ | 5,273 | | | $ | 2,953 | | | $ | 20,738 | | | $ | 329,814 | |
(1)Financing obligations, finance lease liabilities, and operating lease liabilities represent the undiscounted future payments.
(2)Excludes the current portion of operating lease liabilities.
(3)Table does not allocate by year expected tax payments, asset retirement obligations, and uncertain tax positions due to the inability to make reasonably reliable estimates of the timing of future cash settlements.
We anticipate that the obligations and commitments listed above that are due in less than one year will be paid from available cash on-hand, cash generated by operations, and estimatedthe projected availability under our Amended ABL Facility and other existing financing arrangements, cash generated by operations, and available cash on-hand in our international subsidiaries, subject to covenant compliance and certain restrictions as further discussed above. The specific timing of settlement for certain long-term obligations cannot be reasonably estimated.
Critical Accounting Policies
Critical Accounting Estimates
Our consolidated financial statements are prepared in accordance with accounting principles generally accepted in the United States (“U.S. GAAP”), which requires management to make estimates and assumptions that affect the reported amounts and disclosures. Significant estimates used in preparing our consolidated financial statements include estimated cash flows and fair values used for impairments of long-lived assets, including goodwill and other intangibles, and valuation allowances for deferred tax assets. See Note 1 in Item 8. “Financial Statements and Supplementary Data” for a discussion of the accounting policies for each of these matters. Our estimates are based on historical experience and on our future expectations that we believe to be reasonable. The combination of these factors forms the basis for making judgments about the carrying values of assets and liabilities that are not readily apparent from other sources. Actual results may differ from our current estimates and those differences may be material.
We believe the critical accounting policies described below affect our more significant judgments and estimates used in preparing the consolidated financial statements.
Impairment of Long-lived Assets
As of December 31, 2021,2023, our consolidated balance sheet includes $260.3$195.3 million of property, plant and equipment and $24.4$17.1 million of finite-lived intangible assets. We review property, plant and equipment, finite-lived intangible assets and certain other assets for impairment whenever events or changes in circumstances indicate that the carrying amount may not be recoverable. We assess recoverability based on the undiscounted future net cash flows expected from the use and eventual disposition of such asset. Should the review indicate that the carrying value is not fully recoverable, the amount of impairment loss is determined by comparing the carrying value to the estimated fair value.
Fluids Systems Operations
In June 2023, we announced that we engaged Lazard to assist us in a review of strategic alternatives for our Fluids Systems division, and in September 2023, we launched a formal sale process for substantially all the Fluids Systems business as part of this strategic review. As of December 31, 2023, the Fluids Systems business had approximately $227 million of net assets, including $171 million of net working capital and $44 million of long-lived assets, as well as $38 million in cash and $13 million of debt. While the sale process is ongoing, we considered fourth quarter 2023 developments in the sale process to be a potential indicator of impairment that required us to complete an impairment evaluation. The ongoing Fluids sale process did not meet the held for sale accounting criteria as of December 31, 2023, and as such, continued to be accounted for as held for use. Accordingly, we completed the impairment evaluation for the geographic asset groups of the Fluids Systems business and determined that the carrying value exceeded the estimated undiscounted future net cash flows for only the U.S. Land asset group.
We began our Industrial Blending operations inestimated the third quarterfair value for the U.S. Land asset group as of 2020. Although we had initial success in leveraging our chemical blending capabilities intoDecember 31, 2023 based on the disinfectantexpected cash flows to be generated from the anticipated use and cleaning products market,eventual disposition of such asset group. We estimated the fair value of the long-lived assets of the U.S. Land asset group, requiring us to recognize a key customer experienced a significant decline in product demand and cancelled all orders of products in the third quarter of 2021. While we continued to work to further develop the industrial blending business throughout the remainder of 2021 and into 2022, management began a process late$2.5 million impairment charge in the fourth quarter of 2021 to evaluate2023. As of December 31, 2023, the strategic valueU.S. Land asset group had approximately $62 million of this business. As a resultnet assets, including $58 million of the above factors, we reviewed thesenet working capital and $11 million of long-lived assets, for impairment in December 2021, considering the various strategic alternatives being evaluated at such time, and determined that the probability-weighted estimated undiscounted cash flows exceeded the $19.5as well as $3 million carrying value, and therefore, no impairment was required.
In addition, in the fourth quarter of 2021, as part of management and the Board of Directors ongoing review of underperforming areas of our business, we evaluated certain strategic options related to our U.S. fluids systems business. As such, we reviewed the long-lived assets related to this business for impairment in December 2021 and determined that the estimated undiscounted cash flows from the ongoing operations exceeded the $78.7 million carrying value, and therefore, no impairment was required.debt.
Estimating future net cash flows requiresof the geographic asset groups of our Fluids Systems business, as well as the fair value of the U.S. Land asset group and the long-lived assets within such group, required us to make judgments regarding the likelihood of possible outcomes and long-term forecastscash flows of the ongoing sale process, future revenuesrevenue and costs related to the assets subject to review.review, and the use and eventual disposition of such assets. These forecastsjudgments are uncertain in that they require assumptions about the potential outcomes for the eventual disposition of the assets from the ongoing Fluids Systems sale process, as well as forecasts for the demand for our products and services, future market conditions, and technological developments. Ifdevelopment. Depending on the actual outcome of the Fluids Systems sale process, or changes in these assumptions, occur, our expectations regarding future net cash flows may change and a material impairment could result.
Conroe, Texas Blending Facility
In Februaryconnection with the 2022 in consideration of broader strategic priorities and the timeline and efforts required to further develop the industrial blending business, our management recommended and our Board of Directors approved a plan to exit our Industrial Blending operations. As part of the exit plan, we expect to complete the wind down of the Industrial Blending business by the end of the second quarter 2022 and pursue the sale ofsales process associated with the industrial blending and warehouse facility located in Conroe, Texas,and related equipment as well as the sale or other disposal of the blending and packaging equipmentdescribed above, we recognized a $7.9 million impairment charge to impairments and other charges related to these long-lived assets currently used in these operations.the second quarter of 2022, and subsequently recognized a gain of $2.6 million upon the eventual sale in the fourth quarter of 2022.
Gulf of Mexico Operations
In the third quarter of 2022, our Board of Directors approved management’s plan to exit our Fluids Systems Gulf of Mexico operations, including the potential sale of related assets. As a result of the plan to exit the Gulf of Mexico operations as described above, we considered the third quarter of 2022 developments to be a potential indicator of impairment that required us to complete an impairment evaluation. Accordingly, we estimated the fair value for our Gulf of Mexico assets as of September 30, 2022 based on the expected cash flows to be generated from the anticipated transactions and disposedetermined that a $21.5 million impairment charge for the third quarter of the assets used in the Industrial Blending business, we may incur pre-tax charges in the range of approximately $4 million to $8 million primarily2022 was required related to the non-cash impairmentlong-lived assets. While there are inherent uncertainties and management judgment in estimating the fair value of long-lived assets which we expectincluding the discount rate, the estimated future cash flows for these assets primarily relate to recognize in the first quarterrental income from the agreement for a seven-year sublease of 2022.
In February 2022, our BoardFourchon, Louisiana drilling fluids shorebase and blending facility net of Directors also approved management’s plan to explore strategic optionsthe lease payments for our U.S. mineral grinding business. We continue to evaluate other under-performing areasexisting lease of our business, particularly within the U.S. and Gulf of Mexico oil and natural gas markets, which necessitates consideration of broader structural changes to transform this business for the new market realities. In the absence of a longer-term increase in activity levels, we may incur future charges related to these efforts or potential asset impairments, which may negatively impact our future results.such shorebase facility.
As of December 31, 2021,2023, our consolidated balance sheet includes $47.3 million of goodwill, all of which relates to the Site and Access Solutions reporting unit in the Industrial Solutions segment. Goodwill and other indefinite-lived intangible assets are tested for impairment annually as of November 1, or more frequently, if indicators of impairment exists.exist. As part of our annual goodwill review, we first perform a qualitative assessment based on company performance and future business
outlook to determine if indicators of impairment exist. When there are qualitative indicators of impairment, we use an impairment test which includes a comparison of the carrying value of net assets of our reporting units, including goodwill, with their estimated fair values, which we estimate using a combination of a market multiple and discounted cash flow approach (classified within Level 3 of the fair value hierarchy). In completing the annual evaluation during the fourth quarter of 2021,2023, we applied the qualitative assessment and determined that the fair value of the Site and AccessIndustrial Solutions reporting unit was in excess ofsignificantly more than the net carrying value, and therefore, no impairment was required.
Income Taxes
We had total deferred tax assets of $70.2$77.3 million and $56.4$71.9 million at December 31, 20212023 and 2020, respectively, with the increase primarily related to U.S. federal net operating loss carryforwards.2022, respectively. A valuation allowance must be established to offset a deferred tax asset if, based on available evidence, it is more likely than not that some or all of the deferred tax asset will not be realized. We have considered future taxable income and tax planning strategies in assessing the need for our valuation allowance. At December 31, 2021,2023, we had a total valuation allowance of $38.4$49.2 million, which includes a valuation allowance on $22.9$29.3 million of net operating loss carryforwards for certain U.S. federal, state and foreign jurisdictions, including Australia, as well as a valuation allowance of $5.2$13.0 million for certain foreign tax credits recognized related to the accounting for the impact of the Tax Act.and research and development credits. Changes in the expected future generation of qualifying taxable income within these jurisdictions or in the realizability of other tax assets may result in an adjustment to the valuation allowance, which would be charged or credited to income in the period this determination was made.
We file income tax returns in the U.S. and several non-U.S. jurisdictions and are subject to examination in the various jurisdictions in which we file. We are no longer subject to income tax examinations for U.S. federal and substantially all state jurisdictions for years prior to 20142019 and for substantially all foreign jurisdictions for years prior to 2008.
We are under examination by various tax authorities in countries where we operate, and certain foreign jurisdictions have challenged the amounts of taxes due for certain tax periods. These audits are in various stages of completion. We fully cooperate with all audits but defend existing positions vigorously. We evaluate the potential exposure associated with various filing positions and record a liability for uncertain tax positions as circumstances warrant. Although we believe all tax positions are reasonable and properly reported in accordance with applicable tax laws and regulations in effect during the periods involved, the final determination of tax audits and any related litigation could be materially different than that which is reflected in historical income tax provisions and accruals.
New Accounting Pronouncements
See Note 1 in Item 8. “Financial Statements and Supplementary Data” for a discussion of new accounting pronouncements.
ITEM 7A. Quantitative and Qualitative Disclosures About Market Risk
We are exposed to market risk from changes in interest rates and changes in foreign currency exchange rates. A discussion of our primary market risk exposure in financial instruments is presented below.
Interest Rate Risk
At December 31, 2021,2023, we had total principal amounts outstanding under financing arrangements of $115.0$75.1 million, including $86.5$45.0 million of borrowings under our Amended ABL Facility, and $6.0$7.8 million of borrowings under a U.K. term loan and credit facility, and $4.3 million under certain other international credit facilities, which are subject to variable interest rates as determined by the respective debt agreements. The weighted average interest raterates at December 31, 20212023 for the Amended ABL Facility, U.K. debt, and the U.K. term loanother international credit facilities was 1.6%6.9%, 8.4%, and 3.4%8.6%, respectively. Based on the balance of variable rate debt at December 31, 2021,2023, a 100 basis-point increase in short-term interest rates would have increased annual pre-tax interest expense by $0.9$0.6 million.
Foreign Currency Risk
Our principal foreign operations are conducted in certain areas of EMEA, Canada, and Asia Pacific, and Latin America.Pacific. We have foreign currency exchange risks associated with these operations, which are conducted principally in the foreign currency of the jurisdictions in which we operate including European euros, Canadian dollars, Kuwaiti dinar, Algerian dinar, Romanian new leu, British pounds, and Australian dollars. Historically, we have not used off-balance sheet financial hedging instruments to manage foreign currency risks when we enter into a transaction denominated in a currency other than our local currencies.
ITEM 8. Financial Statements and Supplementary Data
REPORT OF INDEPENDENT REGISTERED PUBLIC ACCOUNTING FIRM
To the stockholders and the Board of Directors of Newpark Resources, Inc.
Opinion on the Financial Statements
We have audited the accompanying consolidated balance sheets of Newpark Resources, Inc. and subsidiaries (the “Company”) as of December 31, 20212023 and 2020,2022, the related consolidated statements of operations, comprehensive income (loss), stockholders’ equity, and cash flows, for each of the three years in the period ended December 31, 2021,2023, and the related notes (collectively referred to as the “financial statements”). In our opinion, the financial statements present fairly, in all material respects, the financial position of the Company as of December 31, 20212023 and 2020,2022, and the results of its operations and its cash flows for each of the three years in the period ended December 31, 2021,2023, in conformity with accounting principles generally accepted in the United States of America.
We have also audited, in accordance with the standards of the Public Company Accounting Oversight Board (United States) (PCAOB), the Company’s internal control over financial reporting as of December 31, 2021,2023, based on criteria established in Internal Control—Integrated Framework (2013) issued by the Committee of Sponsoring Organizations of the Treadway Commission and our report dated February 25, 2022,23, 2024, expressed an unqualified opinion on the Company’s internal control over financial reporting.
Basis for Opinion
These financial statements are the responsibility of the Company’s management. Our responsibility is to express an opinion on the Company’s financial statements based on our audits. We are a public accounting firm registered with the PCAOB and are required to be independent with respect to the Company in accordance with the USU.S. federal securities laws and the applicable rules and regulations of the Securities and Exchange Commission and the PCAOB.
We conducted our audits in accordance with the standards of the PCAOB. Those standards require that we plan and perform the audit to obtain reasonable assurance about whether the financial statements are free of material misstatement, whether due to error or fraud. Our audits included performing procedures to assess the risks of material misstatement of the financial statements, whether due to error or fraud, and performing procedures that respond to those risks. Such procedures included examining, on a test basis, evidence regarding the amounts and disclosures in the financial statements. Our audits also included evaluating the accounting principles used and significant estimates made by management, as well as evaluating the overall presentation of the financial statements. We believe that our audits provide a reasonable basis for our opinion.
Critical Audit Matter
The critical audit matter communicated below is a matter arising from the current-period audit of the financial statements that was communicated or required to be communicated to the audit committee and that (1) relatedrelates to accounts or disclosures that are material to the financial statements and (2) involved our especially challenging, subjective, or complex judgments. The communication of critical audit matters does not alter in any way our opinion on the financial statements, taken as a whole, and we are not, by communicating the critical audit matter below, providing a separate opinion on the critical audit matter or on the accounts or disclosures to which it relates.
Evaluation
Long-lived Assets – Review of Long-Lived Asset Impairment – Industrial Blending Asset Group –Strategic Alternatives for Fluids Systems Business— Refer to Notes 12 and 16 of4 to the financial statements
Critical Audit Matter Description
The Company reviews property, plantinitiated a review of strategic alternatives for the long-term positioning of the Fluids Systems division in June 2023 and equipment, finite-lived intangiblein September 2023 launched a formal sale process for substantially all the Fluids Systems business as part of this strategic review. As part of this review, $2.5 million of total charges were recorded related to the impairment of certain long-lived assets and certain other assets for impairment whenever events or changesutilized in circumstances indicate that the carrying amount may not be recoverable. Recoverability is based upon expected undiscounted future net cash flows. Due to changes in operating environment and strategic evaluation impacting the Industrial Blending asset group, management reviewed the related assets for impairment during 2021 and determined that the estimated undiscounted cash flows exceeded the carrying value, and therefore, no impairment was required.
Estimating future net cash flows requires management to make judgments regarding long-term forecasts of future revenues and the related costs associated with the asset group subject to review. If changes in these assumptions occur, expectations regarding future net cash flows may change and an impairment may result.
We identified the estimation of the undiscounted future net cash flows of the Industrial Blending asset groupimpairment for Fluids U.S. Land as a critical audit matter due to the materiality of the property, plant and equipment balance,long-lived assets balances, high degree of auditor judgment, and an increased level of effort when performing audit procedures to evaluate the reasonableness of management’s assumptions in determining the undiscounted future net cash flows, and an increased extent of effort, including those relatedthe need to revenue forecasts, and the weighted-probability approach utilized to determine the estimated future cash flows under various business development plans.involve fair value specialists.
How the Critical Audit Matter Was Addressed in the Audit
Our audit procedures related to the evaluation of the Company’s impairment model used to estimateanalysis for long-lived assets within the undiscounted future net cash flows of the Industrial BlendingFluids U.S. Land asset group included the following, among others:
•EvaluatingReviewed minutes from Board of Director meetings and made inquiries of business unit managers and executives about the reasonablenessexpected plans for sale of the identified triggering events to validate the timing of the asset impairment calculation.related assets.
•TestingEvaluated indicators of impairment by reviewing information received by management from interested third parties.
•Evaluated the completeness and accuracy of the long-lived assets identified for impairment by comparing the listing of assets evaluated by management in the fair value analysis to the listing of assets recorded in the Fluids U.S. Land asset group.
•Evaluated the reasonableness of key assumptions used by management including revenue growth rates and EBITDA margins in determining the undiscounted future net cash flows determination.flows.
•Performing sensitivity analysesWith the assistance of our fair value specialists, we tested the completeness and accuracy of the key assumptionsimpairment charges by comparing fair value of revenue growth rates and costs as well as the weighted probabilitiesunderlying assets to evaluate the change in the undiscounted future net cash flows estimate that would result from changes in the assumptions.independent market data.
•TestingOur audit procedures also included testing the effectiveness of controls over the review of triggering eventsimpairment indicators and management’s long-lived asset impairment evaluation.impairment.
/s/ DELOITTE & TOUCHE LLP
Houston, Texas
February 25, 202223, 2024
We have served as the Company’s auditor since 2008.
Newpark Resources, Inc.
Consolidated Balance Sheets
December 31,
| | | | | | | | | | | |
| (In thousands, except share data) | 2021 | | 2020 |
| ASSETS | | | |
| Cash and cash equivalents | $ | 24,088 | | | $ | 24,197 | |
| Receivables, net | 194,296 | | | 141,045 | |
| Inventories | 155,341 | | | 147,857 | |
| Prepaid expenses and other current assets | 14,787 | | | 15,081 | |
| Total current assets | 388,512 | | | 328,180 | |
| | | |
| Property, plant and equipment, net | 260,256 | | | 277,696 | |
| Operating lease assets | 27,569 | | | 30,969 | |
| Goodwill | 47,283 | | | 42,444 | |
| Other intangible assets, net | 24,959 | | | 25,428 | |
| Deferred tax assets | 2,316 | | | 1,706 | |
| Other assets | 1,991 | | | 2,769 | |
| Total assets | $ | 752,886 | | | $ | 709,192 | |
| | | |
| LIABILITIES AND STOCKHOLDERS’ EQUITY | | | |
| Current debt | $ | 19,210 | | | $ | 67,472 | |
| Accounts payable | 84,585 | | | 49,252 | |
| Accrued liabilities | 46,597 | | | 36,934 | |
| Total current liabilities | 150,392 | | | 153,658 | |
| | | |
| Long-term debt, less current portion | 95,593 | | | 19,690 | |
| Noncurrent operating lease liabilities | 22,352 | | | 25,068 | |
| Deferred tax liabilities | 11,819 | | | 13,368 | |
| Other noncurrent liabilities | 10,344 | | | 9,376 | |
| Total liabilities | 290,500 | | | 221,160 | |
| | | |
| Commitments and contingencies (Note 15) | 0 | | 0 |
| | | |
| Common stock, $0.01 par value (200,000,000 shares authorized and 109,330,733 and 107,587,786 shares issued, respectively) | 1,093 | | | 1,076 | |
| Paid-in capital | 634,929 | | | 627,031 | |
| Accumulated other comprehensive loss | (61,480) | | | (54,172) | |
| Retained earnings | 24,345 | | | 50,937 | |
| Treasury stock, at cost (16,981,147 and 16,781,150 shares, respectively) | (136,501) | | | (136,840) | |
| Total stockholders’ equity | 462,386 | | | 488,032 | |
| Total liabilities and stockholders’ equity | $ | 752,886 | | | $ | 709,192 | |
See Accompanying Notes to Consolidated Financial Statements
Newpark Resources, Inc.
Consolidated Statements of Operations
Years Ended December 31,
| | | | | | | | | | | | | | | | | |
| (In thousands, except per share data) | 2021 | | 2020 | | 2019 |
| Revenues | | | | | |
| Product sales revenues | $ | 484,300 | | | $ | 378,813 | | | $ | 654,006 | |
| Rental and service revenues | 130,481 | | | 113,812 | | | 166,113 | |
| Total revenues | 614,781 | | | 492,625 | | | 820,119 | |
| Cost of revenues | | | | | |
| Cost of product sales revenues | 434,405 | | | 384,519 | | | 568,388 | |
| Cost of rental and service revenues | 95,147 | | | 88,739 | | | 116,350 | |
| Total cost of revenues | 529,552 | | | 473,258 | | | 684,738 | |
| Selling, general and administrative expenses | 94,445 | | | 86,604 | | | 113,394 | |
| Other operating (income) loss, net | (391) | | | (3,330) | | | 170 | |
| Impairments and other charges | — | | | 14,727 | | | 11,422 | |
| Operating income (loss) | (8,825) | | | (78,634) | | | 10,395 | |
| | | | | |
| Foreign currency exchange (gain) loss | (397) | | | 3,378 | | | (816) | |
| Interest expense, net | 8,805 | | | 10,986 | | | 14,369 | |
| (Gain) loss on extinguishment of debt | 1,000 | | | (419) | | | — | |
| Loss before income taxes | (18,233) | | | (92,579) | | | (3,158) | |
| | | | | |
| Provision (benefit) for income taxes | 7,293 | | | (11,883) | | | 9,788 | |
| Net loss | $ | (25,526) | | | $ | (80,696) | | | $ | (12,946) | |
| | | | | |
| Net loss per common share - basic | $ | (0.28) | | | $ | (0.89) | | | $ | (0.14) | |
| Net loss per common share - diluted | $ | (0.28) | | | $ | (0.89) | | | $ | (0.14) | |
See Accompanying Notes to Consolidated Financial Statements
Newpark Resources, Inc.
Consolidated Statements of Comprehensive Income (Loss)
Years Ended December 31,
| | | | | | | | | | | | | | | | | |
| (In thousands) | 2021 | | 2020 | | 2019 |
| | | | | |
| Net loss | $ | (25,526) | | | $ | (80,696) | | | $ | (12,946) | |
| Foreign currency translation adjustments (net of tax benefit of $639, $293, $373) | (7,308) | | | 2,086 | | | (274) | |
| Recognition of Brazil cumulative foreign currency translation losses | — | | | 11,689 | | | — | |
| Comprehensive loss | $ | (32,834) | | | $ | (66,921) | | | $ | (13,220) | |
See Accompanying Notes to Consolidated Financial Statements
Newpark Resources, Inc.
Consolidated Statements of Stockholders’ Equity
| | | | | | | | | | | | | | | | | | | | | | | | | | | | | | | | | | | |
| (In thousands) | Common
Stock | | Paid-In
Capital | | Accumulated
Other
Comprehensive
Loss | | Retained
Earnings | | Treasury
Stock | | Total |
| Balance at January 1, 2019 | $ | 1,064 | | | $ | 617,276 | | | $ | (67,673) | | | $ | 148,802 | | | $ | (129,788) | | | $ | 569,681 | |
| Net loss | — | | | — | | | — | | | (12,946) | | | — | | | (12,946) | |
| Employee stock options, restricted stock and employee stock purchase plan | 3 | | | (8,290) | | | — | | | (1,737) | | | 9,599 | | | (425) | |
| Stock-based compensation expense | — | | | 11,640 | | | — | | | — | | | — | | | 11,640 | |
| Treasury shares purchased at cost | — | | | — | | | — | | | — | | | (19,031) | | | (19,031) | |
| Foreign currency translation, net of tax | — | | | — | | | (274) | | | — | | | — | | | (274) | |
| Balance at December 31, 2019 | 1,067 | | | 620,626 | | | (67,947) | | | 134,119 | | | (139,220) | | | 548,645 | |
| Cumulative effect of accounting change | — | | | — | | | — | | | (735) | | | — | | | (735) | |
| Net loss | — | | | — | | | — | | | (80,696) | | | — | | | (80,696) | |
| Employee stock options, restricted stock and employee stock purchase plan | 9 | | | (173) | | | — | | | (1,751) | | | 2,380 | | | 465 | |
| Stock-based compensation expense | — | | | 6,578 | | | — | | | — | | | — | | | 6,578 | |
| Foreign currency translation, net of tax | — | | | — | | | 2,086 | | | — | | | — | | | 2,086 | |
| Recognition of Brazil cumulative foreign currency translation losses | — | | | — | | | 11,689 | | | — | | | — | | | 11,689 | |
| Balance at December 31, 2020 | 1,076 | | | 627,031 | | | (54,172) | | | 50,937 | | | (136,840) | | | 488,032 | |
| Net loss | — | | | — | | | — | | | (25,526) | | | — | | | (25,526) | |
| Employee stock options, restricted stock and employee stock purchase plan | 17 | | | (28) | | | — | | | (1,066) | | | 339 | | | (738) | |
| Stock-based compensation expense | — | | | 7,926 | | | — | | | — | | | — | | | 7,926 | |
| Foreign currency translation, net of tax | — | | | — | | | (7,308) | | | — | | | — | | | (7,308) | |
| Balance at December 31, 2021 | $ | 1,093 | | | $ | 634,929 | | | $ | (61,480) | | | $ | 24,345 | | | $ | (136,501) | | | $ | 462,386 | |
| | | | | | | | | | | |
| (In thousands, except share data) | 2023 | | 2022 |
| ASSETS | | | |
| Cash and cash equivalents | $ | 38,594 | | | $ | 23,182 | |
| Receivables, net of allowance of $4,751 and $4,817, respectively | 168,457 | | | 242,247 | |
| Inventories | 141,079 | | | 149,571 | |
| Prepaid expenses and other current assets | 9,094 | | | 10,966 | |
| Total current assets | 357,224 | | | 425,966 | |
| | | |
| Property, plant and equipment, net | 195,289 | | | 193,099 | |
| Operating lease assets | 20,731 | | | 23,769 | |
| Goodwill | 47,283 | | | 47,110 | |
| Other intangible assets, net | 17,114 | | | 20,215 | |
| Deferred tax assets | 2,628 | | | 2,275 | |
| Other assets | 2,067 | | | 2,441 | |
| Total assets | $ | 642,336 | | | $ | 714,875 | |
| | | |
| LIABILITIES AND STOCKHOLDERS’ EQUITY | | | |
| Current debt | $ | 16,916 | | | $ | 22,438 | |
| Accounts payable | 70,087 | | | 93,633 | |
| Accrued liabilities | 49,281 | | | 46,871 | |
| Total current liabilities | 136,284 | | | 162,942 | |
| | | |
| Long-term debt, less current portion | 58,117 | | | 91,677 | |
| Noncurrent operating lease liabilities | 17,404 | | | 19,816 | |
| Deferred tax liabilities | 8,307 | | | 8,121 | |
| Other noncurrent liabilities | 6,860 | | | 9,291 | |
| Total liabilities | 226,972 | | | 291,847 | |
| | | |
| Commitments and contingencies (Note 15) | | | |
| | | |
| Common stock, $0.01 par value (200,000,000 shares authorized and 111,669,464 and 111,451,999 shares issued, respectively) | 1,117 | | | 1,115 | |
| Paid-in capital | 639,645 | | | 641,266 | |
| Accumulated other comprehensive loss | (62,839) | | | (67,186) | |
| Retained earnings | 10,773 | | | 2,489 | |
| Treasury stock, at cost (26,471,738 and 21,751,232 shares, respectively) | (173,332) | | | (154,656) | |
| Total stockholders’ equity | 415,364 | | | 423,028 | |
| Total liabilities and stockholders’ equity | $ | 642,336 | | | $ | 714,875 | |
See Accompanying Notes to Consolidated Financial Statements
Newpark Resources, Inc.
Consolidated Statements of Operations
Years Ended December 31,
| | | | | | | | | | | | | | | | | |
| (In thousands, except per share data) | 2023 | | 2022 | | 2021 |
| Revenues | | | | | |
| Product sales revenues | $ | 572,910 | | | $ | 665,318 | | | $ | 484,300 | |
| Rental and service revenues | 176,690 | | | 150,276 | | | 130,481 | |
| Total revenues | 749,600 | | | 815,594 | | | 614,781 | |
| Cost of revenues | | | | | |
| Cost of product sales revenues | 496,654 | | | 588,234 | | | 434,405 | |
| Cost of rental and service revenues | 114,407 | | | 105,824 | | | 95,147 | |
| Total cost of revenues | 611,061 | | | 694,058 | | | 529,552 | |
| Selling, general and administrative expenses | 101,136 | | | 97,618 | | | 94,445 | |
| Other operating (income) loss, net | (2,583) | | | (4,370) | | | (391) | |
| Impairments and other charges | 6,356 | | | 37,322 | | | — | |
| Operating income (loss) | 33,630 | | | (9,034) | | | (8,825) | |
| | | | | |
| Foreign currency exchange (gain) loss | 267 | | | 389 | | | (397) | |
| Interest expense, net | 8,181 | | | 7,040 | | | 8,805 | |
| Loss on extinguishment of debt | — | | | — | | | 1,000 | |
| Income (loss) before income taxes | 25,182 | | | (16,463) | | | (18,233) | |
| | | | | |
| Provision (benefit) for income taxes | 10,666 | | | 4,371 | | | 7,293 | |
| Net income (loss) | $ | 14,516 | | | $ | (20,834) | | | $ | (25,526) | |
| | | | | |
| Net income (loss) per common share - basic | $ | 0.17 | | | $ | (0.22) | | | $ | (0.28) | |
| Net income (loss) per common share - diluted | $ | 0.16 | | | $ | (0.22) | | | $ | (0.28) | |
See Accompanying Notes to Consolidated Financial Statements
Newpark Resources, Inc.
Consolidated Statements of Comprehensive Income (Loss)
Years Ended December 31,
| | | | | | | | | | | | | | | | | |
| (In thousands) | 2023 | | 2022 | | 2021 |
| | | | | |
| Net income (loss) | $ | 14,516 | | | $ | (20,834) | | | $ | (25,526) | |
| Foreign currency translation adjustments, net of tax benefit (expense) of $(93), $1, $639 | 3,549 | | | (5,706) | | | (7,308) | |
| Recognition of Chile cumulative foreign currency translation losses | 798 | | | — | | | — | |
| Comprehensive income (loss) | $ | 18,863 | | | $ | (26,540) | | | $ | (32,834) | |
See Accompanying Notes to Consolidated Financial Statements
Newpark Resources, Inc.
Consolidated Statements of Stockholders’ Equity
| | | | | | | | | | | | | | | | | | | | | | | | | | | | | | | | | | | |
| (In thousands) | Common
Stock | | Paid-In
Capital | | Accumulated
Other
Comprehensive
Loss | | Retained
Earnings | | Treasury
Stock | | Total |
| Balance at December 31, 2020 | $ | 1,076 | | | $ | 627,031 | | | $ | (54,172) | | | $ | 50,937 | | | $ | (136,840) | | | $ | 488,032 | |
| Net loss | — | | | — | | | — | | | (25,526) | | | — | | | (25,526) | |
| Employee stock options, restricted stock and employee stock purchase plan | 17 | | | (28) | | | — | | | (1,066) | | | 339 | | | (738) | |
| Stock-based compensation expense | — | | | 7,926 | | | — | | | — | | | — | | | 7,926 | |
| Foreign currency translation, net of tax | — | | | — | | | (7,308) | | | — | | | — | | | (7,308) | |
| Balance at December 31, 2021 | 1,093 | | | 634,929 | | | (61,480) | | | 24,345 | | | (136,501) | | | 462,386 | |
| Net loss | — | | | — | | | — | | | (20,834) | | | — | | | (20,834) | |
| Employee stock options, restricted stock and employee stock purchase plan | 22 | | | (524) | | | — | | | (1,022) | | | (537) | | | (2,061) | |
| Stock-based compensation expense | — | | | 6,861 | | | — | | | — | | | — | | | 6,861 | |
| Treasury shares purchased at cost | | | | | — | | | | | (17,618) | | | (17,618) | |
| Foreign currency translation, net of tax | — | | | — | | | (5,706) | | | — | | | — | | | (5,706) | |
| Balance at December 31, 2022 | 1,115 | | | 641,266 | | | (67,186) | | | 2,489 | | | (154,656) | | | 423,028 | |
| Net income | — | | | — | | | — | | | 14,516 | | | — | | | 14,516 | |
| Employee stock options, restricted stock and employee stock purchase plan | 2 | | | (8,259) | | | — | | | (6,232) | | | 13,509 | | | (980) | |
| Stock-based compensation expense | — | | | 6,638 | | | — | | | — | | | — | | | 6,638 | |
| Treasury shares purchased at cost | — | | | — | | | — | | | — | | | (32,185) | | | (32,185) | |
| Foreign currency translation, net of tax | — | | | — | | | 3,549 | | | — | | | — | | | 3,549 | |
| Recognition of Chile cumulative foreign currency translation losses | — | | | — | | | 798 | | | — | | | — | | | 798 | |
| Balance at December 31, 2023 | $ | 1,117 | | | $ | 639,645 | | | $ | (62,839) | | | $ | 10,773 | | | $ | (173,332) | | | $ | 415,364 | |
See Accompanying Notes to Consolidated Financial Statements
Newpark Resources, Inc.
Consolidated Statements of Cash Flows
Years Ended December 31,
| | | | | | | | | | | | | | | | | |
| (In thousands) | 2021 | | 2020 | | 2019 |
| Cash flows from operating activities: | | | | | |
| Net loss | $ | (25,526) | | | $ | (80,696) | | | $ | (12,946) | |
| Adjustments to reconcile net loss to net cash provided by (used in) operations: | | | | | |
| Impairments and other non-cash charges | — | | | 25,072 | | | 11,422 | |
| Depreciation and amortization | 42,225 | | | 45,314 | | | 47,144 | |
| Stock-based compensation expense | 7,926 | | | 6,578 | | | 11,640 | |
| Provision for deferred income taxes | (1,209) | | | (18,850) | | | (4,250) | |
| Credit loss expense | 664 | | | 1,427 | | | 1,792 | |
| Gain on sale of assets | (7,182) | | | (6,531) | | | (10,801) | |
| Gain on insurance recovery | (849) | | | — | | | — | |
| (Gain) loss on extinguishment of debt | 1,000 | | | (419) | | | — | |
| Amortization of original issue discount and debt issuance costs | 3,707 | | | 5,152 | | | 6,188 | |
| Change in assets and liabilities: | | | | | |
| (Increase) decrease in receivables | (61,283) | | | 70,994 | | | 40,182 | |
| (Increase) decrease in inventories | (10,336) | | | 39,889 | | | 699 | |
| Increase in other assets | (726) | | | (686) | | | (1,032) | |
| Increase (decrease) in accounts payable | 36,341 | | | (29,457) | | | (8,318) | |
| Increase (decrease) in accrued liabilities and other | 12,235 | | | (1,996) | | | (9,434) | |
| Net cash provided by (used in) operating activities | (3,013) | | | 55,791 | | | 72,286 | |
| | | | | |
| Cash flows from investing activities: | | | | | |
| Capital expenditures | (21,793) | | | (15,794) | | | (44,806) | |
| Business acquisitions, net of cash acquired | (13,434) | | | — | | | (18,692) | |
| Proceeds from sale of property, plant and equipment | 15,999 | | | 12,399 | | | 13,734 | |
| Proceeds from insurance property claim | 1,753 | | | — | | | — | |
| Net cash used in investing activities | (17,475) | | | (3,395) | | | (49,764) | |
| | | | | |
| Cash flows from financing activities: | | | | | |
| Borrowings on lines of credit | 286,154 | | | 173,794 | | | 327,983 | |
| Payments on lines of credit | (208,575) | | | (221,781) | | | (335,613) | |
| Purchases of Convertible Notes | (28,137) | | | (29,124) | | | — | |
| Payment on Convertible Notes | (38,567) | | | — | | | — | |
| Proceeds from term loan | 8,258 | | | — | | | — | |
| Proceeds from financing obligation | 8,004 | | | — | | | — | |
| Debt issuance costs | (295) | | | — | | | (1,214) | |
| Proceeds from employee stock plans | — | | | — | | | 1,314 | |
| Purchases of treasury stock | (1,448) | | | (333) | | | (21,737) | |
| Other financing activities | (3,986) | | | (497) | | | (259) | |
| Net cash provided by (used in) financing activities | 21,408 | | | (77,941) | | | (29,526) | |
| | | | | |
| Effect of exchange rate changes on cash | (1,779) | | | (970) | | | (399) | |
| | | | | |
| Net decrease in cash, cash equivalents, and restricted cash | (859) | | | (26,515) | | | (7,403) | |
| Cash, cash equivalents, and restricted cash at beginning of year | 30,348 | | | 56,863 | | | 64,266 | |
| Cash, cash equivalents, and restricted cash at end of year | $ | 29,489 | | | $ | 30,348 | | | $ | 56,863 | |
| | | | | | | | | | | | | | | | | |
| (In thousands) | 2023 | | 2022 | | 2021 |
| Cash flows from operating activities: | | | | | |
| Net income (loss) | $ | 14,516 | | | $ | (20,834) | | | $ | (25,526) | |
| Adjustments to reconcile net income (loss) to net cash provided by (used in) operations: | | | | | |
| Impairments and other non-cash charges | 6,356 | | | 37,322 | | | — | |
| Depreciation and amortization | 31,372 | | | 38,610 | | | 42,225 | |
| Stock-based compensation expense | 6,638 | | | 6,861 | | | 7,926 | |
| Provision for deferred income taxes | (482) | | | (3,384) | | | (1,209) | |
| Credit loss expense | 1,209 | | | 1,039 | | | 664 | |
| Gain on divestitures | — | | | (3,596) | | | — | |
| Gain on sale of assets | (2,904) | | | (2,809) | | | (7,182) | |
| Gain on insurance recovery | — | | | — | | | (849) | |
| Loss on extinguishment of debt | — | | | — | | | 1,000 | |
| Amortization of original issue discount and debt issuance costs | 541 | | | 871 | | | 3,707 | |
| Change in assets and liabilities: | | | | | |
| (Increase) decrease in receivables | 64,812 | | | (42,452) | | | (61,283) | |
| (Increase) decrease in inventories | 2,256 | | | (46,909) | | | (10,336) | |
| (Increase) decrease in other assets | 307 | | | (855) | | | (726) | |
| Increase (decrease) in accounts payable | (25,065) | | | 10,781 | | | 36,341 | |
| Increase in accrued liabilities and other | 445 | | | 334 | | | 12,235 | |
| Net cash provided by (used in) operating activities | 100,001 | | | (25,021) | | | (3,013) | |
| | | | | |
| Cash flows from investing activities: | | | | | |
| Capital expenditures | (29,232) | | | (28,273) | | | (21,793) | |
| Proceeds from divestitures | 19,833 | | | 71,286 | | | — | |
| Business acquisitions, net of cash acquired | — | | | — | | | (13,434) | |
| Proceeds from sale of property, plant and equipment | 3,709 | | | 3,217 | | | 15,999 | |
| Proceeds from insurance property claim | — | | | — | | | 1,753 | |
| Net cash provided by (used in) investing activities | (5,690) | | | 46,230 | | | (17,475) | |
| | | | | |
| Cash flows from financing activities: | | | | | |
| Borrowings on lines of credit | 241,873 | | | 287,276 | | | 286,154 | |
| Payments on lines of credit | (277,591) | | | (290,886) | | | (208,575) | |
| Purchases of Convertible Notes | — | | | — | | | (28,137) | |
| Payment on Convertible Notes | — | | | — | | | (38,567) | |
| Proceeds from term loan | — | | | 3,754 | | | 8,258 | |
| Proceeds from financing obligation | — | | | — | | | 8,004 | |
| Debt issuance costs | — | | | (1,499) | | | (295) | |
| Purchases of treasury stock | (34,265) | | | (20,248) | | | (1,448) | |
| Proceeds from employee stock plans | 606 | | | — | | | — | |
| Other financing activities | (11,670) | | | (3,327) | | | (3,986) | |
| Net cash provided by (used in) financing activities | (81,047) | | | (24,930) | | | 21,408 | |
| | | | | |
| Effect of exchange rate changes on cash | 576 | | | (707) | | | (1,779) | |
| | | | | |
| Net increase (decrease) in cash, cash equivalents, and restricted cash | 13,840 | | | (4,428) | | | (859) | |
| Cash, cash equivalents, and restricted cash at beginning of year | 25,061 | | | 29,489 | | | 30,348 | |
| Cash, cash equivalents, and restricted cash at end of year | $ | 38,901 | | | $ | 25,061 | | | $ | 29,489 | |
See Accompanying Notes to Consolidated Financial Statements
NEWPARK RESOURCES, INC.
NOTES TO CONSOLIDATED FINANCIAL STATEMENTS
Note 1 — Summary of Significant Accounting Policies
Organization and Principles of Consolidation. Newpark Resources, Inc. was organized in 1932 as a Nevada corporation. In 1991, we changed our state of incorporation to Delaware. The consolidated financial statements include our company and our wholly-owned subsidiaries (“we,(the “Company,” “we,” “our,” or “us”). All intercompany transactions are eliminated in consolidation.
We are a geographically diversified supplier providing environmentally-sensitive products, as well as rentals and services to customers across multiple industries. We currently operate our business through 2two reportable segments: Fluids Systems and Industrial Solutions. In addition, we had a third reportable segment, Industrial Blending, which was exited in 2022. We have reflected these three reportable segments for all periods presented in this Annual Report on Form 10-K.
•Our Fluids Systems segment provides customized drilling completion, and stimulationcompletion fluids products and related technical services to oil and natural gas exploration and production (“E&P”) customers primarily in North America and Europe, the Middle East and Africa (“EMEA”), as well as certain countries in Asia Pacific and Latin America. Pacific.
In the fourth quarter of 2022, we exited two of our Fluids Systems business units, including our U.S.-based mineral grinding business as well as our Gulf of Mexico fluids operations. Additionally, in June 2023, we announced that we engaged Lazard to assist us in a review of strategic alternatives for the long-term positioning of our Fluids Systems division. See Note 2 for additional information.
•Our Industrial Solutions segment includes our Site and Access Solutions business, along with our Industrial Blending operations. Site and Access Solutions provides temporary worksite access solutions, including the rental of our manufactured recyclable composite matting systems, along with related site construction and services to customers in various markets including power transmission, E&P, pipeline, renewable energy, petrochemical, construction and other industries, primarily in the United States and Europe.United Kingdom. We also manufacture and sell our manufactured recyclable composite mats to customers around the world, with power transmission being the primary end-market.
•Our Industrial Blending segment began operations in 2020 and supported industrial end-markets, including the production of disinfectants and industrial cleaning products. We completed the wind down of the Industrial Blending business in the first quarter of 2022 and the sale of the industrial blending assets in the fourth quarter of 2022.
Use of Estimates and Market Risks. The preparation of financial statements in conformity with accounting principles generally accepted in the United States (“U.S. GAAP”) requires management to make estimates and assumptions that affect the reported amounts of assets and liabilities, the disclosure of contingent assets and liabilities at the date of the financial statements, and the reported amounts of revenues and expenses during the reporting period. Actual results could differ from those estimates. Significant estimates used in preparing our consolidated financial statements include, but are not limited to, the following: estimated cash flows and fair values used for impairments of long-lived assets, including goodwill and other intangibles, and valuation allowances for deferred tax assets.
Our Fluids Systems operating results remain dependent on oil and natural gas drilling activity levels in the markets we serve and the nature of the drilling operations (including the depth and whether the wells are drilled vertically or horizontally), which governs the revenue potential of each well. Drilling activity levels, in turn, depend on a variety of factors, including oil and natural gas commodity pricing, inventory levels, product demand, and regulatory restrictions. Oil and natural gas prices and activity are cyclical and volatile, and this market volatility has a significant impact on our operating results.
Cash Equivalents. All highly liquid investments with a remaining maturity of three months or less at the date of acquisition are classified as cash equivalents.
Restricted Cash. Cash that is restricted as to withdrawal or usage is recognized as restricted cash and is included in other current assets in the consolidated balance sheets.
Allowance for Credit Losses. In 2016, the Financial Accounting Standards Board (“FASB”) issued new guidance which requires financial assets measured at amortized cost basis, including tradeTrade receivables to beare presented at the net amount expected to be collected. See "New Accounting Pronouncements" below for details aboutWe estimate the amended guidance and about our adoption. Results for reporting periods beginning after December 31, 2019 are presented under the new guidance, while prior period amounts were not adjusted and continue to be reported in accordance with previous guidance.
The new guidance requires an entity to estimate its lifetime “expected credit loss” for such assets at inception, which will generally resultresults in the earlier recognition of allowances for losses. Under previous guidance, reserves for uncollectible accounts receivable were determined on a specific identification basis when we believed that the required payment of specific amounts owed to us was not probable. Under the new guidance, ourOur allowance for credit losses reflects losses that are expected over the contractual life of the asset, and takes into account historical loss experience, current and future economic conditions, and reasonable and supportable forecasts.
Inventories. Inventories are stated at the lower of cost (principally average cost) or net realizable value. Certain conversion costs associated with the acquisition, production, blending, and storage of inventory in our Fluids Systems segment as well as the manufacturing operations in the Industrial Solutions segment are capitalized as a component of the carrying value of the inventory and expensed as a component of cost of revenues as the products are sold. Reserves for inventory obsolescence
NEWPARK RESOURCES, INC.
NOTES TO CONSOLIDATED FINANCIAL STATEMENTS – (Continued)
are determined based on the net realizable value of the inventory using factors such as our historical usage of inventory on-hand, future expectations related to our customers’ needs, market conditions, and the development of new products.
NEWPARK RESOURCES, INC.
NOTES TO CONSOLIDATED FINANCIAL STATEMENTS – (Continued)
Property, Plant and Equipment. Property, plant and equipment are recorded at cost. Additions and improvements that extend the useful life of an asset are capitalized. We capitalize interest costs on significant capital projects. Maintenance and repairs are expensed as incurred. Sales and disposals of property, plant and equipment are removed at carrying cost less accumulated depreciation with any resulting gain or loss reflected in earnings.
Depreciation is provided on property, plant and equipment, including finance lease assets, primarily utilizing the straight-line method over the following estimated useful service lives or lease term:
| | | | | | | | |
| Computer hardware and office equipment | | 3-5 years |
| Computer software | | 3-103-5 years |
| Autos and light trucks | | 5-7 years |
| Furniture, fixtures, and trailers | | 7-10 years |
| Composite mats (rental fleet) | | 7-12 years |
| Machinery and heavy equipment | | 10-15 years |
| Owned buildings | | 20-39 years |
| Leasehold improvements | Lease term, including reasonably assured renewal periods |
Goodwill and Other Intangible Assets. Goodwill represents the excess of the purchase price of acquisitions over the fair value of the net identifiable assets acquired in business combinations. Goodwill and other intangible assets with indefinite lives are not amortized. Intangible assets with finite useful lives are amortized either on a straight-line basis over the asset’s estimated useful life or on a basis that reflects the pattern in which the economic benefits of the asset are realized. Any period costs of maintaining intangible assets are expensed as incurred.
Impairment of Long-Lived Assets. Goodwill and other indefinite-lived intangible assets are tested for impairment annually as of November 1, or more frequently, if an indicationindicators of impairment exists.exist. As part of our annual goodwill review, we first perform a qualitative assessment based on company performance and future business outlook to determine if indicators of impairment exist. When there are qualitative indicators of impairment, we use an impairment test which includes a comparison of the carrying value of net assets of our reporting units, including goodwill, with their estimated fair values, which we estimate using a combination of a market multiple and discounted cash flow approach (classified within level 3 of the fair value hierarchy). If the carrying value exceeds the estimated fair value, an impairment charge is recorded in the period in which such review is performed. We identify our reporting units based on our analysis of several factors, including our operating segment structure, evaluation of the economic characteristics of our geographic regions within each of our operating segments, and the extent to which our business units share assets and other resources.
We review property, plant and equipment, finite-lived intangible assets and certain other assets for impairment whenever events or changes in circumstances indicate that the carrying amount may not be recoverable. We assess recoverability based on the undiscounted future net cash flows expected from the use and eventual disposition of such asset. Should the review indicate that the carrying value is not fully recoverable, the amount of impairment loss is determined by comparing the carrying value to the estimated fair value.
Insurance. We maintain reserves for estimated future payments associated with our self-insured employee healthcare programs, as well as the self-insured retention exposures under our general liability, auto liability, and workers compensation insurance policies. Our reserves are determined based on historical experience under these programs, including estimated development of known claims and estimated incurred-but-not-reported claims.
Treasury Stock. Treasury stock is carried at cost, which includes the entire cost of the acquired stock.
Revenue Recognition. The following provides a summary of our significant accounting policies for revenue recognition.
Fluids Systems. Revenues for fluid system additive products and engineering services, when provided to customers in the delivery of an integrated fluid system, are recognized as product sales revenues when utilized by the customer. Revenues for formulated liquid systems are recognized as product sales revenues when utilized or lost downhole while drilling. Revenues for equipment rentals and other services provided to customers that are ancillary to the fluid system product delivery are recognized in rental and service revenues when the services are performed. For direct sales of fluid system products, revenues are recognized when control passes to the customer, which is generally upon shipment of materials.
NEWPARK RESOURCES, INC.
NOTES TO CONSOLIDATED FINANCIAL STATEMENTS – (Continued)
Industrial Solutions. Revenues for rentals and services are generated from both fixed-price and unit-priced contracts, which are generally short-term in duration. The activities under these contracts include the installation and rental of matting
NEWPARK RESOURCES, INC.
NOTES TO CONSOLIDATED FINANCIAL STATEMENTS – (Continued)
systems for a period of time and services such as access road construction, site planning and preparation, environmental protection, fluids and spill containment, erosion control, and site restoration services. Rental revenues are recognized over the rental term and service revenues are recognized when the specified services are performed. Revenues from any subsequent extensions to the rental agreements are recognized over the extension period. Revenues from the direct sale of products are recognized when control passes to the customer, which is upon shipment or delivery, depending on the terms of the underlying sales contract.
For bothall segments, the amount of revenue we recognize for products sold and services performed reflects the consideration to which we expect to be entitled in exchange for such goods or services, which generally reflects the amount we have the right to invoice based on agreed upon unit rates. While billing requirements vary, many of our customer contracts require that billings occur periodically or at the completion of specified activities, even though our performance and right to consideration occurs throughout the contract. As such, we recognize revenue as performance is completed in the amount to which we have the right to invoice. We do not disclose the value of our unsatisfied performance obligations for (i) contracts with an original expected length of one year or less and (ii) contracts for which we recognize revenue for the amount to which we have the right to invoice for products sold and services performed.
Shipping and handling costs are reflected in cost of revenues, and all reimbursements by customers of shipping and handling costs are included in revenues.
Income Taxes. We provide for deferred taxes using an asset and liability approach by measuring deferred tax assets and liabilities due to temporary differences existing at year end using currently enacted tax rates and laws that will be in effect when the differences are expected to reverse. We reduce deferred tax assets by a valuation allowance when, based on our estimates, it is more likely than not that a portion of those assets will not be realized in a future period. The estimates utilized in recognition of deferred tax assets are subject to revision, either up or down, in future periods based on new facts or circumstances. We present deferred tax assets and liabilities as noncurrent in the balance sheet based on an analysis of each taxpaying component within a jurisdiction. We evaluate uncertain tax positions and record a liability as circumstances warrant.
Share-Based Compensation. Share-based compensation cost is measured at the grant date based on the fair value of the award, net of an estimated forfeiture rate. We recognize these costs in the statement of operations using the straight-line method over the vesting term.
Foreign Currency Translation. The functional currency for substantially all international subsidiaries is their respective local currency. Financial statements for these international subsidiaries are translated into U.S. dollars using the exchange rate at each balance sheet date for assets and liabilities and the average exchange rates in effect during the respective period for revenues and expenses. Exchange rate adjustments resulting from translation of foreign currency financial statements of our international subsidiaries are reflected in accumulated other comprehensive loss in stockholders’ equity until such time that the international subsidiary is sold or liquidation is substantially complete, at which time the related accumulated adjustments would be reclassified into income. Exchange rate adjustments resulting from foreign currency denominated transactions are recorded in income. At December 31, 20212023 and 2020,2022, accumulated other comprehensive loss related to foreign subsidiaries reflected in stockholders’ equity was $61.5$62.8 million and $54.2$67.2 million, respectively.
During the fourth quarter of 2019, we made the decision to wind down our Brazil operations, and during the fourth quarter of 2020, we completed the substantial liquidation of our Brazil subsidiary and recognized an $11.7 million non-cash charge to "impairments and other charges" for the reclassification of cumulative foreign currency translation losses related to our subsidiary in Brazil.
Fair Value Measurement. Fair value is measured as the price that would be received from selling an asset or paid to transfer a liability in an orderly transaction between market participants at a measurement date. We apply the following fair value hierarchy, which prioritizes the inputs used to measure fair value into three levels and bases the categorization within the hierarchy upon the lowest level of input that is available and significant to the fair value measurement:
•Level 1: The use of quoted prices in active markets for identical financial instruments.
•Level 2: The use of quoted prices for similar instruments in active markets or quoted prices for identical or similar instruments in markets that are not active or other inputs that are observable in the market or can be corroborated by observable market data.
•Level 3: The use of significantly unobservable inputs that typically require the use of management’s estimates of assumptions that market participants would use in pricing.
NEWPARK RESOURCES, INC.
NOTES TO CONSOLIDATED FINANCIAL STATEMENTS – (Continued)
New Accounting Pronouncements
Standards Not Yet Adopted in 2021
Segment Reporting. In November 2023, the Financial Accounting Standards Board (“FASB”) issued new guidance which is intended to improve reportable segment disclosure requirements through enhanced disclosures. The amendments require disclosure of significant segment expenses regularly provided to the chief operating decision maker (CODM) as well as other segment items, extend certain annual disclosures to interim periods, clarify the applicability to single reportable segment entities, permit more than one measure of profit or loss to be reported under certain conditions, and require disclosure of the title and position of the CODM. This guidance will be effective for us for the year ended December 31, 2024. We are currently evaluating the impact of the new guidance on our consolidated financial statements and related disclosures.
Income Taxes: Simplifying the Accounting forImprovements to Income Taxes.Tax Disclosures. In December 2019, the FASB issued new guidance intended to simplify various aspects related to accounting for income taxes. We adopted this new guidance as of January 1, 2021. The adoption of this new guidance had no material impact on our financial statements or related disclosures.
Standards Adopted in 2020
Credit Losses: In 2016,2023, the FASB issued new guidance which requires financial assets measured at amortized cost basis, including trade receivables,is intended to enhance the transparency and decision usefulness of income tax disclosures. This guidance will be presented at the net amount expected to be collected. The new guidance requires an entity to estimate its lifetime “expected credit loss”effective for such assets at inception, which will generally resultus in the earlier recognitionfirst quarter of allowances for losses.2025. We adopted this new guidance asare currently evaluating the impact of January 1, 2020 using the modified retrospective transition method, and recorded a net reduction of $0.7 million to opening retained earnings to reflect the cumulative effect of adoption. Results for reporting periods beginning after December 31, 2019 are presented under the new guidance on our consolidated financial statements and related disclosures.
Note 2 — Divestitures and Other Exit Activities
We regularly review our global portfolio of business activities. These reviews focus on evaluating changes in the outlook for our served markets and customer priorities, while prior period amountsidentifying opportunities for value-creating options in our portfolio, and placing investment emphasis in markets where we generate strong returns and where we see greater long-term viability and stability.
2023 Strategic Actions
The following strategic actions were not adjustedtaken in 2023.
Review of Strategic Alternatives for Fluids Systems Business
We initiated a review of strategic alternatives for the long-term positioning of the Fluids Systems division in June 2023, and continuein September 2023, we launched a formal sale process for substantially all the Fluids Systems business as part of this strategic review. While the sale process is ongoing, we considered fourth quarter 2023 developments in the sale process to be reported in accordance with previous guidance. See Note 7a potential indicator of impairment that required us to complete an impairment evaluation. The ongoing Fluids sale process did not meet the held for additional required disclosures.
The cumulative effectsale accounting criteria as of December 31, 2023, and as such, continued to be accounted for as held for use. Accordingly, we completed the impairment evaluation for the geographic asset groups of the changes made to our consolidated balance sheetFluids Systems business and determined that the carrying value exceeded the estimated undiscounted future net cash flows for only the U.S. Land asset group.
We estimated the fair value for the adoptionU.S. Land asset group as of December 31, 2023 based on the expected cash flows to be generated from the anticipated use and eventual disposition of such asset group. We estimated the fair value of the new accounting guidancelong-lived assets of the U.S. Land asset group, requiring us to recognize a $2.5 million impairment charge in the fourth quarter of 2023. As of December 31, 2023, the U.S. Land asset group had approximately $62 million of net assets, including $58 million of net working capital and $11 million of long-lived assets, as well as $3 million of debt.
Exit of Stimulation Chemicals Product Line
In 2023, we made the decision to exit the stimulation chemicals product line. The Fluids Systems segment operating results for credit losses were2023 includes $1.6 million of total charges (included in impairments and other charges) for inventory write-downs to reduce the carrying values of certain inventory related to the exit of our stimulation chemicals product line to their net realizable value. As of December 31, 2023, we had $2.1 million of inventory remaining related to the stimulation chemicals product line.
Exit of Offshore Australia Operations
In 2023, we made the decision to exit our offshore Australia operations. The Fluids Systems segment operating results for 2023 includes $1.5 million of total charges (included in impairments and other charges) for inventory write-downs to reduce the carrying values of certain inventory related to the exit of our offshore Australia operations to their net realizable value as follows:well as impairments related to the long-lived assets previously used in the now exited business.
| | | | | | | | | | | | | | | | | |
| (In thousands) | Balance at December 31, 2019 | | Impact of Adoption of New Credit Losses Guidance | | Balance at January 1, 2020 |
| Receivables, net | $ | 216,714 | | | $ | (959) | | | $ | 215,755 | |
| Deferred tax assets | 3,600 | | | 59 | | | 3,659 | |
| Deferred tax liabilities | 34,247 | | | (165) | | | 34,082 | |
| Retained earnings | 134,119 | | | (735) | | | 133,384 | |
NEWPARK RESOURCES, INC.
NOTES TO CONSOLIDATED FINANCIAL STATEMENTS – (Continued)
Note 2 — Business CombinationsIn 2023, we completed our customer contract in Chile, and during the fourth quarter of 2023, we completed the substantial liquidation of our Chile subsidiary and recognized an $0.8 million non-cash charge (included in impairments and other charges) for the reclassification of cumulative foreign currency translation losses related to our subsidiary in Chile.
2022 Strategic Actions
The following strategic actions were taken in 2022.
Exit of Industrial Blending Segment and Sale of Conroe, Texas Blending Facility
In December 2021,the first quarter of 2022, in consideration of broader strategic priorities and the timeline and efforts required to further develop the industrial blending business, we acquiredexited our Industrial Blending operations. In November 2022, we completed the sale of the industrial blending and warehouse facility and related equipment located in Conroe, Texas to a global chemical provider, for cash proceeds of approximately $14 million. In connection with this divestiture, we recognized a $7.9 million impairment charge related to these long-lived assets in the second quarter of 2022, and subsequently recognized a gain of $2.6 million upon the eventual sale in the fourth quarter of 2022.
Sale of Excalibar U.S. Mineral Grinding Business
In November 2022, we completed the sale of substantially all the long-lived assets, inventory, and operations of our Excalibar U.S. mineral grinding business (“Excalibar”), which was reported within our Fluids Systems segment, to Cimbar Resources, INC. (“Cimbar”), and received cash proceeds (after purchase price adjustments) of approximately $51 million and recognized a gain of $1.0 million. The Company retained certain assets and assumedliabilities, including accounts receivable and accounts payable. Such working capital provided approximately $10 million of cash generation in the fourth quarter of 2022 and approximately $6 million of additional cash generation in the first quarter of 2023. In connection with the sale, the Company and Cimbar entered into a long-term barite supply agreement for certain liabilitiesregions of Lentzcaping, Inc.our U.S. drilling fluids business, with an initial term of four years following the closing of the transaction.
Exit of Gulf of Mexico Operations
In the third quarter of 2022, our Board of Directors approved management’s plan to exit our Fluids Systems Gulf of Mexico operations, including the potential sale of related assets. In December 2022, we completed the sale of substantially all assets associated with our Gulf of Mexico completion fluids operations. Separately, we also entered a seven-year arrangement to sublease our Fourchon, Louisiana drilling fluids shorebase and Lentzcaping, LLC (together, "Lentzcaping"). Lentzcapingblending facility to a leading global energy services provider. As part of this arrangement, substantially all of our Gulf of Mexico drilling fluids inventory has been a valued partner for Newpark in recent years, primarily serving utility transmission customerssold to the lessee as consumed. These transactions provided cash generation of approximately $6 million in the Northeast U.S.fourth quarter of 2022 and providing a variety of complementary services, including worksite planning and preparation, temporary access, and worksite restoration. The purchase priceapproximately $28 million in 2023. Fluids Systems segment operating income for this acquisition was $13.52023 includes $4.8 million net of cash acquired, and was funded with borrowings under the ABL Facility. The results of operations of Lentzcaping are reported within the Industrial Solutions segment for the period subsequentin charges related to the dateexit of our Gulf of Mexico operations, which was substantially completed during the second quarter of 2023.
As a result of the acquisition.
The Lentzcaping transaction has been recorded usingplan to exit the acquisition methodGulf of accounting and accordingly, assets acquired and liabilities assumed were recorded at their estimated fair valuesMexico operations as ofdescribed above, we considered the acquisition date. The acquisition resulted in the recognition of $3.3 million in other intangible assets, consisting primarily of customer relationships and tradename. The customer relationships and tradename are finite-lived intangible assets that are expectedthird quarter 2022 developments to be amortized over periodsa potential indicator of 15 years and 2 years, respectively. In addition, the acquisition resulted in the recognition of a $2.1 million intangible liabilityimpairment that will be amortizedrequired us to operating expense over the 7-year contract term. The excess of the total consideration was recorded as goodwill, which is deductible for tax purposes. The fair values of the identifiable assets acquired and liabilities assumed were based on our estimates and assumptions using various market, income, and cost valuation approaches, which are classified within level 3 ofcomplete an impairment evaluation. Accordingly, we estimated the fair value hierarchy.
The following table summarizes the preliminary amounts recognized for theour Gulf of Mexico assets acquired and liabilities assumed as of September 30, 2022 based on the December 17, 2021 acquisition date.expected cash flows to be generated from the anticipated transactions and determined that a $21.5 million impairment charge was required related to the long-lived assets. We also recognized an $8.0 million charge to reduce the carrying value of inventory to their net realizable value primarily based on the anticipated transactions. The total charges of $29.4 million were recorded to impairments and other charges in the third quarter of 2022.
NEWPARK RESOURCES, INC.
NOTES TO CONSOLIDATED FINANCIAL STATEMENTS – (Continued)
Total impairments and other charges are shown in the following table:
| | | | | | | | | | | |
| | Year Ended December 31, |
| (In thousands) | 2023 | | 2022 |
| Fluids U.S. Land - Long-lived assets impairment | 2,485 | | | — | |
| Stimulation chemicals product line - Inventory write-downs | 1,576 | | | — | |
| Australia - Inventory write-downs | 1,058 | | | — | |
| Australia - Long-lived assets impairment | 439 | | | — | |
| Chile exit - Recognition of cumulative foreign currency translation losses | 798 | | | — | |
| Industrial Blending - Long-lived assets impairment | — | | | 7,905 | |
| Gulf of Mexico - Long-lived assets impairment | — | | | 21,461 | |
| Gulf of Mexico - Inventory write-downs | — | | | 7,956 | |
| Total impairments and other charges | $ | 6,356 | | | $ | 37,322 | |
Summarized operating results of the business units exited in 2022 (including impairments and other charges described above) are shown in the following table:
| | | | | | | | | | | | | | | | | |
| | Year Ended December 31, |
| (In thousands) | 2023 | | 2022 | | 2021 |
| Revenues | | | | | |
| Industrial Blending | $ | — | | | $ | — | | | $ | 8,821 | |
| Excalibar | — | | | 55,990 | | | 36,396 | |
| Gulf of Mexico | — | | | 26,708 | | | 25,366 | |
| $ | — | | | $ | 82,698 | | | $ | 70,583 | |
| | | | | |
| Operating income (loss) | | | | | |
| Industrial Blending | $ | — | | | $ | (8,002) | | | $ | (2,384) | |
| Excalibar | — | | | 3,665 | | | (277) | |
| Gulf of Mexico | (4,776) | | | (43,215) | | | (6,753) | |
| $ | (4,776) | | | $ | (47,552) | | | $ | (9,414) | |
Summarized net assets related to the business units exited in 2022 are shown in the following table:
| | | | | |
| (In thousands) | December 31, 2022 |
| Receivables, net | $ | 2,80727,798 | |
Intangible assetsInventories | 3,3305,805 | |
Property, plant and equipmentAccounts payable | 4,765 (2,060) | |
Other assetsAccrued liabilities | 346 (311) | |
Total net assets acquired | 11,248 | |
| |
Intangible liability | 2,065 | |
Other liabilities | 604 | |
Total liabilities assumed | 2,669 | |
| |
Net assets purchased | 8,579 | |
Goodwill | 4,871 | |
Total purchase consideration | 13,450 | |
| |
Net cash conveyed at closing | 13,434 | |
Due to seller | 16 | |
Total purchase consideration | $ | 13,45031,232 | |
In October 2019, we completed the acquisitionThe net assets remaining as of Cleansorb Limited (“Cleansorb”), a U.K. based provider of specialty chemicals for the oil and natural gas industry, which further expanded our completion fluids technology portfolio and capabilities. The purchase price for this acquisition was $18.7 million, net of cash acquired, and was funded with borrowings under the ABL Facility. The results of operations of Cleansorb are reported within the Fluids Systems segment for the period subsequentDecember 31, 2022 related to the dateretained working capital from the Excalibar sale and the remaining Gulf of Mexico net assets. During 2023, we substantially settled the acquisition.
Resultsabove net assets related to the now exited Excalibar business and Gulf of operations and pro-forma combined results of operations for these acquired businesses have not been presented as the effect of these acquisitions are not material to our consolidated financial statements.Mexico operations.
NEWPARK RESOURCES, INC.
NOTES TO CONSOLIDATED FINANCIAL STATEMENTS – (Continued)
Note 3 — Inventories
Inventories consisted of the following at December 31:
| | (In thousands) | (In thousands) | 2021 | | 2020 | (In thousands) | 2023 | | 2022 |
| Raw materials: | Raw materials: | | | | Raw materials: | | | |
| Fluids Systems | Fluids Systems | $ | 119,242 | | | $ | 98,974 | |
| Industrial Solutions | Industrial Solutions | 4,939 | | | 6,315 | |
| Total raw materials | Total raw materials | 124,181 | | | 105,289 | |
| Blended fluids systems components | Blended fluids systems components | 27,793 | | | 31,744 | |
Finished goods — mats | Finished goods — mats | 3,367 | | | 10,824 | |
| Total inventories | Total inventories | $ | 155,341 | | | $ | 147,857 | |
Raw materials for the Fluids Systems segment consist primarily of barite, chemicals and other additives that are consumed in the production of our fluids systems. Raw materials for the Industrial Solutions segment consist primarily of resins, chemicals, and other materials used to manufacture composite mats, and cleaning products, as well as materials that are consumed in providing spill containment and other services to our customers. Our blended fluids systems components consist of base fluids systems that have been either mixed internally at our blending facilities or purchased from third-party vendors. These base fluids systems require raw materials to be added, as needed to meet specified customer requirements.
The Fluids Systems segment cost of revenuesoperating results for 20202023 includes $10.3$2.6 million of total charges for inventory write-downs primarily attributable to the reductionincluded in carrying values of certain inventory to their net realizable value.impairments and other charges (as described in Note 2).
Note 4 — Property, Plant and Equipment
Property, plant and equipment consisted of the following at December 31:
| | (In thousands) | (In thousands) | 2021 | | 2020 | (In thousands) | 2023 | | 2022 |
| Land | Land | $ | 11,820 | | | $ | 11,901 | |
| Buildings and improvements | Buildings and improvements | 118,395 | | | 122,961 | |
| Machinery and equipment | Machinery and equipment | 282,258 | | | 285,678 | |
| Computer hardware and software | Computer hardware and software | 48,389 | | | 46,801 | |
| Furniture and fixtures | Furniture and fixtures | 5,879 | | | 5,955 | |
| Construction in progress | Construction in progress | 8,194 | | | 6,958 | |
| | | 474,935 | | | 480,254 | |
| Less accumulated depreciation | Less accumulated depreciation | (287,046) | | | (268,862) | |
| | | 187,889 | | | 211,392 | |
| | Composite mats (rental fleet) | Composite mats (rental fleet) | 135,975 | | | 126,617 | |
| Composite mats (rental fleet) | |
| Composite mats (rental fleet) | |
| Less accumulated depreciation - composite mats | Less accumulated depreciation - composite mats | (63,608) | | | (60,313) | |
| | | 72,367 | | | 66,304 | |
| | Property, plant and equipment, net | Property, plant and equipment, net | $ | 260,256 | | | $ | 277,696 | |
| Property, plant and equipment, net | |
| Property, plant and equipment, net | |
Depreciation expense was $28.0 million, $35.0 million, and $38.5 million $40.9 million,in 2023, 2022 and $42.8 million in 2021, 2020 and 2019, respectively. The Fluids Systems segment operating results for 2023 includes a $3.0$2.9 million impairment chargeof total charges for 2020, attributable to the abandonment of certain property, plant and equipment.long-lived assets impairments (as described in Note 2).
NEWPARK RESOURCES, INC.
NOTES TO CONSOLIDATED FINANCIAL STATEMENTS – (Continued)
Note 5 — Goodwill and Other Intangible Assets
Changes in the carrying amount of goodwill, by reportableall of which relates to the Industrial Solutions segment, are as follows:
| | | | | | | | | | | | | | | | | |
| (In thousands) | Fluids Systems | | Industrial Solutions | | Total |
| Balance at December 31, 2019 | $ | — | | | $ | 42,332 | | | $ | 42,332 | |
| Effects of foreign currency | — | | | 112 | | | 112 | |
| Balance at December 31, 2020 | — | | | 42,444 | | | 42,444 | |
| Acquisition | — | | | 4,871 | | | 4,871 | |
| Effects of foreign currency | — | | | (32) | | | (32) | |
| Balance at December 31, 2021 | $ | — | | | $ | 47,283 | | | $ | 47,283 | |
| | | | | | | | |
| (In thousands) | | Industrial Solutions |
| Balance at December 31, 2021 | | $ | 47,283 | |
| Effects of foreign currency | | (173) | |
| Balance at December 31, 2022 | | 47,110 | |
| Effects of foreign currency | | 173 | |
| Balance at December 31, 2023 | | $ | 47,283 | |
We completed the annual evaluation of the carrying value of our goodwill and other indefinite-lived intangible assets as of November 1, 20212023 and determined that the fair value was in excess ofsignificantly more than the net carrying value, and therefore, no impairment was required.
In March 2020, primarily as a result of the collapse in oil prices and the expected declines in the U.S. land E&P markets, along with a significant decline in the quoted market prices of our common stock, we considered these developments to be a potential indicator of impairment that required us to complete an interim goodwill impairment evaluation. As such, in March 2020, we estimated the fair value of our Site and Access Solutions reporting unit based on our current forecasts and expectations for market conditions and determined that even though the estimated fair value had decreased from our 2019 annual evaluation, the fair value remained substantially in excess of its net carrying value, and therefore, no impairment was required. During the second quarter and third quarter of 2020, we determined that there were no further indicators of events or changes in circumstances that would more likely than not reduce the fair value below its carrying amount. We completed the annual evaluation of the carrying value of our goodwill and other indefinite-lived intangible assets as of November 1, 2020 and determined that the fair value was in excess of the net carrying value, and therefore, no impairment was required.
In 2019, as a result of the decline in drilling activities and the projection of continued softness in the U.S. land market, as well as the decline in the quoted market prices of our common stock, we determined that it was more likely than not that the carrying value of our Fluids Systems reporting unit exceeded its estimated fair value such that goodwill was potentially impaired. As a result, we completed the evaluation to measure the amount of goodwill impairment determining a full impairment of goodwill related to the Fluids Systems reporting unit was required. As such, in the fourth quarter of 2019, we recognized an $11.4 million non-cash impairment charge to write-off all the goodwill related to the Fluids Systems reporting unit.
Our impairment test includes a comparison of the carrying value of net assets of our reporting units, including goodwill, with their estimated fair values, which we estimate using a combination of a market multiple and discounted cash flow approach. Significant assumptions inherent in the evaluation include the estimated growth rates for future revenues and the discount rate. Our assumptions are based on historical data supplemented by current and anticipated market conditions.
Other intangible assets consisted of the following:
| | | | December 31, 2021 | | December 31, 2020 | | December 31, 2023 | | December 31, 2022 |
| (In thousands) | (In thousands) | Gross
Carrying
Amount | | Accumulated
Amortization | | Other
Intangible
Assets, Net | | Gross
Carrying
Amount | | Accumulated
Amortization | | Other
Intangible
Assets, Net | (In thousands) | Gross
Carrying
Amount | | Accumulated
Amortization | | Other
Intangible
Assets, Net | | Gross
Carrying
Amount | | Accumulated
Amortization | | Other
Intangible
Assets, Net |
| Technology related | Technology related | $ | 20,315 | | | $ | (9,201) | | | $ | 11,114 | | | $ | 20,398 | | | $ | (7,958) | | | $ | 12,440 | |
| Customer related | Customer related | 37,176 | | | (23,843) | | | 13,333 | | | 33,891 | | | (21,458) | | | 12,433 | |
| Total amortizing intangible assets | 57,491 | | | (33,044) | | | 24,447 | | | 54,289 | | | (29,416) | | | 24,873 | |
| | Permits and licenses | Permits and licenses | 512 | | | — | | | 512 | | | 555 | | | — | | | 555 | |
| Total indefinite-lived intangible assets | 512 | | | — | | | 512 | | | 555 | | | — | | | 555 | |
| Total intangible assets | Total intangible assets | $ | 58,003 | | | $ | (33,044) | | | $ | 24,959 | | | $ | 54,844 | | | $ | (29,416) | | | $ | 25,428 | |
Total amortization expense related to other intangible assets was $3.4 million, $3.6 million and $3.7 million $4.5 millionin 2023, 2022 and $4.4 million2021, respectively. The decrease in 2021, 2020the gross carrying amount of intangible assets in 2023 was attributable to a write-off of fully amortized balances.
Estimated future amortization expense for the years ended December 31 is as follows:
| | | | | | | | | | | | | | | | | | | | | | | | | | | | | | | | | | | | | | | | | |
| (In thousands) | 2024 | | 2025 | | 2026 | | 2027 | | 2028 | | Thereafter | | Total |
| Technology related | $ | 1,050 | | | $ | 1,035 | | | $ | 1,034 | | | $ | 1,019 | | | $ | 944 | | | $ | 3,584 | | | $ | 8,666 | |
| Customer related | 1,798 | | | 1,535 | | | 1,268 | | | 1,009 | | | 766 | | | 1,753 | | | 8,129 | |
| Permits and licenses | 160 | | | 159 | | | — | | | — | | | — | | | — | | | 319 | |
| Total future amortization expense | $ | 3,008 | | | $ | 2,729 | | | $ | 2,302 | | | $ | 2,028 | | | $ | 1,710 | | | $ | 5,337 | | | $ | 17,114 | |
The weighted average amortization period for technology related, customer related, and 2019,permits and licenses intangible assets is 15 years, 13 years, and 3 years, respectively.
NEWPARK RESOURCES, INC.
NOTES TO CONSOLIDATED FINANCIAL STATEMENTS – (Continued)
Note 6 — Financing Arrangements
Financing arrangements consisted of the following:
| | | | | | | | | | | | | | | | | | | | | | | | | | | | | | | | | | | |
| December 31, 2023 | | December 31, 2022 |
| (In thousands) | Principal Amount | | Unamortized Discount and Debt Issuance Costs | | Total Debt | | Principal Amount | | Unamortized Discount and Debt Issuance Costs | | Total Debt |
| Amended ABL Facility | $ | 45,000 | | | $ | — | | | $ | 45,000 | | | $ | 80,300 | | | $ | — | | | $ | 80,300 | |
| Foreign subsidiary facilities | 11,394 | | | — | | | 11,394 | | | 16,081 | | | — | | | 16,081 | |
| Finance leases | 9,899 | | | — | | | 9,899 | | | 4,999 | | | — | | | 4,999 | |
| U.K. term loan | 5,793 | | | (49) | | | 5,744 | | | 7,201 | | | (99) | | | 7,102 | |
| Other debt | 3,007 | | | (11) | | | 2,996 | | | 5,668 | | | (35) | | | 5,633 | |
| Total debt | 75,093 | | | (60) | | | 75,033 | | | 114,249 | | | (134) | | | 114,115 | |
| Less: current portion | (16,916) | | | — | | | (16,916) | | | (22,438) | | | — | | | (22,438) | |
| Long-term debt | $ | 58,177 | | | $ | (60) | | | $ | 58,117 | | | $ | 91,811 | | | $ | (134) | | | $ | 91,677 | |
Asset-Based Loan Facility. In October 2017, we entered into a U.S. asset-based revolving credit agreement, which was amended in March 2019 and amended and restated in May 2022 (the “Amended ABL Facility”). The Amended ABL Facility provides financing of up to $175.0 million available for borrowings (inclusive of letters of credit), which can be increased up to $250.0 million, subject to certain conditions. The Amended ABL Facility has a five-year term expiring May 2027, is based on a Bloomberg Short-Term Bank Yield Index (“BSBY”) pricing grid, and includes a mechanism to incorporate a sustainability-linked pricing framework with the consent of the required lenders (as defined in the Amended ABL Facility).
As of December 31, 2023, our total availability under the Amended ABL Facility was $109.2 million, of which $45.0 million was drawn and $4.0 million was used for outstanding letters of credit, resulting in remaining availability of $60.2 million.
Borrowing availability under the Amended ABL Facility is calculated based on eligible U.S. accounts receivable, inventory and composite mats included in the rental fleet, net of reserves and subject to limits on certain of the assets included in the borrowing base calculation. To the extent pledged by the borrowers, the borrowing base calculation also includes the amount of eligible pledged cash. The administrative agent may establish reserves in accordance with the Amended ABL Facility, in part based on appraisals of the asset base, and other limits in its discretion, which could reduce the amounts otherwise available under the Amended ABL Facility.
Under the terms of the Amended ABL Facility, we may elect to borrow at a variable interest rate based on either, (1) the BSBY rate (subject to a floor of zero) or (2) the base rate (subject to a floor of zero), equal to the highest of (a) the federal funds rate plus 0.50%, (b) the prime rate of Bank of America, N.A., and (c) BSBY for a one-month interest period plus 1.00%, plus, in each case, an applicable margin per annum. The applicable margin ranges from 1.50% to 2.00% per annum for BSBY borrowings, and 0.50% to 1.00% per annum for base rate borrowings, based on the consolidated leverage ratio (as defined in the Amended ABL Facility) as of the last day of the most recent fiscal quarter. We are also required to pay a commitment fee equal to (i) 0.375% per annum at any time the average daily unused portion of the commitments is greater than 50% and (ii) 0.25% per annum at any time the average daily unused portion of the commitments is less than 50%.
As of December 31, 2023, the applicable margin for borrowings under the Amended ABL Facility was 1.50% with respect to BSBY borrowings and 0.50% with respect to base rate borrowings. As of December 31, 2023, the weighted average interest rate for the Amended ABL Facility was 6.9% and the applicable commitment fee on the unused portion of the Amended ABL Facility was 0.375% per annum.
The Amended ABL Facility is a senior secured obligation of the Company and certain of our U.S. subsidiaries constituting borrowers thereunder, secured by a first priority lien on substantially all of the personal property and certain real property of the borrowers, including a first priority lien on certain equity interests of direct or indirect domestic subsidiaries of the borrowers and certain equity interests issued by certain foreign subsidiaries of the borrowers.
The Amended ABL Facility contains customary representations, warranties and covenants that, among other things, and subject to certain specified circumstances and exceptions, restrict or limit the ability of the borrowers and certain of their subsidiaries to incur indebtedness (including guarantees), grant liens, make investments, pay dividends or distributions with
NEWPARK RESOURCES, INC.
NOTES TO CONSOLIDATED FINANCIAL STATEMENTS – (Continued)
In December 2021, we completedrespect to capital stock and make other restricted payments, make prepayments on certain indebtedness, engage in mergers or other fundamental changes, dispose of property, and change the acquisitionnature of Lentzcaping, which resulted in additionstheir business.
The Amended ABL Facility requires compliance with the following financial covenants: (i) a minimum fixed charge coverage ratio of 1.00 to amortizable intangible assets of $3.3 million. See Note 2 for additional information.
Estimated future amortization expense1.00 for the years ended December 31most recently completed four fiscal quarters and (ii) while a leverage covenant trigger period (as defined in the Amended ABL Facility) is in effect, a maximum consolidated leverage ratio of 4.00 to 1.00 as follows:
| | | | | | | | | | | | | | | | | | | | | | | | | | | | | | | | | | | | | | | | | |
| (In thousands) | 2022 | | 2023 | | 2024 | | 2025 | | 2026 | | Thereafter | | Total |
| Technology related | $ | 1,245 | | | $ | 1,073 | | | $ | 1,051 | | | $ | 1,049 | | | $ | 1,049 | | | $ | 5,647 | | | $ | 11,114 | |
| Customer related | 2,785 | | | 2,260 | | | 1,843 | | | 1,533 | | | 1,268 | | | 3,644 | | | 13,333 | |
| Total future amortization expense | $ | 4,030 | | | $ | 3,333 | | | $ | 2,894 | | | $ | 2,582 | | | $ | 2,317 | | | $ | 9,291 | | | $ | 24,447 | |
The weighted average amortization period for technology relatedAmended ABL Facility includes customary events of default including non-payment of principal, interest or fees, violation of covenants, inaccuracy of representations or warranties, cross-default to other material indebtedness, bankruptcy and customer related intangible assets is 14 yearsinsolvency events, invalidity or impairment of security interests or invalidity of loan documents, certain ERISA events, unsatisfied or unstayed judgments and 13 years, respectively.
Note 6 — Financing Arrangements
Financing arrangements consistedchange of the following:
| | | | | | | | | | | | | | | | | | | | | | | | | | | | | | | | | | | |
| December 31, 2021 | | December 31, 2020 |
| (In thousands) | Principal Amount | | Unamortized Discount and Debt Issuance Costs | | Total Debt | | Principal Amount | | Unamortized Discount and Debt Issuance Costs | | Total Debt |
| Convertible Notes | $ | — | | | $ | — | | | $ | — | | | $ | 66,912 | | | $ | (4,221) | | | $ | 62,691 | |
| ABL Facility | 86,500 | | | — | | | 86,500 | | | 19,100 | | | — | | | 19,100 | |
| Term loan | 6,094 | | | (110) | | | 5,984 | | | — | | | — | | | — | |
| Financing obligation | 6,688 | | | (78) | | | 6,610 | | | — | | | — | | | — | |
| Other debt | 15,709 | | | — | | | 15,709 | | | 5,371 | | | — | | | 5,371 | |
| Total debt | 114,991 | | | (188) | | | 114,803 | | | 91,383 | | | (4,221) | | | 87,162 | |
| Less: current portion | (19,210) | | | — | | | (19,210) | | | (71,693) | | | 4,221 | | | (67,472) | |
| Long-term debt | $ | 95,781 | | | $ | (188) | | | $ | 95,593 | | | $ | 19,690 | | | $ | — | | | $ | 19,690 | |
control.
Convertible Notes. In December 2016, we issued $100.0 million of unsecured convertible senior notes (“Convertible(the “Convertible Notes”) that matured on December 1, 2021. The noteswhich bore interest at a rate of 4.0% per year payable semiannuallyand matured in arrears on June 1 and December 12021. A total of each year. The conversion rate was 107.1381 shares of our common stock per $1,000 principal amount of notes (equivalent to an initial conversion price of $9.33 per share of common stock), subject to adjustment in certain circumstances.
During 2020, we repurchased $33.1$38.6 million of our Convertible Notes in the open market for a total cost of $29.1 million, and recognized a net gain of $0.4 million reflecting the difference in the amount paid and the net carrying value of the extinguished debt, including original issue discount and debt issuance costs.were repaid at maturity. During 2021, we repurchased $28.3 million of our Convertible Notes in the open market for a total cost of $28.1 million and recognized a net loss of $1.0 million reflecting the difference in the amount paid and the net carrying value of the extinguished debt, including original issue discount and debt issuance costs. The remaining $38.6 million
Other Financing Arrangements. Certain of our Convertible Notes were repaid at maturityforeign subsidiaries maintain local credit arrangements consisting primarily of lines of credit or overdraft facilities which are generally renewed on an annual basis. We utilize local financing arrangements in December 2021.
Asset-Based Loan Facility.our foreign operations in order to provide short-term local liquidity needs. In May 2016, weaddition, in April 2022, a U.K. subsidiary entered into an asset-baseda £7.0 million term loan and a £2.0 million revolving credit agreement, which was amendedfacility. Both the term loan and revolving credit facility mature in October 2017April 2025 and in March 2019 (as amended, the “ABL Facility”). The ABL Facility provides financingbear interest at a rate of up to $200.0 million available for borrowings (inclusiveSterling Overnight Index Average plus a margin of letters of credit) and can be increased up to a maximum capacity of $275.0 million, subject to certain conditions. The ABL Facility terminates in March 2024.
3.25% per year. As of December 31, 2021, our total availability under2023, the ABL Facility was $116.3 million, of which $86.5 million was drawn and $1.1 million was used for outstanding letters of credit, resulting in remaining availability of $28.7 million. As of February 24, 2022, our total availability under the ABL Facility was $124.7 million, of which $83.7 million was drawn and $1.1 million was used for outstanding letters of credit, resulting in remaining availability of $39.9 million.
Borrowing availability under the ABL Facility is calculated based on eligible U.S. accounts receivable, inventory, and, subject to satisfaction of certain financial covenants as described below, composite mats included in the rental fleet, net of reserves and limits on such assets included in the borrowing base calculation. To the extent pledged by us, the borrowing base
NEWPARK RESOURCES, INC.
NOTES TO CONSOLIDATED FINANCIAL STATEMENTS – (Continued)
calculation also includes the amount of eligible pledged cash. The lender may establish such reserves, in part based on appraisals of the asset base, and other limits at its discretion which could reduce the amounts otherwise available under the ABL Facility. Availability associated with eligible rental mats will also be subject to maintaining a minimum consolidated fixed charge coverage ratio of 1.5 to 1.0 and at least $1.0 million of operating income for the Site and Access Solutions business, each calculated based on a trailing twelve-month period.
Under the terms of the ABL Facility, we may elect to borrow at a variable interest rate based on either, (1) LIBOR subject to a floor of zero or (2) a base rate equal to the highest of: (a) the federal funds rate plus 50 basis points, (b) the prime rate of Bank of America, N.A. and (c) LIBOR, subject to a floor of zero, plus 100 basis points, plus, in each case, an applicable margin per annum. The applicable margin ranges from 150 to 200 basis points for LIBOR borrowings, and 50 to 100 basis points for base rate borrowings, based on the consolidated fixed charge coverage ratio as defined in the ABL Facility. As of December 31, 2021, the applicable margin for borrowings under our ABL Facility was 150 basis points with respect to LIBOR borrowings and 50 basis points with respect to base rate borrowings. The weighted average interest rate for outstanding borrowings under the ABL FacilityU.K. facilities was 1.6% at December 31, 2021. In addition, we are required to pay a commitment fee on the unused portion8.7%. The term loan is payable in quarterly installments of the ABL Facility ranging from 25 to 37.5 basis points, based on the level of outstanding borrowings, as defined in the ABL Facility. As of December 31, 2021, the applicable commitment fee was 37.5 basis points.
The ABL Facility is a senior secured obligation, secured by first liens on substantially all of our U.S. tangible and intangible assets,£350,000 plus interest beginning June 2022 and a portion of the capital stock of our non-U.S. subsidiaries has£2.8 million payment due at maturity. We also been pledged as collateral. The ABL Facility contains customary operating covenants and certain restrictions including, among other things, those relatingmaintain finance leases primarily related to the incurrence of additional debt, liens, dividends, asset sales, investments, mergers, acquisitions, affiliate transactions, stock repurchases and other restricted payments. The ABL Facility also requires a minimum consolidated fixed charge coverage ratio of 1.0 to 1.0 calculated based on a trailing twelve-month period if availability under the ABL Facility falls below $22.5 million. In addition, the ABL Facility contains customary events of default, including, without limitation, a failure to make payments under the facility, acceleration of more than $25.0 million of other indebtedness, certain bankruptcy events, and certain change of control events.transportation equipment.
Other Debt.In August 2021, we completed sale-leaseback transactions related to certain vehicles and other equipment for net proceeds of approximately $7.9 million. The transactions have been accounted for as financing arrangements as they did not qualify for sale accounting. As a result, the vehicles and other equipment continue to be reflected on our balance sheet in property, plant and equipment, net. The financing arrangements have a weighted average annual interest rate of 5.4% and are payable in monthly installments with varying maturities through October 2025. We had $6.7 million in financing obligations outstanding under these arrangements at December 31, 2021.
In February 2021, a U.K. subsidiary entered a £6.0 million (approximately $8.3 million) term loan facility that matures in February 2024. The term loan bears interest at a rate of LIBOR plus a margin of 3.4% per year, payable in quarterly installments of £375,000 plus interest beginning March 2021 and a £1.5 million payment due at maturity. Effective January 1, 2022, the term loan bears interest at a rate of SONIA plus a margin of 3.5% per year. We had $6.1 million outstanding under this arrangement at December 31, 2021.
Certain of our foreign subsidiaries maintain local credit arrangements consisting primarily of lines of credit or overdraft facilities which are generally renewed on an annual basis. We utilize local financing arrangements in our foreign operations in order to provide short-term local liquidity needs. We had $11.8 million and $3.5 million outstanding under these arrangements at December 31, 2021 and 2020, respectively.
We incurred net interest expense of $8.8$8.2 million, $11.0$7.0 million and $14.4$8.8 million for the years ended December 31, 2021, 20202023, 2022 and 2019,2021, respectively. There was no capitalized interest for the years ended December 31, 2021, 20202023, 2022 or 2019.2021. As of December 31, 2021,2023, we had scheduled repayments for financing arrangements of approximately $19$17 million in 2022, $52024, $9 million in 2023, and $912025, $3 million in 2024.2026, and $46 million in 2027.
NEWPARK RESOURCES, INC.
NOTES TO CONSOLIDATED FINANCIAL STATEMENTS – (Continued)
Note 7 — Fair Value of Financial Instruments and Concentrations of Credit Risk
Fair Value of Financial Instruments
Our financial instruments include cash and cash equivalents, receivables, payables, and debt. We believe the carrying values of these instruments with the exception of our Convertible Notes at December 31, 2020, approximated their fair values at December 31, 20212023 and 2020. The estimated fair value of our Convertible Notes was $61.1 million at December 31, 2020, based on quoted market prices at such date.
NEWPARK RESOURCES, INC.
NOTES TO CONSOLIDATED FINANCIAL STATEMENTS – (Continued)
2022.Concentrations of Credit Risk
Financial instruments that potentially subject us to significant concentrations of credit risk primarily consist of cash and trade accounts receivable. At December 31, 2021,2023, substantially all of our cash deposits were held by our international subsidiaries in accounts at numerous financial institutions across the various regions in which we operate. A majority of the cash was held in accounts that maintain deposit ratings of P-1 by Moody’s, A-1 by Standard & Poor’s, and F1 by Fitch. As part of our investment strategy, we perform periodic evaluations of the relative credit standing of these financial institutions.
Customer Revenue Concentration
We derive a significant portion of our revenues and profitability from companies in the energy industry, and more specifically, customers in the E&P and utility sectors. Our E&P customer base consists primarily of mid-sized and international oil companies as well as government-owned or government-controlled oil companies operating in the markets that we serve. Our utility customer base consists primarily of power transmission service providers, as well as large regulated electrical utility providers as well as power transmission service providers. For 2021, 20202023, 2022 and 2019,2021, revenues from our 20 largest customers represented approximately 39%42%, 49%38% and 42%39%, respectively, of our consolidated revenues. For 2021, 20202023, 2022 and 2019,2021, no single customer accounted for more than 10% of our consolidated revenues.
Receivables
Receivables consisted of the following at December 31:
| | (In thousands) | (In thousands) | 2021 | | 2020 | (In thousands) | 2023 | | 2022 |
| Trade receivables: | Trade receivables: | |
| Gross trade receivables | |
| Gross trade receivables | |
| Gross trade receivables | Gross trade receivables | $ | 185,065 | | | $ | 133,717 | |
| Allowance for credit losses | Allowance for credit losses | (4,587) | | | (5,024) | |
| Net trade receivables | Net trade receivables | 180,478 | | | 128,693 | |
| Income tax receivables | Income tax receivables | 4,167 | | | 6,545 | |
| Other receivables | Other receivables | 9,651 | | | 5,807 | |
| Total receivables, net | Total receivables, net | $ | 194,296 | | | $ | 141,045 | |
The decrease in trade receivables in 2023 was primarily attributable to the decrease in Fluids Systems revenues in the fourth quarter of 2023 compared to the fourth quarter of 2022, as well as collection of trade receivable amounts outstanding related to our divestitures (as described in Note 2). Other receivables include $5.7as of December 31, 2022 included $10.8 million for non-trade receivables related to our divestitures. Other receivables also included $3.6 million and $4.4$3.5 million for value added, goods and service taxes related to foreign jurisdictions as of December 31, 20212023 and 2020,2022, respectively. Other receivables at December 31, 2021 also includes $1.9 million for an insurance claim.
We adopted the new accounting guidance for credit losses as of January 1, 2020 (see Note 1 for additional information). To measure expected credit losses, we evaluate our receivables on a collective basis for assets that share similar risk characteristics. Our allowance for credit losses reflects losses that are expected over the contractual life of the asset, and takes into account historical loss experience, current and future economic conditions, and reasonable and supportable forecasts.
Changes in our allowance for credit losses were as follows:
| | (In thousands) | (In thousands) | 2021 | | 2020 | | 2019 | (In thousands) | 2023 | | 2022 | | 2021 |
| Balance at beginning of year | Balance at beginning of year | $ | 5,024 | | | $ | 6,007 | | | $ | 10,034 | |
| Cumulative effect of accounting change | — | | | 959 | | | — | |
| Credit loss expense | Credit loss expense | 664 | | | 1,427 | | | 1,792 | |
| Write-offs, net of recoveries | Write-offs, net of recoveries | (1,101) | | | (3,369) | | | (5,819) | |
| Balance at end of year | Balance at end of year | $ | 4,587 | | | $ | 5,024 | | | $ | 6,007 | |
NEWPARK RESOURCES, INC.
NOTES TO CONSOLIDATED FINANCIAL STATEMENTS – (Continued)
Note 8 — Leases
We lease certain office space, manufacturing facilities, warehouses, land, equipment, and equipment.an industrial facility. Our leases have remaining terms ranging from 1 to 108 years with various extension and termination options. We consider these options in determining the lease term used to establish our operating lease assets and liabilities. Lease agreements with lease and non-lease components are accounted for as a single lease component. Leases with an initial term of 12 months or less are not recorded in the balance sheet; we recognize lease expense for these leases on a straight-line basis over the lease term.
Leases in the consolidated balance sheets consisted of the following at December 31:
| | (In thousands) | (In thousands) | Balance Sheet Classification | 2021 | | 2020 | (In thousands) | Balance Sheet Classification | 2023 | | 2022 |
| Assets: | Assets: | |
| Operating | |
| Operating | |
| Operating | Operating | Operating lease assets | $ | 27,569 | | | $ | 30,969 | |
| Finance | Finance | Property, plant and equipment, net | 1,709 | | | 942 | |
| Total lease assets | Total lease assets | | $ | 29,278 | | | $ | 31,911 | |
| Liabilities: | Liabilities: | | | | |
| Current: | Current: | |
| Current: | |
| Current: | |
| Operating | |
| Operating | |
| Operating | Operating | Accrued liabilities | $ | 6,494 | | | $ | 6,888 | |
| Finance | Finance | Current debt | 682 | | | 353 | |
| Noncurrent: | Noncurrent: | |
| Operating | Operating | Noncurrent operating lease liabilities | $ | 22,352 | | | $ | 25,068 | |
| Operating | |
| Operating | |
| Finance | Finance | Long-term debt, less current portion | 1,041 | | | 590 | |
| Total lease liabilities | Total lease liabilities | | $ | 30,569 | | | $ | 32,899 | |
Total operating lease expenses were $24.4 million for 2021, of which $14.2 million related to short-term leases and $10.2 million related to leases recognizedLease costs in the balance sheet. Total operating lease expensesconsolidated statements of operations were $25.8 million and $30.1 million for 2020 and 2019, respectively. as follows:
| | | | | | | | | | | | | | | | | |
| | Year Ended December 31, |
| (In thousands) | 2023 | | 2022 | | 2021 |
| Operating lease expenses | | | | | |
| Long-term operating leases expenses | $ | 7,269 | | | $ | 8,265 | | | $ | 10,227 | |
| Short-term operating leases expenses | 16,111 | | | 19,062 | | | 14,180 | |
| Total operating lease expenses | $ | 23,380 | | | $ | 27,327 | | | $ | 24,407 | |
| | | | | |
| Amortization of leased assets for finance leases | $ | 2,483 | | | $ | 909 | | | $ | 386 | |
| | | | | |
| Sublease income | $ | (3,008) | | | $ | (407) | | | $ | — | |
| | | | | |
| Total net lease cost | $ | 22,855 | | | $ | 27,829 | | | $ | 24,793 | |
Total operating lease expenses approximate cash paid during each period. Amortization and interestInterest for finance leases areis not material. Operating lease expenses and amortization of leased assets for finance leases are included in either cost of revenues or selling, general and administrative expenses. Interest for finance leases is included in interest expense, net. Sublease income is included in either cost of revenues or other operating income.
NEWPARK RESOURCES, INC.
NOTES TO CONSOLIDATED FINANCIAL STATEMENTS – (Continued)
The maturity of lease liabilities as of December 31, 20212023 is as follows:
| | (In thousands) | (In thousands) | Operating Leases | | Finance Leases | | Total | (In thousands) | Operating Leases | | Finance Leases | | Total |
| 2022 | $ | 7,678 | | | $ | 722 | | | $ | 8,400 | |
| 2023 | 5,066 | | | 587 | | | 5,653 | |
| 2024 | 2024 | 3,629 | | | 325 | | | 3,954 | |
| 2025 | 2025 | 2,999 | | | 156 | | | 3,155 | |
| 2026 | 2026 | 2,951 | | | 2 | | | 2,953 | |
| 2027 | |
| 2028 | |
| Thereafter | Thereafter | 11,763 | | | — | | | 11,763 | |
| Total lease payments | Total lease payments | 34,086 | | | 1,792 | | | 35,878 | |
| Less: Interest | Less: Interest | 5,240 | | | 69 | | | 5,309 | |
| Present value of lease liabilities | Present value of lease liabilities | $ | 28,846 | | | $ | 1,723 | | | $ | 30,569 | |
During 2021,2023, we entered into $6.5$2.1 million and $1.2$7.5 million of new operating lease liabilities and finance lease liabilities, respectively, in exchange for leased assets. During 2022, we entered into $4.8 million and $4.4 million of new operating lease liabilities and finance lease liabilities, respectively, in exchange for leased assets.
Weighted-average remaining lease terms and the weighted average discount rates were the following at December 31:
| | | | | |
| Lease Term and Discount Rate | December 31, 20212023 |
| Weighted-average remaining lease term (years) | |
| Operating leases | 7.16.0 |
| Finance leases | 2.83.4 |
| Weighted-average discount rate | |
| Operating leases | 4.8 | % |
| Finance leases | 4.17.8 | % |
Note 9 — Income Taxes
The provision (benefit) for income taxes was as follows:
| | | | Year Ended December 31, | | Year Ended December 31, |
| (In thousands) | (In thousands) | 2021 | | 2020 | | 2019 | (In thousands) | 2023 | | 2022 | | 2021 |
| Current: | Current: | | | | | | Current: | | | |
| U.S. Federal | U.S. Federal | $ | 773 | | | $ | 1,591 | | | $ | 1,892 | |
| State | State | 525 | | | 365 | | | 706 | |
| Foreign | Foreign | 7,204 | | | 5,011 | | | 11,440 | |
| Total current | Total current | 8,502 | | | 6,967 | | | 14,038 | |
| Deferred: | Deferred: | | | | | | Deferred: | | | |
| U.S. Federal | U.S. Federal | 547 | | | (16,309) | | | (2,926) | |
| State | State | (545) | | | 598 | | | 1,181 | |
| Foreign | Foreign | (1,211) | | | (3,139) | | | (2,505) | |
| Total deferred | Total deferred | (1,209) | | | (18,850) | | | (4,250) | |
| Total provision (benefit) for income taxes | Total provision (benefit) for income taxes | $ | 7,293 | | | $ | (11,883) | | | $ | 9,788 | |
NEWPARK RESOURCES, INC.
NOTES TO CONSOLIDATED FINANCIAL STATEMENTS – (Continued)
Income (loss) before income taxes was as follows:
| | | | Year Ended December 31, | | Year Ended December 31, |
| (In thousands) | (In thousands) | 2021 | | 2020 | | 2019 | (In thousands) | 2023 | | 2022 | | 2021 |
| U.S. | U.S. | $ | (36,250) | | | $ | (92,838) | | | $ | (15,270) | |
| Foreign | Foreign | 18,017 | | | 259 | | | 12,112 | |
| Loss before income taxes | Loss before income taxes | $ | (18,233) | | | $ | (92,579) | | | $ | (3,158) | |
The effective income tax rate is reconciled to the statutory federal income tax rate as follows:
| | | | Year Ended December 31, | | Year Ended December 31, |
| (In thousands) | (In thousands) | 2021 | | 2020 | | 2019 | (In thousands) | 2023 | | 2022 | | 2021 |
| Income tax expense (benefit) at federal statutory rate | Income tax expense (benefit) at federal statutory rate | $ | (3,829) | | | $ | (19,442) | | | $ | (663) | |
| Recognition of Brazil cumulative foreign currency translation losses | — | | | 2,456 | | | — | |
| Nondeductible goodwill impairment | — | | | — | | | 2,401 | |
| Tax benefit on restructuring of certain subsidiary legal entities | |
| Nondeductible executive compensation | Nondeductible executive compensation | 999 | | | 170 | | | 756 | |
| Other nondeductible expenses | Other nondeductible expenses | 557 | | | 616 | | | 1,506 | |
| Stock-based compensation | Stock-based compensation | 880 | | | 1,602 | | | (248) | |
| Different rates on earnings of foreign operations | Different rates on earnings of foreign operations | (115) | | | 274 | | | 463 | |
| Dividend taxes on unremitted earnings | Dividend taxes on unremitted earnings | 980 | | | 322 | | | 1,609 | |
| U.S. tax on foreign earnings | U.S. tax on foreign earnings | — | | | — | | | 1,215 | |
| Research and development credits | |
| Change in valuation allowance | Change in valuation allowance | 10,416 | | | 2,226 | | | 1,272 | |
| State tax expense (benefit), net | State tax expense (benefit), net | (1,302) | | | 196 | | | 430 | |
| Other items, net | Other items, net | (1,293) | | | (303) | | | 1,047 | |
| Total provision (benefit) for income taxes | Total provision (benefit) for income taxes | $ | 7,293 | | | $ | (11,883) | | | $ | 9,788 | |
The provision for income taxes was $10.7 million for 2023 and primarily reflects income taxes associated with our international operations, including the impact from the geographic composition of our earnings, and was unfavorably impacted by losses in certain international jurisdictions in which we are unable to recognize a related tax benefit, partially offset by the benefit associated with a partial valuation allowance release to recognize a portion of previously unbenefited U.S. net operating losses. The provision for income taxes was $4.4 million for 2022, which includes an income tax benefit of $3.1 million related to the restructuring of certain subsidiary legal entities within Europe, as the undistributed earnings for an international subsidiary are no longer subject to certain taxes upon future distribution. The provision for income taxes in 2022 was unfavorably impacted as we are unable to recognize a tax benefit related to the $37.3 million of impairment charges. The provision for income taxes was $7.3 million for 2021, despite reporting a pretax loss for the year,period, and primarily reflecting the impact of the geographic composition of our pretax loss. The tax expense primarily relates toreflects earnings from our international operations since we are currentlywere unable to recognize the tax benefit from our U.S. losses as they may not be realized. The benefit for income taxes was $11.9 million for 2020 reflecting an effective tax benefit rate of 13%. This result primarily reflects the impact of the $11.7 million non-cash recognition of cumulative foreign currency translation losses related to the substantial liquidation of our subsidiary in Brazil and other nondeductible expenses, as well as the impact of the geographic composition of our pretax loss, where the tax benefit from losses in the U.S was partially offset by the tax expense related to earnings from our international operations. The provision for income taxes was $9.8 million for 2019 despite reporting a small pretax loss for the year. This result reflects the impact of the $11.4 million nondeductible goodwill impairment and other nondeductible expenses, as well as the impact of the geographic composition of our pretax loss, where tax expense related to earnings from our international operations is only partially offset by the tax benefit from losses in the U.S.
The Coronavirus Aid, Relief, and Economic Security Act (“CARES Act”) was enacted in March 2020 in the United States. The CARES Act contains several tax provisions, including additional carryback opportunities for net operating losses, temporary increases in the interest deductibility threshold, and the acceleration of refunds for any remaining alternative minimum tax (“AMT”) carryforwards. There was no material impact from the CARES Act in our provision for income taxes for 2020. In addition, we filed an amendment to our 2018 U.S. federal income tax return in the second quarter of 2020 and received a refund of $0.7 million for AMT carryforwards in July 2020.
The CARES Act also permits most companies to defer paying their portion of certain applicable payroll taxes from the date the CARES Act was signed into law through December 31, 2020. The deferred amount is due in two equal installments on December 31, 2021 and December 31, 2022. We paid the first installment in December 2021, and the remaining deferred amount of applicable payroll taxes was $1.6 million at December 31, 2021.
NEWPARK RESOURCES, INC.
NOTES TO CONSOLIDATED FINANCIAL STATEMENTS – (Continued)
Temporary differences and carryforwards which give rise to deferred tax assets and liabilities consisted of the following at December 31:
| | (In thousands) | (In thousands) | 2021 | | 2020 | (In thousands) | 2023 | | 2022 |
| Deferred tax assets: | Deferred tax assets: | | | | Deferred tax assets: | | | |
| Net operating losses | Net operating losses | $ | 38,746 | | | $ | 25,990 | |
| Foreign tax credits | Foreign tax credits | 8,330 | | | 6,690 | |
| Accruals not currently deductible | Accruals not currently deductible | 4,393 | | | 5,121 | |
| Unrealized foreign exchange losses, net | Unrealized foreign exchange losses, net | 4,590 | | | 3,750 | |
| Research and development credits | |
| Stock-based compensation | Stock-based compensation | 1,856 | | | 2,238 | |
| Capitalized inventory costs | Capitalized inventory costs | 1,706 | | | 3,111 | |
| Capitalized research and development expenditures | |
| Other | Other | 10,534 | | | 9,456 | |
| Total deferred tax assets | Total deferred tax assets | 70,155 | | | 56,356 | |
| Valuation allowance | Valuation allowance | (38,406) | | | (26,250) | |
| Total deferred tax assets, net of allowances | Total deferred tax assets, net of allowances | 31,749 | | | 30,106 | |
| Deferred tax liabilities: | Deferred tax liabilities: | | | | Deferred tax liabilities: | | | |
| Accelerated depreciation and amortization | Accelerated depreciation and amortization | (31,816) | | | (29,587) | |
| Tax on unremitted earnings | Tax on unremitted earnings | (8,214) | | | (9,765) | |
| Original issue discount on Convertible Notes | — | | | (804) | |
| Other | Other | (1,222) | | | (1,612) | |
| Total deferred tax liabilities | Total deferred tax liabilities | (41,252) | | | (41,768) | |
| Total net deferred tax liabilities | Total net deferred tax liabilities | $ | (9,503) | | | $ | (11,662) | |
| | Noncurrent deferred tax assets | Noncurrent deferred tax assets | $ | 2,316 | | | $ | 1,706 | |
| Noncurrent deferred tax assets | |
| Noncurrent deferred tax assets | |
| Noncurrent deferred tax liabilities | Noncurrent deferred tax liabilities | (11,819) | | | (13,368) | |
| Net deferred tax liabilities | Net deferred tax liabilities | $ | (9,503) | | | $ | (11,662) | |
We have U.S. federal income tax net operating loss carryforwards (“NOLs”) of approximately $100.9$82.9 million available to reduce future U.S. taxable income, which do not expire. We also have state NOLs of approximately $208.0$228.5 million available to reduce future state taxable income, including approximately $147.8$167.5 million which do not expire and approximately $60.2$61.0 million which expire in varying amounts beginning in 20222024 through 2041.2043. Foreign NOLs of approximately $21.5$25.4 million are available to reduce future taxable income, some of which expire beginning in 2022.2024. Effective January 1, 2022, certain research and development expenditures are now required under regulations enacted as part of the 2017 U.S. Tax Cuts and Jobs Act to be capitalized and amortized over five years, resulting in a $7.1 million and $4.3 million deferred tax asset at December 31, 2023 and 2022, respectively.
The realization of our net deferred tax assets is dependent on our ability to generate taxable income in future periods. At December 31, 20212023 and 2020,2022, we have recorded a valuation allowance in the amount of $38.4$49.2 million and $26.3$47.3 million, respectively, primarily related to certain U.S. federal, state, and foreign NOL carryforwards, including Australia, as well as for certain foreign tax credits recognized related to the accounting for the impact of the 2017 U.S. Tax Cuts and Jobs Act (“Tax Act”),research and development credits, which may not be realized.
We file income tax returns in the U.S. and several non-U.S. jurisdictions and are subject to examination in the various jurisdictions in which we file. We are no longer subject to income tax examinations for U.S. federal and substantially all state jurisdictions for years prior to 20142019 and for substantially all foreign jurisdictions for years prior to 2008.
We are under examination by various tax authorities in countries where we operate, and certain foreign jurisdictions have challenged the amounts of taxes due for certain tax periods. These audits are in various stages of completion. We fully cooperate with all audits but defend existing positions vigorously. We evaluate the potential exposure associated with various filing positions and record a liability for uncertain tax positions as circumstances warrant. Although we believe all tax positions are reasonable and properly reported in accordance with applicable tax laws and regulations in effect during the periods involved, the final determination of tax audits and any related litigation could be materially different than that which is reflected in historical income tax provisions and accruals.
NEWPARK RESOURCES, INC.
NOTES TO CONSOLIDATED FINANCIAL STATEMENTS – (Continued)
A reconciliation of the beginning and ending provision for uncertain tax positions is as follows:
| | (In thousands) | (In thousands) | 2021 | | 2020 | | 2019 | (In thousands) | 2023 | | 2022 | | 2021 |
| Balance at January 1 | Balance at January 1 | $ | 213 | | | $ | 291 | | | $ | 223 | |
| Additions (reductions) for tax positions of prior years | Additions (reductions) for tax positions of prior years | (6) | | | (6) | | | 68 | |
| Additions (reductions) for tax positions of current year | Additions (reductions) for tax positions of current year | 306 | | | — | | | — | |
| Reductions for settlements with tax authorities | Reductions for settlements with tax authorities | — | | | — | | | — | |
| Reductions for lapse of statute of limitations | Reductions for lapse of statute of limitations | (28) | | | (72) | | | — | |
| Balance at December 31 | Balance at December 31 | $ | 485 | | | $ | 213 | | | $ | 291 | |
Approximately $0.5$0.2 million of unrecognized tax benefits at December 31, 2021,2023, if recognized, would favorably impact the effective tax rate.
We recognize accrued interest and penalties related to uncertain tax positions in operating expenses. The amount of interest and penalties was immaterial for all periods presented.
NEWPARK RESOURCES, INC.
NOTES TO CONSOLIDATED FINANCIAL STATEMENTS – (Continued)
Note 10 — Capital Stock
Common Stock
Changes in outstanding common stock were as follows:
| | (In thousands of shares) | (In thousands of shares) | 2021 | | 2020 | | 2019 | (In thousands of shares) | 2023 | | 2022 | | 2021 |
| Outstanding, beginning of year | Outstanding, beginning of year | 107,588 | | | 106,697 | | | 106,363 | |
| Shares issued for exercise of options | Shares issued for exercise of options | — | | | — | | | 281 | |
| Shares issued for time vested restricted stock (net of forfeitures) | Shares issued for time vested restricted stock (net of forfeitures) | 1,368 | | | 740 | | | 53 | |
| Shares issued for employee stock purchase plan | Shares issued for employee stock purchase plan | 375 | | | 151 | | | — | |
| Outstanding, end of year | Outstanding, end of year | 109,331 | | | 107,588 | | | 106,697 | |
Outstanding shares of common stock include shares held as treasury stock totaling 16,981,147, 16,781,15026,471,738, 21,751,232 and 16,958,41816,981,147 as of December 31, 2023, 2022 and 2021, 2020respectively.
Treasury Stock
Changes in treasury stock were as follows:
| | | | | | | | | | | | | | | | | |
| (In thousands of shares) | 2023 | | 2022 | | 2021 |
| Outstanding, beginning of year | 21,751 | | | 16,981 | | | 16,781 | |
| Shares purchased under our Repurchase Program | 6,523 | | | 4,438 | | | — | |
| Shares purchased for employee stock options, restricted stock and employee stock purchase plan | 577 | | | 592 | | | 419 | |
| Shares reissued for employee stock options, restricted stock and employee stock purchase plan | (2,379) | | | (260) | | | (219) | |
| Outstanding, end of year | 26,472 | | | 21,751 | | | 16,981 | |
During 2023, 2022 and 2019,2021, we purchased shares surrendered in lieu of taxes upon vesting of restricted shares for an aggregate cost of $2.2 million, $2.7 million and $1.4 million, respectively.
Repurchase Program
In November 2018, our Board of Directors authorized a securities repurchase program available for repurchases of any combination of our common stock and our unsecured convertible senior notes, which matured in December 2021. In February 2023, our Board of Directors approved certain changes to the repurchase program as well as additional capacity to increase the total authorization then available to $50.0 million.
During 2023, we repurchased 6,522,797 shares of our common stock under our repurchase program for a total cost of $31.9 million. During 2022, we repurchased 4,437,885 shares of our common stock under our repurchase program for a total cost of $17.5 million.
As of December 31, 2023, we had $18.1 million of authorization remaining under the program. In February 2024, our Board of Directors replaced the existing program with a new repurchase program for repurchases of common stock up to $50.0 million.
Our repurchase program is available to purchase outstanding shares of our common stock in the open market or as otherwise determined by management, subject to certain limitations under the Amended ABL Facility and other factors. The repurchase program has no specific term. Future repurchases are expected to be funded from operating cash flows, available cash on hand, and borrowings under our Amended ABL Facility. As part of the share repurchase program, our management has been authorized to establish trading plans under Rule 10b5-1 of the Securities Exchange Act of 1934.
NEWPARK RESOURCES, INC.
NOTES TO CONSOLIDATED FINANCIAL STATEMENTS – (Continued)
Preferred Stock
We are authorized to issue up to 1,000,000 shares of preferred stock, $0.01 par value. There were no outstanding shares of preferred stock as of December 31, 2021, 20202023, 2022 or 2019.2021.
Treasury Stock
During 2021, 2020 and 2019, we repurchased 419,114, 153,151 and 381,041 shares, respectively, for an aggregate price of $1.4 million, $0.3 million and $2.7 million, respectively, representing employee shares surrendered in lieu of taxes under vesting of restricted stock awards. All of the shares repurchased are held as treasury stock.
During 2021, 2020 and 2019, we reissued 219,117, 330,419 and 1,491,408 shares of treasury stock pursuant to various stock plans.
Repurchase Program
In November 2018, our Board of Directors authorized changes to our securities repurchase program. These changes increased the authorized amount under the repurchase program to $100.0 million, available for repurchases of any combination of our common stock and our Convertible Notes.
Our repurchase program authorizes us to purchase outstanding shares of our common stock or Convertible Notes in the open market or as otherwise determined by management, subject to certain limitations under the ABL Facility and other factors. The repurchase program has no specific term. Repurchases are expected to be funded from operating cash flows, available cash on hand, and borrowings under our ABL Facility. As part of the share repurchase program, our management has been authorized to establish trading plans under Rule 10b5-1 of the Securities Exchange Act of 1934. As of December 31, 2021, we had $23.8 million remaining under the program.
During 2021, we repurchased $28.3 million of our Convertible Notes in the open market under the repurchase program for a total cost of $28.1 million. During 2020, we repurchased $33.1 million of our Convertible Notes in the open market under the repurchase program for a total cost of $29.1 million. There were no Convertible Notes repurchased under the program during 2019.
There were no shares of common stock repurchased under the repurchase program during 2021 or 2020. During 2019, we repurchased an aggregate of 2,537,833 shares of our common stock under our repurchase program for a total cost of $19.0 million.
NEWPARK RESOURCES, INC.
NOTES TO CONSOLIDATED FINANCIAL STATEMENTS – (Continued)
Note 11 — Earnings Per Share
The following table presents the reconciliation of the numerator and denominator for calculating net income (loss) per share:
| | | | Year Ended December 31, | | Year Ended December 31, |
| (In thousands, except per share data) | (In thousands, except per share data) | 2021 | | 2020 | | 2019 | (In thousands, except per share data) | 2023 | | 2022 | | 2021 |
| Numerator | Numerator | | | | | | Numerator | | | |
| Net loss - basic and diluted | $ | (25,526) | | | $ | (80,696) | | | $ | (12,946) | |
| Net income (loss) - basic and diluted | |
| | Denominator | Denominator | |
| Denominator | |
| Denominator | |
| Weighted average common shares outstanding - basic | |
| Weighted average common shares outstanding - basic | |
| Weighted average common shares outstanding - basic | Weighted average common shares outstanding - basic | 91,460 | | | 90,198 | | | 89,782 | |
| Dilutive effect of stock options and restricted stock awards | Dilutive effect of stock options and restricted stock awards | — | | | — | | | — | |
| Dilutive effect of Convertible Notes | — | | | — | | | — | |
| Weighted average common shares outstanding - diluted | Weighted average common shares outstanding - diluted | 91,460 | | | 90,198 | | | 89,782 | |
| | Net loss per common share | |
| Net income (loss) per common share | |
| Net income (loss) per common share | |
| Net income (loss) per common share | |
| Basic | |
| Basic | |
| Basic | Basic | $ | (0.28) | | | $ | (0.89) | | | $ | (0.14) | |
| Diluted | Diluted | $ | (0.28) | | | $ | (0.89) | | | $ | (0.14) | |
We excluded the following weighted-average potential shares from the calculations of diluted net lossincome (loss) per share during the applicable periods because their inclusion would have been anti-dilutive:
| | | | Year Ended December 31, | | Year Ended December 31, |
| (In thousands) | (In thousands) | 2021 | | 2020 | | 2019 | (In thousands) | 2023 | | 2022 | | 2021 |
| Stock options and restricted stock awards | Stock options and restricted stock awards | 5,754 | | | 5,238 | | | 5,312 | |
For 2021, 20202022 and 2019,2021, we excluded all potentially dilutive stock options and restricted stock awards in calculating diluted earnings per share as the effect was anti-dilutive due to the net loss incurred for these periods. TheFor 2021, the Convertible Notes, which matured in December 2021, only impacteddid not impact the calculation of diluted net incomeearnings per share in periods thatdue to the average price of our common stock, as calculated in accordance withnet loss incurred for the terms of the indenture governing the Convertible Notes, exceeded the conversion price of $9.33 per share.period.
Note 12 — Stock-Based Compensation and Other Benefit Plans
The following describes stockholder approved plans utilized by us for the issuance of stock-based awards.
2014 Non-Employee Directors’ Restricted Stock Plan
In May 2014, our stockholders approved the 2014 Non-Employee Directors’ Restricted Stock Plan (“2014 Director Plan”) which authorizes grants of restricted stock to non-employee directors. Each restricted share granted to a non-employee director vests in full on the earlier of the day prior to the next annual meeting of stockholders following the grant date or the first anniversary of the grant. In May 2021,2023, our stockholders approved an amendment to the 2014 Director Plan to increaseincreasing the number of shares authorized for issuance under the 2014 Director Plan from 1,000,0001.4 million to 1,200,0002.0 million shares. At December 31, 2021, 146,5272023, 0.5 million shares remained available for grantaward under the 2014 Director Plan. During 2021, non-employee directors received 210,367 shares of restricted stock at a weighted average grant-date fair value of $3.28 per share and cash-based awards of $0.2 million.
NEWPARK RESOURCES, INC.
NOTES TO CONSOLIDATED FINANCIAL STATEMENTS – (Continued)
2015 Employee Equity Incentive Plan
In May 2015, our stockholders approved the 2015 Employee Equity Incentive Plan (“2015 Plan”) pursuant to which the Compensation Committee of our Board of Directors (“Compensation Committee”) may grant to key employees, including executive officers and other corporate and divisional employees, a variety of forms of equity-based compensation, including options to purchase shares of common stock, shares of restricted common stock, restricted stock units, stock appreciation rights, other stock-based awards, and performance-based awards. In May 2021,2023, our stockholders approved an amendment to the 2015 Plan to increaseincreasing the number of shares authorized for issuance under the 2015 Plan from 12,300,00015.3 million to 14,300,00016.5 million shares. At December 31, 2021, 1,673,1402023, 2.5 million shares remained available for grantaward under the 2015 Plan.
In June 2017, our Board of Directors approved the Long-Term Cash Incentive Plan (“Cash Plan”), a sub-plan to the 2015 Plan, pursuant to which the Compensation Committee may grant time-based cash awards or performance-based cash awards to key employees, including executive officers and other corporate and divisional employees, to provide an opportunity for employees to receive a cash payment upon either completion of a service period or achievement of predetermined performance criteria at the end of a performance period.
During 2019, the Compensation Committee modified our retirement policy applicable to cash and equity awards granted to include our Chief Executive Officer and those officers who report to our Chief Executive Officer, who were previously excluded from the retirement policy. In addition, the Compensation Committee also modified the retirement policy for certain vested stock options that remained outstanding to extend the exercise period available following the qualifying retirement of eligible employees. As a result of these modifications, we recognized a charge of $4.0 million in the first quarter of 2019. This charge primarily reflects the acceleration of expense, as well as the incremental value associated with modifications to extend the exercise period of outstanding options, for previously-granted awards for retirement eligible executive officers.
Activity under each of these programs is described below.
Stock Options
Stock options granted by the Compensation Committee are granted with a three-year vesting period and a term of ten years. There have been no options granted since 2016.
The following table summarizes activity for our outstanding stock options for the year ended December 31, 2021:2023:
| | Stock Options | Stock Options | Shares | | Weighted-
Average
Exercise Price | | Weighted-
Average
Remaining
Contractual
Life (Years) | | Aggregate
Intrinsic Value
(In thousands) | Stock Options | Shares | | Weighted-
Average
Exercise Price | | Weighted-
Average
Remaining
Contractual
Life (Years) | | Aggregate
Intrinsic Value
(In thousands) |
| Outstanding at beginning of period | Outstanding at beginning of period | 2,297,702 | | | $ | 7.34 | | | | | | Outstanding at beginning of period | 1,432,738 | | | $ | | $ | 7.39 | | | | | |
| Granted | Granted | — | | | — | | | | | | Granted | — | | | — | | — | | | | | |
| Exercised | Exercised | — | | | — | | | | | | Exercised | (140,460) | | | 4.32 | | 4.32 | | | | | |
| Expired or canceled | Expired or canceled | (500,826) | | | 8.29 | | | | | | Expired or canceled | (231,745) | | | 10.52 | | 10.52 | | | | | |
| Outstanding at end of period | Outstanding at end of period | 1,796,876 | | | $ | 7.08 | | | 2.94 | | $ | — | |
| | Vested or expected to vest at end of period | Vested or expected to vest at end of period | 1,796,876 | | | $ | 7.08 | | | 2.94 | | $ | — | |
| Vested or expected to vest at end of period | |
| Vested or expected to vest at end of period | |
| Options exercisable at end of period | Options exercisable at end of period | 1,796,876 | | | $ | 7.08 | | | 2.94 | | $ | — | |
There were no options exercised during the years ended December 31, 2021 and 2020. For the year ended December 31, 2019, theThe total intrinsic value of options exercised was $1.6$0.4 million while cash from option exercises totaled $1.3 million. There was no compensation cost recognized for stock options for the years ended December 31, 2021 and 2020. For the year ended December 31, 2019, total compensation cost recognized for stock2023, and cash from options was $1.3exercised totaled $0.6 million. For the year ended December 31, 2019,2023, we recognized tax benefits resulting from the exercise of stock options totaling $0.3$0.1 million.
Performance-Based Restricted Stock Units
In 2016, performance-based restricted stock units were awarded to executive officers and were to be settled in shares of common stock based on the relative ranking of our total shareholder return (“TSR”) as compared to the TSR of our designated peer group over a three-year period. The ending TSR price is equal to the average closing price of our shares over the last 30-calendar days of the performance period. There have been no performance-based restricted stock units granted since
NEWPARK RESOURCES, INC.
NOTES TO CONSOLIDATED FINANCIAL STATEMENTS – (Continued)
2016 or outstanding since 2019. There was no compensation cost recognized for performance-based restricted stock units foroptions during the years ended December 31, 2021 and 2020. For the year ended December 31, 2019, total compensation cost recognized for performance-based restricted2023, 2022, or 2021. There were no stock units was $0.1 million.options exercised during 2022 or 2021.
Restricted Stock Awards and Units
Time-vested restricted stock awards and restricted stock units are periodically granted to key employees, including grants for employment inducements, as well as to members of our Board of Directors. Employee awards provide for vesting periods ranging from three to four years. Non-employee director grants vest in full on the earlier of the day prior to the next annual meeting of stockholders following the grant date or the first anniversary of the grant. Upon vesting of these grants, shares are issued to award recipients.
NEWPARK RESOURCES, INC.
NOTES TO CONSOLIDATED FINANCIAL STATEMENTS – (Continued)
The following tables summarize the activity for our outstanding time-vested restricted stock awards (granted to our Board of Directors) and restricted stock units (granted to employees) for the year ended December 31, 2021:2023:
| | Nonvested Restricted Stock Awards (Time-Vesting) | Nonvested Restricted Stock Awards (Time-Vesting) | Shares | | Weighted-Average
Grant Date
Fair Value | Nonvested Restricted Stock Awards (Time-Vesting) | Shares | | Weighted-Average
Grant Date
Fair Value |
| Nonvested at January 1, 2021 | 181,886 | | | $ | 3.12 | |
| Nonvested at January 1, 2023 | |
| Granted | Granted | 210,367 | | | 3.28 | |
| Vested | Vested | (156,886) | | | 2.06 | |
| Forfeited | Forfeited | — | | | — | |
| Nonvested at December 31, 2021 | 235,367 | | | $ | 3.97 | |
| Nonvested at December 31, 2023 | |
| | Nonvested Restricted Stock Units (Time-Vesting) | Nonvested Restricted Stock Units (Time-Vesting) | Shares | | Weighted-Average
Grant Date
Fair Value | Nonvested Restricted Stock Units (Time-Vesting) | Shares | | Weighted-Average
Grant Date
Fair Value |
| Nonvested at January 1, 2021 | 3,530,366 | | | $ | 4.01 | |
| Nonvested at January 1, 2023 | |
| Granted | Granted | 2,859,177 | | | 3.20 | |
| Vested | Vested | (1,377,181) | | | 4.80 | |
| Forfeited | Forfeited | (373,101) | | | 3.87 | |
| Nonvested at December 31, 2021 | 4,639,261 | | | $ | 3.29 | |
| Nonvested at December 31, 2023 | |
Total compensation cost recognized for restricted stock awards and restricted stock units was $7.7$6.4 million, $6.3$6.7 million and $9.8$7.7 million for the years ended December 31, 2021, 20202023, 2022 and 2019,2021, respectively. Total unrecognized compensation cost at December 31, 20212023 related to restricted stock awards and restricted stock units was approximately $8.7$8.8 million which is expected to be recognized over the next 2.01.8 years. During the years ended December 31, 2021, 20202023, 2022 and 2019,2021, the total fair value of shares vested was $5.3$8.0 million, $1.9$9.4 million and $7.2$5.3 million, respectively. For the years ended December 31, 2021, 20202023, 2022 and 2019,2021, we recognized tax benefits resulting from the vesting of restricted stock awards and units of $1.1$1.8 million, $0.4$1.8 million and $1.9$1.1 million, respectively.
Cash-Based Awards
The Compensation Committee also approved the issuance of cash-based awards to certain executive officers during 2021, 20202023, 2022 and 2019.2021. The 2023 awards included a target value of $2.5 million of performance-based cash awards, the 2022 awards included a target value of $2.8 million of performance-based cash awards, and the 2021 awards included $1.4 million of time-based cash awards and a target amountvalue of $3.0 million of performance-based cash awards. The 2020 and 2019 awards included acash payout for each award ranges from 0% to 200% of target.
Of the $2.5 million aggregate target amountvalue of $2.6 million and $2.3 million, respectively, of performance-based cash awards.
The2023 performance-based cash awards, are$1.8 million will be settled based on the relative ranking of our total shareholder return (“TSR”) as compared to the TSR of our designated peer group and $0.7 million will be settled based on the consolidated return on net capital employed (“RONCE”), each measured over a three-year performance period. TSR performance for the 2023 grants will be determined based upon the Company’s and peer group’s average closing share price for the 30 calendar day period ending May 31, 2026, adjusted for dividends, as compared to the 30 calendar day period ending May 31, 2023. RONCE performance for the 2023 grants will be determined based upon the Company’s average three-year RONCE performance for the fiscal years ending December 31, 2023, 2024 and 2025.
The 2022 and 2021 performance-based cash awards will be settled based on the relative ranking of our TSR as compared to the TSR of our designated peer group over a three-year period. The performance period beganending May 2, 202131, 2025 and ends May 31, 2024, for the 2021 awards, began May 2, 2020 and ends May 31, 2023 for the 2020 awards, and began May 2, 2019 and ends May 31, 2022 for the 2019 awards. The ending TSR price is equal to the average closing price of our shares over the last 30-calendar days of the performance period, and provide for a cash payout ranging from 0% to 200% of target for each eligible executive.respectively.
NEWPARK RESOURCES, INC.
NOTES TO CONSOLIDATED FINANCIAL STATEMENTS – (Continued)
The performance-based cash awards are accrued as a liability award over the performance period based on the estimated fair value. The fair value of the performance-based cash awards is remeasured each period using a Monte Carlo
NEWPARK RESOURCES, INC.
NOTES TO CONSOLIDATED FINANCIAL STATEMENTS – (Continued)
valuation model with changes in fair value recognized in the consolidated statement of operations.
Total compensation cost recognized for cash-based awards was $3.8 million, $3.4 million and $3.9 million for the years ended December 31, 2023, 2022 and 2021, respectively. As of December 31, 20212023 and 2020,2022, the total liability for cash-based awards was $5.7$6.7 million and $4.0$6.5 million, respectively.
Defined Contribution Plan
Substantially all of our U.S. employees are covered by a defined contribution plan (“401(k) Plan”). Employees may voluntarily contribute up to 50% of compensation, as defined in the 401(k) Plan. Participants’ contributions, up to 3%4% of compensation, are matched 100% by us, and the participants’ contributions, from 3%5% to 6% of compensation, are matched 50% by us. Effective January 1, 2023, Participant’s contributions up to 4% are matched 100% by us with contributions from 4% to 6% being matched 50%. In connection with the cost reduction programs implemented in early 2020, we temporarily eliminated our 401(k) matching contribution beginning in April 2020. Beginning in the second quarter of 2021, we reinstituted the matching contribution for our U.S. defined contribution plan.2020 through March 2021. Under the 401(k) Plan, our cash contributions were $3.2 million, $2.5 million and $2.2 million $1.2 millionfor 2023, 2022 and $4.3 million for 2021, 2020 and 2019, respectively.
Note 13 — Segment and Related Information
We currently operate our business through 2two reportable segments: Fluids Systems and Industrial Solutions. In addition, we had a third reportable segment, Industrial Blending, which was exited in 2022. We have reflected these three reportable segments for all periods presented in this Annual Report on Form 10-K. All intercompany revenues and related profits have been eliminated.
•Fluids Systems — Our Fluids Systems segment provides drilling and completion and stimulationfluids products and related technical services to customers for oil, natural gas, and geothermal projects primarily in North America and EMEA, as well as certain countries in Asia PacificPacific.
Over the past few years, our primary focus within the Fluids Systems segment has been the transformation into a more agile and Latin America. We offer customized solutions for complex subsurface conditions such as horizontal, directional, geologically deep,simplified business focused on key markets, while monetizing assets in underperforming or drillingsub-scale markets and reducing our invested capital, particularly in deep water. These projects require high levelsthe U.S. In the fourth quarter of monitoring and technical support2022, we exited two of the fluids system during the drilling process.
We also have industrialour Fluids Systems business units, including our U.S.-based mineral grinding business as well as our Gulf of Mexico fluids operations. In 2023, we exited our stimulation chemicals product line, certain operations for barite,offshore Australia and our Latin America operations in Chile. In June 2023, we announced that we engaged Lazard to assist us in a critical raw materialreview of strategic alternatives for the long-term positioning of our Fluids Systems division, and in fluids systems, which serve to support our activities in certain regions ofSeptember 2023, we launched a formal sale process for substantially all the U.S. fluids market. We use the resulting products in our fluids systems and also sell the products to third party users, including other fluids companies. In addition, we sell a variety of other minerals, principally to third party industrial (non-oil and natural gas) markets.Fluids Systems business. See Note 2 for additional information.
•Industrial Solutions — Our Industrial Solutions segment provides temporary worksite access solutions, including the rental of our manufactured recyclable composite matting systems, along with related site construction and services to customers in various markets including power transmission, E&P, pipeline, renewable energy, petrochemical, construction and other industries, primarily in the United States and Europe.United Kingdom. We also sell our manufactured recyclable composite mats to customers around the world, with power transmission being the primary end-market.
•Industrial Blending — Our Industrial Blending segment began operations in 2020 and supported industrial end-markets, including the production of disinfectants and industrial cleaning products. We completed the wind down of the Industrial Blending business in the first quarter of 2022 and the sale of the industrial blending and warehouse facility and related equipment located in Conroe, Texas in the fourth quarter of 2022 (see Note 2 for additional information).
NEWPARK RESOURCES, INC.
NOTES TO CONSOLIDATED FINANCIAL STATEMENTS – (Continued)
Summarized financial information concerningfor our reportable segments is shown in the following tables:
| | | | Year Ended December 31, | | Year Ended December 31, |
| (In thousands) | (In thousands) | 2021 | | 2020 | | 2019 | (In thousands) | 2023 | | 2022 | | 2021 |
| | Revenues | Revenues | | | | | |
| Revenues | |
| Revenues | | | | |
| Fluids Systems | Fluids Systems | $ | 420,789 | | | $ | 354,608 | | | $ | 620,317 | |
| Industrial Solutions | Industrial Solutions | 193,992 | | | 138,017 | | | 199,802 | |
| Industrial Blending | |
| Total revenues | Total revenues | $ | 614,781 | | | $ | 492,625 | | | $ | 820,119 | |
| | Depreciation and amortization | Depreciation and amortization | | | | | |
| Depreciation and amortization | |
| Depreciation and amortization | | | | |
| Fluids Systems | Fluids Systems | $ | 17,877 | | | $ | 20,555 | | | $ | 21,202 | |
| Industrial Solutions | Industrial Solutions | 20,399 | | | 20,427 | | | 21,763 | |
| Industrial Blending | |
| Corporate office | Corporate office | 3,949 | | | 4,332 | | | 4,179 | |
| Total depreciation and amortization | Total depreciation and amortization | $ | 42,225 | | | $ | 45,314 | | | $ | 47,144 | |
| | Operating income (loss) | Operating income (loss) | | | | | |
| Operating income (loss) | |
| Operating income (loss) | | | | |
| Fluids Systems | Fluids Systems | $ | (19,012) | | | $ | (66,403) | | | $ | 3,814 | |
| Industrial Solutions | Industrial Solutions | 39,733 | | | 13,459 | | | 47,466 | |
| Industrial Blending | |
| Corporate office | Corporate office | (29,546) | | | (25,690) | | | (40,885) | |
| Total operating income (loss) | Total operating income (loss) | $ | (8,825) | | | $ | (78,634) | | | $ | 10,395 | |
| | Segment assets | Segment assets | | | | | |
| Segment assets | |
| Segment assets | | | | |
| Fluids Systems | Fluids Systems | $ | 458,179 | | | $ | 419,381 | | | $ | 593,758 | |
| Industrial Solutions | Industrial Solutions | 267,670 | | | 259,918 | | | 265,786 | |
| Industrial Blending | |
| Corporate office | Corporate office | 27,037 | | | 29,893 | | | 40,535 | |
| Total segment assets | Total segment assets | $ | 752,886 | | | $ | 709,192 | | | $ | 900,079 | |
| | Capital expenditures | Capital expenditures | | | | | |
| Capital expenditures | |
| Capital expenditures | | | | |
| Fluids Systems | Fluids Systems | $ | 3,644 | | | $ | 6,237 | | | $ | 18,416 | |
| Industrial Solutions | Industrial Solutions | 17,402 | | | 7,831 | | | 23,535 | |
| Industrial Blending | |
| Corporate office | Corporate office | 747 | | | 1,726 | | | 2,855 | |
| Total capital expenditures | Total capital expenditures | $ | 21,793 | | | $ | 15,794 | | | $ | 44,806 | |
In August 2021, Hurricane Ida negatively impacted our Gulf of Mexico operations, including damage to certain inventory, equipment and warehouse facilities, at our Fourchon, Louisiana Fluids Systems operating base. While this event is covered by our property and business interruption insurance programs, these programs contain self-insured retentions, which remain our financial obligations. During 2021, ourThe change in Fluids Systems segment incurred hurricane-related costsassets in 2023 primarily reflects a decrease in working capital, while the 2022 change reflects the impact of $5.5 million, which includes $2.5 millionthe Excalibar divestiture (see Note 2 for inventoryadditional information) and property, plant and equipment, and $3.0 in property-related repairs, clean-up and other costs. Based on the provisionstransfer of our insurance policies and initial insurance claims filed, we estimated $2.9 millionKaty, Texas technology center to the Corporate office, partially offset by an increase in expected recoveries and recognized a charge of $2.6 million for 2021working capital. The increase in other operating (income) loss, net, substantially all of which is our self-insured retention under our property insurance policy. The insurance receivable balance includedCorporate office segment assets in other receivables was $1.9 million as of December 31, 2021. As of December 31, 2021, the claims2022 related to the hurricane undertransition of our property and business interruption insurance programs have not been finalized.Katy, Texas technology center from the Fluids Systems operating results for 2021 also includes $3.7 million of charges relatedsegment to a multi-purpose facility exit, severance,housing both business headquarters and other costs,support personnel, as well as a $0.8 million gain related to the final insurance settlement associated with the July 2018 fire at our Kenedy, Texas drilling fluids facility.administrative offices for third-party lessees.
In March 2020, oil prices collapsed due to geopolitical events along with the worldwide effects of the COVID-19 pandemic, which led to a rapid decline in customer activity in the E&P industry. In response to these market changes, we initiated workforce reductions and other cost reduction programs in the first quarter of 2020 and continued these actions throughout 2020 and into 2021.
As part of the cost reduction programs, we reduced our global employee base by approximately 650 (30%) in 2020. As a result of these workforce reductions, our operating results for 2020 included $4.3 million of total severance costs
NEWPARK RESOURCES, INC.
NOTES TO CONSOLIDATED FINANCIAL STATEMENTS – (Continued)
($3.7 million in Fluids Systems and $0.6 million in the Corporate office), with $2.7 million in cost of revenues and $1.6 million in selling, general and administrative expenses. These costs were substantially paid as of December 31, 2020.
For 2020, we recognized $29.2 million of total charges primarily related to our exit from Brazil, inventory write-downs, severance costs, and fixed asset impairments, with $28.6 million inOperating results for the Fluids Systems segment and $0.6include the following charges. See Note 2 for additional information.
| | | | | | | | | | | | | | | | | |
| | Year Ended December 31, |
| (In thousands) | 2023 | | 2022 | | 2021 |
| Impairments and other charges | $ | 6,356 | | | $ | 29,417 | | | $ | — | |
| Fluids sale process transaction expenses | 619 | | | — | | | — | |
| Facility exit costs and other | 4,594 | | | 1,000 | | | 2,399 | |
| Severance costs | 1,172 | | | 398 | | | 1,329 | |
| Kenedy, Texas facility fire (insurance recovery) | — | | | — | | | (849) | |
| Gain on divestitures | — | | | (971) | | | — | |
| Fourchon, Louisiana hurricane-related costs | — | | | — | | | 2,596 | |
| Total Fluids Systems impairments and other charges | $ | 12,741 | | | $ | 29,844 | | | $ | 5,475 | |
Industrial Blending operating results for 2022 includes a $7.9 million non-cash impairment charge related to the long-lived assets previously used in the Corporate office. For 2019, we recognized $23.2 million of total charges primarily related to a non-cash impairment of goodwill and charges associated with facility closures and related exit costs, inventory write-downs, and severance costs,now exited Industrial Blending business, as well as the modification of our retirement policy, with $18.8 milliondescribed in the Fluids Systems segment and $4.4 million in the Corporate office.
See below for details of charges in the Fluids Systems segment.
| | | | | | | | | | | | | | | | | |
| | Year Ended December 31, |
| (In thousands) | 2021 | | 2020 | | 2019 |
| Fourchon, Louisiana hurricane-related costs | $ | 2,596 | | | $ | — | | | $ | — | |
| Facility exit costs and other | 2,399 | | | (201) | | | 2,631 | |
| Severance costs | 1,329 | | | 3,729 | | | 2,264 | |
| Kenedy, Texas facility fire (insurance recovery) | (849) | | | — | | | — | |
| Brazil exit - Recognition of cumulative foreign currency translation losses | — | | | 11,689 | | | — | |
| Inventory write-downs | — | | | 10,345 | | | 1,881 | |
| Property, plant and equipment impairment | — | | | 3,038 | | | — | |
| Goodwill impairment | — | | | — | | | 11,422 | |
| Modification of retirement policy | — | | | — | | | 605 | |
| Total Fluids Systems impairments and other charges | $ | 5,475 | | | $ | 28,600 | | | $ | 18,803 | |
The following table presents further disaggregated revenues for the Fluids Systems segment:
| | | | Year Ended December 31, | | Year Ended December 31, |
| (In thousands) | (In thousands) | 2021 | | 2020 | | 2019 | (In thousands) | 2023 | | 2022 | | 2021 |
| United States | United States | $ | 227,261 | | | $ | 202,052 | | | $ | 395,618 | |
| Canada | Canada | 48,007 | | | 24,762 | | | 31,635 | |
| Total North America | Total North America | 275,268 | | | 226,814 | | | 427,253 | |
| | EMEA | EMEA | 132,221 | | | 115,891 | | | 172,263 | |
| EMEA | |
| EMEA | |
| Other | Other | 13,300 | | | 11,903 | | | 20,801 | |
| Total International | Total International | 145,521 | | | 127,794 | | | 193,064 | |
| | Total Fluids Systems revenues | Total Fluids Systems revenues | $ | 420,789 | | | $ | 354,608 | | | $ | 620,317 | |
| Total Fluids Systems revenues | |
| Total Fluids Systems revenues | |
The following table presents further disaggregated revenues for the Industrial Solutions segment:
| | | | Year Ended December 31, | | Year Ended December 31, |
| (In thousands) | (In thousands) | 2021 | | 2020 | | 2019 | (In thousands) | 2023 | | 2022 | | 2021 |
| Product sales revenues | $ | 66,796 | | | $ | 29,170 | | | $ | 56,465 | |
| Rental revenues | Rental revenues | 68,455 | | | 47,341 | | | 70,207 | |
| Service revenues | Service revenues | 49,920 | | | 53,958 | | | 73,130 | |
Industrial blending revenues (1) | 8,821 | | | 7,548 | | | — | |
| Product sales revenues | |
| Total Industrial Solutions revenues | Total Industrial Solutions revenues | $ | 193,992 | | | $ | 138,017 | | | $ | 199,802 | |
(1) Industrial blending operations began in the second quarter of 2020 and ramped up in the third quarter of 2020. Results for the industrial blending component are presented in Industrial Solutions beginning October 2020. Results for the second quarter and third quarter of 2020 were reported in Fluids Systems and not adjusted as they were not material.
0
NEWPARK RESOURCES, INC.
NOTES TO CONSOLIDATED FINANCIAL STATEMENTS – (Continued)
The following table sets forth geographic information for all of our operations. Revenues by geographic location are determined based on the operating location from which services are rendered or products are sold. Long-lived assets include property, plant and equipment and other long-term assets based on the country in which the assets are located.
| | | | Year Ended December 31, | | Year Ended December 31, |
| (In thousands) | (In thousands) | 2021 | | 2020 | | 2019 | (In thousands) | 2023 | | 2022 | | 2021 |
| Revenues | Revenues | | | | | | Revenues | | | |
| United States | United States | $ | 402,246 | | | $ | 327,598 | | | $ | 578,698 | |
| Canada | Canada | 48,007 | | | 24,762 | | | 37,496 | |
| EMEA | EMEA | 151,228 | | | 128,362 | | | 183,124 | |
| Asia Pacific | Asia Pacific | 7,629 | | | 6,561 | | | 15,273 | |
| Latin America | Latin America | 5,671 | | | 5,342 | | | 5,528 | |
| Total revenues | Total revenues | $ | 614,781 | | | $ | 492,625 | | | $ | 820,119 | |
| | Long-lived assets | Long-lived assets | | | | | |
| Long-lived assets | |
| Long-lived assets | | | | |
| United States | United States | $ | 318,839 | | | $ | 329,719 | | | $ | 365,185 | |
| Canada | Canada | 1,209 | | | 1,503 | | | 2,129 | |
| EMEA | EMEA | 38,923 | | | 44,577 | | | 46,447 | |
| Asia Pacific | Asia Pacific | 2,712 | | | 3,007 | | | 2,862 | |
| Latin America | Latin America | 375 | | | 500 | | | 1,047 | |
| Total long-lived assets | Total long-lived assets | $ | 362,058 | | | $ | 379,306 | | | $ | 417,670 | |
For 2021, 20202023, 2022 and 2019,2021, no single customer accounted for more than 10% of our consolidated revenues.
Note 14 — Supplemental Cash Flow and Other Information
Supplemental disclosures to the statements of cash flows are presented below:
| | (in thousands) | (in thousands) | 2021 | | 2020 | | 2019 | (in thousands) | 2023 | | 2022 | | 2021 |
| Cash paid (received) for: | Cash paid (received) for: | | | | | |
| Income taxes (net of refunds) | Income taxes (net of refunds) | $ | 6,912 | | | $ | 6,350 | | | $ | 12,165 | |
| Income taxes (net of refunds) | |
| Income taxes (net of refunds) | |
| Interest | Interest | $ | 5,339 | | | $ | 6,054 | | | $ | 8,718 | |
Cash, cash equivalents, and restricted cash in the consolidated statements of cash flows consisted of the following:
| | (in thousands) | (in thousands) | 2021 | | 2020 | | 2019 | (in thousands) | 2023 | | 2022 | | 2021 |
| Cash and cash equivalents | Cash and cash equivalents | $ | 24,088 | | | $ | 24,197 | | | $ | 48,672 | |
| Restricted cash (included in other current assets) | Restricted cash (included in other current assets) | 5,401 | | | 6,151 | | | 8,191 | |
| Cash, cash equivalents, and restricted cash | Cash, cash equivalents, and restricted cash | $ | 29,489 | | | $ | 30,348 | | | $ | 56,863 | |
Accounts payable and accrued liabilities at December 31, 2021, 2020,2023, 2022, and 2019,2021, included accruals for capital expenditures of $0.7$1.6 million, $0.5$1.1 million, and $1.8$0.7 million, respectively.
Accrued liabilities at December 31, 20212023 and 20202022 included accruals for employee incentives and other compensation related expenses of $23.1$28.3 million and $16.4$25.2 million, respectively.
Note 15 — Commitments and Contingencies
In the ordinary course of conducting our business, we become involved in litigation and other claims from private party actions, as well as judicial and administrative proceedings involving governmental authorities at the federal, state, and local levels. While the outcome of litigation or other proceedings against us cannot be predicted with certainty, management does not expect that any loss resulting from such litigation or other proceedings, in excess of any amounts accrued or covered by insurance, will have a material adverse impact on our consolidated financial statements.
Other
We do not have any special purpose entities. At December 31, 2021,2023, we had $45.3$39.8 million in outstanding letters of credit, performance bonds, and other guarantees for which certain of the letters of credit are collateralized by $5.4$0.3 million in restricted cash. We also enter into normal short-term operating leases for office and warehouse space, as well as rolling stock and other pieces ofcertain operating equipment. None of these off-balance sheet arrangements either had, or is expected to have, a material effect on our financial statements.
We are self-insured for health claims, subject to certain “stop loss” insurance policies. Claims in excess of $250,000 per incident are insured by third-party insurers. Based on historical experience, we had accrued liabilities of $0.7 million for unpaid claims incurred at both December 31, 20212023 and 2020.2022. Substantially all of these estimated claims are expected to be paid within six months of their occurrence. In addition, we are self-insured for certain workers’ compensation, auto, and general liability claims up to a certain policy limit. Claims in excess of $750,000 are insured by third-party reinsurers. Based on historical experience, we had accrued liabilities of $2.5$1.7 million and $2.8$3.1 million for the uninsured portion of claims at December 31, 20212023 and 2020,2022, respectively.
We also maintain accrued liabilities for asset retirement obligations, which represent obligations associated with the retirement of tangible long-lived assets that result from the normal operation of the long-lived asset. Our asset retirement obligations primarily relate to required expenditures associated with owned and leased facilities. Upon settlement of the liability, a gain or loss for any difference between the settlement amount and the liability recorded is recognized. We had accrued asset retirement obligations of $1.1$1.2 million and $1.2 million at December 31, 20212023 and 2020,2022, respectively.
Note 16 — Subsequent Events
International Subsidiary Restructuring
In January 2022, we completed the restructuring of certain subsidiary legal entities within Europe. As a result of the restructuring, we expect to recognize an income tax benefit of approximately $3 million in the first quarter of 2022 as the undistributed earnings for an international subsidiary will no longer be subject to certain taxes upon future distribution.
Strategic Review Actions
With ongoing support from outside financial and other advisors, we have continuously reviewed our portfolio during the oil and natural gas cycle of the last couple of years. These reviews have focused on evaluating changes in the outlook for our served markets and customer priorities, while identifying opportunities for value-creating options in our portfolio, as well as placing investment emphasis in markets where we generate strong returns and where we see greater long-term viability and stability. As part of our ongoing review of our portfolio, our management recommended and our Board of Directors approved two actions in February 2022 intended to enhance liquidity available for investment in higher returning businesses.
First, in consideration of broader strategic priorities and the timeline and efforts required to further develop the industrial blending business, our management recommended and our Board of Directors approved a plan to exit our Industrial Blending operations. As part of the exit plan, we expect to complete the wind down of the Industrial Blending business by the end of the second quarter 2022 and pursue the sale of the industrial blending and warehouse facility and related equipment located in Conroe, Texas. The Industrial Blending business contributed $9 million of revenues in 2021 and incurred an operating loss of $2 million. As of December 31, 2021, the carrying value of the long-lived assets associated with the Industrial Blending business was $20 million. As a result of the plan to exit and dispose of the assets used in the Industrial Blending business, we may incur pre-tax charges in the range of approximately $4 million to $8 million primarily related to the non-cash impairment of long-lived assets, which we expect to recognize in the first quarter of 2022.
Second, our Board of Directors also approved management’s plan to explore strategic options for our U.S. mineral grinding business, which contributed total third-party revenues of $36 million in 2021 yielding approximately break-even operating income and ended the year with $47 million of net capital employed, including approximately $25 million of net working capital.
ITEM 9. Changes in and Disagreements with Accountants on Accounting and Financial Disclosure
None.
ITEM 9A. Controls and Procedures
Evaluation of Disclosure Controls and Procedures
Our management, with the participation of our Chief Executive Officer and Chief Financial Officer, has evaluated the effectiveness of our disclosure controls and procedures (as defined in Rules 13a-15(e) and 15d-15(e) under the Securities Exchange Act of 1934) as of the end of the period covered by this annual report. Based on such evaluation, our Chief Executive Officer and Chief Financial Officer concluded that our disclosure controls and procedures were effective as of December 31, 2021,2023, the end of the period covered by this annual report.
Changes in Internal Control Over Financial Reporting
There were no changes in our internal control over financial reporting that occurred during the quarter ended December 31, 20212023 that materially affected, or are reasonably likely to materially affect, our internal control over financial reporting.
Management’s Report on Internal Control Over Financial Reporting
We are responsible for establishing and maintaining adequate internal control over financial reporting, as such term is defined in Securities and Exchange Act Rule 13a-15(f) and 15d-15(f). Our internal control system over financial reporting is designed to provide reasonable assurance regarding the reliability of our financial reporting and the preparation of financial statements for external purposes in accordance with accounting principles generally accepted in the United States of America.
Internal control over financial reporting has inherent limitations and may not prevent or detect misstatements. Therefore, even those systems determined to be effective can provide only reasonable assurance, not absolute assurance with respect to the financial statement preparation and presentation. Further, because of changes in conditions, the effectiveness of internal control over financial reporting may vary over time.
Under the supervision and with the participation of our Chief Executive Officer and Chief Financial Officer, we have evaluated the effectiveness of our internal control over financial reporting as of December 31, 20212023 as required by the Securities and Exchange Act of 1934 Rule 13a-15(c). In making our assessment, we have utilized the criteria set forth by the Committee of Sponsoring Organizations of the Treadway Commission (COSO) in a report entitled “Internal Control — Integrated Framework (2013).” We concluded that based on our evaluation, our internal control over financial reporting was effective as of December 31, 2021.2023.
The effectiveness of our internal control over financial reporting as of December 31, 20212023 has been audited by Deloitte & Touche LLP, an independent registered public accounting firm, as stated in their report which is included herein.
/s/ Paul L. HowesMatthew S. Lanigan
Paul L. HowesMatthew S. Lanigan
Chief Executive Officer
/s/ Gregg S. Piontek
Gregg S. Piontek
Senior Vice President and Chief Financial Officer
REPORT OF INDEPENDENT REGISTERED PUBLIC ACCOUNTING FIRM
To the stockholders and the Board of Directors of Newpark Resources, Inc.
Opinion on Internal Control over Financial Reporting
We have audited the internal control over financial reporting of Newpark Resources, Inc. and subsidiaries (the “Company”) as of December 31, 2021,2023, based on criteria established in Internal Control — Integrated Framework (2013) issued by the Committee of Sponsoring Organizations of the Treadway Commission (COSO). In our opinion, the Company maintained, in all material respects, effective internal control over financial reporting as of December 31, 2021,2023, based on criteria established in Internal Control – Integrated Framework (2013) issued by COSO.
We have also audited, in accordance with the standards of the Public Company Accounting Oversight Board (United States) (PCAOB), the consolidated financial statements as of and for the year ended December 31, 2021,2023, of the Company and our report dated February 25, 2022,23, 2024, expressed an unqualified opinion on those financial statements.
Basis for Opinion
The Company’s management is responsible for maintaining effective internal control over financial reporting and for its assessment of the effectiveness of internal control over financial reporting, included in the accompanying Management’s Report on Internal Control Over Financial Reporting. Our responsibility is to express an opinion on the Company’s internal control over financial reporting based on our audit. We are a public accounting firm registered with the PCAOB and are required to be independent with respect to the Company in accordance with the U.S. federal securities laws and the applicable rules and regulations of the Securities and Exchange Commission and the PCAOB.
We conducted our audit in accordance with the standards of the PCAOB. Those standards require that we plan and perform the audit to obtain reasonable assurance about whether effective internal control over financial reporting was maintained in all material respects. Our audit included obtaining an understanding of internal control over financial reporting, assessing the risk that a material weakness exists, testing and evaluating the design and operating effectiveness of internal control based on the assessed risk, and performing such other procedures as we considered necessary in the circumstances. We believe that our audit provides a reasonable basis for our opinion.
Definition and Limitations of Internal Control over Financial Reporting
A company’s internal control over financial reporting is a process designed to provide reasonable assurance regarding the reliability of financial reporting and the preparation of financial statements for external purposes in accordance with generally accepted accounting principles. A company’s internal control over financial reporting includes those policies and procedures that (1) pertain to the maintenance of records that, in reasonable detail, accurately and fairly reflect the transactions and dispositions of the assets of the company; (2) provide reasonable assurance that transactions are recorded as necessary to permit preparation of financial statements in accordance with generally accepted accounting principles, and that receipts and expenditures of the company are being made only in accordance with authorizations of management and directors of the company; and (3) provide reasonable assurance regarding prevention or timely detection of unauthorized acquisition, use, or disposition of the company’s assets that could have a material effect on the financial statements.
Because of its inherent limitations, internal control over financial reporting may not prevent or detect misstatements. Also, projections of any evaluation of effectiveness to future periods are subject to the risk that controls may become inadequate because of changes in conditions, or that the degree of compliance with the policies or procedures may deteriorate.
/s/ DELOITTE & TOUCHE LLP
Houston, Texas
February 25, 202223, 2024
ITEM 9B. Other Information
None.Insider Trading Arrangements
During the quarter ended December 31, 2023, no director or officer of the Company adopted or terminated any Rule 10b5-1 trading arrangement or non-Rule 10b5-1 trading arrangement, as each term is defined in Item 408(a) of Regulation S-K.
ITEM 9C. DisclosuresDisclosure Regarding Foreign Jurisdictions that Prevent Inspections
Not applicable.
PART III
ITEM 10. Directors, Executive Officers and Corporate Governance
Executive Officers and Directors
The information required by this Item is incorporated by reference to the “Executive Officers” and “Election of Directors” sections of the definitive Proxy Statement relating to our 20222024 Annual Meeting of Stockholders.
Compliance with Section 16(a) of the Exchange Act
The information required by this Item, if applicable, is incorporated by reference to the “Delinquent Section 16(a) Reports” section of the definitive Proxy Statement relating to our 20222024 Annual Meeting of Stockholders.
Code of Conduct and Ethics
We have adopted a Code of Ethics for Senior Officers and Directors ("Code of Ethics") and a Code of Business Ethics and Conduct (“Ethics Manual" and, together with the Code of Ethics, the "Codes”) that applies to all officers and employees. The Code of Ethics and Ethics Manual are publicly available in the investor relations area of our website at www.newpark.com. Any amendments to, or waivers of, the Codes with respect to our principal executive officer, principal financial officer or principal accounting officer or controller, or persons performing similar functions, will be disclosed on our website within four business days following the date of the amendment or waiver. Copies of our Code of Ethics may also be requested in print by writing to Newpark Resources, Inc., 9320 Lakeside Blvd., Suite 100, The Woodlands, Texas, 77381.
ITEM 11. Executive Compensation
The information required by this Item is incorporated by reference to the “Executive Compensation” section of the definitive Proxy Statement relating to our 20222024 Annual Meeting of Stockholders.
ITEM 12. Security Ownership of Certain Beneficial Owners and Management and Related Stockholder Matters
The information required by this Item is incorporated by reference to the “Ownership of Common Stock” and “Equity Compensation Plan Information” sections of the definitive Proxy Statement relating to our 20222024 Annual Meeting of Stockholders.
ITEM 13. Certain Relationships and Related Transactions, and Director Independence
The information required by this Item is incorporated by reference to the “Related Person Transactions” and “Director Independence” sections of the definitive Proxy Statement relating to our 20222024 Annual Meeting of Stockholders.
ITEM 14. Principal Accountant Fees and Services
Our independent registered public accounting firm is Deloitte & Touche LLP, Houston, Texas, PCAOB ID No 34.
The information required by this Item is incorporated by reference to the “Independent Auditor” section of the definitive Proxy Statement relating to our 20222024 Annual Meeting of Stockholders.
PART IV
ITEM 15. Exhibit and Financial Statement Schedules
(a) List of documents filed as part of this Annual Report or incorporated herein by reference.
1. Financial Statements
The following financial statements of the Registrant as set forth under Part II, Item 8 of this Annual Report on Form 10-K on the pages indicated.
| | | | | |
| | Page in this Form 10-K |
| Report of Independent Registered Public Accounting Firm | |
| Consolidated Balance Sheets | |
| Consolidated Statements of Operations | |
| Consolidated Statements of Comprehensive Income (Loss) | |
| Consolidated Statements of Stockholders’ Equity | |
| Consolidated Statements of Cash Flows | |
| Notes to Consolidated Financial Statements | |
2. Financial Statement Schedules
All schedules for which provision is made in the applicable accounting regulations of the Securities and Exchange Commission are not required under the related instructions or are inapplicable and, therefore, have been omitted.
3. Exhibits
The exhibits listed are filed as part of, or incorporated by reference into, this Annual Report on Form 10-K.
| | | | | |
| 3.1 | Restated Certificate of Incorporation of Newpark Resources, Inc., incorporated by reference to Exhibit 3.1 to the Company’s Form 10-K405 for the year ended December 31, 1998 filed on March 31, 1999 (SEC File No. 001-02960). |
| 3.2 | Certificate of Designation of Series A Cumulative Perpetual Preferred Stock of Newpark Resources, Inc. incorporated by reference to Exhibit 99.1 to the Company’s Current Report on Form 8-K filed on April 27, 1999 (SEC File No. 001-02960). |
| 3.3 | |
| 3.4 | |
| 3.5 | |
| 3.6 | |
| 3.7 | |
| 3.8 | |
| 3.9 | |
*4.1 | |
| 4.2 | Specimen form of common stock certificate of Newpark Resources, Inc., incorporated by reference to the exhibit filed with the Company’s Registration Statement on Form S-1 (SEC File No. 33-40716). |
| | | | | |
4.3 | |
4.4 | |
4.5 | |
| †10.1 | |
†10.2 | |
†10.310.2 | |
†10.4 | |
†10.5 | |
†10.6 | |
†10.7 | |
†10.810.3 | |
†10.910.4 | |
†10.10*10.5 | |
| †*10.6 | |
| †10.7 | |
†10.1110.8 | |
†10.12 | |
†10.13 | |
†10.14 | |
†10.15 | |
†10.16 | |
†10.17 | |
| | | | | |
†10.2110.10 | |
| †10.11 | |
†10.2210.12 | |
10.23†10.13 | |
| 10.14 | |
10.2410.15 | |
10.2510.16 | |
10.2610.17 | |
†10.27 | |
†10.2810.18 | |
†10.29 | |
†10.3010.19 | |
†10.31 | |
†10.3210.20 | |
†10.3310.21 | |
†10.3410.22 | |
†10.3510.23 | |
†10.36 | |
†10.3710.24 | |
†10.3810.25 | |
| | | | | |
†10.3910.26 | |
†10.40 | |
†10.4110.27 | |
†10.4210.28 | |
†10.4310.29 | |
| | | | | |
†10.4410.30 | |
†10.4510.31 | |
†10.4610.32 | |
†10.4710.33 | |
†10.4810.34 | |
†10.49 | |
†10.50 | |
†10.51 | |
†10.52 | |
†10.53 | |
†10.54 | |
†10.55 | |
†10.56 | |
†10.57 | |
†10.58 | |
| | | | | |
†10.59 | |
†10.60 | |
†10.6110.35 | |
†10.6210.36 | |
†10.63 | |
†10.6410.37 | |
†10.6510.38 | |
†10.6610.39 | |
†10.6710.40 | |
| †10.41 | |
| †10.42 | |
10.6810.43 | |
10.69 | Second Amended and Restated Credit Agreement dated October 17, 2017as of May 2, 2022 by and among Newpark Resources, Inc., Newpark Drilling Fluids LLC, Newpark Mats & Integrated Services LLC, Excalibar Minerals LLC, Newpark Industrial Blending Solutions LLC, and Dura-Base Nevada, Inc., as borrowers, Bank of America, N.A., as the Administrative Agent, Swing Line Lender and an L/C Issuer, and the other Lenders party hereto, incorporated by reference to Exhibit 10.1 to10.3 of the Company’s CurrentCompany's Quarterly Report on Form 8-K10-Q filed on October 18, 2017May 4, 2022 (SEC File No. 001-02960). |
10.70 | First Amendment to Amended and Restated Credit Agreement and Amended and Restated Security Agreement, dated as of March 20, 2019, by and among Newpark Resources, Inc., Newpark Drilling Fluids LLC, Newpark Mats & Integrated Services LLC, Excalibar Minerals LLC and Dura-Base Nevada, Inc., as borrowers, Bank of America, N.A., as Administrative Agent, Swing Line Lender and an L/C Issuer, and the other Lenders party thereto, incorporated by reference to Exhibit 10.1 to the Company’s Current Report on Form 8-K filed on March 21, 2019 (SEC File No. 001-02960). |
10.7110.44 | |
| *21.1 | |
| *23.1 | |
| *31.1 | |
| *31.2 | |
| **32.1 | |
| **32.2 | |
*95.197 | |
| |
| | | | | |
| *101.INS | XBRL Instance Document - the instance document does not appear in the Interactive Data File because its XBRL tags are embedded within the Inline XBRL document |
| | | | | |
| *101.SCH | Inline XBRL Schema Document |
| *101.CAL | Inline XBRL Calculation Linkbase Document |
| *101.LAB | Inline XBRL Label Linkbase Document |
| *101.PRE | Inline XBRL Presentation Linkbase Document |
| *101.DEF | Inline XBRL Definition Linkbase Document |
| *104 | Cover Page Interactive Data File (formatted as Inline XBRL and contained in Exhibit 101) |
† Management compensation plan or agreement.
* Filed herewith.
** Furnished herewith.
ITEM 16. Form 10-K Summary
None.
SIGNATURES
Pursuant to the requirements of Section 13 or 15(d) of the Securities Exchange Act of 1934, the registrant has duly caused this report to be signed on its behalf by the undersigned, thereunto duly authorized.
| | | | | | | | |
| | NEWPARK RESOURCES, INC. |
|
| By: | /s/ Paul L. HowesMatthew S. Lanigan |
| | Paul L. HowesMatthew S. Lanigan |
| | Chief Executive Officer |
Dated: February 25, 202223, 2024
Pursuant to the requirements of the Securities Exchange Act of 1934, this report has been signed below by the following persons on behalf of the registrant and in the capacities and on the dates indicated.
| | | | | | | | | | | |
| Signatures | | Title | Date |
| | | | |
/s/ Paul L. HowesMatthew S. Lanigan | | Chief Executive Officer and Director | February 25, 202223, 2024 |
Paul L. HowesMatthew S. Lanigan | | (Principal Executive Officer) | |
| | | | |
| /s/ Gregg S. Piontek | | Senior Vice President and Chief Financial Officer | February 25, 202223, 2024 |
| Gregg S. Piontek | | (Principal Financial Officer) | |
| | | | |
| /s/ Douglas L. White | | Vice President, Chief Accounting Officer and Treasurer | February 25, 202223, 2024 |
| Douglas L. White | | (Principal Accounting Officer) | |
| | | | |
/s/ Anthony J. BestRose M. Robeson | | Chairman of the Board | February 25, 202223, 2024 |
Anthony J. Best | | | |
| | | |
/s/ G. Stephen Finley | | Director | February 25, 2022 |
G. Stephen FinleyRose M. Robeson | | | |
| | | | |
| /s/ Roderick A. Larson | | Director | February 25, 202223, 2024 |
| Roderick A. Larson | | | |
| | | | |
| /s/ Michael A. Lewis | | Director | February 25, 202223, 2024 |
| Michael A. Lewis | | | |
| | | |
| /s/ Claudia M. Meer | | Director | February 23, 2024 |
| Claudia M. Meer | | | |
| | | |
| /s/ John C. Mingé | | Director | February 25, 202223, 2024 |
| John C. Mingé | | | |
| | | | |
/s/ Rose M. RobesonDonald W. Young | | Director | February 25, 202223, 2024 |
Rose M. RobesonDonald W. Young | | | |