18
Our stores located in shopping centers and malls have been and may be adversely affected by any declines in consumer traffic ofat shopping centers and malls.
The majority of our stores are located within shopping centers and malls and may benefit from the abilities that we and other anchor tenants have to generate consumer traffic. A substantial decline in mallshopping center traffic in favor of e-commerce, the development of new shopping centers and malls, the lack of availability of favorable locations within existing or new shopping centers and malls, the success of individual shopping centers and malls and the success or failure of other anchor tenants have impacted and may negatively impact our ability in the future to maintain or grow our sales in existing stores,business, as well as our ability to open new stores, which could have an adverse effect on our financial condition or results of operations.
Our business depends on third parties forLike other retailers, our stores have been impacted by changing levels of theft or vandalism, which may affect consumer traffic in our stores and cause inventory shrinkage. If we experience higher rates of inventory shrinkage at stores located in shopping centers and malls, or if we are unable to effectively reduce the production, supplyimpact of loss or deliverytheft of goods,assets, our operating results could be adversely affected. The severity or quantity of incidents, including perceptions and a disruption couldreactions, may result in lost salesreputational damage or increased costs.
The continued successloss of our operations is tied to our timely receipt of quality merchandise from third parties. Our process to identify qualified vendors and access quality products in an efficient manner on acceptable terms and cost can be complex. Violations of law with respect to quality and safety by our importers, manufacturers or distributors could result in delays in shipments and receipt of goods or damage our reputation, resulting in lost sales. These vendors may experience difficulties due to economic or political conditions or the countries in which merchandise is manufactured could become subject to new trade restrictions, including increased customs restrictions, tariffs or quotas. Additionally, changes in tax and trade policies that impact the retail industry, such as increased taxation on imported goods, could have a material adverse effect on our business, results of operations and liquidity.customer trust.
The results offrom our Creditcredit card operations could be adversely affected by changes in market conditions.conditions or laws.
Revenues earned under our program agreement with TD are indirectly subject to economic and market conditions that are beyond our control, including, but not limited to, interest rates, consumer credit availability, demand for credit, consumer debt levels, payment patterns, delinquency rates, frequency of fee waivers, frequency or volume of governmental stimulus, personal bankruptcy rates, employment trends, laws and other factors. Additionally, changes in net sales partially translate to program agreement revenues. Changes in these economic, market or regulatory conditions, customer behavior or our mix of sales and market conditionsprogram agreement revenues could impairimpact our revenues and profitability.
Our business and operations could be materially and adversely affected by supply chain disruptions, port disruptions, severe weather patterns, climate change, natural disasters, widespread pandemics, epidemics, civil unrest and other natural or man-made economic, political or environmental disruptions.
These disruptionsDisruptions, and government responses, could cause, among other things, a decreasedecreases in consumer spending that wouldcould negatively impact our sales, declines in traffic in urban centers, staffing shortages in our Supply Chain Network facilities, stores distribution centers or corporate offices, interruptions in the flow of merchandise to our stores, disruptions in the operations of our merchandise vendors or property developers, increased costs and a negative impact on our reputation and long-term growth plans.plans, which could vary based on the length and severity of the disruption. Health pandemics and epidemics, have in the past and may in the future, impact consumer and government responses, which may have an adverse impact on global economic conditions and our business, results of operations and financial condition. We also have a significant amount of our total sales, stores and square footage inon the west coastWest Coast of the United States, particularly in California, which increaseswhere we have experienced earthquakes, wildfires, flooding and power outages and shortages that increase our exposure to any market-disrupting conditions in this region.
RISKS DUE TO LEGAL AND REGULATORY FACTORSRISKS
We are subject to certain laws, litigation, regulatory matters and ethical standards, and ourcompliance or failure to comply with or adequately address developments as they arise could adversely affect our reputation and operations.
Our policies, procedures and practices and the technology we implement are designedintended to comply withaddress applicable federal, state, local and foreign laws, tariffs, rules and regulations, including those imposed by the SEC, consumer protection and other regulatory agencies, the marketplace, and foreign countries, as well as responsible business, social and environmental practices, all of which may change from time to time. ComplianceIf we, or the third parties we do business with, laws and regulationsfail to comply with these requirements and/or significant legislative changes may causeto them, our business tocould be adversely impacted, or even limit or restrict the activities of our business.impacted. In addition, if we fail to complynoncompliance with applicable laws and regulations or failure to implement responsible business, social, environmental and supply chain practices we could be subject toresult in reputational damage, to our reputation, class action lawsuits, regulatory investigations, legal costs and settlement costs,penalties, charges and payments, civil and criminal liability, increased cost of regulatory compliance, losingloss of our ability to offer or accept credit and debit card payments from our customers, restatements of our financial statements, disruption of our business, loss of customers and loss of customers.customer trust. Changes to existing and new privacy and data protection laws may increase compliance expenses and limit business opportunities and strategic initiatives, including customer engagement. Any required changes to our employment practices could result in the loss of employees, reduced sales, increased employment costs, low employee morale and harm to our business and results of operations. In addition, political and economic factors could lead to unfavorable changes in federal, state and foreign tax laws, which may affect our tax assets or liabilities and adversely affect our results of operations. We are also regularly involved in various litigation matters that arise in the ordinary course of business. Litigation or regulatory developments could adversely affect our business and financial condition.
Compliance with Section 404 of the Sarbanes-Oxley Act of 2002 requires management assessments of the effectiveness of our internal controls over financial reporting through documenting, testing, monitoring and enhancement of internal control over financial reporting. If we fail to implement or maintain adequate internal controls, we may not produce reliable financial reports or fail to prevent or detect financial fraud, which may adversely affect our financial position, investor confidence or our stock price.
Nordstrom, Inc. and subsidiaries19
Changes to accounting rules and regulations could affect our financial results or financial condition.
Accounting principles and related pronouncements, implementation guidelines and interpretations with regard to a wide variety of accounting matters that are relevant to our business, including, but not limited to, revenue recognition, merchandise inventories, leasing, goodwill, impairment ofinventory valuation, long-lived assets, stock-based compensationasset recoverability, income taxes and tax matterscontingent liabilities, including assumptions related to our Canada wind-down, are highly complex and involve subjective assumptions, estimates and judgments. Changes in these rules and regulations, changes in our interpretation or our misapplication of the rules or regulations, changes in accounting policies or changes in underlying assumptions, estimates or judgments could adversely affect our financial performance or financial position.
If Nordstrom Canada is unable to make a fair and orderly wind-down of its business operations, or if our existing reserves are not adequate to cover our ultimate liability, our financial condition and results of operations could be adversely affected. On March 2, 2023, we announced the decision to discontinue support for Nordstrom Canada’s operations. Accordingly, Nordstrom Canada commenced a wind-down of its business operations, obtaining an Initial Order from the Ontario Superior Court of Justice under the CCAA on March 2, 2023 to facilitate the wind-down in an orderly fashion. Nordstrom Canada wound down its Nordstrom and Nordstrom Rack stores across Canada, with the help of a third-party liquidator, and its Canadian e-commerce platform. The e-commerce platform ceased operations on March 2, 2023 and the in-store wind-down was completed in June 2023. As described in Note 2: Canada Wind-down in Item 8, we have incurred $284 in pre-tax charges associated with the wind-down of operations in Canada for the year ended February 3, 2024. Our reserves relating to these matters may not be adequate to cover our ultimate liability or we may suffer other losses for which we have not established reserves, although we believe that possibility is not probable. If Nordstrom Canada is unable to effectively and efficiently finalize the wind-down of business operations, or we incur additional costs, there could be a material adverse effect on the conclusion of the CCAA filing or our financial condition and results of operations.
Item 1B. Unresolved Staff Comments.
None.
Item 1C. Cybersecurity.
Nordstrom understands that establishing, executing and sustaining effective cybersecurity measures to secure our information systems and preserve the confidentiality, integrity and availability of our data is critical to the success of the business.
Management of Material Risks and Integrated Overall Risk Management
Our comprehensive risk management framework is intended to strategically incorporate cybersecurity risk management across the company, with the objective of ensuring that cybersecurity considerations underpin the decision-making processes at all organizational levels. Our risk management team collaborates closely across various Enterprise-wide business units to continually assess and address identified cybersecurity risks in alignment with business objectives. The CISO regularly updates the CTIO, Chief Financial Officer and Chief Executive Officer on material cybersecurity risks and events.
Engagement with Third Parties on Management of Cybersecurity Risk
Recognizing the dynamic nature of cybersecurity threats, Nordstrom collaborates with external experts, including assessors, consultants and examiners, to evaluate and test our cybersecurity risk preparedness. Regular exams, threat assessments and consultation on security enhancements with these third parties ensure that our cybersecurity strategies align with industry best practices.
Oversight of Third-party Risk
In the course of our business, we regularly exchange data and information with certain third parties in various ways, exposing us to risk related to the cybersecurity posture of and information management practices of those third parties. To try to mitigate this risk, we have implemented processes that may, depending upon the nature of the relationship with the third party, require security assessments and data integration design reviews prior to allowing our systems to connect with theirs. In addition, we seek to require these third parties to adhere to pre-established cybersecurity standards. Where applicable, we try to obtain contractual commitments with those third parties to ensure these security requirements are met.
Risks from Cybersecurity Threats
Nordstrom has not experienced any cybersecurity incident that has materially impacted, or that is reasonably likely to materially impact, our operations, financial condition and cash flows.
Cybersecurity Risk Management Personnel
Primary responsibility for assessing, monitoring, mitigating and managing our cybersecurity risks rests with our information security organization, led by our CISO and supported by our CTIO. The CISO, who has over 20 years of cybersecurity and technology expertise, supports a skilled information security organization that brings expertise in vulnerability management, incident response, penetration testing, regulatory compliance and other critical information security domains. Our information security team maintains certifications from recognized external security authorities such as ISC2, CompTIA, ISACA, GIAC, SANS, PCI and OffSec. The security program is assessed annually by a reputable third party to provide guidance for continuous improvement.
Monitoring and Responding to Cybersecurity Incidents
The security organization stays informed about the latest developments in cybersecurity, implements processes for regular monitoring of information systems and deploys relevant security measures. In the event of a cybersecurity incident, a formal incident response plan is in place for immediate actions and long-term strategies.
Board of Directors Oversight
The Board of Directors has oversight responsibilities regarding cybersecurity risk. At regularly scheduled meetings (at least quarterly), in addition to such additional interactions as may be necessary in specific circumstances, our Chief Executive Officer, CTIO and CISO update the Board on emerging cybersecurity risks and developments impacting Nordstrom.
Nordstrom, Inc. and subsidiaries1121
Item 2. Properties.
(Square footage amounts in thousands)
The following table summarizes the number ofSupply Chain Network and retail storeslocations we own or lease and the percentage of total store square footage represented by each listed category as of February 3, 2018:2024: | | | | | | | | | | | | | | |
| Number of locations | |
| Supply Chain Network | Nordstrom | Nordstrom Rack | Total square footage |
| Leased buildings on leased land | 2 | | 18 | 259 | | 13,525 | |
| Owned buildings on leased land | — | | 55 | — | | 10,062 | |
| Owned buildings on owned land | 8 | | 24 | 1 | | 8,250 | |
| Partly owned and partly leased | — | | 2 | — | | 544 | |
| Total | 10 | | 99 | | 260 | | 32,381 | |
|
| | | | | | | | | |
| | | Number of stores | | |
| | | Nordstrom Full-Line Stores1 |
| | Nordstrom Rack and Other2 |
| | % of total store
square footage |
|
| Leased stores on leased land | | 26 |
| | 242 |
| | 44 | % |
| Owned stores on leased land | | 63 |
| | — |
| | 37 | % |
| Owned stores on owned land | | 33 |
| | 1 |
| | 18 | % |
| Partly owned and partly leased store | | 1 |
| | — |
| | 1 | % |
| Total | | 123 |
| | 243 |
| | 100 | % |
1 Nordstrom full-line stores include U.S. full line stores, Canada full-line stores and Nordstrom Local.
2 Other includes Trunk Club clubhouses, Jeffrey boutiques and Last Chance stores.
The following table summarizes our Supply Chain Network and retail store openingscount and closures for fiscal 2017 and announced retail store openings and closures for fiscal 2018 by state/province:square footage activity: | | | | | | | | | | | | | | | | | | |
| | Count | | Square footage |
| Fiscal year | 2023 | 2022 | | | 2023 | 2022 |
| Total, beginning of year | 368 | | 367 | | | | 33,693 | | 33,982 | |
| Openings: | | | | | | |
| | | | | | |
| Nordstrom | — | | 1 | | | | — | | — | |
| Nordstrom Rack | 19 | | 2 | | | | 531 | | 55 | |
| Relocations, remodels or changes | — | | — | | | | (8) | | — | |
| Closures | (18) | | (2) | | | | (1,835) | | (344) | |
| Total, end of year | 369 | | 368 | | | | 32,381 | | 33,693 | |
|
| | | | | | | | | | | | |
| | | Number of stores |
| Fiscal year | | 2017 | | Announced 2018 |
| State/Province | | Nordstrom Full-Line Stores1 |
| | Nordstrom Rack and Other2 |
| | Nordstrom Full-Line Stores1 |
| | Nordstrom Rack and Other2 |
|
| Openings | | | | | | | | |
| U.S. | | | | | | | | |
| Arizona | | — |
| | — |
| | — |
| | 1 |
|
| California | | 1 |
| | 3 |
| | — |
| | 1 |
|
| Florida | | — |
| | 1 |
| | — |
| | — |
|
| Illinois | | — |
| | 2 |
| | — |
| | 1 |
|
| Indiana | | — |
| | 1 |
| | — |
| | — |
|
| Maryland | | — |
| | 1 |
| | — |
| | — |
|
| Minnesota | | — |
| | 2 |
| | — |
| | — |
|
| New Jersey | | — |
| | — |
| | — |
| | 1 |
|
| New York | | — |
| | 1 |
| | 1 |
| | — |
|
| Oregon | | — |
| | 1 |
| | — |
| | — |
|
| Pennsylvania | | — |
| | — |
| | — |
| | 1 |
|
| Tennessee | | — |
| | 1 |
| | — |
| | — |
|
| Texas | | — |
| | 2 |
| | — |
| | 1 |
|
| Washington | | — |
| | 2 |
| | — |
| | — |
|
| Canada | | | | | | | | |
| Alberta | | — |
| | — |
| | — |
| | 2 |
|
| Ontario | | 1 |
| | — |
| | — |
| | 4 |
|
| Total Openings | | 2 |
| | 17 |
| | 1 |
| | 12 |
|
| | | | | | | | | |
| Closures | | | | | | | | |
| California | | (1 | ) | | — |
| | — |
| | — |
|
| Oregon | | — |
| | — |
| | (1 | ) | | — |
|
| Virginia | | (1 | ) | | — |
| | — |
| | — |
|
| Total Closures | | (2 | ) | | — |
| | (1 | ) | | — |
|
1 Nordstrom full-line stores include U.S. full line stores, Canada full-line stores and Nordstrom Local.
2 Other includes Trunk Club clubhouses, Jeffrey boutiques and Last Chance stores.
The following table lists our Supply Chain Network and retail store count and square footage by state/provincestate as of February 3, 2018:2024:
|
| | | | | | | | | | | | | | | |
| Retail stores by channel | | Nordstrom Full-Line Stores1 | | Nordstrom Rack and Other2 | | Total |
| State/Province | | Count |
| Square Footage (000’s) |
| | Count |
| Square Footage (000’s) |
| | Count |
| Square Footage (000’s) |
|
| U.S. | | | | | | | | | |
| Alabama | | — |
| — |
| | 1 |
| 35 |
| | 1 |
| 35 |
|
| Alaska | | 1 |
| 97 |
| | 1 |
| 35 |
| | 2 |
| 132 |
|
| Arizona | | 2 |
| 384 |
| | 8 |
| 287 |
| | 10 |
| 671 |
|
California3 | | 31 |
| 5,192 |
| | 53 |
| 1,967 |
| | 84 |
| 7,159 |
|
| Colorado | | 3 |
| 559 |
| | 6 |
| 213 |
| | 9 |
| 772 |
|
| Connecticut | | 1 |
| 189 |
| | 1 |
| 36 |
| | 2 |
| 225 |
|
| Delaware | | 1 |
| 127 |
| | 1 |
| 32 |
| | 2 |
| 159 |
|
| Florida | | 9 |
| 1,389 |
| | 16 |
| 545 |
| | 25 |
| 1,934 |
|
| Georgia | | 2 |
| 383 |
| | 5 |
| 165 |
| | 7 |
| 548 |
|
| Hawaii | | 1 |
| 195 |
| | 2 |
| 78 |
| | 3 |
| 273 |
|
| Idaho | | — |
| — |
| | 1 |
| 37 |
| | 1 |
| 37 |
|
| Illinois | | 4 |
| 947 |
| | 16 |
| 590 |
| | 20 |
| 1,537 |
|
| Indiana | | 1 |
| 134 |
| | 2 |
| 60 |
| | 3 |
| 194 |
|
| Iowa | | — |
| — |
| | 1 |
| 35 |
| | 1 |
| 35 |
|
| Kansas | | 1 |
| 219 |
| | 1 |
| 35 |
| | 2 |
| 254 |
|
| Kentucky | | — |
| — |
| | 1 |
| 33 |
| | 1 |
| 33 |
|
| Louisiana | | — |
| — |
| | 3 |
| 90 |
| | 3 |
| 90 |
|
| Maine | | — |
| — |
| | 1 |
| 30 |
| | 1 |
| 30 |
|
| Maryland | | 4 |
| 765 |
| | 5 |
| 186 |
| | 9 |
| 951 |
|
| Massachusetts | | 4 |
| 595 |
| | 8 |
| 275 |
| | 12 |
| 870 |
|
| Michigan | | 3 |
| 552 |
| | 5 |
| 178 |
| | 8 |
| 730 |
|
| Minnesota | | 2 |
| 380 |
| | 5 |
| 173 |
| | 7 |
| 553 |
|
| Missouri | | 2 |
| 342 |
| | 2 |
| 69 |
| | 4 |
| 411 |
|
| Nevada | | 1 |
| 207 |
| | 3 |
| 101 |
| | 4 |
| 308 |
|
| New Jersey | | 5 |
| 991 |
| | 7 |
| 248 |
| | 12 |
| 1,239 |
|
| New Mexico | | — |
| — |
| | 1 |
| 34 |
| | 1 |
| 34 |
|
| New York | | 2 |
| 460 |
| | 14 |
| 473 |
| | 16 |
| 933 |
|
| North Carolina | | 2 |
| 300 |
| | 2 |
| 74 |
| | 4 |
| 374 |
|
| Ohio | | 3 |
| 549 |
| | 6 |
| 224 |
| | 9 |
| 773 |
|
| Oklahoma | | — |
| — |
| | 2 |
| 67 |
| | 2 |
| 67 |
|
| Oregon | | 4 |
| 555 |
| | 6 |
| 218 |
| | 10 |
| 773 |
|
| Pennsylvania | | 2 |
| 381 |
| | 6 |
| 214 |
| | 8 |
| 595 |
|
| Puerto Rico | | 1 |
| 143 |
| | — |
| — |
| | 1 |
| 143 |
|
| Rhode Island | | 1 |
| 206 |
| | 1 |
| 38 |
| | 2 |
| 244 |
|
| South Carolina | | — |
| — |
| | 4 |
| 104 |
| | 4 |
| 104 |
|
| Tennessee | | 1 |
| 145 |
| | 2 |
| 69 |
| | 3 |
| 214 |
|
Texas3 | | 9 |
| 1,562 |
| | 18 |
| 604 |
| | 27 |
| 2,166 |
|
| Utah | | 2 |
| 277 |
| | 4 |
| 126 |
| | 6 |
| 403 |
|
| Virginia | | 4 |
| 746 |
| | 7 |
| 268 |
| | 11 |
| 1,014 |
|
| Washington | | 7 |
| 1,392 |
| | 9 |
| 354 |
| | 16 |
| 1,746 |
|
| Washington D.C. | | — |
| — |
| | 4 |
| 115 |
| | 4 |
| 115 |
|
| Wisconsin | | 1 |
| 150 |
| | 2 |
| 67 |
| | 3 |
| 217 |
|
| Canada | | | | | | | | | |
| Alberta | | 1 |
| 142 |
| | — |
| — |
| | 1 |
| 142 |
|
| British Columbia | | 1 |
| 231 |
| | — |
| — |
| | 1 |
| 231 |
|
| Ontario | | 4 |
| 750 |
| | — |
| — |
| | 4 |
| 750 |
|
| Total | | 123 |
| 21,636 |
| | 243 |
| 8,582 |
| | 366 |
| 30,218 |
|
1 Nordstrom full-line stores include U.S. full line stores, Canada full-line stores and Nordstrom Local.
2 Other includes seven Trunk Club clubhouses, two Jeffrey boutiques and two Last Chance stores.
3 California and Texas had the highest square footage, with a combined 9,325 square feet, representing 31% of our total Company square footage.
Nordstrom, Inc. and subsidiaries13
| | | | | | | | | | | | | | | | | | | | | | | | | | | | | | | | | | | |
| Supply Chain Network | | Nordstrom | | Nordstrom Rack | | Total |
| Count | Square Footage | | Count | Square Footage | | Count | Square Footage | | Count | Square Footage |
| | | | | | | | | | | |
| Alabama | — | | — | | | — | | — | | | 1 | | 27 | | | 1 | | 27 | |
| Alaska | — | | — | | | — | | — | | | 1 | | 35 | | | 1 | | 35 | |
| Arizona | — | | — | | | 1 | | 235 | | | 10 | | 337 | | | 11 | | 572 | |
| California | 4 | | 2,571 | | | 26 | | 3,669 | | | 61 | | 2,158 | | | 91 | | 8,398 | |
| Colorado | — | | — | | | 2 | | 387 | | | 8 | | 268 | | | 10 | | 655 | |
| Connecticut | — | | — | | | 2 | | 341 | | | 1 | | 36 | | | 3 | | 377 | |
| Delaware | — | | — | | | 1 | | 127 | | | 1 | | 32 | | | 2 | | 159 | |
| Florida | 1 | | 221 | | | 6 | | 1,031 | | | 17 | | 560 | | | 24 | | 1,812 | |
| Georgia | — | | — | | | 2 | | 383 | | | 4 | | 154 | | | 6 | | 537 | |
| Hawaii | — | | — | | | 1 | | 195 | | | 2 | | 78 | | | 3 | | 273 | |
| Idaho | — | | — | | | — | | — | | | 1 | | 37 | | | 1 | | 37 | |
| Illinois | — | | — | | | 4 | | 947 | | | 16 | | 594 | | | 20 | | 1,541 | |
| Indiana | — | | — | | | 1 | | 134 | | | 2 | | 60 | | | 3 | | 194 | |
| Iowa | 2 | | 1,529 | | | — | | — | | | 1 | | 35 | | | 3 | | 1,564 | |
| Kansas | — | | — | | | 1 | | 219 | | | 3 | | 90 | | | 4 | | 309 | |
| Kentucky | — | | — | | | — | | — | | | 1 | | 33 | | | 1 | | 33 | |
| Louisiana | — | | — | | | — | | — | | | 3 | | 90 | | | 3 | | 90 | |
| Maine | — | | — | | | — | | — | | | 1 | | 30 | | | 1 | | 30 | |
| Maryland | 1 | | 451 | | | 3 | | 603 | | | 6 | | 219 | | | 10 | | 1,273 | |
| Massachusetts | — | | — | | | 4 | | 595 | | | 7 | | 266 | | | 11 | | 861 | |
| Michigan | — | | — | | | 2 | | 430 | | | 5 | | 178 | | | 7 | | 608 | |
| Minnesota | — | | — | | | 2 | | 380 | | | 4 | | 134 | | | 6 | | 514 | |
| Missouri | — | | — | | | 2 | | 342 | | | 2 | | 69 | | | 4 | | 411 | |
| Nevada | — | | — | | | 1 | | 207 | | | 4 | | 132 | | | 5 | | 339 | |
| New Jersey | — | | — | | | 4 | | 817 | | | 8 | | 284 | | | 12 | | 1,101 | |
| New Mexico | — | | — | | | — | | — | | | 1 | | 34 | | | 1 | | 34 | |
| New York | — | | — | | | 5 | | 838 | | | 10 | | 354 | | | 15 | | 1,192 | |
| North Carolina | — | | — | | | 2 | | 300 | | | 2 | | 74 | | | 4 | | 374 | |
| Ohio | — | | — | | | 3 | | 549 | | | 6 | | 224 | | | 9 | | 773 | |
| Oklahoma | — | | — | | | — | | — | | | 2 | | 67 | | | 2 | | 67 | |
| Oregon | 1 | | 374 | | | 2 | | 363 | | | 7 | | 243 | | | 10 | | 980 | |
| Pennsylvania | 1 | | 976 | | | 2 | | 381 | | | 7 | | 240 | | | 10 | | 1,597 | |
| Rhode Island | — | | — | | | — | | — | | | 1 | | 38 | | | 1 | | 38 | |
| South Carolina | — | | — | | | — | | — | | | 3 | | 101 | | | 3 | | 101 | |
| Tennessee | — | | — | | | 1 | | 145 | | | 3 | | 93 | | | 4 | | 238 | |
| Texas | — | | — | | | 8 | | 1,413 | | | 21 | | 702 | | | 29 | | 2,115 | |
| Utah | — | | — | | | 2 | | 277 | | | 4 | | 130 | | | 6 | | 407 | |
| Virginia | — | | — | | | 2 | | 452 | | | 7 | | 268 | | | 9 | | 720 | |
| Washington | — | | — | | | 6 | | 1,270 | | | 12 | | 442 | | | 18 | | 1,712 | |
| Washington D.C. | — | | — | | | — | | — | | | 2 | | 66 | | | 2 | | 66 | |
| Wisconsin | — | | — | | | 1 | | 150 | | | 2 | | 67 | | | 3 | | 217 | |
| Total | 10 | | 6,122 | | | 99 | | 17,180 | | | 260 | | 9,079 | | | 369 | | 32,381 | |
Our headquarters are located in Seattle, Washington, where our offices consist of both leased and owned space. On March 2, 2023, Nordstrom Canada commenced a wind-down of its business operations (see Note 2: Canada Wind-down in Item 8 for more information).
For use by our Retail segment,As of March 19, 2024, we have:
six owned merchandise distribution centers (Portland, Oregon; Dubuque, Iowa; Ontario, California; Newark, California; Upper Marlboro, Marylandhave announced 22 Nordstrom Rack store openings in 2024, four Nordstrom Rack store openings in 2025 and Gainesville, Florida),
two owned fulfillment centers (Cedar Rapids, Iowa and Elizabethtown, Pennsylvania),
one leased fulfillment center (San Bernardino, California)closure in 2024.
Nordstrom, Inc. and subsidiaries23
three leased administrative offices (Chicago, Illinois; Los Angeles, California and New York City, New York).
For use by our Credit segment, we have one leased office building (Centennial, Colorado).
Item 3. Legal Proceedings.
We are subject from time to time to various claims and lawsuits arising in the ordinary course of business, including lawsuits alleging violations of state and/or federal wage and hour and other employment laws, privacy and other consumer-based claims. Some of these lawsuits may include certified classes of litigants, or purport or may be determined to be class or collective actions and seek substantial damages or injunctive relief, or both, and some may remain unresolved for several years. We believe the recorded reservesaccruals in our Consolidated Financial Statements are adequate in light of the probable and estimable liabilities.
On March 2, 2023, Nordstrom Canada commenced a wind-down of its business operations pursuant to a CCAA proceeding overseen by the Ontario Superior Court of Justice. See Note 2: Canada Wind-down in Item 8 for more information.
As of the date of this report, we do not believe any other currently identified claim, proceeding or litigation, either alone or in the aggregate, will have a material impact on our results of operations, financial position or cash flows. Since these matters are subject to inherent uncertainties, our view of them may change in the future.
Item 4. Mine Safety Disclosures.
None.
PART II
Item 5. Market for Registrant’s Common Equity, Related Shareholder Matters and Issuer Purchases of Equity Securities.
(Dollar and share amounts in millions, except per share amounts and where otherwise noted)
MARKET SHAREHOLDER AND DIVIDENDSHAREHOLDER INFORMATION
Our common stock, without par value, is traded on the New York Stock ExchangeNYSE under the symbol “JWN.” The approximate number of record holders of common stock as of March 12, 201811, 2024 was 154,000, based upon the number of registered and beneficial shareholders and the number of employee shareholders in the Nordstrom 401(k) Plan.4,435. On this date, we had 167,790,511163,258,218 shares of common stock outstanding.
DIVIDENDS
The high and low prices offollowing table summarizes our common stock andhistorical dividends declared for each quarterand paid per share:
| | | | | | | | |
| Fiscal year | 2023 | 2022 |
| 1st Quarter | $0.19 | | $0.19 | |
| 2nd Quarter | 0.19 | | 0.19 | |
| 3rd Quarter | 0.19 | | 0.19 | |
| 4th Quarter | 0.19 | | 0.19 | |
| Full Year | $0.76 | | $0.76 | |
Any future determination to pay cash dividends and the amount of
2017dividends will be at the discretion of the Board of Directors and 2016 are presentedwill be dependent upon our financial condition, operating results, capital requirements, contractual commitments and such other factors as the Board of Directors deems relevant (see Note 11: Shareholders’ Equity in the table below: |
| | | | | | | | | | | | |
| | | Common Stock Price | | | | |
| | | 2017 | | 2016 | | Dividends per Share |
| | | High | | Low | | High | | Low | | 2017 | | 2016 |
| 1st Quarter | | $48.45 | | $40.70 | | $59.37 | | $46.65 | | $0.37 | | $0.37 |
| 2nd Quarter | | $50.32 | | $39.53 | | $51.74 | | $35.01 | | $0.37 | | $0.37 |
| 3rd Quarter | | $49.00 | | $39.63 | | $55.23 | | $39.05 | | $0.37 | | $0.37 |
| 4th Quarter | | $53.00 | | $37.79 | | $62.82 | | $42.32 | | $0.37 | | $0.37 |
| Full Year | | $53.00 | | $37.79 | | $62.82 | | $35.01 | | $1.48 | | $1.48 |
SHARE REPURCHASES
(Dollar amounts in millions)
In February 2017, our BoardWe repurchased no shares of Directors authorized a program to repurchase up to $500 of our outstanding common stock through August 31, 2018.
Induring the fourth quarter of 2017, we made no share repurchases2023 and we had $414 of$438 remaining in share repurchase capacity as of February 3, 2018. We do not plan to2024.
See Note 11: Shareholders’ Equity in Item 8 for more information about our August 2018 and May 2022 share repurchase shares while the Group explores the possibility of making a going private proposal.programs. The actual timing, price, manner and amounts of future share repurchases, if any, will be subject to the discretion of the Board of Directors, contractual commitments, market and economic conditions and applicable SEC rules.
Nordstrom, Inc. and subsidiaries1525
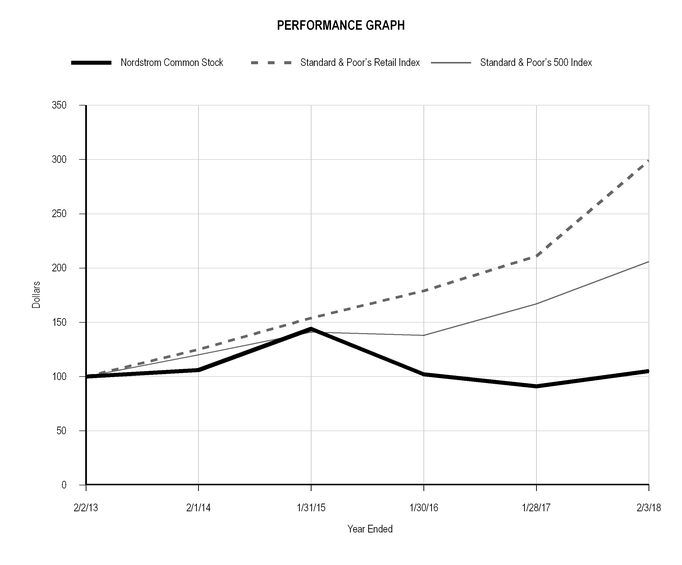
STOCK PRICE PERFORMANCE
The following graph compares the cumulative total return of Nordstrom common stock, Standard & Poor’s Retail Index (“S&P Retail”) and, Standard & Poor’s 500 Index (“S&P 500”) and Nordstrom’s peer group for each of the last five fiscal years ending ended February 3, 2018. The2024. S&P Retail Index is composed of 2917 retail companies including Nordstrom, representing an industry group of the S&P 500. Our peer group is consistent with the retail peer group that we include in the Compensation Discussion and Analysis section of our Proxy Statement for our 2024 Annual Meeting of Shareholders and is weighted by the market capitalization of each component. The following graph assumes an initial investment of $100 each in Nordstrom common stock, the S&P Retail, and the S&P 500 and Nordstrom’s peer group on February 2, 20132019 and assumes reinvestment of dividends.

| | | | | | | | | | | | | | | | | | | | | | | | | | | | | | | | | | | |
End of fiscal year1 | 2018 | | 2019 | | 2020 | | 2021 | | 2022 | | 2023 |
| Nordstrom common stock | $100 | | $85 | | $83 | | $51 | | $45 | | $46 |
| S&P Retail | $100 | | $121 | | $171 | | $181 | | $150 | | $210 |
| S&P 500 | $100 | | $122 | | $142 | | $172 | | $161 | | $199 |
| Nordstrom’s peer group | $100 | | $105 | | $118 | | $127 | | $136 | | $151 |
1 Dollar amounts are in ones.
|
| | | | | | | | | | | | | | | | | |
| End of fiscal year | 2012 |
| | 2013 |
| | 2014 |
| | 2015 |
| | 2016 |
| | 2017 |
|
| Nordstrom common stock | 100 |
| | 106 |
| | 144 |
| | 102 |
| | 91 |
| | 105 |
|
| Standard & Poor’s Retail Index | 100 |
| | 125 |
| | 154 |
| | 179 |
| | 211 |
| | 299 |
|
| Standard & Poor’s 500 Index | 100 |
| | 120 |
| | 141 |
| | 138 |
| | 167 |
| | 206 |
|
Item 6. Selected Financial Data.[Reserved]
Dollars in millions except per square foot and per share amounts
The following selected financial data are derived from the audited Consolidated Financial Statements and should be read in conjunction with Item 1A: Risk Factors, Item 7: Management’s Discussion and Analysis of Financial Condition and Results of Operations and Item 8: Financial Statements and Supplementary Data of this Annual Report on Form 10-K. |
| | | | | | | | | | | | | | | | | | | |
| Fiscal year | 2017 |
| | 2016 |
| | 2015 |
| | 2014 |
| | 2013 |
|
| Earnings Results | | | | | | | | | |
| Net sales |
| $15,137 |
|
|
| $14,498 |
|
|
| $14,095 |
| |
| $13,110 |
| |
| $12,166 |
|
Credit card revenues, net1 | 341 |
|
| 259 |
|
| 342 |
| | 396 |
| | 374 |
|
| Gross profit | 5,247 |
|
| 5,058 |
|
| 4,927 |
| | 4,704 |
| | 4,429 |
|
| Selling, general and administrative (“SG&A”) expenses | (4,662 | ) | | (4,315 | ) | | (4,168 | ) | | (3,777 | ) | | (3,453 | ) |
| Earnings before interest and income taxes (“EBIT”) | 926 |
|
| 805 |
|
| 1,101 |
| | 1,323 |
| | 1,350 |
|
| Net earnings | 437 |
|
| 354 |
|
| 600 |
| | 720 |
| | 734 |
|
| | | | | | | | | | |
| Balance Sheet and Cash Flow Data | | | | | | | | | |
| Cash and cash equivalents |
| $1,181 |
| |
| $1,007 |
| |
| $595 |
| |
| $827 |
| |
| $1,194 |
|
| Merchandise inventories | 2,027 |
|
| 1,896 |
| | 1,945 |
| | 1,733 |
| | 1,531 |
|
| Land, property and equipment, net | 3,939 |
|
| 3,897 |
| | 3,735 |
| | 3,340 |
| | 2,949 |
|
Total assets1 | 8,115 |
|
| 7,858 |
| | 7,698 |
| | 9,245 |
| | 8,574 |
|
Total long-term debt1 | 2,737 |
|
| 2,774 |
| | 2,805 |
| | 3,131 |
| | 3,113 |
|
Cash flow from operations1 | 1,400 |
|
| 1,658 |
| | 2,470 |
| | 1,243 |
| | 1,345 |
|
| Capital expenditures | 731 |
| | 846 |
| | 1,082 |
| | 861 |
| | 803 |
|
| | | | | | | | | | |
| Performance Metrics | | | | | | | | | |
| Net sales increase | 4.4 | % | | 2.9 | % | | 7.5 | % | | 7.8 | % | | 3.4 | % |
Comparable sales increase (decrease)2 | 0.8 | % | | (0.4 | %) | | 2.7 | % | | 4.0 | % | | 2.5 | % |
| Gross profit % of net sales | 34.7 | % | | 34.9 | % | | 35.0 | % | | 35.9 | % | | 36.4 | % |
| SG&A % of net sales | 30.8 | % | | 29.8 | % | | 29.6 | % | | 28.8 | % | | 28.4 | % |
| EBIT % of net sales | 6.1 | % | | 5.6 | % | | 7.8 | % | | 10.1 | % | | 11.1 | % |
| Capital expenditures % of net sales | 4.8 | % | | 5.8 | % | | 7.7 | % | | 6.6 | % | | 6.6 | % |
| Return on assets | 5.4 | % |
| 4.5 | % |
| 6.6 | % |
| 8.1 | % |
| 8.7 | % |
Return on invested capital (“ROIC”)3 | 9.7 | % |
| 8.4 | % |
| 10.7 | % |
| 12.6 | % |
| 13.6 | % |
| Sales per square foot |
| $506 |
| |
| $498 |
| |
| $507 |
| |
| $493 |
| |
| $474 |
|
| 4-wall sales per square foot |
| $384 |
|
|
| $392 |
|
|
| $410 |
| |
| $413 |
| |
| $408 |
|
| Inventory turnover rate | 4.67 |
| | 4.53 |
| | 4.54 |
| | 4.67 |
| | 5.07 |
|
| | | | | | | | | | |
| Per Share Information | | | | | | | | | |
Earnings per diluted share4 |
| $2.59 |
|
|
| $2.02 |
|
|
| $3.15 |
| |
| $3.72 |
| |
| $3.71 |
|
Dividends declared per share1 | 1.48 |
| | 1.48 |
| | 6.33 |
| | 1.32 |
| | 1.20 |
|
| | | | | | | | | | |
| Store Information (at year-end) | | | | | | | | | |
Nordstrom full-line stores5 | 123 |
| | 123 |
| | 121 |
| | 117 |
| | 117 |
|
Nordstrom Rack and other6 | 243 |
| | 226 |
| | 202 |
| | 175 |
| | 143 |
|
| Total square footage | 30,218,000 |
| | 29,792,000 |
| | 28,610,000 |
| | 27,061,000 |
| | 26,017,000 |
|
1 Amounts were impacted by the October 1, 2015, credit card receivable transaction. As a result of the transaction, the dividends paid in the fiscal year 2015 included a special cash dividend of $4.85 per share. For further information regarding these impacts, see Note 2: Credit Card Receivable Transaction and Note 11: Shareholders’ Equity in Item 8.
2 The 53rd week is not included in comparable sales calculations (see Item 7: Management’s Discussion and Analysis of Financial Condition and Results of Operations for more information about the 53rd week).
3 See ROIC (non-GAAP financial measure) in Item 7: Management’s Discussion and Analysis of Financial Condition and Results of Operations for additional information and reconciliation to the most directly comparable GAAP financial measure.
4 Earnings per diluted share included the impact of the Trunk Club goodwill impairment charge of $1.12 per share in fiscal year 2016.
5 Nordstrom full-line stores include U.S. full line stores, Canada full-line stores and Nordstrom Local.
6 Other includes Trunk Club clubhouses, Jeffrey boutiques and Last Chance stores.
Nordstrom, Inc. and subsidiaries17
Item 7. Management’s Discussion and Analysis of Financial Condition and Results of Operations.
(Dollar share and square footageshare amounts in millions, except percentages, per share amounts and per square foot amountswhere otherwise noted)
OVERVIEW
Nordstrom isThe following MD&A provides a leading fashion retailer offering apparel, shoes, cosmetics and accessories for women, men, young adults and children. We offer an extensive selection of high-quality brand-name and private label merchandise in the U.S. and Canada. We serve customers through two brands — Nordstrom full-price and Nordstrom Rack off-price. With customers increasingly engaging with Nordstrom in multiple ways, we’re focused on providing a seamless experience across stores and online. Our operations currently consistnarrative of our Nordstrom U.S.financial performance and Canada full-line stores, Nordstrom.com, Nordstrom Rack stores, Nordstromrack.com/HauteLook, Trunk Club, Jeffrey boutiques, Last Chance clearance stores and Nordstrom Local. Our customers can participate in our Nordstrom Rewards loyalty program which allows themis intended to earn merchandise, services and other experiences. We also offer our customers a variety of payment products and services, including our Nordstrom co-branded credit cards. As we aspire to be the best fashion retailer, our customer strategy is centered on three strategic pillars: providing a differentiated product offering, delivering exceptional services and experiences, and leveraging the strength of our brand.
In 2017, net earnings were $437, or $2.59 per diluted share, which included impacts associated with the Tax Cuts and Jobs Act (the “Tax Act”), consisting of a $0.25 per share reduction related to our income tax provision and a $0.06 per share decrease for a one-time investment in our employees. We reached record sales of $15 billion in 2017. Our net sales increased 4.4%, inclusive of approximately $220 or 150 basis points from the impact of the 53rd week, while comparable sales increased 0.8% and are not inclusive of the 53rd week.
We achieved the following milestones in executing our growth plans:
Nordstrom experienced continued positive customer trends, reflecting customer growth of 4% to 33 million customers. Additionally, 9 million customers are shopping with us in multiple ways, a 6% increase over the previous year.
Generational investments, which include Nordstromrack.com/HauteLook, Canada and Trunk Club, contributed $1.5 billion in sales.
In the Nordstrom full-price business, strategic brands, including product with limited distribution and Nordstrom proprietary labels, continued to deliver outsized sales growth.
The Nordstrom Rack off-price business gained 6 million new customers with approximately one-third of off-price customers expected to cross-shop the full-price business over time.
Nordstrom Rewards loyalty program customers increased by 35% to 10.5 million. Sales from Nordstrom Rewards customers represented 51% of sales, an increase from 44% in 2016.
Looking ahead to 2018, we are executing on our three strategic pillars through a series of initiatives. On April 12, our Nordstrom Men’s Store NYC is slated to open, with our Nordstrom NYC store opening in Fall 2019. We expect this store to be the biggest and best statement of the Nordstrom brand, serving as a gateway to new customers both domestically and internationally.
We are also focusing on further integrating our digital and physical assets in our top markets in order to deliver best-in-class services and experiences to customers in those areas. We will bring our capabilities across supply chain, technology, marketing, product and services to create a digitally-connected and differentiated experience for customers to shop on their terms, starting in Los Angeles, our largest market. We believe that we will gain learnings from our experiences in the Los Angeles market that we can apply to other markets in the future.
Another key initiative for 2018 is the introduction of six Nordstrom Rack stores in Canada, where we completed our full-line store expansion plans last September. Similar to our experience in the U.S., we expect strong synergies between our full-price and off-price businesses.
Finally, we will continue to curate our assortment to provide newness and the opportunity for discovery for our customers. In our full-price business, our focus is on strategic brand growth through new launches and our existing partners. In our off-price business, leveraging our vendor partnerships enables us to offer the best brands at the best prices.
Our strategic brand partnerships and combined digital and physical assets make us uniquely positioned in the marketplace. We believe our diversified and resilient business model will continue to serve us well while creating value for our shareholders, customers and employees.
RESULTS OF OPERATIONS
Our reportable segments in 2017 are Retail and Credit. We analyze our results of operations through earnings before interest and income taxes for our Retail Business and Credit, while interest expense, income taxes and earnings per share are discussed on a total Company basis.
Similar to many other retailers, Nordstrom follows the retail 4-5-4 reporting calendar, which included an extra week in the fourth quarter of 2017 (the “53rd week”). References to 2017 relate to the 53-week fiscal year ended February 3, 2018. References to 2016 and 2015 are based on a 52-week fiscal year. However, the 53rd week is not included in the comparable sales calculations.
RETAIL BUSINESS
Our Retail Business includes our Nordstrom U.S. and Canada full-line stores, Nordstrom.com, Nordstrom Rack stores, Nordstromrack.com/HauteLook, Trunk Club, Jeffrey boutiques, Last Chance clearance stores and Nordstrom Local. For purposes of discussion and analysispromote understanding of our results of operations
of our Retail Business, we combine our Retail segment resultsand financial condition. MD&A is provided as a supplement to, and should be read in conjunction with,
revenuesItem 8: Financial Statements and expenses in the “Corporate/Other” column of Note 15: Segment Reporting in Item 8 (collectively, the “Retail Business”). Amounts in the “Corporate/Other” column include unallocated corporate expensesSupplementary Data and assets (including unallocated assets in corporate headquarters, consisting primarily of cash, land, buildings and equipment and deferred tax assets), sales return reserves, inter-segment eliminations and other adjustments to segment results necessary for the presentation of consolidated financial results in accordance with generally accepted accounting principles.Certain metrics we use to evaluate the Retail Business may not be calculated in a consistent manner among industry peers. Provided below are definitions of metrics we present within our analysis of the Retail Business:
Comparable Sales – sales from stores that have been open at least one full year at the beginning of the year
Total Company comparable sales include sales from our online channels
Gross Profit – net sales less cost of sales and related buying and occupancy costs
Inventory Turnover Rate – trailing 12-months cost of sales and related buying and occupancy costs (for all segments) divided by the trailing 4-quarter average inventory
Total Sales Per Square Foot – net sales divided by weighted-average square footage
4-wall Sales Per Square Foot – sales for Nordstrom U.S. and Canada full-line stores, Nordstrom Rack stores, Trunk Club clubhouses, Jeffrey boutiques, Last Chance clearance stores and Nordstrom Local divided by their weighted-average square footage
Summary
The following table summarizesdiscusses the results of operations for fiscal year 2023 compared with 2022.For our Retail Business:comparison and discussion of 2022 and 2021, see Item 7: Management’s Discussion and Analysis of Financial Condition and Results of Operations in Part II of our 2022 Annual Report. For our discussion of market risk information for 2022, see Item 7A: Quantitative and Qualitative Disclosures About Market Risk in Part II of our 2022 Annual Report. The following discussion and analysis contains forward-looking statements and should also be read in conjunction with Item 1A: Risk Factors in Part I, as well as other cautionary statements and risks described elsewhere in this 2023 Annual Report, before deciding to purchase, hold or sell shares of our common stock. |
| | | | | | | | | | | | | | | | | | | | | |
| Fiscal year | | 2017 | | 2016 | | 2015 |
| | | Amount |
| | % of net sales1 |
| | Amount |
| | % of net sales1 |
| | Amount |
| | % of net sales1 |
|
| Net sales | |
| $15,137 |
| | 100.0 | % | |
| $14,498 |
| | 100.0 | % | |
| $14,095 |
| | 100.0 | % |
| Cost of sales and related buying and occupancy costs | | (9,877 | ) | | (65.3 | %) | | (9,434 | ) | | (65.1 | %) | | (9,161 | ) | | (65.0 | %) |
| Gross profit | | 5,260 |
| | 34.7 | % | | 5,064 |
| | 34.9 | % | | 4,934 |
| | 35.0 | % |
| Selling, general and administrative expenses | | (4,508 | ) | | (29.8 | %) | | (4,159 | ) | | (28.7 | %) | | (4,016 | ) | | (28.5 | %) |
| Goodwill impairment | | — |
| | — |
| | (197 | ) | | (1.4 | %) | | — |
| | — |
|
| Earnings before interest and income taxes | |
| $752 |
| | 5.0 | % | |
| $708 |
| | 4.9 | % | |
| $918 |
| | 6.5 | % |
1 Subtotals and totals may not foot due to rounding.
| | | | | |
| Overview | |
| Results of Operations | |
| Liquidity | |
| Capital Resources | |
| Critical Accounting Estimates | |
| Recent Accounting Pronouncements | |
Nordstrom, Inc. and subsidiaries1927
OVERVIEW
Retail Business Net SalesIn 2023, we reported net earnings of $134, or 0.9% of net sales, $0.82 per diluted share and EBIT of $251, or 1.8% of net sales. Adjusted EBIT1 was $567, or 4.0% of net sales, and Adjusted EPS1 was $2.12, which exclude the impacts of charges related to the wind-down of Canadian operations and a supply chain asset impairment and related charge.
Total company net sales decreased 5.8%, compared with 2022. This included a negative 245 basis point impact from the wind-down of Canadian operations and a positive impact of approximately $190, or 130 basis points, from the 53rd week. We saw sequential improvement in topline trends across both banners throughout the year.
We continued to manage with leaner inventories and exited 2023 with overall ending inventory levels 3% lower than the fourth quarter of 2022 and a positive sales-to-inventory spread. This lower level of inventory required fewer markdowns and helped drive 95 basis points of expansion in our gross profit as a rate of sales, compared with 2022.
We remain committed to delivering profitable growth while improving the customer experience. Our results reflect our focus throughout 2023 on our three priorities: improve Nordstrom Rack performance, increase inventory productivity and optimize our supply chain. We will continue to build on the progress we made in 2023 as we focus our efforts on three refreshed key priorities in 2024: driving Nordstrom banner growth, optimizing operationally and building on momentum at the Rack.
Driving Nordstrom banner growth – Our first priority is to drive growth at our Nordstrom banner, with a focus on digital-led growth supported by our stores. In 2024, we plan to launch our digital marketplace on Nordstrom.com, which will allow us to grow our curated online assortment to serve more customers on even more occasions through increasing our use of unowned inventory. Marketplace will allow our customers to shop more products and sizes from their favorite brands, while providing them more access to new and emerging brands. Expanding our assortment through unowned inventory has the potential to drive GMV growth in addition to providing compelling economics.
We will also focus on driving growth at our Nordstrom banner through increasing customer engagement and improving retention. We will do this through amplifying the brands that matter most to our customers and ensuring we have consistent depth in these brands across our stores and online, with our Beauty division playing a prominent role.
Optimizing operationally – We made significant progress on our supply chain initiatives in 2023, which drove improvements in customer experience and profitability. We delivered a better experience to our customers through faster delivery, lower cancellation rates and increased accuracy of inventory, while also driving cost savings. In the fourth quarter of 2023, our team delivered the sixth consecutive quarter of 50-plus basis points of improvement in variable supply chain expense savings, while at the same time improving our click-to-delivery speed.
We plan to build upon these successes in 2024, with the end goal of enhancing the customer experience through faster delivery, and improving our cost position by maximizing our inventory value throughout its lifecycle. We are making investments in systems and technology enablers to standardize and streamline our inventory processes, expanding the scale of our RFID utilization and improving the inventory movement within our business.
Building on momentum at Nordstrom Rack – In 2023, we opened 19 new stores and our intent is to open 22 new stores in 2024. We believe new Rack stores are a great investment, with returns that exceed our cost of capital and have a short payback period. Expanding our network of stores also brings our omni-channel services closer to the customer, giving them more reasons and opportunities to engage with us.
Our priority for 2024 is to continue building on our momentum from 2023 and deliver topline Rack growth, led by stores and supported by enhanced digital capabilities. We aim to deliver great brands at great prices for our customers at Nordstrom Rack, and we continue to improve by growing the most desirable brands offered, driving greater engagement and profitability at NordstromRack.com and expanding our reach and convenience with new Rack stores in key markets.
We are proud of the efforts that we undertook in 2023, as well as the outcomes that enhanced the customer experience and drove improved financial results. We are committed to delivering profitable growth while improving the customer experience, and we expect 2024 to be a year of continued momentum toward the long-term strength and durability of our business.
1 Adjusted EBIT and Adjusted EPS are non-GAAP financial measures. For a reconciliation between GAAP and non-GAAP financial measures, see Adjusted EBIT, Adjusted EBITDA, Adjusted EBIT margin and Adjusted EPS (Non-GAAP financial measures) below.
RESULTS OF OPERATIONS
In our ongoing effort to enhance the customer experience, we are focused on providing customers with a seamless retail experience across our channels. WhileCompany. We invested early in integrating our operations, merchandising and technology across our stores and online in both our Nordstrom and Nordstrom Rack banners. By connecting our digital and physical assets across Nordstrom and Nordstrom Rack, we are able to better serve customers may engage with us through multiple channels,when, where and how they want to shop. We have one Retail reportable segment and analyze our results on a total Company basis, using customer, market share, operational and net sales metrics.
We operate on a 52/53-week fiscal year ending on the Saturday closest to January 31st. References to 2023 relate to the 53-week fiscal year ending February 3, 2024. References to any other years included within this document are based on a 52-week fiscal year.
We monitor a number of key operating metrics to evaluate our performance. In addition to net sales, net earnings and other results under GAAP, two other key operating metrics we know they valueuse are GMV and inventory turnover rate. Beginning in the overall Nordstrom brand experience and view us simply as Nordstrom, which is ultimatelyfirst quarter of 2023, we made changes to how we viewcalculate these metrics to more closely align with how our business. The followingbusiness is operated. Changes in the methodologies are discussed below and prior periods have been adjusted to reflect a summarycomparable presentation.
•GMV: calculated as the total dollar value of merchandise sold through our digital platforms and stores. GMV includes net merchandise sales from inventory we own, as well as the retail value of merchandise sold under our unowned inventory models with our vendors. We use GMV as an indicator of the scale and growth of our netoperations and the impact of our unowned inventory models. Prior to the first quarter of 2023, we also included non-merchandise sales in our GMV calculation.
•Inventory Turnover Rate: calculated as the trailing 4-quarter merchandise cost of sales divided by channel forthe trailing 13-month average inventory. Inventory turnover rate is an indicator of our Retail Business:
|
| | | | | | | | | | | |
| Fiscal year | 2017 |
| | 2016 |
| | 2015 |
|
| Net sales by channel: | | | | | |
Nordstrom full-line stores - U.S.1 |
| $6,951 |
| |
| $7,186 |
|
|
| $7,633 |
|
| Nordstrom.com | 2,887 |
| | 2,519 |
|
| 2,300 |
|
| Full-price | 9,838 |
| | 9,705 |
| | 9,933 |
|
| | | | | | |
| Nordstrom Rack | 4,059 |
| | 3,809 |
| | 3,533 |
|
| Nordstromrack.com/HauteLook | 897 |
|
| 700 |
|
| 532 |
|
| Off-price | 4,956 |
| | 4,509 |
| | 4,065 |
|
| | | | | | |
Other retail2 | 614 |
| | 554 |
| | 378 |
|
| Retail segment | 15,408 |
| | 14,768 |
| | 14,376 |
|
| Corporate/Other | (271 | ) | | (270 | ) | | (281 | ) |
| Total net sales |
| $15,137 |
| |
| $14,498 |
| |
| $14,095 |
|
| | | | | | |
| Net sales increase | 4.4 | % | | 2.9 | % | | 7.5 | % |
| | | | | | |
Comparable sales increase (decrease) by channel3: | | | | | |
| Nordstrom full-line stores - U.S. | (4.2 | %) | | (6.4 | %) | | (1.1 | %) |
| Nordstrom.com | 13.1 | % | | 9.5 | % | | 15.2 | % |
| Full-price | 0.4 | % | | (2.7 | %) | | 2.3 | % |
| Nordstrom Rack | (1.9 | %) | | 0.2 | % | | (1.0 | %) |
| Nordstromrack.com/HauteLook | 25.5 | % | | 31.7 | % | | 47.4 | % |
| Off-price | 2.5 | % | | 4.5 | % | | 4.3 | % |
| Total Company | 0.8 | % | | (0.4 | %) | | 2.7 | % |
| | | | | | |
| Sales per square foot: | | | | | |
| Total sales per square foot |
| $506 |
| |
| $498 |
| |
| $507 |
|
| 4-wall sales per square foot | 384 |
| | 392 |
| | 410 |
|
| Full-line sales per square foot - U.S. | 337 |
| | 346 |
| | 370 |
|
| Nordstrom Rack sales per square foot | 497 |
| | 507 |
| | 523 |
|
1 Nordstrom full-line stores - U.S. includes Nordstrom Local.
2 Other retail includes Nordstrom Canada full-line stores, Trunk Clubsuccess in optimizing inventory volumes in accordance with customer demand. Prior to the first quarter of 2023, we calculated inventory turnover rate as the trailing 4-quarter cost of sales and Jeffrey boutiques.
3 The 53rd week is not included in comparable sales calculations.related buying and occupancy costs divided by the trailing 4-quarter average inventory.
Net Sales (2017 vs. 2016)
In 2017, totalThe following table summarizes net sales: | | | | | | | | |
| Fiscal year | 2023 | | 2022 | |
| Net sales: | | |
| Nordstrom | $9,436 | | $10,279 | |
| Nordstrom Rack | 4,783 | | 4,813 | |
| Total net sales | $14,219 | | $15,092 | |
| | |
| Net sales (decrease) increase: | | |
| Nordstrom | (8.2 | %) | 6.6 | % |
| Nordstrom Rack | (0.6 | %) | 1.1 | % |
| Total Company | (5.8 | %) | 4.8 | % |
| | |
| Digital sales: | | |
| Digital sales as a % of total net sales | 36 | % | 38 | % |
| Digital sales decrease | (10 | %) | (6 | %) |
| | |
| GMV (decrease) increase: | | |
| Nordstrom | (8.5 | %) | 6.5 | % |
| Total Company | (6.1 | %) | 4.6 | % |
Total Company net sales increased 4.4%, while comparableand GMV decreased for the full fiscal year compared with 2022. The wind-down of our Canadian operations as of March 2, 2023 had a negative impact on net sales increased 0.8%of 245 basis points compared with 2022 (see Note 2: Canada Wind-down in Item 8). During the year, we opened two Nordstrom full-line stores, including one in Canada,This was partially offset by an approximately 130 basis point positive impact and 17 Nordstrom Rack stores. The 53rd week contributed approximately $220$190 in additional net sales.
Full-price net sales which consists ofrelated to the U.S. full-line53rd week. For the full fiscal year, active and Nordstrom.com channels, increased 1.4%beauty were the strongest categories compared with 2016, while comparable sales increased 0.4%. Also on a comparable basis, full-price sales reflected an increase in the average selling price per item sold, partially offset by a decrease in the number of items sold. Kids was the top-performing merchandise category.
Off-price net sales, which consists of Nordstrom Rack and Nordstromrack.com/HauteLook channels, increased 9.9%, compared with 2016 and comparable sales increased 2.5%. Nordstromrack.com/HauteLook had a comparable sales increase of 25.5% and now represents over 18% of off-price sales. Nordstrom Rack net sales increased 6.6%, primarily attributable to 17 new store openings in 2017, while comparable sales decreased 1.9%. On a comparable basis, the average selling price per item sold and the total number of items sold decreased at Nordstrom Rack. The top-performing Nordstrom Rack merchandise category was Beauty.
2022.
20Nordstrom, Inc. and subsidiaries29
Net Sales (2016 vs. 2015)
In 2016, total CompanyNordstrom net sales increased 2.9%, while comparable salesand GMV decreased 0.4%. During the year, we opened three Nordstrom full-line stores, including two in Canada, and 21 Nordstrom Rack stores.
Full-price net sales decreased 2.3% compared with 2015, while comparable sales decreased 2.7%. Also on a comparable basis, full-price sales2022, which reflected a decrease in the total number of items sold, partially offset by an increase in the average selling price per item sold. The top-performing merchandise category was Beauty.
Off-pricewind-down of Canadian operations had a negative impact on Nordstrom banner net sales increased 10.9%,of 360 basis points, partially offset by a 120 basis point positive impact from the 53rd week, compared with 2015 and comparable sales increased 4.5%. Nordstromrack.com/HauteLook had comparable sales increase of 31.7% and represented 15% of off-price sales. 2022.
Nordstrom Rack net sales increased 7.8%, primarily attributable to 21 new store openingsdecreased compared with 2022, which reflected a decrease in 2016. On a comparable basis, the total number of items sold, increased at Nordstrom Rack, partially offset by a decreasean increase in the average selling price per item sold. Kids was the top-performingEliminating store fulfillment for Nordstrom Rack merchandise category.digital orders during the third quarter of 2022 negatively impacted Nordstrom Rack sales by approximately 300 basis points for the full fiscal year compared with 2022. This was partially offset by an approximately 150 basis point positive impact related to the 53rd week.
Retail Business Digital sales decreased compared with 2022. Eliminating store fulfillment for Nordstrom Rack digital orders during the third quarter of 2022 and sunsetting Trunk Club in the second quarter of 2022 negatively impacted digital sales by approximately 350 basis points for the full fiscal year compared with 2022.
During the year, we opened 19 Nordstrom Rack stores and relocated one Nordstrom Rack store. We closed one Nordstrom store, one Nordstrom Local service hub, one ASOS | Nordstrom store and two Nordstrom Rack stores. In addition, we deconsolidated six Nordstrom and seven Nordstrom Rack stores in Canada as of March 2, 2023 (see Note 2: Canada Wind-down in Item 8).
See Note 3: Revenue in Item 8 for information about disaggregated revenues.
Credit Card Revenues, Net
Credit card revenues, net increased $36 compared with 2022, due to increased finance charges from higher rates and outstanding balances, and revenue recognized in connection with our 2022 TD program agreement amendment. The increase was partially offset by increased credit losses.
2024 Total Revenue Outlook
In fiscal 2024, we expect a total revenue range, including retail sales and credit card revenues, of 2% decline to 1% growth compared with the 53-week fiscal 2023, which includes an approximately 135 basis point unfavorable impact from the 53rd week.
Gross Profit
The following table summarizes the Retail Business gross profit (“Retail GP”): |
| | | | | | | | | | | |
| Fiscal year | 2017 |
| | 2016 |
| | 2015 |
|
| Retail gross profit |
| $5,260 |
| |
| $5,064 |
|
|
| $4,934 |
|
| Retail gross profit as a % of net sales | 34.7 | % | | 34.9 | % |
| 35.0 | % |
| Inventory turnover rate | 4.67 |
| | 4.53 |
| | 4.54 |
|
| | | | | | | | | |
| Fiscal year | 2023 | | 2022 | | |
| Gross profit | $4,916 | | $5,073 | | |
| Gross profit as a % of net sales | 34.6 | % | 33.6 | % | |
| Inventory turnover rate | 3.58 | | 3.45 | | |
Gross Profit (2017 vs. 2016)
RetailGPprofit decreased 18 basis points in 2017 when$157, compared with 2016,2022, primarily due to higher plannedlower sales, partially offset by lower markdowns and lower buying and occupancy expenses relatedcosts. Gross profit increased 95 basis points as a rate of net sales, compared with 2022, due to new store growth for Nordstrom Racklower markdowns and Canada.Continued focuslower buying and occupancy costs, partially offset by deleverage on lower sales.
Ending inventory execution led to improvementsas of February 3, 2024 decreased 3%, compared with January 28, 2023, versus a 2% increase in sales in the fourth quarter of 2023, compared with 2022. The decrease in inventory turnover rate in 2017.
Gross Profit (2016 vs. 2015)
Our Retail GP rate was relatively flatlevels compared with 2015, reflecting higher occupancy costs associated with Nordstrom Rack and Canada store growth, in addition to increased markdowns in the first half2022 is a result of the year to realign inventory to sales trends. This was offset bycontinued strong inventory execution during the remainderdiscipline.
Selling, General and Administrative Expenses
Retail Business selling, general and administrative expenses (“Retail SG&A”) are summarized in the following table: |
| | | | | | | | | | | |
| Fiscal year | 2017 |
| | 2016 |
| | 2015 |
|
| Retail selling, general and administrative expenses |
| $4,508 |
| |
| $4,159 |
| |
| $4,016 |
|
| Retail selling, general and administrative expenses as a % of net sales | 29.8 | % | | 28.7 | % | | 28.5 | % |
Selling, General and Administrative Expenses (2017 vs. 2016)
Our Retail SG&A rate increased 99 basis points in 2017 and increased $349 compared with 2016 primarily due to planned technology and performance related expenses.
Selling, General and Administrative Expenses (2016 vs. 2015)
Our Retail SG&A rate increased 19 basis points in 2016 and increased $143 compared with 2015 primarily due to technology and fulfillment expenses.
Retail Business Goodwill Impairment
We recognized a goodwill impairment charge of $197 in 2016 related to Trunk Club (see Note 8: Fair Value Measurements in Item 8).
Nordstrom, Inc. and subsidiaries21
CREDIT SEGMENT
The Nordstrom credit and debit card products are designed to strengthen customer relationships and grow retail sales by providing loyalty benefits, valuable services and payment products. We believe our credit business allows us to build deeper relationships with our customers by fully integrating the Nordstrom Rewards loyalty program with our retail business and providing better service, which in turn fosters greater customer loyalty. Nordstrom cardholders tend to visit our stores more frequently and spend more than non-cardholders. Nordstrom private label credit and debit cards can be used at a majority of our U.S. retail businesses, while Nordstrom Visa credit cards also may be used for purchases outside of Nordstrom (“outside volume”). In 2017, we began offering a Canadian Nordstrom-branded Visa card, which can be used for purchases inside and outside of Nordstrom.
In October 2015, we completed the sale of a substantial majority of our U.S. Visa and private label credit card portfolio to TD. In November 2017, we sold the remaining balances which consisted of employee credit card receivables for the U.S. Visa and Nordstrom private label credit cards to TD (see Note 2: Credit Card Receivable Transaction in Item 8).
Summary
The table below provides a detailed view of the operational results of our Credit segment, consistent with Note 15: Segment Reporting in Item 8: |
| | | | | | | | | | | | |
| Fiscal year | | 2017 |
| | 2016 |
| | 2015 |
|
| Credit card revenues, net | |
| $341 |
| |
| $259 |
| |
| $342 |
|
| Credit expenses | | (167 | ) | | (162 | ) | | (159 | ) |
| Earnings before interest and income taxes | |
| $174 |
| |
| $97 |
| |
| $183 |
|
| | | | | | | |
Credit and debit card volume1: | | | | | | |
| Inside | |
| $5,987 |
| |
| $5,858 |
| |
| $5,953 |
|
| Outside | | 4,434 |
| | 4,160 |
| | 4,309 |
|
| Total volume | |
| $10,421 |
| |
| $10,018 |
| |
| $10,262 |
|
1 Credit and debit card volume represents sales on the total portfolio plus applicable sales taxes.
Credit Card Revenues, net
The following is a summary of our credit card revenues, net: |
| | | | | | | | | | | |
| Fiscal year | 2017 |
| | 2016 |
| | 20151 |
|
| Credit program revenues, net |
| $331 |
| |
| $246 |
| |
| $64 |
|
| Other | 10 |
| | 13 |
| | 278 |
|
| Total credit card revenues, net |
| $341 |
| |
| $259 |
| |
| $342 |
|
1 Other in fiscal year 2015 consisted of $173 of finance charge revenue, $61 in interchange fees and $44 of late fees and other revenue.
Credit program revenues, net include our portion of the ongoing credit card revenue, net of credit losses, from both sold and newly generated credit card receivables pursuant to our program agreement with TD. Asset amortization and deferred revenue recognition associated with the assets and liabilities recorded as part of the transaction are also recorded in credit program revenues, net. Revenue earned under the program agreement is impacted by the credit quality of receivables, both owned and serviced, and factors such as deteriorating economic conditions, declining creditworthiness of cardholders and the success of account management and collection activities may heighten the risk of credit losses.
Other credit card revenues included finance charge revenue, interchange fees and late fees. Finance charges represented interest earned on unpaid balances while interchange fees were earned from the use of Nordstrom Visa credit cards at merchants outside of Nordstrom. Late fees were assessed when a credit card account becomes past due. We continued to recognize revenue in this manner for credit card receivables retained (employee receivables) subsequent to the close of the October 2015 credit card receivable transaction until we sold our remaining receivables in November 2017.
Credit Card Revenues, net increased $82 in 2017 reflecting our strategic partnership with TD to responsibly grow our receivables and associated revenues and a reduction in amortization expense related to the sale of the credit card portfolio. Credit Card Revenues, net decreased $83 in 2016 due to the credit card receivable transaction and the new program agreement.
Credit Expenses
Credit expenses consist of operational, bad debt and occupancy expenses.
Credit Expenses (2017 vs. 2016)
Total credit expenses increased $5 in 2017 compared with 2016 due to an increase in costs associated with the Nordstrom Rewards loyalty program.
Credit Expenses (2016vs. 2015)
Total credit expenses increased $3 in 2016 compared with 2015 primarily due to a $64 gain partially offset by $32 of expenses incurred in 2015 associated with the credit card receivables transaction and a decrease in bad debt expense subsequent to the sale of the credit card receivables in October 2015.
TOTAL COMPANY RESULTS
Interest Expense, Net
Interest expense is summarized in the following table: | | | | | | | | | |
| Fiscal year | 2023 | | 2022 | | |
| SG&A expenses | $4,855 | | $5,046 | | |
| SG&A expenses as a % of net sales | 34.2 | % | 33.4 | % | |
|
| | | | | | | | | | | |
| Fiscal year | 2017 |
|
| 2016 |
|
| 2015 |
|
| Interest on long-term debt and short-term borrowings |
| $168 |
| |
| $147 |
| |
| $153 |
|
| Less: | | | | | |
| Interest income | (5 | ) | | (1 | ) | | — |
|
| Capitalized interest | (27 | ) | | (25 | ) | | (28 | ) |
| Interest expense, net |
| $136 |
| |
| $121 |
| |
| $125 |
|
Interest Expense, Net (2017 vs. 2016)
Interest expense, net increased $15SG&A decreased $191 in 20172023, compared with 20162022, primarily due to lower variable costs, driven by lower sales and supply chain efficiency initiatives, partially offset by higher labor costs and a net interest expense$32 supply chain asset impairment and related charge. In 2022, SG&A included a supply chain technology and related asset impairment charge of $18 related$70 and a $51 gain on sale of our interest in a corporate office building. SG&A increased 70 basis points as a rate of net sales compared with 2022, primarily due to deleverage on lower sales and higher labor costs, partially offset by supply chain efficiencies.
Canada Wind-down Costs
We recognized charges associated with the $650 debt refinancing completedwind-down of Nordstrom Canada of $284 in the first quarter of 2017year ended February 3, 2024 (see Note 7: Debt and Credit Facilities2: Canada Wind-down in Item 8).
Earnings Before Interest and Income Taxes
EBIT is summarized in the following table: | | | | | | | | | |
| Fiscal year | 2023 | | 2022 | | |
| EBIT | $251 | | $465 | | |
| EBIT as a % of net sales | 1.8 | % | 3.1 | % | |
EBIT decreased $214 and 130 basis points as a rate of net sales in 2023, compared with 2022, primarily due to $284 of expenses associated with the wind-down of Canadian operations, a $32 supply chain asset impairment and related charge and lower sales, partially offset by an improved gross profit rate and supply chain efficiency initiatives. In 2022, EBIT included a supply chain technology and related asset impairment charge of $70, a $51 gain on sale of our interest in a corporate office building, and an $18 impairment charge related to costs associated with the wind-down of Trunk Club.
Interest Expense, Net (2016 vs. 2015)
Interest expense, net is summarized in the following table: | | | | | | | | | | |
| Fiscal year | 2023 | 2022 | | | |
| Interest on long-term debt and short-term borrowings | $150 | | $150 | | | |
| | | | |
| Interest income | (33) | | (10) | | | |
| Capitalized interest | (13) | | (12) | | | |
| Interest expense, net | $104 | | $128 | | | |
Interest expense, net decreased $4$24 in 20162023 compared with 2015 2022, primarily due to the defeasancean increase in interest income from higher prevailing rates.
Nordstrom, Inc. and subsidiaries31
Income Tax Expense
Income tax expense is summarized in the following table: | | | | | | | | | | |
| Fiscal year | 2023 | 2022 | | |
| Income tax expense | $13 | | $92 | | | |
| Effective tax rate | 8.6 | % | 27.2 | % | | |
|
| | | | | | | | | | | |
| Fiscal year | 2017 |
| | 2016 |
| | 2015 |
|
| Income tax expense |
| $353 |
| |
| $330 |
| |
| $376 |
|
| Effective tax rate | 44.7 | % | | 48.2 | % | | 38.6 | % |
In December 2017, the Tax Act was signed into law. Among numerous other provisions, the Tax Act significantly revises the U.S. federal corporate income tax by reducing the statutory rate from 35% to 21%, imposing a mandatory one-time transition tax on accumulated unrepatriated earnings of foreign subsidiaries and enhancing and extending the option to claim accelerated depreciation on qualified property. The Tax Act also revises tax laws that will affect 2018, including, but not limited to, eliminating certain deductions for executive compensation and limiting the deduction for interest. We have reasonably estimated the effects of the Tax Act and recorded provisional amounts in our Consolidated Financial Statements as of February 3, 2018. Net earnings included $42 related to the Tax Act, which includes a provisional one-time, non-cash charge of $51 related to the revaluation of our net deferred tax assets for the change in statutory tax rate and for the impacts associated with the future limitations on executive compensation, partially offset by cash tax savings from a lower federal tax rate.As we complete our analysis of the Tax Act and interpret any additional guidance issued by the U.S. Treasury Department, the Internal Revenue Service (“IRS”) and other standard-setting bodies, we may make adjustments to the provisional amounts, which may materially impact our provision for income taxes in the period in which the adjustments are recorded.
Nordstrom, Inc. and subsidiaries23
The following table illustrates the components of our effective tax rate: | | | | | | | | |
| Fiscal year | 2023 | 2022 |
| Statutory rate | 21.0 | % | 21.0 | % |
| State and local income taxes, net of federal income taxes | 4.0 | % | 5.9 | % |
| Federal credits | (4.7 | %) | (3.8 | %) |
| Non-deductible expenses | 2.9 | % | 1.2 | % |
| Stock-based compensation | 5.1 | % | 1.8 | % |
| Valuation allowance | 6.6 | % | 0.4 | % |
| Taxes on foreign operations | 1.5 | % | 1.6 | % |
| Excess tax over book loss on Canada wind-down | (18.2 | %) | — | |
| Resolution of prior period tax matters | (11.2 | %) | — | |
| Other, net | 1.6 | % | (0.9 | %) |
| Effective tax rate | 8.6 | % | 27.2 | % |
|
| | | | | | | | |
| Fiscal year | 2017 |
| | 2016 |
| | 2015 |
|
Statutory rate1 | 33.7 | % | | 35.0 | % | | 35.0 | % |
| Tax Act impact | 6.1 | % | | — |
| | — |
|
| Goodwill impairment | — |
| | 10.1 | % | | — |
|
| State and local income taxes, net of federal income taxes | 4.5 | % | | 5.1 | % | | 4.1 | % |
| Non-deductible acquisition-related items | 0.3 | % | | 0.6 | % | | 0.4 | % |
| Federal credits | (0.7 | %) | | (0.6 | %) | | (0.6 | %) |
| Other, net | 0.8 | % | | (2.0 | %) | | (0.3 | %) |
| Effective tax rate | 44.7 | % | | 48.2 | % | | 38.6 | % |
1 The statutory rate in 2017 is reduced due to tax reform.
Income Tax Expense (2017 vs. 2016)
The decrease in the effective tax rate for 20172023, compared with 20162022, was primarily due to the non-deductible goodwill impairment charge of $197additional tax benefits related to Trunk Clubthe wind-down of Canadian operations and the favorable resolution of certain tax matters, partially offset by increases from additional tax expense for stock-based compensation and valuation allowance increases for Canadian deferred tax assets prior to deconsolidation.
Earnings Per Share
EPS is as follows: | | | | | | | | | | |
| Fiscal year | 2023 | | 2022 | | | |
| Basic | $0.83 | | $1.53 | | | |
| Diluted | $0.82 | | $1.51 | | | |
Diluted EPS decreased $0.69 in the third quarter of 2016 (see Note 8: Fair Value Measurements in Item 8). Excluding the impact of the Trunk Club goodwill impairment, our effective tax rate for 2017 would have increased approximately 700 basis points2023 compared with the prior year2022, primarily due to a provisional, one-time tax chargenet unfavorable impact of $1.30 per diluted share related to the revaluationwind-down of net deferred tax assets as a result of the Tax Act (see Note 13: Income Taxes in Item 8 for additional information).
Income Tax Expense (2016 vs. 2015)
The increase in the effective tax rate for 2016 compared with 2015 was primarily due to the non-deductible goodwill impairment charge of $197 related to Trunk Club. Excluding the impact of the Trunk Club goodwill impairment, our effective tax rate for 2016 would have decreased approximately 100 basis points compared with the prior year primarily due to an increase in nontaxable income.
Earnings Per Share
Earnings per share is as follows: |
| | | | | | | | | | | |
| Fiscal year | 2017 |
| | 2016 |
| | 2015 |
|
| Basic |
| $2.62 |
| |
| $2.05 |
| |
| $3.22 |
|
| Diluted |
| $2.59 |
| |
| $2.02 |
| |
| $3.15 |
|
Earnings Per Share (2017 vs. 2016)
For 2017, diluted earnings per share (“EPS”) of $2.59 included impacts associated with the Tax Act consisting of a $0.25 per share reduction related to our income tax provisionCanadian operations and a $0.06 per share decrease for a one-time investment in our employees. The impact of the Trunk Club goodwill impairment charge of $197 in 2016 was approximately $1.12 per share. Excluding the impact of these items, EPS decreased in 2017 compared with 2016 due to planned increases in supply chain asset impairment and technology costs associated with our growth initiatives,related charge in 2023 and lower sales, partially offset by an increase in net sales.improved gross profit rate and supply chain efficiency initiatives.
Earnings Per Share (2016 vs. 2015)
The decrease in EPS for 2016 compared with 2015 was primarily due to the Trunk Club goodwill impairment charge in 2016. Excluding the goodwill impairment charge, EPS in 2016 was relatively flat compared with 2015 due to higher technology and fulfillment costs supporting multi-channel growth, offset by a decrease in shares outstanding as a result of share repurchases during the year.32
Fourth Quarter Results
The following are our results for the fourth quarters of 2017 and 2016: |
| | | | | | | |
| Quarter ended | February 3, 2018 |
| | January 28, 2017 |
|
| Net sales |
| $4,600 |
|
|
| $4,243 |
|
| Credit card revenues, net | 102 |
|
| 73 |
|
| Gross profit | 1,631 |
| | 1,523 |
|
| Gross profit as a % of net sales | 35.5 | % | | 35.9 | % |
| Retail selling, general and administrative expenses | (1,337 | ) | | (1,134 | ) |
| Retail selling, general and administrative expenses as a % of net sales | (29.1 | %) | | (26.7 | %) |
| Credit expenses | (52 | ) | | (42 | ) |
| Net earnings | 151 |
| | 201 |
|
| EPS (diluted) |
| $0.89 |
| |
| $1.15 |
|
Adjusted EBIT, Adjusted EBITDA, Adjusted EBIT Margin and Adjusted EPS (Non-GAAP financial measures)
Net SalesThe following are key financial metrics and, when used in conjunction with GAAP measures, we believe they provide useful information for evaluating our core business performance, enable comparison of financial results across periods and allow for greater transparency with respect to key metrics used by management for financial and operational decision-making. Adjusted EBIT, Adjusted EBITDA, Adjusted EBIT margin and Adjusted EPS exclude certain items that we do not consider representative of our core operating performance. The financial measure calculated under GAAP which is most directly comparable to Adjusted EBIT and Adjusted EBITDA is net earnings. The financial measure calculated under GAAP which is most directly comparable to Adjusted EBIT margin is net earnings as a percent of net sales. The financial measure calculated under GAAP which is most directly comparable to Adjusted EPS is diluted EPS.
Total Company net sales increased 8.4% in the fourth quarterAdjusted EBIT, Adjusted EBITDA, Adjusted EBIT margin and Adjusted EPS are not measures of 2017, compared with the same period in 2016, inclusive of approximately $220 related to the 53rd week,financial performance under GAAP and comparable sales increased 2.6%.
Full-price net sales increased 6.1% for the fourth quarter of 2017, compared with the same period in 2016, while comparable sales increased 2.4%. Also on a comparable basis for the quarter, full-price sales reflected increases in the average selling price per item sold and the total number of items sold. For the fourth quarter, the top-performing merchandise categories were Kids’ and Men’s Apparel.
Off-price net sales increased 15% for the fourth quarter of 2017, compared with the same period in 2016, while comparable sales increased 3.7%. Nordstrom Rack net sales increased 11.4%, attributable to 17 new store openings since the end of 2016. On a comparable basis, there was a decrease at Nordstrom Rack in the average selling price per item sold while the number of items sold was flat. Beauty was the top-performing Nordstrom Rack merchandise category.
Credit Card Revenues, net
Credit card revenues, net increased $29 for the fourth quarter, compared with the same period in the prior year, reflecting our strategic partnership with TD to responsibly grow our receivables and associated revenues with new and enhanced product offerings. In addition, the impact of the 53rd week contributed approximately $10 in additional revenue.
Gross Profit
Our total Company gross profit rate decreased 44 basis points for the fourth quarter compared with the same period in 2016, primarily due to higher occupancy expenses related to new store growth for Nordstrom Rack and Canada. Merchandise margin performance was in-line with our expectations, reflecting continued strength in regular price selling trends. Ending inventory increased 6.9% over last year, generally in-line with our expectations.
Retail Selling, General and Administrative Expenses
Our Retail SG&A rate increased 231 basis points compared with the same period in 2016. The increase reflected higher supply chain, marketing and technology expenses associated with our growth initiativesshould be considered in addition to, and not as a legal settlement gain in 2016substitute for, net earnings, net earnings as a percent of $22, or approximately 50 basis points.
Credit Expenses
In the fourth quarter of 2017, total credit expenses increased $10 compared with the fourth quarter of 2016, driven primarily by increased technology costs.
Earnings Per Share
EPS for the fourth quarter of 2017 was $0.89net sales, operating cash flows, earnings per share, earnings per diluted share which included impacts associatedor other financial measures performed in accordance with the Tax Act consistingGAAP. Our method of determining non-GAAP financial measures may differ from other companies’ financial measures and therefore may not be comparable to methods used by other companies.
The following is a $0.25 reduction relatedreconciliation of net earnings to ourAdjusted EBIT and Adjusted EBITDA and net earnings as a percent of net sales to Adjusted EBIT margin:
| | | | | | | | |
| Fiscal year | 2023 | 2022 |
| Net earnings | $134 | | $245 | |
| Income tax expense | 13 | | 92 | |
| Interest expense, net | 104 | | 128 | |
| Earnings before interest and income taxes | 251 | | 465 | |
| Supply chain asset impairment and related charges | 32 | | 70 | |
| Canada wind-down costs | 284 | | — | |
| Trunk Club wind-down costs | — | | 18 | |
| Gain on sale of interest in a corporate office building | — | | (51) | |
| Adjusted EBIT | 567 | | 502 | |
| Depreciation and amortization expenses | 586 | | 604 | |
| Amortization of developer reimbursements | (69) | | (72) | |
| Adjusted EBITDA | $1,084 | | $1,034 | |
| | |
| Net sales | $14,219 | $15,092 |
| Net earnings as a % of net sales | 0.9 | % | 1.6 | % |
| EBIT margin % | 1.8 | % | 3.1 | % |
| Adjusted EBIT margin % | 4.0 | % | 3.3 | % |
The following is a reconciliation of diluted EPS to Adjusted EPS:
| | | | | | | | |
| Fiscal year | 2023 | 2022 |
| Diluted EPS | $0.82 | | $1.51 | |
| Supply chain asset impairment and related charges | 0.19 | | 0.44 | |
| Canada wind-down costs | 1.74 | | — | |
| Trunk Club wind-down costs | — | | 0.11 | |
| Gain on sale of interest in a corporate office building | — | | (0.31) | |
Income tax impact on adjustments1 | (0.63) | | (0.06) | |
| Adjusted EPS | $2.12 | | $1.69 | |
| | |
| | |
| | |
1 The income tax provision and a $0.06 decrease for a one-time pre-tax investment in our employees compared with $1.15 per diluted shareimpact of non-GAAP adjustments is calculated using the estimated tax rate for the same period in 2016. Excluding the impact of the Tax Act, EPS per diluted share increased due to higher net sales.
For further information on our quarterly results in 2017 and 2016, refer to Note 16: Selected Quarterly Data in Item 8.
2018 Guidance
Our expectations for 2018, which are shown in comparison to the 53-week fiscal 2017 where applicable, are as follows: |
| |
Net sales | $15.2 to $15.4 billion
|
Comparable sales (percent) | 0.5 to 1.5
|
EBIT | $885 to $940 million
|
Earnings per diluted share (excluding the impact of any future share repurchase) | $3.30 to $3.55 |
The Company’s guidance also incorporates the following assumptions:
The effective tax rate is expected to be approximately 27.5%.
The impact of revenue recognition accounting changes is estimated to reduce EBIT by approximately $30.
The 53rd week in fiscal 2017 creates a timing shift in the 4-5-4 calendar for fiscal 2018 that is expected to impact comparisons to the prior year. This includes the shift in the Anniversary Sale event from the second and third quarters in 2017 to primarily the second quarter in 2018.
As a result of the evolution of our operations, our reportable segments have become progressively more integrated such that we will change our reportable segments to one reportable segment to align with how management will view the results of our operations in the first quarter of 2018, as discussed in Note 15: Segment Reporting in Item 8. These changes are not expected to impact total Company net earnings, earnings per share, financial position or cash flows. In addition, we are evaluating our legacy store based metrics, such as those calculated based on square footage, and migrating to metrics that are more relevant to how customers are engaging with us.
respective non-GAAP adjustment.
Nordstrom, Inc. and subsidiaries2533
Return on Invested Capital (“ROIC”)Adjusted ROIC (Non-GAAP financial measure)
We believe that Adjusted ROIC is a useful financial measure for investors in evaluating the efficiency and effectiveness of the capital we have invested in our use of capitalbusiness to generate returns over time. In addition, we have incorporated it in our executive incentive measures and we believe ROICit is an important componentindicator of shareholders’ return over the long term. In addition, we incorporate ROIC in our executive incentive compensation measures. For the 12 fiscal months ended February 3, 2018, our ROIC increased to 9.7% compared with 8.4% for the 12 fiscal months ended January 28, 2017. Results for the prior period were negatively impacted by approximately 330 basis points due to the Trunk Club non-cash goodwill impairment charge
Beginning in the thirdsecond quarter of 2016 (see Note 8: Fair Value Measurements in Item 8).
We define2023, the Adjusted ROIC ascalculation was updated to exclude certain items that we do not consider representative of our core operating performance. Refer to non-operating related adjustments included within adjusted net operating profit after tax divided by ourand adjusted average invested capital using the trailing 12-month average.capital. Prior periods have been modified to conform with current period presentation.
Adjusted ROIC is not a measure of financial performance under generally accepted accounting principles (“GAAP”)GAAP and should be considered in addition to, and not as a substitute for, return on assets, net earnings, total assets or other GAAP financial measures prepared in accordance with GAAP.measures. Our method of determiningcalculating a non-GAAP financial measuresmeasure may differ from other companies’ methods and therefore may not be comparable to those used by other companies. The financial measure calculated under GAAP which is most directly comparable to Adjusted ROIC is return on assets. The following shows the components to reconcile the return on assets calculation to Adjusted ROIC:
| | | | | | | | |
| Fiscal year | 2023 | 2022 |
| Net earnings | $134 | | $245 | |
| Income tax expense | 13 | | 92 | |
| Interest expense | 137 | | 138 | |
| Earnings before interest and income tax expense | 284 | | 475 | |
| | |
Operating lease interest1 | 86 | | 85 | |
| | |
| | |
Non-operating related adjustments2 | 316 | | 38 | |
| Adjusted net operating profit | 686 | | 598 | |
Adjusted estimated income tax expense3 | (172) | | (162) | |
| Adjusted net operating profit after tax | $514 | | $436 | |
| | |
| Average total assets | $8,766 | | $9,069 | |
Average noncurrent deferred property incentives in excess of ROU assets4 | (157) | | (197) | |
| Average non-interest bearing current liabilities | (2,954) | | (3,185) | |
Non-operating related adjustments5 | 394 | | — | |
| Adjusted average invested capital | $6,049 | | $5,687 | |
| | |
| Return on assets | 1.5 | % | 2.7 | % |
| Adjusted ROIC | 8.5 | % | 7.7 | % |
1 Operating lease interest is a reconciliationcomponent of operating lease cost recorded in occupancy costs. We add back operating lease interest for purposes of calculating adjusted net operating profit for consistency with the componentstreatment of ROICinterest expense on our debt.
2 See the Adjusted EBIT and returnAdjusted EBITDA section, as well as our 2022 Annual Report, for detailed information on assets:certain non-operating related adjustments. |
| | | | | | | | | | | | | | | | | | | |
| | 12 Fiscal Months Ended |
| | February 3, 2018 |
| | January 28, 2017 |
| | January 30, 2016 |
| | January 31, 2015 |
| | February 1, 2014 |
|
| Net earnings |
| $437 |
| |
| $354 |
| |
| $600 |
| |
| $720 |
| |
| $734 |
|
Add: income tax expense1 | 353 |
| | 330 |
| | 376 |
| | 465 |
| | 455 |
|
| Add: interest expense | 141 |
| | 122 |
| | 125 |
| | 139 |
| | 162 |
|
| Earnings before interest and income tax expense | 931 |
| | 806 |
| | 1,101 |
| | 1,324 |
| | 1,351 |
|
| | | | | | | | | | |
| Add: rent expense | 250 |
| | 202 |
| | 176 |
| | 137 |
| | 125 |
|
Less: estimated depreciation on capitalized operating leases2 | (133 | ) | | (108 | ) | | (94 | ) | | (74 | ) | | (67 | ) |
| Net operating profit | 1,048 |
| | 900 |
| | 1,183 |
| | 1,387 |
| | 1,409 |
|
| | | | | | | | | | |
| Less: estimated income tax expense | (468 | ) | | (416 | ) | | (456 | ) | | (544 | ) | | (539 | ) |
| Net operating profit after tax |
| $580 |
| |
| $484 |
| |
| $727 |
| |
| $843 |
| |
| $870 |
|
| | | | | | | | | | |
| Average total assets |
| $8,055 |
| |
| $7,917 |
| |
| $9,076 |
| |
| $8,860 |
| |
| $8,398 |
|
Less: average non-interest-bearing current liabilities3 | (3,261 | ) | | (3,012 | ) | | (2,993 | ) | | (2,730 | ) | | (2,430 | ) |
Less: average deferred property incentives and deferred rent liability3 | (644 | ) | | (644 | ) | | (548 | ) | | (502 | ) | | (489 | ) |
Add: average estimated asset base of capitalized operating leases4 | 1,805 |
| | 1,512 |
| | 1,236 |
| | 1,058 |
| | 929 |
|
| Average invested capital |
| $5,955 |
| |
| $5,773 |
| |
| $6,771 |
| |
| $6,686 |
| |
| $6,408 |
|
| | | | | | | | | | |
Return on assets5 | 5.4 | % | | 4.5 | % | | 6.6 | % | | 8.1 | % | | 8.7 | % |
ROIC5 | 9.7 | % | | 8.4 | % | | 10.7 | % | | 12.6 | % | | 13.6 | % |
1 Results3 Adjusted estimated income tax expense is calculated by multiplying the adjusted net operating profit by the adjusted effective tax rate (which removes the impact of non-operating related adjustments) for the 12 monthstrailing twelve-month periods ended February 3, 2018, include $42 impact2024 and January 28, 2023. The adjusted effective tax rate is calculated by dividing adjusted income tax expense by adjusted earnings before income taxes for the same trailing twelve-month periods.
4 For leases with property incentives that exceed the ROU assets, we reclassify the amount from assets to other current liabilities and other liabilities on the Consolidated Balance Sheets. The current and noncurrent amounts are used to reduce average total assets above, as this better reflects how we manage our business.
5 Non-operating related adjustments primarily relate to the Tax Act.
2 Capitalized operating leases iswind-down of our best estimate of the asset base we would recordCanadian operations for our leases that are classified as operating if they had met the criteria for a capital lease or we had purchased the property. Asset base is calculated as described in footnote 4 below.
3 Balances associated with our deferred rent liability have been classified as long-term liabilities in the current period.
4 Based upon the trailing 12-month average of the monthly asset base. The asset base for each month is calculated as the trailing 12 months of rent expense multiplied by eight. The multiple of eight times rent expense is a commonly used method of estimating the asset base we would record for our capitalized operating leases described in footnote 2.
5 Results for 12 fiscal monthstwelve-month period ended January 28, 2017 include the $197 impact of the Trunk Club non-cash goodwill impairment charge in the third quarter of 2016, which negatively impacted the prior period return on assets by approximately 240 basis points and ROIC by approximately 330 basis points.
February 3, 2024.
LIQUIDITY AND CAPITAL RESOURCES
We strive to maintain a level of liquidity sufficient to allow us to cover our seasonal cash needs and to maintain appropriate levels of short-term borrowings. We believe thatIn the short term, our operatingongoing working capital and capital expenditure requirements, and any dividend payments or share repurchases, are generally funded through cash flows available credit facilitygenerated from operations. In addition, we have access to the commercial paper market and potential future borrowings are sufficient to meetcan draw on our cash requirementsRevolver for the next 12 monthsworking capital, capital expenditures and beyond.
general corporate purposes. Over the long term, we manage our cash and capital structure to maximize shareholder return, maintain our financial position, manage refinancing risk and allow flexibility for strategic initiatives. We regularly assess our debt and leverage levels, capital expenditure requirements, debt service payments, dividend payouts, potential share repurchases and other future investments.
We believe that as of February 3, 2018, our existingended fiscal year 2023 with $628 in cash and cash equivalents on-handand $770 of $1,181,additional liquidity available credit facilitieson our Revolver. Cash and cash equivalents as of $800February 3, 2024 decreased from $687 in 2022, driven by payments for capital expenditures, Canadian guarantee settlements (see Note 2: Canada Wind-down in Item 8) and potential future operatingdividends, partially offset by cash flows from earnings.
As of February 3, 2024, we had $250 in current maturities of long-term debt due April 2024 (see Note 6: Debt and borrowings will beCredit Facilities in Item 8). We intend to retire this outstanding debt during the first quarter of 2024 using cash on hand. We believe that our cash flows from operations are sufficient to fund these scheduledmeet our cash requirements for the next 12 months and beyond. Our cash requirements are subject to change as business conditions warrant and opportunities arise and we may elect to raise additional funds in the future payments and potential long-term initiatives.through the issuance of either debt or equity.
The following is a summary of our cash flows by activity: |
| | | | | | | | | | | |
| Fiscal year | 2017 |
| | 2016 |
| | 2015 |
|
| Net cash provided by operating activities |
| $1,400 |
| |
| $1,658 |
| |
| $2,470 |
|
| Net cash used in investing activities | (684 | ) | | (791 | ) | | (144 | ) |
| Net cash used in financing activities | (542 | ) | | (455 | ) | | (2,558 | ) |
| | | | | | | | | | |
| Fiscal year | 2023 | 2022 | | |
| Net cash provided by operating activities | $621 | | $946 | | | |
| Net cash used in investing activities | (571) | | (393) | | | |
| Net cash used in financing activities | (109) | | (186) | | | |
Operating Activities
The majority of our operating cash inflows are derived from sales. We also receive cash payments for property incentives from developers.developers and vendors. Our operating cash outflows generally consist of payments to our merchandise vendors (net of vendor allowances), and shipping carriers, payments to our employees for wages, salaries and other employee benefits and payments to our landlords for rent. Operating cash outflows also include payments for income taxes and interest payments on our short-term and long-term borrowings.
Net cash provided by operating activities decreased by $258 between 2017$325 between 2023 and 2016 primarily2022 primarily due to changes in working capital driven by the amended TD program agreement in 2022, timing of tax refundspurchases and payments. Net cash provided by operating activities decreased by $812 between 2016payments for inventory and 2015 primarily due to $1,297 of proceeds in 2015 from the sale of our credit card receivables originated at NordstromCanadian guarantee settlements (see Note 2: Credit Card Receivable TransactionCanada Wind-down in Item 8). When removing the impact of the sale proceeds, operating cash flows increased from 2015 primarily due to improvements in working capital.
Investing Activities
Our investing cash outflows include payments for capital expenditures, including technology, stores and supply chain improvements. Our investing cash inflows are generally from proceeds from sales of property and equipment. Our investing cash outflows include payments forActivity also includes the purchase and sale of financial interests of certain private companies and venture capital expenditures, including stores, supply chain improvements and information technology costs. In addition, other investing includes payments for investments in other companies, as well as proceeds from distributions or sales of these investments.funds.
Net cash used in investing activities decreased by $107 between 2017 increased $178 between 2023 and 2016 primarily2022, primarily due to a decrease inincreased capital expenditures. Net cash used in investing activities increased by $647 between 2016 and 2015 primarily due to $890 of proceeds in 2015 fromexpenditures for Nordstrom Rack new store openings, the sale of our credit card receivables originated at third parties, partially offset byinterest in a corporate office building in 2022 and the decrease in capital expenditurescash and cash equivalents resulting from the deconsolidation of Canada in 2016.2023 (see Note 1: Nature of Operations and Summary of Significant Accounting Policies and Note 2: Canada Wind-down in Item 8).
Nordstrom, Inc. and subsidiaries35
Capital Expenditures
Our capital expenditures, net are summarized as follows: | | | | | | | | |
| Fiscal year | 2023 | 2022 |
| Capital expenditures | $569 | | $473 | |
Deferred property incentives1 | (35) | | (20) | |
| Capital expenditures, net | $534 | | $453 | |
| | |
| | |
| | |
| Capital expenditures, net category allocation: | | |
| Technology | 59 | % | 66 | % |
| New stores, relocations, remodels and other | 31 | % | 24 | % |
| Supply chain | 10 | % | 10 | % |
| Total | 100 | % | 100 | % |
| | |
|
| | | | | | | | | | | |
| Fiscal year | 2017 |
| | 2016 |
| | 2015 |
|
| Capital expenditures |
| $731 |
| |
| $846 |
| |
| $1,082 |
|
Less: deferred property incentives1 | (64 | ) | | (65 | ) | | (156 | ) |
| Capital expenditures, net |
| $667 |
| |
| $781 |
| |
| $926 |
|
| | | | | | |
| Capital expenditures % of net sales | 4.8 | % | | 5.8 | % | | 7.7 | % |
| | | | | | |
| Capital expenditures, net category allocation: | | | | | |
New stores, relocations and remodels2 | 65 | % | | 61 | % | | 61 | % |
| Information technology | 30 | % | | 28 | % | | 33 | % |
Other3 | 5 | % | | 11 | % | | 6 | % |
| Total | 100 | % | | 100 | % | | 100 | % |
1 Deferred property incentives are included in our cash provided by operations in our Consolidated Statements of Cash Flows in Item 8. We operationally view the property incentives we receive from our developers and vendors as an offset to our capital expenditures.
2 New stores, relocations and remodels include | | | | | | | | | | | | | | | | | | | | |
| Fiscal year | 20241 | 2023 | | 2022 | | 2021 | | 2020 | | 2019 | |
| Capital expenditures as a % of net sales | 3%-4% | 4.0 | % | 3.1 | % | 3.5 | % | 3.7 | % | 6.2 | % |
1 Rate represents amounts forecasted in 2024.
Capital expenditures as a percentage of net sales in 2023 was on the impacthigher end of our expansion intooutlook, and increased compared with 2022, primarily due to Nordstrom Rack new markets, including Nordstrom Canadastore openings in 2023 and Nordstrom NYC.
3 Other capital expenditures consist of ongoing improvements toinvestments in our stores in the ordinary course of business and expenditures related to various growth initiatives.
Nordstrom, Inc. and subsidiaries27
Capital expenditures, net decreased $114 in 2017 compared with 2016 duesupport continued growth. Going forward, we expect capital expenditure requirements on average to reduced spend for Canada full-line stores. Capital expenditures, net decreased $145 in 2016 compared with 2015 duerange from 3% to reduced spend associated with full-line relocations and new full-line stores.
The following table summarizes our store count and square footage activity: |
| | | | | | | | | | | | | | | | | | |
| | | Store count | | Square footage |
| Fiscal year | | 2017 |
| | 2016 |
| | 2015 |
| | 2017 |
|
| 2016 |
|
| 2015 |
|
| Total, beginning of year | | 349 |
| | 323 |
| | 292 |
| | 29.8 |
| | 28.6 |
| | 27.1 |
|
Store openings1: | | | | | | | | | | | | |
Nordstrom full-line stores2 | | 2 |
| | 3 |
| | 5 |
| | 0.2 |
| | 0.6 |
| | 0.8 |
|
Nordstrom Rack and other stores3 | | 17 |
| | 24 |
| | 27 |
| | 0.5 |
| | 0.8 |
| | 0.9 |
|
| Stores closed | | (2 | ) | | (1 | ) | | (1 | ) | | (0.3 | ) | | (0.2 | ) | | (0.2 | ) |
| Total, end of year | | 366 |
| | 349 |
| | 323 |
| | 30.2 |
| | 29.8 |
| | 28.6 |
|
| | | | | | | | | | | | | |
Relocations and other1 | | 3 |
| | 3 |
| | 1 |
| | — |
| | — |
| | — |
|
1 Store openings include adjustments due to store relocations or remodels.
2 Nordstrom full-line stores include U.S. full line stores, Canada full-line stores and Nordstrom Local.
3 Other includes Trunk Club clubhouses, Jeffrey boutiques and Last Chance stores.
To date in 2018, we have opened three Nordstrom Rack stores and plan to open 9 additional Nordstrom Rack stores and the Nordstrom Men’s Store NYC, increasing our retail square footage by approximately 1%.
Our capital expenditures, net over the next five years is expected to be approximately $3,200, or 4% of net sales, compared with $3,839, or 6%and primarily support investments in technology and stores. Approximately $32 of net sales, over the previous five years. Although we plan our spending in 2018 and 2019purchase obligation commitments relate to increase when compared with 2017 due to a new West Coast fulfillment center and Nordstrom NYC pre-opening costs,capital expenditures, all of which we expect reductionsto impact our liquidity in the following years. We do not expect capital expenditures, net to exceed 5% of net salesnext year (see Note 13: Commitments and Contingencies in any of the next five years.Item 8).
Financing Activities
The majority of our financing activities include long-term debt or Revolver proceeds and/or payments, dividend payments and repurchases of common stock repurchases.stock.
Net cash used in financing activities increased $87 between 2017 decreased $77 between 2023 and 20162022 primarily due to decreased share repurchases in 2023 compared with 2022.
Share Repurchases
In determining the size and timing of share repurchases, we analyze a decreasenumber of different factors, including our liquidity position, current market and economic conditions and alternative uses of capital, including those used to offset anticipated dilution from equity incentive plans. Share repurchases are made as conditions warrant in cash book overdrafts as a resultthe open market and are then retired. We repurchased 0.03 shares of payment timing differences. Net cash usedour common stock for $1 in financing activities decreased $2,103 between 20162023, compared with 2.8 shares repurchased for $62 in 2022, and 2015 primarily due to a decreasehad $438 remaining in cash dividends paid and share repurchase activity.
Borrowing Activity
During 2017, we issued $350 aggregate principal amountcapacity as of 4.00% senior unsecured notes due March 2027February 3, 2024. The actual timing, price, manner and $300 aggregate principal amountamounts of 5.00% senior unsecured notes due January 2044. We recorded debt issuance costs incurred as a resultfuture share repurchases, if any, will be subject to the discretion of the issuance in other financing activities, net in the Consolidated StatementsBoard of Cash Flows in Item 8. With the proceeds of these new notes, we retired our $650 senior unsecured notes that were due January 2018Directors, contractual commitments, market and economic conditions and applicable SEC rules (see Note 7: Debt and Credit Facilities11: Shareholders’ Equity in Item 8).
In 2015, as a condition of closing the credit card receivable transaction, we defeased $325 in secured Series 2011-1 Class A Notes in order to provide the receivables to TD free and clear.
Dividends
In 2017, we paid dividends of $247, or $1.48 per share, compared with $256, or $1.48 per share, in 2016 and $1,185, or $6.33 per share, in 2015. Dividends paid in 2015 included a special cash dividend of $905, or $4.85 per share, in addition to our quarterly dividends totaling $1.48 per share. The special dividend was authorized by our Board of Directors on October 1, 2015, and was paid using proceeds from the sale of our credit card receivables. In determining the dividends to pay, we analyze our dividend payout ratio and dividend yield, while taking into consideration our current and projected operating performance and liquidity. Ourliquidity, subject to our Revolver covenants (see Note 6: Debt and Credit Facilities in Item 8). In 2023, we paid dividends of $123, or $0.76 per share, compared with $119, or $0.76 per share, in 2022 (see Note 11: Shareholders’ Equity in Item 8). We expect a continuation of our 2023 dividend payout ratio target range is 30% to 35% and is calculated as our dividend payments divided by net earnings.payment levels throughout 2024.
In February 2018,2024, subsequent to year end, we declared a quarterly dividend of $0.37$0.19 per share, which will be paid on March 20, 2018.
27, 2024 to shareholders of record as of March 12, 2024.
Cash Requirements
Share RepurchasesWe have various commitments and other executory contracts that are disclosed in the following Notes to Consolidated Financial Statements in Item 8:
•Note 2: Canada Wind-down
•Note 5: Leases
•Note 6: Debt and Credit Facilities
•Note 8: Self-Insurance
•Note 9: Supplemental Executive Retirement Plan
•Note 12: Income Taxes
•Note 13: Commitments and Contingencies
Other commitments include $63 for deferred compensation and other accrued benefits, $9 of which is payable within one year.
Off-Balance Sheet Arrangements
In October 2015,connection with our Boardworkers’ compensation programs, we have a standby letter of Directors authorized a program to repurchase up to $1,000 ofcredit issued on our outstanding common stock, through March 1, 2017. There was $409 of unused capacity upon program expiration. In February 2017, our Board of Directors authorized an additional program to repurchase up to $500 of our outstanding common stock, through August 31, 2018. During the first quarter of 2017, we repurchased 4.6 shares of our common stock for an aggregate purchase price of $206. Since June 2017, when we suspended the February 2017 program, we did notbehalf with $13 available and do not plan to repurchase shares while the Group explores the possibility of a Going Private Transaction. We had $414 remaining in share repurchase capacity$2 outstanding as of February 3, 2018. The actual timing, price, manner2024 (see Note 8: Self-Insurance in Item 8). In addition, we issued a standby letter of credit of $30 in the fourth quarter of 2023 reducing our short-term borrowing capacity on our Revolver (see Note 6: Debt and amounts ofCredit Facilities in Item 8). In management’s opinion, we have no off-balance sheet arrangements that have a material current or future share repurchases, if any, will be subject to market and economic conditions and applicable SEC rules.effect on our financial condition or financial statements.
Free Cash Flow (Non-GAAP financial measure)
Free Cash Flow is one of our key liquidity measures and, when used in conjunction with GAAP measures, we believe it provides investors with a meaningful analysis of our ability to generate cash from our business. For the year ended February 3, 2018, we had Free Cash Flow of $383 compared with $560 for the year ended January 28, 2017.
Free Cash Flow is not a measure of financial performance under GAAP and should be considered in addition to, and not as a substitute for, operating cash flows or other financial measures prepared in accordance with GAAP. Our method of determiningcalculating a non-GAAP financial measuresmeasure may differ from other companies’ methods and therefore may not be comparable to those used by other companies. The financial measure calculated under GAAP which is most directly comparable to Free Cash Flow is net cash provided by operating activities. The following is a reconciliation of net cash provided by operating activities to Free Cash Flow: | | | | | | | | | |
| Fiscal year | 2023 | 2022 | |
| Net cash provided by operating activities | $621 | | $946 | | |
| Capital expenditures | (569) | | (473) | | |
| Change in cash book overdrafts | 2 | | (14) | | |
| Free Cash Flow | $54 | | $459 | | |
| | | |
| | | |
| | | |
Nordstrom, Inc. and subsidiaries37
|
| | | | | | | | | | | |
| Fiscal year | 2017 |
| | 2016 |
| | 2015 |
|
| Net cash provided by operating activities |
| $1,400 |
| |
| $1,658 |
| |
| $2,470 |
|
| Less: capital expenditures | (731 | ) | | (846 | ) | | (1,082 | ) |
| Less: cash dividends paid | (247 | ) | | (256 | ) | | (1,185 | ) |
| Add: proceeds from sale of credit card receivables originated at third parties | 16 |
| | — |
| | 890 |
|
| Add: change in credit card receivables originated at third parties | — |
| | — |
| | 34 |
|
| (Less) Add: change in cash book overdrafts | (55 | ) | | 4 |
| | 23 |
|
| Free Cash Flow |
| $383 |
| |
| $560 |
| |
| $1,150 |
|
CAPITAL RESOURCES
Borrowing Capacity and CommitmentsActivity
As of February 3, 2018,2024, we had totalno borrowings outstanding under our Revolver that expires in May 2027 and our short-term borrowing capacity was reduced by $30 to $770 as a result of $800 under our senior unsecured revolvingissuing a standby letter of credit facility (“revolver”) that expires in April 2020. Under the termsfourth quarter of our revolver, we pay a variable rate of interest and a commitment fee based on our debt rating. The revolver is available for working capital, capital expenditures and general corporate purposes. We have the option to increase the revolving commitment by up to $200, to a total of $1,000, provided that we obtain written consent from the lenders.
Our $800 commercial paper program allows us to use the proceeds to fund operating cash requirements. Under the terms of the commercial paper agreement, we pay a rate of interest based on, among other factors, the maturity of the issuance and market conditions. The issuance of commercial paper has the effect, while it is outstanding, of reducing available liquidity under the revolver by an amount equal to the principal amount of commercial paper.
2023. As of February 3, 2018,2024, we had no issuances outstanding under our commercial paper programprogram. For more information about our credit facilities, see Note 6: Debt and no borrowings outstanding under our revolver.
Our wholly owned subsidiaryCredit Facilities in Puerto Rico maintains a $52 unsecured borrowing facility to support our expansion into that market. The facility expires in Fall 2018 and borrowings on this facility incur interest based upon the LIBOR plus 1.275% per annum and also incurred a fee based on any unused commitment. As of February 3, 2018, we had $48 outstanding on this facility.
We maintain trade and standby letters of credit to facilitate our international payments. As of February 3, 2018, we have $8 available and none outstanding under the trade letter of credit and $15 available and $2 outstanding under the standby letter of credit.
Plans for our Nordstrom NYC store, which we currently expect to open in 2019, ultimately include owning a condominium interest in a mixed-use tower and leasing certain nearby properties. As of February 3, 2018, we had approximately $289 of fee interest in land, which is expected to convert to the condominium interest once the store is constructed. We have committed to make future installment payments based on the developer meeting pre-established construction and development milestones. In the event that this project is not completed, the opening may be delayed and we may be subject to future losses or capital commitments in order to complete construction or to monetize our investment in the land.
Nordstrom, Inc. and subsidiaries29
Item 8.
Impact of Credit Ratings and Revolver Covenants
UnderChanges in our credit ratings may impact our costs to borrow, whether our personal property secures our Revolver and whether and to what extent we are permitted to pay dividends or conduct share repurchases.
For our Revolver, the terms of our revolver,interest rate applicable to any borrowings we may enter into will accrue interest for Euro-Dollar Rate Loans at a floating base rate tied to LIBOR, for Canadian Dealer Offer Rate Loans at a floating rate tied to CDOR, and for Base Rate Loans at the highest of: (i) the Euro-Dollar rate plus 100 basis points, (ii) the federal funds rate plus 50 basis points and (iii) the prime rate.
The rate depends upon the type of borrowing incurred plus in each case an applicable margin. This applicable margin, varies depending upon thewhich is determined based on our credit ratings assigned to our long-term unsecured debt.ratings. At the time of this report, our long-term unsecured debtcredit ratings outlook and resulting applicable marginoutlook were as follows: | | | | | | | | |
| Credit Ratings | Outlook |
| Moody’s | Ba1 | | | Negative |
| S&P Global Ratings | Credit RatingsBB+ | | Outlook |
Negative |
Moody’sFitch Ratings | Baa1BB+ | | Stable |
|
| Standard & Poor’s | BBB+ | Negative |
|
| | | |
| Base Interest
Rate
| | Applicable
Margin
|
|
Euro-Dollar Rate Loan | LIBOR | | 1.02 | % |
Canadian Dealer Offer Rate Loan | CDOR | | 1.02 | % |
Base Rate Loan | various | | — |
|
Should the ratings assigned to our long-term unsecured debt improve, the applicable margin associated with any such borrowings under the Revolver may decrease, resulting in a lower borrowing cost under this facility. ShouldConversely, should the ratings assigned to our long-term unsecured debt worsen, the applicable margin associated with ourany borrowings under the Revolver may increase, resulting in a higher borrowing cost under this facility.
Debt Covenants
The revolver requires that we maintain an adjusted debt to earnings before interest, income taxes, depreciation, amortization and rent (“EBITDAR”) leverage ratio of no more than four times (see the following additional discussion of Adjusted Debt to EBITDAR). As of February 3, 2018,2024, we were in compliance with this covenant.
all covenants. We have certain limitations with respect to the payment of dividends and share repurchases under our Revolver agreement. On March 1, 2023, we amended our Revolver agreement. For more information about our Revolver covenants, see Note 6: Debt and Credit Facilities in Item 8.
Adjusted Debt to EBITDAR (Non-GAAP financial measure)
Adjusted Debtdebt to EBITDAR is one of our key financial metrics and we believe that our debt levels are best analyzed using this measure.measure, as it provides a reflection of our creditworthiness which could impact our credit ratings and borrowing costs. This metric is calculated in accordance with the updates in our Revolver covenant and is a key component in assessing whether our revolving credit facility is secured or unsecured, as well as our ability to make dividend payments and share repurchases. Our goal is to manage debt levels to achieve and maintain an investment-grade credit rating and operateratings while operating with an efficient capital structure. In evaluatingFor more information regarding our debt levels, this measure provides a reflection of our credit worthiness that could impact our credit ratingRevolver, see Note 6: Debt and borrowing costs. We also have aCredit Facilities in Item 8.
Adjusted debt covenant that requires an adjusted debt to EBITDAR leverage ratio of no more than four times. As of February 3, 2018, our Adjusted Debt to EBITDAR was 2.6, and as of January 28, 2017, it was 2.4.
Adjusted Debt to EBITDAR is not a measure of financial performance under GAAP and should be considered in addition to, and not as a substitute for, debt to net earnings, net earnings, debt or other GAAP financial measures prepared in accordance with GAAP.measures. Our method of determiningcalculating a non-GAAP financial measuresmeasure may differ from other companies’ methods and therefore may not be comparable to those used by other companies. The financial measure calculated under GAAP which is most directly comparable to Adjusted Debtdebt to EBITDAR is debt to net earnings. The following is a reconciliation ofshows the components of Adjusted Debt to EBITDAR andreconcile the debt to net earnings:earnings calculation to Adjusted debt to EBITDAR: | | | | | |
| February 3, 2024 |
| Debt | $2,862 | |
| Operating lease liabilities | 1,617 | |
| Adjusted debt | $4,479 | |
| |
| Four Quarters Ended February 3, 2024 |
| Net earnings | $134 | |
| Income tax expense | 13 | |
| Interest expense, net | 104 | |
| Earnings before interest and income taxes | 251 | |
| |
| Depreciation and amortization expenses | 586 | |
| Operating Lease Cost | 278 | |
Amortization of developer reimbursements1 | 69 | |
| Canada wind-down costs | 284 | |
| Supply chain asset impairment and related charge | 32 | |
Other Revolver covenant adjustments2 | 36 | |
| Adjusted EBITDAR | $1,536 | |
| |
| Debt to Net Earnings | 21.4 | |
| Adjusted debt to EBITDAR | 2.9 | |
|
| | | | | | | |
| | 20171 |
| | 20161 |
|
| Debt |
| $2,737 |
| |
| $2,774 |
|
Add: estimated capitalized operating lease liability2 | 2,001 |
| | 1,616 |
|
| Less: fair value hedge adjustment included in long-term debt | — |
| | (12 | ) |
| Adjusted Debt |
| $4,738 |
| |
| $4,378 |
|
| | | | |
| Net earnings | 437 |
| | 354 |
|
| Add: income tax expense | 353 |
| | 330 |
|
| Add: interest expense, net | 136 |
| | 121 |
|
| Earnings before interest and income taxes | 926 |
| | 805 |
|
| | | | |
| Add: depreciation and amortization expenses | 666 |
| | 645 |
|
| Add: rent expense | 250 |
| | 202 |
|
Add: non-cash acquisition-related charges3 | 1 |
| | 198 |
|
| EBITDAR |
| $1,843 |
| |
| $1,850 |
|
| | | | |
Debt to Net Earnings4 | 6.3 |
| | 7.8 |
|
| Adjusted Debt to EBITDAR | 2.6 |
| | 2.4 |
|
1 The components of2 Other adjusting items to reconcile net earnings to Adjusted Debt areEBITDAR as of February 3, 2018defined by our Revolver covenant include interest income, certain non-cash charges and January 28, 2017, whileother gains and losses where relevant. For the components of EBITDAR are for the 12 monthsfour quarters ended February 3, 2018 and January 28, 2017.
2 Based upon the estimated lease liability as of the end of the period, calculated as the trailing 12 months of rent expense multiplied by eight. The multiple of eight times rent expense is a commonly used method of estimating the debt we would record for our leases that are classified as operating if they had met the criteria for a capital lease or we had purchased the property.
3 Non-cash acquisition-related charges for the 12 months ended January 28, 20172024, other Revolver covenant adjustments primarily included the goodwill impairment charge of $197 related to Trunk Club.
4 Results for the period ended January 28, 2017 include the $197 impact of the Trunk Club goodwill impairment charge, which approximates 280 basis points.
interest income.
Nordstrom, Inc. and subsidiaries3139
Contractual Obligations
The following table summarizes our contractual obligations and the expected effect on our liquidity and cash flows as of February 3, 2018. We expect to fund these commitments primarily with operating cash flows generated in the normal course of business and credit available to us under existing and potential future facilities. |
| | | | | | | | | | | | | | | | | | | |
| | Total |
| | Less than 1 year |
| | 1 – 3 years |
| | 3 – 5 years |
| | More than 5 years |
|
| Long-term debt |
| $4,563 |
| |
| $167 |
| |
| $711 |
| |
| $644 |
| |
| $3,041 |
|
| Operating leases | 2,740 |
| | 309 |
| | 605 |
| | 516 |
| | 1,310 |
|
| Purchase obligations | 1,462 |
| | 1,251 |
| | 188 |
| | 23 |
| | — |
|
| Other long-term liabilities | 383 |
| | 64 |
| | 59 |
| | 42 |
| | 218 |
|
| Total |
| $9,148 |
| |
| $1,791 |
| |
| $1,563 |
| |
| $1,225 |
| |
| $4,569 |
|
Included in the required debt repayments disclosed above are estimated total interest payments of $1,732 as of February 3, 2018, payable over the remaining life of the debt.
The operating lease obligations in the table above do not include payments for operating expenses that are required by most of our lease agreements. Such expenses, which include common area charges, real estate taxes and other executory costs, totaled $121 in 2017, $112 in 2016 and $97 in 2015. In addition, some of our leases require additional rental payments based on a percentage of our sales, referred to as “percentage rent.” Percentage rent, which is also excluded from the obligations in the table above, was $11 in 2017, $12 in 2016 and $13 in 2015.
Purchase obligations primarily consist of purchase orders for unreceived goods or services and capital expenditure commitments. Capital expenditure commitments include our Nordstrom Men’s Store NYC and Nordstrom NYC.
Other long-term liabilities consist of workers’ compensation and other liability insurance reserves and postretirement benefits. The payment amounts presented above were estimated based on historical payment trends. Other long-term liabilities not requiring cash payments, such as deferred property incentives and deferred revenue, were excluded from the table above. Also excluded from the table above are unrecognized tax benefits of $34, as we are unable to reasonably estimate the timing of future cash payments, if any, for these liabilities.
Off-Balance Sheet Arrangements
In October 2015, we completed the sale of a substantial majority of our U.S. Visa and private label credit card portfolio to TD. In November 2017, we sold the remaining balances which consisted of employee credit card receivables for the U.S. Visa and Nordstrom private label credit cards to TD (see Note 2: Credit Card Receivable Transaction in Item 8). Pursuant to the program agreement with TD, we offer and administer our Nordstrom Rewards loyalty program and perform other account servicing functions. Credit card receivables serviced under this contract are $3,098 as of February 3, 2018.
Other than items noted in the paragraph above, in addition to operating leases entered into in the normal course of business and the development of our Nordstrom Men’s Store NYC and Nordstrom NYC, we had no material off-balance sheet arrangements during 2017.
CRITICAL ACCOUNTING ESTIMATES
The preparation of our financial statements in conformity with GAAP requires that we make estimates, judgments and judgmentsassumptions that affect the reported amounts of assets, liabilities, revenues and expenses and disclosure of contingent assets and liabilities. We base ourliabilities during the reporting period. Uncertainties regarding such estimates on historical experience and other assumptions that we believe to be reasonable underare inherent in the circumstances.preparation of financial statements. Actual results may differ from these estimates.estimates and assumptions. The following discussion highlights the estimates we believe are critical and should be read in conjunction with the Notes to Consolidated Financial Statements in Item 8. Our management has discussed the development and selection of these critical accounting estimates with the Audit and Finance Committee of our Board of Directors, and the Audit and Finance Committee has reviewed our disclosures that follow.
Revenue RecognitionSales Return Reserve
We recognize sales revenue net of estimated returns and excluding sales taxes. Revenue from sales to customers shipped directly from our stores and fulfillment centers, which includes shipping revenue when applicable, is recognized upon estimated receipt by the customer. We estimate customer merchandise returns based on historical return patterns and reduce sales and cost of sales accordingly.
Although we believe we have sufficientby an estimate of future customer merchandise returns, which is calculated based on historical and expected return patterns, and record a sales return reserve and an estimated returns asset. We record the impact of the sales return reserve separately in both our Nordstrom and Nordstrom Rack banners. The majority of our returns from both digital and physical sales come through our stores. Estimating future returns requires substantial judgment based on current and historical knowledge to record reasonable estimates of sales returns,trends and actual returns could differmay vary from recorded amounts. In the past three years, there were no significant changes in customer return behavior and we have made no material changes to our estimates included in the calculations of our sales return reserve.estimates. A 10% change in the sales return reserve, net of the estimated returns asset, would have had a $10 impact on our net earningsEBIT by approximately $20 for the year ended February 3, 2018.2024.
The Nordy Club Loyalty Program and Gift Cards
We record breakage revenue for The Nordy Club, including unused points and unredeemed Nordstrom Notes, and gift cards based on historical and expected redemption trends. We have experienced a decrease in redemption rates, leading to increased breakage rates for The Nordy Club. A one percentage point change in our gift card breakage rate would impact our EBIT by approximately $43 for the year ended February 3, 2024.
Merchandise Inventories
Merchandise inventories are generally stated at the lower of cost or market value using the retail inventory method. Under the retail method, the valuation of inventories is determined by applying a calculated cost-to-retail ratio to the retail value of ending inventory. The value of our inventory on Inherent in the balance sheet is then reduced by a charge to cost of sales for retail inventory markdowns taken onmethod are certain management judgments that may affect the selling floor. ending inventory valuation, as well as gross profit. To determine if the retail value of our inventory should be marked down, we consider current and anticipated demand, customer preferences, age of the merchandise and fashion trends. Inherent in the retailWe record reserves for excess and obsolete inventory method are certain management judgments that may affect the ending inventory valuation as well as gross profit.
We reserve for obsolescence based on historical trends and specific identification. Our obsolescence reserve contains uncertainties as
We take physical inventory counts at our stores and Supply Chain Network locations and adjust for differences between recorded amounts and counted amounts. Following each physical inventory cycle and using the calculations require management to make assumptionsmost recent physical inventory count and to apply judgment regarding a number of factors, including market conditions, the selling environment, historical results, and current inventory trends.
We do not believe that the assumptions used in these estimates will change significantlywe record an estimate for shrink based on prior experience. Ina percentage of sales until the past three years, we have made no material changes to our estimates included in the calculations of the obsolescence reserve. A 10% change in the obsolescence reserve would have had a $1 impact on our net earnings for the year ended February 3, 2018.
Goodwill
We review our goodwill annually for impairment or when circumstances indicate that the carrying value may exceed the fair value. We perform this evaluation at the reporting unit level, comprised of the principal business units within our Retail segment, through the application of a two-step fair value test. The first step compares the carrying value of the reporting unit to its estimated fair value, which is based on the expected present value of future cash flows (income approach), comparable public companies and acquisitions (market approach) or a combination of both. If fair value is lower than the carrying value, then a second step is performed to quantify the amount of the impairment.
As part of our impairment testing, we utilize certain assumptions and apply judgment regarding a number of factors. Significant estimates in the market approach include identifying similar companies and acquisitions with comparable business factors such as size, growth, profitability, risk and return of investment, and assessing comparable earnings or revenue multiples in estimating the fair value of the reporting unit. Assumptions in the income approach include future cash flows for the business, future growth rates and discount rates. Estimates of cash flows may differ from actual cash flows due to, among other things, economic conditions, changes to the business model or changes in operating performance. For Nordstrom.com, Jeffrey and HauteLook, the fair values substantially exceeded carrying values and therefore we had no material goodwill impairment in 2017, 2016 or 2015. A 10% change in the fair value of any of these reporting units would not have had an impact on our net earnings for the year ended February 3, 2018.
There were no goodwill impairment charges related to Trunk Club in 2017 or 2015. In 2016, we recognized a goodwill impairment charge of $197 resulting from changes to the long-term operating plan that reflected lower expectations for growth and profitability than previous expectations(see Note 1: Nature of Operations and Summary of Significant Accounting Policies and Note 8: Fair Value Measurements in Item 8).next physical inventory count.
Impairment of Long-Lived Assets
When facts and circumstances indicate that the carrying values of long-lived assets, including buildings, equipment and amortizable intangibleROU assets may be impaired, we perform an evaluation of recoverability by comparingcompare the carrying values ofvalue to the net assets to their related projected undiscounted future cash flows, in addition toamong other quantitative and qualitative analyses.
Land, property and equipment are grouped at the lowest level at which there are identifiable cash flows when assessing impairment. Cash flows for our retail store assets are identified at the individual store level, while our intangible assets associated with HauteLook and Trunk Club are identified at their respective reporting unit levels. The assets recorded in connection with the credit card receivable transaction are individually evaluated against the anticipated cash flows under the program agreement (see Note 2: Credit Card Receivable Transaction in Item 8).
Our estimates are subject to uncertainties and may be impacted by various externalflow analysis requires judgment regarding many factors, such as economic conditionsrevenues, growth rates, expenses, capital expenditures and market competition.sublease income.
These projections are inherently subject to uncertainties. While we believe the inputs and assumptions utilized in our analyses of future cash flows are reasonable, events or circumstancesour estimates may change which could cause us to revise these estimates.
Stock-Based Compensation Expense
We grant stock-based awards under our 2010 Equity Incentive Plan (“2010 Plan”), 2002 Nonemployee Director Stock Incentive Plan (“2002 Plan”) and Trunk Club Value Creation Plan (“VCP”), and employees may purchase our stock at a discount under our Employee Stock Purchase Plan (“ESPP”). We predominantly recognize stock-based compensation expense related to stock-based awards at their estimated grant date fair value, recorded on a straight-line basis overin the requisite service period. Compensation expense for certain award holders is accelerated based upon age and years of service. The total compensation expense is reduced by actual forfeitures as they occur over the vesting period of the awards.
Nordstrom, Inc. and subsidiaries33
We estimate the grant date fair value of stock options using the Binomial Lattice option valuation model. Stock-based compensation expense related to the VCP isnear term based on the grant date fair value of the payout scenario we believe is probable using the Black-Scholes valuation modelour current and is recognized on an accelerated basis due to performance criteria and graded vesting features of the plan. The fair value of restricted stock is determined based on the number of shares granted and the quoted price of our common stock on the date of grant, less the estimated present value of dividends over the vesting period. Performance share units granted prior to 2016 are classified as liabilities and revalued using the quoted price of our common stock as of each reporting date. Performance share units granted in 2016 and beyond are classified as equity and the fair value is determined using the Monte-Carlo valuation model.
Calculating the grant date fair value of stock-based awards is based on certain assumptions and requires judgment, including estimating stock price volatility, forfeiture rates, expected life and performance criteria. A 10% change in stock-based compensation expense would have had a $4 impact on our net earnings for the year ended February 3, 2018.future performance.
Income Taxes
We usepay income taxes based on the assettax statutes, regulations and liability methodcase law of accounting forthe various jurisdictions in which we operate. Our income taxes. Using this method,tax expense and deferred tax assets and liabilities reflect our best estimate of current and future taxes to be paid. Income tax expense may be affected by numerous items, such as changes in tax law, changes in business operations, the results of tax audits and changes to our forecasts of income and loss due to economic and other conditions. Significant judgments and estimates are recorded based onrequired in determining consolidated income tax expense.
Deferred tax assets and liabilities arise from differences between the financial reporting and tax basis of assets and liabilities and for operating loss and tax credit carryforwards. The deferred tax assets and liabilities are calculated using the enacted tax rates and laws that are expected to be in effect when the differences are expected to reverse. We routinely evaluateIn evaluating the likelihood of realizing the benefit of our deferred tax assets, and may record a valuation allowance if, based onwe consider all available evidence, it is determined that some portionincluding historical results and projected future taxable income. The assumptions about future taxable income require the use of significant judgment and are consistent with the tax benefit will not be realized.plans and estimates we are using to manage the underlying business.
We regularly evaluate the likelihood
The benefits of uncertain tax positions we have takenare recorded in various federal, state and foreign filings by considering all relevant facts, circumstances and information available. If we believeour financial statements only after determining it is more likely than not the uncertain tax positions would sustain challenge by taxing authorities. We are periodically audited by federal, state and foreign tax authorities related to our tax filing positions and allocation of income among various tax jurisdictions. Although we believe our liabilities for uncertain tax positions are reasonable, because of the complexity of some of these uncertainties, the ultimate resolution may result in an outcome that is materially different from our positioncurrent estimated liability. Furthermore, we are unable to reasonably estimate the timing of related future cash payments. Any differences will be sustained,reflected as increases or decreases to income tax expense in the period of resolution.
Canada Wind-down
To assess the estimated fair value of our Nordstrom Canada investment and our related-party receivables, we recognizeestimated the assets available for distribution in relation to expected claims. At the time of filing for CCAA protection on March 2, 2023, the estimated amount of Nordstrom Canada’s liabilities exceeded the estimated fair value of assets available for distribution to creditors, and we believed we would not recover a benefit at the largest amount that we believe is cumulatively greater than 50% likely to be realized. Our unrecognized tax benefitsignificant portion of our receivables. As a result, our fair value was $31recorded as zero in our Condensed Consolidated Balance Sheets as of April 29, 2023. As of February 3, 2018, and $322024, we adjusted our receivables by an immaterial amount based on currently available information.
As of February 3, 2024, we recorded the amount we believe probable of receipt as part of January 28, 2017. Interest and penaltiesthe claims process. This includes receipts related to income tax matters are classified as a componentthe rights to the former landlords’ distributions, reimbursement of income tax expense.
Income taxes require significant management judgment regarding applicable statutesemployee trust contributions and their related interpretation,other receivables existing at the statustime of various income tax auditsdeconsolidation. The receivable and our particular facts and circumstances. Also, as auditsother estimates are completed or statutes of limitations lapse, it may be necessary to record adjustments to our taxes payable, deferred taxes, tax reserves or income tax expense. Such adjustments did not materially impact our effective income tax rate in 2017 or 2016.
In December 2017,dependent on the Tax Act was signed into law. As we complete our analysisoutcome of the Tax ActNordstrom Canada wind-down process, including the amount of third-party and interpret any additional guidance issuedNordstrom claims asserted and recognized in the claims process, the amount of assets available for distribution and the approval of the CCAA plan of arrangement by the U.S. Treasury Department,Ontario Superior Court of Justice, which we expect to have updated information on in the IRSfirst quarter of 2024. We continue to work through the wind-down process and other standard-setting bodies, weour estimates of net losses are based on currently available information, our assessment of the validity of certain expected claims and our assessment of the recoverability of amounts receivable from Nordstrom Canada. These estimates may make adjustments to the provisional amounts, whichchange as new information becomes available and it is reasonably possible that they may materially impactchange from the estimated amounts. Increases in estimated costs to settle claims and decreases in estimated assets available for distribution may result in additional material charges. At the same time, any future decreases in estimated costs to settle claims or increases in estimated assets available for distribution may result in a gain, which would reduce our provision for income taxes in the period in which the adjustments are recorded (seeestimated charges.
See Note 13: Income Taxes2: Canada Wind-down in Item 8 for additional information).information.
RECENT ACCOUNTING PRONOUNCEMENTS
See Note 1: NatureIn March 2024, the SEC adopted the final rule under SEC Release No. 33-11275, The Enhancement and Standardization of Operations and Summary of Significant Accounting Policies in Item 8Climate-Related Disclosures for Investors, which requires new disclosures regarding information about a discussion of recent accounting pronouncements and the impact these standardsregistrant’s climate-related risks that have materially impacted, or are anticipatedreasonably likely to have a material impact on, ourits business strategy, results of operations, liquidity or capital resources.
financial condition. In addition, certain disclosures related to severe weather events and other natural conditions will also be required in a registrant’s audited financial statements. Annual disclosure requirements will be effective for us in the fourth quarter of 2025. We are currently evaluating the impact of this final rule on our disclosures.
34Nordstrom, Inc. and subsidiaries41
Item 7A. Quantitative and Qualitative Disclosures About Market Risk.
(Dollars in millionsmillions)
INTEREST RATE RISK
For our long-term debt of $2,737,$2,862, our exposure to interest rate risk is primarily limited to changes in fair value. As our debt is primarily fixed-rate, changes in interest rates do not significantlymaterially impact our cash flows. However, changes in interest rates increase or decrease the fair value of our debt, depending on whether market rates are lower or higher than our fixed rates. As of February 3, 2018,2024, the fair value of our long-term debt was $2,827. See$2,441 (see Note 7:6: Debt and Credit Facilities and Note 8:7: Fair Value Measurements in Item 8 for additional information.8).
We are exposed to interest rate risk primarily from changes in short-term interest rates. Interest rate fluctuations can affect our interest income and interest expense. As of February 3, 2018,2024, we had cash and cash equivalents of $1,181$628, which generate interest income at variable rates.rates and no borrowings outstanding under our Revolver, for which we pay interest at a variable rate.
FOREIGN CURRENCY EXCHANGE RISK
The majority of our revenues, expenses and capital expenditures are transacted in U.S. Dollars. Our U.S. operationoperations periodically entersenter into merchandise purchase orders denominated in British Pounds or Euros. From time to time, we may use forward contracts to hedge against fluctuations in foreign currency prices. As of February 3, 2018,2024, our outstanding forward contracts did not have a material impact on our Consolidated Financial Statements.
We have six full-line stores in Canada and have announced plans to open the first six Nordstrom Rack stores in Canada in 2018. The functional currencyOn March 2, 2023, as part of our Canadian operation isinitiatives to drive long-term profitable growth and enhance shareholder value, and after careful consideration of all reasonably available options, we announced the Canadian Dollar. We translate assets and liabilities into U.S. Dollars using the exchange rate in effect at the balance sheet date, while we translate revenues and expenses using a weighted-average exchange ratedecision to discontinue support for the period. We record these translation adjustments as a component of accumulated other comprehensive loss on the Consolidated Balance SheetsNordstrom Canada’s operations. See Note 2: Canada Wind-down in Item 8. Our Canadian operation enters into merchandise purchase orders denominated in U.S. Dollars8 for approximately one fourth of its inventory. As sales in Canada are denominated in the Canadian Dollar, gross profit for our Canadian operation can be impacted by foreign currency fluctuations.more information.
In addition, our U.S. operation incurs certain expenditures denominated in Canadian Dollars and our Canadian operation incurs certain expenditures denominated in U.S. Dollars. This activity results in transaction gains and losses that arise from exchange rate fluctuations, which are recorded as gains or losses in the Consolidated Statements of Earnings in Item 8. As of February 3, 2018,2024, activities associated with foreign currency exchange risk have not had a material impact on our Consolidated Financial Statements.Statements (see Note 1: Nature of Operations and Summary of Significant Accounting Policies in Item 8).
There have been no material changes in our primary risk exposures or management of market risks since the prior year.
Nordstrom, Inc. and subsidiaries3542
Item 8: Financial Statements and Supplementary Data.
| | | | | |
| Report of Independent Registered Public Accounting Firm | |
| Consolidated Statements of Earnings | |
| Consolidated Statements of Comprehensive Earnings | |
| Consolidated Balance Sheets | |
| Consolidated Statements of Shareholders’ Equity | |
| Consolidated Statements of Cash Flows | |
| Notes to Consolidated Financial Statements | |
| Note 1: Nature of Operations and Summary of Significant Accounting Policies | |
| Note 2: Canada Wind-down | |
| Note 3: Revenue | |
| Note 4: Land, Property and Equipment | |
| Note 5: Leases | |
| Note 6: Debt and Credit Facilities | |
| Note 7: Fair Value Measurements | |
| Note 8: Self-Insurance | |
| Note 9: Supplemental Executive Retirement Plan | |
| Note 10: Stock-based Compensation | |
| Note 11: Shareholders’ Equity | |
| Note 12: Income Taxes | |
| Note 13: Commitments and Contingencies | |
| Note 14: Earnings Per Share | |
| Note 15: Segment Reporting | |
| |
| |
Nordstrom, Inc. and subsidiaries43
REPORT OF INDEPENDENT REGISTERED PUBLIC ACCOUNTING FIRM
To the Board of Directors and Shareholders of Nordstrom, Inc.
Opinion on the Financial Statements
We have audited the accompanying consolidated balance sheets of Nordstrom, Inc. and subsidiaries (the “Company”) as of February 3, 20182024 and January 28, 2017,2023 and the related consolidated statements of earnings, comprehensive earnings, shareholders’ equity, and cash flows, for each of the three years in the period ended February 3, 2018,2024, and the related notes (collectively referred to as the “financial statements”). In our opinion, the financial statements present fairly, in all material respects, the financial position of the Company as of February 3, 20182024, and January 28, 2017,2023, and the results of its operations and its cash flows for each of the three years in the period ended February 3, 2018,2024, in conformity with accounting principles generally accepted in the United States of America.
We have also audited, in accordance with the standards of the Public Company Accounting Oversight Board (United States) (PCAOB), the Company’s internal control over financial reporting as of February 3, 2018,2024, based on the criteria established in Internal Control-IntegratedControl—Integrated Framework (2013) issued by the Committee of Sponsoring Organizations of the Treadway Commission, and our report dated March 19, 2018,2024, expressed an unqualified opinion on the Company’s internal control over financial reporting.
Basis for Opinion
These financial statements are the responsibility of the Company’sCompany’s management. Our responsibility is to express an opinion on the Company’s financial statements based on our audits. We are a public accounting firm registered with the PCAOB and are required to be independent with respect to the Company in accordance with the U.S. federal securities laws and the applicable rules and regulations of the Securities and Exchange Commission and the PCAOB.
We conducted our audits in accordance with the standards of the PCAOB. Those standards require that we plan and perform the audit to obtain reasonable assurance about whether the financial statements are free of material misstatement, whether due to error or fraud. Our audits included performing procedures to assess the risks of material misstatement of the financial statements, whether due to error or fraud, and performing procedures that respond to those risks. Such procedures included examining, on a test basis, evidence regarding the amounts and disclosures in the financial statements. Our audits also included evaluating the accounting principles used and significant estimates made by management, as well as evaluating the overall presentation of the financial statements. We believe that our audits provide a reasonable basis for our opinion.
Critical Audit Matter
The critical audit matter communicated below arose from the current-period audit of the financial statements that was communicated or required to be communicated to the Audit and Finance Committee and that (1) relates to accounts or disclosures that are material to the financial statements and (2) involved our especially challenging, subjective, or complex judgments. The communication of critical audit matters does not alter in any way our opinion on the financial statements, taken as a whole, and we are not, by communicating the critical audit matter below, providing a separate opinion on the critical audit matter or on the accounts or disclosures to which it relates.
Merchandise Inventories—Refer to Note 1 to the financial statements
Critical Audit Matter Description
The Company’s merchandise inventories are stated at the lower of cost or market using the retail inventory method (“RIM”). Under the RIM, the valuation of inventories is determined by applying a calculated cost-to-retail ratio to the retail value of ending inventory. The value of the Company’s inventory on the balance sheet is then reduced by a charge to cost of sales for retail inventory markdowns taken on the selling price. To determine if the retail value of its inventory should be marked down, the Company considers many factors, including current and anticipated demand, customer preferences, age of the merchandise and fashion trends. Recorded markdowns represent one of the most significant inputs into the RIM calculation due to their impact on inventory valuation. Accordingly, the Company’s process of recording markdowns is subjective, particularly as it relates to timing of markdowns.
Given the management judgments necessary to identify and record markdowns in a timely manner, performing audit procedures to evaluate the timeliness of markdowns required a high degree of auditor judgment.
How the Critical Audit Matter Was Addressed in the Audit
Our audit procedures related to the timing of markdowns taken, included the following, among others:
•We tested the effectiveness of controls designed to ensure that markdowns are recorded timely.
•We evaluated the reasonableness of the timing of markdowns recorded by performing analytical procedures to compare current period trends to historical trends at varying levels of disaggregation (i.e., total company, operating segment, and business unit level) across multiple fiscal periods, including, but not limited to, metrics such as markdowns relative to sales trends, inventory turnover, and inventory aging.
•We evaluated management’s ability to identify triggering events and accurately forecast markdown activity by:
▪Comparing actual markdowns recorded to management’s historical forecasts
▪Reading information included in Company press releases
▪Reading internal communications to management and the Board of Directors
•We performed a retrospective review of markdowns recorded in periods subsequent to fiscal year-end to assess whether any unusual trends occurred that would indicate untimely markdowns.
/s/ Deloitte & Touche LLP
Seattle, Washington
March 19, 20182024
We have served as the Company’sCompany’s auditor since 1970
1970.
36Nordstrom, Inc. and subsidiaries45
Nordstrom, Inc.
Consolidated Statements of Earnings
(In millions except per share amounts |
| | | | | | | | | | | |
| Fiscal year | 2017 |
|
| 2016 |
|
| 2015 |
|
| Net sales |
| $15,137 |
| |
| $14,498 |
| |
| $14,095 |
|
| Credit card revenues, net | 341 |
| | 259 |
| | 342 |
|
| Total revenues | 15,478 |
| | 14,757 |
| | 14,437 |
|
| Cost of sales and related buying and occupancy costs | (9,890 | ) | | (9,440 | ) | | (9,168 | ) |
| Selling, general and administrative expenses | (4,662 | ) | | (4,315 | ) | | (4,168 | ) |
| Goodwill impairment | — |
| | (197 | ) | | — |
|
| Earnings before interest and income taxes | 926 |
| | 805 |
| | 1,101 |
|
| Interest expense, net | (136 | ) | | (121 | ) | | (125 | ) |
| Earnings before income taxes | 790 |
| | 684 |
|
| 976 |
|
| Income tax expense | (353 | ) | | (330 | ) | | (376 | ) |
| Net earnings |
| $437 |
| |
| $354 |
| |
| $600 |
|
| | | | | | |
| Earnings per share: | | | | | |
| Basic |
| $2.62 |
| |
| $2.05 |
| |
| $3.22 |
|
| Diluted |
| $2.59 |
| |
| $2.02 |
|
|
| $3.15 |
|
| | | | | | |
| Weighted-average shares outstanding: | | | | | |
| Basic | 166.8 |
| | 173.2 |
| | 186.3 |
|
| Diluted | 168.9 |
| | 175.6 |
| | 190.1 |
|
| | | | | | | | | | | |
| Fiscal year | 2023 | 2022 | 2021 |
| Net sales | $14,219 | | $15,092 | | $14,402 | |
| Credit card revenues, net | 474 | | 438 | | 387 | |
| Total revenues | 14,693 | | 15,530 | | 14,789 | |
| Cost of sales and related buying and occupancy costs | (9,303) | | (10,019) | | (9,344) | |
| Selling, general and administrative expenses | (4,855) | | (5,046) | | (4,953) | |
| Canada wind-down costs | (284) | | — | | — | |
| Earnings before interest and income taxes | 251 | | 465 | | 492 | |
| Interest expense, net | (104) | | (128) | | (246) | |
| Earnings before income taxes | 147 | | 337 | | 246 | |
| Income tax expense | (13) | | (92) | | (68) | |
| Net earnings | $134 | | $245 | | $178 | |
| | | |
| Earnings per share: | | | |
| Basic | $0.83 | | $1.53 | | $1.12 | |
| Diluted | $0.82 | | $1.51 | | $1.10 | |
| | | |
| Weighted-average shares outstanding: | | | |
| Basic | 161.8 | | 160.1 | | 159.0 | |
| Diluted | 163.4 | | 162.1 | | 162.5 | |
The accompanying Notes to Consolidated Financial Statements are an integral part of these financial statements.
Nordstrom, Inc.
Consolidated Statements of Comprehensive Earnings
|
| | | | | | | | | | | |
| Fiscal year | 2017 |
| | 2016 |
| | 2015 |
|
| Net earnings |
| $437 |
| |
| $354 |
| |
| $600 |
|
| Postretirement plan adjustments, net of tax of $2, ($1) and ($15) | (6 | ) | | 1 |
| | 24 |
|
| Foreign currency translation adjustment | 20 |
| | 14 |
| | (18 | ) |
| Comprehensive net earnings |
| $451 |
| |
| $369 |
| |
| $606 |
|
| | | | | | | | | | | |
| Fiscal year | 2023 | 2022 | 2021 |
| Net earnings | $134 | | $245 | | $178 | |
| Postretirement plan adjustments, net of tax of ($2), ($12) and ($6) | 5 | | 32 | | 18 | |
| Foreign currency translation adjustment | (4) | | (8) | | 2 | |
| Comprehensive net earnings | $135 | | $269 | | $198 | |
The accompanying Notes to Consolidated Financial Statements are an integral part of these financial statements.
Nordstrom, Inc. and subsidiaries37
Nordstrom, Inc.
Consolidated Balance Sheets
|
| | | | | | | |
| | February 3, 2018 |
| | January 28, 2017 |
|
| Assets | | | |
| Current assets: | | | |
| Cash and cash equivalents |
| $1,181 |
| |
| $1,007 |
|
| Accounts receivable, net | 145 |
| | 199 |
|
| Merchandise inventories | 2,027 |
| | 1,896 |
|
| Prepaid expenses and other | 150 |
| | 140 |
|
| Total current assets | 3,503 |
| | 3,242 |
|
| | | | |
| Land, property and equipment, net | 3,939 |
| | 3,897 |
|
| Goodwill | 238 |
| | 238 |
|
| Other assets | 435 |
| | 481 |
|
| Total assets |
| $8,115 |
| |
| $7,858 |
|
| | | | |
| Liabilities and Shareholders’ Equity | | | |
| Current liabilities: | | | |
| Accounts payable |
| $1,409 |
| |
| $1,340 |
|
| Accrued salaries, wages and related benefits | 578 |
| | 455 |
|
| Other current liabilities | 1,246 |
| | 1,223 |
|
| Current portion of long-term debt | 56 |
| | 11 |
|
| Total current liabilities | 3,289 |
| | 3,029 |
|
| | | | |
| Long-term debt, net | 2,681 |
| | 2,763 |
|
| Deferred property incentives, net | 495 |
| | 521 |
|
| Other liabilities | 673 |
| | 675 |
|
| | | | |
| Commitments and contingencies (Note 10) |
| |
|
| | | | |
| Shareholders’ equity: | | | |
| Common stock, no par value: 1,000 shares authorized; 167.0 and 170.0 shares issued and outstanding | 2,816 |
| | 2,707 |
|
| Accumulated deficit | (1,810 | ) | | (1,794 | ) |
| Accumulated other comprehensive loss | (29 | ) | | (43 | ) |
| Total shareholders’ equity | 977 |
| | 870 |
|
| Total liabilities and shareholders’ equity |
| $8,115 |
| |
| $7,858 |
|
| | | | | | | | |
| February 3, 2024 | January 28, 2023 |
| Assets | | |
| Current assets: | | |
| Cash and cash equivalents | $628 | | $687 | |
| Accounts receivable, net | 334 | | 265 | |
| Merchandise inventories | 1,888 | | 1,941 | |
| Prepaid expenses and other current assets | 286 | | 316 | |
| Total current assets | 3,136 | | 3,209 | |
| | |
| Land, property and equipment, net | 3,177 | | 3,351 | |
| Operating lease right-of-use assets | 1,359 | | 1,470 | |
| Goodwill | 249 | | 249 | |
| Other assets | 523 | | 466 | |
| Total assets | $8,444 | | $8,745 | |
| | |
| Liabilities and Shareholders’ Equity | | |
| Current liabilities: | | |
| Accounts payable | $1,236 | | $1,238 | |
| Accrued salaries, wages and related benefits | 244 | | 291 | |
| Current portion of operating lease liabilities | 240 | | 258 | |
| Other current liabilities | 1,102 | | 1,203 | |
| Current portion of long-term debt | 250 | | — | |
| Total current liabilities | 3,072 | | 2,990 | |
| | |
| Long-term debt, net | 2,612 | | 2,856 | |
| | |
| Non-current operating lease liabilities | 1,377 | | 1,526 | |
| Other liabilities | 535 | | 634 | |
| | |
| Commitments and contingencies (Note 13) | | |
| | |
| Shareholders’ equity: | | |
| Common stock, no par value: 1,000 shares authorized; 162.4 and 160.1 shares issued and outstanding | 3,418 | | 3,353 | |
| Accumulated deficit | (2,578) | | (2,588) | |
| Accumulated other comprehensive gain (loss) | 8 | | (26) | |
| Total shareholders’ equity | 848 | | 739 | |
| Total liabilities and shareholders’ equity | $8,444 | | $8,745 | |
The accompanying Notes to Consolidated Financial Statements are an integral part of these financial statements.
Nordstrom, Inc. and subsidiaries47
38
Nordstrom, Inc.
Consolidated Statements of Shareholders’ Equity
(In millions except per share amountsamounts) | | | | | | | | | Retained |
| | Accumulated |
| | |
| | | | | | | Earnings |
| | Other |
| | |
| | | Common Stock | | (Accumulated |
| | Comprehensive |
| | |
| | | Shares |
| | Amount |
| | Deficit) |
| | Loss |
| | Total |
|
| Balance at January 31, 2015 | | 190.1 |
| |
| $2,338 |
| |
| $166 |
| |
| ($64 | ) | |
| $2,440 |
|
| Net earnings | | — |
| | — |
| | 600 |
| | — |
| | 600 |
|
| Other comprehensive earnings | | — |
| | — |
| | — |
| | 6 |
| | 6 |
|
| Dividends ($1.48 per share) | | — |
| | — |
| | (280 | ) | | — |
| | (280 | ) |
| Special dividend related to the sale of credit card receivables ($4.85 per share) | | — |
| | — |
| | (905 | ) | | — |
| | (905 | ) |
| Issuance of common stock for Trunk Club acquisition | | 0.3 |
| | 23 |
| | — |
| | — |
| | 23 |
|
| Fiscal year ended | | Fiscal year ended | February 3, 2024 | January 28, 2023 | January 29, 2022 |
| Common stock | |
| Balance, beginning of year | |
| Balance, beginning of year | |
| Balance, beginning of year | |
| Issuance of common stock under stock compensation plans | | 2.0 |
| | 108 |
| | — |
| | — |
| | 108 |
|
| Stock-based compensation | | 0.2 |
| | 70 |
| | — |
| | — |
| | 70 |
|
| Balance, end of year | |
| | Accumulated deficit | |
| Accumulated deficit | |
| Accumulated deficit | |
| Balance, beginning of year | |
| Balance, beginning of year | |
| Balance, beginning of year | |
| | Net earnings | |
| Net earnings | |
| Net earnings | |
| Dividends | |
| Repurchase of common stock | | (19.1 | ) | | — |
| | (1,191 | ) | | — |
| | (1,191 | ) |
| Balance at January 30, 2016 | | 173.5 |
| | 2,539 |
| | (1,610 | ) | | (58 | ) | | 871 |
|
| Net earnings | | — |
| | — |
| | 354 |
| | — |
| | 354 |
|
| Balance, end of year | |
| | Accumulated other comprehensive gain (loss) | |
| Accumulated other comprehensive gain (loss) | |
| Accumulated other comprehensive gain (loss) | |
| Balance, beginning of year | |
| Balance, beginning of year | |
| Balance, beginning of year | |
| Accumulated translation loss reclassified to earnings | |
| Other comprehensive earnings | | — |
| | — |
| | — |
| | 15 |
| | 15 |
|
| Dividends ($1.48 per share) | | — |
| | — |
| | (256 | ) | | — |
| | (256 | ) |
| Issuance of common stock under stock compensation plans | | 2.1 |
| | 83 |
| | — |
| | — |
| | 83 |
|
| Stock-based compensation | | 0.3 |
| | 85 |
| | — |
| | — |
| | 85 |
|
| Repurchase of common stock | | (5.9 | ) | | — |
| | (282 | ) | | — |
| | (282 | ) |
| Balance at January 28, 2017 | | 170.0 |
| | 2,707 |
| | (1,794 | ) | | (43 | ) | | 870 |
|
| Net earnings | | — |
| | — |
| | 437 |
| | — |
| | 437 |
|
| Other comprehensive earnings | | — |
| | — |
| | — |
| | 14 |
| | 14 |
|
| Dividends ($1.48 per share) | | — |
| | — |
| | (247 | ) | | — |
| | (247 | ) |
| Issuance of common stock under stock compensation plans | | 1.1 |
| | 39 |
| | — |
| | — |
| | 39 |
|
| Stock-based compensation | | 0.5 |
| | 70 |
| | — |
| | — |
| | 70 |
|
| Repurchase of common stock | | (4.6 | ) | | — |
| | (206 | ) | | — |
| | (206 | ) |
| Balance at February 3, 2018 | | 167.0 |
| |
| $2,816 |
| |
| ($1,810 | ) | |
| ($29 | ) | |
| $977 |
|
| Balance, end of year | |
| | Total | |
| Total | |
| Total | |
| | Dividends per share | |
| Dividends per share | |
| Dividends per share | |
The accompanying Notes to Consolidated Financial Statements are an integral part of these financial statements.
Nordstrom, Inc. and subsidiaries39
Nordstrom, Inc.
Consolidated Statements of Cash Flows
|
| | | | | | | | | | | |
| Fiscal year | 2017 |
| | 2016 |
| | 2015 |
|
| Operating Activities | | | | | |
| Net earnings |
| $437 |
| |
| $354 |
| |
| $600 |
|
| Adjustments to reconcile net earnings to net cash provided by operating activities: | | | | | |
| Depreciation and amortization expenses | 666 |
| | 645 |
| | 576 |
|
| Goodwill impairment | — |
| | 197 |
| | — |
|
| Amortization of deferred property incentives and other, net | (82 | ) | | (76 | ) | | (64 | ) |
| Deferred income taxes, net | 11 |
| | (15 | ) | | 142 |
|
| Stock-based compensation expense | 77 |
| | 91 |
| | 70 |
|
| Bad debt expense | — |
| | — |
| | 26 |
|
| Change in operating assets and liabilities: | | | | | |
| Accounts receivable | 1 |
| | (3 | ) | | (56 | ) |
| Proceeds from sale of credit card receivables originated at Nordstrom | 39 |
| | — |
| | 1,297 |
|
| Merchandise inventories | (62 | ) | | 31 |
| | (203 | ) |
| Prepaid expenses and other assets | (21 | ) | | 100 |
| | (126 | ) |
| Accounts payable | 77 |
| | 16 |
| | (2 | ) |
| Accrued salaries, wages and related benefits | 121 |
| | 38 |
| | 2 |
|
| Other current liabilities | 48 |
| | 181 |
| | 50 |
|
| Deferred property incentives | 64 |
| | 65 |
| | 156 |
|
| Other liabilities | 24 |
| | 34 |
| | 2 |
|
| Net cash provided by operating activities | 1,400 |
| | 1,658 |
|
| 2,470 |
|
| | | | | | |
| Investing Activities | | | | | |
| Capital expenditures | (731 | ) | | (846 | ) | | (1,082 | ) |
| Change in credit card receivables originated at third parties | — |
| | — |
| | 34 |
|
| Proceeds from sale of credit card receivables originated at third parties | 16 |
|
| — |
| | 890 |
|
| Other, net | 31 |
| | 55 |
| | 14 |
|
| Net cash used in investing activities | (684 | ) | | (791 | ) | | (144 | ) |
| | | | | | |
| Financing Activities | | | | | |
| Proceeds from long-term borrowings, net of discounts | 635 |
| | — |
| | 16 |
|
| Principal payments on long-term borrowings | (661 | ) | | (10 | ) | | (8 | ) |
| Defeasance of long-term debt | — |
| | — |
| | (339 | ) |
| (Decrease) increase in cash book overdrafts | (55 | ) | | 4 |
| | 23 |
|
| Cash dividends paid | (247 | ) | | (256 | ) | | (1,185 | ) |
| Payments for repurchase of common stock | (211 | ) | | (277 | ) | | (1,192 | ) |
| Proceeds from issuances under stock compensation plans | 39 |
| | 83 |
| | 94 |
|
| Tax withholding on share-based awards | (7 | ) | | (5 | ) | | (4 | ) |
| Other, net | (35 | ) | | 6 |
| | 37 |
|
| Net cash used in financing activities | (542 | ) | | (455 | ) | | (2,558 | ) |
| | | | | | |
| Net increase (decrease) in cash and cash equivalents | 174 |
| | 412 |
| | (232 | ) |
| Cash and cash equivalents at beginning of year | 1,007 |
| | 595 |
| | 827 |
|
| Cash and cash equivalents at end of year |
| $1,181 |
| |
| $1,007 |
| |
| $595 |
|
| | | | | | |
| Supplemental Cash Flow Information | | | | | |
| Cash paid during the year for: | | | | | |
| Income taxes, net of refunds |
| $363 |
| |
| $112 |
| |
| $383 |
|
| Interest, net of capitalized interest | 143 |
| | 134 |
| | 136 |
|
| | | | | | |
| Non-cash investing and financing activities: | | | | | |
| Beneficial interest asset acquired from the sale of credit card receivables | — |
| | — |
| | 62 |
|
| Issuance of common stock for Trunk Club acquisition | — |
| | — |
| | 23 |
|
| | | | | | | | | | | |
| Fiscal year | 2023 | 2022 | 2021 |
| Operating Activities | | | |
| Net earnings | $134 | | $245 | | $178 | |
| Adjustments to reconcile net earnings to net cash provided by operating activities: | | | |
| Depreciation and amortization expenses | 586 | | 604 | | 615 | |
| Canada wind-down costs | 207 | | — | | — | |
| Asset impairment | 30 | | 80 | | — | |
| Right-of-use asset amortization | 184 | | 185 | | 175 | |
| Deferred income taxes, net | (60) | | (83) | | (11) | |
| Stock-based compensation expense | 52 | | 59 | | 79 | |
| Other, net | (71) | | (46) | | 81 | |
| Change in operating assets and liabilities: | | | |
| Merchandise inventories | (61) | | 265 | | (383) | |
| Other current and noncurrent assets | (39) | | (1) | | 532 | |
| Accounts payable | 40 | | (190) | | (400) | |
| Accrued salaries, wages and related benefits | (42) | | (94) | | 31 | |
| | | |
| Lease liabilities | (272) | | (269) | | (284) | |
| Other current and noncurrent liabilities | (67) | | 191 | | 92 | |
| Net cash provided by operating activities | 621 | | 946 | | 705 | |
| | | |
| Investing Activities | | | |
| Capital expenditures | (569) | | (473) | | (506) | |
| | | |
| Decrease in cash and cash equivalents resulting from Canada deconsolidation | (33) | | — | | — | |
| Proceeds from the sale of assets and other, net | 31 | | 80 | | (15) | |
| Net cash used in investing activities | (571) | | (393) | | (521) | |
| | | |
| Financing Activities | | | |
| Proceeds from revolving line of credit | — | | 100 | | 400 | |
| Payments on revolving line of credit | — | | (100) | | (400) | |
| Proceeds from long-term borrowings | — | | — | | 675 | |
| Principal payments on long-term borrowings | — | | — | | (1,100) | |
| | | |
| Change in cash book overdrafts | 2 | | (14) | | (32) | |
| Cash dividends paid | (123) | | (119) | | — | |
| Payments for repurchase of common stock | (1) | | (62) | | — | |
| Proceeds from issuances under stock compensation plans | 20 | | 29 | | 14 | |
| Other, net | (7) | | (20) | | (101) | |
| Net cash used in financing activities | (109) | | (186) | | (544) | |
| | | |
| Effect of exchange rate changes on cash and cash equivalents | — | | (2) | | 1 | |
| Net (decrease) increase in cash and cash equivalents | (59) | | 365 | | (359) | |
| Cash and cash equivalents at beginning of year | 687 | | 322 | | 681 | |
| Cash and cash equivalents at end of year | $628 | | $687 | | $322 | |
| | | |
| Supplemental Cash Flow Information | | | |
| Income taxes paid, net of refunds received | $53 | | $211 | | ($485) | |
| Interest paid, net of capitalized interest | 143 | | 136 | | 164 | |
The accompanying Notes to Consolidated Financial Statements are an integral part of these financial statements.
Nordstrom, Inc. and subsidiaries49
40
Nordstrom, Inc.
Notes to Consolidated Financial Statements
(Dollar and share amounts in millions except per share, per option and per unit amountsamounts)
NOTE 1: NATURE OF OPERATIONS AND SUMMARY OF SIGNIFICANT ACCOUNTING POLICIES
The Company
Founded in 1901 as a retail shoe business in Seattle, Washington, Nordstrom, Inc.our Company is now a leading fashion retailer that offers customers a well-editedan extensive selection of high-quality fashion brands focused on apparel, shoes, cosmeticsbrand-name and accessoriesprivate-label merchandise for women, men, young adults and children.children, with a focus on apparel, shoes, beauty, accessories and home goods. This breadth of merchandise allows us to serve a wide range of customers who appreciate quality fashion and a superior shopping experience. We offer an extensive selection of high-quality brand-nameexperience, across our digital and private label merchandise through multiple retail channels, including 117physical assets and in both our Nordstrom U.S. full-line stores, including Nordstrom Local and Nordstrom.com, six Canada full-line stores, 232 off-price Nordstrom Rack stores, Nordstromrack.com/HauteLook, seven Trunk Club clubhousesbanners. Our facilities and TrunkClub.com, two Jeffrey boutiques and two Last Chance clearance stores. Our stores are located in 40 states throughout the U.S and in three provinces in Canada.
Through our Credit segment, our customers can access a variety of payment products and services, including a selection of Nordstrom-branded Visa® credit cards in the U.S.
As of February 3, 2024, Nordstrom includes:
•93 Nordstrom stores
•Nordstrom.com website and Canada, as well as a Nordstrom-branded private label credit cardmobile application
•six Nordstrom Locals
As of February 3, 2024, Nordstrom Rack includes:
•258 Nordstrom Rack stores
•NordstromRack.com website and a debit card for Nordstrom purchases. When customers use a Nordstrom-branded credit or debit card, they also participate in our loyalty program that provides benefits based on their level of spending. Although the primary purposes of our Credit segment are to foster greater customer loyalty and drive more sales, we also receive credit card revenue through our program agreement with TD Bank, N.A. (“TD”) (see Note 2: Credit Card Receivable Transaction).mobile application
•two Last Chance clearance stores
Fiscal Year
We operate on a 52/53-week fiscal year ending on the Saturday closest to January 31st. References to 20172023 relate to the 53-week fiscal year endedending February 3, 2018.2024. References to any other years included within this document are based on a 52-week fiscal year.
Principles of Consolidation
The Consolidated Financial Statements include the balances of Nordstrom, Inc. and its subsidiaries.subsidiaries and are presented in U.S. dollars. All intercompany transactions and balances are eliminated in consolidation.
On March 2, 2023, Nordstrom Canada commenced a wind-down of its business operations (see Note 2: Canada Wind-down) and as of this date, Nordstrom Canada was deconsolidated from Nordstrom, Inc.’s financial statements. Nordstrom Canada results prior to March 2, 2023 are included in the Company’s Consolidated Financial Statements.
Use of Estimates
The preparation of financial statements in conformity with accounting principles generally accepted in the U.S.GAAP requires management tothat we make estimates, judgments and assumptions that affect the reported amounts of assets, liabilities, revenues and expenses and disclosure of contingent assets and liabilities during the reporting period. Uncertainties regarding such estimates and assumptions are inherent in the preparation of financial statements and actualstatements. Actual results may differ from these estimates and assumptions. Our most significant accounting judgments and estimates include revenue recognition, inventory valuation, long-lived assets, goodwill, stock-based compensationasset recoverability, income taxes and income taxes.contingent liabilities, including assumptions related to our Canada wind-down, all of which involve assumptions about future events.
Revenue
Net Sales
We recognize sales revenue net of estimated returns and excluding sales taxes. Revenue from sales shipped to customers shippedfrom our Supply Chain Network facilities, stores and directly from our stores and fulfillment centers,vendors, which includes shipping revenue when applicable, is recognized upon estimated receipt byat shipping point, the point in time where control has transferred to the customer. Costs to ship orders to customers are expensed as a fulfillment activity at shipping point, commissions from sales at our Nordstrom stores are expensed at the point of sale and both are recorded in SG&A expenses.
Nordstrom, Inc.
Notes to Consolidated Financial Statements
(Dollar and share amounts in millions except per share, per option and per unit amounts)
We estimate customer merchandise returns based on historical return patterns and reduce sales and cost of sales accordingly. Activityby an estimate of future customer merchandise returns, which is calculated based on historical and expected return patterns, and record a sales return reserve and an estimated returns asset. Our sales return reserve is classified in other current liabilities and our estimated returns asset, calculated based on the cost of merchandise sold, is classified in prepaid expenses and other on the Consolidated Balance Sheets. As of February 3, 2024 and January 28, 2023, our sales return reserve was $377 and $415, and our estimated returns asset was $164 and $179. Due to the seasonality of our business, these balances typically increase when higher sales occur in the allowance for sales returns, net, forlast month of a period, such as during the past three fiscal years is as follows: |
| | | | | | | | | | | |
| Fiscal year | 2017 |
| | 2016 |
| | 2015 |
|
| Allowance at beginning of year |
| $187 |
| |
| $170 |
| |
| $160 |
|
| Charged to costs and expenses | 3,307 |
| | 3,023 |
| | 2,720 |
|
Deductions1 | (3,310 | ) | | (3,006 | ) | | (2,710 | ) |
| Allowance at end of year |
| $184 |
| |
| $187 |
| |
| $170 |
|
1 Deductions consist of actual returns, netAnniversary Sale, which usually occurs at the end of the valuesecond quarter, and decrease in the following period. We record the impact of the merchandise returnedsales return reserve separately in both our Nordstrom and Nordstrom Rack banners. The majority of our returns from both digital and physical sales come through our stores.
Loyalty Program
The Nordy Club is our customer loyalty program that incorporates a traditional point and benefit system, while providing customers exclusive access to products and events, enhanced services, personalized experiences and more convenient ways to shop. Customers accumulate points based on their level of spending and type of participation. Upon reaching certain point thresholds, customers receive Nordstrom Notes, which can be redeemed for goods or services across Nordstrom and Nordstrom Rack. The Nordy Club benefits vary based on the level of customer spend, and include bonus points days and shopping and fashion events.
We offer customers access to a variety of payment products and services, including a selection of Nordstrom-branded Visa® credit cards, as well as a Nordstrom-branded private-label credit card for Nordstrom purchases. When customers use a Nordstrom-branded credit or debit card, they also participate in The Nordy Club and receive additional benefits, which can vary depending on the level of spend, including early access to the Anniversary Sale, enhanced alterations and stylist benefits and incremental accumulation of points toward Nordstrom Notes.
As our customers earn points and Nordstrom Notes in The Nordy Club, a portion of underlying sales revenue is deferred based on an estimated stand-alone selling price of points, Nordstrom Notes and other loyalty benefits, such as alterations. We recognize the revenue and related cost of sale when the Nordstrom Notes are ultimately redeemed and reduce our contract liability. We include the deferred revenue in other current liabilities on the Consolidated Balance Sheets. We record breakage revenue of unused points and unredeemed Nordstrom Notes based on expected customer redemption. We estimate, based on historical and expected usage, that approximately 8% of Nordstrom Notes and points will be unredeemed. Estimating future breakage rates requires judgment based on current and historical trends, and actual breakage rates may vary from our estimates. Other benefits of the loyalty program, including shopping and fashion events, are recorded in SG&A expenses as these are not a material right of the program.
As of both February 3, 2024 and January 28, 2023, our outstanding performance obligation for The Nordy Club, which consists primarily of unredeemed points and Nordstrom Notes at retail value, was $115. Almost all Nordstrom Notes redemptions occur within eleven months of issuance.
Gift Cards
We record deferred revenue from the sale of gift cards at the time of purchase. As gift cards are redeemed, we recognize revenue and reduce our contract liability. Although our gift cards do not have an expiration date, we include this deferred revenue in other current liabilities on the Consolidated Balance Sheets as customers can redeem gift cards at any sales commission.time. We record breakage revenue on unused gift cards based on expected customer redemption. We estimate, based on historical usage, that 4% of gift cards will be unredeemed and recognized as revenue. Estimating future breakage rates requires judgment based on current and historical trends and actual breakage rates may vary from our estimates. Breakage income was $52, $40 and $39 in 2023, 2022 and 2021.
As of February 3, 2024 and January 28, 2023, our outstanding performance obligation for unredeemed gift cards was $343 and $370. Almost all gift card redemptions occur within two years of issuance.
Credit Card Revenues, net
In October 2015,Although the primary purpose of offering our credit cards is to foster greater customer loyalty and drive more sales, we completed the sale of a substantial majority of our U.S. Visa and private labelalso receive credit card portfolio torevenue through our program agreement with TD. In November 2017, we soldUnder that agreement, which was amended in the remaining balances which consistedfourth quarter of employee credit card receivables for2022 and runs through September 2026, TD is the U.S. Visa and Nordstrom private labelexclusive issuer of Nordstrom-branded consumer credit cards to TD (see Note 2:and we perform account servicing functions for those cards. Credit Card Receivable Transaction). Credit programcard revenues, net include our portion of the ongoing credit card revenue, net of credit losses, from both sold and newly generated credit card receivables pursuant to our program agreement with TD. Asset amortization and In connection with the amendment, we recorded deferred revenue, recognition associated withwhich will be recognized in full over the assets and liabilities recorded as partterm of the transaction are also recordedagreement as we perform account servicing functions. Our outstanding performance obligation for the TD agreement is included in credit program revenues, net.
other current liabilities and other liabilities on our Consolidated Balance Sheets and the amortization is included in other operating, net on the Consolidated Statements of Cash Flows.
Nordstrom, Inc. and subsidiaries4151
Nordstrom, Inc.
Notes to Consolidated Financial Statements
(Dollar and share amounts in millions except per share, per option and per unit amountsamounts)
Cost of Sales
Cost of sales primarily includes the purchase costand manufacturing costs of inventory sold, (netnet of vendor allowances),allowances, and in-bound freight and certain costs of our loyalty program benefits.
Loyalty Program
In 2016, our Nordstrom Rewards loyalty program, which allows customers to accumulate points based on their level of spending, was expanded to enable any customer interested in participating to earn benefits regardless of how they choose to pay. Prior to 2016, our loyalty program was only offered to Nordstrom cardholders. Upon reaching certain point thresholds, customers receive Nordstrom Notes (“Notes”), which can be redeemed for goods or services offered at Nordstrom full-line stores, Nordstrom.com, Nordstrom Rack and Nordstromrack.com/HauteLook. Nordstrom cardholders can also earn rewards at Trunk Club. Customers who participate in our loyalty program through our credit and debit cards receive additional benefits including reimbursements for alterations, Personal Triple Points days, shopping and fashion events and early access to the Anniversary Sale. Nordstrom Rewards loyalty program liabilities of $69 and $62 were included in other current liabilities at the end of 2017 and 2016.
We estimate the net cost of Notes that will be issued and redeemed and record this cost as rewards points are accumulated. These costs, as well as reimbursed alterations, are recorded in cost of sales as we provide customers with products and services for these rewards. Other benefits of our Nordstrom Rewards loyalty program, including shopping and fashion events, are recorded in selling, general and administrative expenses. Total costs related to the Nordstrom Rewards loyalty program were $175, $162 and $164 in 2017, 2016 and 2015.duty expense.
Buying and Occupancy Costs
Buying costs consist primarily of compensation and other costs incurred by our merchandising and product development groups. Occupancy costs include rent, depreciation, property taxes and facility operating costs of our retail, corporate center, fulfillmentstores, office facilities and distribution operations.
Rent
We recognize minimum rent expense, net of developer reimbursements, on a straight-line basis over the minimum lease term from the time that we control the leased property. For scheduled rent escalation clauses during the lease terms, we record minimum rent expense on a straight-line basis over the terms of the leases, with the adjustments accrued as current and noncurrent deferred rent and included in other current liabilities and other liabilities on our Consolidated Balance Sheet for the year ended February 3, 2018. Contingent rental payments, typically based on a percentage of sales, are recognized in rent expense when payment of the contingent rent is probable.
We receive incentives from developers to construct stores in certain developments. At the end of 2017 and 2016, liabilities of $485 and $507 were recorded within deferred property incentives, net on the Consolidated Balance Sheets and were recognized as a reduction of rent expense on a straight-line basis over the lease terms.Supply Chain Network facilities.
Selling, General and Administrative Expenses
Selling, general and administrativeSG&A expenses consist primarily of compensation and benefit costs,benefits, marketing, outbound supply chain and technology costs.
Shipping and priorFulfillment Costs
Our shipping and fulfillment costs include payments to third-party shippers and costs to hold, move and prepare merchandise for shipment. These costs do not include in-bound freight to our credit card receivable transactionsSupply Chain Network facilities, which we include in October 2015the cost of our inventory. Shipping and November 2017, bad debt expense related to our credit card operations.fulfillment costs of $712, $885 and $993 in 2023, 2022 and 2021 were included in SG&A expenses.
Advertising
Advertising production costs for internet, magazines, store events and other media are expensed the first time the advertisement is run. Online marketing costs are expensed when incurred. Total advertising expenses, net of vendor allowances, of $261, $241$313, $309 and $227$300 in 2017, 20162023, 2022 and 20152021 were included in selling, general and administrativeSG&A expenses.
Nordstrom, Inc.
Notes to Consolidated Financial Statements
Dollar and share amounts in millions except per share, per option and per unit amounts
Vendor Allowances
We receive allowances from merchandise vendors for cosmetic expenses, purchase price adjustments, cooperativebeauty expenses, advertising programs and various other expenses. Allowances for cosmetic expenses are recorded in selling, general and administrative expenses as a reduction of the related costs when incurred. Purchase price adjustments are recorded as a reduction of cost of sales at the point they have been earned and the related merchandise has been marked down or sold. Allowances for cooperativebeauty expenses, advertising programs and other expenses are recorded in selling, general and administrativeSG&A expenses as a reduction of the related costs when incurred. Any
Vendor allowances earned are as follows:
| | | | | | | | | | | |
| Fiscal year | 2023 | 2022 | 2021 |
| Purchase price adjustments | $94 | | $120 | | $108 | |
| Beauty expenses | 114 | | 111 | | 103 | |
| Advertising | 87 | | 112 | | 110 | |
| Other | 6 | | 2 | | 3 | |
| Total vendor allowances | $301 | | $345 | | $324 | |
Advertising includes NMN, where vendors pay a fee for use of our first-party data. Funds received from vendors are recorded as a reduction of the campaign cost in excess of actual costs incurred that are included in selling, generalSG&A expenses and administrative expensesmedia fees are recorded as a reduction of cost of sales. Vendor allowances earned
401(k) Plan
We provide a 401(k) plan for our employees that allows for employee elective contributions and our matching contributions. Employee elective contributions are
as follows: |
| | | | | | | | | | | |
| Fiscal year | 2017 |
| | 2016 |
| | 2015 |
|
| Cosmetic expenses |
| $159 |
| |
| $166 |
| |
| $161 |
|
| Purchase price adjustments | 184 |
| | 179 |
| | 178 |
|
| Cooperative advertising | 107 |
| | 114 |
| | 109 |
|
| Other | 7 |
| | 6 |
| | 7 |
|
| Total vendor allowances |
| $457 |
| |
| $465 |
| |
| $455 |
|
Shippingfunded through voluntary payroll deductions. Total expenses related to Company contributions were $71 in 2023 and Handling Costs
Our shipping2022 and handling costs include payments to third-party shippers$67 in 2021, and costs to hold, move and prepare merchandise for shipment. These costs do not include in-bound freight to our distribution centers, which we include in the cost of our inventory. Shipping and handling costs of $523, $453 and $428 in 2017, 2016 and 2015 were included in selling, generalboth buying and administrative expenses.occupancy costs and SG&A expenses on our Consolidated Statements of Earnings.
Nordstrom, Inc.
Notes to Consolidated Financial Statements
(Dollar and share amounts in millions except per share, per option and per unit amounts)
Stock-Based Compensation
The 2019 Plan authorizes the grant of stock options, PSUs, RSUs, stock appreciation rights and both restricted and unrestricted shares of common stock to employees and nonemployee directors. We grant stock-based awards under our 2010 Equity Incentive2019 Plan (“2010 Plan”), 2002 Nonemployee Director Stock Incentive Plan (“2002 Plan”) and Trunk Club Value Creation Plan (“VCP”), and employees may purchase our stock at a discount under our Employee Stock Purchase Plan (“ESPP”).ESPP. We predominantly recognize stock-based compensation expense related to stock-based awards at their estimated grant date fair value, recorded on a straight-line basis over the requisite service period. Compensation expense for certain award holders is accelerated based upon age and years of service. Compensation expense for PSUs is adjusted based on the payout percentage of the PSU grant subject to achieving specific performance measures. The total compensation expense is reduced by actual forfeitures as they occur over the vesting period of the awards.occur.
We primarily estimate the grant date fair value of stock options using the Binomial Lattice optionLattice-based valuation model. Stock-based compensation expense related to the VCP is based onmodel, but for our price-hurdle grants in 2021, we estimate the grant date fair value of the payout scenario we believe is probable using the Black-ScholesMonte Carlo simulation valuation model and is recognized on an accelerated basis due to performance criteria and graded vesting features of the plan.model. The grant date fair value of restricted stockRSUs and PSUs is determined based on the number of sharesRSUs or PSUs granted and the quoted price of our common stock on the date of grant, less the estimated present value of dividends over the vesting period. Performance share unitsPSUs granted prior to 2016 are classified as liabilitiesequity.
Amounts included on the following line items of our Consolidated Statements of Shareholders’ Equity and revalued usingour Consolidated Statements of Cash Flows are as follows:
•Issuance of common stock under stock compensation plans — includes common stock option exercises and purchases of shares under the quoted price ofESPP
•Stock-based compensation — primarily includes stock-based compensation expense for our common stock as of each reporting date. Performance share units granted in 2016options, RSUs and beyond are classified as equityPSUs, partially offset by shares withheld for taxes on RSUs and the fair value is determined using the Monte-Carlo valuation model.PSUs
New Store Opening Costs
Non-capital expenditures associated with opening new stores, including marketing expenses, relocation expenses and occupancy costs, are charged to expense as incurred. These costs are included in both buying and occupancy costs and selling, general and administrativeSG&A expenses, according to their nature as disclosed above.
Gift Cards
We recognize revenue from the sale of gift cards when the gift card is redeemed by the customer, or we recognize breakage income when the likelihood of redemption, based on historical experience, is deemed to be remote. Based on an analysis of our program since its inception in 1999, we determined that balances remaining on cards issued beyond five years are unlikely to be redeemed and therefore are recognized as income. Breakage income was $16, $12 and $11 in 2017, 2016 and 2015. To date, our breakage rate is approximately 2% of the amount initially issued as gift cards. Gift card breakage income is included in selling, general and administrative expenses. We had outstanding gift card liabilities of $425 and $389 at the end of 2017 and 2016, which are included in other current liabilities.
Nordstrom, Inc. and subsidiaries43
Nordstrom, Inc.
Notes to Consolidated Financial Statements
Dollar and share amounts in millions except per share, per option and per unit amounts
Income Taxes
We use the asset and liability method of accounting for income taxes. Using this method, deferred tax assets and liabilities are recorded based on differences between the financial reporting and tax basis of assets and liabilities and for operating loss and tax credit carryforwards. The deferred tax assets and liabilities are calculated using the enacted tax rates and laws that are expected to be in effect when the differences are expected to reverse. We routinely evaluate the likelihood of realizing the benefit of our deferred tax assets and may record a valuation allowance if, based on all available evidence, it is determined that some portion of the tax benefit will not be realized.
We regularly evaluate the likelihood of realizing the benefit for income tax positions we have taken in various federal, state and foreign filings by considering all relevant facts, circumstances and information available. If we believe it is more likely than not that our position will be sustained, we recognize a benefit at the largest amount that we believe is cumulatively greater than 50% likely to be realized. Interest and penalties related to income tax matters are classified as a component of income tax expense.
Income taxes require significant management judgment regarding applicable statutes and their related interpretation, the status of various income tax audits and our particular facts and circumstances. Also, as audits are completed or statutes of limitations lapse, it may be necessary to record adjustments to our taxes payable, deferred taxes, tax reserves or income tax expense.
In December 2017,
Nordstrom, Inc. and subsidiaries53
Nordstrom, Inc.
Notes to Consolidated Financial Statements
(Dollar and share amounts in millions except per share, per option and per unit amounts)
Earnings Per Share
Earnings per basic share is computed using the Tax Cutsweighted-average number of common shares outstanding during the year. Earnings per diluted share uses the weighted-average number of common shares outstanding during the year plus dilutive common stock equivalents, primarily RSUs and Jobs Act (the “Tax Act”) was signed into law. Among numerous other provisions,stock options. Dilutive common stock is calculated using the Tax Act significantly revisestreasury stock method and includes outstanding RSUs and options that would reduce the U.S. federal corporate income tax by reducing the statutory rate from 35% to 21%. Netamount of earnings included $42 related to the Tax Act,for which includes a provisional one-time, non-cash charge of $51 related to the revaluation of our net deferred tax assets for the change in statutory tax rate and for the impacts associated with the future limitations on executive compensation, partially offset by cash tax savings from a lower federal tax rate. As we complete our analysis of the Tax Act and interpret any additional guidance issued by the U.S. Treasury Department, the Internal Revenue Service (“IRS”)each share is entitled. Anti-dilutive shares (including stock options and other standard-setting bodies, we may make adjustments toshares) are excluded from the provisional amounts, which may materiallycalculation of diluted shares and earnings per diluted share because their impact our provision for income taxes in the period in which the adjustments are recorded (see Note 13: Income Taxes).could increase earnings per diluted share.
Comprehensive Net Earnings
Comprehensive net earnings consist of net earnings and other gains and losses affecting equity that are excluded from net earnings. These consist of postretirement plan adjustments, net of related income tax effects, and foreign currency translation adjustments.
Cash Equivalents
Cash equivalents are short-term investments with aan original maturity of three months or less from the date of purchase and are carried at cost, which approximates fair value. At the end of 20172023 and 2016,2022, checks not yet presented for payment drawn in excess of our bank deposit balances were $101 and $156 and$62 and $60. Amounts are included withinin accounts payable on our Consolidated Balance Sheets.Sheets and in change in cash book overdrafts as a financing activity in our Consolidated Statements of Cash Flows.
Accounts Receivable
Accounts receivable, net primarily includes receivables from TD related to our program agreement, non-Nordstrom-branded credit and debit cards and priordeveloper reimbursements. As of February 3, 2024, accounts receivable, net also includes the amount we believe probable of receipt as part of the claims process related to our credit card receivable sale transaction in November 2017, employee credit card receivables.the wind-down of Canada (see Note 2: Canada Wind-down).
Merchandise Inventories
Merchandise inventories are generally stated at the lower of cost or market value using the retail inventory method. Under the retail method, the valuation of inventories is determined by applying a calculated cost-to-retail ratio to the retail value of ending inventory. The value of our inventory on the balance sheet is thenalso reduced by a charge to cost of sales for retail inventory markdowns taken on the selling floor.price. To determine if the retail value of our inventory should be marked down, we consider current and anticipated demand, customer preferences, age of the merchandise and fashion trends. We reserverecord reserves for obsolescenceexcess and obsolete inventory based on historical trends and specific identification.
Physical inventories are takenWe take physical inventory counts at our stores and Supply Chain Network locations and adjust for differences between recorded amounts and counted amounts. Following each physical inventory records are adjusted accordingly. We evaluatecycle and determine our shrinkage rate using the most recent physical inventory count and historical results, as the basiswe record an estimate for the shrinkage reserve following each physical inventory cycle and reporting date. The shrinkage reserve isshrink based on a percentage of sales.sales until the next physical inventory count.
Leases
We record leases, which consist primarily of operating leases, on the Consolidated Balance Sheets as operating lease ROU assets and operating lease liabilities, both of which include current and noncurrent portions. Operating lease liabilities are initially recognized based on the net present value of the fixed portion of our lease and common area maintenance payments from lease commencement through the lease term. To calculate the net present value, we apply an incremental borrowing rate. The incremental borrowing rate is determined using a portfolio approach based on the rate of interest we would pay to borrow an amount equal to the lease payments on a collateralized basis over a similar term. We use quoted interest rates obtained from financial institutions as an input to derive our incremental borrowing rate as the discount rate for the lease. We recognize ROU assets based on operating lease liabilities reduced by property incentives received from landlords. We test ROU assets for impairment in the same manner as long-lived assets and exclude the related operating lease liability and operating lease payments in our analysis.
We lease the land, buildings, or land and buildings for many of our stores, office facilities and Supply Chain Network facilities.
Nordstrom, Inc.
Notes to Consolidated Financial Statements
(Dollar and share amounts in millions except per share, per option and per unit amounts)
Land, Property and Equipment
Land is recorded at historical cost, while property and equipment are recorded at cost less accumulated depreciation and amortization. Capitalized software includes the costs of developing or obtaining internal-use software, including external direct costs of materials and services and internal payroll costs related to the software project.
We capitalize interest on construction in progress and software projects during the period in which expenditures have been made, activities are in progress to prepare the asset for its intended use and actual interest costs are being incurred.
Nordstrom, Inc.
Notes to Consolidated Financial Statements
Dollar and share amounts in millions except per share, per option and per unit amounts
Depreciation and amortization are computed using the straight-line method over the asset’s estimated useful life, which is determined by asset category as follows: | | | | | |
| Asset | |
Asset | Life (in years) |
| Buildings and improvements | 5 – 40 |
| Store fixtures and equipment | 3 – 15 |
| Leasehold improvements | 5 – 40 |
| Capitalized software | 32 – 7 |
Leasehold improvements and leased property and equipment that are purchased at the inception of the lease, or during the lease term, are amortized over the shorter of the lease term or the asset life. Lease terms include the fixed, non-cancellablenon-cancelable term of a lease, plus any renewal periods determined to be reasonably assured.
We receive contributions from vendors forLong-Lived Assets
When facts and circumstances indicate the constructioncarrying values of certain fixturesbuildings, equipment and ROU assets may be impaired, we compare the carrying value to the related projected future cash flows, among other quantitative and qualitative analyses. Cash flow analysis requires judgment regarding many factors, such as revenues, growth rates, expenses, capital expenditures and sublease income. These projections are inherently subject to uncertainties. While we believe the inputs and assumptions utilized in our stores.future cash flows are reasonable, our estimates may change in the near term based on our current and future performance. Land, property and equipment are grouped at the lowest level at which there are identifiable cash flows when assessing impairment, while cash flows for our retail store assets are identified at the individual store level.
The following table provides details related to asset impairment charges for each fiscal year:
| | | | | | | | | | | | | | |
| 2023 | | 2022 |
| Supply Chain | | Supply Chain | Trunk Club |
Long-lived asset impairment1 | $9 | | | $58 | | $10 | |
Operating lease ROU asset impairment1 | 21 | | | 12 | | — | |
| Asset impairment | $30 | | | $70 | | $10 | |
1 After impairment, the carrying values of the remaining long-lived tangible and ROU assets were not material.
Supply Chain Impairments
During the fourth quarter of 2023 and the third quarter of 2022, as part of our supply chain optimization initiatives, we incurred a non-cash impairment charge to adjust the carrying values to their estimated fair values for certain supply chain assets. These contributions offsetcharges are included in our Corporate/Other SG&A expense on the Consolidated Statement of Earnings and in asset impairment on the Consolidated Statement of Cash Flows. We evaluated the assets for impairment by comparing the carrying values to the related capital expenditures.projected future cash flows, among other quantitative and qualitative analyses. After impairment, the carrying values of the remaining long-lived tangible and ROU assets were not material.
Trunk Club Wind-down
During the first quarter of 2022, in conjunction with the decision to sunset the Trunk Club brand, we incurred non-cash impairment charges related to a Trunk Club property to adjust the carrying values to their estimated fair value. These charges are included in our Retail segment SG&A expense on the Consolidated Statement of Earnings and in asset impairment on the Consolidated Statement of Cash Flows.
During the second quarter of 2022, we also incurred additional costs of $8 associated with the wind-down of Trunk Club. These expenses are primarily included in our Retail segment cost of sales and related buying and occupancy costs on the Consolidated Statement of Earnings. All charges are classified as operating on the Consolidated Statement of Cash Flows.
Nordstrom, Inc. and subsidiaries55
Nordstrom, Inc.
Notes to Consolidated Financial Statements
(Dollar and share amounts in millions except per share, per option and per unit amounts)
Goodwill
Goodwill represents the excess of acquisition cost over the fair value of the related net assets acquired and is not subject to amortization. We review our goodwill annually for impairment, as of the first day of the fourth quarter, or when circumstances indicate that the carrying value may exceed the fair value. We perform this evaluation at the reporting unit level, comprisedall in our Retail segment. Our goodwill is allocated to two reporting units, Nordstrom and NordstromRack.com. When evaluating these assets for impairment, we may first perform a qualitative assessment to determine whether it is more likely than not that a reporting unit is impaired. If we determine that it is more likely than not that the carrying value exceeds the fair value of the principal business units within our Retail segment, through the application ofreporting unit, we perform a two-stepquantitative fair value test. The first step comparesWe may also choose to bypass this qualitative assessment and perform the quantitative assessment.
As of February 3, 2024 and January 28, 2023, we had goodwill of $249. To determine fair value, we compare the carrying value of the reporting unit to its estimated fair value, which is based on the expected present value of future cash flows (income approach), comparable public companies and acquisitions (market approach) or a combination of both. Determining fair value using these approaches requires management assumptions, estimations and judgments regarding factors like overall economic conditions, prospective financial information, growth rates, terminal value, discount rates and market multiples. If fair value is lower than the carrying value, then a second stepan impairment charge is performedrecognized in an amount equal to quantifythat excess, limited to the total amount of goodwill allocated to that reporting unit. Based on the impairment. The following summarizesresults of our goodwill activity for the past three fiscal years: |
| | | | | | | | | | | | | | | |
| | Trunk Club |
| | HauteLook |
| | Other1 |
| | Total |
|
| Balance at January 31, 2015 |
| $261 |
| |
| $121 |
| |
| $53 |
| |
| $435 |
|
| Additions | — |
| | — |
| | — |
| | — |
|
| Balance at January 30, 2016 | 261 |
| | 121 |
| | 53 |
| | 435 |
|
| Impairment | (197 | ) | | — |
| | — |
| | (197 | ) |
| Balance at January 28, 2017 | 64 |
| | 121 |
| | 53 |
| | 238 |
|
| Additions | — |
| | — |
| | — |
| | — |
|
| Balance at February 3, 2018 |
| $64 |
| |
| $121 |
| |
| $53 |
| |
| $238 |
|
1 Other includes Nordstrom.comtests, fair value exceeded carrying value, and Jeffrey goodwill.
Thewe therefore had no goodwill impairment chargein 2023, 2022 or 2021.
Investments
From time to time, we invest in financial interests of $197 forcertain private companies and venture capital funds that align with our business and omni-channel strategies, which are recorded in other assets in the year endedConsolidated Balance Sheets and proceeds from the sale of assets and other, net on the Consolidated Statements of Cash Flows.
As of February 3, 2024 and January 28, 2017 related to Trunk Club resulted from changes to2023, we held $41 and $42 of equity interests in certain venture capital funds, which are recorded at fair value using the long-term operating plan that reflected lower expectations for growth and profitability than previous expectations(see Note 8: Fair Value Measurements).practical expedient estimate of NAV or its equivalent.
Long-Lived Assets
When facts and circumstances indicate thatDuring the carrying valuesfirst quarter of long-lived assets, including buildings, equipment and amortizable intangible assets, may be impaired, we perform an evaluation of recoverability by comparing the carrying values of the net assets to their related projected undiscounted future cash flows, in addition to other quantitative and qualitative analyses.
Land, property and equipment are grouped at the lowest level at which there are identifiable cash flows when assessing impairment. Cash flows for our retail store assets are identified at the individual store level, while our intangible assets associated with HauteLook and Trunk Club are identified at their respective reporting unit levels. The assets recorded2022, in connection with the credit card receivable transaction are individually evaluated againstsale of a limited partnership interest in a corporate office building, we recognized a gain of $51 in our Corporate/Other SG&A expense in the anticipated cash flows underConsolidated Statement of Earnings and $73 in proceeds from the program agreement (see Note 2: Credit Card Receivable Transaction).
We did not record any material impairment losses for long-lived tangible or amortizable intangiblesale of assets in 2017 or 2016. In 2015, our cash flow analyses resulted in retail store impairment charges of $24 and other, various impairment lossesnet on the Consolidated Statement of $23. The 2015 retail store impairment of $24 related to our full-line store in Puerto Rico and was primarily driven by a challenging retail market in this territory.
Amortization expense for acquired intangibles was $11, $14 and $16 in 2017, 2016 and 2015. Future amortization expense of acquired intangible assets as of February 3, 2018, are expected to be $7 in 2018 and $7 in 2019.
Nordstrom, Inc. and subsidiaries45
Nordstrom, Inc.
Notes to Consolidated Financial Statements
Dollar and share amounts in millions except per share, per option and per unit amounts
Cash Flows.
Self-Insurance
We retain a portion of the risk for certain losses related to employee health and welfare, workers’ compensation and other liability claims. Liabilities associated with these losses include undiscounted estimates of both losses reported and losses incurred but not yet reported. We estimate our ultimate cost using an actuarially-based analysis of claims experience, regulatory changes and other relevant factors.
Foreign Currency
We have six full-line stores inOn March 2, 2023, Nordstrom Canada and have announced plans to open the first six Nordstrom Rack stores in Canada in 2018.commenced a wind-down of its business operations. The functional currency of our Canadian operation isoperations was the Canadian Dollar. We translatePrior to deconsolidation, we translated assets and liabilities into U.S. Dollars using the exchange rate in effect at the balance sheet date, while we translatetranslated revenues and expenses using a weighted-averagean average exchange rate for the period. We recordrecorded these translation adjustments as a component of accumulated other comprehensive loss on the Consolidated Balance Sheets. In the first quarter of 2023, we recognized a charge of $33 related to the derecognition of the accumulated comprehensive loss on foreign currency translation (see Note 2: Canada Wind-down).
In addition,Reclassification
We reclassified amounts in our U.S. operation incurs certain expenditures denominated in Canadian Dollarsfiscal 2022 and our Canadian operation incurs certain expenditures denominated in U.S. Dollars. This activity results in transaction gains and losses that arise from exchange rate fluctuations, which are recorded as gains or losses in the2021 Consolidated Statements of Earnings.Cash Flows to conform with current period presentation. As of February 3, 2018, activities associateda result, we aggregated:
•Accounts receivable, net with foreign currency exchange risk have notprepaid expenses and other assets into other current and noncurrent assets
•Other current liabilities with other liabilities into other current and noncurrent liabilities
•Tax withholding on share-based awards with other financing, net
These reclassifications had a materialno impact on our Consolidated Financial Statements.cash flows from operations, cash flows from investing or cash flows from financing.
Recent Accounting Pronouncements
In May 2014, the Financial Accounting Standards Board (“FASB”) issued Accounting Standards Update (“ASU”) No. 2014-09, Revenue from Contracts with Customers, which was subsequently modified in August 2015 by ASU No. 2015-14, Revenue from Contracts with Customers: Deferral of the Effective Date. The core principle of ASU No. 2014-09 is that companies should recognize revenue when the transfer of promised goods or services to customers occurs in an amount that reflects what the company expects to receive. It requires additional disclosures to describe the nature, amount, timing and uncertainty of revenue and cash flows from contracts with customers. In 2016,November 2023, the FASB issued ASU No. 2023-07, Segment Reporting (Topic 280): Improvements to Reportable Segment Disclosures, which requires additional ASUs which clarifyquarterly and annual reportable segment disclosures, primarily around significant segment expenses. Annual disclosure requirements will be effective for us for the implementation guidance on principal versus agent considerations, on identifying performance obligationsfourth quarter of 2024, and licensing, on the revenue recognition criteria and other technical corrections. We plan to adopt this ASUquarterly disclosure requirements will be effective for us in the first quarter of 2018 using the modified retrospective2025, with early adoption method. In our ongoing evaluation of this ASU, we have determined that the new standard will result in a net cumulative effect adjustment to decrease beginning accumulated deficit by approximately $55, as well as the following impacts:
Gift card breakage will be recorded in sales, rather than selling, general, and administrative expenses. It will be estimated based on expected customer redemption periods, rather than when redemption is considered remote.
Loyalty sales attributable to our Nordstrom Rewards loyalty program benefits (for example, Notes, alterations) will be deferred rather than recording the loyalty program expenses as an increase to cost of sales.
Remaining unamortized balances of deferred revenue and investment in contract asset related to the sale of our receivables to TD will be written off as a cumulative-effect adjustment reducing accumulated deficit.
Revenue related to our online sales will be recognized at the shipping point rather than upon receipt by the customer.
Estimated costs of returns will be recorded as a current asset rather than netted with our sales return reserve.
We do not expect the provisions of this ASU to have a material impact on our Consolidated Financial Statements beyond our initial adoption.
In February 2016, the FASB issued ASU No. 2016-02, Leases. This ASU increases transparency and comparability by recognizing a lessee’s rights and obligations resulting from leases by recording them on the balance sheet as right-of-use assets and lease liabilities. The new standard requires lessees to apply a dual approach, classifying leases as either finance or operating leases based on the principle of whether or not the lease is effectively a financed purchase by the lessee. This classification dictates whether lease expense is to be recognized based on an effective interest method or on a straight-line basis over the term of the lease. Additional qualitative and quantitative disclosures will be required to give financial statement users information on the amount, timing and judgments related to a reporting entity’s cash flows arising from leases. This ASU is effective for Nordstrom beginning in the first quarter of 2019.permitted. We are currently evaluating the impact of the standard, which will require recognizing and measuring leases at the beginning of the earliest period presented using a modified retrospective approach. We expect adoption of this standard will have a material impactASU on our Consolidated Financial Statements.
disclosures.
Nordstrom, Inc.
Notes to Consolidated Financial Statements
(Dollar and share amounts in millions except per share, per option and per unit amountsamounts)
In March 2016,December 2023, the FASB issued ASU No. 2016-09, Compensation — Stock Compensation —2023-09, Income Taxes (Topic 740): Improvements to Employee Share-Based Payment AccountingIncome Tax Disclosures, which simplifies several aspectsrequires disclosure of additional income tax information, primarily related to the accountingrate reconciliation and income taxes paid. Annual disclosure requirements will be effective for share-based payments and presentation withinus for the financial statements.fourth quarter of 2025, with early adoption permitted. We adopted ASU No. 2016-09 with an effective date of January 29, 2017. Theare currently evaluating the impact of this ASU on our disclosures.
NOTE 2: CANADA WIND-DOWN
Background
On March 2, 2023, as part of our initiatives to drive long-term profitable growth and enhance shareholder value, and after careful consideration of all reasonably available options, we announced the adoption resulteddecision to discontinue support for Nordstrom Canada’s operations. Accordingly, Nordstrom Canada commenced a wind-down of its business operations, obtaining an Initial Order from the Ontario Superior Court of Justice under the CCAA on March 2, 2023 to facilitate the wind-down in an orderly fashion. Nordstrom Canada’s e-commerce platform ceased operations on March 2, 2023 and the closure of six Nordstrom and seven Nordstrom Rack stores was completed in June 2023. Significant developments in the following:case, including a creditor vote to approve a Plan of Compromise and Arrangement and a court hearing to sanction that plan and authorize its implementation are scheduled to occur in the first quarter of 2024. Distributions to creditors, including distributions to Nordstrom, Inc. as a creditor of Nordstrom Canada, are expected to be substantially complete by the end of 2024.
Excess tax benefitsThe Ontario Superior Court of Justice has appointed a monitor to oversee the wind-down process. Subsequent to the CCAA filing, Nordstrom has been providing limited support to Nordstrom Canada for the purpose of supporting an orderly wind-down, including providing shared services and deficiencies resulting from stock-based compensation arrangementstemporary use of intellectual property.
Wind-down Charges and Deconsolidation of Nordstrom Canada
The following table details the pre-tax charges associated with the wind-down of operations in Canada:
| | | | | |
| Fiscal year | 2023 |
Loss on Canada write-off1 | $176 | |
Accumulated translation loss reclassified to earnings1 | 33 | |
| Contingent liabilities | 70 | |
Other exit costs2 | 5 | |
| Total pre-tax charges | $284 | |
| |
1 Non-cash amounts are now recorded within income tax expenseincluded in Canada wind-down costs on the Consolidated Statement of Earnings when the awards vest orCash Flows.
2 Other exit costs include funding an employee trust, net of expected recoveries, and professional fees.
These charges are settled, rather than within equity. Additionally, excess tax benefits are now excluded from assumed future proceedsprimarily included in our calculation of diluted shares for purposes of determining diluted earnings per share.Corporate/Other in Note 15: Segment Reporting. The prospective adoption of this provision did not have a material effect on the Consolidated Financial Statements for the year ended February 3, 2018. We had no previously unrecognized excess tax benefits that would have resulted in a cumulative-effect adjustment to beginning retained earnings.
Forfeitures on share-based awards are recorded as they occur, rather than our historical method of estimating forfeitures at the grant date. In evaluating the impact of this change, the adjustment to adopt on a modified retrospective basis was immaterial, therefore, no adjustment has been made to beginning retained earnings.
Excess tax benefits from stock-based compensation arrangements are classified as cash flows from operations, rather than as cash flows from financing activities. We adopted this change retrospectively, which resulted in an increase to net cash provided by operating activities and an increasedecrease in cash flows useddue to the deconsolidation of Nordstrom Canada is included in financing activities of $5 for 2016 and $15 for 2015. Additionally, cash flows related to withholding shares for tax purposes on net-settled awards are classified as financing activities, rather than operating activities. This classification change was also adopted retrospectively, resulting in an increase of $5 for 2016 and $4 for 2015 to net cash provided by operating activities with an offsetting increase to net cash used in financinginvesting activities on the Consolidated Statement of Cash Flows for 2016 and 2015.all other impacts are included in operating cash flows.
Loss on Canada Write-off and Accumulated Translation Loss
While Nordstrom continues to own 100% of the shares of Nordstrom Canada, as of March 2, 2023, the date of the CCAA filing, we no longer have a controlling interest under GAAP and have deconsolidated Nordstrom Canada. We hold a variable interest in the Nordstrom Canada entities, which are considered variable interest entities, but are not consolidated, as we are no longer the primary beneficiary.
For the year ended February 3, 2024, we recorded a pre-tax loss on Canada write-off of $176 that included the derecognition of Nordstrom Canada’s assets and liabilities and the write-down of both our Nordstrom Canada investment and related-party receivables to estimated fair value. In January 2017,addition, we recognized a charge of $33 related to the FASB issued ASU No. 2017-04, Intangibles — Goodwill and Other: Simplifyingderecognition of the Test for Goodwill Impairment, which simplifiesaccumulated comprehensive loss on foreign currency translation.
To assess the accounting for goodwill impairment by eliminating step two from the goodwill impairment test. Under this new guidance, if the carrying amount of a reporting unit exceeds its estimated fair value an impairment charge shall be recognizedof our Nordstrom Canada investment and our related-party receivables, we estimated the assets available for distribution in an amount equalrelation to that excess, limited toexpected claims. At the totaltime of filing for CCAA protection on March 2, 2023, the estimated amount of goodwill allocatedNordstrom Canada’s liabilities exceeded the estimated fair value of assets available for distribution to that reporting unit. The ASU is effective prospectively for fiscal yearscreditors, and interim periods within those years beginning after December 15, 2019. Early adoption is permitted for interim or annual goodwill impairment tests performed on testing dates after January 1, 2017. We are currently evaluating the impact this guidancewe believed we would have on our Consolidated Financial Statements.
In December 2017, the Securities and Exchange Commission (“SEC”) released Staff Accounting Bulletin No. 118 (the “Bulletin”), which provides accounting guidance regarding accounting for income taxes for the reporting period that includes the enactment of the Tax Act. The Bulletin provides guidance in those situations where the accounting for certain income tax effects of the Tax Act will be incomplete by the time financial statements are issued for the reporting period that includes the enactment date. For those elements of the Tax Act that cannot be reasonably estimated, no effect will be recorded.
The SEC has provided in the Bulletin that in situations where the accounting is incomplete for certain effects of the Tax Act,not recover a measurement period which begins in the reporting period that includes the enactment of the Tax Act and ends when the entity has obtained, prepared and analyzed the information is needed in order to complete the accounting requirements. The measurement period shall not exceed one year from enactment. In accordance with SAB 118, we have recorded provisional tax expense associated with the impacts of the Tax Act (see Note 13: Income Taxes for additional information).
In February 2018, the FASB issued ASU No. 2018-02, Income Statement — Reporting Comprehensive Income: Reclassification of Certain Tax Effects from Accumulated Other Comprehensive Income. This new guidance will allow a reclassification from accumulated other comprehensive income to retained earnings for stranded tax effects resulting from the Tax Act. The ASU is effective for us beginning in the first quarter of 2019, with early adoption permitted. We do not expect the adoption of this standard to have a material impact on our Consolidated Financial Statements.
NOTE 2: CREDIT CARD RECEIVABLE TRANSACTION
In October 2015, we completed the sale of a substantial majoritysignificant portion of our U.S. Visa and private label credit card portfolio to TD. In November 2017,receivables. As a result, our fair value was recorded as zero in our Condensed Consolidated Balance Sheets as of April 29, 2023. As of February 3, 2024, we sold the remaining balances which consisted of employee credit cardadjusted our receivables for the U.S. Visa and Nordstrom private label credit cards to TD forby an immaterial amount equal to the gross value of the outstanding receivables. Additionally, we entered into an amended long-term program agreement under which TD is the exclusive issuer of our U.S. consumer credit cards and we perform account servicing functions.
based on currently available information.
Nordstrom, Inc. and subsidiaries4757
Nordstrom, Inc.
Notes to Consolidated Financial Statements
(Dollar and share amounts in millions except per share, per option and per unit amountsamounts)
Prior to deconsolidation, Nordstrom made loans to the Canadian subsidiaries and incurred liabilities related to certain intercompany charges. These were considered intercompany transactions and were eliminated in consolidation of Nordstrom. Subsequent to deconsolidation, these liabilities and receivables were no longer eliminated through consolidation, are considered related-party transactions and are recorded in our Consolidated Balance Sheets at estimated fair value. As of February 3, 2024, Nordstrom had a net outstanding liability to Nordstrom Canada of $52 related to certain intercompany charges incurred prior to deconsolidation.
Contingent Liabilities and Guarantees
In the third quarter of 2023, Nordstrom, Inc. reached a settlement with former landlords related to guarantees of certain lease obligations of Nordstrom Canada. As part of the agreements, we made cash payments to the former landlords in exchange for a release of substantially all our guarantee obligations, as well as the right to these landlords’ distributions from Nordstrom Canada as part of the CCAA proceedings.
Employee Trust
In connection with the closefiling, Nordstrom contributed $11 to establish an employee trust to fund termination and severance payments to employees of Nordstrom Canada. As of February 3, 2024, the trust has been terminated.
Debtor-in-Possession Financing
If needed, Nordstrom has agreed to provide Nordstrom Canada debtor-in-possession financing up to $11. However, we believe Nordstrom Canada has sufficient liquidity to sustain operations through the wind-down period and therefore it is not likely that any amounts would need to be borrowed from Nordstrom. As of February 3, 2024, there were no outstanding borrowings.
Estimates
As of February 3, 2024, we recorded $71 in accounts receivable, net on the Consolidated Balance Sheets to reflect the amount we believe probable of receipt as part of the credit cardclaims process. This includes receipts related to the rights to the former landlords’ distributions, reimbursement of employee trust contributions and other receivables existing at the time of deconsolidation. The receivable transaction in October 2015, we defeased $325 in secured Series 2011-1 Class A Notes in order to provideand our other estimates are dependent on the credit card receivables to TD free and clear.At close, we received $2.2 billion in cash consideration reflecting the par valueoutcome of the receivables sold,Nordstrom Canada wind-down process, including the amount of third-party and incurred $32Nordstrom claims asserted and recognized in transaction-related expenses during the thirdclaims process, the amount of assets available for distribution and the approval of the CCAA plan of arrangement by the Ontario Superior Court of Justice, which we expect to have updated information on in the first quarter of 2015.Pursuant2024. We continue to work through the wind-down process and our estimates of net losses are based on currently available information, our assessment of the validity of certain expected claims and our assessment of the recoverability of amounts receivable from Nordstrom Canada. These estimates may change as new information becomes available and it is reasonably possible that they may materially change from the estimated amounts. Increases in estimated costs to settle claims and decreases in estimated assets available for distribution may result in additional material charges. At the same time, any future decreases in estimated costs to settle claims or increases in estimated assets available for distribution may result in a gain, which would reduce our estimated charges.
Income Taxes
For the year ended February 3, 2024, we recognized net tax benefits of $95 primarily related to the agreement, we are obligated to offer and administerwrite-off of our Nordstrom Rewards loyalty program and perform other account servicing functions. In return, we receive a portion of the ongoing credit card revenue,investment in Canada, net of credit losses, from both the soldtax expense related to an increase in valuation allowance for Canada deferred tax assets.
Nordstrom, Inc.
Notes to Consolidated Financial Statements
(Dollar and newly generated credit card receivables. At close of the November 2017 transaction, we received $55share amounts in cash consideration reflecting the par value of the employee receivables sold.millions except per share, per option and per unit amounts)
In October 2015, we recorded certain assets
NOTE 3: REVENUE
Contract Liabilities
Contract liabilities represent our obligation to transfer goods or services to customers and include deferred revenue for The Nordy Club (including points and Nordstrom Notes), gift cards and our amended 2022 TD program agreement. Our contract liabilities associated with the arrangement. The beneficial interest asset is amortized over approximately four years based primarilyare classified on the payment rateConsolidated Balance Sheets as follows:
| | | | | | | | |
| Other current liabilities | Other liabilities |
| Balance as of January 29, 2022 | $478 | | $— | |
| Balance as of January 28, 2023 | 536 | | 136 | |
| Balance as of February 3, 2024 | 508 | | 85 | |
Contract liabilities increased during 2022 primarily as a result of the associated receivables. The deferred revenue recorded in connection with our amended 2022 TD program agreement. Revenues recognized from our beginning contract liability balance were $316 and investment in contract asset are recognized/amortized over seven$265 for the years on a straight-line basis,ended February 3, 2024 and January 28, 2023.
Disaggregation of Revenue
The following table summarizes our disaggregated net sales: | | | | | | | | | | | |
| Fiscal year | 2023 | 2022 | 2021 |
| Nordstrom | $9,436 | $10,279 | $9,640 |
| Nordstrom Rack | 4,783 | 4,813 | 4,762 |
| Total net sales | $14,219 | $15,092 | $14,402 |
| | | |
| Digital sales as a % of total net sales | 36% | 38% | 42% |
The following table summarizes the deliverypercent of the contract obligationsnet sales by merchandise category: | | | | | | | | | | | |
| Fiscal year | 2023 | 2022 | 2021 |
| Women’s Apparel | 27% | 28% | 28% |
| Shoes | 26% | 26% | 25% |
| Men’s Apparel | 15% | 15% | 14% |
| Beauty | 13% | 12% | 12% |
| Accessories | 12% | 13% | 14% |
| Kids’ Apparel | 4% | 3% | 4% |
| Other | 3% | 3% | 3% |
| Total net sales | 100 | % | 100 | % | 100 | % |
Nordstrom, Inc. and expected lifesubsidiaries59
Cash Flows PresentationContents
Nordstrom, private label creditInc.
Notes to Consolidated Financial Statements
(Dollar and debit cards can be used at a majority of our U.S. retail businesses, while Nordstrom Visa credit cards also may be used for purchases outside of Nordstrom. Prior to the completion of the credit card receivable transactionsshare amounts in October 2015millions except per share, per option and November 2017, cash flows from the use of both the private label and Nordstrom Visa credit cards for sales originating at our stores and our digital channels were treated as an operating activity within the Consolidated Statements of Cash Flows, as they related to sales at Nordstrom. Additionally, cash flows arising from the use of Nordstrom Visa credit cards outside of our stores were treated as an investing activity within the Consolidated Statements of Cash Flows, as they represented loans made to our customers for purchases at third parties.per unit amounts)
NOTE 3:4: LAND, PROPERTY AND EQUIPMENT
Land, property and equipment consist of the following: | | | | | | | | |
| February 3, 2024 | January 28, 2023 |
| Land and land improvements | $283 | | $288 | |
| Buildings and building improvements | 1,365 | | 1,352 | |
| Leasehold improvements | 3,103 | | 3,389 | |
| Store fixtures and equipment | 3,873 | | 4,138 | |
| Capitalized software | 2,439 | | 2,151 | |
| Construction in progress | 365 | | 322 | |
| Land, property and equipment | 11,428 | | 11,640 | |
| Accumulated depreciation and amortization | (8,251) | | (8,289) | |
| Land, property and equipment, net | $3,177 | | $3,351 | |
NOTE 5: LEASES
|
| | | | | | | |
| | February 3, 2018 |
| | January 28, 2017 |
|
| Land and land improvements |
| $111 |
| |
| $107 |
|
| Buildings and building improvements | 1,246 |
| | 1,198 |
|
| Leasehold improvements | 3,099 |
| | 2,938 |
|
| Store fixtures and equipment | 3,724 |
| | 3,513 |
|
| Capitalized software | 1,280 |
| | 1,183 |
|
| Construction in progress | 584 |
| | 554 |
|
| Land, property and equipment | 10,044 |
| | 9,493 |
|
| Less: accumulated depreciation and amortization | (6,105 | ) | | (5,596 | ) |
| Land, property and equipment, net |
| $3,939 |
| |
| $3,897 |
|
We lease the land, buildings, or land and buildings for many of our stores, office facilities and Supply Chain Network facilities, as well as equipment. The total cost of property and equipment held under capital lease obligations was $26 at the end of 2017 and 2016, with related accumulated amortization of $25 in 2017 and 2016. Depreciation and amortization expense was $655, $631 and $560 in 2017, 2016 and 2015.
NOTE 4: SELF-INSURANCE
Our self-insurance reserves are summarized as follows: |
| | | | | | | |
| | February 3, 2018 |
| | January 28, 2017 |
|
| Workers’ compensation |
| $71 |
| |
| $69 |
|
| Employee health and welfare | 26 |
| | 29 |
|
| Other liability | 18 |
| | 16 |
|
| Total self-insurance reserve |
| $115 |
| |
| $114 |
|
Our workers’ compensation policies have a retention per claim of $1 or less and no policy limits.
We are self-insured forfollowing table summarizes the majority of our
employee healthfixed, non-cancelable lease terms: | | | | | |
| Property Type | Lease Term (in years) |
| Nordstrom stores | 15 – 30 |
| Nordstrom Rack stores | Approximately 10 |
| Office and Supply Chain Network facilities | 5 – 20 |
Many of our leases include options that allow us to extend the lease term beyond the initial commitment period.At the commencement of a lease, we generally include only the initial lease term as we have determined that options to extend are not reasonably certain to occur. The exercise of lease renewal options is generally at our sole discretion. At the renewal of an expiring lease, we reassess our options in the agreement and welfare coverageinclude all reasonably certain extensions in the measurement of our lease term.
Most of our leases also require us to pay certain expenses, such as common area maintenance charges, real estate taxes and other executory costs, the fixed portion of which is included in Operating Lease Cost, as we combine lease and non-lease components. We recognize Operating Lease Cost, which is primarily included in occupancy costs, on a straight-line basis over the lease term. Variable lease cost includes payments for variable common area maintenance charges and additional payments based on a percentage of sales, which are recognized when probable. Our lease agreements do not use stop-loss coverage. Participants contribute tocontain any material residual value guarantees or material restrictive covenants.
The following table summarizes the components of lease cost: | | | | | | | | | | | |
| Fiscal year | 2023 | 2022 | 2021 |
| Operating Lease Cost | $278 | | $280 | | $265 | |
Variable lease cost1 | 93 | | 97 | | 100 | |
| Sublease income | (25) | | (19) | | (20) | |
| Total lease cost, net | $346 | | $358 | | $345 | |
1 Variable lease cost of their coverage through premiumsincludes short-term lease cost, which was immaterial in 2023, 2022 and out-of-pocket expenses for deductibles, co-pays and co-insurance.
Our liability policies, encompassing an employment practices liability, with a policy limit up to $30, and a commercial general liability, with a policy limit up to $151, have a retention per claim of $3 or less.
2021.
Nordstrom, Inc. and subsidiaries4860
Nordstrom, Inc.
Notes to Consolidated Financial Statements
(Dollar and share amounts in millions except per share, per option and per unit amountsamounts)
The following table summarizes future lease payments as of February 3, 2024: | | | | | | | |
| Fiscal year | | | Operating Leases |
| 2024 | | | $321 | |
| 2025 | | | 324 | |
| 2026 | | | 273 | |
| 2027 | | | 224 | |
| 2028 | | | 182 | |
| Thereafter | | | 708 | |
Total lease payments1 | | | 2,032 | |
| | | |
| Amount representing interest | | | (415) | |
Present value of net lease payments2 | | | $1,617 | |
NOTE 5: 401(K) PLAN1 Total lease payments do not include payments for variable lease costs that are required by most of our lease agreements.
We provide a 401(k) plan2 Net lease payments exclude $139 of lease payments for our employeesoperating leases that allows for employee elective contributions and discretionary Company contributions. Employee elective contributions are funded through voluntary payroll deductions. Our discretionary Company contribution is funded in an amount determined by our Board of Directors each year. Total expenses related to Company contributions of $110, $92 and $62 in 2017, 2016 and 2015were included in both buying and occupancy costs and selling, general and administrative expenses on our Consolidated Statements of Earnings. The $110 in 2017 included $94 of matching contributions and $16 for a one-time discretionary profit-sharing contribution.
NOTE 6: POSTRETIREMENT BENEFITS
We have an unfunded defined benefit Supplemental Executive Retirement Plan (“SERP”), which provides retirement benefits to certain officers and select employees. The SERP has different benefit levels depending on the participant’s role in the Company. At the end of 2017, we had 57 participants in the plan, including 16 officers and select employees eligible for SERP benefits, 40 retirees and one beneficiary. This plan is non-qualified and does not have a minimum funding requirement.
Benefit Obligations and Funded Status
Our benefit obligation and funded status is as follows: |
| | | | | | | |
| | February 3, 2018 |
| | January 28, 2017 |
|
| Change in benefit obligation: | | | |
| Benefit obligation at beginning of year |
| $188 |
| |
| $181 |
|
| Participant service cost | 3 |
| | 3 |
|
| Interest cost | 7 |
| | 7 |
|
| Benefits paid | (8 | ) | | (7 | ) |
| Actuarial gain | 10 |
| | 4 |
|
| Benefit obligation at end of year | 200 |
| | 188 |
|
| Change in plan assets: | | | |
| Fair value of plan assets at beginning of year | — |
| | — |
|
| Employer contribution | 8 |
| | 7 |
|
| Benefits paid | (8 | ) | | (7 | ) |
| Fair value of plan assets at end of year | — |
| | — |
|
| Underfunded status at end of year |
| ($200 | ) | |
| ($188 | ) |
The accumulated benefit obligation, which is the present value of benefits, assuming no future compensation changes, was $197 and $184 at the end of 2017 and 2016.
Amounts recognized as liabilities in the Consolidated Balance Sheets consist of the following: |
| | | | | | | |
| | February 3, 2018 |
| | January 28, 2017 |
|
| Accrued salaries, wages and related benefits |
| $9 |
| |
| $8 |
|
| Other liabilities (noncurrent) | 191 |
| | 180 |
|
| Net amount recognized |
| $200 |
| |
| $188 |
|
Components of SERP Expense
The components of SERP expense recognized in the Consolidated Statements of Earnings are as follows: |
| | | | | | | | | | | |
| Fiscal year | 2017 |
| | 2016 |
| | 2015 |
|
| Participant service cost |
| $3 |
| |
| $3 |
| |
| $3 |
|
| Interest cost | 7 |
| | 7 |
| | 7 |
|
| Amortization of net loss and other | 3 |
| | 3 |
| | 11 |
|
| Total SERP expense |
| $13 |
| |
| $13 |
| |
| $21 |
|
Nordstrom, Inc. and subsidiaries49
Nordstrom, Inc.
Notes to Consolidated Financial Statements
Dollar and share amounts in millions except per share, per option and per unit amounts
Amountssigned but not yet reflected in SERP expense and included in accumulated other comprehensive loss (pre-tax) consistcommenced as of the following: |
| | | | | | | |
| | February 3, 2018 |
| | January 28, 2017 |
|
| Accumulated loss |
| ($46 | ) | |
| ($41 | ) |
| Prior service credit | 2 |
| | 4 |
|
| Total accumulated other comprehensive loss |
| ($44 | ) | |
| ($37 | ) |
In 2018, we expect $4 of costs currently in accumulated other comprehensive loss to be recognized as components of SERP expense.
Assumptions
Weighted-average assumptions used to determine our benefit obligation and SERP expense are as follows: |
| | | | | | | | |
| Fiscal year | 2017 |
| | 2016 |
| | 2015 |
|
| Assumptions used to determine benefit obligation: | | | | | |
| Discount rate | 3.95 | % | | 4.31 | % | | 4.55 | % |
| Rate of compensation increase | 3.00 | % | | 3.00 | % | | 3.00 | % |
| Assumptions used to determine SERP expense: | | | | | |
| Discount rate | 4.31 | % | | 4.55 | % | | 3.70 | % |
| Rate of compensation increase | 3.00 | % | | 3.00 | % | | 3.00 | % |
Future Benefit Payments and Contributions
As of February 3, 2018, the expected future benefit payments based upon the assumptions described above and including benefits attributable to estimated future employee service are as follows:2024.
The following table includes supplemental information: | | | | | | | | | | | |
| Fiscal year | 2023 | 2022 | 2021 |
| Cash paid related to operating lease liabilities | $358 | | $354 | | $371 | |
| Operating lease interest | 86 | | 85 | | 87 | |
| Operating lease liabilities arising from lease agreements | 242 | | 260 | | 137 | |
| | | |
| | February 3, 2024 | January 28, 2023 |
| Weighted-average remaining lease term | | 8 years | 8 years |
| Weighted-average discount rate | | 5.5 | % | 4.9 | % |
|
| | | |
| Fiscal year | |
| 2018 |
| $9 |
|
| 2019 | 10 |
|
| 2020 | 11 |
|
| 2021 | 11 |
|
| 2022 | 11 |
|
| 2023 – 2027 | 61 |
|
Nordstrom, Inc.
Notes to Consolidated Financial Statements
Dollar and share amounts in millions except per share, per option and per unit amounts
NOTE 7:6: DEBT AND CREDIT FACILITIES
Debt
A summary of our long-term debt including capital leases, is as follows: | | | | | | | | |
| February 3, 2024 | January 28, 2023 |
| | |
| | |
| | |
| | |
| | |
| | |
| Long-term debt, net of unamortized discount: | | |
| | |
| Senior notes, 2.30%, due April 2024 | $250 | | $250 | |
| Senior notes, 4.00%, due March 2027 | 349 | | 349 | |
| Senior debentures, 6.95%, due March 2028 | 300 | | 300 | |
| Senior notes, 4.375%, due April 2030 | 500 | | 500 | |
| Senior notes, 4.25%, due August 2031 | 425 | | 425 | |
| Senior notes, 7.00%, due January 2038 | 147 | | 147 | |
Senior notes, 5.00%, due January 20441 | 909 | | 905 | |
| Deferred bond issuance costs | (18) | | (20) | |
| Total long-term debt | $2,862 | | $2,856 | |
| | |
| Current portion of debt | (250) | | — | |
| Total due beyond one year | $2,612 | | $2,856 | |
|
| | | | | | | |
| | February 3, 2018 |
| | January 28, 2017 |
|
| Secured | | | |
| Mortgage payable, 7.68%, due April 2020 |
| $17 |
| |
| $24 |
|
| Other | 1 |
| | 3 |
|
| Total secured debt | 18 |
| | 27 |
|
| Unsecured | | | |
| Net of unamortized discount: | | | |
| Senior notes, 6.25%, due January 2018 | — |
| | 650 |
|
| Senior notes, 4.75%, due May 2020 | 500 |
| | 499 |
|
| Senior notes, 4.00%, due October 2021 | 500 |
| | 500 |
|
| Senior notes, 4.00%, due March 2027 | 349 |
| | — |
|
| Senior debentures, 6.95%, due March 2028 | 300 |
| | 300 |
|
| Senior notes, 7.00%, due January 2038 | 146 |
| | 146 |
|
| Senior notes, 5.00%, due January 2044 | 892 |
| | 602 |
|
Other1 | 32 |
| | 50 |
|
| Total unsecured debt | 2,719 |
| | 2,747 |
|
| | | | |
| Total long-term debt | 2,737 |
| | 2,774 |
|
| Less: current portion | (56 | ) | | (11 | ) |
| Total due beyond one year |
| $2,681 |
| |
| $2,763 |
|
1Other unsecured debt includes our Puerto Rico unsecured borrowing facility partially offset by deferred bond issue costs.
Our mortgage payable is secured by an office building that had a net book value The unamortized discount on these notes was $57 and $61 as of $56 at the end of 2017.
Required principal payments on long-term debt, excluding capital lease obligations, are as follows: |
| | | |
| Fiscal year | |
| 2018 |
| $56 |
|
| 2019 | 8 |
|
| 2020 | 502 |
|
| 2021 | 500 |
|
| 2022 | — |
|
| Thereafter | 1,764 |
|
During 2017, we issued $350 aggregate principal amount of 4.00% senior unsecured notes due March 2027February 3, 2024 and $300 aggregate principal amount of 5.00% senior unsecured notes due January 2044. With the proceeds of these new notes, we retired our $650 senior unsecured notes that were due January 2018. We incurred $18 of net interest expense related to the refinancing, which included the write-off of unamortized balances associated with the debt discount, issue costs and fair value hedge adjustment resulting from the sale of our interest rate swap agreements in 2012. It also included a one-time payment of $24 to 2018 Senior Note holders under a make-whole provision, which represents the net present value of the expected coupon payments had the notes been outstanding through the original maturity date.
28, 2023.
Nordstrom, Inc. and subsidiaries5161
Nordstrom, Inc.
Notes to Consolidated Financial Statements
(Dollar and share amounts in millions except per share, per option and per unit amountsamounts)
Required principal payments on long-term debt are as follows: | | | | | |
Fiscal year1 | |
| 2024 | $250 | |
| 2025 | — | |
| 2026 | — | |
| 2027 | 350 | |
| 2028 | 300 | |
| Thereafter | 2,039 | |
1 Required principal payments exclude estimated future interest payments of $1,519 as of February 3, 2024, with $136 payable within one year.
During the first quarter of 2021, we issued $250 aggregate principal amount of 2.30% senior notes due April 2024 and $425 aggregate principal amount of 4.25% senior notes due August 2031. With the net proceeds of these new notes, together with cash on hand, we retired our $600 Secured Notes. We recorded $88 related to the redemption in interest expense, net, which primarily consisted of a one-time payment of $78 for a “make-whole” premium, and the write-off of unamortized balances associated with the debt discount and issuance costs. The “make-whole” premium payment was not included in cash paid during the period for interest, net of capitalized interest in the Supplemental Cash Flow Information.
Interest Expense
The components of interest expense, net are as follows: |
| | | | | | | | | | | |
| Fiscal year | 2017 |
| | 2016 |
| | 2015 |
|
| Interest on long-term debt and short-term borrowings |
| $168 |
| |
| $147 |
| |
| $153 |
|
| Less: | | | | | |
| Interest income | (5 | ) | | (1 | ) | | — |
|
| Capitalized interest | (27 | ) | | (25 | ) | | (28 | ) |
| Interest expense, net |
| $136 |
| |
| $121 |
| |
| $125 |
|
| | | | | | | | | | | |
| Fiscal year | 2023 | 2022 | 2021 |
| Interest on long-term debt and short-term borrowings | $150 | | $150 | | $258 | |
| | | |
| Interest income | (33) | | (10) | | (1) | |
| Capitalized interest | (13) | | (12) | | (11) | |
| Interest expense, net | $104 | | $128 | | $246 | |
Credit Facilities
On March 1, 2023, we amended our Revolver originally dated May 6, 2022. Prior to this amendment, Nordstrom Canada Retail, Inc. was a loan party under the Revolver and the obligations under the Revolver were secured, in part, by the assets of this subsidiary. As a result of this amendment, Nordstrom Canada Retail, Inc. was removed as a loan party and obligations under the Revolver are no longer secured by these assets. In addition, this amendment excludes as subsidiaries or affiliates all Nordstrom Canada entities and carves out certain CCAA-related expenses and obligations from financial covenants under the Revolver.
As of February 3, 2018,2024 and January 28, 2023, we had totalno outstanding borrowings under the Revolver that expires in May 2027. Our short-term borrowing capacity was reduced by $30 to $770 as a result of $800issuing a standby letter of credit in the fourth quarter of 2023. Provided that we obtain written consent from the lenders, we have the option to increase the Revolver by up to $200, to a total of $1,000, and two options to extend the Revolver for additional one-year terms.
Any outstanding borrowings under the Revolver are secured by substantially all our senior unsecured revolving credit facility (“revolver”) that expires in April 2020.personal and intellectual property assets and are guaranteed by certain of our subsidiaries. Under the Revolver, our obligation to secure any outstanding borrowings will be eliminated if no default exists and we either have an unsecured investment-grade debt rating from two of three specified ratings agencies, or we have one investment-grade rating and achieve two consecutive fiscal quarters with a Leverage Ratio of less than 2.5 times.
Under the Revolver, we have two financial covenant tests that need to be met on a quarterly basis: a Leverage Ratio that is less than or equal to 4 times and a fixed charge coverage ratio that is greater than or equal to 1.25 times. As of February 3, 2024, we were in compliance with all covenants.
The Revolver contains customary representations, warranties, covenants and terms, of our revolver, we payincluding paying a variable rate of interest and a commitmentfacility fee based on our debt rating. The revolverrating, and is available for working capital, capital expenditures and general corporate purposes. We haveThe Revolver allows us to issue dividends and repurchase shares provided we are not in default and no default would arise as a result of such payments. If the pro-forma Leverage Ratio after such payments is less than 3 times, then such payments are unlimited. If the pro-forma Leverage Ratio is greater than or equal to 3 times but less than 3.5 times, then we are limited to $100 per fiscal quarter and if the pro-forma Leverage Ratio is greater than or equal to 3.5 times, then the limit is $60 per fiscal quarter.
Nordstrom, Inc.
Notes to Consolidated Financial Statements
(Dollar and share amounts in millions except per share, per option to increase the revolving commitment by up to $200, to a total of $1,000, provided that we obtain written consent from the lenders.and per unit amounts)
The revolver requires that we maintain an adjusted debt to earnings before interest, income taxes, depreciation, amortization and rent (“EBITDAR”) leverage ratio of no more than four times. As of February 3, 2018 and January 28, 2017, we were in compliance with this covenant.
Our $800 commercial paper program allows us to use the proceeds to fund operating cash requirements. Under the terms of the commercial paper agreement, we pay a rate of interest based on, among other factors, the maturity of the issuance and market conditions. The issuance of commercial paper has the effect while it is outstanding, of reducing available liquidity under the revolverRevolver by an amount equal to the principal amount of commercial paper.
paper outstanding. Conversely, borrowings under our Revolver have the effect of reducing the available capacity of our commercial paper program by an amount equal to the amount outstanding. As of February 3, 20182024 and January 28, 2017,2023, we had no issuances outstanding under our commercial paper program and no borrowings outstanding under our revolver.program.
Our wholly owned subsidiary in Puerto Rico maintains a $52 unsecured borrowing facility to support our expansion into that market. The facility expires in Fall 2018 and borrowings on this facility incur interest based upon the LIBOR plus 1.275% per annum and also incurred a fee based on any unused commitment. As of February 3, 2018 and January 28, 2017, we had $48 and $50 outstanding on this facility, which is included as a component in other unsecured debt and the current portion of debt.
NOTE 8:7: FAIR VALUE MEASUREMENTS
We disclose our financial assets and liabilities that are measured at fair value in our Consolidated Balance Sheets by level within the fair value hierarchy as defined by applicable accounting standards:
Level 1: Quoted market prices in active markets for identical assets or liabilities
Level 2: Other observable market-based inputs or unobservable inputs that are corroborated by market data
Level 3: Unobservable inputs that cannot be corroborated by market data that reflect the reporting entity’s own assumptions
Financial Instruments Not Measured at Fair Value
Financial instruments not measured at faircarrying value on a recurring basis include cash and cash equivalents, accounts receivable, accounts payable and certificates of deposit,our Revolver, which approximate fair value due to their short-term nature, andnature.
Long-term debt is recorded at carrying value. If long-term debt.
We estimate thedebt was measured at fair value, of long-term debt usingwe would use quoted market prices of the same or similar issues, and, as such, thiswhich is considered a Level 2 fair value measurement. The following table summarizes the carrying value and fair value estimate of our long-term debt, including current maturities: |
| | | | | | | |
| | February 3, 2018 |
| | January 28, 2017 |
|
| Carrying value of long-term debt |
| $2,737 |
| |
| $2,774 |
|
| Fair value of long-term debt | 2,827 |
| | 2,949 |
|
Nordstrom, Inc.
Notes to Consolidated Financial Statements
Dollar and share amounts in millions except per share, per option and per unit amounts
Non-financial Assets Measured at Fair Value on a Nonrecurring Basis | | | | | | | | |
| February 3, 2024 | January 28, 2023 |
| Carrying value of long-term debt | $2,862 | | $2,856 | |
| Fair value of long-term debt | 2,441 | | 2,278 | |
We also measure certain non-financial assetsitems at fair value on a nonrecurring basis, primarily goodwill, investment in contract asset and long-lived tangible and intangibleROU assets, in connection with periodic evaluations for potential impairment. We estimate the fair value of these assets using primarily unobservable inputs and, as such, these are considered Level 3 fair value measurements. There were no material impairment charges for these assets for fiscal year 2017.
In the third quarter of 2016, the long-term operating plan for Trunk Club was updated to reflect current expectations for future growthFor more information regarding long-lived tangible and profitability, which were lower than previous expectations. Due to lowered expectations, we tested Trunk Club goodwill for impairment one quarter prior to the annual evaluation. Step 1 test results indicated that the estimated fair value of the reporting unit was less than the carrying value.
In our Step 2 analysis, we used a combination of the expected present value of future cash flows (income approach) and comparable public companies (market approach) to determine the fair value of the reporting unit. These approaches use primarily unobservable inputs, including discount, sales growth and profit margin rates, which are considered Level 3 fair value measurements. The fair value analysis took into account recent and expected operating performance as well as the overall decline in the retail industry. Within our Retail Segment, we recognized a goodwill impairment charge of $197 in 2016, reducing Trunk Club goodwill to $64 as of January 28, 2017, from $261 as of January 30, 2016.
In 2015, we recordedROU asset impairment charges, of $59, which are included in our Retail Business selling, general and administrative expenses. For additional information related to goodwill, intangible assets, long-lived assets and impairments, see Note 1: Nature of Operations and Summary of Significant Accounting Policies.
During the year ended February 3, 2024, we measured our investment in Nordstrom Canada, our related-party receivables and related lease guarantees at fair value (see Note 2: Canada Wind-down). Investments Measured at NAV
We have certain investments that are measured at fair value using the NAV per share, or its equivalent, as a practical expedient. This class of investments consists of partnership interests that mainly invest in venture capital strategies with a focus on privately held consumer and technology companies. The NAV is based on the fair value of the underlying net assets owned by the fund and the relative interest of each participating investor in the fair value of the underlying assets. Our interest in these partnerships is generally not redeemable and is subject to significant restrictions regarding transfers. Distributions from each fund will be received as the underlying assets of the funds are liquidated. Liquidation is triggered by clauses within the partnership agreements or at the funds’ stated end date. The contractual terms of the partnership interests range from six to ten years. For more information regarding investments measured at NAV, see Note 1: Nature of Operations and Summary of Significant Accounting Policies.
NOTE 9: LEASES8: SELF-INSURANCE
Our self-insurance reserves are summarized as follows: | | | | | | | | |
| February 3, 2024 | January 28, 2023 |
| Workers’ compensation | $73 | | $78 | |
| Employee health and welfare | 28 | | 26 | |
| Other liability | 18 | | 12 | |
| Total self-insurance reserves | $119 | | $116 | |
We leaseare self-insured for the land or the land and buildings at many of our stores. Additionally, we lease office facilities, warehouses and equipment. Most of these leases are classified as operating leases and they expire at various dates through 2080. The majority of our fixed, non-cancellable lease terms are 15 to 30 years for Nordstrom full-line storesworkers’ compensation programs, employee health and 10 to 15 years for Nordstrom Rack stores. Many of our leases include options that allow us to extend the lease term beyond the initial commitment period, subject to terms agreed to at lease inception. Most of our leases also provide for payment of operating expenses, such as common area charges, real estate taxeswelfare coverage and other executory costs, and some leases require additional payments based on sales, referred to as “percentage rent.”
Future minimum lease payments as of February 3, 2018 are as follows: |
| | | | |
| Fiscal year | | Operating leases |
|
| 2018 | |
| $309 |
|
| 2019 | | 312 |
|
| 2020 | | 293 |
|
| 2021 | | 269 |
|
| 2022 | | 247 |
|
| Thereafter | | 1,310 |
|
| Total minimum lease payments | |
| $2,740 |
|
Rent expense for 2017, 2016 and 2015 was as follows: |
| | | | | | | | | | | |
| Fiscal year | 2017 |
| | 2016 |
| | 2015 |
|
| Minimum rent: | | | | | |
| Store locations |
| $274 |
| |
| $230 |
| |
| $204 |
|
| Offices, warehouses and equipment | 44 |
| | 40 |
| | 41 |
|
| Percentage rent | 11 |
| | 12 |
| | 13 |
|
| Property incentives | (79 | ) | | (80 | ) | | (82 | ) |
| Total rent expense |
| $250 |
|
|
| $202 |
|
|
| $176 |
|
The rent expense above does not include common area charges, real estate taxes and other executory costs, which were $121 in 2017, $112 in 2016 and $97 in 2015.
liability.
Nordstrom, Inc. and subsidiaries5363
Nordstrom, Inc.
Notes to Consolidated Financial Statements
(Dollar and share amounts in millions except per share, per option and per unit amountsamounts)
NOTE 10: COMMITMENTS AND CONTINGENCIES
Our estimated total purchaseworkers’ compensation policies have a retention per claim of $1 or less and no policy limits. Approximately 30% of our workers’ compensation obligations capital expenditure contractual commitmentsare payable within one year. In connection with our workers’ compensation programs, we have a standby letter of credit issued on our behalf with $13 available and inventory purchase orders were $1,462$2 outstanding as of February 3, 2018. In connection with the purchase of foreign merchandise, we have no outstanding trade letters2024. This letter of credit is not reflected in our Consolidated Balance Sheets.
Our employee health and welfare programs do not use stop-loss coverage and participants contribute to the cost of their coverage through premiums and out-of-pocket expenses for deductibles, copays and coinsurance.
Other liability primarily includes commercial general liability obligations. Our commercial general liability policy, with a limit up to $111, has a retention per claim of $1 or less. Approximately 50% of our other liability reserve obligations are payable within one year.
NOTE 9: SUPPLEMENTAL EXECUTIVE RETIREMENT PLAN
We have a SERP, which provides retirement benefits to certain officers and select employees. The SERP has different benefit levels depending on the participant’s role. At the end of 2023, we had 57 participants in the plan, including five officers and select employees eligible for SERP benefits, 47 retirees and five beneficiaries. This plan is nonqualified and does not have a minimum funding requirement. We selected the measurement date of January 31, the calendar month end closest to our fiscal year end, to value our SERP.
Benefit Obligation and Funded Status
Our benefit obligation and funded status is as follows: | | | | | | | | |
| February 3, 2024 | January 28, 2023 |
| Change in benefit obligation: | | |
| Benefit obligation at beginning of year | $176 | | $212 | |
| Participant service cost | 1 | | 2 | |
| Interest cost | 9 | | 6 | |
| Benefits paid | (11) | | (10) | |
| Actuarial gain | (7) | | (34) | |
| | |
| Benefit obligation at end of year | 168 | | 176 | |
| Change in plan assets: | | |
| Fair value of plan assets at beginning of year | — | | — | |
| Employer contribution | 11 | | 10 | |
| Benefits paid | (11) | | (10) | |
| Fair value of plan assets at end of year | — | | — | |
| Underfunded status at end of year | ($168) | | ($176) | |
The accumulated benefit obligation, which is the present value of February 3, 2018.benefits, assuming no future compensation changes, was $168 and $175 at the end of 2023 and 2022. Amounts recognized as liabilities in the Consolidated Balance Sheets consist of the following: | | | | | | | | |
| February 3, 2024 | January 28, 2023 |
| Accrued salaries, wages and related benefits | $12 | | $11 | |
| Other liabilities (noncurrent) | 156 | | 165 | |
| Net amount recognized | $168 | | $176 | |
Plans forComponents of SERP Expense
The components of SERP expense recognized in SG&A expense on the Consolidated Statements of Earnings are as follows: | | | | | | | | | | | |
| Fiscal year | 2023 | 2022 | 2021 |
| Participant service cost | $1 | | $2 | | $2 | |
| Interest cost | 9 | | 6 | | 5 | |
| Amortization of net loss and other | — | | 4 | | 8 | |
| Total SERP expense | $10 | | $12 | | $15 | |
Nordstrom, Inc.
Notes to Consolidated Financial Statements
(Dollar and share amounts in millions except per share, per option and per unit amounts)
Accumulated Other Comprehensive Gain (Loss)
Amounts recognized in accumulated other comprehensive gain (loss) (pre-tax) consist of the following:
| | | | | | | | | | | |
| Fiscal year | 2023 | 2022 | 2021 |
| Actuarial gain | ($7) | | ($34) | | ($14) | |
| Amortization of net loss and other | — | | (4) | | (8) | |
| Amounts recognized in accumulated other comprehensive gain (loss) | ($7) | | ($38) | | ($22) | |
Assumptions
Weighted-average assumptions used to determine our Nordstrom NYC store, which we currently expect to open in 2019, ultimately include owning a condominium interest in a mixed-use towerbenefit obligation and leasing certain nearby properties. SERP expense are as follows: | | | | | | | | | | | |
| Fiscal year | 2023 | 2022 | 2021 |
| Assumptions used to determine benefit obligation: | | | |
| Discount rate | 5.27 | % | 4.95 | % | 3.19 | % |
| Rate of compensation increase | 2.50 | % | 2.50 | % | 2.50 | % |
| Assumptions used to determine SERP expense: | | | |
| Discount rate | 4.95 | % | 3.19 | % | 2.62 | % |
| Rate of compensation increase | 2.50 | % | 2.50 | % | 2.50 | % |
| | | |
Future Benefit Payments and Contributions
As of February 3, 2018,2024, the expected future benefit payments based upon the assumptions described above and including benefits attributable to estimated future employee service are as follows: | | | | | |
| Fiscal year | |
| 2024 | $12 | |
| 2025 | 12 | |
| 2026 | 13 | |
| 2027 | 13 | |
| 2028 | 13 | |
| 2029 – 2033 | 61 | |
| Thereafter | 44 | |
NOTE 10: STOCK-BASED COMPENSATION
Under our deferred and stock-based compensation plan arrangements, we issued 2.4, 3.4 and 1.6 shares of common stock in 2023, 2022 and 2021. On June 6, 2023, our shareholders approved an amendment to the 2019 Equity Incentive Plan. The amendment increases common stock available for issuance by 15.0 shares.Under the 2019 Plan, the aggregate number of shares to be issued may not exceed 39.5 plus any shares currently outstanding under the 2010 Plan that are forfeited or expire during the term of the 2019 Plan. As of February 3, 2024, we had approximately $28939.5 shares authorized, 14.8 shares issued and outstanding and 23.9 shares remaining available for future grants under the 2019 Plan.
Under the ESPP, employees may make payroll deductions of fee interestup to 15% of their base compensation for the purchase of Nordstrom common stock. At the end of each six-month offering period, participants apply their accumulated payroll deductions toward the purchase of shares of our common stock at 90% of the fair market value on the last day of the offer period. On June 6, 2023, our shareholders approved an amendment under the ESPP. The amendment increases common stock available for purchase by 3.5 shares. As of February 3, 2024, we had 19.6 shares authorized and 4.9 shares available for issuance under the ESPP. We issued 1.0, 0.9 and 0.5 shares under the ESPP during 2023, 2022 and 2021. At the end of 2023 and 2022, we had current liabilities of $5 and $6 for future purchases of shares under the ESPP.
Nordstrom, Inc. and subsidiaries65
Nordstrom, Inc.
Notes to Consolidated Financial Statements
(Dollar and share amounts in land,millions except per share, per option and per unit amounts)
The following table summarizes our stock-based compensation expense: | | | | | | | | | | | |
| Fiscal year | 2023 | 2022 | 2021 |
| RSUs | $40 | | $41 | | $52 | |
| Stock options | 6 | | 11 | | 22 | |
Other1 | 6 | | 7 | | 5 | |
| Total stock-based compensation expense, before income tax benefit | 52 | | 59 | | 79 | |
| Income tax benefit | (13) | | (15) | | (20) | |
| Total stock-based compensation expense, net of income tax benefit | $39 | | $44 | | $59 | |
1 Other stock-based compensation expense includes PSUs, ESPP and nonemployee director stock awards. The stock-based compensation expense before income tax benefit was recorded in our Consolidated Statements of Earnings as follows: | | | | | | | | | | | |
| Fiscal year | 2023 | 2022 | 2021 |
| Cost of sales and related buying and occupancy costs | $10 | | $9 | | $15 | |
| SG&A expenses | 42 | | 50 | | 64 | |
| Total stock-based compensation expense, before income tax benefit | $52 | | $59 | | $79 | |
Restricted Stock
Our Compensation, People and Culture Committee of our Board of Directors approves grants of restricted stock units to employees. The number of units granted to an individual are determined based upon award amounts and the fair value of the restricted stock units at the time of grant. Restricted stock units typically vest over four years.
A summary of restricted stock unit activity for 2023 is presented below: | | | | | | | | |
| Fiscal year | 2023 |
| | Shares | Weighted-average grant date fair value per unit |
| Outstanding, beginning of year | 4.6 | | $32 | |
| Granted | 3.6 | | 16 | |
| Vested | (1.3) | | 26 | |
| Forfeited or canceled | (0.7) | | 21 | |
| Outstanding, end of year | 6.2 | | $19 | |
The aggregate fair value of restricted stock units vested during 2023, 2022 and 2021 was $33, $62 and $50. As of February 3, 2024, the total unrecognized stock-based compensation expense related to nonvested restricted stock units was $69, which is expected to convertbe recognized over a weighted-average period of 24 months.
Nordstrom, Inc.
Notes to Consolidated Financial Statements
(Dollar and share amounts in millions except per share, per option and per unit amounts)
Stock Options
Our Compensation, People and Culture Committee of our Board of Directors approves grants of nonqualified stock options to employees. The number of awards granted to an individual are determined based upon award amounts and the condominium interest oncefair value of stock options at the storetime of grant. Our options primarily vest equally over a four-year period or at the end of two years, and expire ten years after the date of grant. We used the following assumptions to estimate the fair value for stock options at each grant date:
| | | | | | | | | | | | | | |
| Fiscal year | 2023 | 2022 | 20211 |
| Assumptions | | | |
| Risk-free interest rate2 | 3.98% – 5.05% | 1.18% – 1.95% | 0.11% – 1.51% |
| Weighted-average volatility3 | 52.3 | % | 52.4 | % | 52.2 | % |
| Weighted-average expected dividend yield4 | 3.8 | % | 3.4 | % | 3.4 | % |
| Expected life in years5 | 8.2 | 8.3 | 8.3 |
| | | | |
| Grant Date Information | | | |
| Date of grant | March 6, 2023 | March 3, 2022 | March 4, 2021 |
| Weighted-average fair value per option | $8 | | $10 | | $13 | |
| Exercise price per option | $20 | | $26 | | $36 | |
1 The options granted on March 4, 2021 include market performance-based stock options with a contractual term of ten years that were awarded to certain members of senior management as well as time-based options. The price-hurdle options contain a market condition that requires the closing price of our stock to meet or exceed certain price thresholds for 20 consecutive trading days in order for shares to vest.
2 Represents the yield on U.S. Treasury securities that mature over the 10-year life of the stock options.
3 Based on a combination of the historical volatility of our common stock and the implied volatility of exchange-traded options for our common stock.
4 Our forecasted dividend yield for the next 10 years.
5 Derived from the output of the binomial lattice model and represents the estimated period of time until option exercise. The expected term of options granted is constructed. We have committed to make future installment payments based on our historical exercise behavior, taking into consideration the developer meeting pre-established constructioncontractual term of the option and development milestones. Inour employees’ expected exercise and post-vesting employment termination behavior.
A summary of stock option activity for 2023 is presented below: | | | | | | | | | | | | | | |
| Fiscal year | 2023 |
| | Shares | Weighted- average exercise price | Weighted-average remaining contractual life (years) | Aggregate intrinsic value1 |
| Outstanding, beginning of year | 8.5 | | $38 | | | |
| Granted | 1.1 | | 20 | | | |
| Exercised | (0.3) | | 16 | | | |
| Forfeited or canceled | (1.7) | | 44 | | | |
| Outstanding, end of year | 7.6 | | $35 | | 5 | $5 | |
| Exercisable, end of year | 4.8 | | $40 | | 4 | $5 | |
| | | | |
| Fiscal year | | 2023 | 2022 | 2021 |
| Aggregate intrinsic value of options exercised | | $1 | | $4 | | $— | |
| Fair value of stock options vested | | $4 | | $27 | | $2 | |
1 The aggregate intrinsic value represents the event that this projectamount realized if all in-the-money options were exercised on the final business day before February 3, 2024.
As of February 3, 2024, the total unrecognized stock-based compensation expense related to nonvested stock options was $6, which is not completed, the opening mayexpected to be delayedrecognized over a weighted-average period of 10 months.
Nordstrom, Inc. and we may be subjectsubsidiaries67
Nordstrom, Inc.
Notes to future losses or capital commitmentsConsolidated Financial Statements
(Dollar and share amounts in order to complete construction or to monetize our investment in the land.millions except per share, per option and per unit amounts)
NOTE 11: SHAREHOLDERS’ EQUITY
We have certain limitations with respect to the payment of dividends and share repurchases under our Revolver agreement (see Note 6: Debt and Credit Facilities).
Changes in the number of issued and outstanding shares of our common stock in2023, 2022 and 2021 are the result of share repurchases and compensation plan issuances (see Note 10: Stock-based Compensation).
Share Repurchases
In May 2022, our Board of Directors authorized a new program to repurchase up to $500 of our outstanding common stock, with no expiration date, which replaced the August 2018 program. The following is a summary of the activity related to our share repurchase programs in 2015, 2016 and 2017:programs: | | | | | | | | | | | |
| Shares | Average price per share | Amount |
| Capacity at January 30, 2021 | | | $707 | |
| | | |
| Shares repurchased | — | | — | | — | |
| | | |
| Capacity at January 29, 2022 | | | 707 | |
| August 2018 program termination | | | (707) | |
| May 2022 program authorization (no expiration) | | | 500 | |
| Shares repurchased | 2.8 | | $22 | | (62) | |
| Capacity at January 28, 2023 | | | 438 | |
Shares repurchased1 | 0.03 | | $19 | | (1) | |
Capacity at February 3, 20241 | | | $438 | |
|
| | | | | | | | | | |
| | Shares |
| | Average price per share |
| | Amount |
|
| Capacity at January 31, 2015 | | | | |
| $1,075 |
|
| October 2015 authorization (ended March 1, 2017) | | | | | 1,000 |
|
| Shares repurchased | 19.1 |
| |
| $63 |
| | (1,191 | ) |
Expiration of unused capacity in March 20151 | | | | | (73 | ) |
| Capacity at January 30, 2016 | | | | | 811 |
|
| Shares repurchased | 5.9 |
| |
| $48 |
| | (282 | ) |
| Capacity at January 28, 2017 | | | | | 529 |
|
| February 2017 authorization (ending August 31, 2018) | | | | | 500 |
|
| Shares repurchased | 4.6 |
| |
| $45 |
| | (206 | ) |
| Expiration of unused October 2015 authorization capacity in March 2017 | | | | | (409 | ) |
| Capacity at February 3, 2018 | | | | |
| $414 |
|
1 Expiration relates to the February 2013 program.
The actual timing, price, manner and amounts of future share repurchases, if any, will be subject to market and economic conditions and applicable SEC rules.Dividends
We paid dividends of $1.48$0.76 per share in 20172023 and 2016in 2022 and $6.33 per sharenone in 2015. Dividends paid in 2015 included a special cash dividend of $905, or $4.85 per share of outstanding common stock, in addition to our quarterly dividends totaling $1.48 per share. The special dividend was authorized by our Board of Directors on October 1, 2015, and was paid using proceeds from the sale of our credit card receivables (see Note 2: Credit Card Receivable Transaction).
2021. In February 2018,2024, subsequent to year end, we declared a quarterly dividend of $0.37$0.19 per share, which will be paid on March 20, 2018.27, 2024 to shareholders of record as of March 12, 2024.
NOTE 12: STOCK-BASED COMPENSATION
We currently grant stock-based awards underIn September 2022, our 2010Board of Directors approved a shareholder rights agreement and declared a dividend of one right for each outstanding share of Nordstrom common stock to shareholders of record on September 30, 2022. In June 2023, shareholders approved an advisory vote on the extension of our Rights Plan 2002 Planat our 2023 Annual Meeting, and Trunk Club VCP, and employees mayin August 2023, the Board of Directors extended the expiration date to September 19, 2025, unless redeemed, exchanged or terminated earlier by our Board. Each right entitles holders to purchase ourone newly issued share of Nordstrom common stock at a discount underan exercise price of $94 per right, subject to adjustment. Initially, the rights are not exercisable and trade with our employee stock purchase plan (“ESPP”).In 2010, our shareholders approved the adoption of the 2010 Plan, which replaced the 2004 Equity Incentive Plan (“2004 Plan”). The 2010 Plan authorizes the grant of stock options, restricted stock, performance share units, stock appreciation rights and unrestricted shares of common stock.
In general, the rights become exercisable following a public announcement that a person acquires 10% or more of the outstanding shares of Nordstrom common stock. If the rights are exercised, each holder (except the acquiring person) will have the right to receive common stock equal to employees. On May 16, 2017, our shareholders approved an amendmenttwo times the exercise price of the right. The Company may redeem the rights for $0.001 per right anytime prior to the 2010 Equity Incentive Plan.rights becoming exercisable. The amendment increases common stock availableagreement also provides for issuance by 6.2. The aggregate number of shares to be issued under the 2010 Plan may not exceed 30.4 plus any sharesexceptions and additional terms for other certain situations and circumstances. There is currently outstanding under the 2004 Plan that are forfeited or expire during the term of the 2010 Plan. No future grants will be made under the 2004 Plan. As of February 3, 2018, we have 77.5 shares authorized, 52.8 shares issued and outstanding and 8.7 shares remaining available for future grants under the 2010 Plan.
The 2002 Plan authorizes the grant of stock awardsno impact to our nonemployee directors. These awards may be deferred or issued in the formConsolidated Financial Statements.
NOTE 12: INCOME TAXES
U.S. and foreign components of restricted or unrestricted stock, non-qualified stock options or stock appreciation rights. As of February 3, 2018, we had 0.9 shares authorized and 0.4 shares available for issuance under this plan. In 2017, total expense on deferred shares was less than $1.
earnings before income taxes were as follows: | | | | | | | | | | | |
| Fiscal year | 2023 | 2022 | 2021 |
| U.S. | $143 | $316 | $241 |
| Foreign | 4 | 21 | 5 |
| Earnings before income taxes | $147 | $337 | $246 |
| | | |
Nordstrom, Inc.
Notes to Consolidated Financial Statements
(Dollar and share amounts in millions except per share, per option and per unit amountsamounts)
The Trunk Club VCP is a performance-based plan that provides for three payout scenarios based on the results of Trunk Club’s business meeting minimum or exceeding maximum 2018 sales and earnings metrics. As of February 3, 2018, we granted 0.6 of the 1.0 units available for grant. There is no unrecognized stock-based compensation expense related to nonvested VCP units as no payout is expected. If at any time it becomes probable that another outcome will be achieved, compensation expense will be cumulatively adjusted based on the grant date fair value associated with that payout scenario.
Under the ESPP, employees may make payroll deductions of up to 10% of their base and bonus compensation for the purchase of Nordstrom common stock. At the end of each six-month offering period, participants apply their accumulated payroll deductions toward the purchase of shares of our common stock at 90% of the fair market value on the last day of the offer period. As of February 3, 2018, we had 12.6 shares authorized and 2.2 shares available for issuance under the ESPP. We issued 0.4 shares under the ESPP during 2017 and 2016. At the end of 2017 and 2016, we had current liabilities of $6 for future purchases of shares under the ESPP.
The following table summarizes our stock-based compensation expense: |
| | | | | | | | | | | |
| Fiscal year | 2017 |
| | 2016 |
| | 2015 |
|
| Stock options |
| $18 |
| |
| $36 |
| |
| $33 |
|
| Restricted stock units | 51 |
| | 34 |
| | 18 |
|
| Acquisition-related stock compensation | 1 |
| | 15 |
| | 17 |
|
| Performance share units | 2 |
| | 1 |
| | (3 | ) |
| Other | 5 |
| | 5 |
| | 5 |
|
| Total stock-based compensation expense, before income tax benefit | 77 |
| | 91 |
| | 70 |
|
| Income tax benefit | (20 | ) | | (28 | ) | | (21 | ) |
| Total stock-based compensation expense, net of income tax benefit |
| $57 |
| |
| $63 |
| |
| $49 |
|
The stock-based compensation expense before income tax benefit was recorded in our Consolidated Statements of Earnings as follows: |
| | | | | | | | | | | |
| Fiscal year | 2017 |
| | 2016 |
| | 2015 |
|
| Cost of sales and related buying and occupancy costs |
| $25 |
| |
| $25 |
| |
| $20 |
|
| Selling, general and administrative expenses | 52 |
| | 66 |
| | 50 |
|
| Total stock-based compensation expense, before income tax benefit |
| $77 |
| |
| $91 |
| |
| $70 |
|
The benefit of tax deductions in excess of the compensation cost recognized for stock-based awards is classified as operating cash inflows and is reflected as excess tax benefit from stock-based compensation in the Consolidated Statements of Cash Flows.
Special Dividend Adjustment
In connection with the closing of our credit card receivable transaction on October 1, 2015, our Board of Directors authorized a special cash dividend of $4.85 per share (see Note 11: Shareholders’ Equity). As required by our equity incentive plan’s non-discretionary anti-dilutive provisions, an adjustment was made to outstanding awards to prevent dilution of their value resulting from the special cash dividend. These adjustments did not result in incremental stock-based compensation expense as the fair value measure of the awards were the same immediately before and after the adjustment. The adjustments to awards included increasing the number of outstanding restricted stock units, stock options and performance shares, as well as reducing the exercise prices of outstanding stock options.
Nordstrom, Inc. and subsidiaries55
Nordstrom, Inc.
Notes to Consolidated Financial Statements
Dollar and share amounts in millions except per share, per option and per unit amounts
Stock Options
Our Compensation Committee of our Board of Directors approves annual grants of nonqualified stock options to employees. We used the following assumptions to estimate the fair value for stock options at each grant date (excluding options granted in connection with the Trunk Club acquisition):
|
| | | | | | | | | | | | |
| Fiscal Year | 2017 |
| | 2016 |
| | 2015 |
|
| Assumptions | | | | | |
| | Risk-free interest rate: Represents the yield on U.S. Treasury zero-coupon securities that mature over the 10-year life of the stock options. | 1.0% – 2.5% |
| | 0.7% – 1.9% |
| | 0.2% – 2.1% |
|
| | Weighted-average volatility: Based on a combination of the historical volatility of our common stock and the implied volatility of exchange-traded options for our common stock. | 40.1 | % | | 36.8 | % | | 29.4 | % |
| | Weighted-average expected dividend yield: Our forecasted dividend yield for the next 10 years. | 2.4 | % | | 2.2 | % | | 1.8 | % |
| | Expected life in years: Represents the estimated period of time until option exercise. The expected term of options granted was derived from the output of the Binomial Lattice option valuation model and was based on our historical exercise behavior, taking into consideration the contractual term of the option and our employees’ expected exercise and post-vesting employment termination behavior. | 7.1 |
| | 6.9 |
| | 6.7 |
|
| | | | | | | |
| Grant Date Information | | | | | |
| | Date of grant | February 28, 2017 |
| | February 29, 2016 |
| | February 24, 2015 |
|
| | Weighted-average fair value per option |
| $16 |
| |
| $16 |
| |
| $21 |
|
| | Exercise price per option |
| $47 |
| |
| $51 |
| |
| $81 |
|
Supplemental nonqualified stock options were also granted to certain company leaders on June 7, 2016, at an exercise price per option of $41. The assumptions used to estimate the fair value for the supplemental stock options were similar to the 2016 annual grant assumptions. The weighted-average fair value per option at the grant date was $13. In 2016, we also granted stock options to certain qualified employees outside of the annual and supplemental grant dates, which were insignificant in aggregate. The number of awards granted to an individual are determined based upon a percentage of the recipient’s base salary and the fair value of the stock options. Options typically vest over four years, and expire 10 years after the date of grant.
A summary of stock option activity for 2017, which includes awards issued as part of the Trunk Club acquisition in 2014, is presented below: |
| | | | | | | | | | | | | | |
| Fiscal year | 2017 |
| | Shares |
| | Weighted- average exercise price |
| | Weighted-average remaining contractual life (years) |
| | Aggregate intrinsic value |
|
| Outstanding, beginning of year | 13.5 |
| |
| $48 |
| | | | |
| Granted | 0.3 |
| | 47 |
| | | | |
| Exercised | (0.7 | ) | | 30 |
| | | | |
| Forfeited or cancelled | (0.8 | ) | | 54 |
| | | | |
| Outstanding, end of year | 12.3 |
| |
| $49 |
| | 5 |
| |
| $52 |
|
| Exercisable, end of year | 9.1 |
| |
| $47 |
| | 4 |
| |
| $49 |
|
| Vested or expected to vest, end of year | 11.8 |
| |
| $49 |
| | 5 |
| |
| $52 |
|
| | | | | | | | |
| Fiscal year | | | 2017 |
| | 2016 |
| | 2015 |
|
| Aggregate intrinsic value of options exercised | | |
| $13 |
| |
| $30 |
| |
| $62 |
|
| Fair value of stock options vested | | |
| $34 |
| |
| $40 |
| |
| $44 |
|
As of February 3, 2018, the total unrecognized stock-based compensation expense related to nonvested stock options was $22, which is expected to be recognized over a weighted-average period of 21 months.
Nordstrom, Inc.
Notes to Consolidated Financial Statements
Dollar and share amounts in millions except per share, per option and per unit amounts
Restricted Stock
Our Compensation Committee of our Board of Directors approves grants of restricted stock units to employees. The number of units granted to an individual are determined based upon a percentage of the recipient’s base salary and the fair value of the restricted stock. Restricted stock units typically vest over four years.
A summary of restricted stock unit activity for 2017 is presented below: |
| | | | | | |
| Fiscal year | 2017 |
| | Shares |
| | Weighted-average grant date fair value per unit |
|
| Outstanding, beginning of year | 2.3 |
| |
| $49 |
|
| Granted | 1.9 |
| | 42 |
|
| Vested | (0.5 | ) | | 56 |
|
| Forfeited or cancelled | (0.4 | ) | | 63 |
|
| Outstanding, end of year | 3.3 |
| |
| $45 |
|
The aggregate fair value of restricted stock units vested during 2017, 2016 and 2015 was $26, $17 and $11. As of February 3, 2018, the total unrecognized stock-based compensation expense related to nonvested restricted stock units was $83, which is expected to be recognized over a weighted-average period of 28 months.
Performance Share Units
We grant performance share units to executive officers as one of the ways to align compensation with shareholder interests. Performance share units are earned after a three-year performance cycle only when our total shareholder return (reflecting daily stock price appreciation and compounded reinvestment of dividends) outperforms companies in a defined peer group determined by the Compensation Committee of our Board of Directors. The percentage of units that are earned depends on our relative position at the end of the performance cycle and can range from 0% to 175% of the number of units granted.
Beginning in 2016, performance share units are payable only in Company stock and are classified as equity awards. We record compensation cost based upon the value of the underlying stock at the date of grant. The provisions of the performance share units are considered a market condition, and therefore the effect of that market condition is reflected in the grant date fair value of the award. We used a Monte-Carlo simulation to account for the market condition in the fair value of the award. Compensation cost is recognized regardless of whether the market condition is actually satisfied; however, the compensation cost is reversed if an employee terminates prior to satisfying the requisite service period. Dividends are not paid during the performance period.
Our 2015 performance share units are liability-based awards due to our ability to settle them in cash or stock as elected by the employee. As liability-based awards, they are remeasured, with a corresponding adjustment to earnings, at each fiscal quarter-end during the performance cycle. The performance share unit liability is remeasured using the estimated percentage of units earned multiplied by the closing market price of our common stock on the current period-end date and is pro-rated based on the amount of time that has passed in the vesting period. The price used to determine the amount of cash or stock settled for the performance share units upon vesting is the closing market price of our common stock on the last day of the performance cycle.
The following is a summary of performance share unit activity, which assumes performance share units vest at 100% of the number of units granted: |
| | |
Fiscal year | 2017 |
|
Outstanding units, beginning of year | 0.2 |
|
Granted | 0.1 |
|
Vested | — |
|
Forfeited or cancelled | (0.1 | ) |
Outstanding units, end of year | 0.2 |
|
No performance share units were earned nor vested in 2017. In both 2016 and 2015, performance share units earned and vested at 75%, there was a stock and cash settlement of $3 and performance share units earned were less than 0.1.
Nordstrom, Inc. and subsidiaries57
Nordstrom, Inc.
Notes to Consolidated Financial Statements
Dollar and share amounts in millions except per share, per option and per unit amounts
As of February 3, 2018, there were no liabilities recorded for performance share units and there was $4 in remaining unrecognized stock-based compensation expense for unvested performance share units.
NOTE 13: INCOME TAXES
In December 2017, the Tax Act was signed into law. Among numerous other provisions, the Tax Act significantly revises the U.S. federal corporate income tax by reducing the statutory rate from 35% to 21%, imposing a mandatory one-time transition tax on accumulated unrepatriated earnings of foreign subsidiaries and enhancing and extending the option to claim accelerated depreciation on qualified property. The Tax Act also revises tax laws that will affect 2018, including, but not limited to, eliminating certain deductions for executive compensation and limiting the deduction for interest. We have reasonably estimated the effects of the Tax Act and recorded provisional amounts in our Consolidated Financial Statements as of February 3, 2018. Net earnings included $42 related to the Tax Act, which includes a provisional one-time, non-cash charge of $51 related to the revaluation of our net deferred tax assets for the change in statutory tax rate and for the impacts associated with the future limitations on executive compensation, partially offset by cash tax savings from a lower federal tax rate. As we complete our analysis of the Tax Act and interpret any additional guidance issued by the U.S. Treasury Department, the IRS and other standard-setting bodies, we may make adjustments to the provisional amounts, which may materially impact our provision for income taxes in the period in which the adjustments are recorded.
U.S. and foreign components of earnings before income taxes were as follows: |
| | | | | | | | | | | |
| Fiscal year | 2017 |
| | 2016 |
| | 2015 |
|
| U.S. |
| $803 |
| |
| $687 |
| |
| $996 |
|
| Foreign | (13 | ) | | (3 | ) | | (20 | ) |
| Earnings before income taxes |
| $790 |
| |
| $684 |
| |
| $976 |
|
Income tax expense consists of the following: | | | | | | | | | | | |
| Fiscal year | 2023 | | 2022 | | 2021 | |
| Current income taxes: | | | |
| Federal | $55 | | $149 | | $61 | |
| State and local | 18 | | 27 | | 18 | |
| Foreign | — | | (1) | | — | |
| Total current income tax expense | 73 | | 175 | | 79 | |
| Deferred income taxes: | | | |
| Federal | (59) | | (86) | | (10) | |
| State and local | (10) | | (2) | | (5) | |
| Foreign | 9 | | 5 | | 4 | |
| Total deferred income tax benefit | (60) | | (83) | | (11) | |
| Total income tax expense | $13 | | $92 | | $68 | |
|
| | | | | | | | | | | |
| Fiscal year | 2017 |
| | 2016 |
| | 2015 |
|
| Current income taxes: | | | | | |
| Federal |
| $291 |
| |
| $290 |
| |
| $202 |
|
| State and local | 51 |
| | 54 |
| | 32 |
|
| Foreign | — |
| | 1 |
| | — |
|
| Total current income tax expense | 342 |
| | 345 |
| | 234 |
|
| Deferred income taxes: | | | | | |
| Federal | 10 |
| | (17 | ) | | 123 |
|
| State and local | 1 |
| | (5 | ) | | 23 |
|
| Foreign | — |
| | 7 |
| | (4 | ) |
| Total deferred income tax (benefit) expense | 11 |
| | (15 | ) | | 142 |
|
| Total income tax expense |
| $353 |
| |
| $330 |
| |
| $376 |
|
A reconciliation of the statutory federal income tax rate to the effective tax rate on earnings before income taxes is as follows: | | | | | | | | | | | |
| Fiscal year | 2023 | | 2022 | | 2021 | |
| Statutory rate | 21.0 | % | 21.0 | % | 21.0 | % |
| CARES Act impact | — | | — | | (0.9 | %) |
| State and local income taxes, net of federal income taxes | 4.0 | % | 5.9 | % | 3.4 | % |
| Federal credits | (4.7 | %) | (3.8 | %) | (4.0 | %) |
| Non-deductible expenses | 2.9 | % | 1.2 | % | 2.7 | % |
| Stock-based compensation | 5.1 | % | 1.8 | % | 2.0 | % |
| Valuation allowance | 6.6 | % | 0.4 | % | 1.8 | % |
| Taxes on foreign operations | 1.5 | % | 1.6 | % | 1.3 | % |
| Excess tax over book loss on Canada wind-down | (18.2 | %) | — | | — | |
| Resolution of prior period tax matters | (11.2 | %) | — | | — | |
| Other, net | 1.6 | % | (0.9 | %) | 0.2 | % |
| Effective tax rate | 8.6 | % | 27.2 | % | 27.5 | % |
|
| | | | | | | | |
| Fiscal year | 2017 |
| | 2016 |
| | 2015 |
|
Statutory rate1 | 33.7 | % | | 35.0 | % | | 35.0 | % |
| Tax Act impact | 6.1 | % | | — |
| | — |
|
| Goodwill impairment | — |
| | 10.1 | % | | — |
|
| State and local income taxes, net of federal income taxes | 4.5 | % | | 5.1 | % | | 4.1 | % |
| Non-deductible acquisition-related items | 0.3 | % | | 0.6 | % | | 0.4 | % |
| Federal credits | (0.7 | %) | | (0.6 | %) | | (0.6 | %) |
| Other, net | 0.8 | % | | (2.0 | %) | | (0.3 | %) |
| Effective tax rate | 44.7 | % | | 48.2 | % | | 38.6 | % |
1The statutory rate in 2017 is reduced due tocomponents of deferred tax reform.
assets and liabilities are as follows: | | | | | | | | |
| February 3, 2024 | January 28, 2023 |
| Deferred tax assets: | | |
| Lease liabilities | $425 | | $463 | |
| Compensation and benefits accruals | 104 | | 111 | |
| Sales return reserve | 56 | | 61 | |
| Accrued expenses | 31 | | 28 | |
| Merchandise inventories | 36 | | 33 | |
| Gift cards | 39 | | 43 | |
| The Nordy Club loyalty program | 2 | | 8 | |
| Net operating losses | 38 | | 52 | |
| Other | 36 | | 25 | |
| Total deferred tax assets | 767 | | 824 | |
| Valuation allowance | (1) | | (28) | |
| Total deferred tax assets, net of valuation allowance | 766 | | 796 | |
| Deferred tax liabilities: | | |
| ROU assets | (310) | | (331) | |
| Land, property and equipment | (164) | | (230) | |
| Debt exchange premium | (11) | | (12) | |
| Total deferred tax liabilities | (485) | | (573) | |
| Net deferred tax assets | $281 | | $223 | |
58Nordstrom, Inc. and subsidiaries69
Nordstrom, Inc.
Notes to Consolidated Financial Statements
(Dollar and share amounts in millions except per share, per option and per unit amountsamounts)
The components of deferred tax assets and liabilities are as follows: |
| | | | | | | |
| | February 3, 2018 |
| | January 28, 2017 |
|
| Compensation and benefits accruals |
| $148 |
| |
| $209 |
|
| Allowance for sales returns | 50 |
| | 76 |
|
| Credit card receivable transaction | 8 |
| | 13 |
|
| Accrued expenses | 27 |
| | 39 |
|
| Merchandise inventories | 12 |
| | 43 |
|
| Gift cards | 27 |
| | 33 |
|
| Federal benefit of state taxes | 16 |
| | 18 |
|
| Net operating losses | 22 |
| | 12 |
|
| (Loss) Gain on sale of interest rate swap | (1 | ) | | 4 |
|
| Other | 3 |
| | 18 |
|
| Total deferred tax assets | 312 |
| | 465 |
|
| Valuation allowance | (51 | ) | | (37 | ) |
| Total net deferred tax assets | 261 |
| | 428 |
|
| Land, property and equipment basis and depreciation differences | (109 | ) | | (258 | ) |
| Debt exchange premium | (14 | ) | | (23 | ) |
| Total deferred tax liabilities | (123 | ) | | (281 | ) |
| Net deferred tax assets |
| $138 |
| |
| $147 |
|
As of February 3, 2018, our state and foreignfollowing sets forth information on approximate net operating loss carryforwards for income tax
purposes were approximately $11 and $64. As of January 28, 2017, our state and foreign net operating loss carryforwards for income tax purposes were approximately $11 and $37. purposes: | | | | | | | | |
| February 3, 2024 | January 28, 2023 |
| State | $621 | | $756 | |
| Foreign | — | | 26 | |
The net operating loss carryforwards are subject to certain statutory limitations of the Internal Revenue Code, applicable state laws and applicable foreign laws. If not utilized, a portion of our state and foreign net operating loss carryforwards will begin to expire in 20312024.
As of February 3, 2024 and 2033. Management believes it is more likely than not that certainJanuary 28, 2023, the valuation allowance for deferred tax assets was $1 and $28. As a result of the wind-down of our Canada operations in 2023, the valuation allowance for foreign deferred tax assets increased $9 and upon deconsolidation was written off to zero. The write-off of the deferred tax assets and corresponding valuation allowance for Canada was included in the Canada wind-down costs. In 2023, a valuation allowance of $1 was recorded for state and foreign net operating loss carryforwards and deferred tax assets of foreign subsidiariesthat will not be realized in the foreseeable future. As such, aThere was no change to the valuation allowance of $51 and $37 have been recorded as of February 3, 2018 and January 28, 2017.in 2022.
A reconciliation of the beginning and ending amount of unrecognized tax benefits is as follows: | | | | | | | | | | | |
| Fiscal year | 2023 | 2022 | 2021 |
| Unrecognized tax benefit at beginning of year | $48 | | $47 | | $32 | |
| Gross increase to tax positions in prior periods | 1 | | 1 | | 11 | |
| Gross decrease to tax positions in prior periods | (4) | | (6) | | — | |
| Gross increase to tax positions in current period | 6 | | 7 | | 6 | |
| | | |
| Settlements | (27) | | (1) | | (2) | |
| Unrecognized tax benefit at end of year | $24 | | $48 | | $47 | |
|
| | | | | | | | | | | |
| Fiscal year | 2017 |
| | 2016 |
| | 2015 |
|
| Unrecognized tax benefit at beginning of year |
| $32 |
| |
| $19 |
| |
| $15 |
|
| Gross increase to tax positions in prior periods | 2 |
| | 16 |
| | 6 |
|
| Gross decrease to tax positions in prior periods | (7 | ) | | — |
| | (2 | ) |
| Gross increase to tax positions in current period | 5 |
| | 2 |
| | 2 |
|
| Lapses in statute | (1 | ) | | (5 | ) | | (2 | ) |
| Unrecognized tax benefit at end of year |
| $31 |
| |
| $32 |
| |
| $19 |
|
At the end of 20172023 and 2016, $182022, $22 and $19$45 of the ending gross unrecognized tax benefit related to items which, if recognized, would affect the effective tax rate.
Our income taxThere was no material expense included an increase to expense of $1 in 2017 for tax-related interest and penalties. There were no significant changes to expensepenalties in 20162023, 2022 and 2015.2021. At the end of 20172023 and 2016,2022, our liability for interest and penalties was $3 and $2.$8.
We file income tax returns in the U.S. and a limited number of foreign jurisdictions. With few exceptions, we are no longer subject to federal or state and local or non-U.S. income tax examinations for years before 2013. Unrecognized2014. As of February 3, 2024, we believe it is reasonably possible unrecognized tax benefits related to federal, state and local tax positions may decrease by $6 by February 2, 2019,1, 2025, due to the completion of examinations and the expiration of various statutes of limitations.
NOTE 13: COMMITMENTS AND CONTINGENCIES
Nordstrom, Inc.Our estimated total purchase obligations, which primarily consist of inventory purchase orders and subsidiaries59
capital expenditure commitments, were $2,049 as of February 3, 2024. These purchase obligations are primarily payable within one year. Nordstrom, Inc.
Notes to Consolidated Financial Statements
Dollar and share amounts in millions except per share, per option and per unit amounts
NOTE 14: EARNINGS PER SHARE
Earnings per basic share is computed using the weighted-average number of common shares outstanding during the year. Earnings per diluted share uses the weighted-average number of common shares outstanding during the year plus dilutive common stock equivalents, primarily stock options and restricted stock. Dilutive common stock is calculated using the treasury stock method and includes unvested RSUs and outstanding options that would reduce the amount of earnings for which each share is entitled. Anti-dilutive shares (including stock options and other shares) are excluded from the calculation of diluted shares and earnings per diluted share because their impact could increase earnings per diluted share. The computation of earningsEPS is as follows: | | | | | | | | | | | |
| Fiscal year | 2023 | 2022 | 2021 |
| Net earnings | $134 | | $245 | | $178 | |
| | | |
| Basic weighted-average shares outstanding | 161.8 | | 160.1 | | 159.0 | |
| Dilutive shares | 1.6 | | 2.0 | | 3.5 | |
| Diluted weighted-average shares outstanding | 163.4 | | 162.1 | | 162.5 | |
| | | |
| Basic EPS | $0.83 | | $1.53 | | $1.12 | |
| Diluted EPS | $0.82 | | $1.51 | | $1.10 | |
| | | |
| Anti-dilutive shares | 8.4 | | 8.7 | | 8.1 | |
Nordstrom, Inc.
Notes to Consolidated Financial Statements
(Dollar and share amounts in millions except per share, is as follows:per option and per unit amounts)
|
| | | | | | | | | | | |
| Fiscal year | 2017 |
| | 2016 |
| | 2015 |
|
| Net earnings |
| $437 |
| |
| $354 |
| |
| $600 |
|
| | | | | | |
| Basic shares | 166.8 |
| | 173.2 |
| | 186.3 |
|
| Dilutive effect of common stock equivalents | 2.1 |
| | 2.4 |
| | 3.8 |
|
| Diluted shares | 168.9 |
| | 175.6 |
| | 190.1 |
|
| | | | | | |
| Earnings per basic share |
| $2.62 |
| |
| $2.05 |
| |
| $3.22 |
|
| Earnings per diluted share |
| $2.59 |
| |
| $2.02 |
| |
| $3.15 |
|
| | | | | | |
| Anti-dilutive common stock equivalents | 10.5 |
| | 8.0 |
| | 2.3 |
|
Net earnings in 2016 included the Trunk Club goodwill impairment charge of $197, which had an impact of $1.14 per basic share and $1.12 per diluted share.
NOTE 15: SEGMENT REPORTING
Segments
We have two reportable segments, which include Retail and Credit.
Our Retail segment includes our Full-price operating segment, which is comprised of our Nordstrom U.S. full-line stores and Nordstrom.com. Both of these divisions earn revenue by offering customers a wide range of apparel, shoes, cosmetics and accessories for women, men, young adults and children. Through our multi-channel initiatives, we have integrated the operations, merchandising and technology of our Nordstrom full-line and online stores, consistent with our customers’ expectations of a seamless shopping experience regardless of channel. Internal reporting to our principal executive officer, who is also our chief operating decision maker, is consistent with these multi-channel initiatives. Our Nordstrom Rack, Nordstromrack.com/HauteLook, Nordstrom Canada, Trunk Club and Jeffrey operating segments have similar economic and qualitative characteristics, including nature of products, method of distribution and type of customer, or the segment results are not significant to the operating results of Full-price. Therefore, the results of these operating segments have been aggregated with our Full-price operating segment into the Retail reportable segment.
Through our Credit segment, our customers can access a variety of payment products and services, including a selection of Nordstrom-branded Visa® credit cards in the U.S. and Canada, as well as a Nordstrom-branded private label credit card and a debit card for Nordstrom purchases. When customers use a Nordstrom-branded credit or debit card, they also participate in our loyalty program that provides benefits based on their level of spending. Although the primary purposes of our Credit segment are to foster greater customer loyalty and drive more sales, we also receive credit card revenue through our program agreement with TD (see Note 2: Credit Card Receivable Transaction).
Amounts in the Corporate/Other column include unallocated corporate expenses and assets (including unallocated assets in corporate headquarters, consisting primarily of cash, land, buildings and equipment and deferred tax assets), sales return reserves, inter-segment eliminations and other adjustments to segment results necessary for the presentation of consolidated financial results in accordance with generally accepted accounting principles.
Retail Business represents a subtotal of the Retail segment and Corporate/Other, and is consistent with our presentation in Item 7: Management’s Discussion and Analysis of Financial Condition and Results of Operations. Retail Business is not a reportable segment.
Nordstrom, Inc.
Notes to Consolidated Financial Statements
Dollar and share amounts in millions except per share, per option and per unit amounts
We continually monitor and review our segment reporting structure in accordance with authoritative guidance to determine whether any changes have occurred that would impact our reportable segments. As a result of the evolution of our operations, ourWe have one reportable segments have become progressively more integrated such that we will change our reportable segments to one reportable“Retail” segment to align with how management will viewoperates and evaluates the results of our operations. Our principal executive officer, who is our chief operating decision maker, reviews results on a total Company, Nordstrom and Nordstrom Rack basis and uses EBIT as a measure of profitability.
Our Retail reportable segment aggregates our two operating segments, Nordstrom and Nordstrom Rack. As of February 3, 2024, Nordstrom consists of Nordstrom.com, Nordstrom U.S. stores and Nordstrom Local. Nordstrom also included Canada operations prior to March 2, 2023, inclusive of Nordstrom.ca, Nordstrom Canadian stores and Nordstrom Rack Canadian stores, ASOS | Nordstrom prior to December 2023 and TrunkClub.com prior to October 2022. Nordstrom Rack consists of NordstromRack.com, Nordstrom Rack U.S. stores and Last Chance clearance stores.
Our Nordstrom and Nordstrom Rack operating segments both generate revenue by offering customers an extensive selection of high-quality brand-name and private-label merchandise for women, men, young adults and children, with a focus on apparel, shoes, beauty, accessories and home goods. We continue to focus on omni-channel initiatives by integrating the operations, merchandising and technology necessary to be consistent with our customers’ expectations of a seamless shopping experience regardless of channel or business. Nordstrom and Nordstrom Rack have historically had similar economic characteristics and financial performance over the long-term, which we expect to continue in the first quarterfuture. They also have other similar qualitative characteristics, including suppliers, method of 2018.distribution, type of customer and regulatory environment. Due to their similar qualitative and economic characteristics, we have aggregated our Nordstrom and Nordstrom Rack operating segments into a single reportable segment.
Amounts in the Corporate/Other column include unallocated corporate expenses and assets (including unallocated assets in corporate headquarters, consisting primarily of cash, land, buildings, equipment and deferred tax assets), inter-segment eliminations and other adjustments to segment results necessary for the presentation of consolidated financial results in accordance with GAAP.
Accounting Policy
In general, we use the same measurements to compute earnings before income taxes for reportable segments as we do for the consolidated Company. However, redemptions ofWe present our Nordstrom Notes are included in net sales for our Retail segment. The sales amount in our Corporate/Other column includes an entry to eliminate these transactions from our consolidated net sales. The related Nordstrom Notes expenses are included in our Retail segment at face value. Our Corporate/Other column includes an adjustment to reduce the Nordstrom Notes expense from face value to their estimated cost. In addition, our sales return reserve and other corporate adjustments are recordedresults in the Corporate/Other column. Other than as described above,way that management views our results internally and the accounting policies of the operating segments are the same as those described in Note 1: Nature of Operations and Summary of Significant Accounting Policies.
The following table sets forth information for our reportable segments:
|
| | | | | | | | | | | | | | | | | | | |
| | Retail |
| | Corporate/Other |
| | Retail Business |
| | Credit |
| | Total |
|
| Fiscal year 2017 | | | | | | | | | |
| Net sales |
| $15,408 |
| |
| ($271 | ) | |
| $15,137 |
| |
| $— |
| |
| $15,137 |
|
| Credit card revenues, net | — |
| | — |
| | — |
| | 341 |
| | 341 |
|
| Earnings (loss) before interest and income taxes | 1,206 |
| | (454 | ) | | 752 |
| | 174 |
| | 926 |
|
| Interest expense, net | — |
| | (136 | ) | | (136 | ) | | — |
| | (136 | ) |
| Earnings (loss) before income taxes | 1,206 |
| | (590 | ) | | 616 |
| | 174 |
| | 790 |
|
| Capital expenditures | 516 |
| | 214 |
| | 730 |
| | 1 |
| | 731 |
|
| Depreciation and amortization | 445 |
| | 213 |
| | 658 |
| | 8 |
| | 666 |
|
| Assets | 5,237 |
| | 2,638 |
| | 7,875 |
| | 240 |
| | 8,115 |
|
| | | | | | | | | | |
| Fiscal year 2016 | | | | | | | | | |
| Net sales |
| $14,768 |
| |
| ($270 | ) | |
| $14,498 |
| |
| $— |
| |
| $14,498 |
|
| Credit card revenues, net | — |
| | — |
| | — |
| | 259 |
| | 259 |
|
| Earnings (loss) before interest and income taxes | 1,006 |
| | (298 | ) | | 708 |
| | 97 |
| | 805 |
|
| Interest expense, net | — |
| | (121 | ) | | (121 | ) | | — |
| | (121 | ) |
| Earnings (loss) before income taxes | 1,006 |
| | (419 | ) | | 587 |
| | 97 |
| | 684 |
|
| Capital expenditures | 593 |
| | 249 |
| | 842 |
| | 4 |
| | 846 |
|
| Depreciation and amortization | 456 |
| | 182 |
| | 638 |
| | 7 |
| | 645 |
|
| Assets | 5,291 |
| | 2,088 |
| | 7,379 |
| | 479 |
| | 7,858 |
|
| | | | | | | | | | |
| Fiscal year 2015 | | | | | | | | | |
| Net sales |
| $14,376 |
| |
| ($281 | ) | |
| $14,095 |
| |
| $— |
| |
| $14,095 |
|
| Credit card revenues, net | — |
| | — |
| | — |
| | 342 |
| | 342 |
|
| Earnings (loss) before interest and income taxes | 1,220 |
| | (302 | ) | | 918 |
| | 183 |
| | 1,101 |
|
| Interest expense, net | — |
| | (112 | ) | | (112 | ) | | (13 | ) | | (125 | ) |
| Earnings (loss) before income taxes | 1,220 |
| | (414 | ) | | 806 |
| | 170 |
| | 976 |
|
| Capital expenditures | 837 |
| | 241 |
| | 1,078 |
| | 4 |
| | 1,082 |
|
| Depreciation and amortization | 428 |
| | 143 |
| | 571 |
| | 5 |
| | 576 |
|
| Assets | 5,460 |
| | 1,720 |
| | 7,180 |
| | 518 |
| | 7,698 |
|
Nordstrom, Inc. and subsidiaries6171
Nordstrom, Inc.
Notes to Consolidated Financial Statements
(Dollar and share amounts in millions except per share, per option and per unit amountsamounts)
The following table summarizes net sales withinsets forth information for our reportable segments:segment: | | | | | | | | | | | |
| Retail | Corporate/Other | Total |
| Fiscal year 2023 | | | |
| Net sales | $14,219 | | $— | | $14,219 | |
| Credit card revenues, net | — | | 474 | | 474 | |
| Earnings (loss) before interest and income taxes | 855 | | (604) | | 251 | |
| | | |
| | | |
| | | |
| Capital expenditures | (244) | | (325) | | (569) | |
| Canada wind-down costs | — | | (284) | | (284) | |
| Depreciation and amortization | (263) | | (323) | | (586) | |
| Assets | 5,622 | | 2,822 | | 8,444 | |
| | | |
| Fiscal year 2022 | | | |
| Net sales | $15,092 | | $— | | $15,092 | |
| Credit card revenues, net | — | | 438 | | 438 | |
| Earnings (loss) before interest and income taxes | 719 | | (254) | | 465 | |
| | | |
| | | |
| | | |
| Capital expenditures | (154) | | (319) | | (473) | |
| Depreciation and amortization | (316) | | (288) | | (604) | |
Assets | 5,968 | | 2,777 | | 8,745 | |
| | | |
| Fiscal year 2021 | | | |
| Net sales | $14,402 | | $— | | $14,402 | |
| Credit card revenues, net | — | | 387 | | 387 | |
| Earnings (loss) before interest and income taxes | 687 | | (195) | | 492 | |
| | | |
| | | |
| | | |
| Capital expenditures | (218) | | (288) | | (506) | |
| Depreciation and amortization | (350) | | (265) | | (615) | |
| Assets | 6,244 | | 2,625 | | 8,869 | |
For information about disaggregated revenues, see Note 3: Revenue.
|
| | | | | | | | | | | |
| Fiscal year | 2017 |
| | 2016 |
| | 2015 |
|
Nordstrom full-line stores - U.S.1 |
| $6,951 |
| |
| $7,186 |
|
|
| $7,633 |
|
| Nordstrom.com | 2,887 |
| | 2,519 |
|
| 2,300 |
|
| Full-price | 9,838 |
| | 9,705 |
| | 9,933 |
|
| | | | | | |
| Nordstrom Rack | 4,059 |
| | 3,809 |
| | 3,533 |
|
| Nordstromrack.com/HauteLook | 897 |
| | 700 |
| | 532 |
|
| Off-price | 4,956 |
| | 4,509 |
| | 4,065 |
|
| | | | | | |
Other retail2 | 614 |
| | 554 |
| | 378 |
|
| Retail segment | 15,408 |
| | 14,768 |
| | 14,376 |
|
| Corporate/Other | (271 | ) | | (270 | ) | | (281 | ) |
| Total net sales |
| $15,137 |
| |
| $14,498 |
| |
| $14,095 |
|
1 Nordstrom full-line stores - U.S. includes Nordstrom Local.
2 Other retail includes Nordstrom Canada full-line stores, Trunk Club and Jeffrey boutiques.
The following table summarizes the percent of net sales by merchandise category: |
| | | | | | | | |
| Fiscal year | 2017 |
| | 2016 |
| | 2015 |
|
| Women’s Apparel | 32 | % | | 32 | % | | 31 | % |
| Shoes | 23 | % | | 23 | % | | 23 | % |
| Men’s Apparel | 16 | % | | 17 | % | | 17 | % |
| Women’s Accessories | 11 | % | | 11 | % | | 12 | % |
| Beauty | 11 | % | | 11 | % | | 11 | % |
| Kids’ Apparel | 4 | % | | 3 | % | | 3 | % |
| Other | 3 | % | | 3 | % | | 3 | % |
| Total net sales | 100 | % | | 100 | % | | 100 | % |
Nordstrom, Inc.
Notes to Consolidated Financial Statements
Dollar and share amounts in millions except per share, per option and per unit amounts
NOTE 16: SELECTED QUARTERLY DATA1(UNAUDITED) |
| | | | | | | | | | | | | | | | | | | |
| | 1st Quarter |
| | 2nd Quarter |
| | 3rd Quarter |
| | 4th Quarter |
| | Total |
|
| Fiscal year 2017 | | | | | | | | | |
| Net sales |
| $3,279 |
| |
| $3,717 |
| |
| $3,541 |
| |
| $4,600 |
| |
| $15,137 |
|
Comparable sales (decrease) increase2 | (0.8 | %) | | 1.7 | % | | (0.9 | %) | | 2.6 | % | | 0.8 | % |
| Credit card revenues, net | 75 |
| | 76 |
| | 88 |
| | 102 |
| | 341 |
|
| Gross profit | 1,124 |
| | 1,266 |
| | 1,226 |
| | 1,631 |
| | 5,247 |
|
| Selling, general and administrative expenses | (1,048 | ) | | (1,125 | ) | | (1,106 | ) | | (1,383 | ) | | (4,662 | ) |
| Earnings before interest and income taxes | 151 |
| | 217 |
| | 208 |
| | 350 |
| | 926 |
|
| Net earnings | 63 |
| | 110 |
| | 114 |
| | 151 |
| | 437 |
|
| Earnings per basic share |
| $0.38 |
| |
| $0.66 |
| |
| $0.68 |
| |
| $0.90 |
| |
| $2.62 |
|
| Earnings per diluted share |
| $0.37 |
| |
| $0.65 |
| |
| $0.67 |
| |
| $0.89 |
| |
| $2.59 |
|
| | | | | | | | | | |
| Fiscal year 2016 | | | | | | | | | |
| Net sales |
| $3,192 |
| |
| $3,592 |
| |
| $3,472 |
| |
| $4,243 |
| |
| $14,498 |
|
Comparable sales (decrease) increase3 | (1.7 | %) | | (1.2 | %) | | 2.4 | % | | (0.9 | %) | | (0.4 | %) |
| Credit card revenues, net | 57 |
| | 59 |
| | 70 |
| | 73 |
| | 259 |
|
| Gross profit | 1,092 |
| | 1,233 |
| | 1,211 |
| | 1,523 |
| | 5,058 |
|
| Selling, general and administrative expenses | (1,043 | ) | | (1,071 | ) | | (1,029 | ) | | (1,172 | ) | | (4,315 | ) |
| Goodwill impairment | — |
| | — |
| | (197 | ) | | — |
| | (197 | ) |
| Earnings before interest and income taxes | 106 |
| | 221 |
| | 55 |
| | 424 |
| | 805 |
|
| Net earnings (loss) | 46 |
| | 117 |
| | (10 | ) | | 201 |
| | 354 |
|
Earnings (Loss) per basic share4 |
| $0.27 |
| |
| $0.67 |
| |
| ($0.06 | ) | |
| $1.17 |
| |
| $2.05 |
|
Earnings (Loss) per diluted share4,5 |
| $0.26 |
| |
| $0.67 |
| |
| ($0.06 | ) | |
| $1.15 |
| |
| $2.02 |
|
1 Quarterly totals may not foot across due to rounding.
2 The 53rd week is not included in comparable sales calculations (see Item 7: Management’s Discussion and Analysis of Financial Condition and Results of Operations for more information about the 53rd week).
3 One week of the Anniversary Sale, historically our largest event of the year, shifted into the third quarter. Combined second and third quarter comparable sales, which removes the impact of the event shift, increased 0.4% compared with the same period last year.
4 Loss per basic and diluted share included the impact of the Trunk Club goodwill impairment charge of $1.14 and $1.12 per share in the third quarter of 2016.
5 Due to the anti-dilutive effect resulting from the reported net loss in the third quarter of 2016, the impact of potentially dilutive securities on the weighted-average shares outstanding has been omitted from the quarterly calculation of loss per diluted share. The impact of these potentially dilutive securities has been included in the calculation of weighted-average shares for all other periods in 2016.
Nordstrom, Inc. and subsidiaries63
Item 9. Changes in and Disagreements With Accountants on Accounting and Financial Disclosure.
None.
Item 9A. Controls and Procedures.
DISCLOSURE CONTROLS AND PROCEDURES
Blake Nordstrom, Pete Nordstrom and Erik Nordstrom serve as co-presidents of Nordstrom, Inc. (“Company”). Blake Nordstrom continues to serve asFor the Company’s principal executive officer for purposes of the Securities Exchange Act of 1934, as amended (the “Exchange Act”). The Company’s Chief Financial Officer is the Company’s principal financial officer for purposes of the Exchange Act.Act, our Chief Executive Officer, Erik B. Nordstrom, serves as our principal executive officer and our Chief Financial Officer, Cathy R. Smith, is our principal financial officer and principal accounting officer.
As of the end of the period covered by this Annual Report on Form 10-K, the Company performed an evaluation underUnder the supervision and with the participation of management, including our principal executive officer and principal financial officer, we have performed an evaluation of the design and effectiveness of our disclosure controls and procedures (as defined in rules 13a-15(e) or 15d-15(e) underas of the Exchange Act). last day of the period covered by this report.
Based upon that evaluation, our principal executive officer and principal financial officer concluded that as of the end of the period covered by this Annual Report, our disclosure controls and procedures were effectiveeffective. Disclosure controls and procedures are defined by Rules 13a-15(e) and 15d-15(e) under the Exchange Act as controls and other procedures that are designed to ensure that information required to be disclosed in the timelyreports that we file or submit under the Exchange Act is recorded, processed, summarized and accurate recording, processing, summarizing and reporting of material financial and non-financial informationreported within the time periods specified within the SEC’s rules and forms. Our principal executive officer and principal financial officer also concluded that our disclosureDisclosure controls and procedures were effectiveinclude, without limitation, controls and procedures designed to ensure that information required to be disclosed in the reports that we file or submit under the Exchange Act is accumulated and communicated to our management, including our principal executive officer and principal financial officer, to allow timely decisions regarding required disclosure.
CHANGES IN INTERNAL CONTROL OVER FINANCIAL REPORTING
There have been no changes in our internal control over financial reporting (as defined in Rules 13a-15(f) or 15d-15(f) of the Exchange Act) during our most recently completed fiscal quarter that have materially affected, or are reasonably likely to materially affect, our internal control over financial reporting.
MANAGEMENT’S REPORT ON INTERNAL CONTROL OVER FINANCIAL REPORTING
Our management is responsible for establishing and maintaining adequate internal control over financial reporting, as is defined in the Exchange Act. These internal controls are designed to provide reasonable assurance that the reported financial information is presented fairly, that disclosures are adequate and that the judgments inherent in the preparation of financial statements are reasonable. There are inherent limitations in the effectiveness of any system of internal control, including the possibility of human error and overriding of controls. Consequently, an effective internal control system can only provide reasonable, not absolute, assurance with respect to reporting financial information.
Management conducted an evaluation of the effectiveness of our internal control over financial reporting based on the framework and criteria established in Internal Control – Integrated Framework (2013), issued by the Committee of Sponsoring Organizations of the Treadway Commission. Based on this evaluation, management concluded that the Company’s internal control over financial reporting was effective as of February 3, 2018.2024.
Deloitte & Touche LLP, an independent registered public accounting firm, was retained to audit Nordstrom’sour Consolidated Financial Statements and the effectiveness of the Company’sour internal control over financial reporting. They have issued an attestation report on the Company’sour internal control over financial reporting as of February 3, 2018,2024, which is included herein.
Nordstrom, Inc. and subsidiaries73
64
REPORT OF INDEPENDENT REGISTERED PUBLIC ACCOUNTING FIRM
To the Board of Directors and Shareholders of Nordstrom, Inc.
Opinion on Internal Control over Financial Reporting
We have audited the internal control over financial reporting of Nordstrom, Inc. and subsidiaries (the “Company”) as of February 3, 2018,2024, based on criteria established inInternal Control - Control—Integrated Framework (2013)issued by the Committee of Sponsoring Organizations of the Treadway Commission (COSO). In our opinion, the Company maintained, in all material respects, effective internal control over financial reporting as of February 3, 2018,2024, based on criteria established in Internal Control -— Integrated Framework (2013) issued by COSO.
We have also audited, in accordance with the standards of the Public Company Accounting Oversight Board (United States) (PCAOB), the consolidated financial statements as of and for the year ended February 3, 2018,2024, of the Company and our report dated March 19, 20182024, expressed an unqualified opinion on those financial statements.
Basis for Opinion
The Company’s management is responsible for maintaining effective internal control over financial reporting and for its assessment of the effectiveness of internal control over financial reporting, included in the accompanying Management’s Report Onon Internal Control Over Financial Reporting.Reporting. Our responsibility is to express an opinion on the Company’s internal control over financial reporting based on our audit. We are a public accounting firm registered with the PCAOB and are required to be independent with respect to the Company in accordance with the U.S. federal securities laws and the applicable rules and regulations of the Securities and Exchange Commission and the PCAOB.
We conducted our audit in accordance with the standards of the PCAOB. Those standards require that we plan and perform the audit to obtain reasonable assurance about whether effective internal control over financial reporting was maintained in all material respects. Our audit included obtaining an understanding of internal control over financial reporting, assessing the risk that a material weakness exists, testing and evaluating the design and operating effectiveness of internal control based on the assessed risk, and performing such other procedures as we considered necessary in the circumstances. We believe that our audit provides a reasonable basis for our opinion.
Definition and Limitations of Internal Control over Financial Reporting
A company’s internal control over financial reporting is a process designed to provide reasonable assurance regarding the reliability of financial reporting and the preparation of financial statements for external purposes in accordance with generally accepted accounting principles. A company’s internal control over financial reporting includes those policies and procedures that (1) pertain to the maintenance of records that, in reasonable detail, accurately and fairly reflect the transactions and dispositions of the assets of the company; (2) provide reasonable assurance that transactions are recorded as necessary to permit preparation of financial statements in accordance with generally accepted accounting principles, and that receipts and expenditures of the company are being made only in accordance with authorizations of management and directors of the company; and (3) provide reasonable assurance regarding prevention or timely detection of unauthorized acquisition, use, or disposition of the company’s assets that could have a material effect on the financial statements.
Because of its inherent limitations, internal control over financial reporting may not prevent or detect misstatements. Also, projections of any evaluation of effectiveness to future periods are subject to the risk that controls may become inadequate because of changes in conditions, or that the degree of compliance with the policies or procedures may deteriorate.
/s/ Deloitte & Touche LLP
Seattle, Washington
March 19, 2018
2024
Nordstrom, Inc. and subsidiaries6574
Item 9B. Other Information.
None.
Item 9C. Disclosure Regarding Foreign Jurisdictions that Prevent Inspections.
None.
PART III
Item 10. Directors, Executive Officers and Corporate Governance.
The information required under this item is included in the following sections of our Proxy Statement for our 20182024 Annual Meeting of Shareholders, the sections of which are incorporated by reference herein and will be filed within 120 days after the end of our fiscal year:
Corporate Governance
Director Qualifications, Experience, and Nominating Process
Delinquent Section 16(a) Beneficial Ownership Reporting ComplianceReports
Requirements and Deadlines for Submission of Proxy Proposals, Nomination of Directors, and otherOther Business of Shareholders
The certifications of our Co-PresidentChief Executive Officer and Chief Financial Officer required pursuant to Sections 302 and 906 of the Sarbanes-Oxley Act of 2002 are included as exhibits to this 2023 Annual Report on Form 10-K and were included as exhibits to each of our quarterly reports on Form 10-Q. Our Co-PresidentChief Executive Officer certified to the New York Stock Exchange (“NYSE”)NYSE on May 30, 2017June 13, 2023, pursuant to Section 303A.12(a) of the NYSE’s listing standards, that he was not aware of any violation by the Company of the NYSE’s corporate governance listing standards as of that date.
Item 11. Executive Compensation.
The information required under this item is included in the following sections of our Proxy Statement for our 20182024 Annual Meeting of Shareholders, the sections of which are incorporated by reference herein and will be filed within 120 days after the end of our fiscal year:
Compensation of Executive Officers
Director Compensation and Stock Ownership Guidelines
Compensation Committee Interlocks and Insider Participation
Compensation, People and Culture Committee Report
Item 12. Security Ownership of Certain Beneficial Owners and Management and Related Shareholder Matters.
The information required under this item is included in the following sections of our Proxy Statement for our 20182024 Annual Meeting of Shareholders, the sections of which are incorporated by reference herein and will be filed within 120 days after the end of our fiscal year:
Security Ownership of Certain Beneficial Owners and Management
Equity Compensation Plans
Item 13. Certain Relationships and Related Transactions, and Director Independence.
The information required under this item is included in the following sections of our Proxy Statement for our 20182024 Annual Meeting of Shareholders, the sections of which are incorporated by reference herein and will be filed within 120 days after the end of our fiscal year:
Corporate Governance
Certain Relationships and Related Transactions
Item 14. Principal AccountingAccountant Fees and Services.
Our independent registered public accounting firm is Deloitte & Touche LLP, Seattle, Washington, Auditor ID: 34.
The information required under this item is included in the following Ratification of the Appointment of Independent Registered Public Accounting Firm section of our Proxy Statement for our 20182024 Annual Meeting of Shareholders, the section of which is incorporated by reference herein and will be filed within 120 days after the end of our fiscal year:
Ratification of the Appointment of Independent Registered Public Accounting Firm
year.
66Nordstrom, Inc. and subsidiaries75
PART IV
Item 15. Exhibits,Exhibit and Financial Statement Schedules.
The following information required under this item is filed as part of this report:
(a)1. FINANCIAL STATEMENTS | | | | | |
| Page |
| (a)1. FINANCIAL STATEMENTS | |
| Page |
| Report of Independent Registered Public Accounting Firm | |
| Consolidated Statements of Earnings | |
| Consolidated Statements of Comprehensive Earnings | |
| Consolidated Balance Sheets | |
| Consolidated Statements of Shareholders’ Equity | |
| Consolidated Statements of Cash Flows | |
| Management’s Report on Internal Control Over Financial Reporting | |
| Report of Independent Registered Public Accounting Firm | |
| |
| (a)3. EXHIBITS | |
| Nordstrom, Inc. and Subsidiaries Exhibit Index | |
(a)3. EXHIBITS
Exhibits are incorporated herein by reference or are filed with this report as set forth in the Index to Exhibits on pages 68 through 73 hereof.
All other schedules and exhibits are omitted because they are not applicable, not required or because the information required has been given as part of this report.
Nordstrom, Inc. and subsidiaries67
Nordstrom, Inc. and Subsidiaries
Exhibit Index
| | | | | | | | | | | | | | | | | | | | |
| | | | Incorporated by Reference |
| | | Exhibit | Form | Exhibit | Filing Date |
| 3.1 | | | | 8-K | 3.1 | May 31, 2005 |
| | | | | | |
| 3.2 | | | | 8-K | 3.1 | September 21, 2023 |
| | | | | | |
| 4.1 | | | | S-3 | 4.4 | April 30, 2001 |
| | | | | | |
| 4.2 | | | | S-3/A | 4.1 | March 10, 1998 |
| | | | | | |
| 4.3 | | | | S-4/A | 4.1 | April 29, 2014 |
| | | | | | |
| 4.4 | | | | S-4 | 4.2 | March 28, 2014 |
| | | | | | |
| 4.5 | | | | S-4 | 4.3 | March 28, 2014 |
| | | | | | |
| 4.6 | | | | S-4 | 4.4 | March 28, 2014 |
| | | | | | |
| 4.7 | | | | 8-K | 4.2 | December 3, 2007 |
| | | | | | |
| 4.8 | | | | 8-K | 4.1 | March 9, 2017 |
| | | | | | |
| 4.9 | | | | 8-K | 4.2 | March 9, 2017 |
| | | | | | |
| 4.10 | | | | 8-K | 4.1 | November 6, 2019 |
| | | | | | |
| 4.11 | | | | 10-Q | 4.2 | September 3, 2021 |
| | | | | | |
| 4.12 | | | | 10-Q | 4.3 | September 3, 2021 |
| | | | | | |
| 4.13 | * | | | S-8 | 4.1 | August 27, 2014 |
| | | | | | |
| 4.14 | | | | 8-K | 4.1 | September 20, 2022 |
| | | | | | |
| 4.15 | | | | 8-K | 4.1 | August 21, 2023 |
| | | | | | |
| 10.1 | * | | | DEF 14A | Appendix B | April 7, 2020 |
| | | | | | |
| 10.2 | * | | | DEF 14A | Appendix B | April 28, 2023 |
| | | | | | |
| 10.3 | * | | | DEF 14A | Appendix C | April 28, 2023 |
| | | | | | |
| 10.4 | * | | | 10-Q | 10.2 | June 4, 2021 |
| | | | | | |
| 10.5 | * | | | 11-K | 99.3 | June 10, 2022 |
| | | | | | |
| 10.6 | * | | | 10-K | 10.2 | March 10, 2023 |
| | | | | | |
| 10.7 | * | | | 10-Q | 10.2 | September 2, 2022 |
| | | | | | |
| 10.8 | * | | | 8-K | 10.1 | March 4, 2014 |
| | | | | | |
| 10.9 | * | | | 8-K | 10.1 | February 19, 2015 |
| | | | | | |
| 10.10 | * | | | 8-K | 10.1 | March 1, 2016 |
| | | | | | |
| 10.11 | * | | | 10-Q | 10.2 | August 30, 2016 |
| | | | | | |
| 10.12 | * | | | 8-K | 10.1 | February 23, 2017 |
| | | | | | |
| 10.13 | * | | | 8-K | 10.1 | March 4, 2019 |
| | | | | | |
| 10.14 | * | | | 8-K | 10.2 | March 4, 2019 |
| | | | | | |
| 10.15 | * | | | 8-K | 10.1 | March 3, 2020 |
| | | | | | |
| 10.16 | * | | | 10-Q | 10.5 | June 10, 2020 |
| | | | | | |
|
| | | |
| Exhibit | | Method of Filing |
1.1 | | | Incorporated by reference from the Registrant’s Form 8-K filed on March 10, 2017, Exhibit 1.1 |
| | | |
3.1 | | | Incorporated by reference from the Registrant’s Form 8-K filed on May 31, 2005, Exhibit 3.1 |
| | | |
3.2 | | | Incorporated by reference from the Registrant’s Form 8-K filed on June 8, 2017, Exhibit 3.1 |
| | | |
4.1 | | | Incorporated by reference from Registration No. 333-47035, Exhibit 4.1 |
| | | |
4.2 | | | Incorporated by reference from the Registrant’s Form 8-K filed on May 8, 2007, Exhibit 4.1 |
| | | |
4.3 | | | Incorporated by reference from the Registrant’s Form 8-K filed on November 28, 2011, Exhibit 4.2 |
| | | |
4.4 | | | Incorporated by reference from the Registrant’s Form S-4/A filed on April 29, 2014, Exhibit 4.1 |
| | | |
4.5 | | | Incorporated by reference from the Registrant’s Form 8-K filed on November 28, 2011, Exhibit 4.1 |
| | | |
4.6 | | | Incorporated by reference from the Registrant’s Form 8-K filed on December 3, 2007, Exhibit 4.1 |
| | | |
4.7 | | | Incorporated by reference from the Registrant’s Form 8-K filed on April 23, 2010, Exhibit 4.1 |
| | | |
4.8 | | | Incorporated by reference from the Registrant’s Form 8-K filed on October 11, 2011, Exhibit 4.1 |
| | | |
4.9 | | | Incorporated by reference from the Registrant’s Form S-4 filed on March 28, 2014, Exhibit 4.2 |
| | | |
4.10 | | | Incorporated by reference from the Registrant’s Form S-4 filed on March 28, 2014, Exhibit 4.3 |
| | | |
4.11 | | | Incorporated by reference from the Registrant’s Form S-4 filed on March 28, 2014, Exhibit 4.4 |
| | | |
4.12 | | | Incorporated by reference from the Registrant’s Form 8-K filed on March 9, 2017, Exhibit 4.1 |
| | | |
4.13 | | | Incorporated by reference from the Registrant’s Form 8-K filed on March 9, 2017, Exhibit 4.2 |
| | | |
4.14 | | | Incorporated by reference from the Registrant’s Form S-4 filed on March 28, 2014, Exhibit 4.5 |
| | | |
4.15* | | | Incorporated by reference from the Registrant’s Form S-8 filed on August 27, 2014, Exhibit 4.1 |
| | | |
10.1* | | | Incorporated by reference from the Registrant’s Quarterly Report on Form 10-Q for the quarter ended May 2, 2015, Exhibit 10.2 |
*This exhibit is a management contract, compensatory plan or arrangement |
| | | | | | | | | | | | | | | | | | | | |
| | | | Incorporated by Reference |
| | | Exhibit | Form | Exhibit | Filing Date |
| 10.17 | * | | | 8-K | 10.1 | March 6, 2023 |
| | | | | | |
| 10.18 | * | | | DEF 14A | Appendix A | April 8, 2010 |
| | | | | | |
| 10.19 | * | | | DEF 14A | Appendix A | April 1, 2013 |
| | | | | | |
| 10.20 | * | | | 8-K | 10.4 | March 4, 2014 |
| | | | | | |
| 10.21 | * | | | DEF 14A | Appendix A | April 5, 2017 |
| | | | | | |
| 10.22 | * | | | 10-K | 10.23 | March 20, 2020 |
| | | | | | |
| 10.23 | * | | | 8-K | 10.2 | February 28, 2022 |
| | | | | | |
| 10.24 | * | | | 8-K | 10.2 | March 6, 2023 |
| | | | | | |
| 10.25 | * | | | 8-K | 10.2 | March 5, 2024 |
| | | | | | |
| 10.26 | * | | | 10-Q | 10.1 | September 4, 2020 |
| | | | | | |
| 10.27 | | | | 10-K | 10.48 | March 19, 2018 |
| | | | | | |
| 10.28 | | | | 10-K | 10.78 | March 18, 2011 |
| | | | | | |
| 10.29 | | | | 10-Q | 10.1 | December 1, 2023 |
| | | | | | |
| 10.30 | * | | | 8-K | 10.2 | March 3, 2020 |
| | | | | | |
| 10.31 | * | | | 8-K | 10.1 | May 20, 2022 |
| | | | | | |
| 10.32 | * | | | 8-K | 10.1 | May 10, 2023 |
| | | | | | |
| 10.33 | * | | | 8-K | 10.1 | March 5, 2024 |
| | | | | | |
| 10.34 | | | | 10-Q | 10.2 | June 3, 2022 |
| | | | | | |
| 10.35 | | | | 10-K | 10.30 | March 10, 2023 |
| | | | | | |
| 10.36 | | | | 10-Q | 10.1 | December 1, 2015 |
| | | | | | |
| 10.37 | | | | 10-Q | 10.1 | December 2, 2022 |
| | | | | | |
| 19.1 | † | | | | | |
| | | | | | |
| 21.1 | † | | | | | |
| | | | | | |
| 23.1 | | | | | | |
| | | | | | |
| 31.1 | † | | | | | |
| | | | | | |
| 31.2 | † | | | | | |
| | | | | | |
| 32.1 | ‡ | | | | | |
| | | | | | |
| 97.1 | † | | | | | |
| | | | | | |
| 101.INS | † | | Inline XBRL Instance Document | | | |
| | | | | | |
| 101.SCH | † | | Inline XBRL Taxonomy Extension Schema Document | | | |
| | | | | | |
|
| | | |
| Exhibit | | Method of Filing |
10.2* | | | Incorporated by reference from the Registrant’s Quarterly Report on Form 10-Q for the quarter ended August 2, 2014, Exhibit 10.6 |
| | | |
10.3* | | | Incorporated by reference from the Registrant’s Quarterly Report on Form 10-Q for the quarter ended November 1, 2014, Exhibit 10.2 |
| | | |
10.4* | | | Incorporated by reference from the Registrant’s Quarterly Report on Form 10-Q for the quarter ended November 1, 2014, Exhibit 10.3 |
| | | |
10.5* | | | Incorporated by reference from the Registrant’s Form DEF 14A filed on March 30, 2012 |
| | | |
10.6* | | | Incorporated by reference from the Registrant’s Form DEF 14A filed on April 8, 2016 |
| | | |
10.7* | | | Filed herewith electronically |
| | | |
10.8* | | | Incorporated by reference to Appendix A to the Registrant’s Form DEF 14A filed on March 31, 2011 |
| | | |
10.9* | | | Incorporated by reference from the Registrant’s Quarterly Report on Form 10-Q for the quarter ended July 30, 2016, Exhibit 10.1 |
| | | |
10.10* | | | Incorporated by reference from the Registrant’s Form 8-K filed on March 1, 2005, Exhibit 10.1 |
| | | |
10.11* | | | Incorporated by reference from the Registrant’s Annual Report on Form 10-K for the year ended February 2, 2008, Exhibit 10.45 |
| | | |
10.12* | | | Incorporated by reference from the Registrant’s Form 8-K filed on February 26, 2007, Exhibit 10.1 |
| | | |
10.13* | | | Incorporated by reference from the Registrant’s Form 8-K filed on February 22, 2008, Exhibit 10.1 |
| | | |
10.14* | | | Incorporated by reference from the Registrant’s Form 8-K filed on March 3, 2009, Exhibit 10.2 |
| | | |
10.15* | | | Incorporated by reference from the Registrant’s Form 8-K filed on November 24, 2009, Exhibit 10.1 |
| | | |
10.16* | | | Incorporated by reference from the Registrant’s Form 8-K filed on November 19, 2010, Exhibit 10.1 |
| | | |
10.17* | | | Incorporated by reference from the Registrant’s Form 8-K filed on November 18, 2011, Exhibit 10.1 |
| | | |
10.18* | | | Incorporated by reference from the Registrant’s Form 8-K filed on November 14, 2012, Exhibit 10.1 |
| | | |
10.19* | | | Incorporated by reference from the Registrant’s Form 8-K filed on March 4, 2014, Exhibit 10.1 |
| | | |
10.20* | | | Incorporated by reference from the Registrant’s Form 8-K filed on February 19, 2015, Exhibit 10.1 |
| | | |
10.21* | | | Incorporated by reference from the Registrant’s Form 8-K filed on March 1, 2016, Exhibit 10.1 |
| | | |
10.22* | | | Incorporated by reference from the Registrant’s Quarterly Report on Form 10-Q for the quarter ended July 30, 2016, Exhibit 10.2 |
*This exhibit is a management contract, compensatory plan or arrangement |
Nordstrom, Inc. and subsidiaries69
| | | | | | | | | | | | | | | | | | | | |
| | | | Incorporated by Reference |
| | | Exhibit | Form | Exhibit | Filing Date |
| 101.CAL | Exhibit† | | Method of Filing |
10.23* | | | Incorporated by reference from the Registrant’s Form 8-K filed on February 23, 2017, Exhibit 10.1 |
| | | |
10.24* | | | Incorporated by reference from the Registrant’s definitive proxy statement filed with the Commission on April 15, 2004 |
| | | |
10.25* | | | Incorporated by reference from the Registrant’s Form 8-K filed on November 19, 2007, Exhibit 10.44 |
| | | |
10.26* | | | Incorporated by reference from the Registrant’s Form 8-K filed on November 24, 2008, Exhibit 10.1 |
| | | |
10.27* | | | Incorporated by reference to Appendix A to the Registrant’s Form DEF 14A filed on April 8, 2010 |
| | | |
10.28* | | | Incorporated by reference to Appendix A to the Registrant’s Form DEF 14A filed on April 1, 2013 |
| | | |
10.29* | | | Incorporated by reference from the Registrant’s Form 8-K filed on March 4, 2014, Exhibit 10.4 |
| | | |
10.30* | | | Incorporated by reference to Appendix A to the Registrant’s Form DEF 14A filed on April 5, 2017 |
| | | |
10.31* | | | Incorporated by reference from the Registrant’s Annual Report on Form 10-K for the year ended January 29, 2005, Exhibit 10.43 |
| | | |
10.32* | | | Incorporated by reference from the Registrant’s Annual Report on Form 10-K for the year ended February 2, 2008, Exhibit 10.56 |
| | | |
10.33* | | | Incorporated by reference from the Registrant’s Form 8-K filed on November 24, 2008, Exhibit 10.3 |
| | | |
10.34* | | | Incorporated by reference from the Registrant’s Form 8-K filed on August 25, 2011, Exhibit 10.1 |
| | | |
10.35* | | | Incorporated by reference from the Registrant’s Form 8-K filed on March 5, 2013, Exhibit 10.1 |
| | | |
10.36* | | | Incorporated by reference from the Registrant’s Form 8-K filed on March 1, 2016, Exhibit 10.4 |
| | | |
10.37* | | | Incorporated by reference from the Registrant’s Form 8-K filed on November 19, 2010, Exhibit 10.2 |
| | | |
10.38* | | | Incorporated by reference from the Registrant’s Form 8-K filed on November 18, 2011, Exhibit 10.2 |
| | | |
10.39* | | | Incorporated by reference from the Registrant’s Form 8-K filed on November 14, 2012, Exhibit 10.2 |
| | | |
10.40* | | | Incorporated by reference from the Registrant’s Form 8-K filed on March 4, 2014, Exhibit 10.3 |
| | | |
10.41* | | | Incorporated by reference from the Registrant’s Form 8-K filed on February 19, 2015, Exhibit 10.3 |
| | | |
10.42* | | | Incorporated by reference from the Registrant’s Form 8-K filed on March 1, 2016, Exhibit 10.3 |
| | | |
10.43* | | | Incorporated by reference from the Registrant’s Form 8-K filed on February 23, 2017, Exhibit 10.3 |
| | | |
10.44* | | | Incorporated by reference from the Registrant’s Form 8-K filed on November 24, 2008, Exhibit 10.4 |
*This exhibit is a management contract, compensatory plan or arrangement |
|
| | | |
| Exhibit | | Method of Filing |
10.45* | | | Incorporated by reference from the Registrant’s Form 8-K filed on March 3, 2009, Exhibit 10.4 |
| | | |
10.46* | | | Incorporated by reference from the Registrant’s Form 8-K filed on August 25, 2014, Exhibit 10.1 |
| | | |
10.47* | | | Incorporated by reference from the Registrant’s Form 8-K filed on August 25, 2014, Exhibit 10.2 |
| | | |
10.48 | | | Filed herewith electronically |
| | | |
10.49 | | | Incorporated by reference from the Registrant’s Form 8-K filed on March 3, 2009, Exhibit 10.1 |
| | | |
10.50 | | | Incorporated by reference from the Registrant’s Annual Report on Form 10-K for the year ended January 29, 2011, Exhibit 10.78 |
| | | |
10.51 | | | Incorporated by reference from the Registrant’s Quarterly Report on Form 10-Q for the quarter ended July 31, 2002, Exhibit 10.1 |
| | | |
10.52 | | | Incorporated by reference from the Registrant’s Form 8-K filed on November 19, 2007, Exhibit 10.39 |
| | | |
10.53 | | | Incorporated by reference from the Registrant’s Quarterly Report on Form 10-Q for the quarter ended November 3, 2007, Exhibit 10.1 |
| | | |
10.54 | | | Incorporated by reference from the Registrant’s Form 8-K filed on November 18, 2011, Exhibit 10.3 |
| | | |
10.55 | | | Incorporated by reference from the Registrant’s Form 8-K filed on November 14, 2012, Exhibit 10.3 |
| | | |
10.56 | | | Incorporated by reference from the Registrant’s Form 8-K filed on March 4, 2014, Exhibit 10.2 |
| | | |
10.57 | | | Incorporated by reference from the Registrant’s Form 8-K filed on February 19, 2015, Exhibit 10.2 |
| | | |
10.58 | | | Incorporated by reference from the Registrant’s Form 8-K filed on March 1, 2016, Exhibit 10.2 |
| | | |
10.59 | | | Incorporated by reference from the Registrant’s Quarterly Report on Form 10-Q for the quarter ended July 30, 2016, Exhibit 10.3 |
| | | |
10.60 | | | Incorporated by reference from the Registrant’s Form 8-K filed on February 23, 2017, Exhibit 10.2 |
| | | |
10.61 | | | Incorporated by reference from the Registrant’s Annual Report on Form 10-K for the year ended January 28, 2017, Exhibit 10.67 |
| | | |
10.62 | | | Incorporated by reference from the Registrant’s Quarterly Report on Form 10-Q for the quarter ended July 31, 2004, Exhibit 10.4 |
| | | |
10.63 | | | Incorporated by reference from the Registrant’s Quarterly Report on Form 10-Q for the quarter ended July 31, 2004, Exhibit 10.5 |
*This exhibit is a management contract, compensatory plan or arrangement |
Nordstrom, Inc. and subsidiaries71
|
| | | |
| Exhibit | | Method of Filing |
10.64 | | | Incorporated by reference from the Registrant’s Form 8-K filed on April 6, 2015, Exhibit 10.1 |
| | | |
10.65 | | | Incorporated by reference from the Registrant’s Form 8-K filed on April 6, 2016, Exhibit 10.1 |
| | | |
10.66 | | | Incorporated by reference from the Registrant’s Annual Report on Form 10-K for the year ended January 31, 2002, Exhibit 10.38 |
| | | |
10.67 | | | Incorporated by reference from the Registrant’s Form 8-K filed on May 8, 2007, Exhibit 99.2 |
| | | |
10.68 | Amended and Restated Transfer and Servicing Agreement, dated as of May 1, 2007, by and between Nordstrom Credit Card Receivables II LLC, as transferor, Nordstrom fsb, as servicer, Wells Fargo Bank, National Association, as indenture trustee, and Nordstrom Credit Card Master Note Trust II, as issuer | | Incorporated by reference from the Registrant’s Form 8-K filed on May 8, 2007, Exhibit 99.4 |
| | | |
10.69 | | | Incorporated by reference from the Registrant’s Form 8-K filed on May 8, 2007, Exhibit 99.5 |
| | | |
10.70 | | | Incorporated by reference from the Registrant’s Form 8-K filed on May 8, 2007, Exhibit 99.6 |
| | | |
10.71 | | | Incorporated by reference from the Registrant’s Form 8-K filed on May 8, 2007, Exhibit 99.3 |
| | | |
10.72 | | | Incorporated by reference from the Registrant’s Form 8-K filed on May 8, 2007, Exhibit 99.1 |
| | | |
10.73 | | | Incorporated by reference from the Registrant’s Form 8-K filed on December 23, 2009, Exhibit 10.1 |
| | | |
10.74 | | | Incorporated by reference from the Registrant’s Form 8-K filed on December 23, 2009, Exhibit 10.2 |
| | | |
10.75 | | | Incorporated by reference from the Registrant’s Form 8-K filed on February 28, 2013, Exhibit 99.1 |
| | | |
10.76 | | | Incorporated by reference from the Registrant’s Form 8-K filed on September 4, 2014, Exhibit 99.1 |
| | | |
10.77 | | | Incorporated by reference from the Registrant’s Form 8-K filed on October 2, 2015, Exhibit 99.1 |
| | | |
10.78 | | | Incorporated by reference from the Registrant’s Form 8-K filed on February 21, 2017, Exhibit 99.2 |
| | | |
|
| | | |
| Exhibit | | Method of Filing |
10.79 | | | Incorporated by reference from the Registrant’s Form 8-K filed on December 4, 2013, Exhibit 99.1 |
| | | |
10.80 | | | Incorporated by reference from the Registrant’s Form 8-K filed on December 4, 2013, Exhibit 99.2 |
| | | |
10.81 | | | Incorporated by reference from the Registrant’s Form 8-K filed on December 12, 2013, Exhibit 99.1 |
| | | |
10.82 | | | Incorporated by reference from the Registrant’s Form 8-K filed on December 17, 2013, Exhibit 99.1 |
| | | |
10.83 | | | Incorporated by reference from the Registrant’s Form 8-K filed on January 2, 2014, Exhibit 99.1 |
| | | |
10.84 | | | Incorporated by reference from the Registrant’s Quarterly Report on Form 10-Q for the quarter ended August 1, 2015, Exhibit 10.1 |
| | | |
10.85 | | | Incorporated by reference from the Registrant’s Quarterly Report on Form 10-Q for the quarter ended October 31, 2015, Exhibit 10.1 |
| | | |
10.86 | | | Incorporated by reference from the Registrant’s Form 8-K filed on June 8, 2017, Exhibit 99.2, and the Registrant’s SC 13D filed on June 8, 2017, Exhibit 3 |
| | | |
21.1 | | | Filed herewith electronically |
| | | |
23.1 | | | Filed as page 75 of this report |
| | | |
31.1 | | | Filed herewith electronically |
| | | |
31.2 | | | Filed herewith electronically |
| | | |
32.1 | | | Furnished herewith electronically |
| | | |
101.INS | XBRL Instance Document | | Filed herewith electronically |
| | | |
101.SCH | XBRL Taxonomy Extension Schema Document | | Filed herewith electronically |
| | | |
101.CAL | Inline XBRL Taxonomy Extension Calculation Linkbase Document | | | Filed herewith electronically |
| | | | | | |
| 101.LAB | † | | Inline XBRL Taxonomy Extension Labels Linkbase Document | | | Filed herewith electronically |
| | | | | | |
| 101.PRE | † | | Inline XBRL Taxonomy Extension Presentation Linkbase Document | | | Filed herewith electronically |
| | | | | | |
| 101.DEF | † | | Inline XBRL Taxonomy Extension Definition Linkbase Document | | | |
| | | | | | |
| 104 | † | | Cover Page Interactive Data File (Inline XBRL) | | | |
| | | | | | |
| * Management contract, compensatory plan or arrangement |
| † Filed herewith electronically |
| | | ‡ Furnished herewith electronically |
Nordstrom, Inc. and subsidiaries7379
SIGNATURES
Pursuant to the requirements of Section 13 or 15(d) of the Securities Exchange Act of 1934, the registrant has duly caused this report to be signed on its behalf by the undersigned, thereunto duly authorized.
| | | | | | | | | | | |
| NORDSTROM, INC. | |
| (Registrant) | |
| | | |
| | /s/ | Cathy R. Smith |
| | | | | Cathy R. Smith |
| | NORDSTROM, INC. |
| (Registrant) | |
| | | |
| | /s/ | Anne L. Bramman |
| | | Anne L. Bramman |
| | Chief Financial Officer |
| (Principal Financial Officer and Principal Accounting Officer) |
Date: March 19, 20182024
Pursuant to the requirements of the Securities Exchange Act of 1934, this report has been signed below by the following persons on behalf of the registrant and in the capacities and on the datedates indicated.
| | | | | | | | | | | | | | |
| | | | |
| Principal Financial Officer and Principal Accounting Officer: | | Principal Executive Officer: |
| | | | |
| /s/ | Cathy R. Smith | | /s/ | | Erik B. Nordstrom |
| /s/Cathy R. Smith | | Anne L. Bramman | /s/ | Blake W.Erik B. Nordstrom |
| Anne L. Bramman | | | Blake W. Nordstrom |
| Chief Financial Officer | | | Co-PresidentChief Executive Officer |
| Date: | March 19, 2024 | | Date: | | March 19, 2024 |
| Principal Accounting Officer: | | | |
| | | |
| | | | |
| | | | |
| | | | |
| | | |
| | | | |
| Directors: | | | |
| | | | |
| /s/ | Stacy Brown-Philpot | | /s/ | James L. Donald |
| Stacy Brown-Philpot | | | | James L. Donald |
| /s/Director | | Kelley K. Hall | | Director |
| Date: | Kelley K. HallMarch 15, 2024 | | Date: | | March 15, 2024 |
| Senior Vice President, Chief Accounting Officer and Treasurer | | | |
| /s/ | Kirsten A. Green | | /s/ | Glenda G. McNeal |
| Kirsten A. Green | | | | Glenda G. McNeal |
| Directors:Director | | | Director |
| Date: | March 15, 2024 | | Date: | | March 15, 2024 |
| /s/ | Shellye L. Archambeau | | /s/ | Stacy Brown-Philpot
| /s/ | Shellye L. Archambeau | | | Stacy Brown-Philpot |
| Director | | | Director |
| | | | |
/s/ | Tanya L. Domier | | /s/ | Blake W. Nordstrom |
| Tanya L. Domier | | | Blake W. Nordstrom |
| Director | | | Director |
| | | | |
/s/ | Erik B. Nordstrom | | /s/ | /s/ | Peter E. Nordstrom |
| Erik B. Nordstrom | | | Peter E. Nordstrom |
| Director | | | Director | | | Director |
| Date: | March 19, 2024 | | Date: | | March 19, 2024 |
| | | | |
| /s/ | Philip G. SatreAmie Thuener O’Toole | | /s/ | /s/ | Brad D. SmithGuy B. Persaud |
| Amie Thuener O’Toole | | Philip G. Satre | | Brad D. SmithGuy B. Persaud |
| Director | | | Director |
| Date: | March 15, 2024 | | Date: | March 15, 2024 |
| | | | |
| /s/ | Eric D. Sprunk | | /s/ | Bradley D. Tilden |
| Eric D. Sprunk | | | Bradley D. Tilden |
| Director | | | Chairman of the Board of Directors | | | Director |
| Date: | March 15, 2024 | | Date: | | March 15, 2024 |
| | | | |
| /s/ | Gordon A. SmithMark J. Tritton | | /s/ | /s/ | Bradley D. TildenAtticus N. Tysen |
| Mark J. Tritton | | Gordon A. Smith | | Bradley D. TildenAtticus N. Tysen |
| Director | | | Director | | | Director |
| Date: | March 15, 2024 | | Date: | | March 15, 2024 |
| /s/ | B. Kevin Turner | | /s/ | Robert D. Walter
| | B. Kevin Turner | | | Robert D. Walter
| | Director | | | Director
| | | | |
| | | | |
| | | | |
| Date: | March 19, 2018 | | |
| | | | |
| | | | |
CONSENT OF INDEPENDENT REGISTERED PUBLIC ACCOUNTING FIRM
We consent to the incorporation by reference in Registration Statement Nos. 333-239087, 333-239086, 333-239083, 333-231969, 333-225295, 333-211825, 333-207396, 333-198413, 333-189301, 333-174336, 333-173020, 333-166961, 333-161803, 333-146049, 333-118756, 333-101110, 333-40066, 333-40064, 333-79791, 333-63403333-275859, 333-275861, 333-275864, on Form S-8 and Registration Statement No. 333-230379 on Form S-3 of our reports dated March 19, 2018,2024, relating to the financial statements of Nordstrom Inc. and subsidiaries, and the effectiveness of Nordstrom, Inc. and subsidiaries’ internal control over financial reporting, appearing in the Annual Report on Form 10-K of Nordstrom, Inc. for the year ended February 3, 2018.2024.
/s/ Deloitte & Touche LLP
Seattle, Washington
March 19, 2018
2024
Nordstrom, Inc. and subsidiaries7581
