UNITED STATES
SECURITIES AND EXCHANGE COMMISSION
Washington, D.C. 20549
FORM 10-K
(Mark One)
| | | | | |
| ☑ | ANNUAL REPORT PURSUANT TO SECTION 13 OR 15(d) OF THE SECURITIES EXCHANGE ACT OF 1934 |
For the fiscal year ended January 29, 2022February 3, 2024
or | | | | | |
| ☐ | TRANSITION REPORT PURSUANT TO SECTION 13 OR 15(d) OF THE SECURITIES EXCHANGE ACT OF 1934 |
For the transition period from ___________ to___________
Commission file number 001-15059
Nordstrom, Inc.
(Exact name of registrant as specified in its charter)
| | | | | | | | |
| Washington | | 91-0515058 |
| State or other jurisdiction of incorporation or organization | | (I.R.S. Employer Identification No.) |
1617 Sixth Avenue, Seattle, Washington 98101
(Address of principal executive offices)
Registrant’s telephone number, including area code (206) 628-2111
Securities registered pursuant to Section 12(b) of the Act: | | | | | | | | |
| Title of each class | Trading Symbol | Name of each exchange on which registered |
| Common stock, without par value | JWN | New York Stock Exchange |
| Common stock purchase rights | | New York Stock Exchange |
Securities registered pursuant to section 12(g) of the Act: None
Indicate by check mark if the registrant is a well-known seasoned issuer, as defined in Rule 405 of the Securities Act. Yes ☑ No ☐
Indicate by check mark if the registrant is not required to file reports pursuant to Section 13 or Section 15(d) of the Act. Yes ☐ No ☑
Indicate by check mark whether the registrant (1) has filed all reports required to be filed by Section 13 or 15(d) of the Securities Exchange Act of 1934 during the preceding 12 months (or for such shorter period that the registrant was required to file such reports), and (2) has been subject to such filing requirements for the past 90 days. Yes ☑ No ☐
Indicate by check mark whether the registrant has submitted electronically every Interactive Data File required to be submitted pursuant to Rule 405 of Regulation S-T during the preceding 12 months (or for such shorter period that the registrant was required to submit such files). Yes ☑ No ☐
Indicate by check mark whether the registrant is a large accelerated filer, an accelerated filer, a non-accelerated filer, a smaller reporting company, or emerging growth company. See the definitions of “large accelerated filer,” “accelerated filer,” “smaller reporting company,” and “emerging growth company” in Rule 12b-2 of the Exchange Act. | | | | | | | | | | | |
| ☑ | Large Accelerated Filer | ☐ | Accelerated filer |
| ☐ | Non-accelerated filer | ☐ | Smaller reporting company |
| | ☐ | Emerging growth company |
If an emerging growth company, indicate by check mark if the registrant has elected not to use the extended transition period for complying with any new or revised financial accounting standards provided pursuant to Section 13(a) of the Exchange Act. ☐
Indicate by check mark whether the registrant has filed a report on and attestation to its management’s assessment of the effectiveness of its internal control over financial reporting under Section 404(b) of the Sarbanes-Oxley Act (15 U.S.C. 7262(b)) by the registered public accounting firm that prepared or issued its audit report. ☑
Nordstrom, Inc. and subsidiaries1
If securities are registered pursuant to Section 12(b) of the Act, indicate by check mark whether the financial statements of the registrant included in the filing reflect the correction of an error to previously issued financial statements. ☐
Indicate by check mark whether any of those error corrections are restatements that required a recovery analysis of incentive-based compensation received by any of the registrant’s executive officers during the relevant recovery period pursuant to §240.10D-1(b). ☐
Indicate by check mark whether the registrant is a shell company (as defined in Rule 12b-2 of the Act). Yes ☐ No ☑
As of July 30, 2021,28, 2023, the aggregate market value of the Registrant’s voting and non-voting stock held by non-affiliates of the Registrant was approximately $4.2$3.0 billion using the closing sales price on that day of $33.10.$22.95. On March 7, 2022, 159,398,57711, 2024, 163,258,218 shares of common stock were outstanding.
DOCUMENTS INCORPORATED BY REFERENCE
Portions of the Proxy Statement for the 20222024 Annual Meeting of Shareholders, scheduled to be held on May 18, 2022,22, 2024, are incorporated into Part II and III.
Nordstrom, Inc. and subsidiaries1
[This page intentionally left blank.]
| | | | | | | | |
| TABLE OF CONTENTS | |
| | | Page |
| |
| |
| |
| |
| Item 1. | | |
| Item 1A. | | |
| Item 1B. | | |
| Item 1C. | | |
| Item 2. | | |
| Item 3. | | |
| Item 4. | | |
| |
| |
| Item 5. | | |
| Item 6. | | |
| Item 7. | | |
| Item 7A. | | |
| Item 8. | | |
| Item 9. | | |
| Item 9A. | | |
| Item 9B. | | |
| Item 9C. | | |
| |
| |
| Item 10. | | |
| Item 11. | | |
| Item 12. | | |
| Item 13. | | |
| Item 14. | | |
| |
| |
| Item 15. | | |
| |
| |
| |
| |
Nordstrom, Inc. and subsidiaries 3
FORWARD-LOOKING STATEMENTS
This Annual Report on Form 10-K contains forward-looking statements within the meaning of Section 27A of the Private Securities Litigation Reform Act of 1933, as amended, and Section 21E of the Securities Exchange Act of 1934, as amended, which are subject to the “safe harbor” created by those sections.1995. Forward-looking statements are statements regarding matters that are not historical facts, and are based on our management’s beliefs and assumptions and on information currently available to our management. A forward-looking statement is neither a prediction nor a guarantee of future events or circumstances, and those future events or circumstances may not occur. In some cases, forward-looking statements can be identified by terms such as “may,” “will,” “should,” “could,” “goal,” “would,” “expect,” “plan,” “anticipate,” “believe,” “estimate,” “project,” “predict,” “potential,” “pursue,” “going forward,”forward” and similar expressions intended to identify forward-looking statements. These statements involve known and unknown risks, uncertainties and other factors, which may cause our actual results, performance, time frames or achievements to be materially different from any future results, performance, time frames or achievements expressed or implied by the forward-looking statements. These risks, uncertainties and other factors include, but are not limited to, our anticipated financial outlook for the fiscal year ending January 28, 2023,February 1, 2025, trends in our operations and the following:
Strategic and Operational
•COVID-19, which may make it necessary to close our physical stores and facilities in affected areas, may have a negative impact on our business and results, and may exacerbate the risks below,
•successful execution of our customer strategy to provide customers superior service, products and experiences, online, through our fulfillment capabilities and in stores,
•timely and effective implementation and execution of our evolving business model, including:
◦winning at our market strategy by providing a differentiated and seamless experience, which consists of the integration of our digital and physical assets, development of new supply chain capabilities and timely delivery of products,
◦broadening the reach of Nordstrom Rack, including expanding our price range and selectiondelivering great brands at great prices and leveraging our digital and physical assets,
◦enhancing our platforms and processes to deliver core capabilities to drive customer, employee and partner experiences both digitally and in-store,in stores,
•our ability to effectively manage our merchandise strategy, including our ability to offer compelling assortments and optimize our inventory to ensure we have the right product mix and quantity in each of our channels and locations, allowing us to get closer to our customers,
•our ability to effectively allocate and scale our marketing strategies and resources, as well as realize the expected benefits betweenof Nordstrom Media Network, The Nordy Club, advertising and promotional campaigns,
•our ability to respond to the evolving retail environment, including new fashion trends, environmental considerations and our customers’ changing expectations of service and experience in stores and online, and our development and outcome of new market strategies and customer offerings,
•our ability to mitigate the effects of disruptions in the global supply chain, including factory closures, transportation challenges or stoppages of certain imports, and rising prices of raw materials and freight expenses,
•our ability to control costs through effective inventory management fulfillment and supply chain processes and systems,
•our ability to acquire, develop and retain qualified and diverse talent by providing appropriate training, compelling work environments and competitive compensation and benefits, especially in areas with increased market compensation, all in the context of any labor shortage and competition for talent,
•our ability to realize the expected benefits, anticipate and respond to potential risks and appropriately manage costs associated with our credit card revenue sharing program,
•potential goodwill impairment charges, future impairment charges and fluctuations in the fair values of reporting units or of assets in the event projected financial results are not achieved within expected time frames or if our strategic direction changes,
Data, Cybersecurity and Information Technology
•successful execution of our information technology strategy, including engagement with third-party service providers,
•the impact of any systemssystem or network failures, cybersecurity and/or security breaches, including any security breach of our systems or those of a third-party provider that results in the theft, transfer or unauthorized disclosure of customer, employee or Company information, or that results in the interruption of business processes or causes financial loss, and our compliance with information security and privacy laws and regulations, as well as third-party contractual obligations in the event of such an incident,
Reputation and Relationships
•our ability to maintain our reputation and relationships with our customers, employees, vendors and third-party partners and landlords,
•our ability to act responsibly and with transparency with respect to our corporateenvironmental, social responsibilityand governance practices and initiatives, meet any communicated targets, goals or milestones and adapt to evolving reporting requirements,
•our ability to market our brand and distribute our products through a variety of third-party publisher or platform channels, as well as access mobile operating system and website identifiers for personalized delivery of targeted advertising,
Investment and Capital
•efficient and proper allocation of our capital resources,
•our ability to properly balance our investments in technology, Supply Chain Network facilities and existing and new store locations, including the expansion of our market strategy,
•our ability to maintain or expand our presence, including timely completion of construction associated with Supply Chain Network facilities and new, relocated and remodeled stores, as well as any potential store closures, all of which may be impacted by third parties, consumer demand and other natural or man-made disruptions, and government responses to any such disruptions,
•market fluctuations, increases in operating costs, exit costs and overall liabilities and losses associated with owning and leasing real estate,
•compliance with debt and operating covenants, availability and cost of credit, changes in our credit rating and changes in interest rates,
•the actual timing, price, manner and amounts of future share repurchases, dividend payments or share issuances, if any, subject to the discretion of our Board of Directors, contractual commitments, market and economic conditions and applicable SEC rules,
Economic and External
•the length and severity of epidemics or pandemics, such as the COVID-19 pandemic, or other catastrophic events, and the related impact on customer behavior, store and online operations and supply chain functions, as well as our future consolidated financial position, results of operations and cash flows,
•the impact of the seasonal nature of our business and cyclical customer spending,
•the impact of economic and market conditions, in the U.S.including inflation and Canada, includingmeasures to control inflation, and resulting changes to customer purchasing behavior, unemployment and bankruptcy rates as well as any fiscal stimulus, or the cessation of any fiscal stimulus and the resulting impact on consumer spending and credit patterns,
•the impact of economic, environmental or political conditions,
•the impact of changing traffic patterns at shopping centers and malls,
•financial insecurity or potential insolvency experienced by our vendors, suppliers, developers, landlords, competitors or customers, as a result of any economic downturn,
•weather conditions, natural disasters, climate change, national security concerns, global conflicts, civil unrest, other market and supply chain disruptions, the effects of tariffs, or the prospects of thesesuch events, and the resulting impact any of these events may have on consumer spending patterns or information technology systems and communications,
Legal and Regulatory
•our, and our vendors’,the third parties we do business with, compliance with applicable domestic and international laws, regulations and ethical standards, including those related to COVID-19, minimum wage, employment and tax, information security and privacy, consumer credit and environmental regulations and the outcome of any claims, litigation and regulatory investigations and resolution of such matters,
•the impact of changes in laws relating to consumer credit, the current regulatory environment, the financial system and tax reforms,
•the impact of changes in accounting rules and regulations, changes in our interpretation of the rules or regulations, or changes in underlying assumptions, estimates or judgments.judgments,
•the outcome of events or occurrences related to the wind-down of business operations in Canada.
These and other factors, including those factors we discusseddiscuss in Part I, Item 1A. Risk Factors, could affect our financial results and cause our actual results to differ materially from any forward-looking information we may provide. Given these risks, uncertainties and other factors, undue reliance should not be placed on these forward-looking statements. Also, these forward-looking statements represent our estimates and assumptions only as of the date of this filing.filing, and these estimates and assumptions may prove to be incorrect. This Annual Report on Form 10-K should be read completely and with the understanding that our actual future results may be materially different from what we expect. We hereby qualify our forward-looking statements by these cautionary statements. Except as required by law, we assume no obligation to update these forward-looking statements publicly, or to update the reasons actual results could differ materially from those anticipated in these forward-looking statements, even if new information becomes available in the future.
Nordstrom, Inc. and subsidiaries5
All references to “we,” “us,” “our,” or the “Company” mean Nordstrom, Inc. and its subsidiaries. On March 2, 2023, Nordstrom Canada commenced a wind-down of its business operations (see Note 2: Canada Wind-down in Item 8) and as of this date, Nordstrom Canada was deconsolidated from Nordstrom, Inc.’s financial statements. Nordstrom Canada results prior to March 2, 2023 are included in the Company’s Consolidated Financial Statements.
In addition, statements that “we believe” and similar statements reflect our beliefs and opinions on the relevant subject. These statements are based upon information available to us as of the filing date of this Annual Report on Form 10-K, and while we believe such information forms a reasonable basis for such statements, such information may be limited or incomplete, and our statements should not be read to indicate that we have conducted an exhaustive inquiry into, or review of, all potentially available relevant information. These statements are inherently uncertain and investors are cautioned not to unduly rely upon these statements. In addition, forward-looking statements may be impacted by the actual outcome of events or occurrences related to the wind-down of business operations in Canada.
Nordstrom, Inc. and subsidiaries56
DEFINITIONS OF COMMONLY USED TERMS
| | | | | |
| Term | Definition |
| 2019 Plan | 2019 Equity Incentive Plan |
20212023 Annual Report | Annual Report on Form 10-K filed on March 11, 202219, 2024 |
Adjusted EBITDAEPS | Adjusted earnings (loss) before interest, income taxes, depreciation and amortization (a non-GAAP financial measure) |
Adjusted EBITDAR | Adjusted earnings (loss) before interest, income taxes, depreciation, amortization and rent, as defined by our Revolver covenantper diluted share (a non-GAAP financial measure) |
| Adjusted ROIC | Adjusted return on invested capital (a non-GAAP financial measure) |
| |
ASC | Accounting Standards Codification |
| ASU | Accounting Standards Update |
| CARES Act | Coronavirus Aid, Relief and Economic Security Act |
CODMCCAA | Chief operating decision makerCompanies’ Creditors Arrangement Act |
COVID-19CISO | Novel coronavirusChief Information Security Officer |
| CTIO | Chief Technology and Information Officer |
| Digital sales | Sales conducted through a digital platform such as our websites or mobile apps. Digital sales may be self-guided by the customer, as in a traditional online order, or facilitated by a salesperson using a virtual styling or selling tool. Digital sales may be delivered to the customer or picked up in our Nordstrom stores, Nordstrom Rack stores or Nordstrom Local service hubs. Digital sales also includeincludes a reserve for estimated returns. |
| EBIT | Earnings (loss) before interest and income taxes |
| EBIT margin | Earnings (loss) before interest and income taxes as a percent of net sales |
| EBITDA | Earnings (loss) before interest, income taxes, depreciation and amortization |
| EBITDAR | Earnings (loss) before interest, income taxes, depreciation, amortization and rent, as defined by our Revolver covenant |
| EPS | Earnings (loss) per share |
| ESPP | Employee Stock Purchase Plan |
| Exchange Act | Securities Exchange Act of 1934, as amended |
| FASB | Financial Accounting Standards Board |
| Fiscal year 2024 | 52 fiscal weeks ending February 1, 2025 |
| Fiscal year 2023 | 53 fiscal weeks ending February 3, 2024 |
| Fiscal year 2022 | 52 fiscal weeks ending January 28, 2023 |
| Fiscal year 2021 | 52 fiscal weeks ending January 29, 2022 |
| Fiscal year 2020 | 52 fiscal weeks ending January 30, 2021
| Fiscal year 2019 | 52 fiscal weeks ending February 1, 2020
| |
| |
| GAAP | U.S. generally accepted accounting principles |
| |
| GMV | Gross merchandise value |
| Gross profit | Net sales less cost of sales and related buying and occupancy costs |
| |
| |
| Leverage Ratio | The sum of the preceding twelve months of rent expense under the previousour funded debt and operating lease guidance multiplied by six and funded debtliabilities divided by the preceding twelve months of Adjusted EBITDAR as defined by our Revolver covenant. See Capital Resources in Item 7 for a reconciliation of our non-GAAP financial measure.covenant |
| |
| |
| | | | | |
| Term | Definition |
| MD&A | Management’s Discussion and Analysis of Financial Condition and Results of Operations |
| NAV | Net asset value |
| NMN | Nordstrom Media Network, where we use our first-party data and marketing infrastructure to drive cooperative marketing with vendors across both offsite and onsite marketing platforms |
| Nordstrom | Nordstrom.com, TrunkClub.com, Nordstrom-brandedNordstrom U.S. stores and Nordstrom Local. Nordstrom also included Canada which includesoperations prior to March 2, 2023, inclusive of Nordstrom.ca, Nordstrom Canadian stores and Nordstrom Rack Canadian stores, ASOS | Nordstrom prior to December 2023 and TrunkClub.com prior to October 2022. |
| Nordstrom Canada | Nordstrom Canada Retail, Inc., Nordstrom Canada Holdings, LLC and Nordstrom LocalCanada Holdings II, LLC |
| Nordstrom Local | Nordstrom Local service hubs, which offer Nordstrom order pickups, returns, alterations and other services |
Nordstrom NYC | Our New York City Nordstrom flagship store, including the Men’s location |
Nordstrom Rack | NordstromRack.com, Nordstrom Rack-brandedRack U.S. stores and Last Chance clearance stores and, prior to the first quarter of 2021, HauteLook.com |
| The Nordy Club | Our customer loyalty program |
| NYSE | New York Stock Exchange |
| Operating Lease Cost | Fixed rent expense, including fixed common area maintenance expense, net of developer reimbursement amortization |
| PCAOB | Public Company Accounting Oversight Board (United States) |
| Property incentives | Developer and vendor reimbursements |
| PSU | Performance share unit |
| Revolver | Senior revolving credit facility |
| Rights Plan | Our limited-duration Shareholder Rights Agreement adopted by the Board of Directors |
| ROU asset | Operating lease right-of-use asset |
| RSU | Restricted stock unit |
| SEC | Securities and Exchange Commission |
| SERP | Unfunded defined benefit Supplemental Executive Retirement Plan |
| Secured Notes | 8.750% senior secured notes that were originally due May 2025 |
| SG&A | Selling, general and administrative |
| Supply Chain Network | Fulfillment centers that primarily process and ship orders to our customers, distribution centers that primarily process and ship merchandise to our stores and other facilities and omni-channel centers that both fulfill customer orders and ship merchandise to our stores |
| TD | Toronto-Dominion Bank, N.A. |
| |
| |
6Nordstrom, Inc. and subsidiaries7
PART I
Item 1. Business.
DESCRIPTION OF BUSINESS
Overview
The Company was founded in 1901 as a retail shoe business in Seattle, Washington, under the guiding principle that success would come by offering customers the very best service, selection, quality and value. We aspire to be the best fashion retailer in a digitally-connecteddigitally connected world by leveraging the strength of the Nordstrom and Nordstrom Rack brands.banners, our digital and physical properties, and our interconnected business model. We offer an extensive selection of high-quality brand-name and private labelprivate-label merchandise for women, men, young adults and children, focusedwith a focus on apparel, shoes, beauty, accessories and home goods. No matter how customers choose to shop, we are committed to delivering superior service, productproducts and experience,experiences — including alterations, order pickup, dining and styling — to make shopping fun, personalized and convenient. We have one reportable segment, which aggregates our two operating segments, Nordstrom and Nordstrom Rack.
Nordstrom is a leading destination for a breadth of products across brands, styles and prices complemented by unmatched services and experiences. As of February 3, 2024, Nordstrom includes the following physical and digital and physical properties:
•93 Nordstrom stores in the U.S.
•Nordstrom.com website and mobile application
•Nordstrom.ca website
•TrunkClub.com website
•94 Nordstrom stores in the U.S.
•six Nordstrom stores and sevenLocals
On March 2, 2023, Nordstrom Rack storesCanada commenced a wind-down of its business operations. See Note 2: Canada Wind-down in Canada
•seven Nordstrom LocalsItem 8 for more information.
Nordstrom Rack is a premier off-price destination with an industry-leading off-price digital presence, offering in-demand product and a treasure hunt experiencegreat brands at compellinggreat prices. As of February 3, 2024, Nordstrom Rack includes the following physical and digital and physical properties:
•258 Nordstrom Rack stores in the U.S.
•NordstromRack.com website and mobile application
•240 Nordstrom Rack stores in the U.S.
•two Last Chance clearance stores
Nordstrom Rack purchases merchandise primarily from many of the same vendors carried at Nordstrom and also serves as an outlet for clearance merchandise from the Nordstrom banner. We plancontinue to expand our offerings of the most coveted brands we carry as well as source from new vendors, to ensure we have the selection ouran assortment that customers want. Currently, NordstromRack.com offersOur goal is for customers to shop and discover amazing deals through both a selection of Nordstrom Rack merchandise and limited-time flash sale eventsevents. We continue to expand Nordstrom Rack’s physical footprint — we opened 19 new Nordstrom Rack stores across the U.S. in 2023 and intend on fashion and lifestyle brands, which formerly existed on HauteLook.com prior to the first quarteropening 22 more new stores in 2024. Nordstrom Rack stores serve as our primary source of 2021 when it was consolidated into NordstromRack.com.new customers.
As a business, one of our key advantages lies in our ability to leverage an integrated network of physical and digital assets across both Nordstrom and Nordstrom Rack banners. This creates flexibility and convenience for our customers, no matter how they choose to shop –— online through our apps or in stores. ThisWe are well positioned to support our customers with a scalable platform that has been built to support continued growth.
Our omni-channel platform is our differentiator, providing customers with four times more product available for next day pickup, the ability to pickup or return orders to any store location regardless of purchase origin, and our suite of personalized services.
As our business evolves, our market strategy is a key strategic growth priority. Our strategy leverages a strong store fleet and links our omni-channel capabilities at the local market level, positioningpositions us physically closer to the customer and allowingallows us to drive customer engagement through better service and greater access to product. There are two elements to this strategy: first, we aim to provide customers a greater selectionIn addition, our fleet of merchandise available for next-day pickup or delivery without increasing inventory levels. Second, we are increasing engagementstores helps us engage with customers by offering expressunique events and services such as personal styling, order pickup, returns and alterations at additional convenient locations. In 2021, we expanded our strategy to 20 of our top markets, which encompass approximately 75% of our revenues.
We also receive credit card revenue through our program agreement with TD, whereby TDOur interconnected model is proving that it works — the exclusive issuer of our consumer credit cardsaverage customer who shops across both banners, in both stores and we perform account servicing functions. Credit card revenues, net include our portion of the ongoing credit card revenue, net of credit losses, pursuant to our program agreement with TD.
Nordstrom, Inc. and subsidiaries7
online, spends over twelve times more than a customer shopping a single channel or banner.Products
In order to offer merchandise that our customers want, we purchase from a wide variety of high-quality domestic and foreign suppliers. Additionally, we utilize alternative vendor partnershipunowned inventory models beyond traditional wholesale arrangements that provide a broader assortment in new and existing categories without a corresponding increase in owned inventory.categories. We also have arrangements with agents and contract manufacturers to produce our private labelprivate-brand merchandise.
Nordstrom Rack invests in pack and hold inventory, which involves the strategic purchase of merchandise from some of our top brands in advance of the upcoming selling seasons or to minimize inventory gaps from supply chain disruptions, allowing us to buy larger quantities of relevant items when available, then hold a portion of it to deploy in periods with high demand, tight supply, facilitate new store openings or system constraints. This inventory is typically held for six months on average.
Return Policy
We have a fair and reasonable approach to returns, handling them on a case-by-case basis with the ultimate objective of making our customers happy.customer satisfaction. Almost all merchandise can be returned by mail or at any store location. We have no formal policy on how long we accept returns at Nordstrom stores, Nordstrom.com or Nordstrom.ca. Our goal is to take care of our customers, which includes making returns and exchanges easy, whether in stores or online,online. At our Nordstrom banner, where we offer free shipping on purchases and returns. Trunk Club allows customers five days from delivery to decide what items they would like to keep or send backreturns, we have no formal policy on how long we accept returns for free if the items are in original condition. Trunks can be returned via mail or at any Nordstrom store. Our Nordstrom Rack stores and NordstromRack.compurchases made. We generally accept returns of apparel, footwear, accessories and home products up to 45 days from the date of purchase or date of shipment with the original price tag and sales receipt.receipt up to 30 days from the date of purchase at Nordstrom Rack stores and up to 40 days from the date of order at NordstromRack.com.
Loyalty Program
The Nordy Club is our customer loyalty program that incorporates a traditional point and benefit system, while providing customers exclusive access to products and events, enhanced services, personalized experiences and more convenient ways to shop. Customers accumulate points based on their level of spending and type of participation. Upon reaching certain point thresholds, customers receive Nordstrom Notes, which can be redeemed for goods or services across Nordstrom and Nordstrom Rack. The Nordy Club benefits vary based on the level of customer spend, and include Bonus Pointsbonus points days and shopping and fashion events.
We offer customers access to a variety of payment products and services, including a selection of Nordstrom-branded Visa® credit cards, in the U.S. and Canada, as well as a Nordstrom-branded private labelprivate-label credit card for Nordstrom purchases. When customers use a Nordstrom-branded credit or debit card, they also participate in The Nordy Club and receive additional benefits, which can vary depending on the level of spend, including early access to the Anniversary Sale, enhanced alterationalterations and stylist benefits and incremental accumulation of points toward Nordstrom Notes.
Although the primary purpose of offering our credit cards is to foster greater customer loyalty and drive more sales, we also receive credit card revenue through our program agreement with TD. Under that agreement, which was amended in the fourth quarter of 2022 and runs through September 2026, TD is the exclusive issuer of Nordstrom-branded consumer credit cards and we perform account servicing functions for those cards. Credit card revenues, net include our portion of the ongoing credit card revenue, net of credit losses, pursuant to our program agreement with TD.
Supply Chain Network
Our Supply Chain Network consists of:
•fulfillment centers that primarily process and ship orders to our customers
•distribution centers that primarily process and ship merchandise to our stores and other facilities
•omni-channel centers that both fulfill customer orders and ship merchandise to our stores
We are continually expanding and enhancing our Supply Chain Network facilities and inventory management systems to support our omni-channel capabilities and provide greater access to merchandise selection and faster delivery. As of February 3, 2024, our Supply Chain Network consists of:
•three fulfillment centers that primarily process and ship orders to our customers
•six distribution centers that primarily process and ship merchandise to our stores and other facilities
•one omni-channel center that both fulfills customer orders and ships merchandise to our stores
In addition, our existing fleet of Nordstrom and Nordstrom Rack stores enables pickup and returns of online orders and facilitates a broader assortment to our digital customers. We select locations and customize inventory allocations to enable merchandise to flow more efficiently and quickly to our customers. Nordstrom online purchases are primarily shipped to our customers from our fulfillment centers but may also be shipped from our Nordstrom stores, distribution centers or omni-channel centers.center. Nordstrom in-store purchases are primarily fulfilled from that store’s inventory, but when inventory is unavailable at that store, it may also be shipped to our customers from our fulfillment centers, distribution centers, omni-channel centerscenter or from other Nordstrom stores. Nordstrom Rack online purchases are primarily shipped to our customers from our fulfillment centers and distribution centers, but may also be shipped from our Nordstrom Rack stores.centers. Both Nordstrom and Nordstrom Rack selectively use vendor dropship to supplement online offerings, which are then shipped directly from the vendor to the end customer.
Our first large-scale omni-channel center in Riverside, California, which supports our Nordstrom customers in the West Coast region, opened in 2020. We plan to add Nordstrom Rack inventory and fulfillment will be added to this facility in the future. Our smaller Local Omni-channel Hubomni-channel hub in Torrance, California was openedceased operations in 2019 and supports the greater Los Angeles marketthird quarter of 2022 as part ofwe scaled our market strategy and has highly curated inventoryRiverside location to support demand in that servesregion. Subsequent to year end, on March 5, 2024, we announced the specialized needs of that market.decision to relocate our San Bernardino fulfillment center operations to our West Coast omni-channel center.
EMPLOYEES
We believe that creating an outstandinga best-in-class customer experience begins with creating an environment that celebrates and supports all our employees. As we strive to attract and retain the best talent in the industry, we are committed to cultivating a workplace culture in which each ofwhere our employees isfeel included, supported and feels confident bringing their full selfselves to work.
8Nordstrom, Inc. and subsidiaries9
In 2021,As of February 3, 2024, we employed an averageapproximately 54,000 employees. Approximately 75% of 60,000 full-employees support our stores and part-time employees.approximately 10% support our Supply Chain Network. Due to the seasonal nature of our business, employment increasedthe number of temporary employees may vary and peak during our Anniversary Sale and holiday seasons. In connection with these peak shopping seasons, our employee count may increase by approximately 7% to approximately 72,000 formeet the holiday season. Allneeds of the business. Currently, our employees are non-union.have not chosen to be represented by a union.
Diversity, Equity, Inclusion &and Belonging
Our diversity, inclusioncommitment to fostering a diverse, equitable and belonging strategy focuses on four pillars:
•Talent — increasing demographic diversity amonginclusive environment is key to our employees
•Culture — cultivating a greater sensemission of belonging throughout our organization
•Marketplace — consistently servinghelping our customers through a lensfeel good and look their best. We believe in cultivating equity throughout the retail industry and aim to use our resources, influence and platform to foster greater representation of anti-racism and equity
•Leadership — setting consistent, future-oriented expectations fordiversity from all our leaders
communities. Over the past several years, we have amplified our efforts in these areasthis area and set specific goalsworkplace and marketplace ambitions to achieve by the end of 2025, which include:
•Doubling our charitable giving to nonprofit organizations that promote anti-racism, bringing that total to approximately $1 million a year.
•Delivering $500 million in retail sales from brands owned by, operated by or designed by Black and/or Latinx individuals.
•Increasing representation of Black2025. To lead and Latinx individuals in people-manager roles by at least 50%.
•Leveraging our internship program and other initiatives to help us reach qualified candidates early in their careers, with a goal on average of at least 50% of participants in these programs coming from underrepresented populations.
We monitor and track progress against our strategy. Leadingdrive this work, we have operationalized diversity, equity, inclusion and driving accountability is our Diversity, Inclusion and Belonging Action Council, co-chaired bybelonging through consistent reviews with Erik B. Nordstrom, our Chief Executive Officer, Peter E. Nordstrom, President and Chief Brand Officer and Farrell Redwine,Lisa Price, our Chief Human Resources Officer. The Council brings togetherIn addition, our diversity, equity, inclusion and belonging team serves as a diverse mixcenter of excellence within the human resources organization and collaborates with leaders from across the business to develop and embed equitable and inclusive strategies. Progress toward our Companydiversity, equity, inclusion and a representative frombelonging ambitions is tracked and reviewed regularly by our executive team and the Board of DirectorsDirectors.
As part of these ongoing efforts, we have several internal initiatives to monitor, assess and measure outcomes on Company-wide programs that drive our strategy forward.
Our Culture
We recognize the need for our employees to feelfacilitate a sense of belonging and connection especially throughout the past two years of continued isolation.among our teams. One way we seek to facilitatedo this sense of connection is through our eight employee-led, Nordstrom-sponsoredcompany-sponsored Employee Resource Groups, thatwhich represent a variety of seen and unseen identitiesidentities. In 2023, eight groups served and servewere led by our employees, providing company-wide programming to advance understanding and celebrate voices from across our organization.
Looking ahead,We continue to partner with organizations that invest in equitable pathways for fashion, design and retail talent. In 2023, we are committed to strengthening our employees’ sense of belonging. We survey all employees annually regardingsupported a product management coursework and mentorship program at Morehouse College, National Retail Federation’s Student Program and Harlem’s Fashion Row and their sense of inclusionnonprofit ICON360 with their inaugural Historically Black Colleges and psychological safety at work. With greater understanding of employees' challenges and perspectives, we can work toward building an ever-more supportive and inclusive culture.Universities professor summit.
Employee Safety and Well-being
The health and safety of our customers, employees and communities is somethinga responsibility we take very seriously. At the onset of the pandemic, we worked quickly to close our stores, find new ways to support and protect our teams and customers and keep our employees informed throughout a tumultuous period.
When our stores reopened, we implemented robust health and safety measures designed to keep our teams and our customers safe, including social distancing, mask wearing, hand washing, sanitizing and daily health screenings. We also installed health advisors in each store location, fulfillment center and distribution center to support our employees and keep them informed. We continue to adjust our approach to health and safety in keeping with Centers for Disease Control and Prevention and local jurisdictional guidance and are prepared to make changes as the situation continues to evolve.
The pandemic also underscored the importance of supporting our employees’ mental well-being in addition to their physical safety. We continue to offer a variety of mental, emotional and physical wellness resources to support our employees.employees, including digital mental health support and free counseling services through our Employee Assistance Programs.
We seek to listen to and learn from employees across our organization through our open-door policy, conducting regular listening sessions and utilizing our annual Voice of the Employee survey. We regularly review survey results against industry benchmarks to hold ourselves accountable as we continue to improve and evolve our workplace environment.
We remain committed to creating a culture where employees feel they can bring their whole selves to work and achieve their career goals through ongoing growth and development opportunities and fair and transparent performance management and promotion processes.
Total Rewards
To support our goals to retain and attract talented employees, we review our benefits and compensation approach annually.
•Benefits: We offer a range of benefits to all employees upon meeting eligibility requirements, including health care, wellness programs, financial/financial and retirement plans and time away. Throughout 2021, we provided a short-term disability paid benefit for employees with a confirmed or presumptive COVID-19 diagnosis, high-risk employees and employees who had first degree exposure. We also provided paid time off to quarantine following potential COVID-19 exposure in the workplace, and vaccination pay for employees to receive both doses of the COVID-19 vaccine. In addition, we increased our focus on well-being by activatingthrough a multi-year strategy to bring our people new resources and tools to support total well-being, including mental health support.
•Compensation: We are committed to providing our employees with a great place to grow meaningful careers. We regularly review our pay in the markets in which we operate to ensure we are competitive, and updatewe make updates accordingly throughout the year.
To ensure we offer a rewards package that aligns with the wants and needs of our employees, we routinely ask employees for their feedback in surveys throughout the year. We use the feedback to improve the overall experience of our employees.
CORPORATE SOCIAL RESPONSIBILITY
We believe we have a responsibility to support the communities where we operate and to support the health, safety and human rights of everyone in our value chain.
Nordstrom, Inc. and subsidiaries910
CORPORATE RESPONSIBILITY
We believe we have a responsibility to support the many people and communities we serve. In 2020, we updated ourOur Corporate Social Responsibility strategy with a new set of five-year goals focusedfocuses on environmental sustainability, human rights and corporate philanthropy. These goals guide us as we work to address areas where our Company and industry have the most impact to create positive change.
In 2021,2023, we made meaningful progress to advance our commitment toward responsible business.in these areas. Specific highlights include:
•Environmental Sustainability: Through our beauty packaging take back and recycling program BEAUTYCYCLE, we hit an important milestone of taking back more than 50 tons of beauty packaging waste, bringing us more than halfway to our goal of taking back 100 tons by 2025. We also established science-based targets to reduce our greenhouse gas emissions for scope 1 (direct emissions from sources we own or control), scope 2 (indirect emissions from purchased electricity, heat and cooling) and scope 3 (indirect emissions associated with products we sell).
•Human Rights:We audited Nordstrom Made factoriesare committed to creating safe and fair workplaces for compliance withthe people who make our products and we conduct due diligence to help support human rights and responsible sourcing. Our Human Rights and Responsible Sourcing program is based on international standards, upholding our Partner Code of Conduct and implemented corrective action plans where necessary.using third-party assessments to engage our suppliers on relevant policies and programs. We also strengthened our policies and programs to enhance human rights protectionsduring the year and launched a human rights impact assessment.assess them cyclically.
•Women’s Rights:Gender Equity: This yearPromoting gender equity is part of our commitment to human rights. We aim to drive positive change by producing more of our products in factories where women have resources to learn, grow and lead. By the end of 2025, we hit a milestone: nearly 45%expect 90% or more of our Nordstrom Made products wereproduct volume to be produced in facilities that invest in gender equity programs, and we are actively expanding production in factories that offer women’s empowerment training, bringing us closermade this commitment. We are more than halfway to our goal of producing 90% of Nordstrom Made products in factories that invest in women's empowerment by 2025.goal.
•Charitable Giving: In our 13th year partnering with Shoes That Fit, we raised more than $1.2 million and donated more than 50,000 pairs of shoes to kids in our local communities. We donated nearly $11 million to over 320 organizations located in communities where we operate. Our employees gave donationscontinued our partnerships with Operation Warm and volunteered their time to over 2,700 qualifying nonprofitsBig Brothers Big Sisters, and other organizations, many of which were supported with Company matching. Togethertogether with our customers, andwe raised enough funds to provide over 25,000 new coats to kids in need this holiday season. On Giving Tuesday alone, our employees we used our platformallocated over $1 million to drive more than $14 million in nonprofit donations across the U.S.causes they care about and Canada.
•Environmental Sustainability: We kept approximately 290 tons of clothing out of landfills through donation, resale or refurbishment, exceeding our goal of 250 tons. We also expanded BEAUTYCYCLE, our in-store beauty take-back and recycling program, to our Canadian stores, and took backvolunteered over five tons of beauty packaging.2,500 hours.
Read our full list of 2025 goals and more onabout our corporate social responsibility efforts at NordstromCares.com. The information contained or referred to on our website is not deemed to be incorporated by reference into this Annual Report unless otherwise expressly noted.
TRADEMARKS
Our most notable trademarks includeude Nordstrom, Nordstrom Rack, Trunk Club,Zella, Z by Zella, BP., Open Edit, Chelsea28, Caslon, Halogen, Tucker + Tate, Treasure & Bond, Halogen,14th & Union, Leith, Abound, Harper Canyon and Caslon.Melrose & Market. Each of our trademarks is renewable indefinitely, provided it is still used in commerce at the time of the renewal.
SEASONALITY
Our business, like that of other retailers, is subject to seasonal fluctuations and cyclical trends in consumer spending. Our sales are typically higher in our second quarter, which usually includes most of theour Anniversary Sale, and in ourthe fourth quarter due to the holidays. In 2021, approximately oneOne week of theour Anniversary Sale shifted into ourfrom the second quarter in 2022 to the third quarter and in 2020, as a result of COVID-19, the Anniversary Sale fell entirely in our third quarter. 2023.
Results for any one quarter are not indicative of the results that may be achieved for a full fiscal year. We plan our merchandise purchases and receipts to coincide with expected sales trends. For instance, our merchandise purchases and receipts increase prior to the Anniversary Sale and we purchase and receive a larger amount of merchandise in the fall as we prepare for the holiday shopping season (typically from late November through December). Consistent with our seasonal fluctuations, our working capital requirements have historically increased during the months leading up to the Anniversary Sale and the holidays as we purchase inventory in anticipation of increased sales.
COMPETITIVE CONDITIONS
We operate in a highly competitive business environment. We regularly compete with other international, national, regional and local retailers, including internet-based businesses, omni-channel department stores, online marketplaces, brands selling direct to consumers online and in-stores, specialty stores, off-price stores and boutiques, which may carry similar lines of merchandise. Our specific competitors vary from market to market. We believe the keys to competing in our industry are what will always matter most to our customers: providing compelling product and outstanding service, both digitally and in stores, backed by people who care. This includes serving customers on their terms by providing a seamless digital and physical experience, offering compelling, curated and quality products across a range of price points, and by strategically partnering with relevant and limited distribution brands, all in top markets.
Nordstrom, Inc. and subsidiaries11
AVAILABLE INFORMATION
We file annual, quarterly and current reports, proxy statements and other documents with the SEC. The SEC maintains a website at SEC.gov that contains reports, proxy and information statements, and other information regarding issuers that file with the SEC.
Our website address is Nordstrom.com.addresses are Nordstrom.com and NordstromRack.com. Our annual and quarterly reports on Form 10-K and Form 10-Q, current reports on Form 8-K, proxy statements, our executives’ statements of changes in beneficial ownership of securities on Form 4 and amendments to those reports filed or furnished pursuant to Section 13(a) or 15(d) of the Exchange Act are available for free on or through our website as soon as reasonably practicable after we electronically file the report with or furnish it to the SEC. Interested parties may also access a webcast of quarterly earnings conference calls and other financial events through our website at investor.nordstrom.com.
We have a long-standing commitment to upholding a high level of ethical standards. In addition, we have adopted Codes of Business Conduct and Ethics for our employees, officers and directors and Corporate Governance Guidelines, which comply with the listing standards of the NYSE and SEC requirements. Our Codes of Business Conduct and Ethics, Corporate Governance Guidelines and Committee Charters for the following Board of Director Committees are available through our website:
•Audit and Finance
•Compensation, People and Culture
•Corporate Governance and Nominating
•Technology
Any amendments to these documents, or waivers of the requirements they contain, will also be available on our website.
For printed versions of these items or any other inquiries, please contact:
| | |
| Nordstrom Investor Relations |
| 1617 Sixth Avenue |
| Seattle, Washington 98101 |
|
| InvRelations@Nordstrom.com |
Item 1A. Risk Factors.
Our business faces many risks. We believe the risks described below outline the items of most concern to us. In evaluating our Company, you should carefully consider the following factors, in addition to the other information in this 20212023 Annual Report. Before you buy our common stock or invest in our debt, you should know that making such an investment involves risks including, but not limited to, the risks described below. Any one of the following risks could harm our business, financial condition, results of operations or reputation, each of which could cause our stock price to decline or a default on our debt payments, and you may lose all or a part of your investment. Additional risks, trends and uncertainties not presently known to us or that we currently believe are immaterial may also harm our business, financial condition, results of operations or reputation.
COVID-19 RISKS
The COVID-19 global pandemic has had and may continue to have an adverse effect on our business and results of operations.
The COVID-19 pandemic continued to have widespread, rapidly evolving and unpredictable impacts on workforces, customers, consumer sentiment, economies, financial markets and business practices. Numerous state and local jurisdictions have imposed, and others in the future may impose, shelter-in-place orders, quarantines, vaccination requirements, executive orders and similar government orders and restrictions for their residents to control the spread of COVID-19. The direct effects of COVID-19 and associated consumer and governmental responses have had, and may continue to have, a material adverse impact on global economic conditions and our business, results of operations and financial condition.
OPERATIONAL
We have experienced disruptions within our business, and our results for fiscal year 2021 were adversely impacted. Due to the uncertainty of COVID-19 and the speed at which the pandemic has developed over the past two years, we continue to assess the situation in real time, including government-imposed restrictions, market by market. We also saw the shifts in product and channel preferences in 2020 persist into 2021, such as a shift from occasion-based apparel to casual and home offerings, as well as a reduction in-store traffic in favor of ecommerce.
We, as well as our vendors and third-party service providers, have experienced and will continue to experience adverse operational effects due to supply chain disruptions, labor shortages, social distancing restrictions and the need to adapt to ever-changing regulatory requirements, operating procedures and protocols. To the extent that our employees contract COVID-19, it leads to slowdowns in business processes and other disruptions in business operations as we engage in contact tracing and seek to limit further spread of the virus. We are unable to accurately predict the full impact COVID-19 will have on our longer-term operations as well, particularly with respect to our current mix of merchandise offerings, event-based categories, store traffic trends, employment relations and corporate culture.
In addition, the operations, supply chain and financial condition of many of our vendors have been and may continue to be affected by COVID-19, including difficulty sourcing products and labor or obtaining the financing necessary to manufacture the products they sell to us. As a result, the business disruptions caused by the spread of COVID-19 have impacted our ability to timely acquire the products we sell to our customers. To the extent our vendors may be unable to produce, sell or ship products to us or our customers, our business may be negatively impacted.
Nordstrom, Inc. and subsidiaries11
ECONOMIC
We have been, and may in the future be, negatively impacted by the deterioration in economic conditions caused by the spread of COVID-19 and the follow-on impact of that deterioration on discretionary consumer spending and changes in consumer behavior. Public concern regarding the risk of contracting COVID-19 has reduced store traffic and materially and adversely affected our business. Any resurgence could impede economic activity, consumer confidence or discretionary spending. We are unable to accurately predict the full impact that COVID-19 will have on our operations going forward due to uncertainties, including the currently unknowable duration and spread of COVID-19, actions taken to limit the spread, the public’s willingness to comply with such actions, testing availability, the efficacy, including the duration and protection level, and degree of public acceptance of vaccines and other treatments for COVID-19, and the impact of any governmental regulations imposed in response to the pandemic.
To the extent the COVID-19 pandemic and its associated economic challenges adversely affects our business and financial results, it may also have the effect of heightening many of the other risks described below, such as those risks relating to our level of indebtedness, our need to generate sufficient cash flows to service our indebtedness and other liabilities, our ability to comply with the covenants contained in the agreements that govern our indebtedness, our ability to attract, retain, train and develop talent and future leaders, the performance of our credit card program with TD Bank and our ability to maintain our relationships with our customers, vendors, landlords and employees.
STRATEGIC AND OPERATIONAL RISKS
If we are unable to successfully execute our customer strategy, grow our customer base or evolve our business model, it could negatively impact our business and future profitability and growth.
OurWe believe our omni-channel market strategy is a powerful enabler for the business allowingwhich allows us to better serve customers and provide greater access to product by leveraging all of our assets of people, product and place at the market level. As our business evolves, we must continue to scale our market strategy and focus on better serving our customers through three priorities with significant potential for growth: winning in our most important markets, broadening the reach of Nordstrom Rack and increasing our digital velocity. Our market strategy focuses on our customers by providingseeking to provide a differentiated and seamless experience in a digital world by bringing all of our assets together in each market to serve customers when, where and how they want to shop. We aim to balance our assortment, increase the breadth of selection and continue to leverage our digital and physical assets to increase selection and improve profitability in our Nordstrom Rack brand. As a digital first business, we are well positioned to support our customers with a scalable platform that has been built to support continued growth.banner. We are expandingworking to expand our inventory flexibility through alternative partnershipunowned inventory models, including strategic brands, wholesale, vertical brands,dropship, concession, dropshipmarketplace and other strategies. Additionally, we are scalingworking to scale our Nordstrom Media Network,NMN, which allows our brand partners to directly connect with our customers through onon- and off-site media campaigns to drive traffic, sales and engagement.
Our customer focus on the customer requires us to build new supply chain capabilities and enhance existing ones, develop applications for electronic devices, improve customer-facing technology, deliver purchased products timely, enhance inventory management systems and allow greater and more fluid inventory availability between digital and retail locations through our market strategy. In addition, these strategies will require further expansion of and reliance on data science and analytics. This business model has a highly variable cost structure driven by fulfillment and marketing costs and will continue to require investments in cross-channel operations and supporting technologies. There are also inherent risks associated with the investment in new technologies, such as generative artificial intelligence, and such operational and supporting technologies can be subject to failure, disruption or unavailability and increased vulnerability to cyberattacks and other cyber incidents.
If we do not successfully implement our customer strategy, including thoroughly understanding and delivering on our customercustomers’ needs and wants, effectively integrating our digital operations and stores and scaling our market strategy, strengthening our brand awareness, expanding our supply chain initiatives and efficiently getting product to our customers, we may fall short of our customers’ expectations, which would impact our brand, reputation, profitability and growth. Also, if customers shift tobetween shopping at our store and digital channels, or between our Nordstrom and Nordstrom Rack banners, at a different pace than we anticipate, we may need to quickly modify our digital and store or Nordstrom and Nordstrom Rack initiatives and investments, or ifinvestments. If we do not have or devote the resources necessary to execute upon these strategies, our business could be negatively impacted.
Our business could suffer if we do not appropriately assess and react to competitive market forces and changes in customer behavior.
The retail environment is rapidly evolving. Customer shopping preferences continue to shift, including to digital channels, and increasing expectations for faster delivery of product. In addition, the retail environment is under significant pressure from non-traditional retailers, including the pressure from the emergence ofonline marketplaces and rental and recommerce companies. We regularly compete with other international, national, regional and local retailers, including internet-based businesses, omni-channel department stores, online marketplaces, brands selling direct to consumers online and in-stores, specialty stores, off-price stores and boutiques, which may carry similar lines of merchandise. Digital channels continue to facilitate comparison shopping, intensifying competition in the retail market, and marketing digitally is controlled by a few key platforms. If we fail to adequately anticipate or respond to customer behavior and expectations, or changing market dynamics, we may lose market share or our ability to remain competitive, causing our sales and profitability to suffer.suffer, and may potentially impact the valuation of our goodwill and result in a non-cash impairment charge. If the efficiency and allocation of loyalty marketing, advertising and promotional campaigns that attract customers through various programs and media, including digital media and print, is unsuccessful in influencing consumer behavior in our digital channels and stores, or if our competitors are more effective with their programs than we are, our growth and profitability could suffer. We also may not gather accurate and relevant data or effectively utilize that data, which may impact our strategic planning, marketing and loyalty programs and our overall decision making.
Our customer relationships and sales may be negatively impacted if we do not anticipate and respond to consumer preferences and fashion trends or manage inventory levels appropriately.
Our ability to predict or respond to constantly changing fashion trends, demographics, consumer preferences and spending patterns significantly impacts our sales and operating results. We must effectively manage our merchandise mix to curate an assortment that offers newness and greater selection at various price points. Some merchandise may take several months from the time we place a purchase order to the time it is received, and our ability to accelerate or modify that timeline or purchase order contents may be limited. If we do not identify and respond to emerging trends in consumer spending and preferences quickly enough, identify the right partners that align with our customer strategy, broaden or expand our category offering fast enough or in the right areas or develop, evolve and retain our team'steam’s talent, mindset and technical skills to support changing operating models, we may harm our ability to retain our existing customers or attract new customers. We also store a certain level of pack-and-hold inventory to deploy in periods with high demand, tight supply or system constraints. As a result, we are vulnerable to shifts in consumer demand and misjudgments in the assortment and timing of merchandise purchases which may impact our ability to sell through this inventory in future periods. Ensuring we optimize our inventory and improve the planning and management of inventory through use of data and analytics is critical to serving the customer, driving growth and maximizing profitability. If we purchase too much inventory, we may be forced to sell our merchandise at lower average margins by taking significant markdowns, which could harm our business. Conversely, if we fail to purchase enough merchandise, or inventory does not arrive fast enough or as expected, we may lose opportunities for additional sales and potentially harm relationships with our customers.
Nordstrom, Inc. and subsidiaries13
Any inability to mitigate global labor and merchandise pricing pressures or disruptions may negatively impact our profitability.
Our profitability depends in part on our ability to anticipate and react to operating volatility, including the cost and availability of labor and merchandise. Increases in product and/or delivery costs, including changes in the price of raw materials to us and our vendors that are directly or indirectly related to the production and distribution of our products or increases in energy, labor or fuel and transportation costs, may translate to higher sales prices, which may then impact customer demand. In the near term, we are focused on improving our internal network and processes by diversifying our carrier capacity, gaining better end-to-end visibility of inventory and increasing velocity and throughput in our Supply Chain Network. If we are unable to respond effectively to ongoing pricing pressures or labor shortages, or offset such costs, there could be a material adverse impact on our business and financial results.
Our employees are key to supporting our business and operations effectively, and increased labor costs put pressure on our operating expenses. When wage rates or benefit levels increase in particular markets, increasing our wages or benefits has negatively impacted and may continue to negatively impact our earnings. Conversely, failing to offer competitive wages or benefits could adversely affect our ability to attract or retain sufficient or quality employees, causing increased turnover and our customer service to suffer. Excessive turnover may result in higher costs associated with finding, hiring and training new employees.
Any impediment to our inventory optimization may impact our ability to drive growth and meet customer demand, affecting future results and profitability. Shortages in certain materials and increasing pricing pressures in the highly competitive retail environment have contributed, and may in the future continue to contribute, to fluctuations in the quality, availability and price of our merchandise. The availability of raw materials or inventory to the U.S. may hinder our ability to meet customer demand. VendorsOur vendors and other suppliers of the Company may experience similar fluctuations or restrictions, which may subject us to the effects of their price increases. Additionally, if we do not gather complete, accurate and timely competitive pricing data, or adequately utilize this data to implement an effective pricing strategy, our ability to successfully compete could be negatively impacted, causing our sales, profitability and results of operations to suffer.
Nordstrom, Inc. and subsidiaries13
Improvements to our fulfillment,processes and systems for Supply Chain Network, inventory, buying, vendor payment and accounting processes and systems could adversely affect our business if not successfully executed.
Our business depends on accuracy throughout our product flow process. We are making investments to streamline and standardize our fulfillment,Supply Chain Network, inventory, buying, vendor payments and accounting capabilities through changes in technology, such as the utilization of generative artificial intelligence-enabled methodologies and processes. If we encounter challenges associated with change management, inventory integrity and implementation of associated information technology or adoption of new processes, features or capabilities, our ability to continue to successfully execute or evolve our strategy with changes in the retail environment could be adversely affected. Or, if we are unable to maintain accurate, reliable and effective inventory tracking systems, such as our use of RFID technology, which are critical to our integrated omni-channel business strategy, it may adversely impact our sales and profitability and may result in canceled orders and increased costs relative to our current expectations.
If we do not effectively attract, retain, train and develop talent and future leaders, our business may suffer.
We rely on the experience of our senior management, who have specific knowledge relating to us and our industry that is difficult to replace, to execute our business strategies and objectives. We have succession plans in place and our Board of Directors reviews these succession plans. If our succession plans do not adequately cover significant and unanticipated turnover, the loss of the services of any of these individuals, or any resulting negative perceptions or reactions, could damage our reputation and our business.
Additionally, our success depends on the talents and abilities of our workforce in all areas of our business, especially personnel that can adapt to complexities and grow their skillset across the changing environment. Our ability to successfully execute our customer strategy depends on attracting, developing and retaining qualified talent with diverse sets of skills, especially functional and technology specialists that directly support our strategies. We have a large workforce, and our ability to meet our labor needs is subject to various external factors such as regional minimum wage and benefits requirements, market pressures, including prevailing wage rates, benefit mix, unemployment levels, changing demographics, economic conditions and a dynamic regulatory environment.
We have experienced, and may continue to experience, increased employee attrition due to an intense competition for talent, a competitive wage environment and labor shortages. In the Seattle metropolitan area, where our corporate headquarters are located, we regularly compete for talent with many larger technology-focused companies, which may increase market compensation, especially for certain employee groups. If we are unable to sustain employee satisfaction or offer competitive compensation and benefits, appropriate training and development andor a compelling work environment, or sustain employee satisfaction, our culture may be adversely affected, our reputation may be damaged and we may incur costs related to turnover.
Our program agreement with TD, or changes to that agreement, could adversely impact our business.
The program agreement with TD was consummated on terms that allow us to maintain customer-facing activities, while TD providesfacilitates issuance of Nordstrom-branded payment methods and provides payment processing services. If we fail to meet certain service levels, TD has the right to assume certain individual servicing functions including managing accounts and collection activities. If we lose control of such activities and functions, if we do not successfully respond to potential risks and appropriately manage potential costs associated with the program agreement with TD or if these transactions negatively impact the customer service associated with our cards, resulting in harm to our business reputation and competitive position, our operations, cash flows and earnings could be adversely affected. If, upon expiration of our current program agreement in 2024,2026, a new contract has less favorable terms, our results could be negatively impacted. If TD became unwilling or unable to provide these services or if there are changes to the risk management policies implemented under our program agreement with TD, our results may be negatively impacted. If we lose control over certain servicing functions and TD isare unable to successfully manage accounts and collection activities,ensure the successful management of servicing related to Nordstrom-branded credit cards, it may heighten the risk of credit losses.
DATA, CYBERSECURITY AND INFORMATION TECHNOLOGY RISKS
Even if we take appropriate measures to safeguard our information, network and environment from security breaches or unauthorized disclosures, our customers, employees and business could still be exposed to risk.
We and our third-party providers access, collect, store and transmit sensitive and confidential Company, customer and employee data and information, including consumer preferences and credit card information, all of which are subject to demanding and constantly changingcontinuously evolving privacy and security laws and regulations. A number of jurisdictions where we do business have enacted or are considering new privacy and data protection laws which impact our responsibilities with respect to this data, such as theincluding California, Consumer Privacy ActColorado, Connecticut, Utah and the California Privacy Rights Act. Virginia. In addition, the fact that the substantial majority of our corporate employees working remotely has resultedadvances in increased demand on our information technology infrastructure,artificial intelligence technologies, which can be subject to failure, disruption or unavailability and increasedattackers may use, increase vulnerability to cyberattacks, and other cyber incidents or privacy incidents.
We have taken measures to help prevent a breach of our information securitynetworks and environments and comply with cybersecurity and privacy requirements by implementing safeguards and procedures designed to protect the security, confidentiality and confidentialityintegrity of and the access to, such information. In addition, we have strengthened our contracts to require, where possible, we require our third-party providers to implement administrative, physical and technical safeguards and procedures. We, likeprocedures aligned to industry best practices.
Despite the fact that we have implemented measures to prevent intentional or inadvertent information security breaches and requested our third-party providers to do the same, these measures cannot completely eliminate cybersecurity risk. Like many companies, with an ecommerce presence,we, as well as several of our vendors, have suffered breaches of our cybersecurity in the past and are at risk for such breaches in the future.
Although we and our third-party providers have implemented measures to prevent intentional or inadvertent information security breaches, these measures do not completely eliminate cybersecurity risk. Security breaches and cyber incidents, and their remediation, whether at our Company, our third-party suppliers and service providers or other retailers, could expose us to a risk of loss, unauthorized release or disclosure of customer, employee or Company confidential information, litigation, investigation, regulatory enforcement action, penalties and fines, orders to stop any alleged noncompliant activity, information technology system failures or network disruptions, increased cyber-protection and remediation costs, financial losses, potential liability, or loss of customers’, employees’ or third-party providers’ trust and business, any of which could adversely impact our reputation, competitiveness and financial performance. Concerns about our data management practices, with regard toincluding the collection, use, retention, security or disclosure of personal information or other privacy-related matters, even if unfounded, could subject the Company to regulatory inquiries and damage our reputation, and adversely affectaffecting our operating results.
Our business may be impacted by information technology system failures or network disruptions.
Our ability to transact with customers and operate our business depends on the efficient operation of various internal and third-party information technology systems, including cloud computing, data centers, hardware, software and applications, to manage certain aspects of our Company, including online and store transactions, logistics and communication, inventory and reporting systems. We seek to build qualityresilient and secure systems, select reputable system vendors and implement procedures intended to enable us to protect our systems when we modify them. We test our systems to address vulnerabilities and train our employees regarding practices to protect the safety of our technology systems.
There are inherent risks associated with developing, modifying or replacing information technology systems, and with new or changed relationships, including accurately capturing and maintaining data, realizing the expected benefit of the change and managing the potential disruption of the operation of the systems as the changes are implemented. Potential issues associated with implementing technology initiatives and the time and resources required to optimize the benefits of new elements of our systems and infrastructure could reduce the efficiency of our operations in the short term.
If we encounter an interruption or deterioration in critical systems or processes or experience the loss of critical data, which may result from security or cybersecurity threats or attacks, natural disasters, accidents, power disruptions, telecommunications failures, acts of terrorism or war, computer viruses, physical or electronic break-ins or third-party or other disruptions, our business could be harmed both in the short-term and over a longer period. Depending on the severity of the failure, our disaster recovery plans may be inadequate or ineffective. These events could also damage our reputation, result in increased costs or loss of sales and be expensiverequire significant time and time-consumingexpense to remedy.
Nordstrom, Inc. and subsidiaries15
REPUTATION AND RELATIONSHIP RISKS
Our customer, employee, vendor, third-party partner, landlord and other stakeholder relationships could be negatively affected if we fail to maintain our corporate culture and reputation.
We have a well-recognized culture and reputation that consumers may associate with a high level of integrity, customer service and quality merchandise, and it is one of the reasons customers shop with us and employees choose us as a place of employment. Any significant damage to our reputation, including damages arising from ournoncompliant business, data privacy, information security, diversity, environmental or social responsibility practices, news about our Company or factors outside our control or on social media, could diminish customer trust, weaken our vendor relationships, reduce employee morale and productivity and lead to difficulties in recruiting and retaining qualified employees. Additionally, management may not accurately assess the impact of significant legislative changes, including those that relate to data privacy and security, employment matters, labor issues, environmental compliance and health care, impacting our relationship with our customers or our workforce and adversely affecting our sales and operations.
There is also increased focus from both internal and external stakeholders on corporate social responsibility and sustainability matters. If we do not, or are perceived not to, act responsibly with respect to our practices and initiatives, meet any communicated targets, goals or milestones or lack transparency with our initiatives, our reputation could be damaged. We may also incur additional costs as we invest in new ways to operate to better support our communities and our customers or to report our outcomes and results.
In addition, the customer.long-term reputational impact from winding down business operations in Canada, including the impact to our customers, employees, vendors and third-party partners and landlords, is unknown, and we may need to take actions that could increase our expenses and adversely affect the results of our operations.
Our business depends on third parties for the production, supply and delivery of goods and/or services, and a disruption could result in lost sales or increased costs.
Supply Chain
Timely receiptsreceipt of quality merchandise from third parties is critical to our business.business, as the majority of the goods we sell are produced by vendors in factories overseas. Our process to identify qualified vendors and access quality products in an efficient manner on acceptable terms and cost can be complex. Vendors and factors may also be subject to credit capacity limits that restrict shipments. In addition, we rely on a limited number of carriers to deliver our product to customers. Ongoing disruptions in the global supply chain, including factory closures, transportation challenges, rising freight expenses, violations of law or global standards with respect to human rights, quality and safety by any of our importers, manufacturers or distributors, or parties upstream within their respective supply chains, could result in delays in shipments and receipt of goods or damage our reputation.goods. These third parties may experience supply chain or port disruptions, stoppages of certain imports or other difficulties due to economic, business, political, environmental or epidemic conditions, or may shift their business models away from prior practice, any of which could negatively impact our inventory levels, delivery timelines and ability to meet customer demand.practice. Additionally, the countries in which merchandise is manufactured could become subject to new trade restrictions, including increased taxation on imported goods, customs restrictions, tariffs or quotas. Such violations, disruptions
Any disruption, delay or changeschange in our or our vendors’ supply chain, including increased transit times or costs, could negatively impact our inventory levels, delivery timelines and our ability to meet customer demand, which in turn may have a material adverse effect on our business,reputation, results of operations and liquidity. Our corporate social responsibility and sustainability goals, such as our goal to decrease greenhouse gas emissions in our operations and supply chain, may also be adversely impacted by these disruptions.
Nordstrom, Inc. and subsidiaries15
We are party to contracts, transactions and business relationships with various third parties, including vendors, suppliers, service providers, landlords and lenders, who may have performance, payment and other obligations to us. If any of the third parties with whichwhom we do business change the terms and conditions that govern their relationships with us due to changes in their business strategy, or become subject to bankruptcy, receivership or similar insolvency proceedings, our rights and benefits in relation to our contracts, transactions and business relationships with such third parties could be terminated, modified in a manner adverse to us or otherwise impaired. We cannot make any assurances thatimpaired, and we wouldmay be ableunable to arrange for alternate or replacement contracts, transactions or business relationships on terms as favorable as our existing contracts, transactions or business relationships, if at all. Any inability on our part to do so could negatively affectIn such circumstance, our cash flows, financial condition and results of operations.operations may be negatively impacted.
DistributionThe decision to wind down business operations in Canada may negatively impact our relationships with vendors that also supply our U.S. operations in a way that might cause less favorable terms and marketingincreased costs, result in less timely and efficient deliveries or impact their ability to sell to us.
Our ability to effectively market our brands, sell product through third-party platforms and access to,make our products dependsown apps available for customers relies heavily on a variety of third-party publishers, platforms and platforms.distribution channels. If the regulatory environment or these third parties limit prohibit or otherwise interfere with or change the terms of themarketing, distribution or use or marketing of our products,data, it could adversely affect our results of operations.
We market our brands, sell product through third-party platforms, and distributemake our productsown apps available to customers through a variety of third-party publisher and platform channels. Ourchannels and our ability to market on any given platform or channel is subject to the policies of that party. We are dependentparty and regulatory requirements. Our dependency on the interoperability of our products with popular mobile operating systems, such as Android or iOS, websites, networks, technologies, products and standards that we do not control. Additionally, mobile operating systems and websites have identifiers withincontrol, coupled with their platforms that advertisers use to deliver personalized and targeted advertising, requiring users to “opt-in”.
Changes in our relationships with mobile operating system partners, websites or mobile carriers, or in theirunilateral control of the terms of service and ongoing regulatory scrutiny associated with targeted advertising, could reduce or eliminate our ability to update our apps or distribute our productssell product on these platforms. Any changes, bugs or technical issues in such systems or websites may limit our ability to effectively deliver our products, or to target or measure the effectiveness of ads. There is no guarantee that popular platforms will continue to feature our products, or that mobile device users will continue to use our products rather than competing products.ads. If we do not pick the platforms relevant to our customers, if the platforms give preferential treatment to competitors, limit our ability to deliver, target or measure the effectiveness of ads, or if there is a sudden shift in platform preference, our ability to market our brand effectively could be negatively impacted. Furthermore, to the extent thatplatform users choosedo not “opt-in” to “opt-in” for advertiser access to customer tracking,certain data collection and sharing practices, our ability to deliver, target or measure the effectiveness of ads or drive usage on our apps is limited.impacted.
The concentration of stock ownership in a small number of our shareholders may limit a shareholder’s ability to influence corporate matters and impact the price of our shares.
We have regularly reported in our annual proxy statements the holdings of members of the Nordstrom family, including Bruce A. Nordstrom, our former Co-President and Chairman of the Board, his sister Anne E. Gittinger and certain members of the Nordstrom family within our Executive Team. As of March 11, 2022,19, 2024, these individuals beneficially owned an aggregate of approximately 30% of our common stock. As a result, either individually or acting together, they may be able to exercise considerable influence over matters requiring shareholder approval, including the election of directors or other matters impacting our management or corporate governance. In addition, as reported in our periodic filings, our Board of Directors has from time to time authorized share repurchases. While these share repurchases may be partially offset by share issuances under our equity incentive plans and as consideration for acquisitions, the repurchases may nevertheless have the effect of increasing the overall percentage ownershipinterest held by these shareholders.
Our Board of Directors adopted a limited-duration shareholder rights agreement. The Rights Plan would cause substantial dilution to the ownership of any person or group that acquires 10% or more of the outstanding shares of our common stock, subject to certain exceptions in the plan (including that the ownership of Bruce A. Nordstrom, Anne E. Gittinger and certain other members of the Nordstrom family as of the date of the Rights Plan’s adoption is grandfathered under the plan). By effectively preventing a shareholder or group of shareholders other than the Nordstrom family from acquiring 10% or more of our common stock, the Rights Plan may ensure that the Nordstrom family retains its concentration of ownership relative to other shareholders.
The corporate law of the State of Washington, where we are incorporated, provides that approval of a merger or similar significant corporate transaction requires the affirmative vote of two-thirds of a company’s outstanding shares. The interests of thesethe Nordstrom family shareholders may differ from the interestsinterest of our shareholders as a whole, and thewhole. The beneficial ownership of thesethe Nordstrom family shareholders may have the effect of discouraging offers to acquire us, delaydelaying or otherwise preventpreventing a significant corporate transaction because the consummation of any such transaction would likely require their approval. As a result of any of these factors, the market price of our common stock may be affected.
INVESTMENT AND CAPITAL RISKS
If we fail to appropriately manage our capital, we may negatively impact our operations and shareholder return.
We utilize working capital to finance our operations, pay for capital expenditures, acquisitions and acquisitions,investments, manage our debt levels and return value to our shareholders through dividends and share repurchases. Additionally, in 2021, we amended our Revolver to create flexibility for dividends and share repurchases during our Collateral Period (see Note 5: Debt and Credit Facilities in Item 8). Sufficient cash and liquidity are necessary to fund our business. Changes in the credit and capital markets, including market disruptions, limited liquidity and interest rate fluctuations, may increase the cost of financing or restrict access to a potential source of liquidity. A deterioration in our capital structure or the quality and stability of our earnings could result in noncompliance with our debt covenants or a downgrade of our credit rating, constraining the financing available to us or limiting our ability to issue dividends or repurchase shares. In 2021, Moody’s Investor Service downgraded certain2023, two of our debt and otherthe three major ratings agencies revised the Company’s credit ratings.rating outlook from stable to negative. These downgrades,outlook changes, and any future reductions in our credit ratings, could result in restricted access to financing and increased borrowing costs and could adversely impact our operations and financial condition. In addition, if we do not properly allocate our capital to maximize returns or we do not maintain financial flexibility, our operations, cash flows and returns to shareholders could be adversely affected.
16Nordstrom, Inc. and subsidiaries17
Owning and leasing real estate exposes us to possible liabilities and losses.
We own or lease the land, buildings and equipment for all of our Supply Chain Network facilities, stores and corporate locations and are therefore subject to all of the risks associated with owning and leasing real estate. In particular, the value of the assets could decrease, their operating costs could increase or facilities or stores may not be opened as planned due to changes in the real estate market, demographic trends, site competition, dependence on third-party performance or overall economic environment or may be constrained as a result of the COVID-19 pandemic.environment. We are also potentially subject to liability for environmental conditions, exit costs associated with disposal of a store and commitments to pay base rent for the entire lease term or to operate a store for the duration of an operating covenant. In addition, the invalidity of, or default or termination under, any of our leases may accelerate required cash payments or interfere with our ability to use and operate all or a portion of certain of our facilities, which may have an adverse impact on our operations and results.
The investment in existing and new locations may not achieve our expected returns.returns, such as our investment in the Canada business, which ultimately did not achieve our expectations.
The locations of our Supply Chain Network facilities and existing stores, planned store openings and relocations are assessed based upon desirability, demographics and retail environment. In particular, we have expanded our omni-channel market strategy, where we leverage and connect our digital and physical assets within discrete geographic markets to seamlessly serve our customers within those markets and create synergies between our digital assets, Supply Chain Network and stores. Our expansion of this market strategy has allowed us to execute against one of our top priorities of improving Nordstrom Rack performance through the opening of new Nordstrom Rack stores. We must equip our locations with the proper processes, technology and tools for timely and accurate fulfillment and inventory replenishment. This involves certain risks, including properly balancing our capital investments between fulfillment capabilities, technology, digital channels, new stores, relocations and remodels, assessing the suitability of locations in new domestic and international markets and constructing, furnishing and supplying a facility or store in a timely and cost-effective manner, which may be affected by the actions of third parties, including, but not limited to, private entities and local, state or federal regulatory agencies.
Customers’ expectations regarding speed of delivery are evolving. If we do not effectively integrate our digital and physical assets as part of our market strategy, or select locations to optimize our market strategy, we could incur significantly higher costs and shipping times that do not meet customer expectations, which in turn could have a material adverse effect on our business. Particularly in light of the changing trends between digital and brick-and-mortar shopping channels, salesSales through our digital channels or at our stores may not meet projections as we balance trends between digital and brick-and-mortar shopping channels, which could adversely affect our return on investment. If we do not properly allocate capital expenditures between locations, ensure timely completecompletion of construction projects associated with Supply Chain Network facilities and new, relocated and remodeled stores or properly maintain any of our properties, customer expectations may not be met, we may lose sales and may incur additional expenses.
ECONOMIC AND EXTERNAL MARKET RISKS
Our revenues and operating results are affected by the seasonal nature of our business and cyclical trends in consumer spending.
Our business, like that of other retailers, is subject to seasonal fluctuations and cyclical trends in consumer spending. Our sales are typically higher in our second quarter, which usually includes most of theour Anniversary Sale, and in ourthe fourth quarter due to the holidays. In 2021, approximately oneOne week of theour Anniversary Sale shifted into ourfrom the second quarter in 2022 to the third quarter and in 2020, as a result of COVID-19, the Anniversary Sale fell entirely in our third quarter.2023. To provide shareholders a better understanding of management’s expectations surrounding results, we provide our financial outlook on our expected operating and financial results for future periods comprised of forward-looking statements subject to certain risks and uncertainties. Any factor that negatively impacts these selling seasons could have an adverse and disproportionate effect on our results of operations for the entire year.
Additionally, factors such as results differing from our outlook, changes in sales and operating income, changes in our market valuations, performance results for the general retail industry, news or announcements by us or our industry competitors or changes in analysts’ recommendations may cause volatility in the price of our common stock and our shareholder returns.
A downturn in economic conditions, currency fluctuations, inflation, increased unemployment and bankruptcy rates, changes in fiscal stimulus or interest rates and other external market factors hashave had and could have a significant adverse effect on our business and stock price.
During economic downturns including those resulting from the impacts of COVID-19,or inflationary periods, fewer customers may shop, as these purchases may be seen as discretionary, and those who do shop may limit the amount of their purchases. Any reduced demand or changes in customer purchasing behavior may lead to lower sales, higher markdowns and an overly promotional environment or increased marketing and promotional spending.
Our stores located in shopping centers and malls have been and may be affected by consumer traffic at shopping centers and malls.
The majority of our stores are located within shopping centers and malls and may benefit from the abilities that we and other anchor tenants have to generate consumer traffic. A decline in shopping center traffic in favor of ecommerce,e-commerce, the development of new shopping centers and malls, the lack of availability of favorable locations within existing or new shopping centers and malls, the success of individual shopping centers and malls and the success or failure of other anchor tenants have impacted and may impact our ability in the future to maintain or grow our business, as well as our ability to open new stores, which could have an adverse effect on our financial condition or results of operations.
Nordstrom, Inc.Like other retailers, our stores have been impacted by changing levels of theft or vandalism, which may affect consumer traffic in our stores and subsidiaries17
inventory shrinkage at stores located in shopping centers and malls, or if we are unable to effectively reduce the impact of loss or theft of assets, our operating results could be adversely affected. The severity or quantity of incidents, including perceptions and reactions, may result in reputational damage or loss of customer trust.The results from our credit card operations could be adversely affected by changes in market conditions or laws.
Revenues earned under our program agreement with TD are indirectly subject to economic and market conditions that are beyond our control, including, but not limited to, interest rates, consumer credit availability, demand for credit, consumer debt levels, payment patterns, delinquency rates, frequency of fee waivers, frequency or volume of governmental stimulus, personal bankruptcy rates, employment trends, laws and other factors. Additionally, changes in net sales partially translate to program agreement revenues. Changes in economic, market or regulatory conditions, or customer behavior or changes in our mix of sales and program agreement revenues could impact our revenues and profitability.
Our business and operations could be materially and adversely affected by severe weather patterns, climate change, natural disasters, widespread pandemics, epidemics, civil unrest and other natural or man-made economic, political or environmental disruptions.
Disruptions, and government responses, to any disruption, could cause, among other things, a decreasedecreases in consumer spending that wouldcould negatively impact our sales, declines in traffic in urban centers, staffing shortages in our Supply Chain Network facilities, stores or corporate offices, interruptions in the flow of merchandise to our stores, disruptions in the operations of our merchandise vendors or property developers, increased costs and a negative impact on our reputation and long-term growth plans, and maywhich could vary based on the length and severity of the disruption. Health pandemics and epidemics, have in the past and may in the future, impact consumer and government responses, which may have an adverse impact on global economic conditions and our business, results of operations and financial condition. We also have a significant amount of our total sales, stores and square footage on the west coastWest Coast of the United States, particularly in California, where we have experienced earthquakes, wildfires, flooding and power outages and shortages that increase our exposure to any market-disrupting conditions in this region.
LEGAL AND REGULATORY RISKS
We are subject to certain laws, litigation, regulatory matters and ethical standards, and compliance or failure to comply with or adequately address developments as they arise could adversely affect our reputation and operations.
Our policies, procedures and practices and the technology we implement are intended to comply withaddress applicable federal, state, local and foreign laws, tariffs, rules and regulations, as well as responsible business, social and environmental practices, all of which may change from time to time. Our and our vendors’ complianceIf we, or the third parties we do business with, fail to comply with these requirements and/or changes to them, may cause our business tocould be adversely impacted, or even limit or restrict the activities of our business.impacted. In addition, if we fail to complynoncompliance with applicable laws and regulations or failure to implement responsible business, social, environmental and supply chain practices we could be subject toresult in reputational damage, to our reputation, class action lawsuits, regulatory investigations, legal costs and settlement costs,penalties, charges and payments, civil and criminal liability, increased cost of regulatory compliance, losingloss of our ability to offer or accept credit and debit card payments from our customers, restatements of our financial statements, disruption of our business, loss of customers and loss of customers. Newcustomer trust. Changes to existing and emergingnew privacy and data protection laws may increase compliance expenses and limit business opportunities and strategic initiatives, including customer engagement. Any required changes to our employment practices could result in the loss of employees, reduced sales, increased employment costs, low employee morale and harm to our business and results of operations. In addition, political and economic factors could lead to unfavorable changes in federal, state and foreign tax laws, which may affect our tax assets or liabilities and adversely affect our results of operations. We are also regularly involved in various litigation matters that arise in the ordinary course of business. Litigation or regulatory developments could adversely affect our business and financial condition.
Compliance with Section 404 of the Sarbanes-Oxley Act of 2002 requires management assessments of the effectiveness of our internal controls over financial reporting through documenting, testing, monitoring and enhancement of internal control over financial reporting. If we fail to implement or maintain adequate internal controls, we may not produce reliable financial reports or fail to prevent or detect financial fraud, which may adversely affect our financial position, investor confidence or our stock price.
Nordstrom, Inc. and subsidiaries19
Changes to accounting rules and regulations could affect our financial results or financial condition.
Accounting principles and related pronouncements, implementation guidelines and interpretations with regard to a wide variety of accounting matters that are relevant to our business, including, but not limited to, revenue recognition, inventory valuation, long-lived asset recoverability, and income taxes and contingent liabilities, including assumptions related to our Canada wind-down, are highly complex and involve subjective assumptions, estimates and judgments. Changes in these rules and regulations, changes in our interpretation or our misapplication of the rules or regulations, changes in accounting policies or changes in underlying assumptions, estimates or judgments could adversely affect our financial performance or financial position.
18
Item 1B. Unresolved Staff Comments.
None.
Item 1C. Cybersecurity.
Nordstrom understands that establishing, executing and sustaining effective cybersecurity measures to secure our information systems and preserve the confidentiality, integrity and availability of our data is critical to the success of the business.
Management of Material Risks and Integrated Overall Risk Management
Our comprehensive risk management framework is intended to strategically incorporate cybersecurity risk management across the company, with the objective of ensuring that cybersecurity considerations underpin the decision-making processes at all organizational levels. Our risk management team collaborates closely across various Enterprise-wide business units to continually assess and address identified cybersecurity risks in alignment with business objectives. The CISO regularly updates the CTIO, Chief Financial Officer and Chief Executive Officer on material cybersecurity risks and events.
Engagement with Third Parties on Management of Cybersecurity Risk
Recognizing the dynamic nature of cybersecurity threats, Nordstrom collaborates with external experts, including assessors, consultants and examiners, to evaluate and test our cybersecurity risk preparedness. Regular exams, threat assessments and consultation on security enhancements with these third parties ensure that our cybersecurity strategies align with industry best practices.
Oversight of Third-party Risk
In the course of our business, we regularly exchange data and information with certain third parties in various ways, exposing us to risk related to the cybersecurity posture of and information management practices of those third parties. To try to mitigate this risk, we have implemented processes that may, depending upon the nature of the relationship with the third party, require security assessments and data integration design reviews prior to allowing our systems to connect with theirs. In addition, we seek to require these third parties to adhere to pre-established cybersecurity standards. Where applicable, we try to obtain contractual commitments with those third parties to ensure these security requirements are met.
Risks from Cybersecurity Threats
Nordstrom has not experienced any cybersecurity incident that has materially impacted, or that is reasonably likely to materially impact, our operations, financial condition and cash flows.
Cybersecurity Risk Management Personnel
Primary responsibility for assessing, monitoring, mitigating and managing our cybersecurity risks rests with our information security organization, led by our CISO and supported by our CTIO. The CISO, who has over 20 years of cybersecurity and technology expertise, supports a skilled information security organization that brings expertise in vulnerability management, incident response, penetration testing, regulatory compliance and other critical information security domains. Our information security team maintains certifications from recognized external security authorities such as ISC2, CompTIA, ISACA, GIAC, SANS, PCI and OffSec. The security program is assessed annually by a reputable third party to provide guidance for continuous improvement.
Monitoring and Responding to Cybersecurity Incidents
The security organization stays informed about the latest developments in cybersecurity, implements processes for regular monitoring of information systems and deploys relevant security measures. In the event of a cybersecurity incident, a formal incident response plan is in place for immediate actions and long-term strategies.
Board of Directors Oversight
The Board of Directors has oversight responsibilities regarding cybersecurity risk. At regularly scheduled meetings (at least quarterly), in addition to such additional interactions as may be necessary in specific circumstances, our Chief Executive Officer, CTIO and CISO update the Board on emerging cybersecurity risks and developments impacting Nordstrom.
Nordstrom, Inc. and subsidiaries21
Item 2. Properties.
(Square footage amounts in thousands)
The following table summarizes the Supply Chain Network and retail locations we own or lease and the total square footage by category as of January 29, 2022:February 3, 2024: | | Number of locations | |
| Supply Chain Network | | Nordstrom | | Nordstrom Rack | | Total square footage |
| Number of locations | |
| Supply Chain Network | |
| Supply Chain Network | |
| Supply Chain Network | | Nordstrom | Nordstrom Rack | Total square footage |
| Leased buildings on leased land | Leased buildings on leased land | | 3 | | | 33 | | 241 | | | 15,096 | |
| Owned buildings on leased land | Owned buildings on leased land | | — | | | 55 | | — | | | 10,092 | |
| Owned buildings on owned land | Owned buildings on owned land | | 8 | | | 24 | | 1 | | | 8,250 | |
| Partly owned and partly leased | Partly owned and partly leased | | — | | | 2 | | — | | | 544 | |
| Total | Total | | 11 | | | 114 | | | 242 | | | 33,982 | |
The following table summarizes our Supply Chain Network and retail store count and square footage activity: | | | | | | | | | | | | | | | | | | | | | | | | | | | |
| | | Count | | Square footage |
| Fiscal year | | 2021 | | 2020 | | | 2021 | | 2020 |
| Total, beginning of year | | 369 | | | 390 | | | | 34,080 | | | 35,632 | |
Openings1: | | | | | | | | | |
| Supply Chain Network | | — | | | 1 | | | | (7) | | | 1,000 | |
| Nordstrom | | — | | | 3 | | | | — | | | 23 | |
| Nordstrom Rack | | 1 | | | — | | | | 29 | | | — | |
| Closures | | (3) | | | (25) | | | | (120) | | | (2,575) | |
| Total, end of year | | 367 | | | 369 | | | | 33,982 | | | 34,080 | |
| | | | | | | | | |
Relocations and other1 | | — | | | 2 | | | | (7) | | | (11) | |
1 Openings’ square footage include adjustments due to relocations, remodels or changes in lease-term square footage. | | | | | | | | | | | | | | | | | | |
| | Count | | Square footage |
| Fiscal year | 2023 | 2022 | | | 2023 | 2022 |
| Total, beginning of year | 368 | | 367 | | | | 33,693 | | 33,982 | |
| Openings: | | | | | | |
| | | | | | |
| Nordstrom | — | | 1 | | | | — | | — | |
| Nordstrom Rack | 19 | | 2 | | | | 531 | | 55 | |
| Relocations, remodels or changes | — | | — | | | | (8) | | — | |
| Closures | (18) | | (2) | | | | (1,835) | | (344) | |
| Total, end of year | 369 | | 368 | | | | 32,381 | | 33,693 | |
Nordstrom, Inc. and subsidiaries1922
The following table lists our Supply Chain Network and retail store count and square footage by state/provincestate as of January 29, 2022:February 3, 2024:
| | Supply Chain Network | | | Supply Chain Network | | Nordstrom | | Nordstrom Rack | | Total |
| Count | | | Count | Square Footage | | Count | Square Footage | | Count | Square Footage | | Count | Square Footage |
| | Supply Chain Network | | Nordstrom | | Nordstrom Rack | | Total |
| Count | Square Footage | | Count | Square Footage | | Count | Square Footage | | Count | Square Footage |
| U.S. | |
| Alabama | |
| Alabama | |
| Alabama | Alabama | | — | | — | | | — | | — | | | 1 | | 35 | | | 1 | | 35 | |
| Alaska | Alaska | | — | | — | | | — | | — | | | 1 | | 35 | | | 1 | | 35 | |
| Arizona | Arizona | | — | | — | | | 1 | | 235 | | | 9 | | 313 | | | 10 | | 548 | |
| California | California | | 5 | | 2,876 | | | 28 | | 4,051 | | | 54 | | 1,979 | | | 87 | | 8,906 | |
| Colorado | Colorado | | — | | — | | | 2 | | 387 | | | 7 | | 239 | | | 9 | | 626 | |
| Connecticut | Connecticut | | — | | — | | | 2 | | 341 | | | 1 | | 36 | | | 3 | | 377 | |
| Delaware | Delaware | | — | | — | | | 1 | | 127 | | | 1 | | 32 | | | 2 | | 159 | |
| Florida | Florida | | 1 | | 221 | | | 6 | | 1,031 | | | 16 | | 534 | | | 23 | | 1,786 | |
| Georgia | Georgia | | — | | — | | | 2 | | 383 | | | 4 | | 153 | | | 6 | | 536 | |
| Hawaii | Hawaii | | — | | — | | | 1 | | 195 | | | 2 | | 78 | | | 3 | | 273 | |
| Idaho | Idaho | | — | | — | | | — | | — | | | 1 | | 37 | | | 1 | | 37 | |
| Illinois | Illinois | | — | | — | | | 4 | | 947 | | | 16 | | 594 | | | 20 | | 1,541 | |
| Indiana | Indiana | | — | | — | | | 1 | | 134 | | | 2 | | 60 | | | 3 | | 194 | |
| Iowa | Iowa | | 2 | | 1,529 | | | — | | — | | | 1 | | 35 | | | 3 | | 1,564 | |
| Kansas | Kansas | | — | | — | | | 1 | | 219 | | | 1 | | 35 | | | 2 | | 254 | |
| Kentucky | Kentucky | | — | | — | | | — | | — | | | 1 | | 33 | | | 1 | | 33 | |
| Louisiana | Louisiana | | — | | — | | | — | | — | | | 3 | | 90 | | | 3 | | 90 | |
| Maine | Maine | | — | | — | | | — | | — | | | 1 | | 30 | | | 1 | | 30 | |
| Maryland | Maryland | | 1 | | 451 | | | 3 | | 603 | | | 6 | | 219 | | | 10 | | 1,273 | |
| Massachusetts | Massachusetts | | — | | — | | | 4 | | 595 | | | 7 | | 266 | | | 11 | | 861 | |
| Michigan | Michigan | | — | | — | | | 2 | | 430 | | | 5 | | 178 | | | 7 | | 608 | |
| Minnesota | Minnesota | | — | | — | | | 2 | | 380 | | | 5 | | 173 | | | 7 | | 553 | |
| Missouri | Missouri | | — | | — | | | 2 | | 342 | | | 2 | | 69 | | | 4 | | 411 | |
| Nevada | Nevada | | — | | — | | | 1 | | 207 | | | 3 | | 101 | | | 4 | | 308 | |
| New Jersey | New Jersey | | — | | — | | | 4 | | 817 | | | 8 | | 284 | | | 12 | | 1,101 | |
| New Mexico | New Mexico | | — | | — | | | — | | — | | | 1 | | 34 | | | 1 | | 34 | |
| New York | New York | | — | | — | | | 5 | | 838 | | | 11 | | 394 | | | 16 | | 1,232 | |
| North Carolina | North Carolina | | — | | — | | | 2 | | 300 | | | 2 | | 74 | | | 4 | | 374 | |
| Ohio | Ohio | | — | | — | | | 3 | | 549 | | | 6 | | 224 | | | 9 | | 773 | |
| Oklahoma | Oklahoma | | — | | — | | | — | | — | | | 2 | | 67 | | | 2 | | 67 | |
| Oregon | Oregon | | 1 | | 374 | | | 2 | | 363 | | | 6 | | 218 | | | 9 | | 955 | |
| Pennsylvania | Pennsylvania | | 1 | | 976 | | | 2 | | 381 | | | 7 | | 240 | | | 10 | | 1,597 | |
| | Rhode Island | Rhode Island | | — | | — | | | — | | — | | | 1 | | 38 | | | 1 | | 38 | |
| South Carolina | South Carolina | | — | | — | | | — | | — | | | 3 | | 101 | | | 3 | | 101 | |
| Tennessee | Tennessee | | — | | — | | | 1 | | 145 | | | 2 | | 69 | | | 3 | | 214 | |
| Texas | Texas | | — | | — | | | 8 | | 1,413 | | | 18 | | 613 | | | 26 | | 2,026 | |
| Utah | Utah | | — | | — | | | 2 | | 277 | | | 4 | | 130 | | | 6 | | 407 | |
| Virginia | Virginia | | — | | — | | | 2 | | 452 | | | 7 | | 268 | | | 9 | | 720 | |
| Washington | Washington | | — | | — | | | 6 | | 1,270 | | | 10 | | 383 | | | 16 | | 1,653 | |
| Washington D.C. | Washington D.C. | | — | | — | | | — | | — | | | 2 | | 66 | | | 2 | | 66 | |
| Wisconsin | Wisconsin | | — | | — | | | 1 | | 150 | | | 2 | | 67 | | | 3 | | 217 | |
| Canada | |
| Alberta | | — | | — | | | 3 | | 208 | | | — | | — | | | 3 | | 208 | |
| British Columbia | | — | | — | | | 2 | | 262 | | | — | | — | | | 2 | | 262 | |
| Ontario | | — | | — | | | 8 | | 899 | | | — | | — | | | 8 | | 899 | |
| Total | Total | | 11 | | 6,427 | | | 114 | | 18,931 | | | 242 | | 8,624 | | | 367 | | 33,982 | |
Our headquarters are located in Seattle, Washington, where our offices consist of both leased and owned space. On March 2, 2023, Nordstrom Canada commenced a wind-down of its business operations (see Note 2: Canada Wind-down in Item 8 for more information).
As of March 11, 2022,19, 2024, we have no announced 22 Nordstrom Rack store openings in 2022.2024, four Nordstrom Rack store openings in 2025 and one fulfillment center closure in 2024.
20Nordstrom, Inc. and subsidiaries23
Item 3. Legal Proceedings.
We are subject from time to time to various claims and lawsuits arising in the ordinary course of business, including lawsuits alleging violations of state and/or federal wage and hour and other employment laws, privacy and other consumer-based claims. Some of these lawsuits may include certified classes of litigants, or purport or may be determined to be class or collective actions and seek substantial damages or injunctive relief, or both, and some may remain unresolved for several years. We believe the recorded accruals in our Consolidated Financial Statements are adequate in light of the probable and estimable liabilities.
On March 2, 2023, Nordstrom Canada commenced a wind-down of its business operations pursuant to a CCAA proceeding overseen by the Ontario Superior Court of Justice. See Note 2: Canada Wind-down in Item 8 for more information.
As of the date of this report, we do not believe any other currently identified claim, proceeding or litigation, either alone or in the aggregate, will have a material impact on our results of operations, financial position or cash flows. Since these matters are subject to inherent uncertainties, our view of them may change in the future.
Item 4. Mine Safety Disclosures.
None.
PART II
Item 5. Market for Registrant’s Common Equity, Related Shareholder Matters and Issuer Purchases of Equity Securities.
(Dollar and share amounts in millions, except per share amounts and where noted otherwise)otherwise noted)
MARKET AND SHAREHOLDER INFORMATION
Our common stock, without par value, is traded on the NYSE under the symbol “JWN.” The approximate number of record holders of common stock as of March 7, 202211, 2024 was 4,604.4,435. On this date, we had 159,398,577163,258,218 shares of common stock outstanding.
Further information required under this item is included in the Security Ownership of Certain Beneficial OwnersDIVIDENDS
The following table summarizes our historical dividends declared and Management section of our Proxy Statement for our 2022 Annual Meeting of Shareholders, the section of which is incorporated by reference herein and will be filed within 120 days after the end of our fiscal year.paid per share:
DIVIDENDS | | | | | | | | |
| Fiscal year | 2023 | 2022 |
| 1st Quarter | $0.19 | | $0.19 | |
| 2nd Quarter | 0.19 | | 0.19 | |
| 3rd Quarter | 0.19 | | 0.19 | |
| 4th Quarter | 0.19 | | 0.19 | |
| Full Year | $0.76 | | $0.76 | |
On March 23, 2020, in response to uncertainty from the COVID-19 pandemic, we announced the suspension of our quarterly dividend payments beginning in the second quarter of 2020. We remain committed to this program over the long term and anticipate that we will be in a position to resume returning cash to shareholders in the first quarter of 2022 subject to the completion of certain year-end certification requirements with our bank group. Any future determination to pay cash dividends and the amount of dividends will be at the discretion of the Board of Directors and will be dependent upon our financial condition, operating results, capital requirements, contractual commitments and such other factors as the Board of Directors deems relevant (see Note 11: Shareholders’ Equity in Item 8).
The following table summarizes our historical dividends declared and paid per share:
| | | | | | | | | | | |
| Fiscal year | 2021 | | 2020 |
| 1st Quarter | $— | | | $0.37 | |
| 2nd Quarter | — | | | — | |
| 3rd Quarter | — | | | — | |
| 4th Quarter | — | | | — | |
| Full Year | $— | | | $0.37 | |
SHARE REPURCHASES
In August 2018, our Board of Directors authorized a program to repurchase up to $1,500 of our outstanding common stock, with no expiration date. As a result of uncertainties from COVID-19 impacts, weWe repurchased no shares of our common stock in 2021 and 2020during the fourth quarter of 2023 and we had $707$438 remaining in share repurchase capacity as of January 29, 2022.February 3, 2024.
See Note 11: Shareholders’ Equity in Item 8 for more information about our August 2018 and May 2022 share repurchase programs. The actual timing, price, manner and amounts of future share repurchases, if any, will be subject to the discretion of the Board of Directors, contractual commitments, market and economic conditions and applicable SEC rules.
SHARES AUTHORIZED FOR ISSUANCE UNDER EQUITY COMPENSATION PLANS
Further information required under this item is included in the Equity Compensation Plans section of our Proxy Statement for our 2022 Annual Meeting of Shareholders, the section of which is incorporated by reference herein and will be filed within 120 days after the end of our fiscal year.
Nordstrom, Inc. and subsidiaries 2125
STOCK PRICE PERFORMANCE
The following graph compares the cumulative total return of Nordstrom common stock, Standard & Poor’s Retail Index (“S&P Retail”), Standard & Poor’s 500 Index (“S&P 500”) and Nordstrom’s peer group for each of the last five fiscal years ended January 29, 2022. TheFebruary 3, 2024. S&P Retail Index is composed of 2217 retail companies representing an industry group of the S&P 500. Our peer group is consistent with the retail peer group includedthat we include in the Compensation Discussion and Analysis section of our Proxy Statement for our 20222024 Annual Meeting of Shareholders and is weighted by the market capitalization of each component. The following graph assumes an initial investment of $100 each in Nordstrom common stock, S&P Retail, S&P 500 and Nordstrom’s peer group on January 28, 2017February 2, 2019 and assumes reinvestment of dividends.
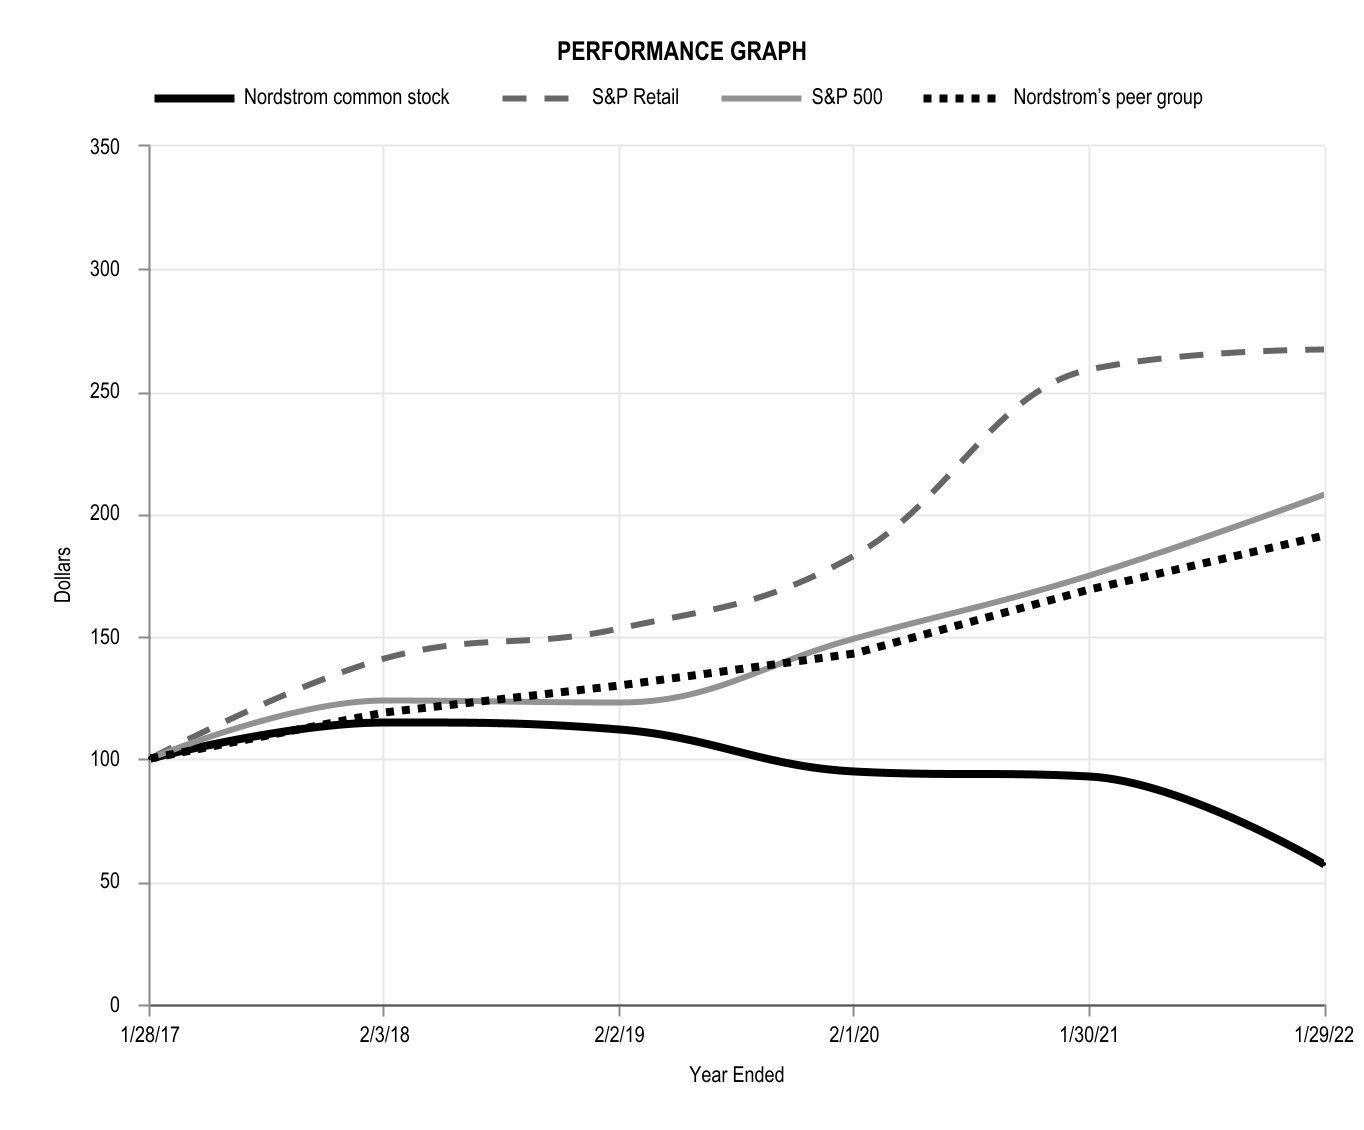
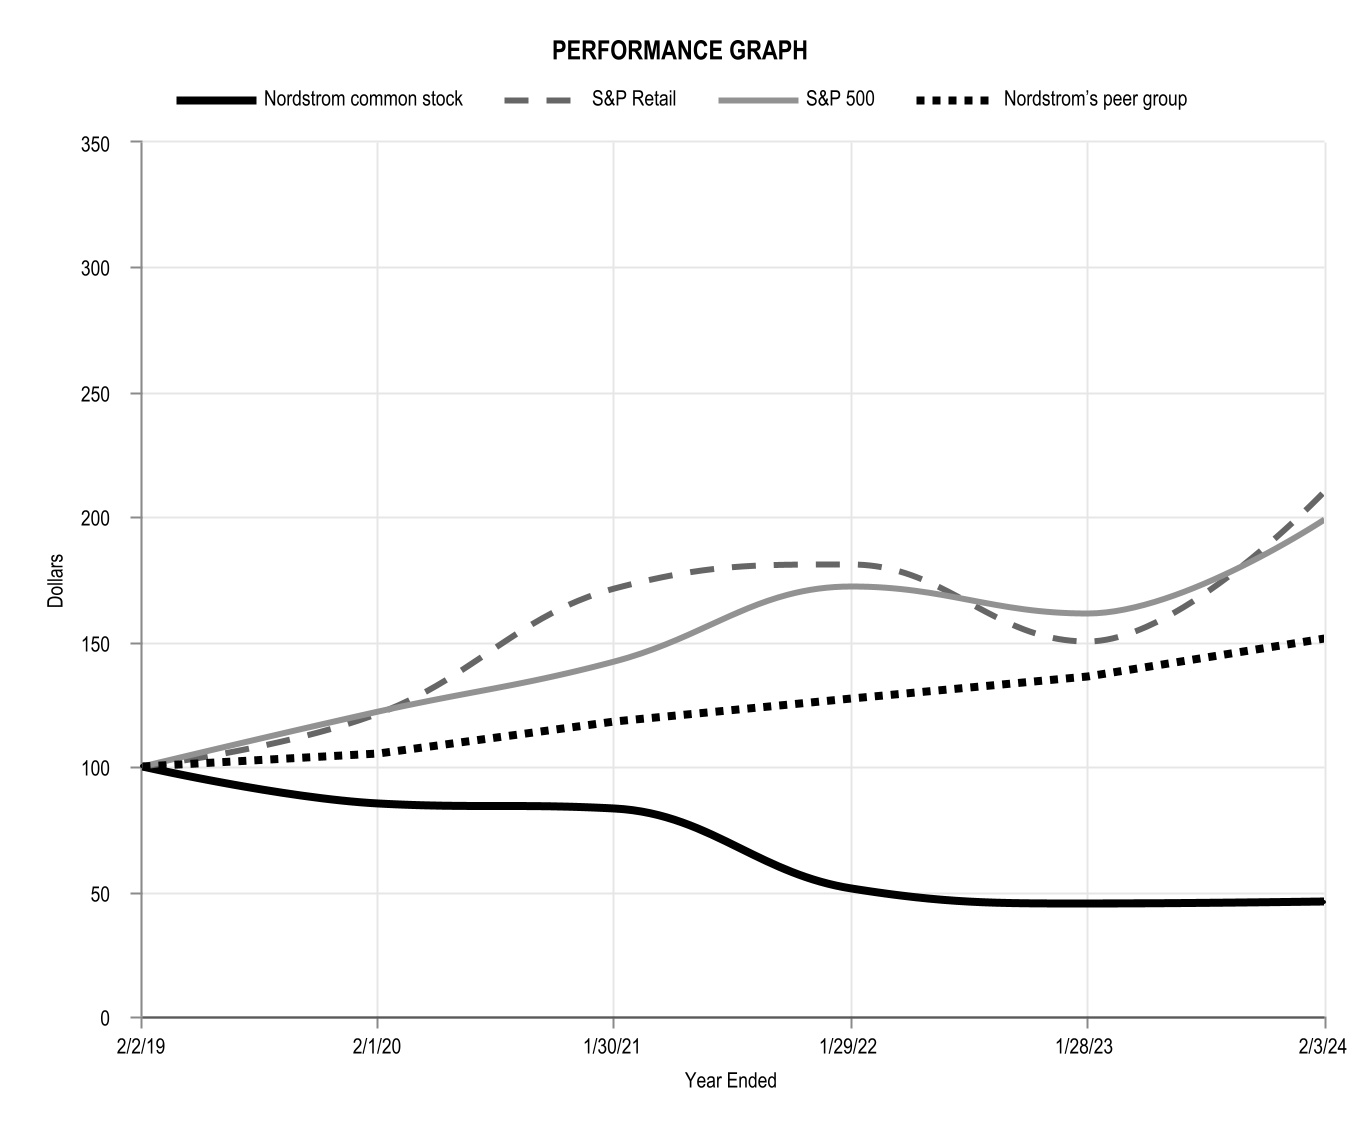
| End of fiscal year1 | End of fiscal year1 | 2016 | | 2017 | | 2018 | | 2019 | | 2020 | | 2021 | End of fiscal year1 | 2018 | | 2019 | | 2020 | | 2021 | | 2022 | | 2023 |
| Nordstrom common stock | Nordstrom common stock | $100 | | $115 | | $112 | | $95 | | $93 | | $57 | Nordstrom common stock | $100 | | $85 | | $83 | | $51 | | $45 | | $46 |
| S&P Retail | S&P Retail | $100 | | $141 | | $153 | | $183 | | $259 | | $267 | S&P Retail | $100 | | $121 | | $171 | | $181 | | $150 | | $210 |
| S&P 500 | S&P 500 | $100 | | $124 | | $123 | | $149 | | $175 | | $208 | S&P 500 | $100 | | $122 | | $142 | | $172 | | $161 | | $199 |
| Nordstrom’s peer group | Nordstrom’s peer group | $100 | | $119 | | $130 | | $143 | | $169 | | $191 | Nordstrom’s peer group | $100 | | $105 | | $118 | | $127 | | $136 | | $151 |
1Dollar amounts are in ones.
Item 6. [Reserved]
Item 7. Management’s Discussion and Analysis of Financial Condition and Results of Operations.
(Dollar and share amounts in millions, except per share amounts and where noted otherwise)otherwise noted)
The following MD&A provides a narrative of our financial performance and is intended to promote understanding of our results of operations and financial condition. MD&A is provided as a supplement to, and should be read in conjunction with, Item 8: Financial Statements and Supplementary Data and generally discusses the results of operations for fiscal year 20212023 compared with 2020.2022. For our comparison and discussion of 20202022 and 2019,2021, see Item 7: Management’s Discussion and Analysis of Financial Condition and Results of Operations in Part II of our 2022 2020 Annual Report. For our discussion of market risk information for 2022, see Item 7A: Quantitative and Qualitative Disclosures About Market Risk in Part II of our 2022 Annual Report. The following discussion and analysis contains forward-looking statements and should also be read in conjunction with Item 1A: Risk Factors in Part I, as well as other cautionary statements and risks described elsewhere in this 20212023 Annual Report, before deciding to purchase, hold or sell shares of our common stock. | | | | | |
| Overview | |
| Results of Operations | |
| Liquidity | |
| Capital Resources | |
| Critical Accounting Estimates | |
| Recent Accounting Pronouncements | |
| |
Nordstrom, Inc. and subsidiaries 2327
OVERVIEW
We made progress this year on our strategic initiatives and met our 2021 financial targets, giving us line of sight to achieving our Investor Event targets in the near term. We continue to work with urgency to build additional capabilities to better serve customers, expand market share and deliver greater profitability.
For the year,In 2023, we reported net earnings were $178,of $134, or $1.100.9% of net sales, $0.82 per diluted share and EBIT of $251, or 1.8% of net sales. Adjusted EBIT1 was $567, or 4.0% of net sales, and Adjusted EPS1 was $2.12, which included an after-tax debt refinancing chargeexclude the impacts of $65, or $0.40 per diluted share. Whilecharges related to the wind-down of Canadian operations and a supply chain asset impairment and related charge.
Total company net sales decreased 5%5.8%, compared with 2019, we2022. This included a negative 245 basis point impact from the wind-down of Canadian operations and a positive impact of approximately $190, or 130 basis points, from the 53rd week. We saw sequential improvement in sales each quarter after taking into account an approximately 200 basis point impact due totopline trends across both banners throughout the timing shift of this year’s Anniversary Sale between the second and third quarter.year.
We endedcontinued to manage with leaner inventories and exited 2023 with overall ending inventory levels 3% lower than the year laser focusedfourth quarter of 2022 and a positive sales-to-inventory spread. This lower level of inventory required fewer markdowns and helped drive 95 basis points of expansion in our gross profit as a rate of sales, compared with 2022.
We remain committed to delivering profitable growth while improving the customer experience. Our results reflect our focus throughout 2023 on our three key areas: improvingpriorities: improve Nordstrom Rack performance, increase inventory productivity and optimize our supply chain. We will continue to build on the progress we made in 2023 as we focus our efforts on three refreshed key priorities in 2024: driving Nordstrom banner growth, optimizing operationally and building on momentum at the Rack.
Driving Nordstrom banner growth – Our first priority is to drive growth at our Nordstrom banner, with a focus on digital-led growth supported by our stores. In 2024, we plan to launch our digital marketplace on Nordstrom.com, which will allow us to grow our curated online assortment to serve more customers on even more occasions through increasing profitabilityour use of unowned inventory. Marketplace will allow our customers to shop more products and optimizingsizes from their favorite brands, while providing them more access to new and emerging brands. Expanding our assortment through unowned inventory has the potential to drive GMV growth in addition to providing compelling economics.
We will also focus on driving growth at our Nordstrom banner through increasing customer engagement and improving retention. We will do this through amplifying the brands that matter most to our customers and ensuring we have consistent depth in these brands across our stores and online, with our Beauty division playing a prominent role.
Optimizing operationally – We made significant progress on our supply chain initiatives in 2023, which drove improvements in customer experience and profitability. We delivered a better experience to our customers through faster delivery, lower cancellation rates and increased accuracy of inventory, flow.while also driving cost savings. In the fourth quarter of 2023, our team delivered the sixth consecutive quarter of 50-plus basis points of improvement in variable supply chain expense savings, while at the same time improving our click-to-delivery speed.
We plan to build upon these successes in 2024, with the end goal of enhancing the customer experience through faster delivery, and improving our cost position by maximizing our inventory value throughout its lifecycle. We are making investments in systems and technology enablers to standardize and streamline our inventory processes, expanding the scale of our RFID utilization and improving the inventory movement within our business.
•Building on momentum at Nordstrom RackFor – In 2023, we opened 19 new stores and our intent is to open 22 new stores in 2024. We believe new Rack stores are a great investment, with returns that exceed our cost of capital and have a short payback period. Expanding our network of stores also brings our omni-channel services closer to the customer, giving them more reasons and opportunities to engage with us.
Our priority for 2024 is to continue building on our momentum from 2023 and deliver topline Rack growth, led by stores and supported by enhanced digital capabilities. We aim to deliver great brands at great prices for our customers at Nordstrom Rack, and we posted a sequential sales improvementcontinue to improve by growing the most desirable brands offered, driving greater engagement and profitability at NordstromRack.com and expanding our reach and convenience with new Rack stores in key markets.
We are proud of 320 basis pointsthe efforts that we undertook in 2023, as well as the fourth quarter. Though we are in the early stages of implementation, Nordstrom Rack results and improving store customer satisfaction scores reaffirm our confidence in our plans to optimizeoutcomes that enhanced the customer experience and improve our performance.
•In terms of profitability, we delivered significant improvement in merchandise margin this quarter.
•drove improved financial results. We expect supply chain optimization workstreams we began implementing in the fourth quarter will enhanceare committed to delivering profitable growth while improving the customer experience, and drive topline growth while also driving efficiencies in labor and fulfillment in 2022.
We also continue to make progress in the key strategic growth priorities we laid out at our Investor Event last year: winning in our most important markets, broadening the reach of Nordstrom Rack and increasing our digital velocity.
Winning in our most important markets: Our market strategy links our omni-channel capabilities at the local market level, allowing us to drive customer engagement through better service and greater access to product no matter how customers choose to shop. This platform is a unique differentiator, delivering unmatched convenience and enabling us to provide customers with four times more product available for next-day pickup, a one-day reduction in average shipping time and the ability to pick up orders at the Nordstrom, Nordstrom Local or Nordstrom Rack location of their choice.
We continue to scale the enhanced options we launched in 2020, like the expansion of order pickup and ship-to-store to all Nordstrom Rack stores, with order pickup reaching a record high 11% of Nordstrom.com sales in the fourth quarter. One-third of fourth quarter next-day Nordstrom.com demand was picked up at Nordstrom Rack stores, demonstrating the power of integrating capabilities across our two brands and across our digital and physical platforms. Increasing “Buy Online Pick Up In Store” utilization is advantageous as it is both our highest satisfaction customer experience and most profitable customer journey.
We also continue to evolve our approach to get closer to our customers than ever before, building deeper connections through our loyalty program and differentiated service model. Our Nordy Club loyalty program is a powerful engagement driver, with 67% sales penetration in 2021. Our core customers remain highly engaged with loyalty customer counts exceeding 2019 levels.
We are advancing our digital tools, including virtual styleboards and style links, to allow our salespeople to offer our customers highly relevant recommendations, both in store and digitally. In 2021, remote selling sales volume increased 63% versus last year. We are encouraged by the results of this program with very high customer satisfaction scores and average customer spend over six times that of an average Nordstrom customer.
Broadening the reach of Nordstrom Rack: Nordstrom Rack has a unique mix of premium brands with limited distribution in the off-price sector. Customers are drawn to Nordstrom Rack to purchase sought after brands at a terrific price. While many retailers are dealing with macro-related supply chain disruptions, Nordstrom Rack faces a heightened challenge as off-price procurement of the same top brands we carry at Nordstrom is particularly difficult in the current environment with lower levels of clearance product. As a result, we are executing a multi-layered plan to both expand our offerings of the most coveted brands we carry, as well as source from new vendors to ensure we have the selection our customers want.
As we improve our supply of premium brands and fine tune our assortment to better align with customer needs, we expect 2024 to achievebe a better balanceyear of price points at Nordstrom Rack. Through this setcontinued momentum toward the long-term strength and durability of actions, as well as strengthening Nordstrom Rack brand awareness and driving traffic, we seek to drive continued improvement in Nordstrom Rack performance throughout 2022.our business.
Increasing our digital velocity:1 We maintained strong growth at Nordstrom.comAdjusted EBIT and NordstromRack.com in 2021, with digital sales increasing 24% compared with 2019. With continued growth in digital, our total penetration has increased by 10 percentage points over the past two years to 42%. In the fourth quarter, we also saw record high mobile app usage, with mobile users representing approximately 70% of total digital traffic.Adjusted EPS are non-GAAP financial measures. For a reconciliation between GAAP and non-GAAP financial measures, see Adjusted EBIT, Adjusted EBITDA, Adjusted EBIT margin and Adjusted EPS (Non-GAAP financial measures) below.
Though we still have work to do on our transformation, the progress we have made gives us confidence in our strategic plans and business outlook for 2022. We believe there is a meaningful opportunity ahead for us to better serve customers by improving Nordstrom Rack performance and transforming our supply chain, leading to increased profitability and shareholder value creation. We have line of sight to achieving the financial targets outlined at our 2021 Investor Event while building the capabilities to profitably grow market share beyond that.
RESULTS OF OPERATIONS
In our ongoing effort to enhance the customer experience, we are focused on providing a seamless retail experience across our Company. We invested early in integrating our operations, merchandising and technology across our stores and online and in both our Nordstrom and Nordstrom Rack banners. By connecting our digital and physical assets across Nordstrom and Nordstrom Rack, we are able to better serve customers when, where and how they want to shop. We have one Retail reportable segment and analyze our results on a total Company basis, using customer, market share, operational and net sales metrics.
DueWe operate on a 52/53-week fiscal year ending on the Saturday closest to January 31st. References to 2023 relate to the extraordinary impact of COVID-19 on our results in53-week fiscal year 2020, we analyzedending February 3, 2024. References to any other years included within this document are based on a 52-week fiscal year 2021 net sales through EBIT against fiscal years 2020 and 2019 to provide useful supplemental comparability.year.
We monitor a number of key operating metrics to evaluate our Company performance. In addition to net sales, net income (loss)earnings and other results under GAAP, two other key operating metrics we use are GMV and inventory turnover rate. Beginning in the first quarter of 2023, we made changes to how we calculate these metrics to more closely align with how our business is operated. Changes in the methodologies are discussed below and prior periods have been adjusted to reflect a comparable presentation.
•GMV: Our GMV representscalculated as the total dollar value of itemsmerchandise sold through our digital platforms and stores. GMV includes net merchandise sales from inventory we own, as well as the retail value of merchandise sold under our alternative partnershipunowned inventory models with our vendors. We use GMV as an indicator of the scale and growth of our operations and the impact of our alternative partnershipunowned inventory models. Prior to the first quarter of 2023, we also included non-merchandise sales in our GMV calculation.
•Inventory Turnover Rate: calculated as the trailing 4-quarter merchandise cost of sales divided by the trailing 13-month average inventory. Inventory turnover rate is an indicator of our success in optimizing inventory volumes in accordance with customer demand. Prior to the first quarter of 2023, we calculated inventory turnover rate as the trailing 4-quarter cost of sales and related buying and occupancy costs divided by the trailing 4-quarter average inventory. Inventory turnover rate is an indicator of our success in optimizing inventory volumes in accordance with customer demand.
Net Sales
The following table summarizes net sales: | | | | | | | | | | | |
| Fiscal year | 2021 | | | 2020 | |
| Nordstrom | $9,640 | | | $6,997 | |
| Nordstrom Rack | 4,762 | | | 3,360 | |
| Total net sales | $14,402 | | | $10,357 | |
| | | |
| Net sales increase (decrease): | | | |
| Nordstrom | 37.8 | % | | (29.6 | %) |
| Nordstrom Rack | 41.7 | % | | (35.3�� | %) |
| Total Company | 39.1 | % | | (31.6 | %) |
| | | |
| Digital sales as a % of net sales | 42 | % | | 55 | % |
| Digital sales increase | 7 | % | | 16 | % |
Net Sales (2021 vs. 2020) | | | | | | | | |
| Fiscal year | 2023 | | 2022 | |
| Net sales: | | |
| Nordstrom | $9,436 | | $10,279 | |
| Nordstrom Rack | 4,783 | | 4,813 | |
| Total net sales | $14,219 | | $15,092 | |
| | |
| Net sales (decrease) increase: | | |
| Nordstrom | (8.2 | %) | 6.6 | % |
| Nordstrom Rack | (0.6 | %) | 1.1 | % |
| Total Company | (5.8 | %) | 4.8 | % |
| | |
| Digital sales: | | |
| Digital sales as a % of total net sales | 36 | % | 38 | % |
| Digital sales decrease | (10 | %) | (6 | %) |
| | |
| GMV (decrease) increase: | | |
| Nordstrom | (8.5 | %) | 6.5 | % |
| Total Company | (6.1 | %) | 4.6 | % |
Total Company net sales increasedand GMV decreased for the full fiscal year compared with 2020. This increase primarily resulted from the impacts2022. The wind-down of COVID-19 and the related temporary store closures for approximately three months during 2020. During the year, we opened one and closed three Nordstrom Rack stores. The top-performing merchandise categories were Men’s Apparel, Designer and Activeour Canadian operations as of March 2, 2023 had a negative impact on net sales of 245 basis points compared with 2020. Total Company GMV increased 40%2022 (see Note 2: Canada Wind-down in Item 8). This was partially offset by an approximately 130 basis point positive impact and approximately $190 in additional net sales related to the 53rd week. For the full fiscal year, active and beauty were the strongest categories compared with 2020. Total Company net sales in the Southern markets, including Southern California, outperformed the Northern markets compared with 2020. Digital sales, Nordstrom net sales and Nordstrom Rack net sales increased compared with 2020.2022.
Nordstrom, Inc. and subsidiaries 2529
Net Sales (2021 vs. 2019)
Total Company net sales decreased 4.8% compared with 2019. The decrease is primarily from the first half of 2021 as we saw sequential quarterly improvement during the year as we recovered from the impacts of COVID-19. The top-performing merchandise categories were Home, Active and Designer compared with 2019. Total Company GMV decreased 4% compared with 2019. Total Company net sales in the Southern markets, including Southern California, outperformed the Northern markets, and suburban locations outperformed our urban locations compared with 2019. Digital sales increased 24%, Nordstrom net sales and GMV decreased 3.0% and compared with 2022, which reflected a decrease in the number of items sold, partially offset by an increase in the average selling price per item sold. The wind-down of Canadian operations had a negative impact on Nordstrom banner net sales of 360 basis points, partially offset by a 120 basis point positive impact from the 53rd week, compared with 2022.
Nordstrom Rack net sales decreased 8.2% compared with 2019.2022, which reflected a decrease in the number of items sold, partially offset by an increase in the average selling price per item sold. Eliminating store fulfillment for Nordstrom Rack digital orders during the third quarter of 2022 negatively impacted Nordstrom Rack sales by approximately 300 basis points for the full fiscal year compared with 2022. This was partially offset by an approximately 150 basis point positive impact related to the 53rd week.
Digital sales decreased compared with 2022. Eliminating store fulfillment for Nordstrom Rack digital orders during the third quarter of 2022 and sunsetting Trunk Club in the second quarter of 2022 negatively impacted digital sales by approximately 350 basis points for the full fiscal year compared with 2022.
During the year, we opened 19 Nordstrom Rack stores and relocated one Nordstrom Rack store. We closed one Nordstrom store, one Nordstrom Local service hub, one ASOS | Nordstrom store and two Nordstrom Rack stores. In addition, we deconsolidated six Nordstrom and seven Nordstrom Rack stores in Canada as of March 2, 2023 (see Note 2: Canada Wind-down in Item 8).
See Note 2:3: Revenue in Item 8 for information about disaggregated revenues.
Credit Card Revenues, Net
Credit card revenues, net include our portion of the ongoing credit card revenue, net of credit losses, pursuant to our program agreement with TD. TD is the exclusive issuer of our consumer credit cards and we perform the account servicing functions.
Credit Card Revenues, Net (2021 vs. 2020)
Credit card revenues, net increased $29$36 compared with 2020, primarily as a result of higher interchange fees2022, due to increased spend onfinance charges from higher rates and outstanding balances, and revenue recognized in connection with our 2022 TD program agreement amendment. The increase was partially offset by increased credit cardslosses.
2024 Total Revenue Outlook
In fiscal 2024, we expect a total revenue range, including retail sales and lower losses from bad debt.
Credit Card Revenues, Net (2021 vs. 2019)
Creditcredit card revenues, net decreased $5of 2% decline to 1% growth compared with 2019, primarily as a result of lower finance charges due to lower outstanding balances.the 53-week fiscal 2023, which includes an approximately 135 basis point unfavorable impact from the 53rd week.
Gross Profit
The following table summarizes gross profit: | | | | | | | | | | | | | | | | | |
| Fiscal year | 2021 | | | 2020 | | | 2019 | |
| Gross profit | $5,058 | | | $2,757 | | | $5,200 | |
| Gross profit as a % of net sales | 35.1 | % | | 26.6 | % | | 34.4 | % |
| Inventory turnover rate | 4.18 | | | 4.42 | | | 4.79 | |
Gross Profit (2021 vs. 2020) | | | | | | | | | |
| Fiscal year | 2023 | | 2022 | | |
| Gross profit | $4,916 | | $5,073 | | |
| Gross profit as a % of net sales | 34.6 | % | 33.6 | % | |
| Inventory turnover rate | 3.58 | | 3.45 | | |
Gross profit decreased $157, compared with 2022, primarily due to lower sales, partially offset by lower markdowns and lower buying and occupancy costs. Gross profit increased $2,301 and 8 percentage95 basis points as a rate of net sales, compared with 2020, primarily2022, due to reducedlower markdowns and increased leverage onlower buying and occupancy costs.costs, partially offset by deleverage on lower sales.
Ending inventory as of February 3, 2024 decreased 3%, compared with January 29, 2022 increased 23%28, 2023, versus a 23%2% increase in sales in the fourth quarter of 20212023, compared with 2020.2022. The changedecrease in inventory levels compared with 2020 was due to planned investments to support improved in-stock levels, as well as decreased2022 is a result of continued strong inventory levels in 2020 that aligned with lower sales from the impactsdiscipline.
Gross Profit (2021 vs. 2019)
Gross profit decreased $142 compared with 2019, due to lower sales volume, partially offset by reduced markdowns. Gross profit rate increased 75 basis points for the same period, primarily due to reduced markdowns, partially offset by deleverage on lower sales volume.Contents
Ending inventory as of January 29, 2022 increased 19%, compared with February 1, 2020, versus a
1% decrease in sales in the fourth quarter of 2021 compared with 2019. Approximately half of the inventory increase compared with 2019 was due to planned investments to support improved in-stock levels.
Selling, General and Administrative Expenses
SG&A is summarized in the following table: | | Fiscal year | Fiscal year | 2021 | | | 2020 | | | 2019 | |
| Fiscal year | |
| Fiscal year | |
| SG&A expenses | |
| SG&A expenses | |
| SG&A expenses | SG&A expenses | $4,953 | | | $4,162 | | | $4,808 | |
| SG&A expenses as a % of net sales | SG&A expenses as a % of net sales | 34.4 | % | | 40.2 | % | | 31.8 | % |
| SG&A expenses as a % of net sales | |
| SG&A expenses as a % of net sales | |
SG&A (2021 vs. 2020)
SG&A increased $791decreased $191 in 20212023, compared with 20202022, primarily due to higherlower variable expenses associated with highercosts, driven by lower sales volume and labor cost pressure,supply chain efficiency initiatives, partially offset by the impacthigher labor costs and a $32 supply chain asset impairment and related charge. In 2022, SG&A included a supply chain technology and related asset impairment charge of COVID-19 related charges that occurred$70 and a $51 gain on sale of our interest in the first half of 2020. SG&A rate decreased 6 percentage points primarily as a result of leverage on higher sales volume and COVID-19 related charges that occurred in the first half of 2020.
SG&A (2021 vs. 2019)
corporate office building. SG&A increased $145 and 3 percentage70 basis points as a rate of net sales during 2021, compared with 2019,2022, primarily due to fulfillmentdeleverage on lower sales and higher labor cost pressures,costs, partially offset by supply chain efficiencies.
Canada Wind-down Costs
We recognized charges associated with the continued benefits from resettingwind-down of Nordstrom Canada of $284 in the cost structureyear ended February 3, 2024 (see Note 2: Canada Wind-down in 2020.Item 8).
Earnings (Loss) Before Interest and Income Taxes
EBIT is summarized in the following table: | | Fiscal year | Fiscal year | 2021 | | | 2020 | | | 2019 | |
| Fiscal year | |
| Fiscal year | |
| EBIT | |
| EBIT | |
| EBIT | EBIT | $492 | | | ($1,047) | | | $784 | |
| EBIT as a % of net sales | EBIT as a % of net sales | 3.4 | % | | (10.1 | %) | | 5.2 | % |
| EBIT as a % of net sales | |
| EBIT as a % of net sales | |
EBIT (2021 vs. 2020)
EBIT increased $1,539decreased $214 and 14 percentage130 basis points as a rate of net sales in 2021,2023, compared with 2020, as a result of reduced markdowns, higher sales volume and the impact of COVID-19 related charges in the first half of 2020.
EBIT (2021 vs. 2019)
EBIT decreased $292 and 2 percentage points as a rate of net sales in 2021, compared with 2019,2022, primarily due to $284 of expenses associated with the wind-down of Canadian operations, a $32 supply chain asset impairment and related charge and lower sales, volume and fulfillment and labor cost pressures, partially offset by an improved gross profit rate and supply chain efficiency initiatives. In 2022, EBIT included a supply chain technology and related asset impairment charge of $70, a $51 gain on sale of our interest in a corporate office building, and an $18 impairment charge related to costs associated with the continued benefits from resetting the cost structure in 2020.wind-down of Trunk Club.
Interest Expense, Net
Interest expense, net is summarized in the following table: | | Fiscal year | Fiscal year | 2021 | | 2020 | | |
| Fiscal year | |
| Fiscal year | |
| Interest on long-term debt and short-term borrowings | Interest on long-term debt and short-term borrowings | $258 | | | $199 | | |
| Less: | | |
| Interest on long-term debt and short-term borrowings | |
| Interest on long-term debt and short-term borrowings | |
| | Interest income | |
| | Interest income | |
| | Interest income | Interest income | (1) | | | (3) | | |
| Capitalized interest | Capitalized interest | (11) | | | (15) | | |
| Capitalized interest | |
| Capitalized interest | |
| Interest expense, net | Interest expense, net | $246 | | | $181 | | |
| Interest expense, net | |
| Interest expense, net | |
Interest expense, net decreased $24 in increased $65 in 20212023 compared with 2020 2022, primarily due to debt refinance charges of $88, partially offset by decreasedan increase in interest related to the redemption of the Secured Notes in the first quarter of 2021.income from higher prevailing rates.
Income Tax Expense
Income tax expense is summarized in the following table: | | | | | | | | | | | | | |
| Fiscal year | 2021 | | 2020 | | |
| Income tax expense (benefit) | $68 | | | ($538) | | | |
| Effective tax rate | 27.5 | % | | 43.8 | % | | |
Nordstrom, Inc. and subsidiaries 2731
Income Tax Expense
Income tax expense is summarized in the following table: | | | | | | | | | | |
| Fiscal year | 2023 | 2022 | | |
| Income tax expense | $13 | | $92 | | | |
| Effective tax rate | 8.6 | % | 27.2 | % | | |
The following table illustrates the components of our effective tax rate: | | | | | | | | | | | |
| Fiscal year | 2021 | | 2020 |
| Statutory rate | 21.0 | % | | 21.0 | % |
| CARES Act impact | (0.9 | %) | | 17.6 | % |
| State and local income taxes, net of federal income taxes | 3.4 | % | | 6.1 | % |
| Federal credits | (4.0 | %) | | 0.5 | % |
Non-deductible expenses1 | 2.7 | % | | (0.3 | %) |
Stock-based compensation1 | 2.0 | % | | (1.0 | %) |
Valuation allowance1 | 1.8 | % | | (0.8 | %) |
Taxes on foreign operations1 | 1.3 | % | | 0.4 | % |
Other, net1 | 0.2 | % | | 0.3 | % |
| Effective tax rate | 27.5 | % | | 43.8 | % |
1 We reclassified immaterial prior year amounts that were included in the other, net category to conform with current period presentation. | | | | | | | | |
| Fiscal year | 2023 | 2022 |
| Statutory rate | 21.0 | % | 21.0 | % |
| State and local income taxes, net of federal income taxes | 4.0 | % | 5.9 | % |
| Federal credits | (4.7 | %) | (3.8 | %) |
| Non-deductible expenses | 2.9 | % | 1.2 | % |
| Stock-based compensation | 5.1 | % | 1.8 | % |
| Valuation allowance | 6.6 | % | 0.4 | % |
| Taxes on foreign operations | 1.5 | % | 1.6 | % |
| Excess tax over book loss on Canada wind-down | (18.2 | %) | — | |
| Resolution of prior period tax matters | (11.2 | %) | — | |
| Other, net | 1.6 | % | (0.9 | %) |
| Effective tax rate | 8.6 | % | 27.2 | % |
The decrease in the effective tax rate for 20212023, compared with 20202022, was primarily due to additional tax benefits related to the CARES Act that allowed uswind-down of Canadian operations and the favorable resolution of certain tax matters, partially offset by increases from additional tax expense for stock-based compensation and valuation allowance increases for Canadian deferred tax assets prior to carry back 2020 losses at the higher tax rate applicable in previous years.deconsolidation.
Earnings (Loss) Per Share
EPS is as follows: | | Fiscal year | Fiscal year | 2021 | | | 2020 | | |
| Fiscal year | |
| Fiscal year | |
| Basic | |
| Basic | |
| Basic | Basic | $1.12 | | | ($4.39) | | |
| Diluted | Diluted | $1.10 | | | ($4.39) | | |
| Diluted | |
| Diluted | |
Earnings (loss) per diluted share increased $5.49Diluted EPS decreased $0.69 in 20212023 compared with 2020, during which stores were temporarily closed for approximately three months of 2020. This increase was2022, primarily due to reduced markdownsa net unfavorable impact of $1.30 per diluted share related to the wind-down of Canadian operations and highera supply chain asset impairment and related charge in 2023 and lower sales, volumes, partially offset by higher taxesan improved gross profit rate and $0.40supply chain efficiency initiatives.
Adjusted EBIT, Adjusted EBITDA, Adjusted EBIT Margin and Adjusted EPS (Non-GAAP financial measures)
The following are key financial metrics and, when used in conjunction with GAAP measures, we believe they provide useful information for evaluating our core business performance, enable comparison of financial results across periods and allow for greater transparency with respect to key metrics used by management for financial and operational decision-making. Adjusted EBIT, Adjusted EBITDA, Adjusted EBIT margin and Adjusted EPS exclude certain items that we do not consider representative of our core operating performance. The financial measure calculated under GAAP which is most directly comparable to Adjusted EBIT and Adjusted EBITDA is net earnings. The financial measure calculated under GAAP which is most directly comparable to Adjusted EBIT margin is net earnings as a percent of net sales. The financial measure calculated under GAAP which is most directly comparable to Adjusted EPS is diluted EPS.
Adjusted EBIT, Adjusted EBITDA, Adjusted EBIT margin and Adjusted EPS are not measures of financial performance under GAAP and should be considered in addition to, and not as a substitute for, net earnings, net earnings as a percent of net sales, operating cash flows, earnings per share, earnings per diluted share for an interest expense charge relatedor other financial measures performed in accordance with GAAP. Our method of determining non-GAAP financial measures may differ from other companies’ financial measures and therefore may not be comparable to the redemptionmethods used by other companies.
The following is a reconciliation of the Secured Notes in the first quarternet earnings to Adjusted EBIT and Adjusted EBITDA and net earnings as a percent of 2021. In 2020, we incurred COVID-19 related charges, which reduced EPS for 2020 by $1.22 per share.net sales to Adjusted EBIT margin:
| | | | | | | | |
| Fiscal year | 2023 | 2022 |
| Net earnings | $134 | | $245 | |
| Income tax expense | 13 | | 92 | |
| Interest expense, net | 104 | | 128 | |
| Earnings before interest and income taxes | 251 | | 465 | |
| Supply chain asset impairment and related charges | 32 | | 70 | |
| Canada wind-down costs | 284 | | — | |
| Trunk Club wind-down costs | — | | 18 | |
| Gain on sale of interest in a corporate office building | — | | (51) | |
| Adjusted EBIT | 567 | | 502 | |
| Depreciation and amortization expenses | 586 | | 604 | |
| Amortization of developer reimbursements | (69) | | (72) | |
| Adjusted EBITDA | $1,084 | | $1,034 | |
| | |
| Net sales | $14,219 | $15,092 |
| Net earnings as a % of net sales | 0.9 | % | 1.6 | % |
| EBIT margin % | 1.8 | % | 3.1 | % |
| Adjusted EBIT margin % | 4.0 | % | 3.3 | % |
2022 OutlookThe following is a reconciliation of diluted EPS to Adjusted EPS:
We have provided the following financial outlook for fiscal 2022: | | | | | | | | |
| Fiscal year | 2023 | 2022 |
| Diluted EPS | $0.82 | | $1.51 | |
| Supply chain asset impairment and related charges | 0.19 | | 0.44 | |
| Canada wind-down costs | 1.74 | | — | |
| Trunk Club wind-down costs | — | | 0.11 | |
| Gain on sale of interest in a corporate office building | — | | (0.31) | |
Income tax impact on adjustments1 | (0.63) | | (0.06) | |
| Adjusted EPS | $2.12 | | $1.69 | |
| | |
| | |
| | |
•1 Revenue growth, including retail sales and credit card revenues,The income tax impact of 5% to 7% versus fiscal 2021
•EBIT margin of 5.6% to 6.0% of sales
•Incomenon-GAAP adjustments is calculated using the estimated tax rate of approximately 27%
•Earnings per share of $3.15 to $3.50, excludingfor the impact of share repurchase activity, if any
•Leverage ratio of approximately 2.5 times by year-endrespective non-GAAP adjustment.
28Nordstrom, Inc. and subsidiaries33
Adjusted ROIC (Non-GAAP financial measure)
We believe that Adjusted ROIC is a useful financial measure for investors in evaluating the efficiency and effectiveness of the capital we have invested in our business to generate returns over time. In addition, we have incorporated it in our executive incentive measures and we believe it is an important indicator of shareholders’ return over the long term.
Beginning in the second quarter of 2023, the Adjusted ROIC calculation was updated to exclude certain items that we do not consider representative of our core operating performance. Refer to non-operating related adjustments included within adjusted net operating profit after tax and adjusted average invested capital. Prior periods have been modified to conform with current period presentation.
Adjusted ROIC is not a measure of financial performance under GAAP and should be considered in addition to, and not as a substitute for, return on assets, net earnings, total assets or other GAAP financial measures. Our method of calculating a non-GAAP financial measure may differ from other companies’ methods and therefore may not be comparable to those used by other companies. The financial measure calculated under GAAP which is most directly comparable to Adjusted ROIC is return on assets. The following is a reconciliation ofshows the components to reconcile the return on assets calculation to Adjusted ROIC:
| | | | | | | | | | | | | |
| Fiscal year | 2021 | | 2020 | | |
| Net earnings (loss) | $178 | | | ($690) | | | |
| Add (Less): income tax expense (benefit) | 68 | | | (538) | | | |
| Add: interest expense | 247 | | | 184 | | | |
| Earnings (loss) before interest and income tax expense | 493 | | | (1,044) | | | |
| | | | | |
Add: operating lease interest1 | 87 | | | 95 | | | |
| | | | | |
| | | | | |
| Adjusted net operating profit (loss) | 580 | | | (949) | | | |
| | | | | |
(Less) Add: estimated income tax (expense) benefit2 | (159) | | | 416 | | | |
| Adjusted net operating profit (loss) after tax | $421 | | | ($533) | | | |
| | | | | |
| Average total assets | $9,301 | | | $9,718 | | | |
| | | | | |
| | | | | |
Less: average deferred property incentives in excess of ROU assets3 | (232) | | | (276) | | | |
| Less: average non-interest bearing current liabilities | (3,352) | | | (3,138) | | | |
| Average invested capital | $5,717 | | | $6,304 | | | |
| | | | | |
Return on assets4 | 1.9 | % | | (7.1 | %) | | |
Adjusted ROIC4 | 7.4 | % | | (8.5 | %) | | |
| | | | | |
| | | | | | | | |
| Fiscal year | 2023 | 2022 |
| Net earnings | $134 | | $245 | |
| Income tax expense | 13 | | 92 | |
| Interest expense | 137 | | 138 | |
| Earnings before interest and income tax expense | 284 | | 475 | |
| | |
Operating lease interest1 | 86 | | 85 | |
| | |
| | |
Non-operating related adjustments2 | 316 | | 38 | |
| Adjusted net operating profit | 686 | | 598 | |
Adjusted estimated income tax expense3 | (172) | | (162) | |
| Adjusted net operating profit after tax | $514 | | $436 | |
| | |
| Average total assets | $8,766 | | $9,069 | |
Average noncurrent deferred property incentives in excess of ROU assets4 | (157) | | (197) | |
| Average non-interest bearing current liabilities | (2,954) | | (3,185) | |
Non-operating related adjustments5 | 394 | | — | |
| Adjusted average invested capital | $6,049 | | $5,687 | |
| | |
| Return on assets | 1.5 | % | 2.7 | % |
| Adjusted ROIC | 8.5 | % | 7.7 | % |
1 We add back the operating lease interest to reflect how we manage our business. Operating lease interest is a component of operating lease cost recorded in occupancy costs. We add back operating lease interest for purposes of calculating adjusted net operating profit for consistency with the treatment of interest expense on our debt.
2 EstimatedSee the Adjusted EBIT and Adjusted EBITDA section, as well as our 2022 Annual Report, for detailed information on certain non-operating related adjustments.
3 Adjusted estimated income tax (expense) benefitexpense is calculated by multiplying the adjusted net operating profit (loss) by the adjusted effective tax rate (which removes the impact of non-operating related adjustments) for the trailing twelve monthtwelve-month periods ended January 29, 2022February 3, 2024 and January 30, 2021.28, 2023. The adjusted effective tax rate is calculated by dividing adjusted income tax expense (benefit) by adjusted earnings (loss) before income taxes for the same trailing twelve monthtwelve-month periods.
34 For leases with property incentives that exceed the ROU assets, we reclassify the amount from assets to other current liabilities and other liabilities on the Consolidated Balance Sheets. The current and noncurrent amounts are used to reduce average total assets above, as this better reflects how we manage our business.
45 COVID-19Non-operating related chargesadjustments primarily relate to the wind-down of our Canadian operations for the four quarterstrailing twelve-month period ended January 30, 2021 negatively impacted return on assets by approximately 200 basis points and Adjusted ROIC by approximately 280 basis points.February 3, 2024.
Nordstrom, Inc. and subsidiaries2934
LIQUIDITY
We strive to maintain a level of liquidity sufficient to allow us to cover our seasonal cash needs and to maintain appropriate levels of short-term borrowings. In the short term, our ongoing working capital and capital expenditure requirements, and any dividend payments or share repurchases, are generally funded primarily through cash flows generated from operations. In addition, we have access to the commercial paper market and can draw on our revolving credit facilitiesRevolver for working capital, capital expenditures and general corporate purposes. Over the long term, we manage our cash and capital structure to maximize shareholder return, maintain our financial position, manage refinancing risk and allow flexibility for strategic initiatives. We regularly assess our debt and leverage levels, capital expenditure requirements, debt service payments, dividend payouts, potential share repurchases and other future investments.
We ended fiscal year 20212023 with $322$628 in cash and cash equivalents and $800$770 of additional liquidity available on our Revolver. The decrease in cashCash and cash equivalents as of February 3, 2024 decreased from $687 in 2021 compared with 2020 reflects2022, driven by payments for capital expenditures, Canadian guarantee settlements (see Note 2: Canada Wind-down in Item 8) and dividends, partially offset by cash flows from earnings.
As of February 3, 2024, we had $250 in current maturities of long-term debt due April 2024 (see Note 6: Debt and higher merchandise purchases.Credit Facilities in Item 8). We intend to retire this outstanding debt during the first quarter of 2024 using cash on hand. We believe that our operating cash flows from operations are sufficient to meet our cash requirements for the next 12 months and beyond. Our cash requirements are subject to change as business conditions warrant and opportunities arise and we may elect to raise additional funds in the future through the issuance of either debt or equity.
The following is a summary of our cash flows by activity: | | Fiscal year | Fiscal year | 2021 | | 2020 | |
| Net cash provided by (used in) operating activities | $705 | | | ($348) | | |
| Fiscal year | |
| Fiscal year | |
| Net cash provided by operating activities | |
| Net cash provided by operating activities | |
| Net cash provided by operating activities | |
| Net cash used in investing activities | Net cash used in investing activities | (521) | | | (347) | | |
| Net cash (used in) provided by financing activities | (544) | | | 530 | | |
| Net cash used in investing activities | |
| Net cash used in investing activities | |
| Net cash used in financing activities | |
| Net cash used in financing activities | |
| Net cash used in financing activities | |
Operating Activities
The majority of our operating cash inflows are derived from sales. We also receive cash payments for property incentives from developers and vendors. Our operating cash outflows generally consist of payments to our merchandise vendors (net of vendor allowances) and shipping carriers, payments to our employees for wages, salaries and other employee benefits and payments to our landlords for rent. Operating cash outflows also include payments for income taxes and interest payments on our short-term and long-term borrowings.
Cash fromNet cash provided by operating activities increased $1,053 between 2021 decreased $325 between 2023 and 2020 primarily2022 primarily due to an improvementchanges in net earningsworking capital driven by the amended TD program agreement in 2022, timing of purchases and receipt of the income tax refund related to the loss carryback provision of the CARES Act, partially offset by an increasepayments for inventory and Canadian guarantee settlements (see Note 2: Canada Wind-down in inventory purchased.Item 8).
Investing Activities
Our investing cash outflows include payments for capital expenditures, including technology, stores and supply chain improvements and technology costs.improvements. Our investing cash inflows are generally from proceeds from sales of property and equipment. Activity also includes the purchase and sale of financial interests.interests of certain private companies and venture capital funds.
Net cash used in investing activities increased $174 between 2021$178 between 2023 and 2020 primarily2022, primarily due to increased spendcapital expenditures for technology,Nordstrom Rack new store openings, the payment of the majoritysale of our final installment related to interest in a corporate office building in 2022 and the decrease in cash and cash equivalents resulting from the deconsolidation of Canada in 2023 (see Note 1: Nature of Operations and Summary of Significant Accounting Policies and Note 2: Canada Wind-down in Item 8).
Nordstrom, NYCInc. and our investment in ASOS.com Ltd.subsidiaries35
Capital Expenditures
Our capital expenditures, net are summarized as follows: | | Fiscal year | Fiscal year | 2021 | | 2020 | Fiscal year | 2023 | 2022 |
| Capital expenditures | Capital expenditures | $506 | | | $385 | |
Less: deferred property incentives1 | (10) | | | (41) | |
Deferred property incentives1 | |
| Capital expenditures, net | Capital expenditures, net | $496 | | | $344 | |
| | | Capital expenditures, net category allocation: | Capital expenditures, net category allocation: | |
| | Capital expenditures, net category allocation: | |
| | Capital expenditures, net category allocation: | |
| Technology | Technology | 61 | % | | 64 | % |
| Technology | |
| Technology | | 59 | % | 66 | % |
| New stores, relocations, remodels and other | | New stores, relocations, remodels and other | 31 | % | 24 | % |
| Supply chain | Supply chain | 17 | % | | 23 | % | Supply chain | 10 | % | 10 | % |
| New stores, relocations, remodels and other | 22 | % | | 13 | % |
| Total | Total | 100 | % | | 100 | % | Total | 100 | % | 100 | % |
|
1 Deferred property incentives are included in our cash provided by operations in our Consolidated Statements of Cash Flows in Item 8. We operationally view the property incentives we receive from our developers and vendors as an offset to our capital expenditures.
| | Fiscal year | Fiscal year | 20221 | | 2021 | | | 2020 | | | 2019 | | | 2018 | | | 2017 | |
| Capital expenditures % of net sales | 3%-4% | | 3.5 | % | | 3.7 | % | | 6.2 | % | | 4.2 | % | | 4.8 | % |
| Capital expenditures as a % of net sales | | Capital expenditures as a % of net sales | 3%-4% | 4.0 | % | 3.1 | % | 3.5 | % | 3.7 | % | 6.2 | % |
1 Rates represent 2022Rate represents amounts forecasted amounts.
Capital expenditures as a percentage of net sales in 2021 were in-line with2023 was on the higher end of our outlook, and decreasedincreased compared with 20202022, primarily due to a decreaseNordstrom Rack new store openings in supply chain2023 and technology spend as a percentage of net sales.investments in our stores to support continued growth. Going forward, through 2025, we expect capital expenditure requirements on average to range from 3% to 4% of net sales, and primarily support investments in technology and our Supply Chain Network. stores. Approximately $40$32 of our purchase obligation commitments relate to capital expenditures, all of which about 60% is expectedwe expect to impact our liquidity in the next year (see Note 13: Commitments and Contingencies in Item 8).
Financing Activities
The majority of our financing activities include long-term debt or Revolver proceeds and/or payments, dividend payments and repurchases of common stock.
Cash fromNet cash used in financing activities decreased $1,074 between 2021$77 between 2023 and 20202022 primarily due to paying down the Secured Notes and the 4.0% senior unsecured notes due in October 2021.
In 2020, in response to uncertainty from the COVID-19 pandemic, we announced the suspension of our quarterly dividend payments beginning in the second quarter of 2020 and the immediate suspension of our share repurchase program. We remain committed to these programs over the long term and anticipate that we will be in a position to resume returning cash to shareholders in the first quarter of 2022 subject to the completion of certain year-end certification requirements with our bank group. We intend to resumedecreased share repurchases when appropriate.in 2023 compared with 2022.
Share Repurchases
In determining the sizingsize and timing of share repurchases, we analyze a number of different factors, including our liquidity position, current market and economic conditions as well asand alternative uses of capital, including those used to offset anticipated dilution from equity incentive plans. Share repurchases are made as conditions warrant in the open market and are then retired. We repurchased norepurchased 0.03 shares of our common stock for $1 in 20212023, compared with 2.8 shares repurchased for $62 in 2022, and had $707 remaining$438 remaining in share repurchase capacity as of January 29, 2022.February 3, 2024. The actual timing, price, manner and amounts of future share repurchases, if any, will be subject to the discretion of the Board of Directors, contractual commitments, market and economic conditions and applicable SEC rules (see Note 11: Shareholders’ Equity in Item 8).
Dividends
In determining the dividends to pay, we analyze our dividend payout ratio and dividend yield, while taking into consideration our current and projected operating performance and liquidity, subject to our Revolver covenants (see Note 5:6: Debt and Credit Facilities in Item 8). In 2021,2023, we paid no dividends,dividends of $123, or $0.76 per share, compared with $58,$119, or $0.37$0.76 per share, in 20202022 (see Note 11: Shareholders’ Equity in Item 8). We expect a continuation of our 2023 dividend payment levels throughout 2024.
In February 2024, subsequent to year end, we declared a quarterly dividend of $0.19 per share, which will be paid on March 27, 2024 to shareholders of record as of March 12, 2024.
Cash Requirements
We have various commitments and other executory contracts that are disclosed in the following Notes to Consolidated Financial Statements in Item 8:
•Note 4:2: Canada Wind-down
•Note 5: Leases
•Note 5:6: Debt and Credit Facilities
•Note 7:8: Self-Insurance
•Note 8:9: Supplemental Executive Retirement Plan
•Note 12: Income Taxes
•Note 13: Commitments and Contingencies
Other commitments include $77$63 for deferred compensation and other accrued benefits, $11$9 of which is payable within one year.
Off-Balance Sheet Arrangements
In connection with our workers’ compensation programs, we have a standby lettersletter of credit issued on our behalf with $13 available and $2 outstanding as of January 29, 2022February 3, 2024 (see Note 7:8: Self-Insurance in Item 8). In addition, we issued a standby letter of credit of $30 in the fourth quarter of 2023 reducing our short-term borrowing capacity on our Revolver (see Note 6: Debt and Credit Facilities in Item 8). In management’s opinion, we have no off-balance sheet arrangements that have a material current or future effect on our financial condition or financial statements.
Nordstrom, Inc. and subsidiaries31
Free Cash Flow (Non-GAAP financial measure)
Free Cash Flow is one of our key liquidity measures and, when used in conjunction with GAAP measures, we believe it provides investors with a meaningful analysis of our ability to generate cash from our business.
Free Cash Flow is not a measure of financial performance under GAAP and should be considered in addition to, and not as a substitute for, operating cash flows or other financial measures prepared in accordance with GAAP. Our method of calculating a non-GAAP financial measure may differ from other companies’ methods and therefore may not be comparable to those used by other companies. The financial measure calculated under GAAP which is most directly comparable to Free Cash Flow is net cash provided by (used in) operating activities. The following is a reconciliation of net cash provided by (used in) operating activities to Free Cash Flow: | | | | | | | | | | | | | | | | | |
| Fiscal year | 2021 | | 2020 | | 2019 |
| Net cash provided by (used in) operating activities | $705 | | | ($348) | | | $1,236 | |
| Less: capital expenditures | (506) | | | (385) | | | (935) | |
| (Less) Add: change in cash book overdrafts | (32) | | | (4) | | | 8 | |
| Free Cash Flow | $167 | | | ($737) | | | $309 | |
| | | | | |
| | | | | |
| | | | | |
Adjusted EBITDA (Non-GAAP financial measure)
Adjusted EBITDA is one of our key financial metrics and, when used in conjunction with GAAP measures, we believe it provides investors with a meaningful analysis of our ability to generate pre-tax earnings and cash flow from our operations. Adjusted EBITDA excludes significant items which are non-operating in nature in order to evaluate our core operating performance against prior periods. The financial measure calculated under GAAP which is most directly comparable to Adjusted EBITDA is net earnings.
Adjusted EBITDA is not a measure of financial performance under GAAP and should be considered in addition to, and not as a substitute for, net earnings, overall change in cash or liquidity of the business as a whole. Our method of calculating a non-GAAP financial measure may differ from other companies’ methods and therefore may not be comparable to those used by other companies. The following is a reconciliation of net earnings (loss) to Adjusted EBITDA:
| | | | | | | | | | | | | | | | | | | | | |
| Fiscal year | 2021 | | 2020 | | 2019 | | | | |
| Net earnings (loss) | $178 | | | ($690) | | | $496 | | | | | |
| Add (Less): income tax expense (benefit) | 68 | | | (538) | | | 186 | | | | | |
| Add: interest expense, net | 246 | | | 181 | | | 102 | | | | | |
| Earnings (loss) before interest and income taxes | 492 | | | (1,047) | | | 784 | | | | | |
| | | | | | | | | |
| Add: depreciation and amortization expenses | 615 | | | 671 | | | 671 | | | | | |
| Less: amortization of developer reimbursements | (78) | | | (86) | | | (75) | | | | | |
| Add: asset impairments | — | | | 137 | | | — | | | | | |
| | | | | | | | | |
| Adjusted EBITDA | $1,029 | | | ($325) | | | $1,380 | | | | | |
| | | | | | | | | |
| Fiscal year | 2023 | 2022 | |
| Net cash provided by operating activities | $621 | | $946 | | |
| Capital expenditures | (569) | | (473) | | |
| Change in cash book overdrafts | 2 | | (14) | | |
| Free Cash Flow | $54 | | $459 | | |
| | | |
| | | |
| | | |
32Nordstrom, Inc. and subsidiaries37
CAPITAL RESOURCES
Borrowing Capacity and Activity
Our Revolver has a maximum borrowing capacity of $800, which expires in September 2023. Provided that we obtain written consent from our lenders, we have the option to increase the Revolver by up to $200, to a total of $1,000, and two options to extend the Revolver by one year. Our $800 commercial paper program has the effect of reducing available liquidity under the Revolver by an amount equal to the principal amount of commercial paper outstanding. Conversely, borrowings under our Revolver have the effect of reducing the available capacity of our commercial paper program by an amount equal to the amount outstanding. As of January 29, 2022,February 3, 2024, we had no borrowings outstanding under our Revolver that expires in May 2027 and our short-term borrowing capacity was reduced by $30 to $770 as a result of issuing a standby letter of credit in the fourth quarter of 2023. As of February 3, 2024, we had no issuances outstanding under our commercial paper program. For more information about our credit facilities, see Note 5:6: Debt and Credit Facilities in Item 8.
The following represents our principal long-term debt and Revolver activity: | | | | | | | | | | | | | | | | | | | | | | | | | | | | | |
| Long-term debt | | Revolver |
| Quarter | First | Second | Third | Fourth | | First | Second | Third | Fourth |
| 2021 | | | | | | | | | |
| Borrowings | $675 | | $— | | $— | | $— | | | $200 | | $— | | $200 | | $— | |
| Payments | (600) | | (500) | | — | | — | | | — | | (200) | | — | | (200) | |
| | | | | | | | | |
| 2020 | | | | | | | | | |
| Borrowings | 600 | | — | | — | | — | | | 800 | | — | | — | | — | |
| Payments | — | | — | | — | | — | | | — | | — | | — | | (800) | |
During 2020, we recorded debt issuance costs in other financing activities, net in the Consolidated Statement of Cash Flows (see Note 5: Debt and Credit Facilities in Item 8).
Impact of Credit Ratings and Revolver Covenants
Changes in our credit ratings may impact our costs to borrow, whether our personal property secures our Revolver and whether and to what extent we are permitted to pay dividends or repurchase shares.conduct share repurchases.
For our Revolver, the interest rate applicable to any borrowings we may enter into depends upon the type of borrowing incurred plus an applicable margin, which is determined based on our credit ratings. At the time of this report, our credit ratings and outlook were as follows: | | | | | | | | | | | |
| Credit Ratings | | Outlook |
| Moody’s | Ba1 | Negative |
| S&P Global Ratings | BB+ | Negative |
| Fitch Ratings | BB+ | Stable |
| Standard & Poor’s | BB+ | Stable |
Fitch | BBB- | | Negative |
| | | |
Should the ratings assigned to our long-term debt improve, the applicable margin associated with any borrowings under the Revolver may decrease, resulting in a lower borrowing cost under this facility. Conversely, should the ratings assigned to our long-term debt worsen, the applicable margin associated with any borrowings under the Revolver may increase, resulting in a higher borrowing cost under this facility.
As of January 29, 2022,February 3, 2024, we were in compliance with all our Revolver covenants. Under our current Revolver covenant structure, if our Leverage Ratio is greater than four or our unsecured debt is rated below BBB-We have certain limitations with a stable outlook at Standard & Poor’s or Baa3 with a stable outlook at Moody’s, any outstanding borrowingsrespect to the payment of dividends and share repurchases under our Revolver will be secured by substantially all our personal property.
As of January 29, 2022, our Leverage Ratio was less than 3.75, thusagreement. On March 1, 2023, we met the requirements underamended our Revolver amendment to pay dividends or repurchase shares.agreement. For more information about our Revolver covenants, see Note 5:6: Debt and Credit Facilities in Item 8.
Nordstrom, Inc. and subsidiaries3338
Adjusted Debt to EBITDAR (Non-GAAP financial measure)
Adjusted Debtdebt to EBITDAR is one of our key financial metrics and we believe that our debt levels are best analyzed using this measure, as it provides a reflection of our creditworthiness which could impact our credit ratingratings and borrowing costs. This metric is calculated in accordance with the updates in our Revolver covenant and is a key component in assessing whether our revolving credit facility is secured or unsecured, as well as our ability to make dividend payments and share repurchases. Our goal is to manage debt levels to achieve and maintain an investment-grade credit ratingratings while operating with an efficient capital structure. For more information regarding our Revolver, see Note 6: Debt and Credit Facilities in Item 8.
Adjusted Debtdebt to EBITDAR is not a measure of financial performance under GAAP and should be considered in addition to, and not as a substitute for, debt to net earnings, net earnings, debt or other GAAP financial measures. Our method of calculating a non-GAAP financial measure may differ from other companies’ methods and therefore may not be comparable to those used by other companies. The financial measure calculated under GAAP which is most directly comparable to Adjusted debt to EBITDAR is debt to net earnings. The following is a reconciliation ofshows the components to reconcile the debt to net earnings calculation to Adjusted Debtdebt to EBITDAR: | | | | | |
| January 29, 2022February 3, 2024 |
| Debt | $2,8532,862 | |
Add: estimated capitalized operatingOperating lease liabilityliabilities1
| 1,3731,617 | |
Adjusted Debtdebt | $4,2264,479 | |
| |
Four Quarters Ended January 29, 2022February 3, 2024 |
| Net earnings | 178$134 | |
Add: incomeIncome tax expense | 6813 | |
Add: interestInterest expense, net | 246104 | |
Adjusted earningsEarnings before interest and income taxes | 492251 | |
| |
Add: depreciationDepreciation and amortization expenses | 615586 | |
| Operating Lease Cost | 278 | |
Add: rent expense, netAmortization of developer reimbursements1
| 69 | |
| Canada wind-down costs | 284 | |
| Supply chain asset impairment and related charge | 32 | |
Other Revolver covenant adjustments2 | 22936 | |
Add: other Revolver covenant adjustments3
| 1 | |
| |
| Adjusted EBITDAR | $1,3371,536 | |
| |
| Debt to Net Earnings | 16.021.4 | |
Adjusted Debtdebt to EBITDAR | 3.22.9 | |
1 Based upon the estimated lease liability as of the end of the period, calculated as the trailing four quarters of rent expense multiplied by six, a method of estimating the debt we would record for our leases that are classified as operating if they had met the criteria for a capital lease or we had purchased the property and is calculated under the previous lease standard (ASC 840), consistent with our Revolver covenant calculation requirements. The estimated lease liability is not calculated in accordance with, nor an alternative for, GAAP and should not be considered in isolation or as a substitution for our results reported under GAAP.
2 Rent expense, net of amortizationAmortization of developer reimbursements is a non-cash reduction of Operating Lease Cost and is therefore added back to Operating Lease Cost for consistency withpurposes of our Revolver covenant calculation requirements, and is calculated under the previous lease standard (ASC 840).calculation.
32 Other adjusting items to reconcile net earnings to Adjusted EBITDAR as defined by our Revolver covenant include interest income, and certain non-cash charges and other gains and losses where relevant. For the four quarters ended February 3, 2024, other Revolver covenant adjustments primarily included interest income.
Nordstrom, Inc. and subsidiaries39
CRITICAL ACCOUNTING ESTIMATES
The preparation of financial statements in conformity with GAAP requires that we make estimates, judgments and assumptions that affect the reported amounts of assets, liabilities, revenues and expenses and disclosure of contingent assets and liabilities during the reporting period. Uncertainties regarding such estimates and assumptions are inherent in the preparation of financial statements and actualstatements. Actual results may differ from these estimates and assumptions. The following discussion highlights the estimates we believe are critical and should be read in conjunction with the Notes to Consolidated Financial Statements in Item 8. Our management has discussed the development and selection of these critical accounting estimates with the Audit and Finance Committee of our Board of Directors, and the Audit and Finance Committee has reviewed our disclosures that follow.
Sales Return Reserve
We reduce sales and cost of sales by an estimate of future customer merchandise returns, which is calculated based on historical and expected return patterns, and record a sales return allowancereserve and an estimated returns asset. We record the impact of the sales return allowancereserve separately in both our separate Nordstrom and Nordstrom Rack banners. The majority of our returns from both digital and physical sales come through our stores. As a result of COVID-19 and the related change in customer buying trends, we experienced declines in 2020 in our online return rates, which historically are higher than our overall average return rates. In 2021, we saw increases in our online return rates, although they were still lower than rates in 2019. Accordingly, we adjusted our estimates of future return rates to reflect recent trends. Estimating future returns requires substantial judgment based on current and historical trends and actual returns may vary from our estimates. A 10% change in the sales return allowancereserve, net of the estimated returns asset, would have approximately $22 impact on our EBIT by approximately $20 for the year ended January 29, 2022. Due to the continued volatility surrounding COVID-19, we may not anticipate changes in return trends or the impact of the sales return reserve accurately in our results.February 3, 2024.
The Nordy Club Loyalty Program and Gift Cards
We record breakage revenue onfor The Nordy Club, including unused points and unredeemed Nordstrom Notes, and gift cards based on expected customer redemption. We estimate breakage for The Nordy Club and gift cards based on historical and expected redemption trends. Actual redemptions may vary from our estimates. We have experienced a reduction in redemption rate trends of gift cards, leading to increased breakage rates. For The Nordy Club, we have seen an increasedecrease in redemption rates, leading to decreasedincreased breakage rates.rates for The Nordy Club. A one percentage point change in our gift card breakage rate would impact our EBIT by approximately $41 approximately $43 for the year ended January 29, 2022.February 3, 2024.
Merchandise Inventories
Merchandise inventories are stated at the lower of cost or market value using the retail inventory method. Under the retail method, the valuation of inventories is determined by applying a calculated cost-to-retail ratio to the retail value of ending inventory. Inherent in the retail inventory method are certain management judgments that may affect the ending inventory valuation, as well as gross profit. To determine if the retail value of our inventory should be marked down, we consider current and anticipated demand, customer preferences, age of the merchandise and fashion trends. We record reserves for excess and obsolete inventory based on historical trends and specific identification.
We take physical inventory counts at our stores and Supply Chain Network locations and adjust for differences between recorded amounts and counted amounts. Following each physical inventory cycle and using the most recent physical inventory count and historical results, we record an estimate for shrink based on a percentage of sales until the next physical inventory count.
Impairment of Long-Lived Assets
When facts and circumstances indicate the carrying values of buildings, equipment and ROU assets may be impaired, we compare the carrying value to the related projected future cash flows, among other quantitative and qualitative analyses. Cash flow analysis requires judgment regarding many factors, such as revenues, growth rates, expenses, capital expenditures and capital expenditures.sublease income.
These projections are inherently subject to uncertainties and whileuncertainties. While we believe the inputs and assumptions utilized in our future cash flows are reasonable, our estimates may change in the near term based on our current and future performance.
Income Taxes
We pay income taxes based on the tax statutes, regulations and case law of the various jurisdictions in which we operate. Our income tax expense and deferred tax assets and liabilities reflect our best estimate of current and future taxes to be paid. TaxIncome tax expense may be affected by numerous items, such as changes in tax law, changes in business operations, the results of tax audits and changes to our forecasts of income and loss due to economic and other conditions, such as COVID-19.conditions. Significant judgments and estimates are required in determining consolidated income tax expense.
Deferred tax assets and liabilities arise from differences between the financial reporting and tax basis of assets and liabilities and for operating loss and tax credit carryforwards. The deferred tax assets and liabilities are calculated using the enacted tax rates and laws expected to be in effect when the differences are expected to reverse. In evaluating the likelihood of realizing the benefit of our deferred tax assets, we consider all available evidence, including historical results and projected future taxable income. The assumptions about future taxable income require the use of significant judgment and are consistent with the plans and estimates we are using to manage the underlying business.
Nordstrom, Inc. and subsidiaries3540
We recorded a valuation allowance against certain foreign deferred tax assets as of January 29, 2022 and January 30, 2021 and intend to maintain the valuation allowance until there is sufficient evidence to support its reversal. We believe there is a reasonable possibility within the next 12 months sufficient positive evidence may become available to allow us to reach a conclusion the valuation allowance will no longer be needed. Release of the valuation allowance would result in the recognition of certain foreign deferred tax assets and decrease our income tax expense for the period the release is recorded.
The benefits of uncertain tax positions are recorded in our financial statements only after determining it is more likely than not the uncertain tax positions would sustain challenge by taxing authorities. We are periodically audited by federal, state and foreign tax authorities related to our tax filing positions and allocation of income among various tax jurisdictions. Although we believe our liabilities for uncertain tax positions are reasonable, because of the complexity of some of these uncertainties, the ultimate resolution may result in an outcome that is materially different from our current estimated liability. Furthermore, we are unable to reasonably estimate the timing of related future cash payments. Any differences will be reflected as increases or decreases to income tax expense in the period of resolution.
Canada Wind-down
To assess the estimated fair value of our Nordstrom Canada investment and our related-party receivables, we estimated the assets available for distribution in relation to expected claims. At the time of filing for CCAA protection on March 2, 2023, the estimated amount of Nordstrom Canada’s liabilities exceeded the estimated fair value of assets available for distribution to creditors, and we believed we would not recover a significant portion of our receivables. As a result, our fair value was recorded as zero in our Condensed Consolidated Balance Sheets as of April 29, 2023. As of February 3, 2024, we adjusted our receivables by an immaterial amount based on currently available information.
As of February 3, 2024, we recorded the amount we believe probable of receipt as part of the claims process. This includes receipts related to the rights to the former landlords’ distributions, reimbursement of employee trust contributions and other receivables existing at the time of deconsolidation. The receivable and our other estimates are dependent on the outcome of the Nordstrom Canada wind-down process, including the amount of third-party and Nordstrom claims asserted and recognized in the claims process, the amount of assets available for distribution and the approval of the CCAA plan of arrangement by the Ontario Superior Court of Justice, which we expect to have updated information on in the first quarter of 2024. We continue to work through the wind-down process and our estimates of net losses are based on currently available information, our assessment of the validity of certain expected claims and our assessment of the recoverability of amounts receivable from Nordstrom Canada. These estimates may change as new information becomes available and it is reasonably possible that they may materially change from the estimated amounts. Increases in estimated costs to settle claims and decreases in estimated assets available for distribution may result in additional material charges. At the same time, any future decreases in estimated costs to settle claims or increases in estimated assets available for distribution may result in a gain, which would reduce our estimated charges.
See Note 2: Canada Wind-down in Item 8 for additional information.
RECENT ACCOUNTING PRONOUNCEMENTS
In November 2020,March 2024, the SEC adopted the final rule under SEC Release No. 33-10890,33-11275, Management’s DiscussionThe Enhancement and Analysis, Selected Financial Data, and Supplementary Financial InformationStandardization of Climate-Related Disclosures for Investors,, which eliminates the requirement for selectedrequires new disclosures regarding information about a registrant’s climate-related risks that have materially impacted, or are reasonably likely to have a material impact on, its business strategy, results of operations, or financial data, streamlinescondition. In addition, certain disclosures related to severe weather events and other natural conditions will also be required in MD&A and eliminates duplicative disclosures with the intention of simplifying reporting compliance. This final rule wasa registrant’s audited financial statements. Annual disclosure requirements will be effective for us beginning in the first quarter of 2021, and we elected to early adopt the amendments to provision 301, Selected financial data and provision 302, Supplementary financial information in the fourth quarter of 2020. The adoption2025. We are currently evaluating the impact of this final rule did not have a material effect on our Consolidated Financial Statements.disclosures.
Nordstrom, Inc. and subsidiaries41
Item 7A. Quantitative and Qualitative Disclosures About Market Risk.
(Dollars in millions)
INTEREST RATE RISK
For our long-term debt of $2,853,$2,862, our exposure to interest rate risk is primarily limited to changes in fair value. As our debt is primarily fixed-rate, changes in interest rates do not materially impact our cash flows. However, changes in interest rates increase or decrease the fair value of our debt, depending on whether market rates are lower or higher than our fixed rates. As of January 29, 2022,February 3, 2024, the fair value of our long-term debt was $2,758 $2,441 (see Note 5:6: Debt and Credit Facilities and Note 6:7: Fair Value Measurements in Item 8).
We are exposed to interest rate risk primarily from changes in short-term interest rates. Interest rate fluctuations can affect our interest income and interest expense. As of January 29, 2022,February 3, 2024, we had cash and cash equivalents of $322$628, which generate interest income at variable rates.rates and no borrowings outstanding under our Revolver, for which we pay interest at a variable rate.
FOREIGN CURRENCY EXCHANGE RISK
The majority of our revenues, expenses and capital expenditures are transacted in U.S. Dollars. Our U.S. operations periodically enter into merchandise purchase orders denominated in British Pounds or Euros. From time to time, we may use forward contracts to hedge against fluctuations in foreign currency prices. As of January 29, 2022,February 3, 2024, our outstanding forward contracts did not have a material impact on our Consolidated Financial Statements.
Our Canadian operations are comprised of the Nordstrom.ca website, six Nordstrom stores and seven Nordstrom Rack stores. Our Canadian operations enter into merchandise purchase orders denominated in U.S. Dollars for some portionOn March 2, 2023, as part of our inventory. As salesinitiatives to drive long-term profitable growth and enhance shareholder value, and after careful consideration of all reasonably available options, we announced the decision to discontinue support for Nordstrom Canada’s operations. See Note 2: Canada Wind-down in Canada are denominated in the Canadian Dollar, gross profitItem 8 for our Canadian operations can be impacted by foreign currency fluctuations. more information.
As of January 29, 2022,February 3, 2024, activities associated with foreign currency exchange risk have not had a material impact on our Consolidated Financial Statements (see Note 1: Nature of Operations and Summary of Significant Accounting Policies in Item 8.)8).
There have been no material changes in our primary risk exposures or management of market risks since the prior year.
Item 8: Financial Statements and Supplementary Data.
| | | | | |
| Report of Independent Registered Public Accounting Firm | |
| Consolidated Statements of Earnings | |
| Consolidated Statements of Comprehensive Earnings | |
| Consolidated Balance Sheets | |
| Consolidated Statements of Shareholders’ Equity | |
| Consolidated Statements of Cash Flows | |
| Notes to Consolidated Financial Statements | |
| Note 1: Nature of Operations and Summary of Significant Accounting Policies | |
Note 2: RevenueCanada Wind-down | |
| Note 3: Revenue | |
| Note 4: Land, Property and Equipment | |
Note 4: Leases | |
| Note 5: Leases | |
| Note 6: Debt and Credit Facilities | |
Note 6:7: Fair Value Measurements | |
Note 7: Self-Insurance | |
| Note 8: Self-Insurance | |
| Note 9: Supplemental Executive Retirement Plan | |
Note 9: 401(k) Plan | |
| Note 10: Stock-based Compensation | |
| Note 11: Shareholders’ Equity | |
| Note 12: Income Taxes | |
| Note 13: Commitments and Contingencies | |
| Note 14: Earnings Per Share | |
| Note 15: Segment Reporting | |
| |
| |
Nordstrom, Inc. and subsidiaries 3743
REPORT OF INDEPENDENT REGISTERED PUBLIC ACCOUNTING FIRM
To the Board of Directors and Shareholders of Nordstrom, Inc.
Opinion on the Financial Statements
We have audited the accompanying consolidated balance sheets of Nordstrom, Inc. and subsidiaries (the “Company”) as of January 29, 2022February 3, 2024 and January 30, 202128, 2023 and the related consolidated statements of earnings, comprehensive earnings, shareholders’ equity, and cash flows, for each of the three years in the period ended January 29, 2022,February 3, 2024, and the related notes (collectively referred to as the “financial statements”). In our opinion, the financial statements present fairly, in all material respects, the financial position of the Company as of January 29, 2022,February 3, 2024, and January 30, 2021,28, 2023, and the results of its operations and its cash flows for each of the three years in the period ended January 29, 2022,February 3, 2024, in conformity with accounting principles generally accepted in the United States of America.
We have also audited, in accordance with the standards of the Public Company Accounting Oversight Board (United States) (PCAOB), the Company’s internal control over financial reporting as of January 29, 2022,February 3, 2024, based on the criteria established in Internal Control—Integrated Framework (2013) issued by the Committee of Sponsoring Organizations of the Treadway Commission, and our report dated March 11, 2022,19, 2024, expressed an unqualified opinion on the Company’s internal control over financial reporting.
Basis for Opinion
These financial statements are the responsibility of the Company’s management. Our responsibility is to express an opinion on the Company’s financial statements based on our audits. We are a public accounting firm registered with the PCAOB and are required to be independent with respect to the Company in accordance with the U.S. federal securities laws and the applicable rules and regulations of the Securities and Exchange Commission and the PCAOB.
We conducted our audits in accordance with the standards of the PCAOB. Those standards require that we plan and perform the auditsaudit to obtain reasonable assurance about whether the financial statements are free of material misstatement, whether due to error or fraud. Our audits included performing procedures to assess the risks of material misstatement of the financial statements, whether due to error or fraud, and performing procedures that respond to those risks. Such procedures included examining, on a test basis, evidence regarding the amounts and disclosures in the financial statements. Our audits also included evaluating the accounting principles used and significant estimates made by management, as well as evaluating the overall presentation of the financial statements. We believe that our audits provide a reasonable basis for our opinion.
Critical Audit Matter
The critical audit matter communicated below arose from the current-period audit of the financial statements that was communicated or required to be communicated to the Audit and Finance Committee and that (1) relates to accounts or disclosures that are material to the financial statements and (2) involved our especially challenging, subjective, or complex judgments. The communication of critical audit matters does not alter in any way our opinion on the financial statements, taken as a whole, and we are not, by communicating the critical audit matter below, providing a separate opinion on the critical audit matter or on the accounts or disclosures to which it relates.
Merchandise Inventories—Refer to Note 1 to the financial statements
Critical Audit Matter Description
The Company’s merchandise inventories are generally stated at the lower of cost or market using the retail inventory method (“RIM”). Under the RIM, the valuation of inventories is determined by applying a calculated cost-to-retail ratio to the retail value of ending inventory. The value of the Company’s inventory on the balance sheet is then reduced by a charge to cost of sales for retail inventory markdowns taken on the selling price. To determine if the retail value of its inventory should be marked down, the Company considers many factors, including current and anticipated demand, customer preferences, age of the merchandise and fashion trends. Recorded markdowns represent one of the most significant inputs into the RIM calculation due to their impact on inventory valuation. Accordingly, the Company’s process of recording markdowns is subjective, particularly as it relates to timing of markdowns.
Given the management judgments necessary to identify and record markdowns in a timely manner, performing audit procedures to evaluate the timeliness of markdowns required a high degree of auditor judgment.
How the Critical Audit Matter Was Addressed in the Audit
Our audit procedures related to the timing of markdowns taken, included the following, among others:
•We tested the effectiveness of controls designed to ensure that markdowns are recorded timely.
•We evaluated the reasonableness of the timing of markdowns recorded by performing analytical procedures to compare current period trends to historical trends at varying levels of disaggregation (i.e., total company, operating segment, and business unit level) across multiple fiscal periods, including, but not limited to, metrics such as markdowns relative to sales trends, inventory turnover, and inventory aging.
•We evaluated management’s ability to identify triggering events and accurately forecast markdown activity by:
▪Comparing actual markdowns recorded to management’s historical forecasts
▪Reading forecasted information included in Company press releases
▪Reading internal communications to management and the Board of Directors.Directors
•We performed a retrospective review of markdowns recorded in periods subsequent to fiscal year-end to assess whether any unusual trends occurred that would indicate untimely markdowns.
/s/ Deloitte & Touche LLP
Seattle, Washington
March 11, 202219, 2024
We have served as the Company’s auditor since 1970.
Nordstrom, Inc. and subsidiaries 3945
Nordstrom, Inc.
Consolidated Statements of Earnings
(In millions except per share amounts) | | Fiscal year | Fiscal year | 2021 | | 2020 | | 2019 | Fiscal year | 2023 | 2022 | 2021 |
| Net sales | Net sales | $14,402 | | | $10,357 | | | $15,132 | |
| Credit card revenues, net | Credit card revenues, net | 387 | | | 358 | | | 392 | |
| Total revenues | Total revenues | 14,789 | | | 10,715 | | | 15,524 | |
| Cost of sales and related buying and occupancy costs | Cost of sales and related buying and occupancy costs | (9,344) | | | (7,600) | | | (9,932) | |
| Selling, general and administrative expenses | Selling, general and administrative expenses | (4,953) | | | (4,162) | | | (4,808) | |
| Earnings (loss) before interest and income taxes | 492 | | | (1,047) | | | 784 | |
| Canada wind-down costs | |
| Earnings before interest and income taxes | |
| Interest expense, net | Interest expense, net | (246) | | | (181) | | | (102) | |
| Earnings (loss) before income taxes | 246 | | | (1,228) | | | 682 | |
| Income tax (expense) benefit | (68) | | | 538 | | | (186) | |
| Net earnings (loss) | $178 | | | ($690) | | | $496 | |
| Earnings before income taxes | |
| Income tax expense | |
| Net earnings | |
| | Earnings (loss) per share: | |
| Earnings per share: | |
| Earnings per share: | |
| Earnings per share: | |
| Basic | |
| Basic | |
| Basic | Basic | $1.12 | | | ($4.39) | | | $3.20 | |
| Diluted | Diluted | $1.10 | | | ($4.39) | | | $3.18 | |
| | Weighted-average shares outstanding: | Weighted-average shares outstanding: | |
| Weighted-average shares outstanding: | |
| Weighted-average shares outstanding: | |
| Basic | |
| Basic | |
| Basic | Basic | 159.0 | | | 157.2 | | | 155.2 | |
| Diluted | Diluted | 162.5 | | | 157.2 | | | 156.1 | |
The accompanying Notes to Consolidated Financial Statements are an integral part of these financial statements.
Nordstrom, Inc.
Consolidated Statements of Comprehensive Earnings
(In millions) | | | | | | | | | | | | | | | | | |
| Fiscal year | 2021 | | 2020 | | 2019 |
| Net earnings (loss) | $178 | | | ($690) | | | $496 | |
| Postretirement plan adjustments, net of tax of ($6), $0 and $9 | 18 | | | (1) | | | (27) | |
| Foreign currency translation adjustment | 2 | | | (1) | | | (4) | |
| Comprehensive net earnings (loss) | $198 | | | ($692) | | | $465 | |
| | | | | | | | | | | |
| Fiscal year | 2023 | 2022 | 2021 |
| Net earnings | $134 | | $245 | | $178 | |
| Postretirement plan adjustments, net of tax of ($2), ($12) and ($6) | 5 | | 32 | | 18 | |
| Foreign currency translation adjustment | (4) | | (8) | | 2 | |
| Comprehensive net earnings | $135 | | $269 | | $198 | |
The accompanying Notes to Consolidated Financial Statements are an integral part of these financial statements.
Nordstrom, Inc.
Consolidated Balance Sheets
(In millions) | | January 29, 2022 | | January 30, 2021 |
| February 3, 2024 | | | February 3, 2024 | January 28, 2023 |
| Assets | Assets | |
| Current assets: | Current assets: | |
| Current assets: | |
| Current assets: | |
| Cash and cash equivalents | |
| Cash and cash equivalents | |
| Cash and cash equivalents | Cash and cash equivalents | $322 | | | $681 | |
| Accounts receivable, net | Accounts receivable, net | 255 | | | 245 | |
| Merchandise inventories | Merchandise inventories | 2,289 | | | 1,863 | |
| Prepaid expenses and other | 306 | | | 853 | |
| Prepaid expenses and other current assets | |
| Total current assets | Total current assets | 3,172 | | | 3,642 | |
| | Land, property and equipment, net | |
| Land, property and equipment, net | |
| Land, property and equipment, net | Land, property and equipment, net | 3,562 | | | 3,732 | |
| Operating lease right-of-use assets | Operating lease right-of-use assets | 1,496 | | | 1,581 | |
| Goodwill | Goodwill | 249 | | | 249 | |
| Other assets | Other assets | 390 | | | 334 | |
| Total assets | Total assets | $8,869 | | | $9,538 | |
| | Liabilities and Shareholders’ Equity | Liabilities and Shareholders’ Equity | |
| Liabilities and Shareholders’ Equity | |
| Liabilities and Shareholders’ Equity | |
| Current liabilities: | Current liabilities: | |
| Current liabilities: | |
| Current liabilities: | |
| Accounts payable | |
| Accounts payable | |
| Accounts payable | Accounts payable | $1,529 | | | $1,960 | |
| Accrued salaries, wages and related benefits | Accrued salaries, wages and related benefits | 383 | | | 352 | |
| Current portion of operating lease liabilities | Current portion of operating lease liabilities | 242 | | | 260 | |
| Other current liabilities | Other current liabilities | 1,160 | | | 1,048 | |
| Current portion of long-term debt | Current portion of long-term debt | — | | | 500 | |
| Total current liabilities | Total current liabilities | 3,314 | | | 4,120 | |
| | Long-term debt, net | Long-term debt, net | 2,853 | | | 2,769 | |
| Long-term debt, net | |
| Long-term debt, net | |
| | Non-current operating lease liabilities | |
| Non-current operating lease liabilities | |
| Non-current operating lease liabilities | Non-current operating lease liabilities | 1,556 | | | 1,687 | |
| Other liabilities | Other liabilities | 565 | | | 657 | |
| | Commitments and contingencies (Note 13) | Commitments and contingencies (Note 13) | 0 | | 0 |
| Commitments and contingencies (Note 13) | |
| Commitments and contingencies (Note 13) | | |
| | Shareholders’ equity: | Shareholders’ equity: | |
| Common stock, no par value: 1,000 shares authorized; 159.4 and 157.8 shares issued and outstanding | 3,283 | | | 3,205 | |
| Shareholders’ equity: | |
| Shareholders’ equity: | |
| Common stock, no par value: 1,000 shares authorized; 162.4 and 160.1 shares issued and outstanding | |
| Common stock, no par value: 1,000 shares authorized; 162.4 and 160.1 shares issued and outstanding | |
| Common stock, no par value: 1,000 shares authorized; 162.4 and 160.1 shares issued and outstanding | |
| Accumulated deficit | Accumulated deficit | (2,652) | | | (2,830) | |
| Accumulated other comprehensive loss | (50) | | | (70) | |
| Accumulated other comprehensive gain (loss) | |
| Total shareholders’ equity | Total shareholders’ equity | 581 | | | 305 | |
| Total liabilities and shareholders’ equity | Total liabilities and shareholders’ equity | $8,869 | | | $9,538 | |
The accompanying Notes to Consolidated Financial Statements are an integral part of these financial statements.
Nordstrom, Inc. and subsidiaries 4147
Nordstrom, Inc.
Consolidated Statements of Shareholders’ Equity
(In millions except per share amounts)
| | Fiscal year ended | Fiscal year ended | January 29, 2022 | | January 30, 2021 | | February 1, 2020 | Fiscal year ended | February 3, 2024 | January 28, 2023 | January 29, 2022 |
| Common stock | Common stock | |
| Balance, beginning of year | |
| Balance, beginning of year | |
| Balance, beginning of year | Balance, beginning of year | $3,205 | | | $3,129 | | | $3,048 | |
| Issuance of common stock under stock compensation plans | Issuance of common stock under stock compensation plans | 14 | | | 16 | | | 29 | |
| Stock-based compensation | Stock-based compensation | 64 | | | 60 | | | 52 | |
| Balance, end of year | Balance, end of year | $3,283 | | | $3,205 | | | $3,129 | |
| | Accumulated deficit | Accumulated deficit | |
| Accumulated deficit | |
| Accumulated deficit | |
| Balance, beginning of year | Balance, beginning of year | ($2,830) | | | ($2,082) | | | ($2,138) | |
| Cumulative effect of adopted accounting standards | — | | | — | | | (25) | |
| Net earnings (loss) | 178 | | | (690) | | | 496 | |
| Balance, beginning of year | |
| Balance, beginning of year | |
| | Net earnings | |
| Net earnings | |
| Net earnings | |
| Dividends | Dividends | — | | | (58) | | | (229) | |
| Repurchase of common stock | Repurchase of common stock | — | | | — | | | (186) | |
| Balance, end of year | Balance, end of year | ($2,652) | | | ($2,830) | | | ($2,082) | |
| | Accumulated other comprehensive loss | |
| Accumulated other comprehensive gain (loss) | |
| Accumulated other comprehensive gain (loss) | |
| Accumulated other comprehensive gain (loss) | |
| Balance, beginning of year | Balance, beginning of year | ($70) | | | ($68) | | | ($37) | |
| Other comprehensive earnings (loss) | 20 | | | (2) | | | (31) | |
| Balance, beginning of year | |
| Balance, beginning of year | |
| Accumulated translation loss reclassified to earnings | |
| Other comprehensive earnings | |
| Balance, end of year | Balance, end of year | ($50) | | | ($70) | | | ($68) | |
| | Total | Total | $581 | | | $305 | | | $979 | |
| Total | |
| Total | |
| | Dividends per share | Dividends per share | $— | | | $0.37 | | | $1.48 | |
| Dividends per share | |
| Dividends per share | |
The accompanying Notes to Consolidated Financial Statements are an integral part of these financial statements.
Nordstrom, Inc.
Consolidated Statements of Cash Flows
(In millions) | | Fiscal year | Fiscal year | 2021 | | 2020 | | 2019 | Fiscal year | 2023 | 2022 | 2021 |
| Operating Activities | Operating Activities | |
| Net earnings (loss) | $178 | | | ($690) | | | $496 | |
| Adjustments to reconcile net earnings (loss) to net cash provided by (used in) operating activities: | |
| Net earnings | |
| Net earnings | |
| Net earnings | |
| Adjustments to reconcile net earnings to net cash provided by operating activities: | |
| Depreciation and amortization expenses | Depreciation and amortization expenses | 615 | | | 671 | | | 671 | |
| Depreciation and amortization expenses | |
| Depreciation and amortization expenses | |
| Canada wind-down costs | |
| Asset impairment | Asset impairment | — | | | 137 | | | — | |
| Right-of-use asset amortization | Right-of-use asset amortization | 175 | | | 168 | | | 183 | |
| Deferred income taxes, net | Deferred income taxes, net | (11) | | | (7) | | | 52 | |
| Stock-based compensation expense | Stock-based compensation expense | 79 | | | 67 | | | 69 | |
| Other, net | Other, net | 81 | | | 4 | | | — | |
| Change in operating assets and liabilities: | Change in operating assets and liabilities: | |
| Accounts receivable | (10) | | | (46) | | | 82 | |
| Merchandise inventories | Merchandise inventories | (383) | | | 53 | | | 30 | |
| Prepaid expenses and other assets | 542 | | | (607) | | | (38) | |
| Merchandise inventories | |
| Merchandise inventories | |
| Other current and noncurrent assets | |
| Accounts payable | Accounts payable | (400) | | | 432 | | | 98 | |
| Accrued salaries, wages and related benefits | Accrued salaries, wages and related benefits | 31 | | | (157) | | | (71) | |
| Other current liabilities | 112 | | | (143) | | | (94) | |
| | Lease liabilities | Lease liabilities | (284) | | | (237) | | | (259) | |
| Other liabilities | (20) | | | 7 | | | 17 | |
| Net cash provided by (used in) operating activities | 705 | | | (348) | | | 1,236 | |
| Lease liabilities | |
| Lease liabilities | |
| Other current and noncurrent liabilities | |
| Net cash provided by operating activities | |
| | Investing Activities | Investing Activities | |
| Investing Activities | |
| Investing Activities | |
| Capital expenditures | |
| Capital expenditures | |
| Capital expenditures | Capital expenditures | (506) | | | (385) | | | (935) | |
| | Other, net | (15) | | | 38 | | | 26 | |
| Decrease in cash and cash equivalents resulting from Canada deconsolidation | |
| Decrease in cash and cash equivalents resulting from Canada deconsolidation | |
| Decrease in cash and cash equivalents resulting from Canada deconsolidation | |
| Proceeds from the sale of assets and other, net | |
| Net cash used in investing activities | Net cash used in investing activities | (521) | | | (347) | | | (909) | |
| | Financing Activities | Financing Activities | |
| Financing Activities | |
| Financing Activities | |
| Proceeds from revolving line of credit | |
| Proceeds from revolving line of credit | |
| Proceeds from revolving line of credit | Proceeds from revolving line of credit | 400 | | | 800 | | | — | |
| Payments on revolving line of credit | Payments on revolving line of credit | (400) | | | (800) | | | — | |
| Proceeds from long-term borrowings | Proceeds from long-term borrowings | 675 | | | 600 | | | 499 | |
| Principal payments on long-term borrowings | Principal payments on long-term borrowings | (1,100) | | | — | | | (500) | |
| | (Decrease) increase in cash book overdrafts | (32) | | | (4) | | | 8 | |
| Change in cash book overdrafts | |
| Change in cash book overdrafts | |
| Change in cash book overdrafts | |
| Cash dividends paid | Cash dividends paid | — | | | (58) | | | (229) | |
| Payments for repurchase of common stock | Payments for repurchase of common stock | — | | | — | | | (210) | |
| Proceeds from issuances under stock compensation plans | Proceeds from issuances under stock compensation plans | 14 | | | 16 | | | 29 | |
| Tax withholding on share-based awards | (15) | | | (9) | | | (17) | |
| Other, net | Other, net | (86) | | | (15) | | | (11) | |
| Net cash (used in) provided by financing activities | (544) | | | 530 | | | (431) | |
| Net cash used in financing activities | |
| | Effect of exchange rate changes on cash and cash equivalents | Effect of exchange rate changes on cash and cash equivalents | 1 | | | (7) | | | — | |
| Net decrease in cash and cash equivalents | (359) | | | (172) | | | (104) | |
| Effect of exchange rate changes on cash and cash equivalents | |
| Effect of exchange rate changes on cash and cash equivalents | |
| Net (decrease) increase in cash and cash equivalents | |
| Cash and cash equivalents at beginning of year | Cash and cash equivalents at beginning of year | 681 | | | 853 | | | 957 | |
| Cash and cash equivalents at end of year | Cash and cash equivalents at end of year | $322 | | | $681 | | | $853 | |
| | Supplemental Cash Flow Information | Supplemental Cash Flow Information | |
| Cash (received) paid during the year for: | |
| Income taxes, net of refunds | ($485) | | | $23 | | | $178 | |
| Interest, net of capitalized interest | 164 | | | 168 | | | 111 | |
| | Supplemental Cash Flow Information | |
| Supplemental Cash Flow Information | |
| Income taxes paid, net of refunds received | |
| Income taxes paid, net of refunds received | |
| Income taxes paid, net of refunds received | |
| Interest paid, net of capitalized interest | |
The accompanying Notes to Consolidated Financial Statements are an integral part of these financial statements.
Nordstrom, Inc. and subsidiaries 4349
Nordstrom, Inc.
Notes to Consolidated Financial Statements
(Dollar and share amounts in millions except per share, per option and per unit amounts)
NOTE 1: NATURE OF OPERATIONS AND SUMMARY OF SIGNIFICANT ACCOUNTING POLICIES
The Company
Founded in 1901 as a retail shoe business in Seattle, Washington, our Company is a leading fashion retailer that offers an extensive selection of high-quality brand-name and private labelprivate-label merchandise for women, men, young adults and children, focusedwith a focus on apparel, shoes, beauty, accessories and home goods. This breadth of merchandise allows us to serve a wide range of customers who appreciate quality fashion and a superior shopping experience. We offer brand-name and private label merchandiseexperience, across our digital and physical assets and in both our Nordstrom and Nordstrom Rack banners. Our facilities and stores are located in 40 states in the U.S. and
As of February 3, provinces in Canada. 2024, Nordstrom includes:
•93 Nordstrom stores
•Nordstrom.com website and mobile application
•six Nordstrom Locals
As of February 3, 2024, Nordstrom Rack includes:
•TrunkClub.com
•Nordstrom.ca
•94 Nordstrom stores in the U.S.
•6 Nordstrom stores and 7258 Nordstrom Rack stores in Canada
•7 Nordstrom Locals
Nordstrom Rack includes:
•NordstromRack.com website and mobile application
•HauteLook.com - prior to the first quarter of 2021
•240 Nordstrom Rack stores in the U.S.
•2two Last Chance clearance stores
Fiscal Year
We operate on a 52/53-week fiscal year ending on the Saturday closest to January 31st. References to 2021 and all2023 relate to the 53-week fiscal year ending February 3, 2024. References to any other years included within this document except 2017 are based on a 52-week fiscal year, while 2017 is based on a 53-week fiscal year.
Principles of Consolidation
The Consolidated Financial Statements include the balances of Nordstrom, Inc. and its subsidiaries.subsidiaries and are presented in U.S. dollars. All intercompany transactions and balances are eliminated in consolidation.
On March 2, 2023, Nordstrom Canada commenced a wind-down of its business operations (see Note 2: Canada Wind-down) and as of this date, Nordstrom Canada was deconsolidated from Nordstrom, Inc.’s financial statements. Nordstrom Canada results prior to March 2, 2023 are included in the Company’s Consolidated Financial Statements.
Use of Estimates
The preparation of financial statements in conformity with GAAP requires that we make estimates, judgments and assumptions that affect the reported amounts of assets, liabilities, revenues and expenses and disclosure of contingent assets and liabilities during the reporting period. Uncertainties regarding such estimates and assumptions are inherent in the preparation of financial statements and actualstatements. Actual results may differ from these estimates and assumptions. Our most significant accounting judgments and estimates include revenue recognition, inventory valuation, long-lived asset recoverability, and income taxes and contingent liabilities, including assumptions related to our Canada wind-down, all of which involve assumptions about future events. We may be unable to accurately predict the impact of COVID-19 going forward and as a result our estimates may change in the near term.
Revenue
Net Sales
We recognize sales revenue net of estimated returns and excluding sales taxes. Revenue from sales shipped to customers shipped from our Supply Chain Network facilities, stores and directly from our vendors, which includes shipping revenue when applicable, is recognized at shipping point, the point in time where control has transferred to the customer. Costs to ship orders to customers are expensed as a fulfillment activity at shipping point, commissions from sales at our Nordstrom stores are expensed at the point of sale and both are recorded in SG&A expenses.
Nordstrom, Inc.
Notes to Consolidated Financial Statements
(Dollar and share amounts in millions except per share, per option and per unit amounts)
We reduce sales and cost of sales by an estimate of future customer merchandise returns, which is calculated based on historical and expected return patterns, and record a sales return allowancereserve and an estimated returns asset. Our sales return allowancereserve is classified in other current liabilities and our estimated returns asset, calculated based on the cost of merchandise sold, is classified in prepaid expenses and other on the Consolidated Balance Sheets. As of January 29, 2022February 3, 2024 and January 30, 2021,28, 2023, our sales return allowancereserve was $411$377 and $299$415, and our estimated returns asset was $186$164 and $134.$179. Due to the seasonality of our business, these balances typically increase when higher sales occur in the last month of a period, such as during the Anniversary Sale, which usually occurs at the end of the second quarter, and decrease in the following period. We record the impact of the sales return allowancereserve separately in both our separate Nordstrom and Nordstrom Rack banners. The majority of our returns from both digital and physical sales come through our stores.As a result of COVID-19 and the related change in customer buying trends, we experienced declines in 2020 in our online return rates, which historically are higher than our overall average return rates. In 2021, we saw increases in our online return rates, although they were still lower than rates in 2019. Accordingly, we adjusted our estimates of future return rates to reflect recent trends. Estimating future returns requires substantial judgment based on current and historical trends and actual returns may vary from our estimates.
Loyalty Program
The Nordy Club is our customer loyalty program that incorporates a traditional point and benefit system, while providing customers exclusive access to products and events, enhanced services, personalized experiences and more convenient ways to shop. Customers accumulate points based on their level of spending and type of participation. Upon reaching certain point thresholds, customers receive Nordstrom Notes, which can be redeemed for goods or services across Nordstrom and Nordstrom Rack. The Nordy Club benefits vary based on the level of customer spend, and include Bonus Pointsbonus points days and shopping and fashion events.
We offer customers access to a variety of payment products and services, including a selection of Nordstrom-branded Visa® credit cards, in the U.S. and Canada, as well as a Nordstrom-branded private labelprivate-label credit card for Nordstrom purchases. When customers use a Nordstrom-branded credit or debit card, they also participate in The Nordy Club and receive additional benefits, which can vary depending on the level of spend, including early access to the Anniversary Sale, enhanced alterationalterations and stylist benefits and incremental accumulation of points toward Nordstrom Notes.
As our customers earn points and Nordstrom Notes in The Nordy Club, a portion of underlying sales revenue is deferred based on an estimated stand-alone selling price of points, Nordstrom Notes and other loyalty benefits, such as alterations. We recognize the revenue and related cost of sale when the Nordstrom Notes are ultimately redeemed and reduce our contract liability. We include the deferred revenue in other current liabilities on the Consolidated Balance Sheets. We record breakage revenue of unused points and unredeemed Nordstrom Notes based on expected customer redemption. We estimate, based on historical and expected usage, that approximatelyly 8% of Nordstrom Notes and points will be unredeemed. Estimating future breakage rates requires judgment based on current and historical trends, and actual breakage rates may vary from our estimates. Other benefits of the loyalty program, including shopping and fashion events, are recorded in SG&A expenses as these are not a material right of the program.
As of January 29, 2022both February 3, 2024 and January 30, 2021,28, 2023, our outstanding performance obligation for The Nordy Club, which consists primarily of unredeemed points and Nordstrom Notes at retail value, was $112 and $137.was $115. Almost all Nordstrom Notes are redeemedredemptions occur within approximatelyteneleven months of issuance.
Gift Cards
We record deferred revenue from the sale of gift cards at the time of purchase. As gift cards are redeemed, we recognize revenue and reduce our contract liability. Although our gift cards do not have an expiration date, we include this deferred revenue in other current liabilities on the Consolidated Balance Sheets as customers can redeem gift cards at any time. We record breakage revenue on unused gift cards based on expected customer redemption. We estimate, based on historical usage, that 3% 4% of gift cards will be unredeemed and recognized as revenue. Estimating future breakage rates requires judgment based on current and historical trends and actual breakage rates may vary from our estimates. Higher volumes of gift cards issued over the last several years prior to COVID-19 combined with higher breakage rates resulted in an increase in breakage income for 2020. However, due to COVID-19 and the related change in customer buying trends there were fewer gift cards issued in the last two years, resulting in a decrease in breakage income for 2021. Breakage income was $52, $40 and $39 $81in 2023, 2022 and $17 in 2021, 2020 and 2019.2021.
As of January 29, 2022February 3, 2024 and January 30, 2021,28, 2023, our outstanding performance obligation for unredeemed gift cards was $366was $343 and $341.$370. Almost all gift cards are redeemedcard redemptions occur within two years of issuance.
Credit Card Revenues, net
Although the primary purpose of offering our credit cards is to foster greater customer loyalty and drive more sales, we also receive credit card revenue through our program agreement with TD. Under that agreement, which was amended in the fourth quarter of 2022 and runs through September 2026, TD is the exclusive issuer of Nordstrom-branded consumer credit cards and we perform account servicing functions for those cards. Credit card revenues, net include our portion of the ongoing credit card revenue, net of credit losses, pursuant to our program agreement with TD. In connection with the amendment, we recorded deferred revenue, which will be recognized in full over the term of the agreement as we perform account servicing functions. Our outstanding performance obligation for the TD agreement is included in other current liabilities and other liabilities on our Consolidated Balance Sheets and the amortization is included in other operating, net on the Consolidated Statements of Cash Flows.
Nordstrom, Inc. and subsidiaries 4551
Nordstrom, Inc.
Notes to Consolidated Financial Statements
(Dollar and share amounts in millions except per share, per option and per unit amounts)
Credit Card Revenues, net
Although the primary purpose of offering our credit cards is to foster greater customer loyalty and drive more sales, we also receive credit card revenue through our program agreement with TD, whereby TD is the exclusive issuer of our consumer credit cards and we perform account servicing functions. Credit card revenues, net include our portion of the ongoing credit card revenue, net of credit losses, pursuant to our program agreement with TD.
Cost of Sales
Cost of sales primarily includes the purchase and manufacturing costs of inventory sold, net of vendor allowances, and in-bound freight and duty expense.
Buying and Occupancy Costs
Buying costs consist primarily of compensation and other costs incurred by our merchandising and product development groups. Occupancy costs include rent, depreciation, property taxes and facility operating costs of our retail, corporate centerstores, office facilities and Supply Chain Network facilities.
Selling, General and Administrative Expenses
SG&A expenses consist primarily of compensation and benefit,benefits, marketing, outbound supply chain and technology costs.
Severance
In 2020, we recorded $88 of restructuring costs in connection with our regional and corporate reorganization, including $25 recorded in cost of sales and related buying and occupancy costs and $63 in SG&A on the Consolidated Statement of Earnings.
Advertising
Advertising production costs for internet, magazines, store events and other media are expensed the first time the advertisement is run. Online marketing costs are expensed when incurred. Total advertising expenses, net of vendor allowances, of $300, $283 and $299 in 2021, 2020 and 2019 were included in SG&A expenses.
Shipping and Fulfillment Costs
Our shipping and fulfillment costs include payments to third-party shippers and costs to hold, move and prepare merchandise for shipment. These costs do not include in-bound freight to our Supply Chain Network facilities, which we include in the cost of our inventory. Shipping and fulfillment costs ofof $712, $885 and $993 $828 in 2023, 2022 and $627 in 2021 2020 and 2019 were included in SG&A expenses.
Advertising
Advertising production costs for internet, magazines, store events and other media are expensed the first time the advertisement is run. Online marketing costs are expensed when incurred. Total advertising expenses, net of vendor allowances, of $313, $309 and $300 in 2023, 2022 and 2021 were included in SG&A expenses.
Vendor Allowances
We receive allowances from merchandise vendors for purchase price adjustments, beauty expenses, advertising programs and various other expenses. Purchase price adjustments are recorded as a reduction of cost of sales at the point they have been earned and the related merchandise has been marked down or sold. Allowances for beauty expenses, advertising programs and other expenses are recorded in SG&A expenses as a reduction of the related costs when incurred.
Vendor allowances earned are as follows:
| | Fiscal year | Fiscal year | 2021 | | 2020 | | 2019 | Fiscal year | 2023 | 2022 | 2021 |
| Purchase price adjustments | Purchase price adjustments | $108 | | | $77 | | | $171 | |
| Beauty expenses | Beauty expenses | 103 | | | 79 | | | 140 | |
| Advertising | Advertising | 110 | | | 82 | | | 101 | |
| Other | Other | 3 | | | 2 | | | 6 | |
| Total vendor allowances | Total vendor allowances | $324 | | | $240 | | | $418 | |
Advertising includes NMN, where vendors pay a fee for use of our first-party data. Funds received from vendors are recorded as a reduction of the campaign cost in SG&A expenses and media fees are recorded as a reduction of cost of sales.
401(k) Plan
We provide a 401(k) plan for our employees that allows for employee elective contributions and our matching contributions. Employee elective contributions are funded through voluntary payroll deductions. Total expenses related to Company contributions were $71 in 2023 and 2022 and $67 in 2021, and were included in both buying and occupancy costs and SG&A expenses on our Consolidated Statements of Earnings.
Nordstrom, Inc.
Notes to Consolidated Financial Statements
(Dollar and share amounts in millions except per share, per option and per unit amounts)
Stock-Based Compensation
The 2019 Plan authorizes the grant of stock options, PSUs, RSUs, stock appreciation rights and both restricted and unrestricted shares of common stock to employees and nonemployee directors. We grant stock-based awards under our 2019 Plan and employees may purchase our stock at a discount under our ESPP. We predominantly recognize stock-based compensation expense related to stock-based awards at their estimated grant date fair value, recorded on a straight-line basis over the requisite service period. Compensation expense for certain award holders is accelerated based upon age and years of service. Compensation expense for PSUs is adjusted based on the payout percentage of the PSU grant subject to achieving specific performance measures. The total compensation expense is reduced by actual forfeitures as they occur.
Nordstrom, Inc.
Notes to Consolidated Financial Statements
(Dollar and share amounts in millions except per share, per option and per unit amounts)
We primarily estimate the grant date fair value of stock options using the Binomial Lattice optionLattice-based valuation model, but for our price-hurdle grants in 2021, we estimate the grant date fair value using the Monte Carlo simulation valuation model. The grant date fair value of RSUs areand PSUs is determined based on the number of RSUs or PSUs granted and the quoted price of our common stock on the date of grant, less the estimated present value of dividends over the vesting period. PSUs granted are classified as equity and the fair value is determined basedequity.
Amounts included on the number of PSUs granted and the quoted pricefollowing line items of our common stock on the dateConsolidated Statements of grant, less the estimated present valueShareholders’ Equity and our Consolidated Statements of dividends over the vesting period.Cash Flows are as follows:
•Issuance of common stock under stock compensation plans on the Consolidated Statements of Shareholders’ Equity— includes proceeds from our common stock option exercises and purchases of shares under the ESPP while stock-based
•Stock-based compensation — primarily includes stock-based compensation expense for our common stock options, RSUs and PSUs, partially offset by shares withheld for taxes on RSUs.RSUs and PSUs
New Store Opening Costs
Non-capital expenditures associated with opening new stores, including marketing expenses, relocation expenses and occupancy costs, are charged to expense as incurred. These costs are included in both buying and occupancy costs and SG&A expenses, according to their nature as disclosed above.
Income Taxes
We use the asset and liability method of accounting for income taxes. Using this method, deferred tax assets and liabilities are recorded based on differences between the financial reporting and tax basis of assets and liabilities and for operating loss and tax credit carryforwards. The deferred tax assets and liabilities are calculated using the enacted tax rates and laws that are expected to be in effect when the differences are expected to reverse. We routinely evaluate the likelihood of realizing the benefit of our deferred tax assets and may record a valuation allowance if, based on all available evidence, it is determined that some portion of the tax benefit will not be realized.
We regularly evaluate the likelihood of realizing the benefit for income tax positions we have taken in various federal, state and foreign filings by considering all relevant facts, circumstances and information available. If we believe it is more likely than not that our position will be sustained, we recognize a benefit at the largest amount we believe is cumulatively greater than 50% likely to be realized. Interest and penalties related to income tax matters are classified as a component of income tax expense.
Income taxes require significant management judgment regarding applicable statutes and their related interpretation, the status of various income tax audits and our particular facts and circumstances. Also, as audits are completed or statutes of limitations lapse, it may be necessary to record adjustments to our taxes payable, deferred taxes, tax reserves or income tax expense.
CARES Act
On March 27, 2020,Nordstrom, Inc. and subsidiaries53
Nordstrom, Inc.
Notes to Consolidated Financial Statements
(Dollar and share amounts in millions except per share, per option and per unit amounts)
Earnings Per Share
Earnings per basic share is computed using the CARES Act was signed into law. Among other provisions, the CARES Act provided for payroll tax credits for employee retention, deferralweighted-average number of payroll taxes and several income tax provisions including allowing for carryback of certain operating losses.
In accordance with our overall approach for determining our income tax provision, which uses an estimated annual effective tax rate based on our best estimates and adjusts for discrete taxable events that occurcommon shares outstanding during the quarter, we made a reasonable estimateyear. Earnings per diluted share uses the weighted-average number of the impacts of the CARES Act in our 2020 results. As of January 29, 2022, we completed our accounting for the impacts of the CARES Act, resulting in no material changes to previously recorded estimated amounts.
Forcommon shares outstanding during the year ended January 30, 2021, we recognized $69 in employee retention payroll tax creditsplus dilutive common stock equivalents, primarily RSUs and elected to defer paymentstock options. Dilutive common stock is calculated using the treasury stock method and includes outstanding RSUs and options that would reduce the amount of the employer portion of social security taxes, both as providedearnings for under the CARES Actwhich each share is entitled. Anti-dilutive shares (including stock options and other COVID-19 related stimulus. Forshares) are excluded from the year ended January 29, 2022, we recognized an additional $7 in COVID-19 payroll-related stimuluscalculation of diluted shares and paid in full the deferred employer portion of social security taxes.earnings per diluted share because their impact could increase earnings per diluted share.
Comprehensive Net Earnings
Comprehensive net earnings consist of net earnings and other gains and losses affecting equity that are excluded from net earnings. These consist of postretirement plan adjustments, net of related income tax effects, and foreign currency translation adjustments.
Cash Equivalents
Cash equivalents are short-term investments with an original maturity of three months or less from the date of purchase and are carried at cost, which approximates fair value. At the end of 20212023 and 2020,2022, checks not yet presented for payment drawn in excess of our bank deposit balances were $74 $62 and $106 and$60. Amounts are included withinin accounts payable on our Consolidated Balance Sheets.
Nordstrom, Inc.Sheets and subsidiaries47
Nordstrom, Inc.
Notes to Consolidated Financial Statements
(Dollar and share amounts in millions except per share, per option and per unit amounts)
Accounts Receivable
Accounts receivable, net primarily includes receivables from TD related to our program agreement, non-Nordstrom-branded credit and debit cards and developer reimbursements. As of February 3, 2024, accounts receivable, net also includes the amount we believe probable of receipt as part of the claims process related to the wind-down of Canada (see Note 2: Canada Wind-down).
Merchandise Inventories
Merchandise inventories are stated at the lower of cost or market value using the retail inventory method. Under the retail method, the valuation of inventories is determined by applying a calculated cost-to-retail ratio to the retail value of ending inventory. The value of our inventory on the balance sheet is thenalso reduced by a charge to cost of sales for retail inventory markdowns taken on the selling price. To determine if the retail value of our inventory should be marked down, we consider current and anticipated demand, customer preferences, age of the merchandise and fashion trends. We record reserves for excess and obsolete inventory based on historical trends and specific identification.
We take physical inventory counts at our stores and Supply Chain Network locations and adjust for differences between recorded amounts and counted amounts. Following each physical inventory cycle and using the most recent physical inventory count and historical results, we record an estimate for shrink based on a percentage of sales until the next physical inventory count.
Leases
We record leases, which consist primarily of operating leases, on the Consolidated Balance Sheets as operating lease ROU assets and operating lease liabilities, both of which include current and noncurrent portions. Operating lease liabilities are initially recognized based on the net present value of the fixed portion of our lease and common area maintenance payments from lease commencement through the lease term. To calculate the net present value, we apply an incremental borrowing rate. The incremental borrowing rate is determined using a portfolio approach based on the rate of interest we would pay to borrow an amount equal to the lease payments on a collateralized basis over a similar term. We use quoted interest rates obtained from financial institutions as an input to derive our incremental borrowing rate as the discount rate for the lease. We recognize ROU assets based on operating lease liabilities reduced by property incentives.incentives received from landlords. We test ROU assets for impairment in the same manner as long-lived assets and exclude the related operating lease liability and operating lease payments in our analysis.
We lease the land, buildings, or land and buildings for many of our stores, office facilities and Supply Chain Network facilities. We also lease equipment
Nordstrom, Inc.
Notes to Consolidated Financial Statements
(Dollar and have service contracts including transportation agreementsshare amounts in millions except per share, per option and warehouse agreements where we control identified assets such as vehicles, warehouse space and equipment and therefore represent embedded leases.per unit amounts)
Land, Property and Equipment
Land is recorded at historical cost, while property and equipment are recorded at cost less accumulated depreciation and amortization. Capitalized software includes the costs of developing or obtaining internal-use software, including external direct costs of materials and services and internal payroll costs related to the software project.
We capitalize interest on construction in progress and software projects during the period in which expenditures have been made, activities are in progress to prepare the asset for its intended use and actual interest costs are being incurred. Depreciation and amortization are computed using the straight-line method over the asset’s estimated useful life, which is determined by asset category as follows: | | | | | |
| Asset | Life (in years) |
| Buildings and improvements | 5 – 40 |
| Store fixtures and equipment | 3 – 15 |
| Leasehold improvements | 5 – 40 |
| Capitalized software | 2 – 7 |
Leasehold improvements and leased property and equipment that are purchased at the inception of the lease, or during the lease term, are amortized over the shorter of the lease term or the asset life. Lease terms include the fixed, non-cancellablenon-cancelable term of a lease, plus any renewal periods determined to be reasonably assured.
Nordstrom, Inc.
Notes to Consolidated Financial Statements
(Dollar and share amounts in millions except per share, per option and per unit amounts)
Long-Lived Assets
When facts and circumstances indicate the carrying values of buildings, equipment and ROU assets may be impaired, we compare the carrying value to the related projected future cash flows, among other quantitative and qualitative analyses. Cash flow analysis requires judgment regarding many factors, such as revenues, growth rates, expenses, capital expenditures and capital expenditures.sublease income. These projections are inherently subject to uncertainties and whileuncertainties. While we believe the inputs and assumptions utilized in our future cash flows are reasonable, our estimates may change in the near term based on our current and future performance. Land, property and equipment are grouped at the lowest level at which there are identifiable cash flows when assessing impairment, while cash flows for our retail store assets are identified at the individual store level.
In 2020,The following table provides details related to asset impairment charges for each fiscal year:
| | | | | | | | | | | | | | |
| 2023 | | 2022 |
| Supply Chain | | Supply Chain | Trunk Club |
Long-lived asset impairment1 | $9 | | | $58 | | $10 | |
Operating lease ROU asset impairment1 | 21 | | | 12 | | — | |
| Asset impairment | $30 | | | $70 | | $10 | |
1 After impairment, the carrying values of the remaining long-lived tangible and ROU assets were not material.
Supply Chain Impairments
During the fourth quarter of 2023 and the third quarter of 2022, as part of our supply chain optimization initiatives, we optimizedincurred a non-cash impairment charge to adjust the carrying values to their estimated fair values for certain supply chain assets. These charges are included in our mixCorporate/Other SG&A expense on the Consolidated Statement of physicalEarnings and digitalin asset impairment on the Consolidated Statement of Cash Flows. We evaluated the assets for impairment by comparing the carrying values to align with longer-term customer trends, we closed 16 Nordstrom stores, 6 the related projected future cash flows, among other quantitative and qualitative analyses. After impairment, the carrying values of the remaining long-lived tangible and ROU assets were not material.
Trunk Club clubhouses and 3 Jeffrey boutiques. InWind-down
During the first quarter of 2022, in conjunction with these closures,the decision to sunset the Trunk Club brand, we incurred non-cash impairment charges on long-lived tangible and ROU assets, primarily associated with the Nordstrom store closures,related to a Trunk Club property to adjust the carrying values to their estimated fair value. The following table provides details related to asset impairment charges as a result of COVID-19:
| | | | | | | |
Fiscal year | 2020 | | | |
Long-lived asset impairment1
| $96 | | | |
Operating lease ROU asset impairment1
| 41 | | | |
Total asset impairment | $137 | | | |
1 As of January 30, 2021, the carrying value of the applicable long-lived and operating lease ROU assets after impairment was $13 and $3.
These charges are primarily included in our Retail segment SG&A expense on the Consolidated Statement of Earnings.Earnings and in asset impairment on the Consolidated Statement of Cash Flows.
Amortization expense for acquired intangibles was $7During the second quarter of 2022, we also incurred additional costs of $8 associated with the wind-down of Trunk Club. These expenses are primarily included in 2019. In 2019,our Retail segment cost of sales and related buying and occupancy costs on the Consolidated Statement of Earnings. All charges are classified as a resultoperating on the Consolidated Statement of the Cash Flows.
Nordstrom, Trunk Club integration, we fully impaired the remaining acquired Inc. and subsidiaries55
Nordstrom, Trunk Club intangible assetInc.
Notes to Consolidated Financial Statements
(Dollar and recorded a loss of $11. No amortization expense was recorded beyond 2019.share amounts in millions except per share, per option and per unit amounts)
Goodwill
Goodwill represents the excess of acquisition cost over the fair value of the related net assets acquired and is not subject to amortization. We review our goodwill annually for impairment, as of the first day of the fourth quarter, or when circumstances indicate that the carrying value may exceed the fair value. We perform this evaluation at the Nordstrom and NordstromRack.com reporting unit level, all withinin our Retail segment. Our goodwill is allocated to two reporting units, Nordstrom and NordstromRack.com. When evaluating these assets for impairment, we may first perform a qualitative assessment to determine whether it is more likely than not that a reporting unit is impaired. If we determine that it is more likely than not that the carrying value exceeds the fair value of the reporting unit, we perform a quantitative fair value test, wheretest. We may also choose to bypass this qualitative assessment and perform the quantitative assessment.
As of February 3, 2024 and January 28, 2023, we had goodwill of $249. To determine fair value, we compare the carrying value of the reporting unit to its estimated fair value, which is based on the expected present value of future cash flows (income approach), comparable public companies and acquisitions (market approach), or a combination of both. Determining fair value using these approaches requires management assumptions, estimations and judgments regarding factors like overall economic conditions, prospective financial information, growth rates, terminal value, discount rates and market multiples. If fair value is lower than the carrying value, an impairment charge is recognized in an amount equal to that excess, limited to the total amount of goodwill allocated to that reporting unit. As of January 29, 2022 and January 30, 2021, we had goodwill of $249. Based on the results of our tests, fair value substantially exceeded carrying value, and we therefore had no goodwill impairment in 2021, 20202023, 2022 or 2019.2021.
Investments
In July 2021,From time to time, we acquired a minority interest in the Topshop, Topman, Miss Selfridge and HIIT brands through a strategic partnership with ASOS.com Ltd. We invest in financial interests of certain private companies and venture capital funds that align with our business and omni-channel strategies, which are recorded in other assets in the Consolidated Balance Sheets and investingproceeds from the sale of assets and other, net on the Consolidated Statements of Cash Flows.
We holdAs of February 3, 2024 and January 28, 2023, we held $41 and $42 of equity interests in certain venture capital funds, which are recorded at fair value using the practical expedient estimate of NAV or its equivalent.
During the first quarter of 2022, in connection with the sale of a limited partnership interest in a corporate office building, that is classified as held forwe recognized a gain of $51 in our Corporate/Other SG&A expense in the Consolidated Statement of Earnings and $73 in proceeds from the sale as we plan to sell our interest within one year. The carrying value of assets and other, net on the interest is not material asConsolidated Statement of January 29, 2022.Cash Flows.
Self-Insurance
We retain a portion of the risk for certain losses related to employee health and welfare, workers’ compensation and other liability claims. Liabilities associated with these losses include undiscounted estimates of both losses reported and losses incurred but not yet reported. We estimate our ultimate cost using an actuarially-based analysis of claims experience, regulatory changes and other relevant factors.
Foreign Currency
Our Canadian operations are comprisedOn March 2, 2023, Nordstrom Canada commenced a wind-down of the Nordstrom.ca website, 6 Nordstrom stores and 7 Nordstrom Rack stores.its business operations. The functional currency of our Canadian operations iswas the Canadian Dollar. We translatePrior to deconsolidation, we translated assets and liabilities into U.S. Dollars using the exchange rate in effect at the balance sheet date, while we translatetranslated revenues and expenses using an average exchange rate for the period. We recordrecorded these translation adjustments as a component of accumulated other comprehensive loss on the Consolidated Balance Sheets. In the first quarter of 2023, we recognized a charge of $33 related to the derecognition of the accumulated comprehensive loss on foreign currency translation (see Note 2: Canada Wind-down).
Reclassification
We reclassified amounts in our fiscal 2022 and 2021 Consolidated Statements of Cash Flows to conform with current period presentation. As a result, we aggregated:
•Accounts receivable, net with prepaid expenses and other assets into other current and noncurrent assets
•Other current liabilities with other liabilities into other current and noncurrent liabilities
•Tax withholding on share-based awards with other financing, net
These reclassifications had no impact on cash flows from operations, cash flows from investing or cash flows from financing.
Recent Accounting Pronouncements
In November 2023, the FASB issued ASU No. 2023-07, Segment Reporting (Topic 280): Improvements to Reportable Segment Disclosures, which requires additional quarterly and annual reportable segment disclosures, primarily around significant segment expenses. Annual disclosure requirements will be effective for us for the fourth quarter of 2024, and quarterly disclosure requirements will be effective for us in the first quarter of 2025, with early adoption permitted. We are currently evaluating the impact of this ASU on our disclosures.
Nordstrom, Inc.
Notes to Consolidated Financial Statements
(Dollar and share amounts in millions except per share, per option and per unit amounts)
In December 2023, the FASB issued ASU 2023-09, Income Taxes (Topic 740): Improvements to Income Tax Disclosures, which requires disclosure of additional income tax information, primarily related to the rate reconciliation and income taxes paid. Annual disclosure requirements will be effective for us for the fourth quarter of 2025, with early adoption permitted. We are currently evaluating the impact of this ASU on our disclosures.
NOTE 2: CANADA WIND-DOWN
Background
On March 2, 2023, as part of our initiatives to drive long-term profitable growth and enhance shareholder value, and after careful consideration of all reasonably available options, we announced the decision to discontinue support for Nordstrom Canada’s operations. Accordingly, Nordstrom Canada commenced a wind-down of its business operations, obtaining an Initial Order from the Ontario Superior Court of Justice under the CCAA on March 2, 2023 to facilitate the wind-down in an orderly fashion. Nordstrom Canada’s e-commerce platform ceased operations on March 2, 2023 and the closure of six Nordstrom and seven Nordstrom Rack stores was completed in June 2023. Significant developments in the case, including a creditor vote to approve a Plan of Compromise and Arrangement and a court hearing to sanction that plan and authorize its implementation are scheduled to occur in the first quarter of 2024. Distributions to creditors, including distributions to Nordstrom, Inc. as a creditor of Nordstrom Canada, are expected to be substantially complete by the end of 2024.
The Ontario Superior Court of Justice has appointed a monitor to oversee the wind-down process. Subsequent to the CCAA filing, Nordstrom has been providing limited support to Nordstrom Canada for the purpose of supporting an orderly wind-down, including providing shared services and temporary use of intellectual property.
Wind-down Charges and Deconsolidation of Nordstrom Canada
The following table details the pre-tax charges associated with the wind-down of operations in Canada:
| | | | | |
| Fiscal year | 2023 |
Loss on Canada write-off1 | $176 | |
Accumulated translation loss reclassified to earnings1 | 33 | |
| Contingent liabilities | 70 | |
Other exit costs2 | 5 | |
| Total pre-tax charges | $284 | |
| |
1 Non-cash amounts are included in Canada wind-down costs on the Consolidated Statement of Cash Flows.
2 Other exit costs include funding an employee trust, net of expected recoveries, and professional fees.
These charges are primarily included in Corporate/Other in Note 15: Segment Reporting. The decrease in cash due to the deconsolidation of Nordstrom Canada is included in investing activities on the Consolidated Statement of Cash Flows and all other impacts are included in operating cash flows.
Loss on Canada Write-off and Accumulated Translation Loss
While Nordstrom continues to own 100% of the shares of Nordstrom Canada, as of March 2, 2023, the date of the CCAA filing, we no longer have a controlling interest under GAAP and have deconsolidated Nordstrom Canada. We hold a variable interest in the Nordstrom Canada entities, which are considered variable interest entities, but are not consolidated, as we are no longer the primary beneficiary.
For the year ended February 3, 2024, we recorded a pre-tax loss on Canada write-off of $176 that included the derecognition of Nordstrom Canada’s assets and liabilities and the write-down of both our Nordstrom Canada investment and related-party receivables to estimated fair value. In addition, we recognized a charge of $33 related to the derecognition of the accumulated comprehensive loss on foreign currency translation.
To assess the estimated fair value of our Nordstrom Canada investment and our related-party receivables, we estimated the assets available for distribution in relation to expected claims. At the time of filing for CCAA protection on March 2, 2023, the estimated amount of Nordstrom Canada’s liabilities exceeded the estimated fair value of assets available for distribution to creditors, and we believed we would not recover a significant portion of our receivables. As a result, our fair value was recorded as zero in our Condensed Consolidated Balance Sheets as of April 29, 2023. As of February 3, 2024, we adjusted our receivables by an immaterial amount based on currently available information.
Nordstrom, Inc. and subsidiaries 4957
Nordstrom, Inc.
Notes to Consolidated Financial Statements
(Dollar and share amounts in millions except per share, per option and per unit amounts)
Prior to deconsolidation, Nordstrom made loans to the Canadian subsidiaries and incurred liabilities related to certain intercompany charges. These were considered intercompany transactions and were eliminated in consolidation of Nordstrom. Subsequent to deconsolidation, these liabilities and receivables were no longer eliminated through consolidation, are considered related-party transactions and are recorded in our Consolidated Balance Sheets at estimated fair value. As of February 3, 2024, Nordstrom had a net outstanding liability to Nordstrom Canada of $52 related to certain intercompany charges incurred prior to deconsolidation.
Contingent Liabilities and Guarantees
In addition,the third quarter of 2023, Nordstrom, Inc. reached a settlement with former landlords related to guarantees of certain lease obligations of Nordstrom Canada. As part of the agreements, we made cash payments to the former landlords in exchange for a release of substantially all our U.S.guarantee obligations, as well as the right to these landlords’ distributions from Nordstrom Canada as part of the CCAA proceedings.
Employee Trust
In connection with the filing, Nordstrom contributed $11 to establish an employee trust to fund termination and severance payments to employees of Nordstrom Canada. As of February 3, 2024, the trust has been terminated.
Debtor-in-Possession Financing
If needed, Nordstrom has agreed to provide Nordstrom Canada debtor-in-possession financing up to $11. However, we believe Nordstrom Canada has sufficient liquidity to sustain operations incur certain expenditures denominatedthrough the wind-down period and therefore it is not likely that any amounts would need to be borrowed from Nordstrom. As of February 3, 2024, there were no outstanding borrowings.
Estimates
As of February 3, 2024, we recorded $71 in Canadian Dollarsaccounts receivable, net on the Consolidated Balance Sheets to reflect the amount we believe probable of receipt as part of the claims process. This includes receipts related to the rights to the former landlords’ distributions, reimbursement of employee trust contributions and other receivables existing at the time of deconsolidation. The receivable and our Canadian operations incur certain expenditures denominated in U.S. Dollars. This activity results in transaction gainsother estimates are dependent on the outcome of the Nordstrom Canada wind-down process, including the amount of third-party and losses that arise from exchange rate fluctuations, which are recorded as gains or lossesNordstrom claims asserted and recognized in the Consolidated Statementsclaims process, the amount of Earnings.
Reclassification
We reclassified our fiscal 2020assets available for distribution and 2019 Consolidated Statementsthe approval of Cash Flowsthe CCAA plan of arrangement by the Ontario Superior Court of Justice, which we expect to conform with current period presentation. To adjust our net loss to reconcile to operating activity cash flows, we present depreciation and amortization separate from other, net, which includes the “make-whole” premiumhave updated information on in the first quarter of 2021 (see Note 5: Debt2024. We continue to work through the wind-down process and Credit Facilities).
NOTE 2: REVENUE
Contract Liabilities
Contract liabilities represent our obligation to transfer goods or services to customers and include deferred revenue for The Nordy Club (including points and Nordstrom Notes) and gift cards. Our contract liabilities are classified as current on the Consolidated Balance Sheets and are as follows:
| | | | | |
| Contract Liabilities |
Balance as of February 1, 2020 | $576 | |
Balance as of January 30, 2021 | 478 | |
Balance as of January 29, 2022 | 478 | |
Revenues recognized from our beginning contract liability balance were $244 and $261 for the years ended January 29, 2022 and January 30, 2021.
Disaggregation of Revenue
The following table summarizes our disaggregated net sales: | | | | | | | | | | | | | | | | | |
| Fiscal year | 2021 | | 2020 | | 2019 |
| Nordstrom | $9,640 | | $6,997 | | $9,943 |
| Nordstrom Rack | 4,762 | | 3,360 | | 5,189 |
| Total net sales | $14,402 | | $10,357 | | $15,132 |
| | | | | |
| Digital sales as a % of total net sales | 42% | | 55% | | 33% |
The following table summarizes the percentestimates of net sales by merchandise category: | | | | | | | | | | | | | | | | | |
| Fiscal year | 2021 | | 2020 | | 2019 |
| Women’s Apparel | 28% | | 29% | | 31% |
| Shoes | 25% | | 26% | | 24% |
| Women’s Accessories | 14% | | 14% | | 11% |
| Men’s Apparel | 14% | | 12% | | 16% |
| Beauty | 12% | | 12% | | 11% |
| Kids’ Apparel | 4% | | 4% | | 4% |
| Other | 3% | | 3% | | 3% |
| Total net sales | 100% | | 100% | | 100% |
| | | | | |
Income Taxes
For the year ended February 3, 2024, we recognized net tax benefits of $95 primarily related to the write-off of our investment in Canada, net of tax expense related to an increase in valuation allowance for Canada deferred tax assets.
Nordstrom, Inc.
Notes to Consolidated Financial Statements
(Dollar and share amounts in millions except per share, per option and per unit amounts)
NOTE 3: REVENUE
Contract Liabilities
Contract liabilities represent our obligation to transfer goods or services to customers and include deferred revenue for The Nordy Club (including points and Nordstrom Notes), gift cards and our amended 2022 TD program agreement. Our contract liabilities are classified on the Consolidated Balance Sheets as follows:
| | | | | | | | |
| Other current liabilities | Other liabilities |
| Balance as of January 29, 2022 | $478 | | $— | |
| Balance as of January 28, 2023 | 536 | | 136 | |
| Balance as of February 3, 2024 | 508 | | 85 | |
Contract liabilities increased during 2022 primarily as a result of deferred revenue recorded in connection with our amended 2022 TD program agreement. Revenues recognized from our beginning contract liability balance were $316 and $265 for the years ended February 3, 2024 and January 28, 2023.
Disaggregation of Revenue
The following table summarizes our disaggregated net sales: | | | | | | | | | | | |
| Fiscal year | 2023 | 2022 | 2021 |
| Nordstrom | $9,436 | $10,279 | $9,640 |
| Nordstrom Rack | 4,783 | 4,813 | 4,762 |
| Total net sales | $14,219 | $15,092 | $14,402 |
| | | |
| Digital sales as a % of total net sales | 36% | 38% | 42% |
The following table summarizes the percent of net sales by merchandise category: | | | | | | | | | | | |
| Fiscal year | 2023 | 2022 | 2021 |
| Women’s Apparel | 27% | 28% | 28% |
| Shoes | 26% | 26% | 25% |
| Men’s Apparel | 15% | 15% | 14% |
| Beauty | 13% | 12% | 12% |
| Accessories | 12% | 13% | 14% |
| Kids’ Apparel | 4% | 3% | 4% |
| Other | 3% | 3% | 3% |
| Total net sales | 100 | % | 100 | % | 100 | % |
Nordstrom, Inc. and subsidiaries59
Nordstrom, Inc.
Notes to Consolidated Financial Statements
(Dollar and share amounts in millions except per share, per option and per unit amounts)
NOTE 3:4: LAND, PROPERTY AND EQUIPMENT
Land, property and equipment consist of the following: | | | | | | | | | | | |
| January 29, 2022 | | January 30, 2021 |
| Land and land improvements | $285 | | | $285 | |
| Buildings and building improvements | 1,338 | | | 1,446 | |
| Leasehold improvements | 3,350 | | | 3,212 | |
| Store fixtures and equipment | 4,038 | | | 3,993 | |
| Capitalized software | 1,915 | | | 1,724 | |
| Construction in progress | 373 | | | 231 | |
| Land, property and equipment | 11,299 | | | 10,891 | |
| Less: accumulated depreciation and amortization | (7,737) | | | (7,159) | |
| Land, property and equipment, net | $3,562 | | | $3,732 | |
Our net non-cash investing activities primarily related to Nordstrom NYC and our Supply Chain Network capital expenditure accruals and resulted in a (decrease) increase to accounts payable of ($48) and $60 in 2020 and 2019. | | | | | | | | |
| February 3, 2024 | January 28, 2023 |
| Land and land improvements | $283 | | $288 | |
| Buildings and building improvements | 1,365 | | 1,352 | |
| Leasehold improvements | 3,103 | | 3,389 | |
| Store fixtures and equipment | 3,873 | | 4,138 | |
| Capitalized software | 2,439 | | 2,151 | |
| Construction in progress | 365 | | 322 | |
| Land, property and equipment | 11,428 | | 11,640 | |
| Accumulated depreciation and amortization | (8,251) | | (8,289) | |
| Land, property and equipment, net | $3,177 | | $3,351 | |
NOTE 4:5: LEASES
We lease the land, buildings, or land and buildings for many of our stores, office facilities and Supply Chain Network facilities, as well as equipment. The following table summarizes the majority of our fixed, non-cancellablenon-cancelable lease terms are 15 to 30 years for Nordstrom stores, approximately 10 years for Nordstrom Rack stores and 5 to 20 years for office facilities and Supply Chain Network facilities. terms: | | | | | |
| Property Type | Lease Term (in years) |
| Nordstrom stores | 15 – 30 |
| Nordstrom Rack stores | Approximately 10 |
| Office and Supply Chain Network facilities | 5 – 20 |
Many of our leases include options that allow us to extend the lease term beyond the initial commitment period. At the commencement of a lease, we generally include only the initial lease term as we have determined that options to extend are not reasonably certain to occur. The exercise of lease renewal options is generally at our sole discretion. At the renewal of an expiring lease, we reassess our options in the agreement and include all reasonably certain extensions in the measurement of our lease term.
Most of our leases also require weus to pay certain expenses, such as common area maintenance charges, real estate taxes and other executory costs, the fixed portion of which is included in Operating Lease Cost.Cost, as we combine lease and non-lease components. We recognize Operating Lease Cost, which is primarily included in occupancy costs, on a straight-line basis over the lease term. Variable lease cost includes payments for variable common area maintenance charges and additional payments based on a percentage of sales, which are recognized when probable. Our lease agreements do not contain any material residual value guarantees or material restrictive covenants.
The following table summarizes the components of lease cost: | | Fiscal year | Fiscal year | 2021 | 2020 | Fiscal year | 2023 | 2022 | 2021 |
| Operating Lease Cost | Operating Lease Cost | $265 | | $263 | |
Variable lease cost1 | Variable lease cost1 | 100 | | 100 | |
| Sublease income | Sublease income | (20) | | (19) | |
| Total lease cost, net | Total lease cost, net | $345 | | $344 | |
1 Variable lease cost includes short-term lease cost, which was immaterial in 20212023, 2022 and 2020.2021.
Nordstrom, Inc. and subsidiaries5160
Nordstrom, Inc.
Notes to Consolidated Financial Statements
(Dollar and share amounts in millions except per share, per option and per unit amounts)
The following table summarizes future lease payments as of January 29, 2022:February 3, 2024: | | Fiscal year | Fiscal year | | Operating Leases |
| 2022 | | $320 | |
| 2023 | | 339 | |
| Fiscal year | |
| Fiscal year | | | | Operating Leases |
| 2024 | 2024 | | 294 | |
| 2025 | 2025 | | 246 | |
| 2026 | 2026 | | 201 | |
| 2027 | |
| 2028 | |
| Thereafter | Thereafter | | 841 | |
Total lease payments1 | Total lease payments1 | | 2,241 | |
| | Less: amount representing interest | | (443) | |
| Amount representing interest | |
| Amount representing interest | |
| Amount representing interest | |
Present value of net lease payments2 | Present value of net lease payments2 | | $1,798 | |
1 Total lease payments do not include payments for variable lease costs that are required by most of our lease agreements and are based on a percentage of sales.agreements.
2 TotalNet lease payments exclude $46$139 of lease payments for operating leases that were signed but not yet commenced as of January 29, 2022.
The following table includes supplemental information: | | Fiscal year | Fiscal year | 2021 | 2020 | Fiscal year | 2023 | 2022 | 2021 |
| Cash paid related to operating lease liabilities | Cash paid related to operating lease liabilities | $371 | | $332 | |
| Operating lease interest | Operating lease interest | 87 | | 95 | |
| | Operating lease liabilities arising from lease agreements | Operating lease liabilities arising from lease agreements | 137 | | 79 | |
| | | January 29, 2022 | January 30, 2021 |
| | February 3, 2024 | |
| | February 3, 2024 | |
| | February 3, 2024 | | January 28, 2023 |
| Weighted-average remaining lease term | Weighted-average remaining lease term | 9 years | 9 years | Weighted-average remaining lease term | | 8 years | 8 years |
| Weighted-average discount rate | Weighted-average discount rate | 4.7 | % | 4.7 | % | Weighted-average discount rate | | 5.5 | % | 4.9 | % |
NOTE 5:6: DEBT AND CREDIT FACILITIES
Debt
A summary of our long-term debt is as follows: | | January 29, 2022 | | January 30, 2021 |
| February 3, 2024 | | | February 3, 2024 | January 28, 2023 |
| | Long-term debt, net of unamortized discount: | Long-term debt, net of unamortized discount: | |
| | Senior notes, 4.00%, due October 2021 | $— | | | $500 | |
| | Long-term debt, net of unamortized discount: | |
| | Long-term debt, net of unamortized discount: | |
| | Senior notes, 2.30%, due April 2024 | Senior notes, 2.30%, due April 2024 | 250 | | | — | |
| Secured Notes, 8.75%, due May 2025 | — | | | 600 | |
| | Senior notes, 2.30%, due April 2024 | |
| | Senior notes, 2.30%, due April 2024 | |
| Senior notes, 4.00%, due March 2027 | Senior notes, 4.00%, due March 2027 | 349 | | | 349 | |
| Senior debentures, 6.95%, due March 2028 | Senior debentures, 6.95%, due March 2028 | 300 | | | 300 | |
| Senior notes, 4.375%, due April 2030 | Senior notes, 4.375%, due April 2030 | 500 | | | 500 | |
| Senior notes, 4.25%, due August 2031 | Senior notes, 4.25%, due August 2031 | 425 | | | — | |
| Senior notes, 7.00%, due January 2038 | Senior notes, 7.00%, due January 2038 | 147 | | | 147 | |
Senior notes, 5.00%, due January 20441 | Senior notes, 5.00%, due January 20441 | 903 | | | 900 | |
| Deferred bond issuance costs | Deferred bond issuance costs | (21) | | | (27) | |
| Total long-term debt | Total long-term debt | 2,853 | | | 3,269 | |
| | Less: current portion | — | | | (500) | |
| Current portion of debt | |
| Current portion of debt | |
| Current portion of debt | |
| Total due beyond one year | Total due beyond one year | $2,853 | | | $2,769 | |
|
1 The unamortized discount on these notes was $63$57 and $66$61 as of January 29, 2022February 3, 2024 and January 30, 2021.28, 2023.
52Nordstrom, Inc. and subsidiaries61
Nordstrom, Inc.
Notes to Consolidated Financial Statements
(Dollar and share amounts in millions except per share, per option and per unit amounts)
Required principal payments on long-term debt are as follows: | Fiscal year1 | Fiscal year1 | |
| 2022 | $— | |
| 2023 | — | |
| 2024 | |
| 2024 | |
| 2024 | 2024 | 250 | |
| 2025 | 2025 | — | |
| 2026 | 2026 | — | |
| 2027 | |
| 2028 | |
| Thereafter | Thereafter | 2,689 | |
1 Required principal payments exclude estimated future interest payments of $1,799$1,519 as of January 29, 2022,February 3, 2024, with $144$136 payable within one year.
During the first quarter of 2021, we issued $250 aggregate principal amount of 2.30% senior notes due April 2024 and $425 aggregate principal amount of 4.25% senior notes due August 2031. These notes are unsecured and can be redeemed at any time in whole or in part. The April 2024 notes can be redeemed at par starting in April 2022. With the net proceeds of these new notes, together with cash on hand, we retired our $600 Secured Notes. We recordedrecorded $88 related to the redemption in interest expense, net, which primarily consisted of a one-time payment of $78 for a “make-whole”“make-whole” premium, and the write-off of unamortized balances associated with the debt discount and issuance costs. The “make-whole” premium payment was not included in cash paid during the period for interest, net of capitalized interest in the Supplemental Cash Flow Information. As a result of this redemption, all our outstanding long-term debt is unsecured and all real estate is unencumbered.
During the second quarter of 2021, we retired our 4.00% senior notes that were due October 2021 using cash on hand.
Interest Expense
The components of interest expense, net are as follows: | | Fiscal year | Fiscal year | 2021 | | 2020 | | 2019 | Fiscal year | 2023 | 2022 | 2021 |
| Interest on long-term debt and short-term borrowings | Interest on long-term debt and short-term borrowings | $258 | | | $199 | | | $151 | |
| Less: | |
| | Interest income | |
| Interest income | |
| Interest income | Interest income | (1) | | | (3) | | | (10) | |
| Capitalized interest | Capitalized interest | (11) | | | (15) | | | (39) | |
| Interest expense, net | Interest expense, net | $246 | | | $181 | | | $102 | |
Credit Facilities
During the first quarter of 2021,On March 1, 2023, we amended our Revolver. UnderRevolver originally dated May 6, 2022. Prior to this amendment, Nordstrom Canada Retail, Inc. was a loan party under the Revolver and the obligations under the Revolver were secured, in part, by the assets of this subsidiary. As a result of this amendment, Nordstrom Canada Retail, Inc. was removed as a loan party and obligations under the Revolver are no longer secured by these assets. In addition, this amendment excludes as subsidiaries or affiliates all Nordstrom Canada entities and carves out certain CCAA-related expenses and obligations from financial covenants under the Revolver.
As of February 3, 2024 and January 28, 2023, we are in a “Collateral Period” if our Leverage Ratio is greater than 4 or our unsecured debt is rated below BBB- with a stable outlook at Standard & Poor’s or Baa3 with a stable outlook at Moody’s. In the Collateral Period, anyhad no outstanding borrowings under ourthe Revolver will bethat expires in May 2027. Our short-term borrowing capacity was reduced by $30 to $770 as a result of issuing a standby letter of credit in the fourth quarter of 2023. Provided that we obtain written consent from the lenders, we have the option to increase the Revolver by up to $200, to a total of $1,000, and two options to extend the Revolver for additional one-year terms.
Any outstanding borrowings under the Revolver are secured by substantially all our personal and intellectual property assets and are guaranteed by certain of our subsidiaries. Under the Revolver, our obligation to secure any outstanding borrowings will be eliminated if no default exists and we willeither have an unsecured investment-grade debt rating from two of three specified ratings agencies, or we have one investment-grade rating and achieve two consecutive fiscal quarters with a Leverage Ratio of less than 2.5 times.
Under the Revolver, we have two financial covenant tests that need to be subject to asset coverage and minimum liquidity covenants, as well asmet on a fixed charge coverage covenant. If ourquarterly basis: a Leverage Ratio that is less than or equal to 4 times and our unsecured debta fixed charge coverage ratio that is rated atgreater than or above BBB- with a stable outlook at Standard & Poor’s and Baa3 with a stable outlook at Moody’s, any borrowings under our Revolver will be unsecured, we will not be subjectequal to the above covenants and the restrictions on dividend payments and share repurchases will be removed.1.25 times. As of January 29, 2022,February 3, 2024, we were in a Collateral Period since we did not meet or exceed our credit rating threshold. We were in compliance with all our Revolver covenants.
UnderThe Revolver contains customary representations, warranties, covenants and terms, including paying a variable rate of interest and a facility fee based on our debt rating, and is available for working capital, capital expenditures and general corporate purposes. The Revolver amendment, we created flexibility forallows us to issue dividends and share repurchases during the Collateral Period,repurchase shares provided we are not in default and no default or event of default existswould arise as a result of such payments,payments. If the pro-forma Leverage Ratio as of the most recent fiscal quarterafter such payments is less than 3.75, pro-forma liquidity at the date of3 times, then such payments are unlimited. If the pro-forma Leverage Ratio is at least $600, and the amount of such payments does not exceed the amount of the correspondinggreater than or equal to 3 times but less than 3.5 times, then we are limited to $100 per fiscal quarter of 2019. Additionally,and if the “make-whole” premium and unamortized deferred bond issuance costs related to the redemption of the Secured Notes are excluded from the Revolver amendment’s definition of interest expense. As of January 29, 2022, ourpro-forma Leverage Ratio was lessis greater than 3.75, thus we metor equal to 3.5 times, then the requirements under our Revolver amendment to pay dividends or repurchase shares.
The Revolver expires in September 2023 and any outstanding borrowings are classified in total current liabilities on the Consolidated Balance Sheets. In 2021, we borrowed $200 under our Revolver in the first quarter, which was fully repaid in the second quarter, and borrowed an additional $200 in the third quarter, which was fully repaid in the fourthlimit is $60 per fiscal quarter. As of January 29, 2022 and January 30, 2021, we had no borrowings outstanding under our Revolver.
Nordstrom, Inc. and subsidiaries5362
Nordstrom, Inc.
Notes to Consolidated Financial Statements
(Dollar and share amounts in millions except per share, per option and per unit amounts)
The Revolver contains customary representations, warranties, covenants and terms, including paying a variable rate of interest and a commitment fee based on our debt rating, and is available for working capital, capital expenditures and general corporate purposes. Provided that we obtain written consent from our lenders, we have the option to increase the Revolver by up to $200, to a total of $1,000, and 2 options to extend the Revolver by one year.
Our $800 commercial paper program allows us to use the proceeds to fund operating cash requirements. Under the terms of the commercial paper agreement, we pay a rate of interest based on, among other factors, the maturity of the issuance and market conditions. The issuance of commercial paper has the effect of reducing available liquidity under the Revolver by an amount equal to the principal amount of commercial paper outstanding. Conversely, borrowings under our Revolver have the effect of reducing the available capacity of our commercial paper program by an amount equal to the amount outstanding. As of January 29, 2022February 3, 2024 and January 30, 2021,28, 2023, we had no issuances outstanding under our commercial paper program.
NOTE 6:7: FAIR VALUE MEASUREMENTS
We disclose our financial assets and liabilities that are measured at fair value in our Consolidated Balance Sheets by level within the fair value hierarchy as defined by applicable accounting standards:
Level 1: Quoted market prices in active markets for identical assets or liabilities
Level 2: Other observable market-based inputs or unobservable inputs that are corroborated by market data
Level 3: Unobservable inputs that cannot be corroborated by market data that reflect the reporting entity’s own assumptions
Financial Instruments Measured at Carrying Value
Financial instruments measured at carrying value on a recurring basis include cash and cash equivalents, accounts receivable, accounts payable and our Revolver, which approximate fair value due to their short-term nature.
Long-term debt is recorded at carrying value. If long-term debt was measured at fair value, we would use quoted market prices of the same or similar issues, which is considered a Level 2 fair value measurement. The following table summarizes the carrying value and fair value estimate of our long-term debt, including current maturities: | | | | | | | | | | | |
| January 29, 2022 | | January 30, 2021 |
| Carrying value of long-term debt | $2,853 | | | $3,269 | |
| Fair value of long-term debt | 2,758 | | | 3,430 | |
Non-financial Assets Measured at Fair Value on a Nonrecurring Basis | | | | | | | | |
| February 3, 2024 | January 28, 2023 |
| Carrying value of long-term debt | $2,862 | | $2,856 | |
| Fair value of long-term debt | 2,441 | | 2,278 | |
We also measure certain non-financial assetsitems at fair value on a nonrecurring basis, primarily goodwill, and long-lived tangible and ROU assets, in connection with periodic evaluations for potential impairment. We estimate the fair value of these assets using primarily unobservable inputs and, as such, these are considered Level 3 fair value measurements. There were no material impairment charges for these assets for the year ended January 29, 2022. For more information regarding long-lived tangible and ROU asset impairment charges, for the year ended January 30, 2021, see Note 1: Nature of Operations and Summary of Significant Accounting Policies.
During the year ended February 3, 2024, we measured our investment in Nordstrom Canada, our related-party receivables and related lease guarantees at fair value (see Note 2: Canada Wind-down).
Investments Measured at NAV
We have certain investments that are measured at fair value using the NAV per share, or its equivalent, as a practical expedient. This class of investments consists of partnership interests that mainly invest in venture capital strategies with a focus on privately held consumer and technology companies. The NAV is based on the fair value of the underlying net assets owned by the fund and the relative interest of each participating investor in the fair value of the underlying assets. Our interest in these partnerships is generally not redeemable and is subject to significant restrictions regarding transfers. Distributions from each fund will be received as the underlying assets of the funds are liquidated. Liquidation is triggered by clauses within the partnership agreements or at the funds’ stated end date. The contractual terms of the partnership interests range from six to ten years. For more information regarding investments measured at NAV, see Note 1: Nature of Operations and Summary of Significant Accounting Policies.
NOTE 7:8: SELF-INSURANCE
Our self-insurance reserves are summarized as follows: | | January 29, 2022 | | January 30, 2021 |
| February 3, 2024 | | | February 3, 2024 | January 28, 2023 |
| Workers’ compensation | Workers’ compensation | $77 | | | $74 | |
| Employee health and welfare | Employee health and welfare | 28 | | | 25 | |
| Other liability | Other liability | 20 | | | 15 | |
| Total self-insurance reserve | $125 | | | $114 | |
| Total self-insurance reserves | |
We are self-insured for the majority of our workers’ compensation programs, employee health and welfare coverage and other liability.
Our workers’ compensation policies have a retention per claim of $1 or less and no policy limits. Approximately 25% of our workers’ compensation obligations are payable within one year. In connection with our workers’ compensation programs, we have standby letters of credit issued on our behalf with $13 available and $2 outstanding as of January 29, 2022. These letters of credit are not reflected in our Consolidated Balance Sheets.
Our employee health and welfare programs do not use stop-loss coverage and participants contribute to the cost of their coverage through premiums and out-of-pocket expenses for deductibles, co-pays and co-insurance.
54Nordstrom, Inc. and subsidiaries63
Nordstrom, Inc.
Notes to Consolidated Financial Statements
(Dollar and share amounts in millions except per share, per option and per unit amounts)
Our workers’ compensation policies have a retention per claim of $1 or less and no policy limits. Approximately 30% of our workers’ compensation obligations are payable within one year. In connection with our workers’ compensation programs, we have a standby letter of credit issued on our behalf with $13 available and $2 outstanding as of February 3, 2024. This letter of credit is not reflected in our Consolidated Balance Sheets.
Our employee health and welfare programs do not use stop-loss coverage and participants contribute to the cost of their coverage through premiums and out-of-pocket expenses for deductibles, copays and coinsurance.
Other liability primarily includes commercial general liability obligations. Our commercial general liability policy, with a limit up to $101,$111, has a retention per claim of $3$1 or less. Approximately 75%50% of our other liability reserve obligations are payable within one year. Beginning in 2021, we no longer carry an employment practices liability policy.
NOTE 8:9: SUPPLEMENTAL EXECUTIVE RETIREMENT PLAN
We have a SERP, which provides retirement benefits to certain officers and select employees. The SERP has different benefit levels depending on the participant’s role. At the end of 2021,2023, we had 57 participants in the plan, including 8five officers and select employees eligible for SERP benefits, 4647 retirees and 3five beneficiaries. This plan is non-qualifiednonqualified and does not have a minimum funding requirement. We selected the measurement date of January 31, the calendar month end closest to our fiscal year end, to value our SERP.
Benefit ObligationsObligation and Funded Status
Our benefit obligation and funded status is as follows: | | January 29, 2022 | | January 30, 2021 |
| February 3, 2024 | | | February 3, 2024 | January 28, 2023 |
| Change in benefit obligation: | Change in benefit obligation: | |
| Benefit obligation at beginning of year | |
| Benefit obligation at beginning of year | |
| Benefit obligation at beginning of year | Benefit obligation at beginning of year | $229 | | | $224 | |
| Participant service cost | Participant service cost | 2 | | | 2 | |
| Interest cost | Interest cost | 5 | | | 6 | |
| Benefits paid | Benefits paid | (10) | | | (10) | |
Actuarial (gain) loss | (14) | | | 7 | |
| Actuarial gain | |
| | Benefit obligation at end of year | Benefit obligation at end of year | 212 | | | 229 | |
| Benefit obligation at end of year | |
| Benefit obligation at end of year | |
| Change in plan assets: | Change in plan assets: | |
| Fair value of plan assets at beginning of year | |
| Fair value of plan assets at beginning of year | |
| Fair value of plan assets at beginning of year | Fair value of plan assets at beginning of year | — | | | — | |
| Employer contribution | Employer contribution | 10 | | | 10 | |
| Benefits paid | Benefits paid | (10) | | | (10) | |
| Fair value of plan assets at end of year | Fair value of plan assets at end of year | — | | | — | |
| Underfunded status at end of year | Underfunded status at end of year | ($212) | | | ($229) | |
The accumulated benefit obligation, which is the present value of benefits, assuming no future compensation changes, was $211$168 and $227$175 at the end of 20212023 and 2020.2022. Amounts recognized as liabilities in the Consolidated Balance Sheets consist of the following: | | January 29, 2022 | | January 30, 2021 |
| February 3, 2024 | | | February 3, 2024 | January 28, 2023 |
| Accrued salaries, wages and related benefits | Accrued salaries, wages and related benefits | $11 | | | $11 | |
| Other liabilities (noncurrent) | Other liabilities (noncurrent) | 201 | | | 218 | |
| Net amount recognized | Net amount recognized | $212 | | | $229 | |
Components of SERP Expense
The components of SERP expense recognized in SG&A expense on the Consolidated Statements of Earnings are as follows: | | | | | | | | | | | | | | | | | |
| Fiscal year | 2021 | | 2020 | | 2019 |
| Participant service cost | $2 | | | $2 | | | $2 | |
| Interest cost | 5 | | | 6 | | | 7 | |
| Amortization of net loss and other | 8 | | | 9 | | | 1 | |
| Total SERP expense | $15 | | | $17 | | | $10 | |
Accumulated Other Comprehensive Loss
Amounts recognized in accumulated other comprehensive loss (pre-tax) consist of the following:
| | | | | | | | | | | | | | | | | |
| 2021 | | 2020 | | 2019 |
| Actuarial (gain) loss | (14) | | | 7 | | | 34 | |
| Amortization of net loss and other | (8) | | | (9) | | | (1) | |
| Total recognized in accumulated other comprehensive loss | ($22) | | | ($2) | | | $33 | |
| | | | | | | | | | | |
| Fiscal year | 2023 | 2022 | 2021 |
| Participant service cost | $1 | | $2 | | $2 | |
| Interest cost | 9 | | 6 | | 5 | |
| Amortization of net loss and other | — | | 4 | | 8 | |
| Total SERP expense | $10 | | $12 | | $15 | |
Nordstrom, Inc. and subsidiaries5564
Nordstrom, Inc.
Notes to Consolidated Financial Statements
(Dollar and share amounts in millions except per share, per option and per unit amounts)
Accumulated Other Comprehensive Gain (Loss)
Amounts recognized in accumulated other comprehensive gain (loss) (pre-tax) consist of the following:
| | | | | | | | | | | |
| Fiscal year | 2023 | 2022 | 2021 |
| Actuarial gain | ($7) | | ($34) | | ($14) | |
| Amortization of net loss and other | — | | (4) | | (8) | |
| Amounts recognized in accumulated other comprehensive gain (loss) | ($7) | | ($38) | | ($22) | |
Assumptions
Weighted-average assumptions used to determine our benefit obligation and SERP expense are as follows: | | Fiscal year | Fiscal year | 2021 | | 2020 | | 2019 | Fiscal year | 2023 | 2022 | 2021 |
| Assumptions used to determine benefit obligation: | Assumptions used to determine benefit obligation: | |
| Discount rate | Discount rate | 3.19 | % | | 2.62 | % | | 2.97 | % |
| Discount rate | |
| Discount rate | | 5.27 | % | 4.95 | % | 3.19 | % |
| Rate of compensation increase | Rate of compensation increase | 2.50 | % | | 2.50 | % | | 2.50 | % | Rate of compensation increase | 2.50 | % | 2.50 | % | 2.50 | % |
| Assumptions used to determine SERP expense: | Assumptions used to determine SERP expense: | |
| Discount rate | Discount rate | 2.62 | % | | 2.97 | % | | 4.27 | % |
| Discount rate | |
| Discount rate | | 4.95 | % | 3.19 | % | 2.62 | % |
| Rate of compensation increase | Rate of compensation increase | 2.50 | % | | 2.50 | % | | 2.50 | % | Rate of compensation increase | 2.50 | % | 2.50 | % | 2.50 | % |
|
Future Benefit Payments and Contributions
As of January 29, 2022,February 3, 2024, the expected future benefit payments based upon the assumptions described above and including benefits attributable to estimated future employee service are as follows: | | Fiscal year | Fiscal year | |
| 2022 | $11 | |
| 2023 | 12 | |
| 2024 | |
| 2024 | |
| 2024 | 2024 | 12 | |
| 2025 | 2025 | 12 | |
| 2026 | 2026 | 12 | |
| 2027 – 2031 | 61 | |
| 2027 | |
| 2028 | |
| 2029 – 2033 | |
| Thereafter | Thereafter | 92 | |
NOTE 9: 401(K) PLAN
We provide a 401(k) plan for our employees that allows for employee elective contributions and our matching contributions. Employee elective contributions are funded through voluntary payroll deductions. Beginning January 1, 2021, the Company contributes a matching percentage of employee contributions to the Plan. Prior to January 1, 2021, the Plan allowed for discretionary Company contributions funded in an amount determined by our Board of Directors each year.
Total expenses related to Company contributions were $67 and $85 in 2021 and 2019 and were included in both buying and occupancy costs and SG&A expenses on our Consolidated Statements of Earnings. In 2020, due to COVID-19 and the steps we took to strengthen our financial flexibility, we temporarily paused our employer match contribution and incurred no expenses related to Company contributions.
NOTE 10: STOCK-BASED COMPENSATION
Under our deferred and stock-based compensation plan arrangements, we issued 1.6, 2.22.4, 3.4 and 2.11.6 shares of common stock in 2021, 20202023, 2022 and 2019. 2021. On June 6, 2023, our shareholders approved an amendment to the 2019 Equity Incentive Plan. The amendment increases common stock available for issuance by 15.0 shares.Under the 2019 Plan, the aggregate number of shares to be issued may not exceed 24.539.5 plus any shares currently outstanding under the 2010 Plan that are forfeited or expire during the term of the 2019 Plan. As of January 29, 2022,February 3, 2024, we have 24.5had 39.5 shares authorized, 15.014.8 shares issued and outstanding and 17.423.9 shares remaining available for future grants under the 2019 Plan.
Under the ESPP, employees may make payroll deductions of up to 15% of their base and bonus compensation for the purchase of Nordstrom common stock. At the end of each six-month offering period, participants apply their accumulated payroll deductions toward the purchase of shares of our common stock at 90% of the fair market value on the last day of the offer period. On June 6, 2023, our shareholders approved an amendment under the ESPP. The amendment increases common stock available for purchase by 3.5 shares. As of January 29, 2022,February 3, 2024, we had 16.1 shares19.6 shares authorized and 3.34.9 shares available for issuance under the ESPP. We issued 1.0, 0.9 and 0.5 and 1.0 shares under the ESPP during 20212023, 2022 and 2020.2021. At the end of 20212023 and 2020,2022, we had current liabilities of $6$5 and $5 for$6 for future purchases of shares under the ESPP.
56Nordstrom, Inc. and subsidiaries65
Nordstrom, Inc.
Notes to Consolidated Financial Statements
(Dollar and share amounts in millions except per share, per option and per unit amounts)
The following table summarizes our stock-based compensation expense: | | Fiscal year | Fiscal year | 2021 | | 2020 | | 2019 | Fiscal year | 2023 | 2022 | 2021 |
| RSUs | RSUs | $52 | | | $53 | | | $49 | |
| Stock options | Stock options | 22 | | | 12 | | | 11 | |
Other1 | Other1 | 5 | | | 2 | | | 9 | |
| Total stock-based compensation expense, before income tax benefit | Total stock-based compensation expense, before income tax benefit | 79 | | | 67 | | | 69 | |
| Income tax benefit | Income tax benefit | (20) | | | (26) | | | (18) | |
| Total stock-based compensation expense, net of income tax benefit | Total stock-based compensation expense, net of income tax benefit | $59 | | | $41 | | | $51 | |
The stock-based compensation expense before income tax benefit was recorded in our Consolidated Statements of Earnings as follows: | | Fiscal year | Fiscal year | 2021 | | 2020 | | 2019 | Fiscal year | 2023 | 2022 | 2021 |
| Cost of sales and related buying and occupancy costs | Cost of sales and related buying and occupancy costs | $15 | | | $16 | | | $20 | |
| SG&A expenses | SG&A expenses | 64 | | | 51 | | | 49 | |
| Total stock-based compensation expense, before income tax benefit | Total stock-based compensation expense, before income tax benefit | $79 | | | $67 | | | $69 | |
Restricted Stock
Our Compensation, People and Culture Committee of our Board of Directors approves grants of restricted stock units to employees. The number of units granted to an individual are determined based upon a percentage of the recipient’s base salaryaward amounts and the fair value of the restricted stock.stock units at the time of grant. Restricted stock units typically vest over four years.
A summary of restricted stock unit activity for 20212023 is presented below: | | Fiscal year | Fiscal year | 2021 | Fiscal year | 2023 |
| | | Shares | | Weighted-average grant date fair value per unit | | Shares | Weighted-average grant date fair value per unit |
| Outstanding, beginning of year | Outstanding, beginning of year | 4.8 | | | $37 | |
| Granted | Granted | 1.8 | | | 31 | |
| Vested | Vested | (1.4) | | | 35 | |
| Forfeited or cancelled | (0.6) | | | 28 | |
| Forfeited or canceled | |
| Outstanding, end of year | Outstanding, end of year | 4.6 | | | $36 | |
The aggregate fair value of restricted stock units vested during 2023, 2022 and 2021 2020was $33, $62 and 2019 was $50, $44 and $65.$50. As of January 29, 2022,February 3, 2024, the total unrecognized stock-based compensation expense related to nonvested restricted stock units was $61,$69, which is expected to be recognized over a weighted-average period of 2824 months.
Nordstrom, Inc. and subsidiaries5766
Nordstrom, Inc.
Notes to Consolidated Financial Statements
(Dollar and share amounts in millions except per share, per option and per unit amounts)
Stock Options
Our Compensation, People and Culture Committee of our Board of Directors approves grants of non-qualifiednonqualified stock options to employees. We used the following assumptions to estimate the fair value for stock options at each grant date:
| | | | | | | | | | | | | | | | | | | | |
| Fiscal year | 2021 | | 20201 | | 2019 |
| Assumptions | | | | | |
| Risk-free interest rate: Represents the yield on U.S. Treasury zero-coupon securities that mature over the 10-year life of the stock options. | 0.11% – 1.51% | | 0.18% – 0.62% | | 2.5% – 2.7% |
| Weighted-average volatility: Based on a combination of the historical volatility of our common stock and the implied volatility of exchange-traded options for our common stock. | 52.2 | % | | 60.1 | % | | 34.6 | % |
| Weighted-average expected dividend yield: Our forecasted dividend yield for the next 10 years. | 3.4 | % | | 3.4 | % | | 1.9 | % |
| Expected life in years: Represents the estimated period of time until option exercise. The expected term of options granted was derived from the output of the Binomial Lattice option valuation model and was based on our historical exercise behavior, taking into consideration the contractual term of the option and our employees’ expected exercise and post-vesting employment termination behavior. | 8.3 | | 7.7 | | 6.8 |
| | | | | | |
| Grant Date Information | | | | | |
| Date of grant | March 4, 2021 | | June 1, 2020 | | March 5, 2019 |
| Weighted-average fair value per option | $13 | | | $7 | | | 15 | |
| Exercise price per option | $36 | | | $17 | | | 45 | |
1 Additionalnon-qualified stock options were also granted to certain company leaders on August 27, 2020 at an exercise price per option of $15. The assumptions used to estimate the fair value for the additional stock options were similar to the 2020 grant assumptions presented in this table. In 2020, we also granted stock options to certain qualified employees outside of the June and August grant dates, which were insignificant in aggregate.
The number of awards granted to an individual are determined based upon award amounts and the fair value of stock options at the time of grant. Our options primarily vest equally over a four-year period or at the end of two years, and expire ten years after the date of grant. We used the following assumptions to estimate the fair value for stock options at each grant date:
| | | | | | | | | | | | | | |
| Fiscal year | 2023 | 2022 | 20211 |
| Assumptions | | | |
| Risk-free interest rate2 | 3.98% – 5.05% | 1.18% – 1.95% | 0.11% – 1.51% |
| Weighted-average volatility3 | 52.3 | % | 52.4 | % | 52.2 | % |
| Weighted-average expected dividend yield4 | 3.8 | % | 3.4 | % | 3.4 | % |
| Expected life in years5 | 8.2 | 8.3 | 8.3 |
| | | | |
| Grant Date Information | | | |
| Date of grant | March 6, 2023 | March 3, 2022 | March 4, 2021 |
| Weighted-average fair value per option | $8 | | $10 | | $13 | |
| Exercise price per option | $20 | | $26 | | $36 | |
1 The options granted on March 4, 2021 include market performance-based stock options with a contractual term of ten years that were awarded to certain members of senior management as well as time-based options. The price-hurdle options contain a market condition that requires the closing price of our stock to meet or exceed certain price thresholds for 20 consecutive trading days in order for shares to vest.
2 Represents the yield on U.S. Treasury securities that mature over the 10-year life of the stock options.
3 Based on a combination of the historical volatility of our common stock and the implied volatility of exchange-traded options for our common stock.
4 Our forecasted dividend yield for the next 10 years.
5 Derived from the output of the binomial lattice model and represents the estimated period of time until option exercise. The expected term of options granted is based on our historical exercise behavior, taking into consideration the contractual term of the option and our employees’ expected exercise and post-vesting employment termination behavior.
A summary of stock option activity for 20212023 is presented below: | | Fiscal year | Fiscal year | 2021 | Fiscal year | 2023 |
| | | Shares | | Weighted- average exercise price | | Weighted-average remaining contractual life (years) | | Aggregate intrinsic value | | Shares | Weighted- average exercise price | Weighted-average remaining contractual life (years) | Aggregate intrinsic value1 |
| Outstanding, beginning of year | Outstanding, beginning of year | 11.0 | | | $40 | | | | | | Outstanding, beginning of year | 8.5 | | $38 | $38 | | | |
| Granted | Granted | 1.2 | | | 36 | | |
| Exercised | Exercised | — | | | 37 | | |
| Forfeited or cancelled | (1.8) | | | 42 | | |
| Exercised | |
| Exercised | |
| Forfeited or canceled | |
| Forfeited or canceled | |
| Forfeited or canceled | |
| Outstanding, end of year | Outstanding, end of year | 10.4 | | | $39 | | | 5 | | $183 | |
| Vested, end of year | 5.2 | | | $54 | | | 3 | | $170 | |
| Vested or expected to vest, end of year | 10.2 | | | $40 | | | 5 | | $180 | |
| Outstanding, end of year | |
| Outstanding, end of year | |
| Exercisable, end of year | |
| | Fiscal year | |
| Fiscal year | |
| Fiscal year | Fiscal year | | 2021 | | 2020 | | 2019 | | 2023 | 2022 | 2021 |
| Aggregate intrinsic value of options exercised | Aggregate intrinsic value of options exercised | | $— | | | $1 | | | $5 | |
| Fair value of stock options vested | Fair value of stock options vested | | $2 | | | $8 | | | $17 | |
1 The aggregate intrinsic value represents the amount realized if all in-the-money options were exercised on the final business day before February 3, 2024.
As of January 29, 2022,February 3, 2024, the total unrecognized stock-based compensation expense related to nonvested stock options was $12,$6, which is expected to be recognized over a weighted-average period of 1810 months.
58Nordstrom, Inc. and subsidiaries67
Nordstrom, Inc.
Notes to Consolidated Financial Statements
(Dollar and share amounts in millions except per share, per option and per unit amounts)
NOTE 11: SHAREHOLDERS’ EQUITY
We have certain limitations with respect to the payment of dividends and share repurchases under our Revolver agreement (see Note 6: Debt and Credit Facilities).
Changes in the number of issued and outstanding shares of our common stock in 2021, 20202023, 2022 and 20192021 are the result of share repurchases and compensation plan issuances (see Note 10: Stock-based Compensation).
Share Repurchases
In May 2022, our Board of Directors authorized a new program to repurchase up to $500 of our outstanding common stock, with no expiration date, which replaced the August 2018 program. The following is a summary of the activity related to our share repurchase programsprograms: | | | | | | | | | | | |
| Shares | Average price per share | Amount |
| Capacity at January 30, 2021 | | | $707 | |
| | | |
| Shares repurchased | — | | — | | — | |
| | | |
| Capacity at January 29, 2022 | | | 707 | |
| August 2018 program termination | | | (707) | |
| May 2022 program authorization (no expiration) | | | 500 | |
| Shares repurchased | 2.8 | | $22 | | (62) | |
| Capacity at January 28, 2023 | | | 438 | |
Shares repurchased1 | 0.03 | | $19 | | (1) | |
Capacity at February 3, 20241 | | | $438 | |
1 Subtotal of ending share repurchase capacity may not foot due to rounding.
Dividends
We paid dividends of $0.76 per share in
2021, 20202023 and
2019: | | | | | | | | | | | | | | | | | |
| Shares | | Average price per share | | Amount |
| Capacity at February 2, 2019 | | | | | $893 | |
| | | | | |
| Shares repurchased | 4.1 | | | $45 | | | (186) | |
| | | | | |
| Capacity at February 1, 2020 | | | | | 707 | |
| | | | | |
| Shares repurchased | — | | | $— | | | — | |
| Capacity at January 30, 2021 | | | | | 707 | |
| | | | | |
| Shares repurchased | — | | | $— | | | — | |
| | | | | |
| Capacity at January 29, 2022 | | | | | $707 | |
The actual timing, price, mannerin 2022 and amountsnone in 2021. In February 2024, subsequent to year end, we declared a quarterly dividend of future$0.19 per share, repurchases, if any,which will be subjectpaid on March 27, 2024 to shareholders of record as of March 12, 2024.
Rights Plan
In September 2022, our Board of Directors approved a shareholder rights agreement and declared a dividend of one right for each outstanding share of Nordstrom common stock to shareholders of record on September 30, 2022. In June 2023, shareholders approved an advisory vote on the discretionextension of our Rights Plan at our 2023 Annual Meeting, and in August 2023, the Board of Directors contractual commitments, marketextended the expiration date to September 19, 2025, unless redeemed, exchanged or terminated earlier by our Board. Each right entitles holders to purchase one newly issued share of Nordstrom common stock at an exercise price of $94 per right, subject to adjustment. Initially, the rights are not exercisable and economic conditionstrade with our shares of common stock. In general, the rights become exercisable following a public announcement that a person acquires 10% or more of the outstanding shares of Nordstrom common stock. If the rights are exercised, each holder (except the acquiring person) will have the right to receive common stock equal to two times the exercise price of the right. The Company may redeem the rights for $0.001 per right anytime prior to the rights becoming exercisable. The agreement also provides for exceptions and applicable SEC rules.
Our Revolver contains negative covenants with respectadditional terms for other certain situations and circumstances. There is currently no impact to payment of dividends and share repurchases. Under our Revolver amendment, we created flexibility for dividends and share repurchases, provided certain requirements are met (see Note 5: Debt and Credit Facilities).
We paid no dividends in 2021, $0.37 per share in 2020 and $1.48 per share in 2019.Consolidated Financial Statements.
NOTE 12: INCOME TAXES
U.S. and foreign components of earnings before income taxes were as follows: | | Fiscal year | Fiscal year | 2021 | | 2020 | | 2019 | Fiscal year | 2023 | 2022 | 2021 |
| U.S. | U.S. | $241 | | ($1,210) | | $654 | U.S. | $143 | $316 | $241 |
| Foreign | Foreign | 5 | | (18) | | 28 | Foreign | 4 | 21 | 5 |
| Earnings (loss) before income taxes | $246 | | ($1,228) | | $682 |
| Earnings before income taxes | | Earnings before income taxes | $147 | $337 | $246 |
|
Nordstrom, Inc.
Notes to Consolidated Financial Statements
(Dollar and share amounts in millions except per share, per option and per unit amounts)
Income tax expense (benefit) consists of the following: | | Fiscal year | Fiscal year | 2021 | | | 2020 | | | 2019 | |
| Current income taxes: | Current income taxes: | |
| Federal | Federal | $61 | | | ($501) | | | $90 | |
| State and local | 18 | | | (34) | | | 44 | |
| Foreign | — | | | 4 | | | — | |
| Total current income tax expense (benefit) | 79 | | | (531) | | | 134 | |
| Deferred income taxes: | |
| Federal | |
| Federal | Federal | (10) | | | 47 | | | 43 | |
| State and local | State and local | (5) | | | (57) | | | 3 | |
| Foreign | Foreign | 4 | | | 3 | | | 6 | |
| Total deferred income tax (benefit) expense | (11) | | | (7) | | | 52 | |
| Total income tax expense (benefit) | $68 | | | ($538) | | | $186 | |
| Total current income tax expense | |
| Deferred income taxes: | |
| Federal | |
| Federal | |
| Federal | |
| State and local | |
| Foreign | |
| Total deferred income tax benefit | |
| Total income tax expense | |
A reconciliation of the statutory federal income tax rate to the effective tax rate on earnings before income taxes is as follows: | | | | | | | | | | | |
| Fiscal year | 2023 | | 2022 | | 2021 | |
| Statutory rate | 21.0 | % | 21.0 | % | 21.0 | % |
| CARES Act impact | — | | — | | (0.9 | %) |
| State and local income taxes, net of federal income taxes | 4.0 | % | 5.9 | % | 3.4 | % |
| Federal credits | (4.7 | %) | (3.8 | %) | (4.0 | %) |
| Non-deductible expenses | 2.9 | % | 1.2 | % | 2.7 | % |
| Stock-based compensation | 5.1 | % | 1.8 | % | 2.0 | % |
| Valuation allowance | 6.6 | % | 0.4 | % | 1.8 | % |
| Taxes on foreign operations | 1.5 | % | 1.6 | % | 1.3 | % |
| Excess tax over book loss on Canada wind-down | (18.2 | %) | — | | — | |
| Resolution of prior period tax matters | (11.2 | %) | — | | — | |
| Other, net | 1.6 | % | (0.9 | %) | 0.2 | % |
| Effective tax rate | 8.6 | % | 27.2 | % | 27.5 | % |
The components of deferred tax assets and liabilities are as follows: | | | | | | | | |
| February 3, 2024 | January 28, 2023 |
| Deferred tax assets: | | |
| Lease liabilities | $425 | | $463 | |
| Compensation and benefits accruals | 104 | | 111 | |
| Sales return reserve | 56 | | 61 | |
| Accrued expenses | 31 | | 28 | |
| Merchandise inventories | 36 | | 33 | |
| Gift cards | 39 | | 43 | |
| The Nordy Club loyalty program | 2 | | 8 | |
| Net operating losses | 38 | | 52 | |
| Other | 36 | | 25 | |
| Total deferred tax assets | 767 | | 824 | |
| Valuation allowance | (1) | | (28) | |
| Total deferred tax assets, net of valuation allowance | 766 | | 796 | |
| Deferred tax liabilities: | | |
| ROU assets | (310) | | (331) | |
| Land, property and equipment | (164) | | (230) | |
| Debt exchange premium | (11) | | (12) | |
| Total deferred tax liabilities | (485) | | (573) | |
| Net deferred tax assets | $281 | | $223 | |
Nordstrom, Inc. and subsidiaries 5969
Nordstrom, Inc.
Notes to Consolidated Financial Statements
(Dollar and share amounts in millions except per share, per option and per unit amounts)
A reconciliation of the statutory federal income tax rate to the effective tax rate on earnings (loss) before income taxes is as follows: | | | | | | | | | | | | | | | | | |
| Fiscal year | 2021 | | | 2020 | | | 2019 | |
| Statutory rate | 21.0 | % | | 21.0 | % | | 21.0 | % |
| CARES Act impact | (0.9 | %) | | 17.6 | % | | — | |
| State and local income taxes, net of federal income taxes | 3.4 | % | | 6.1 | % | | 5.4 | % |
| Federal credits | (4.0 | %) | | 0.5 | % | | (0.9 | %) |
Non-deductible expenses1 | 2.7 | % | | (0.3 | %) | | 0.9 | % |
Stock-based compensation1 | 2.0 | % | | (1.0 | %) | | 0.8 | % |
Valuation allowance1 | 1.8 | % | | (0.8 | %) | | (0.1 | %) |
Taxes on foreign operations1 | 1.3 | % | | 0.4 | % | | 1.0 | % |
Other, net1 | 0.2 | % | | 0.3 | % | | (0.8 | %) |
| Effective tax rate | 27.5 | % | | 43.8 | % | | 27.3 | % |
1 We reclassified immaterial prior year amounts that were included in the other, net category to conform with current period presentation.
The components of deferred tax assets and liabilities are as follows: | | | | | | | | | | | |
| January 29, 2022 | | January 30, 2021 |
| Deferred tax assets: | | | |
| Lease liabilities | $471 | | | $505 | |
| Compensation and benefits accruals | 133 | | | 139 | |
| Allowance for sales returns | 59 | | | 43 | |
| Accrued expenses | 27 | | | 28 | |
| Merchandise inventories | 35 | | | 22 | |
| Gift cards | 25 | | | 10 | |
| The Nordy Club loyalty program | 5 | | | 19 | |
| Net operating losses | 81 | | | 72 | |
| Other | 9 | | | 23 | |
| Total deferred tax assets | 845 | | | 861 | |
| Valuation allowance | (28) | | | (24) | |
| Total deferred tax assets, net of valuation allowance | 817 | | | 837 | |
| Deferred tax liabilities: | | | |
| ROU assets | (326) | | | (337) | |
| Land, property and equipment | (327) | | | (341) | |
| Debt exchange premium | (12) | | | (12) | |
| Total deferred tax liabilities | (665) | | | (690) | |
| Net deferred tax assets | $152 | | | $147 | |
The following sets forth information on approximate net operating loss carryforwards for income tax purposes: | | January 29, 2022 | | January 30, 2021 |
| February 3, 2024 | | | February 3, 2024 | January 28, 2023 |
| State | State | $1,114 | | | $1,036 | |
| Foreign | Foreign | 50 | | | 54 | |
The net operating loss carryforwards are subject to certain statutory limitations of applicable state and foreign laws. If not utilized, a portion of our state and foreign net operating loss carryforwards will begin to expire in 2024 and 2033.2024.
As of January 29, 2022February 3, 2024 and January 30, 2021, we believe there are certain28, 2023, the valuation allowance for deferred tax assets was $1 and $28. As a result of the wind-down of our Canada operations in 2023, the valuation allowance for foreign deferred tax assets increased $9 and upon deconsolidation was written off to zero. The write-off of the deferred tax assets and corresponding valuation allowance for Canada was included in the Canada wind-down costs. In 2023, a valuation allowance of $1 was recorded for state net operating loss carryforwards and deferred tax assets that will not be realized in the foreseeable future. As such, valuation allowances of $28 and $24 have been recorded as of January 29, 2022 and January 30, 2021. In 2021 and 2020,There was no change to the valuation allowance increased $4 and decreased $17.
Nordstrom, Inc.
Notes to Consolidated Financial Statements
(Dollar and share amounts in millions except per share, per option and per unit amounts)
2022.A reconciliation of the beginning and ending amount of unrecognized tax benefits is as follows: | | Fiscal year | Fiscal year | 2021 | | 2020 | | 2019 | Fiscal year | 2023 | 2022 | 2021 |
| Unrecognized tax benefit at beginning of year | Unrecognized tax benefit at beginning of year | $32 | | | $22 | | | $30 | |
| Gross increase to tax positions in prior periods | Gross increase to tax positions in prior periods | 11 | | | 4 | | | — | |
| Gross decrease to tax positions in prior periods | |
| Gross increase to tax positions in current period | |
| | Gross increase to tax positions in current period | 6 | | | 6 | | | 3 | |
| Lapses in statute | — | | | — | | | (1) | |
| Settlements | |
| Settlements | |
| Settlements | Settlements | (2) | | | — | | | (10) | |
| Unrecognized tax benefit at end of year | Unrecognized tax benefit at end of year | $47 | | | $32 | | | $22 | |
At the end of 20212023 and 2020, $392022, $22 and $30$45 of the ending gross unrecognized tax benefit related to items which, if recognized, would affect the effective tax rate.
There was no material expense for interest and penalties in 2021, 20202023, 2022 and 2019.2021. At the end of 20212023 and 2020,2022, our liability for interest and penalties was $7$3 and $4.$8.
We file income tax returns in the U.S. and a limited number of foreign jurisdictions. With few exceptions, we are no longer subject to federal or state and local or non-U.S. income tax examinations for years before 2012.2014. As of January 29, 2022,February 3, 2024, we believe it is reasonably possible unrecognized tax benefits related to federal, state and local tax positions may decrease $39$6 by January 28, 2023,February 1, 2025, due to the completion of examinations and the expiration of various statutes of limitations.
NOTE 13: COMMITMENTS AND CONTINGENCIES
Our estimated total purchase obligations, which primarily consist of inventory purchase orders and capital expenditure commitments, were $2,576$2,049 as of January 29, 2022.February 3, 2024. These purchase obligations are primarily payable within one year.
Our NYC flagship store opened in October 2019 and the related building and equipment assets were placed into service at the end of the third quarter of 2019. While our store has opened, construction continues in the residential condominium units above the store. As of January 29, 2022, we have a fee interest in the retail condominium unit. In the third quarter of 2021, we paid the majority of our final installment payment based on the developer meeting final pre-established construction and development milestones.
NOTE 14: EARNINGS PER SHARE
Earnings per basic share is computed using the weighted-average number of common shares outstanding during the year. Earnings per diluted share uses the weighted-average number of common shares outstanding during the year plus dilutive common stock equivalents, primarily RSUs and stock options. Dilutive common stock is calculated using the treasury stock method and includes unvested RSUs and outstanding options that would reduce the amount of earnings for which each share is entitled. Anti-dilutive shares (including stock options and other shares) are excluded from the calculation of diluted shares and earnings per diluted share because their impact could increase earnings per diluted share. The computation of earnings per shareEPS is as follows: | | | | | | | | | | | | | | | | | |
| Fiscal year | 2021 | | 2020 | | 2019 |
| Net earnings (loss) | $178 | | | ($690) | | | $496 | |
| | | | | |
| Basic shares | 159.0 | | | 157.2 | | | 155.2 | |
| Dilutive effect of common stock equivalents | 3.5 | | | — | | | 0.9 | |
| Diluted shares | 162.5 | | | 157.2 | | | 156.1 | |
| | | | | |
| Earnings (loss) per basic share | $1.12 | | | ($4.39) | | | $3.20 | |
| Earnings (loss) per diluted share | $1.10 | | | ($4.39) | | | $3.18 | |
| | | | | |
| Anti-dilutive common stock equivalents | 8.1 | | | 13.5 | | | 10.0 | |
| | | | | | | | | | | |
| Fiscal year | 2023 | 2022 | 2021 |
| Net earnings | $134 | | $245 | | $178 | |
| | | |
| Basic weighted-average shares outstanding | 161.8 | | 160.1 | | 159.0 | |
| Dilutive shares | 1.6 | | 2.0 | | 3.5 | |
| Diluted weighted-average shares outstanding | 163.4 | | 162.1 | | 162.5 | |
| | | |
| Basic EPS | $0.83 | | $1.53 | | $1.12 | |
| Diluted EPS | $0.82 | | $1.51 | | $1.10 | |
| | | |
| Anti-dilutive shares | 8.4 | | 8.7 | | 8.1 | |
Nordstrom, Inc. and subsidiaries6170
Nordstrom, Inc.
Notes to Consolidated Financial Statements
(Dollar and share amounts in millions except per share, per option and per unit amounts)
NOTE 15: SEGMENT REPORTING
Segments
We continually monitor and review our segment reporting structure in accordance with authoritative guidance to determine whether any changes have occurred that would impact our reportable segments. We have 1one reportable “Retail” segment to align with how management operates and evaluates the results of our operations. Our principal executive officer, who is our CODM,chief operating decision maker, reviews results on a total Company, Nordstrom and Nordstrom Rack basis and uses EBIT as a measure of profitability.
Our Retail reportable segment aggregates our 2two operating segments, Nordstrom and Nordstrom Rack. As of February 3, 2024, Nordstrom consists of Nordstrom.com, TrunkClub.com, Nordstrom-brandedNordstrom U.S. stores and Nordstrom Local. Nordstrom also included Canada which includesoperations prior to March 2, 2023, inclusive of Nordstrom.ca, Nordstrom Canadian stores and Nordstrom Rack Canadian stores, ASOS | Nordstrom prior to December 2023 and Nordstrom Local.TrunkClub.com prior to October 2022. Nordstrom Rack consists of NordstromRack.com, Nordstrom Rack-brandedRack U.S. stores and Last Chance clearance stores and, prior to the first quarter of 2021, HauteLook.com.stores.
Our Nordstrom and Nordstrom Rack operating segments both generate revenue by offering customers an extensive selection of high-quality brand-name and private labelprivate-label merchandise for women, men, young adults and children, focusedwith a focus on apparel, shoes, beauty, accessories and home goods. We continue to focus on omni-channel initiatives by integrating the operations, merchandising and technology necessary to be consistent with our customers’ expectations of a seamless shopping experience regardless of channel or business. Nordstrom and Nordstrom Rack have historically had similar economic characteristics and are expected to have similar economic characteristics and long-term financial performance over the long-term, which we expect to continue in future periods.the future. They also have other similar qualitative characteristics, including suppliers, method of distribution, type of customer and regulatory environment. Due to their similar qualitative and economic characteristics, we have aggregated our Nordstrom and Nordstrom Rack operating segments into a single reportable segment.
Amounts in the Corporate/Other column include unallocated corporate expenses and assets (including unallocated assets in corporate headquarters, consisting primarily of cash, land, buildings, and equipment and deferred tax assets), inter-segment eliminations and other adjustments to segment results necessary for the presentation of consolidated financial results in accordance with GAAP.
Accounting Policy
We present our segment results for all years in the way that management views our results internally and the accounting policies of the operating segments are the same as those described in Note 1: Nature of Operations and Summary of Significant Accounting Policies.
62Nordstrom, Inc. and subsidiaries71
Nordstrom, Inc.
Notes to Consolidated Financial Statements
(Dollar and share amounts in millions except per share, per option and per unit amounts)
The following table sets forth information for our reportable segment: | | Retail | | Corporate/Other | | Total |
| Fiscal year 2021 | |
| Retail | | | Retail | Corporate/Other | Total |
| Fiscal year 2023 | |
| Net sales | |
| Net sales | |
| Net sales | Net sales | $14,402 | | | $— | | | $14,402 | |
| Credit card revenues, net | Credit card revenues, net | — | | | 387 | | | 387 | |
| Earnings (loss) before interest and income taxes | Earnings (loss) before interest and income taxes | 687 | | | (195) | | | 492 | |
| | Capital expenditures | Capital expenditures | (218) | | | (288) | | | (506) | |
| | Capital expenditures | |
| | Capital expenditures | |
| Canada wind-down costs | |
| Depreciation and amortization | Depreciation and amortization | (350) | | | (265) | | | (615) | |
| Assets | Assets | 6,244 | | | 2,625 | | | 8,869 | |
| | Fiscal year 2020 | |
| Fiscal year 2022 | |
| Fiscal year 2022 | |
| Fiscal year 2022 | |
| Net sales | Net sales | $10,357 | | | $— | | | $10,357 | |
| Credit card revenues, net | — | | | 358 | | | 358 | |
| Loss before interest and income taxes | (924) | | | (123) | | | (1,047) | |
| | Capital expenditures | (175) | | | (210) | | | (385) | |
| Depreciation and amortization | (404) | | | (267) | | | (671) | |
Assets | 6,100 | | | 3,438 | | | 9,538 | |
| | Fiscal year 2019 | |
| Net sales | |
| Net sales | Net sales | $15,132 | | | $— | | | $15,132 | |
| Credit card revenues, net | Credit card revenues, net | — | | | 392 | | | 392 | |
| Earnings (loss) before interest and income taxes | Earnings (loss) before interest and income taxes | 1,028 | | | (244) | | | 784 | |
| | Capital expenditures | Capital expenditures | (726) | | | (209) | | | (935) | |
| | Capital expenditures | |
| | Capital expenditures | |
| Depreciation and amortization | Depreciation and amortization | (428) | | | (233) | | | (661) | |
| Assets | Assets | 6,831 | | | 2,906 | | | 9,737 | |
| | Fiscal year 2021 | |
| Fiscal year 2021 | |
| Fiscal year 2021 | |
| Net sales | |
| Net sales | |
| Net sales | |
| Credit card revenues, net | |
| Earnings (loss) before interest and income taxes | |
| | Capital expenditures | |
| | Capital expenditures | |
| | Capital expenditures | |
| Depreciation and amortization | |
| Assets | |
For information about disaggregated revenues, see Note 2:3: Revenue.
Nordstrom, Inc. and subsidiaries6372
Item 9. Changes in and Disagreements With Accountants on Accounting and Financial Disclosure.
None.
Item 9A. Controls and Procedures.
DISCLOSURE CONTROLS AND PROCEDURES
For the purposes of the Exchange Act, our Chief Executive Officer, Erik B. Nordstrom, serves as our principal executive officer and our Chief Financial Officer, Anne L. Bramman,Cathy R. Smith, is our principal financial officer and principal accounting officer.
Under the supervision and with the participation of management, including our principal executive officer and principal financial officer, we have performed an evaluation of the design and effectiveness of our disclosure controls and procedures as of the last day of the period covered by this report.
Based upon that evaluation, our principal executive officer and principal financial officer concluded that our disclosure controls and procedures were effective. Disclosure controls and procedures are defined by Rules 13a-15(e) and 15d-15(e) under the Exchange Act as controls and other procedures that are designed to ensure that information required to be disclosed in the reports that we file or submit under the Exchange Act is recorded, processed, summarized and reported within the time periods specified within the SEC’s rules and forms. Disclosure controls and procedures include, without limitation, controls and procedures designed to ensure that information required to be disclosed in the reports that we file or submit under the Exchange Act is accumulated and communicated to our management, including our principal executive officer and principal financial officer, to allow timely decisions regarding required disclosure.
CHANGES IN INTERNAL CONTROL OVER FINANCIAL REPORTING
There have been no changes in our internal control over financial reporting (as defined in Rules 13a-15(f) or 15d-15(f) of the Exchange Act) during our most recently completed fiscal quarter that have materially affected, or are reasonably likely to materially affect, our internal control over financial reporting.
MANAGEMENT’S REPORT ON INTERNAL CONTROL OVER FINANCIAL REPORTING
Our management is responsible for establishing and maintaining adequate internal control over financial reporting, as is defined in the Exchange Act. These internal controls are designed to provide reasonable assurance that the reported financial information is presented fairly, that disclosures are adequate and that the judgments inherent in the preparation of financial statements are reasonable. There are inherent limitations in the effectiveness of any system of internal control, including the possibility of human error and overriding of controls. Consequently, an effective internal control system can only provide reasonable, not absolute, assurance with respect to reporting financial information.
Management conducted an evaluation of the effectiveness of our internal control over financial reporting based on the framework and criteria established in Internal Control – Integrated Framework (2013), issued by the Committee of Sponsoring Organizations of the Treadway Commission. Based on this evaluation, management concluded that the Company’s internal control over financial reporting was effective as of January 29, 2022.February 3, 2024.
Deloitte & Touche LLP, an independent registered public accounting firm, was retained to audit our Consolidated Financial Statements and the effectiveness of our internal control over financial reporting. They have issued an attestation report on our internal control over financial reporting as of January 29, 2022,February 3, 2024, which is included herein.
64Nordstrom, Inc. and subsidiaries73
REPORT OF INDEPENDENT REGISTERED PUBLIC ACCOUNTING FIRM
To the Board of Directors and Shareholders of Nordstrom, Inc.
Opinion on Internal Control over Financial Reporting
We have audited the internal control over financial reporting of Nordstrom, Inc. and subsidiaries (the “Company”) as of January 29, 2022,February 3, 2024, based on criteria established in Internal Control—Integrated Framework (2013) issued by the Committee of Sponsoring Organizations of the Treadway Commission (COSO). In our opinion, the Company maintained, in all material respects, effective internal control over financial reporting as of January 29, 2022,February 3, 2024, based on criteria established in Internal Control — Integrated Framework (2013) issued by COSO.
We have also audited, in accordance with the standards of the Public Company Accounting Oversight Board (United States) (PCAOB), the consolidated financial statements as of and for the year ended January 29, 2022,February 3, 2024, of the Company and our report dated March 11, 2022,19, 2024, expressed an unqualified opinion on those financial statements.
Basis for Opinion
The Company’s management is responsible for maintaining effective internal control over financial reporting and for its assessment of the effectiveness of internal control over financial reporting, included in the accompanying Management’s Report on Internal Control Over Financial Reporting. Our responsibility is to express an opinion on the Company’s internal control over financial reporting based on our audit. We are a public accounting firm registered with the PCAOB and are required to be independent with respect to the Company in accordance with the U.S. federal securities laws and the applicable rules and regulations of the Securities and Exchange Commission and the PCAOB.
We conducted our audit in accordance with the standards of the PCAOB.
Those standards require that we plan and perform the audit to obtain reasonable assurance about whether effective internal control over financial reporting was maintained in all material respects. Our audit included obtaining an understanding of internal control over financial reporting, assessing the risk that a material weakness exists, testing and evaluating the design and operating effectiveness of internal control based on the assessed risk, and performing such other procedures as we considered necessary in the circumstances. We believe that our audit provides a reasonable basis for our opinion.
Definition and Limitations of Internal Control over Financial Reporting
A company’s internal control over financial reporting is a process designed to provide reasonable assurance regarding the reliability of financial reporting and the preparation of financial statements for external purposes in accordance with generally accepted accounting principles. A company’s internal control over financial reporting includes those policies and procedures that (1) pertain to the maintenance of records that, in reasonable detail, accurately and fairly reflect the transactions and dispositions of the assets of the company; (2) provide reasonable assurance that transactions are recorded as necessary to permit preparation of financial statements in accordance with generally accepted accounting principles, and that receipts and expenditures of the company are being made only in accordance with authorizations of management and directors of the company; and (3) provide reasonable assurance regarding prevention or timely detection of unauthorized acquisition, use, or disposition of the company’s assets that could have a material effect on the financial statements.
Because of its inherent limitations, internal control over financial reporting may not prevent or detect misstatements. Also, projections of any evaluation of effectiveness to future periods are subject to the risk that controls may become inadequate because of changes in conditions, or that the degree of compliance with the policies or procedures may deteriorate.
/s/ Deloitte & Touche LLP
Seattle, Washington
March 11, 202219, 2024
Nordstrom, Inc. and subsidiaries6574
Item 9B. Other Information.
None.
Item 9C. Disclosure Regarding Foreign Jurisdictions that Prevent Inspections.
None.
PART III
Item 10. Directors, Executive Officers and Corporate Governance.
The information required under this item is included in the following sections of our Proxy Statement for our 20222024 Annual Meeting of Shareholders, the sections of which are incorporated by reference herein and will be filed within 120 days after the end of our fiscal year:
Corporate Governance
Director Qualifications, Experience, and Nominating Process
Delinquent Section 16(a) Reports
Requirements and Deadlines for Submission of Proxy Proposals, Nomination of Directors, and Other Business of Shareholders
The certifications of our Chief Executive Officer and Chief Financial Officer required pursuant to Sections 302 and 906 of the Sarbanes-Oxley Act of 2002 are included as exhibits to this 20212023 Annual Report and were included as exhibits to each of our quarterly reports on Form 10-Q. Our Chief Executive Officer certified to the New York Stock Exchange (“NYSE”)NYSE on June 2, 2021,13, 2023, pursuant to Section 303A.12(a) of the NYSE’s listing standards, that he was not aware of any violation by the Company of the NYSE’s corporate governance listing standards as of that date.
Item 11. Executive Compensation.
The information required under this item is included in the following sections of our Proxy Statement for our 20222024 Annual Meeting of Shareholders, the sections of which are incorporated by reference herein and will be filed within 120 days after the end of our fiscal year:
Compensation of Executive Officers
Director Compensation and Stock Ownership Guidelines
Compensation Committee Interlocks and Insider Participation
Compensation, People and Culture Committee Report
Item 12. Security Ownership of Certain Beneficial Owners and Management and Related Shareholder Matters.
The information required under this item is included in the following sections of our Proxy Statement for our 20222024 Annual Meeting of Shareholders, the sections of which are incorporated by reference herein and will be filed within 120 days after the end of our fiscal year:
Security Ownership of Certain Beneficial Owners and Management
Equity Compensation Plans
Item 13. Certain Relationships and Related Transactions, and Director Independence.
The information required under this item is included in the following sections of our Proxy Statement for our 20222024 Annual Meeting of Shareholders, the sections of which are incorporated by reference herein and will be filed within 120 days after the end of our fiscal year:
Corporate Governance
Certain Relationships and Related Transactions
Item 14. Principal Accountant Fees and Services.
Our independent registered public accounting firm is Deloitte & Touche LLP, Seattle, Washington, Auditor ID: 34.
The information required under this item is included in the Ratification of the Appointment of Independent Registered Public Accounting Firm section of our Proxy Statement for our 20222024 Annual Meeting of Shareholders, the section of which is incorporated by reference herein and will be filed within 120 days after the end of our fiscal year.
66Nordstrom, Inc. and subsidiaries75
PART IV
Item 15. Exhibit and Financial Statement Schedules.
The following information required under this item is filed as part of this report: | | | | | |
| | Page |
| (a)1. FINANCIAL STATEMENTS | |
| Report of Independent Registered Public Accounting Firm | |
| Consolidated Statements of Earnings | |
| Consolidated Statements of Comprehensive Earnings | |
| Consolidated Balance Sheets | |
| Consolidated Statements of Shareholders’ Equity | |
| Consolidated Statements of Cash Flows | |
| Management’s Report on Internal Control Over Financial Reporting | |
| Report of Independent Registered Public Accounting Firm | |
| |
| (a)3. EXHIBITS | |
| Nordstrom, Inc. and Subsidiaries Exhibit Index | |
All other schedules and exhibits are omitted because they are not applicable, not required or because the information required has been given as part of this report.
Nordstrom, Inc. and subsidiaries6776
Nordstrom, Inc. and Subsidiaries
Exhibit Index
Listed below are all exhibits included as part of this report. Those denoted with an asterisk (*) are a management contract, compensatory plan or arrangement:
| | | | | | | | | | | | | | |
| | Incorporated by Reference |
| Exhibit | Form | Exhibit | Filing Date |
| 3.1 | | 8-K | 3.1 | May 31, 2005 |
| | | | |
| 3.2 | | 8-K | 3.1 | February 15, 2022 |
| | | | |
| 4.1 | | S-3 | 4.4 | April 30, 2001 |
| | | | |
| 4.2 | | S-3/A | 4.1 | March 10, 1998 |
| | | | |
| 4.3 | | S-4/A | 4.1 | April 29, 2014 |
| | | | |
| 4.4 | | S-4 | 4.2 | March 28, 2014 |
| | | | |
| 4.5 | | S-4 | 4.3 | March 28, 2014 |
| | | | |
| 4.6 | | S-4 | 4.4 | March 28, 2014 |
| | | | |
| 4.7 | | 8-K | 4.1 | March 9, 2017 |
| | | | |
| 4.8 | | 8-K | 4.2 | March 9, 2017 |
| | | | |
| 4.9 | | 8-K | 4.1 | November 6, 2019 |
| | | | |
| 4.10 | | 10-Q | 4.2 | September 3, 2021 |
| | | | |
| 4.11 | | 10-Q | 4.3 | September 3, 2021 |
| | | | |
| 4.12* | | S-8 | 4.1 | August 27, 2014 |
| | | | |
| 4.13 | | 10-Q | 4.1 | June 10, 2020 |
| | | | |
| 10.1* | | DEF 14A | Appendix B | April 7, 2020 |
| | | | |
| 10.2* | | DEF 14A | Appendix A | April 8, 2016 |
| | | | |
| 10.3* | | 10-Q | 10.3 | June 4, 2021 |
| | | | |
| 10.4* | | 10-Q | 10.4 | June 4, 2021 |
| | | | |
| 10.5* | | 8-K | 10.1 | November 18, 2011 |
| | | | |
| 10.6* | | 8-K | 10.1 | November 14, 2012 |
| | | | |
| 10.7* | | 8-K | 10.1 | March 4, 2014 |
| | | | |
| 10.8* | | 8-K | 10.1 | February 19, 2015 |
| | | | |
| 10.9* | | 8-K | 10.1 | March 1, 2016 |
| | | | |
| 10.10* | | 10-Q | 10.2 | August 30, 2016 |
| | | | |
| 10.11* | | 8-K | 10.1 | February 23, 2017 |
| | | | |
| 10.12* | | 8-K | 10.1 | March 4, 2019 |
| | | | |
| 10.13* | | 8-K | 10.2 | March 4, 2019 |
| | | | |
| 10.14* | | 8-K | 10.1 | March 3, 2020 |
| | | | |
| 10.15* | | 10-Q | 10.5 | June 10, 2020 |
| | | | |
| 10.16* | | DEF 14A | Appendix A | April 8, 2010 |
| | | | |
| 10.17* | | DEF 14A | Appendix A | April 1, 2013 |
| | | | |
| 10.18* | | 8-K | 10.4 | March 4, 2014 |
| | | | |
| 10.19* | | DEF 14A | Appendix A | April 5, 2017 |
| | | | | | | | | | | | | | |
| | Incorporated by Reference |
| Exhibit | Form | Exhibit | Filing Date |
| | | | |
| 10.20* | | 10-K | 10.23 | March 20, 2020 |
| | | | |
| 10.21* | | 8-K | 10.4 | March 4, 2019 |
| | | | |
| 10.22* | | 10-Q | 10.1 | September 4, 2020 |
| | | | |
| 10.23 | | 10-K | 10.48 | March 19, 2018 |
| | | | |
| 10.24 | | 8-K | 10.1 | March 3, 2009 |
| | | | |
| 10.25 | | 10-K | 10.78 | March 18, 2011 |
| | | | |
| 10.26* | | 10-K | 10.67 | March 20, 2017 |
| | | | |
| 10.27* | | 8-K | 10.1 | March 8, 2018 |
| | | | |
| 10.28* | | 8-K | 10.3 | March 4, 2019 |
| | | | |
| 10.29* | | 10-Q | 10.1 | December 4, 2019 |
| | | | |
| 10.30* | | 8-K | 10.2 | March 3, 2020 |
| | | | |
| 10.31* | | 8-K | 10.2 | March 8, 2018 |
| | | | |
| 10.32* | | 10-Q | 10.4 | June 10, 2020 |
| | | | |
| 10.33 | | 8-K
| 10.1 | October 2, 2018 |
| | | | |
| 10.34 | | 10-Q | 10.3 | June 10, 2020 |
| | | | |
| 10.35 | | 10-Q | 10.1 | June 4, 2021 |
| | | | |
| 10.36 | | 10-Q | 10.1 | December 1, 2015 |
| | | | |
| 10.37 | | 8-K | 99.2 | June 8, 2017 |
| | | | |
| 21.1 | | | | |
| | | | |
| 23.1 | | | | |
| | | | |
| 31.1 | | | | |
| | | | |
| 31.2 | | | | |
| | | | |
| 32.1 | | | | |
| | | | |
| 101.INS | Inline XBRL Instance Document, filed herewith electronically | | | |
| | | | |
| 101.SCH | Inline XBRL Taxonomy Extension Schema Document, filed herewith electronically | | | |
| | | | |
| 101.CAL | Inline XBRL Taxonomy Extension Calculation Linkbase Document, filed herewith electronically | | | |
| | | | |
| 101.LAB | Inline XBRL Taxonomy Extension Labels Linkbase Document, filed herewith electronically | | | |
| | | | |
| 101.PRE | Inline XBRL Taxonomy Extension Presentation Linkbase Document, filed herewith electronically | | | |
| | | | |
| 101.DEF | Inline XBRL Taxonomy Extension Definition Linkbase Document, filed herewith electronically | | | |
| | | | |
| 104 | Cover Page Interactive Data File (Inline XBRL), filed herewith electronically | | | |
| | | | |
| | | | | | | | | | | | | | | | | | | | |
| | | | Incorporated by Reference |
| | | Exhibit | Form | Exhibit | Filing Date |
| 3.1 | | | | 8-K | 3.1 | May 31, 2005 |
| | | | | | |
| 3.2 | | | | 8-K | 3.1 | September 21, 2023 |
| | | | | | |
| 4.1 | | | | S-3 | 4.4 | April 30, 2001 |
| | | | | | |
| 4.2 | | | | S-3/A | 4.1 | March 10, 1998 |
| | | | | | |
| 4.3 | | | | S-4/A | 4.1 | April 29, 2014 |
| | | | | | |
| 4.4 | | | | S-4 | 4.2 | March 28, 2014 |
| | | | | | |
| 4.5 | | | | S-4 | 4.3 | March 28, 2014 |
| | | | | | |
| 4.6 | | | | S-4 | 4.4 | March 28, 2014 |
| | | | | | |
| 4.7 | | | | 8-K | 4.2 | December 3, 2007 |
| | | | | | |
| 4.8 | | | | 8-K | 4.1 | March 9, 2017 |
| | | | | | |
| 4.9 | | | | 8-K | 4.2 | March 9, 2017 |
| | | | | | |
| 4.10 | | | | 8-K | 4.1 | November 6, 2019 |
| | | | | | |
| 4.11 | | | | 10-Q | 4.2 | September 3, 2021 |
| | | | | | |
| 4.12 | | | | 10-Q | 4.3 | September 3, 2021 |
| | | | | | |
| 4.13 | * | | | S-8 | 4.1 | August 27, 2014 |
| | | | | | |
| 4.14 | | | | 8-K | 4.1 | September 20, 2022 |
| | | | | | |
| 4.15 | | | | 8-K | 4.1 | August 21, 2023 |
| | | | | | |
| 10.1 | * | | | DEF 14A | Appendix B | April 7, 2020 |
| | | | | | |
| 10.2 | * | | | DEF 14A | Appendix B | April 28, 2023 |
| | | | | | |
| 10.3 | * | | | DEF 14A | Appendix C | April 28, 2023 |
| | | | | | |
| 10.4 | * | | | 10-Q | 10.2 | June 4, 2021 |
| | | | | | |
| 10.5 | * | | | 11-K | 99.3 | June 10, 2022 |
| | | | | | |
| 10.6 | * | | | 10-K | 10.2 | March 10, 2023 |
| | | | | | |
| 10.7 | * | | | 10-Q | 10.2 | September 2, 2022 |
| | | | | | |
| 10.8 | * | | | 8-K | 10.1 | March 4, 2014 |
| | | | | | |
| 10.9 | * | | | 8-K | 10.1 | February 19, 2015 |
| | | | | | |
| 10.10 | * | | | 8-K | 10.1 | March 1, 2016 |
| | | | | | |
| 10.11 | * | | | 10-Q | 10.2 | August 30, 2016 |
| | | | | | |
| 10.12 | * | | | 8-K | 10.1 | February 23, 2017 |
| | | | | | |
| 10.13 | * | | | 8-K | 10.1 | March 4, 2019 |
| | | | | | |
| 10.14 | * | | | 8-K | 10.2 | March 4, 2019 |
| | | | | | |
| 10.15 | * | | | 8-K | 10.1 | March 3, 2020 |
| | | | | | |
| 10.16 | * | | | 10-Q | 10.5 | June 10, 2020 |
| | | | | | |
Nordstrom, Inc. and subsidiaries 6977
| | | | | | | | | | | | | | | | | | | | |
| | | | Incorporated by Reference |
| | | Exhibit | Form | Exhibit | Filing Date |
| 10.17 | * | | | 8-K | 10.1 | March 6, 2023 |
| | | | | | |
| 10.18 | * | | | DEF 14A | Appendix A | April 8, 2010 |
| | | | | | |
| 10.19 | * | | | DEF 14A | Appendix A | April 1, 2013 |
| | | | | | |
| 10.20 | * | | | 8-K | 10.4 | March 4, 2014 |
| | | | | | |
| 10.21 | * | | | DEF 14A | Appendix A | April 5, 2017 |
| | | | | | |
| 10.22 | * | | | 10-K | 10.23 | March 20, 2020 |
| | | | | | |
| 10.23 | * | | | 8-K | 10.2 | February 28, 2022 |
| | | | | | |
| 10.24 | * | | | 8-K | 10.2 | March 6, 2023 |
| | | | | | |
| 10.25 | * | | | 8-K | 10.2 | March 5, 2024 |
| | | | | | |
| 10.26 | * | | | 10-Q | 10.1 | September 4, 2020 |
| | | | | | |
| 10.27 | | | | 10-K | 10.48 | March 19, 2018 |
| | | | | | |
| 10.28 | | | | 10-K | 10.78 | March 18, 2011 |
| | | | | | |
| 10.29 | | | | 10-Q | 10.1 | December 1, 2023 |
| | | | | | |
| 10.30 | * | | | 8-K | 10.2 | March 3, 2020 |
| | | | | | |
| 10.31 | * | | | 8-K | 10.1 | May 20, 2022 |
| | | | | | |
| 10.32 | * | | | 8-K | 10.1 | May 10, 2023 |
| | | | | | |
| 10.33 | * | | | 8-K | 10.1 | March 5, 2024 |
| | | | | | |
| 10.34 | | | | 10-Q | 10.2 | June 3, 2022 |
| | | | | | |
| 10.35 | | | | 10-K | 10.30 | March 10, 2023 |
| | | | | | |
| 10.36 | | | | 10-Q | 10.1 | December 1, 2015 |
| | | | | | |
| 10.37 | | | | 10-Q | 10.1 | December 2, 2022 |
| | | | | | |
| 19.1 | † | | | | | |
| | | | | | |
| 21.1 | † | | | | | |
| | | | | | |
| 23.1 | | | | | | |
| | | | | | |
| 31.1 | † | | | | | |
| | | | | | |
| 31.2 | † | | | | | |
| | | | | | |
| 32.1 | ‡ | | | | | |
| | | | | | |
| 97.1 | † | | | | | |
| | | | | | |
| 101.INS | † | | Inline XBRL Instance Document | | | |
| | | | | | |
| 101.SCH | † | | Inline XBRL Taxonomy Extension Schema Document | | | |
| | | | | | |
| | | | | | | | | | | | | | | | | | | | |
| | | | Incorporated by Reference |
| | | Exhibit | Form | Exhibit | Filing Date |
| 101.CAL | † | | Inline XBRL Taxonomy Extension Calculation Linkbase Document | | | |
| | | | | | |
| 101.LAB | † | | Inline XBRL Taxonomy Extension Labels Linkbase Document | | | |
| | | | | | |
| 101.PRE | † | | Inline XBRL Taxonomy Extension Presentation Linkbase Document | | | |
| | | | | | |
| 101.DEF | † | | Inline XBRL Taxonomy Extension Definition Linkbase Document | | | |
| | | | | | |
| 104 | † | | Cover Page Interactive Data File (Inline XBRL) | | | |
| | | | | | |
| * Management contract, compensatory plan or arrangement |
| † Filed herewith electronically |
| ‡ Furnished herewith electronically |
Nordstrom, Inc. and subsidiaries79
SIGNATURES
Pursuant to the requirements of Section 13 or 15(d) of the Securities Exchange Act of 1934, the registrant has duly caused this report to be signed on its behalf by the undersigned, thereunto duly authorized.
| | | | | | | | | | | |
| NORDSTROM, INC. | |
| (Registrant) | |
| | | |
| | /s/ | Anne L. BrammanCathy R. Smith |
| | | Anne L. BrammanCathy R. Smith |
| | Chief Financial Officer |
| (Principal Financial Officer and Principal Accounting Officer) |
Date: March 11, 202219, 2024
Pursuant to the requirements of the Securities Exchange Act of 1934, this report has been signed below by the following persons on behalf of the registrant and in the capacities and on the datedates indicated.
| | | | | | | | | | | | | | |
| Principal Financial Officer and Principal Accounting Officer: | | Principal Executive Officer: |
| | | | |
| /s/ | Anne L. BrammanCathy R. Smith | | /s/ | Erik B. Nordstrom |
| Anne L. BrammanCathy R. Smith | | | Erik B. Nordstrom |
| Chief Financial Officer | | | Chief Executive Officer |
| Date: | March 19, 2024 | | Date: | | March 19, 2024 |
| Principal Accounting Officer: | | | |
| | | | |
| /s/ | Michael W. Maher | | |
| | Michael W. Maher | | |
| Chief Accounting Officer | | | |
| | | |
| | | | |
| Directors: | | | |
| | | | |
/s/ | Shellye L. Archambeau | | /s/ | Stacy Brown-Philpot |
| Shellye L. Archambeau | | | Stacy Brown-Philpot |
| Director | | | Director |
| | | | |
| /s/ | James L. Donald |
| Stacy Brown-Philpot | | | James L. Donald |
| Director | | | Director |
| Date: | March 15, 2024 | | Date: | March 15, 2024 |
| | | | |
| /s/ | Kirsten A. Green |
| James L. Donald | | | Kirsten A. Green |
| Director | | | Director |
| | | | |
| /s/ | Glenda G. McNeal |
| Kirsten A. Green | | | Glenda G. McNeal |
| Director | | | Director |
| Date: | March 15, 2024 | | Date: | March 15, 2024 |
| | | | |
| /s/ | Erik B. Nordstrom |
| Glenda G. McNeal | | | Erik B. Nordstrom |
| Director | | | Director |
| | | | |
| /s/ | Peter E. Nordstrom |
| /s/Erik B. Nordstrom | | Brad D. Smith
| Peter E. Nordstrom | | | Brad D. Smith |
| Director | | | Director |
| Date: | March 19, 2024 | | Date: | March 19, 2024 |
| | | | |
| /s/ | Amie Thuener O’Toole | | /s/ | Guy B. Persaud |
| Amie Thuener O’Toole | | | Guy B. Persaud |
| Director | | | Director |
| Date: | March 15, 2024 | | Date: | March 15, 2024 |
| | | | |
| /s/ | Eric D. Sprunk | | /s/ | Bradley D. Tilden |
| Eric D. Sprunk | | | Bradley D. Tilden |
| Director | | | Chairman of the Board of Directors |
| Date: | March 15, 2024 | | Date: | | March 15, 2024 |
| /s/ | Bradley D. Tilden | | |
| /s/ | Mark J. Tritton | | /s/ | Atticus N. Tysen |
| Bradley D. Tilden | | | Mark J. Tritton | | | Atticus N. Tysen |
| Director | | | Director |
| | | | |
| | | | |
| | | | |
| | | | |
| | | | |
| | | | |
| | | | |
| | | | |
| | | | |
| | | | |
| Date: | March 11, 202215, 2024 | | Date: | March 15, 2024 |
| | | | |
| | | | |
| | | | |
| | | | |
| | | | |
| | | | |
| | | | |
| | | | |
| | | | |
CONSENT OF INDEPENDENT REGISTERED PUBLIC ACCOUNTING FIRM
We consent to the incorporation by reference in Registration Statement Nos. 333-239087, 333-239086, 333-239083, 333-231969, 333-225295, 333-211825, 333-207396, 333-198413, 333-189301, 333-166961, 333-161803, 333-275859, 333-275861, 333-275864, on Form S-8 and Registration Statement No. 333-230379 on Form S-3 of our reports dated March 11, 2022,19, 2024, relating to the financial statements of Nordstrom Inc. and subsidiaries, and the effectiveness of Nordstrom, Inc. and subsidiaries’ internal control over financial reporting, appearing in the Annual Report on Form 10-K of Nordstrom, Inc. for the year ended January 29, 2022.February 3, 2024.
/s/ Deloitte & Touche LLP
Seattle, Washington
March 11, 202219, 2024
Nordstrom, Inc. and subsidiaries 7181