0000072741us-gaap:OtherPostretirementBenefitPlansDefinedBenefitMemberus-gaap:PrivateEquityFundsMember2022-12-31StateAndLocalJurisdictionMembersrt:ParentCompanyMember2022-01-012022-12-31
| | | | | | | | |
| |
| UNITED STATES
SECURITIES AND EXCHANGE COMMISSION
WASHINGTON, D.C. 20549 |
| FORM | 10-K |
| | |
| ☒ | ANNUAL REPORT PURSUANT TO SECTION 13 OR 15(d) OF THE
SECURITIES EXCHANGE ACT OF 1934 |
|
For the fiscal year ended | December 31, 20222023 |
| or |
| ☐ | TRANSITION REPORT PURSUANT TO SECTION 13 OR 15(d) OF THE
SECURITIES EXCHANGE ACT OF 1934 |
|
For the transition period from ____________ to ____________ |
Registrant; State of Incorporation; Address; Telephone Number;
Commission File Number; and I.R.S. Employer Identification No.
EVERSOURCE ENERGY
(a Massachusetts voluntary association)
300 Cadwell Drive, Springfield, Massachusetts 01104
Telephone: (800) 286-5000
Commission File Number: 001-05324
I.R.S. Employer Identification No. 04-2147929
THE CONNECTICUT LIGHT AND POWER COMPANY
(a Connecticut corporation)
107 Selden Street, Berlin, Connecticut 06037-1616
Telephone: (800) 286-5000
Commission File Number: 000-00404
I.R.S. Employer Identification No. 06-0303850
NSTAR ELECTRIC COMPANY
(a Massachusetts corporation)
800 Boylston Street, Boston, Massachusetts 02199
Telephone: (800) 286-5000
Commission File Number: 001-02301
I.R.S. Employer Identification No. 04-1278810
PUBLIC SERVICE COMPANY OF NEW HAMPSHIRE
(a New Hampshire corporation)
Energy Park
780 North Commercial Street, Manchester, New Hampshire 03101-1134
Telephone: (800) 286-5000
Commission File Number: 001-06392
I.R.S. Employer Identification No. 02-0181050
| | | | | | | | | | | | | | |
| Securities registered pursuant to Section 12(b) of the Act: |
| | | | |
| Title of each class | | Trading Symbol(s) | | Name of each exchange on which registered |
| Common Shares, $5.00 par value per share | | ES | | New York Stock Exchange |
Securities registered pursuant to Section 12(g) of the Act:
| | | | | | | | | | | | | | |
Registrant | Title of Class |
| | | | |
The Connecticut Light and Power Company | Preferred Stock, par value $50.00 per share, issuable in series, of which the following series are outstanding: |
| $1.90
$2.00
$2.04
$2.20
3.90%
$2.06
$2.09
4.50%
4.96%
4.50%
5.28%
$3.24
6.56% | Series
Series
Series
Series
Series
Series E
Series F
Series
Series
Series
Series
Series G
Series | of 1947
of 1947
of 1949
of 1949
of 1949
of 1954
of 1955
of 1956
of 1958
of 1963
of 1967
of 1968
of 1968 |
| |
NSTAR Electric Company | Preferred Stock, par value $100.00 per share, issuable in series, of which the following series are outstanding: |
| | 4.25%
4.78% | Series
Series | of 1956
of 1958 |
Indicate by check mark if the registrants are well-known seasoned issuers, as defined in Rule 405 of the Securities Act.
Indicate by check mark if the registrants are not required to file reports pursuant to Section 13 or Section 15(d) of the Act.
Indicate by check mark whether the registrants (1) have filed all reports required to be filed by Section 13 or 15(d) of the Securities Exchange Act of 1934 during the preceding 12 months (or for such shorter period that the registrants were required to file such reports), and (2) have been subject to such filing requirements for the past 90 days.
Indicate by check mark whether the registrants have submitted electronically every Interactive Data File required to be submitted pursuant to Rule 405 of Regulation S-T (§ 232.405 of this chapter) during the preceding 12 months (or for such shorter period that the registrants were required to submit such files).
Indicate by check mark whether the registrant is a large accelerated filer, an accelerated filer, a non-accelerated filer, a smaller reporting company, or an emerging growth company. See the definitions of “large accelerated filer,” “accelerated filer,” “smaller reporting company,” and “emerging growth company” in Rule 12b-2 of the Exchange Act.
| | | | | | | | | | | | | | | | | | | | | | | | | | | | | | | | |
| Eversource Energy | Large accelerated filer | ☒ | Accelerated
filer | ☐ | Non-accelerated
filer | ☐ | Smaller reporting company | ☐ | Emerging growth company | ☐ |
| The Connecticut Light and Power Company | Large accelerated filer | ☐ | Accelerated
filer | ☐ | Non-accelerated filer | ☒ | Smaller reporting company | ☐ | Emerging growth company | ☐ |
| NSTAR Electric Company | Large accelerated filer | ☐ | Accelerated
filer | ☐ | Non-accelerated filer | ☒ | Smaller reporting company | ☐ | Emerging growth company | ☐ |
| Public Service Company of New Hampshire | Large accelerated filer | ☐ | Accelerated
filer | ☐ | Non-accelerated filer | ☒ | Smaller reporting company | ☐ | Emerging growth company | ☐ |
If an emerging growth company, indicate by check mark if the registrant has elected not to use the extended transition period for complying with any new or revised financial accounting standards provided pursuant to Section 13(a) of the Exchange Act. ¨
Indicate by check mark whether the registrant has filed a report on and attestation to its management's assessment of the effectiveness of its internal control over financial reporting under Section 404(b) of the Sarbanes-Oxley Act (15 U.S.C. 7262(b)) by the registered public accounting firm that prepared or issued its audit report. ☒
If securities are registered pursuant to Section 12(b) of the Act, indicate by check mark whether the financial statements of the registrant included in the filing reflect the correction of an error to previously issued financial statements. ☐
Indicate by check mark whether any of those error corrections are restatements that required a recovery analysis of incentive-based compensation received by any of the registrant’s executive officers during the relevant recovery period pursuant to §240.10D-1(b). ☐
Indicate by check mark whether the registrants are shell companies (as defined in Rule 12b-2 of the Exchange Act):
| | | | | | | | |
| | Yes | No |
| Eversource Energy | ☐ | ☒ |
| The Connecticut Light and Power Company | ☐ | ☒ |
| NSTAR Electric Company | ☐ | ☒ |
| Public Service Company of New Hampshire | ☐ | ☒ |
The aggregate market value of Eversource Energy's Common Shares, $5.00 par value, held by non-affiliates, computed by reference to the price at which the common equity was last sold, or the average bid and asked price of such common equity, as of the last business day of Eversource Energy's most recently completed second fiscal quarter (June 30, 2022)2023) was $29,211,450,455$24,734,207,777 based on a closing market price of $84.47$70.92 per share for the 345,820,415348,762,095 common shares outstanding held by non-affiliates on June 30, 2022.2023.
Indicate the number of shares outstanding of each of the registrant's classes of common stock, as of the latest practicable date:
| | | | | | | | |
| Company - Class of Stock | Outstanding as of January 31, 20232024 |
Eversource Energy
Common Shares, $5.00 par value | 348,483,425349,687,183 | | shares |
| | |
The Connecticut Light and Power Company
Common Stock, $10.00 par value | 6,035,205 | | shares |
| | |
NSTAR Electric Company
Common Stock, $1.00 par value | 200 | | shares |
| | | |
Public Service Company of New Hampshire
Common Stock, $1.00 par value | 301 | | shares |
Eversource Energy holds all of the 6,035,205 shares, 200 shares, and 301 shares of the outstanding common stock of The Connecticut Light and Power Company, NSTAR Electric Company and Public Service Company of New Hampshire, respectively.
The Connecticut Light and Power Company, NSTAR Electric Company and Public Service Company of New Hampshire each meet the conditions set forth in General Instruction I(1)(a) and (b) of Form 10-K, and each is therefore filing this Form 10-K with the reduced disclosure format specified in General Instruction I(2) of Form 10‑K.
Eversource Energy, The Connecticut Light and Power Company, NSTAR Electric Company and Public Service Company of New Hampshire each separately file this combined Form 10-K. Information contained herein relating to any individual registrant is filed by such registrant on its own behalf. Each registrant makes no representation as to information relating to the other registrants.
Documents Incorporated by Reference
Portions of the Eversource Energy and Subsidiaries 20212022 combined Annual Report on Form 10-K and portions of the Proxy Statement relating to the Annual Meeting of Shareholders to be held on May 3, 2023,1, 2024, are incorporated by reference into Parts II and III of this Report.
GLOSSARY OF TERMS
The following is a glossary of abbreviations and acronyms that are found in this report:
| | | | | |
| Current or former Eversource Energy companies, segments or investments: |
| Eversource, ES or the Company | Eversource Energy and subsidiaries |
| Eversource parent or ES parent | Eversource Energy, a public utility holding company |
| ES parent and other companies | ES parent and other companies are comprised of Eversource parent, Eversource Service, and other subsidiaries, which primarily includes our unregulated businesses, HWP Company, The Rocky River Realty Company (a real estate subsidiary), the consolidated operations of CYAPC and YAEC, and Eversource parent's equity ownership interests that are not consolidated |
| CL&P | The Connecticut Light and Power Company |
| NSTAR Electric | NSTAR Electric Company |
| PSNH | Public Service Company of New Hampshire |
| PSNH Funding | PSNH Funding LLC 3, a bankruptcy remote, special purpose, wholly-owned subsidiary of PSNH |
| NSTAR Gas | NSTAR Gas Company |
| EGMA | Eversource Gas Company of Massachusetts |
| Yankee Gas | Yankee Gas Services Company |
| Aquarion | Aquarion Company and its subsidiaries |
| HEEC | Harbor Electric Energy Company, a wholly-owned subsidiary of NSTAR Electric |
| Eversource Service | Eversource Energy Service Company |
| North East Offshore | North East Offshore, LLC, an offshore wind business being developed jointly by Eversource and Denmark-based Ørsted |
| CYAPC | Connecticut Yankee Atomic Power Company |
| MYAPC | Maine Yankee Atomic Power Company |
| YAEC | Yankee Atomic Electric Company |
| Yankee Companies | CYAPC, YAEC and MYAPC |
| Regulated companies | The Eversource regulated companies are comprised of the electric distribution and transmission businesses of CL&P, NSTAR Electric and PSNH, the natural gas distribution businesses of Yankee Gas, NSTAR Gas and EGMA, Aquarion’s water distribution businesses, and the solar power facilities of NSTAR Electric |
| Regulators and Government Agencies: |
| BOEM | U.S. Bureau of Ocean Energy Management |
| DEEP | Connecticut Department of Energy and Environmental Protection |
| DOE | U.S. Department of Energy |
| DOER | Massachusetts Department of Energy Resources |
| DPU | Massachusetts Department of Public Utilities |
| EPA | U.S. Environmental Protection Agency |
| FERC | Federal Energy Regulatory Commission |
| ISO-NE | ISO New England, Inc., the New England Independent System Operator |
| MA DEP | Massachusetts Department of Environmental Protection |
| NHPUC | New Hampshire Public Utilities Commission |
| PURA | Connecticut Public Utilities Regulatory Authority |
| SEC | U.S. Securities and Exchange Commission |
| Other Terms and Abbreviations: |
| ADIT | Accumulated Deferred Income Taxes |
| AFUDC | Allowance For Funds Used During Construction |
| AOCI | Accumulated Other Comprehensive Income |
| ARO | Asset Retirement Obligation |
| Bcf | Billion cubic feet |
| CfD | Contract for Differences |
| CWIP | Construction Work in Progress |
| EDC | Electric distribution company |
| EDIT | Excess Deferred Income Taxes |
| EPS | Earnings Per Share |
| ERISA | Employee Retirement Income Security Act of 1974 |
| | | | | |
| ESOP | Employee Stock Ownership Plan |
Eversource 20212022 Form 10-K | The Eversource Energy and Subsidiaries 20212022 combined Annual Report on Form 10-K as filed with the SEC |
| Fitch | Fitch Ratings, Inc. |
| | | | | |
| FMCC | Federally Mandated Congestion Charge |
| GAAP | Accounting principles generally accepted in the United States of America |
| GWh | Gigawatt-Hours |
| IPP | Independent Power Producers |
| ISO-NE Tariff | ISO-NE FERC Transmission, Markets and Services Tariff |
| kV | Kilovolt |
| kVa | Kilovolt-ampere |
| kW | Kilowatt (equal to one thousand watts) |
| LNG | Liquefied natural gas |
| LPG | Liquefied petroleum gas |
| LRS | Supplier of last resort service |
| MG | Million gallons |
| MGP | Manufactured Gas Plant |
| MMBtu | One millionMillion British thermal units |
| MMcf | Million cubic feet |
| Moody's | Moody's Investors Services, Inc. |
| MW | Megawatt |
| MWh | Megawatt-Hours |
| NETOs | New England Transmission Owners (including Eversource, National Grid and Avangrid) |
| OCI | Other Comprehensive Income/(Loss) |
| OREC | Offshore Wind Renewable Energy Certificate |
| PAM | Pension and PBOP Rate Adjustment Mechanism |
| PBOP | Postretirement Benefits Other Than Pension |
| PBOP Plan | Postretirement Benefits Other Than Pension Plan |
| Pension Plan | Single uniform noncontributory defined benefit retirement plan |
| PPA | Power purchase agreement |
| PPAM | Pole Plant Adjustment Mechanism |
| RECs | Renewable Energy Certificates |
| Regulatory ROE | The average cost of capital method for calculating the return on equity related to the distribution business segment excluding the wholesale transmission segment |
| ROE | Return on Equity |
| RRBs | Rate Reduction Bonds or Rate Reduction Certificates |
| RSUs | Restricted share units |
| S&P | Standard & Poor's Financial Services LLC |
| SERP | Supplemental Executive Retirement Plans and non-qualified defined benefit retirement plans |
| SS | Standard service |
| UI | The United Illuminating Company |
| VIE | Variable Interest Entity |
EVERSOURCE ENERGY AND SUBSIDIARIES
THE CONNECTICUT LIGHT AND POWER COMPANY
NSTAR ELECTRIC COMPANY AND SUBSIDIARY
PUBLIC SERVICE COMPANY OF NEW HAMPSHIRE AND SUBSIDIARIES
20222023 FORM 10-K ANNUAL REPORT
TABLE OF CONTENTS
| | | | | | | | |
| | Page |
| PART I | |
| Item 1. | | |
| Item 1A. | | |
| Item 1B. | | |
| Item 1C. | | |
| Item 2. | | |
| Item 3. | | |
| Item 4. | | |
| | |
| | | |
| PART II | |
| Item 5. | | |
| Item 6. | | |
| Item 7. | | |
| Item 7A. | | |
| Item 8. | | |
| Item 9. | | |
| Item 9A. | | |
| Item 9B. | | |
| | | |
| PART III | |
| Item 10. | | |
| Item 11. | | |
| Item 12. | | |
| Item 13. | | |
| Item 14. | | |
| | | |
| PART IV | |
| Item 15. | | |
| Item 16. | | |
| |
EVERSOURCE ENERGY AND SUBSIDIARIES
THE CONNECTICUT LIGHT AND POWER COMPANY
NSTAR ELECTRIC COMPANY AND SUBSIDIARY
PUBLIC SERVICE COMPANY OF NEW HAMPSHIRE AND SUBSIDIARIES
SAFE HARBOR STATEMENT UNDER THE PRIVATE SECURITIES
LITIGATION REFORM ACT OF 1995
References in this Annual Report on Form 10-K to "Eversource," the "Company," "we," "our," and "us" refer to Eversource Energy and its consolidated subsidiaries. CL&P, NSTAR Electric, and PSNH are each doing business as Eversource Energy.
We make statements concerning our expectations, beliefs, plans, objectives, goals, strategies, assumptions of future events, future financial performance or growth and other statements that are not historical facts. These statements are "forward-looking statements" within the meaning of the Private Securities Litigation Reform Act of 1995.U.S. federal securities laws. You can generally identify our forward-looking statements through the use of words or phrases such as "estimate," "expect," "anticipate," "intend," "plan," "project," "believe," "forecast," "would," "should," "could," and other similar expressions. Forward-looking statements involve risks and uncertainties that may cause actual results or outcomes to differ materially from those included in our forward-looking statements. Forward-looking statements are based on the current expectations, estimates, assumptions or projections of management and are not guarantees of future performance. These expectations, estimates, assumptions or projections may vary materially from actual results. Accordingly, any such statements are qualified in their entirety by reference to, and are accompanied by, the following important factors that may cause our actual results or outcomes to differ materially from those contained in our forward-looking statements, including, but not limited to:
•cyberattacks or breaches, including those resulting in the compromise of the confidentiality of our proprietary information and the personal information of our customers,
•our ability to complete the offshore wind investments sales process on the timelines, terms and pricing we expect; if we and the counterparties are unable to satisfy all closing conditions and consummate the purchase and sale transactions with respect to our offshore wind assets; if Sunrise Wind does not win in the OREC contract solicitation process; if we are unable to qualify for investment tax credits related to these projects; if we experience variability in the projected construction costs of the offshore wind projects, if there is a deterioration of market conditions in the offshore wind industry; and if the projects do not commence operation as scheduled or within budget or are not completed,
•disruptions in the capital markets or other events that make our access to necessary capital more difficult or costly,
• changes in economic conditions, including impact on interest rates, tax policies, and customer demand and payment ability,
• ability or inability to commence and complete our major strategic development projects and opportunities,
• acts of war or terrorism, physical attacks or grid disturbances that may damage and disrupt our electric transmission and electric,
natural gas, and water distribution systems,
• actions or inaction of local, state and federal regulatory, public policy and taxing bodies,
• substandard performance of third-party suppliers and service providers,
• fluctuations in weather patterns, including extreme weather due to climate change,
• changes in business conditions, which could include disruptive technology or development of alternative energy sources related to our
current or future business model,
• contamination of, or disruption in, our water supplies,
• changes in levels or timing of capital expenditures,
• changes in laws, regulations or regulatory policy, including compliance with environmental laws and regulations,
• changes in accounting standards and financial reporting regulations,
• actions of rating agencies, and
• other presently unknown or unforeseen factors.
Other risk factors are detailed in our reports filed with the SEC and are updated as necessary and available on our website at www.eversource.com and on the SEC’s website at www.sec.gov, and we encourage you to consult such disclosures.
All such factors are difficult to predict and contain uncertainties that may materially affect our actual results, many of which are beyond our control. You should not place undue reliance on the forward-looking statements, as each speaks only as of the date on which such statement is made, and, except as required by federal securities laws, we undertake no obligation to update any forward-looking statement or statements to reflect events or circumstances after the date on which such statement is made or to reflect the occurrence of unanticipated events. New factors emerge from time to time and it is not possible for us to predict all of such factors, nor can we assess the impact of each such factor on the business or the extent to which any factor, or combination of factors, may cause actual results to differ materially from those contained in any forward-looking statements. For more information, see Item 1A, Risk Factors, included in this combined Annual Report on Form 10-K. This Annual Report on Form 10-K also describes material contingencies and critical accounting policies in the accompanying Management's Discussion and Analysis of Financial Condition and Results of Operations and Combined Notes to Financial Statements. We encourage you to review these items.
EVERSOURCE ENERGY AND SUBSIDIARIES
THE CONNECTICUT LIGHT AND POWER COMPANY
NSTAR ELECTRIC COMPANY AND SUBSIDIARY
PUBLIC SERVICE COMPANY OF NEW HAMPSHIRE AND SUBSIDIARIES
PART I
Item 1. Business
Please refer to the Glossary of Terms for definitions of defined terms and abbreviations used in this combined Annual Report on Form 10-K.
Eversource Energy (Eversource), headquartered in Boston, Massachusetts and Hartford, Connecticut, is a public utility holding company subject to regulation by the Federal Energy Regulatory Commission (FERC) under the Public Utility Holding Company Act of 2005. We are engaged primarily in the energy delivery business through the following wholly-owned utility subsidiaries:
•The Connecticut Light and Power Company (CL&P), a regulated electric utility that serves residential, commercial and industrial customers in parts of Connecticut;
•NSTAR Electric Company (NSTAR Electric), a regulated electric utility that serves residential, commercial and industrial customers in parts of eastern and western Massachusetts and owns solar power facilities, and its wholly-owned subsidiary Harbor Electric Energy Company (HEEC), also a regulated electric utility that distributes electric energy to its sole customer;
•Public Service Company of New Hampshire (PSNH), a regulated electric utility that serves residential, commercial and industrial customers in parts of New Hampshire;
•NSTAR Gas Company (NSTAR Gas), a regulated natural gas utility that serves residential, commercial and industrial customers in parts of Massachusetts;
•Eversource Gas Company of Massachusetts (EGMA), a regulated natural gas utility that serves residential, commercial and industrial customers in parts of Massachusetts;
•Yankee Gas Services Company (Yankee Gas), a regulated natural gas utility that serves residential, commercial and industrial customers in parts of Connecticut; and
•Aquarion Company (Aquarion), a utility holding company that owns five separate regulated water utility subsidiaries and collectively serves residential, commercial, industrial, and municipal and fire protection customers in parts of Connecticut, Massachusetts and New Hampshire.
CL&P, NSTAR Electric and PSNH also serve New England customers through Eversource Energy'sEversource's electric transmission business. Along with NSTAR Gas, EGMA and Yankee Gas, each is doing business as Eversource Energy in its respective service territory.
Eversource, Energy, CL&P, NSTAR Electric and PSNH each report their financial results separately. We also include information in this report on a segment basis for Eversource. Eversource Energy. Eversource Energy has four reportable segments: electric distribution, electric transmission, natural gas distribution and water distribution. These segments represent substantially all of Eversource Energy'sEversource's total consolidated revenues. CL&P, NSTAR Electric and PSNH do not report separate business segments.
Eversource Energy also has an offshore wind business, which includes a 50 percent ownership interestinterests in three offshore wind projects that are being developed and constructed through a joint and equal partnership with Ørsted.tax equity investment in one of the projects. For further information, see "Offshore Wind Business” below.
ELECTRIC DISTRIBUTION SEGMENT
Eversource Energy'sEversource's electric distribution segment consists of the distribution businesses of CL&P, NSTAR Electric and PSNH, which are engaged in the distribution of electricity to retail customers in Connecticut, Massachusetts and New Hampshire, respectively, and the solar power facilities of NSTAR Electric.
ELECTRIC DISTRIBUTION – CONNECTICUT – THE CONNECTICUT LIGHT AND POWER COMPANY
CL&P's distribution business consists primarily of the purchase, delivery and sale of electricity to its residential, commercial and industrial customers. As of December 31, 2022,2023, CL&P furnished retail franchise electric service to approximately 1.28 million customers in 149157 cities and towns in Connecticut, covering an area of approximately 4,400 square miles.Connecticut. CL&P does not own any electric generation facilities.
Rates
CL&P is subject to regulation by the Connecticut Public Utilities Regulatory Authority (PURA), which, among other things, has jurisdiction over rates, certain dispositions of property and plant, mergers and consolidations, issuances of long-term securities, standards of service and construction and operation of facilities. CL&P's present general rate structure consists of various rate and service classifications covering residential, commercial and industrial services. CL&P's retail rates include a delivery service component, which includes distribution, transmission, conservation, renewable energy programs and other charges that are assessed on all customers.
Under Connecticut law, all of CL&P's customers are entitled to choose their energy suppliers, while CL&P remains their electric distribution company. For those customers who do not choose a competitive energy supplier, CL&P purchases power on behalf of, and passes the related cost without mark-up through to, those customers under standard service (SS) rates for customers with less than 500 kilowatts of demand (residential customers and small and medium commercial and industrial customers), and supplier of last resort service (LRS) rates for customers with 500 kilowatts or more of demand (larger commercial and industrial customers). CL&P charges customers only the amount that it pays generators for producing electricity and does not earn a profit on the cost of electricity.
The rates established by PURA for CL&P are comprised of the following:
•An electric generation service charge, which recovers energy-related costs incurred as a result of providing electric generation service supply to all customers who have not migrated to competitive energy suppliers. The generation service charge is adjusted periodically and reconciled annually in accordance with the policies and procedures of the PURA, with any differences refunded to, or recovered from, customers.
•A distribution charge, which includes a fixed customer charge and a demand and/or energy charge to collect the costs of building and expanding the infrastructure to deliver electricity to customers, as well as ongoing operating costs to maintain the infrastructure.
•A revenue decoupling adjustment that reconciles annual base distribution rate recovery amounts recovered from customers to the pre-established level of baseline distribution delivery service revenue requirement approved by PURA.
•An Electric System Improvements (ESI) charge, which collects the costs of building and expanding the infrastructure to deliver electricity to customers above the level recovered through the distribution charge. The ESI also recovers costs associated with CL&P’s system resiliency program. The ESI is adjusted periodically and reconciled annually in accordance with the policies and procedures of the PURA, with any differences refunded to, or recovered from, customers.
•A Federally Mandated Congestion Charge (FMCC), which recovers any costs imposed by the FERC as part of the New England Standard Market Design, including locational marginal pricing, locational installed capacity payments, any costs approved by PURA to reduce these charges, as well as other costs approved by PURA. The FMCC has both a bypassable component and a non-bypassable component, and is adjusted periodically and reconciled annually in accordance with the policies and procedures of the PURA, with any differences refunded to, or recovered from, customers.
•A transmission charge that recovers the cost of transporting electricity over high-voltage lines from generating plants to substations, including costs allocated by ISO-NE to maintain the wholesale electric market. The transmission charge is adjusted periodically and reconciled annually to actual costs incurred, and reviewed by PURA, with any difference refunded to, or recovered from, customers.
•A Competitive Transition Assessment (CTA) charge, assessed to recover stranded costs associated with electric industry restructuring such as various IPP contracts. The CTA is reconciled annually to actual costs incurred and reviewed by PURA, with any difference refunded to, or recovered from, customers.
•A Systems Benefits Charge (SBC), established to fund expenses associated with various hardship and low-income programs. The SBC is reconciled annually to actual costs incurred, and reviewed by PURA, with any difference refunded to, or recovered from, customers.
•A Renewable Energy Investment Charge, which is used to promote investment in renewable energy sources. Amounts collected by this charge are deposited into the Connecticut Clean Energy Fund and administered by the Connecticut Green Bank.
•A Conservation Adjustment Mechanism (CAM) charge established to implement cost-effective energy conservation programs and market transformation initiatives. The CAM charge is reconciled annually to actual costs incurred, and reviewed by PURA, with any difference refunded to, or recovered from, customers through an approved adjustment to the following year’s energy conservation spending plan budget.
As required by regulation, CL&P has entered into long-term contracts for the purchase of (i) products from renewable energy facilities, which may include energy, renewable energy certificates, or capacity, (ii) capacity-related contracts with generation facilities, and (iii) contracts for peaking capacity. Some of these contracts are subject to sharing agreements with UI, whereby CL&P is responsible for 80 percent and UI for 20 percent of the net costs or benefits. CL&P's portion of the costs and benefits of these contracts will be paid by, or refunded to, CL&P's customers.
Distribution Rate Case: CL&P's distribution rates were established in an April 2018 PURA-approved rate case settlement agreement with rates effective May 1, 2018, and incremental step adjustments effective May 1, 2019 and May 1, 2020.
CL&P Settlement Agreement: On October 1, 2021, CL&P entered into a settlement agreement with the DEEP, Office of Consumer Counsel, Office of the Attorney General and the Connecticut Industrial Energy Consumers, resolving certain issues that arose in then-pending regulatory proceedings initiated by PURA. PURA approved the settlement agreement on October 27, 2021. In accordance with thea 2021 settlement agreement, CL&P agreed that its current base distribution rates shallwould be frozen, subject to certain customer credits, until no earlier than January 1, 2024. The rate freeze appliesapplied only to base distribution rates (including storm costs) and not to other rate mechanisms such as the retail rate components, rate reconciling mechanisms, formula rates and any other adjustment mechanisms. The rate freeze also doesdid not apply to any cost recovery mechanism outside of the base distribution rates with regard to grid-modernization initiatives or any other proceedings that were either currently pending or that maycould be initiated during the rate freeze period, that may placecould have placed additional obligations on CL&P. The approval of the settlement agreement satisfiessatisfied the Connecticut statute of rate review requirements that requires electric utilities to file a distribution rate case within four years of the last rate case. For further information, see "Regulatory Developments and Rate Matters - Connecticut" in the accompanying Item 7, Management's Discussion and Analysis of Financial Condition and Results of Operations.
CL&P Performance Based Rate Making: PURA currently has an open proceeding to evaluate and eventually implement performance based regulation (PBR) for electric distribution companies. For further information, see "Regulatory Developments and Rate Matters - Connecticut" in the accompanying Item 7, Management's Discussion and Analysis of Financial Condition and Results of Operations.
Sources and Availability of Electric Power Supply
As noted above, CL&P does not own any generation assets and purchases energy supply to serve its SS and LRS loads from a variety of competitive sources through requests for proposals. During 2022,2023, CL&P supplied approximately 56 percent of its customer load at SS or LRS rates while the other 44 percent of its customer load had migrated to competitive energy suppliers. In terms of the total number of CL&P customers, this equates to 1425 percent being on competitive supply, while 8675 percent remain with SS or LRS. Because this customer migration is only forlimited to energy supply service, it has no impact on CL&P's electric distribution business or its operating income.
As approved by PURA, CL&P periodically enters into full requirements supply contracts for SS loads for periods of up to one year. CL&P typically enters into full requirements supply contracts for LRS loads every three months. If CL&P does not obtain full requirements supply contracts for 100 percent of the customer load for any period, it is authorized by PURA to meet the remaining load obligations directly through the ISO-NE wholesale markets. Currently, CL&P has full requirements supply contracts in place for 80100 percent of its SS load for the first half of 2023 and will self-manage the remaining 20 percent of the load obligation through the ISO-NE wholesale markets.2024. For the second half of 2023,2024, CL&P has 2070 percent of its SS load under full requirements supply contracts and intends to purchase an additional 8030 percent of full requirements. NoneTen percent of the SS load for 20242025 has been procured. CL&P was unable to obtainobtained a full requirements supply contract for its LRS load through March 2023June 2024 and will self-manage the LRS load through ISO-NE wholesale markets. CL&P intends to purchase 100 percent of full requirements for LRS for the remainder of 2023, but2024. CL&P is prepared to self-manage the LRS load if CL&P is unable to obtain full requirements supply contracts for LRS.
ELECTRIC DISTRIBUTION – MASSACHUSETTS – NSTAR ELECTRIC COMPANY
NSTAR Electric's distribution business consists primarily of the purchase, delivery and sale of electricity to its residential, commercial and industrial customers. As of December 31, 2022,2023, NSTAR Electric furnished retail franchise electric service to approximately 1.471.49 million customers in 140161 cities and towns in eastern and western Massachusetts, including Boston, Cape Cod, Martha's Vineyard and the greater Springfield metropolitan area, covering an aggregate area of approximately 3,200 square miles.area.
NSTAR Electric does not own any generating facilities that are used to supply customers, and purchases its energy requirements from competitive energy suppliers.
NSTAR Electric owns, operates and maintains a total of 70 MW of solar power facilities on twenty-two sites in Massachusetts. NSTAR Electric sells energy from these facilities into the ISO-NE market, with proceeds credited to customers.
Rates
NSTAR Electric is subject to regulation by the Massachusetts Department of Public Utilities (DPU), which, among other things, has jurisdiction over rates, certain dispositions of property and plant, mergers and consolidations, issuances of long-term securities, acquisition of securities, standards of service and construction and operation of facilities. The present general rate structure for NSTAR Electric consists of various rate and service classifications covering residential, commercial and industrial services.
Under Massachusetts law, all customers of NSTAR Electric are entitled to choose their energy suppliers, while NSTAR Electric remains their electric distribution company. For those customers who do not choose a competitive energy supplier, NSTAR Electric purchases power from competitive suppliers on behalf of, and passes the related cost without mark-up through to, those customers (basic service). Electric distribution companies in Massachusetts are required to obtain and resell power to retail customers through basic service for those who choose not to buy energy from a competitive energy supplier. NSTAR Electric charges customers only the amount that it pays generators for producing electricity and does not earn a profit on the cost of electricity.
The rates established by the DPU for NSTAR Electric are comprised of the following:
•A basic service charge that represents the collection of energy costs incurred as a result of providing electric generation service supply to all customers who have not migrated to competitive energy suppliers, including costs related to charge-offs of uncollectible energy costs from customers. Basic service rates are reset every six months (every three months for large commercial and industrial customers). Additionally, the DPU has authorized NSTAR Electric to recover the cost of its NSTAR Green wind contracts through the basic service charge. Basic service costs are reconciled annually, with any differences refunded to, or recovered from, customers.
•A distribution charge, which includes a fixed customer charge and a demand and/or energy charge to collect the costs of building and expanding the distribution infrastructure to deliver electricity to its destination, as well as ongoing operating costs.
•A revenue decoupling adjustment that reconciles annual base distribution rate recovery amounts recovered from customers to the pre-established level of baseline distribution delivery service revenue requirement approved by the DPU. Annual base distribution amounts are adjusted for inflation and certain other items and filed for approval by the DPU on an annual basis, until the next rate case.
•A transmission charge that recovers the cost of transporting electricity over high-voltage lines from generating plants to substations, including costs allocated by ISO-NE to maintain the wholesale electric market. The transmission charge is reconciled annually to actual costs incurred, and reviewed by the DPU, with any difference refunded to, or recovered from, customers.
•A transition charge that represents costs to be collected primarily from previously held investments in generating plants, costs related to existing above-market power contracts, and contract costs related to long-term power contract buy-outs. The transition charge is reconciled annually to actual costs incurred, and reviewed by the DPU, with any difference refunded to, or recovered from, customers.
•A renewable energy charge that represents a legislatively-mandated charge to support the Massachusetts Renewable Energy Trust Fund.
•An energy efficiency charge that represents a legislatively-mandated charge to collect costs for energy efficiency programs. The energy efficiency charge is reconciled annually to actual costs incurred, and reviewed by the DPU, with any difference refunded to, or recovered from, customers.
•Reconciling adjustment charges that recover certain DPU-approved costs, including pension and PBOP benefits, low income customer discounts, credits issued to net-meteringnet metering facilities installed by customers, payments to solar facilities qualified under the state solar renewable energy target program, attorney general consultant expenses, long-term renewable contracts, company-owned solar facilities, vegetation management costs, storm restoration, credits related to the Tax Cuts and Jobs Act of 2017, grid modernization costs, advanced metering infrastructure costs, electric vehicle make-ready infrastructure costs and provisional system planning charges. These charges are reconciled annually to actual costs incurred, and reviewed by the DPU, with any difference refunded to, or recovered from, customers.
As approved by the DPU, NSTAR Electric has signed long-term commitments for the purchase of energy from renewable energy facilities.
Distribution Rate Case: NSTAR Electric distribution rates were established in a November 2022 DPU-approved rate case, with rates effective January 1, 2023. The DPU approved a renewal of the performance-based ratemaking (PBR)PBR plan originally authorized in its last rate case for a five-year term, with a corresponding stay out provision. The PBR plan term has the possibility of a five-year extension. The PBR mechanism allows for an annual adjustment to base distribution rates for inflation, exogenous events and future capital additions based on a historical five-year average of total capital additions. For further information, see "Regulatory Developments and Rate Matters - Massachusetts" in the accompanying Item 7, Management's Discussion and Analysis of Financial Condition and Results of Operations.
Service Quality Metrics: NSTAR Electric is subject to service quality (SQ) metrics that measure safety, reliability and customer service, and could be required to pay to customers a SQ charge of up to 2.5 percent of annual transmission and distribution revenues for failing to meet such metrics. NSTAR Electric will not be required to pay a SQ charge for its 20222023 performance as the company achieved results at or above target for all of its SQ metrics in 2022.2023.
Sources and Availability of Electric Power Supply
As noted above, NSTAR Electric does not own any generation assets (other than 70 MW of solar power facilities that produce energy that is sold into the ISO-NE market) and purchases its energy supply requirements from a variety of competitive sources through requests for proposals issued periodically, consistent with DPU regulations. As approved by the DPU, NSTAR Electric enters into supply contracts for basic service for approximately 3532 percent of its residential and 2529 percent of its small commercial and industrial (C&I) customers twice per year for twelve-month terms. NSTAR Electric enters into supply contracts for basic service for 117 percent of its large C&I customers every three months.
During 2022,2023, NSTAR Electric supplied approximately 18 percent of its overall customer load at basic service rates. The remaining 82 percent of its overall customer load was served either by municipal aggregation or competitive supply. Because customer migration is limited to energy supply service, it has no impact on NSTAR Electric’s electric distribution business or its operating income of NSTAR Electric.income.
ELECTRIC DISTRIBUTION – NEW HAMPSHIRE – PUBLIC SERVICE COMPANY OF NEW HAMPSHIRE
PSNH's distribution business consists primarily of the purchase, delivery and sale of electricity to its residential, commercial and industrial customers. As of December 31, 2022,2023, PSNH furnished retail franchise electric service to approximately 535,000539,000 retail customers in 211215 cities and towns in New Hampshire, covering an area of approximately 5,630 square miles.Hampshire. PSNH does not own any electric generation facilities.
Rates
PSNH is subject to regulation by the New Hampshire Public Utilities Commission (NHPUC), which, among other things, has jurisdiction over rates, certain dispositions of property and plant, mergers and consolidations, issuances of securities, standards of service and construction and operation of facilities.
Under New Hampshire law, all of PSNH's customers are entitled to choose competitive energy suppliers. For those customers who do not choose a competitive energy supplier, PSNH purchases power on behalf of, and passes the related cost without mark-up through to, those customers (default energy service). PSNH charges customers only the amount that it pays generators for producing electricity and does not earn a profit on the cost of electricity.
The rates established by the NHPUC for PSNH are comprised of the following:
•A default energy service charge recovers energy-related costs incurred as a result of providing electric generation service supply to all customers who have not migrated to competitive energy suppliers.
•A distribution charge, which includes kilowatt-hour and/or demand-based charges to recover costs related to the maintenance and operation of PSNH's infrastructure to deliver power to its destination, as well as power restoration and service costs. It also includes a customer charge to collect the cost of providing service to a customer; such as the installation, maintenance, reading and replacement of meters and maintaining accounts and records.
•A transmission chargeTransmission Charge Adjustment Mechanism (TCAM) that recovers the cost of transporting electricity over high-voltage lines from generating plants to substations, including costs allocated by ISO-NE to maintain the wholesale electric market.
•A Stranded Cost Recovery Charge (SCRC), which allows PSNH to recover its stranded costs, including above-market expenses incurred under mandated power purchase obligations, other long-term investments and obligations, and the remaining costs associated with the 2018 sales of its generation facilities.
•A Systems Benefits Charge (SBC), which funds energy efficiency programs for all customers, as well as assistance programs for residential customers within certain income guidelines. The SBC also has a component for the company to collect lost base revenue (LBR) from the implementation of energy efficiency measures. LBR will remain a component of the SBC charge unless and until PSNH has a decoupling or other revenue adjustment mechanism approved by the NHPUC.
•A Regulatory Reconciliation Adjustment (RRA) that reconciles the difference between certain estimated and actual costs included in base distribution rates, including costs related to regulatory assessments, vegetation management program expenses, property tax expenses, storm cost amortization updated for the actual cost of long-term debt and lost base revenues related to net metering.
As approved by•A Pole Plant Adjustment Mechanism (PPAM) that recovers certain costs associated with poles acquired under a 2023 purchase agreement between PSNH and Consolidated Communications, including the NHPUC, PSNH has signed long-term commitments foroperation and maintenance of poles, pole inspections, and vegetation management expenses incurred, beginning February 10, 2021 through April 30, 2023. For further information, see "Regulatory Developments and Rate Matters - New Hampshire" in the purchaseaccompanying Item 7, Management's Discussion and Analysis of energy from renewable energy facilities.Financial Condition and Results of Operations.
The default energy service charge changes semi-annually, the SCRC rate changes annually with the option to change semi-annually beginning in 2023, and the transmission and SBC rates change annually. These rates are reconciled annually in accordance with the policies and procedures of the NHPUC, with any differences refunded to, or recovered from, customers.
As approved by the NHPUC, PSNH has signed long-term commitments for the purchase of energy from renewable energy facilities.
Distribution Rate Case: PSNH’s distribution rates were established in a December 2020 NHPUC-approved settlement agreement, with rates effective January 1, 2021. PSNH was also permitted three step increases, effective January 1, 2021, August 1, 2021, and August 1, 2022, to reflect plant additions in calendar years 2019, 2020 and 2021, respectively. The NHPUC approved a rate increase effective February 1, 2022 designed to collect $1.1 million dollars annually to fund a reserve account to pay for arrearage forgiveness for customers with past due balances and the New Start Program. On October 20, 2022, the NHPUC approved the third step adjustment for 2021 plant in service to recover a revenue requirement of $8.9 million, with rates effective November 1, 2022. The total approved revenue requirement increase is beingwas collected over the remainder of the rate year (November 1, 2022 – July 31, 2023).
Sources and Availability of Electric Power Supply
PSNH does not own any generation assets and as approved by the NHPUC, purchases energy supply from a variety of competitive suppliers for its energy service customers through requests for proposals issued twice per year, for six-month terms, for approximately 8164 percent of its residential and small C&I customers and for 179 percent of its large C&I customers.
During 2022,2023, PSNH supplied approximately 4837 percent of its customer load at default energy service rates while the other 5263 percent of its customer load had migrated to competitive energy suppliers. Because this customer migration is only forlimited to energy supply service, it has no impact on PSNH’s electric distribution business or its operating income.
ELECTRIC TRANSMISSION SEGMENT
CL&P, NSTAR Electric and PSNH each own and maintain transmission facilities that are part of an interstate power transmission grid over which electricity is transmitted throughout New England. Each of CL&P, NSTAR Electric and PSNH, and most other New England utilities, are parties to a series of agreements that provide for coordinated planning and operation of the region's transmission facilities and the rules by which they acquire transmission services. Under these arrangements, ISO-NE, a non-profit corporation whose board of directors and staff are independent of all market participants, serves as the regional transmission organization of the New England transmission system.
Wholesale Transmission Rates
Wholesale transmission revenues are recovered through FERC-approved formula rates. Annual transmission revenue requirements include recovery of transmission costs and include a return on equity applied to transmission rate base. Transmission revenues are collected from New England customers, including distribution customers of CL&P, NSTAR Electric and PSNH. The transmission rates provide for an annual true-up of estimated to actual costs. The financial impacts of differences between actual and estimated costs are deferred for future recovery from, or refund to, transmission customers.
Transmission Rate Base
Transmission rate base under our FERC-approved tariff primarily consists of our investment in transmission net utility plant less accumulated deferred income taxes. Under our FERC-approved tariff, investments in net utility plant generally enter rate base after they are placed in commercial operation. At the end of 2022,2023, our estimated transmission rate base was approximately $9.2$9.8 billion, including approximately $4.0$4.1 billion at CL&P, $3.7$3.9 billion at NSTAR Electric, and $1.5$1.8 billion at PSNH.
FERC ROE Complaints
Four separate complaints were filed at the FERC by combinations of New England state attorneys general, state regulatory commissions, consumer advocates, consumer groups, municipal parties and other parties (collectively, the Complainants). In each of the first three complaints, filed on October 1, 2011, December 27, 2012, and July 31, 2014, respectively, the Complainants challenged the NETOs' base ROE of 11.14 percent that had been utilized since 2005 and sought an order to reduce it prospectively from the date of the final FERC order and for the separate 15-month complaint periods. In the fourth complaint, filed April 29, 2016, the Complainants challenged the NETOs' base ROE billed of 10.57 percent and the maximum ROE for transmission incentive (incentive cap) of 11.74 percent, asserting that these ROEs were unjust and unreasonable.
In response to appeals of the FERC decision in the first complaint filed by the NETOs and the Complainants, the U.S. Court of Appeals for the D.C. Circuit (the Court) issued a decision on April 14, 2017 vacating and remanding the FERC's decision. On October 16, 2018, FERC issued an order on all four complaints describing how it intends to address the issues that were remanded by the Court. FERC proposed a new framework to determine (1) whether an existing ROE is unjust and unreasonable and, if so, (2) how to calculate a replacement ROE.
During 2019 and 2020, FERC has also issued multiple decisions in two pending transmission ROE complaints against the Midcontinent ISO (MISO) transmission owners, in which FERC adopted new methodologies for determining base ROEs. On August 9, 2022, the Court issued a decision vacating these MISO FERC decisions and remanded to FERC to reopen the proceedings. At this time, Eversource cannot predict how and when FERC will address the Court’s findings on the remand of the MISO FERC opinions or any potential associated impact on the NETOs’ four pending ROE complaint cases.
Given the significant uncertainty regarding the applicability of the FERC opinions in the MISO transmission owners' two complaint cases to the NETOs' pending four complaint cases, Eversource concluded that there is no reasonable basis for a change to the reserve or recognized ROEs for any of the complaint periods at this time. As well, Eversource cannot reasonably estimate a range of loss for any of the four complaint proceedings at this time.
For further information, see "FERC Regulatory Matters - FERC ROE Complaints" in the accompanying Item 7, Management's Discussion and Analysis of Financial Condition and Results of Operations.
NATURAL GAS DISTRIBUTION SEGMENT
On October 9, 2020, Eversource acquired certain assets and liabilities that comprised the NiSource Inc. (NiSource) natural gas distribution business in Massachusetts, which was previously doing business as Columbia Gas of Massachusetts (CMA), pursuant to an asset purchase agreement (the Agreement) entered into on February 26, 2020 between Eversource and NiSource. The cash purchase price was $1.1 billion, plus a working capital amount of $68.6 million, as finalized in 2021. The natural gas distribution assets acquired from CMA were assigned to Eversource Gas Company of Massachusetts (EGMA), an indirect wholly-owned subsidiary of Eversource formed in 2020. The LNG assets acquired from CMA were assigned to Hopkinton LNG Corp, also a subsidiary of Eversource.
NATURAL GAS DISTRIBUTION SEGMENT
NSTAR Gas distributes natural gas to approximately 306,000307,000 customers in 5259 communities in central and eastern Massachusetts covering 1,104 square miles.Massachusetts. EGMA distributes natural gas to approximately 333,000336,000 customers in 6566 communities throughout Massachusetts covering 1,206 square miles.Massachusetts. Yankee Gas distributes natural gas to approximately 251,000252,000 customers in 7485 cities and towns in Connecticut covering 2,632 square miles.Connecticut. Total throughput (sales and transportation) in 20222023 was approximately 66.167.1 Bcf for NSTAR Gas, 54.354.2 Bcf for EGMA, and 58.456.4 Bcf for Yankee Gas. Our natural gas businesses provide firm natural gas sales and transportation service to eligible retail customers who require a continuous natural gas supply throughout the year, such as residential customers who rely on natural gas for heating, hot water and cooking needs, as well as commercial and industrial customers who rely on natural gas for space heating, hot water, cooking and commercial and industrial applications.
NSTAR Gas, EGMA and Yankee Gas generate revenues primarily through the sale and/or transportation of natural gas. All NSTAR Gas and EGMA retail customers have the ability to choose to purchase gas from third party marketers under the Massachusetts Retail Choice program. In the past year in Massachusetts, Retail Choice represented only approximately one percent of the total residential load, while Retail Choice represented approximately 5650 percent of the total commercial and industrial load. Retail natural gas service in Connecticut is partially unbundled: residential customers in Yankee Gas' service territory buy natural gas supply and delivery only from Yankee Gas while commercial and industrial customers may choose their natural gas suppliers. For customers who purchase natural gas from NSTAR Gas, EGMA and Yankee Gas, the purchased natural gas commodity cost is passed through to those customers without mark-up. NSTAR Gas, EGMA and Yankee Gas do not earn a profit on the cost of purchased gas.
Firm transportation service is offered to customers who purchase natural gas from sources other than NSTAR Gas, EGMA or Yankee Gas. NSTAR Gas and EGMA have the ability to offer interruptible transportation and interruptible natural gas sales service to high volume commercial and industrial customers. Yankee Gas offers interruptible transportation and interruptible natural gas sales service to commercial and industrial customers who have the ability to switch from natural gas to an alternate fuel on short notice. NSTAR Gas, EGMA and Yankee Gas can interrupt service to these customers during peak demand periods or at any other time to maintain distribution system integrity.
A portion of the storage of natural gas supply for NSTAR Gas and EGMA during the winter heating season is provided by Hopkinton LNG Corp., an indirect, wholly-owned subsidiary of Eversource Energy.Eversource. NSTAR Gas has access to facilities consisting of an LNG liquefaction and vaporization plant and three above-ground cryogenic storage tanks having an aggregate capacity of 3.0 Bcf of liquefied natural gas and facilities that include additional storage capacity of 0.5 Bcf. Total vaporization capacity of these facilities is 0.21 Bcf per day. EGMA has access to approximately 1.8 Bcf of LNG and 0.1 Bcf of LPG storage, with a total vaporization capacity of 0.14 Bcf per day. Yankee Gas owns a 1.2 Bcf LNG facility, which also has the ability to liquefy and vaporize up to 0.1 Bcf per day. This facility is used primarily to assist Yankee Gas in meeting its supplier-of-last-resort obligations and also enables it to provide economic supply and make economic refill of natural gas, typically during periods of low demand.
Rates
NSTAR Gas and EGMA are subject to regulation by the DPU and Yankee Gas is subject to regulation by the PURA, both of which, among other things, have jurisdiction over rates, certain dispositions of property and plant, mergers and consolidations, issuances of long-term securities, standards of service and construction and operation of facilities.
Retail natural gas delivery and supply rates are established by the DPU and the PURA and are comprised of:
•A distribution charge consisting of a fixed customer charge and a demand and/or energy charge that collects the costs of building, maintaining, and expanding the natural gas infrastructure to deliver natural gas supply to its customers. This also includes collection of ongoing operating costs.
•A seasonal cost of gas adjustment clause (CGAC) at NSTAR Gas and EGMA that collects natural gas supply costs, pipeline and storage capacity costs, costs related to charge-offs of uncollected energy costs and working capital related costs. The CGAC is reset semi-annually with any difference being recovered from, or refunded to, customers during the following corresponding season. In addition, NSTAR Gas and EGMA file interim changes to the CGAC factor when the actual costs of natural gas supply vary from projections by more than five percent.
•A Purchased Gas Adjustment (PGA) clause at Yankee Gas that collects the costs of the procurement of natural gas for its firm and seasonal customers. The PGA is evaluated monthly. Differences between actual natural gas costs and collection amounts from September 1st through August 31st of each PGA year are deferred and then recovered from, or refunded to, customers during the following PGA year. Carrying charges on outstanding balances are calculated using Yankee Gas' weighted average cost of capital in accordance with the directives of the PURA.
•A local distribution adjustment clause (LDAC) at NSTAR Gas and EGMA that collects all energy efficiency and related program costs, environmental costs, pension and PBOP related costs, attorney general consultant costs, credits related to the Tax Cuts and Jobs Act of 2017, gas system enhancement program (GSEP) costs, costs associated with low income customers, and costs associated with a geothermal pilot program. The LDAC is reset annually with any difference being recovered from, or refunded to, customers during the following period and provides for the recovery of certain costs applicable to both sales and transportation customers.
•A Conservation Adjustment Mechanism (CAM) at Yankee Gas, which allows 100 percent recovery of conservation costs through this mechanism including program incentives to promote energy efficiency. A reconciliation of CAM revenues to expenses is performed annually with any difference being recovered from, or refunded to, customers with carrying charges during the following year.
•A Gas System Improvement (GSI) reconciliation mechanism at Yankee Gas, which collects the costs of certain Distribution Integrity Management Program (DIMP) and core capital plant in service above and beyond the level that is recovered through the distribution charge. The GSI is adjusted and reconciled annually, with any differences refunded to, or recovered from, customers.
•A System Expansion Rate (SER) reconciliation mechanism at Yankee Gas, which compares distribution system expansion investment costs and revenues for newfrom system expansion customers with the level projected in current distribution customer rates. This reconciliation is performed annually and customer rates are adjusted accordingly.
•A Revenue Decoupling Mechanism (RDM) at NSTAR Gas and EGMA that reconciles annual base distribution rate recovery amounts recovered from customers to the pre-established level of baseline distribution delivery service revenue requirement approved by the DPU. The pre-established level of baseline distribution delivery service revenue requirement is also subject to adjustment in accordance with provisions of the November 2020 NSTAR Gas distribution rate case and the October 2020 EGMA rate settlement agreement.
•A RDM at Yankee Gas that reconciles annual base distribution rate recovery amounts recovered from customers to the pre-established level of baseline distribution delivery service revenue requirement approved by the PURA. The pre-established level of baseline distribution delivery service revenue requirement is also subject to adjustment in accordance with provisions of the 2018 rate case settlement agreement.
Distribution Rate Cases:
NSTAR Gas: NSTAR Gas distribution rates were established in an October 2020 DPU-approved rate case, with rates effective November 1, 2020. The DPU also approved a 10-year performance-based ratemakingPBR plan through November 1, 2030, which includes inflation-based adjustments to annual base distribution amounts effective annually beginning November 1, 2021. For further information, see "Regulatory Developments and Rate Matters - Massachusetts" in the accompanying Item 7, Management's Discussion and Analysis of Financial Condition and Results of Operations.
EGMA: EGMA’s distribution rates were established in a DPU-approved October 7, 2020 rate settlement agreement, with rate increases on November 1, 2021 and November 1, 2022, and two rate base resets during an eight-year rate plan, occurring on November 1, 2024 and November 1, 2027. Notwithstanding the two distribution rate increases, the two rate base reset provisions, and potential adjustments for qualifying exogenous events, EGMA agreed not to file for an increase or redesign of distribution base rates effective prior to November 1, 2028.
Yankee Gas: Yankee Gas distribution rates were established in a December 2018 PURA-approved rate case settlement agreement, with rates effective November 15, 2018. PURA also approved step adjustments effective January 1, 2019, January 1, 2020 and MarchJanuary 1, 2021.
Service Quality Metrics: NSTAR Gas and EGMA are subject to SQ metrics that measure safety, reliability and customer service and each could be required to pay to customers a SQ charge of up to 2.5 percent of annual distribution revenues for failing to meet such metrics. NSTAR Gas and EGMA will not be required to pay anany SQ charge forcharges relating to their 2022 performance as each achieved results at or above target for all of their SQ metrics in 2022.2023 performance.
Natural Gas Replacement
Massachusetts: Pursuant to Massachusetts legislation, in October of each year, NSTAR Gas and EGMA file GSEP Plans with the DPU for the following construction year. The GSEP Program is designed to accelerate the replacement of certain natural gas distribution facilities in the system to less than 25 years. The GSEP includes a tariff that provides NSTAR Gas and EGMA an opportunity to collect the costs for the program on an annual basis through a reconciling factor. On April 30th each year, the DPU approves the GSEP rate recovery factor that goes into effect on May 1st.
In October 2020, the DPU opened Docket “DPU 20-80 The Future of Gas” to examine the role of Massachusetts natural gas local distribution companies (LDCs) in helping to meet the state’s 2050 climate goals. In December 2023, the DPU issued an order for this docket. The DPU will consider and, in some cases, require new processes and analysis for traditional natural gas investments, which may require significant changes to the LDC planning process and business models. The DPU intends to put policies and structures in place that would protect customers as Massachusetts works to decarbonize the building sector, which may involve subsequent dockets and regulatory proceedings and potentially recasting the role of LDCs in Massachusetts, which may require significant changes toMassachusetts. The DPU preserved customer choice for energy needs and encouraged further development of decarbonized alternatives, such as the LDCs planning processes and business models.networked geothermal systems that NSTAR Gas is piloting in Framingham, Massachusetts. At this time, Eversource cannot predict the ultimate outcome of this proceeding, as the Company and other LDCs are seeking formal clarity from the DPU to fully understand the resulting impact to itstheir natural gas businesses howeverand the associated timing of any impacts. The Company does not believe there is any indication of an inability to recover costs or risk of impairment of our natural gas assets at this time.
Connecticut: Yankee Gas' December 2018 PURA-approved rate case settlement agreement included an accelerated pipeline replacement cost recovery program. The Gas System Improvement (GSI)GSI rate recovers accelerated pipeline replacement as well as other capital investment through an annual reconciliation. Yankee Gas files its GSI reconciliation annually on March 1st for rates effective April 1st.
In September 2021, PURA undertook a review of Connecticut natural gas companies’ infrastructure system expansion plan (SEP) to determine if the SEP continues to be in the best interest of the state’s comprehensive energy strategy. On April 27, 2022, PURA issued an order for the immediate winding down of the SEP by (1) ending the enrollment of new customers in the SEP program and permitting only a specific group of potential customers who have executed a services agreement with a natural gas company on or before a specified date (subsequently approved as August 16, 2022) to qualify for incentives under the current SEP; (2) directing all surplus non-firm margin to be deferred as a regulatory liability and applied to rate base in a future rate proceeding; and (3) directing the natural gas companies to cease all outbound and passive marketing regarding the SEP. On July 15, 2022, EversourceYankee Gas appealed the portion of this order pertaining to the deferral of non-firm margin as a reduction to future rate base. EversourceOn October 24, 2023, Yankee Gas informed the Connecticut Superior Court that the parties mutually agreed to resolve the appeal through a stipulation, which clarified that PURA will decide in Yankee Gas’s next gas rate case the ratemaking treatment of the deferred non-firm margin. Yankee Gas evaluated the prospective impact of this proceeding and does not believe the impact will be material to its future financial position, results of operations and cash flows.
Sources and Availability of Natural Gas Supply
NSTAR Gas maintains aand EGMA maintain flexible resource portfolioportfolios consisting of natural gas supply contracts, transportation contracts on interstate pipelines, market area storage and peaking services. NSTAR Gas purchasesand EGMA purchase transportation, storage, and balancing services from Tennessee Gas Pipeline Company and Algonquin Gas Transmission Company, as well as other upstream pipelines that transport natural gas from major natural gas producing regions in the U.S., including the Gulf Coast, Mid-continent region, and Appalachian Shale supplies(as well as Ontario, Canada specific to EGMA), which supply to the final delivery points in the NSTAR Gas and EGMA service area.areas. NSTAR Gas purchases all of its natural gas supply under a firm, competitively bid annual portfolio management contract. EGMA purchases the majority of its natural gas supply under a number of firm, competitively bid annual portfolio management contracts, and manages a portion of its own portfolio. In addition to the firm transportation and natural gas storage supplies discussed above, NSTAR Gas utilizesand EGMA utilize on-system LNG facilities (and also LPG facilities for EGMA) to meet its winter peaking demands. These LNG facilities are located within NSTAR Gas' and EGMA’s distribution systemsystems and are used to liquefy and store pipeline natural gas and/or receive liquefied natural gas or liquefied petroleum gas to be stored during the warmer months for vaporization and use during the heating season. During the summer injection season, excess pipeline capacity and supplies are used to deliver and store natural gas in market area underground storage facilities located in Maryland and Pennsylvania. Stored natural gas is withdrawn during the winter season to supplement flowing pipeline supplies in order to meet firm heating demand. NSTAR Gas has firm underground storage contracts and total storage capacity entitlements of approximately 6.6 Bcf, and 3.5 Bcf LNG storage is provided by Hopkinton LNG Corp. in facilities located in two different locations in Massachusetts.
EGMA maintains a flexible resource portfolio consisting of natural gas supply contracts, transportation contracts on interstate pipelines, market area storage and peaking services. EGMA purchases transportation, storage, and balancing services from Tennessee Gas Pipeline Company and Algonquin Gas Transmission Company, as well as other upstream pipelines that transport natural gas from major natural gas producing regions in the U.S. as well as Canada, including the Gulf Coast, Mid-continent region, Appalachian Shale, and Dawn, Ontario supplies to the final delivery points in the EGMA service area. EGMA purchases the majority of its natural gas supply under a number of firm, competitively bid annual portfolio management contracts and manages a portion of its portfolio itself. In addition to the firm transportation and natural gas storage supplies discussed above, EGMA utilizes on-system LNG and LPG facilities to meet its winter peaking demands. These LNG and LPG facilities are located within EGMA’s distribution system and are used to liquefy pipeline natural gas and/or receive liquefied natural gas or liquefied petroleum gas to be stored during the warmer months for vaporization and use during the heating season. During the summer injection season, excess pipeline capacity and supplies are used to deliver and store natural gas in market area underground storage facilities located in Maryland and Pennsylvania. Stored natural gas is withdrawn during the winter season to supplement flowing pipeline supplies in order to meet firm heating demand. EGMA has firm underground storage contracts and total storage capacity entitlements of approximately 8.6 Bcf, and 1.9 Bcf LNG and LPG storage is provided by Hopkinton LNG Corp. in facilities located at seven different locations in Massachusetts.
PURA requires Yankee Gas to meet the needs of its firm customers under all weather conditions. Specifically, Yankee Gas must structure its supply portfolio to meet firm customer needs under a design day scenario (defined as the coldest day in 30 years) and under a design year scenario (defined as the average of the four coldest years in the last 30 years). Yankee Gas also maintains a flexible resource portfolio consisting of natural gas supply contracts, transportation contracts on interstate pipelines, off-system storage and its on-system 1.2 Bcf LNG storage facility in Connecticut to meet consumption needs during the coldest days of winter. Yankee Gas obtains its interstate capacity from the three interstate pipelines that directly serve Connecticut: the Algonquin, Tennessee and Iroquois Pipelines, which connect to other upstream pipelines that transport natural gas from major natural gas producing regions, including the Gulf Coast, Mid-continent, Canadian regions and Appalachian Shale supplies.
Based on information currently available regarding projected growth in demand and estimates of availability of future supplies of pipeline natural gas, each of NSTAR Gas, EGMA and Yankee Gas believes that in order to meet the long-term firm customer requirements in a reliable manner, a combination of pipeline, storage, and non-pipeline solutions will be necessary.
WATER DISTRIBUTION SEGMENT
Aquarion Company (Aquarion) operates five separate regulated water utilities in Connecticut (Aquarion Water Company of Connecticut, or AWC-CT, and The Torrington Water Company), Massachusetts (Aquarion Water Company of Massachusetts, or AWC-MA), and New Hampshire (Aquarion Water Company of New Hampshire, or AWC-NH, and Abenaki Water Company). These regulated companies provide water services to approximately 237,000241,000 residential, commercial, industrial, municipal and fire protection and other customers, in 72 towns and cities in Connecticut, Massachusetts and New Hampshire. As of December 31, 2022,2023, approximately 92 percent of Aquarion’s customers were based in Connecticut.
Rates
Aquarion's water utilities are subject to regulation by the PURA, the DPU and the NHPUC in Connecticut, Massachusetts and New Hampshire, respectively. These regulatory agencies have jurisdiction over, among other things, rates, certain dispositions of property and plant, mergers and consolidations, issuances of long-term securities, standards of service and construction and operation of facilities.
Aquarion’s general rate structure consists of various rate and service classifications covering residential, commercial, industrial, and municipal and fire protection services.
The rates established by the PURA, DPU and NHPUC are comprised of the following:
•A base rate, which is comprised of fixed charges based on meter/fire connection sizes, as well as volumetric charges based on the amount of water sold. Together these charges are designed to recover the full cost of service resulting from a general rate proceeding.
•In Connecticut, a revenue adjustment mechanism (RAM) that reconciles earned revenues, with certain allowed adjustments, on an annual basis, to the revenue requirement approved by PURA.
•In Connecticut and New Hampshire, a water infrastructure conservation adjustment (WICA) charge, and in Massachusetts, an annual main replacement adjustment mechanism (MRAM) charge, which is applied between rate case proceedings and seeks recovery of allowed costs associated with eligible infrastructure improvement projects placed in-service. The WICA is updated semi-annually in Connecticut and annually in New Hampshire. In Connecticut, an annual WICA reconciliation mechanism reconciles earned WICA revenue to the approved WICA revenue with any differences refunded to, or recovered from, customers.
Sources and Availability of Water Supply
Our water utilities obtain their water supplies from owned surface water sources (reservoirs) and groundwater supplies (wells) with a total supply yield of approximately 133135 million gallons per day, as well as water purchased from other water suppliers. Approximately 98 percent of our annual production is self-supplied and processed at nineten surface water treatment plants and numerous well stations, which are all located in Connecticut, Massachusetts, and New Hampshire.
The capacities of Aquarion’s sources of supply, and water treatment, pumping and distribution facilities, are considered sufficient to meet the present requirements of Aquarion’s customers under normal conditions. On occasion, drought declarations are issued for portions of Aquarion’s service territories in response to extended periods of dry weather conditions.
OFFSHORE WIND BUSINESS
Eversource'sEversource’s offshore wind business includes a 50 percent ownership interestinterests in North East Offshore,wind partnerships, which holds power purchase agreements (PPAs) and contracts forcollectively hold the Revolution Wind, South Fork Wind and Sunrise Wind projects, as well as an undeveloped offshore lease area. Ourand a tax equity investment in South Fork Wind. The offshore wind projects are being developed and constructed through a joint and equal partnershippartnerships with Ørsted.
The offshore leases include a 257 square-mile ocean lease off the coasts of Massachusetts and Rhode Island and a separate, adjacent 300 square-mile ocean lease located approximately 25 miles south of the coast of Massachusetts. In aggregate, these ocean lease sites jointly-owned by Eversource and Ørsted could eventually develop at least 4,000 MW of clean, renewable offshore wind energy.
Revolution Wind is a 704 MW offshore wind power project located approximately 15 miles south of the Rhode Island coast, and South Fork Wind is a 130 MW offshore wind power project located approximately 35 miles east of Long Island. Sunrise Wind is a 924 MW offshore wind facility which will be developedlocated 35 miles east of Montauk Point, Long Island. The completion dates for these projects are subject to federal permitting through BOEM, engineering, state siting and permitting in New York, Rhode Island and Massachusetts and construction schedules.
We have initiated a strategic revieware in the process of selling our existing 50 percent interests in the three jointly-owned offshore wind investment portfolio. As partprojects. In connection with the sales process, we have recorded impairments to the carrying value of that review, we are exploring strategic alternatives that could result in a potential sale of all, or part, of our 50 percent interest in ourthe offshore wind partnership with Ørsted.investments to reflect the investments at estimated fair value. For more information on these projects, the sales process, and on the strategic review,impairment evaluations, see "Business Development and Capital Expenditures – Offshore Wind Business" in the accompanying Item 7, Management's Discussion and Analysis of Financial Condition and Results of Operations.
CAPITAL EXPENDITURES
For information on capital expenditures and projects during 2022,2023, as well as projected capital expenditures by business, see "Business Development and Capital Expenditures" in the accompanying Item 7, Management's Discussion and Analysis of Financial Condition and Results of Operations.
FINANCING
For information regarding short-term and long-term debt agreements, see "Liquidity" in the accompanying Item 7, Management's Discussion and Analysis of Financial Condition and Results of Operations, and Note 8, "Short-Term Debt," and Note 9, "Long-Term Debt," of the Combined Notes to Financial Statements.
NUCLEAR FUEL STORAGE
CL&P, NSTAR Electric, PSNH, and several other New England electric utilities are stockholders in three inactive regional nuclear generation companies, CYAPC, MYAPC and YAEC (collectively, the Yankee Companies). The Yankee Companies have completed the physical decommissioning of their respective nuclear power facilities and are now engaged in the long-term storage of their spent nuclear fuel. The Yankee Companies fund these costs through litigation proceeds received from the DOE and, to the extent necessary, through wholesale, FERC-approved rates charged under power purchase agreements with several New England utilities, including CL&P, NSTAR Electric and PSNH. CL&P, NSTAR Electric and PSNH, in turn recover these costs from their customers through state regulatory commission-approved retail rates. The Yankee Companies collect amounts that we believe are adequate to recover the remaining plant closure and fuel storage cost estimates for the respective plants. We believe CL&P and NSTAR Electric will recover their shares of these obligations from their customers. PSNH has recovered its total share of these costs from its customers.
We consolidate the assets and obligations of CYAPC and YAEC on our consolidated balance sheet because our ownership and voting interests are greater than 50 percent of each of these companies.
OTHER REGULATORY AND ENVIRONMENTAL MATTERS
General
We are regulated by various federal and state agencies, including FERC, the SEC, and various state and/or local regulatory authorities with jurisdiction over the industry and the service areas in which each of our companies operates, including the PURA, which has jurisdiction over CL&P, Yankee Gas, and Aquarion, the DPU, which has jurisdiction over NSTAR Electric, NSTAR Gas, EGMA and Aquarion, and the NHPUC, which has jurisdiction over PSNH and Aquarion.
Renewable Portfolio Standards
Each of the states in which we do business has Renewable Portfolio Standards (RPS) requirements, which generally require fixed percentages of our energy supply to come from renewable energy sources such as solar, wind, hydropower, landfill gas, fuel cells and other similar sources.
Connecticut's RPS statute requires increasing percentages of the electricity sold to retail customers to have direct ties to renewable sources. In 2022,2023, the total RPS obligation was 33.035.0 percent and will ultimately reach 48.0 percent in 2030. CL&P is permitted to recover any costs incurred in complying with RPS from its customers through its generation service charge rate.
Massachusetts' RPS program requires electricity suppliers to meet renewable energy standards. For 2022,2023, the RPS and Clean Energy Standard (CES) requirements were 51.359.2 percent, and will ultimately reach 64.363.1 percent in 2025. Massachusetts electric suppliers were also required to meet Alternative Energy Portfolio Standards (APS) of 5.55.75 percent and Clean Peak Energy Standards (CPS) of 4.56.0 percent in 2022.2023. Those requirements will reach 6.25 and 9.00 percent in 2025, respectively. NSTAR Electric is permitted to recover any costs incurred in complying with these requirements from its customers through rates. NSTAR Electric also owns renewable solar power facilities. The RECs generated from NSTAR Electric's solar power facilities are sold to other energy suppliers, and the proceeds from these sales are credited back to customers.
New Hampshire's RPS provision requires increasing percentages of the electricity sold to retail customers to have direct ties to renewable sources. In 2022,2023, the total RPS obligation was 22.523.4 percent and it will ultimately reach 25.2 percent in 2025. The costs of the RECs are recovered by PSNH through rates charged to customers.
Environmental Regulation and Matters
We are subject to various federal, state and local environmental legislation and regulation with respect to water quality, air quality, natural/working lands (wetlands, resource areas, habitat), hazardous materials and other environmental matters. Our environmental policy includes formal procedures and a task-scheduling system in place to help ensure environmental compliance. The Board’s Governance, Environmental and Social Responsibility Committee also provides oversight of climate issues, environmental matters and compliance. We also identify and address potential environmental risks through our Enterprise Risk Management (ERM) program in addition to rigorous audits of our facilities, vendors, and processes.
Additionally, projects may not be constructed or significantly modified without a review of the environmental impact of the proposed construction or modification by the applicable federal or state agencies. Many of our construction projects require the submission of comprehensive permitting applications to various local, state and federal agencies. The permits we receive outline various best management practices and restoration requirements to address construction period-impacts.
We have recorded a liability for what we believe, based upon currently available information, is our reasonably estimable environmental investigation, remediation, and/or natural resource damages costs for waste disposal sites for which we have probable liability. Under federal and state law, government agencies and private parties can attempt to impose liability on us for recovery of investigation and remediation costs at contaminated sites. As of December 31, 2022,2023, the liability recorded for our reasonably estimable and probable environmental remediation costs for known sites needing investigation and/or remediation, exclusive of recoveries from insurance or from third parties, was $122.6$128.2 million, representing 5965 sites. These costs could be significantly higher if additional remediation becomes necessary or when additional information as to the extent of contamination becomes available.
The most significant liabilities currently relate to future clean-up costs at former MGP facilities. These facilities were owned and operated by our predecessor companies from the mid-1800's to mid-1900's. By-products from the manufacture of natural gas using coal resulted in fuel oils, hydrocarbons, coal tar, purifier wastes, metals and other waste products that may pose a potential risk to human health and the environment. We currently have partial or full ownership responsibilities at former MGP sites that have a reserve balance of $112.6$117.1 million of the total $122.6$128.2 million as of December 31, 2022.2023. MGP costs are recoverable through rates charged to our customers.
When planning environmental investigations and remediation of impacted properties, we work closely with the municipalities and environmental regulators to ensure that our remediation plans adhere to applicable regulations while protecting human health and the environment. In many cases, these remediation projects are designed to address opportunities for beneficial reuse of the property.
Global Climate Change and Greenhouse Gas Emission Issues
We assessEversource assesses the regulatory, physical and transitional impacts related to climate change to develop mitigation strategies including evaluating the impacts of more severe weather events, financial risks, changing customer behaviors, and opportunities to reduce emissions in our operations and for the region through clean energy and emerging technologies investments.
Regulatory Impacts of Climate Change: Global climate change continues to receive increasing focus from the federal and state governments. The Biden administration has communicated a strong focus on addressing climate change by setting a U.S. target of reducing greenhouse gas (GHG) emissions by 50 percent by 2030, compared to 2005 levels, and achieving net-zero emissions by 2050 economy-wide. The plan calls for aggressive measures focused on clean transportation, clean energy and climate investments targeted at environmental justice communities. In support of this plan, federal funding and incentive programs for clean transportation and energy offer opportunities for Eversource to invest in projects that have the ability to reduce emissions in the region while benefiting our communities and shareholders. Similarly, some of the states in which we operate have aggressive climate goals and implementation plans. In Connecticut, legislation includes a target to achieve zero-carbon electricity by 2040. In response to the 2021 Massachusetts climate legislation in 2022, Massachusetts finalized sub-limitscalling for increased electrification of the transportation and building sectors, in 2023, Eversource developed an Electric Sector Modernization Plan (ESMP) detailing steps the Company will take over the next five and electricity sectors, among others, inten years to help ensure reliability and resiliency while supporting a clean energy future. Similarly, the Massachusetts “Future of Gas” docket (DPU 20-80) looks to identify ways for natural gas local distribution companies to support of the state’s net zero emissions target by 2050.2050 climate goal. These state regulations and related policies may introduce risks and opportunities to our businesses if demands for energy or heating change or if investment opportunities for new projects present themselves.change.
We areEversource continually evaluatingevaluates the evolving regulatory landscape concerning climate change, which could potentially lead to additional requirements and additional rules and regulations that could impact how we operate our businesses. Potential future environmental statutes and regulations, such as additional greenhouse gas reduction regulations to address global climate change, could impose significant additional costs and there can be no assurance that regulators will approve the recovery of those costs.
Physical and Transitional Impacts of Climate Change: Eversource assesses the physical impacts of climate change that are event-driven or due to longer-term shifts in climate patterns, as well as transitional impacts related to a shift to a lower-carbon economy and changes to address mitigation and adaptation requirements. To address physical and transitional impacts related to climate change, maintain resiliency across our system, and enable potential opportunities for our business, we are pursuing the following actions:
•Improving our system resiliency in response to climate change through vegetation management, pole and wire strengthening, flood proofing, and other system hardening measures;
•Implementing a grid modernization plan that will enhance our electric distribution infrastructure to improve resiliency and reliability and increase opportunities to facilitate integration of distributed energy resources and electric vehicle infrastructure;
•Focusing on improving the efficiency of our electric and natural gas distribution systems, preparing for increased opportunities that clean energy advancements create, and providing customers with ways to optimize their energy efficiency;
•Investigating emerging technologies such as energy storage and automation programs that improve reliability;
•Implementing programs to address risks that may impact water availability and water quality; and
•Evaluating opportunities for our natural gas system and exploring alternative, less carbon-intense, technologies like renewable natural gas and geothermal for heating.
Physical risks from climate change may result frombe acute due to increased severity of extreme weather events or chronic due to changes in precipitation patterns and extreme variability in weather patterns, rising mean temperatures and/or rising sea level riselevels, and shifting weather conditions, such as changes in precipitation, extreme heat, more frequent and severe storms, droughts, wildfires and floods. These risks may result in customers’ energy and water usage increasing or decreasing depending on the duration and magnitude of the changes, degradation of water quality and our ability to reliably deliver our services to customers. Severe weather may cause outages, potential disruption of operations, and property damage to our operating facilities.
Our actions to improve system reliability and resiliency allow our business to operate under changing conditions and meet customer expectations. System improvements are designed to withstand severe weather impacts and include installing new and stronger infrastructure like poles, wires and related system equipment, as well as enhanced year-round tree trimming. We are reinforcing existing critical facilities to withstand storm surges and all future substations are being “flood hardened” to better protect our system against storm surges associated with the increasing risk of severe weather. We created our comprehensive emergency preparedness and response plans in partnership with state and community leaders so that when a storm occurs, we can provide customers and municipalities with timely and accurate information, while safely and promptly restoring power. Additionally, we collaborate with other utility providers and industry partners across the country to better understand storm hazards and develop solutions to improve our system reliability.
We haveEversource has made a corporate commitment to reduce Scope 1 and 2 greenhouse gasGHG emissions from our operations and reach carbon neutrality by 2030. In November 2022,December 2023, we committedsubmitted an application to settingthe Science Based Target initiative (SBTi) seeking validation of a science-basedbroader GHG target, within the next two years, which will expand our emission reduction efforts toand include indirect Scope 3 sources. Greenhouse gas emissions from our operations consist primarily of line loss (emissions associated with the energy lost when power is transmitted and distributed across the electric system), methane leaks from our natural gas distribution system, operating our facilities and vehicle fleet, and sulfur hexafluoride (SF6) leaks from electric equipment. To measure our influences on climate change, we quantify and publicly report our operational carbon footprint through a third-party verified GHG emission inventory on an annual basis. Our initiatives to reduce GHG emissions across our company include improving energy efficiency and expanding the use of renewable energy at our buildings, utilizing alternative fuels and introducing more hybrid vehicles into the company fleet, cuttingreducing fugitive emissions of methane and SF6 by replacing leakyleak-prone natural gas pipes, improving maintenance of SF6 electrical equipment, and piloting innovative technologies.technologies, such as alternative SF6 electrical equipment.
Our business is also transitioning in responseexposed to climate changeclimate-related transitional risks, such as policy, legal and reputational impacts, and technology and market changes as we are enablingenable broad decarbonization of the electrical and building sectors in support of regional policies and targets. We actively support local, state and federal emission reduction goals to address climate change and pursue climate-related opportunities that enable continued business success while serving the needs of our customers. Our clean energy investments help reduce regional emissions while improving shareholder value. Meanwhile, our energy efficiency solutions and electric vehicle infrastructure investments allow our customers to make choices that minimize climate-related impacts.
Additionally, as our business transitions to support a low carbon economy, human capital needs will also change with the potential to impact our workforce. As new technologies are implemented, we will need to recruit, develop and possibly retrain employees to meet the need for new skill sets.
Electric and Magnetic Fields
For more than forty years, published reports have discussed the possibility of adverse health effects from electric and magnetic fields (EMF) associated with electric transmission and distribution facilities, including appliances, and wiring in buildings and homes. Some epidemiology studies have reported a possible statistical association between adverse health effects and exposure with EMF. The association identified in some of these studies remain unexplained and inconclusive. Numerous scientific review panels, considering all significant EMF epidemiology and laboratory studies, have concluded that the available body of scientific information does not support a conclusion that EMF affects human health at levels expected in the vicinity. In accordance with recommendations of various regulatory bodies and public health organizations, we use design principles that help reduce potential EMF exposures associated with new transmission lines.
HUMAN CAPITAL
Eversource is committed to delivering reliable energy and superior customer service; expanding energy options for our region; environmental stewardship; a safe, diverse and fairly-compensatedfairly compensated workforce; and community service and leadership. Our employees are critical to achieving this mission and we recognize the importance of attracting, retaining growing and developing our employees. Leaders at all levels strive to create a workplace where our employees are engaged, empowered, advocate for the customer, work collaboratively, raise ideas for improvement and focus on delivering a superior customer experience. We build employee engagement through continuous communication, developing talent, fostering teamwork and creating a diverse, equitable and inclusive workplace. We have established metrics and annual goals on our corporate scorecard, including safety performance, talent diversity and employee engagement, that drive accountability for progress across all areas of the business.
As of December 31, 2022,2023, Eversource Energy employed a total of 9,62610,171 employees, excluding temporary employees, of which 1,4441,529 were employed by CL&P, 1,6482,044 were employed by NSTAR Electric, and 796830 were employed by PSNH. In addition, 3,6644,007 were employed by Eversource Service, Eversource's service company, that provides support services to all Eversource operating companies. Approximately 5049 percent of our employees are members of the International Brotherhood of Electrical Workers, the Utility Workers Union of America or The United Steelworkers, and are covered by 13various collective bargaining agreements.
Safety. At Eversource, our commitment to “Safety First and Always” is a principle and a mindset present in every job and every task, whether in the field, office or at home. A priority at Eversource is continuous improvement and safety is at the forefront as we continue to build a strong safety culture, embrace new technologies, and learn with our industry and community partners to improve safety performance. We provide safety training and perform field safety job observations of both internal and contractor crews with a focus on high-energy hazards. We use metrics such as Eversource Corporate Days Away Restricted Time (DART) and Preventable Motor Vehicle events,High Energy Field Observations, among others, to monitor safety performance. Our DART safety performance was 1.00.81 in 2022,2023, measured by days away, restricted or transferred per 100 workers, using the DART-OSHA method of measurement.
Diversity, Equity & Inclusion. Our commitment to Diversity, Equity & Inclusion (DEI) is critical to building a diverse, empowered and engaged team that delivers greatsuperior service safely to our customers. A diverse workforce and inclusive culture contribute to our success and sustainability by driving innovation and creating trusted relationships with our employees, customers, suppliers, and community partners. We continue to identify and support many programs and agencies that address racial and ethnic disparities in our communities and beyond. We also remain committed to developing a workforce that fully reflects the diversity of the people and communities we serve. Our hiring practices emphasize diversity, equity and inclusion, and we encourage employees to embrace different people, perspectives, and experiences in our workplace and within our communities. Additionally, our leadership behaviors underscore the importance of creating inclusive teams, where employees’ voices and contributions are essential to delivering superior customer service.
Eversource continues to develop a diverse workforce with an increased focus on women and minorities in leadership and has DEI goals and initiatives for diversity in leadership promotions and new hires, diverse external hires, number of diverse candidate slate,applicants for jobs, key talent, workforce representation including female employees, diverse employees, and veteran hires, leadership engagement, community support and supplier spends.spending. Eversource drives accountability for DEI progress throughout the company and executive compensation is linked to meeting these goals. We sustained our successful drive to increase workforce diversity;diversity in 2022, 61.6%2023 with 55.9% of our external hires werebeing women and/or people of color and 45.1%48.1% percent of new hires and promotions into leadership roles werebeing women and/or people of color.
Eversource’s executive leadership team promotes and supports DEI by leadingbuilding and buildingleading diverse, inclusive work teams with high engagement,engagement. Leaders are committed to growing a pipeline of diverse talent, leveraging multiple perspectives to improve customer service, using diverse suppliers, and engaging with multicultural organizations in our communities and supporting the work of ourcommunities. Our DEI council, racial equity task force, business resource groups, and our cross-functional pro-equitypro-
equity advisory team, which developed equity guidelines and began to implement justice and equity training to all employees starting in 2022.2022 and continuing into 2024, provide our leaders with valuable feedback on the impact of our DEI and environmental justice efforts.
Eversource's Board of Trustees is committed to diversity, equity and inclusion and receives regular monthly progress updates. The Corporate Governance, Environmental and Social Responsibility Committee of the Board of Trustees is responsible for the oversight of environmental, human capital management and social responsibility strategy,strategies, programs and policies. The Board of Trustees seeks diversity in gender, race/race, ethnicity and personal background when considering Trustee candidates.
Compensation, Health and Wellness BenefitsBenefits.. We are Eversource is committed to the health, safety and wellness of our employees. We provide competitive compensation and comprehensive benefit packages, including healthcare, life insurance, long-termsick time and disability insurance,plans, death benefits, retirement plans (defined benefit pension plans or 401k Plan), an Employee Stock Purchase Plan, health savings and flexible spending accounts, paid time off, employee assistance programs, and tuition assistance, among many others. Eversource also provides wellness programs and benefits to encourage employees and their families to adopt and maintain healthy lifestyle habits. Eversource has established flexible work guidelines and offers hybrid work arrangements to employees in applicable positions.
Talent Development, Training Programs and Education Opportunities.Strategic workforce plans are developed every year as part of the annual business planning process to identifyaddress immediate and long-range needs and to ensure that we acquire, developEversource acquires, develops and retainretains diverse, capable talent. Eversource supports and develops its employees through training and development programs that build and strengthen employees’ leadership and skill set. Employee development programs are aligned to our strategic workforce plan to support succession within all levels of the organization. Continuous professional development is important to support our employees’ ongoing success. These professional development programs include leadership effectiveness programs designed to develop new and current supervisors; a talent management process to identify high potential and emerging talent and ensure their development; a rotational associate engineering program;multiple early career development programs in Engineering, Transmission and Operations; educational and professional development opportunities for employees who are recent college graduates; tuition assistance program; and paid internships and co-ops.co-ops; and workforce development programs focused on building a talent pipeline for our technical craft roles.
We leverage educational partnerships in critical trade and technical areas and have developed proactive sourcing strategies to attract experienced workers in highly technical roles in engineering, electric and gas operations, and energy efficiency. As part of this process, we identifyEversource identifies critical roles and developdevelops succession plans to ensure we have a capable supply of talent for the future.
Community & Social Impact. Eversource and our employees support many nonprofit organizations and programs agencies,that make a positive difference in the lives of our customers and not-for-profitthe communities that we serve. The Eversource Foundation provides grants to charitable organizations that provide economichelp to make broad, meaningful, and community development, the environment,sustainable change, with a focus on environmental justice and initiativeshistorically marginalized communities. Our employees also lend their time and talents to volunteer with charitable organizations that address local high-priority concerns and needs. Our goal at Eversource provides donationsis to lend a hand to organizations that really make a difference in the communities where we live and other support to community agencies, including significant volunteer hours of our employees.work.
See Item 11, Executive Compensation, included in this Annual Report on Form 10-K, as well as our 20212022 Sustainability Report and our 20212022 Diversity, Equity and Inclusion Report located on our website, for more detailed information regarding our human capital programs and initiatives. Nothing on our website, including our Sustainability Report, our Diversity, Equity and Inclusion Report, or sections thereof, shall be deemed incorporated by reference into this Annual Report.
INTERNET INFORMATION
Our website address is www.eversource.com. We make available through our website a link to the SEC's EDGAR website (http://www.sec.gov/edgar/searchedgar/companysearch.html), at which site Eversource's, CL&P's, NSTAR Electric's and PSNH's combined Annual Reports on Form 10-K, combined Quarterly Reports on Form 10-Q, Current Reports on Form 8-K and any amendments to those reports may be reviewed. Information contained on the Company's website or that can be accessed through the website is not incorporated into and does not constitute a part of this Annual Report on Form 10-K. Printed copies of these reports may be obtained free of charge by writing to our Investor Relations Department at Eversource Energy, 107 Selden Street, Berlin, CT 06037.
Item 1A. Risk Factors
In addition to the matters set forth under "Safe Harbor Statement Under the Private Securities Litigation Reform Act of 1995" included immediately prior to Item 1, Business, above, we are subject to a variety of material risks. Our susceptibility to certain risks, including those discussed in detail below, could exacerbate other risks. These risk factors should be considered carefully in evaluating our risk profile. There may be additional risks and uncertainties (either currently unknown or not currently believed to be material) that could adversely affect our financial position, results of operations, and cash flows.
Cybersecurity Threats and Data Privacy Risks:Attacks:
Cyberattacks, including acts of war or terrorism, targeted directly on or indirectly affecting our systems or the systems of third parties on which we rely, could severely impair operations, negatively impact our business, lead to the disclosure of confidential information and adversely affect our reputation.
Cyberattacks that seek to exploit potential vulnerabilities in the utility industry and seek to disrupt electric, natural gas and water transmission and distribution systems are increasing in sophistication, magnitude and frequency. InVarious geo-political conflicts and acts of war around the first quarter of 2022, the federal government notified the owners and operators ofworld continue to result in increased cyberattacks against critical infrastructure that the conflict between Russia and Ukraine has increased the likelihood of a cyberattack on such systems.infrastructure. A successful cyberattack on the information technology systems that control our transmission, distribution, natural gas and water systems or other assets could impair or prevent us from managing these systems and facilities, operating our systems effectively, or properly managing our data, networks and programs. The breach of certain information technology systems could adversely affect our ability to correctly record, process and report financial information. A major cyber incident could result in significant expenses to investigate and to repair system damage or security breaches and could lead to litigation, fines, other remedial action, heightened regulatory scrutiny and damage to our reputation.
We have instituted safeguards to protect our information technology systems and assets. We deploy substantial technologies to system and application security, encryption and other measures to protect our computer systems and infrastructure from unauthorized access or misuse. Specifically, regarding vulnerabilities, we patch systems where patches are available to deploy, and have technologies that detect exploits of vulnerabilities and proactively block the exploit when it happens. We also interface with numerous external entities to improve our cybersecurity situational awareness. The FERC, through the North American Electric Reliability Corporation (NERC), requires certain safeguards to be implemented to deter cyberattacks. These safeguards may not always be effective due to the evolving nature of cyberattacks. We maintain cyber insurance to cover damages, potential ransom and defense costs related to breaches of networks or operational technology, but it may be insufficient in limits and coverage exclusions to cover all losses.
Any such cyberattacks could result in loss of service to customers and a significant decrease in revenues, which could have a material adverse impact on our financial position, results of operations and cash flows.
For further information, see Item 1C, Cybersecurity included in this Annual Report on Form 10-K.
The unauthorized access to, and the misappropriation of, confidential and proprietary Company, customer, employee, financial or system operating information could adversely affect our business operations and adversely impact our reputation.
In the regular course of business, we, and our third-party suppliers, rely on information technology to maintain sensitive Company, customer, employee, financial and system operating information. We are required by various federal and state laws to safeguard this information. Cyber intrusions, security breaches, theft or loss of this information by cybercrime or otherwise could lead to the release of critical operating information or confidential Company, customer or employee information, which could adversely affect our business operations or adversely impact our reputation, and could result in significant costs, fines and litigation. We employ system controls to prevent the dissemination of certain confidential information and periodically train employees on phishing risks. We maintain cyber insurance to cover damages, potential ransom and defense costs arising from unauthorized disclosure of, or failure to protect, private information, as well as costs for notification to, or for credit monitoring of, customers, employees and other persons in the event of a breach of private information. This insurance covers amounts paid to address a network attack or the disclosure of personal information, and costs of a qualified forensics firm to determine the cause, source and extent of a network attack or to investigate, examine and analyze our network to find the cause, source and extent of a data breach, but it may be insufficient to cover all losses. While we have implemented measures designed to prevent network attacks and mitigate their effects should they occur, these measures may not be effective due to the continually evolving nature of efforts to access confidential information.
Offshore Wind Business and Operational Risks:Risk:
Strategic development opportunities associated withOur financial position and future results could be materially adversely affected if we are unable to sell our 50 percent interests in three offshore wind orprojects on the timelines, terms and pricing we expect, if we and the counterparties are unable to satisfy all closing conditions and consummate the purchase and sale transactions with respect to our offshore wind assets, if Sunrise Wind does not win in the OREC contract solicitation process, if we are unable to qualify for investment opportunitiestax credits related to these projects, if we experience variability in electric transmission, distributed generation, or clean-energy opportunities may not be successful,the projected construction costs of the offshore wind projects, if there is a deterioration of market conditions in the offshore wind industry, and if the projects maydo not commence operation as scheduled or within budget or be completed, which could have a material adverse effect on our business prospects.are not completed.
We are pursuing broader strategic
Our offshore wind business includes 50 percent ownership interests in three jointly-owned offshore wind projects being developed and constructed. The development investment opportunities that will benefit the Northeast region related to the development,and construction and operation of these offshore wind electric generation facilities and investment opportunities in electric transmission facilities, distributed generation and other clean-energy infrastructure. The states in which we provide service have implemented selection procedures for such new facilities that require the review of competing projects and permit the selection of only those projects that are expected to provide the greatest benefit to customers. Accordingly, our projects may not be selected for construction. The development and construction of projects selected for construction involves numerous significant risks including scheduling delays, increased costs, tax strategies and changes to federal tax laws,meeting construction schedules, federal, state and local permitting and regulatory approval processes, specifically BOEM’s approval processes,scheduling or permitting delays, cost overruns, higher interest rates, tax strategies and changes to federal tax laws impacting the offshore wind partnership’s ability to monetize tax attributes, new legislation impacting the industry, future legislative or regulatory actions that could result in thesethe cancellation of any projects, not being probable of entering the construction phase, economic events or factors, environmental and community concerns, design and siting issues, difficulties in obtaining required rights of way, competition
from incumbent utilities and other entities, actions of our strategic partners, and capacity factors once projects are placed in operation. Also, supply constraints in New England are leading to historic increases in fuel and commodity costs which may impact our ability to accomplish our strategic objectives.
partner
Our. Operational risks of these offshore wind partnership’s ability to generate returns from its offshore wind projects will depend on meeting construction schedules, controlling project costs,electric generation facilities include maintaining continuing interconnection arrangements, power purchase agreements, or other market mechanisms, as well as interconnecting utility and Regional Transmission Organizations rules, policies, procedures and FERC tariffs that permit future offshore wind project operations. Additionally, scheduling or permitting delaysoperations, and capacity factors once projects are placed in offshore wind projects, increases in cost estimates, higher interest rates, changes to tax laws impacting theoperation. These risks could impact our offshore wind partnership’s ability to monetize tax attributes, or the cancellation of anygenerate returns from its offshore wind projects as well as the other risk factors described above, couldand result in lower investment returnsreturns.
We have entered into agreements to sell our interest in the three offshore wind projects, however we may be unable to complete the sales of these projects on the timelines and if significant enough, an impairment offor the carryingsales value we expect. If the ultimate sales value of our investment. Such an impairmentinterest in these projects is lower than expected, or we are unable to sell our interests, it could have a materialan adverse effect on our financial condition and results of operations. The sales agreements are subject to certain regulatory approvals as well as other conditions, and we may be unable to satisfy all closing conditions necessary to consummate the purchase and sale transactions. The purchaser of the Revolution Wind and South Fork Wind projects may be unable to reach a partnership agreement with Ørsted, which is a condition of closing that transaction. The sale of the Sunrise Wind project to Ørsted is dependent on the successful outcome of Sunrise Wind’s re-bidding process of its OREC contract in the New York solicitation. If Sunrise Wind were to lose to a competing bid in the New York solicitation, then the existing OREC contract for Sunrise Wind will be cancelled according to the state’s requirements, and Eversource and Ørsted’s joint venture for Sunrise Wind will remain in place. That scenario could adversely impact the ability to sell the Sunrise Wind project in the future, and could result in the project to be abandoned. If the Sunrise Wind project were to be abandoned, there would be cancellation and other abandonment costs incurred, and those costs could be above amounts already assumed in our impairment evaluation and reflected in the current fair value on our balance sheet, which could have an adverse effect on our financial condition and results of operations.
Future cash flows resulting from the expected sales are also impacted by the ability to qualify the Revolution Wind project for investment tax credit adders, as included in the Inflation Reduction Act. Evaluating the project’s qualifications to achieve these investment tax credit adders requires significant judgment, and we may be unable to meet these qualifications. Additionally, for Revolution Wind and South Fork Wind, there could be cost overruns on the projects through each project's respective commercial operation date, which would not be recovered in the expected sales price and other potential future payments to maintain transaction economics required of Eversource. Amounts incurred above those that have already been assumed in our impairment evaluation and reflected in the current fair value on our balance sheet would adversely impact our financial position, results of operations and cash flows, or our future growth opportunities may not be realized as anticipated.flows.
We assess our investments (recorded as either long-lived assets or equity method investments) for impairment whenever events or circumstances indicate thatThese risks could adversely affect the carrying amount of the investment may not be recoverable. To the extent theultimate value of the investment becomes impaired, thewind projects and result in an additional, significant impairment chargein a future period, which could have a material adverse effect on our financial condition and results of operations. Lower-than-expected sales prices, or the inability to sell the wind projects, could also result in liquidity issues, negatively impact certain of our financial metrics and operations plan, or could result in a downgrade in our credit rating, which could increase our cost of borrowing and cost of capital or restrict our ability to access the capital markets.
We rely on third-party suppliers for equipment, materials,Regulatory, Legislative and services and we outsource certain business functions to third-party suppliers and service providers, and substandard performance or inability to fulfill obligations by those third parties could harm our business, reputation and results of operations.Compliance Risks:
We outsource certain services to third parties in areas including information technology, transaction processing, human resources, payrollThe actions of regulators and payroll processing and certain operational areas. Outsourcing of services to third partieslegislators could expose us to substandard quality of service delivery or substandard deliverables, which may result in missed deadlines or other timeliness issues, non-compliance (including with applicable legal requirements and industry standards) or reputational harm, which could negatively impact our results of operations. Our contractual arrangements with these contractors typically include performance standards, progress payments, insurance requirements and security for performance. We also continue to pursue enhancements to standardize our systems and processes. The global supply chain of goods and services is currently being negatively impacted by several factors, including the geopolitical climate, labor shortages, domestic and international shipping constraints, increased demand, and shortages of raw materials. As a result, we are seeing delivery delays of certain goods. Additionally, the prices for equipment, materials, and contractor services have increased, andoutcomes that may continue to increase. If significant difficulties in the global supply chain cycle or inflationary impacts were to continue or worsen, they could adversely affect our resultsearnings and liquidity.
The rates that our electric, natural gas and water companies charge their customers are determined by their state regulatory commissions. These commissions also regulate the companies' accounting, operations, the issuance of operations,certain securities and certain other matters. The FERC regulates the transmission of electric energy, the sale of electric energy at wholesale, accounting, issuance of certain securities and certain other matters, including reliability standards through the NERC. The regulatory process may be adversely affected by the political, regulatory and economic environment in the states in which we operate.
Under state and federal law, our electric, natural gas and water companies are entitled to charge rates that are sufficient to allow them an opportunity to recover their prudently incurred operating and capital costs and a reasonable rate of return on invested capital, to attract needed capital and maintain their financial integrity, while also protecting relevant public interests. Our electric, natural gas and water companies are required to engage in regulatory approval proceedings as a part of the process of establishing the terms and rates for their respective services. Each of these companies prepares and submits periodic rate filings with their respective state regulatory commissions for review and approval, which allows for various entities to challenge our current or adversely affectfuture rates, structures or mechanisms and could alter or limit the rates we are allowed to charge our customers. These proceedings typically involve multiple parties, including governmental bodies and officials, consumer advocacy groups, and various consumers of energy, who have differing concerns. Any change in rates, including changes in allowed rate of return, are subject to regulatory approval proceedings that can be contentious, lengthy, and subject to appeal. This may lead to uncertainty as to the ultimate result of those proceedings. Established rates are also subject to subsequent prudency reviews by state regulators, whereby various portions of rates could be adjusted, subject to refund or disallowed, including cost recovery mechanisms. The ultimate outcome and timing of regulatory rate proceedings, or challenges to certain provisions in our distribution tariffs could have a significant effect on our ability to work with regulators, unions, customersrecover costs or employees.
Our transmission and distribution systems may not operate as expected, and could require unplanned expenditures, whichearn an adequate return. Adverse decisions in our proceedings could adversely affect our financial position, results of operations and cash flows. We continue to experience challenges related to the regulatory environment in Connecticut with respect to our electric distribution, natural gas, and water businesses.
Our ability to properly operate our transmission
The federal, state and distribution systems is critical to the financial performance of our business. Our transmissionlocal political and distribution businesses face several operational risks, including the breakdown, failure of, or damage to operating equipment, information technology systems, or processes, especially due to age; labor disputes; disruptionseconomic environment currently has, and may in the deliveryfuture have, an adverse effect on regulatory decisions with negative consequences for us. These decisions may require us to cancel, reduce, or delay planned development activities or other planned capital expenditures or investments or otherwise incur costs that we may not be able to recover through rates. There can be no assurance that regulators will approve the recovery of electricity,all costs incurred by our electric, natural gas and water; increased capital expenditure requirements,water companies, including those due to environmental regulation; catastrophic events such as fires, explosions, a solar event, an electromagnetic event, or other similar occurrences; increasingly severe weather conditions due to climate change beyond equipment and plant design capacity; human error; global supply chain disruptions; and potential claimscosts for property damage or personal injuries beyond the scope of our insurance coverage. Many of our transmission projects are expected to alleviate identified reliability issues and reduce customers' costs. However, if the in-service date for one or more of these projects is delayed due to economic events or factors, or regulatory or other delays, the risk of failures in the electric transmission system may increase. We also implement new information technology systems from time to time, which may disrupt operations. Any failure of our transmission and distribution systems to operate as planned may result in increased capital costs, reduced earnings or unplanned increases in operationsconstruction, operation and maintenance, costs.and storm restoration. The inability to recover a significant amount of suchoperating costs could have an adverse effect on our financial position, results of operations, and cash flows. Changes to rates may occur at times different from when costs are incurred. Additionally, catastrophic events at other utilities could result in our regulators and legislators imposing additional requirements that may lead to additional costs for the companies. In addition to the risk of disallowance of incurred costs, regulators may also impose downward adjustments in a company’s allowed ROE as well as assess penalties and fines. These actions would have an adverse effect on our financial position, results of operations and cash flows.
New technologyThe FERC has jurisdiction over our transmission costs recovery and alternative energy sourcesour allowed ROEs. If FERC changes its methodology on developing ROEs, there could be a negative impact on our results of operations and cash flows. Additionally, certain outside parties have filed four complaints against transmission-owning electric companies within ISO-NE alleging that our allowed ROEs are unjust and unreasonable. An adverse decision in any of these four complaints could adversely affect our financial position, results of operations and cash flows.
The FERC also has jurisdiction over our transmission rate incentives such as the regional transmission organization (RTO) participation ROE incentive adder, CWIP in rate base incentive and the abandoned plant incentive. If the FERC changes its policies regarding these incentives, there could be a negative impact on our financial results.position, results of operations and cash flows. Additionally, the FERC issued a Supplemental Notice of Proposed Rulemaking (NOPR) on Transmission Incentives that proposes to eliminate the existing RTO ROE incentive adder for utilities that have been participating in an RTO for more than three years. A FERC decision approving this proposal could adversely affect our financial position, results of operations and cash flows.
Advances in technology that reduceFERC's policy has encouraged competition for transmission projects, even within existing service territories of electric companies, as it looks to expand the coststransmission system to accommodate state and federal policy goals to utilize more renewable energy resources as well as to enhance reliability and resilience for extreme weather events. Implementation of alternative methods of producing electric energy to a level that is competitive with that of current electric production methods, could result in loss of market share and customers, andFERC's goals, including within our service territories, may requireexpose us to make significant expenditurescompetition for construction of transmission projects, additional regulatory considerations, and potential delay with respect to remain competitive. These changesfuture transmission projects, which may adversely affect our results of operations and lower rate base growth.
Changes in technology, including micro-gridstax laws, as well as the potential tax effects of business decisions could negatively impact our business, results of operations, financial condition and advances in energy or battery storage, could also alter the channels through which electric customers buy or utilize energy, which could reduce our revenues or increase our expenses. Economic downturns or periods of high energy supply costs typically can lead to the development of legislative and regulatory policy designed to promote reductions in energy consumption and increased energy efficiency and self-generation by customers. Additionally, in response to risks posed by climate change, we may need to make investments in our system including upgrades or retrofits to meet enhanced design criteria, which can incur additional costs over conventional solutions.cash flows.
We are exposed to significant reputational risks, which make us vulnerable to increased regulatory oversight or other sanctions.
Because utility companies, including our electric, natural gas and water utility subsidiaries, have large customer bases, they are subject to adverse publicity focused on the reliability of their distribution services and the speed with which they are able to respond to electric outages, natural gas leaks and similar interruptions caused by storm damage or other unanticipated events, including those related to climate change. Adverse publicity of this nature could harm our reputation and the reputation of our subsidiaries; may make state legislatures, utility commissions and other regulatory authorities less likely to view us in a favorable light; and may cause us to be subject to less favorable legislative and regulatory outcomes, legal claims or increased regulatory oversight. Unfavorable regulatory outcomes can include more stringent laws and regulations governing our operations, such as reliability and customer service quality standards or vegetation management requirements, as well as fines, penalties or other sanctions or requirements. Further, we rely upon purchased power and purchased natural gas supply from third parties to meet customers’ energy requirements.Due to a variety of factors, including the inflationary economic environment, geo-political conflicts, and increased customer energy demand, the cost of energy supply in New England remains high. We also may be required to implement rolling blackouts by ISO-NE, the region’s independent grid operator if enough capacity is not available in the area to meet peak demand needs. The significant supply cost increases, as well as any failure to meet customer energy requirements, could negatively impact the satisfaction of our customers and our customers’ ability to pay their utility bills, which could have an adverse impact on our business, reputation, financial position, results of operations and cash flows.
Addressing any adverse publicity, regulatory scrutiny or enforcement or other legal proceedings is time consuming and expensive and, regardless of the factual basis for the assertions being made, can have a negative impact on the reputation of our business, on the morale and performance of our employees and on our relationships with respective regulators, customers and counterparties. We are unable to predict future legislative or regulatory changes, initiatives or interpretations or other legal proceedings, and there can be no assurance that we will be able to respond adequately to such actions. The direct and indirect effects of negative publicity, and the demands of responding to and addressing it, may have a material adverse effect on our financial position, results of operations and cash flows.
Costs of compliance with environmental laws and regulations, including those related to climate change, may increase and have an adverse effect on our business and results of operations.
Our subsidiaries’ operations are subject to extensive and increasing federal, state and local environmental statutes, rules and regulations that govern, among other things, water quality (including treatment of PFAS (Per- and Polyfluoroalkyl Substances) and lead), water discharges, the management of hazardous material and solid waste, and air emissions. Compliance with these requirements requires us to incur significant costs relating to environmental permitting, monitoring, maintenance and upgrading of facilities, remediation, and reporting. For our water business, compliance with proposed water quality regulations, including those for PFAS and lead, could require the construction of facilities and replacement of customer lead service lines, respectively.
The losscosts of key personnel,compliance with existing legal requirements or legal requirements not yet adopted may increase in the inabilityfuture. Although we have recorded liabilities for known environmental obligations, these costs can be difficult to hireestimate due to uncertainties about the extent of contamination, remediation alternatives, the remediation levels required by state and retain qualified employees, orfederal agencies, and the failure to maintain a positive relationship with our workforcefinancial ability of other potentially responsible parties. An increase in such costs, unless promptly recovered, could have an adverse effectimpact on our business and our financial position, and results of operations.operations and cash flows.
Our operations dependFor further information, see Item 1,Business – Other Regulatory and Environmental Matters, included in this Annual Report on the continued efforts of our employees. Retaining key employees and maintaining the ability to attract new employees are important to both our operational and financial performance. We cannot guarantee that any member of our management or any key employee at the Eversource parent or subsidiary level will continue to serve in any capacity for any particular period of time. Our workforce in our subsidiaries includes many workers with highly specialized skills maintaining and servicing the electric, natural gas and water infrastructure that cannot be quickly replaced due to the technically complex work they perform. We have developed strategic workforce plans to identify key functions and proactively implement plans to assure a ready and qualified workforce, but we cannot predict the impact of these plans on our ability to hire and retain key employees. Labor disputes, work stoppages or an inability to negotiate future collective bargaining agreements on commercially reasonable terms, as well as the increased competition for talent or the intentional misconduct of employees or contractors, may also have an adverse effect on our business, financial position and results of operations.Form 10-K.
Risks Related to the Environment and Catastrophic Events:
The effects of climate change, including severe storms, could cause significant damage to any of our facilities requiring extensive expenditures, the recovery for which is subject to approval by regulators.
Climate change creates physical and financial risks to our operations. Physical risks from climate change may include an increase in sea levels and changes in weather conditions, such as changes in precipitation, extreme heat and extreme weather events. Customers’ energy and water needs vary with weather conditions, primarily temperature and humidity. For residential customers, heating and cooling represent their largest energy use. For water customers, conservation measures imposed by the communities we serve could impact water usage. To the extent weather conditions are affected by climate change, customers’ energy and water usage could increase or decrease depending on the duration and magnitude of the changes.
Severe weather induced by climate change, such as extreme and frequent ice and snow storms, tornadoes, micro-bursts, hurricanes, floods, droughts, wildfires, and other natural disasters, may cause outages and property damage, which may require us to incur additional costs that may not be recoverable from customers. The cost of repairing damage to our operating subsidiaries' facilities and the potential disruption of their operations due to storms, natural disasters or other catastrophic events could be substantial, particularly as regulators and customers demand better and quicker response times to outages. If, upon review, any of our state regulatory authorities finds that our actions were imprudent, some of those restoration costs may not be recoverable from customers and could result in penalties or fines. The inability to recover a significant amount of such costs could have an adverse effect on our financial position, results of operations and cash flows. We maintain property insurance, but it may be insufficient in limits and coverage exclusions to cover all losses. Additionally, these types of weather events risk interruption of the supply chain and could disrupt the delivery of goods and services required for our operations.
Transitional impacts related to climate change may have an adverse effect on our business and results of operations due to costs associated with new technologies, evolving customer expectations and changing workforce needs.
Initiatives to mitigate the impacts of climate change, support a transition to cleaner energy, and reduce emissions, may have a material adverse financial impact to our business. These impacts include the costs associated with the development and implementation of new technologies to maintain system reliability and resiliency and lower emissions, including grid modernization and energy storage. An increase in such costs, unless promptly recovered, could have an adverse impact on our financial position, results of operations and cash flows. There may also be financial and reputational risks if we fail to meet evolving customer expectations, including enabling the integration of residential renewables and providing low carbon solutions, such as electric vehicle infrastructure and energy efficiency services. Additionally, actions to mitigate climate change may result in a transition in our workforce that must adapt to meet the need for new job skills. Associated costs include training programs for existing employees and workforce development as we transition to new technologies and clean energy solutions.
Adequacy of water supplies and contamination of our water supplies, the failure of dams on reservoirs providing water to our customers, or requirements to repair, upgrade or dismantle any of these dams, may disrupt our ability to distribute water to our customers and result in substantial additional costs, which could adversely affect our financial position, results of operations and cash flows.
Our water business faces an inherent strategic risk related to adequacy of supply (i.e., water scarcity). Water scarcity risk is heightened by multiple factors. We expect that climate change will cause both an increase in demand due to increasing temperatures and a potential for a decrease of available supply due to shifting rainfall and recharge patterns. Regulatory constraints also present challenges to permit new sources of supply in the region. In Connecticut, where the vast majority of our dams are located, impounded waterways are required to release minimum downstream flow. New regulations are being phased into effect over the next one to five years that will increase the volume of downstream releases required across our Connecticut service territory, depleting the volume of supply in storage that is used to meet customer demands. This combination of factors may cause an increased likelihood of drought emergencies and water use restrictions that could adversely affect our ability to provide water to our customers, and reputational/brand damage that could negatively impact our water business.
Our water supplies, including water provided to our customers, are also subject to possible contamination from naturally occurring compounds and elements or man-made substances.non-organic substances, including PFAS and lead. Our water systems include impounding dams and reservoirs of various sizes. Although we believe our dams are structurally sound and well-maintained, significant damage to these facilities, or a significant decrease in the water in our reservoirs, could adversely affect our ability to provide water to our customers until the facilities and a sufficient amount of water in our reservoirs can be restored. A failure of a dam could result in personal injuries and downstream property damage for which we may be liable. The failure of a dam would also adversely affect our ability to supply water in sufficient quantities to our customers. Any losses or liabilities incurred due to a failure of one of our
dams may not be recoverable in rates and may have a material adverse effect on our financial position, results of operations and cash flows. We maintain liability insurance, but it may be insufficient in limits and coverage exclusions to cover all losses.
Physical attacks, including acts of war or terrorism, both threatened and actual, could adversely affect our ability to operate our systems and could adversely affect our financial results and liquidity.
Physical attacks, including acts of war or terrorism, both threatened and actual, that damage our transmission and distribution systems or other assets could negatively impact our ability to transmit or distribute energy, water, natural gas, or operate our systems efficiently or at all. Because our electric transmission systems are part of an interconnected regional grid, we face the risk of widespread blackouts due to grid disturbances or disruptions on a neighboring interconnected system. Similarly, our natural gas distribution system is connected to transmission pipelines not owned by Eversource. If there was an attack on the transmission pipelines, it could impact our ability to deliver natural gas. If our assets were physically damaged and were not recovered in a timely manner, it could result in a loss of service to customers, a significant decrease in revenues, significant expense to repair system damage, costs associated with governmental actions in response to such attacks, and liability claims, all of which could have a material adverse impact on our financial position, results of operations and cash flows. We maintain property and liability insurance, but it may be insufficient in limits and coverage exclusions to cover all losses. In addition, physical attacks against third-party providers could have a similar effect on the operation of our systems.
Regulatory, LegislativeBusiness and ComplianceOperational Risks:
The actions of regulators and legislatorsStrategic development or investment opportunities in electric transmission, distributed generation, or clean-energy technologies may not be successful, which could result in outcomes that may adversely affecthave a material adverse effect on our earnings and liquidity.business prospects.
We are pursuing investment opportunities in electric transmission facilities, distributed generation and other clean-energy infrastructure, including interconnection facilities. The rates thatdevelopment of these projects involve numerous significant risks including federal, state and local permitting and regulatory approval processes, scheduling or permitting delays, increased costs, tax strategies and changes to federal tax laws, new legislation impacting the industry, economic events or factors, environmental and community concerns, design and siting issues, difficulties in obtaining required rights of way, and competition from incumbent utilities and other entities. Also, supply constraints in New England have led to significant increases in commodity costs which may impact our electric, natural gasability to accomplish our strategic objectives. Further, regional clean energy goals may not be achieved if local, state, and water companies charge their customers are determined by their state regulatory commissions and by the FERC. These commissions also regulate the companies' accounting, operations, the issuancefederal policy is not in alignment with integrated planning of certain securities and certain other matters. The FERC also regulates the transmission of electric energy, the sale of electric energy at wholesale, accounting, issuance of certain securities and certain other matters, including reliability standards through the NERC. The regulatory process may be adversely affected by the political, regulatory and economic environment in the states in which we operate.our infrastructure investments.
Under stateOur transmission and federal law, our electric, natural gas and water companies are entitled to charge rates that are sufficient to allow them an opportunity to recover their prudently incurred operating and capital costs and a reasonable rate of return on invested capital, to attract needed capital and maintain their financial integrity, while also protecting relevant public interests. Our electric, natural gas and water companies are required to engage in regulatory approval proceedingsdistribution systems may not operate as a part of the process of establishing the terms and rates for their respective services. Each of these companies prepares and submits periodic rate filings with their respective regulatory commissions for review and approval, which allows for various entities to challenge our current or future rates, structures or mechanismsexpected, and could alter or limit the rates we are allowed to charge our customers. These proceedings typically involve multiple parties, including governmental bodies and officials, consumer advocacy groups, and various consumers of energy, who have differing concerns. Any change in rates, including changes in allowed rate of return, are subject to regulatory approval proceedings that can be contentious, lengthy, and subject to appeal. This may lead to uncertainty as to the ultimate result of those proceedings. Established rates are also subject to subsequent prudency reviews by state regulators, whereby various portions of rates could be adjusted, subject to refund or disallowed, including cost recovery mechanisms. The ultimate outcome and timing of regulatory rate proceedings or challenges to certain provisions in our distribution tariffs could have a significant effect on our ability to recover costs or earn an adequate return. Adverse decisions in our proceedingsrequire unplanned expenditures, which could adversely affect our financial position, results of operations and cash flows.
The federal, stateOur ability to properly operate our transmission and local politicaldistribution systems is critical to the financial performance of our business. Our transmission and economic environment has had, and maydistribution businesses face several operational risks, including the breakdown, failure of, or damage to operating equipment, information technology systems, or processes, especially due to age; labor disputes; disruptions in the future have, an adverse effect on regulatory decisions with negative consequences for us. These decisions may require us to cancel, reduce, or delay planned development activities or other planned capital expenditures or investments or otherwise incur costs that we may not be able to recover through rates. There can be no assurance that regulators will approve the recoverydelivery of all costs incurred by our electric,electricity, natural gas and water companies,water; increased capital expenditure requirements, including those due to environmental regulation; catastrophic events resulting from equipment failures such as wildfires and explosions, or external events such as a solar event, an electromagnetic event, or other similar occurrences; increasingly severe weather conditions due to climate change beyond equipment and plant design capacity; human error; global supply chain disruptions; and potential claims for property damage or personal injuries beyond the scope of our insurance coverage. Many of our transmission projects are expected to alleviate identified reliability issues and reduce customers' costs. However, if the in-service date for one or more of these projects is delayed due to economic events or factors, or regulatory or other delays, including permitting and siting, the risk of failures in the electric transmission system may increase. We also implement new information technology systems from time to time, which may disrupt operations. Any failure of our transmission and distribution systems to operate as planned may result in increased capital costs, for construction, operationreduced earnings or unplanned increases in operations and maintenance and storm restoration.costs. The inability to recover a significant amount of operatingsuch costs could have an adverse effect on our financial position, results of operations and cash flows. Changes
New technology and alternative energy sources could adversely affect our operations and financial results.
Advances in technology that reduce the costs of alternative methods of producing electric energy to rates may occur at times different from when costs are incurred. Additionally, catastrophic events at other utilitiesa level that is competitive with that of current electric production methods, could result in loss of market share and customers, and may require us to make significant expenditures to remain competitive. These changes in technology, including micro-grids and advances in energy or battery storage, could also alter the channels through which electric customers buy or utilize energy, which could reduce our regulators and legislators imposing additional requirements that mayrevenues or increase our expenses. Economic downturns or periods of high energy supply costs typically can lead to the development of legislative and regulatory policy designed to promote reductions in energy consumption and increased energy efficiency and self-generation by customers. Additionally, in response to risks posed by climate change, we may need to make investments in our system including upgrades or retrofits to meet enhanced design criteria, which can incur additional costs over conventional solutions.
We rely on third-party suppliers for equipment, materials, and services and we outsource certain business functions to third-party suppliers and service providers, and substandard performance or inability to fulfill obligations by those third parties could harm our business, reputation and results of operations.
We outsource certain services to third parties in areas including information technology, transaction processing, human resources, payroll and payroll processing and certain operational areas. Outsourcing of services to third parties could expose us to substandard quality of service delivery or substandard deliverables, which may result in missed deadlines or other timeliness issues, non-compliance (including with applicable legal requirements and industry standards) or reputational harm, which could negatively impact our results of operations. Our contractual arrangements with these contractors typically include performance standards, progress payments, insurance requirements and security for performance. The global supply chain of goods and services remains volatile, and as a result, we are seeing delivery delays of certain goods, particularly certain types
of transformers. If significant difficulties in the companies. In additionglobal supply chain cycle or inflationary impacts were to worsen, they could adversely affect our results of operations, or adversely affect our ability to work with regulators, unions, customers or employees.
The loss of key personnel, the risk of disallowance of incurred costs, regulators may also impose downward adjustments ininability to hire and retain qualified employees, or the failure to maintain a company’s allowed ROE as well as assess penalties and fines. These actions wouldpositive relationship with our workforce could have an adverse effect on our business, financial position results of operations and cash flows.
The FERC has jurisdiction over our transmission costs recovery and our allowed ROEs. If FERC changes their methodologies on developing ROEs there could be a negative impact on our results of operations and cash flows. Additionally, certain outside parties have filed four complaints against all electric companies under the jurisdiction of ISO-NE alleging that our allowed ROEs are unjust and unreasonable. An adverse decision in any of these four complaints could adversely affect our financial position, results of operations and cash flows.
FERC's policy has encouraged competition for transmission projects, even within existing service territories of electric companies. Implementation of FERC's goals, including within our service territories, may expose us to competition for construction of transmission projects, additional regulatory considerations, and potential delay with respect to future transmission projects, which may adversely affect our results of operations and lower rate base growth.
Changes in tax laws, including the Inflation Reduction Act (IRA) of 2022, as well as the potential tax effects of business decisions could negatively impact our business, results of operations (including our expected project returns from our planned offshore wind facilities), financial condition and cash flows.
We are exposed to significant reputational risks, which make us vulnerable to increased regulatory oversight or other sanctions.
Because utility companies, including our electric, natural gas and water utility subsidiaries, have large customer bases, they are subject to adverse publicity focused on the reliability of their distribution services and the speed with which they are able to respond to electric outages, natural gas leaks and similar interruptions caused by storm damage or other unanticipated events, including those related to climate change. Adverse publicity of this nature could harm our reputation and the reputation of our subsidiaries; may make state legislatures, utility commissions and other regulatory authorities less likely to view us in a favorable light; and may cause us to be subject to less favorable legislative and regulatory outcomes, legal claims or increased regulatory oversight. Unfavorable regulatory outcomes can include more stringent laws and regulations governing our operations, such as reliability and customer service quality standards or vegetation management requirements, as well as fines, penalties or other sanctions or requirements. Further, we rely upon purchased power and purchased natural gas supply from third parties to meet customers’ energy requirements. Due to a variety of factors, including the inflationary economic environment, conflict in Russia and Ukraine, and increased customer energy demand, the cost of energy supply in New England has significantly increased. We also may be required to implement rolling blackouts by ISO-New England, the region’s independent grid operator if enough capacity is not available in the area to meet peak demand needs. The significant supply cost increases, as well as any failure to meet customer energy requirements, could negatively impact the satisfaction of our customers and our customers’ ability to pay their utility bill, which could have an adverse impact on our business, reputation, financial position, results of operations and cash flows.
Addressing any adverse publicity, regulatory scrutiny or enforcement or other legal proceedings is time consuming and expensive and, regardless of the factual basis for the assertions being made, can have a negative impact on the reputation of our business, on the morale and performance of our employees and on our relationships with respective regulators, customers and counterparties. We are unable to predict future legislative or regulatory changes, initiatives or interpretations, and there can be no assurance that we will be able to respond adequately or sufficiently quickly to such actions. The direct and indirect effects of negative publicity, and the demands of responding to and addressing it, may have a material adverse effect on our financial position, results of operations and cash flows.
Costs of compliance with environmental laws and regulations, including those related to climate change, may increase and have an adverse effect on our business and results of operations.
Our subsidiaries' operations depend on the continued efforts of our employees. Retaining key employees and maintaining the ability to attract new employees are subjectimportant to extensiveboth our operational and increasing federal, statefinancial performance. We cannot guarantee that any member of our management or any key employee at the Eversource parent or subsidiary level will continue to serve in any capacity for any particular period of time. Our workforce in our subsidiaries includes many workers with highly specialized skills maintaining and local environmental statutes, rulesservicing the electric, natural gas and regulationswater infrastructure that govern, among other things, water quality, water discharges, the management of hazardous material and solid waste, and air emissions. Compliance with these requirements requires us to incur significant costs relating to environmental permitting, monitoring, maintenance and upgrading of facilities, remediation, and reporting.
The costs of compliance with existing legal requirements or legal requirements not yet adopted may increase in the future. Although we have recorded liabilities for known environmental obligations, these costs cancannot be difficult to estimatequickly replaced due to uncertainties about the extenttechnically complex work they perform. We have developed strategic workforce plans to identify key functions and proactively implement plans to assure a ready and qualified workforce, but we cannot predict the impact of contamination, remediation alternatives,these plans on our ability to hire and retain key employees. Labor disputes, work stoppages or an inability to negotiate future collective bargaining agreements on commercially reasonable terms, as well as the remediation levels required by state and federal agencies, andincreased competition for talent or the financial abilityintentional misconduct of other potentially responsible parties. An increase in such costs, unless promptly recovered, couldemployees or contractors, may also have an adverse impacteffect on our business, and our financial position and results of operations and cash flows.
For further information, see Item 1, Business - Other Regulatory and Environmental Matters, included in this Annual Report on Form 10-K.operations.
Financial, Economic, and Market Risks:
Limits on our access to, or increases in, the cost of capital may adversely impact our ability to execute our business plan.
We use short-term debt and the long-term capital markets as a significant source of liquidity and funding for capital requirements not obtained from our operating cash flow. If access to these sources of liquidity becomes constrained, our ability to implement our business strategy could be adversely affected. In addition, interest rates have increased and may continue to increase in the future. As a result, interest rates on future credit facilities and debt offerings could be higher than current levels, causing our financing costs to increase accordingly, which could adversely impact our financial position, results of operations and cash flows. A downgrade of our credit ratings or events beyond our control, such as a disruption in global capital and credit markets, could increase our cost of borrowing and cost of capital or restrict our ability to access the capital markets and negatively affect our ability to maintain and to expand our businesses.
Market performance or changes in assumptions may require us to make significant contributions to our pension and other postretirement benefit plans.
We provide a defined benefit pension plan and other postretirement benefits for a substantial number of employees, former employees and retirees. Our future pension obligations, costs and liabilities are highly dependent on a variety of factors, many of which are beyond our control. These factors include estimated investment returns, interest rates, discount rates, health care cost trends, benefit changes, salary increases and the demographics of plan participants. If our assumptions prove to be inaccurate, our future costs could increase significantly. In addition, various factors, including underperformance of plan investments and changes in law or regulation, could increase the amount of contributions required to fund our pension plan in the future. Additional large funding requirements, when combined with the financing requirements of our construction program, could impact the timing, amounts, and number of future financings and negatively affect our financial position, results of operations and cash flows.
Our goodwill is recorded at an amount that,Goodwill, investments in equity method investments, and long-lived assets if impaired and written down, could adversely affect our future operating results and total capitalization.
We have a significant amount of goodwill on our consolidated balance sheet, which, as of December 31, 2022,2023, totaled $4.52$4.53 billion. The carrying value of goodwill represents the fair value of an acquired business in excess of the fair value of identifiable assets and liabilities as of the acquisition date. We test our goodwill balances for impairment on an annual basis or whenever events occur, or circumstances change that would indicate a potential for impairment. A determination that goodwill is deemed to be impaired would result in a non-cash charge that could materially adversely affect our financial position, results of operations and total capitalization.
We assess our investments (recorded as either long-lived assets or equity method investments) for impairment whenever events or circumstances indicate that the carrying amount of the investment may not be recoverable. To the extent the value of the investment becomes impaired, the impairment charge could have a material adverse effect on our financial condition and results of operations.
Our counterparties may not meet their obligations to us or may elect to exercise their termination rights, which could adversely affect our earnings.
We are exposed to the risk that counterparties to various arrangements that owe us money, have contracted to supply us with energy or other commodities or services, or that work with us as strategic partners, including on significant capital projects, will not be able to perform their obligations, will terminate such arrangements or, with respect to our credit facilities, fail to honor their commitments. Should any of these counterparties fail to perform their obligations or terminate such arrangements, we might be forced to replace the underlying commitment at higher market prices and/or have to delay the completion of, or cancel, a capital project. Should any lenders under our credit facilities fail to perform, the level of borrowing capacity under those arrangements could decrease. In any such events, our financial position, results of operations, or cash flows could be adversely affected.
As a holding company with no revenue-generating operations, Eversource parent's liquidity is dependent on dividends from its subsidiaries, its commercial paper program, and its ability to access the long-term debt and equity capital markets.
Eversource parent is a holding company and as such, has no revenue-generating operations of its own. Its ability to meet its debt service obligations and to pay dividends on its common shares is largely dependent on the ability of its subsidiaries to pay dividends to, or repay borrowings from, Eversource parent, and/or Eversource parent's ability to access its commercial paper program or the long-term debt and equity capital markets. Prior to funding Eversource parent, the subsidiary companies have financial obligations that must be satisfied, including among others, their operating expenses, debt service, preferred dividends of certain subsidiaries, and obligations to trade creditors. Should the subsidiary companies not be able to pay dividends or repay funds due to Eversource parent, or if Eversource parent cannot access its commercial paper programs or the long-term debt and equity capital markets, Eversource parent's ability to pay interest, dividends and its own debt obligations would be restricted.
Item 1B. Unresolved Staff Comments
We do not have any unresolved SEC staff comments.
Item 1C. Cybersecurity
The Company’s policies, practices and technologies allow it to protect its information systems and operational assets from threats. The Board of Trustees and its Finance and Audit Committees continue to provide substantial and focused attention to cyber and system security. The Finance Committee of the Board of Trustees is responsible for oversight of the Company’s enterprise-wide risks, including risks associated with cyber and physical security, and the Company’s programs and practices to monitor and mitigate these risks.
Management prepares comprehensive cyber security reports that are discussed at each meeting of the Finance Committee. The reports focus on the changing threat landscape and the risks to the Company, describe Eversource’s cyber security drills and exercises, attempted and actual breaches on our systems, cyber incidents within the utility industry and around the world, and mitigation strategies. In addition, third-party experts of cyber security risks provide periodic assessments to the utility industry and the Company in particular to the Finance Committee. The Company regularly reviews and updates its cyber and system security programs, and the Finance Committee continues to enhance its robust oversight activities, including meetings with financial, information technology, legal and accounting management, other members of the Board, representatives of the Company’s independent registered public accounting firm, and outside advisors and experts in cyber security risks, at which cyber and system security programs and issues that might affect the Company’s financial statements and operational systems are discussed.
The Company has a robust Enterprise Risk Management Program which has identified cyber security as a top enterprise risk. The managing and monitoring of risks are the responsibility of the Company’s Risk Committee, which meets quarterly and is chaired by the Chief Financial Officer.
The Company is committed to continuous monitoring and assessment of cyber security controls. The Chief Information Security Officer is responsible for developing, implementing, and enforcing our cyber security program and information security policies to protect the Company’s information systems and operational assets. The Chief Information Security Officer position requires at least 15 years of relevant information security experience and relevant security certifications. The Chief Information Security Officer reports directly to the Chief Information Officer and provides regular updates to the executive management team. Our Chief Information Security Officer has over 20 years of relevant experience.
The Company created a Cyber Governance Committee, which includes the Chief Information Security Officer, Chief Information Technology Officer, Chief Accounting Officer, members of the executive management team, and other assurance functions such as Corporate Compliance, Enterprise Risk Management, and Internal Audit.
To assess, identify and manage material risks from cybersecurity threats and to prevent, detect, mitigate and remediate a cyber security or ransomware incident, the following key processes and programs have been implemented and are performed by the Company’s Cyber Security Group, which is overseen by the Chief Information Security Officer:
•Implementation of security solutions and standards based on industry best practices to prevent unauthorized access. The Company’s cyber program has been modeled after the National Institute of Standards and Technology framework; a widely accepted framework utilized by critical infrastructure industries.
•Periodic external assessments, including outside system access testing, are performed. Rigorous auditing of all safeguards is performed on a regular basis. Risk assessments are held to identify and address new and changing risks to protect systems and sensitive data. Identified areas are monitored and improvements are implemented.
•Eversource participates in information sharing programs both within and outside the utility industry, including with the U.S. government and industry organizations, to be able to identify and respond to emerging threats.
•The Company maintains current incident response and business continuity plans, which are periodically updated and tested.
•Network activity is monitored on an ongoing basis.
•Anti-phishing and malware tools are utilized and assessed.
•Employees are trained to recognize phishing attempts and are periodically tested. Results of phishing testing are benchmarked against other companies both within and outside the utility industry.
Specific to third parties, Eversource has implemented formal screening processes for any applicable vendors by the Company’s Cyber Security Group as part of the Procurement process. The vendors are risk ranked based on the type of work being performed. Periodic rescreening is performed on critical vendors. Vendors are required to attest to their business continuity programs and provide evidence of appropriate insurance and indemnification agreements. The Company bars sourcing from countries included on the Department of Homeland Security’s list of Prohibited Nations to further protect the Company’s supply chain. The Company maintains cyber insurance which covers breaches of networks and operational technology. Our existing insurance limits may be inadequate to cover a material cyber incident. This could expose us to potentially significant claims and damages.
As of December 31, 2023, there were no risks from cybersecurity threats, including due to any previous cybersecurity incidents, that have materially affected or are reasonably likely to materially affect the Company, its business strategy, results of operations, or financial condition.
Item 2. Properties
Transmission and Distribution System
As of December 31, 2022,2023, Eversource and our electric operating subsidiaries owned the following:
| | Electric
Distribution | | Electric
Transmission |
| Electric
Distribution | | | Electric
Distribution | | Electric
Transmission |
| Eversource | Eversource | Electric
Distribution | | Electric
Transmission |
| Number of substations owned | |
| Number of substations owned | |
| Number of substations owned | Number of substations owned | 474 | | | 73 | |
| Transformer capacity (in kVa) | Transformer capacity (in kVa) | 44,614,960 | | | 19,129,000 | |
| Overhead lines (in circuit miles) | Overhead lines (in circuit miles) | 40,502 | | | 3,984 | |
| Underground lines (in circuit miles) | Underground lines (in circuit miles) | 18,085 | | | 423 | |
| Capacity range of overhead transmission lines (in kV) | Capacity range of overhead transmission lines (in kV) | N/A | | 69 to 345 | Capacity range of overhead transmission lines (in kV) | N/A | | 69 to 345 |
| Capacity range of underground transmission lines (in kV) | Capacity range of underground transmission lines (in kV) | N/A | | 69 to 345 | Capacity range of underground transmission lines (in kV) | N/A | | 69 to 345 |
| | | | CL&P | | NSTAR Electric | | PSNH | | CL&P | | NSTAR Electric | | PSNH |
| | | Distribution | | Transmission | | Distribution | | Transmission | | Distribution | | Transmission | | Distribution | | Transmission | | Distribution | | Transmission | | Distribution | | Transmission |
| Number of substations owned | Number of substations owned | 175 | | | 20 | | | 176 | | | 31 | | | 123 | | | 22 | |
| Transformer capacity (in kVa) | Transformer capacity (in kVa) | 21,967,000 | | | 3,184,000 | | | 18,151,360 | | | 11,595,000 | | | 4,496,600 | | | 4,350,000 | |
| Overhead lines (in circuit miles) | Overhead lines (in circuit miles) | 16,717 | | | 1,678 | | | 11,489 | | | 1,252 | | | 12,296 | | | 1,054 | |
| Underground lines (in circuit miles) | Underground lines (in circuit miles) | 6,839 | | | 143 | | | 9,167 | | | 277 | | | 2,079 | | | 3 | |
| Capacity range of overhead transmission lines (in kV) | Capacity range of overhead transmission lines (in kV) | N/A | | 69 to 345 | | N/A | | 69 to 345 | | N/A | | 115 to 345 | Capacity range of overhead transmission lines (in kV) | N/A | | 69 to 345 | | N/A | | 69 to 345 | | N/A | | 115 to 345 |
| Capacity range of underground transmission lines (in kV) | Capacity range of underground transmission lines (in kV) | N/A | | 69 to 345 | | N/A | | 115 to 345 | | N/A | | 115 | |
| | Eversource | | CL&P | | NSTAR Electric | | PSNH |
| Eversource | | | Eversource | | CL&P | | NSTAR Electric | | PSNH |
| Underground and overhead line transformers in service | Underground and overhead line transformers in service | 680,739 | | | 293,512 | | | 217,089 | | | 170,138 | |
| Aggregate capacity (in kVa) | Aggregate capacity (in kVa) | 41,162,476 | | | 16,574,834 | | | 17,389,978 | | | 7,197,664 | |
Electric Generating Plants
As of December 31, 2022,2023, NSTAR Electric owned the following solar power facilities:
| | | | | | | | | | | | | | | | | | | | |
| Type of Plant | | Number
of Sites | | Year
Installed | | Capacity
(kilowatts, dc) |
| Solar Fixed Tilt, Photovoltaic | | 22 | | 2010 - 2019 | | 70,000 |
CL&P and PSNH do not own any electric generating plants.
Natural Gas Distribution System
As of December 31, 2022,2023, NSTAR Gas owned 22 active gate stations, 147 district regulator stations, and approximately 3,3243,330 miles of natural gas main pipeline. Hopkinton, another subsidiary of Eversource, owns a satellite vaporization plant and above ground storage tanks in Acushnet, Massachusetts (0.5 Bcf of natural gas). In addition, Hopkinton owns a liquefaction and vaporization plant with above ground storage tanks in Hopkinton, Massachusetts (3.0 Bcf of natural gas). Combined, the two plants' tanks have an aggregate storage capacity equivalent to 3.5 Bcf of natural gas that is provided to NSTAR Gas under contract.
As of December 31, 2022,2023, EGMA owned 14 active gate stations, 191 district regulator stations, and approximately 5,0115,033 miles of natural gas main pipeline. Hopkinton, another subsidiary of Eversource, owns liquefaction and vaporization plants and above ground storage tanks at four locations throughout Massachusetts with an aggregate storage capacity equivalent to 1.8 Bcf of natural gas. In addition, Hopkinton owns three propane peak shaving plants at three locations throughout Massachusetts with an aggregate storage capacity equivalent to 0.1 Bcf. Combined, these seven plants have an aggregate storage capacity equivalent to 1.9 Bcf of natural gas that is provided to EGMA under contract.
As of December 31, 2022,2023, Yankee Gas owned 28 active gate stations, 200 district regulator stations, and approximately 3,5193,540 miles of natural gas main pipeline. Yankee Gas also owns a liquefaction and vaporization plant and above ground storage tank with a storage capacity equivalent of 1.2 Bcf of natural gas in Waterbury, Connecticut.
Natural Gas Transmission System
As of December 31, 2022,2023, NSTAR Gas and EGMA owned 1.0 and 0.50.65 miles of intrastate transmission natural gas pipeline. NSTAR Gas reclassified 0.35 miles of transmission pipeline respectively.from 49 CFR 192 Pipeline regulated to 49 CFR 193 LNG regulated at the Hopkinton LNG facility. As of December 31, 2023, EGMA did not own any miles of intrastate transmission natural gas pipeline. EGMA replaced its last remaining 0.5 miles of transmission pipeline. The replacement pipeline was designed and engineered to be Distribution class.
Water Distribution System
Aquarion’s properties consist of water transmission and distribution mains and associated valves, hydrants and service lines, water treatment plants, pumping facilities, wells, tanks, meters, dams, reservoirs, buildings, and other facilities and equipment used for the operation of our systems, including the collection, treatment, storage, and distribution of water.
As of December 31, 2022,2023, Aquarion owned and operated sources of water supply with a combined yield of approximately 133135 million gallons per day; 3,7463,802 miles of transmission and distribution mains; 10 surface water treatment plants; 36 dams; and 116119 wellfields.
Franchises
CL&P Subject to the power of alteration, amendment or repeal by the General Assembly of Connecticut and subject to certain approvals, permits and consents of public authority and others prescribed by statute, CL&P has, subject to certain exceptions not deemed material, valid franchises free from burdensome restrictions to provide electric transmission and distribution services in the respective areas in which it is now supplying such service.
In addition to the right to provide electric transmission and distribution services as set forth above, the franchises of CL&P include, among others, limited rights and powers, as set forth under Connecticut law and the special acts of the General Assembly constituting its charter, to manufacture, generate, purchase and/or sell electricity at retail, including to provide Standard Service, Supplier of Last Resort service and backup service, to sell electricity at wholesale and to erect and maintain certain facilities on public highways and grounds, all subject to such consents and approvals of public authority and others as may be required by law. The franchises of CL&P include the power of eminent domain. Connecticut law prohibits an electric distribution company from owning or operating generation assets. However, under "An Act Concerning Electricity and Energy Efficiency," enacted in 2007, an electric distribution company, such as CL&P, is permitted to purchase an existing electric generating plant located in Connecticut that is offered for sale, subject to prior approval from PURA and a determination by PURA that such purchase is in the public interest.
NSTAR Electric Through its charter, which is unlimited in time, NSTAR Electric has the right to engage in the business of delivering and selling electricity within its respective service territory, and has the power incidental thereto and is entitled to all the rights and privileges of and subject to the duties imposed upon electric companies under Massachusetts laws. The locations in public ways for electric transmission and distribution lines are obtained from municipal and other state authorities who, in granting these locations, act as agents for the state. In some cases, the actions of these authorities are subject to appeal to the DPU. The rights to these locations are not limited in time and are subject to the action of these authorities and the legislature. Under Massachusetts law, no other entity may provide electric delivery service to retail customers within NSTAR Electric service territory without the written consent of NSTAR Electric. This consent must be filed with the DPU and the municipality so affected. The franchises of NSTAR Electric include the power of eminent domain, obtained through application to the DPU.
Massachusetts restructuring legislation defines service territories as those territories actually served on July 1, 1997 and following municipal boundaries to the extent possible. The restructuring legislation further provides that until terminated by law or otherwise, distribution companies shall have the exclusive obligation to serve all retail customers within their service territories and no other person shall provide distribution service within such service territories without the written consent of such distribution companies.
PSNH The NHPUC, pursuant to statutory requirements, has issued orders granting PSNH exclusive franchises to distribute electricity in the respective areas in which it is now supplying such service.
In addition to the right to distribute electricity as set forth above, the franchises of PSNH include, among others, rights and powers to manufacture, generate, purchase, and transmit electricity, to sell electricity at wholesale to other utility companies and municipalities and to erect and maintain certain facilities on certain public highways and grounds, all subject to such consents and approvals of public authority and others as may be required by law. PSNH's status as a public utility gives it the ability to petition the NHPUC for the right to exercise eminent domain for distribution services and for transmission eligible for regional cost allocation.
PSNH is also subject to certain regulatory oversight by the Maine Public Utilities Commission and the Vermont Public Utility Commission.
NSTAR Gas Through its charter, which is unlimited in time, NSTAR Gas has the right to engage in the business of delivering and selling natural gas within its respective service territory, and has the power incidental thereto and is entitled to all the rights and privileges of and subject to the duties imposed upon natural gas companies under Massachusetts laws. The locations in public ways for natural gas distribution pipelines are obtained from municipal and other state authorities who, in granting these locations, act as agents for the state. In some cases, the actions of these authorities are subject to appeal to the DPU. The rights to these locations are not limited in time and are subject to the action of these authorities and the legislature. Under Massachusetts law, no other entity may provide natural gas delivery service to retail customers within the NSTAR Gas service territory without the written consent of NSTAR Gas. This consent must be filed with the DPU and the municipality so affected.
Eversource Gas Company of MassachusettsEGMA Eversource Gas CompanyThrough its charter, which is unlimited in time, EGMA has the right to engage in the business of Massachusetts holds valid franchises to selldelivering and selling natural gas inwithin its respective service territory, and has the areas in which it suppliespower incidental thereto and is entitled to all the rights and privileges of and subject to the duties imposed upon natural gas service. Generally, Eversource Gas Companycompanies under Massachusetts laws. The locations in public ways for natural gas distribution pipelines are obtained from municipal and other state authorities who, in granting these locations, act as agents for the state. In some cases, the actions of Massachusetts holds franchisesthese authorities are subject to serve customers in areas designated by those franchises as well as in most other areas throughout Massachusetts so long as those areasappeal to the DPU. The rights to these locations are not occupiedlimited in time and served by anotherare subject to the action of these authorities and the legislature. Under Massachusetts law, no other entity may provide natural gas utility under a valid franchisedelivery service to retail customers within the EGMA service territory without the written consent of its own or are not subject to an exclusive franchise of another natural gas utility or by consent.EGMA. This consent must be filed with the DPU and the municipality so affected.
Yankee Gas Yankee Gas holds valid franchises to sell natural gas in the areas in which Yankee Gas supplies natural gas service. Generally, Yankee Gas holds franchises to serve customers in areas designated by those franchises as well as in most other areas throughout Connecticut so long as those areas are not occupied and served by another natural gas utility under a valid franchise of its own or are not subject to an exclusive franchise of another natural gas utility or by consent. Yankee Gas' franchises are perpetual but remain subject to the power of alteration, amendment or repeal by the General Assembly of the State of Connecticut, the power of revocation by PURA and certain approvals, permits and consents of public authorities and others prescribed by statute. Generally, Yankee Gas' franchises include, among other rights and powers, the right and power to manufacture, generate, purchase, transmit and distribute natural gas and to erect and maintain certain facilities on public highways and grounds, and the right of eminent domain, all subject to such consents and approvals of public authorities and others as may be required by law.
Aquarion Water Company of Connecticut and The Torrington Water Company AWC-CT and The Torrington Water Company derive their rights and franchises to operate from special acts of the Connecticut General Assembly and subject to certain approvals, permits and consents of public authority and others prescribed by statute and by its charter, they have, with minor exceptions, solid franchises free from burdensome restrictions and unlimited as to time, and are authorized to sell potable water in the towns (or parts thereof) in which water is now being supplied by AWC-CT and The Torrington Water Company.
In addition to the right to sell water as set forth above, the franchises of AWC-CT and The Torrington Water Company include rights and powers to erect and maintain certain facilities on public highways and grounds, all subject to such consents and approvals of public authority and others as may be required by law. Under the Connecticut General Statutes, AWC-CT and The Torrington Water Company may, upon payment of compensation, take and use such lands, springs, streams or ponds, or such rights or interests therein as the Connecticut Superior Court, upon application, may determine is necessary to enable AWC-CT and The Torrington Water Company to supply potable water for public or domestic use in its franchise areas.
Aquarion Water Company of Massachusetts Through its charters, which are unlimited in time, AWC-MA has the right to engage in the business of distributing and selling water within its service territories, and has the power incidental thereto and is entitled to all the rights and privileges of and subject to the duties imposed upon water companies under Massachusetts laws. AWC-MA has the right to construct and maintain its mains and distribution pipes in and under any public ways and to take and hold water within its respective service territories. Subject to DPU regulation, AWC-MA has the right to establish and fix rates for use of the water distributed and to establish reasonable regulations regarding the same. Certain of the towns within our service area have the right, at any time, to purchase the corporate property and all rights and privileges of AWC-MA according to pricing formulas and procedures specifically described in AWC-MA's respective charters and in compliance with Massachusetts law.
Aquarion Water Company of New Hampshire and Abenaki Water Company The NHPUC, pursuant to statutory law, has issued orders granting and affirming AWC-NH’s and Abenaki’sAbenaki Water Company’s exclusive franchises to own, operate, and manage plant and equipment and any part of the same, for the conveyance of water for the public located within its franchise territory. AWC-NH’s franchise territory encompasses the towns of Hampton, North Hampton, Rye and a limited portion of Stratham. Abenaki’sAbenaki Water Company’s franchises extend to the boundaries of the water systems in the towns of Belmont, Bow, Carroll, and Gilford. Subject to NHPUC’s regulations, AWC-NH and Abenaki have the right to establish and fix rates for use of the water distributed and to establish reasonable regulations regarding the same.
In addition to the right to provide water supply, the franchise also allows AWC-NH and Abenaki to sell water at wholesale to other water utilities and municipalities and to construct plant and equipment and maintain such plant and equipment on certain public highways and grounds, all subject to such consents and approvals of public authority and others as may be required by law.
AWC-NH's and Abenaki’s status as regulated public utilities gives them the ability to petition the NHPUC for the right to exercise eminent domain for the establishment of plant and equipment. They can also petition the NHPUC for exemption from the operation of any local ordinance when certain utility structures are reasonably necessary for the convenience or welfare of the public and the local conditions, and, if the purpose of the structure relates to water supply withdrawal, the exemption is recommended by the New Hampshire Department of Environmental Services.
Item 3. Legal Proceedings
We are involved in legal, tax and regulatory proceedings regarding matters arising in the ordinary course of business. For information regarding material lawsuits and proceedings, see Note 13, “Commitments and Contingencies,” of the Combined Notes to Financial Statements.
In addition, see Item 1, Business: "– Electric Distribution Segment," "– Electric Transmission Segment," "– Natural Gas Distribution Segment," and "– Water Distribution Segment" for information about various state and federal regulatory and rate proceedings, civil lawsuits related thereto, and information about proceedings relating to power, transmission and pricing issues; "– Nuclear Fuel Storage" for information related to nuclear waste; and "– Other Regulatory and Environmental Matters" for information about toxic substances and hazardous materials, climate change, and other matters. In addition, see Item 1A, Risk Factors, for general information about several significant risks.
Item 4. Mine Safety Disclosures
Not applicable.
INFORMATION ABOUT OUR EXECUTIVE OFFICERS
The following sets forth the executive officers of Eversource Energy as of February 15, 2023.14, 2024. All of Eversource Energy’s officers serve terms of one year and until their successors are elected and qualified.
| | | | | | | | | | | | | | |
| Name | | Age | | Title |
| | | | |
| Joseph R. Nolan, Jr. | | 5960 | | Chairman of the Board, President, Chief Executive Officer and a Trustee |
| John M. Moreira | | 6162 | | Executive Vice President, Chief Financial Officer and Treasurer |
| | | | |
| Gregory B. Butler | | 6566 | | Executive Vice President and General Counsel |
Christine M. CarmodyPaul Chodak III | | 60 | | Executive Vice President-Human ResourcesPresident and Information TechnologyChief Operating Officer |
| Penelope M. Conner | | 5960 | | Executive Vice President-Customer Experience and Energy Strategy |
| James W. Hunt, III | | 5152 | | Executive Vice President-Corporate Relations and Sustainability and Secretary |
Werner J. SchweigerSusan Sgroi | | 6359 | | Executive Vice PresidentPresident-Human Resources and Chief Operating OfficerInformation Technology |
| Jay S. Buth | | 5354 | | Vice President, Controller and Chief Accounting Officer |
Joseph R. Nolan, Jr. Mr. Nolan has served as Chairman of the Board of Eversource Energy since January 1, 2023, and has served as President and Chief Executive Officer and a Trustee of Eversource Energy since 2021. Previously, Mr. Nolan served as Executive Vice President-Strategy, Customer and Corporate Relations of Eversource Energy from February 5, 2020 until May 5, 2021, and as Executive Vice President-Customer and Corporate Relations of Eversource Energy from August 8, 2016 to February 5, 2020. Based on his experience as described, Mr. Nolan has the skills and qualifications necessary to serve as a Trustee of Eversource Energy.
John M. Moreira. Mr. Moreira has served as Executive Vice President, Chief Financial Officer and Treasurer of Eversource Energy since May 4, 2022. He previously served as Senior Vice President-Financial and Regulatory and Treasurer of Eversource Energy from September 12, 2018 until May 4, 2022.
Gregory B. Butler. Mr. Butler has served as General Counsel of Eversource Energy since May 1, 2001. He has served as Executive Vice President of Eversource Energy since August 8, 2016.
Christine M. Carmody.Paul Chodak III. Ms. CarmodyMr. Chodak has served as Executive Vice President-Human ResourcesPresident and Information TechnologyChief Operating Officer of Eversource Energy since August 8, 2016.November 13, 2023. Previously, Mr. Chodak served as Executive Vice President – Generation of American Electric Power Company, Inc. (“AEP”) from January 1, 2019 until September 15, 2023, and as Executive Vice President – Utilities of AEP from January 1, 2017 until December 31, 2018.
Penelope M. Conner. Ms. Conner has served as Executive Vice President-Customer Experience and Energy Strategy of Eversource Energy since May 5, 2021. Previously, Ms. Conner served as Senior Vice President and Chief Customer Officer of Eversource Service from March 2, 2013 until May 5, 2021.
James W. Hunt, III. Mr. Hunt has served as Executive Vice President-Corporate Relations and Sustainability of Eversource Energy since May 5, 2021 and as Secretary of Eversource Energy since July 9, 2021. Previously Mr. Hunt served as Senior Vice President-Communications, External Affairs and Sustainability of Eversource Service from December 17, 2019 until May 5, 2021 and as Senior Vice President-Regulatory Affairs and Chief Communications Officer of Eversource Service from October 3, 2016 until December 17, 2019.
Werner J. Schweiger.Susan Sgroi. Mr. SchweigerMs. Sgroi has served as Executive Vice President-Human Resources and Information Technology of Eversource Energy since January 8, 2024. Previously, Ms. Sgroi served as Executive Vice President and Chief OperatingHuman Resources Officer of Eversource Energy since September 2, 2014.Blue Cross and Blue Shield of Massachusetts from 2015 until October 31, 2023.
Jay S. Buth. Mr. Buth has served as Vice President, Controller and Chief Accounting Officer of Eversource Energy since April 10, 2012.
PART II
Item 5. Market for the Registrants' Common Equity, Related Stockholder Matters and Issuer Purchases of Equity Securities
(a) Market Information
Our common shares are listed on the New York Stock Exchange. The ticker symbol is "ES." There is no established public trading market for the common stock of CL&P, NSTAR Electric and PSNH. All of the common stock of CL&P, NSTAR Electric and PSNH is held solely by Eversource.
(b) Holders
As of January 31, 2023,2024, there were 30,11529,025 registered common shareholders of our company on record. As of the same date, there were a total of 348,483,425349,687,183 shares outstanding.
(c) Dividends
Information with respect to dividends and dividend restrictions for Eversource, CL&P, NSTAR Electric and PSNH is contained in Item 8, Financial Statements and Supplementary Data, in the Combined Notes to Financial Statements, within this Annual Report on Form 10-K.
(d) Securities Authorized for Issuance Under Equity Compensation Plans
For information regarding securities authorized for issuance under equity compensation plans, see Item 12, Security Ownership of Certain Beneficial Owners and Management and Related Stockholder Matters, included in this Annual Report on Form 10-K.
(e) Performance Graph
The performance graph below illustrates a five-year comparison of cumulative total returns based on an initial investment of $100 in 20172018 in Eversource Energy common stock, as compared with the S&P 500 Stock Index and the EEI Index for the period 20172018 through 2022,2023, assuming all dividends are reinvested.

| | | | | | | | | | | | | | | | | | | | |
| December 31, |
| 2018 | 2019 | 2020 | 2021 | 2022 | 2023 |
| Eversource Energy | $100 | $134 | $140 | $152 | $144 | $111 |
| EEI Index | $100 | $126 | $124 | $146 | $147 | $134 |
| S&P 500 | $100 | $131 | $156 | $200 | $164 | $207 |
| | | | | | | | | | | | | | | | | | | | |
| December 31, |
| 2017 | 2018 | 2019 | 2020 | 2021 | 2022 |
| Eversource Energy | $100 | $106 | $143 | $149 | $162 | $154 |
| EEI Index | $100 | $104 | $130 | $129 | $151 | $153 |
| S&P 500 | $100 | $96 | $126 | $149 | $192 | $157 |
Purchases of Equity Securities by the Issuer and Affiliated Purchasers
The following table discloses purchases of our common shares made by us or on our behalf for the periods shown below. The common shares purchased consist of open market purchases made by the Company or an independent agent. These share transactions related to matching contributions under the Eversource 401k Plan.
| | | | | | | | | | | | | | | | | | | | | | | |
| Period | Total Number of Shares Purchased | | Average Price Paid per Share | | Total Number of Shares Purchased as
Part of Publicly Announced Plans or Programs | | Approximate Dollar
Value of Shares that
May Yet Be Purchased Under the Plans and Programs (at month end) |
| October 1 - October 31, 2022 | — | | | $ | — | | | — | | | — | |
| November 1 - November 30, 2022 | — | | | — | | | — | | | — | |
| December 1 - December 31, 2022 | 2,214 | | | 84.21 | | | — | | | — | |
| Total | 2,214 | | | $ | 84.21 | | | — | | | — | |
| | | | | | | | | | | | | | | | | | | | | | | |
| Period | Total Number of Shares Purchased | | Average Price Paid per Share | | Total Number of Shares Purchased as
Part of Publicly Announced Plans or Programs | | Approximate Dollar
Value of Shares that
May Yet Be Purchased Under the Plans and Programs (at month end) |
| October 1 - October 31, 2023 | — | | | $ | — | | | — | | | — | |
| November 1 - November 30, 2023 | — | | | — | | | — | | | — | |
| December 1 - December 31, 2023 | 2,941 | | | 61.80 | | | — | | | — | |
| Total | 2,941 | | | $ | 61.80 | | | — | | | — | |
Item 6. Removed and Reserved
Item 7. Management's Discussion and Analysis of Financial Condition and Results of Operations
EVERSOURCE ENERGY AND SUBSIDIARIES
The following discussion and analysis should be read in conjunction with our consolidated financial statements and related combined notes included in this combined Annual Report on Form 10-K. References in this combined Annual Report on Form 10-K to "Eversource," the "Company," "we," "us," and "our" refer to Eversource Energy and its consolidated subsidiaries. All per-share amounts are reported on a diluted basis. The consolidated financial statements of Eversource, NSTAR Electric and PSNH and the financial statements of CL&P are herein collectively referred to as the "financial statements." Our discussion of fiscal year 20222023 compared to fiscal year 20212022 is included herein. Unless expressly stated otherwise, for discussion and analysis of fiscal year 20202021 items and of fiscal year 20212022 compared to fiscal year 2020,2021, please refer to Item 7, Management's Discussion and Analysis of Financial Condition and Results of Operations, in our combined 20212022 Annual Report on Form 10-K, which is incorporated herein by reference.
Refer to the Glossary of Terms included in this combined Annual Report on Form 10-K for abbreviations and acronyms used throughout this Management's Discussion and Analysis of Financial Condition and Results of Operations.
The only common equity securities that are publicly traded are common shares of Eversource. TheOur earnings and EPS of each business do not represent a direct legal interest in the assets and liabilities of such business, but rather represent a direct interest in our assets and liabilities as a whole. EPS by business is adiscussion includes financial measuremeasures that isare not recognized under GAAP (non-GAAP) and is calculated by dividing the Net Income Attributable to Common Shareholders of each business by the weighted average diluted Eversource common shares outstanding for the period. Our earnings discussion also includes non-GAAP financial measures referencing our earnings and EPS excluding the impairment charges for the offshore wind investments, a loss on the disposition of land that was initially acquired to construct the Northern Pass Transmission project and was subsequently abandoned, certain transaction and transition costs, and our 2021 earnings and EPS excluding charges at CL&P related to an October 2021 settlement agreement that included credits to customers and funding of various customer assistance initiatives and a 2021 storm performance penalty imposed on CL&P by PURA. EPS by business is also a non-GAAP financial measure and is calculated by dividing the Net Income Attributable to Common Shareholders of each business by the weighted average diluted Eversource common shares outstanding for the period. The earnings and EPS of each business do not represent a direct legal interest in the assets and liabilities of such business, but rather represent a direct interest in our assets and liabilities as a whole.
We use these non-GAAP financial measures to evaluate and provide details of earnings results by business and to more fully compare and explain our results without including these items. This information is among the primary indicators we use as a basis for evaluating performance and planning and forecasting of future periods. We believe the impacts of the impairment charges for the offshore wind investments, the loss on the disposition of land associated with an abandoned project, transaction and transition costs, and the CL&P October 2021 settlement agreement, and the 2021 storm performance penalty imposed on CL&P by PURA are not indicative of our ongoing costs and performance. We view these charges as not directly related to the ongoing operations of the business and therefore not an indicator of baseline operating performance. Due to the nature and significance of the effect of these items on Net Income Attributable to Common Shareholders and EPS, we believe that the non-GAAP presentation is a more meaningful representation of our financial performance and provides additional and useful information to readers of this report in analyzing historical and future performance of our business. These non-GAAP financial measures should not be considered as alternatives to reported Net Income Attributable to Common Shareholders or EPS determined in accordance with GAAP as indicators of operating performance.
Financial Condition and Business Analysis
Executive Summary
Eversource Energy is a public utility holding company primarily engaged, through its wholly-owned regulated utility subsidiaries, in the energy delivery business. Eversource Energy's wholly-owned regulated utility subsidiaries consist of CL&P, NSTAR Electric and PSNH (electric utilities), Yankee Gas, NSTAR Gas and EGMA (natural gas utilities) and Aquarion (water utilities). Eversource is organized into the electric distribution, electric transmission, natural gas distribution, and water distribution reportable segments.
The following items in this executive summary are explained in more detail in this combined Annual Report on Form 10-K:
Earnings Overview and Future Outlook:
•We earnedhad a loss of $442.2 million, or $1.26 per share, in 2023, compared with earnings of $1.40 billion, or $4.05 per share, in 2022, compared with $1.222022. Our 2023 results include after-tax impairment charges of $1.95 billion, or $3.54$5.58 per share, in 2021.
•recorded at Eversource parent to reflect our current estimate of the fair value of the offshore wind projects. Our 2023 results also include after-tax land abandonment and other charges recorded at Eversource parent of $6.9 million, or $0.02 per share. Our 2022 results include after-tax transaction and transition costs recorded at Eversource parent of $15.0 million, or $0.04 per share, in 2022, compared with $23.6 million,share. Excluding the offshore wind impairments and these other charges, our non-GAAP earnings were $1.52 billion, or $0.07$4.34 per share, in 2021. Our 2021 results also include after-tax charges of $86.1 million, or $0.25 per share, resulting from a PURA-approved CL&P settlement agreement and a PURA assessment as a result of CL&P’s preparation for, and response to, Tropical Storm Isaias in August 2020, which were recorded within the electric distribution segment. Excluding these costs, our non-GAAP earnings were2023, compared with $1.42 billion, or $4.09 per share, in 2022, compared with $1.33 billion, or $3.86 per share, in 2021.2022.
•We project that we will earn within a 20232024 non-GAAP earning guidance range of between $4.25$4.50 per share and $4.43$4.67 per share, which excludes the potential impact of the strategic reviewexpected sales of our 50 percent interests in three jointly-owned offshore wind investment portfolio.projects and related transaction costs. We also project that our long-term EPS growth rate through 20272028 from our regulated utility businesses will be in the upper half of a 5 to 7 percent range.
Liquidity:
•Cash flows provided by operating activities totaled $1.65 billion in 2023, compared with $2.40 billion in 2022, compared with $1.96 billion in 2021.2022. Investments in property, plant and equipment totaled $4.34 billion in 2023 and $3.44 billion in 2022 and $3.18 billion in 2021.2022.
•Cash and Cash Equivalents totaled $53.9 million as of December 31, 2023, compared with $374.6 million as of December 31, 2022, compared with $66.8 million as of December 31, 2021.2022. Our available borrowing capacity under our commercial paper programs totaled $1.21 billion$512.3 million as of December 31, 2022.2023.
•In 2022,2023, we issued $4.05$5.20 billion of new long-term debt and we repaid $1.18$2.01 billion of long-term debt.
•In 2022, we issued 2,165,671 common shares, which resulted in proceeds of $197.1 million, net of issuance costs.
•In 2022,2023, we paid dividends totaling $2.55$2.70 per common share, compared with dividends of $2.41$2.55 per common share in 2021.2022. Our quarterly common share dividend payment was $0.675 per share in 2023, as compared to $0.6375 per share in 2022, as compared to $0.6025 per share in 2021.2022. On February 1, 2023,January 31, 2024, our Board of Trustees approved a common share dividend payment of $0.675$0.715 per share, payable on March 31, 202329, 2024 to shareholders of record as of March 2, 2023.5, 2024.
•We project to make capital expenditures of $21.52$23.12 billion from 20232024 through 2027,2028, of which we expect $8.86$9.71 billion to be in our electric distribution segment, $5.25$5.44 billion to be in our natural gas distribution segment, $5.29$5.77 billion to be in our electric transmission segment, and $1.02$1.08 billion to be in our water distribution segment. We also project to invest $1.10$1.12 billion in information technology and facilities upgrades and enhancements. Additionally,
•On February 13, 2024, we currently expect to make investments ininitiated an exploratory assessment of monetizing our offshore windwater distribution business between $1.9 billion and $2.1 billion in 2023 and expect to make investments for our three projects in total between $1.6 billion and $1.9 billion from 2024 through 2026. These estimates assume that the three projects are completed and are in-service byexploring the endpotential sale of 2025, as planned. These projected investments could be impacted by the strategic review of our offshore wind investment.business.
Strategic and Regulatory Transactions and Developments:
•On May 4, 2022, weFebruary 13, 2024, Eversource announced that we had initiated a strategic review of our offshore wind investment portfolio.it has executed an agreement to sell its existing 50 percent interests in the South Fork Wind and Revolution Wind projects to Global Infrastructure Partners (GIP). As part of this transaction, Eversource expects to receive approximately $1.1 billion of cash proceeds upon closing, which includes the sales value related to the 10 percent energy community ITC adder of approximately $170 million related to Revolution Wind, and to exit these projects while retaining certain cost sharing obligations for the construction of Revolution Wind. The purchase price is subject to future post-closing adjustment payments based on, among other things, the progress, timing and expense of construction at each project. The cost sharing obligations provide that review, we are exploring strategic alternatives that couldEversource would share equally with GIP in GIP’s funding obligations for up to approximately $240 million of incremental capital expenditure overruns incurred during the construction phase for the Revolution Wind project, after which GIP’s obligations for any additional capital expenditure overruns would be shared equally by Eversource and Ørsted. Additionally, Eversource’s financial exposure will be adjusted by certain purchase price adjustments to be made following commercial operation of the Revolution Wind project and closing of South Fork as a result in a potential sale of all, or part,final project economics, which includes Eversource’s obligation to maintain GIP’s internal rate of our 50 percent interest in our offshore wind partnership with Ørsted. We continue to work with interested parties through this ongoing process and expect to complete this reviewreturn for each project as specified in the second quarteragreement. Eversource currently expects that South Fork Wind will reach full commercial operation prior to closing of 2023.the sale with GIP and Eversource does not expect any material cost sharing or other purchase price adjustment payments for South Fork Wind. Closing of the transaction is currently expected to occur in mid-2024.
•On November 30, 2022,January 24, 2024, Ørsted signed an agreement with Eversource to acquire Eversource’s 50 percent share of Sunrise Wind. The sale is subject to the DPU issued its decisionsuccessful selection of Sunrise Wind in the NSTAR Electric distribution rate caseongoing New York fourth solicitation for offshore wind capacity, signing of an OREC contract with NYSERDA, finalization of sale agreements, receipt of final federal construction permits, and approved a base distribution rate increase of $64 million effective January 1, 2023. The DPU approved a renewal ofrelevant regulatory approvals. If Sunrise Wind is not successful in the performance-based ratemaking (PBR) plan originally authorized in its previous rate casesolicitation, then the existing OREC contract for a five-year term, with a corresponding stay out provision. The PBR plan term has the possibility of a five-year extension. The PBR mechanism allows for an annual adjustment to base distribution rates for inflation and exogenous events. The DPU also allowed for adjustmentsSunrise Wind will be cancelled according to the PBR mechanismstate’s requirements, and Eversource and Ørsted’s joint venture for Sunrise Wind will remain in place. In that scenario, Ørsted and Eversource would then assess their options in determining the recovery of future capital additions based on a historical five-year average of total capital additions, beginning withbest path forward for Sunrise Wind and its assets, which include the January 1, 2024 PBR adjustment. The decision allows an authorized regulatory ROE of 9.80 percent on a capital structure including 53.2 percent equity.BOEM offshore lease area.
•On January 25, 2024, Eversource and Ørsted submitted a new proposal for Sunrise Wind in the New York fourth offshore wind solicitation.
•Four of South Fork Wind’s twelve turbines were installed and placed into service by January 1, 2024, meeting the project commercial operation date requirements under the power purchase agreement with LIPA. All wind turbines are expected to be installed and placed into service by the end of March 2024.
Earnings Overview
Consolidated: Below is a summary of our earningsearnings/(loss) by business, which also reconciles the non-GAAP financial measures of consolidated non-GAAP earnings and EPS, as well as EPS by business, to the most directly comparable GAAP measures of consolidated Net (Loss)/Income Attributable to Common Shareholders and diluted EPS.
| | | | For the Years Ended December 31, | | For the Years Ended December 31, |
| 2023 | | | 2023 | | 2022 | | 2021 |
| (Millions of Dollars, Except Per Share Amounts) | | (Millions of Dollars, Except Per Share Amounts) | Amount | | Per Share | | Amount | | Per Share | | Amount | | Per Share |
| Net (Loss)/Income Attributable to Common Shareholders (GAAP) | |
| | 2022 | | 2021 | | 2020 |
| (Millions of Dollars, Except Per Share Amounts) | Amount | | Per Share | | Amount | | Per Share | | Amount | | Per Share |
| Net Income Attributable to Common Shareholders (GAAP) | $ | 1,404.9 | | | $ | 4.05 | | | $ | 1,220.5 | | | $ | 3.54 | | | $ | 1,205.2 | | | $ | 3.55 | |
| | Regulated Companies (Non-GAAP) | |
| Regulated Companies (Non-GAAP) | |
| Regulated Companies (Non-GAAP) | Regulated Companies (Non-GAAP) | $ | 1,460.4 | | | $ | 4.21 | | | $ | 1,342.4 | | | $ | 3.89 | | | $ | 1,223.3 | | | $ | 3.60 | |
| Eversource Parent and Other Companies (Non-GAAP) | Eversource Parent and Other Companies (Non-GAAP) | (40.5) | | | (0.12) | | | (12.2) | | | (0.03) | | | 14.0 | | | 0.04 | |
| Non-GAAP Earnings | Non-GAAP Earnings | $ | 1,419.9 | | | $ | 4.09 | | | $ | 1,330.2 | | | $ | 3.86 | | | $ | 1,237.3 | | | $ | 3.64 | |
CL&P Settlement Impacts (after-tax) (1) | — | | | — | | | (86.1) | | | (0.25) | | | — | | | — | |
Transaction and Transition Costs (after-tax) (2) | (15.0) | | | (0.04) | | | (23.6) | | | (0.07) | | | (32.1) | | | (0.09) | |
| Net Income Attributable to Common Shareholders (GAAP) | $ | 1,404.9 | | | $ | 4.05 | | | $ | 1,220.5 | | | $ | 3.54 | | | $ | 1,205.2 | | | $ | 3.55 | |
Impairments of Offshore Wind Investments (after-tax) (1) | |
Land Abandonment Loss and Other Charges (after-tax) (2) | |
Transaction and Transition Costs (after-tax) (3) | |
CL&P Settlement Impacts (after-tax) (4) | |
| Net (Loss)/Income Attributable to Common Shareholders (GAAP) | |
(1) The 2021 after-tax costs are associated withWe recorded impairment charges resulting from the October 1, 2021 CL&P settlement agreement approved by PURA on October 27, 2021, which included a pre-tax $65 million chargeexpected sales of our offshore wind investments and to earnings for customer credits provided to customers over a two-month billing period from December 1, 2021 to January 31, 2022 and a $10 million pre-tax charge to earnings to establish a fund that provided bill payment assistance to certain existing non-hardship and hardship customers carrying arrearages. The 2021 after-tax costs also include a charge recorded at CL&P as a result of PURA’s April 28, 2021 and July 14, 2021 decisions, which included a pre-tax $28.4 million penalty for storm performance results provided as credits to customer bills over a one-year period that began September 1, 2021 and a pre-tax $0.2 million fine to the State of Connecticut’s general fund. As a resultreflect our current estimate of the October 1, 2021 settlement agreement, CL&P agreed to withdraw its pending appeals related to
the storm performance penalty imposed in PURA’s April 28, 2021 and July 14, 2021 decisions. Management views these collective charges as not directly related to the ongoing operationsfair value of the businessoffshore wind projects. For further information, see "Business Development and therefore not an indicatorCapital Expenditures – Offshore Wind Business" included in this Management's Discussion and Analysis of baseline operating performance.Financial Condition and Results of Operations.
(2) The after-tax2023 charges primarily include a loss on the disposition of land. The land was initially acquired to construct the Northern Pass Transmission project and was subsequently abandoned.
(3) Transaction costs are forin 2022 and 2021 primarily include costs associated with the transition of systems as a result of our purchase of the assets of Columbia Gas of Massachusetts (CMA) on October 9, 2020 and integrating the CMA assets onto Eversource’s systems.
(4) The 2021 after-tax costs also include costsare associated with our water business acquisitionsthe October 1, 2021 CL&P settlement agreement approved by PURA that included credits to customers and the strategic reviewfunding of our offshore wind investment portfolio. We expect transaction costs in 2023 asvarious customer assistance initiatives and a result of the wind strategic review.2021 storm performance penalty imposed on CL&P by PURA.
Regulated Companies: Our regulated companies comprise the electric distribution, electric transmission, natural gas distribution and water distribution segments. A summary of our segment earnings and EPS is as follows:
| | | | For the Years Ended December 31, | | For the Years Ended December 31, |
| | | 2022 | | 2021 | | 2020 | | 2023 | | 2022 | | 2021 |
| (Millions of Dollars, Except Per Share Amounts) | (Millions of Dollars, Except Per Share Amounts) | Amount | | Per Share | | Amount | | Per Share | | Amount | | Per Share | (Millions of Dollars, Except Per Share Amounts) | Amount | | Per Share | | Amount | | Per Share | | Amount | | Per Share |
| Net Income - Regulated Companies (GAAP) | Net Income - Regulated Companies (GAAP) | $ | 1,460.4 | | | $ | 4.21 | | | $ | 1,256.3 | | | $ | 3.64 | | | $ | 1,221.8 | | | $ | 3.60 | |
| Electric Distribution, excluding CL&P Settlement Impacts
(Non-GAAP) | Electric Distribution, excluding CL&P Settlement Impacts
(Non-GAAP) | $ | 592.8 | | | $ | 1.71 | | | $ | 556.2 | | | $ | 1.61 | | | $ | 544.0 | | | $ | 1.60 | |
Electric Distribution, excluding CL&P Settlement Impacts
(Non-GAAP) | |
Electric Distribution, excluding CL&P Settlement Impacts
(Non-GAAP) | |
| Electric Transmission | Electric Transmission | 596.6 | | | 1.72 | | | 544.6 | | | 1.58 | | | 502.5 | | | 1.48 | |
Natural Gas Distribution, excluding Transaction-Related Costs
(Non-GAAP) | 234.2 | | | 0.67 | | | 204.8 | | | 0.59 | | | 135.6 | | | 0.40 | |
| Natural Gas Distribution | |
| Water Distribution | Water Distribution | 36.8 | | | 0.11 | | | 36.8 | | | 0.11 | | | 41.2 | | | 0.12 | |
| Net Income - Regulated Companies (Non-GAAP) | Net Income - Regulated Companies (Non-GAAP) | $ | 1,460.4 | | | $ | 4.21 | | | $ | 1,342.4 | | | $ | 3.89 | | | $ | 1,223.3 | | | $ | 3.60 | |
| CL&P Settlement Impacts (after-tax) | CL&P Settlement Impacts (after-tax) | — | | | — | | | (86.1) | | | (0.25) | | | — | | | — | |
| Transaction and Transition Costs (after-tax) | — | | | — | | | — | | | — | | | (1.5) | | | — | |
| Net Income - Regulated Companies (GAAP) | Net Income - Regulated Companies (GAAP) | $ | 1,460.4 | | | $ | 4.21 | | | $ | 1,256.3 | | | $ | 3.64 | | | $ | 1,221.8 | | | $ | 3.60 | |
Our electric distribution segment earnings increased $122.7$15.2 million in 2022,2023, as compared to 2021, due primarily to the absence in 2022, of CL&P’s October 1, 2021 settlement agreement that resulted in a $75 million pre-tax charge to earnings and a $28.6 million pre-tax charge to earnings at CL&P for a 2021 storm performance penalty imposed by PURA as a result of CL&P’s preparation for, and response to, Tropical Storm Isaias. The after-tax impact of the CL&P settlement agreement and CL&P storm performance penalty imposed by PURA was $86.1 million, or $0.25 per share. Excluding those 2021 charges, electric distribution segment earnings increased $36.6 million due primarily to a base distribution rate increase at NSTAR Electric effective January 1, 2022,2023 at NSTAR Electric, higher earnings from CL&P's capital tracking mechanism due to increased electric system improvements, lower pension plan expense in Connecticut and New Hampshire, and an increase in interest income primarily on regulatory deferrals.deferrals, the impact of a new regulatory tracking mechanism at PSNH that allows for the recovery of previously incurred operating expenses associated with poles acquired on May 1, 2023, and higher AFUDC equity income. Those earnings increases were partially offset by higher operations and maintenance expense, driven primarily by higher shared corporate costs resulting from the implementation of new information technology systems, higher storm costs, a $10 million pre-tax charge to earnings as a result of CL&P’s commitment to contribute to an energy assistance program as part of its 2022 rate relief plan, and higher insurance reserves. Earnings were also unfavorably impacted by higher depreciationinterest expense, higher property and other tax expense, higher depreciation expense and higher interest expense.lower pension income.
Our electric transmission segment earnings increased $52.0$46.8 million in 2022,2023, as compared to 2021,2022, due primarily to a higher transmission rate base as a result of our continued investment in our transmission infrastructure partially offset byand a higherlower effective income tax rate and higher interest expense on short-term debt.rate.
Our natural gas distribution segment earnings increased $29.4decreased $9.4 million in 2022,2023, as compared to 2021,2022, due primarily to base distributionhigher depreciation expense, higher interest expense, a higher effective tax rate, increases effective November 1, 2021an unfavorable regulatory adjustment resulting from NSTAR Gas’ GSEP reconciliation filing, higher operations and November 1, 2022 at each of EGMAmaintenance expense arising primarily from higher uncollectible expense, and NSTAR Gas,higher property tax expense. Those earnings decreases were partially offset by higher earnings from capital tracking mechanisms due to continued investments in natural gas infrastructure, base distribution rate increases effective November 1, 2023 and lower pension plan expenseNovember 1, 2022 at Yankee Gas. Those earnings increases were partially offset by higher operationsNSTAR Gas and maintenance expense, higher property tax expense, highereffective November 1, 2022 at EGMA, and an increase in interest expense, and higher depreciation expense.income primarily on regulatory deferrals.
Our water distribution segment earnings were flatdecreased $3.7 million in 2022,2023, as compared to 2021.2022, due primarily to higher depreciation, operations and maintenance expense and higher interest expense.
Eversource Parent and Other Companies: Eversource parent and other companies’ losses increased $19.7 million$1.90 billion in 2022,2023, as compared to 2021,2022, due primarily to the 2023 impairments of Eversource parent’s offshore wind investments, which resulted in a total after-tax charge of $1.95 billion, or $5.58 per share. Earnings were also unfavorably impacted by higher interest expense and a higherloss on the disposition of land in 2023 that was initially acquired to construct the Northern Pass Transmission project and was subsequently abandoned. Earnings benefited by a lower effective tax rate partially offset by higher unrealized gains associated with ouras a result of the ability to utilize tax credits and benefits in 2023, as well as a decrease in after-tax transaction and transition costs. Additionally, 2023 earnings were favorably impacted from the liquidation of Eversource parent’s equity method investment in a renewable energy fund, and an after-tax decreasepartially offset by a charitable contribution made with a portion of $8.6 millionthe proceeds from the liquidation in transition costs associated with EGMA integration and transaction costs in 2022, as compared to 2021.2023.
Liquidity
Sources and Uses of Cash: Eversource’s regulated business is capital intensive and requires considerable capital resources. Eversource’s regulated companies’ capital resources are provided by cash flows generated from operations, short-term borrowings, long-term debt issuances, capital contributions from Eversource parent, and existing cash, and are used to fund their liquidity and capital requirements. Eversource’s regulated companies typically maintain minimal cash balances and use short-term borrowings to meet their working capital needs and other cash requirements. Short-term borrowings are also used as a bridge to long-term debt financings. The levels of short-term borrowing may vary significantly over the course of the year due to the impact of fluctuations in cash flows from operations (including timing of storm costs and regulatory recoveries), dividends paid, capital contributions received and the timing of long-term debt financings.
Eversource, CL&P, NSTAR Electric and PSNH each uses its available capital resources to fund its respective construction expenditures, meet debt requirements, pay operating costs, including storm-related costs, pay dividends, and fund other corporate obligations, such as pension contributions. Eversource's regulated companies recover their electric, natural gas and water distribution construction expenditures as the related project costs are depreciated over the life of the assets. This impacts the timing of the revenue stream designed to fully recover the total investment plus a return on the equity and debt used to finance the investments. Eversource's regulated companies spend a significant amount of cash on capital improvements and construction projects that have a long-term return on investment and recovery period. In addition, Eversource uses its capital resources to fund investments in its offshore wind business, which are recognized as long-term assets. These factors have resulted in current liabilities exceeding current assets by $2.58$2.09 billion, $168.6$308.5 million and $330.0$143.6 million at Eversource, CL&P,NSTAR Electric and PSNH, respectively, as of December 31, 2022.2023.
We expect the future operating cash flows of Eversource, CL&P, NSTAR Electric and PSNH, along with our existing borrowing availability and access to both debt and equity markets, will be sufficient to meet any working capital and future operating requirements, and capital investment forecasted opportunities.
As of December 31, 2022, $2.012023, $1.95 billion of Eversource's long-term debt, including $1.20$1.35 billion at Eversource parent $400.0and $139.8 million at CL&P, $80.0 million at NSTAR Electric, and $325.0 million at PSNH, matures within the next 12 months. CL&P repaid this long-term debt at maturity in January 2023. Eversource, with its strongsolid credit ratings, has several options available in the financial markets to repay or refinance these maturities with the issuance of new long-term debt. Eversource, CL&P, NSTAR Electric and PSNH will reduce their short-term borrowings with operating cash flows or with the issuance of new long-term debt, determined by considering capital requirements and maintenance of Eversource's credit rating and profile.
Cash and Cash Equivalents totaled $53.9 million as of December 31, 2023, compared with $374.6 million as of December 31, 2022, compared with $66.8 million as of December 31, 2021.2022.
Short-Term Debt - Commercial Paper Programs and Credit Agreements: Eversource parent has a $2.00 billion commercial paper program allowing Eversource parent to issue commercial paper as a form of short-term debt. Eversource parent, CL&P, PSNH, NSTAR Gas, Yankee Gas, EGMA and Aquarion Water Company of Connecticut are parties to a five-year $2.00 billion revolving credit facility, which terminates on October 15, 2027.13, 2028. This revolving credit facility serves to backstop Eversource parent's $2.00 billion commercial paper program.
NSTAR Electric has a $650 million commercial paper program allowing NSTAR Electric to issue commercial paper as a form of short-term debt. NSTAR Electric is also a party to a five-year $650 million revolving credit facility, which terminates on October 15, 2027. This revolving credit facility13, 2028, and serves to backstop NSTAR Electric's $650 million commercial paper program.
The amount of borrowings outstanding and available under the commercial paper programs were as follows:
| | | | | | | | | | | | | | | | | | | | | | | | | | | | | | | | | | | |
| Borrowings Outstanding
as of December 31, | | Available Borrowing Capacity as of December 31, | | Weighted-Average Interest Rate as of December 31, |
| (Millions of Dollars) | 2022 | | 2021 | | 2022 | | 2021 | | 2022 | | 2021 |
| Eversource Parent Commercial Paper Program | $ | 1,442.2 | | | $ | 1,343.0 | | | $ | 557.8 | | | $ | 657.0 | | | 4.63 | % | | 0.31 | % |
| NSTAR Electric Commercial Paper Program | — | | | 162.5 | | | 650.0 | | | 487.5 | | | — | % | | 0.14 | % |
| | | | | | | | | | | | | | | | | | | | | | | | | | | | | | | | | | | |
| Borrowings Outstanding
as of December 31, | | Available Borrowing Capacity as of December 31, | | Weighted-Average Interest Rate as of December 31, |
| (Millions of Dollars) | 2023 | | 2022 | | 2023 | | 2022 | | 2023 | | 2022 |
| Eversource Parent Commercial Paper Program | $ | 1,771.9 | | | $ | 1,442.2 | | | $ | 228.1 | | | $ | 557.8 | | | 5.60 | % | | 4.63 | % |
| NSTAR Electric Commercial Paper Program | 365.8 | | | — | | | 284.2 | | | 650.0 | | | 5.40 | % | | — | % |
There were no borrowings outstanding on the revolving credit facilities as of December 31, 20222023 or 2021.2022.
CL&P and PSNH have uncommitted line of credit agreements totaling $450$375 million and $300$250 million, respectively, which will expire on May 12, 2023.in 2024. There are no borrowings outstanding on either the CL&P or PSNH uncommitted line of credit agreements as of December 31, 2022.2023.
Amounts outstanding under the commercial paper programs are included in Notes Payable and classified in current liabilities on the Eversource and NSTAR Electric balance sheets, as all borrowings are outstanding for no more than 364 days at one time. As a result of the CL&P long-term debt issuance in January 2024, $207.3 million of commercial paper borrowings under the Eversource parent commercial paper program were reclassified as Long-Term Debt on Eversource parent’s balance sheet as of December 31, 2023.
Intercompany Borrowings: Eversource parent uses its available capital resources to provide loans to its subsidiaries to assist in meeting their short-term borrowing needs. Eversource parent records intercompany interest income from its loans to subsidiaries, which is eliminated in consolidation. Intercompany loans from Eversource parent to its subsidiaries are eliminated in consolidation on Eversource's balance sheets. As of December 31, 2023, there were intercompany loans from Eversource parent to CL&P of $457.0 million and to PSNH of $233.0 million. As of December 31, 2022, there were intercompany loans from Eversource parent to PSNH of $173.3 million. As of December 31, 2021, there wereEversource parent charges interest on these intercompany loans from Eversource parent to PSNH of $110.6 million.at the same weighted-average interest rate as its commercial paper program. Intercompany loans from Eversource parent are included in Notes Payable to Eversource Parentparent and classified in current liabilities on the respective subsidiary's balance sheets.sheets, as these intercompany borrowings are outstanding for no more than 364 days at one time. As a result of the CL&P long-term debt issuance in January 2024, $207.3 million of CL&P’s intercompany borrowings were reclassified to Long-Term Debt on CL&P’s balance sheet as of December 31, 2023.
Availability under Long-Term Debt Issuance Authorizations: On DecemberJune 14, 2022, the NHPUCDPU approved PSNH’sNSTAR Gas’ request for authorization to issue up to $600$325 million in long-term debt through December 31, 2023.2024. On November 30, 2022, the PURA approved CL&P's request for authorization to issue up to $1.15 billion in long-term debt through December 31, 2024. As a result of CL&P’s January 2024 long-term debt issuance, CL&P has now fully utilized this authorization. On June 14, 2022, the DPU7, 2023, PURA approved NSTARYankee Gas’ request for authorization to issue up to $325$350 million in long-term debt through December 31, 2024. The remaining Eversource operating companies, includingOn November 21, 2023, NSTAR Electric have utilizedpetitioned the DPU requesting authorization to issue up to $2.4 billion in long-term debt authorizationsthrough December 31, 2026. On February 8, 2024, the NHPUC approved PSNH’s request for authorization to issue up to $300 million in place with the respective regulatory commissions.long-term debt through December 31, 2024.
Long-Term Debt Issuances and Repayments: The following table summarizes long-term debt issuances and repayments:
| | | | | | | | | | | | | | | | | | | | | | | | | | | | | |
| (Millions of Dollars) | Interest Rate | | Issuance/
(Repayment) | | Issue Date or Repayment Date | | Maturity Date | | Use of Proceeds for Issuance/
Repayment Information |
| CL&P 2023 Series A First Mortgage Bonds | 5.25 | % | | $ | 500.0 | | | January 2023 | | January 2053 | | Repaid 2013 Series A Bonds at maturity and short-term debt, and paid capital expenditures and working capital |
| CL&P 2013 Series A First Mortgage Bonds | 2.50 | % | | (400.0) | | | January 2023 | | January 2023 | | Paid at maturity |
| NSTAR Electric 2022 Debentures | 4.55 | % | | 450.0 | | | May 2022 | | June 2052 | | Repaid short-term debt, paid capital expenditures and working capital |
| NSTAR Electric 2022 Debentures | 4.95 | % | | 400.0 | | | September 2022 | | September 2052 | | Refinanced investments in eligible green expenditures, which were previously financed using short-term debt from October 1, 2020 through June 30, 2022 |
| NSTAR Electric 2012 Debentures | 2.375 | % | | (400.0) | | | October 2022 | | October 2022 | | Paid at maturity |
| PSNH Series W First Mortgage Bonds | 5.15 | % | | 300.0 | | | January 2023 | | January 2053 | | Repaid short-term debt, paid capital expenditures and working capital |
| Eversource Parent Series V Senior Notes | 2.90 | % | | 650.0 | | | February 2022 | | March 2027 | | Repaid Series K Senior Notes at maturity and short-term debt |
| Eversource Parent Series W Senior Notes | 3.375 | % | | 650.0 | | | February 2022 | | March 2032 | | Repaid Series K Senior Notes at maturity and short-term debt |
| Eversource Parent Series X Senior Notes | 4.20 | % | | 900.0 | | | June 2022 | | June 2024 | | Repaid short-term debt and paid working capital |
| Eversource Parent Series Y Senior Notes | 4.60 | % | | 600.0 | | | June 2022 | | July 2027 | | Repaid short-term debt and paid working capital |
| Eversource Parent Series K Senior Notes | 2.75 | % | | (750.0) | | | March 2022 | | March 2022 | | Paid at maturity |
| Yankee Gas Series B First Mortgage Bonds | 8.48 | % | | (20.0) | | | March 2022 | | March 2022 | | Paid at maturity |
| Yankee Gas Series U First Mortgage Bonds | 4.31 | % | | 100.0 | | | September 2022 | | September 2032 | | Repaid short-term debt, paid capital expenditures and for general corporate purposes |
| EGMA Series C First Mortgage Bonds | 4.70 | % | | 100.0 | | | June 2022 | | June 2052 | | Repaid short-term debt, paid capital expenditures and for general corporate purposes |
| NSTAR Gas Series V First Mortgage Bonds | 4.40 | % | | 125.0 | | | July 2022 | | August 2032 | | Repaid short-term debt, paid capital expenditures and for general corporate purposes |
| Aquarion Water Company of New Hampshire General Mortgage Bonds | 4.45 | % | | (5.0) | | | July 2022 | | July 2022 | | Paid at maturity |
| Aquarion Water Company of Connecticut Senior Notes | 4.69 | % | | 70.0 | | | August 2022 | | September 2052 | | Repaid short-term debt |
| | | | | | | | | | | | | | | | | | | | | | | | | | | | | |
| (Millions of Dollars) | Interest Rate | | Issuance/
(Repayment) | | Issue Date or Repayment Date | | Maturity Date | | Use of Proceeds for Issuance/
Repayment Information |
| CL&P 2023 Series A First Mortgage Bonds | 5.25 | % | | $ | 500.0 | | | January 2023 | | January 2053 | | Repaid 2013 Series A Bonds at maturity and short-term debt, and paid capital expenditures and working capital |
| CL&P 2013 Series A First Mortgage Bonds | 2.50 | % | | (400.0) | | | January 2023 | | January 2023 | | Paid at maturity |
| CL&P 2023 Series B First Mortgage Bonds | 4.90 | % | | 300.0 | | | July 2023 | | July 2033 | | Repaid short-term debt, paid capital expenditures and working capital |
| CL&P 2024 Series A First Mortgage Bonds | 4.65 | % | | 350.0 | | | January 2024 | | January 2029 | | Repaid short-term debt, paid capital expenditures and working capital |
| NSTAR Electric 2023 Debentures | 5.60 | % | | 150.0 | | | September 2023 | | October 2028 | | Repaid Series G Senior Notes at maturity and short-term debt and for general corporate purposes |
| NSTAR Electric 2013 Series G Senior Notes | 3.88 | % | | (80.0) | | | November 2023 | | November 2023 | | Paid at maturity |
| PSNH Series W First Mortgage Bonds | 5.15 | % | | 300.0 | | | January 2023 | | January 2053 | | Repaid short-term debt, paid capital expenditures and working capital |
| PSNH Series X First Mortgage Bonds | 5.35 | % | | 300.0 | | | September 2023 | | October 2033 | | Repaid Series S Bonds at maturity and for general corporate purposes |
| PSNH Series S First Mortgage Bonds | 3.50 | % | | (325.0) | | | November 2023 | | November 2023 | | Paid at maturity |
| Eversource Parent Series Z Senior Notes | 5.45 | % | | 750.0 | | | March 2023 | | March 2028 | | Repaid Series F Senior Notes at maturity and short-term debt |
| Eversource Parent Series F Senior Notes | 2.80 | % | | (450.0) | | | May 2023 | | May 2023 | | Paid at maturity |
| Eversource Parent Series Z Senior Notes | 5.45 | % | | 550.0 | | | May 2023 | | March 2028 | | Repaid Series T Senior Notes and Series N Senior Notes at maturity and short-term debt |
| Eversource Parent Series AA Senior Notes | 4.75 | % | | 450.0 | | | May 2023 | | May 2026 | | Repaid Series T Senior Notes and Series N Senior Notes at maturity and short-term debt |
| Eversource Parent Series BB Senior Notes | 5.125 | % | | 800.0 | | | May 2023 | | May 2033 | | Repaid Series T Senior Notes and Series N Senior Notes at maturity and short-term debt |
| Eversource Parent Variable Rate Series T Senior Notes | SOFR plus 0.25% | | (350.0) | | | August 2023 | | August 2023 | | Paid at maturity |
| Eversource Parent Series CC Senior Notes | 5.95 | % | | 800.0 | | | November 2023 | | February 2029 | | Repaid Series N Senior Notes at maturity and short-term debt |
| Eversource Parent Series N Senior Notes | 3.80 | % | | (400.0) | | | December 2023 | | December 2023 | | Paid at maturity |
| Eversource Parent Series DD Senior Notes | 5.00 | % | | 350.0 | | | January 2024 | | January 2027 | | Repaid short-term debt |
| Eversource Parent Series EE Senior Notes | 5.50 | % | | 650.0 | | | January 2024 | | January 2034 | | Repaid short-term debt |
| Yankee Gas Series V First Mortgage Bonds | 5.51 | % | | 170.0 | | | August 2023 | | August 2030 | | Repaid short-term debt and general corporate purposes |
| EGMA Series D First Mortgage Bonds | 5.73 | % | | 58.0 | | | November 2023 | | November 2028 | | Repaid short-term debt, paid capital expenditures and working capital |
| Aquarion Water Company of Connecticut Senior Notes | 5.89 | % | | 50.0 | | | September 2023 | | October 2043 | | Repaid existing indebtedness, paid capital expenditures and general corporate purposes |
As a result of the CL&P and PSNHEversource parent long-term debt issuances in January 2023, $4002024, $139.8 million and $295.3$990.9 million, respectively, of current portion of long-term debt were reclassified as Long-Term Debt on CL&P’s and PSNH’sEversource parent’s balance sheets as of December 31, 2022.2023.
Rate Reduction Bonds: PSNH's RRB payments consist of principal and interest and are paid semi-annually. PSNH paid $43.2 million of RRB principal payments in each of 2023 and 2022, and paid $16.2 million and $17.6 million of interest payments in 2023 and 2022, and paid $43.2 million of RRB principal payments and $18.9 million of interest payments in 2021.respectively.
Common Share Issuances and 2022 Equity Distribution Agreement: On May 11, 2022, Eversource entered into an equity distribution agreement pursuant to which it may offer and sell up to $1.2 billion of its common shares from time to time through an “at-the-market” (ATM) equity offering program. Eversource may issue and sell its commonIn 2023, no shares through its sales agents during the term ofwere issued under this agreement. Shares may be offered in transactions on the New York Stock Exchange, in the over-the-counter market, through negotiated transactions or otherwise. Sales may be made at either market prices prevailing at the time of sale, at prices related to such prevailing market prices or at negotiated prices. In 2022, Eversource issued 2,165,671 common shares, which resulted in proceeds of $197.1 million, net of issuance costs. Eversource used the net proceeds received for general corporate purposes.
Cash Flows: Cash flows from operating activities primarily result from the transmission and distribution of electricity, and the distribution of natural gas and water. Cash flows provided by operating activities totaled $1.65 billion in 2023, compared with $2.40 billion in 2022, compared with $1.96 billion in 2021. Changes in Eversource’s cash flows from operations were generally consistent with changes in its results of operations, after adjustment for non-cash items and as adjusted by changes in working capital in the normal course of business.2022. Operating cash flows were favorablyunfavorably impacted by an increase in regulatory under-recoveries driven primarily by the timing of collections for the CL&P non-bypassable FMCC and other regulatory tracking mechanisms, the timing of cash payments made on our accounts payable, ana $26.7 million increase in regulatory over-recoveries driven bycash payments to vendors for storm costs, an $11.9 million increase in cost of removal expenditures, and the timing of collections forother working capital items. In 2023, CL&P increased the flow back to customers of net revenues generated by long-term state-approved energy contracts by providing these credits to customers through the non-bypassable FMCC atretail rate. The reduction in the CL&P non-bypassable FMCC retail rate decreased the regulatory over-recovery balance and other regulatory tracking mechanisms,created an under-recovery balance as of December 31, 2023, which resulted in a decrease to amortization expense of $99.2$802.3 million in pension and PBOP contributions made in 2022,2023, as compared to 2021,2022, and is presented as a $43.7 million decreasecash outflow in income tax payments made in 2022, as compared to 2021.Amortization on the statement of cash
flows. The impactimpacts of regulatory collections are included in both Regulatory Over/Under Recoveries and Amortization on the statements of cash flows. These favorableunfavorable impacts were partially
offset by the timing of cash collections on our accounts receivable, the absence in 2023 of $78.4 million of payments in 2022 related to withheld property taxes at our Massachusetts companies, primarily at NSTAR Electric,a decrease of $76.3 million in pension contributions made in 2023 compared to 2022, the absence in 2023 of $72.0 million of customer credits distributed to CL&P’s customers in 2022 at CL&P as a result of the October 2021 settlement agreement and the 2021 storm performance penalty for CL&P’s response to Tropical Storm Isaias, and a $61.6$38.7 million increase in cost of removal expenditures, and an increase of $34.0 million inoperating cash payments for storm costs at NSTAR Electric.flows due to lower income tax payments.
In 2023, we paid cash dividends of $919.0 million and issued non-cash dividends of $23.4 millionin the form of treasury shares, totaling dividends of $942.4 million, or $2.70 per common share. In 2022, we paid cash dividends of $860.0 million and issued non-cash dividends of $23.1 millionin the form of treasury shares, totaling dividends of $883.1 million, or $2.55 per common share. In 2021, we paid cash dividends of $805.4 million and issued non-cash dividends of $22.9 million in the form of treasury shares, totaling dividends of $828.3 million, or $2.41 per common share. Our quarterly common share dividend payment was $0.675 per share in 2023, as compared to $0.6375 per share in 2022, as compared to $0.6025 per share in 2021.2022. On February 1, 2023,January 31, 2024, our Board of Trustees approved a common share dividend payment of $0.675$0.715 per share, payable on March 31, 202329, 2024 to shareholders of record as of March 2, 2023.5, 2024.
Eversource issues treasury shares to satisfy awards under the Company's incentive plans, shares issued under the dividend reinvestment and share purchase plan, and matching contributions under the Eversource 401k Plan.
In 2022,2023, CL&P, NSTAR Electric and PSNH paid $292.4$330.4 million, $287.6$327.4 million and $104.0$112.0 million, respectively, in common stock dividends to Eversource parent.
Investments in Property, Plant and Equipment on the statements of cash flows do not include amounts incurred on capital projects but not yet paid, cost of removal, AFUDC related to equity funds, and the capitalized and deferred portions of pension and PBOP income/expense. In 2022,2023, investments for Eversource, CL&P, NSTAR Electric, and PSNH were $3.44$4.34 billion, $876.7 million, $954.3 million$1.09 billion, $1.38 billion and $485.6$605.1 million, respectively. Capital expenditures were primarily for continuing projects to maintain and improve infrastructure and operations, including enhancing reliability to the transmission and distribution systems.
Capital contributions in the offshore wind investments, including the 2023 contribution for the tax equity investment in South Fork Wind, are included in Investments in Unconsolidated Affiliates on the statements of cash flows. Proceeds received from the sale of the uncommitted lease area of $625 million in 2023 and from an October 2023 distribution of $318 million received primarily as a result of being a 50 percent joint owner in the Class B shares of South Fork Wind which was restructured as a tax equity investment, are included in Proceeds from Unconsolidated Affiliates on the statement of cash flows. Proceeds from the October 2023 distribution were used to pay down short-term debt. Proceeds from Unconsolidated Affiliates also includes proceeds received from the liquidation of an equity method investment in a renewable energy investment fund of $147.6 million in 2023.
Contractual Obligations: For information regarding our cash requirements from contractual obligations and payment schedules, see Note 9, "Long-Term Debt," Note 10, "Rate Reduction Bonds and Variable Interest Entities," Note 11A, "Employee Benefits - Pension Benefits and Postretirement Benefits Other Than Pension," Note 13, "Commitments and Contingencies," and Note 14, "Leases," to the financial statements.
Estimated interest payments on existing long-term fixed-rate debt are calculated by multiplying the coupon rate on the debt by its scheduled notional amount outstanding for the period of measurement as of December 31, 20222023 and are as follows:
| | (Millions of Dollars) | (Millions of Dollars) | 2023 | | 2024 | | 2025 | | 2026 | | 2027 | | Thereafter | | Total | (Millions of Dollars) | 2024 | | 2025 | | 2026 | | 2027 | | 2028 | | Thereafter | | Total |
| Eversource | Eversource | $ | 722.6 | | | $ | 654.7 | | | $ | 589.6 | | | $ | 559.7 | | | $ | 517.3 | | | $ | 5,864.4 | | | $ | 8,908.3 | |
| CL&P | 154.7 | | | 149.7 | | | 138.6 | | | 135.6 | | | 127.6 | | | 1,657.2 | | | 2,363.4 | |
Our commitments to make payments in addition to these contractual obligations include other liabilities reflected on our balance sheets, future funding of our offshore wind equity method investment,investments until the expected sales are completed, and guarantees of certain obligations primarily associated with our offshore wind investment.investments. The future funding and guarantee obligations associated with our offshore wind investment couldinvestments will be impacted by the strategic reviewexpected sales of our offshore wind investment.investments and related developments.
For information regarding our projected capital expenditures over the next five years, see "Business Development and Capital Expenditures - Projected Capital Expenditures" and for projected investments infurther information on the expected sales of our offshore wind business,investments, see Business“Business Development and Capital Expenditures - Offshore Wind Business" included in this Management's Discussion and Analysis of Financial Condition and Results of Operations.
Credit Ratings: A summary of our current corporate credit ratings and outlooks by S&P, Moody's, and Fitch is as follows:
| | | | | | | | | | | | | | | | | | | | | | | | | | | | | | | | | | | |
| | S&P | | Moody's | | Fitch |
| | Current | | Outlook | | Current | | Outlook | | Current | | Outlook |
| Eversource Parent | A- | | PositiveWatch Neg | | Baa1Baa2 | | Negative | | BBB+BBB | | Stable |
| CL&P | A | | PositiveWatch Neg | | A3 | | Stable | | A- | | Stable |
| NSTAR Electric | A | | PositiveWatch Neg | | A1A2 | | Negative | | A A- | | Stable |
| PSNH | A | | Watch Neg | | A3 | | Stable | | A3 | | Stable | | A- | | Stable |
A summary of the current credit ratings and outlooks by S&P, Moody's, and Fitch for senior unsecured debt of Eversource parent and NSTAR Electric, and senior secured debt of CL&P and PSNH is as follows:
| | | | | | | | | | | | | | | | | | | | | | | | | | | | | | | | | | | |
| | S&P | | Moody's | | Fitch |
| | Current | | Outlook | | Current | | Outlook | | Current | | Outlook |
| Eversource Parent | BBB+ | | PositiveWatch Neg | | Baa1Baa2 | | Negative | | BBB+ BBB | | Stable |
| CL&P | A+ | | PositiveWatch Neg | | A1 | | Stable | | A+ | | Stable |
| NSTAR Electric | A | | PositiveWatch Neg | | A1A2 | | Negative | | A+A | | Stable |
| PSNH | A+ | | Watch Neg | | A1 | | Stable | | A1 | | Stable | | A+ | | Stable |
Impact of COVID-19
The financial impacts of COVID-19 as it relates to our businesses primarily relate to collectability of customer receivables and the outcome of future proceedings before our state regulatory commissions to recover our incremental uncollectible customer receivable costs associated with COVID-19.
As of December 31, 2022, our allowance for uncollectible customer receivable balance of $486.3 million, of which $284.4 million relates to hardship accounts that are specifically recovered in rates charged to customers, adequately reflected the collection risk and net realizable value for our receivables. As of December 31, 2022 and 2021, the total amount incurred as a result of COVID-19 included in the allowance for uncollectible accounts was $50.9 million and $55.3 million at Eversource, $16.0 million and $23.9 million at CL&P, and $4.1 million and $9.0 million at NSTAR Electric, respectively. At our Connecticut and Massachusetts utilities, the COVID-19 related uncollectible amounts were deferred either as incremental regulatory costs or deferred through existing regulatory tracking mechanisms that recover uncollectible energy supply costs, as management believes it is probable that these costs will ultimately be recovered from customers in future rates. No COVID-19 related uncollectible amounts were deferred at PSNH as a result of a July 2021 NHPUC order. Based on the status of our COVID-19 regulatory dockets, policies and practices in the jurisdictions in which we operate, we believe the state regulatory commissions in Connecticut and Massachusetts will allow us to recover our incremental uncollectible customer receivable costs associated with COVID-19.
Business Development and Capital Expenditures
Our consolidated capital expenditures, including amounts incurred but not paid, cost of removal, AFUDC, and the capitalized and deferred portions of pension and PBOP income/expense (all of which are non-cash factors), totaled $4.59 billion in 2023, $3.79 billion in 2022, and $3.54 billion in 2021, and $3.06 billion in 2020.2021. These amounts included $214.4 million in 2023, $266.5 million in 2022, and $238.0 million in 2021 and $239.1 million in 2020 related to information technology and facilities upgrades and enhancements, primarily at Eversource Service and The Rocky River Realty Company.
Electric Transmission Business: Our consolidated electric transmission business capital expenditures increased by $91.7$240.8 million in 2022,2023, as compared to 2021.2022. A summary of electric transmission capital expenditures by company is as follows:
| | | | For the Years Ended December 31, | | For the Years Ended December 31, |
| (Millions of Dollars) | (Millions of Dollars) | 2022 | | 2021 | | 2020 | (Millions of Dollars) | 2023 | | 2022 | | 2021 |
| CL&P | CL&P | $ | 416.8 | | | $ | 400.0 | | | $ | 402.9 | |
| NSTAR Electric | NSTAR Electric | 438.4 | | | 480.3 | | | 366.8 | |
| PSNH | PSNH | 351.8 | | | 235.0 | | | 193.9 | |
| Total Electric Transmission Segment | $ | 1,207.0 | | | $ | 1,115.3 | | | $ | 963.6 | |
| Total Electric Transmission | |
Our transmission projects are designed to improve the reliability of the electric grid, meet customer demand for power and increases in electrification of municipal infrastructure, strengthen the electric grid's resilience against extreme weather and other safety and security threats, and enable integration of increasing amounts of clean power generation from renewable sources, such as solar, battery storage, and offshore wind. In Connecticut, Massachusetts and New Hampshire, our transmission projects include transmission line upgrades, the installation of new transmission interconnection facilities, substations and lines, and transmission substation enhancements.
Our transmission projects in Massachusetts include electric transmission upgrades in the greater Boston metropolitan area. Two of these upgrades, the Mystic-Woburn and the Wakefield-Woburn reliability projects, are under construction and are expected to be placed in service by the fourth quarter of 2023. Construction on the last remaining upgrade, the Sudbury-Hudson Reliability Project, commenced in the fourth quarter of 2022. We spent $71.9 million during 2022 and we expect to make additional capital expenditures of approximately $115 million on these remaining transmission upgrades. There are also several transmission projects underway in southeastern Massachusetts, including Cape Cod, required to reinforce the Southeastern Massachusetts transmission system and bring the system into compliance with applicable national and regional reliability standards. We spent $23.2 million during 2022 and we expect to make additional capital expenditures of approximately $110 million on these transmission upgrades.
Distribution Business: A summary of distribution capital expenditures is as follows:
| | For the Years Ended December 31, |
| For the Years Ended December 31, | | | For the Years Ended December 31, |
| (Millions of Dollars) | (Millions of Dollars) | CL&P | | NSTAR Electric | | PSNH | | Total Electric | | Natural Gas | | Water | | Total | (Millions of Dollars) | CL&P | | NSTAR Electric | | PSNH | | Total Electric | | Natural Gas | | Water | | Total |
| 2022 | | | | | | | | | | | | | |
| 2023 | |
| Basic Business | |
| Basic Business | |
| Basic Business | Basic Business | $ | 267.8 | | | $ | 202.4 | | | $ | 68.6 | | | $ | 538.8 | | | $ | 175.2 | | | $ | 16.8 | | | $ | 730.8 | |
| Aging Infrastructure | Aging Infrastructure | 199.9 | | | 245.1 | | | 70.8 | | | 515.8 | | | 562.3 | | | 137.6 | | | 1,215.7 | |
| Load Growth and Other | Load Growth and Other | 90.7 | | | 177.0 | | | 31.3 | | | 299.0 | | | 66.4 | | | 0.9 | | | 366.3 | |
| | Total Distribution | Total Distribution | $ | 558.4 | | | $ | 624.5 | | | $ | 170.7 | | | $ | 1,353.6 | | | $ | 803.9 | | | $ | 155.3 | | | $ | 2,312.8 | |
| | 2021 | |
| Total Distribution | |
| | Total Distribution | |
| | 2022 | |
| 2022 | |
| 2022 | |
| Basic Business | |
| Basic Business | |
| Basic Business | Basic Business | $ | 256.2 | | | $ | 179.9 | | | $ | 56.0 | | | $ | 492.1 | | | $ | 206.1 | | | $ | 16.5 | | | $ | 714.7 | |
| Aging Infrastructure | Aging Infrastructure | 178.0 | | | 219.1 | | | 67.7 | | | 464.8 | | | 509.6 | | | 127.1 | | | 1,101.5 | |
| Load Growth and Other | Load Growth and Other | 80.2 | | | 169.9 | | | 37.1 | | | 287.2 | | | 83.3 | | | 0.6 | | | 371.1 | |
| | Total Distribution | Total Distribution | $ | 514.4 | | | $ | 568.9 | | | $ | 160.8 | | | $ | 1,244.1 | | | $ | 799.0 | | | $ | 144.2 | | | $ | 2,187.3 | |
| | 2020 | |
| Total Distribution | |
| | Total Distribution | |
| | 2021 | |
| 2021 | |
| 2021 | |
| Basic Business | |
| Basic Business | |
| Basic Business | Basic Business | $ | 233.4 | | | $ | 195.1 | | | $ | 52.4 | | | $ | 480.9 | | | $ | 88.2 | | | $ | 10.9 | | | $ | 580.0 | |
| Aging Infrastructure | Aging Infrastructure | 179.9 | | | 237.1 | | | 80.2 | | | 497.2 | | | 391.3 | | | 115.5 | | | 1,004.0 | |
| Load Growth and Other | Load Growth and Other | 77.8 | | | 112.2 | | | 21.3 | | | 211.3 | | | 65.6 | | | 0.8 | | | 277.7 | |
| | Total Distribution | Total Distribution | $ | 491.1 | | | $ | 544.4 | | | $ | 153.9 | | | $ | 1,189.4 | | | $ | 545.1 | | | $ | 127.2 | | | $ | 1,861.7 | |
| | Total Distribution | |
| | Total Distribution | |
For the electric distribution business, basic business includes the purchase of meters, tools, vehicles, information technology, transformer replacements, equipment facilities, and the relocation of plant. Aging infrastructure relates to reliability and the replacement of overhead lines, plant substations, underground cable replacement, and equipment failures. Load growth and other includes requests for new business and capacity additions on distribution lines and substation additions and expansions.
For the natural gas distribution business, basic business addresses daily operational needs including meters, pipe relocations due to public works projects, vehicles, and tools. Aging infrastructure projects seek to improve the reliability of the system through enhancements related to cast iron and bare steel replacement of main and services, corrosion mediation, and station upgrades. Load growth and other reflects growth in existing service territories including new developments, installation of services, and expansion.
For the water distribution business, basic business addresses daily operational needs including periodic meter replacement, water main relocation, facility maintenance, and tools. Aging infrastructure relates to reliability and the replacement of water mains, regulators, storage tanks, pumping stations, wellfields, reservoirs, and treatment facilities. Load growth and other reflects growth in our service territory, including improvements of acquisitions, installation of new services, and interconnections of systems.
Projected Capital Expenditures: A summary of the projected capital expenditures for the regulated companies' electric transmission and for the total electric distribution, natural gas distribution and water distribution for 20232024 through 2027,2028, including information technology and facilities upgrades and enhancements on behalf of the regulated companies, is as follows:
| | | | Years | | Years |
| (Millions of Dollars) | (Millions of Dollars) | 2023 | | 2024 | | 2025 | | 2026 | | 2027 | | 2023 - 2027 Total | (Millions of Dollars) | 2024 | | 2025 | | 2026 | | 2027 | | 2028 | | 2024 - 2028 Total |
| CL&P Transmission | CL&P Transmission | $ | 406 | | | $ | 312 | | | $ | 324 | | | $ | 263 | | | $ | 136 | | | $ | 1,441 | |
| NSTAR Electric Transmission | NSTAR Electric Transmission | 461 | | | 527 | | | 436 | | | 575 | | | 748 | | | 2,747 | |
| PSNH Transmission | PSNH Transmission | 329 | | | 270 | | | 252 | | | 174 | | | 72 | | | 1,097 | |
Total Electric Transmission | Total Electric Transmission | $ | 1,196 | | | $ | 1,109 | | | $ | 1,012 | | | $ | 1,012 | | | $ | 956 | | | $ | 5,285 | |
| Electric Distribution | Electric Distribution | $ | 1,847 | | | $ | 1,750 | | | $ | 1,768 | | | $ | 1,870 | | | $ | 1,628 | | | $ | 8,863 | |
| Natural Gas Distribution | Natural Gas Distribution | 1,035 | | | 1,038 | | | 1,146 | | | 1,115 | | | 918 | | | 5,252 | |
Total Electric and Natural Gas Distribution | Total Electric and Natural Gas Distribution | $ | 2,882 | | | $ | 2,788 | | | $ | 2,914 | | | $ | 2,985 | | | $ | 2,546 | | | $ | 14,115 | |
| Water Distribution | Water Distribution | $ | 170 | | | $ | 194 | | | $ | 203 | | | $ | 218 | | | $ | 235 | | | $ | 1,020 | |
| Information Technology and All Other | Information Technology and All Other | $ | 215 | | | $ | 213 | | | $ | 244 | | | $ | 219 | | | $ | 208 | | | $ | 1,099 | |
| Total | Total | $ | 4,463 | | | $ | 4,304 | | | $ | 4,373 | | | $ | 4,434 | | | $ | 3,945 | | | $ | 21,519 | |
The projections do not include investments related to offshore wind projects. Actual capital expenditures could vary from the projected amounts for the companies and years above.
Acquisition of The Torrington Water Company: On October 3, 2022, Aquarion acquired The Torrington Water Company (TWC) following the receipt of all required approvals. The acquisition was structured as a stock-for-stock exchange, and Eversource issued 925,264 treasury shares at closing for a purchase price of $72.1 million. TWC provides regulated water service to approximately 10,100 customers in Connecticut.
Offshore Wind Business: OurEversource’s offshore wind business includes a 50 percent ownership interestinterests in North East Offshore,wind partnerships, which holds PPAs and contracts forcollectively hold the Revolution Wind, South Fork Wind and Sunrise Wind projects, as well as an undeveloped offshore lease area. Ourand a tax equity investment in South Fork Wind. The offshore wind projects are being developed and constructed through a joint and equal partnershippartnerships with Ørsted.
The offshore leases include a 257 square-mile ocean lease off the coasts of Massachusetts and Rhode Island and a separate, adjacent 300-square-mile ocean lease located approximately 25 miles south of the coast of Massachusetts. In aggregate, these ocean lease sites jointly-owned by Eversource and Ørsted could eventually develop at least 4,000 MW of clean, renewable offshore wind energy.
As of December 31, 20222023 and 2021,2022, Eversource's total equity investment balance in its offshore wind business was $515.5 million and $1.95 billion, and $1.21 billion, respectively. This equity investment includes capital expenditures for the three projects, as well as capitalized costs related to future development, acquisition costs of offshore lease areas, and capitalized interest.
Strategic ReviewExpected Sales of Offshore Wind Investments: On May 4, 2022, we25, 2023, Eversource announced that weit had initiatedcompleted a strategic review of ourits offshore wind investments and determined that it would pursue the sale of its offshore wind investments. On September 7, 2023, Eversource completed the sale of its 50 percent interest in an uncommitted lease area consisting of approximately 175,000 developable acres located 25 miles off the south coast of Massachusetts to Ørsted for $625 million in an all-cash transaction.
In September of 2023, Eversource made a contribution of $528 million using the proceeds from the lease area sale to invest in a tax equity interest for South Fork Wind. South Fork Wind was restructured as a tax equity investment, portfolio.with Eversource purchasing 100 percent ownership of a new Class A tax equity membership interest. As a result of this investment, Eversource expects to receive investment tax credits after the turbines are placed in service for South Fork Wind and meet the requirements to qualify for the ITC. These credits will be utilized to reduce Eversource’s federal tax liability or generate tax refunds over the next 24 months. All of South Fork Wind’s twelve turbines are expected to be installed and placed into service by the end of March 2024.
On January 24, 2024, Ørsted signed an agreement with Eversource to acquire Eversource’s 50 percent share of Sunrise Wind. The sale is subject to the successful selection of Sunrise Wind in the ongoing New York fourth solicitation for offshore wind capacity, signing of an OREC contract with NYSERDA, finalization of sale agreements, receipt of final federal construction permits, and relevant regulatory approvals. If Sunrise Wind is not successful in the solicitation, then the existing OREC contract for Sunrise Wind will be cancelled according to the state’s requirements, and Eversource and Ørsted’s joint venture for Sunrise Wind will remain in place. In that scenario, Ørsted and Eversource would then assess their options in determining the best path forward for Sunrise Wind and its assets, which include the BOEM offshore lease area. If Sunrise Wind’s revised bid is successful in the new solicitation, Sunrise Wind would have 90 days to negotiate a new OREC agreement at the re-bid price. In a successful re-bid, Ørsted would become the sole owner of Sunrise Wind, while Eversource would remain contracted to lead the project’s onshore construction. If Sunrise Wind is successful in the re-bid, Ørsted would pay Eversource 50 percent of the negotiated purchase price upon closing the sale transaction, with the remaining 50 percent paid when onshore construction is completed and certain other milestones are achieved. On January 25, 2024, Eversource and Ørsted submitted a new proposal for Sunrise Wind in the New York fourth offshore wind solicitation.
On February 13, 2024, Eversource announced that it has executed an agreement to sell its existing 50 percent interests in the South Fork Wind and Revolution Wind projects to Global Infrastructure Partners (GIP). As part of this transaction, Eversource expects to receive approximately $1.1 billion of cash proceeds upon closing, which includes the sales value related to the 10 percent energy community ITC adder of approximately $170 million related to Revolution Wind, and to exit these projects while retaining certain cost sharing obligations for the construction of Revolution Wind. The purchase price is subject to future post-closing adjustment payments based on, among other things, the progress, timing and expense of construction at each project. The cost sharing obligations provide that review, we are exploring strategic alternativesEversource would share equally with GIP in GIP’s funding obligations for up to approximately $240 million of incremental capital expenditure overruns incurred during the construction phase for the Revolution Wind project, after which GIP’s obligations for any additional capital expenditure overruns would be shared equally by Eversource and Ørsted. Additionally, Eversource’s financial exposure will be adjusted by certain purchase price adjustments to be made following commercial operation of the Revolution Wind project and closing of South Fork as a result of final project economics, which includes Eversource’s obligation to maintain GIP’s internal rate of return for each project as specified in the agreement. Eversource currently expects that South Fork Wind will reach full commercial operation prior to closing of the sale with GIP and Eversource does not expect any material cost sharing or other purchase price adjustment payments for South Fork Wind.
Factors that could result in Eversource’s total net proceeds from the transaction to be lower or higher include Revolution Wind’s eligibility for federal investment tax credits at other than the anticipated 40 percent level; the ultimate cost of construction and extent of cost overruns for Revolution Wind; delays in constructing Revolution Wind, which would impact the economics associated with the purchase price adjustment; and a potentialbenefit due to Eversource if there are lower operation costs or higher availability of the projects through the period that is four years following the commercial operation date of the Revolution Wind project.
Closing a transaction with GIP would be subject to customary conditions, including certain regulatory approvals under the Hart Scott Rodino Act and by the New York Public Service Commission and the FERC, as well as other conditions, among which is the completion and execution of the partnership agreements between GIP and Ørsted that will govern GIP’s new ownership interest in those projects following Eversource’s divestiture. Closing of the transaction is currently expected to occur in mid-2024. If closing of the sale is delayed, additional capital contributions made by Eversource would be recovered in the sales price. Under the agreement, Eversource’s existing credit support obligations are expected to roll off for each project around the time that each project completes its expected capital spend.
Impairment: Equity method investments are assessed for impairment when conditions exist as of the balance sheet date that indicate that the fair value of the investment may be less than book value. Eversource continually monitors and evaluates its equity method investments to determine if there are indicators of an other-than-temporary impairment. If the decline in value is considered to be other-than-temporary, the investment is written down to its estimated fair value, which establishes a new cost basis in the investment. Subsequent declines or recoveries after the reporting date are not considered in the impairment recognized. Investments that are other-than-temporarily impaired and written down to their estimated fair value cannot subsequently be written back up for increases in estimated fair value. Impairment evaluations involve a significant degree of judgment and estimation, including identifying circumstances that indicate an impairment may exist at the equity method investment level, selecting discount rates used to determine fair values, and developing an estimate of discounted future cash flows expected from investment operations or the sale of all, or part, of our 50 percent interest in ourthe investment.
In connection with the process to divest its offshore wind partnership with Ørsted.business, Eversource identified indicators for impairment in both the second and fourth quarters of 2023. In late July, we started preliminaryeach impairment assessment, Eversource evaluated its investments and targeted outreach to interested parties. We continue to work with interested parties through this ongoing processdetermined that the carrying value of the equity method offshore wind investments exceeded the fair value of the investments and expect to complete thisthat the decline in fair value was other-than-temporary. The completion of the strategic review in the second quarter of 2023 resulted in Eversource recording a pre-tax other-than-temporary impairment charge of $401 million ($331 million after-tax) to reflect the investment at estimated fair value based on the expected sales price at that time. This established a new cost basis in the investments. Negative developments in the fourth quarter of 2023, including a lower expected sales price, additional projected construction cost increases, and the October 2023 OREC pricing denial for Sunrise Wind, resulted in Eversource conducting an impairment evaluation and recognizing an additional pre-tax other-than-temporary impairment charge of $1.77 billion ($1.62 billion after-tax) and establishing a new cost basis in the investments as of December 31, 2023. IfThe Eversource statement of income reflects a total pre-tax other-than-temporary impairment charge of $2.17 billion ($1.95 billion after-tax) in its offshore wind investments for the recommended path forward followingyear ended 2023.
The impairment evaluations involved judgments in developing the strategic review is a saleestimates and timing of all, or part,the future cash flows arising from the expected sales price of ourEversource’s 50 percent interest in the partnership, we expect potential proceedswind projects, including expected sales value from investment tax credit adder amounts, less estimated costs to sell, and uncertainties related to the Sunrise Wind re-bid process in New York’s offshore wind solicitation. Additional assumptions in the fourth quarter assessment included revised projected construction costs and estimated project cost overruns, estimated termination costs, salvage values of Sunrise Wind assets, and the value of the tax equity ownership interest. The assumptions used in the discounted cash flow analyses are subject to inherent uncertainties and subjectivity. The use of different assumptions, estimates, or judgments with respect to the estimation of future cash flows could materially change the impairment charges. The impairment evaluations were based on best information available at the impairment assessment dates. New information from events or circumstances arising after the balance sheet date, such transactionas the January 25, 2024 re-bid of Sunrise Wind in the New York solicitation, are not included in the December 31, 2023 impairment evaluation. All significant inputs into the impairment evaluations were Level 3 fair value measurements.
The expected cash flows arising from the anticipated sales are a significant input in the impairment evaluation. In the fourth quarter of 2023, project construction forecasts were updated, and these new forecasts reflected additional expenditures for construction and scheduling related pressures, including the availability and increased cost of installation vessels and supply chain cost increases related to foundation fabrication. In determining the current fair value of the investments, these updated projections exceeded the previously estimated projections for construction expenditures, which resulted in a revised sales price that was significantly lower than the previous bid value. Another significant assumption in the impairment evaluation includes the probability of payment of future cost overruns on the three wind projects through each project's respective commercial operation date, which would likelynot be used to support our regulated investmentsrecovered in strengthening, modernizing and decarbonizing our regulated energy and water delivery systems. We currently believe that the fair market valueexpected sales price. This assumption was based on construction projections updated in the fourth quarter of 2023 exceeding prior estimates. An increase in expected cost overruns could result in a significant impairment in a future period.
Another key assumption in the impairment model of our offshore wind investments was investment tax credit (“ITC”) adders that were included in the Inflation Reduction Act and were a separate part of the sales price value offered by GIP. An ITC adder is greater thanan additional 10 percent of credit value for ITC eligible costs and include two distinct qualifications related to either using domestic sourced materials (domestic content) or construction of an onshore substation in a designated community (energy community). Similar to the carrying value; however, therebase ITC of 30 percent of the eligible costs, any ITC adders generated would be used to reduce an owner’s federal tax liability and could be changes in market conditionsused to receive tax refunds from prior years as well. Management believes there is a high likelihood that the 10 percent energy community ITC adder is realizable, and that ITC adder would impact our abilityamount to sell this investment or realize aapproximately $170 million of additional sales value in excess of our carrying value. As the strategic review proceeds, we remain committedrelated to continue providing oversight of the siting and construction of onshore elements of our South Fork Wind, Revolution Wind and that it would qualify for the ITC adder after it reaches commercial operation in 2025. Although management believes the ITC adder value is realizable, there is some uncertainty at this time as to whether or not those ITC adders can be achieved, and management continues to evaluate the project’s qualifications and to monitor guidance issued by the United States Treasury Department. A change in the expected value or qualification of ITC adders could result in a significant impairment in a future period.
Another fourth quarter 2023 development included in the impairment evaluation is the key judgment regarding the probability of future cash inflows and outflows associated with the sale or abandonment of the Sunrise Wind project and the expected outcome of the New York fourth offshore wind solicitation in 2024. In June 2023, Sunrise Wind filed a petition with the New York State Public Service Commission for an order authorizing NYSERDA to amend the Sunrise Wind OREC contract to increase the contract price to cover increased costs and inflation. At that time, management expected the contract repricing would be successful given NYSERDA’s public support for pricing adjustments. On October 12, 2023, the New York State Public Service Commission denied this petition. Subsequent to the denial, on November 30, 2023, the general terms of an expedited offshore wind renewable energy solicitation in New York were released. A primary condition for Sunrise Wind to participate in this new solicitation was to agree to terminate its existing OREC agreement. As of December 31, 2023, Eversource and Ørsted were considering whether to submit a new bid for Sunrise Wind, the price at which a new bid would be made, and the probability of success in the new bidding process. The December 31, 2023 impairment evaluation included management’s judgment of the likelihood of possible future scenarios that included the Sunrise Wind project continuing with its existing OREC contract, the project re-bidding and being selected in the new solicitation, the project re-bidding and not being selected, or the project not moving forward. The unfavorable development of the October 2023 denial of the OREC pricing petition, management’s assessment of the likelihood of success in the competitive New York re-bidding process, and the increased costs to build the project, have resulted in management’s assumption that the Sunrise Wind project will ultimately be abandoned, and therefore, no sales value was modeled in the impairment evaluation. Additionally, in the abandonment assumption, management has assumed the loss of contingent sales value associated with any related ITC adders and has estimated future cash outflows for Eversource’s share of cancellation costs required under Sunrise Wind’s supplier contracts, partially offset by expected salvage value and expected cost overruns not incurred in the case of abandonment that are included in the fourth quarter 2023 impairment charge. An increase in expected cancellation costs could result in a significant impairment in a future period.
A summary of the significant estimates and assumptions included in the 2023 impairment charges is as follows:
| | | | | | | | | | | | | | | | | | | | |
| | Second Quarter 2023 | | Fourth Quarter 2023 | | Total |
| (Millions of Dollars) | | | |
| Lower expected sales proceeds across all three wind projects | | $ | 401 | | | $ | 525 | | | $ | 926 | |
| Expected cost overruns not recovered in the sales price | | — | | | 441 | | | 441 | |
| Loss of sales value from the sale price offered by GIP, including loss of ITC adders value, cancellation costs and other impacts assuming Sunrise Wind project is abandoned | | — | | | 800 | | | 800 | |
| Impairment Charges, pre-tax | | 401 | | | 1,766 | | | 2,167 | |
| Tax Benefit | | (70) | | | (144) | | | (214) | |
| Impairment Charges, after-tax | | $ | 331 | | | $ | 1,622 | | | 1,953 | |
A summary of the carrying value by investee and by project as of December 31, 2023 is as follows:
| | | | | | | | | | | | | | | | | | | | | | | | | | | | | |
| Investments Expected to be Disposed of | | Investment to be Held | | |
| North East Offshore | | South Fork Class B Member, LLC | | South Fork Wind Holdings, LLC Class A | | Total Offshore Wind Investments |
| (Millions of Dollars) | Sunrise Wind | | Revolution Wind | | | |
Carrying Value as of December 31, 2023, before
Impairment Charge | $ | 699 | | | $ | 799 | | | $ | 299 | | | $ | 485 | | | $ | 2,282 | |
| Fourth Quarter 2023 Impairment Charge | (1,218) | | | (544) | | | — | | | (4) | | | (1,766) | |
| Carrying Value as of December 31, 2023 | $ | (519) | | | $ | 255 | | | $ | 299 | | | $ | 481 | | | $ | 516 | |
Management will continue to monitor and evaluate all facts and circumstances in the offshore wind sales process and the impact on its investment balance. Adverse changes in facts and circumstances of estimates and timing of future cash flows and the factors described above could result in the recognition of additional, significant impairment charges that could be material to the financial statements.
The impairment charge was a non-cash charge and did not impact Eversource’s cash position. Eversource will continue to make future cash expenditures for required cash contributions to its offshore wind investments up to the time of disposition of each of the offshore wind projects. Capital contributions are expected until the sales are completed and changes in the timing and amounts of these contributions would be adjusted in the sales prices and therefore not result in an additional impairment charge. Proceeds from the transactions will be used to pay off parent company debt. Eversource’s offshore wind investments do not meet the criteria to qualify for presentation as a discontinued operation.
Contracts, Permitting and Construction of Offshore Wind Projects: The following table provides a summary of the Eversource and Ørsted major projects with announced contracts:
| | Wind Project | Wind Project | State Servicing | Size (MW) | Term (Years) | Price per MWh | Pricing Terms | Contract Status | Wind Project | State Servicing | Size (MW) | Term (Years) | Price per MWh | Pricing Terms | Contract Status |
| Revolution Wind | Revolution Wind | Rhode Island | 400 | 20 | $98.43 | Fixed price contract; no price escalation | Approved | Revolution Wind | Rhode Island | 400 | 20 | $98.43 | Fixed price contract; no price escalation | Approved |
| Revolution Wind | Revolution Wind | Connecticut | 304 | 20 | $98.43 - $99.50 | Fixed price contracts; no price escalation | Approved | Revolution Wind | Connecticut | 304 | 20 | $98.43 - $99.50 | Fixed price contracts; no price escalation | Approved |
| South Fork Wind | South Fork Wind | New York (LIPA) | 90 | 20 | $160.33 | 2 percent average price escalation | Approved | South Fork Wind | New York (LIPA) | 90 | 20 | $160.33 | 2 percent average price escalation | Approved |
| South Fork Wind | South Fork Wind | New York (LIPA) | 40 | 20 | $86.25 | 2 percent average price escalation | Approved | South Fork Wind | New York (LIPA) | 40 | 20 | $86.25 | 2 percent average price escalation | Approved |
| Sunrise Wind | New York (NYSERDA) | 924 | 25 | $110.37 (1) | Fixed price contract; no price escalation | Approved |
|
(1) Index Offshore Wind Renewable Energy Certificate (OREC) strike price.
Revolution Wind and Sunrise WindThe offshore wind projects are subject torequire receipt of federal, state and local approvals necessary to construct and operate the projects. The federal permitting process is led by BOEM, and state approvals are required from New York, Rhode Island and Massachusetts. South Fork Wind and Revolution Wind have received all required approvals to start construction. Significant delays in the siting and permitting process resulting from the timeline for obtaining approval from BOEM and the state and local agencies could adversely impact the timing of these projects'Sunrise Wind’s' in-service dates.date.
Federal Siting and Permitting Process: The federal siting and permitting process for each of our offshore wind projects commence with the filing of a Construction and Operations Plan (COP) application with BOEM. The first major milestone in the BOEM review process is an issuance of a Notice of Intent (NOI) to complete an Environmental Impact Statement (EIS). BOEM then provides a final review schedule for the project’s COP approval. BOEMapproval and conducts environmental and technical reviews of the COP. The EISBOEM issues an Environmental Impact Statement (EIS) that assesses the environmental, social, and economic impacts of constructing the project and recommends measures to minimize impacts. The Final EIS will inform BOEM in deciding whether to approve the project or to approve with modifications and BOEM will then issue its Record of Decision. BOEM issues its final approval of the COP following the Record of Decision.
Revolution Wind and Sunrise Wind filed their COP applications with BOEM in March 2020 and September 2020, respectively. For the Revolution Wind project, BOEM released its Draft EIS on September 2, 2022 forand its Final EIS on July 17, 2023. On August 21, 2023, BOEM issued its Record of Decision, which concluded BOEM’s environmental review of the project and identified the recommended configuration. Final approval of the Revolution Wind project andwas received on November 20, 2023. For the Sunrise Wind project, BOEM released its Draft EIS on December 16, 2022 for the Sunrise Wind project.and its Final EIS on December 15, 2023. The Draft EIS analyzes the potential environmental impactsRecord of the project and the alternatives to the project to be evaluated as part of the process. Each of the identified alternative configurationsDecision is expected in the Draft EISs had a similar levelfirst quarter of environmental impacts,2024 and if an alternative configuration was selected, the Revolution Wind project and thefinal approval of Sunrise Wind project would each still meet their respective contractual output requirements. For Revolution Wind, a final EIS is expected in the second quarter of 2023, the Record of Decision in the third quarter of 2023, and final approval is expected in the fourth quarter of 2023. For Sunrise Wind, a final EIS and Record of Decision are expected in the third quarter of 2023, and final approval is expected in the fourth quarter of 2023.2024.
South Fork Wind, Revolution Wind and Sunrise Wind are each designated as a “Covered Project” pursuant to Title 41 of the Fixing America’s Surface Transportation Act (FAST41) and a Major Infrastructure Project under Section 3(e) of Executive Order 13807, which provides greater federal attention on meeting the projects’ permitting timelines.
State and Local Siting and Permitting Process: State permitting applications in Rhode Island for Revolution Wind and in New York for Sunrise Wind were filed in December 2020. On July 8, 2022, the Rhode Island Energy Facilities Siting Board issued a Final Decision and Order approving the Revolution Wind project and granting a license to construct and operate. On September 23, 2022, Sunrise Wind filed a Joint Proposal to the New York State Public Service Commission. Among other things, the Joint Proposal includes proposed mitigation for certain environmental, community and construction impacts associated with constructing the project. The Joint Proposal was signed by the New York Departments of Public Service, Environmental Conservation, Transportation and State as well as the Office of Agriculture and Markets and the Long Island Commercial Fisheries Association.
On November 17, 2022, the New York Public Service Commission approved an order adopting thea Joint Proposal filed by Sunrise Wind and granting a Certificate of Environmental Compatibility and Public Need. On November 18, 2022, Sunrise Wind filed its Phase 1 Environmental Management and Construction Plan (EM&CP) with the New York Public Service Commission, which details the plans on howlimited onshore construction activities subject to state and local jurisdiction. On March 27, 2023, Sunrise Wind filed its EM&CP for Phase 2, which covers the remainder of the project will be constructed in accordance with the conditionscomponents. On June 22, 2023, Sunrise Wind received approval of the Phase 1 EM&CP. On July 13, 2023, the New York State Public Service Commission approved Joint Proposal. Comments from severalSunrise Wind’s notice for authorization to proceed with construction for Phase 1. On December 18, 2023, Sunrise Wind received approval of the reviewing agencies and parties have been received and Sunrise Wind is in the process of reviewing and addressing those comments in the plan. Phase 2 EM&CP.
On November 9, 2022, the Towns of Brookhaven and Suffolk County executed the easements and other real estate rights necessary to construct the Sunrise Wind project. On November 28, 2022, the Town of North Kingstown and the Quonset Development Corporation approved Revolution Wind’s real estate PILOT terms and the personal property PILOT agreement necessary to construct the Revolution Wind project.
Construction Process: South Fork Wind received all required approvals to start construction and the project entered the construction phase in early 2022. OnshoreAll major onshore construction activities, forincluding the project’s underground onshore transmission line and construction of the onshore interconnection facility located in East Hampton, New York are underway.complete. Offshore construction activities began in the fourth quarter of 2022, with constructionand installation of the sea-to-shore conduit system. Other marine construction activities, includingsubsea transmission cable, the project’s monopile foundations and offshore substation was completed in 2023. Installation of the project’s 11-megawatt wind turbines cable installation,continued throughout 2023 and offshore substation,four of South Fork Wind’s twelve turbines were placed into service by January 1, 2024, meeting the project commercial operation date requirements under the power purchase agreement with LIPA. All wind turbines are expected to occur in 2023. Construction-related purchase agreements with third-party contractors be installed
and materials contracts have largely been secured.placed into service by the end of March 2024. South Fork Wind faces several challenges and appeals of New York State and federal agency approvals, however it believeswe believe it is probable itwe will be able to overcome these challenges.
For Revolution Wind, on October 31, 2023, the joint venture made its final investment decision to advance to full onshore and offshore construction and installation, and major construction began in the fourth quarter of 2023 upon receipt of all necessary federal, state and local approvals. For Sunrise Wind, construction is expected to begin in the second half of 2023 once all necessary federal, state and local approvals are received.received and the joint venture has made its final investment decision, informed in part by the outcome of the New York fourth solicitation, then major construction is expected to begin. Sunrise Wind has started limited onshore construction activities.
Projected In-Service Dates: We expect the South Fork Wind project to be in-service by the end of 2023. ForMarch 2024 and the Revolution Wind andproject to be in-service in late 2025. For Sunrise Wind, based on the updated BOEM permit schedule included in each respective NOI outlining when BOEM will complete its review of the COP, we currently expect an in-service datesdate in 2025 for both projects.
Projected Investments: For Revolution Wind and Sunrise Wind, we are preparing our final project designs and advancing the appropriate federal, state, and local siting and permitting processes along with our offshore wind partner, Ørsted. Construction of South Fork Wind is underway. Construction-related purchase agreements with third-party contractors and materials contracts have largely been secured. Subject to advancing our final project designs and federal, state and local permitting processes and construction schedules, we currently expect to make investments in our offshore wind business between $1.9 billion and $2.1 billion in 2023 and expect to make investments for our three projects in total between $1.6 billion and $1.9 billion from 2024 through 2026. These estimates assume that the three projects are completed and are in-service by the end of 2025, as planned. These projected investments could be impacted by the strategic review of our offshore wind investment.
FERC Regulatory Matters
FERC ROE Complaints: Four separate complaints were filed at the FERC by combinations of New England state attorneys general, state regulatory commissions, consumer advocates, consumer groups, municipal parties and other parties (collectively, the Complainants). In each of the first three complaints, filed on October 1, 2011, December 27, 2012, and July 31, 2014, respectively, the Complainants challenged the NETOs' base ROE of 11.14 percent that had been utilized since 2005 and sought an order to reduce it prospectively from the date of the final FERC order and for the separate 15-month complaint periods. In the fourth complaint, filed April 29, 2016, the Complainants challenged the NETOs' base ROE billed of 10.57 percent and the maximum ROE for transmission incentive (incentive cap) of 11.74 percent, asserting that these ROEs were unjust and unreasonable.
The ROE originally billed during the period October 1, 2011 (beginning of the first complaint period) through October 15, 2014 consisted of a base ROE of 11.14 percent and incentives up to 13.1 percent. On October 16, 2014, FERC issued Opinion No. 531-A and set the base ROE at 10.57 percent and the incentive cap at 11.74 percent for the first complaint period. This was also effective for all prospective billings to customers beginning October 16, 2014. This FERC order was vacated on April 14, 2017 by the U.S. Court of Appeals for the D.C. Circuit (the Court).
All amounts associated with the first complaint period have been refunded. Eversource has recorded a reserve of $39.1 million (pre-tax and excluding interest) for the second complaint period as of both December 31, 20222023 and 2021.2022. This reserve represents the difference between the billed rates during the second complaint period and a 10.57 percent base ROE and 11.74 percent incentive cap. The reserve consisted of $21.4 million for CL&P, $14.6 million for NSTAR Electric and $3.1 million for PSNH as of both December 31, 20222023 and 2021.2022.
On October 16, 2018, FERC issued an order on all four complaints describing how it intends to address the issues that were remanded by the Court. FERC proposed a new framework to determine (1) whether an existing ROE is unjust and unreasonable and, if so, (2) how to calculate a replacement ROE. Initial briefs were filed by the NETOs, Complainants and FERC Trial Staff on January 11, 2019 and reply briefs were filed on March 8, 2019. The NETOs' brief was supportive of the overall ROE methodology determined in the October 16, 2018 order provided the FERC does not change the proposed methodology or alter its implementation in a manner that has a material impact on the results.
The FERC order included illustrative calculations for the first complaint using FERC's proposed frameworks with financial data from that complaint. Those illustrative calculations indicated that for the first complaint period, for the NETOs, which FERC concludes are of average financial risk, the preliminary just and reasonable base ROE is 10.41 percent and the preliminary incentive cap on total ROE is 13.08 percent. If the results of the illustrative calculations were included in a final FERC order for each of the complaint periods, then a 10.41 percent base ROE and a 13.08 percent incentive cap would not have a significant impact on our financial statements for all of the complaint periods. These preliminary calculations are not binding and do not represent what we believe to be the most likely outcome of a final FERC order.
On November 21, 2019, FERC issued Opinion No. 569 affecting the two pending transmission ROE complaints against the Midcontinent ISO (MISO) transmission owners, in which FERC adopted a new methodology for determining base ROEs. Various parties sought rehearing. On December 23, 2019, the NETOs filed supplementary materials in the NETOs' four pending cases to respond to this new methodology because of the uncertainty of the applicability to the NETOs' cases. On May 21, 2020, the FERC issued its order in Opinion No. 569-A on the rehearing of the MISO transmission owners' cases, in which FERC again changed its methodology for determining the MISO transmission owners' base ROEs. On November 19, 2020, the FERC issued Opinion No. 569-B denying rehearing of Opinion No. 569-A and reaffirmed the methodology previously adopted in Opinion No. 569-A. The new methodology differs significantly from the methodology proposed by FERC in its October 16, 2018 order to determine the NETOs' base ROEs in its four pending cases. FERC Opinion Nos. 569-A and 569-B were appealed to the Court. On August 9, 2022, the Court issued its decision vacating MISO ROE FERC Opinion Nos. 569, 569-A and 569-B and remanded to FERC to reopen the proceedings. The Court found that FERC’s development of the new return methodology was arbitrary and capricious due to FERC’s failure to offer a reasonable explanation for its decision to reintroduce the risk-premium financial model in its new methodology for calculating a just and reasonable return. At this time, Eversource cannot predict how and when FERC will address the Court’s findings on the remand of the MISO FERC opinions or any potential associated impact on the NETOs’ four pending ROE complaint cases.
Given the significant uncertainty regarding the applicability of the FERC opinions in the MISO transmission owners’ two complaint cases to the NETOs’ pending four complaint cases, Eversource concluded that there is no reasonable basis for a change to the reserve or recognized ROEs for any of the complaint periods at this time. As well, Eversource cannot reasonably estimate a range of loss for any of the four complaint proceedings at this time. Eversource, CL&P, NSTAR Electric and PSNH currently record revenues at the 10.57 percent base ROE and incentive cap at 11.74 percent established in the October 16, 2014 FERC order.
A change of 10 basis points to the base ROE used to establish the reserves would impact Eversource’s after-tax earnings by an average of approximately $3 million for each of the four 15-month complaint periods. Prospectively from the date of a final FERC order implementing a new base ROE, based off of estimated 20222023 rate base, a change of 10 basis points to the base ROE would impact Eversource’s future annual after-tax earnings by approximately $5$5.5 million per year, and will increase slightly over time as we continue to invest in our transmission infrastructure.
FERC Notice of Inquiry on ROE: On March 21, 2019, FERC issued a Notice of Inquiry (NOI) seeking comments from all stakeholders on FERC's policies for evaluating ROEs for electric public utilities, and interstate natural gas and oil pipelines. On June 26, 2019, the NETOs jointly filed comments supporting the methodology established in the FERC’s October 16, 2018 order with minor enhancements going forward. The NETOs jointly filed reply comments in the FERC ROE NOI on July 26, 2019. On May 12, 2020, the NETOs filed supplemental comments in the NOI ROE docket. At this time, Eversource cannot predict how this proceeding will affect its transmission ROEs.
FERC Notice of Inquiry and Proposed Rulemaking on Transmission Incentives: On March 21, 2019, FERC issued an NOI seeking comments on FERC's policies for implementing electric transmission incentives. On June 26, 2019, Eversource filed comments requesting that FERC retain policies that have been effective in encouraging new transmission investment and remain flexible enough to attract investment in new and emerging transmission technologies. Eversource filed reply comments on August 26, 2019. On March 20, 2020, FERC issued a Notice of Proposed Rulemaking (NOPR) on transmission incentives. The NOPR intends to revise FERC’s electric transmission incentive policies to reflect competing uses of transmission due to generation resource mix, technological innovation and shifts in load patterns. FERC proposes to grant transmission incentives based on measurable project economics and reliability benefits to consumers rather than its current project risks and challenges framework. On July 1, 2020, Eversource filed comments generally supporting the NOPR.
On April 15, 2021, FERC issued a Supplemental NOPR that proposes to eliminate the existing 50 basis point return on equity for utilities that have been participating in a regional transmission organization (RTO ROE incentive) for more than three years. On June 25, 2021, the NETOs jointly filed comments strongly opposing FERC’s proposal. On July 26, 2021, the NETOs filed Supplemental NOPR reply comments responding to various parties advocating for the elimination of the RTO Adder. If FERC issues a final order eliminating the RTO ROE incentive as proposed in the Supplemental NOPR, the estimated annual impact (using 20222023 estimated rate base) on Eversource’sEversource's after-tax earnings is approximately $18$19.5 million. The Supplemental NOPR contemplates an effective date 30 days from the final order.
At this time, Eversource cannot predict the ultimate outcome of these proceedings, including possible appellate review, and the resulting impact on its transmission incentives.
Regulatory Developments and Rate Matters
Electric, Natural Gas and Water Utility Retail Tariff Rates: Each Eversource utility subsidiary is subject to the regulatory jurisdiction of the state in which it operates: CL&P, Yankee Gas and Aquarion operate in Connecticut and are subject to PURA regulation; NSTAR Electric, NSTAR Gas, EGMA and Aquarion operate in Massachusetts and are subject to DPU regulation; and PSNH and Aquarion operate in New Hampshire and are subject to NHPUC regulation. The regulated companies' distribution rates are set by their respective state regulatory commissions, and their tariffs include mechanisms for periodically adjusting their rates for the recovery of specific incurred costs.
Base Distribution Rates: In Connecticut, electric, and natural gas and water utilities serving more than seventy-five thousand customers are required to file a distribution rate case within four years of the last rate case. PURA can elect to convene a general rate hearing at an interval of less than four years unless prohibited from doing so by an agency decision or other law. CL&P's and Yankee Gas' base distribution rates were each established in 2018 PURA-approved rate case settlement agreements. On October 27, 2021, PURA approved a settlement agreement atfor CL&P that included a current base distribution rate freeze until no earlier than January 1, 2024. The approval of the settlement agreement satisfiessatisfied the Connecticut statute of rate review requirements that requires electric utilities to file a distribution rate case within four years of the last rate case.
On March 15, 2023, PURA issued a final decision that rejected Aquarion is not required to initiate a rate review with PURA on a set schedule. On August 29, 2022, Aquarion filed anWater Company of Connecticut’s (AWC-CT) application with PURA to amend its existing rate schedulesschedules. AWC-CT filed an appeal on the decision and on May 25, 2023, the State of Connecticut Superior Court granted a final decisionpermanent stay of certain orders affecting base rates, which will keep existing rates in place until the appeal is expected March 15, 2023.completed. For further information, see "Regulatory Developments and Rate Matters - Connecticut," below.
In Massachusetts, electric distribution companies are required to file distribution rate schedules every five years, and natural gas local distribution companies to file distribution rate schedules every 10 years, and those companies are limited to one settlement agreement in any 10-year period. NSTAR Electric's base distribution rates were established in a November 2022 DPU-approved rate case. NSTAR Gas' base distribution rates were established in an October 2020 DPU-approved rate case. EGMA's base distribution rates were established in an October 2020 DPU-approved rate settlement agreement. Aquarion is not required to initiate a rate review with the DPU. Aquarion’s base distribution rates were established in a 2018 DPU-approved rate case.
In New Hampshire, PSNH's base distribution rates were established in a December 2020 NHPUC-approved rate case settlement agreement. Aquarion's base distribution rates were established in a July 2022 NHPUC-approved rate case settlement agreement, with a single step adjustment approved on January 19, 2023. Rates arewere effective March 1, 2023.
Rate Reconciling Mechanisms: The Eversource electric distribution companies obtain and resell power to retail customers who choose not to buy energy from a competitive energy supplier. CL&P, NSTAR Electric and PSNH enter into full requirements energy supply procurement contracts for its customers that choose to purchase power from the electric distribution company (standard offer, basic service or default energy service, respectively). The natural gas distribution companies procure natural gas for firm and seasonal customers. These energy supply and natural gas supply procurement costs are recovered from customers in energy supply rates that are approved by the respective state regulatory commission. The rates are reset periodically (every six months for electric residential customers) and are fully reconciled to their costs. New energy supply rates for residential customers are established effective July 1st at CL&P and NSTAR Electric and effective August 1st at PSNH. Each electric and natural gas distribution company fully recovers its energy supply costs through approved regulatory rate mechanisms on a timely basis and, therefore, such costs have no impact on earnings. Increases or decreases in energy supply retail rates result in corresponding fluctuations in both energy supply procurement revenues and purchased power or purchased natural gas expenses on the statements of income.
The electric and natural gas distribution companies also recover certain other costs in retail rates on a fully reconciling basis through regulatory commission-approved cost tracking mechanisms and, therefore, recovery of these costs has no impact on earnings. Costs recovered through cost tracking mechanisms include, among others, electric retail transmission charges, energy efficiency program costs, electric restructuring and stranded cost recovery revenues (including securitized RRB charges), certain capital tracking mechanisms for infrastructure improvements, and additionally for the Massachusetts utilities, pension and PBOP benefits, net metering for distributed generation, and solar-related programs. The reconciliation filings compare the total actual costs allowed to revenue requirements related to these services and the difference between the costs incurred (or the rate recovery allowed) and the actual costs allowed is deferred and included, to be either recovered or refunded, in future customer rates. These cost tracking mechanisms also include certain incentives earned, return on capital tracking mechanisms, and carrying charges that are billed in rates to customers, which do impact earnings.
Connecticut:
CL&P Performance Based Rate Making: On May 26, 2021, in accordance with an October 2020 Connecticut law, PURA opened a proceeding to begin to evaluate and eventually implement performance based regulation (PBR) for electric distribution companies. PURA is conducting the proceeding in two phases. On January 25, 2023, PURA staff issued a proposal outlining a suggested portfolio of PBR elements for further exploration and potential implementation in the second phase of the proceeding. On April 26, 2023, PURA issued a final decision on the first phase and identified various objectives to guide PBR development and evaluate adoption of a PBR framework. The decision commenced Phase 2 by initiating three reopener dockets focused on revenue adjustment mechanisms, performance metrics and integrated distribution system planning with final decisions expected in 2025.
On November 16, 2023, PURA issued a straw proposal in the first reopener that focused on revenue adjustment mechanisms. The proposal outlines potential additions and reforms to the current revenue adjustment mechanisms, such as multi-year rate plans, earnings sharing mechanisms and the revenue decoupling mechanism, which would apply at the time of CL&P’s next distribution rate case. The straw proposal is not authoritative and technical sessions are continuing prior to a final decision. PURA is expected to issue a straw proposal in the second reopener focusing on performance incentive mechanisms (PIMs) in the first quarter of 2024.The three reopener dockets continue to progress through the Phase 2 process. We continue to monitor developments in this proceeding, and at this time, we cannot predict the ultimate outcome of this proceeding and the resulting impact to CL&P.
CL&P Storm Filing: On December 22, 2023, CL&P initiated a docket seeking a prudency review of approximately $634 million of catastrophic storm costs for twenty-four weather events from January 1, 2018 to December 31, 2021. In the filing, CL&P requested PURA establish a rate to collect $50 million annually from customers from the date of the final decision in this proceeding. This rate would be effective until the next distribution rate case and would replenish the under-collected storm reserve and reduce future carrying charges for customers.
CL&P Advanced Metering Infrastructure Filing: On July 31, 2020, CL&P submitted to PURA its proposed $512 million Advanced Metering Infrastructure investment and implementation plan. On August 17, 2021, PURA issued a Notice of Request for an Amended EDC Advanced Metering Infrastructure Proposal. On November 8, 2021, CL&P submitted an Amended Proposal in response to this request on November 8, 2021 with an updated schedule for the years 2022 through 2028, which included additional information as required by PURA. As required, the plan includes a full deployment of advanced metering functionality and a composite business case in support of the Advanced Metering Infrastructure plan. The procedural schedule includes briefsOn January 3, 2024, PURA issued a final decision regarding CL&P’s Advanced Metering Infrastructure investment and implementation plan, which CL&P most recently estimated at $766.4 million for capital costs and one-time operating expenses. In CL&P’s view, the final decision does not provide a reasonable path for cost recovery and delays implementation by a year. In addition, the final decision modifies the prudence standard for recovery of costs expended on the project, improperly linking recovery to outcomes not known at the outset of the project. On January 18, 2024, CL&P submitted a motion for reconsideration to PURA asking that were filed on April 29, 2022, written comments that were filed July 20, 2022, and a technical session on September 14, 2022.the agency modify these aspects of the decision.
Termination of Park City Wind’s Power Purchase Agreement with CL&P Rate Relief Plan:: On November 28, 2022, Governor Lamont, DEEP, Office of Consumer Counsel,October 2, 2023, Park City Wind LLC and CL&P jointly developedsigned an agreement to terminate the Park City Wind offshore wind generation PPA, at the request of Park City Wind LLC. The termination agreement was effective on October 13, 2023, the date of PURA approval. In October 2023, Park City Wind LLC paid a rate relief plan for electric customers fortermination payment of $12.9 million to CL&P resulting from the winter peak season of January 1, 2023 through April 30, 2023. On December 16, 2022, PURA approved the rate relief plan. As parttermination of the rate relief plan,PPA, which CL&P reduced the Non-Bypassable Federally Mandated Congestion Charge (NBFMCC) rate effective January 1, 2023 to provide customers with an average $10 monthly bill credit from January through April 2023. This rate reduction accelerates thewill return to customers of net revenues generated by long-term state-approved energy contracts with the Millstone and Seabrook nuclear power plants of approximately $90 million. The rate relief plan also included instituting a temporary, flat monthly discount for qualifying low-income hardship customers effective January 1, 2023. This flat-rate credit will continue until a new low-income discount rate that was approved by PURA in an October 19, 2022 decision is implemented in 2024. These aspects of the rate relief plan do not impact CL&P’s earnings but do impact its future cash flows. Also as part of the rate relief plan, CL&P committed to contribute $10 million to an energy assistance program for qualifying hardship customers, which is expected to be distributed as a bill credit to those customers by the end of the first quarter of 2023. CL&P recorded a current liability of $10 million on the balance sheet and a charge to expense on the statement of income for the year ended December 31, 2022 associated with the customer assistance program.customers.
CL&P Performance Based Rate Making: On May 26, 2021, in accordance with an October 2020 Connecticut law, PURA opened a proceeding to begin to evaluate and eventually implement performance based regulation for electric distribution companies. PURA will conduct the proceeding in two phases, with a draft decision on the first phase expected in March 2023 and then a procedural schedule established for the second phase. On January 25, 2023, PURA staff issued a proposal outlining a suggested portfolio of performance based regulation elements for further exploration and implementation in the second phase of the proceeding. At this time, we cannot predict the ultimate outcome of this proceeding and the resulting impact to CL&P.
Aquarion Water Company of Connecticut Distribution Rate Case: On August 29, 2022, Aquarion Water Company of Connecticut (AWC-CT) filed an application with PURA to amend its existing rate schedules to address an operating revenue deficiency. AWC-CT’s rate application requested approval of rate increases of $27.5 million, an additional $13.6 million, and an additional $8.8 million, effective March 15, 2023, 2024, and 2025, respectively. AOn March 15, 2023, PURA issued a final decision fromthat rejected this request. In this decision, PURA is expectedordered a base distribution rate decrease of $2.0 million effective March 15, 2023. The decision allows an authorized regulatory ROE of 8.70 percent. On March 30, 2023, AWC-CT filed an appeal on the decision and requested a stay of the decision with the State of Connecticut Superior Court. On April 5, 2023, the Court temporarily granted AWC-CT’s request to stay and on May 25, 2023 granted a permanent stay of certain orders affecting base rates, which will keep existing rates in place until the appeal is completed. The stay included the condition that AWC-CT place any revenue received from customers above the rates and amounts authorized in the March 15, 2023 decision in a separate, interest bearing account until further order. A hearing on the merits of the appeal was held on January 11, 2024. A decision from the State of Connecticut Superior Court is pending.
Massachusetts:
NSTAR Electric Distribution Rates: As part of an inflation-based mechanism, NSTAR Electric submitted its fourth annual Performance Based
Rate (PBR) Adjustment filing on November 10, 2021 and on December 22, 2021, the DPU approved a $36.8 million increase to base distribution rates effective January 1, 2022.
NSTAR Electric Distribution Rate Case: On November 30, 2022, the DPU issued its decision in the NSTAR Electric distribution rate case and approved a base distribution rate increase of $64 million effective January 1, 2023. The
NSTAR Electric’s PBR mechanism allows for an annual adjustment to base distribution rates for inflation, exogenous events and future capital additions based on a historical five-year average of total capital additions. NSTAR Electric submitted its first annual PBR Adjustment filing on September 15, 2023 and on December 26, 2023, the DPU approved a renewal$104.9 million increase to base distribution rates effective January 1, 2024. The base distribution rate increase was comprised of a $50.6 million inflation-based adjustment and a $54.3 million K-bar adjustment for capital additions based on the difference between the historical five-year average of total capital additions and the base capital revenue requirement.
NSTAR Electric’s Electric Sector Modernization Plan (ESMP) Filing: Massachusetts state law requires the electric distribution companies to file a comprehensive distribution system plan by January 29, 2024, to proactively upgrade the distribution system (and, where applicable, the associated transmission system) to: (i) improve grid reliability, communications and resiliency; (ii) enable increased, timely adoption of renewable energy and distributed energy resources; (iii) promote energy storage and electrification technologies necessary to decarbonize the environment and economy; (iv) prepare for future climate-driven impacts on the transmission and distribution systems; (v) accommodate increased transportation electrification, increased building electrification and other potential future demands on distribution and, where applicable, the transmission system; and (vi) minimize or mitigate impacts on Massachusetts ratepayers, thereby helping the state realize its statewide greenhouse gas emissions limits and sublimits under the law. On January 29, 2024, NSTAR Electric filed its ESMP with the DPU. NSTAR Electric’s plan meets these requirements by providing a comprehensive view of all the investments required to build a safer, more reliable, more resilient electric distribution system taking into account the needs of environmental justice communities. For the five-year period from 2025 through 2029, the proposed incremental capital investment is $608 million and the incremental expense amount is $211 million. The DPU must approve, approve with modification, or reject the ESMP filing within seven months after filing.
Termination of SouthCoast Wind’s Power Purchase Agreements with NSTAR Electric: On August 28, 2023, SouthCoast Wind Energy LLC and NSTAR Electric signed agreements to terminate three SouthCoast Wind offshore wind generation PPAs, at the request of SouthCoast Wind Energy LLC. The termination agreements were effective on September 29, 2023, the date of DPU approval. In October 2023, SouthCoast Wind Energy, LLC paid a termination payment totaling $32.5 million to NSTAR Electric resulting from the termination of the performance-based ratemaking (PBR) plan originally authorized in its previous rate case forPPAs, which NSTAR Electric will return to customers.
Termination of Commonwealth Wind’s Power Purchase Agreement with NSTAR Electric: On July 13, 2023, Commonwealth Wind, LLC and NSTAR Electric signed an agreement to terminate the Commonwealth Wind offshore wind generation PPA, at the request of Commonwealth Wind, LLC. The termination agreement was effective on August 23, 2023, the date of DPU approval. In October 2023, Commonwealth Wind, LLC paid a five-year term, with a corresponding stay out provision. The PBR plan term has the possibilitytermination payment of a five-year extension. The$25.9 million to NSTAR Electric, which NSTAR Electric will return to customers.
NSTAR Gas Distribution Rates: NSTAR Gas’ PBR mechanism allows for an annual adjustment to base distribution rates for inflation and exogenous events. The DPU also allowed for adjustments to the PBR mechanism for the recovery of future capital additions based on a historical five-year average of total capital additions, beginning with the January 1, 2024 PBR adjustment. The decision allows an authorized regulatory ROE of 9.80 percent on a capital structure including 53.2 percent equity.
Among other items, the DPU approved an increase to the annual storm fund contribution collected through base distribution rates from $10 million to $31 million, and allowed for the recovery of storm threshold costs of $1.3 million per storm event subsequent to the eighth storm in a calendar year (six recovered in base rates plus two additional storms). The DPU approved cost recovery of a portion of NSTAR Electric’s outstanding storm costs beginning on January 1, 2023 and January 1, 2024, subject to reconciliation from future prudency reviews. In a subsequent compliance filing, the DPU allowed recovery to commence for outstanding storm costs occurring between 2018 and 2022 and interest in a total of $162.1 million over a five-year period starting January 1, 2023. In addition, NSTAR Electric will begin to recover 2021 exogenous storms and interest in a total of $220.9 million over a five-year period beginning January 1, 2024. The DPU also approved the recovery of historical exogenous property taxes of $30.8 million incurred from 2020 through 2022 over a two-year period and $8.3 million incurred from 2012 through 2015 over a five-year period effective January 1, 2023. NSTAR Electric’s AMI Implementation Plan and a new Advanced Metering Infrastructure tariff (AMIF) reconciling mechanism effective January 1, 2023 were also approved and NSTAR Electric will recover all meter-related capital now through the AMIF as opposed to base distribution rates.
NSTAR Electric Grid Modernization Plan: On October 7, 2022, the DPU issued an order approving continuing investments from the initial 2018 to 2021 Grid Modernization Plan that were included in the 2022 to 2025 Grid Modernization Plan. The DPU established a preauthorized total budget cap of $162.6 million over the four-year plan period for these continuing investments. On November 30, 2022, the DPU issued an order that preauthorized a four-year $43.0 million budget for new grid-facing investments. All of the ongoing and new investments will have targeted cost recovery through NSTAR Electric’s annual grid modernization factor filings.
NSTAR Electric Advanced Metering Infrastructure Plan: On November 30, 2022, the DPU approved NSTAR Electric’s proposed Advanced Metering Infrastructure customer-facing investment and implementation plan (including program operating costs), including a full deployment of advanced metering functionality, for the years 2022 through 2028. The DPU established preauthorized total budget caps of $534.8 million for core AMI investments and corresponding operating costs and $133.1 million for supporting AMI investments and corresponding operating costs over the seven-year plan period. The DPU approved a new AMIF tariff reconciling mechanism effective January 1, 2023 to recover eligible costs associated with both AMI customer-facing investments and implementation costs. Investments above these budget caps can be recovered in a future base distribution rate proceeding.
NSTAR Electric Transmission Support Agreement: On June 17, 2022, FERC approved a transmission support agreement between NSTAR Electric and Park City Wind LLC (PCW). The agreement commits NSTAR Electric to construct certain transmission facilities required to interconnect PCW’s future 800 MW offshore wind generation facility to NSTAR Electric’s transmission system. Of the total estimated $196 million project, NSTAR Electric will finance an estimated $152 million and earn a return on those specific investments over a ten-year period once the facility is in operation based on the authorized return that is in effect at the applicable time for regional transmission service under the ISO-NE Open Access Transmission Tariff. The interconnection transmission facilities are currently expected to be in-service in 2026.
NSTAR Electric CIP Filing: On December 30, 2022, the DPU approved a provisional system planning tariff for the recovery of costs associated with a capital investment project (CIP) proposal submitted by NSTAR Electric for one of six geographic study areas in its service territory in accordance with DPU’s directives. The DPU established a new, provisional framework for planning and funding upgrades to the electric power system to foster development and interconnection of distributed energy facilities. Under the DPU program, NSTAR Electric has filed infrastructure upgrade proposals to be built within a four-year construction timeframe that allocate the costs of interconnection upgrades between the interconnecting distributed generation facility and distribution customers. Payments made by the distributed generation facility will be applied against the total capital investment made by NSTAR Electric and NSTAR Electric will earn a return on the net investment. The amount allocated to distribution customers will be recovered through a reconciling mechanism, the Provisional System Planning Tariff. The DPU approved the first of these provisional system planning projects, the Marion-Fairhaven group study area, which will enable 141 MW of distributed energy to be interconnected at a total estimated cost of $119.7 million. Of the total $119.7 million, $65.8 million will be allocated to distribution customers, once the enabled distributed energy facilities capacity is fully subscribed by distributed energy facilities interconnecting customers. Additionally, NSTAR Electric will proceed with construction of $54 million of transmission upgrades necessary to improve local reliability and integrate distribution energy resources in the Marion-Fairhaven area and recover the amount through local transmission rates.
NSTAR Electric Electric Vehicles Program: On December 30, 2022, NSTAR Electric received DPU approval for a new Phase 2 electric vehicle (EV) charging infrastructure program (including operating costs) totaling $188 million over a four-year period, which includes make-ready costs and other EV expenditures to support the deployment of charging ports and provides incentives for charging infrastructure installed at commercial and residential sites in Massachusetts. NSTAR Electric will recover the cost of this program through an Electric Vehicle Program tariff.
NSTAR Gas Distribution Rates: As part of an inflation-based mechanism, NSTAR Gas submitted its secondthird annual Performance Based RatePBR Adjustment filing on September 15, 20222023 and on October 31, 2022,30, 2023, the DPU approved a $21.7$25.4 million increase to base distribution rates, of which, $15.5 million was associated with a base rate adjustment and the remainder for a prior period exogenous cost adjustment, for effect on November 1, 2022. The increase is inclusive of a $4.5 million permanent increase related to exogenous property taxes and a $5.4 million increase related to an October 6, 2021 mitigation plan filing that delayed recovery of a portion of a base distribution rate increase originally scheduled to take effect November 1, 2021. The DPU also approved the recovery of historical exogenous property taxes incurred from November 1, 2020 through October 31, 2022 of $8.2 million over a two-year period through a separate reconciling mechanism effective November 1, 2022.
EGMA Distribution Rates: As established in an October 7, 2020 EGMA Rate Settlement Agreement approved by the DPU, on September 16, 2022 EGMA filed for its second base distribution rate increase and on October 31, 2022, the DPU approved a $6.7 million increase to base distribution rates and a $3.3 million increase to the Tax Act Credit Factor for effect on November 1, 2022. The DPU also approved the recovery of historical exogenous property taxes incurred from November 1, 2020 through October 31, 2022 of $8.6 million over a two-year period through a separate reconciling mechanism effective November 1, 2022. EGMA will request recovery of incremental property taxes incurred after October 31, 2022 in future exogenous filings.2023.
New Hampshire:
PSNH Distribution Rates: In connection with an October 9, 2020 settlement agreement, PSNH was permitted three step increases to reflect qualifying plant additions in calendar years 2019, 2020 and 2021. The first two step adjustments had effective dates of January 1, 2021 and August 1, 2021, respectively. On October 20, 2022, the NHPUC approved the third step adjustment for 2021 plant in service to recover a revenue requirement of $8.9 million, with rates effective November 1, 2022. The total approved revenue requirement increase is being collected over the remainder of the rate year (November 1, 2022 – July 31, 2023).
PSNH Pole Acquisition Approval: On November 18, 2022, the NHPUC issued a decision that approved a proposed purchase agreement between PSNH and Consolidated Communications, in which, PSNH would acquire approximately 343,000both jointly-owned utility poles and approximately 3,800 solely-owned poles and pole assets. The NHPUC also authorized PSNH to recover certain expenses associated with the operation and maintenance of the transferred poles, pole inspections, and vegetation management expenses through a new cost recovery mechanism, the Pole Plant Adjustment Mechanism (PPAM),PPAM, subject to consummation of the purchase agreement. On December 16, 2022,The purchase agreement was finalized on May 1, 2023 for a motion for rehearingpurchase price of NHPUC’s approval was filed by an intervenor, which was denied by the NHPUC on February 8, 2023. PSNH cannot predict the timing of$23.3 million. Upon consummation of the proposed purchase agreement.agreement, PSNH established a regulatory asset of $16.9 million for operation and maintenance expenses and vegetation management expenses associated with the purchased poles incurred from February 10, 2021 through April 30, 2023 that PSNH is authorized to collect through the PPAM regulatory tracking mechanism. The establishment of the PPAM regulatory asset resulted in a pre-tax benefit recorded in Amortization expense on the PSNH statement of income in 2023.
PSNH Energy Efficiency Plan:Plan On November 12, 2021, the NHPUC issued an order rejecting the proposed 2021 through 2023 energy efficiency plan and significantly reduced funding and operational functions of the program. The order eliminated the recovery of performance incentives and made other key changes to the energy efficiency plan beginning in 2022. PSNH sought a rehearing of the order and was denied, which resulted in PSNH filing a formal appeal to the New Hampshire Supreme Court.
On February 10, 2022, the NHPUC issued an order that restored the 2022 energy efficiency rate to be consistent with the 2021 rate, which PSNH implemented effective March 1, 2022.: On February 24, 2022, a state legislationlaw was signed into lawenacted that undid the most impactful effects of the November 12, 2021 NHPUC order. The legislation directed that the joint utility energy efficiency plan and programming framework in effect on January 1, 2021 be utilized going forward, including utility performance incentive payments, lost base revenue calculations, and Evaluation, Measurement, and Verification process. Additionally, the legislationlaw established a process for future plan proposals, including the 2024 through 2026 triennial plan, and includes a mechanism for future rate increases based on the consumer price index. As a result of the new legislation passed specific to this order, PSNH withdrew its appeal to the New Hampshire Supreme Court. PSNH made the required filing for the remainder of the 2022 through 2023 triennial plan on March 1, 2022, which was approved as filed by the NHPUC on April 29, 2022.
On November 30, 2023, the NHPUC approved a three-year joint utility energy efficiency plan for 2024 through 2026, of which, $158 million is the PSNH program budget over the next three years. Additionally, on December 22, 2023, the NHPUC approved the annual LBR rate for 2024, allowing PSNH to recover approximately $14 million in revenue that would have been collected if not for the implementation of energy efficiency measures.
Legislative and Policy Matters
Massachusetts:Connecticut: On August 11, 2022, Governor Baker signed into law climate-related legislation which, among other things, affirms the state’s commitment to contractJune 29, 2023, Connecticut enacted Public Act No. 23-102 (Substitute Senate Bill No. 7) (the Act) that encompasses 40 sections. The Act prohibits recovery in retail rates of certain costs incurred by utilities, including costs for 5,600 MW of offshore wind by June 30, 2027, modifies the bidding process to encourage more competition among offshore wind developers,consultants and provides incentives to increase the manufacturingoutside counsel for rate cases, membership dues, and assembly of offshore wind components in Massachusetts. The law also provides incentives to encourage the sale and leasing of electric vehicles, promotes energy storage and electrification technologies, directs electric companies to develop grid modernization plans to upgrade distribution and transmission facilities, and initiates a pilot program that would allow up to ten communities in the state to restrict fossil fuel use in new buildings. Additionally, for long-term contracts that are approved by the DPU between developers of offshore wind generation and the contracting electric distribution company, the law provides for an annual remuneration for the distribution company equal to 2.25 percentlobbying. None of the annual payments under the contractrate-setting provisions will result in an immediate change to compensate therates, as all will require some future process, primarily a general distribution company for accepting the financial obligation of the long-term contract.rate proceeding before PURA.
Federal:
On August 16, 2022,
The Act also makes prospective adjustments to the Inflation Reductiontiming and procedures used in the retail rate setting process, including (1) requiring additional procedural steps to be satisfied for proposed settlements of cases; (2) increasing the deadline to issue a final decision on an application from a water company to amend base rates from 200 days to 270 days; (3) authorizing PURA to elect to evaluate if rates should be reduced on an interim basis if a utility earns an ROE that exceeds its authorized ROE by 50 basis points over a rolling 12-month period ending with the two most recent consecutive financial quarters (instead of the current standard of 100 basis points); and (4) authorizing PURA to elect to convene a general rate hearing at an interval of less than four years unless prohibited from doing so by an agency decision or other law. The Act is prospective, not retroactive and therefore, does not change obligations or rate provisions established by settlements implemented prior to the Act.
The Act also prohibits CL&P’s electric system improvements (ESI) capital tracking mechanism from being reauthorized in the next general distribution proceeding. The ESI will therefore remain in place until base distribution rates are adjusted in CL&P’s next general distribution rate proceeding. The Act also excludes storms and other emergencies affecting 70 percent or more of 2022 (IRA) was signed into law. This is a broad package of legislation that includes incentives and support for clean energy resource development. Most notable for Eversource,an electric distribution company’s customers from the investment tax credit (ITC) on offshore wind projects increases from 30 percent to 40 percent if certain requirements for labor and domestic content are met. The act also re-establishes the production tax credit for solar and wind energy projects, gives increased credit for projects in certain communities, and sets2020 law requiring credits for qualifying clean energy generationresidential customers who are without power for 96 or more consecutive hours.
Lastly, the Act was amended by Public Act No. 23-204 (House Bill No. 6941) to require the Governor to designate the chairperson of PURA from among the sitting commissioners by June 30, 2023 and energy storage projects. The tax provisionsevery two years thereafter; and to delete the changes in Section 21 of the IRA provide additional incentives for offshore wind projects and could reduce retail electricity costs for our customers related to those clean energy investments. The IRA includes other tax provisions focused on implementing a 15 percent minimum tax on adjusted financial statement income and a one percent excise tax on corporate share repurchases. The Department of Treasury and the Internal Revenue Service issued limited guidance in the fourth quarter; however, they are expected to issue additional needed guidance with respectAct to the applicationduties and powers of PURA commissioners. Designation of the newly enacted IRA provisions in the future. We will continue to monitor and evaluate impacts on our consolidated financial statements. We currently dochairperson does not expect the alternative minimum tax change to haveconstitute a material impact on our earnings, financial condition or cash flows.renomination for a full commission term, as otherwise provided by law.
Critical Accounting Policies
The preparation of financial statements in conformity with GAAP requires management to make estimates, assumptions and, at times, difficult, subjective or complex judgments. Changes in these estimates, assumptions and judgments, in and of themselves, could materially impact our financial position, results of operations or cash flows. Our management discusses with the Audit Committee of our Board of Trustees significant matters relating to critical accounting policies. Our critical accounting policies are discussed below. See the combined notes to our financial statements for further information concerning the accounting policies, estimates and assumptions used in the preparation of our financial statements.
Regulatory Accounting: Our regulated companies are subject to rate regulation that is based on cost recovery and meets the criteria for application of accounting guidance for rate-regulated operations, which considers the effect of regulation on the timing of the recognition of certain revenues and expenses. The regulated companies' financial statements reflect the effects of the rate-making process. The rates charged to the customers of our regulated companies are designed to collect each company's costs to provide service, plus a return on investment.
We believe that the operations of each of our regulated companies currently satisfy the criteria for application of regulatory accounting. If events or circumstances should change in a future period so that those criteria are no longer satisfied, we would be required to eliminate any associated regulatory assets and liabilities and the impact would be recognized in the statement of income and may result in a material adverse effect on results of operations and financial condition.
The application of accounting guidance for rate-regulated enterprises results in recording regulatory assets and liabilities. Regulatory assets represent the deferral of incurred costs that are probable of future recovery in customer rates. Regulatory assets are amortized as the incurred costs are recovered through customer rates. In some cases, we record regulatory assets before approval for recovery has been received from the applicable regulatory commission. We must use judgment to conclude that costs deferred as regulatory assets are probable of future recovery. We base our conclusion on certain factors, including, but not limited to, regulatory precedent.
Regulatory liabilities represent either revenues received from customers to fund expected costs that have not yet been incurred or probable future refunds to customers. We make judgments regarding the future outcome of regulatory proceedings that involve potential future refund to customers and record liabilities for these loss contingencies when probable and reasonably estimable based upon available information. Regulatory liabilities are recorded at the best estimate, or at a low end of the range of possible loss. The amount recorded may differ from when the uncertainty is resolved. Such differences could have a significant impact on our financial statements.
We continually assess whether the regulatory assets and liabilities continue to meet the criteria for probable future recovery or refund. This assessment includes consideration of recent orders issued by regulatory commissions, the passage of new legislation, historical regulatory treatment for similar costs in each of our jurisdictions, discussions with legal counsel, the status of any appeals of regulatory decisions, and changes in applicable regulatory and political environments. We believe that we will continue to be able to defer and recover prudently incurred costs, including additional storm costs, based on the legal and regulatory framework.
We use judgment when recording regulatory assets and liabilities; however, regulatory commissions can reach different conclusions about the recovery of costs, and those conclusions could have a material impact on our financial statements. The ultimate outcome of regulatory rate proceedings could have a significant effect on our ability to recover costs or earn an adequate return. Established rates are also often subject to subsequent prudency reviews by state regulators, whereby various portions of rates could be adjusted, subject to refund or disallowed. Storm restoration and pre-staging costs are subject to prudency reviews from our regulators. We have approximately $1.4$1.75 billion of deferred storm costs that either have yet to be filed with the applicable regulatory commission, are pending regulatory approval, or are subject to prudency review as of December 31, 2022.2023. Tropical Storm Isaias resulted in deferred storm restoration costs of approximately $235$232 million at CL&P as of December 31, 2022.2023. While it is possible that some amount of the Tropical Storm Isaias costs may be disallowed by PURA, in a future proceeding, any such
amount cannot be estimated at this time. We believe that our storm restoration costs were prudently incurred, meet the criteria for cost recovery and are probable of recovery.
We believe it is probable that each of our regulated companies will recover its respective investments in long-lived assets and the regulatory assets that have been recorded. If we determine that we can no longer apply the accounting guidance applicable to rate-regulated enterprises, or that we cannot conclude it is probable that costs will be recovered from customers in future rates, the applicable costs would be charged to net income in the period in which the determination is made.
Pension, SERP and PBOP: We sponsor Pension, SERP and PBOP Plans to provide retirement benefits to our employees. Plan assets and the benefit obligation are presented on a net basis and we recognize the overfunded or underfunded status of the plans as an asset or liability on the balance sheet. These amounts are remeasured annually using a December 31st measurement date. For each of these plans, several significant assumptions are used to determine the projected benefit obligation, funded status and net periodic benefit expense/income. These assumptions include the expected long-term rate of return on plan assets, discount rate, compensation/progression rate and mortality and retirement assumptions. We evaluate these assumptions annually and adjust them as necessary. Changes in these assumptions could have a material impact on our financial position, results of operations or cash flows.
Expected Long-Term Rate of Return on Plan Assets Assumption: In developing the expected long-term rate of return, we consider historical and expected returns, as well as input from our consultants. Our expected long-term rate of return on assets is based on assumptions regarding target asset allocations and corresponding expected rates of return for each asset class. We routinely review the actual asset allocations and periodically rebalance the investments to the targeted asset allocations. For the year ended December 31, 2022,2023, our expected long-term rate-of-return assumption used to determine our pension and PBOP expense was 8.25 percent for the Eversource Service plansPension and 7 percent for the AquarionPBOP plans. For the forecasted 20232024 pension and PBOP expense, an expected long-term rate of return of 8.25 percent for the Eversource Service plansPension and 7 percent for the AquarionPBOP plans will be used reflecting our target asset allocations.
Discount Rate Assumptions: Payment obligations related to the Pension, SERP and PBOP Plans are discounted at interest rates applicable to the expected timing of each plan's cash flows. The discount rate that was utilized in determining the pension, SERP and PBOP obligations was based on a yield-curve approach. This approach utilizes a population of bonds with an average rating of AA based on bond ratings by Moody's, S&P and Fitch, and uses bonds with above median yields within that population. As of December 31, 2022,2023, the discount rates used to determine the funded status were within a range of 4.9 percent to 5.0 percent for the Pension and SERP Plans, and 5.0 percent to 5.2 percent for the PBOP Plans. As of December 31, 2022, the discount rates used were within a range of 5.1 percent to 5.2 percent for the Pension and SERP Plans, and 5.2 percent for the PBOP Plans. As of December 31, 2021, the discount rates used were within a range of 2.8 percent to 3.0 percent for the Pension and SERP Plans, and within a range of 2.91 percent to 2.92 percent for the PBOP Plans. The increasedecrease in the discount rates used to calculate the funded status resulted in a decreasean increase to the Pension and SERP Plans’ projected benefit obligation of $98.9 million and an increase to the PBOP Plans' projected benefit obligation of $1.48 billion and $180.1$12.0 million respectively, as of December 31, 2022.2023.
The Company uses the spot rate methodology for the service and interest cost components of Pension, SERP and PBOP expense because it provides a relatively precise measurement by matching projected cash flows to the corresponding spot rates on the yield curve. The discount rates used to estimate the 20222023 expense were within a range of 2.24.9 percent to 3.25.3 percent for the Pension and SERP Plans, and within a range of 2.35.1 percent to 3.35.4 percent for the PBOP Plans.
Mortality Assumptions: Assumptions as to mortality of the participants in our Pension, SERP and PBOP Plans are a key estimate in measuring the expected payments a participant may receive over their lifetime and the corresponding plan liability we need to record. The mortality assumption is composed of a base table that represents the current expectation of life expectancy of the population adjusted by an improvement scale that attempts to anticipate future improvements in life expectancy. In 2022,2023, our mortality assumption utilized the Society of Actuaries base mortality tables (Pri-2012), adjusted to reflect Eversource’s own mortality experience, and projected generationally using the MP-2021 improvement scale.
Compensation/Progression Rate Assumptions: This assumption reflects the expected long-term salary growth rate, including consideration of the levels of increases built into collective bargaining agreements, and impacts the estimated benefits that Pension and SERP Plan participants will receive in the future. As of December 31, 20222023 and 2021,2022, the compensation/progression rates used to determine the funded status were within a range of 3.5 percent to 4.0 percent.
Health Care Cost Assumptions: The Eversource Service PBOP Plan is not subject to health care cost trends. As of December 31, 2022,2023, for the Aquarion PBOP Plan, the health care trend rate used to determine the funded status for pre-65 retirees is 76.75 percent, with an ultimate rate of 5 percent in 2031, and for post-65 retirees, the health care trend rate and ultimate rate is 3.5 percent.
Actuarial Gains and Losses: Actuarial gains and losses represent the differences between actuarial assumptions and actual information or updated assumptions. Unamortized actuarial gains or losses arising at the December 31st measurement date are primarily from differences in actual investment performance compared to our expected return and changes in the discount rate assumption. The Eversource Service Pension and PBOP Plans use the corridor approach to determine the amount of gain or loss to amortize into net periodic benefit expense/income. The corridor approach defers all actuarial gains and losses arising at remeasurement and the net unrecognized actuarial gain or loss balance is amortized as a component of expense if, as of the beginning of the year, that net gain or loss exceeds 10 percent of the greater of the market value of the plan’s assets or the projected benefit obligation. The amount of net unrecognized actuarial gain or loss in excess of the 10 percent corridor is amortized to expense over the estimated average future employee service period. For the Eversource Service Pension Plan, the net actuarial gain or loss is amortized as a component of expense over the estimated average future employee service period of seven years. For the Eversource Service PBOP Plan, the net unrecognized actuarial gain or loss was within the 10 percent corridor and therefore there was no amortization to expense during 2022.2023.
An increaseA decrease in the discount rate used to determine our pension funded status would decreaseincrease our projected benefit obligation at December 31st, resulting in a lowerhigher unamortized actuarial loss to be recognized in future years’ pension expense, subject to exceeding the 10 percent corridor. An increaseA decrease in the discount rate at December 31st would also result in an increasea decrease in the interest cost component and a decreasean increase in the service cost component of the subsequent year’s benefit plan expense.
The calculated expected return on plan assets is compared to the actual return or loss on plan assets at the end of each year to determine the investment gains or losses to be immediately reflected in unamortized actuarial gains and losses. An underperformance of our pension plan investment returns relative to the expected returns would increase our pension liability at December 31st, resulting in a higher unamortized actuarial loss to be recognized in future years’ pension expense, subject to exceeding the 10 percent corridor, and a lower expected return on assets component of pension expense in future years’ pension expense.
Net Periodic Benefit Expense/Income: Pension, SERP and PBOP expense/income is determined by our actuaries and consists of service cost and prior service cost/credit, interest cost based on the discounting of the obligations, amortization of actuarial gains and losses, and the expected return on plan assets. For the Pension and SERP Plans, pre-tax net periodic benefit income was $108.4 million and $181.6 million for the yearyears ended December 31, 2023 and 2022, respectively, and there was pre-tax net periodic benefit expense of $23.6 million and $56.9 million for the yearsyear ended December 31, 2021 and 2020, respectively.2021. For the PBOP Plans, pre-tax net periodic benefit income was $57.3 million, $79.8 million $60.5 million and $51.6$60.5 million for the years ended December 31, 2023, 2022 2021 and 2020,2021, respectively.
The change in pension, SERP and PBOP expense/income arising from the annual remeasurement does not fully impact earnings. Our Massachusetts utilities recover qualified pension and PBOP expenses related to their distribution operations through a rate reconciling mechanism that fully tracks the change in net pension and PBOP expenses each year, therefore the change in their pension and PBOP expense does not impact earnings. Our electric transmission companies' rates provide for an annual true-up of estimated to actual costs, which include pension and PBOP expenses, therefore the change in their pension and PBOP expense does not impact earnings. Any differences between the fixed level of PBOP expense included in our formula rate and the PBOP expense calculated in accordance with authoritative accounting guidance is accumulated as a regulatory asset or liability, and is expected, over time, to be recovered from or returned to customers. Additionally, the portion of our pension and PBOP expense that relates to company labor devoted to capital projects is capitalized on the balance sheet instead of being charged to expense.
Forecasted Expense/Income and Expected Contributions: We estimate that net periodic benefit income in 20232024 for the Pension and SERP Plans will be approximately $114$90 million and for the PBOP Plans will be approximately $57$65 million. The changedecrease in pension income from 20222023 to 20232024 is driven primarily by an increasehigher amortization of actuarial loss due to unrecognized actuarial loss arising in 2023, partially offset by the absence in 2024 of a 2023 SERP settlement charge and a decrease in the interest cost component due to a higherlower discount rate and lowerrate. The increase in PBOP income from 2023 to 2024 is driven primarily by favorable expected return on assets due to a lowerhigher asset balance partially offset by lower amortization of actuarial losses due to unrecognized actuarial gains arising in 2022. The change in PBOP income from 2022 to 2023 is driven primarily by an increaseand a decrease in the interest cost component due to a higherlower discount rate and lower expected return on assets due to a lower asset balance.rate. For the PBOP Plans, there is no amortization of actuarial lossesloss in 2023.2024. Pension, SERP and PBOP expense/income for subsequent years will depend on future investment performance, changes in future discount rates and other assumptions, and various other factors related to the populations participating in the plans.
Our policy is to fund the Pension Plans annually in an amount at least equal to the amount that will satisfy all federal funding requirements. We contributed $80.0 million to the Pension Plans in 2022. Based on the current status of the Pension Plans and federal pension funding requirements, there is no minimum funding requirement for our Eversource Service Pension Plan in 20232024 and we do not expect to make pension contributions in 2023.2024. It is our policy to fund the PBOP Plans annually through tax deductible contributions to external trusts. We do not expect to make any contributions to the Eversource Service PBOP Plan in 2023. We contributed $3.1 million to the Aquarion PBOP Plan in 2022. We currently estimate contributing $5.0 million and $2.9 million to the Aquarion Pension and PBOP Plans, respectively in 2023.2024.
Sensitivity Analysis: The following table illustrates the hypothetical effect on reported annual net periodic benefit income as a result of a change in the following assumptions by 50 basis points:
| | Pension Plans (excluding SERP Plans) | | PBOP Plans |
| Decrease in Plan Income | | Increase in Plan Expense | | Decrease in Plan Income |
| Pension Plans (excluding SERP Plans) | | | Pension Plans (excluding SERP Plans) | | PBOP Plans |
| Decrease in Plan Income | | | Decrease in Plan Income |
| (Millions of Dollars) | (Millions of Dollars) | For the Years Ended December 31, | | For the Years Ended December 31, | (Millions of Dollars) | For the Years Ended December 31, | | For the Years Ended December 31, |
| Eversource | Eversource | 2022 | | 2021 | | 2022 | | 2021 | Eversource | 2023 | | 2022 | | 2023 | | 2022 |
| Lower expected long-term rate of return | Lower expected long-term rate of return | $ | 32.5 | | | $ | 26.5 | | | $ | 5.6 | | | $ | 4.8 | |
| Lower discount rate | Lower discount rate | 32.6 | | | 27.0 | | | 1.7 | | | 2.6 | |
| Higher compensation rate | Higher compensation rate | 7.6 | | | 9.9 | | | N/A | | N/A | Higher compensation rate | 8.1 | | | 7.6 | | 7.6 | | | N/A | | N/A |
Goodwill: We recorded goodwill on our balance sheet associated with previous mergers and acquisitions, all of which totaled $4.52$4.53 billion as of December 31, 2022.2023. We have identified our reporting units for purposes of allocating and testing goodwill as Electric Distribution, Electric Transmission, Natural Gas Distribution and Water Distribution. Electric Distribution and Electric Transmission reporting units include carrying values for the respective components of CL&P, NSTAR Electric and PSNH. The Natural Gas Distribution reporting unit includes the carrying values of NSTAR Gas, Yankee Gas and EGMA. The Water Distribution reporting unit includes the Aquarion water utility businesses. As of December 31, 2022,2023, goodwill was allocated to the reporting units as follows: $2.54 billion to Electric Distribution, $577 million to Electric Transmission, $451 million to Natural Gas Distribution and $951$961 million to Water Distribution.
Goodwill recorded and allocated to the Water Distribution reporting unit included $44.8 million in 2022 arising from the acquisition of The Torrington Water Company on October 3, 2022 and $22.2 million arising from the acquisition of NESC on December 1, 2021, which included measurement period increases in 2022 totaling $0.5 million.
We are required to test goodwill balances for impairment at least annually by considering the fair values of the reporting units, which requires us to use estimates and judgments. Additionally, we monitor all relevant events and circumstances during the year to determine if an interim impairment test is required. We have selected October 1st of each year as the annual goodwill impairment test date. Goodwill impairment is deemed to exist if the carrying amount of a reporting unit exceeds its estimated fair value. If goodwill were deemed to be impaired, it would be written down in the current period to the extent of the impairment.
In assessing goodwill for impairment, an entity is permitted to first assess qualitatively whether it is more likely than not that goodwill impairment exists as of the annual impairment test date. A quantitative impairment test is required only if it is concluded that it is more likely than not that a reporting unit’s fair value is less than its carrying amount.
We performed an impairment assessment of goodwill as of October 1, 20222023 for the Electric Distribution, Electric Transmission, Natural Gas Distribution and Water Distribution reporting units. Our qualitative assessment included an evaluation of multiple factors that impact the fair value of the reporting units, including general, macroeconomic and market conditions, and entity-specific assumptions that affect the future cash flows of the reporting units. Key considerations include discount rates, utility sector market performance and merger transaction multiples, the Company's share price and credit ratings, analyst reports, financial performance, cost and risk factors, internal estimates and projections of future cash flows and net income, long-term strategy, the timing and outcome of rate cases, and recent regulatory and legislative proceedings.
The 20222023 goodwill impairment assessment resulted in a conclusion that goodwill is not impaired and no reporting unit is at risk of a goodwill impairment.impaired. We believe that the fair value of the reporting units was substantially in excess of carrying value. Adverse regulatory actions, changes in the regulatory and political environment, or changes in significant assumptions could potentially result in future goodwill impairment indicators.
Long-Lived Assets: Impairment evaluations of long-lived assets, including property, plant and equipment and other assets, involve a significant degree of estimation and judgment, including identifying circumstances that indicate an impairment may exist. An impairment analysis is required when events or changes in circumstances indicate that the carrying value of a long-lived asset may not be recoverable. Indicators of potential impairment include a deteriorating business climate, unfavorable regulatory action, decline in value that is other than temporary in nature, plans to dispose of a long-lived asset significantly before the end of its useful life, and accumulation of costs that are in excess of amounts allowed for recovery. The review of long-lived assets for impairment utilizes significant assumptions about operating strategies and external developments, including assessment of current and projected market conditions that can impact future cash flows. If indicators are present for a long-lived asset or asset group, a comparison of the undiscounted expected future cash flows to the carrying value is performed. No impairments occurred during the year 2022.2023.
Equity Method Investments: Investments in affiliates where we have the ability to exercise significant influence, but not control, over an investee are initially recognized as an equity method investment at cost. Any differences between the cost of an investment and the amount of underlying equity in net assets of an investee are considered basis differences and are determined based upon the estimated fair values of the investee's identifiable assets and liabilities. For our offshore wind equity method investment, basis differences are related to intangible assets for PPAs that will be amortized over the term of the PPAs, and equity method goodwill that is not amortized. Capitalized interest associated with our offshore wind equity method investment is included in the investment balance.
Equity method investments are assessed for impairment when conditions exist as of the balance sheet date that indicate that the fair value of the investment ismay be less than book value. Eversource continually monitors and evaluates its equity method investments to determine if there are indicators of an other-than-temporary impairment. If the decline in value is considered to be other-than-temporary, the investment is written down to its estimated fair value, which establishes a new cost basis in the investment. Subsequent declines or recoveries after the reporting date are not considered in the impairment recognized. Investments that are other-than-temporarily impaired and written down to their estimated fair value cannot subsequently be written back up for increases in estimated fair value. Impairment evaluations involve a significant degree of judgment and estimation, including identifying circumstances that indicate an impairment may exist at the equity method investment level, selecting discount rates used to determine fair values, and developing an estimate of discounted future cash flows expected from investment operations or the sale of the investment. No
In connection with the process to divest its offshore wind business, Eversource identified indicators for impairment in both the second and fourth quarters of 2023. In each impairment assessment, Eversource evaluated its investments and determined that the carrying value of the equity method offshore wind investments exceeded the fair value of the investments and that the decline was other-than-temporary. The impairment evaluations involved judgments in developing the estimate and timing of future cash flows, including key judgments in determining the most likely outcome of the projects, the likelihood of realization of investment tax credit adders, and the likelihood of future spending amounts and cost overruns, as well as potential cancellation costs and salvage values of Sunrise Wind assets. The assumptions used in the discounted cash flow analyses are subject to inherent uncertainties and subjectivity. The use of different assumptions, estimates, or judgments with respect to the estimation of future cash flows could materially change the impairment charges. The impairment evaluations were based on best information available at the impairment assessment date.
Management will continue to monitor and evaluate all facts and circumstances in the offshore wind sales process and the impact on its investment balance. Adverse changes in facts and circumstances of estimates and timing of future cash flows and the factors described above could result in the recognition of additional, significant impairment charges and could be material to the financial statements. See Note 6, “Investments in Unconsolidated Affiliates,” to the financial statements for further information on the impairments occurred during 2022. Eversource continually monitors and evaluates itsto Eversource’s offshore wind equity method investments to determine if there are indicators of an other-than-temporary impairment.carrying value.
Income Taxes: Income tax expense is estimated for each of the jurisdictions in which we operate and is recorded each quarter using an estimated annualized effective tax rate. This process to record income tax expense involves estimating current and deferred income tax expense or benefit and the impact of temporary differences resulting from differing treatment of items for financial reporting and income tax return reporting purposes. Such differences are the result of timing of the deduction for expenses, as well as any impact of permanent differences, or other items that directly impact income tax expense as a result of regulatory activity (flow-through items). The temporary differences and flow-through items result in deferred tax assets and liabilities that are included in the balance sheets.
We also account for uncertainty in income taxes, which applies to all income tax positions previously filed in a tax return and income tax positions expected to be taken in a future tax return that have been reflected on our balance sheets. The determination of whether a tax position meets the recognition threshold under applicable accounting guidance is based on facts and circumstances available to us.
The interpretation of tax laws and associated regulations involves uncertainty since tax authorities may interpret the laws differently. Ultimate resolution or clarification of income tax matters may result in favorable or unfavorable impacts to net income and cash flows, and adjustments to tax-related assets and liabilities could be material.
Significant management judgment is required in determining the provision for income taxes, primarily due to the uncertainty related to tax positions taken, as well as deferred tax assets and liabilities and valuation allowances. We evaluate the probability of realizing deferred tax assets by reviewing a forecast of future taxable income and our intent and ability to implement tax planning strategies, if necessary, to realize deferred tax assets. We also assess negative evidence, such as the expiration of historical operating loss or tax credit carryforwards, that could indicate the
inability to realize the deferred tax assets. Valuation allowances are provided to reduce deferred tax assets to the amount that will more likely than not be realized in future periods. This requires management to make judgments and estimates regarding the amount and timing of the reversal of taxable temporary differences, expected future taxable income, and the impact of tax planning strategies.
Actual income taxes could vary from estimated amounts due to the future impacts of various items, including future changes in income tax laws, not realizing expected tax planning strategy amounts, as well as results of audits and examinations of filed tax returns by taxing authorities.
Accounting for Environmental Reserves: Environmental reserves are accrued when assessments indicate it is probable that a liability has been incurred and an amount can be reasonably estimated. Increases to estimates of environmental liabilities could have an adverse impact on earnings. We estimate these liabilities based on findings through various phases of the assessment, considering the most likely action plan from a variety of available remediation options (ranging from no action required to full site remediation and long-term monitoring), current site information from our site assessments, remediation estimates from third party engineering and remediation contractors, and our prior experience in remediating contaminated sites. If a most likely action plan cannot yet be determined, we estimate the liability based on the low end of a range of possible action plans. A significant portion of our environmental sites and reserve amounts relate to former MGP sites that were operated several decades ago and manufactured natural gas from coal and other processes, which resulted in certain by-products remaining in the environment that may pose a potential risk to human health and the environment, for which we may have potential liability. Estimates are based on the expected remediation plan. Our estimates are subject to revision in future periods based on actual costs or new information from other sources, including the level of contamination at the site, the extent of our responsibility or the extent of remediation required, recently enacted laws and regulations or a change in cost estimates.
Fair Value Measurements: We follow fair value measurement guidance that defines fair value as the price that would be received for the sale of an asset or paid to transfer a liability in an orderly transaction between market participants at the measurement date (an exit price). We have applied this guidance to our Company's derivative contracts that are not elected or designated as "normal purchases” or “normal sales,” to marketable securities held in trusts, and to our investments in our Pension and PBOP Plans. Fair value measurements are also incorporated into the accounting for goodwill, long-lived assets, equity method investments, AROs, and in the valuation of business combinations and asset acquisitions. The fair value measurement guidance was also applied in estimating the fair value of preferred stock, long-term debt and RRBs.
Changes in fair value of our derivative contracts are recorded as Regulatory Assets or Liabilities, as we recover the costs of these contracts in rates charged to customers. These valuations are sensitive to the prices of energy-related products in future years and assumptions made.
We use quoted market prices when available to determine the fair value of financial instruments. When quoted prices in active markets for the same or similar instruments are not available, we value derivative contracts using models that incorporate both observable and unobservable inputs. Significant unobservable inputs utilized in the models include energy-related product prices for future years for long-dated derivative contracts and market volatilities. Discounted cash flow valuations incorporate estimates of premiums or discounts, reflecting risk-adjusted profit that would be required by a market participant to arrive at an exit price, using available historical market transaction information. Valuations of derivative contracts also reflect our estimates of nonperformance risk, including credit risk.
RESULTS OF OPERATIONS – EVERSOURCE ENERGY AND SUBSIDIARIES
The following provides the amounts and variances in operating revenues and expense line items in the statements of income for Eversource for the years ended December 31, 20222023 and 20212022 included in this Annual Report on Form 10-K:
| | For the Years Ended December 31, |
| For the Years Ended December 31, | |
| For the Years Ended December 31, | |
| For the Years Ended December 31, | |
| (Millions of Dollars) | (Millions of Dollars) | 2022 | | 2021 | | Increase | |
| Operating Revenues | Operating Revenues | $ | 12,289.3 | | | $ | 9,863.1 | | | $ | 2,426.2 | | |
| Operating Revenues | |
| Operating Revenues | |
| Operating Expenses: | |
| Operating Expenses: | |
| Operating Expenses: | Operating Expenses: | | | | | | |
| Purchased Power, Purchased Natural Gas and Transmission | Purchased Power, Purchased Natural Gas and Transmission | 5,014.1 | | | 3,372.3 | | | 1,641.8 | | |
| Purchased Power, Purchased Natural Gas and Transmission | |
| Purchased Power, Purchased Natural Gas and Transmission | |
| Operations and Maintenance | |
| Operations and Maintenance | |
| Operations and Maintenance | Operations and Maintenance | 1,865.3 | | | 1,739.7 | | | 125.6 | | |
| Depreciation | Depreciation | 1,194.2 | | | 1,103.0 | | | 91.2 | | |
| Depreciation | |
| Depreciation | |
| Amortization | |
| Amortization | |
| Amortization | Amortization | 448.9 | | | 232.0 | | | 216.9 | | |
| Energy Efficiency Programs | Energy Efficiency Programs | 658.0 | | | 592.8 | | | 65.2 | | |
| Energy Efficiency Programs | |
| Energy Efficiency Programs | |
| Taxes Other Than Income Taxes | |
| Taxes Other Than Income Taxes | |
| Taxes Other Than Income Taxes | Taxes Other Than Income Taxes | 910.6 | | | 830.0 | | | 80.6 | | |
| | Total Operating Expenses | Total Operating Expenses | 10,091.1 | | | 7,869.8 | | | 2,221.3 | | |
| | Total Operating Expenses | |
| | Total Operating Expenses | |
| Operating Income | |
| Operating Income | |
| Operating Income | Operating Income | 2,198.2 | | | 1,993.3 | | | 204.9 | | |
| Interest Expense | Interest Expense | 678.3 | | | 582.4 | | | 95.9 | | |
| Interest Expense | |
| Interest Expense | |
| Impairments of Offshore Wind Investments | |
| Impairments of Offshore Wind Investments | |
| Impairments of Offshore Wind Investments | |
| Other Income, Net | Other Income, Net | 346.1 | | | 161.3 | | | 184.8 | | |
| Income Before Income Tax Expense | 1,866.0 | | | 1,572.2 | | | 293.8 | | |
| Other Income, Net | |
| Other Income, Net | |
| (Loss)/Income Before Income Tax Expense | |
| (Loss)/Income Before Income Tax Expense | |
| (Loss)/Income Before Income Tax Expense | |
| Income Tax Expense | Income Tax Expense | 453.6 | | | 344.2 | | | 109.4 | | |
| Net Income | 1,412.4 | | | 1,228.0 | | | 184.4 | | |
| Income Tax Expense | |
| Income Tax Expense | |
| Net (Loss)/Income | |
| Net (Loss)/Income | |
| Net (Loss)/Income | |
| Net Income Attributable to Noncontrolling Interests | Net Income Attributable to Noncontrolling Interests | 7.5 | | | 7.5 | | | — | | |
| Net Income Attributable to Common Shareholders | $ | 1,404.9 | | | $ | 1,220.5 | | | $ | 184.4 | | |
| Net Income Attributable to Noncontrolling Interests | |
| Net Income Attributable to Noncontrolling Interests | |
| Net (Loss)/Income Attributable to Common Shareholders | |
| Net (Loss)/Income Attributable to Common Shareholders | |
| Net (Loss)/Income Attributable to Common Shareholders | |
Operating Revenues
Sales Volumes: A summary of our retail electric GWh sales volumes, our firm natural gas MMcf sales volumes, and our water MG sales volumes, and percentage changes, is as follows:
| | | | | | | | | | | | | | | | | | | | | | | | | | | | | | | | | | | | | | | | | | | | | | | | | | | | | |
| Electric | | Firm Natural Gas | | Water |
| | Sales Volumes (GWh) | | Percentage
(Decrease)/Increase | | Sales Volumes (MMcf) | | Percentage
Increase | | Sales Volumes (MG) | | Percentage
Increase |
| 2022 | | 2021 | | | 2022 | | 2021 | | | 2022 | | 2021 | |
| Traditional | 7,764 | | | 7,782 | | | (0.2) | % | | — | | | — | | | — | % | | 1,857 | | | 1,256 | | | 47.9 | % |
Decoupled and Special Contracts (1) | 43,493 | | | 43,228 | | | 0.6 | % | | 152,291 | | | 150,145 | | | 1.4 | % | | 23,154 | | | 22,099 | | | 4.8 | % |
| Total Sales Volumes | 51,257 | | | 51,010 | | | 0.5 | % | | 152,291 | | | 150,145 | | | 1.4 | % | | 25,011 | | | 23,355 | | | 7.1 | % |
(1)Special contracts are unique to Yankee Gas natural gas distribution customers who take service under such an arrangement and generally specify the amount of distribution revenue to be paid to Yankee Gas regardless of the customers' usage. | | | | | | | | | | | | | | | | | | | | | | | | | | | | | | | | | | | | | | | | | | | | | | | | | | | | | |
| Electric | | Firm Natural Gas | | Water |
| | Sales Volumes (GWh) | | Percentage
Decrease | | Sales Volumes (MMcf) | | Percentage
Decrease | | Sales Volumes (MG) | | Percentage
Decrease |
| 2023 | | 2022 | | | 2023 | | 2022 | | | 2023 | | 2022 | |
| Traditional | 7,590 | | | 7,764 | | | (2.2) | % | | — | | | — | | | — | % | | 1,488 | | | 1,857 | | | (19.9) | % |
| Decoupled | 41,978 | | | 43,493 | | | (3.5) | % | | 142,328 | | | 152,291 | | | (6.5) | % | | 23,129 | | | 23,154 | | | (0.1) | % |
| Total Sales Volumes | 49,568 | | | 51,257 | | | (3.3) | % | | 142,328 | | | 152,291 | | | (6.5) | % | | 24,617 | | | 25,011 | | | (1.6) | % |
Weather, fluctuations in energy supply costs,rates, conservation measures (including utility-sponsored energy efficiency programs), and economic conditions affect customer energy usage and water consumption. Industrial sales volumes are less sensitive to temperature variations than residential and commercial sales volumes. In our service territories, weather impacts both electric and water sales volumes during the summer and both electric and natural gas sales volumes during the winter; however, natural gas sales volumes are more sensitive to temperature variations than electric sales volumes. Customer heating or cooling usage may not directly correlate with historical levels or with the level of degree-days that occur.
Fluctuations in retail electric sales volumes at PSNH impact earnings ("Traditional" in the table above). For CL&P, NSTAR Electric, NSTAR Gas, EGMA, Yankee Gas, and our Connecticut water distribution business, fluctuations in retail sales volumes do not materially impact earnings due to their respective regulatory commission-approved distribution revenue decoupling mechanisms ("Decoupled" in the table above). These distribution revenues are decoupled from their customer sales volumes, which breaks the relationship between sales volumes and revenues recognized.
Operating Revenues: The variance in Operating Revenues by segment increased in 2022,2023, as compared to 2021,2022, is as follows:
| | | | | |
| (Millions of Dollars) | Increase/(Decrease) |
| Electric Distribution | $ | 1,981.7 (431.8) | |
| Natural Gas Distribution | 426.06.1 | |
| Electric Transmission | 174.1107.2 | |
| Water Distribution | 11.210.0 | |
| Other | 81.5201.1 | |
| Eliminations | (248.3)(271.2) | |
| Total Operating Revenues | $ | 2,426.2 (378.6) | |
Electric and Natural Gas (excluding EGMA) Distribution Revenues:
Base Distribution Revenues:
•Base electric distribution revenues increased $43.4$36.6 million in 2022, as compared to 2021, due primarily to the impact ofa base distribution rate increasesincrease at NSTAR Electric effective January 1, 2022 resulting from its annual Performance Based Rate Adjustment filing and at PSNH effective August 1, 2021 and November 1, 2022.2023.
•Base natural gas distribution revenues (excluding EGMA) increased $21.4$18.5 million in 2022, as compared to 2021, due primarily to base distribution rate increases effective November 1, 2023 and November 1, 2022 at NSTAR Gas and effective November 1, 2021 and November 1, 2022.
Electric distribution revenues2022 at CL&P also increased $93.4 million in 2022, as compared to 2021, due to the absence of a 2021 reserve established to provide bill credits to customers as a result of CL&P’s settlement agreement on October 1, 2021 and a storm performance penalty assessed by PURA. In the 2021 settlement agreement, CL&P agreed to provide a total of $65 million of customer credits, which were distributed based on customer sales over a two-month period from December 1, 2021 to January 31, 2022. Additionally, CL&P recorded a $28.4 million reserve in 2021 for a civil penalty for non-compliance with storm performance standards that was provided as credits to customers on electric bills beginning on September 1, 2021 over a one-year period.EGMA.
Tracked Distribution Revenues: Tracked distribution revenues consist of certain costs that are recovered from customers in retail rates through regulatory commission-approved cost tracking mechanisms and therefore, recovery of these costs has no impact on earnings. Revenues from certain of these cost tracking mechanisms also include certain incentives earned, return on capital tracking mechanisms, and carrying charges that are billed in rates to customers, which do impact earnings. Costs recovered through cost tracking mechanisms include, among others, energy supply and natural gas supply procurement and other energy-related costs, electric retail transmission charges, energy efficiency program costs, electric restructuring and stranded cost recovery revenues (including securitized RRB charges), certain capital tracking mechanisms for infrastructure improvements, and additionally for the Massachusetts utilities, pension and PBOP benefits, net metering for distributed generation, and solar-related programs. Tracked revenues also include wholesale market sales transactions, such as sales of energy and energy-related products into the ISO-NE wholesale electricity market, sales of natural gas to third party marketers, and the sale of RECs to various counterparties.
Customers have the choice to purchase electricity from each Eversource electric utility or from a competitive third party supplier. For customers who have contracted separately with these competitive suppliers, revenue is not recorded for the sale of the electricity commodity, as the utility is acting as an agent on behalf of the third party supplier. For customers that choose to purchase electric generation from CL&P, NSTAR Electric or PSNH, each purchases power on behalf of, and is permitted to recover the related energy supply cost without mark-up from, its customers, and records offsetting amounts in revenues and purchased power and amortization expense related to this energy supply procurement. CL&P, NSTAR Electric and PSNH each remain as the distribution service provider for all customers and charge a regulated rate for distribution delivery service recorded in revenues. Certain eligible natural gas customers may elect to purchase natural gas from each Eversource natural gas utility or may contract separately with a
gas supply operator. Revenue is not recorded for the sale of the natural gas commodity to customers who have contracted separately with these
operators, only the delivery to a customer, as the utility is acting as an agent on behalf of the gas supply operator.
Tracked distribution revenues increased/(decreased) in 2022,2023, as compared to 2021,2022, due primarily to the following:
| | (Millions of Dollars) | (Millions of Dollars) | Electric Distribution | | Natural Gas Distribution | (Millions of Dollars) | Electric Distribution | | Natural Gas Distribution |
| Retail Tariff Tracked Revenues: | Retail Tariff Tracked Revenues: | | | |
| Energy supply procurement | Energy supply procurement | $ | 1,032.9 | | | $ | 144.1 | |
| Energy supply procurement | |
| Energy supply procurement | |
| CL&P FMCC | |
| Retail transmission | Retail transmission | 246.8 | | | — | |
| CL&P FMCC | (87.8) | | | — | |
| Energy efficiency | Energy efficiency | 52.9 | | | (1.4) | |
| Stranded costs | (72.5) | | | — | |
| | Other distribution tracking mechanisms | |
| Other distribution tracking mechanisms | |
| Other distribution tracking mechanisms | Other distribution tracking mechanisms | 49.8 | | | 31.7 | |
| Wholesale Market Sales Revenue | Wholesale Market Sales Revenue | 615.1 | | | 33.3 | |
The increase in energy supply procurement within electric distribution and natural gas distribution in 2022, as compared to 2021, was driven by higher average prices, partially offset by lower average supply-related sales volumes. The decrease in energy supply procurement within natural gas distribution was driven by lower average prices and higherlower average supply-related sales volumes. Fluctuations in retail transmission revenues are driven by the recovery of the costs of our wholesale transmission business, such as those billed by ISO-NE and Local and Regional Network Service charges. For further information, see "Purchased Power, Purchased Natural Gas and Transmission Expense" expense below.
47The decrease in CL&P’s FMCC revenues was driven by a decrease in the retail Non-Bypassable Federally Mandated Congestion Charge (NBFMCC) rate, which reflects the impact of returning net benefits of higher wholesale market sales received in the ISO-NE market for long-term state approved energy contracts at CL&P, which are then credited back to customers through the retail NBFMCC rate. CL&P’s average NBFMCC rate in effect from January 1, 2022 through April 30, 2022 was $0.01423 per kWh and from May 1 through August 31, 2022 was $0.01251 per kWh. As a result of the CL&P RAM proceeding in Docket No. 22-01-03, CL&P reduced the average NBFMCC rate effective September 1, 2022 from $0.01251 per kWh to $0.00000 per kWh. As part of a November 2022 rate relief plan, CL&P further reduced the average NBFMCC rate effective January 1, 2023 to a credit of $0.01524 per kWh. These rate reductions returned to customers the net revenues generated by long-term state-approved energy contracts with the Millstone and Seabrook nuclear power plants. The average NBFMCC rate changed to $0.00000 per kWh effective July 1, 2023. As a result of the 2023 CL&P RAM decision, the average NBFMCC rate changed to $0.00293 per kWh effective September 1, 2023.
The increasedecrease in electric distribution wholesale market sales revenue in 2022, as compared to 2021, was due primarily to higherlower average electricity market prices received for wholesale sales at CL&P, NSTAR Electric and PSNH. ISO-NE average market prices received for CL&P’s wholesale sales increased approximately 90 percentdecreased to an average price of $36.60 per MWh in 2022,2023, as compared to 2021,$82.88 per MWh in 2022, driven primarily by higherlower natural gas prices in New England. The increase was also due to higher wholesale sales volumes at CL&P resulting from the sale of output generated by the Seabrook PPA beginning in the first quarter of 2022. Volumes sold into the market were primarily from the sale of output generated by the Millstone PPA and Seabrook PPA that CL&P entered into in 2019, as required by regulation. CL&P sells the energy purchased from Millstone and Seabrook into the wholesale market and uses the proceeds from the energy sales to offset the contract costs. The net sales or net cost amount is refunded to, or recovered from, customers in the non-bypassable component of the CL&P FMCC rate. The increase in electric distribution wholesale market sales revenues was also driven by higher proceeds from the sale of transmission rights over a one-year period under CL&P’s, NSTAR Electric’s and PSNH’s Hydro-Quebec transmission support agreements. Proceeds from these sales are credited back to customers.
The decrease in CL&P’s FMCC revenues and PSNH’s stranded cost revenues was driven by decreases in the retail rate, which reflect the net benefit of higher wholesale market sales received in the ISO-NE market for long-term state approved energy contracts at CL&P and PSNH, which are then credited back to customers through these retail rates. The decrease in PSNH’s stranded cost revenues was also due to lower stranded costs to be recovered due to higher Regional Greenhouse Gas Initiative (RGGI) proceeds received, which are credited back to customers.
EGMA Natural Gas Distribution Revenues: EGMA total operating revenues at the natural gas distribution segment increased by $193.8 million in 2022, as compared to 2021. Included in the total operating revenues increase was EGMA’s base natural gas distribution revenues increase of $26.3 million in 2022, as compared to 2021, due primarily to base distribution rate increases effective November 1, 2021 and November 1, 2022.
Electric Transmission Revenues: Electric transmission revenues increased $174.1$107.2 million in 2022, as compared to 2021, due primarily to a higher transmission rate base as a result of our continued investment in our transmission infrastructure.
Other Revenues and Eliminations: Other revenues primarily include the revenues of Eversource's service company, most of which are eliminated in consolidation. Eliminations are also primarily related to the Eversource electric transmission revenues that are derived from ISO-NE regional transmission charges to the distribution businesses of CL&P, NSTAR Electric and PSNH that recover the costs of the wholesale transmission business in rates charged to their customers.
Purchased Power, Purchased Natural Gas and Transmission expense includes costs associated with purchasing electricityproviding electric generation service
supply and natural gas on behalf of ourto all customers andwho have not migrated to third party suppliers, the cost of energy purchase contracts entered into as
required by regulation.regulation, and transmission costs. These electric and natural gas supply procurement costs, other energy-related costs, and other energy-related
transmission costs are recovered from customers in rates through commission-approved cost tracking mechanisms, which have no impact on
earnings (tracked costs). The variance in Purchased Power, Purchased Natural Gas and Transmission expense increased in 2022,2023, as compared to 2021,2022, is due primarily to the following:
| | | | | |
| (Millions of Dollars) | IncreaseIncrease/(Decrease) |
Purchased Power CostsEnergy supply procurement costs | $ | 1,217.5495.3 | |
| Other electric distribution costs | (68.7) | |
Natural Gas Costsgas supply costs | 307.7 (113.9) | |
Transmission Costscosts | 277.1 (87.1) | |
| Eliminations | (160.5)(71.5) | |
| Total Purchased Power, Purchased Natural Gas and Transmission | $ | 1,641.8154.1 | |
The increasevariance in purchased power expense at the electric distribution business in 2022, as compared to 2021, was driven primarily by higher energy supply procurement costs resulting from higher average pricesis offset in Operating Revenues (tracked energy supply procurement revenues). The decrease in other electric distributions costs was primarily the result of a decrease in long-term renewable contract costs and higher average supply-related sales volumes, as well aslower net metering costs at NSTAR Electric, partially offset by higher long-term contractual energy-related costs at CL&P that are recovered in the non-bypassable component of the FMCC mechanism, at CL&P, and by higher net metering costs at NSTAR Electric and CL&P.PSNH.
The increase in costsCosts at the natural gas distribution segment in 2022, as comparedrelate to 2021, wassupply procurement costs for retail customers. Total natural gas costs decreased due primarily to higherlower average prices and higherlower average supply-related sales volumes.purchased supply volumes, partially offset by an increase in the retail cost deferral.
The increasedecrease in transmission costs in 2022, as compared to 2021, was primarily the result of an increase resulting froma decrease in the retail transmission cost deferral, which reflects the actual cost of transmission service compared to estimated amounts billed to customers. This wascustomers and a decrease in costs billed by ISO-NE that support regional grid investments. These decreases were partially offset by a decreasean increase in Local Network Service charges, which reflectsreflect the cost of transmission service provided by Eversource over our local transmission network, and a decrease in costs billed by ISO-NE that support regional grid investments.
Operations and Maintenance expense includes tracked costs and costs that are part of base electric, natural gas and water distribution rates with changes impacting earnings (non-tracked costs). The variance in Operations and Maintenance expense increased in 2022,2023, as compared to 2021,2022, is due primarily to the following:
| | | | | |
| (Millions of Dollars) | Increase/(Decrease) |
| Base Electric Distribution (Non-Tracked Costs): | |
| Shared corporate costs (including IT system depreciation at Eversource Service) | $ | 41.4 | |
| Storm costs | 13.3 | |
| Uncollectible expense | 5.1 | |
| General costs (including vendor services in corporate areas, insurance, fees and assessments) | $4.7 | | 26.8 |
Shared corporate costs (including computer software depreciation at Eversource Service) | 25.0 | |
Storm costs | 22.0 | |
Commitment toAbsence in 2023 of energy assistance program as part of CL&P rate relief plan | 10.0 (10.0) | |
| Employee-related expenses, including labor and benefits | (9.2) | |
| Operations-related expenses (including vegetation management, vendor services and vehicles) | 4.4 (7.8) | |
Employee-related expenses, including labor and benefits | (20.5) | |
Absence in 2022 of CL&P charge to fund various customer assistance initiatives associated with the settlement agreement on October 1, 2021 | (10.0) | |
Other non-tracked operations and maintenance | 20.3 | |
| Total Base Electric Distribution (Non-Tracked Costs) | 78.037.5 | |
Tracked Electric Costs (Electric Distribution and Electric Transmission) - Increase due primarily to higher transmission expensesuncollectible expense and higher funding of $35.1 million and increaseNSTAR Electric storm reserve as part of $34.7 million due to higherJanuary 1, 2023 rate change, partially offset by lower pension tracking mechanism at NSTAR Electric | 72.444.7 | |
| Total Electric Distribution and Electric Transmission | 150.482.2 | |
| Natural Gas Distribution: | |
Base (Non-Tracked Costs) - Increase due primarily to higher employee-related expensesuncollectible expense and higher shared corporate costs, partially offset by lower employee-related expenses | 12.66.5 | |
| Tracked Costs | 18.6 (0.1) | |
| Total Natural Gas Distribution | 31.26.4 | |
| Water Distribution | 8.34.8 | |
| Parent and Other Companies and Eliminations: | |
| Eversource Parent and Other Companies - other operations and maintenance | 30.5158.8 | |
| Transaction and Transition Costs | (11.8)(17.8) | |
| Eliminations | (83.0)(204.0) | |
| Total Operations and Maintenance | $ | 125.630.4 | |
Depreciation expense increased in 2022, as compared to 2021, dueprimarily to higher utilitynet plant in service balances.balances, partially offset by a decrease in approved depreciation rates as part of the rate case decision effective January 1, 2023 at NSTAR Electric.
Amortization expense includes the deferral of energy supply, energy-related costs and other costs that are included in certain regulatory commission-approved cost tracking mechanisms. This deferral adjusts expense to match the corresponding revenues compared to the actual costs incurred. Energy supply and energy-relatedThese costs are recovered from customers in rates and have no impact on earnings. Amortization expense also includes the amortization of certain costs as those costs are collected in rates.
Amortization increased in 2022, as compared to 2021,decreased due primarily to the deferral adjustment of energy supply, energy-related and other tracked costs at CL&P (included in the non-bypassable component of the FMCC mechanism), and NSTAR Electric and PSNH, which can fluctuate from period to period based on the timing of costs incurred and related rate changes to recover these costs. The increasedecrease in the CL&P FMCC mechanism at CL&P was driven primarily by the net costsNovember 2022 rate relief plan, which reduced the non-bypassable FMCC rate effective January 1, 2023. The reduction in the CL&P non-bypassable FMCC retail rate decreased the regulatory over-recovery balance and benefitscreated an under-recovery balance as of December 31, 2023, which resulted in a decrease to amortization expense of $802.3 million. The decrease was also driven by the impact of a new regulatory tracking mechanism at PSNH that allows for the recovery of operating expenses associated with poles acquired from Consolidated Communications on May 1, 2023. The establishment of the long-term state approved contracts that Eversource has executed with Millstone and Seabrook, among others. PPAM regulatory asset resulted in a pre-tax benefit of $16.9 million recorded in Amortization expense on the statement of income in 2023.
The increasedecrease was partially offset by a decreasethe amortization of historical exogenous property taxes that were approved for recovery effective January 1, 2023 at NSTAR Electric and effective November 1, 2022 at NSTAR Gas and EGMA, and an unfavorable regulatory adjustment resulting from NSTAR Gas’ GSEP reconciliation filing that resulted in storman increase to amortization expense at CL&P related to the completion of the amortization period of certain storm cost deferred assets.$9.0 million recorded in 2023.
Energy Efficiency Programs expense increased in 2022, as compared to 2021, due primarily to the deferral adjustment whichand the timing of the recovery of energy efficiency costs at NSTAR Gas and EGMA, partially offset by a decrease at NSTAR Electric. The deferral adjustment reflects the actual costs of energy efficiency programs compared to the amounts billed to customers, and the timing of the recovery of energy efficiency costs.customers. The costs for the majority of the state energy policy initiatives and expanded energy efficiency programs are recovered from customers in rates and have no impact on earnings.
Taxes Other Than Income Taxes expense increased in 2022, as compared to 2021, due primarily to an increase inhigher employment-related taxes based on the timing of payroll pay periods, higher property taxes as a result of higher assessments and higher utility plant balances, and higher Connecticut gross earnings taxes.
Interest Expense increased in 2022, as compared to 2021, due primarily to an increase in interest on long-term debt as a result of new debt issuances ($101.3200.3 million), an increase in interest on short-term notes payable ($10.943.8 million), higher amortization of debt discounts and premiums, net ($2.7 million), and an increase in interest expense on regulatory deferrals ($6.7 million), and higher amortization of debt discounts and premiums, net ($3.31.3 million), partially offset by an increase in capitalized AFUDC related to debt funds and other capitalized interest ($20.0 million), lower interest resulting from the 2022 payment of withheld property taxes at NSTAR Electric ($5.063.1 million), and a decrease in RRB interest expense ($1.41.3 million).
Impairments of Offshore Wind Investments relates to impairment charges in the second and fourth quarters of 2023 associated with Eversource’s offshore wind equity method investments resulting from the expected sale of the 50 percent interests in three jointly-owned offshore wind projects. See "Business Development and Capital Expenditures – Offshore Wind Business" included in this Management's Discussion and Analysis of Financial Condition and Results of Operations.
Other Income, Net increased in 2022, as compared to 2021, due primarily to an increase in interest income primarily from regulatory deferrals ($43.7 million) and an increase in capitalized AFUDC related to equity funds ($30.8 million), partially offset by a decrease related to pension, SERP and PBOP non-service income components ($135.486.9 million), an increasea loss on the disposition of land in interest income primarily from regulatory deferrals2023 compared to gains on the sales of property in 2022 ($24.99.0 million), an increase in capitalized AFUDC related to equity funds ($10.0 million), an increasea decrease in equity in earnings related to Eversource’s equity method investments ($8.77.4 million), a gain on the sale of propertyand investment losses in 2022 ($2.5 million) and2023 compared to investment income in 2022 compared to investment losses in 2021 driven by market volatility ($2.16.8 million). Other Income, Net also increased due to a benefit in 2023 from the liquidation of Eversource’s equity method investment in a renewable energy fund in excess of its carrying value, partially offset by a charitable contribution made with a portion of the proceeds from the liquidation in 2023.
Income Tax Expense increased in 2022, as compared to 2021,decreased due primarily to higherlower pre-tax earnings ($61.7449.6 million), higherlower state taxes ($5.9 million), lower share-based payment excess tax benefits ($1.9 million), an increase in return to provision adjustments ($11.23.4 million), a decrease in amortization of EDIT ($20.0 million), an increase in valuation allowances ($8.5 million), and an increase in items that impact our tax rate as a result of regulatory treatment (flow-through items) and permanent differences ($0.27.4 million)., an increase in amortization of EDIT ($2.4 million), and lower return to provision adjustments ($66.7 million), partially offset by lower share-based payment excess tax benefits ($2.6 million), and an increase in reserves ($233.0 million) primarily related to the impairment of Eversource’s offshore wind investment valuation allowance reserve of $224.0 million and $8.8 million relating to an uncertain tax position.
RESULTS OF OPERATIONS –
THE CONNECTICUT LIGHT AND POWER COMPANY
NSTAR ELECTRIC COMPANY AND SUBSIDIARY
PUBLIC SERVICE COMPANY OF NEW HAMPSHIRE AND SUBSIDIARIES
The following provides the amounts and variances in operating revenues and expense line items in the statements of income for CL&P, NSTAR Electric and PSNH for the years ended December 31, 20222023 and 20212022 included in this Annual Report on Form 10-K:
| | | | For the Years Ended December 31, | | For the Years Ended December 31, |
| CL&P | | NSTAR Electric | | PSNH |
| CL&P | | | CL&P | | NSTAR Electric | | PSNH |
| (Millions of Dollars) | (Millions of Dollars) | 2022 | | 2021 | | Increase | | 2022 | | 2021 | | Increase/
(Decrease) | | 2022 | | 2021 | | Increase/
(Decrease) | (Millions of Dollars) | 2023 | | 2022 | | Increase/
(Decrease) | | 2023 | | 2022 | | Increase/
(Decrease) | | 2023 | | 2022 | | Increase/
(Decrease) |
| Operating Revenues | Operating Revenues | $ | 4,817.7 | | | $ | 3,637.4 | | | $ | 1,180.3 | | | $ | 3,583.1 | | | $ | 3,056.4 | | | $ | 526.7 | | | $ | 1,474.8 | | | $ | 1,177.2 | | | $ | 297.6 | |
| Operating Expenses: | Operating Expenses: | | | | | | | | | | | | | | | | | | Operating Expenses: | | | |
| Purchased Power and Transmission | Purchased Power and Transmission | 2,110.3 | | | 1,393.0 | | | 717.3 | | | 1,264.8 | | | 932.5 | | | 332.3 | | | 665.5 | | | 370.3 | | | 295.2 | |
| Operations and Maintenance | Operations and Maintenance | 707.2 | | | 644.2 | | | 63.0 | | | 640.8 | | | 563.2 | | | 77.6 | | | 256.0 | | | 237.7 | | | 18.3 | |
| Depreciation | Depreciation | 355.5 | | | 338.9 | | | 16.6 | | | 362.0 | | | 337.5 | | | 24.5 | | | 128.0 | | | 120.1 | | | 7.9 | |
| Amortization of Regulatory Assets, Net | 335.6 | | | 99.0 | | | 236.6 | | | 83.9 | | | 55.8 | | | 28.1 | | | 42.9 | | | 86.8 | | | (43.9) | |
| Amortization of Regulatory (Liabilities)/Assets, Net | |
| Energy Efficiency Programs | Energy Efficiency Programs | 134.2 | | | 129.6 | | | 4.6 | | | 332.3 | | | 288.6 | | | 43.7 | | | 37.4 | | | 38.7 | | | (1.3) | |
| Taxes Other Than Income Taxes | Taxes Other Than Income Taxes | 384.7 | | | 363.8 | | | 20.9 | | | 246.7 | | | 216.7 | | | 30.0 | | | 95.3 | | | 91.5 | | | 3.8 | |
| Total Operating Expenses | Total Operating Expenses | 4,027.5 | | | 2,968.5 | | | 1,059.0 | | | 2,930.5 | | | 2,394.3 | | | 536.2 | | | 1,225.1 | | | 945.1 | | | 280.0 | |
| Operating Income | Operating Income | 790.2 | | | 668.9 | | | 121.3 | | | 652.6 | | | 662.1 | | | (9.5) | | | 249.7 | | | 232.1 | | | 17.6 | |
| Interest Expense | Interest Expense | 169.4 | | | 166.1 | | | 3.3 | | | 162.9 | | | 146.0 | | | 16.9 | | | 59.5 | | | 57.0 | | | 2.5 | |
| Other Income, Net | Other Income, Net | 83.3 | | | 30.2 | | | 53.1 | | | 142.7 | | | 74.8 | | | 67.9 | | | 32.7 | | | 14.6 | | | 18.1 | |
| Income Before Income Tax Expense | Income Before Income Tax Expense | 704.1 | | | 533.0 | | | 171.1 | | | 632.4 | | | 590.9 | | | 41.5 | | | 222.9 | | | 189.7 | | | 33.2 | |
| Income Tax Expense | Income Tax Expense | 171.2 | | | 131.3 | | | 39.9 | | | 140.0 | | | 114.3 | | | 25.7 | | | 51.3 | | | 39.4 | | | 11.9 | |
| Net Income | Net Income | $ | 532.9 | | | $ | 401.7 | | | $ | 131.2 | | | $ | 492.4 | | | $ | 476.6 | | | $ | 15.8 | | | $ | 171.6 | | | $ | 150.3 | | | $ | 21.3 | |
Operating Revenues
Sales Volumes: A summary of our retail electric GWh sales volumes is as follows:
| | | | For the Years Ended December 31, | | For the Years Ended December 31, |
| | | 2022 | | 2021 | | Increase/(Decrease) | | Percentage
Increase/(Decrease) | | 2023 | | 2022 | | Decrease | | Percentage
Decrease |
| CL&P | CL&P | 20,560 | | | 20,501 | | | 59 | | | 0.3 | % | CL&P | 19,577 | | | 20,560 | | 20,560 | | | (983) | | (983) | | | (4.8) | | (4.8) | % |
| NSTAR Electric | NSTAR Electric | 22,933 | | | 22,727 | | | 206 | | | 0.9 | % | NSTAR Electric | 22,401 | | | 22,933 | | 22,933 | | | (532) | | (532) | | | (2.3) | | (2.3) | % |
| PSNH | PSNH | 7,764 | | | 7,782 | | | (18) | | | (0.2) | % | PSNH | 7,590 | | | 7,764 | | 7,764 | | | (174) | | (174) | | | (2.2) | | (2.2) | % |
Fluctuations in retail electric sales volumes at PSNH impact earnings. For CL&P and NSTAR Electric, fluctuations in retail electric sales volumes do not impact earnings due to their respective regulatory commission-approved distribution revenue decoupling mechanisms.
Operating Revenues: Operating Revenues, which consist of base distribution revenues and tracked revenues further described below, increased $1.18 billiondecreased $238.9 million at CL&P, $526.7$67.6 million at NSTAR Electric, and $297.6$26.9 million at PSNH in 2022,2023, as compared to 2021.2022.
Base Distribution Revenues:
•CL&P's distribution revenues increased $0.4 million.were flat.
•NSTAR Electric's distribution revenues increased $36.9$37.4 million due primarily to the impact of itsa base distribution rate increase effective January 1, 2022 resulting from its annual Performance Based Rate Adjustment filing.2023.
•PSNH's distribution revenues increased $6.1decreased $0.8 million due primarily to the impacta decrease in sales volumes as a result of itsmilder weather in 2023 compared to 2022, partially offset by a base distribution rate increasesincrease effective August 1, 2021 and November 1, 2022.
Electric distribution revenues at CL&P also increased $93.4 million in 2022, as compared to 2021, due to the absence of a 2021 reserve established to provide bill credits to customers as a result of CL&P’s settlement agreement on October 1, 2021 and a storm performance penalty assessed by PURA. In the 2021 settlement agreement, CL&P agreed to provide a total of $65 million of customer credits, which were distributed based on customer sales over a two-month period from December 1, 2021 to January 31, 2022. Additionally, CL&P recorded a $28.4 million reserve in 2021 for a civil penalty for non-compliance with storm performance standards that was provided as credits to customers on electric bills beginning on September 1, 2021 over a one-year period.
Tracked Distribution Revenues: Tracked distribution revenues consist of certain costs that are recovered from customers in retail rates through regulatory
commission-approved cost tracking mechanisms and therefore, recovery of these costs has no impact on earnings. Revenues from certain of these
cost tracking mechanisms also include certain incentives earned, return on capital tracking mechanisms, and carrying charges that are billed in
rates to customers, which do impact earnings. Costs recovered through cost tracking mechanisms include, among others, energy supply
procurement and other energy-related costs, retail transmission charges, energy efficiency program costs, electric restructuring and stranded cost
recovery revenues (including securitized RRB charges), certain capital tracking mechanisms for infrastructure improvements, and additionally for NSTAR Electric, pension and PBOP benefits, net metering for distributed generation, and solar-related programs. Tracked revenues also include wholesale market sales transactions, such as sales of energy and energy-related products into the ISO-NE wholesale electricity market and the sale of RECs to various counterparties.
Customers have the choice to purchase electricity from each Eversource electric utility or from a competitive third party supplier. For customers who have contracted separately with these competitive suppliers, revenue is not recorded for the sale of the electricity commodity, as the utility is acting as an agent on behalf of the third party supplier. For customers that choose to purchase electric generation from CL&P, NSTAR Electric or PSNH, each purchases power on behalf of, and is permitted to recover the related energy supply cost without mark-up from, its customers, and records offsetting amounts in revenues and purchased power and amortization expense related to this energy supply procurement. CL&P, NSTAR Electric and PSNH each remain as the distribution service provider for all customers and charge a regulated rate for distribution delivery service recorded in revenues.
TrackedThe variance in tracked distribution revenues increased/(decreased) in 2022,2023, as compared to 2021,2022, is due primarily to the following:
| | (Millions of Dollars) | (Millions of Dollars) | CL&P | | NSTAR Electric | | PSNH | (Millions of Dollars) | CL&P | | NSTAR Electric | | PSNH |
| Retail Tariff Tracked Revenues: | Retail Tariff Tracked Revenues: | | | | | |
| Energy supply procurement | Energy supply procurement | $ | 559.9 | | | $ | 178.4 | | | $ | 294.6 | |
| Energy supply procurement | |
| Energy supply procurement | |
| CL&P FMCC | |
| Retail transmission | Retail transmission | 110.6 | | | 155.1 | | | (18.9) | |
| CL&P FMCC | (87.8) | | | — | | | — | |
| Energy efficiency | 7.2 | | | 41.9 | | | 3.8 | |
| Stranded costs | 1.1 | | | (14.6) | | | (59.0) | |
| | Other distribution tracking mechanisms | |
| | Other distribution tracking mechanisms | |
| | Other distribution tracking mechanisms | Other distribution tracking mechanisms | 28.2 | | | 22.9 | | | (1.3) | |
| Wholesale Market Sales Revenue | Wholesale Market Sales Revenue | 464.9 | | | 105.8 | | | 44.4 | |
The increase in energy supply procurement at CL&P was driven by higher average prices and higher average supply-related sales volumes. The increase in energy supply procurement at NSTAR Electric was driven by higher average prices, partially offset by lower average supply-related sales volumes. The increasedecrease in energy supply procurement at PSNH was driven by lower average supply-related sales volumes, partially offset by higher average prices. Fluctuations in retail transmission revenues are driven by the recovery of the costs of our wholesale transmission business, such as those billed by ISO-NE and Local and Regional Network Service charges. For further information, see "Purchased Power and Transmission Expense" expense below.
The increasedecrease in CL&P’s FMCC revenues was driven by a decrease in the retail Non-Bypassable Federally Mandated Congestion Charge (NBFMCC) rate, which reflects the impact of returning net benefits of higher wholesale market sales received in the ISO-NE market for long-term state approved energy contracts at CL&P, which are then credited back to customers through the retail NBFMCC rate. CL&P’s average NBFMCC rate in effect from January 1, 2022 through April 30, 2022 was $0.01423 per kWh and from May 1 through August 31, 2022 was $0.01251 per kWh. As a result of the CL&P RAM proceeding in Docket No. 22-01-03, CL&P reduced the average NBFMCC rate effective September 1, 2022 from $0.01251 per kWh to $0.00000 per kWh. As part of a November 2022 rate relief plan, CL&P further reduced the average NBFMCC rate effective January 1, 2023 to a credit of $0.01524 per kWh. These rate reductions returned to customers the net revenues generated by long-term state-approved energy contracts with the Millstone and Seabrook nuclear power plants. The average NBFMCC rate changed to $0.00000 per kWh effective July 1, 2023. As a result of the 2023 CL&P RAM decision, the average NBFMCC rate changed to $0.00293 per kWh effective September 1, 2023.
The decrease in wholesale market sales revenue in 2022, as compared to 2021, was due primarily to higherlower average electricity market prices received for wholesale sales at CL&P, NSTAR Electric and PSNH. ISO-NE average market prices received for CL&P’s wholesale sales increased approximately 90 percentdecreased to an average price of $36.60 per MWh in 2022,2023, as compared to 2021,$82.88 per MWh in 2022, driven primarily by higherlower natural gas prices in New England. The increase at CL&P was also due to higher wholesale sales volumes resulting from the sale of output generated by the Seabrook PPA beginning in the first quarter of 2022. CL&P’s volumes sold into the market were primarily from the sale of output generated by the Millstone PPA and Seabrook PPA that CL&P entered into in 2019, as required by regulation. CL&P sells the energy purchased from Millstone and Seabrook into the wholesale market and uses the proceeds from the energy sales to offset the contract costs. The net sales or net cost amount is refunded to, or recovered from, customers in the non-bypassable component of the CL&P FMCC rate. The increase in wholesale market sales revenues at CL&P, NSTAR Electric and PSNH was also driven by higher proceeds from the sale of transmission rights over a one-year period under Hydro-Quebec transmission support agreements. Proceeds from these sales are credited back to customers.
The decrease in CL&P’s FMCC revenues and PSNH’s stranded cost revenues was driven by decreases in the retail rate, which reflect the net benefit of higher wholesale market sales received in the ISO-NE market for long-term state approved energy contracts at CL&P and PSNH, which are then credited back to customers through these retail rates. The decrease in PSNH’s stranded cost revenues was also due to lower stranded costs to be recovered due to higher Regional Greenhouse Gas Initiative (RGGI) proceeds received, which are credited back to customers.
Transmission Revenues: Transmission revenues increased $61.5$21.9 million at CL&P, $73.5$36.1 million at NSTAR Electric and $39.1$49.2 million at PSNH in 2022, as compared to 2021, due primarily to a higher transmission rate base as a result of our continued investment in our transmission infrastructure.
Eliminations: Eliminations are primarily related to the Eversource electric transmission revenues that are derived from ISO-NE regional transmission charges to the distribution businesses of CL&P, NSTAR Electric and PSNH that recover the costs of the wholesale transmission business in rates charged to their customers. The impact of eliminations decreasedincreased revenues by $60.8$8.6 million at CL&P $78.6and $2.9 million at PSNH and decreased revenues by $18.2 million at NSTAR Electric and $12.9 million at PSNH in 2022, as compared to 2021.Electric.
Purchased Power and Transmissionexpense includes costs associated with purchasing electricity on behalf of CL&P, NSTAR Electric and PSNH'sproviding electric generation service supply to all customers andwho have not migrated to third party suppliers, the cost of energy purchase contracts entered into as required by regulation.regulation, and transmission costs. These energy supply andprocurement, other energy-related costs, and transmission costs are recovered from customers in rates through commission-approved cost tracking mechanisms, which have no impact on earnings (tracked costs). The variance in Purchased Power and Transmission expense increased in 2022,2023, as compared to 2021,2022, is due primarily to the following:
| | (Millions of Dollars) | (Millions of Dollars) | CL&P | | NSTAR Electric | | PSNH | (Millions of Dollars) | CL&P | | NSTAR Electric | | PSNH |
| Purchased Power Costs | $ | 650.6 | | | $ | 255.5 | | | $ | 311.4 | |
| Transmission Costs | 125.1 | | | 155.4 | | | (3.4) | |
| Energy supply procurement costs | |
| Other electric distribution costs | |
| Transmission costs | |
| Eliminations | Eliminations | (58.4) | | | (78.6) | | | (12.8) | |
| Total Purchased Power and Transmission | Total Purchased Power and Transmission | $ | 717.3 | | | $ | 332.3 | | | $ | 295.2 | |
Purchased Power Costs: IncludedThe variance in purchased power costs are the costs associated with providing electric generation service supply to all customers who have not migrated to third party suppliers and the cost of energy purchase contracts, as required by regulation.
•The increase at CL&P was due primarily to higher energy supply procurement costs resulting from higher average prices and higher average supply-related volumes.is offset in Operating Revenues (tracked energy supply procurement revenues). The increase was alsovariance in other electric distribution costs at CL&P is due to higher long-term contractual energy-related costs and higher net metering costs that are recovered in the non-bypassable component of the FMCC mechanism.
•The increasemechanism, at NSTAR Electric wasis due to a decrease in long-term renewable contract costs and lower net metering costs, and at PSNH is due primarily to higher energy supply procurement costs resulting from higher average prices, partially offset by lower supply-related sales volumes. The increase was also due to higher net metering costs.
•The increase at PSNH was due primarily to higher energy supply procurement costs resulting from higher average prices.
Transmission Costs: Included in transmission costs are charges that recover the cost of transporting electricity over high-voltage lines from generation facilities to substations, including costs allocated by ISO-NE to maintain the wholesale electric market.
•The increase in transmission costs at CL&P was due primarily to an increase resulting from the retail transmission cost deferral, which reflects the actual cost of transmission service compared to estimated amounts billed to customers. This was partially offset by a decrease in Local Network Service charges, which reflect the cost of transmission service provided by Eversource over our local transmission network, and an increase resulting from the retail transmission cost deferral, which reflects the actual costs of transmission service compared to estimated amounts billed to customers. These increases were partially offset by a decrease in costs billed by ISO-NE that support regional grid investments.
•The increasedecrease in transmission costs at NSTAR Electric and PSNH was due primarily to an increasea decrease resulting from the retail transmission cost deferral and a decrease in costs billed by ISO-NE. These decreases were partially offset by an increase in Local Network Service charges, and an increase in costs billed by ISO-NE.
•The decrease in transmission costs at PSNH was due primarily to a decrease in costs billed by ISO-NE and a decrease in Local Network Service charges, partially offset by an increase resulting from the retail transmission cost deferral.charges.
Operations and Maintenance expense includes tracked costs and costs that are part of base distribution rates with changes impacting earnings (non-tracked costs). The variance in Operations and Maintenance expense increased in 2022,2023, as compared to 2021,2022, is due primarily to the following:
| | (Millions of Dollars) | (Millions of Dollars) | CL&P | | NSTAR Electric | | PSNH | (Millions of Dollars) | CL&P | | NSTAR Electric | | PSNH |
| Base Electric Distribution (Non-Tracked Costs): | Base Electric Distribution (Non-Tracked Costs): | | | | | | Base Electric Distribution (Non-Tracked Costs): | | | | | |
| Shared corporate costs (including IT system depreciation at Eversource Service) | |
| Storm costs | |
| General costs (including vendor services in corporate areas, insurance, fees and assessments) | General costs (including vendor services in corporate areas, insurance, fees and assessments) | $ | 12.3 | | | $ | 8.8 | | | $ | 5.7 | |
| Shared corporate costs (including computer software depreciation at Eversource Service) | 8.7 | | | 13.2 | | | 3.1 | |
| Storm costs | 9.0 | | | 9.5 | | | 3.5 | |
| Commitment to energy assistance program as part of CL&P rate relief plan | 10.0 | | | — | | | — | |
| Absence in 2023 of energy assistance program as part of CL&P rate relief plan | |
| Employee-related expenses, including labor and benefits | |
| Operations-related expenses (including vegetation management, vendor services and vehicles) | Operations-related expenses (including vegetation management, vendor services and vehicles) | 3.1 | | | 2.2 | | | (0.9) | |
| Absence in 2022 of CL&P charge to fund various customer assistance initiatives associated with the settlement agreement on October 1, 2021 | (10.0) | | | — | | | — | |
| Employee-related expenses, including labor and benefits | (1.5) | | | (11.0) | | | 0.5 | |
| Other non-tracked operations and maintenance | 5.6 | | | 15.8 | | | (1.1) | |
| Uncollectible expense | |
| Total Base Electric Distribution (Non-Tracked Costs) | Total Base Electric Distribution (Non-Tracked Costs) | 37.2 | | | 38.5 | | | 10.8 | |
| Tracked Costs: | | | | | |
| Transmission expenses | 19.4 | | | 7.4 | | | 8.3 | |
| Other tracked operations and maintenance | 6.4 | | | 31.7 | | | (0.8) | |
| Total Tracked Costs | Total Tracked Costs | 25.8 | | | 39.1 | | | 7.5 | |
| Total Operations and Maintenance | Total Operations and Maintenance | $ | 63.0 | | | $ | 77.6 | | | $ | 18.3 | |
Depreciation expense increased in 2022, as compared to 2021, for CL&P, NSTAR Electric and PSNH due to higher net plant in service balances. The increase at NSTAR Electric was partially offset by a decrease in approved depreciation rates as part of the rate case decision effective January 1, 2023.
Amortization of Regulatory (Liabilities)/Assets, Net expense includes the deferral of energy supply, energy-related costs and other costs that are included in certain regulatory-approvedregulatory commission-approved cost tracking mechanisms. This deferral adjusts expense to match the corresponding revenues compared to the actual costs incurred. Energy supply and energy-relatedThese costs are recovered from customers in rates and have no impact on earnings. Amortization expense also includes the amortization of certain costs as those costs are collected in rates. The variance in Amortization of Regulatory (Liabilities)/Assets, Net increased/decreased in 2022, as compared to 2021,is due primarily to the following:
•The increasedecrease at CL&P was due primarily to the deferral adjustment of energy supply, energy-related and other tracked costs that are included in the non-bypassable component of the FMCC mechanism, which can fluctuate from period to period based on the timing of
costs incurred and related rate changes to recover these costs. The increasedecrease in the FMCC mechanism was driven primarily by the net costsCL&P November 2022 rate relief plan, which reduced the non-bypassable FMCC rate effective January 1, 2023. The reduction in the CL&P non-
bypassable FMCC retail rate decreased the regulatory over-recovery balance and benefitscreated an under-recovery balance as of the long-term state approved contracts that CL&P executed with Millstone and Seabrook, among others. The increase was partially offset byDecember 31, 2023, which resulted in a decrease in stormto amortization expense related to the completion of the amortization period of certain storm cost deferred assets.$802.3 million.
•The increasedecrease at NSTAR Electric was due to the deferral adjustment of energy supply, energy-related costs and other tracked costs.costs, partially offset by an increase due to the amortization of historical exogenous property taxes that were approved for recovery effective January 1, 2023 in the November 2022 NSTAR Electric distribution rate case decision.
•The decrease at PSNH was due to the deferral adjustment of energy-related and other tracked costs.costs, as well as the impact of a new regulatory tracking mechanism at PSNH that allows for the recovery of operating expenses associated with poles acquired from Consolidated Communications on May 1, 2023. The establishment of the PPAM regulatory asset resulted in a pre-tax benefit of $16.9 million recorded in Amortization expense on the PSNH statement of income in 2023.
Energy Efficiency Programs expense includes costs of various state energy policy initiatives and expanded energy efficiency programs that are recovered from customers in rates, most of which have no impact on earnings. The variance in Energy Efficiency Programs expense increased/decreased in 2022, as compared to 2021,is due primarily to the following:
•The increasesdecrease at CL&P and NSTAR Electric werewas due to the deferral adjustment, which reflects the actual costs of energy efficiency programs compared to the estimated amounts billed to customers, and the timing of the recovery of energy efficiency costs.
•The decreaseincrease at PSNH was due to the deferral adjustment and the timing of the recovery of energy efficiency costs.
Taxes Other Than Income Taxes - increased in 2022, as compared to 2021,the variance is due primarily to the following:
•The increase at CL&P was related to higher property taxes as a result of a higher utility plant balance and higherConnecticut gross earnings taxes.
•The increases at NSTAR Electrictaxes, higher employment-related taxes based on the timing of payroll pay periods, and PSNH were due to higher property taxes as a result of higher utility plant balances.
•The increase at NSTAR Electric was due to higher property taxes as a result of higher assessments and higher utility plant balances and higher employment-related taxes based on the timing of payroll pay periods.
•The decrease at PSNH was due to lower property taxes as a result of lower assessments accompanied by lower mill rates, partially offset by an increase due to higher employment-related taxes based on the timing of payroll pay periods.
Interest Expense increased in 2022, as compared to 2021,- the variance is due primarily to the following:
•The increase at CL&P was due primarily to an increasehigher interest on long-term debt ($23.2 million) and higher interest on short-term notes payable ($9.5 million), partially offset by a decrease in interest expense on regulatory deferrals ($3.44.6 million), higher interest on long-term debt ($0.8 million), and higher amortization of debt discounts and premiums, net ($0.3 million), partially offset by an increase in capitalized AFUDC related to debt funds ($1.92.9 million), and lower amortization of debt discounts and premiums, net ($0.3 million).
•The increase at NSTAR Electric was due primarily to higher interest on long-term debt ($19.916.0 million), higher interest on short-term notes payable ($10.1 million), and an increase in interest expense on regulatory deferrals ($3.0 million), and higher amortization of debt discounts and premiums, net ($0.58.0 million), partially offset by lower interest resulting from the 2022 payment of withheld property taxes ($5.0 million), and an increase in capitalized AFUDC related to debt funds ($1.76.5 million).
•The increase at PSNH was due primarily to higher interest expense on regulatory deferralslong-term debt ($3.217.4 million), and higher interest on short-term notes payable ($2.1 million), higher interest on long-term debt ($0.65.4 million), partially offset by lower amortization of debt discounts and premiums, net ($1.6 million), a decrease in RRB interest expense ($1.4 million), and an increase in capitalized AFUDC related to debt funds ($0.64.7 million), a decrease in interest expense on regulatory deferrals ($3.7 million), and a decrease in RRB interest expense ($1.3 million).
Other Income, Net increased in 2022, as compared to 2021,- the variance is due primarily to the following:
•The increasedecrease at CL&P was due primarily to an increasea decrease related to pension, SERP and PBOP non-service income components ($49.229.5 million) and an increase in investment losses driven by market volatility ($1.1 million), partially offset by an increase in capitalized AFUDC related to equity funds ($5.96.4 million) and an increase in interest income primarily on regulatory deferrals ($0.6 million), partially offset by investment losses in 2022 compared to investment income in 2021 driven by market volatility ($2.62.5 million).
•The increase at NSTAR Electric was due primarily to an increase in interest income primarily on regulatory deferrals ($29.9 million) and an increase in capitalized AFUDC related to equity funds ($21.1 million), partially offset by a decrease related to pension, SERP and PBOP non-service income components ($45.328.1 million) and investment losses in 2023 compared to investment income in 2022 driven by market volatility ($1.4 million).
•The decrease at PSNH was due primarily to a decrease related to pension, SERP and PBOP non-service income components ($10.6 million) and investment losses in 2023 compared to investment income in 2022 driven by market volatility ($0.9 million), an increase in interest income primarily on regulatory deferrals ($17.3 million),partially offset by an increase in capitalized AFUDC related to equity funds ($4.2 million) and an increase in investment income ($1.1 million).
•The increase at PSNH was due primarily to an increase related to pension, SERP and PBOP non-service income components ($16.5 million), an increase in capitalized AFUDC related to equity funds ($0.92.9 million) and an increase in interest income primarily on regulatory deferrals ($0.72.2 million).
Income Tax Expense increased in 2022, as compared to 2021,- the variance is due primarily to the following:
•The increasedecrease at CL&P was due primarily to higherlower pre-tax earnings ($36.03.0 million), higherlower state taxes ($2.33.0 million), an increase in valuation allowances ($8.0 million), a decrease in amortization of EDIT ($0.61.3 million) and lower share-based payment excess tax benefits ($0.8 million), partially offset by lower return to provision adjustments ($6.3 million) and a decrease in items that impact our tax rate as a result of regulatory treatment (flow-through items) and permanent differences ($1.51.4 million), partially offset by higher return to provision adjustments ($7.3 million), lower share-based payment excess tax benefits ($0.9 million), and an increase in valuation allowances ($0.2 million).
•The increase at NSTAR Electric was due primarily to higher pre-tax earnings ($13.7 million), higher state taxes ($1.6 million), lower share-based payment excess tax benefits ($1.0 million), and a decrease in amortization of EDIT ($14.0 million), an increase in pre-tax earnings ($8.7 million), higher state taxes ($2.8 million), and lower share-based payment excess tax benefits ($0.60.8 million), partially offset by a decrease in items that impact our tax rate as a result of regulatory treatment (flow-through items) and permanent differences ($0.44.1 million).
•The increase at PSNH was due primarily to higher pre-tax earnings ($6.96.7 million), higher state taxes ($3.21.6 million), and a decrease in amortization of EDIT ($2.80.9 million), and an increasepartially offset by a decrease in items that impact our tax rate as a result of regulatory treatment (flow-through items) and permanent differences ($1.31.0 million), partially offset by a decrease inand lower return to provision adjustments ($2.30.5 million).
EARNINGS SUMMARY
CL&P's earnings increased $131.2decreased $14.2 million in 2022,2023, as compared to 2021,2022, due primarily to the absence in 2022 of the October 1, 2021 settlement agreement that resulted inhigher operations and maintenance expense, higher interest expense, higher depreciation expense, lower pension income, a $75 million pre-tax charge tohigher effective tax rate, and higher property and other tax expense. The earnings and a $28.6 million pre-tax charge to earnings for a 2021 storm performance penalty imposed by PURA as a result of CL&P’s preparation for, and response to, Tropical Storm Isaias. The after-tax impact of the settlement agreement and storm performance penalty imposed by PURAdecrease was $86.1 million. Earnings were also favorably impactedpartially offset by higher earnings from its capital tracking mechanism due to increased electric system improvements,improvements.
NSTAR Electric's earnings increased $52.1 million in 2023, as compared to 2022, due primarily to higher revenues as a result of the base distribution rate increase effective January 1, 2023, an increase in transmission earnings driven by a higher transmission rate base, an increase in interest income primarily on regulatory deferrals, and lower pension plan expense.higher AFUDC equity income. The earnings increase was partially offset by higher operations and maintenance expense, driven primarily by a $10 million pre-tax charge to earnings as a result of CL&P’s commitment to contribute to an energy assistance program as part of its 2022 rate relief plan, higher storm costs, higher shared corporate costs resulting from the implementation of new information technology systems and higher insurance reserves, as well as higher depreciation expense and higher property and other tax expense.
NSTAR Electric's earnings increased $15.8 million in 2022, as compared to 2021, due primarily to the base distribution rate increase effective January 1, 2022, an increase in transmission earnings driven by a higher transmission rate base, and an increase in interest income primarily on regulatory deferrals. The earnings increase was partially offset by higher operations and maintenance expense driven primarily by higher shared corporate costs resulting from the implementation of new information technology systems and higher storm costs, as well as higher property tax expense, higher depreciationinterest expense, and higher interestdepreciation expense.
PSNH's earnings increased $21.3$24.1 million in 2022,2023, as compared to 2021,2022, due primarily to an increase in transmission earnings driven by a higher transmission rate base lower pension plan expense, and the base distribution rate increases effective Augustimpact of a new regulatory tracking mechanism at PSNH that allows for the recovery of previously incurred operating expenses associated with poles acquired on May 1, 2021 and November 1, 2022.2023. The earnings increase was partially offset by higher operations and maintenanceinterest expense, driven primarily by higher storm costs and higher shared corporate costs resulting from the implementation of new information technology systems, the absence in 2022 of a favorable impact of a new tracker mechanism at PSNH approved as part of the 2020 rate settlement agreement that was recorded in 2021, and higher depreciation expense.expense, and lower pension income.
LIQUIDITY
Cash Flows: CL&P had cash flows provided by operating activities of $449.6 million in 2023, as compared to $869.6 million in 2022, as compared to $612.9 million in 2021.2022. The increasedecrease in operating cash flows was due primarily to an increase in regulatory over-recoveriesunder-recoveries driven primarily by the timing of collections for the non-bypassable FMCC, the SBC and other regulatory tracking mechanisms, the timing of cash payments made on our accounts payable, the absence in 2022 of pension contributions of $98.9and an $8.9 million made in 2021, an increase in earnings after adjustment for non-cash items primarily due to higher revenues, and a $24.2 million decrease in cost of removal expenditures. In 2023, CL&P increased the flow back to customers of net revenues generated by long-term state-approved energy contracts by providing these credits to customers through the non-bypassable FMCC retail rate. The impactreduction in the non-bypassable FMCC retail rate decreased the regulatory over-recovery balance and created an under-recovery balance as of December 31, 2023, which resulted in a decrease to amortization expense of $802.3 million in 2023, as compared to 2022, and is presented as a cash outflow in Amortization of Regulatory (Liabilities)/Assets on the statement of cash flows. The impacts of regulatory collections are included in both Regulatory Over/Under Recoveries and Amortization of Regulatory (Liabilities)/Assets on the statements of cash flows. These favorableunfavorable impacts were partially offset by a $161.7 million increase in operating cash flows due to income tax refunds received in 2023 compared to income tax payments in 2022, the timing of cash collections on our accounts receivable, a $79.2 million increasethe absence in income tax payments made in 2022, as compared to 2021,2023 of $72.0 million of customer credits distributed in 2022 as a result of the October 2021 settlement agreement and the 2021 storm performance penalty for CL&P’s response to Tropical Storm Isaias, a $32.4 million decrease in cash payments to vendors for storm costs, and the timing of other working capital items.
NSTAR Electric had cash flows provided by operating activities of $713.6 million in 2023, as compared to $771.5 million in 2022, as compared to $700.9 million in 2021.2022. The increasedecrease in operating cash flows was due primarily to an increase in earnings after adjustment for non-cash items primarily due to higher revenues, a decrease in regulatory under-recoveries driven by the timing of collections for regulatory tracking mechanisms a $50.4 million decrease in income tax payments made in 2022, as compared to 2021,including transmission and net metering, the timing of other working capital items, the timing of cash collections on our accounts receivable, an $11.0 million increase in cost of removal expenditures, and a $15.0$7.5 million decreaseincrease in pension contributions made in 2022, as compared to 2021, and the timing of other working capital items.income tax payments made. The impactimpacts of regulatory collections are included in both Regulatory Over/Under Recoveries and Amortization of Regulatory Assets on the statements of cash flows. These favorableunfavorable impacts were partially offset by the absence in 2023 of $76.3 million of payments in 2022 related to withheld property taxes, a $34.0$59.1 million increasedecrease in cash payments to vendors for storm costs, the absence in 2023 of pension contributions of $15.0 million made in 2022, and the timing of cash payments made on our accounts payable.
PSNH had cash flows provided by operating activities of $32.0 million in 2023, as compared to $361.5 million in 2022, as compared to $336.1 million in 2021.2022. The increasedecrease in operating cash flows was due primarily to an increase in regulatory under-recoveries driven by the timing of collections for regulatory tracking mechanisms including energy supply, stranded costs, retail transmission and wholesale transmission, the timing of cash payments made on our accounts payable, and ana $118.2 million increase in earnings after adjustmentcash payments to vendors for non-cash items primarily due to higher revenues.storm costs, and the timing of other working capital items. The impacts of regulatory collections are included in both Regulatory Recoveries and Amortization of Regulatory (Liabilities)/Assets on the statements of cash flows. These favorableunfavorable impacts were partially offset by a $118.2 million increase in operating cash flows due to income tax refunds received in 2023 compared to income tax payments in 2022, and the timing of cash collections on our accounts receivable, a decrease in regulatory over-recoveries driven by the timing of collections for regulatory tracking mechanisms, the timing of other working capital items, a $9.1 million increase in cost of removal expenditures, and a $7.2 million increase in income tax payments made in 2022, as compared to 2021. The impact of regulatory collections are included in both Regulatory Over/Under Recoveries and Amortization of Regulatory Assets on the statements of cash flows.receivable.
For further information on CL&P's, NSTAR Electric's and PSNH's liquidity and capital resources, see "Liquidity" and "Business Development and Capital Expenditures" included in this Management's Discussion and Analysis of Financial Condition and Results of Operations.
Item 7A. Quantitative and Qualitative Disclosures about Market Risk
Market Risk Information
Commodity Price Risk Management: Our regulated companies enter into energy contracts to serve our customers, and the economic impacts of those contracts are passed on to our customers. Accordingly, the regulated companies have no exposure to loss of future earnings or fair values due to these market risk-sensitive instruments. Eversource's Energy Supply Risk Committee, comprised of senior officers, reviews and approves all large-scale energy related transactions entered into by its regulated companies.
Other Risk Management Activities
We have an Enterprise Risk Management (ERM) program for identifying the principal risks of the Company. Our ERM program involves the application of a well-defined, enterprise-wide methodology designed to allow our Risk Committee, comprised of our senior officers of the Company, to identify, categorize, prioritize, and mitigate the principal risks to the Company. The ERM program is integrated with other assurance functions throughout the Company including Compliance, Auditing, and Insurance to ensure appropriate coverage of risks that could impact the Company. In addition to known risks, ERM identifies emerging risks to the Company, through participation in industry groups, discussions with management and in consultation with outside advisers. Our management then analyzes risks to determine materiality, likelihood and impact, and develops mitigation strategies. Management broadly considers our business model, the utility industry, the global economy, climate change, sustainability and the current environment to identify risks. The Finance Committee of the Board of Trustees is responsible for oversight of the Company's ERM program and enterprise-wide risks as well as specific risks associated with insurance, credit, financing, investments, pensions and overall system security including cyber security. The findings of the ERM process are periodically discussed with the Finance Committee of our Board of Trustees, as well as with other Board Committees or the full Board of Trustees, as appropriate, including reporting on how these issues are being measured and managed. However, there can be no assurances that the ERM process will identify or manage every risk or event that could impact our financial position, results of operations or cash flows.
Interest Rate Risk Management: We manageInterest rate risk is associated with changes in interest rates for our outstanding long-term debt. Our interest rate risk exposure in accordance withis significantly reduced as typically all or most of our written policies and procedures by maintaining a mix ofdebt financings have fixed and variable rate long-term debt.interest rates. As of December 31, 2022, approximately 98 percent2023, all of our long-term debt was at a fixed interest rate. The remaining long-term debt is at variable interest rates and is subject to interest rate risk that could result in earnings volatility. Assuming a one percentage point increase in our variable interest rates, annual interest expense would have increased by a pre-tax amount of $3.5 million.
Credit Risk Management: Credit risk relates to the risk of loss that we would incur as a result of non-performance by counterparties pursuant to the terms of our contractual obligations. We serve a wide variety of customers and transact with suppliers that include IPPs, industrial companies, natural gas and electric utilities, oil and natural gas producers, financial institutions, and other energy marketers. Margin accounts exist within this diverse group, and we realize interest receipts and payments related to balances outstanding in these margin accounts. This wide customer and supplier mix generates a need for a variety of contractual structures, products and terms that, in turn, require us to manage the portfolio of market risk inherent in those transactions in a manner consistent with the parameters established by our risk management process.
Our regulated companies are subject to credit risk from certain long-term or high-volume supply contracts with energy marketing companies. Our regulated companies manage the credit risk with these counterparties in accordance with established credit risk practices and monitor contracting risks, including credit risk. As of December 31, 2022,2023, our regulated companies held collateral (letters of credit or cash) of $32$32.0 million from counterparties related to our standard service contracts. As of December 31, 2022,2023, Eversource had $35.7$28.7 million of cash posted with ISO-NE related to energy transactions. For further information on cash collateral deposited and posted with counterparties, see Note 1M, "Summary of Significant Accounting Policies - Supplemental Cash Flow Information," to the financial statements.
If the respective unsecured debt ratings of Eversource or its subsidiaries were reduced to below investment grade by either Moody's, S&P or Fitch, certain of Eversource's contracts would require additional collateral in the form of cash or letters of credit to be provided to counterparties and independent system operators. Eversource would have been and remains able to provide that collateral.
Item 8. Financial Statements and Supplementary Data
| | | | | | | | |
| Eversource | | |
| Management’s Report on Internal Controls Over Financial Reporting | |
| Reports of Independent Registered Public Accounting Firm (PCAOB ID No. 34) | |
| Consolidated Financial Statements | |
| | |
| CL&P | | |
| Management’s Report on Internal Controls Over Financial Reporting | |
| Report of Independent Registered Public Accounting Firm (PCAOB ID No. 34) | |
| Financial Statements | |
| | |
| NSTAR Electric | | |
| Management’s Report on Internal Controls Over Financial Reporting | |
| Report of Independent Registered Public Accounting Firm (PCAOB ID No. 34) | |
| Consolidated Financial Statements | |
| | |
| PSNH | | |
| Management’s Report on Internal Controls Over Financial Reporting | |
| Report of Independent Registered Public Accounting Firm (PCAOB ID No. 34) | |
| Consolidated Financial Statements | |
| | |
Management’s Report on Internal Controls Over Financial Reporting
Eversource Energy
Management is responsible for the preparation, integrity, and fair presentation of the accompanying consolidated financial statements of Eversource Energy and subsidiaries (Eversource or the Company) and of other sections of this annual report. Eversource's internal controls over financial reporting were audited by Deloitte & Touche LLP.
Management is responsible for establishing and maintaining adequate internal controls over financial reporting. The Company's internal control framework and processes have been designed to provide reasonable assurance regarding the reliability of financial reporting and the preparation of financial statements for external purposes in accordance with accounting principles generally accepted in the United States of America. There are inherent limitations of internal controls over financial reporting that could allow material misstatements due to error or fraud to occur and not be prevented or detected on a timely basis by employees during the normal course of business. Additionally, internal controls over financial reporting may become inadequate in the future due to changes in the business environment.
Under the supervision and with the participation of the principal executive officer and principal financial officer, Eversource conducted an evaluation of the effectiveness of internal controls over financial reporting based on criteria established in Internal Control – Integrated Framework (2013) issued by the Committee of Sponsoring Organizations of the Treadway Commission (COSO). Based on this evaluation under the framework in COSO, management concluded that internal controls over financial reporting were effective as of December 31, 2022.2023.
February 15, 202314, 2024
REPORT OF INDEPENDENT REGISTERED PUBLIC ACCOUNTING FIRM
To the Board of Trustees and Shareholders of Eversource Energy:
Opinion on Internal Control over Financial Reporting
We have audited the internal control over financial reporting of Eversource Energy and subsidiaries (the “Company”) as of December 31, 2022,2023, based on criteria established in Internal Control - Integrated Framework (2013) issued by the Committee of Sponsoring Organizations of the Treadway Commission (COSO). In our opinion, the Company maintained, in all material respects, effective internal control over financial reporting as of December 31, 2022,2023, based on criteria established in Internal Control - Integrated Framework (2013) issued by COSO.
We have also audited, in accordance with the standards of the Public Company Accounting Oversight Board (United States) (PCAOB), the consolidated financial statements as of and for the year ended December 31, 2022,2023, of the Company and our report dated February 15, 2023,14, 2024, expressed an unqualified opinion on those financial statements.
Basis for Opinion
The Company’s management is responsible for maintaining effective internal control over financial reporting and for its assessment of the effectiveness of internal control over financial reporting, included in the accompanying Management’s Report on Internal Controls Over Financial Reporting. Our responsibility is to express an opinion on the Company’s internal control over financial reporting based on our audit. We are a public accounting firm registered with the PCAOB and are required to be independent with respect to the Company in accordance with the U.S. federal securities laws and the applicable rules and regulations of the Securities and Exchange Commission and the PCAOB.
We conducted our audit in accordance with the standards of the PCAOB. Those standards require that we plan and perform the audit to obtain reasonable assurance about whether effective internal control over financial reporting was maintained in all material respects. Our audit included obtaining an understanding of internal control over financial reporting, assessing the risk that a material weakness exists, testing and evaluating the design and operating effectiveness of internal control based on the assessed risk, and performing such other procedures as we considered necessary in the circumstances. We believe that our audit provides a reasonable basis for our opinion.
Definition and Limitations of Internal Control over Financial Reporting
A company’s internal control over financial reporting is a process designed to provide reasonable assurance regarding the reliability of financial reporting and the preparation of financial statements for external purposes in accordance with generally accepted accounting principles. A company’s internal control over financial reporting includes those policies and procedures that (1) pertain to the maintenance of records that, in reasonable detail, accurately and fairly reflect the transactions and dispositions of the assets of the company; (2) provide reasonable assurance that transactions are recorded as necessary to permit preparation of financial statements in accordance with generally accepted accounting principles, and that receipts and expenditures of the company are being made only in accordance with authorizations of management and directors of the company; and (3) provide reasonable assurance regarding prevention or timely detection of unauthorized acquisition, use, or disposition of the company’s assets that could have a material effect on the financial statements.
Because of its inherent limitations, internal control over financial reporting may not prevent or detect misstatements. Also, projections of any evaluation of effectiveness to future periods are subject to the risk that controls may become inadequate because of changes in conditions, or that the degree of compliance with the policies or procedures may deteriorate.
/s/ Deloitte & Touche LLP
Hartford, Connecticut
February 15, 202314, 2024
REPORT OF INDEPENDENT REGISTERED PUBLIC ACCOUNTING FIRM
To the Board of Trustees and Shareholders of Eversource Energy:
Opinion on the Financial Statements
We have audited the accompanying consolidated balance sheets of Eversource Energy and subsidiaries (the “Company”) as of December 31, 20222023 and 2021,2022, the related consolidated statements of income, comprehensive income, common shareholders’ equity, and cash flows, for each of the three years in the period ended December 31, 2022,2023, and the related notes and the schedules listed in the Index at Item 15 of Part IV (collectively referred to as the “financial statements”). In our opinion, the financial statements present fairly, in all material respects, the financial position of the Company as of December 31, 20222023 and 2021,2022, and the results of its operations and its cash flows for each of the three years in the period ended December 31, 2022,2023, in conformity with accounting principles generally accepted in the United States of America.
We have also audited, in accordance with standards of the Public Company Accounting Oversight Board (United States) (PCAOB), the Company’s internal control over financial reporting as of December 31, 2022,2023, based on criteria established in Internal Control — Integrated Framework (2013) issued by the Committee of Sponsoring Organizations of the Treadway Commission and our report dated February 15, 2023,14, 2024, expressed an unqualified opinion on the Company’s internal control over financial reporting.
Basis for Opinion
These financial statements are the responsibility of the Company’s management. Our responsibility is to express an opinion on the Company’s financial statements based on our audits. We are a public accounting firm registered with the PCAOB and are required to be independent with respect to the Company in accordance with the U.S. federal securities laws and the applicable rules and regulations of the Securities and Exchange Commission and the PCAOB.
We conducted our audits in accordance with the standards of the PCAOB. Those standards require that we plan and perform the audit to obtain reasonable assurance about whether the financial statements are free of material misstatement, whether due to error or fraud. Our audits included performing procedures to assess the risks of material misstatement of the financial statements, whether due to error or fraud, and performing procedures that respond to those risks. Such procedures included examining, on a test basis, evidence regarding the amounts and disclosures in the financial statements. Our audits also included evaluating the accounting principles used and significant estimates made by management, as well as evaluating the overall presentation of the financial statements. We believe that our audits provide a reasonable basis for our opinion.
Critical Audit Matter
The critical audit mattermatters communicated below is a matterare matters arising from the current-period audit of the financial statements that waswere communicated or required to be communicated to the audit committee and that (1) relatesrelate to accounts or disclosures that are material to the financial statements and (2) involved our especially challenging, subjective, or complex judgments. The communication of critical audit matters does not alter in any way our opinion on the financial statements, taken as a whole, and we are not, by communicating the critical audit mattermatters below, providing a separate opinionopinions on the critical audit mattermatters or on the accounts or disclosures to which it relates.they relate.
Regulatory Accounting - Impact of Rate Regulation on the Financial Statements - Refer to Note 2 to the Financial Statements
Critical Audit Matter Description
The Company’s utility companies are subject to rate regulation by the Federal Energy Regulatory Commission and by their respective state public utility authorities in Connecticut, Massachusetts, or New Hampshire (the “Commissions”). The rate regulation by these Commissions is based on cost recovery. The regulated companies’ financial statements reflect the effects of the rate-making process. The rates charged to the customers of the Company’s regulated companies are designed to collect each company’s cost to provide service, plus a return on investment.
The application of accounting guidance for rate-regulated enterprises results in recording regulatory assets and liabilities. Regulatory assets represent the deferral of incurred costs that are probable of future recovery in customer rates. Regulatory assets are amortized as the incurred costs are recovered through customer rates. In some cases, the Company records regulatory assets before approval for recovery has been received from the applicable regulatory commission. The Company must use judgment to conclude that costs deferred as regulatory assets are probable of future recovery. The Company bases its conclusion on certain factors, including, but not limited to, regulatory precedent. Regulatory liabilities represent either revenues received from customers to fund expected costs that have not yet been incurred or probable future refunds to customers.
The Company uses judgment when recording regulatory assets and liabilities; however, regulatory commissions can reach different conclusions about the recovery of costs, and those conclusions could have a material impact on the Company’s financial statements. Management believes it is probable that each of the regulated companies will recover its respective investment in long-lived assets, including regulatory assets. If management were to determine that it could no longer apply the accounting guidance applicable to rate-regulated enterprises to any of the regulated companies’ operations, or if management could not conclude it is probable that costs would be recovered from customers in future rates, the costs would be charged to net income in the period in which the determination is made.
Accounting for the economics of rate-regulation impacts multiple financial statement line items and disclosures, such as regulated property, plant, and equipment, regulatory assets and liabilities, operating revenues, depreciation expense and amortization of regulatory assets. While management has indicated it expects to recover costs from customers through regulated rates, there is a risk that the Commissions will not approve full recovery of such costs or full recovery of all amounts invested in the utility business and a reasonable return on that investment. We identified the impact of rate-regulation as a critical audit matter due to the significant judgments made by management to support its assertions about impact of future regulatory orders on the financial statements. Management judgments include assessing the probability of recovery in future rates of incurred costs and of a refund to customers. Given that management’s accounting judgments are based on assumptions about the outcome of future decisions by the Commissions, auditing these judgments requires specialized knowledge of accounting for rate regulation and the rate setting process due to its inherent complexities.
How the Critical Audit Matter Was Addressed in the Audit
Our audit procedures related to the uncertainty of future decisions by the Commissions included the following, among others:
• We tested the effectiveness of management’s controls over the evaluation of the likelihood of (1) the recovery in future rates of costs incurred as property, plant, and equipment and deferred as regulatory assets, and (2) a refund or a future reduction in rates that should be reported as regulatory liabilities. We tested the effectiveness of management’s controls over the initial recognition of amounts as property, plant, and equipment; regulatory assets or liabilities; and the monitoring and evaluation of regulatory developments that may affect the likelihood of recovering costs in future rates, a refund, or a future reduction in rates.
• We evaluated the Company’s disclosures related to the applicability and impacts of rate regulation, including the balances recorded and regulatory developments disclosed in the financial statements.
• We read relevant regulatory orders issued by the Commissions for the Company and other public utilities, regulatory statutes, interpretations, procedural memorandums, filings made by intervenors, and other publicly available information to assess the likelihood of recovery in future rates or of a future refund or reduction in rates based on precedents of the Commissions’ treatment of similar costs under similar circumstances. We evaluated the external information and compared it to management’s recorded regulatory asset and liability balances for completeness.
• For regulatory matters in process, we inspected the Company’s filings with the Commissions and the filings with the Commissions by intervenors that may impact the Company’s future rates, for any evidence that might contradict management’s assertions.
• We made inquiries of management, including legal counsel, and obtained the regulatory orders and analysis from management that support the probability of recovery, refund, or future reductions in rates for regulatory assets and liabilities to assess management’s assertion that amounts are probable of recovery, refund, or a future reduction in rates.
Investments in Unconsolidated Affiliates – Impact of Offshore Wind Impairment and Offshore Wind Divestiture - Refer to Note 6 to the Financial Statements
Critical Audit Matter Description
Eversource’s offshore wind business includes 50 percent ownership interests in each of North East Offshore and South Fork Class B Member, LLC, which collectively hold three offshore wind projects. North East Offshore holds the Revolution Wind project and the Sunrise Wind project. South Fork Class B Member, LLC holds the South Fork Wind project. Eversource’s offshore wind business also includes a noncontrolling tax equity investment in South Fork Wind through a 100 percent ownership in South Fork Wind Holdings, LLC Class A shares. The offshore wind projects are being developed and constructed through joint and equal partnerships with Ørsted.
In the second quarter of 2023, the Company announced that it had completed the strategic review of its offshore wind investments and determined that it would continue to pursue the sale of its offshore wind investments. The Company also entered into a purchase and sale agreement with Ørsted for its 50% interest in an uncommitted lease area and committed to provide tax equity for the South Fork Wind project through a new tax equity ownership interest. In connection with the conclusion of the strategic review, Eversource evaluated its aggregate investment in the projects, uncommitted lease area, and other related capitalized costs and determined that the carrying value of the equity method offshore wind investment exceeded the fair value of the investment and that the decline was other-than-temporary. The estimate of fair value was based on the expected sale price of the Company’s 50 percent interest in the three contracted projects based on the most recent bid value, the sale price of the uncommitted lease area included in the purchase and sale agreement, expected investment tax credits and potential investment tax credit adder amounts, the value of the tax equity ownership interest, and the expectation of a successful repricing of the Sunrise Wind Offshore Renewable Energy Credit (“OREC”) contract. As a result, the Company recognized an other-than temporary impairment charge in the second quarter of 2023.
In the fourth quarter of 2023, The New York State Public Service Commission denied Sunrise Wind’s petition to amend its OREC contract to increase the contract price to cover increased costs and inflation. Also during the fourth quarter, project construction forecasts were updated, and these new forecasts reflected additional expenditures for construction and scheduling related pressures, including the availability and increased cost of installation vessels and supply chain cost increases related to foundation fabrication. In determining the current fair value of the investments, these updated projections exceeded the previously estimated projections for construction expenditures, which resulted in a revised sales price that is now significantly lower than the previous bid value. Accordingly, the Company also recognized an other-than temporary impairment charge in the fourth quarter of 2023.
We identified the evaluation of other-than-temporary impairment charge for the offshore wind investment as a critical audit matter. It involves a significant degree of judgment and estimation, including identifying circumstances that indicate an impairment may exist at the equity method investment level, selecting discount rates used to determine fair values, and developing an estimate of discounted future cash flows expected from
investment operations or the sale of the investment. This required a high degree of auditor judgment and an increased extent of effort when performing audit procedures to evaluate the reasonableness of management’s estimates and assumptions related to the price and the discount rate used in the discounted future cash flow method.
How the Critical Audit Matter Was Addressed in the Audit
Our audit procedures related to the discount rate used to determine fair market values and the estimates of discounted future cash flows expected from the sale of the investment.
• We tested the effectiveness of management’s controls over impairment considerations including the aggregate investment in the projects, the sale price of the uncommitted lease area, and other related capitalized costs, as well as the discounted cash flow analysis for the offshore wind investments. We tested the effectiveness of management’s controls over the initial recognition of the impairment charge.
• We evaluated the Company’s disclosures related to the impairment charges disclosed in the financial statements.
• We evaluated the assumptions utilized within the discounted cash flow model used in the Company’s impairment analysis.
• We made inquiries of management and evaluated the full impairment analysis from management that supported the other-than-temporary impairment charge in accordance with ASC 323-10-35-32A “Equity Method and Joint Ventures – Subsequent Measurement”.
/s/ Deloitte & Touche LLP
Hartford, Connecticut
February 15, 202314, 2024
We have served as the Company’s auditor since 2002.
EVERSOURCE ENERGY AND SUBSIDIARIES
CONSOLIDATED BALANCE SHEETS
| | | | As of December 31, | | As of December 31, |
| (Thousands of Dollars) | (Thousands of Dollars) | 2022 | | 2021 | (Thousands of Dollars) | 2023 | | 2022 |
| | ASSETS | ASSETS | | | |
| ASSETS | |
| ASSETS | | | | |
| Current Assets: | Current Assets: | | | | Current Assets: | | | |
| Cash | Cash | $ | 47,597 | | | $ | 66,773 | |
| Cash Equivalents | Cash Equivalents | 327,006 | | | — | |
Receivables, Net (net of allowance for uncollectible accounts of $486,297 and $417,406 as of December 31, 2022 and 2021, respectively) | 1,517,138 | | | 1,226,069 | |
Receivables, Net (net of allowance for uncollectible accounts of $554,455 and $486,297 as of December 31, 2023 and 2022, respectively) | |
| Unbilled Revenues | Unbilled Revenues | 238,968 | | | 210,879 | |
| Materials, Supplies, Natural Gas and REC Inventory | Materials, Supplies, Natural Gas and REC Inventory | 374,395 | | | 267,547 | |
| Regulatory Assets | Regulatory Assets | 1,335,491 | | | 1,129,093 | |
| Prepayments and Other Current Assets | Prepayments and Other Current Assets | 382,603 | | | 369,759 | |
| Total Current Assets | Total Current Assets | 4,223,198 | | | 3,270,120 | |
| Property, Plant and Equipment, Net | Property, Plant and Equipment, Net | 36,112,820 | | | 33,377,650 | |
| Deferred Debits and Other Assets: | Deferred Debits and Other Assets: | | | |
| Regulatory Assets | |
| Regulatory Assets | |
| Regulatory Assets | Regulatory Assets | 4,242,794 | | | 4,586,709 | |
| Goodwill | Goodwill | 4,522,632 | | | 4,477,269 | |
| Investments in Unconsolidated Affiliates | Investments in Unconsolidated Affiliates | 2,176,080 | | | 1,436,293 | |
| Prepaid Pension and PBOP | Prepaid Pension and PBOP | 1,045,524 | | | 271,987 | |
| Marketable Securities | Marketable Securities | 366,508 | | | 460,347 | |
| Other Long-Term Assets | Other Long-Term Assets | 541,344 | | | 611,769 | |
| Total Deferred Debits and Other Assets | Total Deferred Debits and Other Assets | 12,894,882 | | | 11,844,374 | |
| Total Assets | Total Assets | $ | 53,230,900 | | | $ | 48,492,144 | |
| | LIABILITIES AND CAPITALIZATION | LIABILITIES AND CAPITALIZATION | | |
| LIABILITIES AND CAPITALIZATION | |
| LIABILITIES AND CAPITALIZATION | |
| Current Liabilities: | Current Liabilities: | | |
| Current Liabilities: | |
| Current Liabilities: | |
| Notes Payable | |
| Notes Payable | |
| Notes Payable | Notes Payable | $ | 1,442,200 | | | $ | 1,505,450 | |
| Long-Term Debt – Current Portion | Long-Term Debt – Current Portion | 1,320,129 | | | 1,193,097 | |
| Rate Reduction Bonds – Current Portion | Rate Reduction Bonds – Current Portion | 43,210 | | | 43,210 | |
| Accounts Payable | Accounts Payable | 2,113,905 | | | 1,672,230 | |
| Regulatory Liabilities | Regulatory Liabilities | 890,786 | | | 602,432 | |
| Other Current Liabilities | Other Current Liabilities | 989,053 | | | 830,620 | |
| Total Current Liabilities | Total Current Liabilities | 6,799,283 | | | 5,847,039 | |
| Deferred Credits and Other Liabilities: | Deferred Credits and Other Liabilities: | | | |
| Accumulated Deferred Income Taxes | |
| Accumulated Deferred Income Taxes | |
| Accumulated Deferred Income Taxes | Accumulated Deferred Income Taxes | 5,067,902 | | | 4,597,120 | |
| Regulatory Liabilities | Regulatory Liabilities | 3,930,305 | | | 3,866,251 | |
| Derivative Liabilities | Derivative Liabilities | 143,929 | | | 235,387 | |
| Asset Retirement Obligations | Asset Retirement Obligations | 502,713 | | | 500,111 | |
| Accrued Pension, SERP and PBOP | Accrued Pension, SERP and PBOP | 135,473 | | | 242,463 | |
| Other Long-Term Liabilities | Other Long-Term Liabilities | 888,081 | | | 971,080 | |
| Total Deferred Credits and Other Liabilities | Total Deferred Credits and Other Liabilities | 10,668,403 | | | 10,412,412 | |
| Long-Term Debt | Long-Term Debt | 19,723,994 | | | 17,023,577 | |
| Rate Reduction Bonds | Rate Reduction Bonds | 410,492 | | | 453,702 | |
| Noncontrolling Interest - Preferred Stock of Subsidiaries | Noncontrolling Interest - Preferred Stock of Subsidiaries | 155,570 | | | 155,570 | |
| Common Shareholders' Equity: | Common Shareholders' Equity: | | | |
| Common Shares | Common Shares | 1,799,920 | | | 1,789,092 | |
| Common Shares | |
| Common Shares | |
| Capital Surplus, Paid In | Capital Surplus, Paid In | 8,401,731 | | | 8,098,514 | |
| Retained Earnings | Retained Earnings | 5,527,153 | | | 5,005,391 | |
| Accumulated Other Comprehensive Loss | Accumulated Other Comprehensive Loss | (39,421) | | | (42,275) | |
| Treasury Stock | Treasury Stock | (216,225) | | | (250,878) | |
| Common Shareholders' Equity | Common Shareholders' Equity | 15,473,158 | | | 14,599,844 | |
| Commitments and Contingencies (Note 13) | Commitments and Contingencies (Note 13) | | | | Commitments and Contingencies (Note 13) | | | |
| Total Liabilities and Capitalization | Total Liabilities and Capitalization | $ | 53,230,900 | | | $ | 48,492,144 | |
The accompanying notes are an integral part of these consolidated financial statements.
EVERSOURCE ENERGY AND SUBSIDIARIES
CONSOLIDATED STATEMENTS OF (LOSS)/INCOME
| | | | For the Years Ended December 31, | | For the Years Ended December 31, |
| (Thousands of Dollars, Except Share Information) | (Thousands of Dollars, Except Share Information) | 2022 | | 2021 | | 2020 | (Thousands of Dollars, Except Share Information) | 2023 | | 2022 | | 2021 |
| | Operating Revenues | Operating Revenues | $ | 12,289,336 | | | $ | 9,863,085 | | | $ | 8,904,430 | |
| Operating Revenues | |
| Operating Revenues | |
| | Operating Expenses: | Operating Expenses: | | |
| Operating Expenses: | |
| Operating Expenses: | |
| Purchased Power, Purchased Natural Gas and Transmission | |
| Purchased Power, Purchased Natural Gas and Transmission | |
| Purchased Power, Purchased Natural Gas and Transmission | Purchased Power, Purchased Natural Gas and Transmission | 5,014,074 | | | 3,372,344 | | | 2,987,840 | |
| Operations and Maintenance | Operations and Maintenance | 1,865,328 | | | 1,739,685 | | | 1,480,252 | |
| Depreciation | Depreciation | 1,194,246 | | | 1,103,008 | | | 981,380 | |
| Amortization | Amortization | 448,892 | | | 231,965 | | | 177,679 | |
| Energy Efficiency Programs | Energy Efficiency Programs | 658,051 | | | 592,775 | | | 535,760 | |
| Taxes Other Than Income Taxes | Taxes Other Than Income Taxes | 910,591 | | | 829,987 | | | 752,785 | |
| | Total Operating Expenses | Total Operating Expenses | 10,091,182 | | | 7,869,764 | | | 6,915,696 | |
| Total Operating Expenses | |
| Total Operating Expenses | |
| Operating Income | Operating Income | 2,198,154 | | | 1,993,321 | | | 1,988,734 | |
| Interest Expense | Interest Expense | 678,274 | | | 582,334 | | | 538,452 | |
| Impairments of Offshore Wind Investments | |
| Other Income, Net | Other Income, Net | 346,088 | | | 161,282 | | | 108,590 | |
| Income Before Income Tax Expense | 1,865,968 | | | 1,572,269 | | | 1,558,872 | |
| (Loss)/Income Before Income Tax Expense | |
| Income Tax Expense | Income Tax Expense | 453,574 | | | 344,223 | | | 346,186 | |
| Net Income | 1,412,394 | | | 1,228,046 | | | 1,212,686 | |
| Net (Loss)/Income | |
| Net Income Attributable to Noncontrolling Interests | Net Income Attributable to Noncontrolling Interests | 7,519 | | | 7,519 | | | 7,519 | |
| Net Income Attributable to Common Shareholders | $ | 1,404,875 | | | $ | 1,220,527 | | | $ | 1,205,167 | |
| Net (Loss)/Income Attributable to Common Shareholders | |
| | Basic Earnings Per Common Share | $ | 4.05 | | | $ | 3.55 | | | $ | 3.56 | |
| Basic (Loss)/Earnings Per Common Share | |
| Basic (Loss)/Earnings Per Common Share | |
| Basic (Loss)/Earnings Per Common Share | |
| | Diluted Earnings Per Common Share | $ | 4.05 | | | $ | 3.54 | | | $ | 3.55 | |
| Diluted (Loss)/Earnings Per Common Share | |
| Diluted (Loss)/Earnings Per Common Share | |
| Diluted (Loss)/Earnings Per Common Share | |
| | Weighted Average Common Shares Outstanding: | |
| Weighted Average Common Shares Outstanding: | |
| Weighted Average Common Shares Outstanding: | Weighted Average Common Shares Outstanding: | | | | | | | | |
| Basic | Basic | 346,783,444 | | | 343,972,926 | | | 338,836,147 | |
| Diluted | Diluted | 347,246,768 | | | 344,631,056 | | | 339,847,062 | |
The accompanying notes are an integral part of these consolidated financial statements.
CONSOLIDATED STATEMENTS OF COMPREHENSIVE (LOSS)/INCOME
| | | | | | | | | | | | | | | | | |
| For the Years Ended December 31, |
| (Thousands of Dollars) | 2022 | | 2021 | | 2020 |
| | | | | |
| Net Income | $ | 1,412,394 | | | $ | 1,228,046 | | | $ | 1,212,686 | |
| Other Comprehensive Income/(Loss), Net of Tax: | | | | | |
| Qualified Cash Flow Hedging Instruments | 20 | | | 972 | | | 1,596 | |
| Changes in Unrealized (Losses)/Gains on Marketable Securities | (1,636) | | | (671) | | | 342 | |
| Changes in Funded Status of Pension, SERP and PBOP Benefit Plans | 4,470 | | | 33,835 | | | (13,290) | |
| Other Comprehensive Income/(Loss), Net of Tax | 2,854 | | | 34,136 | | | (11,352) | |
| Comprehensive Income Attributable to Noncontrolling Interests | (7,519) | | | (7,519) | | | (7,519) | |
| Comprehensive Income Attributable to Common Shareholders | $ | 1,407,729 | | | $ | 1,254,663 | | | $ | 1,193,815 | |
| | | | | | | | | | | | | | | | | |
| For the Years Ended December 31, |
| (Thousands of Dollars) | 2023 | | 2022 | | 2021 |
| | | | | |
| Net (Loss)/Income | $ | (434,721) | | | $ | 1,412,394 | | | $ | 1,228,046 | |
| Other Comprehensive Income, Net of Tax: | | | | | |
| Qualified Cash Flow Hedging Instruments | 20 | | | 20 | | | 972 | |
| Changes in Unrealized Gains/(Losses) on Marketable Securities | 1,252 | | | (1,636) | | | (671) | |
| Changes in Funded Status of Pension, SERP and PBOP Benefit Plans | 4,412 | | | 4,470 | | | 33,835 | |
| Other Comprehensive Income, Net of Tax | 5,684 | | | 2,854 | | | 34,136 | |
| Comprehensive Income Attributable to Noncontrolling Interests | (7,519) | | | (7,519) | | | (7,519) | |
| Comprehensive (Loss)/Income Attributable to Common Shareholders | $ | (436,556) | | | $ | 1,407,729 | | | $ | 1,254,663 | |
The accompanying notes are an integral part of these consolidated financial statements.
EVERSOURCE ENERGY AND SUBSIDIARIES
CONSOLIDATED STATEMENTS OF COMMON SHAREHOLDERS' EQUITY
| | | | Common Shares | Capital
Surplus,
Paid In | Retained Earnings | Accumulated Other Comprehensive Loss | Treasury Stock | Total Common Shareholders' Equity | | Common Shares | Capital
Surplus,
Paid In | Retained Earnings | Accumulated Other Comprehensive Loss | Treasury Stock | Total Common Shareholders' Equity |
| (Thousands of Dollars, Except Share Information) | (Thousands of Dollars, Except Share Information) | Shares | Amount | (Thousands of Dollars, Except Share Information) | Shares | Amount |
| Balance as of January 1, 2020 | 329,880,645 | | $ | 1,729,292 | | $ | 7,087,768 | | $ | 4,177,048 | | $ | (65,059) | | $ | (299,055) | | $ | 12,629,994 | |
| Net Income | | | 1,212,686 | | | 1,212,686 | |
| Dividends on Common Shares - $2.27 Per Share | | | (767,500) | | | (767,500) | |
| Dividends on Preferred Stock | | | (7,519) | | | (7,519) | |
| Issuance of Common Shares - $5 par value | 11,960,000 | | 59,800 | | 889,860 | | | 949,660 | |
| Long-Term Incentive Plan Activity | | 7,890 | | | | 7,890 | |
| Issuance of Treasury Shares | 1,113,378 | | | 50,812 | | | 21,076 | | 71,888 | |
| Capital Stock Expense | | (20,667) | | | (20,667) | |
| Adoption of Accounting Standards Update 2016-13 | | (1,514) | | | (1,514) | |
| | Other Comprehensive Loss | | | (11,352) | | | (11,352) | |
| Balance as of December 31, 2020 | 342,954,023 | | 1,789,092 | | 8,015,663 | | 4,613,201 | | (76,411) | | (277,979) | | 14,063,566 | |
| Balance as of January 1, 2021 | |
| Net Income | Net Income | | | 1,228,046 | | | 1,228,046 | |
| Dividends on Common Shares - $2.41 Per Share | Dividends on Common Shares - $2.41 Per Share | | | (828,337) | | | (828,337) | |
| Dividends on Preferred Stock | Dividends on Preferred Stock | | | (7,519) | | | (7,519) | |
| | Long-Term Incentive Plan Activity | |
| Long-Term Incentive Plan Activity | |
| Long-Term Incentive Plan Activity | Long-Term Incentive Plan Activity | | 3,537 | | | 3,537 | |
| Issuance of Treasury Shares | Issuance of Treasury Shares | 986,656 | | 49,913 | | | 18,451 | 68,364 | |
Issuance of Treasury Shares for Acquisition of
New England Service Company | Issuance of Treasury Shares for Acquisition of
New England Service Company | 462,517 | | | 29,401 | | | 8,650 | 38,051 | |
| | Other Comprehensive Income | |
| | Other Comprehensive Income | |
| | Other Comprehensive Income | Other Comprehensive Income | | | 34,136 | | | 34,136 | |
| Balance as of December 31, 2021 | Balance as of December 31, 2021 | 344,403,196 | | 1,789,092 | | 8,098,514 | | 5,005,391 | | (42,275) | | (250,878) | | 14,599,844 | |
| Net Income | Net Income | | | 1,412,394 | | | 1,412,394 | |
| Dividends on Common Shares - $2.55 Per Share | Dividends on Common Shares - $2.55 Per Share | | | (883,113) | | | (883,113) | |
| Dividends on Preferred Stock | Dividends on Preferred Stock | | | (7,519) | | | (7,519) | |
| Issuance of Common Shares - $5 par value | Issuance of Common Shares - $5 par value | 2,165,671 | 10,828 | 189,077 | | | 199,905 | |
| Long-Term Incentive Plan Activity | Long-Term Incentive Plan Activity | | 8,335 | | | 8,335 | |
| Issuance of Treasury Shares | Issuance of Treasury Shares | 949,724 | | 53,822 | | | 17,350 | 71,172 | |
| Capital Stock Expense | Capital Stock Expense | | (2,847) | | | (2,847) | |
Issuance of Treasury Shares for Acquisition of
The Torrington Water Company | Issuance of Treasury Shares for Acquisition of
The Torrington Water Company | 925,264 | | 54,830 | | 17,303 | 72,133 | |
| Other Comprehensive Income | Other Comprehensive Income | | | | 2,854 | | | 2,854 | |
| Balance as of December 31, 2022 | Balance as of December 31, 2022 | 348,443,855 | | $ | 1,799,920 | | $ | 8,401,731 | | $ | 5,527,153 | | $ | (39,421) | | $ | (216,225) | | $ | 15,473,158 | |
| Net Loss | |
| Dividends on Common Shares - $2.70 Per Share | |
| Dividends on Preferred Stock | |
| | Long-Term Incentive Plan Activity | |
| Long-Term Incentive Plan Activity | |
| Long-Term Incentive Plan Activity | |
| Issuance of Treasury Shares | |
| | Other Comprehensive Income | |
| Other Comprehensive Income | |
| Other Comprehensive Income | |
| Balance as of December 31, 2023 | |
The accompanying notes are an integral part of these consolidated financial statements.
EVERSOURCE ENERGY AND SUBSIDIARIES
CONSOLIDATED STATEMENTS OF CASH FLOWS
| | | | For the Years Ended December 31, | | For the Years Ended December 31, |
| (Thousands of Dollars) | (Thousands of Dollars) | 2022 | | 2021 | | 2020 | (Thousands of Dollars) | 2023 | | 2022 | | 2021 |
| | Operating Activities: | Operating Activities: | | | | | |
| Net Income | $ | 1,412,394 | | | $ | 1,228,046 | | | $ | 1,212,686 | |
| Adjustments to Reconcile Net Income to Net Cash Flows Provided by Operating Activities: | | |
| Operating Activities: | |
| Operating Activities: | | | | |
| Net (Loss)/Income | |
| Adjustments to Reconcile Net (Loss)/Income to Net Cash Flows Provided by Operating Activities: | |
| Depreciation | |
| Depreciation | |
| Depreciation | Depreciation | 1,194,246 | | | 1,103,008 | | | 981,380 | |
| Deferred Income Taxes | Deferred Income Taxes | 346,779 | | | 347,056 | | | 257,154 | |
| Uncollectible Expense | Uncollectible Expense | 61,876 | | | 60,886 | | | 53,461 | |
| Pension, SERP and PBOP (Income)/Expense, Net | (160,857) | | | (14,693) | | | 12,888 | |
| Pension, SERP and PBOP Income, Net | |
| Pension and PBOP Contributions | Pension and PBOP Contributions | (83,148) | | | (182,344) | | | (111,524) | |
| Regulatory Under Recoveries, Net | Regulatory Under Recoveries, Net | (205,294) | | | (314,211) | | | (516,411) | |
(Customer Credits)/Reserve at CL&P related to PURA Settlement Agreement and
Storm Performance Penalty | (Customer Credits)/Reserve at CL&P related to PURA Settlement Agreement and
Storm Performance Penalty | (72,041) | | | 81,274 | | | — | |
| Amortization | Amortization | 448,892 | | | 231,965 | | | 177,679�� | |
| Cost of Removal Expenditures | Cost of Removal Expenditures | (303,755) | | | (242,130) | | | (148,332) | |
| Payment of Withheld Property Taxes | (78,446) | | | — | | | — | |
| Payment in 2022 of Withheld Property Taxes | |
| Impairments of Offshore Wind Investments | |
| Other | Other | (39,192) | | | (64,640) | | | (25,957) | |
| Changes in Current Assets and Liabilities: | Changes in Current Assets and Liabilities: | | |
| Receivables and Unbilled Revenues, Net | Receivables and Unbilled Revenues, Net | (470,593) | | | (135,505) | | | (351,843) | |
| Receivables and Unbilled Revenues, Net | |
| Receivables and Unbilled Revenues, Net | |
| | Taxes Receivable/Accrued, Net | |
| Taxes Receivable/Accrued, Net | |
| Taxes Receivable/Accrued, Net | Taxes Receivable/Accrued, Net | 18,358 | | | (110,621) | | | 43,819 | |
| Accounts Payable | Accounts Payable | 377,657 | | | (29,201) | | | 122,567 | |
| Other Current Assets and Liabilities, Net | Other Current Assets and Liabilities, Net | (45,583) | | | 3,710 | | | (24,995) | |
| Net Cash Flows Provided by Operating Activities | Net Cash Flows Provided by Operating Activities | 2,401,293 | | | 1,962,600 | | | 1,682,572 | |
| | | | | | | |
| Investing Activities: | Investing Activities: | | | | | |
| Investing Activities: | |
| Investing Activities: | | | | |
| Investments in Property, Plant and Equipment | Investments in Property, Plant and Equipment | (3,441,852) | | | (3,175,080) | | | (2,942,996) | |
| Proceeds from Sales of Marketable Securities | Proceeds from Sales of Marketable Securities | 457,612 | | | 447,893 | | | 434,124 | |
| | Purchases of Marketable Securities | Purchases of Marketable Securities | (424,174) | | | (414,980) | | | (401,823) | |
| Acquisition of Assets of Columbia Gas of Massachusetts, Net of Restricted Cash | — | | | — | | | (1,113,252) | |
| Purchases of Marketable Securities | |
| Purchases of Marketable Securities | |
| | Investments in Unconsolidated Affiliates | Investments in Unconsolidated Affiliates | (742,496) | | | (327,385) | | | (239,673) | |
| Proceeds from the Sale of Hingham Water System | — | | | — | | | 110,536 | |
| Investments in Unconsolidated Affiliates | |
| Investments in Unconsolidated Affiliates | |
| | Proceeds from Unconsolidated Affiliates | |
| Proceeds from Unconsolidated Affiliates | |
| Proceeds from Unconsolidated Affiliates | |
| Other Investing Activities | Other Investing Activities | 20,420 | | | 22,178 | | | 23,809 | |
| Net Cash Flows Used in Investing Activities | Net Cash Flows Used in Investing Activities | (4,130,490) | | | (3,447,374) | | | (4,129,275) | |
| | Financing Activities: | Financing Activities: | | | | | |
| Financing Activities: | |
| Financing Activities: | | | | |
| Issuance of Common Shares, Net of Issuance Costs | Issuance of Common Shares, Net of Issuance Costs | 197,058 | | | — | | | 928,992 | |
| Cash Dividends on Common Shares | Cash Dividends on Common Shares | (860,033) | | | (805,439) | | | (744,665) | |
| Cash Dividends on Preferred Stock | Cash Dividends on Preferred Stock | (7,519) | | | (7,519) | | | (7,519) | |
| (Decrease)/Increase in Notes Payable | (78,170) | | | 256,125 | | | 13,955 | |
| Increase/(Decrease) in Notes Payable | |
| Repayment of Rate Reduction Bonds | Repayment of Rate Reduction Bonds | (43,210) | | | (43,210) | | | (43,210) | |
| Issuance of Long-Term Debt | Issuance of Long-Term Debt | 4,045,000 | | | 3,230,000 | | | 2,760,000 | |
| Retirement of Long-Term Debt | Retirement of Long-Term Debt | (1,175,000) | | | (1,142,500) | | | (327,236) | |
| Other Financing Activities | Other Financing Activities | (48,185) | | | (46,625) | | | 14,273 | |
| Net Cash Flows Provided by Financing Activities | Net Cash Flows Provided by Financing Activities | 2,029,941 | | | 1,440,832 | | | 2,594,590 | |
| Net Increase/(Decrease) in Cash, Cash Equivalents and Restricted Cash | 300,744 | | | (43,942) | | | 147,887 | |
| Net (Decrease)/Increase in Cash, Cash Equivalents and Restricted Cash | |
| Cash, Cash Equivalents and Restricted Cash - Beginning of Year | Cash, Cash Equivalents and Restricted Cash - Beginning of Year | 221,008 | | | 264,950 | | | 117,063 | |
| Cash, Cash Equivalents and Restricted Cash - End of Year | Cash, Cash Equivalents and Restricted Cash - End of Year | $ | 521,752 | | | $ | 221,008 | | | $ | 264,950 | |
The accompanying notes are an integral part of these consolidated financial statements.
Management’s Report on Internal Controls Over Financial Reporting
The Connecticut Light and Power Company
Management is responsible for the preparation, integrity, and fair presentation of the accompanying financial statements of The Connecticut Light and Power Company (CL&P or the Company) and of other sections of this annual report.
Management is responsible for establishing and maintaining adequate internal controls over financial reporting. The Company's internal control framework and processes have been designed to provide reasonable assurance regarding the reliability of financial reporting and the preparation of financial statements for external purposes in accordance with accounting principles generally accepted in the United States of America. There are inherent limitations of internal controls over financial reporting that could allow material misstatements due to error or fraud to occur and not be prevented or detected on a timely basis by employees during the normal course of business. Additionally, internal controls over financial reporting may become inadequate in the future due to changes in the business environment.
Under the supervision and with the participation of the principal executive officer and principal financial officer, CL&P conducted an evaluation of the effectiveness of internal controls over financial reporting based on criteria established in Internal Control – Integrated Framework (2013) issued by the Committee of Sponsoring Organizations of the Treadway Commission (COSO). Based on this evaluation under the framework in COSO, management concluded that internal controls over financial reporting were effective as of December 31, 2022.2023.
February 15, 202314, 2024
REPORT OF INDEPENDENT REGISTERED PUBLIC ACCOUNTING FIRM
To the Board of Directors and Stockholder of The Connecticut Light and Power Company:
Opinion on the Financial Statements
We have audited the accompanying balance sheets of The Connecticut Light and Power Company (the “Company”) as of December 31, 20222023 and 2021,2022, the related statements of income, comprehensive income, common stockholder’s equity, and cash flows, for each of the three years in the period ended December 31, 2022,2023, and the related notes and the schedule listed in the Index at Item 15 of Part IV (collectively referred to as the “financial statements”). In our opinion, the financial statements present fairly, in all material respects, the financial position of the Company as of December 31, 20222023 and 2021,2022, and the results of its operations and its cash flows for each of the three years in the period ended December 31, 2022,2023, in conformity with accounting principles generally accepted in the United States of America.
Basis for Opinion
These financial statements are the responsibility of the Company’s management. Our responsibility is to express an opinion on the Company’s financial statements based on our audits. We are a public accounting firm registered with the PCAOB and are required to be independent with respect to the Company in accordance with the U.S. federal securities laws and the applicable rules and regulations of the Securities and Exchange Commission and the PCAOB.
We conducted our audits in accordance with the standards of the PCAOB. Those standards require that we plan and perform the audit to obtain reasonable assurance about whether the financial statements are free of material misstatement, whether due to error or fraud. The Company is not required to have, nor were we engaged to perform, an audit of its internal control over financial reporting. As part of our audits, we are required to obtain an understanding of internal control over financial reporting but not for the purpose of expressing an opinion on the effectiveness of the Company’s internal control over financial reporting. Accordingly, we express no such opinion.
Our audits included performing procedures to assess the risks of material misstatement of the financial statements, whether due to error or fraud, and performing procedures that respond to those risks. Such procedures included examining, on a test basis, evidence regarding the amounts and disclosures in the financial statements. Our audits also included evaluating the accounting principles used and significant estimates made by management, as well as evaluating the overall presentation of the financial statements. We believe that our audits provide a reasonable basis for our opinion.
Critical Audit Matter
The critical audit matter communicated below is a matter arising from the current-period audit of the financial statements that was communicated or required to be communicated to the audit committee and that (1) relates to accounts or disclosures that are material to the financial statements and (2) involved our especially challenging, subjective, or complex judgments. The communication of critical audit matters does not alter in any way our opinion on the financial statements, taken as a whole, and we are not, by communicating the critical audit matter below, providing a separate opinion on the critical audit matter or on the accounts or disclosures to which it relates.
Regulatory Accounting - Impact of Rate Regulation on the Financial Statements - Refer to Note 2 to the Financial Statements
Critical Audit Matter Description
The Company is subject to rate regulation by the Federal Energy Regulatory Commission and the state public utility authority in Connecticut (the “Commissions”). The rate regulation by these Commissions is based on cost recovery. The Company’s financial statements reflect the effects of the rate-making process. The rates charged to the customers are designed to collect the Company’s cost to provide service, plus a return on investment.
The application of accounting guidance for rate-regulated enterprises results in recording regulatory assets and liabilities. Regulatory assets represent the deferral of incurred costs that are probable of future recovery in customer rates. Regulatory assets are amortized as the incurred costs are recovered through customer rates. In some cases, the Company records regulatory assets before approval for recovery has been received from the applicable regulatory commission. The Company must use judgment to conclude that costs deferred as regulatory assets are probable of future recovery. The Company bases its conclusion on certain factors, including, but not limited to, regulatory precedent. Regulatory liabilities represent either revenues received from customers to fund expected costs that have not yet been incurred or probable future refunds to customers.
The Company uses judgment when recording regulatory assets and liabilities; however, regulatory commissions can reach different conclusions about the recovery of costs, and those conclusions could have a material impact on the Company’s financial statements. Management believes it is probable that the Company will recover its investment in long-lived assets, including regulatory assets. If management were to determine that it could no longer apply the accounting guidance applicable to rate-regulated enterprises to the Company’s operations, or if management could not conclude it is probable that costs would be recovered from customers in future rates, the costs would be charged to net income in the period in which the determination is made.
Accounting for the economics of rate-regulation impacts multiple financial statement line items and disclosures, such as regulated property, plant, and equipment, regulatory assets and liabilities, operating revenues, depreciation expense and amortization of regulatory assets. While management has indicated it expects to recover costs from customers through regulated rates, there is a risk that the Commissions will not approve full recovery of such costs or full recovery of all amounts invested in the Company and a reasonable return on that investment. We identified the impact of rate-regulation as a critical audit matter due to the significant judgments made by management to support its assertions about impact of future regulatory orders on the financial statements. Management judgments include assessing the probability of recovery in future rates of incurred costs and of a refund to customers. Given that management’s accounting judgments are based on assumptions about the outcome of future decisions by the Commissions, auditing these judgments requires specialized knowledge of accounting for rate regulation and the rate setting process due to its inherent complexities.
How the Critical Audit Matter Was Addressed in the Audit
Our audit procedures related to the uncertainty of future decisions by the Commissions included the following, among others:
• We tested the effectiveness of management’s controls over the evaluation of the likelihood of (1) the recovery in future rates of costs incurred as property, plant, and equipment and deferred as regulatory assets, and (2) a refund or a future reduction in rates that should be reported as regulatory liabilities. We tested the effectiveness of management’s controls over the initial recognition of amounts as property, plant, and equipment; regulatory assets or liabilities; and the monitoring and evaluation of regulatory developments that may affect the likelihood of recovering costs in future rates, a refund, or a future reduction in rates.
• We evaluated the Company’s disclosures related to the applicability and impacts of rate regulation, including the balances recorded and regulatory developments disclosed in the financial statements.
• We read relevant regulatory orders issued by the Commissions for the Company and other public utilities, regulatory statutes, interpretations, procedural memorandums, filings made by intervenors, and other publicly available information to assess the likelihood of recovery in future rates or of a future refund or reduction in rates based on precedents of the Commissions’ treatment of similar costs under similar circumstances. We evaluated the external information and compared it to management’s recorded regulatory asset and liability balances for completeness.
• For regulatory matters in process, we inspected the Company’s filings with the Commissions and the filings with the Commissions by intervenors that may impact the Company’s future rates, for any evidence that might contradict management’s assertions.
• We made inquiries of management, including legal counsel, and obtained the regulatory orders and analysis from management that support the probability of recovery, refund, or future reductions in rates for regulatory assets and liabilities to assess management’s assertion that amounts are probable of recovery, refund, or a future reduction in rates.
/s/ Deloitte & Touche LLP
Hartford, Connecticut
February 15, 202314, 2024
We have served as the Company’s auditor since 2002.
THE CONNECTICUT LIGHT AND POWER COMPANY
BALANCE SHEETS
| | | | As of December 31, | | As of December 31, |
| (Thousands of Dollars) | (Thousands of Dollars) | 2022 | | 2021 | (Thousands of Dollars) | 2023 | | 2022 |
| | ASSETS | ASSETS | | | |
| ASSETS | |
| ASSETS | | | | |
| Current Assets: | Current Assets: | | | | Current Assets: | | | |
| Cash | Cash | $ | 11,312 | | | $ | 55,804 | |
Receivables, Net (net of allowance for uncollectible accounts of $225,320 and $181,319 as of December 31, 2022 and 2021, respectively) | 612,052 | | | 447,774 | |
Receivables, Net (net of allowance for uncollectible accounts of $296,030 and $225,320 as of December 31, 2023 and 2022, respectively) | |
| Accounts Receivable from Affiliated Companies | Accounts Receivable from Affiliated Companies | 46,439 | | | 43,944 | |
| Unbilled Revenues | Unbilled Revenues | 59,363 | | | 56,787 | |
| Materials and Supplies | 88,157 | | | 60,264 | |
| Materials, Supplies and REC Inventory | |
| Taxes Receivable | Taxes Receivable | 65,785 | | | 55,223 | |
| Regulatory Assets | Regulatory Assets | 314,089 | | | 371,609 | |
| | Prepayments and Other Current Assets | |
| Prepayments and Other Current Assets | |
| Prepayments and Other Current Assets | Prepayments and Other Current Assets | 62,524 | | | 65,034 | |
| Total Current Assets | Total Current Assets | 1,259,721 | | | 1,156,439 | |
| Property, Plant and Equipment, Net | Property, Plant and Equipment, Net | 11,467,024 | | | 10,803,543 | |
| Deferred Debits and Other Assets: | Deferred Debits and Other Assets: | | | | Deferred Debits and Other Assets: | | | |
| Regulatory Assets | Regulatory Assets | 1,593,693 | | | 1,713,161 | |
| Prepaid Pension | 147,914 | | | 429 | |
| Prepaid Pension and PBOP | |
| Other Long-Term Assets | Other Long-Term Assets | 290,444 | | | 276,084 | |
| Total Deferred Debits and Other Assets | Total Deferred Debits and Other Assets | 2,032,051 | | | 1,989,674 | |
| Total Assets | Total Assets | $ | 14,758,796 | | | $ | 13,949,656 | |
| | LIABILITIES AND CAPITALIZATION | LIABILITIES AND CAPITALIZATION | | | |
| LIABILITIES AND CAPITALIZATION | |
| LIABILITIES AND CAPITALIZATION | | | | |
| Current Liabilities: | Current Liabilities: | | | Current Liabilities: | | | |
| | Notes Payable to Eversource Parent | |
| | Accounts Payable | Accounts Payable | $ | 710,500 | | | $ | 533,454 | |
| Accounts Payable | |
| Accounts Payable | |
| Accounts Payable to Affiliated Companies | Accounts Payable to Affiliated Companies | 136,277 | | | 132,578 | |
| | Obligations to Third Party Suppliers | |
| Regulatory Liabilities | Regulatory Liabilities | 336,048 | | | 266,489 | |
| Derivative Liabilities | Derivative Liabilities | 81,588 | | | 73,528 | |
| Other Current Liabilities | Other Current Liabilities | 163,875 | | | 141,955 | |
| Total Current Liabilities | Total Current Liabilities | 1,428,288 | | | 1,148,004 | |
| Deferred Credits and Other Liabilities: | Deferred Credits and Other Liabilities: | | | | Deferred Credits and Other Liabilities: | | | |
| Accumulated Deferred Income Taxes | Accumulated Deferred Income Taxes | 1,640,034 | | | 1,562,102 | |
| Regulatory Liabilities | Regulatory Liabilities | 1,263,396 | | | 1,193,259 | |
| Derivative Liabilities | Derivative Liabilities | 143,929 | | | 235,387 | |
| Accrued Pension, SERP and PBOP | 12,887 | | | 26,820 | |
| | Other Long-Term Liabilities | |
| Other Long-Term Liabilities | |
| Other Long-Term Liabilities | Other Long-Term Liabilities | 153,194 | | | 153,004 | |
| Total Deferred Credits and Other Liabilities | Total Deferred Credits and Other Liabilities | 3,213,440 | | | 3,170,572 | |
| Long-Term Debt | Long-Term Debt | 4,216,488 | | | 4,215,379 | |
| Preferred Stock Not Subject to Mandatory Redemption | Preferred Stock Not Subject to Mandatory Redemption | 116,200 | | | 116,200 | |
| Common Stockholder's Equity: | Common Stockholder's Equity: | | | | Common Stockholder's Equity: | | | |
| Common Stock | Common Stock | 60,352 | | | 60,352 | |
| Capital Surplus, Paid In | Capital Surplus, Paid In | 3,260,765 | | | 3,010,765 | |
| Retained Earnings | Retained Earnings | 2,463,094 | | | 2,228,133 | |
| Accumulated Other Comprehensive Income | Accumulated Other Comprehensive Income | 169 | | | 251 | |
| Common Stockholder's Equity | Common Stockholder's Equity | 5,784,380 | | | 5,299,501 | |
| Commitments and Contingencies (Note 13) | Commitments and Contingencies (Note 13) | | | | Commitments and Contingencies (Note 13) | | | |
| Total Liabilities and Capitalization | Total Liabilities and Capitalization | $ | 14,758,796 | | | $ | 13,949,656 | |
The accompanying notes are an integral part of these financial statements.
THE CONNECTICUT LIGHT AND POWER COMPANY
STATEMENTS OF INCOME
| | | | For the Years Ended December 31, | | For the Years Ended December 31, |
| (Thousands of Dollars) | (Thousands of Dollars) | 2022 | | 2021 | | 2020 | (Thousands of Dollars) | 2023 | | 2022 | | 2021 |
| | Operating Revenues | Operating Revenues | $ | 4,817,744 | | | $ | 3,637,412 | | | $ | 3,547,527 | |
| Operating Revenues | |
| Operating Revenues | |
| | Operating Expenses: | |
| Operating Expenses: | |
| Operating Expenses: | Operating Expenses: | | | | | | | | | |
| Purchased Power and Transmission | Purchased Power and Transmission | 2,110,253 | | | 1,392,969 | | | 1,369,196 | |
| Operations and Maintenance | Operations and Maintenance | 707,162 | | | 644,175 | | | 572,897 | |
| Depreciation | Depreciation | 355,511 | | | 338,915 | | | 320,709 | |
| Amortization of Regulatory Assets, Net | 335,636 | | | 99,009 | | | 58,412 | |
| Amortization of Regulatory (Liabilities)/Assets, Net | |
| Energy Efficiency Programs | Energy Efficiency Programs | 134,222 | | | 129,564 | | | 141,453 | |
| Taxes Other Than Income Taxes | Taxes Other Than Income Taxes | 384,746 | | | 363,862 | | | 344,451 | |
| Total Operating Expenses | Total Operating Expenses | 4,027,530 | | | 2,968,494 | | | 2,807,118 | |
| Operating Income | Operating Income | 790,214 | | | 668,918 | | | 740,409 | |
| Interest Expense | Interest Expense | 169,348 | | | 166,107 | | | 153,547 | |
| Other Income, Net | Other Income, Net | 83,252 | | | 30,187 | | | 20,774 | |
| Income Before Income Tax Expense | Income Before Income Tax Expense | 704,118 | | | 532,998 | | | 607,636 | |
| Income Tax Expense | Income Tax Expense | 171,198 | | | 131,273 | | | 149,702 | |
| Net Income | Net Income | $ | 532,920 | | | $ | 401,725 | | | $ | 457,934 | |
The accompanying notes are an integral part of these financial statements.
STATEMENTS OF COMPREHENSIVE INCOME
| | | | For the Years Ended December 31, | | For the Years Ended December 31, |
| (Thousands of Dollars) | (Thousands of Dollars) | 2022 | | 2021 | | 2020 | (Thousands of Dollars) | 2023 | | 2022 | | 2021 |
| | Net Income | Net Income | $ | 532,920 | | | $ | 401,725 | | | $ | 457,934 | |
| Other Comprehensive Loss, Net of Tax: | | | | | |
| Net Income | |
| Net Income | |
| Other Comprehensive Income/(Loss), Net of Tax: | | Other Comprehensive Income/(Loss), Net of Tax: | | | |
| Qualified Cash Flow Hedging Instruments | Qualified Cash Flow Hedging Instruments | (26) | | | (26) | | | (26) | |
| Changes in Unrealized (Losses)/Gains on Marketable Securities | (56) | | | (25) | | | 12 | |
| Other Comprehensive Loss, Net of Tax | (82) | | | (51) | | | (14) | |
| Changes in Unrealized Gains/(Loss) on Marketable Securities | |
| Other Comprehensive Income/(Loss), Net of Tax | |
| Comprehensive Income | Comprehensive Income | $ | 532,838 | | | $ | 401,674 | | | $ | 457,920 | |
The accompanying notes are an integral part of these financial statements.
THE CONNECTICUT LIGHT AND POWER COMPANY
STATEMENTS OF COMMON STOCKHOLDER'S EQUITY
| | | | Common Stock | | Capital
Surplus,
Paid In | | Retained
Earnings | | Accumulated
Other
Comprehensive
Income | | Total
Common
Stockholder's
Equity | | Common Stock | | Capital
Surplus,
Paid In | | Retained
Earnings | | Accumulated
Other
Comprehensive
Income | | Total
Common
Stockholder's
Equity |
| (Thousands of Dollars, Except Stock Information) | (Thousands of Dollars, Except Stock Information) | Stock | | Amount | |
| Balance as of January 1, 2020 | 6,035,205 | | | $ | 60,352 | | | $ | 2,535,765 | | | $ | 1,791,392 | | | $ | 316 | | | $ | 4,387,825 | |
| Balance as of January 1, 2021 | |
| Balance as of January 1, 2021 | |
| Balance as of January 1, 2021 | |
| Net Income | Net Income | | | | | | | 457,934 | | | | | 457,934 | |
| Dividends on Preferred Stock | Dividends on Preferred Stock | | | | | | | (5,559) | | | | | (5,559) | |
| Dividends on Common Stock | Dividends on Common Stock | | | | | | | (69,500) | | | | | (69,500) | |
| Capital Contributions from Eversource Parent | Capital Contributions from Eversource Parent | | | | | 275,000 | | | | | | | 275,000 | |
| Adoption of Accounting Standards Update 2016-13 | | (900) | | | (900) | |
| Other Comprehensive Loss | | | | | | | | | (14) | | | (14) | |
| Balance as of December 31, 2020 | 6,035,205 | | | 60,352 | | | 2,810,765 | | | 2,173,367 | | | 302 | | | 5,044,786 | |
| Net Income | | | | | | | 401,725 | | | | | 401,725 | |
| Dividends on Preferred Stock | | | | | | | (5,559) | | | | | (5,559) | |
| Dividends on Common Stock | | | | | | | (341,400) | | | | | (341,400) | |
| Capital Contributions from Eversource Parent | | | | | 200,000 | | | | | | | 200,000 | |
| | Other Comprehensive Loss | Other Comprehensive Loss | | | | | | | | | (51) | | | (51) | |
| Balance as of December 31, 2021 | Balance as of December 31, 2021 | 6,035,205 | | | 60,352 | | | 3,010,765 | | | 2,228,133 | | | 251 | | | 5,299,501 | |
| Net Income | Net Income | | | | | | | 532,920 | | | | | 532,920 | |
| Dividends on Preferred Stock | Dividends on Preferred Stock | | | | | (5,559) | | | (5,559) | |
| Dividends on Common Stock | Dividends on Common Stock | | | | | (292,400) | | | (292,400) | |
| Capital Contributions from Eversource Parent | Capital Contributions from Eversource Parent | | | | | 250,000 | | | 250,000 | |
| | Other Comprehensive Loss | Other Comprehensive Loss | | | | | (82) | | | (82) | |
| Other Comprehensive Loss | |
| Other Comprehensive Loss | |
| Balance as of December 31, 2022 | Balance as of December 31, 2022 | 6,035,205 | | | $ | 60,352 | | | $ | 3,260,765 | | | $ | 2,463,094 | | | $ | 169 | | | $ | 5,784,380 | |
| Net Income | |
| Dividends on Preferred Stock | |
| Dividends on Common Stock | |
| Capital Contributions from Eversource Parent | |
| Other Comprehensive Income | |
| Balance as of December 31, 2023 | |
The accompanying notes are an integral part of these financial statements.
THE CONNECTICUT LIGHT AND POWER COMPANY
STATEMENTS OF CASH FLOWS
| | | | For the Years Ended December 31, | | For the Years Ended December 31, |
| (Thousands of Dollars) | (Thousands of Dollars) | 2022 | | 2021 | | 2020 | (Thousands of Dollars) | 2023 | | 2022 | | 2021 |
| | Operating Activities: | |
| Operating Activities: | |
| Operating Activities: | Operating Activities: | | | | | | | | |
| Net Income | Net Income | $ | 532,920 | | | $ | 401,725 | | | $ | 457,934 | |
| Adjustments to Reconcile Net Income to Net Cash Flows Provided by Operating Activities: | Adjustments to Reconcile Net Income to Net Cash Flows Provided by Operating Activities: | | | | | | Adjustments to Reconcile Net Income to Net Cash Flows Provided by Operating Activities: | | | |
| Depreciation | Depreciation | 355,511 | | | 338,915 | | | 320,709 | |
| Deferred Income Taxes | Deferred Income Taxes | 45,381 | | | 123,889 | | | 144,527 | |
| Uncollectible Expense | Uncollectible Expense | 15,578 | | | 13,495 | | | 12,882 | |
| Pension, SERP and PBOP (Income)/Expense, Net | Pension, SERP and PBOP (Income)/Expense, Net | (28,971) | | | 5,295 | | | 11,372 | |
| Pension Contributions | Pension Contributions | — | | | (98,913) | | | (23,200) | |
| Regulatory Under Recoveries, Net | (144,793) | | | (152,775) | | | (279,941) | |
| Regulatory Over/(Under) Recoveries, Net | |
(Customer Credits)/Reserve related to PURA Settlement Agreement and
Storm Performance Penalty | (Customer Credits)/Reserve related to PURA Settlement Agreement and
Storm Performance Penalty | (72,041) | | | 81,274 | | | — | |
| Amortization of Regulatory Assets, Net | 335,636 | | | 99,009 | | | 58,412 | |
| Amortization of Regulatory (Liabilities)/Assets, Net | |
| Cost of Removal Expenditures | Cost of Removal Expenditures | (71,596) | | | (95,792) | | | (57,343) | |
| Other | Other | (25,927) | | | (10,194) | | | (57,870) | |
| Changes in Current Assets and Liabilities: | Changes in Current Assets and Liabilities: | | | | | | Changes in Current Assets and Liabilities: | | | |
| Receivables and Unbilled Revenues, Net | Receivables and Unbilled Revenues, Net | (256,338) | | | (75,881) | | | (126,638) | |
| | Taxes Receivable/Accrued, Net | Taxes Receivable/Accrued, Net | 897 | | | (25,162) | | | (12,014) | |
| Taxes Receivable/Accrued, Net | |
| Taxes Receivable/Accrued, Net | |
| Accounts Payable | Accounts Payable | 207,698 | | | 24,895 | | | (17,028) | |
| Other Current Assets and Liabilities, Net | Other Current Assets and Liabilities, Net | (24,308) | | | (16,925) | | | (34,729) | |
| Net Cash Flows Provided by Operating Activities | Net Cash Flows Provided by Operating Activities | 869,647 | | | 612,855 | | | 397,073 | |
| | Investing Activities: | |
| Investing Activities: | |
| Investing Activities: | Investing Activities: | | | | | | | | |
| Investments in Property, Plant and Equipment | Investments in Property, Plant and Equipment | (876,740) | | | (790,083) | | | (833,973) | |
| Other Investing Activities | Other Investing Activities | 591 | | | 329 | | | 573 | |
| Net Cash Flows Used in Investing Activities | Net Cash Flows Used in Investing Activities | (876,149) | | | (789,754) | | | (833,400) | |
| | Financing Activities: | Financing Activities: | | | | | |
| Financing Activities: | |
| Financing Activities: | | | | |
| Cash Dividends on Common Stock | Cash Dividends on Common Stock | (292,400) | | | (341,400) | | | (69,500) | |
| Cash Dividends on Preferred Stock | Cash Dividends on Preferred Stock | (5,559) | | | (5,559) | | | (5,559) | |
| Decrease in Notes Payable to Eversource Parent | — | | | — | | | (63,800) | |
| Increase in Notes Payable to Eversource Parent | |
| Issuance of Long-Term Debt | Issuance of Long-Term Debt | — | | | 425,000 | | | 400,000 | |
| Retirement of Long-Term Debt | Retirement of Long-Term Debt | — | | | (120,500) | | | — | |
| Capital Contributions from Eversource Parent | Capital Contributions from Eversource Parent | 250,000 | | | 200,000 | | | 275,000 | |
| Other Financing Activities | Other Financing Activities | — | | | (5,663) | | | (4,976) | |
| Net Cash Flows (Used In)/Provided by Financing Activities | (47,959) | | | 151,878 | | | 531,165 | |
| Net (Decrease)/Increase in Cash and Restricted Cash | (54,461) | | | (25,021) | | | 94,838 | |
| Net Cash Flows Provided by/(Used In) Financing Activities | |
| Net Decrease in Cash and Restricted Cash | |
| Cash and Restricted Cash - Beginning of Year | Cash and Restricted Cash - Beginning of Year | 74,788 | | | 99,809 | | | 4,971 | |
| Cash and Restricted Cash - End of Year | Cash and Restricted Cash - End of Year | $ | 20,327 | | | $ | 74,788 | | | $ | 99,809 | |
The accompanying notes are an integral part of these financial statements.
Management’s Report on Internal Controls Over Financial Reporting
NSTAR Electric Company
Management is responsible for the preparation, integrity, and fair presentation of the accompanying consolidated financial statements of NSTAR Electric Company and subsidiary (NSTAR Electric or the Company) and of other sections of this annual report.
Management is responsible for establishing and maintaining adequate internal controls over financial reporting. The Company's internal control framework and processes have been designed to provide reasonable assurance regarding the reliability of financial reporting and the preparation of financial statements for external purposes in accordance with accounting principles generally accepted in the United States of America. There are inherent limitations of internal controls over financial reporting that could allow material misstatements due to error or fraud to occur and not be prevented or detected on a timely basis by employees during the normal course of business. Additionally, internal controls over financial reporting may become inadequate in the future due to changes in the business environment.
Under the supervision and with the participation of the principal executive officer and principal financial officer, NSTAR Electric conducted an evaluation of the effectiveness of internal controls over financial reporting based on criteria established in Internal Control – Integrated Framework (2013) issued by the Committee of Sponsoring Organizations of the Treadway Commission (COSO). Based on this evaluation under the framework in COSO, management concluded that internal controls over financial reporting were effective as of December 31, 2022.2023.
February 15, 202314, 2024
REPORT OF INDEPENDENT REGISTERED PUBLIC ACCOUNTING FIRM
To the Board of Directors and Stockholder of NSTAR Electric Company:
Opinion on the Financial Statements
We have audited the accompanying consolidated balance sheets of NSTAR Electric Company and subsidiary (the “Company”) as of December 31, 20222023 and 2021,2022, the related consolidated statements of income, comprehensive income, common stockholder’s equity, and cash flows, for each of the three years in the period ended December 31, 2022,2023, and the related notes and the schedule listed in the Index at Item 15 of Part IV (collectively referred to as the “financial statements”). In our opinion, the financial statements present fairly, in all material respects, the financial position of the Company as of December 31, 20222023 and 2021,2022, and the results of its operations and its cash flows for each of the three years in the period ended December 31, 20222023 in conformity with accounting principles generally accepted in the United States of America.
Basis for Opinion
These financial statements are the responsibility of the Company’s management. Our responsibility is to express an opinion on the Company’s financial statements based on our audits. We are a public accounting firm registered with the PCAOB and are required to be independent with respect to the Company in accordance with the U.S. federal securities laws and the applicable rules and regulations of the Securities and Exchange Commission and the PCAOB.
We conducted our audits in accordance with the standards of the PCAOB. Those standards require that we plan and perform the audit to obtain reasonable assurance about whether the financial statements are free of material misstatement, whether due to error or fraud. The Company is not required to have, nor were we engaged to perform, an audit of its internal control over financial reporting. As part of our audits, we are required to obtain an understanding of internal control over financial reporting but not for the purpose of expressing an opinion on the effectiveness of the Company’s internal control over financial reporting. Accordingly, we express no such opinion.
Our audits included performing procedures to assess the risks of material misstatement of the financial statements, whether due to error or fraud, and performing procedures that respond to those risks. Such procedures included examining, on a test basis, evidence regarding the amounts and disclosures in the financial statements. Our audits also included evaluating the accounting principles used and significant estimates made by management, as well as evaluating the overall presentation of the financial statements. We believe that our audits provide a reasonable basis for our opinion.
Critical Audit Matter
The critical audit matter communicated below is a matter arising from the current-period audit of the financial statements that was communicated or required to be communicated to the audit committee and that (1) relates to accounts or disclosures that are material to the financial statements and (2) involved our especially challenging, subjective, or complex judgments. The communication of critical audit matters does not alter in any way our opinion on the financial statements, taken as a whole, and we are not, by communicating the critical audit matter below, providing a separate opinion on the critical audit matter or on the accounts or disclosures to which it relates.
Regulatory Accounting - Impact of Rate Regulation on the Financial Statements - Refer to Note 2 to the Financial Statements
Critical Audit Matter Description
The Company is subject to rate regulation by the Federal Energy Regulatory Commission and the state public utility authority in Massachusetts (the “Commissions”). The rate regulation by these Commissions is based on cost recovery. The Company’s financial statements reflect the effects of the rate-making process. The rates charged to the customers are designed to collect the Company’s cost to provide service, plus a return on investment.
The application of accounting guidance for rate-regulated enterprises results in recording regulatory assets and liabilities. Regulatory assets represent the deferral of incurred costs that are probable of future recovery in customer rates. Regulatory assets are amortized as the incurred costs are recovered through customer rates. In some cases, the Company records regulatory assets before approval for recovery has been received from the applicable regulatory commission. The Company must use judgment to conclude that costs deferred as regulatory assets are probable of future recovery. The Company bases its conclusion on certain factors, including, but not limited to, regulatory precedent. Regulatory liabilities represent either revenues received from customers to fund expected costs that have not yet been incurred or probable future refunds to customers.
The Company uses judgment when recording regulatory assets and liabilities; however, regulatory commissions can reach different conclusions about the recovery of costs, and those conclusions could have a material impact on the Company’s financial statements. Management believes it is probable that the Company will recover its investment in long-lived assets, including regulatory assets. If management were to determine that it could no longer apply the accounting guidance applicable to rate-regulated enterprises to the Company’s operations, or if management could not conclude it is probable that costs would be recovered from customers in future rates, the costs would be charged to net income in the period in which the determination is made.
Accounting for the economics of rate-regulation impacts multiple financial statement line items and disclosures, such as regulated property, plant, and equipment, regulatory assets and liabilities, operating revenues, depreciation expense and amortization of regulatory assets. While management has indicated it expects to recover costs from customers through regulated rates, there is a risk that the Commissions will not approve full recovery of such costs or full recovery of all amounts invested in the Company and a reasonable return on that investment. We identified the impact of rate-regulation as a critical audit matter due to the significant judgments made by management to support its assertions about impact of future regulatory orders on the financial statements. Management judgments include assessing the probability of recovery in future rates of incurred costs and of a refund to customers. Given that management’s accounting judgments are based on assumptions about the outcome of future decisions by the Commissions, auditing these judgments requires specialized knowledge of accounting for rate regulation and the rate setting process due to its inherent complexities.
How the Critical Audit Matter Was Addressed in the Audit
Our audit procedures related to the uncertainty of future decisions by the Commissions included the following, among others:
• We tested the effectiveness of management’s controls over the evaluation of the likelihood of (1) the recovery in future rates of costs incurred as property, plant, and equipment and deferred as regulatory assets, and (2) a refund or a future reduction in rates that should be reported as regulatory liabilities. We tested the effectiveness of management’s controls over the initial recognition of amounts as property, plant, and equipment; regulatory assets or liabilities; and the monitoring and evaluation of regulatory developments that may affect the likelihood of recovering costs in future rates, a refund, or a future reduction in rates.
• We evaluated the Company’s disclosures related to the applicability and impacts of rate regulation, including the balances recorded and regulatory developments disclosed in the financial statements.
• We read relevant regulatory orders issued by the Commissions for the Company and other public utilities, regulatory statutes, interpretations, procedural memorandums, filings made by intervenors, and other publicly available information to assess the likelihood of recovery in future rates or of a future refund or reduction in rates based on precedents of the Commissions’ treatment of similar costs under similar circumstances. We also read the November 30, 2022 Massachusetts Department of Public Utilities final decision on the NSTAR Electric distribution rate case proceeding as well as the publicly available filings made by NSTAR Electric and related attachments. We evaluated the external information and compared it to management’s recorded regulatory asset and liability balances for completeness.
• For regulatory matters in process, we inspected the Company’s filings with the Commissions and the filings with the Commissions by intervenors that may impact the Company’s future rates, for any evidence that might contradict management’s assertions.
• We made inquiries of management, including legal counsel, and obtained the regulatory orders and analysis from management that support the probability of recovery, refund, or future reductions in rates for regulatory assets and liabilities to assess management’s assertion that amounts are probable of recovery, refund, or a future reduction in rates.
/s/ Deloitte & Touche LLP
Hartford, Connecticut
February 15, 202314, 2024
We have served as the Company’s auditor since 2012.
NSTAR ELECTRIC COMPANY AND SUBSIDIARY
CONSOLIDATED BALANCE SHEETS
| | | | As of December 31, | | As of December 31, |
| (Thousands of Dollars) | (Thousands of Dollars) | 2022 | | 2021 | (Thousands of Dollars) | 2023 | | 2022 |
| | ASSETS | ASSETS | | | |
| ASSETS | |
| ASSETS | | | | |
| Current Assets: | Current Assets: | | | | Current Assets: | | | |
| Cash | Cash | $ | 738 | | | $ | 745 | |
| Cash Equivalents | Cash Equivalents | 327,006 | | | — | |
Receivables, Net (net of allowance for uncollectible accounts of $94,958 and $97,005 as of December 31, 2022 and 2021, respectively) | 453,371 | | | 405,674 | |
Receivables, Net (net of allowance for uncollectible accounts of $97,026 and $94,958 as of December 31, 2023 and 2022, respectively) | |
| Accounts Receivable from Affiliated Companies | Accounts Receivable from Affiliated Companies | 35,196 | | | 67,420 | |
| Unbilled Revenues | Unbilled Revenues | 39,680 | | | 37,497 | |
| Materials, Supplies and REC Inventory | Materials, Supplies and REC Inventory | 138,352 | | | 116,712 | |
| Taxes Receivable | 45,474 | | | 80,617 | |
| | Regulatory Assets | |
| Regulatory Assets | |
| Regulatory Assets | Regulatory Assets | 492,759 | | | 443,956 | |
| Prepayments and Other Current Assets | Prepayments and Other Current Assets | 25,802 | | | 22,397 | |
| Total Current Assets | Total Current Assets | 1,558,378 | | | 1,175,018 | |
| Property, Plant and Equipment, Net | Property, Plant and Equipment, Net | 11,626,968 | | | 10,876,614 | |
| Deferred Debits and Other Assets: | Deferred Debits and Other Assets: | | | | Deferred Debits and Other Assets: | | | |
| Regulatory Assets | Regulatory Assets | 1,221,619 | | | 1,135,231 | |
| Prepaid Pension and PBOP | Prepaid Pension and PBOP | 576,809 | | | 441,426 | |
| Other Long-Term Assets | Other Long-Term Assets | 111,846 | | | 171,657 | |
| Total Deferred Debits and Other Assets | Total Deferred Debits and Other Assets | 1,910,274 | | | 1,748,314 | |
| Total Assets | Total Assets | $ | 15,095,620 | | | $ | 13,799,946 | |
| | LIABILITIES AND CAPITALIZATION | LIABILITIES AND CAPITALIZATION | | | |
| LIABILITIES AND CAPITALIZATION | |
| LIABILITIES AND CAPITALIZATION | | | | |
| Current Liabilities: | Current Liabilities: | | | | Current Liabilities: | | | |
| Notes Payable | Notes Payable | $ | — | | | $ | 162,500 | |
| Long-Term Debt – Current Portion | |
Long-Term Debt – Current Portion | |
Long-Term Debt – Current Portion | Long-Term Debt – Current Portion | 80,000 | | | 400,000 | |
| Accounts Payable | Accounts Payable | 559,676 | | | 490,915 | |
| Accounts Payable to Affiliated Companies | Accounts Payable to Affiliated Companies | 108,907 | | | 129,575 | |
| Obligations to Third Party Suppliers | Obligations to Third Party Suppliers | 142,628 | | | 116,273 | |
| Renewable Portfolio Standards Compliance Obligations | Renewable Portfolio Standards Compliance Obligations | 120,239 | | | 100,200 | |
| Regulatory Liabilities | Regulatory Liabilities | 373,221 | | | 228,248 | |
| Other Current Liabilities | Other Current Liabilities | 83,925 | | | 84,303 | |
| Total Current Liabilities | Total Current Liabilities | 1,468,596 | | | 1,712,014 | |
| Deferred Credits and Other Liabilities: | Deferred Credits and Other Liabilities: | | | | Deferred Credits and Other Liabilities: | | | |
| Accumulated Deferred Income Taxes | Accumulated Deferred Income Taxes | 1,700,875 | | | 1,579,508 | |
| Regulatory Liabilities | Regulatory Liabilities | 1,548,081 | | | 1,559,072 | |
| Accrued SERP | 1,619 | | | 2,046 | |
| | Other Long-Term Liabilities | |
| Other Long-Term Liabilities | |
| Other Long-Term Liabilities | Other Long-Term Liabilities | 287,694 | | | 345,888 | |
| Total Deferred Credits and Other Liabilities | Total Deferred Credits and Other Liabilities | 3,538,269 | | | 3,486,514 | |
| Long-Term Debt | Long-Term Debt | 4,345,085 | | | 3,585,399 | |
| Preferred Stock Not Subject to Mandatory Redemption | Preferred Stock Not Subject to Mandatory Redemption | 43,000 | | | 43,000 | |
| Common Stockholder's Equity: | Common Stockholder's Equity: | | | | Common Stockholder's Equity: | | | |
| Common Stock | Common Stock | — | | | — | |
| Capital Surplus, Paid In | Capital Surplus, Paid In | 2,778,942 | | | 2,253,942 | |
| Retained Earnings | Retained Earnings | 2,921,444 | | | 2,718,576 | |
| Accumulated Other Comprehensive Income | Accumulated Other Comprehensive Income | 284 | | | 501 | |
| Common Stockholder's Equity | Common Stockholder's Equity | 5,700,670 | | | 4,973,019 | |
| Commitments and Contingencies (Note 13) | Commitments and Contingencies (Note 13) | | | | Commitments and Contingencies (Note 13) | | | |
| Total Liabilities and Capitalization | Total Liabilities and Capitalization | $ | 15,095,620 | | | $ | 13,799,946 | |
The accompanying notes are an integral part of these consolidated financial statements.
NSTAR ELECTRIC COMPANY AND SUBSIDIARY
CONSOLIDATED STATEMENTS OF INCOME
| | | | For the Years Ended December 31, | | For the Years Ended December 31, |
| (Thousands of Dollars) | (Thousands of Dollars) | 2022 | | 2021 | | 2020 | (Thousands of Dollars) | 2023 | | 2022 | | 2021 |
| | Operating Revenues | Operating Revenues | $ | 3,583,070 | | | $ | 3,056,350 | | | $ | 2,941,148 | |
| Operating Revenues | |
| Operating Revenues | |
| | Operating Expenses: | Operating Expenses: | | | | |
| Operating Expenses: | |
| Operating Expenses: | |
| Purchased Power and Transmission | |
| Purchased Power and Transmission | |
| Purchased Power and Transmission | Purchased Power and Transmission | 1,264,824 | | | 932,530 | | | 879,244 | |
| Operations and Maintenance | Operations and Maintenance | 640,834 | | | 563,172 | | | 534,118 | |
| Depreciation | Depreciation | 361,969 | | | 337,451 | | | 319,468 | |
| Amortization of Regulatory Assets, Net | Amortization of Regulatory Assets, Net | 83,855 | | | 55,774 | | | 83,248 | |
| Energy Efficiency Programs | Energy Efficiency Programs | 332,247 | | | 288,612 | | | 263,986 | |
| Taxes Other Than Income Taxes | Taxes Other Than Income Taxes | 246,705 | | | 216,703 | | | 206,764 | |
| Total Operating Expenses | Total Operating Expenses | 2,930,434 | | | 2,394,242 | | | 2,286,828 | |
| Operating Income | Operating Income | 652,636 | | | 662,108 | | | 654,320 | |
| Interest Expense | Interest Expense | 162,892 | | | 146,048 | | | 130,508 | |
| Other Income, Net | Other Income, Net | 142,661 | | | 74,844 | | | 52,017 | |
| Income Before Income Tax Expense | Income Before Income Tax Expense | 632,405 | | | 590,904 | | | 575,829 | |
| Income Tax Expense | Income Tax Expense | 139,977 | | | 114,335 | | | 130,828 | |
| Net Income | Net Income | $ | 492,428 | | | $ | 476,569 | | | $ | 445,001 | |
The accompanying notes are an integral part of these consolidated financial statements.
CONSOLIDATED STATEMENTS OF COMPREHENSIVE INCOME
| | | | For the Years Ended December 31, | | For the Years Ended December 31, |
| (Thousands of Dollars) | (Thousands of Dollars) | 2022 | | 2021 | | 2020 | (Thousands of Dollars) | 2023 | | 2022 | | 2021 |
| | Net Income | Net Income | $ | 492,428 | | | $ | 476,569 | | | $ | 445,001 | |
| Net Income | |
| Net Income | |
| Other Comprehensive (Loss)/Income, Net of Tax: | Other Comprehensive (Loss)/Income, Net of Tax: | | | | | | Other Comprehensive (Loss)/Income, Net of Tax: | | | |
| Changes in Funded Status of SERP Benefit Plan | Changes in Funded Status of SERP Benefit Plan | (221) | | | (100) | | | (286) | |
| Qualified Cash Flow Hedging Instruments | Qualified Cash Flow Hedging Instruments | 20 | | | 298 | | | 437 | |
| Changes in Unrealized (Losses)/Gains on Marketable Securities | (16) | | | (6) | | | 3 | |
| Changes in Unrealized Gains/(Losses) on Marketable Securities | |
| Other Comprehensive (Loss)/Income, Net of Tax | Other Comprehensive (Loss)/Income, Net of Tax | (217) | | | 192 | | | 154 | |
| Comprehensive Income | Comprehensive Income | $ | 492,211 | | | $ | 476,761 | | | $ | 445,155 | |
The accompanying notes are an integral part of these consolidated financial statements.
NSTAR ELECTRIC COMPANY AND SUBSIDIARY
CONSOLIDATED STATEMENTS OF COMMON STOCKHOLDER'S EQUITY
| | | | Common Stock | | Capital
Surplus,
Paid In | | Retained
Earnings | | Accumulated
Other
Comprehensive
Income | | Total
Common
Stockholder's
Equity | | Common Stock | | Capital
Surplus,
Paid In | | Retained
Earnings | | Accumulated
Other
Comprehensive
Income | | Total
Common
Stockholder's
Equity |
| (Thousands of Dollars, Except Stock Information) | (Thousands of Dollars, Except Stock Information) | Stock | | Amount | |
| Balance as of January 1, 2020 | 200 | | | $ | — | | | $ | 1,813,442 | | | $ | 2,346,287 | | | $ | 155 | | | $ | 4,159,884 | |
| Net Income | | | | | | | 445,001 | | | | | 445,001 | |
| Dividends on Preferred Stock | | | | | | | (1,960) | | | | | (1,960) | |
| Dividends on Common Stock | | | | | | | (262,000) | | | | | (262,000) | |
| Capital Contributions from Eversource Parent | | | | | 180,500 | | | | | | | 180,500 | |
| Adoption of Accounting Standards Update 2016-13 | | (161) | | | (161) | |
| Other Comprehensive Income | | | | | | | | | 154 | | | 154 | |
| Balance as of December 31, 2020 | 200 | | | — | | | 1,993,942 | | | 2,527,167 | | | 309 | | | 4,521,418 | |
| Balance as of January 1, 2021 | |
| Balance as of January 1, 2021 | |
| Balance as of January 1, 2021 | |
| Net Income | Net Income | | | | | | | 476,569 | | | | | 476,569 | |
| Dividends on Preferred Stock | Dividends on Preferred Stock | | | | | | | (1,960) | | | | | (1,960) | |
| Dividends on Common Stock | Dividends on Common Stock | | | | | | | (283,200) | | | | | (283,200) | |
| Capital Contributions from Eversource Parent | Capital Contributions from Eversource Parent | | | | | 260,000 | | | | | | | 260,000 | |
| | Other Comprehensive Income | Other Comprehensive Income | | | | | | | | | 192 | | | 192 | |
| Other Comprehensive Income | |
| Other Comprehensive Income | |
| Balance as of December 31, 2021 | Balance as of December 31, 2021 | 200 | | | — | | | 2,253,942 | | | 2,718,576 | | | 501 | | | 4,973,019 | |
| Net Income | Net Income | | | | | | | 492,428 | | | | | 492,428 | |
| Dividends on Preferred Stock | Dividends on Preferred Stock | | | | | | | (1,960) | | | | | (1,960) | |
| Dividends on Common Stock | Dividends on Common Stock | | | | | | | (287,600) | | | | | (287,600) | |
| Capital Contributions from Eversource Parent | Capital Contributions from Eversource Parent | | | | | 525,000 | | | | | | | 525,000 | |
| | Other Comprehensive Loss | |
| Other Comprehensive Loss | |
| Other Comprehensive Loss | Other Comprehensive Loss | | | | | | | | | (217) | | | (217) | |
| Balance as of December 31, 2022 | Balance as of December 31, 2022 | 200 | | | $ | — | | | $ | 2,778,942 | | | $ | 2,921,444 | | | $ | 284 | | | $ | 5,700,670 | |
| Net Income | |
| Dividends on Preferred Stock | |
| Dividends on Common Stock | |
| Capital Contributions from Eversource Parent | |
| Other Comprehensive Loss | |
| Balance as of December 31, 2023 | |
The accompanying notes are an integral part of these consolidated financial statements.
NSTAR ELECTRIC COMPANY AND SUBSIDIARY
CONSOLIDATED STATEMENTS OF CASH FLOWS
| | | | For the Years Ended December 31, | | For the Years Ended December 31, |
| (Thousands of Dollars) | (Thousands of Dollars) | 2022 | | 2021 | | 2020 | (Thousands of Dollars) | 2023 | | 2022 | | 2021 |
| | Operating Activities: | Operating Activities: | | | | | |
| Operating Activities: | |
| Operating Activities: | | | | |
| Net Income | Net Income | $ | 492,428 | | | $ | 476,569 | | | $ | 445,001 | |
| Adjustments to Reconcile Net Income to Net Cash Flows Provided by Operating Activities: | Adjustments to Reconcile Net Income to Net Cash Flows Provided by Operating Activities: | | | | | | Adjustments to Reconcile Net Income to Net Cash Flows Provided by Operating Activities: | | | |
| Depreciation | Depreciation | 361,969 | | | 337,451 | | | 319,468 | |
| Deferred Income Taxes | Deferred Income Taxes | 78,039 | | | 57,507 | | | 72,595 | |
| Uncollectible Expense | |
| Pension, SERP and PBOP Income, Net | Pension, SERP and PBOP Income, Net | (55,830) | | | (26,120) | | | (18,132) | |
| Pension Contributions | Pension Contributions | (15,000) | | | (30,000) | | | (650) | |
| Regulatory Under Recoveries, Net | Regulatory Under Recoveries, Net | (88,220) | | | (79,075) | | | (186,081) | |
| Amortization of Regulatory Assets, Net | Amortization of Regulatory Assets, Net | 83,855 | | | 55,774 | | | 83,248 | |
| Uncollectible Expense | 21,550 | | | 16,649 | | | 15,293 | |
| Cost of Removal Expenditures | Cost of Removal Expenditures | (57,339) | | | (58,967) | | | (39,166) | |
| Payment of Withheld Property Taxes | (76,311) | | | — | | | — | |
| Payment in 2022 of Withheld Property Taxes | |
| Other | Other | (14,294) | | | (32,447) | | | (22,888) | |
| Changes in Current Assets and Liabilities: | Changes in Current Assets and Liabilities: | | | | | | Changes in Current Assets and Liabilities: | | | |
| Receivables and Unbilled Revenues, Net | Receivables and Unbilled Revenues, Net | (23,757) | | | (45,774) | | | (81,571) | |
| | Taxes Receivable/Accrued, Net | |
| Taxes Receivable/Accrued, Net | |
| Taxes Receivable/Accrued, Net | Taxes Receivable/Accrued, Net | 35,143 | | | (16,219) | | | (44,045) | |
| Accounts Payable | Accounts Payable | 8,815 | | | 31,650 | | | 25,573 | |
| Other Current Assets and Liabilities, Net | Other Current Assets and Liabilities, Net | 20,430 | | | 13,944 | | | (42,831) | |
| Net Cash Flows Provided by Operating Activities | Net Cash Flows Provided by Operating Activities | 771,478 | | | 700,942 | | | 525,814 | |
| | Investing Activities: | Investing Activities: | | | | | |
| Investing Activities: | |
| Investing Activities: | | | | |
| Investments in Property, Plant and Equipment | Investments in Property, Plant and Equipment | (954,281) | | | (960,949) | | | (907,000) | |
| | | Other Investing Activities | |
| | Other Investing Activities | |
| | Other Investing Activities | Other Investing Activities | 165 | | | 91 | | | 159 | |
| Net Cash Flows Used in Investing Activities | Net Cash Flows Used in Investing Activities | (954,116) | | | (960,858) | | | (906,841) | |
| | Financing Activities: | Financing Activities: | | | | | |
| Financing Activities: | |
| Financing Activities: | | | | |
| Cash Dividends on Common Stock | Cash Dividends on Common Stock | (287,600) | | | (283,200) | | | (262,000) | |
| Cash Dividends on Preferred Stock | Cash Dividends on Preferred Stock | (1,960) | | | (1,960) | | | (1,960) | |
| (Decrease)/Increase in Notes Payable | (162,500) | | | (32,500) | | | 184,500 | |
| Increase/(Decrease) in Notes Payable | |
| Decrease in Notes Payable to Eversource Parent | Decrease in Notes Payable to Eversource Parent | — | | | (21,300) | | | (9,000) | |
| Capital Contributions from Eversource Parent | Capital Contributions from Eversource Parent | 525,000 | | | 260,000 | | | 180,500 | |
| Issuance of Long-Term Debt | Issuance of Long-Term Debt | 850,000 | | | 600,000 | | | 400,000 | |
| Retirement of Long-Term Debt | Retirement of Long-Term Debt | (400,000) | | | (250,000) | | | (95,000) | |
| Other Financing Activities | Other Financing Activities | (13,188) | | | (10,355) | | | (4,915) | |
| Net Cash Flows Provided by Financing Activities | Net Cash Flows Provided by Financing Activities | 509,752 | | | 260,685 | | | 392,125 | |
| Net Increase in Cash, Cash Equivalents and Restricted Cash | 327,114 | | | 769 | | | 11,098 | |
| Net (Decrease)/Increase in Cash, Cash Equivalents and Restricted Cash | |
| Cash, Cash Equivalents and Restricted Cash - Beginning of Year | Cash, Cash Equivalents and Restricted Cash - Beginning of Year | 18,179 | | | 17,410 | | | 6,312 | |
| Cash, Cash Equivalents and Restricted Cash - End of Year | Cash, Cash Equivalents and Restricted Cash - End of Year | $ | 345,293 | | | $ | 18,179 | | | $ | 17,410 | |
The accompanying notes are an integral part of these consolidated financial statements.
Management’s Report on Internal Controls Over Financial Reporting
Public Service Company of New Hampshire
Management is responsible for the preparation, integrity, and fair presentation of the accompanying consolidated financial statements of Public Service Company of New Hampshire and subsidiaries (PSNH or the Company) and of other sections of this annual report.
Management is responsible for establishing and maintaining adequate internal controls over financial reporting. The Company's internal control framework and processes have been designed to provide reasonable assurance regarding the reliability of financial reporting and the preparation of financial statements for external purposes in accordance with accounting principles generally accepted in the United States of America. There are inherent limitations of internal controls over financial reporting that could allow material misstatements due to error or fraud to occur and not be prevented or detected on a timely basis by employees during the normal course of business. Additionally, internal controls over financial reporting may become inadequate in the future due to changes in the business environment.
Under the supervision and with the participation of the principal executive officer and principal financial officer, PSNH conducted an evaluation of the effectiveness of internal controls over financial reporting based on criteria established in Internal Control - Integrated Framework (2013) issued by the Committee of Sponsoring Organizations of the Treadway Commission (COSO). Based on this evaluation under the framework in COSO, management concluded that internal controls over financial reporting were effective as of December 31, 2022.2023.
February 15, 202314, 2024
REPORT OF INDEPENDENT REGISTERED PUBLIC ACCOUNTING FIRM
To the Board of Directors and Stockholder of Public Service Company of New Hampshire:
Opinion on the Financial Statements
We have audited the accompanying consolidated balance sheets of Public Service Company of New Hampshire and subsidiaries (the “Company”) as of December 31, 20222023 and 2021,2022, the related consolidated statements of income, comprehensive income, common stockholder’s equity, and cash flows, for each of the three years in the period ended December 31, 2022,2023, and the related notes and the schedule listed in the Index at Item 15 of Part IV (collectively referred to as the “financial statements”). In our opinion, the financial statements present fairly, in all material respects, the financial position of the Company as of December 31, 20222023 and 2021,2022, and the results of its operations and its cash flows for each of the three years in the period ended December 31, 2022,2023, in conformity with accounting principles generally accepted in the United States of America.
Basis for Opinion
These financial statements are the responsibility of the Company’s management. Our responsibility is to express an opinion on the Company’s financial statements based on our audits. We are a public accounting firm registered with the PCAOB and are required to be independent with respect to the Company in accordance with the U.S. federal securities laws and the applicable rules and regulations of the Securities and Exchange Commission and the PCAOB.
We conducted our audits in accordance with the standards of the PCAOB. Those standards require that we plan and perform the audit to obtain reasonable assurance about whether the financial statements are free of material misstatement, whether due to error or fraud. The Company is not required to have, nor were we engaged to perform, an audit of its internal control over financial reporting. As part of our audits, we are required to obtain an understanding of internal control over financial reporting but not for the purpose of expressing an opinion on the effectiveness of the Company’s internal control over financial reporting. Accordingly, we express no such opinion.
Our audits included performing procedures to assess the risks of material misstatement of the financial statements, whether due to error or fraud, and performing procedures that respond to those risks. Such procedures included examining, on a test basis, evidence regarding the amounts and disclosures in the financial statements. Our audits also included evaluating the accounting principles used and significant estimates made by management, as well as evaluating the overall presentation of the financial statements. We believe that our audits provide a reasonable basis for our opinion.
Critical Audit Matter
The critical audit matter communicated below is a matter arising from the current-period audit of the financial statements that was communicated or required to be communicated to the audit committee and that (1) relates to accounts or disclosures that are material to the financial statements and (2) involved our especially challenging, subjective, or complex judgments. The communication of critical audit matters does not alter in any way our opinion on the financial statements, taken as a whole, and we are not, by communicating the critical audit matter below, providing a separate opinion on the critical audit matter or on the accounts or disclosures to which it relates.
Regulatory Accounting - Impact of Rate Regulation on the Financial Statements - Refer to Note 2 to the Financial Statements
Critical Audit Matter Description
The Company is subject to rate regulation by the Federal Energy Regulatory Commission and the state public utility authority in New Hampshire (the “Commissions”). The rate regulation by these Commissions is based on cost recovery. The Company’s financial statements reflect the effects of the rate-making process. The rates charged to the customers are designed to collect the Company’s cost to provide service, plus a return on investment.
The application of accounting guidance for rate-regulated enterprises results in recording regulatory assets and liabilities. Regulatory assets represent the deferral of incurred costs that are probable of future recovery in customer rates. Regulatory assets are amortized as the incurred costs are recovered through customer rates. In some cases, the Company records regulatory assets before approval for recovery has been received from the applicable regulatory commission. The Company must use judgment to conclude that costs deferred as regulatory assets are probable of future recovery. The Company bases its conclusion on certain factors, including, but not limited to, regulatory precedent. Regulatory liabilities represent either revenues received from customers to fund expected costs that have not yet been incurred or probable future refunds to customers.
The Company uses judgment when recording regulatory assets and liabilities; however, regulatory commissions can reach different conclusions about the recovery of costs, and those conclusions could have a material impact on the Company’s financial statements. Management believes it is probable that the Company will recover its investment in long-lived assets, including regulatory assets. If management were to determine that it could no longer apply the accounting guidance applicable to rate-regulated enterprises to the Company’s operations, or if management could not conclude it is probable that costs would be recovered from customers in future rates, the costs would be charged to net income in the period in which the determination is made.
Accounting for the economics of rate-regulation impacts multiple financial statement line items and disclosures, such as regulated property, plant, and equipment, regulatory assets and liabilities, operating revenues, depreciation expense and amortization of regulatory assets. While management has indicated it expects to recover costs from customers through regulated rates, there is a risk that the Commissions will not approve full recovery of such costs or full recovery of all amounts invested in the Company and a reasonable return on that investment. We identified the impact of rate-regulation as a critical audit matter due to the significant judgments made by management to support its assertions about impact of future regulatory orders on the financial statements. Management judgments include assessing the probability of recovery in future rates of incurred costs and of a refund to customers. Given that management’s accounting judgments are based on assumptions about the outcome of future decisions by the Commissions, auditing these judgments requires specialized knowledge of accounting for rate regulation and the rate setting process due to its inherent complexities.
How the Critical Audit Matter Was Addressed in the Audit
Our audit procedures related to the uncertainty of future decisions by the Commissions included the following, among others:
• We tested the effectiveness of management’s controls over the evaluation of the likelihood of (1) the recovery in future rates of costs incurred as property, plant, and equipment and deferred as regulatory assets, and (2) a refund or a future reduction in rates that should be reported as regulatory liabilities. We tested the effectiveness of management’s controls over the initial recognition of amounts as property, plant, and equipment; regulatory assets or liabilities; and the monitoring and evaluation of regulatory developments that may affect the likelihood of recovering costs in future rates, a refund, or a future reduction in rates.
• We evaluated the Company’s disclosures related to the applicability and impacts of rate regulation, including the balances recorded and regulatory developments disclosed in the financial statements.
• We read relevant regulatory orders issued by the Commissions for the Company and other public utilities, regulatory statutes, interpretations, procedural memorandums, filings made by intervenors, and other publicly available information to assess the likelihood of recovery in future rates or of a future refund or reduction in rates based on precedents of the Commissions’ treatment of similar costs under similar circumstances. We evaluated the external information and compared it to management’s recorded regulatory asset and liability balances for completeness.
• For regulatory matters in process, we inspected the Company’s filings with the Commissions and the filings with the Commissions by intervenors that may impact the Company’s future rates, for any evidence that might contradict management’s assertions.
• We made inquiries of management, including legal counsel, and obtained the regulatory orders and analysis from management that support the probability of recovery, refund, or future reductions in rates for regulatory assets and liabilities to assess management’s assertion that amounts are probable of recovery, refund, or a future reduction in rates.
/s/ Deloitte & Touche LLP
Hartford, Connecticut
February 15, 202314, 2024
We have served as the Company’s auditor since 2002.
PUBLIC SERVICE COMPANY OF NEW HAMPSHIRE AND SUBSIDIARIES
CONSOLIDATED BALANCE SHEETS
| | | | As of December 31, | | As of December 31, |
| (Thousands of Dollars) | (Thousands of Dollars) | 2022 | | 2021 | (Thousands of Dollars) | 2023 | | 2022 |
| | ASSETS | ASSETS | | | |
| ASSETS | |
| ASSETS | | | | |
| Current Assets: | Current Assets: | | | | Current Assets: | | | |
| Cash | Cash | $ | 136 | | | $ | 15 | |
Receivables, Net (net of allowance for uncollectible accounts of $29,236 and $24,331 as of December 31, 2022 and 2021, respectively) | 173,337 | | | 124,232 | |
Receivables, Net (net of allowance for uncollectible accounts of $14,322 and $29,236 as of December 31, 2023 and 2022, respectively) | |
| Accounts Receivable from Affiliated Companies | Accounts Receivable from Affiliated Companies | 8,193 | | | 17,156 | |
| Unbilled Revenues | Unbilled Revenues | 72,713 | | | 53,937 | |
| Taxes Receivable | Taxes Receivable | 27,978 | | | 4,487 | |
| Materials, Supplies and REC Inventory | Materials, Supplies and REC Inventory | 34,521 | | | 25,930 | |
| Regulatory Assets | Regulatory Assets | 102,240 | | | 107,169 | |
| Special Deposits | Special Deposits | 33,140 | | | 31,390 | |
| | Prepayments and Other Current Assets | Prepayments and Other Current Assets | 13,297 | | | 17,622 | |
| Prepayments and Other Current Assets | |
| Prepayments and Other Current Assets | |
| Total Current Assets | Total Current Assets | 465,555 | | | 381,938 | |
| Property, Plant and Equipment, Net | Property, Plant and Equipment, Net | 4,060,224 | | | 3,656,462 | |
| Deferred Debits and Other Assets: | Deferred Debits and Other Assets: | | | | Deferred Debits and Other Assets: | | | |
| Regulatory Assets | Regulatory Assets | 593,974 | | | 679,182 | |
| Prepaid Pension | 66,384 | | | — | |
| Prepaid Pension and PBOP | |
| Other Long-Term Assets | Other Long-Term Assets | 16,517 | | | 23,202 | |
| Total Deferred Debits and Other Assets | Total Deferred Debits and Other Assets | 676,875 | | | 702,384 | |
| Total Assets | Total Assets | $ | 5,202,654 | | | $ | 4,740,784 | |
| | LIABILITIES AND CAPITALIZATION | |
| LIABILITIES AND CAPITALIZATION | |
| LIABILITIES AND CAPITALIZATION | LIABILITIES AND CAPITALIZATION | | | | | | |
| Current Liabilities: | Current Liabilities: | | | | Current Liabilities: | | | |
| Notes Payable to Eversource Parent | Notes Payable to Eversource Parent | $ | 173,300 | | | $ | 110,600 | |
Long-Term Debt – Current Portion | Long-Term Debt – Current Portion | 29,668 | | | — | |
Rate Reduction Bonds – Current Portion | Rate Reduction Bonds – Current Portion | 43,210 | | | 43,210 | |
| Accounts Payable | Accounts Payable | 291,556 | | | 166,452 | |
| Accounts Payable to Affiliated Companies | Accounts Payable to Affiliated Companies | 36,231 | | | 43,485 | |
| Regulatory Liabilities | Regulatory Liabilities | 161,963 | | | 120,176 | |
| | Other Current Liabilities | Other Current Liabilities | 59,616 | | | 63,005 | |
| Other Current Liabilities | |
| Other Current Liabilities | |
| Total Current Liabilities | Total Current Liabilities | 795,544 | | | 546,928 | |
| Deferred Credits and Other Liabilities: | Deferred Credits and Other Liabilities: | | | | Deferred Credits and Other Liabilities: | | | |
| Accumulated Deferred Income Taxes | Accumulated Deferred Income Taxes | 562,802 | | | 537,978 | |
| Regulatory Liabilities | Regulatory Liabilities | 391,628 | | | 381,366 | |
| Accrued Pension, SERP and PBOP | 6,508 | | | 30,184 | |
| | Other Long-Term Liabilities | |
| Other Long-Term Liabilities | |
| Other Long-Term Liabilities | Other Long-Term Liabilities | 30,579 | | | 34,080 | |
| Total Deferred Credits and Other Liabilities | Total Deferred Credits and Other Liabilities | 991,517 | | | 983,608 | |
| Long-Term Debt | Long-Term Debt | 1,134,914 | | | 1,163,833 | |
| Rate Reduction Bonds | Rate Reduction Bonds | 410,492 | | | 453,702 | |
| Common Stockholder's Equity: | Common Stockholder's Equity: | | | | Common Stockholder's Equity: | | | |
| Common Stock | Common Stock | — | | | — | |
| Capital Surplus, Paid In | Capital Surplus, Paid In | 1,298,134 | | | 1,088,134 | |
| Retained Earnings | Retained Earnings | 572,126 | | | 504,556 | |
| Accumulated Other Comprehensive (Loss)/Income | (73) | | | 23 | |
| Accumulated Other Comprehensive Loss | |
| Common Stockholder's Equity | Common Stockholder's Equity | 1,870,187 | | | 1,592,713 | |
| Commitments and Contingencies (Note 13) | Commitments and Contingencies (Note 13) | | | | Commitments and Contingencies (Note 13) | | | |
| Total Liabilities and Capitalization | Total Liabilities and Capitalization | $ | 5,202,654 | | | $ | 4,740,784 | |
The accompanying notes are an integral part of these consolidated financial statements.
PUBLIC SERVICE COMPANY OF NEW HAMPSHIRE AND SUBSIDIARIES
CONSOLIDATED STATEMENTS OF INCOME
| | | | For the Years Ended December 31, | | For the Years Ended December 31, |
| (Thousands of Dollars) | (Thousands of Dollars) | 2022 | | 2021 | | 2020 | (Thousands of Dollars) | 2023 | | 2022 | | 2021 |
| | Operating Revenues | Operating Revenues | $ | 1,474,799 | | | $ | 1,177,248 | | | $ | 1,079,095 | |
| Operating Revenues | |
| Operating Revenues | |
| | Operating Expenses: | |
| Operating Expenses: | |
| Operating Expenses: | Operating Expenses: | | | | | | | | |
| Purchased Power and Transmission | Purchased Power and Transmission | 665,478 | | | 370,271 | | | 364,067 | |
| Operations and Maintenance | Operations and Maintenance | 255,991 | | | 237,659 | | | 219,325 | |
| Depreciation | Depreciation | 127,962 | | | 120,065 | | | 100,372 | |
| Amortization of Regulatory Assets, Net | 42,867 | | | 86,832 | | | 52,804 | |
| Amortization of Regulatory (Liabilities)/Assets, Net | |
| Energy Efficiency Programs | Energy Efficiency Programs | 37,434 | | | 38,752 | | | 37,583 | |
| Taxes Other Than Income Taxes | Taxes Other Than Income Taxes | 95,301 | | | 91,465 | | | 81,611 | |
| Total Operating Expenses | Total Operating Expenses | 1,225,033 | | | 945,044 | | | 855,762 | |
| Operating Income | Operating Income | 249,766 | | | 232,204 | | | 223,333 | |
| Interest Expense | Interest Expense | 59,548 | | | 56,998 | | | 58,127 | |
| Other Income, Net | Other Income, Net | 32,666 | | | 14,565 | | | 13,786 | |
| Income Before Income Tax Expense | Income Before Income Tax Expense | 222,884 | | | 189,771 | | | 178,992 | |
| Income Tax Expense | Income Tax Expense | 51,314 | | | 39,433 | | | 31,680 | |
| Net Income | Net Income | $ | 171,570 | | | $ | 150,338 | | | $ | 147,312 | |
The accompanying notes are an integral part of these consolidated financial statements.
CONSOLIDATED STATEMENTS OF COMPREHENSIVE INCOME
| | | | For the Years Ended December 31, | | For the Years Ended December 31, |
| (Thousands of Dollars) | (Thousands of Dollars) | 2022 | | 2021 | | 2020 | (Thousands of Dollars) | 2023 | | 2022 | | 2021 |
| | Net Income | Net Income | $ | 171,570 | | | $ | 150,338 | | | $ | 147,312 | |
| Other Comprehensive (Loss)/Income, Net of Tax: | | | | | |
| Net Income | |
| Net Income | |
| Other Comprehensive Income/(Loss), Net of Tax: | | Other Comprehensive Income/(Loss), Net of Tax: | | | |
| Qualified Cash Flow Hedging Instruments | Qualified Cash Flow Hedging Instruments | — | | | 673 | | | 1,075 | |
| Changes in Unrealized (Losses)/Gains on Marketable Securities | (96) | | | (37) | | | 19 | |
| Other Comprehensive (Loss)/Income, Net of Tax | (96) | | | 636 | | | 1,094 | |
| Changes in Unrealized Gains/(Loss) on Marketable Securities | |
| Other Comprehensive Income/(Loss), Net of Tax | |
| Comprehensive Income | Comprehensive Income | $ | 171,474 | | | $ | 150,974 | | | $ | 148,406 | |
The accompanying notes are an integral part of these consolidated financial statements.
PUBLIC SERVICE COMPANY OF NEW HAMPSHIRE AND SUBSIDIARIES
CONSOLIDATED STATEMENTS OF COMMON STOCKHOLDER'S EQUITY
| | | | Common Stock | | Capital
Surplus,
Paid In | | Retained
Earnings | | Accumulated Other
Comprehensive
(Loss)/Income | | Total
Common
Stockholder's
Equity | | Common Stock | | Capital
Surplus,
Paid In | | Retained
Earnings | | Accumulated Other
Comprehensive
(Loss)/Income | | Total
Common
Stockholder's
Equity |
| (Thousands of Dollars, Except Stock Information) | (Thousands of Dollars, Except Stock Information) | Stock | | Amount | |
| Balance as of January 1, 2020 | 301 | | | $ | — | | | $ | 903,134 | | | $ | 490,306 | | | $ | (1,707) | | | $ | 1,391,733 | |
| Net Income | | | | | 147,312 | | | 147,312 | |
| Dividends on Common Stock | | | | | (22,300) | | | (22,300) | |
| Capital Contributions from Eversource Parent | | 25,000 | | | 25,000 | |
| Adoption of Accounting Standards Update 2016-13 | | (300) | | | (300) | |
| Other Comprehensive Income | | | | | 1,094 | | | 1,094 | |
| Balance as of December 31, 2020 | 301 | | | — | | | 928,134 | | | 615,018 | | | (613) | | | 1,542,539 | |
| Balance as of January 1, 2021 | |
| Balance as of January 1, 2021 | |
| Balance as of January 1, 2021 | |
| Net Income | Net Income | | | | | 150,338 | | | 150,338 | |
| Dividends on Common Stock | Dividends on Common Stock | | | | | (260,800) | | | (260,800) | |
| Capital Contributions from Eversource Parent | Capital Contributions from Eversource Parent | | 160,000 | | | 160,000 | |
| | Other Comprehensive Income | |
| Other Comprehensive Income | |
| Other Comprehensive Income | Other Comprehensive Income | | 636 | | | 636 | |
| Balance as of December 31, 2021 | Balance as of December 31, 2021 | 301 | | | — | | | 1,088,134 | | | 504,556 | | | 23 | | | 1,592,713 | |
| Net Income | Net Income | | | | | | | 171,570 | | | | | 171,570 | |
| Dividends on Common Stock | Dividends on Common Stock | | | | | (104,000) | | | | | (104,000) | |
| Capital Contributions from Eversource Parent | Capital Contributions from Eversource Parent | | 210,000 | | | 210,000 | |
| | Other Comprehensive Loss | Other Comprehensive Loss | | | | | | | | | (96) | | | (96) | |
| Other Comprehensive Loss | |
| Other Comprehensive Loss | |
| Balance as of December 31, 2022 | Balance as of December 31, 2022 | 301 | | | $ | — | | | $ | 1,298,134 | | | $ | 572,126 | | | $ | (73) | | | $ | 1,870,187 | |
| Net Income | |
| Dividends on Common Stock | |
| Capital Contributions from Eversource Parent | |
| | Other Comprehensive Income | |
| Other Comprehensive Income | |
| Other Comprehensive Income | |
| Balance as of December 31, 2023 | |
The accompanying notes are an integral part of these consolidated financial statements.
PUBLIC SERVICE COMPANY OF NEW HAMPSHIRE AND SUBSIDIARIES
CONSOLIDATED STATEMENTS OF CASH FLOWS
| | | | For the Years Ended December 31, | | For the Years Ended December 31, |
| (Thousands of Dollars) | (Thousands of Dollars) | 2022 | | 2021 | | 2020 | (Thousands of Dollars) | 2023 | | 2022 | | 2021 |
| | Operating Activities: | |
| Operating Activities: | |
| Operating Activities: | Operating Activities: | | | | | | | | |
| Net Income | Net Income | $ | 171,570 | | | $ | 150,338 | | | $ | 147,312 | |
| Adjustments to Reconcile Net Income to Net Cash Flows Provided by Operating Activities: | Adjustments to Reconcile Net Income to Net Cash Flows Provided by Operating Activities: | | | | | | Adjustments to Reconcile Net Income to Net Cash Flows Provided by Operating Activities: | | | |
| Depreciation | Depreciation | 127,962 | | | 120,065 | | | 100,372 | |
| Deferred Income Taxes | Deferred Income Taxes | 15,765 | | | (14,530) | | | 7,337 | |
| Uncollectible Expense | Uncollectible Expense | 9,211 | | | 13,113 | | | 5,164 | |
| Pension, SERP and PBOP Income, Net | Pension, SERP and PBOP Income, Net | (16,421) | | | (3,296) | | | (1,255) | |
| Pension Contributions | — | | | — | | | (19,500) | |
| Regulatory Over/(Under) Recoveries, Net | 53,181 | | | 32,587 | | | (45,830) | |
| Amortization of Regulatory Assets, Net | 42,867 | | | 86,832 | | | 52,804 | |
| | Regulatory (Under)/Over Recoveries, Net | |
| Regulatory (Under)/Over Recoveries, Net | |
| Regulatory (Under)/Over Recoveries, Net | |
| Amortization of Regulatory (Liabilities)/Assets, Net | |
| Cost of Removal Expenditures | Cost of Removal Expenditures | (39,895) | | | (30,804) | | | (22,063) | |
| Other | Other | 8,691 | | | (1,370) | | | 17,221 | |
| Changes in Current Assets and Liabilities: | Changes in Current Assets and Liabilities: | | | | | | Changes in Current Assets and Liabilities: | | | |
| Receivables and Unbilled Revenues, Net | Receivables and Unbilled Revenues, Net | (62,078) | | | (32,003) | | | (33,612) | |
| | Taxes Receivable/Accrued, Net | Taxes Receivable/Accrued, Net | (23,492) | | | 3,952 | | | (6,942) | |
| Taxes Receivable/Accrued, Net | |
| Taxes Receivable/Accrued, Net | |
| Accounts Payable | Accounts Payable | 81,046 | | | (3,256) | | | 27,270 | |
| Other Current Assets and Liabilities, Net | Other Current Assets and Liabilities, Net | (6,908) | | | 14,454 | | | (9,610) | |
| Net Cash Flows Provided by Operating Activities | Net Cash Flows Provided by Operating Activities | 361,499 | | | 336,082 | | | 218,668 | |
| | Investing Activities: | Investing Activities: | | | | | |
| Investing Activities: | |
| Investing Activities: | | | | |
| Investments in Property, Plant and Equipment | Investments in Property, Plant and Equipment | (485,611) | | | (326,379) | | | (342,586) | |
| | Other Investing Activities | Other Investing Activities | 1,013 | | | 562 | | | 982 | |
| | Other Investing Activities | |
| | Other Investing Activities | |
| Net Cash Flows Used in Investing Activities | Net Cash Flows Used in Investing Activities | (484,598) | | | (325,817) | | | (341,604) | |
| | Financing Activities: | |
| Financing Activities: | |
| Financing Activities: | Financing Activities: | | | | | | | | |
| Cash Dividends on Common Stock | Cash Dividends on Common Stock | (104,000) | | | (260,800) | | | (22,300) | |
| Increase in Notes Payable to Eversource Parent | Increase in Notes Payable to Eversource Parent | 62,700 | | | 64,300 | | | 19,300 | |
| Issuance of Long-Term Debt | Issuance of Long-Term Debt | — | | | 350,000 | | | 150,000 | |
| Retirement of Long-Term Debt | Retirement of Long-Term Debt | — | | | (282,000) | | | — | |
| Repayment of Rate Reduction Bonds | Repayment of Rate Reduction Bonds | (43,210) | | | (43,210) | | | (43,210) | |
| | Capital Contributions from Eversource Parent | Capital Contributions from Eversource Parent | 210,000 | | | 160,000 | | | 25,000 | |
| Capital Contributions from Eversource Parent | |
| Capital Contributions from Eversource Parent | |
| Other Financing Activities | Other Financing Activities | (705) | | | (2,984) | | | (2,987) | |
| Net Cash Flows Provided by/(Used In) Financing Activities | Net Cash Flows Provided by/(Used In) Financing Activities | 124,785 | | | (14,694) | | | 125,803 | |
| Net Increase/(Decrease) in Cash and Restricted Cash | 1,686 | | | (4,429) | | | 2,867 | |
| Net (Decrease)/Increase in Cash and Restricted Cash | |
| Cash and Restricted Cash - Beginning of Year | Cash and Restricted Cash - Beginning of Year | 35,126 | | | 39,555 | | | 36,688 | |
| Cash and Restricted Cash - End of Year | Cash and Restricted Cash - End of Year | $ | 36,812 | | | $ | 35,126 | | | $ | 39,555 | |
The accompanying notes are an integral part of these consolidated financial statements.
EVERSOURCE ENERGY AND SUBSIDIARIES
THE CONNECTICUT LIGHT AND POWER COMPANY
NSTAR ELECTRIC COMPANY AND SUBSIDIARY
PUBLIC SERVICE COMPANY OF NEW HAMPSHIRE AND SUBSIDIARIES
COMBINED NOTES TO FINANCIAL STATEMENTS
Refer to the Glossary of Terms included in this combined Annual Report on Form 10-K for abbreviations and acronyms used throughout the combined notes to the financial statements.
1. SUMMARY OF SIGNIFICANT ACCOUNTING POLICIES
A. About Eversource, CL&P, NSTAR Electric and PSNH
Eversource Energy is a public utility holding company primarily engaged, through its wholly-owned regulated utility subsidiaries, in the energy delivery business. Eversource Energy's wholly-owned regulated utility subsidiaries consist of CL&P, NSTAR Electric and PSNH (electric utilities), Yankee Gas, NSTAR Gas and EGMA (natural gas utilities), and Aquarion (water utilities). Eversource provides energy delivery and/or water service to approximately 4.4 million electric, natural gas and water customers through twelve regulated utilities in Connecticut, Massachusetts and New Hampshire.
Eversource, CL&P, NSTAR Electric and PSNH are reporting companies under the Securities Exchange Act of 1934. Eversource Energy is a public utility holding company under the Public Utility Holding Company Act of 2005. Arrangements among the regulated electric companies and other Eversource companies, outside agencies and other utilities covering interconnections, interchange of electric power and sales of utility property are subject to regulation by the FERC. Eversource's regulated companies are subject to regulation of rates, accounting and other matters by the FERC and/or applicable state regulatory commissions (the PURA for CL&P, Yankee Gas and Aquarion, the DPU for NSTAR Electric, NSTAR Gas, EGMA and Aquarion, and the NHPUC for PSNH and Aquarion).
CL&P, NSTAR Electric and PSNH furnish franchised retail electric service in Connecticut, Massachusetts and New Hampshire, respectively. NSTAR Gas and EGMA are engaged in the distribution and sale of natural gas to customers within Massachusetts and Yankee Gas is engaged in the distribution and sale of natural gas to customers within Connecticut. Aquarion is engaged in the collection, treatment and distribution of water in Connecticut, Massachusetts and New Hampshire. CL&P, NSTAR Electric and PSNH's results include the operations of their respective distribution and transmission businesses. The distribution business also includes the results of NSTAR Electric's solar power facilities.
Eversource Service, Eversource's service company, and several wholly-owned real estate subsidiaries of Eversource, provide support services to Eversource, including its regulated companies.
B. Basis of Presentation
The consolidated financial statements of Eversource, NSTAR Electric and PSNH include the accounts of each of their respective subsidiaries. Intercompany transactions have been eliminated in consolidation. The accompanying consolidated financial statements of Eversource, NSTAR Electric and PSNH and the financial statements of CL&P are herein collectively referred to as the "financial statements."
The preparation of the financial statements in conformity with GAAP requires management to make estimates and assumptions that affect the reported amounts of assets and liabilities and the disclosure of contingent liabilities as of the date of the financial statements and the reported amounts of revenues and expenses during the reporting period. Actual results could differ from those estimates.
CYAPC and YAEC are inactive regional nuclear power companies engaged in the long-term storage of their spent nuclear fuel. Eversource consolidates the operations of CYAPC and YAEC because CL&P's, NSTAR Electric's and PSNH's combined ownership and voting interests in each of these entities is greater than 50 percent. Intercompany transactions between CL&P, NSTAR Electric, PSNH and the CYAPC and YAEC companies have been eliminated in consolidation of the Eversource financial statements.
Eversource holds several equity ownership interests that are not consolidated and are accounted for under the equity method.method, including 50 percent ownership interests in three offshore wind projects and a tax equity investment in one of the projects. See Note 6, “Investments in Unconsolidated Affiliates,” for further information on Eversource’s equity method investments and impairment charges recorded in 2023 to the offshore wind investments carrying value.
In accordance with accounting guidance on noncontrolling interests in consolidated financial statements, the Preferred Stock of CL&P and the Preferred Stock of NSTAR Electric, which are not owned by Eversource or its consolidated subsidiaries and are not subject to mandatory redemption, have been presented as noncontrolling interests in the financial statements of Eversource. The Preferred Stock of CL&P and the Preferred Stock of NSTAR Electric are considered to be temporary equity and have been classified between liabilities and permanent shareholders' equity on the balance sheets of Eversource, CL&P and NSTAR Electric due to a provision in the preferred stock agreements of both CL&P and NSTAR Electric that grant preferred stockholders the right to elect a majority of the CL&P and NSTAR Electric Boards of Directors, respectively, should certain conditions exist, such as if preferred dividends are in arrears for a specified amount of time. The Net Income reported in the statements of income and cash flows represents net income prior to apportionment to noncontrolling interests, which is represented by dividends on preferred stock of CL&P and NSTAR Electric.
Eversource's utility subsidiaries' electric, natural gas and water distribution and transmission businesses are subject to rate-regulation that is based on cost recovery and meets the criteria for application of accounting guidance for entities with rate-regulated operations, which considers the effect of regulation on the differences in the timing of the recognition of certain revenues and expenses from those of other businesses and industries. See Note 2, "Regulatory Accounting," for further information.
As of December 31, 20222023 and 2021,2022, Eversource's carrying amount of goodwill was $4.52$4.53 billion and $4.48$4.52 billion, respectively. Eversource performs an assessment for possible impairment of its goodwill at least annually. Eversource completed its annual goodwill impairment assessment for each of its reporting units as of October 1, 20222023 and determined that no impairment exists. See Note 25,24, "Goodwill," for further information.
For the year ended December 31, 2022, no impairments to goodwill, long-lived assets, available-for-sale debt securities, or equity method investment carrying values were identified.
Certain reclassifications of prior year data were made in the accompanying financial statements to conform to the current year presentation.
C. Cash and Cash Equivalents
Cash includes cash on hand. At the end of each reporting period, any overdraft amounts are reclassified from Cash to Accounts Payable on the balance sheets. Cash Equivalents include short-term cash investments that are highly liquid in nature and have original maturities of three months or less.
D. Allowance for Uncollectible Accounts
Receivables, Net on the balance sheets primarily includes trade receivables from retail customers and customers related to wholesale transmission contracts, wholesale market sales, sales of RECs, and property rentals. Receivables, Net also includes customer receivables for the purchase of electricity from a competitive third party supplier, the current portion of customer energy efficiency loans, property damage receivables and other miscellaneous receivables. There is no material concentration of receivables.
Receivables are recorded at amortized cost, net of a credit loss provision (or allowance for uncollectible accounts). The current expected credit loss (CECL) model which was implemented on January 1, 2020 (ASU 2016-13), is applied to receivables for purposes of calculating the allowance for uncollectible accounts. This model is based on expected losses and results in the recognition of estimated expected credit losses, including uncollectible amounts for both billed and unbilled revenues, over the life of the receivable at the time a receivable is recorded.
The allowance for uncollectible accounts is determined based upon a variety of judgments and factors, including an aging-based quantitative assessment that applies an estimated uncollectible percentage to each receivable aging category. Factors in determining credit loss include historical collection, write-off experience, analysis of delinquency statistics, and management's assessment of collectability from customers, including current economic conditions, customer payment trends, the impact on customer bills because of energy usage trends and changes in rates, flexible payment plans and financial hardship arrearage management programs being offered to customers, reasonable forecasts, and expectations of future collectability and collection efforts. Management continuously assesses the collectability of receivables and adjusts estimates based on actual experience and future expectations based on economic conditions, collection efforts and other factors. Management also monitors the aging analysis of receivables to determine if there are changes in the collections of accounts receivable. Receivable balances are written off against the allowance for uncollectible accounts when the customer accounts are no longer in service and these balances are deemed to be uncollectible. Management concluded that the reserve balance as of December 31, 20222023 adequately reflected the collection risk and net realizable value for its receivables.
As of December 31, 2022 and 2021, the total amount incurred as a result of COVID-19 included in the allowance for uncollectible accounts was $50.9 million and $55.3 million at Eversource, $16.0 million and $23.9 million at CL&P, and $4.1 million and $9.0 million at NSTAR Electric, respectively. At our Connecticut and Massachusetts utilities, the COVID-19 related uncollectible amounts were deferred either as incremental regulatory costs or deferred through existing regulatory tracking mechanisms that recover uncollectible energy supply costs, as management believes it is probable that these costs will ultimately be recovered from customers in future rates. No COVID-19 related uncollectible amounts were deferred at PSNH as a result of a July 2021 NHPUC order. Based on the status of our COVID-19 regulatory dockets, policies and practices in the jurisdictions in which we operate, we believe the state regulatory commissions in Connecticut and Massachusetts will allow us to recover our incremental uncollectible customer receivable costs associated with COVID-19.
The PURA allows CL&P and Yankee Gas to accelerate the recovery of accounts receivable balances attributable to qualified customers under financial or medical duress (uncollectible hardship accounts receivable) outstanding for greater than 180 days and 90 days, respectively. The DPU allows NSTAR Electric, NSTAR Gas and EGMA to recover in rates amounts associated with certain uncollectible hardship accounts receivable. These uncollectible hardship customer account balances are included in Regulatory Assets or Other Long-Term Assets on the balance sheets. Hardship customers are protected from shut-off in certain circumstances, and historical collection experience has reflected a higher default risk as compared to the rest of the receivable population. Management uses a higher credit risk profile for this pool of trade receivables as compared to non-hardship receivables. The allowance for uncollectible hardship accounts is included in the total uncollectible allowance balance.
The total allowance for uncollectible accounts is included in Receivables, Net on the balance sheets. The activity in the allowance for uncollectible accounts by portfolio segment is as follows:
| | Eversource | | CL&P | | NSTAR Electric | | PSNH |
| Eversource | | | Eversource | | CL&P | | NSTAR Electric | | PSNH |
| (Millions of Dollars) | (Millions of Dollars) | Hardship Accounts | | Retail (Non-Hardship),
Wholesale, and Other | | Total Allowance | | Hardship Accounts | | Retail (Non-Hardship),
Wholesale, and Other | | Total Allowance | | Hardship Accounts | | Retail (Non-Hardship),
Wholesale, and Other | | Total Allowance | | Total Allowance | (Millions of Dollars) | Hardship Accounts | | Retail (Non-Hardship),
Wholesale, and Other | | Total Allowance | | Hardship Accounts | | Retail (Non-Hardship),
Wholesale, and Other | | Total Allowance | | Hardship Accounts | | Retail (Non-Hardship),
Wholesale, and Other | | Total Allowance | | Total Allowance (2) |
| Balance as of January 1, 2020 | $ | 143.3 | | | $ | 81.5 | | | $ | 224.8 | | | $ | 80.1 | | | $ | 17.2 | | | $ | 97.3 | | | $ | 43.9 | | | $ | 31.5 | | | $ | 75.4 | | | $ | 10.5 | |
ASU 2016-13 Implementation
Impact on January 1, 2020 | 21.6 | | | 2.2 | | | 23.8 | | | 21.3 | | | 0.9 | | | 22.2 | | | (1.6) | | | 0.3 | | | (1.3) | | | 0.3 | |
| Increase due to CMA acquisition | — | | | 24.2 | | | 24.2 | | | — | | | — | | | — | | | — | | | — | | | — | | | — | |
| Uncollectible Expense | — | | | 53.5 | | | 53.5 | | | — | | | 12.9 | | | 12.9 | | | — | | | 15.3 | | | 15.3 | | | 5.2 | |
Uncollectible Costs Deferred (1) | 43.1 | | | 53.9 | | | 97.0 | | | 38.2 | | | 10.8 | | | 49.0 | | | (1.7) | | | 26.4 | | | 24.7 | | | 7.4 | |
| Write-Offs | (14.7) | | | (63.3) | | | (78.0) | | | (11.9) | | | (17.8) | | | (29.7) | | | (0.9) | | | (26.3) | | | (27.2) | | | (6.9) | |
| Recoveries Collected | 1.5 | | | 12.1 | | | 13.6 | | | 1.4 | | | 4.3 | | | 5.7 | | | — | | | 4.7 | | | 4.7 | | | 0.7 | |
| Balance as of December 31, 2020 | $ | 194.8 | | | $ | 164.1 | | | $ | 358.9 | | | $ | 129.1 | | | $ | 28.3 | | | $ | 157.4 | | | $ | 39.7 | | | $ | 51.9 | | | $ | 91.6 | | | $ | 17.2 | |
| Balance as of January 1, 2021 | |
| Uncollectible Expense | Uncollectible Expense | — | | | 60.9 | | | 60.9 | | | — | | | 13.5 | | | 13.5 | | | — | | | 16.6 | | | 16.6 | | | 13.1 | |
Uncollectible Costs Deferred (1) | Uncollectible Costs Deferred (1) | 51.9 | | | 58.7 | | | 110.6 | | | 32.3 | | | 25.5 | | | 57.8 | | | 4.3 | | | 15.8 | | | 20.1 | | | 3.1 | |
| Write-Offs | Write-Offs | (22.0) | | | (107.7) | | | (129.7) | | | (18.0) | | | (36.2) | | | (54.2) | | | (0.7) | | | (36.3) | | | (37.0) | | | (10.0) | |
| Recoveries Collected | Recoveries Collected | 1.4 | | | 15.3 | | | 16.7 | | | 1.2 | | | 5.6 | | | 6.8 | | | — | | | 5.7 | | | 5.7 | | | 0.9 | |
| Balance as of December 31, 2021 | Balance as of December 31, 2021 | $ | 226.1 | | | $ | 191.3 | | | $ | 417.4 | | | $ | 144.6 | | | $ | 36.7 | | | $ | 181.3 | | | $ | 43.3 | | | $ | 53.7 | | | $ | 97.0 | | | $ | 24.3 | |
| Uncollectible Expense | Uncollectible Expense | — | | | 61.9 | | | 61.9 | | | — | | | 15.6 | | | 15.6 | | | — | | | 21.6 | | | 21.6 | | | 9.2 | |
Uncollectible Costs Deferred (1) | Uncollectible Costs Deferred (1) | 77.8 | | | 34.7 | | | 112.5 | | | 58.3 | | | 1.2 | | | 59.5 | | | 1.5 | | | 10.9 | | | 12.4 | | | 2.5 | |
| Write-Offs | Write-Offs | (21.3) | | | (102.7) | | | (124.0) | | | (15.3) | | | (23.0) | | | (38.3) | | | (1.1) | | | (41.2) | | | (42.3) | | | (7.7) | |
| Recoveries Collected | Recoveries Collected | 1.8 | | | 16.7 | | | 18.5 | | | 1.3 | | | 5.9 | | | 7.2 | | | — | | | 6.3 | | | 6.3 | | | 0.9 | |
| Balance as of December 31, 2022 | Balance as of December 31, 2022 | $ | 284.4 | | | $ | 201.9 | | | $ | 486.3 | | | $ | 188.9 | | | $ | 36.4 | | | $ | 225.3 | | | $ | 43.7 | | | $ | 51.3 | | | $ | 95.0 | | | $ | 29.2 | |
| Uncollectible Expense | |
Uncollectible Costs Deferred (1) | |
| Write-Offs | |
| Recoveries Collected | |
| Balance as of December 31, 2023 | |
(1) These expected credit losses are deferred as regulatory costs on the balance sheets, as these amounts are ultimately recovered in rates. Amounts include uncollectible costs for hardship accounts and other customer receivables, including uncollectible amounts related to uncollectible energy supply costs and COVID-19. The increase in the allowance for uncollectible hardship accounts in both 2023 and 2022 at Eversource and CL&P primarily relates to increased customer enrollment in disconnection prevention programs in Connecticut.
(2) In connection with PSNH’s pole purchase agreement on May 1, 2023, the purchase price included the forgiveness of previously reserved receivables for reimbursement of operation and maintenance and vegetation management costs.
E. Transfer of Energy Efficiency Loans
CL&P transferred a portion of its energy efficiency customer loan portfolio to outside lenders in order to make additional loans to customers. CL&P remains the servicer of the loans and will transmit customer payments to the lenders, with a maximum amount outstanding under this program of $55 million. The amounts of the loans are included in Accounts Receivable,Receivables, Net and Other Long-Term Assets, and are offset by Other Current Liabilities and Other Long-Term Liabilities on CL&P’s balance sheet. The current and long-term portions totaled $8.5 million and $14.5 million, respectively, as of December 31, 2023, and $9.1 million and $13.0 million, respectively, as of December 31, 2022, and $10.5 million and $8.3 million, respectively, as of December 31, 2021.2022.
F. Materials, Supplies, Natural Gas and REC Inventory
Materials, Supplies, Natural Gas and REC Inventory include materials and supplies purchased primarily for construction or operation and maintenance purposes, natural gas purchased for delivery to customers, and RECs. Inventory is valued at the lower of cost or net realizable value. RECs are purchased from suppliers of renewable sources of generation and are used to meet state mandated Renewable Portfolio Standards requirements. The carrying amounts of materials and supplies, natural gas inventory, and RECs, which are included in Current Assets on the balance sheets, were as follows:
| | | | As of December 31, | | As of December 31, |
| | | 2022 | | 2021 | | 2023 | | 2022 |
| (Millions of Dollars) | (Millions of Dollars) | Eversource | | CL&P | | NSTAR Electric | | PSNH | | Eversource | | CL&P | | NSTAR Electric | | PSNH | (Millions of Dollars) | Eversource | | CL&P | | NSTAR Electric | | PSNH | | Eversource | | CL&P | | NSTAR Electric | | PSNH |
| Materials and Supplies | Materials and Supplies | $ | 221.0 | | | $ | 88.2 | | | $ | 81.0 | | | $ | 34.4 | | | $ | 148.9 | | | $ | 60.3 | | | $ | 55.0 | | | $ | 25.2 | |
| Natural Gas | Natural Gas | 95.9 | | | — | | | — | | | — | | | 56.2 | | | — | | | — | | | — | |
| RECs | RECs | 57.5 | | | — | | | 57.4 | | | 0.1 | | | 62.4 | | | — | | | 61.7 | | | 0.7 | |
| Total | Total | $ | 374.4 | | | $ | 88.2 | | | $ | 138.4 | | | $ | 34.5 | | | $ | 267.5 | | | $ | 60.3 | | | $ | 116.7 | | | $ | 25.9 | |
G. Fair Value Measurements
Fair value measurement guidance is applied to derivative contracts that are not elected or designated as "normal purchases" or "normal sales" (normal) and to marketable securities held in trusts. Fair value measurement guidance is also applied to valuations of the investments used to calculate the funded status of pension and PBOP plans, the nonrecurring fair value measurements of nonfinancial assets such as goodwill, long-lived assets, equity method investments, AROs, and in the valuation of business combinations and asset acquisitions. The fair value measurement guidance was also applied in estimating the fair value of preferred stock, long-term debt and RRBs.
Fair Value Hierarchy: In measuring fair value, Eversource uses observable market data when available in order to minimize the use of unobservable inputs. Inputs used in fair value measurements are categorized into three fair value hierarchy levels for disclosure purposes. The entire fair value measurement is categorized based on the lowest level of input that is significant to the fair value measurement. Eversource evaluates the classification of assets and liabilities measured at fair value on a quarterly basis.
The levels of the fair value hierarchy are described below:
Level 1 - Inputs are quoted prices (unadjusted) in active markets for identical assets or liabilities as of the reporting date. Active markets are those in which transactions for the asset or liability occur in sufficient frequency and volume to provide pricing information on an ongoing basis.
Level 2 - Inputs are quoted prices for similar instruments in active markets, quoted prices for identical or similar instruments in markets that are not active, and model-derived valuations in which all significant inputs are observable.
Level 3 - Quoted market prices are not available. Fair value is derived from valuation techniques in which one or more significant inputs or assumptions are unobservable. Where possible, valuation techniques incorporate observable market inputs that can be validated to external sources such as industry exchanges, including prices of energy and energy-related products.
Uncategorized - Investments that are measured at net asset value are not categorized within the fair value hierarchy.
Determination of Fair Value: The valuation techniques and inputs used in Eversource's fair value measurements are described in Note 4, "Derivative Instruments," Note 5, "Marketable Securities," Note 6, "Investments in Unconsolidated Affiliates," Note 7, "Asset Retirement Obligations," Note 11A, "Employee Benefits – Pension Benefits and Postretirement Benefits Other Than Pension," Note 15, "Fair Value of Financial Instruments," and Note 25,24, “Goodwill,” to the financial statements.
H. Derivative Accounting
Many of the electric and natural gas companies' contracts for the purchase and sale of energy or energy-related products are derivatives. The accounting treatment for energy contracts entered into varies and depends on the intended use of the particular contract and on whether or not the contract is a derivative.
The application of derivative accounting is complex and requires management judgment in the following respects: identification of derivatives and embedded derivatives, election and designation of a contract as normal, and determination of the fair value of derivative contracts. All of these judgments can have a significant impact on the financial statements. The judgment applied in the election of a contract as normal (and resulting accrual accounting) includes the conclusion that it is probable at the inception of the contract and throughout its term that it will result in physical delivery of the underlying product and that the quantities will be used or sold by the business in the normal course of business. If facts and circumstances change and management can no longer support this conclusion, then a contract cannot be considered normal, accrual accounting is terminated, and fair value accounting is applied prospectively.
The fair value of derivative contracts is based upon the contract terms and conditions and the underlying market price or fair value per unit. When quantities are not specified in the contract, the Company determines whether the contract has a determinable quantity by using amounts referenced in default provisions and other relevant sections of the contract. The fair value of derivative assets and liabilities with the same counterparty are offset and recorded as a net derivative asset or liability on the balance sheets.
Regulatory assets or regulatory liabilities are recorded to offset the fair values of these derivative contracts related to energy and energy-related products, as contract settlements are recovered from, or refunded to, customers in future rates. All changes in the fair value of these derivative contracts are recorded as regulatory assets or liabilities and do not impact net income.
For further information regarding derivative contracts, see Note 4, "Derivative Instruments," to the financial statements.
I. Operating Expenses
The cost of natural gas included in Purchased Power, Purchased Natural Gas and Transmission on the statements of income were as follows:
| | | | For the Years Ended December 31, | | For the Years Ended December 31, |
| (Millions of Dollars) | (Millions of Dollars) | 2022 | | 2021 | | 2020 | (Millions of Dollars) | 2023 | | 2022 | | 2021 |
| Eversource - Cost of Natural Gas | Eversource - Cost of Natural Gas | $ | 1,010.2 | | | $ | 718.6 | | | $ | 464.2 | |
J. Allowance for Funds Used During Construction
AFUDC represents the cost of borrowed and equity funds used to finance construction and is included in the cost of the electric, natural gas and water companies' utility plant on the balance sheet. The portion of AFUDC attributable to borrowed funds is recorded as a reduction of Interest Expense, and the AFUDC related to equity funds is recorded as Other Income, Net on the statements of income. AFUDC costs are recovered from customers over the service life of the related plant in the form of increased revenue collected as a result of higher depreciation expense.
The average AFUDC rate is based on a FERC-prescribed formula using the cost of a company's short-term financings and capitalization (preferred stock, long-term debt and common equity), as appropriate. The average rate is applied to average eligible CWIP amounts to calculate AFUDC.
AFUDC costs and the weighted-average AFUDC rates were as follows:
| | Eversource | Eversource | For the Years Ended December 31, | Eversource | For the Years Ended December 31, |
| (Millions of Dollars, except percentages) | (Millions of Dollars, except percentages) | 2022 | | 2021 | | 2020 | (Millions of Dollars, except percentages) | 2023 | | 2022 | | 2021 |
| Borrowed Funds | Borrowed Funds | $ | 21.8 | | | $ | 18.4 | | | $ | 23.7 | |
| Equity Funds | Equity Funds | 47.3 | | | 37.3 | | | 42.0 | |
| Total AFUDC | Total AFUDC | $ | 69.1 | | | $ | 55.7 | | | $ | 65.7 | |
| Average AFUDC Rate | Average AFUDC Rate | 4.7 | % | | 4.2 | % | | 5.0 | % | Average AFUDC Rate | 5.8 | % | | 4.7 | % | | 4.2 | % |
| | | | For the Years Ended December 31, | | For the Years Ended December 31, |
| | | 2022 | | 2021 | | 2020 | | 2023 | | 2022 | | 2021 |
(Millions of Dollars,
except percentages) | (Millions of Dollars,
except percentages) | CL&P | | NSTAR
Electric | | PSNH | | CL&P | | NSTAR
Electric | | PSNH | | CL&P | | NSTAR
Electric | | PSNH | (Millions of Dollars,
except percentages) | CL&P | | NSTAR
Electric | | PSNH | | CL&P | | NSTAR
Electric | | PSNH | | CL&P | | NSTAR
Electric | | PSNH |
| Borrowed Funds | Borrowed Funds | $ | 4.8 | | | $ | 10.7 | | | $ | 1.4 | | | $ | 2.9 | | | $ | 9.0 | | | $ | 0.8 | | | $ | 6.6 | | | $ | 9.1 | | | $ | 2.1 | |
| Equity Funds | Equity Funds | 13.6 | | | 24.6 | | | 2.5 | | | 7.7 | | | 20.4 | | | 1.6 | | | 13.8 | | | 21.5 | | | 4.2 | |
| Total AFUDC | Total AFUDC | $ | 18.4 | | | $ | 35.3 | | | $ | 3.9 | | | $ | 10.6 | | | $ | 29.4 | | | $ | 2.4 | | | $ | 20.4 | | | $ | 30.6 | | | $ | 6.3 | |
| Average AFUDC Rate | Average AFUDC Rate | 6.6 | % | | 5.4 | % | | 2.6 | % | | 5.0 | % | | 4.9 | % | | 2.5 | % | | 5.9 | % | | 5.7 | % | | 4.7 | % | Average AFUDC Rate | 6.7 | % | | 5.9 | % | | 5.1 | % | | 6.6 | % | | 5.4 | % | | 2.6 | % | | 5.0 | % | | 4.9 | % | | 2.5 | % |
K. Other Income, Net
The components of Other Income, Net on the statements of income were as follows:
| | Eversource | Eversource | For the Years Ended December 31, | Eversource | For the Years Ended December 31, |
| (Millions of Dollars) | (Millions of Dollars) | 2022 | | 2021 | | 2020 | (Millions of Dollars) | 2023 | | 2022 | | 2021 |
Pension, SERP and PBOP Non-Service Income Components, Net of Deferred Portion (1) | Pension, SERP and PBOP Non-Service Income Components, Net of Deferred Portion (1) | $ | 219.8 | | | $ | 84.4 | | | $ | 44.4 | |
| AFUDC Equity | AFUDC Equity | 47.3 | | | 37.3 | | | 42.0 | |
Equity in Earnings of Unconsolidated Affiliates (2) | Equity in Earnings of Unconsolidated Affiliates (2) | 22.9 | | | 14.2 | | | 14.2 | |
| Investment Income/(Loss) | 1.9 | | | (0.2) | | | 1.1 | |
| Investment (Loss)/Income | |
| Interest Income | Interest Income | 50.5 | | | 25.6 | | | 4.8 | |
| Gain on Sale of Property | 2.6 | | | 0.1 | | | 1.8 | |
| Other | 1.1 | | | (0.1) | | | 0.3 | |
| Other (2) | |
Other (2) | |
Other (2) | |
| Total Other Income, Net | Total Other Income, Net | $ | 346.1 | | | $ | 161.3 | | | $ | 108.6 | |
| | | | For the Years Ended December 31, | | For the Years Ended December 31, |
| | | 2022 | | 2021 | | 2020 | | 2023 | | 2022 | | 2021 |
| (Millions of Dollars) | (Millions of Dollars) | CL&P | | NSTAR
Electric | | PSNH | | CL&P | | NSTAR
Electric | | PSNH | | CL&P | | NSTAR
Electric | | PSNH | (Millions of Dollars) | CL&P | | NSTAR
Electric | | PSNH | | CL&P | | NSTAR
Electric | | PSNH | | CL&P | | NSTAR
Electric | | PSNH |
Pension, SERP and PBOP Non-Service Income Components, Net of Deferred Portion (1) | Pension, SERP and PBOP Non-Service Income Components, Net of Deferred Portion (1) | $ | 64.4 | | | $ | 85.5 | | | $ | 26.8 | | | $ | 15.2 | | | $ | 40.2 | | | $ | 10.3 | | | $ | 3.8 | | | $ | 29.3 | | | $ | 7.0 | |
| AFUDC Equity | AFUDC Equity | 13.6 | | | 24.6 | | | 2.5 | | | 7.7 | | | 20.4 | | | 1.6 | | | 13.8 | | | 21.5 | | | 4.2 | |
| | Investment (Loss)/Income | |
| Investment (Loss)/Income | |
| Investment (Loss)/Income | Investment (Loss)/Income | (1.3) | | | 1.2 | | | 0.2 | | | 1.3 | | | 0.1 | | | 0.1 | | | 1.1 | | | (0.8) | | | 0.1 | |
| Interest Income | Interest Income | 6.5 | | | 30.7 | | | 3.1 | | | 5.9 | | | 13.4 | | | 2.4 | | | 2.0 | | | 0.9 | | | 2.4 | |
| Other | Other | 0.1 | | | 0.7 | | | 0.1 | | | 0.1 | | | 0.7 | | | 0.2 | | | 0.1 | | | 1.1 | | | 0.1 | |
| Total Other Income, Net | Total Other Income, Net | $ | 83.3 | | | $ | 142.7 | | | $ | 32.7 | | | $ | 30.2 | | | $ | 74.8 | | | $ | 14.6 | | | $ | 20.8 | | | $ | 52.0 | | | $ | 13.8 | |
(1) See Note 11A, "Employee Benefits – Pension Benefits and Postretirement Benefits Other Than Pension," for the components of net periodic benefit income/expense for the Pension, SERP and PBOP Plans. The non-service related components of pension, SERP and PBOP benefit income/expense, after capitalization or deferral, are presented as non-operating income and recorded in Other Income, Net on the statements of income.
(2) EquityEversource’s equity method investment in earningsa renewable energy fund was liquidated in March 2023. Liquidation proceeds in excess of unconsolidated affiliates includes $12.2 million and $2.1 million of pre-tax unrealized gainsthe carrying value were recorded in 2023 within Other in the table above. See Note 6, “Investments in Unconsolidated Affiliates,” for further information. For the years ended December 31, 2022 and 2021, respectively,pre-tax income of $12.2 million and $2.4$2.1 million, of primarily realized gains for the year ended December 31, 2020,respectively, associated with an equity methodthis investment was included in a renewable energy fund. Equity in earningsEarnings of unconsolidated affiliates forUnconsolidated Affiliates within Other Income, Net in the year ended December 31, 2020 includes an other-than-temporary impairment of $2.8 million related to a write-off of an investment within a renewable energy fund. See Note 6, "Investments in Unconsolidated Affiliates," for Eversource’s equity method investments.table above.
L. Other Taxes
Eversource's companies that serve customers in Connecticut collect gross receipts taxes levied by the state of Connecticut from their customers. These gross receipts taxes are recorded separately with collections in Operating Revenues and with payments in Taxes Other Than Income Taxes on the statements of income as follows:
| | | | For the Years Ended December 31, | | For the Years Ended December 31, |
| (Millions of Dollars) | (Millions of Dollars) | 2022 | | 2021 | | 2020 | (Millions of Dollars) | 2023 | | 2022 | | 2021 |
| Eversource | Eversource | $ | 194.7 | | | $ | 181.9 | | | $ | 170.6 | |
| CL&P | CL&P | 166.1 | | | 158.1 | | | 149.9 | |
As agents for state and local governments, Eversource's companies that serve customers in Connecticut and Massachusetts collect certain sales taxes that are recorded on a net basis with no impact on the statements of income.
M. Supplemental Cash Flow Information | | | | | | | | | | | | | | | | | |
Eversource (Millions of Dollars) | As of and For the Years Ended December 31, |
| 2023 | | 2022 | | 2021 |
| Cash Paid During the Year for: | | | | | |
| Interest, Net of Amounts Capitalized | $ | 783.2 | | | $ | 636.2 | | | $ | 568.7 | |
| Income Taxes | 39.2 | | | 77.9 | | | 121.6 | |
| Non-Cash Investing Activities: | | | | | |
| Plant Additions Included in Accounts Payable (As of) | 564.1 | | | 586.9 | | | 467.9 | |
| | | | | | | | | | | | | | | | | |
Eversource (Millions of Dollars) | As of and For the Years Ended December 31, |
| 2022 | | 2021 | | 2020 |
| Cash Paid During the Year for: | | | | | |
| Interest, Net of Amounts Capitalized | $ | 636.2 | | | $ | 568.7 | | | $ | 518.0 | |
| Income Taxes | 77.9 | | | 121.6 | | | 48.9 | |
| Non-Cash Investing Activities: | | | | | |
| Plant Additions Included in Accounts Payable (As of) | 586.9 | | | 467.9 | | | 367.2 | |
| | | | As of and For the Years Ended December 31, | | As of and For the Years Ended December 31, |
| | | 2022 | | 2021 | | 2020 | | 2023 | | 2022 | | 2021 |
| (Millions of Dollars) | (Millions of Dollars) | CL&P | | NSTAR
Electric | | PSNH | | CL&P | | NSTAR
Electric | | PSNH | | CL&P | | NSTAR
Electric | | PSNH | (Millions of Dollars) | CL&P | | NSTAR
Electric | | PSNH | | CL&P | | NSTAR
Electric | | PSNH | | CL&P | | NSTAR
Electric | | PSNH |
| Cash Paid During the Year for: | | | | | | | | | | | | | | | | | |
| Cash Paid/(Received) During the Year for: | | Cash Paid/(Received) During the Year for: | | | |
| Interest, Net of Amounts Capitalized | Interest, Net of Amounts Capitalized | $ | 167.2 | | | $ | 152.8 | | | $ | 58.3 | | | $ | 161.5 | | | $ | 141.6 | | | $ | 56.5 | | | $ | 149.0 | | | $ | 129.4 | | | $ | 54.5 | |
| Income Taxes | Income Taxes | 117.6 | | | 23.8 | | | 58.3 | | | 38.4 | | | 74.2 | | | 51.1 | | | 10.9 | | | 110.7 | | | 34.2 | |
| Non-Cash Investing Activities: | Non-Cash Investing Activities: | | | | | | |
Plant Additions Included in Accounts
Payable (As of) | Plant Additions Included in Accounts
Payable (As of) | 131.8 | | | 184.3 | | | 76.2 | | | 110.6 | | | 120.0 | | | 68.7 | | | 101.8 | | | 103.2 | | | 33.3 | |
Plant Additions Included in Accounts
Payable (As of) | |
Plant Additions Included in Accounts
Payable (As of) | |
The following table reconciles cash and cash equivalents as reported on the balance sheets to the cash, cash equivalents and restricted cash balance as reported on the statements of cash flows: | | As of December 31, |
| As of December 31, | | | As of December 31, |
| | | 2022 | | 2021 | | 2023 | | 2022 |
| (Millions of Dollars) | (Millions of Dollars) | Eversource | | CL&P | | NSTAR Electric | | PSNH | | Eversource | | CL&P | | NSTAR Electric | | PSNH | (Millions of Dollars) | Eversource | | CL&P | | NSTAR Electric | | PSNH | | Eversource | | CL&P | | NSTAR Electric | | PSNH |
Cash and Cash Equivalents as reported on the
Balance Sheets | Cash and Cash Equivalents as reported on the
Balance Sheets | $ | 374.6 | | | $ | 11.3 | | | $ | 327.7 | | | $ | 0.1 | | | $ | 66.8 | | | $ | 55.8 | | | $ | 0.7 | | | $ | — | |
| Restricted cash included in: | Restricted cash included in: | |
| Special Deposits | Special Deposits | 102.2 | | | 8.8 | | | 17.5 | | | 33.1 | | | 78.2 | | | 18.7 | | | 17.4 | | | 31.4 | |
| Special Deposits | |
| Special Deposits | |
| Marketable Securities | Marketable Securities | 25.4 | | | 0.2 | | | 0.1 | | | 0.4 | | | 31.3 | | | 0.3 | | | 0.1 | | | 0.5 | |
| Other Long-Term Assets | Other Long-Term Assets | 19.6 | | | — | | | — | | | 3.2 | | | 44.7 | | | — | | | — | | | 3.2 | |
Cash, Cash Equivalents and Restricted Cash
as reported on the Statements of Cash Flows | Cash, Cash Equivalents and Restricted Cash
as reported on the Statements of Cash Flows | $ | 521.8 | | | $ | 20.3 | | | $ | 345.3 | | | $ | 36.8 | | | $ | 221.0 | | | $ | 74.8 | | | $ | 18.2 | | | $ | 35.1 | |
Special Deposits represent cash collections related to the PSNH RRB customer charges that are held in trust, required ISO-NE cash deposits, cash held in escrow accounts, and CYAPC and YAEC cash balances. The December 31, 2021 balance also included a $10 million customer assistance fund to provide bill payment assistance to certain existing non-hardship and hardship customers carrying arrearages at CL&P established under the terms of the PURA-approved October 2021 settlement agreement. Those customers were provided with $10 million of bill forgiveness in the first quarter of 2022, which represented a non-cash transaction. Special Deposits are included in Current Assets on the balance sheets. RestrictedAs of both December 31, 2023 and December 31, 2022, restricted cash included in Marketable Securities representsrepresented money market funds held in trusts to fund certain non-qualified executive benefits and restricted trusts to fund CYAPC and YAEC's spent nuclear fuel storage obligations. As of December 31, 2022, restricted cash included in Marketable Securities also included money market funds held in trusts to fund certain non-qualified executive benefits.
RestrictedEversource’s restricted cash also includes an Energy Relief Fund for energy efficiency and clean energy measures in the Merrimack Valley and an additional energy efficiency program established under the terms of the EGMA 2020 settlement agreement. As of December 31, 2022,This restricted cash held in escrow accounts included $20.0 million of this restricted cash was recorded as short-term in Special Deposits as of both December 31, 2023 and December 31, 2022, and $14.1 million and $15.9 million was recorded in Other Long-Term Assets. As of December 31, 2021, this restricted cash totaled $41.5 million and was recorded in Other Long-Term Assets on the balance sheet.
Cash Equivalents at NSTAR Electricsheets as of $327.0 million related to a cash infusion by Eversource parent received in December 31, 2023 and December 31, 2022, recorded in a money market account.respectively.
N. Related Parties
Eversource Service, Eversource's service company, provides centralized accounting, administrative, engineering, financial, information technology, legal, operational, planning, purchasing, tax, and other services to Eversource's companies. The Rocky River Realty Company and Properties, Inc., two other Eversource subsidiaries, construct, acquire or lease some of the property and facilities used by Eversource's companies.
As of both December 31, 2022, and 2021, CL&P, NSTAR Electric and PSNH had long-term receivables from Eversource Service in the amounts of $25.0 million, $5.5 million and $3.8 million, respectively, which were included in Other Long-Term Assets on the balance sheets. These amounts related to the funding of investments held in trust by Eversource Service in connection with certain postretirement benefits for CL&P, NSTAR Electric and PSNH employees and have beenwere eliminated in consolidation on the Eversource financial statements. As of December 31, 2023, these intercompany balances were settled.
Included in the CL&P, NSTAR Electric and PSNH balance sheets as of December 31, 20222023 and 20212022 were Accounts Receivable from Affiliated Companies and Accounts Payable to Affiliated Companies relating to transactions between CL&P, NSTAR Electric and PSNH and other subsidiaries that are wholly-owned by Eversource. These amounts have been eliminated in consolidation on the Eversource financial statements.
The Eversource Energy Foundation is an independent not-for-profit charitable entity and is not included in the consolidated financial statements of Eversource as the Company does not have title to, and cannot receive contributions back from, the Eversource Energy Foundation's assets. Eversource made contributions to the Eversource Energy Foundation of $20.0 million in 2023 and $8.0 million in 2022, and $6.4 million in 2020 and did not make any contributions in 2021.
2. REGULATORY ACCOUNTING
Eversource's utility companies are subject to rate regulation that is based on cost recovery and meets the criteria for application of accounting guidance for rate-regulated operations, which considers the effect of regulation on the timing of the recognition of certain revenues and expenses. The regulated companies' financial statements reflect the effects of the rate-making process. The rates charged to the customers of Eversource's regulated companies are designed to collect each company's costs to provide service, plus a return on investment.
The application of accounting guidance for rate-regulated enterprises results in recording regulatory assets and liabilities. Regulatory assets represent the deferral of incurred costs that are probable of future recovery in customer rates. Regulatory assets are amortized as the incurred costs are recovered through customer rates. Regulatory liabilities represent either revenues received from customers to fund expected costs that have not yet been incurred or probable future refunds to customers.
Management believes it is probable that each of the regulated companies will recover its respective investments in long-lived assets and the regulatory assets that have been recorded. If management were to determine that it could no longer apply the accounting guidance applicable to rate-regulated enterprises, or if management could not conclude it is probable that costs would be recovered from customers in future rates, the applicable costs would be charged to net income in the period in which the determination is made.
Regulatory Assets: The components of regulatory assets were as follows:
| | | | As of December 31, | | As of December 31, |
| | | 2022 | | 2021 | | 2023 | | 2022 |
| (Millions of Dollars) | (Millions of Dollars) | Eversource | | CL&P | | NSTAR Electric | | PSNH | | Eversource | | CL&P | | NSTAR Electric | | PSNH | (Millions of Dollars) | Eversource | | CL&P | | NSTAR Electric | | PSNH | | Eversource | | CL&P | | NSTAR Electric | | PSNH |
| Benefit Costs | $ | 921.7 | | | $ | 156.7 | | | $ | 299.5 | | | $ | 56.6 | | | $ | 1,481.0 | | | $ | 272.4 | | | $ | 395.5 | | | $ | 118.9 | |
| Storm Costs, Net | Storm Costs, Net | 1,379.1 | | | 799.3 | | | 484.4 | | | 95.4 | | | 1,102.7 | | | 695.6 | | | 341.3 | | | 65.8 | |
| Regulatory Tracking Mechanisms | Regulatory Tracking Mechanisms | 1,075.3 | | | 216.8 | | | 391.5 | | | 73.7 | | | 1,050.5 | | | 333.6 | | | 376.6 | | | 85.4 | |
| Benefit Costs | |
| Income Taxes, Net | Income Taxes, Net | 853.3 | | | 491.1 | | | 115.6 | | | 16.0 | | | 790.7 | | | 470.5 | | | 112.6 | | | 17.5 | |
| Securitized Stranded Costs | Securitized Stranded Costs | 435.7 | | | — | | | — | | | 435.7 | | | 478.9 | | | — | | | — | | | 478.9 | |
| Goodwill-related | Goodwill-related | 281.0 | | | — | | | 241.2 | | | — | | | 297.8 | | | — | | | 255.7 | | | — | |
| Asset Retirement Obligations | |
| Derivative Liabilities | Derivative Liabilities | 181.8 | | | 181.8 | | | — | | | — | | | 249.2 | | | 249.2 | | | — | | | — | |
| Asset Retirement Obligations | 127.9 | | | 35.9 | | | 68.2 | | | 4.4 | | | 115.0 | | | 33.6 | | | 59.8 | | | 4.1 | |
| Other Regulatory Assets | Other Regulatory Assets | 322.5 | | | 26.2 | | | 114.0 | | | 14.4 | | | 150.0 | | | 29.9 | | | 37.7 | | | 15.8 | |
| Total Regulatory Assets | Total Regulatory Assets | 5,578.3 | | | 1,907.8 | | | 1,714.4 | | | 696.2 | | | 5,715.8 | | | 2,084.8 | | | 1,579.2 | | | 786.4 | |
| Less: Current Portion | Less: Current Portion | 1,335.5 | | | 314.1 | | | 492.8 | | | 102.2 | | | 1,129.1 | | | 371.6 | | | 444.0 | | | 107.2 | |
| Total Long-Term Regulatory Assets | Total Long-Term Regulatory Assets | $ | 4,242.8 | | | $ | 1,593.7 | | | $ | 1,221.6 | | | $ | 594.0 | | | $ | 4,586.7 | | | $ | 1,713.2 | | | $ | 1,135.2 | | | $ | 679.2 | |
Storm Costs, Net: The storm cost deferrals relate to costs incurred for storm events at CL&P, NSTAR Electric and PSNH that each company expects to recover from customers. A storm must meet certain criteria to qualify for deferral and recovery with the criteria specific to each state jurisdiction and utility company. Once a storm qualifies for recovery, all qualifying expenses incurred during storm restoration efforts are deferred and recovered from customers. Costs for storms that do not meet the specific criteria are expensed as incurred. In addition to storm restoration costs, CL&P and PSNH are each allowed to recover pre-staging storm costs. Management believes all storm costs deferred were prudently incurred and meet the criteria for specific cost recovery in Connecticut, Massachusetts and New Hampshire, and that recovery from customers is probable through the applicable regulatory recovery processes. Each electric utility company either recovers a carrying charge on its deferred storm cost regulatory asset balance or the regulatory asset balance is included in rate base.
Multiple tropical and severe storms over the past several years have caused extensive damage to Eversource’s electric distribution systems resulting in significant numbers and durations of customer outages, along with significant pre-staging costs. Storms in 2023 that qualified for future recovery resulted in deferred storm restoration costs and pre-staging costs totaling $542 million at Eversource, including $178 million at CL&P, $192 million at NSTAR Electric, and $172 million at PSNH. Management believes that all of these storm costs were prudently incurred and meet the criteria for specific cost recovery. Of Eversource’s total deferred storm costs, $1.75 billion either have yet to be filed with the applicable regulatory commission, are pending regulatory approval, or are subject to prudency review (including $975 million at CL&P, $526 million at NSTAR Electric and $246 million at PSNH) as of December 31, 2023. These storm cost totals exclude storm funding amounts that are collected in rates, which are recorded as a reduction to the deferred storm cost regulatory asset balance.
CL&P, NSTAR Electric and PSNH are seeking approval of their deferred storm restoration costs through the applicable regulatory recovery process. As part of CL&P’s October 1, 2021 settlement agreement, CL&P agreed to freeze its current base distribution rates (including storm costs) until no earlier than January 1, 2024. On December 22, 2023, CL&P initiated a docket seeking a prudency review of approximately $634 million of catastrophic storm costs for twenty-four weather events from January 1, 2018 to December 31, 2021. In the filing, CL&P requested PURA establish a rate to collect $50 million annually from customers from the date of the final decision in this proceeding. This rate
would be effective until the next distribution rate case and would replenish the under-collected storm reserve and reduce future carrying charges for customers.
CL&P’s storm events include the August 4, 2020 Tropical Storm Isaias, which resulted in deferred storm restoration costs of approximately $232 million at CL&P as of December 31, 2023. Although in 2021 PURA found that CL&P’s performance in its preparation for, and response to, Tropical Storm Isaias fell below applicable performance standards in certain instances, CL&P believes it presented in its 2023 storm filing, credible evidence demonstrating there is no reasonably close causal connection between the alleged sub-standard performance and the storm costs incurred. While it is possible that some amount of storm costs may be disallowed by PURA, any such amount cannot be estimated at this time. CL&P continues to believe that these storm restoration costs associated with Tropical Storm Isaias were prudently incurred and meet the criteria for cost recovery; and as a result, management does not expect the storm cost review by PURA to have a material impact on the financial position or results of operations of CL&P.
Regulatory Tracking Mechanisms:The regulated companies' approved rates are designed to recover costs incurred to provide service to customers. The regulated companies recover certain of their costs on a fully-reconciling basis through regulatory commission-approved tracking mechanisms. The differences between the costs incurred (or the rate recovery allowed) and the actual revenues are recorded as regulatory assets (for undercollections) or as regulatory liabilities (for overcollections) to be included in future customer rates each year. Carrying charges are recovered in rates on all material regulatory tracking mechanisms.
The electric and natural gas distribution companies recover, on a fully reconciling basis, the costs associated with the procurement of energy and natural gas supply, electric transmission related costs from FERC-approved transmission tariffs, energy efficiency programs, low income assistance programs, certain uncollectible accounts receivable for hardship customers, restructuring and stranded costs as a result of deregulation (including securitized RRB charges), certain capital tracking mechanisms for infrastructure improvements, and additionally for the Massachusetts utilities, pension and PBOP benefits, net metering for distributed generation, and solar-related programs.
CL&P, NSTAR Electric, Yankee Gas, NSTAR Gas, EGMA and the Aquarion Water Company of Connecticut each have a regulatory commission approved revenue decoupling mechanism. Distribution revenues are decoupled from customer sales volumes, where applicable, which breaks the relationship between sales volumes and revenues. Each company reconciles its annual base distribution rate recovery amount to the pre-established levels of baseline distribution delivery service revenues. Any difference between the allowed level of distribution revenue and the actual amount realized during a 12-month period is adjusted through rates in the following period.
Benefit Costs: Deferred benefit costs represent unrecognized actuarial losses and gains and unrecognized prior service costs and credits attributable to Eversource's Pension, SERP and PBOP Plans. The regulated companies record actuarial losses and gains and prior service costs and credits arising at the December 31st remeasurement date of the funded status of the benefit plans as a regulatory asset or regulatory liability in lieu of a charge to Accumulated Other Comprehensive Income/(Loss), reflecting ultimate recovery from customers through rates. The regulatory asset or regulatory liability is amortized with the recognition of actuarial losses and gains and prior service costs and credits to net periodic benefit expense/income over the estimated average future employee service period using the corridor approach. Regulatory accounting is also applied to the portions of Eversource's service company costs that support the regulated companies, as these amounts are also recoverable. As these regulatory assets or regulatory liabilities do not represent a cash outlay for the regulated companies, no carrying charge is recovered from customers. See Note 11A, "Employee Benefits - Pension Benefits and Postretirement Benefits Other Than Pension," for further information on regulatory benefit plan amounts arising and amortized during the year.
Eversource, CL&P, NSTAR Electric, and PSNH recover benefit costs related to their distribution and transmission operations from customers in rates as allowed by their applicable regulatory commissions. NSTAR Electric, NSTAR Gas and EGMA recover qualified pension and PBOP expenses related to their distribution operations through a rate reconciling mechanism that fully tracks the change in net pension and PBOP expenses each year. The electric transmission companies' rates provide for an annual true-up of estimated to actual costs, which include pension and PBOP expenses.
Storm Costs, Net: The storm cost deferrals relate to costs incurred for storm events at CL&P, NSTAR Electric and PSNH that each company expects to recover from customers. A storm must meet certain criteria to qualify for deferral and recovery with the criteria specific to each state jurisdiction and utility company. Once a storm qualifies for recovery, all qualifying expenses incurred during storm restoration efforts are deferred and recovered from customers. Costs for storms that do not meet the specific criteria are expensed as incurred. In addition to storm restoration costs, CL&P and PSNH are each allowed to recover pre-staging storm costs. Management believes all storm costs deferred were prudently incurred and meet the criteria for specific cost recovery in Connecticut, Massachusetts and New Hampshire, and that recovery from customers is probable through the applicable regulatory recovery processes. Each electric utility company either recovers a carrying charge on its deferred storm cost regulatory asset balance or the regulatory asset balance is included in rate base.
Multiple tropical and severe storms over the past several years have caused extensive damage to Eversource’s electric distribution systems resulting in significant numbers and durations of customer outages, along with significant pre-staging costs. Storms in 2022 that qualified for future recovery resulted in deferred storm restoration costs and pre-staging costs totaling $399 million at Eversource, including $163 million at CL&P, $181 million at NSTAR Electric, and $55 million at PSNH. Management believes that all of these storm costs were prudently incurred and meet the criteria for specific cost recovery. Of Eversource’s total deferred storm costs, $1.40 billion either have yet to be filed with the applicable regulatory commission, are pending regulatory approval, or are subject to prudency review (including $807 million at CL&P, $492 million at NSTAR Electric and $98 million at PSNH) as of December 31, 2022. These storm cost totals exclude storm funding amounts that are collected in rates, which are recorded as a reduction to the deferred storm cost regulatory asset balance. NSTAR Electric and PSNH are seeking approval of their deferred storm restoration costs through the applicable regulatory recovery process. As part of CL&P’s October 1, 2021 settlement agreement, CL&P agreed to freeze its current base distribution rates (including storm costs) until no earlier than January 1, 2024. As a result, CL&P has not yet filed for approval of its storm costs in a regulatory proceeding.
CL&P Tropical Storm Isaias Costs:On August 4, 2020, Tropical Storm Isaias caused catastrophic damage to our electric distribution system, which resulted in significant numbers and durations of customer outages, primarily in Connecticut. In terms of customer outages, this storm was one of the worst in CL&P’s history. PURA will investigate the prudency of costs incurred by CL&P to restore service in response to Tropical Storm Isaias. That investigation is expected to occur either in a separate proceeding not yet initiated or as part of CL&P’s next rate review proceeding. Tropical Storm Isaias resulted in deferred storm restoration costs of approximately $235 million at CL&P as of December 31, 2022. Although PURA found that CL&P’s performance in its preparation for, and response to, Tropical Storm Isaias fell below applicable performance standards in certain instances, CL&P believes it will be able to present credible evidence in a future proceeding demonstrating there is no reasonably close causal connection between the alleged sub-standard performance and the storm costs incurred. While it is possible that some amount of storm costs may be disallowed by PURA in a future proceeding, any such amount cannot be estimated at this time. Eversource and CL&P continue to believe that these storm restoration costs associated with Tropical Storm Isaias were prudently incurred and meet the criteria for cost recovery; and as a result, management does not expect the storm cost review by PURA to have a material impact on the financial position or results of operations of Eversource or CL&P.
Regulatory Tracking Mechanisms:The regulated companies' approved rates are designed to recover costs incurred to provide service to customers. The regulated companies recover certain of their costs on a fully-reconciling basis through regulatory commission-approved tracking mechanisms. The differences between the costs incurred (or the rate recovery allowed) and the actual revenues are recorded as regulatory assets (for undercollections) or as regulatory liabilities (for overcollections) to be included in future customer rates each year. Carrying charges are recovered in rates on all material regulatory tracking mechanisms.
The electric and natural gas distribution companies recover, on a fully reconciling basis, the costs associated with the procurement of energy and natural gas supply, electric transmission related costs from FERC-approved transmission tariffs, energy efficiency programs, low income assistance programs, certain uncollectible accounts receivable for hardship customers, restructuring and stranded costs as a result of deregulation (including securitized RRB charges), certain capital tracking mechanisms for infrastructure improvements, and additionally for the Massachusetts utilities, pension and PBOP benefits, net metering for distributed generation, and solar-related programs.
CL&P, NSTAR Electric, Yankee Gas, NSTAR Gas, EGMA and the Aquarion Water Company of Connecticut each have a regulatory commission approved revenue decoupling mechanism. Distribution revenues are decoupled from customer sales volumes, where applicable, which breaks the relationship between sales volumes and revenues. Each company reconciles its annual base distribution rate recovery amount to the pre-established levels of baseline distribution delivery service revenues. Any difference between the allowed level of distribution revenue and the actual amount realized during a 12-month period is adjusted through rates in the following period.
Income Taxes, Net: The tax effect of temporary book-tax differences (differences between the periods in which transactions affect income in the financial statements and the periods in which they affect the determination of taxable income, including those differences relating to uncertain tax positions) is accounted for in accordance with the rate-making treatment of the applicable regulatory commissions and accounting guidance for income taxes. Differences in income taxes between the accounting guidance and the rate-making treatment of the applicable regulatory commissions are recorded as regulatory assets. As these assets are offset by deferred income tax liabilities, no carrying charge is collected. The amortization period of these assets varies depending on the nature and/or remaining life of the underlying assets and liabilities. For further information regarding income taxes, see Note 12, "Income Taxes," to the financial statements.
Securitized Stranded Costs: In 2018, a subsidiary of PSNH issued $635.7 million of securitized RRBs to finance PSNH's unrecovered remaining costs associated with the divestiture of its generation assets. Securitized regulatory assets, which are not earning an equity return, are being recovered over the amortization period of the associated RRBs. The PSNH RRBs are expected to be repaid by February 1, 2033. For further information, see Note 10, "Rate Reduction Bonds and Variable Interest Entities," to the financial statements.
Goodwill-related: The goodwill regulatory asset originated from a 1999 transaction, and the DPU allowed its recovery in NSTAR Electric and NSTAR Gas rates. This regulatory asset is currently being amortized and recovered from customers in rates without a carrying charge over a 40-year period, and as of December 31, 2022,2023, there were 1716 years of amortization remaining.
Asset Retirement Obligations: The costs associated with the depreciation of the regulated companies' ARO assets and accretion of the ARO liabilities are recorded as regulatory assets in accordance with regulatory accounting guidance. The regulated companies' ARO assets, regulatory assets, and ARO liabilities offset and are excluded from rate base. These costs are being recovered over the life of the underlying property, plant and equipment.
Derivative Liabilities: Regulatory assets are recorded as an offset to derivative liabilities and relate to the fair value of contracts used to purchase energy and energy-related products that will be recovered from customers in future rates. These assets are excluded from rate base and are being recovered as the actual settlements occur over the duration of the contracts. See Note 4, "Derivative Instruments," to the financial statements for further information on these contracts.
Asset Retirement Obligations: The costs associated with the depreciation of the regulated companies' ARO assets and accretion of the ARO liabilities are recorded as regulatory assets in accordance with regulatory accounting guidance. The regulated companies' ARO assets, regulatory assets, and ARO liabilities offset and are excluded from rate base. These costs are being recovered over the life of the underlying property, plant and equipment.
Other Regulatory Assets: Other Regulatory Assets primarily include environmental remediation costs, certain uncollectible accounts receivable for hardship customers, certain exogenous property taxes and merger-related costs allowed for recovery, contractual obligations associated with the spent nuclear fuel storage costs of the CYAPC, YAEC and MYAPC decommissioned nuclear power facilities, water tank painting costs, losses associated with the reacquisition or redemption of long-term debt, removal costs incurred that exceed amounts collected from customers, and various other items.
Regulatory Costs in Other Long-Term Assets: Eversource's regulated companies had $241.7 million (including $166.7 million for CL&P, $21.9 million for NSTAR Electric and $1.2 million for PSNH) and $210.8 million (including $135.9 million for CL&P, $19.8 million for NSTAR Electric and $1.0 million for PSNH) and $252.5 million (including $114.9 million for CL&P, $85.0 million for NSTAR Electric and $3.4 million for PSNH) of additional regulatory costs not yet specifically approved as of December 31, 20222023 and 2021,2022, respectively, that were included in long-term assetsOther Long-Term Assets on the balance sheets. These amounts represent incurred costs for which recovery has not yet been specifically approvedwill be reclassified to Regulatory Assets upon approval by the applicable regulatory agency. However, basedBased on regulatory policies or past precedent on similar costs, management believes it is probable that these costs will ultimately be approved and recovered from customers in rates. As of December 31, 20222023 and 2021,2022, these regulatory costs included incremental COVID-19 related non-tracked uncollectible expense deferred of $29.8$82.1 million and $33.0(including $64.0 million at Eversource, $11.8 million and $18.0 million atfor CL&P and $2.2$7.3 million for NSTAR Electric) and $6.1$64.0 million at(including $52.8 million for CL&P and $3.5 million for NSTAR Electric, respectively.Electric), respectively, of deferred uncollectible hardship costs.
Equity Return on Regulatory Assets: For rate-making purposes, the regulated companies recover the carrying costs related to their regulatory assets. For certain regulatory assets, the carrying cost recovered includes an equity return component. This equity return is not recorded on the balance sheets. The equity return for PSNH was $4.1$10.2 million and $5.0$4.1 million as of December 31, 20222023 and 2021,2022, respectively. These carrying costs will be recovered from customers in future rates.
Regulatory Liabilities: The components of regulatory liabilities were as follows:
| | As of December 31, |
| As of December 31, | | | As of December 31, |
| | | 2022 | | 2021 | | 2023 | | 2022 |
| (Millions of Dollars) | (Millions of Dollars) | Eversource | | CL&P | | NSTAR Electric | | PSNH | | Eversource | | CL&P | | NSTAR Electric | | PSNH | (Millions of Dollars) | Eversource | | CL&P | | NSTAR Electric | | PSNH | | Eversource | | CL&P | | NSTAR Electric | | PSNH |
| EDIT due to Tax Cuts and Jobs Act of 2017 | EDIT due to Tax Cuts and Jobs Act of 2017 | $ | 2,619.3 | | | $ | 983.6 | | | $ | 944.3 | | | $ | 348.6 | | | $ | 2,685.2 | | | $ | 996.1 | | | $ | 984.5 | | | $ | 359.2 | |
| Cost of Removal | Cost of Removal | 670.6 | | | 130.8 | | | 405.3 | | | 14.7 | | | 649.6 | | | 100.1 | | | 381.0 | | | 17.2 | |
| Regulatory Tracking Mechanisms | Regulatory Tracking Mechanisms | 890.8 | | | 361.0 | | | 336.1 | | | 155.0 | | | 448.4 | | | 182.0 | | | 185.1 | | | 107.0 | |
Deferred Portion of Non-Service Income
Components of Pension, SERP and PBOP | Deferred Portion of Non-Service Income
Components of Pension, SERP and PBOP | 270.9 | | | 34.5 | | | 139.7 | | | 28.8 | | | 148.3 | | | 12.0 | | | 90.7 | | | 14.9 | |
| AFUDC - Transmission | |
| Benefit Costs | Benefit Costs | 55.4 | | | 0.7 | | | 31.4 | | | — | | | 133.5 | | | — | | | 107.4 | | | — | |
| AFUDC - Transmission | 98.2 | | | 48.2 | | | 50.0 | | | — | | | 81.0 | | | 43.2 | | | 37.8 | | | — | |
CL&P Settlement Agreement and Storm
Performance Penalty | — | | | — | | | — | | | — | | | 81.3 | | | 81.3 | | | — | | | — | |
| Other Regulatory Liabilities | Other Regulatory Liabilities | 215.9 | | | 40.6 | | | 14.5 | | | 6.5 | | | 241.4 | | | 45.1 | | | 0.8 | | | 3.3 | |
| Total Regulatory Liabilities | Total Regulatory Liabilities | 4,821.1 | | | 1,599.4 | | | 1,921.3 | | | 553.6 | | | 4,468.7 | | | 1,459.8 | | | 1,787.3 | | | 501.6 | |
| Less: Current Portion | Less: Current Portion | 890.8 | | | 336.0 | | | 373.2 | | | 162.0 | | | 602.4 | | | 266.5 | | | 228.2 | | | 120.2 | |
| Total Long-Term Regulatory Liabilities | Total Long-Term Regulatory Liabilities | $ | 3,930.3 | | | $ | 1,263.4 | | | $ | 1,548.1 | | | $ | 391.6 | | | $ | 3,866.3 | | | $ | 1,193.3 | | | $ | 1,559.1 | | | $ | 381.4 | |
EDIT due to Tax Cuts and Jobs Act of 2017: Pursuant to the Tax Cuts and Jobs Act of 2017, Eversource had remeasured its existing deferred federal income tax balances to reflect the decrease in the U.S. federal corporate income tax rate from 35 percent to 21 percent. The remeasurement resulted in provisional regulated excess accumulated deferred income tax (excess ADIT or EDIT) liabilities that will benefit customers in future periods and were recognized as regulatory liabilities on the balance sheet. EDIT liabilities related to property, plant, and equipment are subject to IRS normalization rules and will be returned to customers using the same timing as the remaining useful lives of the underlying assets that gave rise to the ADIT liabilities. Eversource's regulated companies (except for the Connecticut water business) are in the process of refunding the EDIT liabilities to customers based on orders issued by applicable state and federal regulatory commissions.
Cost of Removal: Eversource's regulated companies currently recover amounts in rates for future costs of removal of plant assets over the lives of the assets. The estimated cost to remove utility assets from service is recognized as a component of depreciation expense, and the cumulative amount collected from customers but not yet expended is recognized as a regulatory liability. Expended removal costs that exceed amounts collected from customers are recognized as regulatory assets, as they are probable of recovery in future rates.
Deferred Portion of Non-Service Income Components of Pension, SERP and PBOP: Regulatory liabilities were recorded for the deferred portion of the non-service related components of net periodic benefit expense/(income) for the Pension, SERP and PBOP Plans. These regulatory liabilities will be amortized over the remaining useful lives of the various classes of utility property, plant and equipment.
AFUDC - Transmission: Regulatory liabilities were recorded by CL&P and NSTAR Electric for AFUDC accrued on certain reliability-related transmission projects to reflect local rate base recovery. These regulatory liabilities will be amortized over the depreciable life of the related transmission assets.
CL&P Settlement Agreement and Storm Performance Penalty: On April 28, 2021, PURA issued a final decision on CL&P’s compliance with its emergency response plan that concluded CL&P failed to comply with certain storm performance standards and was imprudent in certain instances. A $28.4 million performance penalty assessed by PURA was recorded within current regulatory liabilities on CL&P’s balance sheet and was credited to customers on electric bills beginning on September 1, 2021 over a one-year period. On October 1, 2021, CL&P entered into a settlement agreement with the DEEP, Office of Consumer Counsel, Office of the Attorney General and the Connecticut Industrial Energy Consumers, resolving certain issues that arose in then-pending regulatory proceedings initiated by PURA. PURA approved the settlement agreement on October 27, 2021. CL&P recorded a current regulatory liability of $75 million on the balance sheet associated with the provisions of the settlement agreement. Customer credits of $65 million were distributed based on customer sales over a two-month billing period from December 1, 2021 to January 31, 2022. CL&P also irrevocably set aside $10 million in a customer assistance fund to provide bill payment assistance to certain existing non-hardship and hardship customers carrying arrearages. Those customers were provided with $10 million of bill forgiveness in the first quarter of 2022. The balance as of December 31, 2021 represented the reserve for customer credits not yet issued and bill payment assistance not yet provided. See Note 13G, “Commitments and Contingencies - CL&P Regulatory Matters,” for further information.
Other Regulatory Liabilities: Other Regulatory Liabilities primarily include EGMA’s acquired regulatory liability as a result of the 2020 DPU-approved rate settlement agreement and the CMA asset acquisition on October 9, 2020, and various other items.
FERC ROE ComplaintsComplaints:: As of December 31, 2023 and 2022, Eversource has a reserve established for the second ROE complaint period in the pending FERC ROE complaint proceedings, which was recorded as a regulatory liability and is reflected within Regulatory Tracking Mechanisms in the table above. The cumulative pre-tax reserve (excluding interest) as of December 31, 2023 and 2022 totaled $39.1 million for Eversource (including $21.4 million for CL&P, $14.6 million for NSTAR Electric and $3.1 million for PSNH). See Note 13E, "Commitments and Contingencies – FERC ROE Complaints," for further information on developments in the pending ROE complaint proceedings.
Recent Regulatory Developments:
2022 CL&P Rate Relief Plan: On November 28, 2022, Governor Lamont, DEEP, Office of Consumer Counsel, and CL&P jointly developed a rate relief plan for electric customers for the winter peak season of January 1, 2023 through April 30, 2023. On December 16, 2022, PURA approved the rate relief plan. As part of the rate relief plan, CL&P reduced the Non-Bypassable Federally Mandated Congestion Charge (NBFMCC) rate effective January 1, 2023 to provide customers with an average $10 monthly bill credit from January through April 2023. This rate reduction acceleratesaccelerated the return to customers of net revenues generated by long-term state-approved energy contracts with the Millstone and Seabrook nuclear power plants of approximately $90 million. The rate relief plan also included instituting a temporary, flat monthly discount for qualifying low-income hardship customers effective January 1, 2023. This flat-rate credit will continue until a new low-income discount rate that was approved by PURA in an October 19, 2022 decision is implemented in 2024. These aspects of the rate relief plan do not impact CL&P’s earnings but do impact its future cash flows. Also as part of the rate relief plan, CL&P committed to contribute $10 million to an energy assistance program for qualifying hardship customers, which is expected to bewas distributed as a bill credit to those customers by the end of the first quarter ofduring 2023. CL&P recorded a current liability of $10 million on the balance sheet and a charge to expense on the statement of income for the year ended December 31, 2022 associated with the customer assistance program.
2022 NSTAR Electric Distribution Rate Case: On November 30, 2022, the DPU issued its decision in the NSTAR Electric distribution rate case and approved a base distribution rate increase of $64 million effective January 1, 2023. The DPU approved a renewal of the performance-based ratemaking (PBR)PBR plan originally authorized in its previous rate case for a five-year term, with a corresponding stay out provision. The PBR plan term has the possibility of a five-year extension. The PBR mechanism allows for an annual adjustment to base distribution rates for inflation and exogenous events. The DPU also allowed for adjustments to the PBR mechanism for the recovery of future capital additions based on a historical five-year average of total capital additions, beginning with the January 1, 2024 PBR adjustment. The decision allows an authorized regulatory ROE of 9.80 percent on a capital structure including 53.2 percent equity.
Among other items, the DPU approved an increase to the annual storm fund contribution collected through base distribution rates from $10 million to $31 million, and allowed for the recovery of storm threshold costs of $1.3 million per storm event subsequent to the eighth storm in a calendar year (six recovered in base rates plus two additional storms). The DPU approved cost recovery of a portion of NSTAR Electric’s outstanding storm costs beginning on January 1, 2023 and January 1, 2024, subject to reconciliation from future prudency reviews. In a subsequent compliance filing, the DPU allowed recovery to commence for outstanding storm costs occurring between 2018 and 2022 and interest in a total of $162.1 million over a five-year period starting January 1, 2023. In addition, NSTAR Electric will begin to recover 2021 exogenous storms and interest in a total of $220.9 million over a five-year period beginning January 1, 2024. The DPU also approved the recovery of historical exogenous property taxes of $30.8 million incurred from 2020 through 2022 over a two-year period and $8.3 million incurred from 2012 through 2015 over a five-year period effective January 1, 2023. As a result of this decision, these deferred property taxes were reclassified from Other Long-Term Assets to Regulatory Assets on the NSTAR Electric December 31, 2022 balance sheet.
2023 NSTAR Electric Distribution Rates: NSTAR Electric submitted its first annual PBR Adjustment filing on September 15, 2023 and on December 26, 2023, the DPU approved a $104.9 million increase to base distribution rates effective January 1, 2024. The base distribution rate increase was comprised of a $50.6 million inflation-based adjustment and a $54.3 million K-bar adjustment for capital additions based on the difference between the historical five-year average of total capital additions and the base capital revenue requirement.
2022 NSTAR Gas Distribution Rates: As part ofNSTAR Gas’ PBR mechanism allows for an inflation-based mechanism,annual adjustment to base distribution rates for inflation and exogenous events. NSTAR Gas submitted its second annual Performance Based RatePBR Adjustment filing on September 15, 2022 and on October 31, 2022, the DPU approved a $21.7 million increase to base distribution rates for effect on November 1, 2022. The increase is inclusive of a $4.5 million permanent increase related to exogenous property taxes and a $5.4 million increase related to an October 6, 2021 mitigation plan filing that delayed recovery of a portion of a base distribution rate increase originally scheduled to take effect November 1, 2021. The DPU also approved the recovery of historical exogenous property taxes incurred from November 1, 2020 through October 31, 2022 of $8.2 million over a two-year period through a separate reconciling mechanism effective November 1, 2022. As a result of this decision, these deferred property taxes were reclassified from Other Long-Term Assets to Regulatory Assets on the Eversource December 31, 2022 balance sheet.
2023 NSTAR Gas Distribution Rates: NSTAR Gas submitted its third annual PBR Adjustment filing on September 15, 2023 and on October 30, 2023, the DPU approved a $25.4 million increase to base distribution rates, of which, $15.5 million was associated with a base rate adjustment and the remainder for a prior period exogenous cost adjustment, for effect on November 1, 2023.
2022 EGMA Distribution Rates: As established in an October 7, 2020 EGMA Rate Settlement Agreement approved by the DPU, on September 16, 2022 EGMA filed for its second base distribution rate increase and on October 31, 2022, the DPU approved a $6.7 million increase to base distribution rates and a $3.3 million increase to the Tax Act Credit Factor for effect on November 1, 2022. The DPU also approved the recovery of historical exogenous property taxes incurred from November 1, 2020 through October 31, 2022 of $8.6 million over a two-year period through a separate reconciling mechanism effective November 1, 2022. EGMA will request recovery of incremental property taxes incurred after October 31, 2022 in future exogenous filings. As a result of this decision, these deferred property taxes were reclassified from Other Long-Term Assets to Regulatory Assets on the Eversource December 31, 2022 balance sheet.
962023 PSNH Pole Acquisition Approval: On November 18, 2022, the NHPUC issued a decision that approved a proposed purchase agreement between PSNH and Consolidated Communications, in which, PSNH would acquire both jointly-owned and solely-owned poles and pole assets. The NHPUC also authorized PSNH to recover certain expenses associated with the operation and maintenance of the transferred poles, pole inspections, and vegetation management expenses through a new cost recovery mechanism, the Pole Plant Adjustment Mechanism (PPAM), subject to consummation of the purchase agreement. The purchase agreement was finalized on May 1, 2023 for a purchase price of $23.3 million. Upon consummation of the purchase agreement, PSNH established a regulatory asset of $16.9 million for operation and maintenance expenses and vegetation management expenses associated with the purchased poles incurred from February 10, 2021 through April 30, 2023 that PSNH is authorized to collect through the PPAM regulatory tracking mechanism. The establishment of the PPAM regulatory asset resulted in a pre-tax benefit recorded in Amortization expense on the PSNH statement of income in 2023.
3. PROPERTY, PLANT AND EQUIPMENT AND ACCUMULATED DEPRECIATION
Utility property, plant and equipment is recorded at original cost. Original cost includes materials, labor, construction overheads and AFUDC for regulated property. The cost of repairs and maintenance is charged to Operations and Maintenance expense as incurred.
The following tables summarize property, plant and equipment by asset category:
| | Eversource | Eversource | As of December 31, | Eversource | As of December 31, |
| (Millions of Dollars) | (Millions of Dollars) | 2022 | | 2021 | (Millions of Dollars) | 2023 | | 2022 |
| Distribution - Electric | Distribution - Electric | $ | 18,326.2 | | | $ | 17,679.1 | |
| Distribution - Natural Gas | Distribution - Natural Gas | 7,443.8 | | | 6,694.8 | |
| Transmission - Electric | Transmission - Electric | 13,709.3 | | | 12,882.4 | |
| Distribution - Water | Distribution - Water | 2,112.6 | | | 1,900.9 | |
| Solar | Solar | 200.8 | | | 200.9 | |
| Utility | Utility | 41,792.7 | | | 39,358.1 | |
Other (1) | Other (1) | 1,738.1 | | | 1,469.5 | |
| Property, Plant and Equipment, Gross | Property, Plant and Equipment, Gross | 43,530.8 | | | 40,827.6 | |
| Less: Accumulated Depreciation | Less: Accumulated Depreciation | | | | Less: Accumulated Depreciation | | | |
| Utility | Utility | (9,167.4) | | | (8,885.2) | |
| Other | Other | (706.1) | | | (580.1) | |
| Total Accumulated Depreciation | Total Accumulated Depreciation | (9,873.5) | | | (9,465.3) | |
| Property, Plant and Equipment, Net | Property, Plant and Equipment, Net | 33,657.3 | | | 31,362.3 | |
| Construction Work in Progress | Construction Work in Progress | 2,455.5 | | | 2,015.4 | |
| Total Property, Plant and Equipment, Net | Total Property, Plant and Equipment, Net | $ | 36,112.8 | | | $ | 33,377.7 | |
| | | | As of December 31, | | As of December 31, |
| | | 2022 | | 2021 | | 2023 | | 2022 |
| (Millions of Dollars) | (Millions of Dollars) | CL&P | | NSTAR
Electric | | PSNH | | CL&P | | NSTAR
Electric | | PSNH | (Millions of Dollars) | CL&P | | NSTAR
Electric | | PSNH | | CL&P | | NSTAR
Electric | | PSNH |
| Distribution - Electric | Distribution - Electric | $ | 7,370.1 | | | $ | 8,410.0 | | | $ | 2,586.4 | | | $ | 7,117.6 | | | $ | 8,105.5 | | | $ | 2,496.2 | |
| Transmission - Electric | Transmission - Electric | 6,165.1 | | | 5,333.8 | | | 2,212.0 | | | 5,859.0 | | | 5,090.5 | | | 1,934.6 | |
| Solar | Solar | — | | | 200.8 | | | — | | | — | | | 200.9 | | | — | |
| Property, Plant and Equipment, Gross | Property, Plant and Equipment, Gross | 13,535.2 | | | 13,944.6 | | | 4,798.4 | | | 12,976.6 | | | 13,396.9 | | | 4,430.8 | |
| Less: Accumulated Depreciation | Less: Accumulated Depreciation | (2,567.1) | | | (3,381.2) | | | (912.3) | | | (2,572.1) | | | (3,227.3) | | | (908.4) | |
| Property, Plant and Equipment, Net | Property, Plant and Equipment, Net | 10,968.1 | | | 10,563.4 | | | 3,886.1 | | | 10,404.5 | | | 10,169.6 | | | 3,522.4 | |
| Construction Work in Progress | Construction Work in Progress | 498.9 | | | 1,063.6 | | | 174.1 | | | 399.0 | | | 707.0 | | | 134.1 | |
| Total Property, Plant and Equipment, Net | Total Property, Plant and Equipment, Net | $ | 11,467.0 | | | $ | 11,627.0 | | | $ | 4,060.2 | | | $ | 10,803.5 | | | $ | 10,876.6 | | | $ | 3,656.5 | |
(1)These assets are primarily comprised of computer software, hardware and equipment at Eversource Service and buildings at The Rocky River Realty Company.
Depreciation: Depreciation of utility assets is calculated on a straight-line basis using composite rates based on the estimated remaining useful lives of the various classes of property (estimated useful life for PSNH distribution and the water utilities). The composite rates, which are subject to approval by the appropriate state regulatory agency, include a cost of removal component, which is collected from customers over the lives of the plant assets and is recognized as a regulatory liability. Depreciation rates are applied to property from the time it is placed in service.
Upon retirement from service, the cost of the utility asset is charged to the accumulated provision for depreciation. The actual incurred removal costs are applied against the related regulatory liability.
The depreciation rates for the various classes of utility property, plant and equipment aggregate to composite rates as follows:
| | (Percent) | (Percent) | 2022 | | 2021 | | 2020 | (Percent) | 2023 | | 2022 | | 2021 |
| Eversource | Eversource | 3.0 | % | | 3.1 | % | | 3.0 | % | Eversource | 3.1 | % | | 3.0 | % | | 3.1 | % |
| CL&P | CL&P | 2.8 | % | | 2.8 | % | | 2.8 | % | CL&P | 2.8 | % | | 2.8 | % | | 2.8 | % |
| NSTAR Electric | NSTAR Electric | 2.7 | % | | 2.8 | % | | 2.8 | % | NSTAR Electric | 2.7 | % | | 2.7 | % | | 2.8 | % |
| PSNH | PSNH | 3.0 | % | | 3.1 | % | | 2.8 | % | PSNH | 3.0 | % | | 3.0 | % | | 3.1 | % |
The following table summarizes average remaining useful lives of depreciable assets:
| | | | As of December 31, 2022 | | As of December 31, 2023 |
| (Years) | (Years) | Eversource | | CL&P | | NSTAR Electric | | PSNH | (Years) | Eversource | | CL&P | | NSTAR Electric | | PSNH |
| Distribution - Electric | Distribution - Electric | 34.2 | | 35.0 | | 34.6 | | 30.8 | Distribution - Electric | 34.0 | | 35.3 | | 34.5 | | 29.6 |
| Distribution - Natural Gas | Distribution - Natural Gas | 37.4 | | — | | | — | | | — | |
| Transmission - Electric | Transmission - Electric | 39.8 | | 36.3 | | 45.2 | | 39.3 | Transmission - Electric | 40.6 | | 37.1 | | 45.3 | | 41.4 |
| Distribution - Water | Distribution - Water | 39.0 | | — | | | — | | | — | |
| Solar | Solar | 22.9 | | — | | | 22.9 | | — | |
Other (1) | Other (1) | 11.0 | | — | | | — | | | — | |
(1)The estimated useful life of computer software, hardware and equipment primarily ranges from 5 to 15 years and of buildings is 40 years.
4. DERIVATIVE INSTRUMENTS
The electric and natural gas companies purchase and procure energy and energy-related products, which are subject to price volatility, for their customers. The costs associated with supplying energy to customers are recoverable from customers in future rates. These regulated companies manage the risks associated with the price volatility of energy and energy-related products through the use of derivative and non-derivative contracts.
Many of the derivative contracts meet the definition of, and are designated as, normal and qualify for accrual accounting under the applicable accounting guidance. The costs and benefits of derivative contracts that meet the definition of normal are recognized in Operating Expenses on the statements of income as electricity or natural gas is delivered.
Derivative contracts that are not designated as normal are recorded at fair value as current or long-term Derivative Assets or Derivative Liabilities on the balance sheets. For the electric and natural gas companies, regulatory assets or regulatory liabilities are recorded to offset the fair values of derivatives, as contract settlement amounts are recovered from, or refunded to, customers in their respective energy supply rates.
The gross fair values of derivative assets and liabilities with the same counterparty are offset and reported as net Derivative Assets or Derivative Liabilities, with current and long-term portions, on the balance sheets. The following table presents the gross fair values of contracts, categorized by risk type, and the net amounts recorded as current or long-term derivative assets or liabilities:
| | | | | As of December 31, | | As of December 31, |
| | | | 2022 | | 2021 | | 2023 | | 2022 |
CL&P (Millions of Dollars) | CL&P (Millions of Dollars) | Fair Value Hierarchy | | Commodity Supply
and Price Risk
Management | | Netting (1) | | Net Amount
Recorded as
a Derivative | | Commodity Supply
and Price Risk
Management | | Netting (1) | | Net Amount
Recorded as
a Derivative | CL&P (Millions of Dollars) | Fair Value Hierarchy | | Commodity Supply
and Price Risk
Management | | Netting (1) | | Net Amount
Recorded as
a Derivative | | Fair Value Hierarchy | | Commodity Supply
and Price Risk
Management | | Netting (1) | | Net Amount
Recorded as
a Derivative |
| Current Derivative Assets | Current Derivative Assets | Level 3 | | $ | 16.3 | | | $ | (0.5) | | | $ | 15.8 | | | $ | 14.7 | | | $ | (1.0) | | | $ | 13.7 | |
| Long-Term Derivative Assets | Long-Term Derivative Assets | Level 3 | | 28.8 | | | (0.9) | | | 27.9 | | | 46.9 | | | (0.9) | | | 46.0 | |
| Current Derivative Liabilities | Current Derivative Liabilities | Level 3 | | (81.6) | | | — | | | (81.6) | | | (73.5) | | | — | | | (73.5) | |
| Long-Term Derivative Liabilities | Long-Term Derivative Liabilities | Level 3 | | (143.9) | | | — | | | (143.9) | | | (235.4) | | | — | | | (235.4) | |
(1) Amounts represent derivative assets and liabilities that Eversource elected to record net on the balance sheets. These amounts are subject to master netting agreements or similar agreements for which the right of offset exists.
The business activities that result in the recognition of derivative assets also create exposure to various counterparties. As of December 31, 2022,2023, CL&P's derivative assets were exposed to counterparty credit risk and contracted with investment grade entities.
Derivative Contracts at Fair Value with Offsetting Regulatory Amounts
Commodity Supply and Price Risk Management: As required by regulation, CL&P, along with UI, has capacity-related contracts with generation facilities. CL&P has a sharing agreement with UI, with 80 percent of the costs or benefits of each contract borne by or allocated to CL&P and 20 percent borne by or allocated to UI. The combined capacities of these contracts as of December 31, 2023 and 2022 and 2021 were 674682 MW and 675674 MW, respectively. The capacity contracts extend through 2026 and obligate both CL&P and UI to make or receive payments on a monthly basis to or from the generation facilities based on the difference between a set capacity price and the capacity market price received in the ISO-NE capacity markets.
For the years ended December 31, 2023, 2022 2021 and 2020,2021, there were losses of $3.9 million, gains of $10.1 million and losses of $7.1 million and $21.2 million, respectively, deferred as regulatory costs, which reflect the change in fair value associated with Eversource's derivative contracts.
Fair Value Measurements of Derivative Instruments
The fair value of derivative contracts classified as Level 3 utilizes both significant observable and unobservable inputs. The fair value is modeled using income techniques, such as discounted cash flow valuations adjusted for assumptions related to exit price. Valuations of derivative contracts using a discounted cash flow methodology include assumptions regarding the timing and likelihood of scheduled capacity payments and also reflect non-performance risk, including credit, using the default probability approach based on the counterparty’s credit rating for assets and the Company’s credit rating for liabilities. Significant observable inputs for valuations of these contracts include energy-related product prices in future years for which quoted prices in an active market exist. Valuations incorporate estimates of premiums or discounts that would be required by a market participant to arrive at an exit price, using historical market transactions adjusted for the terms of the contract. Fair value measurements categorized in Level 3 of the fair value hierarchy arewere prepared by individuals with expertise in valuation techniques, pricing of energy-related products, and accounting requirements. All derivative contracts were classified as Level 2 in the fair value hierarchy as of December 31, 2023, and were classified as Level 3 as of December 31, 2022.
The following is a summary of the significant unobservable inputs utilized in the valuations of the derivative contracts classified as Level 3:
| | | | | | | | | | | | | | | | | | | | | | | | | | | | | | | | | | | | | | | | | | | | | | | | | | | | | | | | | | | | | | | | | | | | | | | |
| | As of December 31, |
| | 2022 | | 2021 |
| CL&P | Range | | Average | | | | Period Covered | | Range | | Average | | | | Period Covered |
| Forward Reserve Prices | $ | 0.44 | | | — | | $0.50 | | $ | 0.47 | | | per kW-Month | | 2023 - 2024 | | $ | 0.50 | | | — | | $1.15 | | $ | 0.82 | | | per kW-Month | | 2022 - 2024 |
Exit price premiums of 2.9 percent through 7.1 percent, or a weighted average of 6.1 percent, are also Level 3 significant unobservable inputs applied to these contracts and reflect the uncertainty and illiquidity premiums that would be required based on the most recent market activity available for similar type contracts. The risk premium was weighted by the relative fair value of the net derivative instruments.As of December 31, 2022, these exit price premiums were a Level 3 significant unobservable input and ranged from 2.9 percent through 7.1 percent, or a weighted average of 6.1 percent. As of December 31, 2023, exit price premiums are no longer considered significant in the valuation of the derivative contracts.
As of December 31, 2021,2022, Level 3 significant unobservable inputs also utilized in the valuation of CL&P’s capacity-related contracts included capacityforward reserve prices of $2.61$0.44 per kW-Month through $0.50 per kW-Month, or a weighted average of $0.47 per kW-Month, over the period 20252023 through 2026. Beginning in the first quarter2024. As of 2022,December 31, 2023, these capacityforward reserve price inputs are now observable.
Significant increases or decreases in future capacity or forward reserve prices in isolation would decrease or increase, respectively, the fair value of the derivative liability. Any increases in risk premiums would increase the fair value of the derivative liability. Changes in these fair values are recorded as a regulatory asset or liability and do not impact net income.
The following table presents changes in the Level 3 category of derivative assets and derivative liabilities measured at fair value on a recurring basis. The derivative assets and liabilities are presented on a net basis.
| CL&P (Millions of Dollars) | CL&P (Millions of Dollars) | For the Years Ended December 31, | CL&P (Millions of Dollars) | For the Years Ended December 31, |
| 2022 | | 2021 | 2023 | | 2022 |
| Derivatives, Net: | Derivatives, Net: | | | |
| Fair Value as of Beginning of Period | Fair Value as of Beginning of Period | $ | (249.2) | | | $ | (293.1) | |
| Net Realized/Unrealized Gains/(Losses) Included in Regulatory Assets | 10.1 | | | (8.5) | |
| Fair Value as of Beginning of Period | |
| Fair Value as of Beginning of Period | |
| Net Realized/Unrealized (Losses)/Gains Included in Regulatory Assets | |
| Settlements | Settlements | 57.3 | | | 52.4 | |
Transfers out of Level 3 (1) | |
| Fair Value as of End of Period | Fair Value as of End of Period | $ | (181.8) | | | $ | (249.2) | |
(1) Transfers out of Level 3 pertain to certain significant valuation inputs becoming observable as well as certain unobservable inputs no longer being significant to the fair value of the derivative contracts. Eversource's policy is to recognize transfers between levels of the fair value hierarchy as of the end of the reporting period.
5. MARKETABLE SECURITIES
Eversource holds marketable securities that are primarily used to fund certain non-qualified executive benefits. The trusts that hold these marketable securities are not subject to regulatory oversight by state or federal agencies. Eversource’s marketable securities also include the CYAPC and YAEC legally restricted trusts that each hold equity and available-for-sale debt securities to fund the spent nuclear fuel removal obligations of their nuclear fuel storage facilities. Eversource also holds trusts that are not subject to regulatory oversight by state or federal agencies that are primarily used to fund certain non-qualified executive benefits. The marketable securities within these non-qualified executive benefit trusts were sold in 2023. Equity and available-for-sale debt marketable securities are recorded at fair value, with the current portion recorded in Prepayments and Other Current Assets and the long-term portion recorded in Marketable Securities on the balance sheets.
Equity Securities: Unrealized gains and losses on equity securities held in Eversource's non-qualified executive benefit trusttrusts are recorded in Other Income, Net on the statements of income. The fair value of these equity securities as of December 31, 2023 and 2022 was $3.3 million and 2021 was $20.0 million, respectively. Eversource’s non-qualified executive benefits equity securities were sold during 2023 and $40.2resulted in a $1.1 million respectively.gain recorded in Other Income, Net for the year ended December 31, 2023. For the years ended December 31, 2022 2021 and 2020,2021, there were unrealized losses of $9.7 million and unrealized gains of $4.4 million and $3.7 million recorded in Other Income, Net related to these equity securities, respectively.
Eversource's equity securities also include CYAPC's and YAEC's marketable securities held in spent nuclear fuel trusts, which had fair values of $170.1$173.6 million and $214.0$170.1 million as of December 31, 20222023 and 2021,2022, respectively. Unrealized gains and losses for these spent nuclear fuel trusts are subject to regulatory accounting treatment and are recorded in long-term Marketable Securities with the corresponding offset to long-term liabilities on the balance sheets, with no impact on the statements of income.
Available-for-Sale Debt Securities: The following is a summary of the available-for-sale debt securities:
| | | | As of December 31, | | As of December 31, |
| | | 2022 | | 2021 | | 2023 | | 2022 |
Eversource (Millions of Dollars) | Eversource (Millions of Dollars) | Amortized
Cost | | Pre-Tax
Unrealized
Gains | | Pre-Tax
Unrealized
Losses | | Fair Value | | Amortized
Cost | | Pre-Tax
Unrealized
Gains | | Pre-Tax
Unrealized
Losses | | Fair Value | Eversource (Millions of Dollars) | Amortized
Cost | | Pre-Tax
Unrealized
Gains | | Pre-Tax
Unrealized
Losses | | Fair Value | | Amortized
Cost | | Pre-Tax
Unrealized
Gains | | Pre-Tax
Unrealized
Losses | | Fair Value |
| Debt Securities | Debt Securities | $ | 201.6 | | | $ | 0.1 | | | $ | (16.2) | | | $ | 185.5 | | | $ | 214.5 | | | $ | 5.1 | | | $ | (0.2) | | | $ | 219.4 | |
Unrealized gains and losses on available-for-sale debt securities held in Eversource's non-qualified executive benefit trust are recorded in Accumulated Other Comprehensive Income, excluding amounts related to credit losses or losses on securities intended to be sold, which are recorded in Other Income, Net. These debt securities were sold during 2023 and resulted in $1.2 million of realized losses for the year ended December 31, 2023 that were reclassified out of Accumulated Other Comprehensive Income and recorded in Other Income, Net. There have beenwere no credit losses for the years ended December 31, 20222023 and 2021,2022, and no allowance for credit losses as of December 31, 2022.2023. Factors considered in determining whether a credit loss exists include adverse conditions specifically affecting the issuer, the payment history, ratings and rating changes of the security, and the severity of the impairment. For asset-backed debt securities, underlying collateral and expected future cash flows are also evaluated. Debt securities included in Eversource's non-qualified benefit trust portfolio arewere investment-grade bonds with a lower default risk based on their credit quality.
Eversource's debt securities also include CYAPC's and YAEC's marketable securities held in spent nuclear fuel trusts in the amounts of $163.2$164.3 million and $189.9$163.2 million as of December 31, 20222023 and 2021,2022, respectively. Unrealized gains and losses for available-for-sale debt securities included in the CYAPC and YAEC spent nuclear fuel trusts are subject to regulatory accounting treatment and are recorded in Marketable Securities with the corresponding offset to long-term liabilities on the balance sheets, with no impact on the statements of income. Pre-tax unrealized gains and losses as of December 31, 20222023 and 20212022 primarily relate to the debt securities included in CYAPC's and YAEC's spent nuclear fuel trusts.
As of December 31, 2022, the contractual maturities of available-for-sale debt securities were as follows:
| | | | | | | | | | | |
Eversource (Millions of Dollars) | Amortized
Cost | | Fair
Value |
|
Less than one year (1) | $ | 28.5 | | | $ | 28.3 | |
| One to five years | 43.8 | | | 42.4 | |
| Six to ten years | 35.6 | | | 32.3 | |
| Greater than ten years | 93.7 | | | 82.5 | |
| Total Debt Securities | $ | 201.6 | | | $ | 185.5 | |
(1)Amounts in the Less than one year category include securities in the CYAPC and YAECYAEC’s spent nuclear fuel trusts which are restricted and are classified in long-term Marketable Securities on the balance sheets.
As of December 31, 2023, the contractual maturities of available-for-sale debt securities were as follows:
| | | | | | | | | | | |
Eversource (Millions of Dollars) | Amortized
Cost | | Fair
Value |
|
| Less than one year | $ | 15.9 | | | $ | 15.9 | |
| One to five years | 30.9 | | | 30.9 | |
| Six to ten years | 38.1 | | | 37.8 | |
| Greater than ten years | 84.6 | | | 79.7 | |
| Total Debt Securities | $ | 169.5 | | | $ | 164.3 | |
Realized Gains and Losses: Realized gains and losses are recorded in Other Income, Net for Eversource's benefit trust and are offset in long-term liabilities for CYAPC and YAEC. Eversource utilizes the specific identification basis method for the Eversource non-qualified benefit trust, and the average cost basis method for the CYAPC and YAEC spent nuclear fuel trusts to compute the realized gains and losses on the sale of marketable securities.
Fair Value Measurements: The following table presents the marketable securities recorded at fair value on a recurring basis by the level in which they are classified within the fair value hierarchy:
| Eversource (Millions of Dollars) | Eversource (Millions of Dollars) | As of December 31, | Eversource (Millions of Dollars) | As of December 31, |
| 2022 | | 2021 | 2023 | | 2022 |
| Level 1: | Level 1: | | | | Level 1: | | | |
| Mutual Funds and Equities | Mutual Funds and Equities | $ | 190.1 | | | $ | 254.2 | |
| Money Market Funds | Money Market Funds | 25.4 | | | 31.3 | |
| Total Level 1 | Total Level 1 | $ | 215.5 | | | $ | 285.5 | |
| Level 2: | Level 2: | | | | Level 2: | | | |
| U.S. Government Issued Debt Securities (Agency and Treasury) | U.S. Government Issued Debt Securities (Agency and Treasury) | $ | 82.3 | | | $ | 81.3 | |
| Corporate Debt Securities | Corporate Debt Securities | 46.1 | | | 65.3 | |
| Asset-Backed Debt Securities | Asset-Backed Debt Securities | 8.6 | | | 12.6 | |
| Municipal Bonds | Municipal Bonds | 12.7 | | | 12.3 | |
| Other Fixed Income Securities | Other Fixed Income Securities | 10.4 | | | 16.6 | |
| Total Level 2 | Total Level 2 | $ | 160.1 | | | $ | 188.1 | |
| Total Marketable Securities | Total Marketable Securities | $ | 375.6 | | | $ | 473.6 | |
U.S. government issued debt securities are valued using market approaches that incorporate transactions for the same or similar bonds and adjustments for yields and maturity dates. Corporate debt securities are valued using a market approach, utilizing recent trades of the same or similar instruments and also incorporating yield curves, credit spreads and specific bond terms and conditions. Asset-backed debt securities include collateralized mortgage obligations, commercial mortgage backed securities, and securities collateralized by auto loans, credit card loans or receivables. Asset-backed debt securities are valued using recent trades of similar instruments, prepayment assumptions, yield curves, issuance and maturity dates, and tranche information. Municipal bonds are valued using a market approach that incorporates reported trades and benchmark yields. Other fixed income securities are valued using pricing models, quoted prices of securities with similar characteristics, and discounted cash flows.
6. INVESTMENTS IN UNCONSOLIDATED AFFILIATES
Investments in entities that are not consolidated are included in long-term assets on the balance sheets and earnings impacts from these equity investments are included in Other Income, Net on the statements of income. Eversource's investments included the following:
| | | | | Investment Balance as of December 31, | | | | | | Investment Balance as of December 31, |
| (Millions of Dollars) | (Millions of Dollars) | Ownership Interest | | 2022 | | 2021 | (Millions of Dollars) | Ownership Interest | | 2023 | | 2022 |
| Offshore Wind Business - North East Offshore | 50 | % | | $ | 1,947.1 | | | $ | 1,213.6 | |
| Offshore Wind Business | |
| | Natural Gas Pipeline - Algonquin Gas Transmission, LLC | |
| | Natural Gas Pipeline - Algonquin Gas Transmission, LLC | |
| | Natural Gas Pipeline - Algonquin Gas Transmission, LLC | Natural Gas Pipeline - Algonquin Gas Transmission, LLC | 15 | % | | 118.8 | | | 121.9 | |
| Renewable Energy Investment Fund | Renewable Energy Investment Fund | 90 | % | | 84.1 | | | 76.5 | |
| Other | Other | various | | 26.1 | | | 24.3 | |
| Total Investments in Unconsolidated Affiliates | Total Investments in Unconsolidated Affiliates | | $ | 2,176.1 | | | $ | 1,436.3 | |
For the years ended December 31, 2023, 2022 2021 and 2020,2021, Eversource had equity in earnings of unconsolidated affiliates of $22.9$15.5 million, $14.2$22.9 million, and $14.2 million, respectively. Eversource received dividends from its equity method investees (excluding proceeds received from sale or liquidation of investments) of $20.1 million, $26.2 million, $21.6 million, and $21.8$21.6 million, respectively, for the years ended December 31, 2023, 2022 2021 and 2020.2021.
Investments in affiliates where Eversource has the ability to exercise significant influence, but not control, over an investee are initially recognized as an equity method investment at cost. Any differences between the cost of an investment and the amount of underlying equity in net assets of an investee are considered basis differences, and are determined based upon the estimated fair values of the investee's identifiable assets and liabilities. The carrying amount of Eversource’s offshore wind investments, exceededwhich include 50 percent ownership interests in two offshore wind joint ventures and a 100 percent ownership in a tax equity investment, do not represent controlling financial interests. Eversource’s offshore wind investments, its share of underlyingthe natural gas pipeline and other investments included in the table above are accounted for under the equity in net assets by $343.1 million and $300.4 million, respectively, as of December 31, 2022 and 2021. As of December 31, 2022, these basis differences are primarily comprised of $168.9 million of equity method goodwill that is not being amortized, intangible assets for PPAs, and capitalized interest.method.
Offshore Wind Business: Eversource'sEversource’s offshore wind business includes a 50 percent ownership interestinterests in each of North East Offshore and South Fork Class B Member, LLC, which collectively hold three offshore wind projects. North East Offshore holds PPAs and contracts for the Revolution Wind project and the Sunrise Wind project. South Fork Class B Member, LLC holds the South Fork Wind and Sunriseproject. Eversource’s offshore wind business also includes a noncontrolling tax equity investment in South Fork Wind projects, as well as an undeveloped offshore lease area.through a 100 percent ownership in South Fork Wind Holdings, LLC Class A shares. The offshore wind investment includes capital expenditures for the three offshore wind projects as well as capitalized costs related to future development, acquisition costs of offshore lease areas,are being developed and capitalized interest. Cash flows used in investing activities presented in Investments in Unconsolidated Affiliates on the statements of cash flows primarily relates to capital contributions in the offshore wind investment.constructed through joint and equal partnerships with Ørsted.
Expected Sales of Offshore Wind Investments:On May 4, 2022,25, 2023, Eversource announced that it had initiatedcompleted a strategic review of its offshore wind investment portfolio. As part ofinvestments and determined that review, Eversource is exploring strategic alternatives that could result in a potentialit would pursue the sale of all, or part,its offshore wind investments. On September 7, 2023, Eversource completed the sale of its 50 percent interest in itsan uncommitted lease area consisting of approximately 175,000 developable acres located 25 miles off the south coast of Massachusetts to Ørsted for $625 million in an all-cash transaction.
In September of 2023, Eversource made a contribution of $528 million using the proceeds from the lease area sale to invest in a tax equity interest for South Fork Wind. South Fork Wind was restructured as a tax equity investment, with Eversource purchasing 100 percent ownership of a new Class A tax equity membership interest. As a result of this investment, Eversource expects to receive investment tax credits after the turbines are placed in service for South Fork Wind and meet the requirements to qualify for the ITC. These credits will be utilized to reduce Eversource’s federal tax liability or generate tax refunds over the next 24 months. All of South Fork Wind’s twelve turbines are expected to be installed and placed into service by the end of March 2024.
On January 24, 2024, Ørsted signed an agreement with Eversource to acquire Eversource’s 50 percent share of Sunrise Wind. The sale is subject to the successful selection of Sunrise Wind in the ongoing New York fourth solicitation for offshore wind partnershipcapacity, signing of an OREC contract with Ørsted.NYSERDA, finalization of sale agreements, receipt of final federal construction permits, and relevant regulatory approvals. If Sunrise Wind is not successful in the solicitation, then the existing OREC contract for Sunrise Wind will be cancelled according to the state’s requirements, and Eversource and Ørsted’s joint venture for Sunrise Wind will remain in place. In late July,that scenario, Ørsted and Eversource started preliminarywould then assess their options in determining the best path forward for Sunrise Wind and targeted outreachits assets, which include the BOEM offshore lease area. If Sunrise Wind’s revised bid is successful in the new solicitation, Sunrise Wind would have 90 days to interested parties.negotiate a new OREC agreement at the re-bid price. In a successful re-bid, Ørsted would become the sole owner of Sunrise Wind, while Eversource continueswould remain contracted to worklead the project’s onshore construction. If Sunrise Wind is successful in the re-bid, Ørsted would pay Eversource 50 percent of the negotiated purchase price upon closing the sale transaction, with interested parties throughthe remaining 50 percent paid when onshore construction is completed and certain other milestones are achieved. On January 25, 2024, Eversource and Ørsted submitted a new proposal for Sunrise Wind in the New York fourth offshore wind solicitation.
On February 13, 2024, Eversource announced that it has executed an agreement to sell its existing 50 percent interests in the South Fork Wind and Revolution Wind projects to Global Infrastructure Partners (GIP). As part of this ongoing process andtransaction, Eversource expects to complete this reviewreceive approximately $1.1 billion of cash proceeds upon closing, which includes the sales value related to the 10 percent energy community ITC adder of approximately $170 million related to Revolution Wind, and to exit these projects while retaining certain cost sharing obligations for the construction of Revolution Wind. The purchase price is subject to future post-closing adjustment payments based on, among other things, the progress, timing and expense of construction at each project. The cost sharing obligations provide that Eversource would share equally with GIP in GIP’s funding obligations for up to approximately $240 million of incremental capital expenditure overruns incurred during the construction phase for the Revolution Wind project, after which GIP’s obligations for any additional capital expenditure overruns would be shared equally by Eversource and Ørsted. Additionally, Eversource’s financial exposure will be adjusted by certain purchase price adjustments to be made following commercial operation of the Revolution Wind project and closing of South Fork as a result of final project economics, which includes Eversource’s obligation to maintain GIP’s internal rate of return for each project as specified in the second quarteragreement. Eversource currently expects that South Fork Wind will reach full commercial operation prior to closing of 2023. Eversource’s strategic review of its offshore wind investmentthe sale with GIP and Eversource does not expect any material cost sharing or other purchase price adjustment payments for South Fork Wind.
Factors that could result in Eversource’s total net proceeds from the transaction to be lower or higher include Revolution Wind’s eligibility for federal investment tax credits at other than the anticipated 40 percent level; the ultimate cost of construction and extent of cost overruns for Revolution Wind; delays in constructing Revolution Wind, which would impact the presentationeconomics associated with the purchase price adjustment; and a benefit due to Eversource if there are lower operation costs or higher availability of the December 31, 2022 financial statements.projects through the period that is four years following the commercial operation date of the Revolution Wind project.
Closing a transaction with GIP would be subject to customary conditions, including certain regulatory approvals under the Hart Scott Rodino Act and by the New York Public Service Commission and the FERC, as well as other conditions, among which is the completion and execution of the partnership agreements between GIP and Ørsted that will govern GIP’s new ownership interest in those projects following Eversource’s divestiture. Closing of the transaction is currently expected to occur in mid-2024. If closing of the sale is delayed, additional capital contributions made by Eversource would be recovered in the sales price. Under the agreement, Eversource’s existing credit support obligations are expected to roll off for each project around the time that each project completes its expected capital spend.
NSTAR Electric: Impairment:As of December 31, 2022 and 2021, NSTAR Electric's investments included a 14.5 percent ownership interest in two companies that transmit hydro-electricity imported from the Hydro-Quebec system in Canada of $9.3 million and $9.0 million, respectively.
Impairment of Equity Method Investments: Equity method investments are assessed for impairment when conditions exist as of the balance sheet date that indicate that the fair value of the investment ismay be less than book value. Eversource continually monitors and evaluates its equity method investments to determine if there are indicators of an other-than-temporary impairment. If the decline in value is considered to be other-than-temporary, the investment is written down to its estimated fair value, which establishes a new cost basis in the investment. Subsequent declines or recoveries after the reporting date are not considered in the impairment recognized. Investments that are other-than-temporarily impaired and written down to their estimated fair value cannot subsequently be written back up for increases in estimated fair value. Impairment evaluations involve a significant degree of judgment and estimation, including identifying circumstances that indicate an impairment may exist at the equity method investment level, selecting discount rates used to determine fair values, and developing an estimate of discounted future cash flows expected from investment operations or the sale of the investment. No impairments occurred during the year 2022. Eversource continually monitors and evaluates its equity method investments to determine if there are indicators of an other-than-temporary impairment.
In connection with the fair market value ofprocess to divest its offshore wind investment is greater thanbusiness, Eversource identified indicators for impairment in both the second and fourth quarters of 2023. In each impairment assessment, Eversource evaluated its investments and determined that the carrying value of the equity method offshore wind investments exceeded the fair value of the investments and that the decline in fair value was other-than-temporary. The completion of the strategic review in the second quarter of 2023 resulted in Eversource recording a pre-tax other-than-temporary impairment charge of $401 million ($331 million after-tax) to reflect the investment at estimated fair value based upon management’s expectationon the expected sales price at that time. This established a new cost basis in the investments. Negative developments in the fourth quarter of 2023, including a lower expected sales price, additional projected construction cost increases, and the October 2023 OREC pricing denial for Sunrise Wind, resulted in Eversource conducting an impairment evaluation and recognizing an additional pre-tax other-than-temporary impairment charge of $1.77 billion ($1.62 billion after-tax) and establishing a new cost basis in the investments as of December 31, 2023. The Eversource statement of income reflects a total pre-tax other-than-temporary impairment charge of $2.17 billion ($1.95 billion after-tax) in its offshore wind investments for the year ended 2023.
The impairment evaluations involved judgments in developing the estimates and timing of the future cash flows arising from the saleexpected sales price of all,Eversource’s 50 percent interest in the wind projects, including expected sales value from investment tax credit adder amounts, less estimated costs to sell, and uncertainties related to the Sunrise Wind re-bid process in New York’s offshore wind solicitation. Additional assumptions in the fourth quarter assessment included revised projected construction costs and estimated project cost overruns, estimated termination costs, salvage values of Sunrise Wind assets, and the value of the tax equity ownership interest. The assumptions used in the discounted cash flow analyses are subject to inherent uncertainties and subjectivity. The use of different assumptions, estimates, or part,judgments with respect to the estimation of its investment. Therefuture cash flows could materially change the impairment charges. The impairment evaluations were based on best information available at the impairment assessment dates. New information from events or circumstances arising after the balance sheet date, such as the January 25, 2024 re-bid of Sunrise Wind in the New York solicitation, are uncertaintiesnot included in the December 31, 2023 impairment evaluation. All significant inputs into the impairment evaluations were Level 3 fair value measurements.
The expected cash flows arising from the anticipated sales are a significant input in the impairment evaluation. In the fourth quarter of 2023, project construction forecasts were updated, and these new forecasts reflected additional expenditures for construction and scheduling related pressures, including the availability and increased cost of installation vessels and supply chain cost increases related to foundation fabrication. In determining the current fair value of the investments, these updated projections exceeded the previously estimated projections for construction expenditures, which resulted in a sale process, and there could be changes in market conditionsrevised sales price that would impact Eversource’s ability to sell this investment orwas significantly lower than the value it would receive for these assets. In the event that the strategic review does not resultprevious bid value. Another significant assumption in the saleimpairment evaluation includes the probability of payment of future cost overruns on the offshorethree wind business or that a sale of the offshore wind business is significantly delayed or at lower than expected value from these changes in market conditions driven by unfavorable developments, such as scheduling or permitting delays, increases in cost estimates, changes to tax laws impacting the project’s ability to monetize tax attributes, higher interest rates, and increasesprojects through each project's respective commercial operation date, which would not be recovered in the discount rate, itexpected sales price. This assumption was based on construction projections updated in the fourth quarter of 2023 exceeding prior estimates. An increase in expected cost overruns could result in Eversource havinga significant impairment in a future period.
Another key assumption in the impairment model of our offshore wind investments was investment tax credit (“ITC”) adders that were included in the Inflation Reduction Act and were a separate part of the sales price value offered by GIP. An ITC adder is an additional 10 percent of credit value for ITC eligible costs and include two distinct qualifications related to evaluateeither using domestic sourced materials (domestic content) or construction of an onshore substation in a designated community (energy community). Similar to the base ITC of 30 percent of the eligible costs, any ITC adders generated would be used to reduce an owner’s federal tax liability and could be used to receive tax refunds from prior years as well. Management believes there is a high likelihood that the 10 percent energy community ITC adder is realizable, and that ITC adder would amount to approximately $170 million of additional sales value related to Revolution Wind and that it would qualify for the ITC adder after it reaches commercial operation in 2025. Although management believes the ITC adder value is realizable, there is some uncertainty at this time as to whether or not those ITC adders can be achieved, and management continues to evaluate the project’s qualifications and to monitor guidance issued by the United States Treasury Department. A change in the expected value or qualification of ITC adders could result in a significant impairment in a future period.
Another fourth quarter 2023 development included in the impairment evaluation is the key judgment regarding the probability of future cash inflows and outflows associated with the sale or abandonment of the Sunrise Wind project and the expected outcome of the New York fourth offshore wind solicitation in 2024. In June 2023, Sunrise Wind filed a petition with the New York State Public Service Commission for an order authorizing NYSERDA to amend the Sunrise Wind OREC contract to increase the contract price to cover increased costs and inflation. At that time, management expected the contract repricing would be successful given NYSERDA’s public support for pricing adjustments. On October 12, 2023, the New York State Public Service Commission denied this petition. Subsequent to the denial, on November 30, 2023, the general terms of an expedited offshore wind renewable energy solicitation in New York were released. A primary condition for Sunrise Wind to participate in this new solicitation was to agree to terminate its investment is impaired. Any resultingexisting OREC agreement. As of December 31, 2023, Eversource and Ørsted were considering whether to submit a new bid for Sunrise Wind, the price at which a new bid would be made, and the probability of success in the new bidding process. The December 31, 2023 impairment chargeevaluation included management’s judgment of the likelihood of possible future scenarios that included the Sunrise Wind project continuing with its existing OREC contract, the project re-bidding and being selected in the new solicitation, the project re-bidding and not being selected, or the project not moving forward. The unfavorable development of the October 2023 denial of the OREC pricing petition, management’s assessment of the likelihood of success in the competitive New York re-bidding process, and the increased costs to build the project, have resulted in management’s assumption that the Sunrise Wind project will ultimately be abandoned, and therefore, no sales value was modeled in the impairment evaluation. Additionally, in the abandonment assumption, management has assumed the loss of contingent sales value associated with any related ITC adders and has estimated future cash outflows for Eversource’s share of cancellation costs required under Sunrise Wind’s supplier contracts, partially offset by expected salvage value and expected cost overruns not incurred in the case of abandonment that are included in the fourth quarter 2023 impairment charge. An increase in expected cancellation costs could haveresult in a material adverse effect on the financial position and results of operations.significant impairment in a future period.
DuringA summary of the significant estimates and assumptions included in the 2023 impairment charges is as follows:
| | | | | | | | | | | | | | | | | | | | |
| | Second Quarter 2023 | | Fourth Quarter 2023 | | Total |
| (Millions of Dollars) | | | |
| Lower expected sales proceeds across all three wind projects | | $ | 401 | | | $ | 525 | | | $ | 926 | |
| Expected cost overruns not recovered in the sales price | | — | | | 441 | | | 441 | |
| Loss of sales value from the sale price offered by GIP, including loss of ITC adders value, cancellation costs and other impacts assuming Sunrise Wind project is abandoned | | — | | | 800 | | | 800 | |
| Impairment Charges, pre-tax | | 401 | | | 1,766 | | | 2,167 | |
| Tax Benefit | | (70) | | | (144) | | | (214) | |
| Impairment Charges, after-tax | | $ | 331 | | | $ | 1,622 | | | 1,953 | |
A summary of the carrying value by investee and by project as of December 31, 2023 is as follows:
| | | | | | | | | | | | | | | | | | | | | | | | | | | | | |
| Investments Expected to be Disposed of | | Investment to be Held | | |
| North East Offshore | | South Fork Class B Member, LLC | | South Fork Wind Holdings, LLC Class A | | Total Offshore Wind Investments |
| (Millions of Dollars) | Sunrise Wind | | Revolution Wind | | | |
Carrying Value as of December 31, 2023, before
Impairment Charge | $ | 699 | | | $ | 799 | | | $ | 299 | | | $ | 485 | | | $ | 2,282 | |
| Fourth Quarter 2023 Impairment Charge | (1,218) | | | (544) | | | — | | | (4) | | | (1,766) | |
| Carrying Value as of December 31, 2023 | $ | (519) | | | $ | 255 | | | $ | 299 | | | $ | 481 | | | $ | 516 | |
Management will continue to monitor and evaluate all facts and circumstances in the offshore wind sales process and the impact on its investment balance. Adverse changes in facts and circumstances of estimates and timing of future cash flows and the factors described above could result in the recognition of additional, significant impairment charges that could be material to the financial statements.
The impairment charge was a non-cash charge and did not impact Eversource’s cash position. Eversource will continue to make future cash expenditures for required cash contributions to its offshore wind investments up to the time of disposition of each of the offshore wind projects. Capital contributions are expected until the sales are completed and changes in the timing and amounts of these contributions would be adjusted in the sales prices and therefore not result in an additional impairment charge. Proceeds from the transactions will be used to pay off parent company debt. Eversource’s offshore wind investments do not meet the criteria to qualify for presentation as a discontinued operation.
Capital contributions in the offshore wind investments, including the 2023 contribution for the tax equity investment in South Fork Wind, are included in Investments in Unconsolidated Affiliates on the statements of cash flows. Proceeds received from the 2023 sale of the uncommitted lease area and from an October 2023 distribution of $318 million received primarily as a result of being a 50 percent joint owner in the Class B shares of South Fork Wind which was restructured as a tax equity investment, are included in Proceeds from Unconsolidated Affiliates on the statement of cash flows.
As of December 31, 2023, Eversource’s share of underlying equity in net assets of the offshore wind business exceeded the carrying amount of the offshore wind investments as a result of the 2023 impairments. As of December 31, 2022, the carrying amount of Eversource’s offshore wind investments exceeded its share of underlying equity in net assets by $343.1 million. The basis differences as of December 31, 2022 were primarily comprised of $168.9 million of equity method goodwill that was not being amortized, intangible assets for PPAs, and capitalized interest.
Liquidation of Renewable Energy Investment Fund: On March 21, 2023, Eversource’s equity method investment in a renewable energy investment fund was liquidated by the fund’s general partner in accordance with the partnership agreement. Proceeds received from the liquidation totaled $147.6 million and are included in Proceeds from Unconsolidated Affiliates on the statement of cash flows for the year ended December 31, 2020,2023. A portion of the proceeds was used to make a charitable contribution to the Eversource recorded an other-than-temporary impairmentEnergy Foundation (a related party) of $2.8$20.0 million withinin 2023. The liquidation benefit received in excess of the investment’s carrying value and the charitable contribution are included in Other Income, Net on the statement of income, related to a write-off of an investment within a renewable energy fund.income.
NSTAR Electric: As of December 31, 2023 and 2022, NSTAR Electric's investments included a 14.5 percent ownership interest in two companies that transmit hydro-electricity imported from the Hydro-Quebec system in Canada of $9.6 million and $9.3 million, respectively.
7. ASSET RETIREMENT OBLIGATIONS
Eversource, including CL&P, NSTAR Electric and PSNH, recognizes a liability for the fair value of an ARO on the obligation date if the liability's fair value can be reasonably estimated, even if it is conditional on a future event. Settlement dates and future costs are reasonably estimated when sufficient information becomes available. Management has identified various categories of AROs, primarily CYAPC's and YAEC's obligation to dispose of spent nuclear fuel and high level waste, and also certain assets containing asbestos and hazardous contamination. Management has performed fair value calculations reflecting expected probabilities for settlement scenarios.
The fair value of an ARO is recorded as a long-term liability with a corresponding amount included in Property, Plant and Equipment, Net on the balance sheets. The ARO assets are depreciated, and the ARO liabilities are accreted over the estimated life of the obligation and the corresponding credits are recorded as accumulated depreciation and ARO liabilities, respectively. As the electric and natural gas companies are rate-regulated on a cost-of-service basis, these companies apply regulatory accounting guidance and both the depreciation and accretion costs associated with these companies' AROs are recorded as increases to Regulatory Assets on the balance sheets.
A reconciliation of the beginning and ending carrying amounts of ARO liabilities is as follows:
| | | | As of December 31, | | As of December 31, |
| | | 2022 | | 2021 | | 2023 | | 2022 |
| (Millions of Dollars) | (Millions of Dollars) | Eversource | | CL&P | | NSTAR
Electric | | PSNH | | Eversource | | CL&P | | NSTAR
Electric | | PSNH | (Millions of Dollars) | Eversource | | CL&P | | NSTAR
Electric | | PSNH | | Eversource | | CL&P | | NSTAR
Electric | | PSNH |
| Balance as of Beginning of Year | Balance as of Beginning of Year | $ | 500.1 | | | $ | 35.0 | | | $ | 97.5 | | | $ | 4.7 | | | $ | 499.7 | | | $ | 33.4 | | | $ | 91.8 | | | $ | 4.4 | |
| | Liabilities Settled During the Year | Liabilities Settled During the Year | (22.3) | | | — | | | — | | | — | | | (23.9) | | | (0.6) | | | — | | | — | |
| Liabilities Settled During the Year | |
| Liabilities Settled During the Year | |
| Accretion | Accretion | 28.9 | | | 2.4 | | | 4.1 | | | 0.2 | | | 29.4 | | | 2.2 | | | 4.0 | | | 0.3 | |
| Revisions in Estimated Cash Flows | Revisions in Estimated Cash Flows | (4.0) | | | — | | | (0.3) | | | — | | | (5.1) | | | — | | | 1.7 | | | — | |
| Balance as of End of Year | Balance as of End of Year | $ | 502.7 | | | $ | 37.4 | | | $ | 101.3 | | | $ | 4.9 | | | $ | 500.1 | | | $ | 35.0 | | | $ | 97.5 | | | $ | 4.7 | |
Eversource's amounts include CYAPC and YAEC's AROs of $320.5$315.8 million and $325.9$320.5 million as of December 31, 20222023 and 2021,2022, respectively. The fair value of the ARO for CYAPC and YAEC includes uncertainties of the fuel off-load dates related to the DOE's timing of performance regarding its obligation to dispose of the spent nuclear fuel and high level waste and other assumptions, including discount rates. The incremental asset recorded as an offset to the ARO liability was fully depreciated since the plants have no remaining useful life. Any changes in the ARO liability are recorded with a corresponding offset to the related regulatory asset. The assets held in the CYAPC and YAEC spent nuclear fuel trusts are restricted for settling the ARO and all other nuclear fuel storage obligations. For further information on the assets held in the spent nuclear fuel trusts, see Note 5, "Marketable Securities," to the financial statements.
8. SHORT-TERM DEBT
Short-Term Debt - Borrowing Limits: The amount of short-term borrowings that may be incurred by CL&P and NSTAR Electric is subject to periodic approval by the FERC. Because the NHPUC has jurisdiction over PSNH's short-term debt, PSNH is not currently required to obtain FERC approval for its short-term borrowings. On December 3, 2021,November 30, 2023, the FERC granted authorization that allows CL&P to issue total short-term borrowings in an aggregate principal amount not to exceed $600 million outstanding at any one time, through December 31, 2023.2025. On December 3, 2021,18, 2023, the FERC granted authorization that allows NSTAR Electric to issue total short-term borrowings in an aggregate principal amount not to exceed $655 million outstanding at any one time, through December 31, 2023.2025.
PSNH is authorized by regulation of the NHPUC to incur short-term borrowings up to 10 percent of net fixed plant plus an additional $60 million until further ordered by the NHPUC. As of December 31, 2022,2023, PSNH's short-term debt authorization under the 10 percent of net fixed plant test plus $60 million totaled $443.5$483.2 million.
CL&P's certificate of incorporation contains preferred stock provisions restricting the amount of unsecured debt that CL&P may incur, including limiting unsecured indebtedness with a maturity of less than 10 years to 10 percent of total capitalization. As of December 31, 2022,2023, CL&P had $1.01 billion$625.7 million of unsecured debt capacity available under this authorization.
Yankee Gas, NSTAR Gas and EGMA are not required to obtain approval from any state or federal authority to incur short-term debt.
Short-Term Debt - Commercial Paper Programs and Credit Agreements: Eversource parent has a $2.00 billion commercial paper program allowing Eversource parent to issue commercial paper as a form of short-term debt. Eversource parent, CL&P, PSNH, NSTAR Gas, Yankee Gas, EGMA and Aquarion Water Company of Connecticut are parties to a five-year $2.00 billion revolving credit facility, which terminates on October 15, 2027.13, 2028. This revolving credit facility serves to backstop Eversource parent's $2.00 billion commercial paper program.
NSTAR Electric has a $650 million commercial paper program allowing NSTAR Electric to issue commercial paper as a form of short-term debt. NSTAR Electric is also a party to a five-year $650 million revolving credit facility, which terminates on October 15, 2027. This revolving credit facility13, 2028, and serves to backstop NSTAR Electric's $650 million commercial paper program.
The amount of borrowings outstanding and available under the commercial paper programs were as follows:
| | Borrowings Outstanding
as of December 31, | | Available Borrowing Capacity as of December 31, | | Weighted-Average Interest Rate as of December 31, |
| Borrowings Outstanding
as of December 31, | | | Borrowings Outstanding
as of December 31, | | Available Borrowing Capacity as of December 31, | | Weighted-Average Interest Rate as of December 31, |
| (Millions of Dollars) | (Millions of Dollars) | 2022 | | 2021 | | 2022 | | 2021 | | 2022 | | 2021 | (Millions of Dollars) | 2023 | | 2022 | | 2023 | | 2022 | | 2023 | | 2022 |
| Eversource Parent Commercial Paper Program | Eversource Parent Commercial Paper Program | $ | 1,442.2 | | | $ | 1,343.0 | | | $ | 557.8 | | | $ | 657.0 | | | 4.63 | % | | 0.31 | % | Eversource Parent Commercial Paper Program | $ | 1,771.9 | | | $ | | $ | 1,442.2 | | | $ | | $ | 228.1 | | | $ | | $ | 557.8 | | | 5.60 | | 5.60 | % | | 4.63 | % |
| NSTAR Electric Commercial Paper Program | NSTAR Electric Commercial Paper Program | — | | | 162.5 | | | 650.0 | | | 487.5 | | | — | % | | 0.14 | % | NSTAR Electric Commercial Paper Program | 365.8 | | | — | | — | | | 284.2 | | 284.2 | | | 650.0 | | 650.0 | | | 5.40 | | 5.40 | % | | — | % |
There were no borrowings outstanding on the revolving credit facilities as of December 31, 20222023 or 2021.2022.
CL&P and PSNH have uncommitted line of credit agreements totaling $450$375 million and $300$250 million, respectively, which will expire on May 12, 2023.in 2024. There are no borrowings outstanding on either the CL&P or PSNH uncommitted line of credit agreements as of December 31, 2022.2023.
Amounts outstanding under the commercial paper programs are included in Notes Payable and classified in current liabilities on the Eversource and NSTAR Electric balance sheets, as all borrowings are outstanding for no more than 364 days at one time.As a result of the CL&P long-term debt issuance in January 2024, $207.3 million of commercial paper borrowings under the Eversource parent commercial paper program were reclassified as Long-Term Debt on Eversource parent’s balance sheet as of December 31, 2023.
Under the credit facilities described above, Eversource and its subsidiaries, including CL&P, NSTAR Electric, PSNH, NSTAR Gas, EGMA, Yankee Gas, and Aquarion Water Company of Connecticut, must comply with certain financial and non-financial covenants, including a consolidated debt to total capitalization ratio. As of December 31, 20222023 and 2021,2022, Eversource and its subsidiaries were in compliance with these covenants. If Eversource or its subsidiaries were not in compliance with these covenants, an event of default would occur requiring all outstanding borrowings by such borrower to be repaid, and additional borrowings by such borrower would not be permitted under its respective credit facility.
Intercompany Borrowings: Eversource parent uses its available capital resources to provide loans to its subsidiaries to assist in meeting their short-term borrowing needs. Eversource parent records intercompany interest income from its loans to subsidiaries, which is eliminated in consolidation. Intercompany loans from Eversource parent to its subsidiaries are eliminated in consolidation on Eversource's balance sheets. As of December 31, 2023, there were intercompany loans from Eversource parent to CL&P of $457.0 million and to PSNH of $233.0 million. As of December 31, 2022, there were intercompany loans from Eversource parent to PSNH of $173.3 million. As of December 31, 2021, there wereEversource parent charges interest on these intercompany loans from Eversource parent to PSNH of $110.6 million.at the same weighted-average interest rate as its commercial paper program. Intercompany loans from Eversource parent are included in Notes Payable to Eversource Parentparent and classified in current liabilities on the respective subsidiary's balance sheets.sheets, as these intercompany borrowings are outstanding for no more than 364 days at one time. As a result of the CL&P long-term debt issuance in January 2024, $207.3 million of CL&P’s intercompany borrowings were reclassified to Long-Term Debt on CL&P’s balance sheet as of December 31, 2023.
Sources and Uses of Cash: The Company expects the future operating cash flows of Eversource, CL&P, NSTAR Electric and PSNH, along with existing borrowing availability and access to both debt and equity markets, will be sufficient to meet any working capital and future operating requirements, and capital investment forecasted opportunities.
9. LONG-TERM DEBT
Details of long-term debt outstanding are as follows:
| CL&P
(Millions of Dollars) | CL&P
(Millions of Dollars) | | As of December 31, | CL&P
(Millions of Dollars) | | | As of December 31, |
| Interest Rate | | 2022 | | 2021 | Interest Rate | | 2023 | | 2022 |
| First Mortgage Bonds: | First Mortgage Bonds: | | | | | | First Mortgage Bonds: | | | | | |
| 1994 Series D due 2024 | 1994 Series D due 2024 | 7.875 | % | | $ | 139.8 | | | $ | 139.8 | |
| 2004 Series B due 2034 | 2004 Series B due 2034 | 5.750 | % | | 130.0 | | | 130.0 | |
| 2005 Series B due 2035 | 2005 Series B due 2035 | 5.625 | % | | 100.0 | | | 100.0 | |
| 2006 Series A due 2036 | 2006 Series A due 2036 | 6.350 | % | | 250.0 | | | 250.0 | |
| 2007 Series B due 2037 | 2007 Series B due 2037 | 5.750 | % | | 150.0 | | | 150.0 | |
| 2007 Series D due 2037 | 2007 Series D due 2037 | 6.375 | % | | 100.0 | | | 100.0 | |
| 2013 Series A due 2023 | 2013 Series A due 2023 | 2.500 | % | | 400.0 | | | 400.0 | |
| 2014 Series A due 2044 | 2014 Series A due 2044 | 4.300 | % | | 475.0 | | | 475.0 | |
| 2015 Series A due 2045 | 2015 Series A due 2045 | 4.150 | % | | 350.0 | | | 350.0 | |
| 2017 Series A due 2027 | 2017 Series A due 2027 | 3.200 | % | | 500.0 | | | 500.0 | |
| 2018 Series A due 2048 | 2018 Series A due 2048 | 4.000 | % | | 800.0 | | | 800.0 | |
| 2020 Series A due 2025 | 2020 Series A due 2025 | 0.750 | % | | 400.0 | | | 400.0 | |
| 2021 Series A due 2031 | 2021 Series A due 2031 | 2.050 | % | | 425.0 | | | 425.0 | |
| 2023 Series A due 2053 | |
| 2023 Series B due 2033 | |
| Total First Mortgage Bonds | Total First Mortgage Bonds | | 4,219.8 | | | 4,219.8 | |
| Less Amounts due Within One Year | Less Amounts due Within One Year | | (400.0) | | | — | |
Current Portion Classified as Long-Term Debt (1) | Current Portion Classified as Long-Term Debt (1) | | 400.0 | | | — | |
| Commercial Paper Classified as Long-Term Debt (See Note 8, Short-Term Debt) | |
| Unamortized Premiums and Discounts, Net | Unamortized Premiums and Discounts, Net | | 21.5 | | | 23.1 | |
| Unamortized Debt Issuance Costs | Unamortized Debt Issuance Costs | | (24.8) | | | (27.5) | |
| CL&P Long-Term Debt | CL&P Long-Term Debt | | $ | 4,216.5 | | | $ | 4,215.4 | |
| | | | | | | | | | | | | | | | | |
NSTAR Electric
(Millions of Dollars) | | | As of December 31, |
| Interest Rate | | 2023 | | 2022 |
| Debentures: | | | | | |
| 2006 Debentures due 2036 | 5.750 | % | | $ | 200.0 | | | $ | 200.0 | |
| 2010 Debentures due 2040 | 5.500 | % | | 300.0 | | | 300.0 | |
| 2014 Debentures due 2044 | 4.400 | % | | 300.0 | | | 300.0 | |
| 2015 Debentures due 2025 | 3.250 | % | | 250.0 | | | 250.0 | |
| 2016 Debentures due 2026 | 2.700 | % | | 250.0 | | | 250.0 | |
| 2017 Debentures due 2027 | 3.200 | % | | 700.0 | | | 700.0 | |
| 2019 Debentures due 2029 | 3.250 | % | | 400.0 | | | 400.0 | |
| 2020 Debentures due 2030 | 3.950 | % | | 400.0 | | | 400.0 | |
| 2021 Debentures due 2051 | 3.100 | % | | 300.0 | | | 300.0 | |
| 2021 Debentures due 2031 | 1.950 | % | | 300.0 | | | 300.0 | |
| 2022 Debentures due 2052 | 4.550 | % | | 450.0 | | | 450.0 | |
| 2022 Debentures due 2052 | 4.950 | % | | 400.0 | | | 400.0 | |
| 2023 Debentures due 2028 | 5.600 | % | | 150.0 | | | — | |
| Total Debentures | | | 4,400.0 | | | 4,250.0 | |
| Notes: | | | | | |
| 2004 Senior Notes Series B due 2034 | 5.900 | % | | 50.0 | | | 50.0 | |
| 2007 Senior Notes Series D due 2037 | 6.700 | % | | 40.0 | | | 40.0 | |
| | | | | |
| 2013 Senior Notes Series G due 2023 | 3.880 | % | | — | | | 80.0 | |
| 2016 Senior Notes Series H due 2026 | 2.750 | % | | 50.0 | | | 50.0 | |
| Total Notes | | | 140.0 | | | 220.0 | |
| Less Amounts due Within One Year | | | — | | | (80.0) | |
| Unamortized Premiums and Discounts, Net | | | (14.0) | | | (14.8) | |
| Unamortized Debt Issuance Costs | | | (29.1) | | | (30.1) | |
| NSTAR Electric Long-Term Debt | | | $ | 4,496.9 | | | $ | 4,345.1 | |
| | | | | | | | | | | | | | | | | |
NSTAR Electric
(Millions of Dollars) | | | As of December 31, |
| Interest Rate | | 2022 | | 2021 |
| Debentures: | | | | | |
| 2006 Debentures due 2036 | 5.750 | % | | $ | 200.0 | | | $ | 200.0 | |
| 2010 Debentures due 2040 | 5.500 | % | | 300.0 | | | 300.0 | |
| 2012 Debentures due 2022 | 2.375 | % | | — | | | 400.0 | |
| 2014 Debentures due 2044 | 4.400 | % | | 300.0 | | | 300.0 | |
| 2015 Debentures due 2025 | 3.250 | % | | 250.0 | | | 250.0 | |
| 2016 Debentures due 2026 | 2.700 | % | | 250.0 | | | 250.0 | |
| 2017 Debentures due 2027 | 3.200 | % | | 700.0 | | | 700.0 | |
| 2019 Debentures due 2029 | 3.250 | % | | 400.0 | | | 400.0 | |
| 2020 Debentures due 2030 | 3.950 | % | | 400.0 | | | 400.0 | |
| 2021 Debentures due 2051 | 3.100 | % | | 300.0 | | | 300.0 | |
| 2021 Debentures due 2031 | 1.950 | % | | 300.0 | | | 300.0 | |
| 2022 Debentures due 2052 | 4.550 | % | | 450.0 | | | — | |
| 2022 Debentures due 2052 | 4.950 | % | | 400.0 | | | — | |
| Total Debentures | | | 4,250.0 | | | 3,800.0 | |
| Notes: | | | | | |
| 2004 Senior Notes Series B due 2034 | 5.900 | % | | 50.0 | | | 50.0 | |
| 2007 Senior Notes Series D due 2037 | 6.700 | % | | 40.0 | | | 40.0 | |
| | | | | |
| 2013 Senior Notes Series G due 2023 | 3.880 | % | | 80.0 | | | 80.0 | |
| 2016 Senior Notes Series H due 2026 | 2.750 | % | | 50.0 | | | 50.0 | |
| Total Notes | | | 220.0 | | | 220.0 | |
| Less Amounts due Within One Year | | | (80.0) | | | (400.0) | |
| Unamortized Premiums and Discounts, Net | | | (14.8) | | | (11.2) | |
| Unamortized Debt Issuance Costs | | | (30.1) | | | (23.4) | |
| NSTAR Electric Long-Term Debt | | | $ | 4,345.1 | | | $ | 3,585.4 | |
| | | | | | | | | | | | | | | | | |
PSNH
(Millions of Dollars) | | | As of December 31, |
| Interest Rate | | 2023 | | 2022 |
| First Mortgage Bonds: | | | | | |
| 2005 Series M due 2035 | 5.600 | % | | $ | 50.0 | | | $ | 50.0 | |
| | | | | |
| | | | | |
| 2013 Series S due 2023 | 3.500 | % | | — | | | 325.0 | |
| 2019 Series T due 2049 | 3.600 | % | | 300.0 | | | 300.0 | |
| 2020 Series U due 2050 | 2.400 | % | | 150.0 | | | 150.0 | |
| 2021 Series V due 2031 | 2.200 | % | | 350.0 | | | 350.0 | |
| 2023 Series W due 2053 | 5.150 | % | | 300.0 | | | — | |
| 2023 Series X due 2033 | 5.350 | % | | 300.0 | | | — | |
| Total First Mortgage Bonds | | | 1,450.0 | | | 1,175.0 | |
| Less Amounts due Within One Year | | | — | | | (325.0) | |
Current Portion Classified as Long-Term Debt (1) | | | — | | | 295.3 | |
| Unamortized Premiums and Discounts, Net | | | (4.9) | | | (2.5) | |
| Unamortized Debt Issuance Costs | | | (13.5) | | | (7.9) | |
| PSNH Long-Term Debt | | | $ | 1,431.6 | | | $ | 1,134.9 | |
| | | | | | | | | | | | | | | | | |
PSNH
(Millions of Dollars) | | | As of December 31, |
| Interest Rate | | 2022 | | 2021 |
| First Mortgage Bonds: | | | | | |
| 2005 Series M due 2035 | 5.600 | % | | $ | 50.0 | | | $ | 50.0 | |
| | | | | |
| | | | | |
| 2013 Series S due 2023 | 3.500 | % | | 325.0 | | | 325.0 | |
| 2019 Series T due 2049 | 3.600 | % | | 300.0 | | | 300.0 | |
| 2020 Series U due 2050 | 2.400 | % | | 150.0 | | | 150.0 | |
| 2021 Series V due 2031 | 2.200 | % | | 350.0 | | | 350.0 | |
| Total First Mortgage Bonds | | | 1,175.0 | | | 1,175.0 | |
| Less Amounts due Within One Year | | | (325.0) | | | — | |
Current Portion Classified as Long-Term Debt (1) | | | 295.3 | | | — | |
| Unamortized Premiums and Discounts, Net | | | (2.5) | | | (2.6) | |
| Unamortized Debt Issuance Costs | | | (7.9) | | | (8.6) | |
| PSNH Long-Term Debt | | | $ | 1,134.9 | | | $ | 1,163.8 | |
| OTHER
(Millions of Dollars) | OTHER
(Millions of Dollars) | | As of December 31, | OTHER
(Millions of Dollars) | | | | | As of December 31, |
| Interest Rate | | 2022 | | 2021 | Interest Rate | | 2023 | | 2022 |
| Eversource Parent - Senior Notes due 2024 - 2050 | |
| Yankee Gas - First Mortgage Bonds due 2024 - 2051 | Yankee Gas - First Mortgage Bonds due 2024 - 2051 | 1.380 | % | - | 5.350% | | $ | 845.0 | | | $ | 765.0 | |
| NSTAR Gas - First Mortgage Bonds due 2025 - 2051 | NSTAR Gas - First Mortgage Bonds due 2025 - 2051 | 2.250 | % | - | 7.110% | | 705.0 | | | 580.0 | |
| EGMA - First Mortgage Bonds due 2031 - 2052 | 2.110 | % | - | 4.700% | | 650.0 | | | 550.0 | |
| EGMA - First Mortgage Bonds due 2028 - 2052 | |
| Aquarion - Senior Notes due 2024 | Aquarion - Senior Notes due 2024 | 4.000% | | 360.0 | | | 360.0 | |
| Aquarion - Unsecured Notes due 2023 - 2052 | — | % | - | 6.430% | | 464.7 | | | 394.9 | |
| Aquarion - Secured Debt due 2023 - 2044 | 2.864 | % | - | 9.290% | | 34.4 | | | 39.6 | |
| Eversource Parent - Senior Notes due 2023 - 2050 | 0.800 | % | - | 4.600% | | 8,150.0 | | | 6,100.0 | |
| Aquarion - Unsecured Notes due 2028 - 2052 | |
| Aquarion - Secured Debt due 2027 - 2044 | |
| Pre-1983 Spent Nuclear Fuel Obligation (CYAPC) | Pre-1983 Spent Nuclear Fuel Obligation (CYAPC) | | 11.9 | | | 11.7 | |
Fair Value Adjustment (2) | Fair Value Adjustment (2) | | 26.2 | | | 43.8 | |
Less Fair Value Adjustment - Current Portion (2) | Less Fair Value Adjustment - Current Portion (2) | | (7.0) | | | (17.7) | |
| Less Amounts due in One Year | Less Amounts due in One Year | | (1,203.4) | | | (775.4) | |
| Current Portion Classified as Long-Term Debt (1) | |
| Unamortized Premiums and Discounts, Net | Unamortized Premiums and Discounts, Net | | 40.1 | | | 43.4 | |
| Unamortized Debt Issuance Costs | Unamortized Debt Issuance Costs | | (49.4) | | | (36.3) | |
| Total Other Long-Term Debt | Total Other Long-Term Debt | | $ | 10,027.5 | | | $ | 8,059.0 | |
| | Total Eversource Long-Term Debt | Total Eversource Long-Term Debt | | $ | 19,724.0 | | | $ | 17,023.6 | |
| Total Eversource Long-Term Debt | |
| Total Eversource Long-Term Debt | |
(1) As a result of the CL&P and Eversource parent long-term debt issuances in January 2024, $139.8 million and $990.9 million, respectively, of current portion of long-term debt were reclassified as Long-Term Debt on CL&P’s and Eversource parent’s balance sheets as of December 31, 2023. As a result of the CL&P and PSNH long-term debt issuances in January 2023, $400 million and $295.3 million, respectively, of current portion of long-term debt were reclassified as Long-Term Debt on CL&P’s and PSNH’s balance sheets as of December 31, 2022.
(2) The fair value adjustment amount is the purchase price adjustments, net of amortization, required to record long-term debt at fair value on the dates of the 2012 merger with NSTAR and the 2017 acquisition of Aquarion.
Availability under Long-Term Debt Issuance Authorizations: On DecemberJune 14, 2022, the NHPUCDPU approved PSNH’sNSTAR Gas’ request for authorization to issue up to $600$325 million in long-term debt through December 31, 2023.2024. On November 30, 2022, the PURA approved CL&P's request for authorization to issue up to $1.15 billion in long-term debt through December 31, 2024. As a result of CL&P’s January 2024 long-term debt issuance, CL&P has now fully utilized this authorization. On June 14, 2022, the DPU7, 2023, PURA approved NSTARYankee Gas’ request for authorization to issue up to $325$350 million in long-term debt through December 31, 2024. The remaining Eversource operating companies, includingOn November 21, 2023, NSTAR Electric have utilizedpetitioned the DPU requesting authorization to issue up to $2.4 billion in long-term debt authorizationsthrough December 31, 2026. On February 8, 2024, the NHPUC approved PSNH’s request for authorization to issue up to $300 million in place with the respective regulatory commissions.long-term debt through December 31, 2024.
Long-Term Debt Issuances and Repayments: The following table summarizes long-term debt issuances and repayments:
| | | | | | | | | | | | | | | | | | | | | | | | | | | | | |
| (Millions of Dollars) | Interest Rate | | Issuance/
(Repayment) | | Issue Date or Repayment Date | | Maturity Date | | Use of Proceeds for Issuance/
Repayment Information |
| CL&P 2023 Series A First Mortgage Bonds | 5.25 | % | | $ | 500.0 | | | January 2023 | | January 2053 | | Repaid 2013 Series A Bonds at maturity and short-term debt, and paid capital expenditures and working capital |
| CL&P 2013 Series A First Mortgage Bonds | 2.50 | % | | (400.0) | | | January 2023 | | January 2023 | | Paid at maturity |
| NSTAR Electric 2022 Debentures | 4.55 | % | | 450.0 | | | May 2022 | | June 2052 | | Repaid short-term debt, paid capital expenditures and working capital |
| NSTAR Electric 2022 Debentures | 4.95 | % | | 400.0 | | | September 2022 | | September 2052 | | Refinanced investments in eligible green expenditures, which were previously financed using short-term debt from October 1, 2020 through June 30, 2022 |
| NSTAR Electric 2012 Debentures | 2.375 | % | | (400.0) | | | October 2022 | | October 2022 | | Paid at maturity |
| PSNH Series W First Mortgage Bonds | 5.15 | % | | 300.0 | | | January 2023 | | January 2053 | | Repaid short-term debt, paid capital expenditures and working capital |
| Eversource Parent Series V Senior Notes | 2.90 | % | | 650.0 | | | February 2022 | | March 2027 | | Repaid Series K Senior Notes at maturity and short-term debt |
| Eversource Parent Series W Senior Notes | 3.375 | % | | 650.0 | | | February 2022 | | March 2032 | | Repaid Series K Senior Notes at maturity and short-term debt |
| Eversource Parent Series X Senior Notes | 4.20 | % | | 900.0 | | | June 2022 | | June 2024 | | Repaid short-term debt and paid working capital |
| Eversource Parent Series Y Senior Notes | 4.60 | % | | 600.0 | | | June 2022 | | July 2027 | | Repaid short-term debt and paid working capital |
| Eversource Parent Series K Senior Notes | 2.75 | % | | (750.0) | | | March 2022 | | March 2022 | | Paid at maturity |
| Yankee Gas Series B First Mortgage Bonds | 8.48 | % | | (20.0) | | | March 2022 | | March 2022 | | Paid at maturity |
| Yankee Gas Series U First Mortgage Bonds | 4.31 | % | | 100.0 | | | September 2022 | | September 2032 | | Repaid short-term debt, paid capital expenditures and for general corporate purposes |
| EGMA Series C First Mortgage Bonds | 4.70 | % | | 100.0 | | | June 2022 | | June 2052 | | Repaid short-term debt, paid capital expenditures and for general corporate purposes |
| NSTAR Gas Series V First Mortgage Bonds | 4.40 | % | | 125.0 | | | July 2022 | | August 2032 | | Repaid short-term debt, paid capital expenditures and for general corporate purposes |
| Aquarion Water Company of New Hampshire General Mortgage Bonds | 4.45 | % | | (5.0) | | | July 2022 | | July 2022 | | Paid at maturity |
| Aquarion Water Company of Connecticut Senior Notes | 4.69 | % | | 70.0 | | | August 2022 | | September 2052 | | Repaid short-term debt |
| | | | | | | | | | | | | | | | | | | | | | | | | | | | | |
| (Millions of Dollars) | Interest Rate | | Issuance/
(Repayment) | | Issue Date or Repayment Date | | Maturity Date | | Use of Proceeds for Issuance/
Repayment Information |
| CL&P 2023 Series A First Mortgage Bonds | 5.25 | % | | $ | 500.0 | | | January 2023 | | January 2053 | | Repaid 2013 Series A Bonds at maturity and short-term debt, and paid capital expenditures and working capital |
| CL&P 2013 Series A First Mortgage Bonds | 2.50 | % | | (400.0) | | | January 2023 | | January 2023 | | Paid at maturity |
| CL&P 2023 Series B First Mortgage Bonds | 4.90 | % | | 300.0 | | | July 2023 | | July 2033 | | Repaid short-term debt, paid capital expenditures and working capital |
| CL&P 2024 Series A First Mortgage Bonds | 4.65 | % | | 350.0 | | | January 2024 | | January 2029 | | Repaid short-term debt, paid capital expenditures and working capital |
| NSTAR Electric 2023 Debentures | 5.60 | % | | 150.0 | | | September 2023 | | October 2028 | | Repaid Series G Senior Notes at maturity and short-term debt and for general corporate purposes |
| NSTAR Electric 2013 Series G Senior Notes | 3.88 | % | | (80.0) | | | November 2023 | | November 2023 | | Paid at maturity |
| PSNH Series W First Mortgage Bonds | 5.15 | % | | 300.0 | | | January 2023 | | January 2053 | | Repaid short-term debt, paid capital expenditures and working capital |
| PSNH Series X First Mortgage Bonds | 5.35 | % | | 300.0 | | | September 2023 | | October 2033 | | Repaid Series S Bonds at maturity and for general corporate purposes |
| PSNH Series S First Mortgage Bonds | 3.50 | % | | (325.0) | | | November 2023 | | November 2023 | | Paid at maturity |
| Eversource Parent Series Z Senior Notes | 5.45 | % | | 750.0 | | | March 2023 | | March 2028 | | Repaid Series F Senior Notes at maturity and short-term debt |
| Eversource Parent Series F Senior Notes | 2.80 | % | | (450.0) | | | May 2023 | | May 2023 | | Paid at maturity |
| Eversource Parent Series Z Senior Notes | 5.45 | % | | 550.0 | | | May 2023 | | March 2028 | | Repaid Series T Senior Notes and Series N Senior Notes at maturity and short-term debt |
| Eversource Parent Series AA Senior Notes | 4.75 | % | | 450.0 | | | May 2023 | | May 2026 | | Repaid Series T Senior Notes and Series N Senior Notes at maturity and short-term debt |
| Eversource Parent Series BB Senior Notes | 5.125 | % | | 800.0 | | | May 2023 | | May 2033 | | Repaid Series T Senior Notes and Series N Senior Notes at maturity and short-term debt |
| Eversource Parent Variable Rate Series T Senior Notes | SOFR plus 0.25% | | (350.0) | | | August 2023 | | August 2023 | | Paid at maturity |
| Eversource Parent Series CC Senior Notes | 5.95 | % | | 800.0 | | | November 2023 | | February 2029 | | Repaid Series N Senior Notes at maturity and short-term debt |
| Eversource Parent Series N Senior Notes | 3.80 | % | | (400.0) | | | December 2023 | | December 2023 | | Paid at maturity |
| Eversource Parent Series DD Senior Notes | 5.00 | % | | 350.0 | | | January 2024 | | January 2027 | | Repaid short-term debt |
| Eversource Parent Series EE Senior Notes | 5.50 | % | | 650.0 | | | January 2024 | | January 2034 | | Repaid short-term debt |
| Yankee Gas Series V First Mortgage Bonds | 5.51 | % | | 170.0 | | | August 2023 | | August 2030 | | Repaid short-term debt and general corporate purposes |
| EGMA Series D First Mortgage Bonds | 5.73 | % | | 58.0 | | | November 2023 | | November 2028 | | Repaid short-term debt, paid capital expenditures and working capital |
| Aquarion Water Company of Connecticut Senior Notes | 5.89 | % | | 50.0 | | | September 2023 | | October 2043 | | Repaid existing indebtedness, paid capital expenditures and general corporate purposes |
Long-Term Debt Provisions: The utility plant of CL&P, PSNH, Yankee Gas, NSTAR Gas, EGMA and a portion of Aquarion is subject to the lien of each company's respective first mortgage bond indenture. The Eversource parent, NSTAR Electric and a portion of Aquarion debt is unsecured. Additionally, the long-term debt agreements provide that Eversource and certain of its subsidiaries must comply with certain covenants as are customarily included in such agreements, including equity requirements for NSTAR Electric, NSTAR Gas and Aquarion. Under the equity requirements, NSTAR Electric's and Aquarion's senior notes must maintain a certain consolidated indebtedness to capitalization ratio as of the end of any fiscal quarter and NSTAR Gas' outstanding long-term debt must not exceed equity.
Certain secured and unsecured long-term debt securities are callable at redemption price or are subject to make-whole provisions.
No long-term debt defaults have occurred as of December 31, 2022.2023.
CYAPC's Pre-1983 Spent Nuclear Fuel Obligation: Under the Nuclear Waste Policy Act of 1982, the DOE is responsible for the selection and development of repositories for, and the disposal of, spent nuclear fuel and high-level radioactive waste. CYAPC is obligated to pay the DOE for the costs to dispose of spent nuclear fuel and high-level radioactive waste generated prior to April 7, 1983 (pre-1983 Spent Nuclear Fuel). CYAPC has partially paid this obligation and recorded an accrual for its remaining liability to the DOE. This liability accrues interest costs at the 3-month Treasury bill yield rate. For nuclear fuel used to generate electricity prior to April 7, 1983, payment may be made any time prior to the first delivery of spent fuel to the DOE. As of December 31, 20222023 and 2021,2022, as a result of consolidating CYAPC, Eversource has consolidated $11.9$12.5 million and $11.7$11.9 million, respectively, in pre-1983 spent nuclear fuel obligations to the DOE. The obligation includes accumulated interest costs of $8.8$9.5 million and $8.7$8.8 million as of December 31, 20222023 and 2021,2022, respectively. CYAPC maintains a trust to fund amounts due to the DOE for the disposal of pre-1983 spent nuclear fuel. For further information, see Note 5, "Marketable Securities," to the financial statements. Fees for disposal of nuclear fuel burned on or after April 7, 1983 were billed to member companies and paid to the DOE.
Long-Term Debt Maturities: Long-term debt maturities on debt outstanding for the years 20232024 through 20272028 and thereafter are shown below. These amounts exclude PSNH rate reduction bonds, CYAPC pre-1983 spent nuclear fuel obligation, net unamortized premiums, discounts and debt issuance costs, and other fair value adjustments as of December 31, 2022:2023:
| | (Millions of Dollars) | (Millions of Dollars) | Eversource | | CL&P | | NSTAR Electric | | PSNH | (Millions of Dollars) | Eversource | | CL&P | | NSTAR Electric | | PSNH |
| 2023 | $ | 2,008.4 | | | $ | 400.0 | | | $ | 80.0 | | | $ | 325.0 | |
| 2024 | 2024 | 1,950.0 | | | 139.8 | | | — | | | — | |
| 2025 | 2025 | 1,400.2 | | | 400.0 | | | 250.0 | | | — | |
| 2026 | 2026 | 940.2 | | | — | | | 300.0 | | | — | |
| 2027 | 2027 | 2,539.2 | | | 500.0 | | | 700.0 | | | — | |
| 2028 | |
| Thereafter | Thereafter | 12,236.0 | | | 2,780.0 | | | 3,140.0 | | | 850.0 | |
| Total | Total | $ | 21,074.0 | | | $ | 4,219.8 | | | $ | 4,470.0 | | | $ | 1,175.0 | |
10. RATE REDUCTION BONDS AND VARIABLE INTEREST ENTITIES
Rate Reduction Bonds: In May 2018, PSNH Funding, a wholly-owned subsidiary of PSNH, issued $635.7 million of securitized RRBs in multiple tranches with a weighted average interest rate of 3.66 percent, and final maturity dates ranging from 2026 to 2035. The RRBs are expected to be repaid by February 1, 2033. RRB payments consist of principal and interest and are paid semi-annually, beginning on February 1, 2019. The RRBs were issued pursuant to a finance order issued by the NHPUC in January 2018 to recover remaining costs resulting from the divestiture of PSNH’s generation assets.
The proceeds were used by PSNH Funding to purchase PSNH’s stranded cost asset-recovery property, including its vested property right to bill, collect and adjust a non-bypassable stranded cost recovery charge from PSNH’s retail customers. The collections are used to pay principal, interest and other costs in connection with the RRBs. The RRBs are secured by the stranded cost asset-recovery property. Cash collections from the stranded cost recovery charges and funds on deposit in trust accounts are the sole source of funds to satisfy the debt obligation. PSNH is not the owner of the RRBs, and PSNH Funding’s assets and revenues are not available to pay PSNH’s creditors. The RRBs are non-recourse senior secured obligations of PSNH Funding and are not insured or guaranteed by PSNH or Eversource Energy.
PSNH Funding was formed solely to issue RRBs to finance PSNH's unrecovered remaining costs associated with the divestiture of its generation assets. PSNH Funding is considered a VIE primarily because the equity capitalization is insufficient to support its operations. PSNH has the power to direct the significant activities of the VIE and is most closely associated with the VIE as compared to other interest holders. Therefore, PSNH is considered the primary beneficiary and consolidates PSNH Funding in its consolidated financial statements. The following tables summarize the impact of PSNH Funding on PSNH's balance sheets and income statements:
| | (Millions of Dollars) | (Millions of Dollars) | As of December 31, | (Millions of Dollars) | As of December 31, |
| PSNH Balance Sheets: | PSNH Balance Sheets: | 2022 | | 2021 | PSNH Balance Sheets: | 2023 | | 2022 |
| Restricted Cash - Current Portion (included in Current Assets) | Restricted Cash - Current Portion (included in Current Assets) | $ | 32.4 | | | $ | 31.1 | |
| Restricted Cash - Long-Term Portion (included in Other Long-Term Assets) | Restricted Cash - Long-Term Portion (included in Other Long-Term Assets) | 3.2 | | | 3.2 | |
| Securitized Stranded Cost (included in Regulatory Assets) | Securitized Stranded Cost (included in Regulatory Assets) | 435.7 | | | 478.9 | |
| Other Regulatory Liabilities (included in Regulatory Liabilities) | Other Regulatory Liabilities (included in Regulatory Liabilities) | 6.0 | | | 5.4 | |
| Accrued Interest (included in Other Current Liabilities) | Accrued Interest (included in Other Current Liabilities) | 6.9 | | | 7.5 | |
| Rate Reduction Bonds - Current Portion | Rate Reduction Bonds - Current Portion | 43.2 | | | 43.2 | |
| Rate Reduction Bonds - Long-Term Portion | Rate Reduction Bonds - Long-Term Portion | 410.5 | | | 453.7 | |
| (Millions of Dollars)
PSNH Income Statements: | (Millions of Dollars)
PSNH Income Statements: | For the Years Ended December 31, | (Millions of Dollars)
PSNH Income Statements: | For the Years Ended December 31, |
| 2022 | | 2021 | | 2020 | 2023 | | 2022 | | 2021 |
| Amortization of RRB Principal (included in Amortization of Regulatory Assets, Net) | $ | 43.2 | | | $ | 43.2 | | | $ | 43.2 | |
| Amortization of RRB Principal (included in Amortization of Regulatory (Liabilities)/Assets, Net) | |
| Interest Expense on RRB Principal (included in Interest Expense) | Interest Expense on RRB Principal (included in Interest Expense) | 17.0 | | | 18.4 | | | 19.7 | |
Estimated principal payments on RRBs as of December 31, 2022,2023, is summarized annually through 20272028 and thereafter as follows:
| | (Millions of Dollars) | (Millions of Dollars) | 2023 | | 2024 | | 2025 | | 2026 | | 2027 | | Thereafter | | Total | (Millions of Dollars) | 2024 | | 2025 | | 2026 | | 2027 | | 2028 | | Thereafter | | Total |
| PSNH | PSNH | $ | 43.2 | | | $ | 43.2 | | | $ | 43.2 | | | $ | 43.2 | | | $ | 43.2 | | | $ | 237.7 | | | $ | 453.7 | |
Variable Interest Entities - Other: The Company's variable interests outside of the consolidated group include contracts that are required by regulation and provide for regulatory recovery of contract costs and benefits through customer rates. Eversource, CL&P and NSTAR Electric hold variable interests in VIEs through agreements with certain entities that own single renewable energy or peaking generation power plants, with other independent power producers and with transmission businesses. Eversource, CL&P and NSTAR Electric do not control the activities that are economically significant to these VIEs or provide financial or other support to these VIEs. Therefore, Eversource, CL&P and NSTAR Electric do not consolidate these VIEs.
11. EMPLOYEE BENEFITS
A. Pension Benefits and Postretirement Benefits Other Than Pension
Eversource provides defined benefit retirement plans (Pension Plans) that cover eligible employees and are subject to the provisions of ERISA, as amended by the Pension Protection Act of 2006. Eversource's policy is to annually fund the Pension Plans in an amount at least equal to an amount that will satisfy all federal funding requirements. In addition to the Pension Plans, Eversource maintains non-qualified defined benefit retirement plans (SERP Plans), which provide benefits in excess of Internal Revenue Code limitations to eligible participants consisting of current and retired employees.
Eversource also provides defined benefit postretirement plans (PBOP Plans) that provide life insurance and a health reimbursement arrangement created for the purpose of reimbursing retirees and dependents for health insurance premiums and certain medical expenses to eligible employees that meet certain age and service eligibility requirements. The benefits provided under the PBOP Plans are not vested, and the Company has the right to modify any benefit provision subject to applicable laws at that time. Eversource annually funds postretirement costs through tax deductible contributions to external trusts.
Funded Status: The Pension, SERP and PBOP Plans are accounted for under the multiple-employer approach, with each operating company's balance sheet reflecting its share of the funded status of the plans. Although Eversource maintains marketable securities in a benefit trust, the SERP Plans do not contain any assets. For further information, see Note 5, "Marketable Securities," to the financial statements. The following tables provide information on the plan benefit obligations, fair values of plan assets, and funded status:
| | | | Pension and SERP | | Pension and SERP |
| As of December 31, |
| As of December 31, | | | As of December 31, |
| | | 2022 | | 2021 | | 2023 | | 2022 |
| (Millions of Dollars) | (Millions of Dollars) | Eversource | | CL&P | | NSTAR
Electric | | PSNH | | Eversource | | CL&P | | NSTAR
Electric | | PSNH | (Millions of Dollars) | Eversource | | CL&P | | NSTAR
Electric | | PSNH | | Eversource | | CL&P | | NSTAR
Electric | | PSNH |
| Change in Benefit Obligation: | Change in Benefit Obligation: | | | | | | | | | | | | | | | | Change in Benefit Obligation: | | | | | | | | | | | |
| Benefit Obligation as of Beginning of Year | Benefit Obligation as of Beginning of Year | $ | (6,729.7) | | | $ | (1,330.9) | | | $ | (1,448.4) | | | $ | (721.0) | | | $ | (7,045.3) | | | $ | (1,477.3) | | | $ | (1,517.9) | | | $ | (748.7) | |
| Service Cost | Service Cost | (70.1) | | | (18.7) | | | (13.8) | | | (6.9) | | | (85.8) | | | (23.0) | | | (15.8) | | | (8.9) | |
| Interest Cost | Interest Cost | (154.5) | | | (31.3) | | | (32.8) | | | (16.9) | | | (130.0) | | | (27.3) | | | (26.8) | | | (14.5) | |
| Actuarial Gain | 1,385.8 | | | 284.1 | | | 295.5 | | | 156.7 | | | 177.1 | | | 127.8 | | | 20.8 | | | 14.7 | |
| Actuarial (Loss)/Gain | |
| Benefits Paid - Pension | Benefits Paid - Pension | 302.5 | | | 63.3 | | | 68.4 | | | 33.9 | | | 309.5 | | | 64.6 | | | 68.7 | | | 34.7 | |
| Benefits Paid - Lump Sum | Benefits Paid - Lump Sum | 33.0 | | | — | | | 14.8 | | | 1.0 | | | 34.7 | | | — | | | 15.6 | | | — | |
| Benefits Paid - SERP | Benefits Paid - SERP | 12.9 | | | 0.3 | | | 0.2 | | | 0.4 | | | 10.1 | | | 0.3 | | | 0.2 | | | 0.4 | |
| Employee Transfers | Employee Transfers | — | | | 3.2 | | | 5.7 | | | (3.4) | | | — | | | 4.0 | | | 6.8 | | | 1.3 | |
| Benefit Obligation as of End of Year | Benefit Obligation as of End of Year | $ | (5,220.1) | | | $ | (1,030.0) | | | $ | (1,110.4) | | | $ | (556.2) | | | $ | (6,729.7) | | | $ | (1,330.9) | | | $ | (1,448.4) | | | $ | (721.0) | |
| Change in Pension Plan Assets: | Change in Pension Plan Assets: | | | | | | | | | | | | | | | | Change in Pension Plan Assets: | | | | | | | | | | | |
Fair Value of Pension Plan Assets as of
Beginning of Year | Fair Value of Pension Plan Assets as of
Beginning of Year | $ | 6,495.5 | | | $ | 1,323.8 | | | $ | 1,596.0 | | | $ | 694.6 | | | $ | 5,409.2 | | | $ | 1,043.1 | | | $ | 1,345.1 | | | $ | 593.7 | |
| Employer Contributions | Employer Contributions | 80.0 | | | — | | | 15.0 | | | — | | | 180.0 | | | 98.9 | | | 30.0 | | | — | |
| Actual Return on Pension Plan Assets | Actual Return on Pension Plan Assets | (433.6) | | | (85.3) | | | (103.3) | | | (45.1) | | | 1,250.5 | | | 250.4 | | | 312.0 | | | 136.9 | |
| Benefits Paid - Pension | Benefits Paid - Pension | (302.5) | | | (63.3) | | | (68.4) | | | (33.9) | | | (309.5) | | | (64.6) | | | (68.7) | | | (34.7) | |
| Benefits Paid - Lump Sum | Benefits Paid - Lump Sum | (33.0) | | | — | | | (14.8) | | | (1.0) | | | (34.7) | | | — | | | (15.6) | | | — | |
| Employee Transfers | Employee Transfers | — | | | (3.2) | | | (5.7) | | | 3.4 | | | — | | | (4.0) | | | (6.8) | | | (1.3) | |
| Fair Value of Pension Plan Assets as of End of Year | Fair Value of Pension Plan Assets as of End of Year | $ | 5,806.4 | | | $ | 1,172.0 | | | $ | 1,418.8 | | | $ | 618.0 | | | $ | 6,495.5 | | | $ | 1,323.8 | | | $ | 1,596.0 | | | $ | 694.6 | |
| Funded Status as of December 31st | Funded Status as of December 31st | $ | 586.3 | | | $ | 142.0 | | | $ | 308.4 | | | $ | 61.8 | | | $ | (234.2) | | | $ | (7.1) | | | $ | 147.6 | | | $ | (26.4) | |
Actuarial Gains(Loss)/Gain: For the year ended December 31, 2023, the actuarial loss was primarily attributable to a decrease in the discount rate, which resulted in an increase to Eversource's Pension and Losses:SERP Plans’ projected benefit obligation of $98.9 million. For the year ended December 31, 2022, the actuarial gains weregain was primarily attributable to an increase in the discount rate, which resulted in a decrease to Eversource's Pension and SERP Plans’ projected benefit obligation of $1.48 billion. For the year ended December 31, 2021, actuarial gains were primarily attributable to an increase in the discount rate, which resulted in a decrease to Eversource's Pension and SERP Plans’ projected benefit obligation of $286.8 million, which was partially offset by actuarial losses resulting from changes in the mortality assumption.
As of December 31, 20222023 and 2021,2022, the accumulated benefit obligation for the Pension and SERP Plans is as follows:
| | (Millions of Dollars) | (Millions of Dollars) | Eversource | | CL&P | | NSTAR Electric | | PSNH | (Millions of Dollars) | Eversource | | CL&P | | NSTAR Electric | | PSNH |
| 2023 | |
| 2022 | 2022 | $ | 4,911.6 | | | $ | 960.7 | | | $ | 1,055.1 | | | $ | 516.9 | |
| 2021 | 6,337.3 | | | 1,241.1 | | | 1,376.1 | | | 670.3 | |
| | | | PBOP | | PBOP |
| | | As of December 31, | | As of December 31, |
| | | 2022 | | 2021 | | 2023 | | 2022 |
| (Millions of Dollars) | (Millions of Dollars) | Eversource | | CL&P | | NSTAR
Electric | | PSNH | | Eversource | | CL&P | | NSTAR
Electric | | PSNH | (Millions of Dollars) | Eversource | | CL&P | | NSTAR
Electric | | PSNH | | Eversource | | CL&P | | NSTAR
Electric | | PSNH |
| Change in Benefit Obligation: | Change in Benefit Obligation: | | | | | | | | | | | | | | | | Change in Benefit Obligation: | | | | | | | | | | | |
| Benefit Obligation as of Beginning of Year | Benefit Obligation as of Beginning of Year | $ | (884.3) | | | $ | (165.5) | | | $ | (238.4) | | | $ | (92.3) | | | $ | (993.9) | | | $ | (178.6) | | | $ | (260.5) | | | $ | (109.5) | |
| Service Cost | Service Cost | (11.6) | | | (2.0) | | | (2.0) | | | (1.1) | | | (13.5) | | | (2.3) | | | (2.4) | | | (1.2) | |
| Interest Cost | Interest Cost | (20.2) | | | (3.7) | | | (5.3) | | | (2.2) | | | (17.4) | | | (3.2) | | | (4.4) | | | (1.8) | |
| Actuarial Gain | 173.6 | | | 33.0 | | | 39.4 | | | 15.2 | | | 81.4 | | | 5.8 | | | 11.5 | | | 14.6 | |
| Actuarial Gain/(Loss) | |
| Benefits Paid | Benefits Paid | 52.1 | | | 10.4 | | | 16.6 | | | 6.0 | | | 51.7 | | | 10.9 | | | 16.3 | | | 5.6 | |
| Employee Transfers | Employee Transfers | — | | | (0.1) | | | 0.2 | | | (0.2) | | | — | | | 1.9 | | | 1.1 | | | — | |
| Plan Amendment | |
| Impact of Acquisitions | Impact of Acquisitions | (3.3) | | | — | | | — | | | — | | | 7.4 | | | — | | | — | | | — | |
| Benefit Obligation as of End of Year | Benefit Obligation as of End of Year | $ | (693.7) | | | $ | (127.9) | | | $ | (189.5) | | | $ | (74.6) | | | $ | (884.3) | | | $ | (165.5) | | | $ | (238.4) | | | $ | (92.3) | |
| Change in Plan Assets: | Change in Plan Assets: | | | | | | | | | | | | | | | | Change in Plan Assets: | | | | | | | | | | | |
| Fair Value of Plan Assets as of Beginning of Year | Fair Value of Plan Assets as of Beginning of Year | $ | 1,138.3 | | | $ | 145.7 | | | $ | 530.0 | | | $ | 88.0 | | | $ | 1,004.1 | | | $ | 134.1 | | | $ | 464.6 | | | $ | 79.4 | |
| Actual Return on Plan Assets | Actual Return on Plan Assets | (119.6) | | | (15.0) | | | (57.0) | | | (9.8) | | | 183.2 | | | 24.1 | | | 84.2 | | | 14.2 | |
| Employer Contributions | Employer Contributions | 3.1 | | | — | | | — | | | — | | | 2.3 | | | — | | | — | | | — | |
| Benefits Paid | Benefits Paid | (51.7) | | | (10.4) | | | (16.6) | | | (6.0) | | | (51.3) | | | (10.9) | | | (16.3) | | | (5.6) | |
| Employee Transfers | Employee Transfers | — | | | 0.3 | | | (0.3) | | | 0.1 | | | — | | | (1.6) | | | (2.5) | | | — | |
| Fair Value of Plan Assets as of End of Year | Fair Value of Plan Assets as of End of Year | $ | 970.1 | | | $ | 120.6 | | | $ | 456.1 | | | $ | 72.3 | | | $ | 1,138.3 | | | $ | 145.7 | | | $ | 530.0 | | | $ | 88.0 | |
| Funded Status as of December 31st | Funded Status as of December 31st | $ | 276.4 | | | $ | (7.3) | | | $ | 266.6 | | | $ | (2.3) | | | $ | 254.0 | | | $ | (19.8) | | | $ | 291.6 | | | $ | (4.3) | |
Actuarial GainsGain/(Loss): For the year ended December 31, 2023, the actuarial gain was primarily attributable to changes to termination, retirement, and Losses:dependency rates that were updated as a result of an experience study performed in 2023, updated census data, changes to plan provisions, and other assumption changes, which resulted in a decrease to the Eversource PBOP projected benefit obligation of $17 million. The actuarial gain was partially offset by a decrease in the discount rate, which resulted in an increase to the Eversource PBOP projected benefit obligation of $12 million. For the year ended December 31, 2022, the actuarial gains weregain was primarily attributable to an increase in the discount rate, which resulted in a decrease to the Eversource PBOP projected benefit obligation of $180.1 million. For the year ended December 31, 2021, actuarial gains were primarily attributable to an increase in the discount rate, which resulted in a decrease to the Eversource PBOP liability of $29.8 million, and by changes in our retirement assumptions.
A reconciliation of the prepaid assets and liabilities within the Eversource Pension, SERP and PBOP Plans’ funded status to the balance sheets is as follows:
| | As of December 31, |
| As of December 31, | | | As of December 31, |
| | | 2022 | | 2021 | | 2023 | | 2022 |
| (Millions of Dollars) | (Millions of Dollars) | Eversource | | CL&P | | NSTAR
Electric | | PSNH | | Eversource | | CL&P | | NSTAR
Electric | | PSNH | (Millions of Dollars) | Eversource | | CL&P | | NSTAR
Electric | | PSNH | | Eversource | | CL&P | | NSTAR
Electric | | PSNH |
| Prepaid Pension | Prepaid Pension | $ | 756.7 | | | $ | 147.9 | | | $ | 310.2 | | | $ | 66.4 | | | $ | — | | | $ | 0.4 | | | $ | 149.8 | | | $ | — | |
| Prepaid PBOP | Prepaid PBOP | 288.8 | | | — | | | 266.6 | | | — | | | 272.0 | | | — | | | 291.6 | | | — | |
| Prepaid Pension and PBOP | Prepaid Pension and PBOP | $ | 1,045.5 | | | $ | 147.9 | | | $ | 576.8 | | | $ | 66.4 | | | $ | 272.0 | | | $ | 0.4 | | | $ | 441.4 | | | $ | — | |
| | Accrued Pension | Accrued Pension | $ | 3.7 | | | $ | — | | | $ | — | | | $ | — | | | $ | 58.1 | | | $ | — | | | $ | — | | | $ | 20.6 | |
| Accrued Pension | |
| Accrued Pension | |
| Accrued SERP | Accrued SERP | 166.7 | | | 5.9 | | | 1.8 | | | 4.6 | | | 176.1 | | | 7.5 | | | 2.2 | | | 5.8 | |
| Accrued PBOP | Accrued PBOP | 12.4 | | | 7.3 | | | — | | | 2.3 | | | 18.0 | | | 19.8 | | | — | | | 4.3 | |
| Less: Accrued SERP - current portion | Less: Accrued SERP - current portion | (47.3) | | | (0.3) | | | (0.2) | | | (0.4) | | | (9.7) | | | (0.5) | | | (0.2) | | | (0.5) | |
| Accrued Pension, SERP and PBOP | Accrued Pension, SERP and PBOP | $ | 135.5 | | | $ | 12.9 | | | $ | 1.6 | | | $ | 6.5 | | | $ | 242.5 | | | $ | 26.8 | | | $ | 2.0 | | | $ | 30.2 | |
The following actuarial assumptions were used in calculating the Pension, SERP and PBOP Plans' year end funded status:
| | | | Pension and SERP | | PBOP | | Pension and SERP | | PBOP |
| | | As of December 31, | | As of December 31, | | As of December 31, | | As of December 31, |
| | | | 2022 | | 2021 | | 2022 | | 2021 | | | 2023 | | 2022 | | 2023 | | 2022 |
| Discount Rate | Discount Rate | | 5.1% | — | 5.2% | | 2.8% | — | 3.0% | | 5.2% | | 2.91% | — | 2.92% | Discount Rate | | 4.9% | — | 5.0% | | 5.1% | — | 5.2% | | 5.0% | — | 5.2% | | 5.2% |
| Compensation/Progression Rate | Compensation/Progression Rate | | 3.5% | — | 4.0% | | 3.5% | — | 4.0% | | N/A | Compensation/Progression Rate | | 3.5% | — | 4.0% | | 3.5% | — | 4.0% | | N/A |
For the Eversource Service PBOP Plan, the health care cost trend rate is not applicable. For the Aquarion PBOP Plan, the health care cost trend rate for pre-65 retirees is 76.75 percent, with an ultimate rate of 5 percent in 2031, and for post-65 retirees, the health care trend rate and ultimate rate is 3.5 percent.
Expense: Eversource charges net periodic benefit plan expense/(income) for the Pension, SERP and PBOP Plans to its subsidiaries based on the actual participant demographic data for each subsidiary's participants. The actual investment return in the trust is allocated to each of the subsidiaries annually in proportion to the investment return expected to be earned during the year. The Company utilizes the spot rate methodology to estimate the discount rate for the service and interest cost components of benefit expense, which provides a relatively precise measurement by matching projected cash flows to the corresponding spot rates on the yield curve.
The components of net periodic benefit plan expense/(income) for the Pension, SERP and PBOP Plans, prior to amounts capitalized as Property, Plant and Equipment or deferred as regulatory assets/(liabilities) for future recovery or refund, are shown below. The service cost component of net periodic benefit plan expense/(income), less the capitalized portion, is included in Operations and Maintenance expense on the statements of income. The remaining components of net periodic benefit plan expense/(income), less the deferred portion, are included in Other Income, Net on the statements of income. Pension, SERP and PBOP expense reflected in the statements of cash flows for CL&P, NSTAR Electric and PSNH does not include intercompany allocations of net periodic benefit plan expense/(income), as these amounts are cash settled on a short-term basis.
| | | | | | | | | | | | | | | | | | | | | | | | | | | | | | | | | | | | | | | | | | | | | | | |
| | Pension and SERP | | PBOP |
| | For the Year Ended December 31, 2023 | | For the Year Ended December 31, 2023 |
| (Millions of Dollars) | Eversource | | CL&P | | NSTAR Electric | | PSNH | | Eversource | | CL&P | | NSTAR Electric | | PSNH |
| Service Cost | $ | 43.1 | | | $ | 12.3 | | | $ | 7.8 | | | $ | 4.3 | | | $ | 7.6 | | | $ | 1.3 | | | $ | 1.2 | | | $ | 0.7 | |
| Interest Cost | 254.0 | | | 50.5 | | | 53.9 | | | 27.3 | | | 33.8 | | | 6.2 | | | 9.2 | | | 3.7 | |
| Expected Return on Plan Assets | (465.0) | | | (94.2) | | | (113.8) | | | (49.5) | | | (77.1) | | | (9.4) | | | (36.9) | | | (5.5) | |
| Actuarial Loss | 45.8 | | | 2.5 | | | 17.1 | | | 1.5 | | | — | | | — | | | — | | | — | |
| Prior Service Cost/(Credit) | 1.3 | | | — | | | 0.3 | | | — | | | (21.6) | | | 1.1 | | | (17.0) | | | 0.4 | |
| Settlement Loss | 12.4 | | | — | | | — | | | — | | | — | | | — | | | — | | | — | |
| Total Net Periodic Benefit Plan Income | $ | (108.4) | | | $ | (28.9) | | | $ | (34.7) | | | $ | (16.4) | | | $ | (57.3) | | | $ | (0.8) | | | $ | (43.5) | | | $ | (0.7) | |
| Intercompany Income Allocations | N/A | | $ | (4.0) | | | $ | (3.0) | | | $ | (0.8) | | | N/A | | $ | (1.9) | | | $ | (2.1) | | | $ | (0.7) | |
| | | | | | | | | | | | | | | | | | | | | | | | | | | | | | | | | | | | | | | | | | | | | | | |
| | Pension and SERP | | PBOP |
| | For the Year Ended December 31, 2022 | | For the Year Ended December 31, 2022 |
| (Millions of Dollars) | Eversource | | CL&P | | NSTAR Electric | | PSNH | | Eversource | | CL&P | | NSTAR Electric | | PSNH |
| Service Cost | $ | 70.1 | | | $ | 18.7 | | | $ | 13.8 | | | $ | 6.9 | | | $ | 11.6 | | | $ | 2.0 | | | $ | 2.0 | | | $ | 1.1 | |
| Interest Cost | 154.5 | | | 31.3 | | | 32.8 | | | 16.9 | | | 20.2 | | | 3.7 | | | 5.3 | | | 2.2 | |
| Expected Return on Plan Assets | (523.6) | | | (106.3) | | | (128.4) | | | (56.1) | | | (89.9) | | | (11.4) | | | (42.4) | | | (6.7) | |
| Actuarial Loss | 116.0 | | | 16.2 | | | 32.8 | | | 7.9 | | | — | | | — | | | — | | | — | |
| Prior Service Cost/(Credit) | 1.4 | | | — | | | 0.3 | | | — | | | (21.7) | | | 1.1 | | | (17.0) | | | 0.4 | |
| Total Net Periodic Benefit Plan Income | $ | (181.6) | | | $ | (40.1) | | | $ | (48.7) | | | $ | (24.4) | | | $ | (79.8) | | | $ | (4.6) | | | $ | (52.1) | | | $ | (3.0) | |
| Intercompany Income Allocations | N/A | | $ | (16.0) | | | $ | (12.4) | | | $ | (3.6) | | | N/A | | $ | (3.7) | | | $ | (3.6) | | | $ | (1.2) | |
| | | | | | | | | | | | | | | | | | | | | | | | | | | | | | | | | | | | | | | | | | | | | | | |
| | Pension and SERP | | PBOP |
| | For the Year Ended December 31, 2021 | | For the Year Ended December 31, 2021 |
| (Millions of Dollars) | Eversource | | CL&P | | NSTAR Electric | | PSNH | | Eversource | | CL&P | | NSTAR Electric | | PSNH |
| Service Cost | $ | 85.8 | | | $ | 23.0 | | | $ | 15.8 | | | $ | 8.9 | | | $ | 13.5 | | | $ | 2.3 | | | $ | 2.4 | | | $ | 1.2 | |
| Interest Cost | 130.0 | | | 27.3 | | | 26.8 | | | 14.5 | | | 17.4 | | | 3.2 | | | 4.4 | | | 1.8 | |
| Expected Return on Plan Assets | (437.5) | | | (86.8) | | | (108.1) | | | (47.5) | | | (79.1) | | | (10.3) | | | (36.9) | | | (6.1) | |
| Actuarial Loss | 243.9 | | | 45.5 | | | 61.6 | | | 20.7 | | | 8.9 | | | 1.8 | | | 2.4 | | | 0.7 | |
| Prior Service Cost/(Credit) | 1.4 | | | — | | | 0.3 | | | — | | | (21.2) | | | 1.1 | | | (17.0) | | | 0.4 | |
| Total Net Periodic Benefit Plan Expense/(Income) | $ | 23.6 | | | $ | 9.0 | | | $ | (3.6) | | | $ | (3.4) | | | $ | (60.5) | | | $ | (1.9) | | | $ | (44.7) | | | $ | (2.0) | |
| Intercompany Expense/(Income) Allocations | N/A | | $ | 8.0 | | | $ | 8.8 | | | $ | 2.7 | | | N/A | | $ | (1.6) | | | $ | (1.9) | | | $ | (0.6) | |
| | | | | | | | | | | | | | | | | | | | | | | | | | | | | | | | | | | | | | | | | | | | | | | |
| | Pension and SERP | | PBOP |
| | For the Year Ended December 31, 2020 | | For the Year Ended December 31, 2020 |
| (Millions of Dollars) | Eversource | | CL&P | | NSTAR Electric | | PSNH | | Eversource | | CL&P | | NSTAR Electric | | PSNH |
| Service Cost | $ | 76.2 | | | $ | 21.8 | | | $ | 15.4 | | | $ | 8.2 | | | $ | 10.2 | | | $ | 1.7 | | | $ | 2.1 | | | $ | 0.9 | |
| Interest Cost | 177.8 | | | 37.3 | | | 38.6 | | | 19.4 | | | 24.6 | | | 4.4 | | | 6.6 | | | 2.8 | |
| Expected Return on Plan Assets | (400.3) | | | (79.2) | | | (103.0) | | | (44.7) | | | (73.6) | | | (9.9) | | | (34.0) | | | (5.7) | |
| Actuarial Loss | 202.0 | | | 39.2 | | | 55.2 | | | 15.6 | | | 8.4 | | | 1.1 | | | 2.5 | | | 0.8 | |
| Prior Service Cost/(Credit) | 1.2 | | | — | | | 0.3 | | | — | | | (21.2) | | | 1.1 | | | (17.0) | | | 0.4 | |
| Total Net Periodic Benefit Plan Expense/(Income) | $ | 56.9 | | | $ | 19.1 | | | $ | 6.5 | | | $ | (1.5) | | | $ | (51.6) | | | $ | (1.6) | | | $ | (39.8) | | | $ | (0.8) | |
| Intercompany Expense/(Income) Allocations | N/A | | $ | 9.1 | | | $ | 8.9 | | | $ | 2.9 | | | N/A | | $ | (1.1) | | | $ | (1.4) | | | $ | (0.5) | |
The following actuarial assumptions were used to calculate Pension, SERP and PBOP expense amounts:
| | Pension and SERP | | PBOP |
| Pension and SERP | | | Pension and SERP | | PBOP |
| | | For the Years Ended December 31, | | For the Years Ended December 31, | | For the Years Ended December 31, | | For the Years Ended December 31, |
| | | 2022 | | 2021 | | 2020 | | 2022 | | 2021 | | 2020 | | 2023 | | 2022 | | 2021 | | 2023 | | 2022 | | 2021 |
| Discount Rate | Discount Rate | 2.2% | — | 3.2% | | 1.5% | — | 3.0% | | 2.6% | — | 3.5% | | 2.3% | — | 3.3% | | 1.8% | — | 3.1% | | 2.7% | — | 3.6% | Discount Rate | 4.9% | — | 5.3% | | 2.2% | — | 3.2% | | 1.5% | — | 3.0% | | 5.1% | — | 5.4% | | 2.3% | — | 3.3% | | 1.8% | — | 3.1% |
| Expected Long-Term Rate of Return | Expected Long-Term Rate of Return | 8.25% | | 8.25% | | 8.25% | | 8.25% | | 8.25% | | 8.25% | Expected Long-Term Rate of Return | 8.25% | | 8.25% |
| Compensation/Progression Rate | Compensation/Progression Rate | 3.5% | — | 4.0% | | 3.5% | — | 4.0% | | 3.5% | — | 4.0% | | N/A | | N/A | | N/A | Compensation/Progression Rate | 3.5% | — | 4.0% | | 3.5% | — | 4.0% | | 3.5% | — | 4.0% | | N/A |
For the Aquarion Pension Plan, the expected long-term rate of return was 7.94 percent and 7 percent for the years ended December 31, 2023 and 2022, respectively. For the Aquarion PBOP Plans,Plan the expected long-term rate of return was 7 percent for the years ended December 31, 2023 and 2022 and 2021. For the Aquarion PBOP Plan, the health care cost trend rate was a range of 3.5 percent to 7 percent for the year ended December 31, 2023 and 3.5 percent to 6.5 percent for the year ended December 31, 2022 and 3.5 percent to 6.2 percent for the year ended December 31, 2021.2022.
Regulatory Assets and Accumulated Other Comprehensive Income/(Loss) Amounts: The Pension, SERP and PBOP Plans cover eligible employees, including, among others, employees of the regulated companies. The regulated companies record actuarial losses and gains and prior service costs and credits arising at the December 31st remeasurement date of the funded status of the benefit plans as a regulatory asset or regulatory liability in lieu of a charge to Accumulated Other Comprehensive Income/(Loss), reflecting ultimate recovery from customers through rates. Regulatory accounting is also applied to the portions of the Eversource Service retiree benefit costs that support the regulated companies, as these costs are also recovered from customers. Adjustments to the Pension, SERP and PBOP Plans' funded status for the unregulated companies are recorded on an after-tax basis to Accumulated Other Comprehensive Income/(Loss). For further information, see Note 2, "Regulatory Accounting," and Note 16, "Accumulated Other Comprehensive Income/(Loss)," to the financial statements.
The following is a summary of the changes in plan assets and benefit obligations recognized in Regulatory Assets and Other Comprehensive Income (OCI) as well as amounts in Regulatory Assets and OCI that were reclassified as net periodic benefit expense during the years presented:
| | Pension and SERP | | PBOP |
| Pension and SERP | | | Pension and SERP | | PBOP |
| | | Regulatory Assets | | OCI | | Regulatory Assets | | OCI | | Regulatory Assets | | OCI | | Regulatory Assets | | OCI |
| | | For the Years Ended December 31, | | For the Years Ended December 31, | | For the Years Ended December 31, | | For the Years Ended December 31, |
| (Millions of Dollars) | (Millions of Dollars) | 2022 | | 2021 | | 2022 | | 2021 | | 2022 | | 2021 | | 2022 | | 2021 | (Millions of Dollars) | 2023 | | 2022 | | 2023 | | 2022 | | 2023 | | 2022 | | 2023 | | 2022 |
| Actuarial (Gains)/Losses Arising During the Year | $ | (431.6) | | | $ | (961.7) | | | $ | 4.6 | | | $ | (28.4) | | | $ | 36.8 | | | $ | (181.5) | | | $ | (0.8) | | | $ | (4.0) | |
| Actuarial Losses Reclassified as Net Periodic Benefit Expense | (107.0) | | | (231.2) | | | (9.0) | | | (12.7) | | | — | | | (8.5) | | | — | | | (0.4) | |
| | Actuarial (Gain)/Loss Arising During the Year | |
| Actuarial Loss Reclassified as Net Periodic Benefit Expense | |
| Settlement Loss | |
| Prior Service Credit Arising During the Year | |
Prior Service (Cost)/Credit Reclassified as Net Periodic
Benefit (Expense)/Income | Prior Service (Cost)/Credit Reclassified as Net Periodic
Benefit (Expense)/Income | (1.2) | | | (1.3) | | | (0.2) | | | (0.1) | | | 21.8 | | | 21.1 | | | (0.1) | | | 0.1 | |
The following is a summary of the remaining Regulatory Assets and Accumulated Other Comprehensive Income amounts that have not been recognized as components of net periodic benefit expense as of December 31, 20222023 and 2021:2022:
| | Regulatory Assets as of December 31, | | AOCI as of December 31, |
| Regulatory Assets as of December 31, | | | Regulatory Assets as of December 31, | | AOCI as of December 31, |
| (Millions of Dollars) | (Millions of Dollars) | 2022 | | 2021 | | 2022 | | 2021 | (Millions of Dollars) | 2023 | | 2022 | | 2023 | | 2022 |
| Pension and SERP | Pension and SERP | | | | | | | |
| Actuarial Loss | |
| Actuarial Loss | |
| Actuarial Loss | Actuarial Loss | $ | 888.7 | | | $ | 1,427.3 | | | $ | 61.9 | | | $ | 66.3 | |
| Prior Service Cost | Prior Service Cost | 4.1 | | | 5.3 | | | 0.4 | | | 0.6 | |
| PBOP | PBOP | |
| Actuarial Loss | Actuarial Loss | $ | 81.8 | | | $ | 45.0 | | | $ | 2.7 | | | $ | 3.5 | |
| Actuarial Loss | |
| Actuarial Loss | |
| Prior Service (Credit)/Cost | Prior Service (Credit)/Cost | (108.3) | | | (130.1) | | | 0.9 | | | 1.0 | |
The difference between the actual return and calculated expected return on plan assets for the Pension and PBOP Plans, as well as changes in actuarial assumptions impacting the projected benefit obligation, are recorded as unamortized actuarial gains or losses arising during the year in Regulatory Assets or Accumulated Other Comprehensive Income/(Loss). Unamortized actuarial gains or losses are amortized as a component of pension and PBOP expense over the estimated average future employee service period using the corridor approach.
Estimated Future Benefit Payments: The following benefit payments, which reflect expected future service, are expected to be paid by the Pension, SERP and PBOP Plans:
| | (Millions of Dollars) | (Millions of Dollars) | 2023 | | 2024 | | 2025 | | 2026 | | 2027 | | 2028 - 2032 | (Millions of Dollars) | 2024 | | 2025 | | 2026 | | 2027 | | 2028 | | 2029 - 2033 |
| Pension and SERP | Pension and SERP | $ | 401.4 | | | $ | 374.4 | | | $ | 380.1 | | | $ | 383.0 | | | $ | 384.1 | | | $ | 1,901.7 | |
| PBOP | PBOP | 57.9 | | | 57.3 | | | 56.6 | | | 55.5 | | | 54.4 | | | 253.7 | |
Eversource Contributions: Based on the current status of the Pension Plans and federal pension funding requirements, there is no minimum funding requirement for our Eversource Service Pension Plan in 20232024 and we do not expect to make pension contributions in 2023.2024. We do not expect to make any contributions to the Eversource Service PBOP Plan in 2023. 2024.
Eversource currently estimates contributingcontributed $5.0 million and $2.9$1.9 million to the Aquarion Pension and PBOP Plans, respectively, in 2023. Eversource currently estimates contributing $5.0 million and $2.4 million to the Aquarion Pension and PBOP Plans, respectively, in 2024.
Fair Value of Pension and PBOP Plan Assets: Pension and PBOP funds are held in external trusts. Trust assets, including accumulated earnings, must be used exclusively for Pension and PBOP payments. Eversource's investment strategy for its Pension and PBOP Plans is to maximize the long-term rates of return on these plans' assets within an acceptable level of risk. The investment strategyguidelines for each asset category includes a diversification of asset types, fund strategies and fund managers and it establishes target asset allocations that are routinely reviewed and periodically rebalanced. PBOP assets are comprised of assets held in the PBOP Plan trust, as well as specific assets within the Pension Plan trust (401(h) assets). The investment policy and strategy of the 401(h) assets is consistent with that of the defined benefit pension plan. Eversource's expected long-term rates of return on Pension and PBOP Plan assets are based on target asset allocation assumptions and related expected long-term rates of return. In developing its expected long-term rate of return assumptions for the Pension and PBOP Plans, Eversource evaluated input from consultants, as well as long-term inflation assumptions and historical returns. Management has assumed long-term rates of return of 8.25 percent for the Eversource Service Pension Plan assets, the Eversource Service PBOP Plan assets and PBOPthe Aquarion Pension Plan assets, and a 7 percent long-term rate of return for the Aquarion PlansPBOP Plan, to estimate its 20232024 Pension and PBOP costs.
These long-term rates of return are based on the assumed rates of return for the target asset allocations as follows:
| | | | | As of December 31, |
| 2023 | | | 2023 | | 2022 |
| | | | | | | | | | | | | | | | | | | | | | Target Asset Allocation | | Assumed Rate of Return | | Target Asset Allocation | | Assumed Rate of Return |
| | | As of December 31, | | Eversource Pension Plan | | Eversource PBOP Plan | | Eversource Pension Plan and PBOP Plan | | Eversource Pension Plan and PBOP Plan |
| | 2022 | | 2021 |
| | Eversource Pension Plan and PBOP Plan | | Eversource Pension Plan and PBOP Plan |
| | Target Asset Allocation | | Assumed Rate of Return | | Target Asset Allocation | | Assumed Rate of Return |
| Equity Securities: | |
| Equity Securities: | |
| Equity Securities: | Equity Securities: | | | | | | | | | | | | | | | | |
| United States | United States | 15.0 | % | | 8.5 | % | | 15.0 | % | | 8.5 | % | United States | — | % | | 20.0 | % | | 8.5 | % | | 15.0 | % | | 8.5 | % |
| Global | Global | 10.0 | % | | 8.75 | % | | 10.0 | % | | 8.75 | % | Global | 20.0 | % | | — | % | | 8.75 | % | | 10.0 | % | | 8.75 | % |
| Non-United States | Non-United States | 8.0 | % | | 8.5 | % | | 8.0 | % | | 8.5 | % | Non-United States | — | % | | 11.0 | % | | 8.5 | % | | 8.0 | % | | 8.5 | % |
| Emerging Markets | Emerging Markets | 4.0 | % | | 10.0 | % | | 4.0 | % | | 10.0 | % | Emerging Markets | — | % | | 6.0 | % | | 10.0 | % | | 4.0 | % | | 10.0 | % |
| Debt Securities: | Debt Securities: | |
| Fixed Income | Fixed Income | 13.0 | % | | 4.0 | % | | 13.0 | % | | 4.0 | % |
| Fixed Income | |
| Fixed Income | | 16.0 | % | | 17.0 | % | | 5.5 | % | | 13.0 | % | | 4.0 | % |
| Public High Yield Fixed Income | Public High Yield Fixed Income | 4.0 | % | | 6.5 | % | | 4.0 | % | | 6.5 | % | Public High Yield Fixed Income | 5.0 | % | | — | % | | 7.5 | % | | 4.0 | % | | 6.5 | % |
| United States Treasuries | | United States Treasuries | 11.0 | % | | — | % | | 4.5 | % | | — | % | | — | % |
| Private Debt | Private Debt | 13.0 | % | | 9.0 | % | | 13.0 | % | | 9.0 | % | Private Debt | 10.0 | % | | 13.0 | % | | 10.0 | % | | 13.0 | % | | 9.0 | % |
| Private Equity | Private Equity | 18.0 | % | | 12.0 | % | | 18.0 | % | | 12.0 | % | Private Equity | 23.0 | % | | 18.0 | % | | 12.0 | % | | 18.0 | % | | 12.0 | % |
| Real Assets | Real Assets | 15.0 | % | | 7.5 | % | | 15.0 | % | | 7.5 | % | Real Assets | 15.0 | % | | 15.0 | % | | 7.5 | % | | 15.0 | % | | 7.5 | % |
The following table presents,tables present, by asset category, the Pension and PBOP Plan assets recorded at fair value on a recurring basis by the level in which they are classified within the fair value hierarchy:
| | | Pension Plan | | Pension Plan |
| | Fair Value Measurements as of December 31, | | Fair Value Measurements as of December 31, |
| (Millions of Dollars) | (Millions of Dollars) | 2022 | | 2021 | (Millions of Dollars) | 2023 | | 2022 |
| Asset Category: | Asset Category: | Level 1 | | Level 2 | | Uncategorized | | Total | | Level 1 | | Level 2 | | Uncategorized | | Total | Asset Category: | Level 1 | | Level 2 | | Uncategorized | | Total | | Level 1 | | Level 2 | | Uncategorized | | Total |
| Equity Securities | Equity Securities | $ | 407.7 | | | $ | — | | | $ | 1,102.2 | | | $ | 1,509.9 | | | $ | 722.5 | | | $ | — | | | $ | 1,385.2 | | | $ | 2,107.7 | |
Fixed Income (1) | Fixed Income (1) | 277.1 | | | 78.5 | | | 1,598.8 | | | 1,954.4 | | | 139.6 | | | 233.8 | | | 1,689.1 | | | 2,062.5 | |
| Private Equity | Private Equity | — | | | — | | | 1,684.9 | | | 1,684.9 | | | — | | | — | | | 1,702.7 | | | 1,702.7 | |
| Real Assets | Real Assets | 181.8 | | | — | | | 731.0 | | | 912.8 | | | 218.3 | | | — | | | 702.8 | | | 921.1 | |
| Total | Total | $ | 866.6 | | | $ | 78.5 | | | $ | 5,116.9 | | | $ | 6,062.0 | | | $ | 1,080.4 | | | $ | 233.8 | | | $ | 5,479.8 | | | $ | 6,794.0 | |
Less: 401(h) PBOP Assets (2) | Less: 401(h) PBOP Assets (2) | | | | | | | (255.6) | | | | | | | | | (298.5) | |
| Total Pension Assets | Total Pension Assets | | | | | $ | 5,806.4 | | | | | | | $ | 6,495.5 | |
| | | | PBOP Plan | | PBOP Plan |
| | Fair Value Measurements as of December 31, | | Fair Value Measurements as of December 31, |
| (Millions of Dollars) | (Millions of Dollars) | 2022 | | 2021 | (Millions of Dollars) | 2023 | | 2022 |
| Asset Category: | Asset Category: | Level 1 | | Level 2 | | Uncategorized | | Total | | Level 1 | | Level 2 | | Uncategorized | | Total | Asset Category: | Level 1 | | Level 2 | | Uncategorized | | Total | | Level 1 | | Level 2 | | Uncategorized | | Total |
| Equity Securities | Equity Securities | $ | 153.2 | | | $ | — | | | $ | 183.5 | | | $ | 336.7 | | | $ | 191.4 | | | $ | — | | | $ | 248.3 | | | $ | 439.7 | |
| Fixed Income | Fixed Income | 18.2 | | | 40.2 | | | 141.1 | | | 199.5 | | | 49.7 | | | 45.2 | | | 125.5 | | | 220.4 | |
| Private Equity | Private Equity | — | | | — | | | 70.9 | | | 70.9 | | | — | | | — | | | 58.7 | | | 58.7 | |
| Real Assets | Real Assets | 71.2 | | | — | | | 36.2 | | | 107.4 | | | 90.0 | | | — | | | 31.0 | | | 121.0 | |
| Total | Total | $ | 242.6 | | | $ | 40.2 | | | $ | 431.7 | | | $ | 714.5 | | | $ | 331.1 | | | $ | 45.2 | | | $ | 463.5 | | | $ | 839.8 | |
Add: 401(h) PBOP Assets (2) | Add: 401(h) PBOP Assets (2) | | | | | | | 255.6 | | | | | | | | | 298.5 | |
| Total PBOP Assets | Total PBOP Assets | | | | | $ | 970.1 | | | | | | | $ | 1,138.3 | |
(1) Fixed Income investments classified as Level 1 as of December 31, 2023 and 2022 include pending purchases and pending redemption settlements of $31 million and $138 million.million, respectively.
(2) The assets of the Pension Plan include a 401(h) account that has been allocated to provide health and welfare postretirement benefits under the PBOP Plan.
The Company values assets based on observable inputs when available. Equity securities, exchange traded funds and futures contracts classified as Level 1 in the fair value hierarchy are priced based on the closing price on the primary exchange as of the balance sheet date.
Fixed income securities, such as government issued securities and corporate bonds, are included in Level 2 and are valued using pricing models, quoted prices of securities with similar characteristics or discounted cash flows. The pricing models utilize observable inputs such as recent trades
for the same or similar instruments, yield curves, discount margins and bond structures. Swaps are valued using pricing models that incorporate interest rates and equity and fixed income index closing prices to determine a net present value of the cash flows.
Certain investments, such as commingled funds, private equity investments, fixed income funds, real asset funds and hedge funds are valued using the net asset value (NAV) as a practical expedient. Assets valued at NAV are uncategorized in the fair value hierarchy. These investments are structured as investment companies offering shares or units to multiple investors for the purpose of providing a return. Commingled funds are recorded at NAV provided by the asset manager, which is based on the market prices of the underlying equity securities. Private Equity investments, Fixed Income partnership funds and Real Assets are valued using the NAV provided by the partnerships, which are based on discounted cash flows of the underlying investments, real estate appraisals or public market comparables of the underlying investments, or the NAV of underlying assets held in hedge funds. Equity Securities investments in United States, Global, Non-United States and Emerging Markets that are uncategorized include investments in commingled funds and hedge funds that are overlaid with equity index swaps and futures contracts. Fixed Income investments that are uncategorized include investments in commingled funds, fixed income funds that invest in a variety of opportunistic credit and private debt strategies, and hedge funds that are overlaid with fixed income futures.
B. Defined Contribution Plans
Eversource maintains defined contribution plans on behalf of eligible participants. The Eversource 401k Plan provides for employee and employer contributions up to statutory limits. For eligible employees, the Eversource 401k Plan provides employer matching contributions of either 100 percent up to a maximum of three percent of eligible compensation or 50 percent up to a maximum of eight percent of eligible compensation. The Eversource 401k Plan also contains a K-Vantage feature for the benefit of eligible participants, which provides an additional annual employer contribution based on age and years of service. K-Vantage participants are not eligible to actively participate in the Eversource Pension Plan.
The total Eversource 401k Plan employer matching contributions, including the K-Vantage contributions, were as follows:
| | (Millions of Dollars) | (Millions of Dollars) | Eversource | | CL&P | | NSTAR Electric | | PSNH | (Millions of Dollars) | Eversource | | CL&P | | NSTAR Electric | | PSNH |
| 2023 | |
| 2022 | 2022 | $ | 59.9 | | | $ | 7.7 | | | $ | 12.8 | | | $ | 4.8 | |
| 2021 | 2021 | 55.5 | | | 7.0 | | | 12.2 | | | 4.3 | |
| 2020 | 49.4 | | | 6.6 | | | 11.8 | | | 4.1 | |
C. Share-Based Payments
Share-based compensation awards are recorded using a fair-value based method at the date of grant. Eversource, CL&P, NSTAR Electric and PSNH record compensation expense related to these awards, as applicable, for shares issued to their respective employees and officers, as well as for the allocation of costs associated with shares issued to Eversource's service company employees and officers that support CL&P, NSTAR Electric and PSNH.
Eversource Incentive Plans: Eversource maintains long-term equity-based incentive plans in which Eversource, CL&P, NSTAR Electric and PSNH employees, officers and board members are eligible to participate. The incentive plans authorize Eversource to grant up to 3,200,0007,400,000 new shares for various types of awards, including RSUs and performance shares, to eligible employees, officers, and board members. As of December 31, 20222023 and 2021,2022, Eversource had 903,1834,587,376 and 2,430,716903,183 common shares, respectively, available for issuance under these plans.
Eversource accounts for its various share-based plans as follows:
•RSUs - Eversource records compensation expense, net of estimated forfeitures, on a straight-line basis over the requisite service period based upon the fair value of Eversource's common shares at the date of grant. The par value of RSUs is reclassified to Common Stock from Capital Surplus, Paid In as RSUs become issued as common shares.
•Performance Shares - Eversource records compensation expense, net of estimated forfeitures, over the requisite service period. Performance shares vest based upon the extent to which Company goals are achieved. Vesting of outstanding performance shares is based upon the Company's EPS growth over the requisite service period and level of payout is determined based on the total shareholder return as compared to the Edison Electric Institute (EEI) Index during the requisite service period. The fair value of performance shares is determined at the date of grant using a lattice model. Compensation expense is subject to volatility until payout is established.
RSUs: Eversource granted RSUs under the annual long-term incentive programs that are subject to three-year graded vesting schedules for employees, and one-year graded vesting schedules, or immediate vesting, for board members. RSUs are paid in shares, reduced by amounts sufficient to satisfy withholdings for income taxes, subsequent to vesting. A summary of RSU transactions is as follows:
| | RSUs
(Units) | | Weighted Average
Grant-Date Fair Value |
| Outstanding as of December 31, 2021 | 594,623 | | | $ | 65.70 | |
| RSUs
(Units) | | | RSUs
(Units) | | Weighted Average
Grant-Date Fair Value |
| Outstanding as of December 31, 2022 | |
| Granted | Granted | 218,005 | | | $ | 85.96 | |
| Shares Issued | Shares Issued | (174,633) | | | $ | 79.89 | |
| Forfeited | Forfeited | (8,261) | | | $ | 85.87 | |
| Outstanding as of December 31, 2022 | 629,734 | | | $ | 68.52 | |
| Outstanding as of December 31, 2023 | |
The weighted average grant-date fair value of RSUs granted for the years ended December 31, 2023, 2022 and 2021 was $76.42, $85.96 and 2020 was $85.96, $81.89, and $88.23, respectively. As of December 31, 20222023 and 2021,2022, the number and weighted average grant-date fair value of unvested RSUs was 326,581
and $80.76 per share, and 300,592 and $87.21 per share, and 297,270 and $83.39 per share, respectively. During 2022,2023, there were 184,540199,145 RSUs at a weighted average grant-date fair value of $81.07$86.92 per share that vested during the year and were either paid or deferred. As of December 31, 2022, 329,1422023, 345,661 RSUs were fully vested and deferred and an additional 285,562310,252 are expected to vest.
Performance Shares: Eversource granted performance shares under the annual long-term incentive programs that vest based upon the extent to which Company goals are achieved at the end of three-year performance measurement periods. Performance shares are paid in shares, after the performance measurement period. A summary of performance share transactions is as follows:
| | Performance Shares
(Units) | | Weighted Average
Grant-Date Fair Value |
| Outstanding as of December 31, 2021 | 464,507 | | | $ | 80.54 | |
| Performance Shares
(Units) | | | Performance Shares
(Units) | | Weighted Average
Grant-Date Fair Value |
| Outstanding as of December 31, 2022 | |
| Granted | Granted | 337,406 | | | $ | 83.34 | |
| Shares Issued | Shares Issued | (248,981) | | | $ | 68.96 | |
| Forfeited | Forfeited | (5,642) | | | $ | 85.28 | |
| Outstanding as of December 31, 2022 | 547,290 | | | $ | 87.49 | |
| Outstanding as of December 31, 2023 | |
The weighted average grant-date fair value of performance shares granted for the years ended December 31, 2023, 2022 and 2021 was $83.39, $83.34 and 2020 was $83.34, $76.08, and $75.36, respectively. As of December 31, 20222023 and 2021,2022, the number and weighted average grant-date fair value of unvested performance shares was 485,480 and $85.20 per share, and 457,069 and $88.43 per share, and 436,957 and $81.41 per share, respectively. During 2022,2023, there were 311,553214,742 performance shares at a weighted average grant-date fair value of $73.15$89.70 per share that vested during the year and were either paid or deferred. As of December 31, 2022, 90,2212023, 178,944 performance shares were fully vested and deferred.
Compensation Expense: The total compensation expense and associated future income tax benefits recognized by Eversource, CL&P, NSTAR Electric and PSNH for share-based compensation awards were as follows:
| | | | | | | | | | | | | | | | | |
| Eversource | For the Years Ended December 31, |
| (Millions of Dollars) | 2022 | | 2021 | | 2020 |
| Compensation Expense | $ | 33.4 | | | $ | 28.2 | | | $ | 33.9 | |
| Future Income Tax Benefit | 8.7 | | | 7.3 | | | 8.9 | |
| | | | | | | | | | | | | | | | | | | | | | | | | | | | | | | | | | | | | | | | | | | | | | | | | | | | | |
| | For the Years Ended December 31, |
| | 2022 | | 2021 | | 2020 |
| (Millions of Dollars) | CL&P | | NSTAR
Electric | | PSNH | | CL&P | | NSTAR
Electric | | PSNH | | CL&P | | NSTAR
Electric | | PSNH |
| Compensation Expense | $ | 10.0 | | | $ | 10.7 | | | $ | 3.6 | | | $ | 8.8 | | | $ | 9.0 | | | $ | 3.0 | | | $ | 10.9 | | | $ | 11.3 | | | $ | 3.6 | |
| Future Income Tax Benefit | 2.6 | | | 2.8 | | | 0.9 | | | 2.3 | | | 2.3 | | | 0.8 | | | 2.9 | | | 3.0 | | | 1.0 | |
| | | | | | | | | | | | | | | | | |
| Eversource | For the Years Ended December 31, |
| (Millions of Dollars) | 2023 | | 2022 | | 2021 |
| Compensation Expense | $ | 27.8 | | | $ | 33.4 | | | $ | 28.2 | |
| Future Income Tax Benefit | 7.3 | | | 8.7 | | | 7.3 | |
| | | | | | | | | | | | | | | | | | | | | | | | | | | | | | | | | | | | | | | | | | | | | | | | | | | | | |
| | For the Years Ended December 31, |
| | 2023 | | 2022 | | 2021 |
| (Millions of Dollars) | CL&P | | NSTAR
Electric | | PSNH | | CL&P | | NSTAR
Electric | | PSNH | | CL&P | | NSTAR
Electric | | PSNH |
| Compensation Expense | $ | 8.7 | | | $ | 8.7 | | | $ | 3.0 | | | $ | 10.0 | | | $ | 10.7 | | | $ | 3.6 | | | $ | 8.8 | | | $ | 9.0 | | | $ | 3.0 | |
| Future Income Tax Benefit | 2.3 | | | 2.3 | | | 0.8 | | | 2.6 | | | 2.8 | | | 0.9 | | | 2.3 | | | 2.3 | | | 0.8 | |
As of December 31, 2022,2023, there was $24.5$31.3 million of total unrecognized compensation expense related to nonvested share-based awards for Eversource, including $4.0$5.8 million for CL&P, $6.9$8.6 million for NSTAR Electric, and $1.4$1.9 million for PSNH. This cost is expected to be recognized ratably over a weighted-average period of 1.771.81 years for Eversource, and 1.78 years for CL&P, NSTAR Electric and PSNH.
An income tax rate of 26 percent was used to estimate the tax effect on total share-based payments determined under the fair-value based method for all awards. The Company issues treasury shares to settle fully vested RSUs and performance shares under the Company's incentive plans.
For the year ended December 31, 2023, a tax deficiency associated with the distribution of stock compensation awards increased income tax expense by $0.5 million, which decreased cash flows from operating activities on the statements of cash flows. For the years ended December 31, 2022 2021 and 2020,2021, excess tax benefits associated with the distribution of stock compensation awards reduced income tax expense by $2.1 million $4.0 million, and $6.6$4.0 million, respectively, which increased cash flows from operating activities on the statements of cash flows.
D. Other Retirement Benefits
Eversource provides retirement and other benefits for certain current and past company officers. These benefits are accounted for on an accrual basis and expensed over a period equal to the service lives of the employees. The actuarially-determined liability for these benefits is included in Other Current and Long-Term Liabilities on the balance sheets. The related expense, which includes the allocation of expense associated with Eversource's service company officers that support CL&P, NSTAR Electric and PSNH, is included in Operations and Maintenance Expense on the income statements. The liability and expense amounts are as follows:
| | | | | | | | | | | | | | | | | |
Eversource (Millions of Dollars) | As of and For the Years Ended December 31, |
| 2022 | | 2021 | | 2020 |
| Actuarially-Determined Liability | $ | 43.4 | | | $ | 42.8 | | | $ | 45.7 | |
Other Retirement Benefits Expense (1) | 10.9 | | | 2.2 | | | 3.3 | |
| | | As of and For the Years Ended December 31, |
| | 2022 | | 2021 | | 2020 |
| (Millions of Dollars) | CL&P | | NSTAR Electric | | PSNH | | CL&P | | NSTAR Electric | | PSNH | | CL&P | | NSTAR Electric | | PSNH |
Eversource (Millions of Dollars) | | Eversource (Millions of Dollars) | As of and For the Years Ended December 31, |
| 2023 | | 2022 | | 2021 |
| Actuarially-Determined Liability | Actuarially-Determined Liability | $ | 0.2 | | | $ | 0.1 | | | $ | 1.3 | | | $ | 0.2 | | | $ | 0.1 | | | $ | 1.5 | | | $ | 0.2 | | | $ | 0.1 | | | $ | 1.7 | |
Other Retirement Benefits Expense (1) | Other Retirement Benefits Expense (1) | 4.0 | | | 3.7 | | | 1.3 | | | 0.7 | | | 0.7 | | | 0.3 | | | 1.2 | | | 1.1 | | | 0.5 | |
| | | | | | | | | | | | | | | | | | | | | | | | | | | | | | | | | | | | | | | | | | | | | | | | | | | | | |
| | As of and For the Years Ended December 31, |
| | 2023 | | 2022 | | 2021 |
| (Millions of Dollars) | CL&P | | NSTAR Electric | | PSNH | | CL&P | | NSTAR Electric | | PSNH | | CL&P | | NSTAR Electric | | PSNH |
| Actuarially-Determined Liability | $ | 0.2 | | | $ | — | | | $ | 1.1 | | | $ | 0.2 | | | $ | 0.1 | | | $ | 1.3 | | | $ | 0.2 | | | $ | 0.1 | | | $ | 1.5 | |
Other Retirement Benefits Expense (1) | 0.8 | | | 0.8 | | | 0.4 | | | 4.0 | | | 3.7 | | | 1.3 | | | 0.7 | | | 0.7 | | | 0.3 | |
(1) Other Retirement Benefits Expense in 2022 includes a one-time special retirement benefit payable of $9.2 million.million, which was paid in 2023.
12. INCOME TAXES
The components of income tax expense are as follows:
| Eversource (Millions of Dollars) | Eversource (Millions of Dollars) | For the Years Ended December 31, | Eversource (Millions of Dollars) | For the Years Ended December 31, |
| 2022 | | 2021 | | 2020 | 2023 | | 2022 | | 2021 |
| Current Income Taxes: | Current Income Taxes: | | | | | | Current Income Taxes: | | | |
| Federal | Federal | $ | 95.8 | | | $ | 21.5 | | | $ | 73.6 | |
| State | State | 13.6 | | | (21.6) | | | 19.1 | |
| Total Current | Total Current | 109.4 | | | (0.1) | | | 92.7 | |
| Deferred Income Taxes, Net: | Deferred Income Taxes, Net: | | | | | |
| Federal | Federal | 198.8 | | | 199.7 | | | 173.5 | |
| Federal | |
| Federal | |
| State | State | 148.0 | | | 147.4 | | | 83.7 | |
| Total Deferred | Total Deferred | 346.8 | | | 347.1 | | | 257.2 | |
| Investment Tax Credits, Net | Investment Tax Credits, Net | (2.6) | | | (2.8) | | | (3.7) | |
| Income Tax Expense | Income Tax Expense | $ | 453.6 | | | $ | 344.2 | | | $ | 346.2 | |
| | | | For the Years Ended December 31, | | For the Years Ended December 31, |
| | | 2022 | | 2021 | | 2020 | | 2023 | | 2022 | | 2021 |
| (Millions of Dollars) | (Millions of Dollars) | CL&P | | NSTAR
Electric | | PSNH | | CL&P | | NSTAR Electric | | PSNH | | CL&P | | NSTAR Electric | | PSNH | (Millions of Dollars) | CL&P | | NSTAR
Electric | | PSNH | | CL&P | | NSTAR Electric | | PSNH | | CL&P | | NSTAR Electric | | PSNH |
| Current Income Taxes: | Current Income Taxes: | | | | | | | | | | | | | | | | | | Current Income Taxes: | | | |
| Federal | Federal | $ | 106.2 | | | $ | 55.0 | | | $ | 29.6 | | | $ | 15.0 | | | $ | 52.3 | | | $ | 43.1 | | | $ | 12.0 | | | $ | 53.9 | | | $ | 20.6 | |
| State | State | 20.1 | | | 8.7 | | | 5.9 | | | (7.0) | | | 6.2 | | | 10.8 | | | (6.1) | | | 6.9 | | | 3.8 | |
| Total Current | Total Current | 126.3 | | | 63.7 | | | 35.5 | | | 8.0 | | | 58.5 | | | 53.9 | | | 5.9 | | | 60.8 | | | 24.4 | |
| Deferred Income Taxes, Net: | Deferred Income Taxes, Net: | | | | | | | | | | | | | | | | | |
| Federal | Federal | 17.2 | | | 35.6 | | | 5.9 | | | 76.3 | | | 16.3 | | | (14.9) | | | 101.1 | | | 33.8 | | | (1.3) | |
| Federal | |
| Federal | |
| State | State | 28.2 | | | 42.4 | | | 9.9 | | | 47.6 | | | 41.2 | | | 0.4 | | | 43.4 | | | 38.8 | | | 8.6 | |
| Total Deferred | Total Deferred | 45.4 | | | 78.0 | | | 15.8 | | | 123.9 | | | 57.5 | | | (14.5) | | | 144.5 | | | 72.6 | | | 7.3 | |
| Investment Tax Credits, Net | Investment Tax Credits, Net | (0.5) | | | (1.7) | | | — | | | (0.6) | | | (1.7) | | | — | | | (0.7) | | | (2.6) | | | — | |
| Income Tax Expense | Income Tax Expense | $ | 171.2 | | | $ | 140.0 | | | $ | 51.3 | | | $ | 131.3 | | | $ | 114.3 | | | $ | 39.4 | | | $ | 149.7 | | | $ | 130.8 | | | $ | 31.7 | |
A reconciliation between income tax expense and the expected tax expense at the statutory rate is as follows:
| Eversource (Millions of Dollars, except percentages) | Eversource (Millions of Dollars, except percentages) | For the Years Ended December 31, | Eversource (Millions of Dollars, except percentages) | For the Years Ended December 31, |
| 2022 | | 2021 | | 2020 | 2023 | | 2022 | | 2021 |
| Income Before Income Tax Expense | $ | 1,866.0 | | | $ | 1,572.3 | | | $ | 1,558.9 | |
| (Loss)/Income Before Income Tax Expense | |
| | Statutory Federal Income Tax Expense at 21% | |
| Statutory Federal Income Tax Expense at 21% | |
| Statutory Federal Income Tax Expense at 21% | Statutory Federal Income Tax Expense at 21% | 391.9 | | | 330.2 | | | 327.4 | |
| Tax Effect of Differences: | Tax Effect of Differences: | | | | | Tax Effect of Differences: | | | | | |
| Depreciation | Depreciation | (17.1) | | | (18.1) | | | (11.1) | |
| Investment Tax Credit Amortization | Investment Tax Credit Amortization | (2.6) | | | (2.8) | | | (3.7) | |
| State Income Taxes, Net of Federal Impact | State Income Taxes, Net of Federal Impact | 75.9 | | | 54.4 | | | 44.9 | |
| Dividends on ESOP | Dividends on ESOP | (5.1) | | | (5.1) | | | (5.1) | |
| Tax Asset Valuation Allowance/Reserve Adjustments | Tax Asset Valuation Allowance/Reserve Adjustments | 51.6 | | | 44.6 | | | 33.4 | |
| Excess Stock Benefit | (2.1) | | | (4.0) | | | (6.6) | |
| Tax Deficiency/(Excess Stock Benefit) | |
| EDIT Amortization | EDIT Amortization | (49.1) | | | (69.1) | | | (48.7) | |
| Other, Net | Other, Net | 10.2 | | | 14.1 | | | 15.7 | |
| Income Tax Expense | Income Tax Expense | $ | 453.6 | | | $ | 344.2 | | | $ | 346.2 | |
| Effective Tax Rate | Effective Tax Rate | 24.3 | % | | 21.9 | % | | 22.2 | % | Effective Tax Rate | (58.1) | % | | 24.3 | % | | 21.9 | % |
| | | | For the Years Ended December 31, | | For the Years Ended December 31, |
| | | 2022 | | 2021 | | 2020 | | 2023 | | 2022 | | 2021 |
| (Millions of Dollars, except percentages) | (Millions of Dollars, except percentages) | CL&P | | NSTAR
Electric | | PSNH | | CL&P | | NSTAR
Electric | | PSNH | | CL&P | | NSTAR
Electric | | PSNH | (Millions of Dollars, except percentages) | CL&P | | NSTAR
Electric | | PSNH | | CL&P | | NSTAR
Electric | | PSNH | | CL&P | | NSTAR
Electric | | PSNH |
| Income Before Income Tax Expense | Income Before Income Tax Expense | $ | 704.1 | | | $ | 632.4 | | | $ | 222.9 | | | $ | 533.0 | | | $ | 590.9 | | | $ | 189.8 | | | $ | 607.6 | | | $ | 575.8 | | | $ | 179.0 | |
| | Statutory Federal Income Tax Expense at 21% | Statutory Federal Income Tax Expense at 21% | 147.9 | | | 132.8 | | | 46.8 | | | 111.9 | | | 124.1 | | | 39.9 | | | 127.6 | | | 120.9 | | | 37.6 | |
| Statutory Federal Income Tax Expense at 21% | |
| Statutory Federal Income Tax Expense at 21% | |
| Tax Effect of Differences: | Tax Effect of Differences: | | | | | | | | | | | | | | | | | | Tax Effect of Differences: | | | |
| Depreciation | Depreciation | (3.7) | | | (4.2) | | | 0.9 | | | (6.4) | | | (3.4) | | | (0.2) | | | 0.4 | | | (3.7) | | | (1.4) | |
| Investment Tax Credit Amortization | Investment Tax Credit Amortization | (0.5) | | | (1.7) | | | — | | | (0.6) | | | (1.7) | | | — | | | (0.7) | | | (2.6) | | | — | |
| State Income Taxes, Net of Federal Impact | State Income Taxes, Net of Federal Impact | (6.6) | | | 40.3 | | | 12.5 | | | (4.6) | | | 37.5 | | | 8.9 | | | (1.2) | | | 36.0 | | | 9.8 | |
Tax Asset Valuation
Allowance/Reserve Adjustments | Tax Asset Valuation
Allowance/Reserve Adjustments | 44.7 | | | — | | | — | | | 36.7 | | | — | | | — | | | 30.7 | | | — | | | — | |
| Excess Stock Benefit | (0.7) | | | (0.8) | | | (0.3) | | | (1.5) | | | (1.4) | | | (0.5) | | | (2.3) | | | (2.3) | | | (0.8) | |
| Tax Deficiency/(Excess Stock Benefit) | |
| EDIT Amortization | EDIT Amortization | (9.2) | | | (29.2) | | | (7.7) | | | (9.8) | | | (43.2) | | | (10.5) | | | (9.0) | | | (20.4) | | | (15.4) | |
| Other, Net | Other, Net | (0.7) | | | 2.8 | | | (0.9) | | | 5.6 | | | 2.4 | | | 1.8 | | | 4.2 | | | 2.9 | | | 1.9 | |
| Income Tax Expense | Income Tax Expense | $ | 171.2 | | | $ | 140.0 | | | $ | 51.3 | | | $ | 131.3 | | | $ | 114.3 | | | $ | 39.4 | | | $ | 149.7 | | | $ | 130.8 | | | $ | 31.7 | |
| Effective Tax Rate | Effective Tax Rate | 24.3 | % | | 22.1 | % | | 23.0 | % | | 24.6 | % | | 19.3 | % | | 20.8 | % | | 24.6 | % | | 22.7 | % | | 17.7 | % | Effective Tax Rate | 24.8 | % | | 21.9 | % | | 23.2 | % | | 24.3 | % | | 22.1 | % | | 23.0 | % | | 24.6 | % | | 19.3 | % | | 20.8 | % |
Eversource, CL&P, NSTAR Electric and PSNH file a consolidated federal income tax return and unitary, combined and separate state income tax returns. These entities are also parties to a tax allocation agreement under which taxable subsidiaries do not pay any more taxes than they would have otherwise paid had they filed a separate company tax return, and subsidiaries generating tax losses, if any, are paid for their losses when utilized.
Deferred tax assets and liabilities are recognized for the future tax effects of temporary differences between the carrying amounts and the tax basis of assets and liabilities. The tax effect of temporary differences is accounted for in accordance with the rate-making treatment of the applicable regulatory commissions and relevant accounting authoritative literature. The tax effects of temporary differences that give rise to the net accumulated deferred income tax obligations are as follows:
| | | | As of December 31, | | As of December 31, |
| | | 2022 | | 2021 | | 2023 | | 2022 |
| (Millions of Dollars) | (Millions of Dollars) | Eversource | | CL&P | | NSTAR
Electric | | PSNH | | Eversource | | CL&P | | NSTAR
Electric | | PSNH | (Millions of Dollars) | Eversource | | CL&P | | NSTAR
Electric | | PSNH | | Eversource | | CL&P | | NSTAR
Electric | | PSNH |
| Deferred Tax Assets: | Deferred Tax Assets: | | | | | | | | | | | | | | | | Deferred Tax Assets: | | | | | | | | | | | | | |
| Employee Benefits | Employee Benefits | $ | 228.9 | | | $ | 25.3 | | | $ | 57.4 | | | $ | 11.6 | | | $ | 270.8 | | | $ | 23.9 | | | $ | 40.3 | | | $ | 14.1 | |
| Derivative Liabilities | Derivative Liabilities | 53.8 | | | 53.8 | | | — | | | — | | | 76.8 | | | 76.8 | | | — | | | — | |
| Regulatory Deferrals - Liabilities | Regulatory Deferrals - Liabilities | 529.5 | | | 146.6 | | | 285.7 | | | 42.1 | | | 390.7 | | | 90.9 | | | 215.4 | | | 24.3 | |
| Allowance for Uncollectible Accounts | Allowance for Uncollectible Accounts | 125.5 | | | 60.5 | | | 20.7 | | | 7.9 | | | 104.1 | | | 48.8 | | | 21.5 | | | 6.2 | |
| Tax Effect - Tax Regulatory Liabilities | Tax Effect - Tax Regulatory Liabilities | 762.9 | | | 324.6 | | | 241.8 | | | 97.8 | | | 783.4 | | | 328.2 | | | 254.3 | | | 100.9 | |
| Net Operating Loss Carryforwards | Net Operating Loss Carryforwards | 16.7 | | | — | | | — | | | — | | | 7.5 | | | — | | | — | | | — | |
| Purchase Accounting Adjustment | Purchase Accounting Adjustment | 62.0 | | | — | | | — | | | — | | | 67.2 | | | — | | | — | | | — | |
| Equity Method Wind Investments | |
| Other | Other | 176.6 | | | 109.5 | | | 20.5 | | | 21.3 | | | 196.6 | | | 103.9 | | | 21.7 | | | 22.9 | |
| Total Deferred Tax Assets | Total Deferred Tax Assets | 1,955.9 | | | 720.3 | | | 626.1 | | | 180.7 | | | 1,897.1 | | | 672.5 | | | 553.2 | | | 168.4 | |
Less: Valuation Allowance | Less: Valuation Allowance | 82.8 | | | 63.3 | | | — | | | — | | | 61.5 | | | 44.5 | | | — | | | — | |
| Net Deferred Tax Assets | Net Deferred Tax Assets | $ | 1,873.1 | | | $ | 657.0 | | | $ | 626.1 | | | $ | 180.7 | | | $ | 1,835.6 | | | $ | 628.0 | | | $ | 553.2 | | | $ | 168.4 | |
| Deferred Tax Liabilities: | Deferred Tax Liabilities: | | | | | | | | | | | | | | | | Deferred Tax Liabilities: | | | |
Accelerated Depreciation and Other
Plant-Related Differences | Accelerated Depreciation and Other
Plant-Related Differences | $ | 4,793.7 | | | $ | 1,602.0 | | | $ | 1,643.7 | | | $ | 523.8 | | | $ | 4,426.0 | | | $ | 1,509.5 | | | $ | 1,553.7 | | | $ | 482.9 | |
| Property Tax Accruals | Property Tax Accruals | 95.3 | | | 40.7 | | | 41.3 | | | 6.7 | | | 88.1 | | | 40.5 | | | 33.7 | | | 6.3 | |
| Regulatory Amounts: | Regulatory Amounts: | |
| Regulatory Deferrals - Assets | Regulatory Deferrals - Assets | 1,251.9 | | | 406.4 | | | 407.9 | | | 165.2 | | | 1,260.3 | | | 438.3 | | | 337.6 | | | 198.4 | |
| Regulatory Deferrals - Assets | |
| Regulatory Deferrals - Assets | |
| Tax Effect - Tax Regulatory Assets | Tax Effect - Tax Regulatory Assets | 271.7 | | | 185.6 | | | 10.7 | | | 7.9 | | | 257.8 | | | 181.4 | | | 10.9 | | | 8.3 | |
| Goodwill-related Regulatory Asset - 1999 Merger | Goodwill-related Regulatory Asset - 1999 Merger | 76.8 | | | — | | | 65.9 | | | — | | | 81.4 | | | — | | | 69.9 | | | — | |
| Employee Benefits | Employee Benefits | 305.5 | | | 45.0 | | | 140.8 | | | 18.7 | | | 174.7 | | | 3.5 | | | 107.1 | | | 0.7 | |
| Derivative Assets | Derivative Assets | 10.5 | | | 10.5 | | | — | | | — | | | 14.9 | | | 14.9 | | | — | | | — | |
| Other | Other | 135.6 | | | 6.8 | | | 16.7 | | | 21.2 | | | 129.5 | | | 2.0 | | | 19.8 | | | 9.8 | |
| Total Deferred Tax Liabilities | Total Deferred Tax Liabilities | $ | 6,941.0 | | | $ | 2,297.0 | | | $ | 2,327.0 | | | $ | 743.5 | | | $ | 6,432.7 | | | $ | 2,190.1 | | | $ | 2,132.7 | | | $ | 706.4 | |
2022 Federal Legislation: On August 16, 2022, the Inflation Reduction Act of 2022 (IRA) was signed into law. This is a broad package of legislation that includes incentives and support for clean energy resource development. Most notable for Eversource, the investment tax credit (ITC) on offshore wind projects increases from 30 percent to 40 percent if certain requirements for labor and domestic content are met. The act also re-establishes the production tax credit for solar and wind energy projects, gives increased credit for projects in certain communities, and sets credits for qualifying clean energy generation and energy storage projects. The tax provisions of the IRA provide additional incentives for offshore wind projects and could reduce retail electricity costs for our customers related to those clean energy investments. The IRA includes other tax provisions focused on implementing a 15 percent minimum tax on adjusted financial statement income and a one percent excise tax on corporate share repurchases. The Department of Treasury and the Internal Revenue Service issued limitedsome guidance in the fourth quarter;during 2023; however, they are expected to issue additional needed guidance with respect to the application of the newly enacted IRA provisions in the future. We will continue to monitor and evaluate impacts on our consolidated financial statements. We currently do not expect the alternative minimum tax change to have a material impact on our earnings, financial condition or cash flows.
2021 Federal Legislation: On November 5, 2021, Congress passed the Infrastructure Investment and Jobs Act. The Act provided spending of more than $500 billion on roads, highways, bridges, public transit, and utilities. For water and sewer utilities, the Act restored the exclusion from a corporation’s income for contributions in aid of construction where the corporation is a water or sewer utility eliminated by the Tax Cuts and Jobs Act of 2017. Under the Act, a regulated public utility that provides water or sewage disposal services can treat money or property received from any person as a tax-free contribution to capital if it meets certain criteria for contributions made after 2020. The Act did not have a material impact on Eversource in 2021.
Carryforwards: The following table provides the amounts and expiration dates of state tax credit and loss carryforwards and federal tax credit and net operating loss carryforwards:
| | As of December 31, |
| As of December 31, | | | As of December 31, |
| | | 2022 | | 2021 | | 2023 | | 2022 |
| (Millions of Dollars) | (Millions of Dollars) | Eversource | | CL&P | | NSTAR
Electric | | PSNH | | Expiration Range | | Eversource | | CL&P | | NSTAR
Electric | | PSNH | | Expiration Range | (Millions of Dollars) | Eversource | | CL&P | | NSTAR
Electric | | PSNH | | Expiration Range | | Eversource | | CL&P | | NSTAR
Electric | | PSNH | | Expiration Range |
| | State Net Operating Loss | State Net Operating Loss | $ | 288.1 | | | $ | — | | | $ | — | | | $ | — | | | 2022 - 2041 | | $ | 138.3 | | | $ | — | | | $ | — | | | $ | — | | | 2021 - 2040 |
| State Net Operating Loss | |
| State Net Operating Loss | | $ | 243.4 | | | $ | — | | | $ | — | | | $ | — | | | 2023 - 2041 | | $ | 288.1 | | | $ | — | | | $ | — | | | $ | — | | | 2022 - 2041 |
| State Tax Credit | State Tax Credit | 204.5 | | | 137.7 | | | — | | | — | | | 2022 - 2027 | | 197.7 | | | 137.0 | | | — | | | — | | | 2021 - 2026 | State Tax Credit | 228.5 | | | 157.5 | | 157.5 | | | — | | — | | | — | | — | | | 2023 - 2028 | | 2023 - 2028 | | 204.5 | | | 137.7 | | 137.7 | | | — | | — | | | — | | — | | | 2022 - 2027 | | 2022 - 2027 |
| State Charitable Contribution | State Charitable Contribution | 20.1 | | | — | | | — | | | — | | | 2022 - 2026 | | 23.7 | | | — | | | — | | | — | | | 2021 - 2025 | State Charitable Contribution | 7.9 | | | — | | — | | | — | | — | | | — | | — | | | 2023 - 2027 | | 2023 - 2027 | | 20.1 | | | — | | — | | | — | | — | | | — | | — | | | 2022 - 2026 | | 2022 - 2026 |
In 2022,2023, the Company increased its valuation allowance reserve for state credits by $21.3 million ($17.3 million for CL&P), net of tax, to reflect an update for expiring tax credits. In 2022,the Company increased its valuation allowance reserve for state credits by $21.3 million ($18.8 million for CL&P), net of tax, to reflect an update for expiring tax credits.In 2021,the Company increased its valuation allowance reserve for state credits by $13.0 million ($10.8 million for CL&P), net of tax, to reflect an update for expiring tax credits.
For 2022 and 2021,2023, state credit and state loss carryforwards have been partially reserved by a valuation allowance of $82.8 million and $61.5$104.1 million (net of tax), respectively. and for 2022, state credit and state loss carryforwards were partially reserved by a valuation allowance of $82.8 million (net of tax).
Unrecognized Tax Benefits: A reconciliation of the activity in unrecognized tax benefits, all of which would impact the effective tax rate if recognized, is as follows:
| | (Millions of Dollars) | (Millions of Dollars) | Eversource | | CL&P | (Millions of Dollars) | Eversource | | CL&P |
| Balance as of January 1, 2020 | $ | 55.0 | | | $ | 23.1 | |
| Gross Increases - Current Year | 11.9 | | | 4.6 | |
| Gross Increases - Prior Year | 1.4 | | | 0.7 | |
| Lapse of Statute of Limitations | (6.5) | | | (2.6) | |
| Balance as of December 31, 2020 | 61.8 | | | 25.8 | |
| Balance as of January 1, 2021 | |
| Gross Increases - Current Year | Gross Increases - Current Year | 11.3 | | | 3.8 | |
| Gross Decreases - Prior Year | Gross Decreases - Prior Year | (0.3) | | | (0.6) | |
| Lapse of Statute of Limitations | Lapse of Statute of Limitations | (7.0) | | | (2.8) | |
| Balance as of December 31, 2021 | Balance as of December 31, 2021 | 65.8 | | | 26.2 | |
| Gross Increases - Current Year | Gross Increases - Current Year | 11.5 | | | 3.5 | |
| Gross Decreases - Prior Year | Gross Decreases - Prior Year | (2.4) | | | (0.9) | |
| Lapse of Statute of Limitations | Lapse of Statute of Limitations | (7.8) | | | (3.3) | |
| Balance as of December 31, 2022 | Balance as of December 31, 2022 | $ | 67.1 | | | $ | 25.5 | |
| Gross Increases - Current Year | |
| Gross Increases - Prior Year | |
| Gross Decreases - Prior Year | |
| Lapse of Statute of Limitations | |
| Balance as of December 31, 2023 | |
Interest and Penalties: Interest on uncertain tax positions is recorded and generally classified as a component of Other Interest Expense on the statements of income. However, when resolution of uncertainties results in the Company receiving interest income, any related interest benefit is recorded in Other Income, Net on the statements of income. No penalties have been recorded. The amount of interest expense recognized on uncertain tax positions was $0.3 million for the year ended December 31, 2023. There has beenwas no interest expense or incomeexpense/(income) recognized on uncertain tax positions for the years ended December 31, 2022 2021 or 2020. The accrued2021. Accrued interest payable was $0.4 million and $0.1 million as of both December 31, 2023 and 2022, and 2021.respectively.
Tax Positions: During 20222023 and 2021,2022, Eversource did not resolve any of its uncertain tax positions.
Open Tax Years: The following table summarizes Eversource, CL&P, NSTAR Electric, and PSNH's tax years that remain subject to examination by major tax jurisdictions as of December 31, 2022:2023:
| | | | | |
| Description | Tax Years |
| Federal | 20222023 |
| Connecticut | 20192020 - 20222023 |
| Massachusetts | 20192020 - 20222023 |
| New Hampshire | 20192020 - 20222023 |
Eversource does not estimate to have an earnings impact related to unrecognized tax benefits during the next twelve months.
13. COMMITMENTS AND CONTINGENCIES
A. Environmental Matters
Eversource, CL&P, NSTAR Electric and PSNH are subject to environmental laws and regulations intended to mitigate or remove the effect of past operations and improve or maintain the quality of the environment. These laws and regulations require the removal or the remedy of the effect on the environment of the disposal or release of certain specified hazardous substances at current and former operating sites. Eversource, CL&P, NSTAR Electric and PSNH have an active environmental auditing and training program and each believes it is substantially in compliance with all enacted laws and regulations.
Environmental reserves are accrued when assessments indicate it is probable that a liability has been incurred and an amount can be reasonably estimated. The approach used estimates the liability based on the most likely action plan from a variety of available remediation options, including no action required or several different remedies ranging from establishing institutional controls to full site remediation and monitoring. These liabilities are estimated on an undiscounted basis and do not assume that the amounts are recoverable from insurance companies or other third parties. The environmental reserves include sites at different stages of discovery and remediation and do not include any unasserted claims.
These reserve estimates are subjective in nature as they take into consideration several different remediation options at each specific site. The reliability and precision of these estimates can be affected by several factors, including new information concerning either the level of contamination at the site, the extent of Eversource's, CL&P's, NSTAR Electric's and PSNH's responsibility for remediation or the extent of remediation required, recently enacted laws and regulations or changes in cost estimates due to certain economic factors. It is possible that new information or future developments could require a reassessment of the potential exposure to required environmental remediation. As this information becomes available, management will continue to assess the potential exposure and adjust the reserves accordingly.
The amounts recorded as environmental reserves are included in Other Current Liabilities and Other Long-Term Liabilities on the balance sheets and represent management's best estimate of the liability for environmental costs, and take into consideration site assessment, remediation and long-term monitoring costs. The environmental reserves also take into account recurring costs of managing hazardous substances and pollutants, mandated expenditures to remediate contaminated sites and any other infrequent and non-recurring clean-up costs. A reconciliation of the activity in the environmental reserves is as follows:
| | (Millions of Dollars) | (Millions of Dollars) | Eversource | | CL&P | | NSTAR Electric | | PSNH | (Millions of Dollars) | Eversource | | CL&P | | NSTAR Electric | | PSNH |
| Balance as of January 1, 2021 | $ | 102.4 | | | $ | 12.3 | | | $ | 4.7 | | | $ | 7.1 | |
| Additions | 23.4 | | | 4.4 | | | — | | | — | |
| Payments/Reductions | (10.4) | | | (2.8) | | | (1.4) | | | (0.8) | |
| Balance as of December 31, 2021 | 115.4 | | | 13.9 | | | 3.3 | | | 6.3 | |
| Balance as of January 1, 2022 | |
| Additions | Additions | 12.6 | | | 0.9 | | | 0.4 | | | 0.5 | |
| Payments/Reductions | Payments/Reductions | (5.4) | | | (0.9) | | | (0.3) | | | (0.7) | |
| Balance as of December 31, 2022 | Balance as of December 31, 2022 | $ | 122.6 | | | $ | 13.9 | | | $ | 3.4 | | | $ | 6.1 | |
| Additions | |
| Payments/Reductions | |
| Balance as of December 31, 2023 | |
The number of environmental sites for which remediation or long-term monitoring, preliminary site work or site assessment is being performed are as follows:
| | Eversource | | CL&P | | NSTAR Electric | | PSNH |
| Eversource | | | Eversource | | CL&P | | NSTAR Electric | | PSNH |
| 2023 | | 2023 | 65 | | 16 | | 12 | | 8 |
| 2022 | 2022 | 59 | | 13 | | 10 | | 8 | 2022 | 59 | | 13 | | 10 | | 8 |
| 2021 | 61 | | 14 | | 11 | | 9 |
The increase in the reserve balance was due primarily to the addition of one environmental site at NSTAR Gas, two additional sites at NSTAR Electric, three additional sites at CL&P, and changes in cost estimates at certain MGP sites at our natural gas business segment,companies and PSNH for which we now knowadditional remediation will require additional remediation.be required.
Included in the number of sites and reserve amounts above are former MGP sites that were operated several decades ago and manufactured natural gas from coal and other processes, which resulted in certain by-products remaining in the environment that may pose a potential risk to human health and the environment, for which Eversource may have potential liability. The reserve balances related to these former MGP sites were $112.6$117.1 million and $105.6$112.6 million as of December 31, 20222023 and 2021,2022, respectively, and related primarily to the natural gas business segment.
As of December 31, 2022,2023, for 1519 environmental sites (7(11 for CL&P and 1 for NSTAR Electric) that are included in the Company's reserve for environmental costs, management cannot reasonably estimate the exposure to loss in excess of the reserve, or range of loss, as these sites are under investigation and/or there is significant uncertainty as to what remedial actions, if any, the Company may be required to undertake. As of December 31, 2022, $25.82023, $39.9 million (including $4.4$12.6 million for CL&P and $0.1$0.3 million for NSTAR Electric) had been accrued as a liability for these sites.
As of December 31, 2022,2023, for 7 environmental sites (1 for CL&P) that are included in the Company's reserve for environmental costs, the information known and the nature of the remediation options allow for the Company to estimate the range of losses for environmental costs. As of December 31, 2022, $29.92023, $29.4 million (including $0.6$0.4 million for CL&P) has been accrued as a liability for these sites, which represents the low end of the range of the liabilities for environmental costs. Management believes that additional losses of up to approximately $17$17.7 million ($0.30.5 million at CL&P) may be incurred in executing current remediation plans for these sites.
As of December 31, 2022,2023, for the remaining 3739 environmental sites (including 54 for CL&P, 911 for NSTAR Electric and 8 for PSNH) that are included in the Company's reserve for environmental costs, the $66.9$58.9 million accrual (including $8.9$0.8 million for CL&P, $3.3$5.1 million for NSTAR Electric and $6.1$7.6 million for PSNH) represents management's best estimate of the probable liability and no additional loss is estimable at this time.
PSNH, NSTAR Gas, EGMA and Yankee Gas have rate recovery mechanisms for MGP related environmental costs, therefore, changes in their respective environmental reserves do not impact Net Income. CL&P is allowed to defer certain environmental costs for future recovery. NSTAR Electric does not have a separate environmental cost recovery regulatory mechanism.
B. Long-Term Contractual Arrangements
Estimated Future Annual Costs: The estimated future annual costs of significant executed, non-cancelable, long-term contractual arrangements in effect as of December 31, 20222023 are as follows:
| | Eversource | Eversource | | | | | | | | | | | | | | Eversource | | | |
| (Millions of Dollars) | (Millions of Dollars) | 2023 | | 2024 | | 2025 | | 2026 | | 2027 | | Thereafter | | Total | (Millions of Dollars) | 2024 | | 2025 | | 2026 | | 2027 | | 2028 | | Thereafter | | Total |
| Renewable Energy Purchase Contracts | Renewable Energy Purchase Contracts | $ | 751.8 | | | $ | 952.6 | | | $ | 954.8 | | | $ | 983.0 | | | $ | 998.5 | | | $ | 8,141.1 | | | $ | 12,781.8 | |
| Natural Gas Procurement | Natural Gas Procurement | 447.1 | | | 419.4 | | | 340.9 | | | 298.5 | | | 269.4 | | | 1,450.6 | | | 3,225.9 | |
| Purchased Power and Capacity | Purchased Power and Capacity | 87.6 | | | 86.8 | | | 75.2 | | | 2.9 | | | 2.7 | | | 7.2 | | | 262.4 | |
| Peaker CfDs | Peaker CfDs | 20.3 | | | 21.1 | | | 17.9 | | | 16.0 | | | 11.4 | | | 64.4 | | | 151.1 | |
| Transmission Support Commitments | Transmission Support Commitments | 17.8 | | | 20.7 | | | 22.6 | | | 22.6 | | | 22.6 | | | 22.6 | | | 128.9 | |
| Total | Total | $ | 1,324.6 | | | $ | 1,500.6 | | | $ | 1,411.4 | | | $ | 1,323.0 | | | $ | 1,304.6 | | | $ | 9,685.9 | | | $ | 16,550.1 | |
| | CL&P | CL&P | | | | | | | | | | | | | | CL&P | | | |
| (Millions of Dollars) | (Millions of Dollars) | 2023 | | 2024 | | 2025 | | 2026 | | 2027 | | Thereafter | | Total | (Millions of Dollars) | 2024 | | 2025 | | 2026 | | 2027 | | 2028 | | Thereafter | | Total |
| Renewable Energy Purchase Contracts | Renewable Energy Purchase Contracts | $ | 594.8 | | | $ | 609.1 | | | $ | 610.2 | | | $ | 607.6 | | | $ | 609.0 | | | $ | 2,253.1 | | | $ | 5,283.8 | |
| Purchased Power and Capacity | Purchased Power and Capacity | 83.5 | | | 83.9 | | | 72.4 | | | 0.1 | | | — | | | — | | | 239.9 | |
| Peaker CfDs | Peaker CfDs | 20.3 | | | 21.1 | | | 17.9 | | | 16.0 | | | 11.4 | | | 64.4 | | | 151.1 | |
| Transmission Support Commitments | Transmission Support Commitments | 7.0 | | | 8.2 | | | 8.9 | | | 8.9 | | | 8.9 | | | 8.9 | | | 50.8 | |
| Total | Total | $ | 705.6 | | | $ | 722.3 | | | $ | 709.4 | | | $ | 632.6 | | | $ | 629.3 | | | $ | 2,326.4 | | | $ | 5,725.6 | |
| | NSTAR Electric | NSTAR Electric | | | | | | | | | | | | | | NSTAR Electric | | | |
| (Millions of Dollars) | (Millions of Dollars) | 2023 | | 2024 | | 2025 | | 2026 | | 2027 | | Thereafter | | Total | (Millions of Dollars) | 2024 | | 2025 | | 2026 | | 2027 | | 2028 | | Thereafter | | Total |
| Renewable Energy Purchase Contracts | Renewable Energy Purchase Contracts | $ | 79.2 | | | $ | 270.0 | | | $ | 316.5 | | | $ | 322.9 | | | $ | 328.6 | | | $ | 5,519.8 | | | $ | 6,837.0 | |
| Purchased Power and Capacity | Purchased Power and Capacity | 2.9 | | | 2.9 | | | 2.8 | | | 2.8 | | | 2.7 | | | 7.2 | | | 21.3 | |
| Transmission Support Commitments | Transmission Support Commitments | 7.0 | | | 8.1 | | | 8.9 | | | 8.9 | | | 8.9 | | | 8.9 | | | 50.7 | |
| Total | Total | $ | 89.1 | | | $ | 281.0 | | | $ | 328.2 | | | $ | 334.6 | | | $ | 340.2 | | | $ | 5,535.9 | | | $ | 6,909.0 | |
| | PSNH | PSNH | | | | | | | | | | | | | | PSNH | | | |
| (Millions of Dollars) | (Millions of Dollars) | 2023 | | 2024 | | 2025 | | 2026 | | 2027 | | Thereafter | | Total | (Millions of Dollars) | 2024 | | 2025 | | 2026 | | 2027 | | 2028 | | Thereafter | | Total |
| Renewable Energy Purchase Contracts | Renewable Energy Purchase Contracts | $ | 77.8 | | | $ | 73.5 | | | $ | 28.1 | | | $ | 52.5 | | | $ | 60.9 | | | $ | 368.2 | | | $ | 661.0 | |
| Purchased Power and Capacity | 1.2 | | | — | | | — | | | — | | | — | | | — | | | 1.2 | |
| | Transmission Support Commitments | |
| Transmission Support Commitments | |
| Transmission Support Commitments | Transmission Support Commitments | 3.8 | | | 4.4 | | | 4.8 | | | 4.8 | | | 4.8 | | | 4.8 | | | 27.4 | |
| Total | Total | $ | 82.8 | | | $ | 77.9 | | | $ | 32.9 | | | $ | 57.3 | | | $ | 65.7 | | | $ | 373.0 | | | $ | 689.6 | |
The contractual obligations table above does not include CL&P's, NSTAR Electric's or PSNH's standard/basic service contracts for the purchase of energy supply, the amounts of which vary with customers' energy needs.
Renewable Energy Purchase Contracts: Renewable energy purchase contracts include non-cancellable commitments under contracts of CL&P, NSTAR Electric and PSNH for the purchase of energy and capacity from renewable energy facilities. Such contracts extend through 20432044 for CL&P 2044 forand NSTAR Electric and 2033 for PSNH.
Renewable Energy and Purchase Contracts includes long-term commitments of NSTAR Electric pertaining to the Vineyard Wind LLC contract awarded under the Massachusetts Clean Energy 83C procurement solicitation. NSTAR Electric, along with other Massachusetts distribution companies, entered into 20-year contracts to purchase electricity generated by this 800 megawatt offshore wind project. Construction on the Vineyard Wind project commenced in 2022. Estimated energy costs under this contract are expected to begin when the facilities are in service in 2024 and range between $240$100 million and $375$200 million per year under NSTAR Electric’s 20-year contract, totaling approximately $6.0$2.6 billion.
As required by 2018 regulation, CL&P and UI each entered into PURA-approved ten-year contracts in 2019 to purchase a combined total of approximately 9 million MWh annually from the Millstone Nuclear Power Station generation facility, which represents a combined amount of approximately 50 percent of the facility's output (approximately 40 percent by CL&P). The Millstone Nuclear Power Station has a 2,112 MW nameplate capacity. Energy deliveries and payments under these contracts began in 2019. Also as required by 2018 regulation, CL&P and UI each entered into PURA-approved eight-year contracts in 2019 to purchase a combined amount of approximately 18 percent of the Seabrook Nuclear Power Plant’s output (approximately 15 percent by CL&P) beginning January 1, 2022. The Seabrook Nuclear Power Plant has an approximate 1,250 MW nameplate capacity. The total estimated remaining future cost of the Millstone Nuclear Power Station and Seabrook Nuclear Power Plant energy purchase contracts are $2.9$2.4 billion and are reflected in the table above. CL&P sells the energy purchased under these contracts into the market and uses the proceeds from these energy sales to offset the contract costs. As the net costs under these contracts are recovered from customers in future rates, the contracts do not have an impact on the net income of CL&P. These contracts do not meet the definition of a derivative, and accordingly, the costs of these contracts are being accounted for as incurred.
Excluded from the table above are long-term commitments of NSTAR Electric pertaining to the Massachusetts Clean Energy 83D contract, for which construction was suspended prior to December 31, 2021. Should the project attain feasibility and construction recommence, the estimated costs under the contract may potentially begin in 2023 and range between $150 million and $415 million per year under a 20-year contract, totaling approximately $6.7 billion.
The contractual obligations table above does not include long-term commitments signed by CL&P and NSTAR Electric, as required by the PURA and the DPU, respectively, for the purchase of renewable energy and related products that are contingent on the future construction of energy facilities.facilities, such as the long-term commitments of NSTAR Electric pertaining to the Massachusetts Clean Energy 83D contract entered into in 2018.
Natural Gas Procurement: Eversource's natural gas distribution businesses have long-term contracts for the purchase, transportation and storage of natural gas as part of its portfolio of supplies, which extend through 2045.
Purchased Power and Capacity: These contracts include capacity CfDs ofwith generation facilities at CL&P through 2026, and various IPP contracts or purchase obligations for electricity which extend through 2024 for CL&P and 2031 for NSTAR Electric and 2023 for PSNH.
As required by regulation, CL&P, along with UI, has capacity-related contracts with generation facilities. CL&P has a sharing agreement with UI, with 80 percent of the costs or benefits of each contract borne by or allocated to CL&P and 20 percent borne by or allocated to UI. The combined capacities of these contracts as of December 31, 2022 and 2021 were 674 MW and 675 MW, respectively. The capacity contracts extend through 2026 and obligate both CL&P and UI to make or receive payments on a monthly basis to or from the generation facilities based on the difference between a set capacity price and the capacity market price received in the ISO-NE capacity markets.Electric. CL&P's portion of the costs and benefits ofunder these capacity contracts will be paid by,are recovered from, or refunded to, CL&P's customers.
The contractual obligations table above does not include CL&P's, NSTAR Electric's or PSNH's standard/basic service contracts for the purchase of energy supply, the amounts of which vary with customers' energy needs.
Peaker CfDs: CL&P, along with UI, has three peaker CfDs for a total of approximately 500 MW of peaking capacity through 2042. CL&P has a sharing agreement with UI, whereby CL&P is responsible for 80 percent and UI for 20 percent of the net costs or benefits of these CfDs. The Peaker CfDs pay the generation facility owner the difference between capacity, forward reserve and energy market revenues and a cost-of-service payment stream for 30 years. The ultimate cost or benefit to CL&P under these contracts will depend on the costs of plant operation and the prices that the projects receive for capacity and other products in the ISO-NE markets. CL&P's portion of the amounts paid or received under the Peaker CfDs are recovered from, or refunded to, CL&P's customers.
Transmission Support Commitments: Along with other New England utilities, CL&P, NSTAR Electric and PSNH have entered into a series of agreements in the 1980’s to support the costs of, and receive rights to use, transmission and terminal facilities that were built to import electricity from the Hydro-Québec system in Canada. CL&P, NSTAR Electric and PSNH wereare obligated to pay, over a 30-year20-year period that endedending in 2020,2040, their proportionate shares of the annual operation and maintenance expenses and capital costs of those facilities. On December 18, 2020, the parties to these agreements submitted to FERC an offer of settlement and amendments to these agreements implementing the terms of an extension for an additional 20-year period ending in 2040. On May 20, 2021, FERC approved this settlement, effective January 1, 2021.
The total costs incurred under these agreements were as follows:
| | Eversource | Eversource | For the Years Ended December 31, | Eversource | For the Years Ended December 31, |
| (Millions of Dollars) | (Millions of Dollars) | 2022 | | 2021 | | 2020 | (Millions of Dollars) | 2023 | | 2022 | | 2021 |
| Renewable Energy Purchase Contracts | Renewable Energy Purchase Contracts | $ | 678.1 | | | $ | 609.2 | | | $ | 584.2 | |
| Natural Gas Procurement | Natural Gas Procurement | 1,042.8 | | | 712.7 | | | 453.4 | |
| Purchased Power and Capacity | Purchased Power and Capacity | 61.6 | | | 56.4 | | | 62.7 | |
| Peaker CfDs | Peaker CfDs | 13.4 | | | 24.3 | | | 22.7 | |
| Transmission Support Commitments | Transmission Support Commitments | 12.7 | | | 15.4 | | | 22.1 | |
| | | | For the Years Ended December 31, | | For the Years Ended December 31, |
| | | 2022 | | 2021 | | 2020 | | 2023 | | 2022 | | 2021 |
| (Millions of Dollars) | (Millions of Dollars) | CL&P | | NSTAR
Electric | | PSNH | | CL&P | | NSTAR
Electric | | PSNH | | CL&P | | NSTAR
Electric | | PSNH | (Millions of Dollars) | CL&P | | NSTAR
Electric | | PSNH | | CL&P | | NSTAR
Electric | | PSNH | | CL&P | | NSTAR
Electric | | PSNH |
| Renewable Energy Purchase Contracts | Renewable Energy Purchase Contracts | $ | 513.2 | | | $ | 90.8 | | | $ | 74.1 | | | $ | 457.1 | | | $ | 84.7 | | | $ | 67.4 | | | $ | 426.3 | | | $ | 88.8 | | | $ | 69.1 | |
| Purchased Power and Capacity | Purchased Power and Capacity | 57.7 | | | 3.0 | | | 0.9 | | | 53.1 | | | 3.0 | | | 0.3 | | | 59.3 | | | 3.1 | | | 0.3 | |
| Peaker CfDs | Peaker CfDs | 13.4 | | | — | | | — | | | 24.3 | | | — | | | — | | | 22.7 | | | — | | | — | |
| Transmission Support Commitments | Transmission Support Commitments | 5.0 | | | 5.0 | | | 2.7 | | | 6.1 | | | 6.0 | | | 3.3 | | | 8.7 | | | 8.7 | | | 4.7 | |
C. Spent Nuclear Fuel Obligations - Yankee Companies
CL&P, NSTAR Electric and PSNH have plant closure and fuel storage cost obligations to the Yankee Companies, which have each completed the physical decommissioning of their respective nuclear power facilities and are now engaged in the long-term storage of their spent fuel. The Yankee Companies fund these costs through litigation proceeds received from the DOE and, to the extent necessary, through wholesale, FERC-approved rates charged under power purchase agreements with several New England utilities, including CL&P, NSTAR Electric and PSNH. CL&P, NSTAR Electric and PSNH, in turn recover these costs from their customers through state regulatory commission-approved retail rates. The Yankee Companies collect amounts that management believes are adequate to recover the remaining plant closure and fuel storage cost
estimates for the respective plants. Management believes CL&P and NSTAR Electric will recover their shares of these obligations from their customers. PSNH has recovered its total share of these costs from its customers.
Spent Nuclear Fuel Litigation:
The Yankee Companies have filed complaints against the DOE in the Court of Federal Claims seeking monetary damages resulting from the DOE's failure to accept delivery of, and provide for a permanent facility to store, spent nuclear fuel pursuant to the terms of the 1983 spent fuel and high-level waste disposal contracts between the Yankee Companies and the DOE. The court previously awarded the Yankee Companies damages for Phases I, II, III and IV of litigation resulting from the DOE's failure to meet its contractual obligations. These Phases covered damages incurred in the years 1998 through 2016, and the awarded damages have been received by the Yankee Companies with certain amounts of the damages refunded to their customers.
DOE Phase V Damages - On March 25, 2021, each of the Yankee Companies filed a fifth set of lawsuits against the DOE in the Court of Federal Claims resulting from the DOE's failure to begin accepting spent nuclear fuel for disposal covering the years from 2017 to 2020. The Yankee Companies filed claims seeking monetary damages totaling $120.4 million for CYAPC, YAEC and MYAPC. Pursuant to a June 2, 2022 court order, the Yankee Companies were subsequently permitted to include monetary damages relating to the year 2021 in the DOE Phase V complaint. The Yankee Companies submitted a supplemental filing to include these costs of $33.1 million on June 8, 2022. The DOE Phase V trial is expected to begin in the third quarterspring of 2023.2024.
D. Guarantees and Indemnifications
In the normal course of business, Eversource parent provides credit assurances on behalf of its subsidiaries, including CL&P, NSTAR Electric and PSNH, in the form of guarantees. Management does not anticipate a material impact to net income or cash flows as a result of these various guarantees and indemnifications.
Guarantees issued on behalf of unconsolidated entities, including equity method offshore wind investments, for which Eversource parent is the guarantor, are recorded at fair value as a liability on the balance sheet at the inception of the guarantee. The fair value of guarantees issued on behalf of unconsolidated entities are recorded within Other Long-Term Liabilities on the balance sheet, and were $4.4 million and $4.2 million as of December 31, 2023 and 2022, respectively. Eversource regularly reviews performance risk under these guarantee arrangements, and inbelieves the likelihood of payments being required under the guarantees is remote. In the event it becomes probable that Eversource parent will be required to perform under the guarantee, the amount of probable payment will be recorded. The fair value of guarantees issued on behalf of unconsolidated entities are recorded within Other Long-Term Liabilities on the balance sheet, and were $4.2 million and $7.3 million as of December 31, 2022 and 2021, respectively.
The following table summarizes Eversource parent's exposure to guarantees and indemnifications of its subsidiaries and affiliates to external parties, and primarily relates to its offshore wind business:
| | | | | | | | | | | | | | | | | | | | |
| As of December 31, 2022 |
| Company (Obligor) | | Description | | Maximum Exposure
(in millions) | | Expiration Dates |
| North East Offshore LLC | | Construction-related purchase agreements with third-party contractors (1) | | $ | 717.6 | | | (1) |
| Sunrise Wind LLC | | Construction-related purchase agreements with third-party contractors (2) | | 311.5 | | | 2025 - 2026 |
| Revolution Wind, LLC | | Construction-related purchase agreements with third-party contractors (3) | | 419.1 | | | 2024 - 2027 |
| South Fork Wind, LLC | | Construction-related purchase agreements with third-party contractors (4) | | 142.1 | | | 2023 - 2026 |
| Eversource Investment LLC | | Funding and indemnification obligations of North East Offshore LLC (5) | | 77.0 | | | (5) |
| South Fork Wind, LLC | | Power Purchase Agreement Security (6) | | 7.1 | | | (6) |
| Sunrise Wind LLC | | OREC capacity production (7) | | 2.2 | | | (7) |
| Bay State Wind LLC | | Real estate purchase | | 2.5 | | | 2023 |
| South Fork Wind, LLC | | Transmission interconnection | | 1.2 | | | — |
| Eversource Investment LLC | | Letters of Credit (8) | | 4.3 | | | — |
| Various | | Surety bonds (9) | | 35.7 | | | 2023 |
| Eversource Service | | Lease payments for real estate | | 0.5 | | | 2024 |
| | | | | | | | | | | | | | |
| As of December 31, 2023 |
| Company (Obligor) | | Description | | Maximum Exposure
(in millions) |
| North East Offshore, LLC, Sunrise Wind LLC, Revolution Wind, LLC and South Fork Wind, LLC | | Offshore wind construction-related purchase agreements with third-party contractors (1) | | $ | 1,941.1 | |
| Eversource Investment LLC and South Fork Class B Member, LLC | | Funding and indemnification obligations of South Fork Wind and North East Offshore, LLC (2) | | 485.9 | |
| Sunrise Wind LLC | | OREC capacity production (3) | | 11.0 | |
| | | | |
| | | | |
| | | | |
| | | | |
| South Fork Wind, LLC | | Power Purchase Agreement Security (4) | | 7.1 | |
| | | | |
| | | | |
| | | | |
| Eversource Investment LLC | | Letters of Credit (5) | | 15.2 | |
| Eversource TEI LLC | | South Fork Wind Tax Equity (6) | | — | |
| Various | | Surety bonds (7) | | 38.8 | |
| | | | |
| Sunrise Wind LLC | | Surety bonds (8) | | 20.5 | |
(1) Eversource parent issued guarantees on behalf of its 50 percent-owned affiliate,affiliates, North East Offshore, LLC (NEO), Sunrise Wind LLC, Revolution Wind, LLC and South Fork Wind, LLC, under which Eversource parent agreed to guarantee 50 percent of NEO’seach entity’s performance of obligations under certain construction-related purchase agreements with third-party contractors, in an aggregate amount not to exceed $1.3 billion with an expiration date in 2025.$3.03 billion. Eversource parent’s obligations under the guarantees expire upon the earlier of (i) dates ranging between May 2024 and October 2028 and (ii) full performance of the guaranteed obligations. Eversource parent also issued a separate guarantee to Ørsted on behalf of NEO, under which Eversource parent agreed to guarantee 50 percent of NEO’s payment obligations under certain offshore wind project construction-related agreements with Ørsted in an aggregate amount not to exceed $62.5 million and expiring upon full performance of the guaranteed obligation. Any amounts paid under this guarantee to Ørsted will count toward, but not increase, the maximum amount of the Funding Guarantee described in Note 5, below.
(2) Eversource parent issued guarantees on behalf of its 50 percent-owned affiliate, Sunrise Wind LLC, whereby Eversource parent will guarantee Sunrise Wind LLC's performance of certain obligations, in an aggregate amount not to exceed $465.8 million, in connection with construction-related purchase agreements. Eversource parent’s obligations under the guarantees expire upon the earlier of (i) dates ranging from March 2025 and April 2026 and (ii) full performance of the guaranteed obligations.
(3) Eversource parent issued guarantees on behalf of its 50 percent-owned affiliate, Revolution Wind,wholly-owned subsidiary Eversource Investment LLC whereby Eversource parent will guarantee Revolution Wind, LLC's performance of certain obligations,(EI), which holds Eversource's investments in an aggregate amount not to exceed $546.7 million, in connection with construction-related purchase agreements. Eversource parent’s obligations under the guarantees expire upon the earlier of (i) dates ranging from May 2024offshore wind-related equity method investments, and November 2027 and (ii) full performance of the guaranteed obligations.
(4) Eversource parent issued guarantees on behalf of its 50 percent-owned affiliate, South Fork Wind,Class B Member, LLC, whereby Eversource parent will guarantee South Fork Wind, LLC'seach entity’s performance of certain obligations in connection with construction-related purchase agreements. Under these guarantees, Eversource parent will guarantee South Fork Wind, LLC's performance of certain obligations, in a total aggregate amount not to exceed $207.7 million. Eversource parent’s obligations under these guarantees expire upon the earlier of (i) dates ranging from June 2023 and August 2026 and (ii) full performance of the guaranteed obligations.
(5) Eversource parent issued a guarantee (Funding Guarantee) on behalf of Eversource Investment LLC (EI), its wholly-owned subsidiary that holds a 50 percent ownership interest in NEO, under which Eversource parent agreed to guarantee certain funding obligations and certain indemnification payments of EI under the operating agreement of NEO, in an amount not to exceed $910 million. The guaranteed obligations include payment of EI'scapital expenditure funding obligations during the construction phasephases of the South Fork Wind project and NEO’s underlying offshore wind projects andprojects. Eversource parent also guaranteed certain indemnification obligations of EI associated with third party credit support for itsEI’s investment in NEO. Eversource parent’s obligations under the Funding GuaranteeThese guarantees will not exceed $1.52 billion and expire upon the full performance of the guaranteed obligations.
(6) Eversource parent issued a guarantee on behalf of its 50 percent-owned affiliate, South Fork Wind, LLC, whereby Eversource parent will guarantee South Fork Wind, LLC's performance of certain obligations, in an amount not to exceed $7.1 million, under a Power Purchase Agreement between the Long Island Power Authority and South Fork Wind, LLC (the Agreement). The guarantee expires upon the later of (i) the end of the Agreement term and (ii) full performance of the guarantee obligations.
(7)(3) Eversource parent issued a guarantee on behalf of its 50 percent-owned affiliate, Sunrise Wind LLC, whereby Eversource parent will guarantee Sunrise Wind LLC's performance of certain obligations, in an amount not to exceed $15.4 million, under the Offshore Wind Renewable Energy Certificate Purchase and Sale Agreement (the Agreement). The Agreement was executed by and between the New York State Energy Research and Development Authority (NYSERDA) and Sunrise Wind LLC. The guarantee expires upon the full performance of the guaranteed obligations. Effective January 1, 2023,2024, the maximum exposure under the guarantee increased from $2.2$11.0 million to $11.0$15.4 million.
122(4) Eversource parent issued a guarantee on behalf of its 50 percent-owned affiliate, South Fork Wind, LLC, whereby Eversource parent will guarantee South Fork Wind, LLC's performance of certain obligations, in an amount not to exceed $7.1 million, under a Power Purchase Agreement between the Long Island Power Authority and South Fork Wind, LLC (the Agreement). The guarantee expires upon the later of (i) the end of the Agreement term and (ii) full performance of the guaranteed obligations.
(8)(5) On September 16, 2020, Eversource parent entered into a guarantee on behalf of EI, which holds Eversource's investments in offshore wind-related equity method investments, under which Eversource parent would guarantee EI's obligations under a letter of credit facility with a financial institution that EI may request in an aggregate amount of up to approximately $25 million. In January 2022, Eversource parentAs of December 31, 2023, EI has issued two letters of credit on behalf of South Fork Wind, LLC, related to future decommissioning obligationsSunrise Wind LLC and Revolution Wind, LLC totaling $15.2 million. In January 2024, EI issued two additional letters of certain onshore transmission assetscredit on behalf of Sunrise Wind LLC totaling $4.3$8.0 million. The guarantee will remain in effect until full performance of the guaranteed obligations.
(9)(6) Eversource parent issued a guarantee on behalf of its wholly-owned subsidiary, Eversource TEI LLC, whereby Eversource parent will guarantee Eversource TEI LLC’s performance of certain obligations, in an amount not to exceed $528.4 million, primarily in connection with tax equity funding obligations during the construction phase of the South Fork Wind project. Eversource parent’s obligations expire upon the full performance of the guaranteed obligations.
(7) Surety bond expirationbonds expire in 2024. Expiration dates reflect termination dates, the majority of which will be renewed or extended. Certain surety bonds contain credit ratings triggers that would require Eversource parent to post collateral in the event that the unsecured debt credit ratings of Eversource parent are downgraded.
2023 Guaranty(8) : In the first quarter ofDecember 2023, Eversource parent issued an additional guaranty on behalf of Sunrise Wind LLC totaling $58.1 million, whereby Eversource parent will guarantee Sunrise Wind LLC'sissued a surety bond related to future decommissioning obligations of certain onshore transmission assets in the amount of $20.5 million. The surety bond shall remain outstanding until full performance of certain contractualthe obligations.
E. FERC ROE Complaints
Four separate complaints were filed at the FERC by combinations of New England state attorneys general, state regulatory commissions, consumer advocates, consumer groups, municipal parties and other parties (collectively, the Complainants). In each of the first three complaints, filed on October 1, 2011, December 27, 2012, and July 31, 2014, respectively, the Complainants challenged the NETOs' base ROE of 11.14 percent that had been utilized since 2005 and sought an order to reduce it prospectively from the date of the final FERC order and for the separate 15-month complaint periods. In the fourth complaint, filed April 29, 2016, the Complainants challenged the NETOs' base ROE billed of 10.57 percent and the maximum ROE for transmission incentive (incentive cap) of 11.74 percent, asserting that these ROEs were unjust and unreasonable.
The ROE originally billed during the period October 1, 2011 (beginning of the first complaint period) through October 15, 2014 consisted of a base ROE of 11.14 percent and incentives up to 13.1 percent. On October 16, 2014, FERC issued Opinion No. 531-A and set the base ROE at 10.57 percent and the incentive cap at 11.74 percent for the first complaint period. This was also effective for all prospective billings to customers beginning October 16, 2014. This FERC order was vacated on April 14, 2017 by the U.S. Court of Appeals for the D.C. Circuit (the Court).
All amounts associated with the first complaint period have been refunded, which totaled $38.9 million (pre-tax and excluding interest) at Eversource and reflected both the base ROE and incentive cap prescribed by the FERC order. The refund consisted of $22.4 million for CL&P, $13.7 million for NSTAR Electric and $2.8 million for PSNH.
Eversource has recorded a reserve of $39.1 million (pre-tax and excluding interest) for the second complaint period as of both December 31, 20222023 and 2021.2022. This reserve represents the difference between the billed rates during the second complaint period and a 10.57 percent base ROE and 11.74 percent incentive cap. The reserve consisted of $21.4 million for CL&P, $14.6 million for NSTAR Electric and $3.1 million for PSNH as of both December 31, 20222023 and 2021.2022.
On October 16, 2018, FERC issued an order on all four complaints describing how it intends to address the issues that were remanded by the Court. FERC proposed a new framework to determine (1) whether an existing ROE is unjust and unreasonable and, if so, (2) how to calculate a replacement ROE. Initial briefs were filed by the NETOs, Complainants and FERC Trial Staff on January 11, 2019 and reply briefs were filed on March 8, 2019. The NETOs' brief was supportive of the overall ROE methodology determined in the October 16, 2018 order provided the FERC does not change the proposed methodology or alter its implementation in a manner that has a material impact on the results.
The FERC order included illustrative calculations for the first complaint using FERC's proposed frameworks with financial data from that complaint. Those illustrative calculations indicated that for the first complaint period, for the NETOs, which FERC concludes are of average financial risk, the preliminary just and reasonable base ROE is 10.41 percent and the preliminary incentive cap on total ROE is 13.08 percent. If the results of the illustrative calculations were included in a final FERC order for each of the complaint periods, then a 10.41 percent base ROE and a 13.08 percent incentive cap would not have a significant impact on our financial statements for all of the complaint periods. These preliminary calculations are not binding and do not represent what we believe to be the most likely outcome of a final FERC order.
On November 21, 2019, FERC issued Opinion No. 569 affecting the two pending transmission ROE complaints against the Midcontinent ISO (MISO) transmission owners, in which FERC adopted a new methodology for determining base ROEs. Various parties sought rehearing. On December 23, 2019, the NETOs filed supplementary materials in the NETOs' four pending cases to respond to this new methodology because of the uncertainty of the applicability to the NETOs' cases. On May 21, 2020, the FERC issued its order in Opinion No. 569-A on the rehearing of the MISO transmission owners' cases, in which FERC again changed its methodology for determining the MISO transmission owners' base ROEs. On November 19, 2020, the FERC issued Opinion No. 569-B denying rehearing of Opinion No. 569-A and reaffirmed the methodology previously adopted in Opinion No. 569-A. The new methodology differs significantly from the methodology proposed by FERC in its October 16, 2018 order to determine the NETOs' base ROEs in its four pending cases. FERC Opinion Nos. 569-A and 569-B were appealed to the Court. On August 9, 2022, the Court issued its decision vacating MISO ROE FERC Opinion Nos. 569, 569-A and 569-B and remanded to FERC to reopen the proceedings. The Court found that FERC’s development of the new return methodology was arbitrary and capricious due to FERC’s failure to offer a reasonable explanation for its decision to reintroduce the risk-premium financial model in its new methodology for calculating a just and reasonable return. At this time, Eversource cannot predict how and when FERC will address the Court’s findings on the remand of the MISO FERC opinions or any potential associated impact on the NETOs’ four pending ROE complaint cases.
Given the significant uncertainty regarding the applicability of the FERC opinions in the MISO transmission owners’ two complaint cases to the NETOs’ pending four complaint cases, Eversource concluded that there is no reasonable basis for a change to the reserve or recognized ROEs for any of the complaint periods at this time. As well, Eversource cannot reasonably estimate a range of loss for any of the four complaint proceedings
at this time. Eversource, CL&P, NSTAR Electric and PSNH currently record revenues at the 10.57 percent base ROE and incentive cap at 11.74 percent established in the October 16, 2014 FERC order.
A change of 10 basis points to the base ROE used to establish the reserves would impact Eversource’s after-tax earnings by an average of approximately $3 million for each of the four 15-month complaint periods.
F. Eversource and NSTAR Electric Boston Harbor Civil Action
In 2016, the United States Attorney on behalf of the United States Army Corps of Engineers filed a civil action in the United States District Court for the District of Massachusetts against NSTAR Electric, HEEC, and the Massachusetts Water Resources Authority (together with NSTAR Electric and HEEC, the "Defendants"). The action alleged that the Defendants failed to comply with certain permitting requirements related to the placement of the HEEC-owned electric distribution cable beneath Boston Harbor. The parties reached a settlement pursuant to which HEEC agreed to install a new 115kV distribution cable across Boston Harbor to Deer Island, utilizing a different route, and remove portions of the existing cable. Construction of the new distribution cable was completed in August 2019 and removal of the portions of the existing cable was completed in January 2020.
On February 9, 2023, the parties filed a Voluntary Stipulation of Dismissal with Prejudice with the United States District Court for the District of Massachusetts whereby the parties agreed to dismiss all remaining claims, crossclaims and counterclaims with prejudice.
G. CL&P Regulatory Matters
CL&P Tropical Storm Isaias Response Investigation: On April 28, 2021, PURA issued a final decision on CL&P’s compliance with its emergency response plan that concluded CL&P failed to comply with certain storm performance standards and was imprudent in certain instances regarding its preparation for, and response to, Tropical Storm Isaias. Based on its findings, PURA ordered CL&P to adjust its future rates in a pending or future rate proceeding to reflect a monetary penalty in the form of a downward adjustment of 90 basis points in its allowed rate of return on equity (ROE), which is currently 9.25 percent. On July 14, 2021, PURA issued a final decision in a penalty proceeding that included an assessment of $28.6 million, consisting of a $28.4 million civil penalty for non-compliance with storm performance standards to be provided as credits on customer bills and a $0.2 million fine for violations of accident reporting requirements to be paid to the State of Connecticut’s general fund. The $28.4 million performance penalty was credited to customers on electric bills beginning on September 1, 2021 over a one-year period. The $28.4 million is the maximum statutory penalty amount under applicable Connecticut law in effect at the time of Tropical Storm Isaias, which is 2.5 percent of CL&P’s annual distribution revenues. The liability for the performance penalty was recorded as a current regulatory liability on CL&P’s balance sheet and as a reduction to Operating Revenues on the year ended December 31, 2021 statement of income.
CL&P Settlement Agreement: On October 1, 2021, CL&P entered into a settlement agreement with the DEEP, Office of Consumer Counsel, Office of the Attorney General and the Connecticut Industrial Energy Consumers, resolving certain issues that arose in then-pending regulatory proceedings initiated by PURA. PURA approved the settlement agreement on October 27, 2021. In the settlement agreement, CL&P agreed to provide a total of $65 million of customer credits, which were distributed based on customer sales over a two-month billing period from December 1, 2021 to January 31, 2022. CL&P also agreed to irrevocably set aside $10 million in a customer assistance fund to provide bill payment assistance to certain existing non-hardship and hardship customers carrying arrearages, as approved by PURA, with the objective of disbursing the funds prior to April 30, 2022. Those customers were provided with $10 million of bill forgiveness in the first quarter of 2022. CL&P recorded a current regulatory liability of $75 million on the balance sheet associated with the provisions of the settlement agreement, with a $65 million pre-tax charge as a reduction to Operating Revenues associated with the customer credits and a $10 million charge to Operations and Maintenance expense associated with the customer assistance fund on the year ended December 31, 2021 statement of income.
In exchange for the $75 million of customer credits and assistance, PURA’s interim rate reduction docket was resolved without findings. As a result of the settlement agreement, neither the 90 basis point reduction to CL&P’s return on equity introduced in PURA’s storm-related decision issued April 28, 2021, nor the 45 basis point reduction to CL&P’s return on equity included in PURA’s decision issued September 14, 2021 in the interim rate reduction docket, will be implemented. CL&P has also agreed to freeze its current base distribution rates, subject to the customer credits described above, until no earlier than January 1, 2024. The rate freeze appliesapplied only to base distribution rates (including storm costs) and not to other rate mechanisms such as the retail rate components, rate reconciling mechanisms, formula rates and any other adjustment mechanisms. The rate freeze also doesdid not apply to any cost recovery mechanism outside of the base distribution rates with regard to grid-modernization initiatives or any other proceedings that were either currently pending or that maycould be initiated during the rate freeze period, that may placecould have placed additional obligations on CL&P. The approval of the settlement agreement satisfiessatisfied the Connecticut statute of rate review requirements that requires electric utilities to file a distribution rate case within four years of the last rate case.
As part of the settlement agreement, CL&P agreed to withdraw with prejudice its pending appeals of PURA’s decisions dated April 28, 2021 and July 14, 2021 related to Storm Isaias and agreed to waive its right to file an appeal and seek a judicial stay of the September 14, 2021 decision in the interim rate reduction docket. The settlement agreement assures that CL&P will have the opportunity to petition for and demonstrate the prudency of the storm costs incurred to respond to customer outages associated with Storm Isaias in a future ratemaking proceeding.
The cumulative pre-tax impact of the settlement agreement and the Storm Isaias assessment imposed in PURA’s April 28, 2021 and July 14, 2021 decisions totaled $103.6 million, and the after-tax earnings impact was $86.1 million, or $0.25 per share, for the year ended December 31, 2021.
H.G. Litigation and Legal Proceedings
Eversource, including CL&P, NSTAR Electric and PSNH, are involved in legal, tax and regulatory proceedings regarding matters arising in the ordinary course of business, which involve management's assessment to determine the probability of whether a loss will occur and, if probable, its best estimate of probable loss. The Company records and discloses losses when these losses are probable and reasonably estimable, and discloses matters when losses are probable but not estimable or when losses are reasonably possible. Legal costs related to the defense of loss contingencies are expensed as incurred.
14. LEASES
Eversource, including CL&P, NSTAR Electric and PSNH, has entered into lease agreements as a lessee for the use of land, office space, service centers, vehicles, information technology, and equipment. These lease agreements are classified as either finance or operating leases and the liability and right-of-use asset are recognized on the balance sheet at lease commencement. Leases with an initial term of 12 months or less are not recorded on the balance sheet and are recognized as lease expense on a straight-line basis over the lease term.
Eversource determines whether or not a contract contains a lease based on whether or not it provides Eversource with the use of a specifically identified asset for a period of time, as well as both the right to direct the use of that asset and receive the significant economic benefits of the asset. Eversource has elected the practical expedient to not separate non-lease components from lease components and instead to account for both as a single lease component, with the exception of the information technology asset class where the lease and non-lease components are separated.
The provisions of Eversource, CL&P, NSTAR Electric and PSNH lease agreements contain renewal options. The renewal options range from one year to twenty years. The renewal period is included in the measurement of the lease liability if it is reasonably certain that Eversource will exercise these renewal options.
For leases entered into or modified after the January 1, 2019 implementation date of the leases standard under Topic 842, the discount rate utilized for classification and measurement purposes as of the inception date of the lease is based on each company's collateralized incremental interest rate to borrow over a comparable term for an individual lease because the rate implicit in the lease is not determinable.
CL&P and PSNH entered into certain contracts for the purchase of energy that qualify as leases. These contracts do not have minimum lease payments and therefore are not recognized as a lease liability on the balance sheet and are not reflected in the future minimum lease payments table below. Expense related to these contracts is included as variable lease cost in the table below. The expense and long-term obligation for these contracts are also included in Note 13B, "Commitments and Contingencies - Long-Term Contractual Arrangements," to the financial statements.
The components of lease cost, prior to amounts capitalized, are as follows:
| | Eversource | Eversource | For the Years Ended December 31, | Eversource | For the Years Ended December 31, |
| (Millions of Dollars) | (Millions of Dollars) | 2022 | | 2021 | | 2020 | (Millions of Dollars) | 2023 | | 2022 | | 2021 |
| Finance Lease Cost: | Finance Lease Cost: | | | | | |
| Amortization of Right-of-use-Assets | |
| Amortization of Right-of-use-Assets | |
| Amortization of Right-of-use-Assets | Amortization of Right-of-use-Assets | $ | 8.3 | | | $ | 4.6 | | | $ | 2.6 | |
| Interest on Lease Liabilities | Interest on Lease Liabilities | 2.0 | | | 3.9 | | | 1.4 | |
| Total Finance Lease Cost | Total Finance Lease Cost | 10.3 | | | 8.5 | | | 4.0 | |
| Operating Lease Cost | Operating Lease Cost | 11.6 | | | 12.2 | | | 11.1 | |
| Variable Lease Cost | Variable Lease Cost | 78.1 | | | 61.0 | | | 57.8 | |
| Total Lease Cost | Total Lease Cost | $ | 100.0 | | | $ | 81.7 | | | $ | 72.9 | |
| | | | For the Years Ended December 31, | | For the Years Ended December 31, |
| | | 2022 | | 2021 | | 2020 | | 2023 | | 2022 | | 2021 |
| (Millions of Dollars) | (Millions of Dollars) | CL&P | | NSTAR
Electric | | PSNH | | CL&P | | NSTAR
Electric | | PSNH | | CL&P | | NSTAR
Electric | | PSNH | (Millions of Dollars) | CL&P | | NSTAR
Electric | | PSNH | | CL&P | | NSTAR
Electric | | PSNH | | CL&P | | NSTAR
Electric | | PSNH |
| Finance Lease Cost: | Finance Lease Cost: | | | | | | | | | | | | | | | | | |
| Amortization of Right-of-use-Assets | Amortization of Right-of-use-Assets | $ | — | | | $ | 0.2 | | | $ | 0.1 | | | $ | 0.5 | | | $ | 0.2 | | | $ | 0.1 | | | $ | 0.7 | | | $ | 0.2 | | | $ | 0.1 | |
| Amortization of Right-of-use-Assets | |
| Amortization of Right-of-use-Assets | |
| Interest on Lease Liabilities | Interest on Lease Liabilities | — | | | 0.6 | | | — | | | 0.1 | | | 0.6 | | | — | | | 0.3 | | | 0.6 | | | — | |
| Total Finance Lease Cost | Total Finance Lease Cost | — | | | 0.8 | | | 0.1 | | | 0.6 | | | 0.8 | | | 0.1 | | | 1.0 | | | 0.8 | | | 0.1 | |
| Operating Lease Cost | Operating Lease Cost | 0.3 | | | 2.3 | | | 0.1 | | | 0.3 | | | 2.3 | | | 0.1 | | | 0.6 | | | 2.1 | | | 0.1 | |
| Variable Lease Cost | Variable Lease Cost | 25.6 | | | — | | | 52.5 | | | 16.2 | | | — | | | 44.8 | | | 12.2 | | | — | | | 45.6 | |
| Total Lease Cost | Total Lease Cost | $ | 25.9 | | | $ | 3.1 | | | $ | 52.7 | | | $ | 17.1 | | | $ | 3.1 | | | $ | 45.0 | | | $ | 13.8 | | | $ | 2.9 | | | $ | 45.8 | |
Operating lease cost, net of the capitalized portion, is included in Operations and Maintenance (or Purchased Power, Purchased Natural Gas and Transmission expense for transmission leases) on the statements of income. Amortization of finance lease assets is included in Depreciation on the statements of income. Interest expense on finance leases is included in Interest Expense on the statements of income.
Supplemental balance sheet information related to leases is as follows:
| | As of December 31, 2022 | | As of December 31, 2021 |
| | | As of December 31, 2023 | | | | | As of December 31, 2023 | | As of December 31, 2022 |
| (Millions of Dollars) | (Millions of Dollars) | Balance Sheet Classification | | Eversource | | CL&P | | NSTAR Electric | | PSNH | | Eversource | | CL&P | | NSTAR Electric | | PSNH | (Millions of Dollars) | Balance Sheet Classification | | Eversource | | CL&P | | NSTAR Electric | | PSNH | | Eversource | | CL&P | | NSTAR Electric | | PSNH |
| Operating Leases: | Operating Leases: | | | | | | | | | | | | | | | | | |
| Right-of-use-Assets, Net | Right-of-use-Assets, Net | Other Long-Term Assets | | $ | 56.9 | | | $ | 2.2 | | | $ | 22.5 | | | $ | — | | | $ | 47.2 | | | $ | 0.1 | | | $ | 24.3 | | | $ | 0.3 | |
| Right-of-use-Assets, Net | |
| Right-of-use-Assets, Net | |
| Operating Lease Liabilities | Operating Lease Liabilities | |
| Current Portion | |
| Current Portion | |
| Current Portion | Current Portion | Other Current Liabilities | | $ | 9.0 | | | $ | 0.6 | | | $ | 1.2 | | | $ | — | | | $ | 10.0 | | | $ | 0.1 | | | $ | 1.1 | | | $ | — | |
| Long-Term | Long-Term | Other Long-Term Liabilities | | 47.9 | | | 1.6 | | | 21.3 | | | — | | | 37.2 | | | — | | | 23.2 | | | 0.3 | |
| Total Operating Lease Liabilities | Total Operating Lease Liabilities | | $ | 56.9 | | | $ | 2.2 | | | $ | 22.5 | | | $ | — | | | $ | 47.2 | | | $ | 0.1 | | | $ | 24.3 | | | $ | 0.3 | |
| Finance Leases: | Finance Leases: | |
| Right-of-use-Assets, Net | Right-of-use-Assets, Net | Property, Plant and Equipment, Net | | $ | 54.5 | | | $ | — | | | $ | 3.2 | | | $ | — | | | $ | 58.0 | | | $ | — | | | $ | 3.3 | | | $ | 0.7 | |
| Right-of-use-Assets, Net | |
| Right-of-use-Assets, Net | |
| Finance Lease Liabilities | Finance Lease Liabilities | |
| Current Portion | |
| Current Portion | |
| Current Portion | Current Portion | Other Current Liabilities | | $ | 3.8 | | | $ | — | | | $ | — | | | $ | — | | | $ | 3.9 | | | $ | — | | | $ | — | | | $ | 0.1 | |
| Long-Term | Long-Term | Other Long-Term Liabilities | | 54.2 | | | — | | | 4.9 | | | — | | | 55.4 | | | — | | | 4.9 | | | 0.6 | |
| Total Finance Lease Liabilities | Total Finance Lease Liabilities | | $ | 58.0 | | | $ | — | | | $ | 4.9 | | | $ | — | | | $ | 59.3 | | | $ | — | | | $ | 4.9 | | | $ | 0.7 | |
The finance lease payments that NSTAR Electric will make over the next twelve months are entirely interest-related, due to escalating payments. As such, none of the finance lease payments over the next twelve months will reduce the finance lease liability.
Other information related to leases is as follows:
| | As of December 31, |
| 2022 | | 2021 |
| Eversource | | CL&P | | NSTAR Electric | | PSNH | | Eversource | | CL&P | | NSTAR Electric | | PSNH |
| As of December 31, | | | As of December 31, |
| 2023 | | | 2023 | | 2022 |
| Eversource | | | Eversource | | CL&P | | NSTAR Electric | | PSNH | | Eversource | | CL&P | | NSTAR Electric | | PSNH |
| Weighted-Average Remaining Lease Term (Years): | Weighted-Average Remaining Lease Term (Years): | | | | | | | | | | | | | | | |
| Operating Leases | |
| Operating Leases | |
| Operating Leases | Operating Leases | 11 | | 4 | | 17 | | — | | | 13 | | 7 | | 18 | | 7 |
| Finance Leases | Finance Leases | 15 | | — | | | 19 | | — | | | 16 | | — | | | 20 | | 7 |
| Weighted-Average Discount Rate (Percentage): | Weighted-Average Discount Rate (Percentage): | |
| Operating Leases | Operating Leases | 3.2 | % | | 3.8 | % | | 4.0 | % | | — | % | | 4.1 | % | | 3.0 | % | | 4.0 | % | | 3.7 | % |
| Operating Leases | |
| Operating Leases | | 4.0 | % | | 5.2 | % | | 4.2 | % | | 5.2 | % | | 3.2 | % | | 3.8 | % | | 4.0 | % | | — | % |
| Finance Leases | Finance Leases | 2.7 | % | | — | % | | 2.9 | % | | — | % | | 2.7 | % | | — | % | | 2.9 | % | | 3.5 | % | Finance Leases | 3.3 | % | | 5.3 | % | | 2.9 | % | | — | % | | 2.7 | % | | — | % | | 2.9 | % | | — | % |
| | | | | | | | | | | | | | | | | | | | | | | |
| (Millions of Dollars) | Eversource | | CL&P | | NSTAR Electric | | PSNH |
| For the Year Ended December 31, 2023 | | | | | | | |
| Cash Paid for Amounts Included in the Measurement of Lease Liabilities: | | | | | | | |
| Operating Cash Flows from Operating Leases | $ | 10.5 | | | $ | 0.7 | | | $ | 2.5 | | | $ | 0.4 | |
| Operating Cash Flows from Finance Leases | 2.0 | | | — | | | 0.6 | | | — | |
| Financing Cash Flows from Finance Leases | 3.9 | | | — | | | — | | | — | |
| Supplemental Non-Cash Information on Lease Liabilities: | | | | | | | |
| Right-of-use-Assets Obtained in Exchange for New Operating Lease Liabilities | 12.8 | | | 0.6 | | | 7.0 | | | 5.0 | |
| Right-of-use-Assets Obtained in Exchange for New Finance Lease Liabilities | 18.5 | | | 18.3 | | | — | | | — | |
| | | | | | | | | | | | | | | | | | | | | | | |
| (Millions of Dollars) | Eversource | | CL&P | | NSTAR Electric | | PSNH |
| For the Year Ended December 31, 2022 | | | | | | | |
| Cash Paid for Amounts Included in the Measurement of Lease Liabilities: | | | | | | | |
| Operating Cash Flows from Operating Leases | $ | 11.3 | | | $ | 0.3 | | | $ | 2.1 | | | $ | 0.1 | |
| Operating Cash Flows from Finance Leases | 2.0 | | | — | | | 0.6 | | | — | |
| Financing Cash Flows from Finance Leases | 3.9 | | | — | | | — | | | 0.1 | |
| Supplemental Non-Cash Information on Lease Liabilities: | | | | | | | |
| Right-of-use-Assets Obtained in Exchange for New Operating Lease Liabilities | 18.9 | | | 2.4 | | | — | | | — | |
| Right-of-use-Assets Obtained in Exchange for New Finance Lease Liabilities | 3.5 | | | — | | | — | | | — | |
| | | | | | | | | | | | | | | | | | | | | | | |
| (Millions of Dollars) | Eversource | | CL&P | | NSTAR Electric | | PSNH |
| For the Year Ended December 31, 2021 | | | | | | | |
| Cash Paid for Amounts Included in the Measurement of Lease Liabilities: | | | | | | | |
| Operating Cash Flows from Operating Leases | $ | 12.1 | | | $ | 0.3 | | | $ | 2.1 | | | $ | 0.1 | |
| Operating Cash Flows from Finance Leases | 3.4 | | | 0.1 | | | 0.6 | | | — | |
| Financing Cash Flows from Finance Leases | 4.1 | | | 1.4 | | | — | | | 0.1 | |
| Supplemental Non-Cash Information on Lease Liabilities: | | | | | | | |
| Right-of-use-Assets Obtained in Exchange for New Operating Lease Liabilities | 2.1 | | | — | | | 1.9 | | | — | |
| Right-of-use-Assets Obtained in Exchange for New Finance Lease Liabilities | 2.3 | | | — | | | — | | | — | |
| | (Millions of Dollars) | (Millions of Dollars) | Eversource | | CL&P | | NSTAR Electric | | PSNH | (Millions of Dollars) | Eversource | | CL&P | | NSTAR Electric | | PSNH |
| For the Year Ended December 31, 2020 | | | | | | | |
| For the Year Ended December 31, 2021 | |
| Cash Paid for Amounts Included in the Measurement of Lease Liabilities: | Cash Paid for Amounts Included in the Measurement of Lease Liabilities: | |
| Cash Paid for Amounts Included in the Measurement of Lease Liabilities: | |
| Cash Paid for Amounts Included in the Measurement of Lease Liabilities: | |
| Operating Cash Flows from Operating Leases | |
| Operating Cash Flows from Operating Leases | |
| Operating Cash Flows from Operating Leases | Operating Cash Flows from Operating Leases | $ | 10.9 | | | $ | 0.6 | | | $ | 1.8 | | | $ | 0.1 | |
| Operating Cash Flows from Finance Leases | Operating Cash Flows from Finance Leases | 1.7 | | | 0.3 | | | 0.6 | | | — | |
| Financing Cash Flows from Finance Leases | Financing Cash Flows from Finance Leases | 2.8 | | | 1.6 | | | — | | | 0.1 | |
| Supplemental Non-Cash Information on Lease Liabilities: | Supplemental Non-Cash Information on Lease Liabilities: | |
| Right-of-use-Assets Obtained in Exchange for New Operating Lease Liabilities | Right-of-use-Assets Obtained in Exchange for New Operating Lease Liabilities | 0.6 | | | 0.1 | | | 0.2 | | | — | |
| Right-of-use-Assets Obtained in Exchange for New Operating Lease Liabilities | |
| Right-of-use-Assets Obtained in Exchange for New Operating Lease Liabilities | |
| Right-of-use-Assets Obtained in Exchange for New Finance Lease Liabilities | Right-of-use-Assets Obtained in Exchange for New Finance Lease Liabilities | 0.7 | | | — | | | 0.3 | | | — | |
In 2020,As of December 31, 2023, lease agreements executed but not having yet commenced totaled $11.5 million for Eversource, also acquired $14.7$7 million offor CL&P and $4.5 million for NSTAR Electric. These amounts are not recorded as right-of-use assets in exchange for the assumption of newand operating lease liabilities and $54.2 millionas of December 31, 2023, but will be in 2024. Also in 2023, EGMA executed an early termination of an office space lease in connection with the purchase of the same facilities from the lessor, which reduced right-of-use assets in exchange for the assumptionoperating leases of new finance lease liabilities as a result of the CMA asset acquisition.Eversource by $7.5 million.
Future minimum lease payments, excluding variable costs, under long-term leases, as of December 31, 20222023 are as follows:
| | Operating Leases | | Finance Leases |
| Operating Leases | | | Operating Leases | | Finance Leases |
(Millions of Dollars) |
(Millions of Dollars) | Eversource | | CL&P | | NSTAR Electric | | Eversource | | NSTAR Electric |
(Millions of Dollars) | Eversource | | CL&P | | NSTAR Electric | PSNH | | Eversource | | CL&P | NSTAR Electric |
| Year Ending December 31, | Year Ending December 31, | | | | | | | | | |
| 2023 | $ | 10.3 | | | $ | 0.7 | | | $ | 2.1 | | | $ | 5.9 | | | $ | 0.6 | |
| 2024 | |
| 2024 | |
| 2024 | 2024 | 9.3 | | | 0.7 | | | 2.1 | | | 5.9 | | | 0.6 | |
| 2025 | 2025 | 6.4 | | | 0.7 | | | 1.7 | | | 5.9 | | | 0.6 | |
| 2026 | 2026 | 5.5 | | | 0.3 | | | 1.7 | | | 5.4 | | | 0.7 | |
| 2027 | 2027 | 5.2 | | | — | | | 1.7 | | | 5.4 | | | 0.7 | |
| 2028 | |
| Thereafter | Thereafter | 31.2 | | | — | | | 23.6 | | | 50.9 | | | 11.8 | |
| Future lease payments | Future lease payments | 67.9 | | | 2.4 | | | 32.9 | | | 79.4 | | | 15.0 | |
| Less amount representing interest | Less amount representing interest | 11.0 | | | 0.2 | | | 10.4 | | | 21.4 | | | 10.1 | |
| Present value of future minimum lease payments | Present value of future minimum lease payments | $ | 56.9 | | | $ | 2.2 | | | $ | 22.5 | | | $ | 58.0 | | | $ | 4.9 | |
15. FAIR VALUE OF FINANCIAL INSTRUMENTS
The following methods and assumptions were used to estimate the fair value of each of the following financial instruments:
Preferred Stock, Long-Term Debt and Rate Reduction Bonds: The fair value of CL&P's and NSTAR Electric's preferred stock is based upon pricing models that incorporate interest rates and other market factors, valuations or trades of similar securities and cash flow projections. The fair value of long-term debt and RRB debt securities is based upon pricing models that incorporate quoted market prices for those issues or similar issues adjusted for market conditions, credit ratings of the respective companies and treasury benchmark yields. The fair values provided in the table below are classified as Level 2 within the fair value hierarchy. Carrying amounts and estimated fair values are as follows:
| | | | Eversource | | CL&P | | NSTAR Electric | | PSNH | | Eversource | | CL&P | | NSTAR Electric | | PSNH |
| (Millions of Dollars) | (Millions of Dollars) | Carrying Amount | | Fair Value | | Carrying
Amount | | Fair
Value | | Carrying
Amount | | Fair
Value | | Carrying
Amount | | Fair
Value | (Millions of Dollars) | Carrying Amount | | Fair Value | | Carrying
Amount | | Fair
Value | | Carrying
Amount | | Fair
Value | | Carrying
Amount | | Fair
Value |
| As of December 31, 2022: | | | | | | | | | | | | | | | |
| As of December 31, 2023: | |
| Preferred Stock Not Subject to Mandatory Redemption | |
| Preferred Stock Not Subject to Mandatory Redemption | |
| Preferred Stock Not Subject to Mandatory Redemption | Preferred Stock Not Subject to Mandatory Redemption | $ | 155.6 | | | $ | 136.7 | | | $ | 116.2 | | | $ | 99.2 | | | $ | 43.0 | | | $ | 37.5 | | | $ | — | | | $ | — | |
| Long-Term Debt | Long-Term Debt | 21,044.1 | | | 18,891.3 | | | 4,216.5 | | | 3,828.3 | | | 4,425.1 | | | 4,091.8 | | | 1,164.6 | | | 970.5 | |
| Rate Reduction Bonds | Rate Reduction Bonds | 453.7 | | | 424.7 | | | — | | | — | | | — | | | — | | | 453.7 | | | 424.7 | |
| | As of December 31, 2021: | |
| As of December 31, 2022: | |
| As of December 31, 2022: | |
| As of December 31, 2022: | |
| Preferred Stock Not Subject to Mandatory Redemption | |
| Preferred Stock Not Subject to Mandatory Redemption | |
| Preferred Stock Not Subject to Mandatory Redemption | Preferred Stock Not Subject to Mandatory Redemption | $ | 155.6 | | | $ | 166.3 | | | $ | 116.2 | | | $ | 122.3 | | | $ | 43.0 | | | $ | 44.0 | | | $ | — | | | $ | — | |
| Long-Term Debt | Long-Term Debt | 18,216.7 | | | 19,636.3 | | | 4,215.4 | | | 4,848.9 | | | 3,985.4 | | | 4,453.5 | | | 1,163.8 | | | 1,220.6 | |
| Rate Reduction Bonds | Rate Reduction Bonds | 496.9 | | | 543.3 | | | — | | | — | | | — | | | — | | | 496.9 | | | 543.3 | |
Derivative Instruments and Marketable Securities: Derivative instruments and investments in marketable securities are carried at fair value. For further information, see Note 4, "Derivative Instruments," and Note 5, "Marketable Securities," to the financial statements.
See Note 1G, "Summary of Significant Accounting Policies – Fair Value Measurements," for the fair value measurement policy and the fair value hierarchy.
16. ACCUMULATED OTHER COMPREHENSIVE INCOME/(LOSS)
The changes in accumulated other comprehensive income/(loss) by component, net of tax, are as follows:
| | | | For the Year Ended December 31, 2022 | | For the Year Ended December 31, 2021 | | For the Year Ended December 31, 2023 | | For the Year Ended December 31, 2022 |
Eversource (Millions of Dollars) | Eversource (Millions of Dollars) | Qualified
Cash Flow
Hedging
Instruments | | Unrealized
Gains/(Losses)
on Marketable
Securities | | Defined
Benefit
Plans | | Total | | Qualified
Cash Flow
Hedging
Instruments | | Unrealized
Gains/(Losses)
on Marketable
Securities | | Defined
Benefit
Plans | | Total | Eversource (Millions of Dollars) | Qualified
Cash Flow
Hedging
Instruments | | Unrealized
Gains/(Losses)
on Marketable
Securities | | Defined
Benefit
Plans | | Total | | Qualified
Cash Flow
Hedging
Instruments | | Unrealized
Gains/(Losses)
on Marketable
Securities | | Defined
Benefit
Plans | | Total |
| Balance as of January 1st | Balance as of January 1st | $ | (0.4) | | | $ | 0.4 | | | $ | (42.3) | | | $ | (42.3) | | | $ | (1.4) | | | $ | 1.1 | | | $ | (76.1) | | | $ | (76.4) | |
| | OCI Before Reclassifications | OCI Before Reclassifications | — | | | (1.6) | | | (2.5) | | | (4.1) | | | — | | | (0.7) | | | 24.1 | | | 23.4 | |
| OCI Before Reclassifications | |
| OCI Before Reclassifications | |
| Amounts Reclassified from AOCI | Amounts Reclassified from AOCI | — | | | — | | | 7.0 | | | 7.0 | | | 1.0 | | | — | | | 9.7 | | | 10.7 | |
| Net OCI | Net OCI | — | | | (1.6) | | | 4.5 | | | 2.9 | | | 1.0 | | | (0.7) | | | 33.8 | | | 34.1 | |
| Balance as of December 31st | Balance as of December 31st | $ | (0.4) | | | $ | (1.2) | | | $ | (37.8) | | | $ | (39.4) | | | $ | (0.4) | | | $ | 0.4 | | | $ | (42.3) | | | $ | (42.3) | |
Defined benefit plan OCI amounts before reclassifications relate to actuarial gains and losses that arose during the year and were recognized in AOCI. The unamortized actuarial gains and losses and prior service costs on the defined benefit plans are amortized from AOCI into Other Income, Net over the average future employee service period, and are reflected in amounts reclassified from AOCI. The related tax effects of the defined benefit plan OCI amounts before reclassifications recognized in AOCI were net deferred tax assets of $4.9 million and $1.3 million in 2023 and $6.0 million in 2022, and 2020, respectively and were net deferred tax liabilities of $8.3 million in 2021.
The following table sets forth the amounts reclassified from AOCI by component and the impacted line item on the statements of income:
| | | | Amounts Reclassified from AOCI | | | | Amounts Reclassified from AOCI | | |
Eversource (Millions of Dollars) | Eversource (Millions of Dollars) | For the Years Ended December 31, | | Statements of Income
Line Item Impacted | Eversource (Millions of Dollars) | For the Years Ended December 31, | | Statements of Income
Line Item Impacted |
| 2022 | | 2021 | | 2020 | |
| Qualified Cash Flow Hedging Instruments | Qualified Cash Flow Hedging Instruments | $ | — | | | $ | (1.7) | | | $ | (2.5) | | | Interest Expense |
| Qualified Cash Flow Hedging Instruments | |
| Qualified Cash Flow Hedging Instruments | | $ | — | | | $ | — | | | $ | (1.7) | | | Interest Expense |
| Tax Effect | Tax Effect | — | | | 0.7 | | | 0.9 | | | Income Tax Expense | Tax Effect | — | | | — | | — | | | 0.7 | | 0.7 | | | Income Tax Expense | | Income Tax Expense |
| Qualified Cash Flow Hedging Instruments, Net of Tax | Qualified Cash Flow Hedging Instruments, Net of Tax | $ | — | | | $ | (1.0) | | | $ | (1.6) | | | | Qualified Cash Flow Hedging Instruments, Net of Tax | — | | | — | | — | | | (1.0) | | (1.0) | | | | | |
| | Unrealized Gains/(Losses) on Marketable Securities | |
| Unrealized Gains/(Losses) on Marketable Securities | |
| Unrealized Gains/(Losses) on Marketable Securities | | (1.6) | | | — | | | — | | | Other Income, Net |
| Tax Effect | | Tax Effect | 0.4 | | | — | | | — | | | Income Tax Expense |
| Unrealized Gains/(Losses) on Marketable Securities, Net of Tax | |
| | Defined Benefit Plan Costs: | |
| | Defined Benefit Plan Costs: | |
| | Defined Benefit Plan Costs: | Defined Benefit Plan Costs: | | | | | | | | | | | | |
| Amortization of Actuarial Losses | Amortization of Actuarial Losses | $ | (9.0) | | | $ | (13.1) | | | $ | (8.1) | | | Other Income, Net (1) | Amortization of Actuarial Losses | (7.0) | | | (9.0) | | (9.0) | | | (13.1) | | (13.1) | | | Other Income, Net (1) | | Other Income, Net (1) |
| Amortization of Prior Service Cost | Amortization of Prior Service Cost | (0.3) | | | — | | | (0.3) | | | Other Income, Net (1) | Amortization of Prior Service Cost | (0.3) | | | (0.3) | | (0.3) | | | — | | — | | | Other Income, Net (1) | | Other Income, Net (1) |
| Settlement Loss | | Settlement Loss | (12.4) | | | — | | | — | | | Other Income, Net (1) |
| Total Defined Benefit Plan Costs | Total Defined Benefit Plan Costs | (9.3) | | | (13.1) | | | (8.4) | | | | Total Defined Benefit Plan Costs | (19.7) | | | (9.3) | | (9.3) | | | (13.1) | | (13.1) | | | | | |
| Tax Effect | Tax Effect | 2.3 | | | 3.4 | | | 2.1 | | | Income Tax Expense | Tax Effect | 6.4 | | | 2.3 | | 2.3 | | | 3.4 | | 3.4 | | | Income Tax Expense | | Income Tax Expense |
| Defined Benefit Plan Costs, Net of Tax | Defined Benefit Plan Costs, Net of Tax | $ | (7.0) | | | $ | (9.7) | | | $ | (6.3) | | | | Defined Benefit Plan Costs, Net of Tax | (13.3) | | | (7.0) | | (7.0) | | | (9.7) | | (9.7) | | | | | |
| Total Amounts Reclassified from AOCI, Net of Tax | Total Amounts Reclassified from AOCI, Net of Tax | $ | (7.0) | | | $ | (10.7) | | | $ | (7.9) | | | | Total Amounts Reclassified from AOCI, Net of Tax | $ | (14.5) | | | $ | | $ | (7.0) | | | $ | | $ | (10.7) | | | | | |
(1) These amounts are included in the computation of net periodic Pension, SERP and PBOP costs. See Note 1K, "Summary of Significant Accounting Policies – Other Income, Net" and Note 11A, "Employee Benefits – Pension Benefits and Postretirement Benefits Other Than Pension," for further information.
17. DIVIDEND RESTRICTIONS
Eversource parent's ability to pay dividends may be affected by certain state statutes, the ability of its subsidiaries to pay common dividends and the leverage restriction tied to its consolidated total indebtedness to total capitalization ratio requirement in its revolving credit agreements. Pursuant to the joint revolving credit agreement of Eversource, CL&P, PSNH, NSTAR Gas, Yankee Gas, EGMA and Aquarion Water Company of Connecticut, and to the NSTAR Electric revolving credit agreement, Eversource is required to maintain consolidated total indebtedness to total capitalization ratio of no greater than 70 percent at the end of each fiscal quarter and each other company is required to maintain consolidated total indebtedness to total capitalization ratio of no greater than 65 percent at the end of each fiscal quarter. As of December 31, 2022,2023, all companies were in compliance with suchsuch covenant and in compliance with all such provisions of the revolving credit agreements that may restrict the payment of dividends as of December 31, 2022.2023.
The Retained Earnings balances subject to dividend restrictions were $5.53$4.14 billion for Eversource, $2.46$2.65 billion for CL&P, $2.92$3.14 billion for NSTAR Electric and $572.1$655.8 million for PSNH as of December 31, 2022.2023.
CL&P, NSTAR Electric and PSNH are subject to Section 305 of the Federal Power Act that makes it unlawful for a public utility to make or pay a dividend from any funds "properly included in its capital account." Management believes that this Federal Power Act restriction, as applied to CL&P, NSTAR Electric and PSNH, would not be construed or applied by the FERC to prohibit the payment of dividends from retained earnings for lawful and legitimate business purposes. In addition, certain state statutes may impose additional limitations on such companies and, including but not limited to, on NSTAR Gas, Yankee Gas, EGMA, Aquarion Water Company of Connecticut, Aquarion Water Company of Massachusetts and Aquarion Water Company of New Hampshire.Aquarion’s operating companies. Such state law restrictions do not restrict the payment of dividends from retained earnings or net income.
18. COMMON SHARES
The following table sets forth the Eversource parent common shares and the shares of common stock of CL&P, NSTAR Electric and PSNH that were authorized and issued, as well as the respective per share par values:
| | | | Shares | | Shares |
| | |
Par Value | | Authorized as of December 31, 2022 and 2021 | | Issued as of December 31, | |
Par Value | | Authorized as of December 31, | | Issued as of December 31, |
| 2022 | | 2021 | 2023 | | 2022 | 2023 | | 2022 |
| Eversource | Eversource | $ | 5 | | | 380,000,000 | | | 359,984,073 | | | 357,818,402 | |
| CL&P | CL&P | $ | 10 | | | 24,500,000 | | | 6,035,205 | | | 6,035,205 | |
| NSTAR Electric | NSTAR Electric | $ | 1 | | | 100,000,000 | | | 200 | | | 200 | |
| PSNH | PSNH | $ | 1 | | | 100,000,000 | | | 301 | | | 301 | |
Common Share Issuances and 2022 Equity Distribution Agreement: On May 11, 2022, Eversource entered into an equity distribution agreement pursuant to which it may offer and sell up to $1.2 billion of its common shares from time to time through an “at-the-market” (ATM) equity offering program. Eversource may issue and sell its common shares through its sales agents during the term of this agreement. Shares may be offered in transactions on the New York Stock Exchange, in the over-the-counter market, through negotiated transactions or otherwise. Sales may be made at either market prices prevailing at the time of sale, at prices related to such prevailing market prices or at negotiated prices. In 2023, no shares were issued under this agreement. In 2022, Eversource issued 2,165,671 common shares, which resulted in proceeds of $197.1 million, net of issuance costs. Eversource used the net proceeds received for general corporate purposes.
Treasury Shares: As of December 31, 20222023 and 2021,2022, there were 11,540,21810,443,807 and 13,415,20611,540,218 Eversource common shares held as treasury shares, respectively. As of December 31, 20222023 and 2021,2022, there were 348,443,855349,540,266 and 344,403,196348,443,855 Eversource common shares outstanding, respectively.
Acquisition of The Torrington Water Company: On October 3, 2022, Aquarion acquired The Torrington Water Company (TWC) following the receipt of all required approvals. The acquisition was structured as a stock-for-stock exchange, and Eversource issued 925,264 treasury shares at closing for a purchase price of $72.1 million.
Acquisition of New England Service Company: On December 1, 2021, Aquarion acquired New England Service Company (NESC), pursuant to a definitive agreement entered into on April 8, 2021. The acquisition was structured as a stock-for-stock merger and Eversource issued 462,517 treasury shares at closing for a purchase price of $38.1 million.
Eversource issues treasury shares to satisfy awards under the Company's incentive plans, shares issued under the dividend reinvestment and share purchase plan, and matching contributions under the Eversource 401k Plan. Eversource also issued treasury shares for its December 2021 and October 2022 water business acquisitions. The issuance of treasury shares represents a non-cash transaction, as the treasury shares were used to fulfill Eversource's obligations that require the issuance of common shares.
On May 3, 2023, shareholders voted to increase the authorized common shares from 380,000,000 shares to 410,000,000 shares.
19. PREFERRED STOCK NOT SUBJECT TO MANDATORY REDEMPTION
The CL&P and NSTAR Electric preferred stock is not subject to mandatory redemption and is presented as a noncontrolling interest of a subsidiary in Eversource's financial statements.
CL&P is authorized to issue up to 9,000,000 shares of preferred stock, par value $50 per share, and NSTAR Electric is authorized to issue 2,890,000 shares of preferred stock, par value $100 per share. Holders of preferred stock of CL&P and NSTAR Electric are entitled to receive cumulative dividends in preference to any payment of dividends on the common stock. Upon liquidation, holders of preferred stock of CL&P and NSTAR Electric are entitled to receive a liquidation preference before any distribution to holders of common stock in an amount equal to the par value of the preferred stock plus accrued and unpaid dividends. If the net assets were to be insufficient to pay the liquidation preference in full, then the net assets would be distributed ratably to all holders of preferred stock. The preferred stock of CL&P and NSTAR Electric is subject to optional redemption by the CL&P and NSTAR Electric Boards of Directors at any time.
Details of preferred stock not subject to mandatory redemption are as follows (in millions, except in redemption price and shares):
| | | |
| | | | | Redemption Price
Per Share | | Shares Outstanding as of December 31, | | As of December 31, | |
| Series | Series | | 2022 | | 2021 | | 2022 | | 2021 | |
| Series | |
| Series | |
| CL&P | |
| CL&P | |
| CL&P | CL&P | | | | | | | | | | | |
| $1.90 | $1.90 | Series of 1947 | | $ | 52.50 | | | 163,912 | | | 163,912 | | | $ | 8.2 | | | $ | 8.2 | | |
| $1.90 | |
| $1.90 | |
| $2.00 | |
| $2.00 | |
| $2.00 | $2.00 | Series of 1947 | | $ | 54.00 | | | 336,088 | | | 336,088 | | | 16.8 | | | 16.8 | | |
| $2.04 | $2.04 | Series of 1949 | | $ | 52.00 | | | 100,000 | | | 100,000 | | | 5.0 | | | 5.0 | | |
| $2.04 | |
| $2.04 | |
| $2.20 | |
| $2.20 | |
| $2.20 | $2.20 | Series of 1949 | | $ | 52.50 | | | 200,000 | | | 200,000 | | | 10.0 | | | 10.0 | | |
| 3.90% | 3.90% | Series of 1949 | | $ | 50.50 | | | 160,000 | | | 160,000 | | | 8.0 | | | 8.0 | | |
| 3.90% | |
| 3.90% | |
| $2.06 | |
| $2.06 | |
| $2.06 | $2.06 | Series E of 1954 | | $ | 51.00 | | | 200,000 | | | 200,000 | | | 10.0 | | | 10.0 | | |
| $2.09 | $2.09 | Series F of 1955 | | $ | 51.00 | | | 100,000 | | | 100,000 | | | 5.0 | | | 5.0 | | |
| $2.09 | |
| $2.09 | |
| 4.50% | |
| 4.50% | |
| 4.50% | 4.50% | Series of 1956 | | $ | 50.75 | | | 104,000 | | | 104,000 | | | 5.2 | | | 5.2 | | |
| 4.96% | 4.96% | Series of 1958 | | $ | 50.50 | | | 100,000 | | | 100,000 | | | 5.0 | | | 5.0 | | |
| 4.96% | |
| 4.96% | |
| 4.50% | |
| 4.50% | |
| 4.50% | 4.50% | Series of 1963 | | $ | 50.50 | | | 160,000 | | | 160,000 | | | 8.0 | | | 8.0 | | |
| 5.28% | 5.28% | Series of 1967 | | $ | 51.43 | | | 200,000 | | | 200,000 | | | 10.0 | | | 10.0 | | |
| 5.28% | |
| 5.28% | |
| $3.24 | |
| $3.24 | |
| $3.24 | $3.24 | Series G of 1968 | | $ | 51.84 | | | 300,000 | | | 300,000 | | | 15.0 | | | 15.0 | | |
| 6.56% | 6.56% | Series of 1968 | | $ | 51.44 | | | 200,000 | | | 200,000 | | | 10.0 | | | 10.0 | | |
| 6.56% | |
| 6.56% | |
| Total CL&P | |
| Total CL&P | |
| Total CL&P | Total CL&P | | | | 2,324,000 | | | 2,324,000 | | | $ | 116.2 | | | $ | 116.2 | | |
| NSTAR Electric | NSTAR Electric | | | | | | | | | | | |
| NSTAR Electric | |
| NSTAR Electric | |
| 4.25% | |
| 4.25% | |
| 4.25% | 4.25% | Series of 1956 | | $ | 103.625 | | | 180,000 | | | 180,000 | | | $ | 18.0 | | | $ | 18.0 | | |
| 4.78% | 4.78% | Series of 1958 | | $ | 102.80 | | | 250,000 | | | 250,000 | | | 25.0 | | | 25.0 | | |
| 4.78% | |
| 4.78% | |
| Total NSTAR Electric | |
| Total NSTAR Electric | |
| Total NSTAR Electric | Total NSTAR Electric | | | | 430,000 | | | 430,000 | | | $ | 43.0 | | | $ | 43.0 | | |
| Fair Value Adjustment due to Merger with NSTAR | Fair Value Adjustment due to Merger with NSTAR | | | | | | (3.6) | | | (3.6) | | |
| Fair Value Adjustment due to Merger with NSTAR | |
| Fair Value Adjustment due to Merger with NSTAR | |
| Other | |
| Other | |
| Other | Other | | |
| 6.00% | 6.00% | Series of 1958 | | $ | 100.00 | | | 23 | | | 23 | | | $ | — | | | $ | — | | |
| 6.00% | |
| 6.00% | |
| Total Eversource - Noncontrolling Interest - Preferred Stock of Subsidiaries | Total Eversource - Noncontrolling Interest - Preferred Stock of Subsidiaries | | $ | 155.6 | | | $ | 155.6 | | |
| Total Eversource - Noncontrolling Interest - Preferred Stock of Subsidiaries | |
| Total Eversource - Noncontrolling Interest - Preferred Stock of Subsidiaries | |
20. COMMON SHAREHOLDERS' EQUITY AND NONCONTROLLING INTERESTS
Dividends on the preferred stock of CL&P and NSTAR Electric totaled $7.5 million for each of the years ended December 31, 2023, 2022 2021 and 2020.2021. These dividends were presented as Net Income Attributable to Noncontrolling Interests on the Eversource statements of income. Noncontrolling Interest – Preferred Stock of Subsidiaries on the Eversource balance sheets totaled $155.6 million as of December 31, 20222023 and 2021.2022. On the Eversource balance sheets, Common Shareholders' Equity was fully attributable to Eversource parent and Noncontrolling Interest – Preferred Stock of Subsidiaries was fully attributable to the noncontrolling interest.
For the years ended December 31, 2023, 2022 2021 and 2020,2021, there was no change in ownership of the common equity of CL&P and NSTAR Electric.
21. EARNINGSEARNINGS/(LOSS) PER SHARE
Basic EPSearnings/(loss) per share is computed based upon the weighted average number of common shares outstanding during each period. Diluted EPSearnings/(loss) per share is computed on the basis of the weighted average number of common shares outstanding plus the potential dilutive effect of certain share-based compensation awards and the equity forward sale agreement, as if they were converted into outstanding common shares. The dilutive effect of unvested RSU and performance share awards as well as the equity forward sale agreement, is calculated using the treasury stock method. RSU and performance share awards are included in basic weighted average common shares outstanding as of the date that all necessary vesting conditions have been satisfied.
Earnings per share dilution related to the equity forward sale agreement was determined under the treasury stock method until settlement of the forward sale agreement. Under this method, the number of Eversource common shares used in calculating diluted EPS was deemed to be increased by the excess, if any, of the number of shares that would be issued upon physical settlement of the forward sale agreement less the number of shares that would be purchased by Eversource in the market (based on the average market price during the same reporting period) using the proceeds receivable upon settlement (based on the adjusted forward sale price at the end of that reporting period). Share dilution occurred when the average market price of Eversource's common shares was higher than the adjusted forward sale price. Eversource physically settled all remaining shares under the forward sale agreement as of March 26, 2020.
For the years ended December 31, 2023, 2022 and 2021, there were no antidilutive share awards excluded from the computation. For the year ended December 31, 2020, 39,560 antidilutive share awards were excluded from the EPS computation, as their impact would have been antidilutive. Antidilutive shares pertained to a purchase option extended to underwriters in connection with Eversource's June 2020 common share issuance.
The following table sets forth the components of basic and diluted EPS:earnings/(loss) per share:
| | | | | | | | | | | | | | | | | |
Eversource (Millions of Dollars, except share information) | For the Years Ended December 31, |
| 2022 | | 2021 | | 2020 |
| Net Income Attributable to Common Shareholders | $ | 1,404.9 | | | $ | 1,220.5 | | | $ | 1,205.2 | |
| Weighted Average Common Shares Outstanding: | | | | | |
| Basic | 346,783,444 | | | 343,972,926 | | | 338,836,147 | |
| Dilutive Effect of: | | | | | |
| Share-Based Compensation Awards and Other | 463,324 | | | 658,130 | | | 738,994 | |
| Equity Forward Sale Agreement | — | | | — | | | 271,921 | |
| Total Dilutive Effect | 463,324 | | | 658,130 | | | 1,010,915 | |
| Diluted | 347,246,768 | | | 344,631,056 | | | 339,847,062 | |
| Basic EPS | $ | 4.05 | | | $ | 3.55 | | | $ | 3.56 | |
| Diluted EPS | $ | 4.05 | | | $ | 3.54 | | | $ | 3.55 | |
| | | | | | | | | | | | | | | | | |
Eversource (Millions of Dollars, except share information) | For the Years Ended December 31, |
| 2023 | | 2022 | | 2021 |
| Net (Loss)/Income Attributable to Common Shareholders | $ | (442.2) | | | $ | 1,404.9 | | | $ | 1,220.5 | |
| Weighted Average Common Shares Outstanding: | | | | | |
| Basic | 349,580,638 | | | 346,783,444 | | | 343,972,926 | |
| Dilutive Effect | 259,843 | | | 463,324 | | | 658,130 | |
| Diluted | 349,840,481 | | | 347,246,768 | | | 344,631,056 | |
| Basic (Loss)/Earnings Per Common Share | $ | (1.27) | | | $ | 4.05 | | | $ | 3.55 | |
| Diluted (Loss)/Earnings Per Common Share | $ | (1.26) | | | $ | 4.05 | | | $ | 3.54 | |
22. REVENUES
Revenue is recognized when promised goods or services (referred to as performance obligations) are transferred to customers in an amount that reflects the consideration to which the company expects to be entitled in exchange for those goods or services. A five-step model is used for recognizing and measuring revenue from contracts with customers, which includes identifying the contract with the customer, identifying the performance obligations promised within the contract, determining the transaction price (the amount of consideration to which the company expects to be entitled), allocating the transaction price to the performance obligations and recognizing revenue when (or as) the performance obligation is satisfied.
The following tables present operating revenues disaggregated by revenue source:
| | For the Year Ended December 31, 2022 |
| For the Year Ended December 31, 2023 | | | For the Year Ended December 31, 2023 |
Eversource (Millions of Dollars) | Eversource (Millions of Dollars) | Electric
Distribution | | Natural Gas
Distribution | | Electric
Transmission | | Water Distribution | | Other | | Eliminations | | Total | Eversource (Millions of Dollars) | Electric
Distribution | | Natural Gas
Distribution | | Electric
Transmission | | Water Distribution | | Other | | Eliminations | | Total |
| Revenues from Contracts with Customers | Revenues from Contracts with Customers | | | | | | | | | | | | | |
| Retail Tariff Sales | Retail Tariff Sales | |
| Retail Tariff Sales | |
| Retail Tariff Sales | |
| Residential | |
| Residential | |
| Residential | Residential | $ | 4,796.1 | | | $ | 1,204.9 | | | $ | — | | | $ | 141.7 | | | $ | — | | | $ | — | | | $ | 6,142.7 | |
| Commercial | Commercial | 2,903.3 | | | 648.5 | | | — | | | 66.5 | | | — | | | (4.1) | | | 3,614.2 | |
| Industrial | Industrial | 374.9 | | | 199.7 | | | — | | | 4.7 | | | — | | | (20.1) | | | 559.2 | |
| Total Retail Tariff Sales Revenues | Total Retail Tariff Sales Revenues | 8,074.3 | | | 2,053.1 | | | — | | | 212.9 | | | — | | | (24.2) | | | 10,316.1 | |
| Wholesale Transmission Revenues | Wholesale Transmission Revenues | — | | | — | | | 1,700.5 | | | — | | | — | | | (1,264.5) | | | 436.0 | |
| Wholesale Market Sales Revenues | Wholesale Market Sales Revenues | 1,190.9 | | | 140.8 | | | — | | | 3.8 | | | — | | | — | | | 1,335.5 | |
| Other Revenues from Contracts with Customers | Other Revenues from Contracts with Customers | 72.3 | | | 5.6 | | | 14.1 | | | 8.4 | | | 1,435.5 | | | (1,425.3) | | | 110.6 | |
Amortization of/(Reserve for) Revenues
Subject to Refund | 72.0 | | | — | | | 0.7 | | | (0.7) | | | — | | | — | | | 72.0 | |
| Amortization of Revenues Subject to Refund | |
| Total Revenues from Contracts with Customers | Total Revenues from Contracts with Customers | 9,409.5 | | | 2,199.5 | | | 1,715.3 | | | 224.4 | | | 1,435.5 | | | (2,714.0) | | | 12,270.2 | |
| Alternative Revenue Programs | Alternative Revenue Programs | (15.4) | | | 14.8 | | | 92.7 | | | (2.5) | | | — | | | (84.3) | | | 5.3 | |
| Other Revenues | Other Revenues | 11.2 | | | 1.3 | | | 0.7 | | | 0.6 | | | — | | | — | | | 13.8 | |
| Total Operating Revenues | Total Operating Revenues | $ | 9,405.3 | | | $ | 2,215.6 | | | $ | 1,808.7 | | | $ | 222.5 | | | $ | 1,435.5 | | | $ | (2,798.3) | | | $ | 12,289.3 | |
| | For the Year Ended December 31, 2021 |
| For the Year Ended December 31, 2022 | | | For the Year Ended December 31, 2022 |
Eversource (Millions of Dollars) | Eversource (Millions of Dollars) | Electric
Distribution | | Natural Gas
Distribution | | Electric
Transmission | | Water Distribution | | Other | | Eliminations | | Total | Eversource (Millions of Dollars) | Electric
Distribution | | Natural Gas
Distribution | | Electric
Transmission | | Water Distribution | | Other | | Eliminations | | Total |
| Revenues from Contracts with Customers | Revenues from Contracts with Customers | | | | | | | | | | | | | |
| Retail Tariff Sales | Retail Tariff Sales | |
| Retail Tariff Sales | |
| Retail Tariff Sales | |
| Residential | |
| Residential | |
| Residential | Residential | $ | 3,989.8 | | | $ | 1,000.3 | | | $ | — | | | $ | 133.5 | | | $ | — | | | $ | — | | | $ | 5,123.6 | |
| Commercial | Commercial | 2,486.1 | | | 497.6 | | | — | | | 62.8 | | | — | | | (5.1) | | | 3,041.4 | |
| Industrial | Industrial | 345.3 | | | 167.2 | | | — | | | 4.3 | | | — | | | (17.1) | | | 499.7 | |
| Total Retail Tariff Sales Revenues | Total Retail Tariff Sales Revenues | 6,821.2 | | | 1,665.1 | | | — | | | 200.6 | | | — | | | (22.2) | | | 8,664.7 | |
| Wholesale Transmission Revenues | Wholesale Transmission Revenues | — | | | — | | | 1,751.3 | | | — | | | 86.6 | | | (1,384.7) | | | 453.2 | |
| Wholesale Market Sales Revenues | Wholesale Market Sales Revenues | 575.8 | | | 82.1 | | | — | | | 3.9 | | | — | | | — | | | 661.8 | |
| Other Revenues from Contracts with Customers | Other Revenues from Contracts with Customers | 78.1 | | | 5.1 | | | 13.6 | | | 7.5 | | | 1,267.4 | | | (1,257.7) | | | 114.0 | |
| Reserve for Revenues Subject to Refund | (71.1) | | | — | | | (5.0) | | | (2.6) | | | — | | | — | | | (78.7) | |
Amortization of/(Reserve for) Revenues
Subject to Refund | |
| Total Revenues from Contracts with Customers | Total Revenues from Contracts with Customers | 7,404.0 | | | 1,752.3 | | | 1,759.9 | | | 209.4 | | | 1,354.0 | | | (2,664.6) | | | 9,815.0 | |
| Alternative Revenue Programs | Alternative Revenue Programs | 14.7 | | | 37.0 | | | (126.1) | | | 1.5 | | | — | | | 114.6 | | | 41.7 | |
| Other Revenues | Other Revenues | 4.9 | | | 0.3 | | | 0.8 | | | 0.4 | | | — | | | — | | | 6.4 | |
| Total Operating Revenues | Total Operating Revenues | $ | 7,423.6 | | | $ | 1,789.6 | | | $ | 1,634.6 | | | $ | 211.3 | | | $ | 1,354.0 | | | $ | (2,550.0) | | | $ | 9,863.1 | |
| | For the Year Ended December 31, 2020 |
| For the Year Ended December 31, 2021 | | | For the Year Ended December 31, 2021 |
Eversource (Millions of Dollars) | Eversource (Millions of Dollars) | Electric
Distribution | | Natural Gas
Distribution | | Electric
Transmission | | Water Distribution | | Other | | Eliminations | | Total | Eversource (Millions of Dollars) | Electric
Distribution | | Natural Gas
Distribution | | Electric
Transmission | | Water Distribution | | Other | | Eliminations | | Total |
| Revenues from Contracts with Customers | Revenues from Contracts with Customers | | | | | | | | | | | | | |
| Retail Tariff Sales | Retail Tariff Sales | |
| Retail Tariff Sales | |
| Retail Tariff Sales | |
| Residential | |
| Residential | |
| Residential | Residential | $ | 3,951.5 | | | $ | 644.9 | | | $ | — | | | $ | 145.1 | | | $ | — | | | $ | — | | | $ | 4,741.5 | |
| Commercial | Commercial | 2,353.4 | | | 361.9 | | | — | | | 62.4 | | | — | | | (4.8) | | | 2,772.9 | |
| Industrial | Industrial | 327.1 | | | 107.4 | | | — | | | 4.8 | | | — | | | (13.7) | | | 425.6 | |
| Total Retail Tariff Sales Revenues | Total Retail Tariff Sales Revenues | 6,632.0 | | | 1,114.2 | | | — | | | 212.3 | | | — | | | (18.5) | | | 7,940.0 | |
| Wholesale Transmission Revenues | Wholesale Transmission Revenues | — | | | — | | | 1,557.3 | | | — | | | 74.2 | | | (1,290.6) | | | 340.9 | |
| Wholesale Market Sales Revenues | Wholesale Market Sales Revenues | 327.3 | | | 43.0 | | | — | | | 3.8 | | | — | | | — | | | 374.1 | |
| Other Revenues from Contracts with Customers | Other Revenues from Contracts with Customers | 79.3 | | | 5.7 | | | 13.3 | | | 3.5 | | | 1,161.7 | | | (1,152.0) | | | 111.5 | |
| Reserve for Revenues Subject to Refund | |
| Total Revenues from Contracts with Customers | Total Revenues from Contracts with Customers | 7,038.6 | | | 1,162.9 | | | 1,570.6 | | | 219.6 | | | 1,235.9 | | | (2,461.1) | | | 8,766.5 | |
| Alternative Revenue Programs | Alternative Revenue Programs | 88.1 | | | 44.7 | | | (35.2) | | | (4.7) | | | — | | | 37.1 | | | 130.0 | |
| Other Revenues | Other Revenues | 5.6 | | | 1.1 | | | 0.7 | | | 0.5 | | | — | | | — | | | 7.9 | |
| Total Operating Revenues | Total Operating Revenues | $ | 7,132.3 | | | $ | 1,208.7 | | | $ | 1,536.1 | | | $ | 215.4 | | | $ | 1,235.9 | | | $ | (2,424.0) | | | $ | 8,904.4 | |
| | For the Years Ended December 31, |
| 2022 | | 2021 | | 2020 |
| For the Years Ended December 31, | | | For the Years Ended December 31, |
| 2023 | | | 2023 | | 2022 | | 2021 |
| (Millions of Dollars) | (Millions of Dollars) | CL&P | | NSTAR Electric | | PSNH | | CL&P | | NSTAR Electric | | PSNH | | CL&P | | NSTAR Electric | | PSNH | (Millions of Dollars) | CL&P | | NSTAR Electric | | PSNH | | CL&P | | NSTAR Electric | | PSNH | | CL&P | | NSTAR Electric | | PSNH |
| Revenues from Contracts with Customers | Revenues from Contracts with Customers | | | | | | | | | | | | | | | | | |
| Retail Tariff Sales | Retail Tariff Sales | |
| Retail Tariff Sales | |
| Retail Tariff Sales | |
| Residential | |
| Residential | |
| Residential | Residential | $ | 2,397.2 | | | $ | 1,601.8 | | | $ | 797.1 | | | $ | 1,994.2 | | | $ | 1,375.8 | | | $ | 619.8 | | | $ | 2,011.1 | | | $ | 1,365.8 | | | $ | 574.6 | |
| Commercial | Commercial | 1,067.9 | | | 1,457.4 | | | 380.8 | | | 890.6 | | | 1,265.0 | | | 332.2 | | | 878.3 | | | 1,176.8 | | | 299.9 | |
| Industrial | Industrial | 146.4 | | | 135.8 | | | 92.7 | | | 131.4 | | | 119.1 | | | 94.8 | | | 137.5 | | | 106.4 | | | 83.2 | |
| Total Retail Tariff Sales Revenues | Total Retail Tariff Sales Revenues | 3,611.5 | | | 3,195.0 | | | 1,270.6 | | | 3,016.2 | | | 2,759.9 | | | 1,046.8 | | | 3,026.9 | | | 2,649.0 | | | 957.7 | |
| Wholesale Transmission Revenues | Wholesale Transmission Revenues | 755.1 | | | 670.4 | | | 275.0 | | | 863.3 | | | 616.3 | | | 271.7 | | | 754.8 | | | 576.5 | | | 226.0 | |
| Wholesale Market Sales Revenues | Wholesale Market Sales Revenues | 873.7 | | | 215.0 | | | 102.2 | | | 408.8 | | | 109.2 | | | 57.8 | | | 230.1 | | | 58.4 | | | 38.8 | |
Other Revenues from Contracts
with Customers | Other Revenues from Contracts
with Customers | 30.2 | | | 46.9 | | | 11.8 | | | 26.7 | | | 56.2 | | | 11.3 | | | 32.9 | | | 43.6 | | | 14.2 | |
Amortization of/(Reserve for) Revenues
Subject to Refund | Amortization of/(Reserve for) Revenues
Subject to Refund | 72.7 | | | — | | | — | | | (76.1) | | | — | | | — | | | — | | | — | | | 4.6 | |
Total Revenues from Contracts
with Customers | Total Revenues from Contracts
with Customers | 5,343.2 | | | 4,127.3 | | | 1,659.6 | | | 4,238.9 | | | 3,541.6 | | | 1,387.6 | | | 4,044.7 | | | 3,327.5 | | | 1,241.3 | |
| Alternative Revenue Programs | Alternative Revenue Programs | 56.5 | | | 0.7 | | | 20.1 | | | (78.9) | | | (15.1) | | | (17.4) | | | (4.2) | | | 54.5 | | | 2.6 | |
| Other Revenues | Other Revenues | 1.8 | | | 7.2 | | | 2.9 | | | 0.4 | | | 3.4 | | | 1.9 | | | 2.2 | | | 3.5 | | | 0.6 | |
| Eliminations | Eliminations | (583.8) | | | (552.1) | | | (207.8) | | | (523.0) | | | (473.5) | | | (194.9) | | | (495.2) | | | (444.4) | | | (165.4) | |
| Total Operating Revenues | Total Operating Revenues | $ | 4,817.7 | | | $ | 3,583.1 | | | $ | 1,474.8 | | | $ | 3,637.4 | | | $ | 3,056.4 | | | $ | 1,177.2 | | | $ | 3,547.5 | | | $ | 2,941.1 | | | $ | 1,079.1 | |
Retail Tariff Sales: Regulated utilities provide products and services to their regulated customers under rates, pricing, payment terms and conditions of service, regulated by each state regulatory agency. The arrangement whereby a utility provides commodity service to a customer for a price approved by the respective state regulatory commission is referred to as a tariff sale contract, and the tariff governs all aspects of the provision of regulated services by utilities. The majority of revenue for Eversource, CL&P, NSTAR Electric and PSNH is derived from regulated retail tariff sales for the sale and distribution of electricity, natural gas and water to residential, commercial and industrial retail customers.
The utility's performance obligation for the regulated tariff sales is to provide electricity, natural gas or water to the customer as demanded. The promise to provide the commodity represents a single performance obligation, as it is a promise to transfer a series of distinct goods or services that are substantially the same and that have the same pattern of transfer to the customer. Revenue is recognized over time as the customer simultaneously receives and consumes the benefits provided by the utility, and the utility satisfies its performance obligation. Revenue is recognized based on the output method as there is a directly observable output to the customer (electricity, natural gas or water units delivered to the customer and immediately consumed). Each Eversource utility is entitled to be compensated for performance completed to date (service taken by the customer) until service is terminated.
In regulated tariff sales, the transaction prices are the rates approved by the respective state regulatory commissions. In general, rates can only be changed through formal proceedings with the state regulatory commissions. These rates are designed to recover the costs to provide service to customers and include a return on investment. Regulatory commission-approved tracking mechanisms are included in these rates and are also used to recover, on a fully-reconciling basis, certain costs, such as the procurement of energy supply, retail transmission charges, energy efficiency program costs, net metering for distributed generation, and restructuring and stranded costs, among others. These tracking mechanisms result in rates being changed periodically to ensure recovery of actual costs incurred and the refund of any overcollection of costs.
CustomersElectric customers may elect to purchase electricity from each Eversource electric utility or may contract separately with a competitive third party supplier. Certain eligible natural gas customers may elect to purchase natural gas from each Eversource natural gas utility or may contract separately with a gas supply operator. Revenue is not recorded for the sale of the electricity or the natural gas commodity to customers who have contracted separately with these suppliers, only the delivery to a customer, as the utility is acting as an agent on behalf of the third party supplier.
Wholesale Transmission Revenues: The Eversource electric transmission-owning companies (CL&P, NSTAR Electric and PSNH) each own and maintain transmission facilities that are part of an interstate power transmission grid over which electricity is transmitted throughout New England. CL&P, NSTAR Electric and PSNH, as well as most other New England utilities, are parties to a series of agreements that provide for coordinated planning and operation of the region's transmission facilities and the rules by which they acquire transmission services. The Eversource electric transmission-owning companies have a combination of FERC-approved regional and local formula rates that work in tandem to recover all their transmission costs. These rates are part of the ISO-NE Tariff. Regional rates recover the costs of higher voltage transmission facilities that benefit the region and are collected from all New England transmission customers, including the Eversource distribution businesses. Eversource's local rates recover the costs of transmission facilities that do not provide a benefit to the region, and are collected from Eversource's distribution businesses and other transmission customers. The distribution businesses of Eversource, in turn, recover the FERC approved charges from retail customers through annual tracking mechanisms, which are retail tariff sales.
The utility's performance obligation for regulated wholesale transmission sales is to provide transmission services to the customer as demanded. The promise to provide transmission service represents a single performance obligation. The transaction prices are the transmission rate formulas as defined by the ISO-NE Tariff and are regulated and established by FERC. Wholesale transmission revenue is recognized over time as the performance obligation is completed, which occurs as transmission services are provided to customers. The revenue is recognized based on the output method. Each Eversource utility is entitled to be compensated for performance completed to date (e.g., use of the transmission system by the customer).
Wholesale Market Sales Revenues: Wholesale market sales transactions include sales of energy and energy-related products into the ISO-NE wholesale electricity market, sales of natural gas to third party marketers, and also the sale of RECs to various counterparties. ISO-NE oversees the region's wholesale electricity market and administers the transactions and terms and conditions, including payment terms, which are established in the ISO-NE tariff, between the buyers and sellers in the market. Pricing is set by the wholesale market. The wholesale transactions in the ISO-NE market occur on a day-ahead basis or a real-time basis (daily) and are, therefore, short-term. Transactions are tracked and reported by ISO-NE net by the hour, which is the net hourly position of energy sales and purchases by each market participant. The performance obligation for ISO-NE energy transactions is defined to be the net by hour transaction. Revenue is recognized when the performance obligation for these energy sales transactions is satisfied, which is when the sale occurs and the energy is transferred to the customer. For sales of natural gas, transportation, and natural gas pipeline capacity to third party marketers, revenue is recognized when the performance obligation is satisfied at the point in time the sale occurs and the natural gas or related product is transferred to the marketer. RECs are sold to various counterparties, and revenue is recognized when the performance obligation is satisfied upon transfer of title to the customer through the New England Power Pool Generation Information System. Wholesale transactions also include the sale of CL&P’s, NSTAR Electric’s and PSNH’s transmission rights associated with their proportionate equity ownership share in the transmission lines of the Hydro-Québec system in Canada.
Other Revenues from Contracts with Customers: Other revenues from contracts with customers primarily include property rentals that are not deemed leases. These revenues are generally recognized on a straight-line basis over time as the service is provided to the customer. Other revenues also include revenues from Eversource's service company, which is eliminated in consolidation.
Amortization of/(Reserve for) Revenues Subject to Refund: A reserve is recorded as a reduction to revenues when future refunds to customers are deemed probable. The reserve is reversed as refunds are provided to customers in rates. Amortization of Revenues Subject to Refund within the Electric Distribution segment in 2022 represents the reversal of a 2021 reserve at CL&P established to provide bill credits to customers as a result of the settlement agreement on October 1, 2021 and a storm performance penalty assessed by PURA. The reserve was reversed as customer credits were distributed to CL&P’s customers in retail electric rates. Total customer credits as a result of the 2021 settlement and civil penalty of $93.4 million were recorded as a reserve for revenues subject to refund within current regulatory liabilities and reflected as a reduction to Operating Revenues on the 2021 income statement. The settlement amount of $65 million was refunded over a two-month billing period from December 1, 2021 to January 31, 2022 and the civil penalty of $28.4 million was refunded over a one year billing period, which began September 1, 2021.
The Connecticut water business continues to record a regulatory liability and reduction to revenues to reflect the difference between the 35 percent federal corporate income tax rate included in base distribution rates charged to customers and the 21 percent federal corporate income tax rate currently effective. This reserve will continue until base distribution rates are updated to reflect the lower federal tax rate.
Alternative Revenue Programs: In accordance with accounting guidance for rate-regulated operations, certain of Eversource's utilities' rate making mechanisms qualify as alternative revenue programs (ARPs) if they meet specified criteria, in which case revenues may be recognized prior to billing based on allowed levels of collection in rates. Eversource's utility companies recognize revenue and record a regulatory asset or liability once the condition or event allowing for the automatic adjustment of future rates occurs. ARP revenues include both the recognition of the deferral adjustment to ARP revenues, when the regulator-specified condition or event allowing for additional billing or refund has occurred, and an equal and offsetting reversal of the ARP deferral to revenues as those amounts are reflected in the price of service in subsequent periods.
Eversource’s ARPs include the revenue decoupling mechanism, the annual reconciliation adjustment to transmission formula rates, and certain capital tracker mechanisms. Certain Eversource electric, natural gas and water companies, including CL&P and NSTAR Electric, have revenue decoupling mechanisms approved by a regulatory commission (decoupled companies). Decoupled companies’ distribution revenues are not directly based on sales volumes. The decoupled companies reconcile their annual base distribution rate recovery to pre-established levels of baseline distribution delivery service revenues, with any difference between the allowed level of distribution revenue and the actual amount realized adjusted through subsequent rates. The transmission formula rates provide for the annual reconciliation and recovery or refund of estimated costs to actual costs. The financial impacts of differences between actual and estimated costs are deferred for future recovery from, or refund to, transmission customers. This transmission deferral reconciles billed transmission revenues to the revenue requirement for our transmission businesses.
Other Revenues: Other Revenues include certain fees charged to customers that are not considered revenue from contracts with customers. Other revenues also include lease revenues under lessor accounting guidance of $4.6 million ($0.7 million at CL&P and $2.5 million at NSTAR Electric), $4.0 million ($0.8 million at CL&P and $2.5 million at NSTAR Electric), and $4.8 million, ($0.8 million at CL&P and $3.1 million at NSTAR Electric), and $4.3 million, ($0.8 million at CL&P and $2.7 million at NSTAR Electric) for the years ended December 31, 2023, 2022 2021 and 2020,2021, respectively.
Intercompany Eliminations: Intercompany eliminations are primarily related to the Eversource electric transmission revenues that are derived from ISO-NE regional transmission charges to the distribution businesses of CL&P, NSTAR Electric and PSNH that recover the costs of the wholesale transmission business, and revenues from Eversource's service company. Intercompany revenues and expenses between the Eversource wholesale transmission businesses and the Eversource distribution businesses and from Eversource's service company are eliminated in consolidation and included in "Eliminations" in the tables above.
Receivables: Receivables, Net on the balance sheet primarily includes trade receivables from retail customers and customers related to wholesale transmission contracts, wholesale market sales, sales of RECs, and property rentals. In general, retail tariff customers and wholesale transmission customers are billed monthly and the payment terms are generally due and payable upon receipt of the bill.
Unbilled Revenues: Unbilled Revenues on the balance sheet represent estimated amounts due from retail customers for electricity, natural gas or water delivered to customers but not yet billed. The utility company has satisfied its performance obligation and the customer has received and consumed the commodity as of the balance sheet date, and therefore, the utility company records revenue for those services in the period the services were provided. Only the passage of time is required before the company is entitled to payment for the satisfaction of the performance obligation. Payment from customers is due monthly as services are rendered and amounts are billed. Actual amounts billed to customers when meter readings become available may vary from the estimated amount.
Unbilled revenues are recognized by allocating estimated unbilled sales volumes to the respective customer classes, and then applying an estimated rate by customer class to those sales volumes. Unbilled revenue estimates reflect seasonality, weather, customer usage patterns, customer rates in effect for customer classes, and the timing of customer billing. The companies that have a decoupling mechanism record a regulatory deferral to reflect the actual allowed amount of revenue associated with their respective decoupled distribution rate design.
Practical Expedients: Eversource has elected practical expedients in the accounting guidance that allow the company to record revenue in the amount that the company has a right to invoice, if that amount corresponds directly with the value to the customer of the company's performance to date, and not to disclose related unsatisfied performance obligations. Retail and wholesale transmission tariff sales fall into this category, as these sales are recognized as revenue in the period the utility provides the service and completes the performance obligation, which is the same as the monthly amount billed to customers. There are no other material revenue streams for which Eversource has unsatisfied performance obligations.
23. SEGMENT INFORMATION
Eversource is organized into the Electric Distribution, Electric Transmission, Natural Gas Distribution and Water Distribution reportable segments and Other based on a combination of factors, including the characteristics of each segments' services, the sources of operating revenues and expenses and the regulatory environment in which each segment operates. These reportable segments represent substantially all of Eversource's total consolidated revenues. Revenues from the sale of electricity, natural gas and water primarily are derived from residential, commercial and industrial customers and are not dependent on any single customer. The Electric Distribution reportable segment includes the results of NSTAR Electric's solar power facilities. Eversource's reportable segments are determined based upon the level at which Eversource's chief operating decision maker assesses performance and makes decisions about the allocation of company resources.
The remainder of Eversource's operations is presented as Other in the tables below and primarily consists of 1) the equity in earnings of Eversource parent from its subsidiaries and intercompany interest income, both of which are eliminated in consolidation, and interest expense related to the debt of Eversource parent, 2) the revenues and expenses of Eversource Service, most of which are eliminated in consolidation, 3) the operations of CYAPC and YAEC, 4) the results of other unregulated subsidiaries, which are not part of its core business, and 5) Eversource parent's equity ownership interests that are not consolidated, which primarily include the offshore wind business, a natural gas pipeline owned by Enbridge, Inc., and a renewable energy investment fund.fund that was liquidated in 2023.
In the ordinary course of business, Yankee Gas, NSTAR Gas and EGMA purchase natural gas transmission services from the Enbridge, Inc. natural gas pipeline project described above. These affiliate transaction costs total $77.7 million annually and are classified as Purchased Power, Purchased Natural Gas and Transmission on the Eversource statements of income.
Each of Eversource's subsidiaries, including CL&P, NSTAR Electric and PSNH, has one reportable segment.
Cash flows used for investments in plant included in the segment information below are cash capital expenditures that do not include amounts incurred on capital projects but not yet paid, cost of removal, AFUDC related to equity funds, and the capitalized and deferred portions of pension and PBOP income/expense.
Eversource's segment information is as follows:
| | | | For the Year Ended December 31, 2022 | | For the Year Ended December 31, 2023 |
Eversource (Millions of Dollars) | Eversource (Millions of Dollars) | Electric
Distribution | | Natural Gas
Distribution | | Electric Transmission | | Water Distribution | | Other | | Eliminations | | Total | Eversource (Millions of Dollars) | Electric
Distribution | | Natural Gas
Distribution | | Electric Transmission | | Water Distribution | | Other | | Eliminations | | Total |
| Operating Revenues | Operating Revenues | $ | 9,405.3 | | | $ | 2,215.6 | | | $ | 1,808.7 | | | $ | 222.5 | | | $ | 1,435.5 | | | $ | (2,798.3) | | | $ | 12,289.3 | |
| Depreciation and Amortization | Depreciation and Amortization | (970.4) | | | (157.6) | | | (337.4) | | | (50.9) | | | (132.6) | | | 5.8 | | | (1,643.1) | |
| Other Operating Expenses | Other Operating Expenses | (7,663.7) | | | (1,727.0) | | | (548.4) | | | (111.8) | | | (1,189.1) | | | 2,792.0 | | | (8,448.0) | |
| Operating Income | Operating Income | 771.2 | | | 331.0 | | | 922.9 | | | 59.8 | | | 113.8 | | | (0.5) | | | 2,198.2 | |
| Interest Expense | Interest Expense | (253.1) | | | (71.4) | | | (145.5) | | | (34.7) | | | (247.8) | | | 74.2 | | | (678.3) | |
| Impairments of Offshore Wind Investments | |
| Interest Income | Interest Income | 45.1 | | | 10.2 | | | 0.5 | | | — | | | 66.3 | | | (71.6) | | | 50.5 | |
| Other Income, Net | 180.4 | | | 33.6 | | | 37.9 | | | 8.5 | | | 1,600.8 | | | (1,565.6) | | | 295.6 | |
| Other Income/(Loss), Net | |
| Income Tax (Expense)/Benefit | Income Tax (Expense)/Benefit | (146.2) | | | (69.2) | | | (216.3) | | | 3.2 | | | (25.1) | | | — | | | (453.6) | |
| Net Income | 597.4 | | | 234.2 | | | 599.5 | | | 36.8 | | | 1,508.0 | | | (1,563.5) | | | 1,412.4 | |
| Net Income/(Loss) | |
| Net Income Attributable to Noncontrolling Interests | Net Income Attributable to Noncontrolling Interests | (4.6) | | | — | | | (2.9) | | | — | | | — | | | — | | | (7.5) | |
| Net Income Attributable to Common Shareholders | $ | 592.8 | | | $ | 234.2 | | | $ | 596.6 | | | $ | 36.8 | | | $ | 1,508.0 | | | $ | (1,563.5) | | | $ | 1,404.9 | |
Net Income/(Loss) Attributable to
Common Shareholders | |
| Total Assets (as of) | Total Assets (as of) | $ | 27,365.0 | | | $ | 8,084.9 | | | $ | 13,369.5 | | | $ | 2,783.8 | | | $ | 26,365.2 | | | $ | (24,737.5) | | | $ | 53,230.9 | |
| Cash Flows Used for Investments in Plant | Cash Flows Used for Investments in Plant | $ | 1,172.6 | | | $ | 710.3 | | | $ | 1,144.0 | | | $ | 154.4 | | | $ | 260.6 | | | $ | — | | | $ | 3,441.9 | |
| | | | For the Year Ended December 31, 2021 | | For the Year Ended December 31, 2022 |
Eversource (Millions of Dollars) | Eversource (Millions of Dollars) | Electric
Distribution | | Natural Gas
Distribution | | Electric
Transmission | | Water Distribution | | Other | | Eliminations | | Total | Eversource (Millions of Dollars) | Electric
Distribution | | Natural Gas
Distribution | | Electric
Transmission | | Water Distribution | | Other | | Eliminations | | Total |
| Operating Revenues | Operating Revenues | $ | 7,423.6 | | | $ | 1,789.6 | | | $ | 1,634.6 | | | $ | 211.3 | | | $ | 1,354.0 | | | $ | (2,550.0) | | | $ | 9,863.1 | |
| Depreciation and Amortization | Depreciation and Amortization | (737.8) | | | (142.3) | | | (300.3) | | | (46.1) | | | (113.1) | | | 4.6 | | | (1,335.0) | |
| Other Operating Expenses | Other Operating Expenses | (5,970.0) | | | (1,345.4) | | | (496.2) | | | (101.4) | | | (1,170.4) | | | 2,548.6 | | | (6,534.8) | |
| Operating Income | Operating Income | 715.8 | | | 301.9 | | | 838.1 | | | 63.8 | | | 70.5 | | | 3.2 | | | 1,993.3 | |
| Interest Expense | Interest Expense | (236.4) | | | (58.6) | | | (133.2) | | | (32.0) | | | (168.8) | | | 46.6 | | | (582.4) | |
| Interest Income | Interest Income | 20.7 | | | 4.5 | | | 2.2 | | | — | | | 46.0 | | | (47.8) | | | 25.6 | |
| Other Income, Net | Other Income, Net | 78.1 | | | 17.9 | | | 19.8 | | | 3.3 | | | 1,363.9 | | | (1,347.3) | | | 135.7 | |
| Income Tax (Expense)/Benefit | Income Tax (Expense)/Benefit | (103.5) | | | (60.9) | | | (179.4) | | | 1.7 | | | (2.1) | | | — | | | (344.2) | |
| Net Income | Net Income | 474.7 | | | 204.8 | | | 547.5 | | | 36.8 | | | 1,309.5 | | | (1,345.3) | | | 1,228.0 | |
| Net Income Attributable to Noncontrolling Interests | Net Income Attributable to Noncontrolling Interests | (4.6) | | | — | | | (2.9) | | | — | | | — | | | — | | | (7.5) | |
| Net Income Attributable to Common Shareholders | Net Income Attributable to Common Shareholders | $ | 470.1 | | | $ | 204.8 | | | $ | 544.6 | | | $ | 36.8 | | | $ | 1,309.5 | | | $ | (1,345.3) | | | $ | 1,220.5 | |
| Total Assets (as of) | Total Assets (as of) | $ | 25,411.2 | | | $ | 7,215.9 | | | $ | 12,377.8 | | | $ | 2,551.1 | | | $ | 22,674.7 | | | $ | (21,738.6) | | | $ | 48,492.1 | |
| Cash Flows Used for Investments in Plant | Cash Flows Used for Investments in Plant | $ | 1,053.3 | | | $ | 721.1 | | | $ | 1,024.1 | | | $ | 137.2 | | | $ | 239.4 | | | $ | — | | | $ | 3,175.1 | |
| | | | For the Year Ended December 31, 2020 | | For the Year Ended December 31, 2021 |
Eversource
(Millions of Dollars) | Eversource
(Millions of Dollars) | Electric
Distribution | | Natural Gas
Distribution | | Electric
Transmission | | Water Distribution | | Other | | Eliminations | | Total | Eversource
(Millions of Dollars) | Electric
Distribution | | Natural Gas
Distribution | | Electric
Transmission | | Water Distribution | | Other | | Eliminations | | Total |
| Operating Revenues | Operating Revenues | $ | 7,132.3 | | | $ | 1,208.7 | | | $ | 1,536.1 | | | $ | 215.4 | | | $ | 1,235.9 | | | $ | (2,424.0) | | | $ | 8,904.4 | |
| Depreciation and Amortization | Depreciation and Amortization | (657.0) | | | (87.9) | | | (278.1) | | | (44.2) | | | (93.5) | | | 1.6 | | | (1,159.1) | |
| Other Operating Expenses | Other Operating Expenses | (5,642.3) | | | (913.8) | | | (470.0) | | | (86.6) | | | (1,071.9) | | | 2,428.0 | | | (5,756.6) | |
| Operating Income | Operating Income | 833.0 | | | 207.0 | | | 788.0 | | | 84.6 | | | 70.5 | | | 5.6 | | | 1,988.7 | |
| Interest Expense | Interest Expense | (216.0) | | | (40.0) | | | (126.8) | | | (32.9) | | | (161.0) | | | 38.3 | | | (538.4) | |
| Interest Income | Interest Income | 3.2 | | | 0.9 | | | 4.7 | | | — | | | 37.8 | | | (41.8) | | | 4.8 | |
| Other Income, Net | Other Income, Net | 58.0 | | | 3.1 | | | 23.3 | | | 2.0 | | | 1,382.9 | | | (1,365.5) | | | 103.8 | |
| Income Tax (Expense)/Benefit | Income Tax (Expense)/Benefit | (129.6) | | | (36.9) | | | (183.8) | | | (12.5) | | | 16.6 | | | — | | | (346.2) | |
| Net Income | Net Income | 548.6 | | | 134.1 | | | 505.4 | | | 41.2 | | | 1,346.8 | | | (1,363.4) | | | 1,212.7 | |
| Net Income Attributable to Noncontrolling Interests | Net Income Attributable to Noncontrolling Interests | (4.6) | | | — | | | (2.9) | | | — | | | — | | | — | | | (7.5) | |
| Net Income Attributable to Common Shareholders | Net Income Attributable to Common Shareholders | $ | 544.0 | | | $ | 134.1 | | | $ | 502.5 | | | $ | 41.2 | | | $ | 1,346.8 | | | $ | (1,363.4) | | | $ | 1,205.2 | |
| Cash Flows Used for Investments in Plant | Cash Flows Used for Investments in Plant | $ | 1,079.0 | | | $ | 494.4 | | | $ | 1,004.6 | | | $ | 118.8 | | | $ | 246.2 | | | $ | — | | | $ | 2,943.0 | |
24. ACQUISITION OF ASSETS OF COLUMBIA GAS OF MASSACHUSETTS
On October 9, 2020, Eversource acquired certain assets and liabilities that comprised the NiSource Inc. (NiSource) natural gas distribution business in Massachusetts, which was previously doing business as Columbia Gas of Massachusetts (CMA), pursuant to an asset purchase agreement (the Agreement) entered into on February 26, 2020 between Eversource and NiSource. The cash purchase price was $1.1 billion, plus a working capital amount of $68.6 million, as finalized in 2021. Eversource financed the acquisition through a combination of debt and equity issuances in a ratio that was consistent with its consolidated capital structure.
Pro Forma Financial Information: The following unaudited pro forma financial information reflects the pro forma combined results of operations of Eversource and the CMA business acquired and reflects the amortization of purchase price adjustments assuming the acquisition had taken place on January 1, 2019. The unaudited pro forma financial information has been presented for illustrative purposes only and is not necessarily indicative of the consolidated results of operations that would have been achieved or the future consolidated results of operations of Eversource. Pro forma net income excludes the impact of assets and liabilities not assumed by Eversource and non-recurring costs associated with the transaction.
| | | | | | |
(Pro forma amounts in millions, except share amounts) | For the Year Ended
December 31, 2020 | |
Operating Revenues | $ | 9,273 | | |
Net Income Attributable to Common Shareholders | 1,265 | | |
Basic EPS | 3.73 | | |
Diluted EPS | 3.72 | | |
Revenues and Net Income: The impact of CMA on Eversource's accompanying consolidated statement of income included operating revenues of $154.8 million and net income attributable to common shareholders of $13.9 million for the year ended December 31, 2020.
Transactions recognized separately from the business combination: Eversource entered into Transition Services Agreements (TSAs) with NiSource, under which NiSource provided certain administrative functions. The TSAs were completed in 2022. Eversource recorded $7.9 million and $21.4 million in Operating Expenses on the statements of income related to TSA costs for the years ended December 31, 2022 and 2021, respectively, and $15.9 million of TSA and pre-TSA costs in Operating Expenses in 2020. In addition, Eversource recorded $2.0 million in Energy Efficiency expense related to the implementation of new energy efficiency programs as specified in a DPU-approved rate settlement agreement in the fourth quarter of 2020.
25. GOODWILL
In a business combination, the excess of the purchase price over the estimated fair values of the assets acquired and liabilities assumed
is recognized as goodwill. The following table presents Eversource’s goodwill by reportable segment:
| | (Millions of Dollars) | (Millions of Dollars) | Electric
Distribution | | Electric
Transmission | | Natural Gas
Distribution | | Water
Distribution | | Total | (Millions of Dollars) | Electric
Distribution | | Electric
Transmission | | Natural Gas
Distribution | | Water
Distribution | | Total |
| Balance as of January 1, 2021 | $ | 2,543.6 | | | $ | 576.8 | | | $ | 441.4 | | | $ | 884.2 | | | $ | 4,446.0 | |
| CMA Measurement Period Adjustments | — | | | — | | | 9.6 | | | — | | | 9.6 | |
| Acquisition of NESC | — | | | — | | | — | | | 21.7 | | | 21.7 | |
| Balance as of December 31, 2021 | $ | 2,543.6 | | | $ | 576.8 | | | $ | 451.0 | | | $ | 905.9 | | | $ | 4,477.3 | |
| Balance as of January 1, 2022 | |
| NESC Measurement Period Adjustments | NESC Measurement Period Adjustments | — | | | — | | | — | | | 0.5 | | | 0.5 | |
| Acquisition of TWC | Acquisition of TWC | — | | | — | | | — | | | 44.8 | | | 44.8 | |
| Balance as of December 31, 2022 | Balance as of December 31, 2022 | $ | 2,543.6 | | | $ | 576.8 | | | $ | 451.0 | | | $ | 951.2 | | | $ | 4,522.6 | |
| Water Acquisitions | |
| Balance as of December 31, 2023 | |
Eversource completed the acquisition of TWC on October 3, 2022, resulting in the addition of $44.8 million of goodwill, all of which was allocated to the Water Distribution reporting unit. Eversource completed the acquisition of NESC on December 1, 2021, resulting in the addition of $22.2 million of goodwill, which included measurement period increases in 2022 totaling $0.5 million. The goodwill was allocated to the Water Distribution reporting unit. Eversource completed the CMA asset acquisition on October 9, 2020,two water acquisitions in 2023, resulting in the addition of $51.9 million of goodwill, which included measurement period adjustments in 2021 resulting in an additional $9.6$9.5 million of goodwill. The goodwill was allocated to the Natural GasWater Distribution reporting unit. For further information on the acquisitions of TWC and NESC, see Note 18, “Common Shares,” to the financial statements.
Goodwill is evaluated for impairment at least annually and more frequently if indicators of impairment arise. In accordance with the accounting standards, if the fair value of a reporting unit is less than its carrying value (including goodwill), the goodwill is tested for impairment. Goodwill is not subject to amortization, however is subject to a fair value based assessment for impairment at least annually and whenever facts or circumstances indicate that there may be an impairment. A resulting write-down, if any, would be charged to Operating Expenses.
In assessing goodwill for impairment, an entity is permitted to first assess qualitatively whether it is more likely than not that goodwill impairment exists as of the annual impairment test date. A quantitative impairment test is required only if it is concluded that it is more likely than not that a reporting unit’s fair value is less than it’s carrying amount. The annual goodwill assessment included a qualitative evaluation of multiple factors that impact the fair value of the reporting units, including general, macroeconomic and market conditions, and entity-specific assumptions that affect the future cash flows of the reporting units. Key considerations include discount rates, utility sector market performance and merger transaction multiples, the Company's share price and credit ratings, analyst reports, financial performance, cost and risk factors, internal estimates and projections of future cash flows and net income, long-term strategy, the timing and outcome of rate cases, and recent regulatory and legislative proceedings.
Eversource's reporting units for the purpose of testing goodwill are Electric Distribution, Electric Transmission, Natural Gas Distribution and Water Distribution. These reporting units are consistent with the operating segments underlying the reportable segments identified in Note 23, "Segment Information," to the financial statements.
Eversource completed its annual goodwill impairment assessment for the Electric Distribution, Electric Transmission, Natural Gas Distribution and Water Distribution reporting units as of October 1, 20222023 and determined that no impairment existed. There were no events subsequent to October 1, 20222023 that indicated impairment of goodwill.
Item 9. Changes in and Disagreements with Accountants on Accounting and Financial Disclosure
No events that would be described in response to this item have occurred with respect to Eversource, CL&P, NSTAR Electric or PSNH.
Item 9A. Controls and Procedures
Management, on behalf of Eversource, CL&P, NSTAR Electric and PSNH, is responsible for the preparation, integrity, and fair presentation of the accompanying Financial Statements and other sections of this combined Annual Report on Form 10-K. Eversource's internal controls over financial reporting were audited by Deloitte & Touche LLP.
Management, on behalf of Eversource, CL&P, NSTAR Electric and PSNH, is responsible for establishing and maintaining adequate internal controls over financial reporting. The internal control framework and processes have been designed to provide reasonable assurance regarding the reliability of financial reporting and the preparation of financial statements for external purposes in accordance with GAAP. There are inherent limitations of internal controls over financial reporting that could allow material misstatements due to error or fraud to occur and not be prevented or detected on a timely basis by employees during the normal course of business. Additionally, internal controls over financial reporting may become inadequate in the future due to changes in the business environment. Under the supervision and with the participation of the principal executive officer and principal financial officer, an evaluation of the effectiveness of internal controls over financial reporting was conducted based on criteria established in Internal Control - Integrated Framework (2013) issued by the Committee of Sponsoring Organizations of the Treadway Commission (COSO). Based on this evaluation under the framework in COSO, management concluded that internal controls over financial reporting at Eversource, CL&P, NSTAR Electric and PSNH were effective as of December 31, 2022.2023.
Management, on behalf of Eversource, CL&P, NSTAR Electric and PSNH, evaluated the design and operation of the disclosure controls and procedures as of December 31, 20222023 to determine whether they are effective in ensuring that the disclosure of required information is made timely and in accordance with the Securities Exchange Act of 1934 and the rules and regulations of the SEC. This evaluation was made under management's supervision and with management's participation, including the principal executive officer and principal financial officer as of the end of the period covered by this Annual Report on Form 10-K. There are inherent limitations of disclosure controls and procedures, including the possibility of human error and the circumventing or overriding of the controls and procedures. Accordingly, even effective disclosure controls and procedures can only provide reasonable assurance of achieving their control objectives. The principal executive officer and principal financial officer have concluded, based on their review, that the disclosure controls and procedures of Eversource, CL&P, NSTAR Electric and PSNH are effective to ensure that information required to be disclosed by us in reports filed under the Securities Exchange Act of 1934 (i) is recorded, processed, summarized, and reported within the time periods specified in SEC rules and regulations and (ii) is accumulated and communicated to management, including the principal executive officer and principal financial officer, as appropriate to allow timely decisions regarding required disclosures.
There have been no changes in internal controls over financial reporting for Eversource, CL&P, NSTAR Electric and PSNH during the quarter ended December 31, 20222023 that have materially affected, or are reasonably likely to materially affect, internal controls over financial reporting.
Item 9B. Other Information
During the quarter ended December 31, 2023, none of the Company’s directors or officers adopted, modified, or terminated a “Rule 10b5-1 trading arrangement” or a “non-Rule 10b5-1 trading arrangement,” as such terms are defined under Item 408 of Regulation S-K.
No additional information is required to be disclosed under this item as of December 31, 2022,2023, as this information has been previously disclosed in applicable reports on Form 8-K during the fourth quarter of 2022.2023.
PART III
Item 10. Directors, Executive Officers and Corporate Governance
The information in Item 10 is provided as of February 15, 2023, except where otherwise indicated.Eversource Energy
CertainThe information required by this Item 10 is omitted for NSTAR Electric and PSNH pursuant to Instruction I(2)(c) to Form 10-K, Omission of Information by Certain Wholly Owned Subsidiaries.
Eversource Energy
In addition to the information provided below concerning the executive officers of Eversource Energy, is incorporated herein by reference is theto certain information to be contained in the sections captioned “Election of Trustees,” and “Governance of Eversource Energy” and theplus related subsections, “Selection of Trustees,” and “Delinquent Section 16(a) Reports” of Eversource Energy’s definitive proxy statement for solicitation of proxies, expected to be filed with the SEC on or about March 24, 2023.22, 2024.
Eversource Energy and CL&P
Ms. Conner and Messrs. Butler, Moreira and Schweiger, four of the seven CL&P Board of Directors are employees of Eversource Service. Messrs. Howard, McGrath and Nicholson were elected to the CL&P Board effective June 1, 2022 and are non-employee Directors of CL&P. Directors are elected annually to serve for one year until their successors are elected and qualified. CL&P is a wholly owned subsidiary of Eversource Energy.
Set forth below is certain informationInformation concerning CL&P’s directors as well as Eversource Energy’s and CL&P’s executive officers:
| | | | | | | | | | | | | | |
Name | | Age | | Title |
Joseph R. Nolan, Jr. 1
| | 59 | | Chairman of the Board, President, Chief Executive Officer and a Trustee of Eversource Energy |
John M. Moreira | | 61 | | Executive Vice President, Chief Financial Officer and Treasurer of Eversource Energy and CL&P; Director of CL&P |
Gregory B. Butler | | 65 | | Executive Vice President and General Counsel of Eversource Energy and CL&P; Director of CL&P |
Christine M. Carmody 1
| | 60 | | Executive Vice President-Human Resources and Information Technology of Eversource Energy |
Penelope M. Conner | | 59 | | Executive Vice President-Customer Experience and Energy Strategy of Eversource Energy; Director of CL&P |
Chandler J. Howard | | 71 | | Director of CL&P |
James W. Hunt, III 1
| | 51 | | Executive Vice President-Corporate Relations and Sustainability and Secretary of Eversource Energy |
Patrick J. McGrath | | 50 | | Director of CL&P |
Ian G. Nicholson | | 55 | | Director of CL&P |
Werner J. Schweiger | | 63 | | Executive Vice President and Chief Operating Officer of Eversource Energy; Chairman, Chief Executive Officer and Director of CL&P |
Stephen T. Sullivan | | 61 | | President and Chief Operating Officer of CL&P |
Jay S. Buth | | 53 | | Vice President, Controller and Chief Accounting Officer of Eversource Energy and CL&P |
1 Deemed an executive officer of CL&P pursuant to Rule 3b-7 under the Securities Exchange Act of 1934.
Joseph R. Nolan, Jr. Mr. Nolan has served as Chairman of the Boardofficers of Eversource Energy since January 1, 2023, and has served as President and Chiefrequired by this Item 10 is reported under a separate caption entitled “Information About Our Executive Officer and a TrusteeOfficers” in Part I of Eversource Energy since 2021. Previously, Mr. Nolan served as Executive Vice President-Strategy, Customer and Corporate Relations of Eversource Energy from February 5, 2020 until May 5, 2021, and as Executive Vice President-Customer and Corporate Relations of Eversource Energy from August 8, 2016 to February 5, 2020. Based on his experience as described, Mr. Nolan has the skills and qualifications necessary to serve as a Trustee of Eversource Energy.
John M. Moreira. Mr. Moreira has served as Executive Vice President, Chief Financial Officer and Treasurer of Eversource Energy and CL&P since May 4, 2022. He previously served as Senior Vice President-Financial and Regulatory and Treasurer of Eversource Energy and CL&P from September 12, 2018 until May 4, 2022. Based on his experience as described, Mr. Moreira has the skills and qualifications necessary to serve as a Director of CL&P.
Gregory B. Butler. Mr. Butler has served as General Counsel of Eversource Energy since May 1, 2001, and of CL&P since March 9, 2006. He has served as Executive Vice President of Eversource Energy and CL&P since August 8, 2016. He has served as a Director of CL&P since April 22, 2009. Based on his experience as described, Mr. Butler has the skills and qualifications necessary to serve as a Director of CL&P.
Christine M. Carmody. Ms. Carmody has served as Executive Vice President-Human Resources and Information Technology of Eversource Energy since August 8, 2016. Previously, Ms. Carmody served as Senior Vice President-Human Resources of Eversource Energy from May 4, 2016 until August 8, 2016; and of Eversource Service from April 10, 2012 until August 8, 2016.
Penelope M. Conner. Ms. Conner has served as Executive Vice President-Customer Experience and Energy Strategy of Eversource Energy since May 5, 2021. Previously, Ms. Conner served as Senior Vice President and Chief Customer Officer of Eversource Service from March 2, 2013 until May 5, 2021. Based on her experience as described, Ms. Conner has the skills and qualifications necessary to serve as a Director of CL&P.
Chandler J. Howard. Mr. Howard serves as a Director of Liberty Bank, a Connecticut based financial institution serving more than 200,000 consumers and businesses through 55 retail banking locations. From 2007 until his retirement in 2019, Mr. Chandler served as the President and Chief Executive Officer of Liberty Bank. Mr. Howard has significant experience in the regulated banking industry through positions of increasing responsibility at People’s United Bank, Bank of America, and Fleet Bank, culminating in a more than 35-year career at Liberty Bank. His career has provided him with a broad base of financial expertise, leadership and management skills, and community experience. Based on his experience as described, Mr. Howard has the skills and qualifications necessary to serve as a Director of CL&P.
James W. Hunt, III. Mr. Hunt has served as Executive Vice President-Corporate Relations and Sustainability of Eversource Energy since May 5, 2021, and as Secretary of Eversource Energy since July 9, 2021.Previously Mr. Hunt served as Senior Vice President-Communications, External Affairs and Sustainability of Eversource Service from December 17, 2019 until May 5, 2021 and as Senior Vice President-Regulatory Affairs and Chief Communications Officer of Eversource Service from October 3, 2016 until December 17, 2019.
Patrick J. McGrath. Mr. McGrath has been a Partner of the Connecticut law firm of Cicchetti, Tansley & McGrath LLP since 2005. Mr. McGrath has over twenty years of experience as an attorney representing clients including businesses, financial institutions and individuals in a broad range of transactional and administrative matters. He routinely provides advice to his clients to facilitate informed business decisions. Mr. McGrath also has significant experience serving on several non-profit boards. Based on his experience as described, Mr. McGrath has the skills and qualifications necessary to serve as a Director of CL&P.
Ian G. Nicholson. Mr. Nicholson is a retired Connecticut State Trooper. From 2011 to 2022, he served as a member of the Connecticut Governor’s Security Unit, and he served as a Supervisor from 2019 until his retirement in 2022. Previously, Mr. Nicholson served as the Resident State Trooper for Harwinton, Connecticut, where he developed an extensive network of experts and analysts and gained significant experience in investigative analysis with a specific focus on cybercrimes. Mr. Nicholson promotes cybersecurity best practices including training and awareness to recognize and respond to cyber threats. Based on his experience as described, Mr. Nicholson has the skills and qualifications necessary to serve as a Director of CL&P.
Werner J. Schweiger. Mr. Schweiger has served as Executive Vice President and Chief Operating Officer of Eversource Energy since September 2, 2014 and as Chief Executive Officer of CL&P since August 11, 2014. Mr. Schweiger has served as a Director of CL&P since May 28, 2013 and as Chairman of the Board of CL&P since May 27, 2022. Based on his experience as described, Mr. Schweiger has the skills and qualifications necessary to serve as a Director of CL&P.
Stephen T. Sullivan. Mr. Sullivan has served as President and Chief Operating Officer of CL&P since December 5, 2021.Previously Mr. Sullivan served as Vice President-Project Management and Construction of Eversource Service from March 16, 2021 until December 5, 2021, and as Vice President-Project Management of Eversource Service from October 25, 2015 until March 16, 2021.
Jay S. Buth. Mr. Buth has served as Vice President, Controller and Chief Accounting Officer of Eversource Energy and CL&P since April 10, 2012.
There are no family relationships between any director or executive officer and any other trustee, director or executive officer of Eversource Energy or CL&P and none of the above executive officers or directors serves as an executive officer or director pursuant to any agreement or understanding with any other person. Our executive officers hold the offices set forth opposite their names until the next annual meeting of the Board of Trustees, in the case of Eversource Energy, and the Board of Directors, in the case of CL&P, and until their successors have been elected and qualified.this report.
CL&P, obtains audit services from the independent registered public accounting firm engaged by the Audit Committee of Eversource Energy’s Board of Trustees. CL&P does not have its own audit committee or, accordingly, an audit committee financial expert. CL&P relies on Eversource Energy’s audit committeeNSTAR Electric and the audit committee financial expert.PSNH
CODE OF ETHICS AND CODE OF BUSINESS CONDUCT
Each of Eversource Energy,Certain information required by this Item 10 is omitted for CL&P, NSTAR Electric and PSNH has adopted a Codepursuant to Instruction I(2)(c) to Form 10-K, Omission of Ethics for Senior Financial Officers (Chief Executive Officer, Chief Financial Officer and Controller) and the Code of Business Conduct, which are applicable to all Trustees, directors, officers, employees, contractors and agents of Eversource Energy, CL&P, NSTAR Electric and PSNH. The Code of Ethics and the Code of Business Conduct have both been posted on the Eversource Energy web site and are available at www.eversource.com/Content/general/about/investors/corporate-governance on the Internet. Any amendments to or waivers from the Code of Ethics and Code of Business Conduct for executive officers, directors or Trustees will be posted on the website. Any such amendment or waiver would require the prior consent of the Board of Trustees or an applicable committee thereof.
Printed copies of the Code of Ethics and the Code of Business Conduct are also available to any shareholder without charge upon written request mailed to:
James W. Hunt, III
Secretary
Eversource Energy
800 Boylston Street, 17th Floor
Boston, Massachusetts 02199-7050Information by Certain Wholly Owned Subsidiaries.
Item 11. Executive Compensation
Eversource Energy
The information required by this Item 11 for Eversource Energy is incorporated herein by reference to certain information contained in Eversource Energy's definitive proxy statement for solicitation of proxies, which is expected to be filed with the SEC on or about March 24, 2023,22, 2024, under the sections captioned “Compensation Discussion and Analysis,” plus related subsections, and “Compensation Committee Report,” plus related subsections following such Report.
CL&P, NSTAR ELECTRICElectric and PSNH
Certain information required by this Item 11 has been omitted for CL&P, NSTAR Electric and PSNH pursuant to Instruction I(2)(c) to Form 10-K, Omission of Information by Certain Wholly-Owned Subsidiaries.
CL&P
The information in this Item 11 relates solely to CL&P.
COMPENSATION DISCUSSION AND ANALYSIS
CL&P is a wholly-owned subsidiary of Eversource Energy. Its board of directors consists of four executive officers of Eversource Energy system companies and three independent, non-employee directors who were elected to the board of directors on June 1, 2022 in accordance with the previously noted settlement agreement with PURA. CL&P does not have a compensation committee, and the Compensation Committee of Eversource Energy's Board of Trustees determines compensation for the executive officers of CL&P, including their salaries, annual incentive awards and long-term incentive awards. All of CL&P's “Named Executive Officers,” as defined below, also serve or served as officers of Eversource Energy and one or more other subsidiaries of Eversource Energy. Compensation set by the Compensation Committee of Eversource Energy (the “Committee”) and set forth herein is for services rendered to Eversource Energy and its subsidiaries by such officers in all capacities.
This Compensation Discussion and Analysis (CD&A) provides information about Eversource Energy’s compensation principles, objectives, plans, policies and actions for its Named Executive Officers. The discussion describes the specific components used in its compensation programs and approach to executive compensation, how Eversource Energy measures performance, and how Eversource Energy’s compensation principles were applied to compensation awards and decisions that were made by the Compensation Committee for the Named Executive Officers, as presented in the tables and narratives that follow. While this discussion focuses primarily on 2022 information, it also addresses decisions that were made in prior periods to the extent that these decisions are relevant to the full understanding of Eversource Energy’s compensation programs and the decisions that were made regarding 2022 performance. The CD&A also contains an assessment of performance measured against established 2022 goals and additional accomplishments, the compensation awards made by the Compensation Committee, and other information relating to Eversource Energy’s compensation programs, including:
| | | | | | | | | | | |
= | Summary of 2022 Accomplishments | = | 2022 Annual Incentive Program Assessment |
= | Pay for Performance Philosophy | = | Long-Term Incentive Program |
= | Executive Compensation Governance | = | Clawback, No Hedging and No Pledging Policies |
= | Named Executive Officers | = | Share Ownership Guidelines and Retention Requirements |
= | Overview of the Compensation Program | = | Other Benefits |
= | Market Analysis | = | Contractual Agreements |
= | Mix of Compensation Elements | = | Tax and Accounting Considerations |
= | Results of 2022 Say on Pay Vote | = | Equity Grant Practices |
= | Elements of 2022 Compensation | = | Compensation Committee Report |
= | Risk Analysis of Executive Compensation Program | | |
Summary of 2022 Accomplishments
2022 Financial and Operational Accomplishments
In 2022, Eversource Energy continued to outperform its peers in most financial metrics, demonstrate our leadership in ESG, and achieve the operational goals as set by the Committee, while continuing to safeguard our employees and customers. The following is a summary of some of the most important accomplishments in 2022:
•FINANCIAL PERFORMANCE: 2022 GAAP earnings per share equaled $4.05 per share, and non-GAAP earnings per share equaled $4.09. Non-GAAP earnings excludes $5.0 million of certain charges described below and in Exhibit A.(1)
•DIVIDENDS PAID: The Board of Trustees increased the annual dividend rate by 5.8 percent for 2022 to $2.55 per share, which exceeded the median dividend growth rate of 4.5 percent for the utilities that constitute the Edison Electric Institute Index (EEI Utility Index).
•SHAREHOLDER RETURN: Eversource Energy’s Total Shareholder Return (TSR) in 2022 was -5.0 percent, compared to 1.2 percent for the EEI Index of 39 companies. While our performance in recent years has trailed the EEI Utility Index, Eversource has continued to outperform the EEI Utility Index over the last five- and 10-year periods. This long-term performance ranks Eversource among the top 15 companies in the Index. An investment of $1,000 in Eversource’s common shares for the 10-year period beginning January 1, 2013 was
(1) Non-GAAP EPS presented in this proxy statement excludes $0.04 per share relating to (1) the Columbia Gas acquisition and related transition costs in 2022 (2) charges in 2022 related to the acquisition and transition of New England Service Company and The Torrington Water Company and (3) charges in 2022 related to the strategic review of offshore wind. Eversource Energy uses this non-GAAP financial measure to more fully compare and explain 2022 earnings results without including the impact of these costs. Due to the effect of such costs on net income attributable to common shareholders, management believes that the non-GAAP presentation is a more meaningful representation of Eversource Energy’s financial performance and provides additional information to readers in analyzing historical and future performance of the business. Non-GAAP financial measures should not be considered as alternatives to Eversource Energy’s consolidated net income attributable to common shareholders. For further information, see Exhibit A to this Item 11.
worth $2,925 on December 31, 2022, representing approximately a 193% total return. The following chart represents the comparative total shareholder returns for the periods ended December 31, 2022:
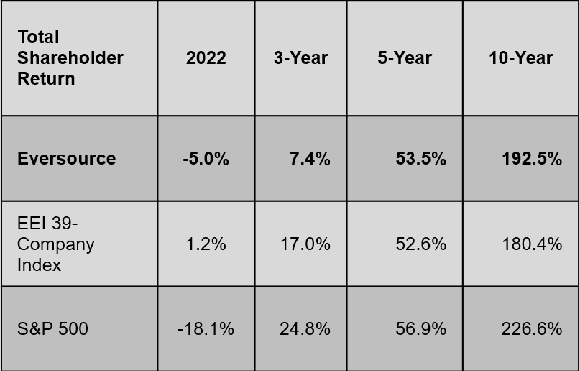
•STRATEGIC INITIATIVES AND REGULATORY OUTCOMES: Eversource successfully advanced several strategic initiatives and produced positive regulatory outcomes during 2022. Eversource made substantial progress advancing the offshore wind strategic review by launching the process with potential buyers, with an announcement anticipated in the second quarter of 2023. The Eversource Gas Company of Massachusetts’ integration and transition that followed the Columbia Gas asset purchase was completed ahead of schedule and below budget, exiting the 115 transition service functions. In October, our Aquarion Water subsidiary successfully completed the purchase of The Torrington Water Company, adding about 10,200 customers, and in November executed a purchase and sale agreement to acquire the Pinehills Water Company, which will add about 2,700 customers upon closing, advancing our water customer growth initiative. NSTAR Electric’s rate case received a favorable order, including a rate increase of $64 million, a 9.8% return on equity, and approval of its Advanced Metering Infrastructure project with timely cost recovery, as well as a new mechanism for better timely recovery of all other capital investments. NSTAR Electric filed with the Massachusetts Department of Public Utilities (MA DPU) a creative solution that allocates cost between Transmission, Distribution and Solar Developers needed to allow Renewable Distributed Energy Resources in Massachusetts to connect to the grid. The first of six projects was approved by the MA DPU in December and Eversource expects the remaining five projects to be approved in 2023. Lastly, in Massachusetts, the MA DPU issued an order supporting Eversource’s position that recent increases in property tax expense should be treated as "exogenous," allowing for full recovery. The Federal Energy Regulatory Commission approved an innovative, cost-effective transmission support agreement between Eversource and the offshore wind project Park City Wind, enabling Eversource to integrate a necessary reliability project with that offshore wind interconnection investment, resulting in savings to customers. In New Hampshire, Eversource was successful with efforts to have the New Hampshire Public Utilities Commission (NHPUC) reinstate the Energy Efficiency Customer Program and also approved a $9 million step base rate increase. After two years of negotiations and regulatory processes, Eversource also received initial approval from the New Hampshire Public Utilities Commission allowing for the acquisition of the distribution pole plant owned by Consolidated Communications. Eversource has implemented several emergency response enhancements, including the roll out of new outage management and community portal systems, which were well received in Connecticut, Massachusetts, and New Hampshire. The Connecticut line worker pipeline program also received great feedback, as well as our support of the Connecticut Governor and Attorney General in helping customers with the recent extraordinary energy supply price increases. The positive relationships Eversource continues to have with its unions supported many of these successful initiatives.
•RELIABILITY PERFORMANCE: Electric System Reliability, measured by months between interruptions, was top decile for the industry in 2022; customer power interruptions were on average 19.5 months apart, a performance that is top decile among our peers.
Eversource’s recent Provincetown, Massachusetts battery storage project enables it to now help prevent outages which would otherwise affect approximately 11,000 customers.
•RESTORATION PERFORMANCE: The average system outage duration was 65.2 minutes, also top quartile in the utility industry for the fastest restoration time.
•SAFETY: Eversource’s safety performance was 1.0, measured by days away, restricted or transferred (DART) per 100 workers, which continues to improve over 2021, 2020 and 2019 performance. In 2022, Eversource used the DART-OSHA method of measurement for both the goal and 2022 results; 2019-2021 results shown in the graph below were converted to the DART-OSHA method. The strong partnerships that have been developed between Eversource management and the union leadership continue to assist us in both helping to safeguard our employees and in advancing our business initiatives.
•GAS EMERGENCY RESPONSE: On-time response to gas customer emergency calls was 97.8 percent, which continues to exceed mandated emergency response requirements.
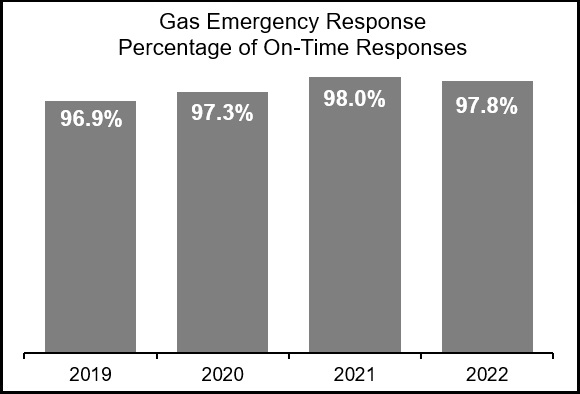
•ENHANCE THE CUSTOMER EXPERIENCE: Significant success has been achieved enhancing Eversource’s Customer Experience with go-live transition of Eversource Gas Company of Massachusetts' Customer Information System (CIS) and new SCADA system with no system interruptions, while delivering exceptional employee and customer experience. The next phase of the CIS/OMNI implementation impacting other Massachusetts operations has been launched. Eversource’s Advanced Metering Infrastructure Implementation Project was approved by the MA DPU in December. The new Outage Management System and Analytics Platform went live in 2022 along with a Storm Restoration Dashboard for storm events incorporating input from town and state stakeholders, all of which enhance Emergency Response capability and communication with customers, including improvements to the customer outage reporting function on Eversource’s web page. Additional technologies were implemented to reduce cyber threats and Eversource enhanced tools that increase customer password security standards. Fee free credit card transactions were also approved by the MA DPU for all electric and natural gas customers.
•CLEAN ENERGY EXECUTION: Eversource made significant progress to advance the siting of all three of its offshore wind projects (South Fork, Sunrise and Revolution Wind) at the federal and state levels, including achieving key permitting milestones and the installation of a critical duct bank system for the South Fork Wind Project. Eversource continues to advance the development of its electric vehicle infrastructure in both Connecticut and Massachusetts, successfully executed its first Massachusetts Grid Modernization plan, and submitted its next round of plan investments for approval, including Advanced Metering Infrastructure. Eversource’s commitment to clean energy advanced with the completion of the Provincetown Battery Energy Storage system, as well as demonstrating industry leadership in the MA DPU’s Future of Gas Proceeding. Eversource also executed its $596 million annual energy efficiency program, received MA DPU approval for its $1 billion new energy efficiency three-year program, and made solid progress in the Geothermal Pilot Program launched in the city of Framingham, Massachusetts. Phase 1 of the new Massachusetts Solar Program was filed with the MA DPU, and the Department also issued a constructive order on the next Grid Modernization phase. Eversource announced its commitment to developing Science Based Emission Targets and continued to position its natural gas business for long term success in many areas, including stakeholder engagement, geothermal pilot deployment, advancing RNG/hydrogen supply options, and other methane emission reductions. Eversource also established an internal team to focus on obtaining federal funding for clean energy related investments in support of customers. During 2022, Eversource, once again, received the ENERGY STAR™ Partner of the Year Sustained Excellence Award from the Environmental Protection Agency and U.S. Department of Energy.
2022 Sustainability/ESG
•SUSTAINABILITY: In 2022, Eversource’s strong environmental, social and governance performance produced numerous national and local awards and recognition. These honors are a result of a deep commitment to corporate responsibility, evidenced by the high ratings Eversource continues to receive from leading sustainability raters. In 2022, Eversource achieved its target range of 85 percent to 97 percent compared to its peer group assessed by two leading sustainability rating firms, with a combined end of-year ranking of 89.5 percent. Eversource continues to engage with a strong cross-functional network throughout the company to advance its sustainability strategy and drive performance that addresses the evolving expectations of our shareholders, customers, employees, regulators and the communities Eversource serves.
Eversource continued to take steps to mitigate climate change impacts through leading clean energy initiatives and ambitious greenhouse gas emission (GHG) reduction targets. Since 2019, Eversource has been focused on the ambitious goal of achieving carbon neutrality in company operations by 2030. Eversource continues to progress toward this goal by working with all areas of the company to reduce Scope 1 and 2 GHG emissions to as close to zero as possible. For emissions that cannot be avoided, Eversource is preparing to invest in qualified offsets. Eversource reduced its carbon footprint by 13 percent from the 2018 base year through 2021 by executing its carbon reduction initiatives associated with fleet, electric line losses, SF6 gas used in electric switchgear, energy efficiency, and leak prone gas pipe replacements. Building on this strong foundation and looking beyond its own operational GHG emissions, Eversource committed to setting a science-based target, which will be worked on with the Science Based Target initiative, to validate as an acceptable emissions goal aiming to limit global warming to 1.5 degrees Celsius. This target will address GHG reductions related to procuring energy supply
on behalf of customers, the largest source of indirect Scope 3 emissions. Eversource continues to support customers to reduce their impacts on the climate through solutions such as energy efficiency programs, providing access to more renewable energy options, and advancing electric vehicle infrastructures and energy storage capabilities.
To address physical and transitional impacts related to climate change and maintain resiliency across our system in the face of climate change, Eversource continued to pursue the following actions:
•Working with regulators to gain approval for new programs that will help improve system resiliency in response to climate change, including vegetation management, pole and wire strengthening, flood proofing, and other system hardening measures;
•Implementing a grid modernization plan that will enhance the electric distribution infrastructure to improve resiliency and reliability and facilitate integration of distributed energy resources and electric vehicle infrastructure;
•Focusing on improving the efficiency of electric and natural gas distribution systems and preparing for the opportunities that clean energy advancements create;
•Investigating emerging technologies such as energy storage and automation programs that improve reliability;
•Implementing programs to address risks that may impact water availability and water quality;
•Evaluating the natural gas system and exploring alternative, less carbon-intense technologies like renewable natural gas and geothermal systems; and
•Pursuing opportunities that meet evolving customer expectations, including investments in electric vehicle infrastructure and providing customers with ways to minimize their energy use.
•DIVERSITY: In 2022, Eversource sustained its successful drive to increase workforce diversity and build a talent pipeline. In 2022, 61.6 percent of external hires were women and/or people of color, and 45.1 percent of external hires and internal promotions into leadership roles were women and/or people of color. Eversource continued to support a multitude of programs and agencies that address racial and ethnic disparities in its customers’ communities and beyond. Eversource also remains committed to developing a workforce that fully reflects the diversity of the people and communities it serves. Eversource’s hiring and talent practices emphasize diversity, equity, and inclusion (DE&I), and Eversource encourages employees to embrace different people, perspectives, and experiences in the workplace and within our communities – regardless of their race, color, religion, national origin, ancestry, sex, gender identity, age, disability, marital status, sexual orientation, active military or veteran status.
Eversource is a signatory to the CEO Action for Inclusion Pledge to advance diversity, equity and inclusion in the workplace, as well as a member of the Paradigm for Parity coalition, committed to addressing gender parity. Eversource offered a variety of programs, events, activities and discussions in 2022 focused on diversity, equity and inclusion, to provide employees with education and experiences to further emphasize messages of racial and social justice. Eversource held listening sessions with our business resource group leaders, who provided valuable input to address concerns during an ever changing and challenging year. Eversource’s Racial Equity Task Force maintained its focus on increasing racial equity and social justice through the lens of talent management, inclusion, and support for our diverse communities, including increasing business with diverse suppliers. Eversource held a highly-attended Day of Understanding virtual event to celebrate Juneteenth and followed up with discussions in business groups. Eversource continued these conversations with quarterly discussions hosted by its senior leaders, all focused on advancing our DE&I goals.
In addition, Eversource hosted monthly conversations in our Diversity and Inclusion multicultural book club and held signature learning events to celebrate Black History Month, Hispanic Heritage Month, and Asian American Month, focusing on the history, contributions, and current challenges of each group. Eversource also continued its webinar series on employee resilience and self-care. An example of Eversource’s commitment to promote equity and diversity in its communities is its investment in Girls With Impact, a business and leadership program that funds scholarships for under-resourced young women in Connecticut and Massachusetts. The investment is valued at nearly $300,000 and will fund approximately 300 scholarships. In response to the continuing calls for racial, social and environmental justice, Eversource’s Vice President of Corporate Citizenship, Equity, and Environmental Justice continued to lead a 15-member cross-functional pro-equity advisory team tasked with developing and implementing a strategy, guidelines, leadership toolkits, training materials and decision frameworks to promote equity in siting, customer-facing projects, procurement and philanthropy. This group developed and began to roll out justice and equity training to all Eversource employees in 2022. Eversource also developed a full 2021 DE&I Report, which detailed its many DE&I initiatives, programs, goals, successes, challenges and progress to date that was released in 2022. To further Eversource’s commitment to transparency, the report included our 2021 EEO-1 data.
•EMPLOYEES:Eversource recognizes that its employees are its most valuable asset. Eversource has developed strategic workplans as part of the annual business and workforce planning process to address immediate and long-range needs to ensure that it acquires, develops, and retains excellent talent. Virtual learning and development opportunities were provided in 2022 to employees, including the launch of a career management series and a new hire networking series with executive overviews. Interactive engagement and support tools were leveraged to promote remote worker effectiveness supporting the workforce with business, leadership, and technical knowledge. Employee development programs were aligned to the strategic workforce plan to support succession within all levels of the organization. Programs like the Growth Opportunities for Leadership Development Program provide development for recent college graduates and were expanded to include employees new to the utility industry. The Transmission Training, Engineering Development, and Transmission Cohort programs promoted educational and professional development opportunities for recent college graduates. Tuition assistance programs, paid internships, co-ops, and other pipeline development programs continued to ensure progress in future workforce technical skills and competencies. Targeted training, development and educational opportunities were offered to high potential employees to ensure their continued growth and development as future leaders. Thought provoking stretch assignments, high impact cross-functional team memberships, senior management interaction and exposure, targeted coaching and feedback, and diverse learning experiences that promote interdependent thinking and embrace alternative perspectives, while building teamwork and collaboration, represent core components of the key talent development program.
Additionally, Eversource leveraged educational partnerships within the diverse communities it serves in critical trade and technical areas and has developed proactive sourcing strategies to attract experienced workers in highly technical roles in areas like engineering, electric and gas operations, and energy efficiency. As part of this process, Eversource added new college partnerships to increase its pipelines for diverse talent. Eversource also provides employees with fair pay, comprehensive benefits, and a variety of field and classroom training opportunities throughout their careers to support their ongoing success on the job.
The success of these programs, policies and opportunities is evidenced by Eversource’s most current comprehensive employee survey, which saw strong participation of 70 percent of the employee population and a high level of engagement, with an eight-point improvement in overall favorability.
•AWARDS: Eversource continued to receive numerous national awards in 2022 recognizing it as a leader and catalyst in the areas of sustainability and ESG.
◦Newsweek magazine ranked Eversource as the #1 energy company in their 2023 list of the Most Responsible Companies. This listing determines the most responsible companies of 2022 based on their corporate social sustainability performance and reputation.
◦Eversource was again ranked in the top 100 of America’s Most Just Companies for 2022 by Forbes/JUST Capitalin partnership with CNBC. The listing recognizes corporate social responsibility and commitment to local communities and celebrates public companies for their positive impact and leadership on priorities such as ethical leadership, environmental impact, customer treatment, shareholder return, fair pay and benefits, and equal opportunity.
◦As You Sow named Eversource as a Top 10 Company on both their Racial Justice and DE&I scorecards.
◦Eversource was again selected to be included in the Bloomberg Gender-Equality Index, which recognizes companies that have shown their commitment to advancing women’s equality in the workplace and transparency in gender reporting.
◦Eversource was recognized again by the U.S. Department of Labor as a HIRE Vets Medallion Award recipient for our commitment to recruiting, employing, and retaining veterans.
◦Eversource was recognized as one of America’s “best employers for diversity” by Forbes magazine, which surveyed over 50,000 U.S. employees regarding age, gender, ethnicity, LGBTQA and diversity in their current workplace.
◦Eversource was recognized as a finalist for the Healthiest Employer Program for its commitment to workplace wellness and exceptional health benefits.
◦Eversource was again selected as a “most honored” company by Institutional Investor magazine for industry leading ESG, investor relations and multiple other categories as voted by institutional investors.
◦Eversource was included in Barron’s 2022 Most Sustainable Companies list. Barron’s based its list on performance indicators that address environmental, social and governance matters.
Achievement of the 2022 performance goals, additional accomplishments and the Compensation Committee’s assessment of Eversource and executive performance are more fully described in the section below titled “2022 Annual Incentive Program Assessment.” Specific decisions regarding executive compensation based upon the Committee’s assessment of company and executive performance and market data are also described below.
Pay for Performance Philosophy
The Compensation Committee links the compensation of the executive officers, including the Named Executive Officers, to performance that will ultimately benefit customers, employees, shareholders and communities served. Eversource’s compensation program is intended to attract and retain the best executive talent in the industry, motivate our executives to meet or exceed specific stretch financial and operational goals each year, and compensate our executives in a manner that aligns compensation directly with performance. Eversource strives to provide executives with base salary, performance-based annual incentive compensation, and performance-based long-term incentive compensation opportunities that are competitive with market practices and that reward excellent performance. Additional Pay for Performance information is set forth in this Item 11.
Executive Compensation Governance
•What Eversource DOES:
| | | | | | | | |
ü | Focus on Pay for Performance | |
ü | Maintain share ownership and holding guidelines | |
ü | Utilize balanced incentive metrics including both absolute and relative measures | |
ü | Deliver the majority of incentive compensation opportunity in long-term equity | |
ü | Maintain double-trigger change in control vesting provisions | |
ü | Hold shareholder engagement meetings throughout the year between management and shareholders that discuss compensation governance financial performance, ESG, climate change and sustainability, and overall corporate governance | |
ü | Maintain a broad financial and personal misconduct clawback policy relating to incentive compensation | |
ü | Tie 75 percent of long-term incentive compensation to performance and grant 100 percent of long-term incentive compensation in equity | |
ü | Engage an independent compensation consultant | |
ü | Hold an annual Say-on-Pay vote | |
ü | Impose payout limitations on incentive awards | |
ü | Maintain limited executive and Trustee trading window | |
What Eversource DOESN’T do:
| | | | | |
û | Include tax gross ups in any new or materially amended executive compensation agreements |
û | Allow hedging, pledging or similar transactions by executives and Trustees |
û | Provide for liberal share recycling within long-term compensation grants |
û | Pay dividends on equity awards before vesting |
û | Allow for discounts or repricing of options or stock appreciation rights |
û | Grant change in control agreements (since 2010) |
Named Executive Officers
The executive officers of CL&P listed in the Summary Compensation Table and whose compensation is discussed in this CD&A are referred to as the “Named Executive Officers” under SEC regulations.For 2022, CL&P’s Named Executive Officers (NEOs) were:
•Werner J. Schweiger, Executive Vice President and Chief Operating Officer of Eversource Energy, and Chairman of the Board and Chief Executive Officer of CL&P
•John M. Moreira, Executive Vice President, Chief Financial Officer and Treasurer of Eversource Energy and CL&P
•Gregory B. Butler, Executive Vice President and General Counsel of Eversource Energy and CL&P
•Christine M. Carmody, Executive Vice President-Human Resources and Information Technology of Eversource Energy
•James W. Hunt, III, Executive Vice President-Corporate Relations and Sustainability and Secretary of Eversource Energy
•Joseph R. Nolan, Jr., Chairman of the Board, President and Chief Executive Officer of Eversource Energy and Former Chairman of the Board of CL&P
•Philip J. Lembo, Former Executive Vice President and Chief Financial Officer of Eversource Energy and CL&P
Overview of Our Compensation Program
The Role of the Compensation Committee. The Eversource Board of Trustees has delegated to the Compensation Committee overall responsibility for establishing the compensation program for those senior executive officers, who are referred to in this CD&A as “executives” and who are deemed to be “executive officers” under the SEC’s regulations that determine the persons whose compensation is subject to disclosure. In this role, the Committee sets compensation policy and compensation levels, reviews and approves performance goals and evaluates executive performance. Although this CD&A refers principally to compensation for the Named Executive Officers, the same compensation principles and practices apply to all vice presidents and above. The compensation of Eversource’s Chief Executive Officer and its Executive Chairman is subject to the further review and approval of all of the independent Eversource Trustees.
Elements of Compensation. Total direct compensation consists of three elements: base salary, annual cash incentive awards, and long-term equity-based incentive awards. Indirect compensation is provided through certain retirement, perquisite, severance, and health and welfare benefit programs.
Eversource’s Compensation Objectives. The objectives of Eversource’s compensation program are to attract and retain superior executive talent, motivate executives to achieve annual and long-term performance goals set each year, and provide total compensation opportunities that are competitive with market practices. With respect to incentive compensation, the Committee believes it is important to balance short-term goals, such as producing earnings, with longer-term goals, such as long-term value creation for shareholders, maintaining a strong balance sheet, and being a leader in clean energy and sustainability. The Committee also places great emphasis on operating performance, customer service, safety, sustainability and workforce diversity. Eversource’s compensation program utilizes performance-based incentive compensation to reward individual and corporate performance and to align the interests of executives with Eversource’s customers, employees, and shareholders. The Committee continually increases expectations to motivate executives and employees to achieve continuous improvement in carrying out their responsibilities to customers to deliver energy and water reliably, safely, mindful of the environment and employee well-being, and at a reasonable cost, while providing an above-average total return to Eversource shareholders.
Setting Compensation Levels. To ensure that Eversource achieves its goal of providing market-based total direct compensation levels to attract and retain top quality management, the Committee provides executives with target compensation opportunities approximately equal to median compensation levels for executive officers of companies in the utility industry comparable to Eversource in size. To achieve that goal, the Committee, and its independent compensation consultant work together to determine the market values of executive direct and indirect compensation elements by using competitive market compensation data.
The Committee reviews competitive compensation data obtained from utility and general industry surveys and a specific group of peer utility companies. Incumbent compensation levels may be set below the market median for those executives who are new to their roles, while long-tenured, high performing executives may be compensated above median. The review by Pay Governance performed in December 2022 indicated that Eversource’s aggregate executive compensation levels continue to be aligned with median market rates.
Role of the Compensation Consultant. The Committee has retained Pay Governance as its independent compensation consultant. Pay Governance reports directly to the Committee and does not provide any other services to Eversource. With the consent of the Committee, Pay Governance works cooperatively with Eversource management to develop analyses and proposals for presentation to the Committee. The
Committee generally relies on Pay Governance for peer group market data and information as to market practices and trends to assess the competitiveness of the compensation that Eversource pays to its executives and to review the Committee’s proposed compensation decisions.
Pay Governance Independence. In February 2023, the Committee assessed the independence of Pay Governance pursuant to SEC and NYSE rules and concluded that it is independent and that no conflict of interest exists that would prevent Pay Governance from independently advising the Committee. In making this assessment, the Committee considered the independence factors enumerated in Rule 10C-1(b) under the Securities Exchange Act of 1934, as well as the written representations of Pay Governance that Pay Governance does not provide any other services to Eversource, the level of fees received from Eversource as a percentage of Pay Governance’s total revenues, the policies and procedures employed by Pay Governance to prevent conflicts of interest, and whether the individual Pay Governance advisers with whom the Committee consulted own any Eversource common shares or have any business or personal relationships with members of the Committee or Eversource executives.
Role of Management. Management’s roles, and specifically the roles of Eversource’s Chief Executive Officer and the Executive Vice President-Human Resources and Information Technology, are to provide current compensation information to the compensation consultant and analyses and recommendations on executive compensation to the Committee based on the market value of the position, individual performance, experience and internal pay equity. Eversource’s Chief Executive Officer also provides recommendations on the compensation for the other Named Executive Officers other than the Executive Chairman. None of the executives makes recommendations that affect their individual compensation.
Market Analysis
The Compensation Committee seeks to provide executives with target compensation opportunities using a range that is approximately equal to the median compensation levels for executive officers of utility companies comparable to Eversource. Set forth below is a description of the sources of the compensation data used by the Committee when reviewing 2022 compensation:
•Competitive Compensation Survey Data. The Committee reviews compensation information obtained from surveys of diverse groups of utility and general industry companies that represent the market for executive officer talent. Utility industry data serve as the primary reference point for benchmarking officer compensation and are based on a defined peer set, as discussed below, while general industry data are derived from compensation consultant surveys and serve as a secondary reference point. General industry data are used for staff positions and are size adjusted to ensure a close correlation between the market data and Eversource’s scope of operations. The Committee references this information, which it obtains from Pay Governance, to evaluate and determine base salaries and incentive opportunities.
•Peer Group Data. In support of our executive pay decisions, the Committee consulted with Pay Governance, which provided the Committee with a competitive assessment analysis of Eversource’s executive compensation levels as compared to the 18 peer group companies listed in the table below. This peer group, which the Committee reviews annually, was chosen because these companies are similar to Eversource Energy in terms of size, business model and long-term strategies.
| | | | | | | | |
Alliant Energy Corporation | Dominion Energy, Inc. | Pinnacle West Capital Corporation |
Ameren Corporation | DTE Energy Company | PPL Corporation |
American Electric Power Co., Inc. | Edison International | Public Service Enterprise Group, Inc. |
CenterPoint Energy, Inc. | Entergy Corporation | Sempra Energy |
CMS Energy Corp. | FirstEnergy Corp. | WEC Energy Group, Inc. |
Consolidated Edison, Inc. | NiSource Inc. | Xcel Energy Inc. |
The Committee adjusts the target percentages of annual and long-term incentives based on the survey data and recommendations from Eversource’s Chief Executive Officer, after discussion with the compensation consultant, to ensure that they are approximately equal to competitive median levels.
The Committee periodically reviews the general market for supplemental benefits and perquisites using utility and general industry survey data, including data obtained from companies in the peer group.
Mix of Compensation Elements
Eversource targets the mix of compensation for its Chief Executive Officer and the other Named Executive Officers so that the percentages of each compensation element are approximately equal to the competitive median market mix. The mix is heavily weighted toward incentive compensation, and incentive compensation is heavily weighted toward performance-based long-term compensation. Since the most senior positions have the greatest responsibility for implementing long-term business plans and strategies, a greater proportion of total compensation is based on performance with a long-term focus.
The Committee determines the compensation for each executive based on the relative authority, duties and responsibilities of the executive. Eversource’s Chief Executive Officer’s responsibilities for the strategic direction and daily operations and management of Eversource are greater than the duties and responsibilities of our other executives. As a result, Eversource’s Chief Executive Officer’s compensation is higher than the compensation of our other executives. Assisted by the compensation consultant, the Committee regularly reviews market compensation data for executive officer positions similar to those held by our executives, including its Chief Executive Officer.
The following table sets forth the contribution to 2022 Total Direct Compensation (TDC) of each element of compensation at target, reflected as a percentage of TDC, for the Named Executive Officers. The percentages shown in this table are at target and therefore do not correspond to the amounts appearing in the Summary Compensation Table.
| | | | | | | | | | | | | | | | | |
| Percentage of TDC at Target | |
| | | Long-Term Incentives | |
| Base Salary | Annual Incentive (1) | Performance Shares (1) | | |
| Named Executive Officer | RSUs (2) | TDC |
| Werner J. Schweiger | 25% | 20% | 41% | 14% | 100% |
| John M. Moreira | 25% | 20% | 41% | 14% | 100% |
| Gregory B. Butler | 28% | 20% | 39% | 13% | 100% |
| Christine M. Carmody | 28% | 20% | 39% | 13% | 100% |
| James W. Hunt, III | 33% | 20% | 35% | 12% | 100% |
| Joseph R. Nolan, Jr. | 15% | 17% | 51% | 17% | 100% |
Philip J. Lembo (3) | 31% | 0 | 52% | 17% | 100% |
| NEO average, excluding CEO | 26.7% | 16.2% | 41.2% | 14.3% | 100% |
| NEO average, excluding CEO, Former Chairman and Former CFO | 28.5% | 20% | 38.5% | 13% | 100% |
(1) The annual incentive compensation element and performance shares under the long-term incentive compensation element are performance-based.
(2) Restricted Share Units (RSUs) vest in three equal annual installments over three years contingent upon continued employment.
(3) Mr. Lembo retired during 2022 and was not eligible to receive an Annual Incentive award for 2022.
Results of Eversource's 2022 Say-on-Pay Vote. Eversource provides its shareholders with the required opportunity to cast the annual advisory vote on executive compensation (a Say-on-Pay proposal). At Eversource’s Annual Meeting of Shareholders held on May 4, 2022, 92.27 percent of the votes cast on the Say-on-Pay proposal were voted to approve the 2021 compensation of the Named Executive Officers, as described in Eversource’s 2022 proxy statement. Eversource’s Say-on-Pay results, along with those of utility and general industry peers, are reviewed by the Committee annually to help assess whether Eversource shareholders continue to deem its executives’ compensation to be appropriate. The Committee has and will continue to consider the outcome of Eversource’s Say-on-Pay votes when making future compensation decisions for the Named Executive Officers.
ELEMENTS OF 2022 COMPENSATION
Base Salary
Base salary is designed to attract and retain key executives by providing an element of total compensation at levels competitive with those of other executives employed by companies of similar size and complexity in the utility and general industries. In establishing base salary, the Compensation Committee relies on compensation data obtained from independent third-party surveys of companies and from an industry peer group to ensure that the compensation opportunities Eversource offers are capable of attracting and retaining executives with the experience and talent required to achieve our strategic objectives. Adjustments to base salaries are generally made on an annual basis except in instances of promotions.
When setting or adjusting base salaries, the Committee considers annual executive performance appraisals; market pay movement across industries (determined through market analysis); targeted market pay positioning for each executive; individual experience; strategic importance of a position; recommendations of Eversource’s Chief Executive Officer; and internal pay equity.
Incentive Compensation
Annual incentive and long-term incentive compensation are provided under Eversource’s Incentive Plan, which was approved by shareholders in 2018. The annual incentive program provides cash compensation intended to reward performance under Eversource’s annual operating plan. The long-term stock-based incentive program is designed to reward demonstrated performance and leadership, motivate future performance, align the interests of the executives with those of shareholders, and retain the executives during the term of grants. The annual and long-term programs are designed to strike a balance between Eversource’s short- and long-term objectives so that the programs work in tandem.
In addition to the specific performance goals, the Committee assesses other factors, as well as the executives’ roles and individual performance, and then makes annual incentive program awards at the levels and amounts disclosed in this CD&A.
RISK ANALYSIS OF EXECUTIVE COMPENSATION PROGRAM
The overall compensation program includes a mix of compensation elements ranging from a fixed base salary that is not at risk to annual and long-term incentive compensation programs intended to motivate executives and other eligible employees to achieve individual and corporate performance goals that reflect an appropriate level of risk. The fundamental objective of the compensation program is to foster the continued growth and success of Eversource’s business. The design and implementation of the overall compensation program provide the Committee with opportunities throughout the year to assess risks within the compensation program that may have a material effect on Eversource and its shareholders.
The Compensation Committee assesses the risks associated with the executive compensation program on an ongoing basis by reviewing the various elements of incentive compensation. The annual incentive program is designed to ensure an appropriate balance between individual and corporate goals, which were deemed appropriate and supportive of Eversource’s annual business plan. Similarly, the long-term incentive program is designed to ensure that the performance metrics are properly weighted and supportive of Eversource’s strategy. The Committee reviewed the overall compensation program in the context of risks identified in the annual operating plan. The annual and long-term incentive programs were designed to include mechanisms to mitigate risk. These mechanisms include realistic goal setting and discretion with respect to actual payments, in addition to:
•A mix of annual and long-term performance awards to provide an appropriate balance of short- and long-term risk and reward horizon;
•A variety of performance metrics, including financial, operational, customer service, ESG, diversity, safety and strategic goals and initiatives for annual performance awards to avoid excessive focus on a single measure of performance;
•Metrics in Eversource’s long-term incentive compensation program that use earnings per share growth and relative total shareholder return, which are both robust measures of shareholder value and which reduce the risk that employees might be encouraged to pursue other objectives that increase risk or reduce financial performance;
•The provisions of Eversource’s annual and long-term incentive programs, which cap awards at 200 percent of target;
•Eversource’s expansive clawback provisions on incentive compensation, including clawback for material violations of the Eversource Code of Business Conduct; and
•Stock ownership requirements for all executives, including Eversource’s NEOs, and prohibitions on hedging, pledging and other derivative transactions related to Eversource common shares.
Based on these factors, the Compensation Committee and the Board of Trustees believe the overall compensation program risks are mitigated to reduce overall compensation risk.
2022 ANNUAL INCENTIVE PROGRAM ASSESSMENT
In early February of 2022, the Committee established the terms of the 2022 Annual Incentive Program. As part of the overall program, and after consulting with Pay Governance, the Committee set target award levels for each of Eversource’s Named Executive Officers that ranged from 70 percent to 125 percent of base salary.
At the February 2022 meeting, the Committee determined that for 2022 it would continue to base 70 percent of the annual incentive performance goals on Eversource’s overall financial performance and 30 percent of the annual performance goals on Eversource’s overall operational performance. The Committee also determined the specific goals that would be used to assess performance, with potential ratings on each goal ranging from zero percent to 200 percent of target. The Committee assigned weightings to each of the goals. For the financial component, the following goals were used: earnings per share, weighted at 60 percent, advancement of strategic growth initiatives and regulatory outcomes, weighted at 30 percent, and dividend growth, weighted at 10 percent. For the operational component, the Committee used the following goals: combined safety ratings, gas service response, diversity promotions and hires of leadership employee positions, and sustainability, customer and clean energy initiatives, weighted at 50 percent, service reliability weighted at 25 percent, and restoration of outages duration, weighted at 25 percent.
In establishing the individual annual performance goals, the Committee sets stretch goals for both the financial and operational components. Many of the goals use performance ranges, as opposed to threshold or target ranges, whereby the lower end of the performance range does not represent average or less compared to industry peers, or other similar performance benchmarks, but requires performance that exceeds industry standards, peer performance and other benchmarks in order to be met, while achievement at the higher end of the range represents superior performance. Achieving performance of these stretch goals within the particular range will therefore justify an assessment beyond target.
2022 Performance Goals
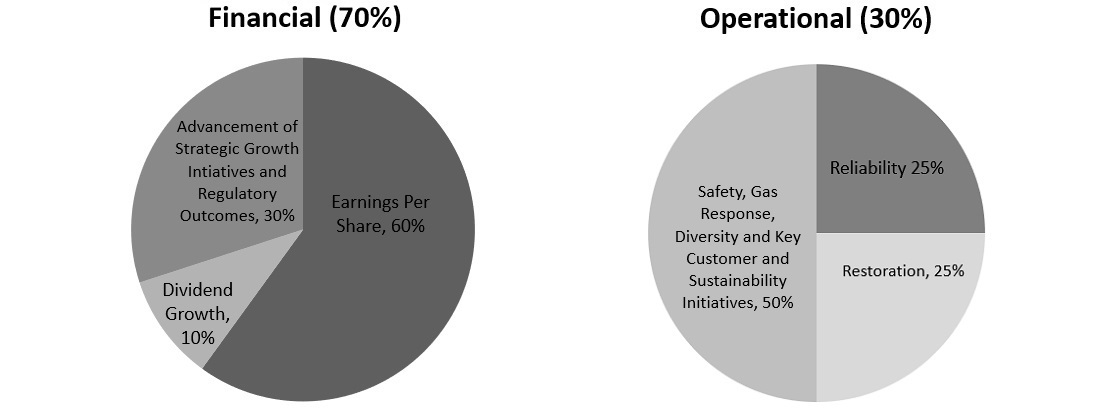
At the December 2022 meeting of the Committee, Eversource’s management provided an initial review of its 2022 performance, followed in February 2023 by a full assessment of the performance goals, the additional accomplishments noted below under the caption “Additional Factors” and the overall performance of Eversource and its executives. In addition to these meetings, the Committee and the Eversource Board were provided updates during 2022 on corporate performance. At the February 1, 2023 meeting, the Committee determined, based on its assessment of the financial and operational performance goals and the other factors noted above, to set the level of achievement of combined financial and operational performance goals results at 164 percent, reflecting the strong performance of Eversource and its executive team in executing Eversource’s Operating Plan. In arriving at this determination, the Committee determined that the weighted financial performance goals result was 118 percent and the weighted operational performance goals result was 46 percent. Eversource’s Chief Executive Officer recommended to the Committee awards for its executives (other than himself) based on his assessment of each executive’s individual performance towards achievement of the performance goals and the additional accomplishments of Eversource, together with each executive’s contributions to the overall performance of Eversource. The actual awards determined by the Committee were also based on the same criteria.
Financial Performance Goals Assessment
•FINANCIAL PERFORMANCE: Eversource’s non-GAAP earnings per share in 2022 of $4.09, which excludes the adjustment to earnings as described in Exhibit A to this Item 11, increased by 6.0 percent when compared to non-GAAP adjusted earnings per share in 2021, and exceeded the established goal of $4.06. Eversource was able to achieve this goal through effective management of the 2022 Operating Plan on a day-by-day basis, including execution of its $3.8 billion utility capital plan, and by overcoming several challenges to plan achievement, including higher than plan interest costs due to the number and scale of federal interest rate increases; higher O&M expenses caused primarily by the significant number and severity of storm events; higher employee-related costs; higher COVID-related bad debt expense; an unplanned contribution to help customers in Connecticut with the high cost of energy; and the financial and operational impacts of supply chain challenges. Please see Exhibit A to this Item 11, which provides detailed information of GAAP and non-GAAP financial information and the Committee’s determination with respect to the earnings per share goal. The Committee determined the earnings per share goal to have attained a 170 percent performance result.
•DIVIDEND GROWTH: Eversource increased its annual dividend to $2.55 per share, a 5.8 percent increase from the prior year, significantly above the utility industry’s median dividend growth of 4.5 percent for the EEI Utility Index. The Committee determined this goal to have attained a 160 percent performance result.
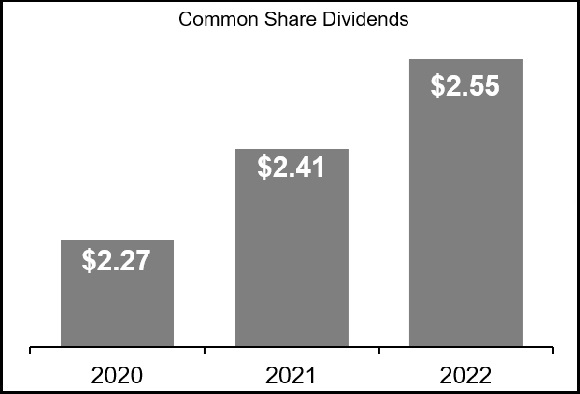
•STRATEGIC INITIATIVES AND REGULATORY OUTCOMES: Eversource successfully advanced several strategic initiatives and produced positive regulatory outcomes during 2022. Eversource made substantial progress advancing the offshore wind strategic review announced in 2022 by launching the process with potential buyers, with an announcement anticipated in the second quarter of 2023. The Eversource Gas Company of Massachusetts integration and transition that followed the Columbia Gas asset purchase was completed ahead of schedule and below budget, exiting the 115 transition service functions. In October, Eversource’s Aquarion Water subsidiary successfully completed the purchase of The Torrington Water Company, adding about 10,200 customers, and in November executed a purchase and sale agreement to acquire the Pinehills Water Company, which will add about 2,700 customers upon closing, advancing Eversource’s water customer growth initiative. NSTAR Electric’s rate case received a very favorable order, including a rate increase of $64 million, a 9.8% return on equity, and approval of an Advanced Metering Infrastructure project with timely cost recovery, an annual performance-based rate mechanism, as well as a new mechanism for better timely recovery of all other capital investments. Eversource filed with the MA DPU a creative solution that allocates cost between Transmission, Distribution and Solar Developers needed to allow Renewable Distributed Energy Resources in Massachusetts to connect to the grid. Lastly, in Massachusetts, the MA DPU issued an order supporting Eversource’s position that recent increases in property tax expense should be treated as "exogenous," allowing for full recovery. The Federal Energy Regulatory Commission approved an innovative, cost-effective transmission support agreement between Eversource and the offshore wind project, Park City Wind, enabling Eversource to integrate a necessary reliability project with the offshore wind interconnection investment, resulting in savings for customers. In New Hampshire, Eversource was successful with efforts to have the NHPUC reinstate the Energy Efficiency Customer Program and also approved a $9 million step base rate increase. After two years of negotiations and regulatory processes, Eversource received initial approval from the NHPUC allowing for the acquisition of the distribution pole plant owned by Consolidated Communications. Eversource has implemented several emergency response enhancements, including the roll out of its new outage management and community portal systems, which were well received in Connecticut, Massachusetts, and New Hampshire. In addition, Eversource’s Connecticut line worker pipeline program also received great feedback, as well as its support of the Connecticut Governor and Attorney General in helping customers with the recent extraordinary energy supply price increases. The Committee determined this goal to have attained a 170 percent performance result.
Operational Performance Goals Assessment
•RELIABILITY PERFORMANCE: Electric System Reliability, measured by months between interruptions, was top decile in the industry in 2022; customer power interruptions were on average 19.5 months apart. The Committee determined this goal to have attained a 175 percent performance result.
•RESTORATION PERFORMANCE: The average system outage duration was 65.2 minutes, which was in the top quartile of the utility industry for the fastest restoration time. The Committee determined this goal to have attained a 170 percent performance result.
•SAFETY: Eversource’s safety performance was 1.0, measured by days away, restricted or transferred (DART) per 100 workers, which met the stated goal and continues to improve over 2021, 2020 and 2019 performance. In 2022, Eversource used the DART-OSHA method of measurement for both the goal and 2022 results; 2019-2021 results shown in the graph below were converted to the DART-OSHA results method. The strong partnerships that have been developed between Eversource management and the leadership of our
unions continue to assist us in both helping safeguard employees and in advancing business initiatives. The Committee determined this goal to be underperforming due to other considerations and to have attained a 50 percent performance result.
•GAS EMERGENCY RESPONSE: On-time response to gas customer emergency calls was 97.8 percent, which continues to exceed mandated emergency response requirements. The Committee determined this goal to have attained a 175 percent performance result.
•DIVERSE LEADERSHIP: Eversource continued its successful drive to increase workforce diversity and build a diverse talent pipeline. In 2022, 61.6 percent of Eversource’s external hires were women and/or people of color and 45.1 percent of external hires and internal promotions into leadership roles were women and/or people of color, slightly above the goal of 45 percent. The Committee determined this goal to have attained a 175 percent performance result.
•SUSTAINABILITY: In 2022, Eversource achieved the target range of 85 percent to 97 percent compared to the peer group assessed by two leading sustainability rating firms, with a combined end of-year ranking of 89.5 percent. In addition, Eversource’s strong environmental, social and governance performance, including the advancement of clean energy initiatives, resulted in numerous national and local awards and recognitions noted in this Item 11. These honors are a result of Eversource’s deep commitment to corporate responsibility, evidenced by the high ratings it receives from leading sustainability raters. Eversource continues to engage with a strong cross-functional network throughout the business to advance its sustainability strategy and drive performance that addresses the evolving expectations of shareholders, customers, employees, regulators and the communities Eversource serves. Eversource continued to position its gas business for long-term success in many areas, including stakeholder engagement, geothermal pilot deployment, advancing RNG/hydrogen supply options, and other methane emission reductions. The Committee determined this goal to have attained a 125 percent performance result.
•ENHANCE THE CUSTOMER EXPERIENCE: Eversource launched the next phase of its customer information and SCADA systems impacting our Massachusetts operations and launched the next phase of its OMNI customer information system. Eversource’s new Outage Management System and Analytics Platform went live in 2022 along with a Storm Restoration Dashboard for storm events incorporating input from town and state stakeholders, all of which enhance Eversource’s emergency response capability and communication with customers. Eversource also implemented additional technologies to reduce cyber threats, modified the View and Report Outage function with the web and enhanced tools that increase customer password security standards. The Committee determined this goal to have attained a 125 percent performance result.
•CLEAN ENERGY EXECUTION: Eversource made significant progress to advance the siting of all three of its offshore wind projects (South Fork, Sunrise and Revolution Wind) at the federal and state levels, including achieving key permitting milestones and the installation of a critical duct bank system for the South Fork Wind Project. Eversource continues to advance the development of electric vehicle infrastructure in both Connecticut and Massachusetts, successfully executed its first Massachusetts Grid Modernization plan, and submitted its next round of plan investments for approval, including Advanced Metering Infrastructure. Eversource’s commitment to clean energy advanced with the completion of the Provincetown Battery Energy Storage system, as well as demonstrating industry leadership in the MA DPU’s Future of Gas Proceeding. Eversource also executed its $596 million annual energy efficiency program and received MA DPU approval for its $1 billion new energy efficiency three-year program and made solid progress in the Geothermal Pilot Program launched in the city of Framingham, Massachusetts. Eversource announced its commitment to developing Science Based emission targets and continued to position its gas business for long-term success in many areas, including stakeholder engagement, and geothermal pilot deployment. The Committee determined this goal to have attained a 150 percent performance result.
2022 Annual Incentive Program Performance Assessments
| | | | | | | | | | | |
Financial Performance Goals | | |
Category | 2022 Goal | Eversource Performance | Assessment |
Earnings Per Share | $4.06 earnings per share | Exceeded: Non-GAAP earnings per share, excluding costs noted on Exhibit A of this Item 11, equaled $4.09 per share, $0.03 ahead of plan, an increase of 6% over 2021 non-GAAP earnings per share and exceeding the average growth rate of Eversource’s peers. | 170% |
Dividend Growth | Increase dividend beyond industry average | Achieved: Increased dividend to $2.55 per share, a $0.14 increase and 5.8% growth over 2021, exceeding the industry median of 4.5% and consistent with long range plan and management guidance. | 160% |
Strategic Growth Initiatives | Advancement of Key Strategic Projects and Regulatory Outcomes | Achieved: Successfully advanced several strategic initiatives and produced positive regulatory outcomes during 2022. Eversource Gas Company of Massachusetts (EGMA) integration and transition was completed ahead of schedule and below budget, exiting the 115 transition service functions. Advanced offshore wind strategic review by launching process with prospective buyers, with an announcement anticipated in the 2nd quarter of 2023. Aquarion Company successfully completed the purchase of The Torrington Water Company, adding about 10,200 customers, and executed a purchase and sale agreement to acquire the Pinehills Water Company, which will add about 2,700 customers upon closing, advancing Eversource’s water customer growth initiative. NSTAR Electric’s distribution rate case was completed with constructive results, including a $64M rate increase and 9.8% return on equity. Filed with the MA DPU a creative solution that allocates cost between Transmission, Distribution and Solar Developers needed to allow Renewable Distributed Energy Resources in MA to connect to the grid; favorable decision on the first of six projects received. The FERC approved an innovative, cost-effective transmission support agreement between Eversource and the offshore wind project, Park City Wind, enabling Eversource to integrate a necessary reliability project, resulting in savings to customers. NHPUC reinstated EE Customer Program and approved a $9M rate increase. | 170% |
Weightings = Earnings Per Share: 60%; Dividend Growth: 10%; Strategic Growth Initiatives: 30% |
| | | | | | | | | | | |
Operational Performance Goals | | |
Category | 2022 Goal | Eversource Performance | Assessment |
Reliability – Average Months Between Interruptions (MBI) | Achieve MBI of within 17.2 to 19.2 months | Exceeded: MBI = 19.5 months. At the top level of the performance goal’s range and in the top decile of the industry peer group. | 175% |
Average Restoration Duration (SAIDI) | Achieve SAIDI of 63 to 76 minutes | Achieved: SAIDI = 65.2 minutes. At the top level of the performance range, and in the top quartile of the industry group as measured by recognized industry standards. | 170% |
Safety Rate (Days Away Restricted Time (DART)) | 1.0 – 1.4 DART | Achieved: 1.0 DART – At the lower (good) end of the performance goal range; outperformed industry; despite these strong numeric results, the performance assessment was reduced in recognition of the death of an employee who ultimately succumbed to injuries incurred on the job. | 50% |
Gas Service Response | 95% - 97% on time | Achieved: 97.8%; Performance above industry average, meeting or exceeding all regulatory requirements, and above the level of the performance goal range. | 175% |
Diverse Leadership | 40% - 45% diverse hires or promotions of leadership level | Exceeded: 45.1% - 200 out of 443 of Eversource’s promotions and hires were women and/or people of color and 61.6% of external hires were women and/or people of color. | 175% |
Sustainability Ranking | 85th percentile – 97th percentile vs. US peer companies | Achieved: At 89.5th percentile, Eversource’s performance was first quartile; received numerous recognitions and awards acknowledging Eversource’s sustainability excellence again in 2022. | 125% |
Enhance the Customer Experience | Continued enhancement and efficient execution of Emergency Response Plan, OMNI Customer Information System and new SCADA system and new OMS and analytics program | Achieved: Successful go-live transition of EGMA’s Customer Information System (CIS) and new SCADA system with no system interruptions, while delivering excellent employee and customer experience. Next phase of the OMNI CIS implementation impacting other MA operations has been launched. Advanced Metering Infrastructure plan approved by the MA DPU. Outage Management System and Analytics Platform went live in 2022 along with a Storm Restoration Dashboard for storm events, incorporating input from town and state stakeholders, all of which enhance Eversource’s Emergency Response capability and communication with customers. Additional technologies were implemented to reduce cyber threats. Modified the View and Report Outage function and enhanced tools that increase customer password security standards. | 125% |
Clean Energy Execution | Successfully advance and execute clean energy initiatives | Achieved: Successfully advanced several additional clean energy initiatives, including the offshore wind ventures, completion of a critical duct bank installation on Long Island and receipt of key permits for all three projects. Advanced the electric vehicle infrastructure program development in CT and site installations in MA, advancing clean energy leadership in New England. Completed Provincetown Battery Energy Storage system; Geothermal Pilot Program launched in the city of Framingham, MA, as well as demonstrating industry leadership in the MA DPU Future of Gas Proceeding. Phase I of the new MA solar program was filed with the MA DPU, while the MA DPU issued a favorable order on the next Grid Mod phase. Once again, Eversource received the ENERGY STARTM Partner of the Year Sustained Excellence Award from the Environmental Protection Agency and U.S. Department of Energy. Advanced clean energy leadership by announcing a commitment to developing “Science Based Targets” for cross-sector emission reductions. | 150% |
Weightings = Reliability: 25%; Restoration: 25%; Safety, Gas Response, Diversity, Sustainability and Key Initiatives: 50% |
| | | | | |
Performance Goals Assessment | |
Financial Performance at 169% (weighted 70%) | 118% |
Operational Performance at 154% (weighted 30%) | 46% |
Overall Performance | 164% |
Additional Factors
The following important financial, strategic, environmental and customer-focused results were also considered by the Committee in assessing overall financial and operational performance:
•Newsweek magazine ranked Eversource as the #1 energy company in its 2023 list of the Most Responsible Companies. This listing determines the most responsible companies of 2022 based on their corporate social sustainability performance and reputation.
•Eversource was again ranked in the top 100 of America’s Most Just Companies for 2022 by Forbes/JUST Capital in partnership with CNBC. The listing recognizes corporate social responsibility and commitment to local communities and celebrates public companies for their positive impact and leadership on priorities such as ethical leadership, environmental impact, customer treatment, shareholder return, fair pay and benefits, and equal opportunity.
•Eversource was recognized again by the U.S. Department of Labor as a HIRE Vets Medallion Award recipient for its commitment to recruiting, employing, and retaining veterans.
•As You Sow named Eversource a Top 10 Company on both their Racial Justice and DE&I scorecards.
•Eversource was again selected to be included in the Bloomberg Gender-Equality Index, which recognizes companies that have shown their commitment to advancing women’s equality in the workplace and transparency in gender reporting.
•Eversource was recognized as one of America’s “best employers for diversity” by Forbes magazine, which surveyed over 50,000 U.S. employees regarding age, gender, ethnicity, LGBTQA and diversity in their current workplace.
•Eversource was recognized as a finalist for the Healthiest Employer Program for our commitment to workplace wellness and exceptional health benefits.
•Eversource was again selected as a “most honored” company by Institutional Investor magazine for industry leading ESG, investor relations and multiple other categories as voted by institutional investors.
•Eversource was on Barron’s 2022 Most Sustainable Companies list. Barron’s based its list on performance indicators that address environmental, social and governance matters.
•Eversource’s 2022 charitable giving totaled $15.8 million, including major event lead sponsorships for the Eversource Walk for Children’s Hospital of Boston, Eversource Walk and 5K Run for Easterseals New Hampshire, Mass General Cancer Center/Eversource Every Day Amazing Race, Eversource Hartford Marathon, Travelers Championship, and Special Olympics in Connecticut and New Hampshire.
Individual Executives' Performance Factors Considered by the Committee
It is the Committee’s philosophy to provide incentives for Eversource executives to work together as a highly effective, integrated team to achieve or exceed the financial, operational, safety, customer, sustainability, strategic and diversity goals and objectives. The Committee also reviews and assesses individual executive performance. The Committee based the annual incentive payments on team performance and the Committee’s assessment of each executive’s individual performance in supporting the performance goals, additional achievements, and overall results of Eversource. With respect to Eversource’s Chief Executive Officer, the Committee and the independent Trustees assessed performance. Based on the recommendations of the Chief Executive Officer as to executives other than himself, the Committee assessed the performance of the active Named Executive Officers and Eversource to be excellent in totality and approved annual incentive program payments for the active Named Executive Officers noted in the Summary Compensation Table at levels that ranged from 149 percent to 185 percent of target. These payments reflected the individual and team contributions of those Named Executive Officers in achieving the goals and the additional accomplishments and Eversource’s overall performance.
In determining Mr. Nolan’s annual incentive payment of $2,688,000, which was 166 percent of target, and which reflect his and Eversource’s excellent 2022 performance, the Committee and the Board considered the totality of Eversource’s success in accomplishing the goals set by the Committee and Mr. Nolan’s performance in leading Eversource to another very successful year financially, operationally, in Eversource’s continuing successful efforts in all areas of ESG, and in overcoming several challenges resulting from substantial storm expenses and interest rate hikes along with the impacts of inflation and supply chain issues.
| | | | | | | | |
| 2022 and 2021 Annual Incentive Program Awards |
| Named Executive Officer | 2022 Award | 2021 Award |
| Werner J. Schweiger | $ | 1,050,000 | $ | 1,000,000 |
John M. Moreira (1) | 900,000 | — |
| Gregory B. Butler | 720,000 | 700,000 |
| Christine M. Carmody | 720,000 | 650,000 |
James W. Hunt, III (1) | 500,000 | — |
| Joseph R. Nolan, Jr. | 2,688,000 | 2,250,000 |
Philip J. Lembo (2) | — | 1,050,000 |
(1) Messrs. Moreira and Hunt were not Named Executive Officers in 2021.
(2) Mr. Lembo retired during 2022 and was not eligible to receive an Annual Incentive Award for 2022.
Long-Term Incentive Program
Eversource’s long-term incentive program is intended primarily to focus on Eversource’s longer-term strategic goals and to also help retain its executives. A new three-year program commences every year. Performance Shares are designed to reward long-term achievements as measured against pre-established performance measures. RSUs are designed to provide executives with an incentive to increase the value of Eversource common shares in alignment with shareholder interests, while also serving as a retention component for executive talent. Eversource’s believes these compensation elements create a focus on continued company and share price growth to further align the interests of the executives with the interests of shareholders.
Performance Share Grants
General
Performance Shares are designed to reward future financial performance, measured by long-term earnings growth and shareholder returns over a three-year performance period, therefore aligning executive compensation with performance. Performance Shares are granted as a target number of Eversource Energy common shares. The number of Performance Shares is determined by dividing the target grant value in dollars by the average daily closing price of Eversource common shares on the New York Stock Exchange for the ten business days preceding the grant date and rounding to the nearest whole share. Until the end of the performance period, the value of dividends that would have been paid with respect to the Performance Shares had the Performance Shares been actual common shares are deemed to be invested in additional Performance Shares, which remain at risk and are not distributed until actual performance for the period is determined and vesting takes place.
Performance Shares under the 2022 – 2024, 2021 – 2023 and 2020 – 2022 Programs
For the 2022 – 2024 Program, the Committee determined it would continue to measure performance using: (i) average diluted earnings per share growth (EPSG); and (ii) relative total shareholder return (TSR) measured against the performance of companies that comprise the EEI Index. As in previous years, the Committee selected EPSG and TSR as performance measures because the Committee continues to believe that they are generally recognized as the best indicators of overall corporate performance. The Committee considers it a best practice to use a combination of relative and absolute metrics, with absolute EPS growth serving as a key input to shareholder value and relative TSR serving as the output.
For the 2021 – 2023 Program, the Committee also increased the percentage of total long-term incentive opportunity that is provided in Performance Shares to 75 percent and decreased the percentage of total long-term incentive opportunity that is provided in RSUs to 25 percent.
The number of Performance Shares awarded at the end of the three-year period ranges from zero percent to 200 percent of target, depending on EPSG and relative TSR performance as set forth in the performance matrices below. Performance Share grants are based on a percentage of annualized base salary at the time of the grant and are measured in dollars. The target number of shares under the 2022 – 2024 Program for Eversource’s Named Executive Officers ranged from 105 percent to 368 percent of base salary. Vesting at 100 percent of target occurs at various combinations of EPSG and TSR performance as set forth in the charts that follow. In addition, the value of any performance shares that actually vest may increase or decrease over the vesting period based on Eversource’s share price performance. The number of performance shares granted at target were approved as set forth in the table below. The Committee and the independent members of Eversource’s Board determined the Performance Share grants for Eversource’s Chief Executive Officer and the Executive Chairman. Based on input from Eversource’s Chief Executive Officer, the Committee determined the Performance Share grants for each of the other executive officers, including the other Named Executive Officers. For all three programs, the Committee used the same performance measures of EPSG and TSR.
The performance matrices set forth below describe how the Performance Share payout was determined under the 2020 – 2022 Program and how the Performance Share payout will be determined under the 2021 – 2023 Program and the 2022 – 2024 Program. Three-year average EPSG is cross-referenced with the actual three-year TSR percentile to determine actual performance share payout as a percentage of target.
| | | | | | | | | | | | | | | | | | | | | | | | | | | | | | | | |
| 2020 — 2022 Long-Term Incentive Program Performance Share Potential Payout |
Three-Year
Average
EPS Growth | Three-Year Relative Total Shareholder Return Percentiles |
Below
10th | 20th | 30th | 40th | 50th | 60th | 70th | 80th | 90th | Above 90th |
| 9.5% | 110% | 120% | 130% | 140% | 150% | 160% | 170% | 180% | 190% | 200% |
| 8.5% | 100% | 110% | 120% | 130% | 140% | 150% | 160% | 170% | 180% | 190% |
| 7.5% | 90% | 100% | 110% | 120% | 130% | 140% | 150% | 160% | 170% | 180% |
| 6.5% | 80% | 90% | 100% | 110% | 120% | 130% | 140% | 150% | 160% | 170% |
| 5.5% | 70% | 80% | 90% | 100% | 110% | 120% | 130% | 140% | 150% | 160% |
| 4.5% | 60% | 70% | 80% | 90% | 100% | 110% | 120% | 130% | 140% | 150% |
| 3.5% | 40% | 50% | 70% | 80% | 90% | 100% | 110% | 120% | 130% | 140% |
| 2.5% | 20% | 40% | 60% | 70% | 80% | 90% | 100% | 110% | 120% | 130% |
| 1.5% | — | 10% | 40% | 60% | 70% | 80% | 90% | 100% | 110% | 120% |
| 0.5% | — | — | 20% | 30% | 50% | 70% | 80% | 90% | 100% | 110% |
| 0.0% | — | — | — | 10% | 20% | 30% | 40% | 50% | 70% | 70% |
| Below 0% | — | — | — | — | 10% | 20% | 30% | 40% | 50% | 60% |
| | | | | | | | | | | | | | | | | | | | | | | | | | | | | | | | |
| 2021 — 2023 and 2022 — 2024 Long-Term Incentive Program Performance Share Potential Payout |
Three-Year
Average
EPS Growth | Three-Year Relative Total Shareholder Return Percentiles |
Below
10th | 20th | 30th | 40th | 50th | 60th | 70th | 80th | 90th | Above 90th |
| 10.0% | 110% | 120% | 130% | 140% | 150% | 160% | 170% | 180% | 190% | 200% |
| 9.0% | 100% | 110% | 120% | 130% | 140% | 150% | 160% | 170% | 180% | 190% |
| 8.0% | 90% | 100% | 110% | 120% | 130% | 140% | 150% | 160% | 170% | 180% |
| 7.0% | 80% | 90% | 100% | 110% | 120% | 130% | 140% | 150% | 160% | 170% |
| 6.0% | 70% | 80% | 90% | 100% | 110% | 120% | 130% | 140% | 150% | 160% |
| 5.0% | 60% | 70% | 80% | 90% | 100% | 110% | 120% | 130% | 140% | 150% |
| 4.0% | 40% | 50% | 70% | 80% | 90% | 100% | 110% | 120% | 130% | 140% |
| 3.0% | 20% | 40% | 60% | 70% | 80% | 90% | 100% | 110% | 120% | 130% |
| 2.0% | — | 10% | 40% | 60% | 70% | 80% | 90% | 100% | 110% | 120% |
| 1.0% | — | — | 20% | 30% | 50% | 60% | 80% | 80% | 100% | 110% |
| 0.0% | — | — | — | 10% | 20% | 30% | 40% | 50% | 60% | 70% |
| Below 0% | — | — | — | — | 10% | 20% | 30% | 40% | 50% | 60% |
| | | | | |
Long-Term Incentive Program Performance Share Grants at Target |
Named Executive Officer | 2022 — 2024
Performance Share Grant |
Werner J. Schweiger | 15,089 |
John M. Moreira | 2,911 |
Gregory B. Butler | 10,739 |
Christine M. Carmody | 8,672 |
James W. Hunt, III | 5,663 |
Joseph R. Nolan, Jr. | 54,871 |
Philp J. Lembo | 14,111 |
Results of the 2020 – 2022 Performance Share Program
The 2020 – 2022 Program was completed on December 31, 2022. The actual performance level achieved under the Program was a three-year average adjusted EPS growth of 5.8 percent and a three-year total shareholder return at the 45th percentile, which, when interpolated in accordance with the criteria established by the Committee, resulted in vesting performance share units at 108 percent of target. 2020, 2021 and 2022 non-GAAP earnings per share, as described in Exhibit A to this Item 11, were the basis for performance level assessment determined by the Committee at its February 2021, 2022 and 2023 meetings. At its February 1, 2023 meeting, the Committee confirmed that the actual results achieved were calculated in accordance with established performance criteria. The number of Performance Shares awarded to the Named Executive Officers were approved as set forth in the table below.
| | | | | |
2020 – 2022 Long-Term Incentive Program
Performance Share Awards |
Named Executive Officer | Performance
Share Award |
Werner J. Schweiger | 10,870 |
John M. Moreira | 2,036 |
Gregory B. Butler | 7,739 |
Christine M. Carmody | 6,250 |
James W. Hunt, III | 1,964 |
Joseph R. Nolan, Jr. | 8,965 |
Philp J. Lembo | 10,164 |
Restricted Share Units (RSUs)
General
Each RSU granted under the long-term incentive program entitles the holder to receive one common share at the time of vesting. All RSUs granted under the long-term incentive program vest in equal annual installments over three years. RSU holders are eligible to receive reinvested dividend units on outstanding RSUs held by them to the same extent that dividends are declared and paid on Eversource common shares. Reinvested dividend equivalents are accounted for as additional RSUs that accrue and are distributed with the common shares issued upon vesting of the underlying RSUs. Common shares, including any additional common shares in respect of reinvested dividend equivalents, are not issued for any RSUs that do not vest.
The Committee determined RSU grants for each Eversource executive officer participating in the long-term incentive program. RSU grants are based on a percentage of annualized base salary at the time of the grant. In 2022, the percentage used for each Named Executive Officer was based on their position in Eversource and ranged from 45 percent to 123 percent of base salary. The Committee reserves the right to increase or decrease the RSU grant from target for each executive officer under special circumstances. The Committee and all other independent members of the Eversource Board determined the RSU grants for the Eversource Chief Executive Officer and the Executive Chairman. Based on input from Eversource’s Chief Executive Officer, the Committee determined the RSU grants for each of the other executive officers, including the other Named Executive Officers.
All RSUs are granted on the date of the Committee meeting at which they are approved. RSU grants are subsequently converted from a percent of salary into common share equivalents by dividing the value of each grant by the average closing price for Eversource common shares over the ten trading days prior to the date of the grant. RSU grants at 100 percent of target were approved as set forth in the table below.
| | | | | | | | | | | |
| RSUs Granted |
| Named Executive Officer | 2020 | 2021 (1) | 2022 |
| Werner J. Schweiger | 9,235 | 4,782 | 5,030 |
John M. Moreira (2) | — | — | 970 |
| Gregory B. Butler | 6,575 | 3,404 | 3,580 |
Christine M. Carmody (3) | — | 2,749 | 2,891 |
James W. Hunt, III (2) | — | — | 5,663 |
| Joseph R. Nolan, Jr. | 7,616 | 3,944 | 18,290 |
| Philip J. Lembo | 8,635 | 4,472 | 4,704 |
(1) Reflects change for 2021 to 75 percent Performance Shares/25 percent RSUs.
(2) Messrs. Moreira and Hunt were not Named Executive Officers in 2020 and 2021.
(3) Ms. Carmody was not a Named Executive Officer in 2020.
Clawbacks
If Eversource’s earnings were to be restated as a result of noncompliance with accounting rules caused by fraud or misconduct, or if any plan participant engages in a willful material violation of our Code of Business Conduct or material corporate policy, or the breach of a material covenant in an employment agreement, as determined by the Board of Trustees, the participant will be required by our 2018 Incentive Plan to reimburse us for incentive compensation awards received by them for that year. Eversource is aware of the new clawback rules and will amend its clawback policy over the next year to be in compliance with the new rules.
No Hedging and No Pledging Policy
Eversource has a long-standing policy prohibiting the purchase of any financial instruments or otherwise entering into transactions designed to have the effect of hedging or offsetting any decrease in the value of Eversource common shares or other equity securities of Eversource or its subsidiaries by its Trustees and executives, including exchange-traded options to purchase or sell Eversource securities (so-called “puts” and “calls”) or financial instruments that are designed to hedge or offset any decrease in the market value of Eversource securities (including, but not limited to, prepaid variable forward contracts, equity swaps, collars and exchange funds). This policy also prohibits short sales, the holding of any Eversource common shares in a margin account, borrowing shares, selling future securities that establish a position that increases in value as the
value of Eversource’s shares decreases, or pledging Eversource common shares. The policy applies to Eversource Trustees and executives but not to non-executives and does not apply to broad-based index funds or similar transactions.
Share Ownership Guidelines and Retention Requirements
The Committee has approved share ownership guidelines to further emphasize the importance of share ownership by officers. As indicated in the table below, the guidelines call for Eversource’s Chief Executive Officer to own common shares equal to six times base salary, executive vice presidents to own a number of common shares equal to three times base salary, senior vice presidents to own common shares equal to two times base salary, and all other officers to own a number of common shares equal to one to one and one-half times base salary. Officers and Eversource Trustees may only transact in Eversource Energy common shares during approved trading windows and are subject to continuing compliance with these share ownership guidelines.
| | | | | |
Executive Officer | Base Salary Multiple |
Chief Executive Officer/Executive Chairman | 6 |
Executive Vice Presidents | 3 |
Operating Company Presidents / Senior Vice Presidents | 2 |
Vice Presidents | 1 – 1.5 |
Eversource requires that its officers attain these ownership levels within five years after promotion. All officers, including the Named Executive Officers, have either satisfied the share ownership guidelines or are expected to satisfy them within the applicable timeframe. Common shares, whether held of record, in street name, or in individual 401(k) accounts, and RSUs satisfy the ownership requirements. Unvested performance shares do not count toward satisfying the ownership guidelines. In addition to the share ownership guidelines noted above, all officers must hold the net shares awarded under Eversource’s incentive compensation plan until the share ownership guidelines have been met.
Other Benefits
Retirement Benefits
Eversource provides a qualified defined benefit pension program for certain officers, which is a final average pay program subject to tax code limits. Because of such limits, Eversource also maintains a supplemental non-qualified pension program. Benefits are based on base salary and certain incentive payments, which is consistent with the goal of providing a retirement benefit that replaces a percentage of pre-retirement income. The supplemental program compensates for benefits barred by tax code limits, and generally provides (together with the qualified pension program) benefits equal to approximately 60 percent of pre-retirement compensation (approximately 50 percent of such compensation for Mr. Butler). The supplemental program was discontinued in 2012 for newly elected officers.
For certain participants, the benefits payable under the Supplemental Non-Qualified Pension Program differ from those described above. The program benefit payable to Mr. Schweiger is fully vested and is further reduced by benefits he is entitled to receive under previous employers’ retirement plans.
Also see the narrative accompanying the “Pension Benefits” table and accompanying notes for more detail on the above program.
401(k) Benefits
Eversource offers a qualified 401(k) program for all employees, including executives, subject to tax code limits. After applying these limits, the program provides a match of 50 percent of the first eight percent of eligible base salary, up to a maximum of $12,200 per year for Messrs. Schweiger, Moreira, Hunt, Nolan and Lembo, and Ms. Carmody. For Mr. Butler, the program provides a match of 100 percent of the first three percent of eligible base salary, up to a maximum of $9,150 per year.
Deferred Compensation
Eversource offers a non-qualified deferred compensation program for its executives. In 2022, the program allowed deferral of up to 100 percent of base salary, annual incentives and long-term incentive awards. The program allows participants to select investment measures for deferrals based on an array of deemed investment options (including certain mutual funds and publicly traded securities).
See the Non-Qualified Deferred Compensation Table and accompanying notes for additional details on the above program.
Perquisites
Eversource provides executives with limited financial planning benefits, vehicle leasing and access to tickets to sporting events. The current level of perquisites does not factor into decisions on total compensation.
Contractual Agreements
Eversource currently maintains contractual agreements with certain of our Named Executive Officers that provide for potential compensation in the event of certain terminations, including termination following a Change in Control. These agreements were made to attract and retain high quality executives and to ensure executive focus on Eversource’s business during the period leading up to a potential Change in Control, though we have not entered into a Change in Control or employment agreement with any executive since 2010. The agreements are “double-trigger” agreements that provide executives with compensation in the event of a Change in Control followed by termination of employment due to one or more of the events set forth in the agreements, while still providing an incentive to remain employed with Eversource for the transition period that follows.
Under the agreements, certain compensation is generally payable if, during the applicable change in control period, the executive is involuntarily terminated (other than for cause) or terminates employment for “good reason.” These agreements are described more fully in the Tables following this CD&A under “Payments Upon Termination.”
Tax and Accounting Considerations
Section 162(m) of the Internal Revenue Code precludes a public company from taking an income tax deduction in any one year for compensation in excess of $1 million payable to its named executive officers who are employed on the last day of the fiscal year, unless certain specific performance goals are satisfied. Until January 1, 2018, there was an exception to the $1 million limitation for performance-based compensation meeting certain requirements. This exception was repealed, effective for taxable years beginning after December 31, 2017, and the limitation on deductibility generally was expanded to include all Named Executive Officers. As a result, compensation paid to the Named Executive Officers in excess of $1 million per officer will not be deductible unless it qualifies for transition relief applicable to certain arrangements in place as of and not modified after November 2, 2017.
The Committee believes that the availability of a tax deduction for forms of compensation should be one of many factors taken into consideration of providing market-based compensation to attract and retain highly qualified executives. The Committee believes it is in Eversource’s best interests to retain discretion to make compensation awards, whether or not deductible.
Eversource has adopted the provisions of Financial Accounting Standards Board (FASB) Accounting Standards Codification (ASC) Topic 718, Compensation-Stock Compensation. In general, Eversource and the Committee do not consider accounting considerations in structuring compensation arrangements.
Equity Grant Practices
Equity awards noted in the compensation tables are made annually at the February meeting of the Compensation Committee (subject to further approval by all of the independent members of Eversource’s Board of Trustees of the Chief Executive Officer’s and Executive Chairman’s award) when the Committee also determines base salary, annual incentive opportunities, long-term incentive compensation grants, and annual and long-term performance plan awards. The date of this meeting is chosen at least a year in advance, and therefore awards are not coordinated with the release of material non-public information.
SUMMARY COMPENSATION TABLE
The table below summarizes the total compensation paid or earned by CL&P’s principal executive officer (Mr. Schweiger), CL&P’s principal financial officer (Mr. Moreira), the three other most highly compensated executive officers in 2022, Mr. Nolan, who served as Chairman of the Board of CL&P during a portion of 2022, and Mr. Lembo, who served as Executive Vice President and Chief Financial Officer of CL&P during a portion of 2022, determined in accordance with the applicable SEC disclosure rules (collectively, the Named Executive Officers). As explained in the tables and footnotes below, the amounts reflect the economic benefit to each Named Executive Officer of the compensation item paid or accrued on their behalf for the fiscal year ended December 31, 2022 in accordance with such rules. All salaries, annual incentive amounts and long-term incentive amounts shown for each Named Executive Officer were paid for all services rendered to Eversource Energy and its subsidiaries, including CL&P, in all capacities.
| | | | | | | | | | | | | | | | | | | | | | | | | | | | | | | | | | | | | | | | | | | | |
Name and Principal Position | Year | Salary | | Stock Awards (7) | | Non-Equity Incentive Plan (8) | | Change in Pension Value and Non- Qualified Deferred Earnings (9) | | All Other Compen- sation (10) | | SEC Total | | Adjusted SEC Total (11) |
| Werner J. Schweiger (1) | 2022 | $ | 787,693 | | | 1,877,101 | | | 1,050,000 | | | — | | | 20,589 | | | $ | 3,735,383 | | | $ | 3,735,383 | |
| Executive Vice President and Chief Operating Officer of Eversource Energy and Chairman of the Board and Chief Executive Officer of CL&P | 2021 | 770,001 | | | 1,748,151 | | | 1,000,000 | | | 852,718 | | | 19,989 | | | 4,390,859 | | | 3,538,141 | |
| 2020 | 765,885 | | | 1,721,496 | | | 950,000 | | | 2,698,083 | | | 20,657 | | | 6,156,121 | | | 3,458,038 | |
| John M. Moreira (2) | 2022 | 543,056 | | | 362,099 | | | 900,000 | | | 419,646 | | | 12,200 | | | 2,237,001 | | | $ | 1,817,355 | |
| Executive Vice President, Chief Financial Officer and Treasurer of Eversource Energy and CL&P | | | | | | | | | | | | | | |
| Gregory B. Butler | 2022 | 685,387 | | | 1,335,961 | | | 720,000 | | | — | | | 12,106 | | | 2,753,454 | | | 2,753,454 | |
| Executive Vice President and General Counsel of Eversource Energy and CL&P | 2021 | 670,002 | | | 1,244,544 | | | 700,000 | | | 2,611,448 | | | 11,656 | | | 5,237,650 | | | 2,626,202 | |
| 2020 | 670,292 | | | 1,225,646 | | | 700,000 | | | 1,637,907 | | | 15,839 | | | 4,249,684 | | | 2,611,777 | |
| Christine M. Carmody (3) | 2022 | 553,808 | | | 1,078,826 | | | 720,000 | | | — | | | 20,583 | | | 2,373,217 | | | 2,373,217 | |
| Executive Vice President-Human Resources and Info Technology of Eversource Energy | 2021 | 541,001 | | | 1,005,122 | | | 650,000 | | | 645,323 | | | 19,983 | | | 2,861,429 | | | 2,216,106 | |
| James W. Hunt, III (4) | 2022 | 458,077 | | | 854,553 | | | 500,000 | | | 127,089 | | | 22,852 | | | 1,962,571 | | | 1,835,482 | |
| Executive Vice President-Corporate Relations and Sustainability and Secretary of Eversource Energy | | | | | | | | | | | | | | |
| Joseph R. Nolan, Jr. (5) | 2022 | 1,273,078 | | | 6,825,923 | | | 2,688,000 | | | 2,143,443 | | | 28,690 | | | 12,959,134 | | | 10,815,691 | |
| Chairman of the Board, President and Chief Executive Officer of Eversource Energy; Former Chairman of CL&P | 2021 | 1,004,424 | | | 1,441,650 | | | 2,250,000 | | | 1,705,782 | | | 65,222 | | | 6,467,078 | | | 4,761,296 | |
| 2020 | 630,962 | | | 1,419,699 | | | 850,000 | | | 2,134,658 | | | 18,921 | | | 5,054,240 | | | 2,919,582 | |
| Philip J. Lembo (6) | 2022 | 642,497 | | | 1,755,438 | | | — | | | — | | | 26,285 | | | 2,424,220 | | | 2,424,220 | |
| Retired Executive Vice President and Chief Financial Officer of Eversource Energy and CL&P | 2021 | 720,001 | | | 1,634,650 | | | 1,050,000 | | | 713,766 | | | 20,685 | | | 4,139,102 | | | 3,425,336 | |
| 2020 | 718,846 | | | 1,609,650 | | | 950,000 | | | 1,248,852 | | | 21,985 | | | 4,549,333 | | | 3,300,481 | |
(1) Mr. Schweiger was elected Chairman of the Board of CL&P on May 27, 2022.
(2) Mr. Moreira was elected Executive Vice President, Chief Financial Officer and Treasurer of Eversource Energy and CL&P on May 4, 2022. He was not a Named Executive Officer in 2020 and 2021.
(3) Ms. Carmody was not a Named Executive Officer in 2020.
(4) Mr. Hunt was not a Named Executive Officer in 2020 and 2021.
(5) Mr. Nolan served as Chairman of the Board and a director of CL&P from May 5, 2021 to May 27, 2022.
(6) Mr. Lembo transitioned to a non-executive role on May 4, 2022, and retired effective November 30, 2022.
(7) RSUs were granted to each Named Executive Officer in 2022 as long-term compensation, which vest in equal annual installments over three years. Each of the Named Executive Officers, except for Mr. Lembo, was also granted performance shares as long-term incentive compensation. These performance shares will vest based on the extent to which the performance conditions described in the CD&A are achieved as of December 31, 2024. The grant date fair values for the performance shares, assuming achievement of the highest level of both performance conditions, are as follows: Mr. Schweiger: $2,100,389; Mr. Moreira: $405,211; Mr. Butler: $1,494,869; Ms. Carmody: $1,207,142; Mr. Hunt: $788,290 and Mr. Nolan: $7,683,043.
Holders of RSUs and performance shares are eligible to receive dividend equivalent units on outstanding awards to the same extent that dividends are declared and paid on Eversource common shares. Dividend equivalent units are accounted for as additional common shares that accrue and are distributed simultaneously with those common shares that are issued upon vesting of the underlying RSUs and performance shares. No dividends are paid unless and until the underlying shares vest.
(8) Consists of payments to the Named Executive Officers under the 2022 Annual Incentive Program. Mr. Lembo retired during 2022 and was not eligible to receive an Annual Incentive Award for 2022.
(9) Includes the actuarial increase in the present value from December 31, 2021 to December 31, 2022 of the Named Executive Officers’ accumulated benefits under all of our defined benefit pension programs and agreements, determined using interest rate and mortality rate assumptions consistent with those appearing in the footnotes to our Annual Report on Form 10-K for the fiscal year ended December 31, 2022. The Named Executive Officer may not be fully vested in such amounts. More information on this topic is set forth in the Pension Benefits table. There were no above-market earnings in deferred compensation value during 2022, as the terms of the Deferred Compensation Plan provide for market-based investments, including Eversource common shares.
(10) Includes matching contributions allocated by us to the accounts of Named Executive Officers under the 401k Plan as follows: $12,200 for each of Messrs. Schweiger, Moreira, Hunt, Nolan and Lembo, and Ms. Carmody, and $9,150 for Mr. Butler. For Mr. Nolan, the value shown includes financial planning services valued at $10,000, $4,085, representing the value in 2022 of a company-owned vehicle provided to Mr. Nolan, and $2,405 for home security systems provided in accordance with the company’s security protocols. For Mr. Lembo, the value shown includes financial planning services valued at $10,500, and $3,585, representing the value in 2022 of a company-owned vehicle provided to Mr. Lembo. None of the other Named Executive Officers received perquisites valued in the aggregate in excess of $10,000.
(11) The amounts in the Adjusted SEC Total column reflect an adjustment to the total compensation reported in the column marked SEC Total. The Adjusted SEC Total subtracts the actuarial change in pension value disclosed in the column titled “Change in Pension Value and Non-Qualified Deferred Earnings” as further described in footnote 6 above in order to reflect compensation earned during the year by the executive without consideration of pension benefit impacts. The amounts in this column differ substantially from, and are not a substitute for, the amounts noted in the SEC Total.
GRANTS OF PLAN-BASED AWARDS DURING 2022
The Grants of Plan-Based Awards Table below provides information on the range of potential payouts under all incentive plan awards during the fiscal year ended December 31, 2022. The table also discloses the underlying equity awards and the grant date for equity-based awards. Eversource has not granted any stock options since 2002.
| | | | | | | | | | | | | | | | | | | | | | | | | | | | | | | | |
| | | | | | | | | All Other Stock Awards: Number of Shares of Stock or Units (#) (2) | Grant Date Fair Value of Stock and Option Awards ($) (3) |
| | Estimated Future Payouts Under
Non-Equity Incentive Plan Awards | | Estimated Future Payouts Under Equity Incentive Plan Awards (1) |
| | Grant Date | Threshold
($) | Target
($) | Maximum
($) | | Threshold
($) | Target
(#) | Maximum
(#) |
| Name |
| Werner J. Schweiger | | | | | | | | | | |
Annual Incentive (4) | 2/2/2022 | $ | 317,000 | | $ | 634,000 | | $ | 1,268,000 | | | $ | — | | $ | — | | $ | — | | $ | — | | $ | — | |
Long-Term Incentive (5) | 2/2/2022 | — | | — | | — | | | — | | 15,089 | | 30,178 | | 5,030 | | 1,877,101 | |
| John M. Moreira | | | | | | | | | | |
Annual Incentive (4) | 2/2/2022 | 250,000 | 500,000 | 1,000,000 | | — | — | — | — | — |
Long-Term Incentive (5) | 2/2/2022 | — | — | — | | — | 2,911 | 5,822 | 970 | 362,099 |
| Gregory B. Butler | | | | | | | | | | |
Annual Incentive (4) | 2/2/2022 | 241,500 | 483,000 | 966,000 | | — | — | — | — | — |
Long-Term Incentive (5) | 2/2/2022 | — | — | — | | — | 10,739 | 21,478 | 3,580 | 1,335,961 |
| Christine M. Carmody | | | | | | | | | | |
Annual Incentive (4) | 2/2/2022 | 195,000 | | 390,000 | | 780,000 | | | — | | — | | — | | — | | — | |
Long-Term Incentive (5) | 2/2/2022 | — | | — | | — | | | — | | 8,672 | | 17,344 | | 2,891 | | 1,078,826 | |
| James W. Hunt, III | | | | | | | | | | |
Annual Incentive (4) | 2/2/2022 | 140,500 | | 281,000 | | 562,000 | | | — | — | — | — | — |
Long-Term Incentive (5) | 2/2/2022 | — | — | — | | — | 5,663 | 1,888 | 3,580 | 854,553 |
| Joseph R. Nolan, Jr. | | | | | | | | | | |
Annual Incentive (4) | 2/2/2022 | 809,500 | 1,619,000 | 3,238,000 | | — | | — | | — | | — | | |
Long-Term Incentive (5) | 2/2/2022 | — | | — | | — | | | | 54,871 | 109,742 | 18,290 | 6,825,923 |
| Philip J. Lembo | | | | | | | | | | |
Annual Incentive (4) | 2/2/2022 | — | — | — | | — | — | — | — | — |
Long-Term Incentive (5) | 2/2/2022 | — | — | — | | — | 14,111 | 28,222 | 4,704 | 1,755,438 |
(1) Reflects the number of performance shares granted to each of the Named Executive Officers on February 2, 2022 under the 2022 – 2024 Long-Term Incentive Program. Performance shares were granted subject to a three-year Performance Period that ends on December 31, 2024. At the end of the Performance Period, Eversource common shares will be awarded based on actual performance results as a percentage of target, subject to reduction for applicable payroll withholding taxes. Holders of performance shares are eligible to receive dividend equivalent units on outstanding performance shares awarded to them to the same extent that dividends are declared and paid on our common shares. Dividend equivalent units are accounted for as additional
common shares that accrue and are distributed simultaneously with the number of common shares underlying the performance shares that are actually awarded. No dividends are paid unless and until the underlying shares vest. The Annual Incentive Program did not include an equity component.
(2) Reflects the number of RSUs granted to each of the Named Executive Officers on February 2, 2022 under the 2022 – 2024 Long-Term Incentive Program. RSUs vest in equal installments on February 2, 2023, 2024 and 2025. Eversource common shares are distributed with respect to vested RSUs on a one-for-one basis following vesting, after reduction for applicable payroll withholding taxes. Holders of RSUs are eligible to receive dividend equivalent units on outstanding RSUs awarded to them to the same extent that dividends are declared and paid on our common shares. Dividend equivalent units are accounted for as additional common shares that accrue and are distributed simultaneously with those common shares actually distributed in respect of the underlying RSUs. No dividends are paid unless and until the underlying shares vest.
(3) Reflects the grant date fair value, determined in accordance with FASB ASC Topic 718, of RSUs and performance shares granted to the Named Executive Officers on February 2, 2022 under the 2022 – 2024 Long-Term Incentive Program.
(4) The threshold payment under the Annual Incentive Program is 50 percent of target. The actual payments in 2022 for performance in 2022 are set forth in the Non-Equity Incentive Plan column of the Summary Compensation Table.
(5) Reflects the range of potential payouts, if any, pursuant to performance share awards under the 2022 – 2024 Long-Term Incentive Program, as described in the CD&A.
OUTSTANDING EQUITY GRANTS AT DECEMBER 31, 2022
The following table sets forth RSU and performance share grants outstanding at the end of the fiscal year ended December 31, 2022 for each of the Named Executive Officers. There are no outstanding options.
| | | | | | | | | | | | | | |
| | Stock Awards (1) |
| Number of Shares or Units of Stock That Have Not Vested (#) (2) | Market Value of Shares or Units of Stock That Have Not Vested ($) (3) | Equity Incentive Plan Awards: Number of Unearned Shares, Units or Other Rights That Have Not Vested (#) (4) | Equity Incentive Plan Awards: Market or Payout Value of Unearned Shares, Units or Other Rights That Have Not Vested ($) (5) |
| Name |
| Werner J. Schweiger | 11,833 | $ | 992,038 | 40,530 | $ | 3,398,016 |
| John M. Moreira | 2,264 | 189,806 | 7,762 | 650,778 |
| Gregory B. Butler | 8,423 | 706,205 | 28,852 | 2,418,915 |
| Christine M. Carmody | 6,802 | 570,267 | 23,300 | 1,953,481 |
| James. W. Hunt, III | 7,314 | 613,229 | 10,410 | 872,749 |
| Joseph R. Nolan, Jr. | 24,228 | 2,031,254 | 76,832 | 6,441,623 |
| Philip J. Lembo | 10,264 | 860,506 | 36,696 | 3,076,595 |
(1) Awards and market values of awards appearing in the table and the accompanying notes have been rounded to whole units.
(2) A total of 28,578 unvested RSUs vested on February 15, 2023 (Mr. Schweiger: 6,723; Mr. Moreira: 1,278; Mr. Butler: 4,786; Ms. Carmody: 3,864; Mr. Hunt: 1,559; and Mr. Nolan: 10,368). A total of 16,993 unvested RSUs will vest on February 15, 2024 (Mr. Schweiger: 3,394; Mr. Moreira: 655; Mr. Butler: 2,415; Ms. Carmody: 1,951; Mr. Hunt: 956; and Mr. Nolan: 7,622). A total of 11,138 unvested RSUs will vest on February 2, 2025 (Mr. Schweiger: 1,716; Mr. Moreira: 331; Mr. Butler: 1,222; Ms. Carmody: 986; Mr. Hunt: 645; and Mr. Nolan: 6,238). For Mr. Lembo, all of the unvested RSUs will vest and will be distributed on June 1, 2023.
(3) The market value of RSUs is determined by multiplying the number of RSUs by $83.84, the closing price of Eversource Energy common shares on December 30, 2022, the last trading day of the year.
(4) Reflects the target payout level for performance shares granted under the 2020 – 2022 Program, the 2021 – 2023 Program and the 2022 – 2024 Program.
The performance period for the 2020 – 2022 Program ended on December 31, 2022. Awards under that program are set forth in the CD&A under the “Results of the 2020 – 2022 Performance Share Program.”
The performance share awards for 2021 – 2023 Program and the 2022 – 2024 Program will be based on actual performance results as a percentage of target, subject to reduction for applicable payroll withholding taxes. As described more fully under “Performance Shares” in the CD&A and footnote (1) to the Grants of Plan-Based Awards table, performance shares will vest following a three-year performance period based on the extent to which the two performance conditions are achieved. Under the 2021 – 2023 Program, a total of 66,799 performance shares (including accrued dividend equivalents) will vest based on the extent to which the two performance conditions described in the CD&A are achieved as of December 31, 2023. Assuming achievement of these conditions at a target level of performance, the amount of the awards would be as follows: Mr. Schweiger: 15,102; Mr. Moreira: 2,912; Mr. Butler: 10,752; Ms. Carmody: 8,648; Mr. Hunt: 2,810; Mr. Nolan: 12,454; and Mr. Lembo: 14,121. Under the 2022 – 2024 Program, a total of 113,444 performance shares (including accrued dividend equivalents) will vest based on the extent to which the two performance conditions described in the CD&A are achieved as of December 31, 2024. Assuming achievement of these conditions at a target level of performance, the amount of the awards would be as follows: Mr. Schweiger: 15,438; Mr. Moreira: 2,978; Mr. Butler: 10,987; Ms. Carmody: 8,873; Mr. Hunt: 5,794; Mr. Nolan: 56,140; and Mr. Lembo: 13,234. No dividends are paid unless and until the underlying shares vest.
(5) The market value is determined by multiplying the number of performance shares in the adjacent column by $83.84, the closing price of Eversource Energy common shares on December 30, 2022, the last trading day of the year.
OPTION EXERCISES AND STOCK VESTED IN 2022
The following table reports amounts realized on equity compensation during the fiscal year ended December 31, 2022. The Stock Awards columns report the vesting of RSU and performance share grants to the Named Executive Officers in 2022. There were no options exercised as Eversource has not granted options since 2002.
| | | | | | | | |
| | Stock Awards |
| Number of Shares Acquired on Vesting (#) (1) | Value Realized on Vesting (2) |
| Name |
| Werner J. Schweiger | 25,673 | $ | 2,067,601 |
| John M. Moreira | 5,519 | 444,229 |
| Gregory B. Butler | 20,612 | 1,659,093 |
| Christine M. Carmody | 16,650 | 1,340,151 |
| James W. Hunt, III | 4,893 | 394,069 |
| Joseph R. Nolan, Jr. | 19,714 | 1,588,275 |
| Philip J. Lembo | 25,354 | 2,041,421 |
(1) Includes RSUs and performance shares granted to the Named Executive Officers under the long-term incentive programs, including dividend reinvestment, as follows:
| | | | | | | | | | | |
| Name | 2019 Program | 2020 Program | 2021 Program |
| Werner J. Schweiger | 20,779 | 3,254 | 1,640 |
| John M. Moreira | 4,593 | 610 | 316 |
| Gregory B. Butler | 17,128 | 2,318 | 1,167 |
| Christine M. Carmody | 13,836 | 1,871 | 942 |
| James W. Hunt, III | 3,973 | 606 | 314 |
| Joseph R. Nolan, Jr. | 15,678 | 2,684 | 1,352 |
| Philip J. Lembo | 20,779 | 3,043 | 1,533 |
In all cases, the distribution of common shares are reduced by that number of shares valued in an amount sufficient to satisfy payroll tax withholding obligations.
(2) Values realized on vesting of RSUs granted under the 2019 – 2021, 2020 – 2022 and 2021 – 2023 Programs were based on $82.21 per share, the closing price of Eversource Energy common shares on February 14, 2022. Values realized on vesting of performance shares granted under the 2019 – 2021 Program were based on $79.70 per share, the closing price of Eversource Energy common shares on February 23, 2022.
PENSION BENEFITS IN 2022
The Pension Benefits Table shows the estimated present value of accumulated retirement benefits payable to each Named Executive Officer upon retirement based on the assumptions described below. The table distinguishes between benefits available under the qualified pension plan program (QP), the pension equity plan program (PEP), the supplemental pension program (SERP), and the supplemental pension (Excess). See the narrative above in the CD&A under the captions “Other Benefits – Retirement Benefits” and “Contractual Agreements” for additional information on benefits under these plans and agreements.
The values shown in the Pension Benefits Table for Messrs. Nolan, Lembo, Schweiger and Judge and Ms. Carmody were calculated as of December 31, 2022 based on benefit payments in the form of a lump sum. For Mr. Butler, a payment of benefits was assumed in the form of a contingent annuitant option. Such earned pension program benefit value could otherwise have changed because of the reduction in mortality factors and potentially rising interest rates.
The values shown in this Table for the Named Executive Officers were based on benefit payments on the actual ages or the earliest possible ages for retirement with unreduced benefits for the Named Executive Officers: Mr. Schweiger: age 55, Mr. Butler: age 62, Ms. Carmody: age 62, Mr. Nolan: age 62, and Mr. Lembo: age 62.
In addition, benefits were determined under the qualified pension program using tax code limits in effect on December 31, 2022. For Messrs. Schweiger, Moreira, Hunt, Nolan and Lembo and Ms. Carmody, the values shown reflect actual 2022 salary and annual incentives earned in 2021 but paid in 2022 (per applicable supplemental program rules). For Mr. Butler, the values shown reflect actual 2022 salary and annual incentives earned in 2022 but paid in 2023 (per applicable supplemental program rules).
The present value of benefits at retirement age were determined using the discount rate within a range of 5.16 percent to 5.17 percent under ASC 715-30 pension accounting for the 2022 fiscal year end measurement as of December 31, 2022. This present value assumes no pre-retirement mortality, turnover or disability. However, for the postretirement period beginning at retirement age, the 2022 IRS lump sum mortality table was used for Messrs. Schweiger, Moreira, Hunt, Nolan and Lembo and Ms. Carmody. The RP2014 Employee Table Projected Generationally with Scale MP2020 was used for Mr. Butler. This new mortality table (as published by the Society of Actuaries in 2014) and projection scale were used
by the Eversource Pension Plan for year-end 2022 financial disclosure. Additional assumptions appear in the footnotes to this Annual Report on Form 10‑K.
| | | | | | | | | | | | | | |
| Pension Benefits | | | | |
| | Number of
Years Credited Service (#) | Present Value
of Accumulated Benefit | During Last Fiscal Year |
| Name | Plan Name |
| Werner J. Schweiger | Retirement Plan (QP) | 20.83 | $ | 770,967 | $ | — | |
| Supplemental Plan (Excess) | 20.83 | 3,901,275 | — | |
| Supplemental Plan (SERP) | 20.00 | 8,258,175 | — | |
| John M. Moreira | Retirement Plan (QP) | 22.67 | 773,402 | — | |
| Supplemental Plan (PEP) | 22.67 | 1,340,447 | — | |
| Gregory B. Butler | Retirement Plan (QP) | 26.00 | 1,436,573 | — | |
| Supplemental Plan (Excess) | 26.00 | 6,296,128 | — | |
| Supplemental Plan (Excess) | 26.00 | 4,260,121 | — | |
| Christine M. Carmody | Retirement Plan (QP) | 19.25 | 650,082 | — | |
| Supplemental Plan (Excess) | 19.25 | 1,990,139 | — | |
| Supplemental Plan (SERP) | 16.00 | 3,964,751 | — | |
| James W. Hunt, III | Retirement Plan (QP) | 10.25 | 297,491 | — | |
| Supplemental Plan (Excess) | 10.25 | 498,737 | — | |
| Joseph R. Nolan, Jr. | Retirement Plan (QP) | 37.42 | 1,110,849 | — | |
| Supplemental Plan (PEP) | 37.42 | 7,730,512 | — | |
| Supplemental Plan (SERP) | 20.00 | 7,111,910 | — | |
| Philip J. Lembo | Retirement Plan (QP) | 39.08 | 1,979,805 | — | |
| Supplemental Plan (PEP) | 39.08 | 21,906 | — | |
| Supplemental Plan (SERP) | 39.08 | 8,863,836 | — | |
NONQUALIFIED DEFERRED COMPENSATION IN 2022
The following table reports amounts contributed in 2022, together with aggregate earnings on contributions and withdrawals or distributions on contributions in 2022, under the Eversource deferred compensation program, along with aggregate balances on contributions. See the narrative above in the CD&A under the caption “Other Benefits - Deferred Compensation” for more detail on our non-qualified deferred compensation program.
| | | | | | | | | | | | | | | | | |
| Executive
Contributions
in Last FY | Registrant
Contributions
in Last FY | Aggregate
Earnings in
in Last FY | Aggregate
Withdrawals/
Distributions | Aggregate Balance at Last FYE (1) |
| Name |
| Werner J. Schweiger | $ | — | | $ | — | | $ | (5,041,612) | $ | — | | $ | 21,263,902 |
| John M. Moreira | — | | — | | — | — | | — |
| Gregory B. Butler | — | | — | | (2,567) | — | | 29,310 |
| Christine M. Carmody | — | | — | | (134,743) | — | | 1,554,461 |
| James W. Hunt, III | — | | — | | — | — | | — |
| Joseph R. Nolan, Jr. | | | (738,565) | | 7,466,727 |
| Philip J. Lembo | — | | — | | (350,036) | — | | 1,736,907 |
(1) Includes the total market value of deferred compensation program balances at December 31, 2022, plus the value of vested RSUs or other awards for which the distribution of common shares is currently deferred, based on $83.84, the closing price of Eversource Energy common shares on December 30, 2022, the last trading day of the year. The aggregate balances reflect a significant level of earnings on previously earned and deferred compensation.
POTENTIAL PAYMENTS UPON TERMINATION OR CHANGE IN CONTROL
The discussion and tables below show compensation payable to each Named Executive Officer who is still an employee of Eversource, in the event of: (i) voluntary termination; (ii) involuntary not-for-cause termination; (iii) termination in the event of death or disability; and (iv) termination following a change in control. No amounts are payable in the event of a termination for cause. The amounts shown assume that each termination was effective as of December 31, 2022, the last business day of the fiscal year.
Generally, a “change in control” means a change in ownership or control effected through (i) the acquisition of 30 percent or more of the combined voting power of common shares or other voting securities (20 percent for Mr. Butler, excluding certain defined transactions); (ii) the acquisition of more than 50 percent of our common shares, excluding certain defined transactions (for Messrs. Schweiger, Moreira, Hunt and Nolan and Ms. Carmody); (iii) a change in the majority of the Eversource Board of Trustees, unless approved by a majority of the incumbent Trustees; (iv) certain reorganizations, mergers or consolidations where substantially all of the persons who were the beneficial owners of the outstanding common shares immediately prior to such business combination do not beneficially own more than 50 percent of the voting power of the resulting business entity (excluding in certain cases defined transactions); and (v) complete liquidation or dissolution of Eversource, or a sale or disposition of all or substantially all of the assets of Eversource other than, for Mr. Butler, to an entity with respect to which following completion of the
transaction more than 50 percent of common shares or other voting securities is then owned by all or substantially all of the persons who were the beneficial owners of common shares and other voting securities immediately prior to such transaction.
In the event of a change in control, the Named Executive Officers are generally entitled to receive compensation and benefits following either involuntary termination of employment without “cause” or voluntary termination of employment for “good reason” within the applicable period (generally two years following a change in control). The Compensation Committee believes that termination for good reason is conceptually the same as termination “without cause” and, in the absence of this provision, potential acquirers would have an incentive to constructively terminate executives to avoid paying severance. Termination for “cause” generally means termination due to a felony or certain other convictions; fraud, embezzlement, or theft in the course of employment; intentional, wrongful damage to Eversource property; gross misconduct or gross negligence in the course of employment or gross neglect of duties harmful to Eversource; or a material breach of obligations under the agreement. “Good reason” for termination generally exists after assignment of duties inconsistent with executive’s position, a material reduction in compensation or benefits, a transfer more than 50 miles from the executive’s pre-change in control principal business location (or for Messrs. Schweiger, Moreira, Hunt and Nolan and Ms. Carmody, an involuntary transfer outside the greater Boston metropolitan area), or requiring business travel to a substantially greater extent than required prior to the change in control.
The summaries above do not purport to be complete and are qualified in their entirety by the actual terms and provisions of the agreements and plans, copies of which have been filed as exhibits to this Annual Report on Form 10-K.
Payments Upon Termination
Regardless of the manner in which the employment of a Named Executive Officer terminates, the executive is entitled to receive certain amounts earned during the executive’s term of employment. Such amounts include:
•Vested RSUs and certain other vested awards;
•Amounts contributed and any vested matching contributions under the deferred compensation program;
•Pay for unused vacation; and
•Amounts accrued and vested under the pension/supplemental and 401k programs (except in the event of a termination for cause under the supplemental program).
The following table describes additional compensation payable to the Named Executive Officers in the event of voluntary termination, involuntary termination not for cause, termination in the event of death or disability and termination following a change in control. No benefits are provided in the event of termination for cause. See the section above captioned “Pension Benefits in 2022” for information about the pension program, supplemental program and other benefits, and the section captioned “Nonqualified Deferred Compensation in 2022.”
POST-EMPLOYMENT COMPENSATION PAYMENTS UPON TERMINATION
| | | | | | | | | | | | | | | | | |
| Name | Type of Payments | Voluntary Termination | Involuntary Termination
Not for Cause | Termination Upon Death or Disability | Termination Following a
Change in Control |
| Werner J. Schweiger | Annual Incentives (1) | $ | — | | $ | — | | $ | — | | $ | 634,000 | |
| Performance Shares (2) | 2,112,988 | | 2,112,988 | | 2,112,988 | | 3,398,016 | |
| RSUs (3) | 518,576 | | 518,576 | | 518,576 | | 992,038 | |
| Special Retirement Benefit (4) | — | | — | | — | | 715,351 | |
| Health and Welfare Benefits (5) | — | | — | | — | | 74,867 | |
| Perquisites (6) | — | | — | | — | | 16,500 | |
| Separation Payment for Liquidated Damages (8) | — | | — | | — | | 5,379,000 | |
| Total | $ | 2,631,564 | | $ | 2,631,564 | | $ | 2,631,564 | | $ | 11,209,772 | |
| John M. Moreira | Annual Incentives (1) | $ | — | | $ | — | | $ | — | | $ | 500,000 | |
| Performance Shares (2) | 402,897 | | 402,897 | | 402,897 | | 650,777 | |
| RSUs (3) | 98,557 | | 98,557 | | 98,557 | | 189,806 | |
| Special Retirement Benefit (4) | — | | — | | — | | — | |
| Health and Welfare Benefits (5) | — | | — | | — | | — | |
| Perquisites (6) | — | | — | | — | | — | |
| Separation Payment for Liquidated Damages (8) | — | | — | | — | | — | |
| Total | $ | 501,454 | | $ | 501,454 | | $ | 501,454 | | $ | 1,340,583 | |
| Gregory B. Butler | Annual Incentives (1) | $ | — | | $ | — | | $ | — | | $ | 483,000 | |
| Performance Shares (2) | 1,504,249 | | 1,504,249 | | 1,504,249 | | 2,418,915 | |
| RSUs (3) | 369,187 | | 369,187 | | 369,187 | | 706,204 | |
| Health and Welfare Benefits (5) | — | | 47,287 | | — | | 70,931 | |
| Perquisites (6) | — | | 11,000 | | — | | 16,500 | |
| Separation Payment for Liquidated Damages (8) | — | | 1,173,000 | | — | | 1,173,000 | |
| Separation Payment for Non-Compete Agreement (9) | — | | 1,173,000 | | — | | 2,346,000 | |
| Total | $ | 1,873,436 | | $ | 4,277,723 | | $ | 1,873,436 | | $ | 7,214,550 | |
| Christine M. Carmody | Annual Incentives (1) | $ | — | | $ | — | | $ | — | | $ | 390,000 | |
| Performance Shares (2) | 1,214,833 | | 1,214,833 | | 1,214,833 | | 1,953,481 | |
| RSUs (3) | 298,046 | | 298,046 | | 298,046 | | 570,267 | |
| Health and Welfare Benefits (5) | — | | — | | — | | 11,737 | |
| Perquisites (6) | — | | — | | — | | 16,500 | |
| Separation Payment for Liquidated Damages (8) | — | | — | | — | | 3,608,930 | |
| Total | $ | 1,512,879 | | $ | 1,512,879 | | $ | 1,512,879 | | $ | 6,550,915 | |
| James W. Hunt, III | Annual Incentives (1) | $ | — | | $ | — | | $ | — | | $ | 281,000 | |
| Performance Shares (2) | 469,531 | | 469,531 | | 469,531 | | 872,749 | |
| RSUs (3) | 120,225 | | 120,225 | | 120,225 | | 264,885 | |
| Health and Welfare Benefits (5) | — | | — | | — | | — | |
| Perquisites (6) | — | | — | | — | | — | |
| Separation Payment for Liquidated Damages (8) | — | | — | | — | | — | |
| Total | $ | 589,756 | | $ | 589,756 | | $ | 589,756 | | $ | 1,418,634 | |
| Joseph R. Nolan, Jr. | Annual Incentives (1) | $ | — | | $ | — | | $ | — | | $ | 1,619,000 | |
| Performance Shares (2) | 2,943,513 | | 2,943,513 | | 2,943,513 | | 6,441,624 | |
| RSUs (3) | 799,681 | | 799,681 | | 799,681 | | 2,031,254 | |
| Special Retirement Benefit (4) | — | | — | | — | | 16,580,742 | |
| Health and Welfare Benefits (5) | — | | — | | — | | 109,680 | |
| Perquisites (6) | — | | — | | — | | 30,000 | |
| Excise Tax and Gross-ups (7) | — | | — | | — | | 10,872,687 | |
| Separation Payment for Liquidated Damages (8) | — | | — | | — | | 10,635,000 | |
| Total | $ | 3,743,194 | | $ | 3,743,194 | | $ | 3,743,194 | | $ | 48,319,987 | |
(1) �� For Termination Following a Change in Control: Represents target 2022 annual incentive awards as described in the Grants of Plan Based Awards Table.
(2) For Voluntary Termination and Involuntary Termination Not For Cause, and Termination Upon Death or Disability: Represents 100 percent of the performance share awards under the 2020 – 2022 Long-Term Incentive Program, 67 percent of the performance share awards under the 2021 – 2023 Long-Term Incentive Program, and 33 percent of the performance share awards under the 2022 – 2024 Long-Term Incentive Program. The values were calculated by multiplying the number of RSUs by $83.84, the closing price of Eversource common shares on December 30, 2022, the last trading day of the year. For Termination Following a Change in Control: Represents 100 percent of the performance share awards under each of the three Programs noted in the previous two sentences.
(3) For Voluntary Termination and Involuntary Termination Not For Cause, and Termination Upon Death or Disability: Represents values of RSUs granted under our long-term incentive programs that, at year-end 2022, were unvested under applicable vesting schedules. Under these programs, RSUs vest pro rata based on credited service years and age at termination, and time worked during the vesting period. For all, the values were calculated by multiplying the
number of RSUs by $83.84, the closing price of Eversource common shares on December 30, 2022, the last trading day of the year. For Termination Following a Change in Control: Represents values of all RSUs granted under our long-term incentive programs that, at year-end 2022, were unvested under applicable vesting schedules, all of which vest in full.
(4) For Termination Following a Change in Control: Represents actuarial present values at year-end 2022 of amounts payable solely under employment agreements upon termination (which are in addition to amounts due under the pension program). For Messrs. Schweiger and Nolan, pension benefits were calculated by adding three years of service. A lump sum of this benefit value is payable to Messrs. Schweiger and Nolan. Pension amounts shown in the table are present values at year-end 2022 of benefits payable upon termination as described with respect to the Pension Benefits Table above.
(5) The amount noted in the Involuntary Termination, Not for Cause: Represents for Mr. Butler the value of two years’ employer contributions toward active health, long-term disability, and life insurance benefits, plus a payment to offset any taxes thereon. For Termination Following a Change in Control: represents estimated Company cost at year-end 2022 (estimated by our consultants) of providing post-employment health and welfare benefits beyond those available to non-executives upon involuntary termination. The amounts shown in the table for Messrs. Schweiger and Nolan represent the value of three years (two years for Ms. Carmody) continued health and welfare plan participation. The amounts shown in the table for Mr. Butler represent the value of three years’ employer contributions toward active health, long-term disability, and life insurance benefits, plus a payment to offset any taxes on the value of these benefits, less the value of one year of retiree health coverage at retiree rates.
(6) The amount for Involuntary Termination, Not for Cause: Represents Company cost of reimbursing Mr. Butler for two years of financial planning and tax preparation fees. For Termination Following a Change in Control: Represents Company cost of reimbursing Messrs. Schweiger, Nolan and Butler for three years (two years for Ms. Carmody and Mr. Hunt) of financial planning and tax preparation fees.
(7) For Termination Following a Change in Control: Represents payments made to offset costs associated with certain excise taxes under Section 280G of the Internal Revenue Code. Executives may be subject to certain excise taxes under Section 280G if they receive payments and benefits related to a Termination Following a Change in Control that exceed specified Internal Revenue Service limits. Contractual agreements with the above executives provide for a grossed-up reimbursement of these excise taxes. The amounts in the table are based on the Section 280G excise tax rate of 20 percent, the statutory federal income tax withholding rate of 35 percent, the applicable state income tax rate, and the Medicare tax rate of 1.45 percent.
(8) For Involuntary Termination, Not for Cause: Represents for Mr. Butler a severance payment (two-times the sum of base salary plus relevant annual incentive award) in addition to any non-compete agreement payment described above. For Termination Following a Change in Control: Represents severance payments in addition to any non-compete agreement payments described in the prior note. For Messrs. Schweiger, and Nolan and Ms. Carmody, this payment equals three-times the sum of base salary plus relevant annual incentive award (two-times the sum for Mr. Butler). Pursuant to Ms. Carmody’s agreement, the lump sum severance payment and payment of the value of three additional years of service under the SERP as provided under the agreement are limited to 2.99 times the sum of her most recent annual base salary and annual bonus during the period prior to the date of termination. These payments do not replace, offset or otherwise affect the calculation or payment of the annual incentive awards.
(9) For Involuntary Termination, Not For Cause and Termination Following a Change in Control: Represents payments made under agreements or Eversource programs to Mr. Butler as consideration for agreement not to compete with Eversource following termination of employment, equal to the sum of base salary plus relevant annual incentive award. These payments do not replace, offset or otherwise affect the calculation or payment of the annual incentive awards.
Payments to Retired Named Executive Officer
Mr. Lembo retired effective November 30, 2022. Mr. Lembo will receive common shares in respect of RSUs granted under the 2020, 2021 and 2022 RSU programs on June 1, 2023, the scheduled distribution date. The estimated aggregate value of these common shares is $850,447, based on a price of $82.86 per common share, the closing price of Eversource’s common shares on November 30, 2022. Mr. Lembo will also receive common shares in respect of performance shares granted under the program that ended on December 31, 2022, on February 21, 2023, the scheduled distribution date. Common shares in respect of performance share awards under the programs ending on December 31, 2023 and December 31, 2024, will be finally determined and distributed in 2024 and 2025, respectively, under the terms of those programs. The estimated aggregate value of the performance shares is $3,040,632, based on a price of $82.86 per common share, the closing price of Eversource’s common shares on November 30, 2022.
DIRECTOR COMPENSATION
The CL&P Board of Directors consists of seven directors: Gregory B. Butler, Penelope M. Conner, Chandler J. Howard, Patrick J. McGrath, John M. Moreira, Ian G. Nicholson and Werner J. Schweiger. Messrs. Howard, McGrath and Nicholson are independent, non-employee directors, who were elected to the CL&P Board of Directors on June 1, 2022, in accordance with the previously noted settlement agreement with PURA, and receive cash compensation of $50,000 per year for service on the CL&P Board as noted below. All other CL&P directors are executive officers of Eversource Energy. None of CL&P’s executive directors who are NEOs receive specific compensation for their service as directors and are compensated for all services provided to Eversource Energy and its subsidiaries, including CL&P. Ms. Conner is not an Eversource Energy NEO, but like all other CL&P directors who are also Eversource executive officers, she receives no specific compensation for her service as a director and is compensated for all services provided to Eversource Energy and its subsidiaries, including CL&P.
The table below sets forth all compensation paid to or accrued by each non-employee Director.
| | | | | | | | |
| Director | Fees Earned or Paid in Cash ($) (1) | Total ($) |
| Chandler J. Howard | 29,167 | 29,167 |
| Patrick J. McGrath | 29,167 | 29,167 |
| Ian G. Nicholson | 29,167 | 29,167 |
(1) Director compensation for non-employee CL&P directors consists of cash compensation of $50,000 per year, paid quarterly.Compensation for 2022 was pro-rated, as all of the non-employee directors were elected to the CL&P Board effective June 1, 2022.
PAY RATIO
Eversource's Chief Executive Officer to median employee pay ratio is calculated pursuant to the requirements of Item 402(u) of Regulation S-K. Eversource identifies a new median employee each year. For 2022, Eversource identified the median employee by reviewing the 2022 total cash compensation of all full-time employees, excluding Eversource’s Chief Executive Officer, who were employed by Eversource and its subsidiaries on December 31, 2022. In Eversource's assessment of median employee compensation, pay was annualized for those employees who commenced work during 2022. Otherwise, no assumptions, adjustments, or estimates were made with respect to total cash compensation, and the compensation for any full-time employees who were not employed by Eversource at the end of 2022 was not annualized. Eversource believes the use of total cash compensation for all employees is a consistently applied compensation measure, as Eversource does not widely distribute annual equity awards to employees.
After identifying the median employee based on total cash compensation, Eversource calculated the annual total compensation for such employee using the same methodology used for its Named Executive Officers as set forth in the 2022 Summary Compensation Table.
Mr. Nolan had 2022 total compensation of $12,959,134. Eversource’s median employee’s annual total compensation for 2022 was $136,254. Eversource’s 2022 Chief Executive Officer to median employee pay ratio is 95 to 1.
EXHIBIT A
Adjusted Earnings (Non-GAAP)
We use Adjusted Earnings (non-GAAP) and its per share impact as our principal financial measure of operating performance because management believes it best reflects our baseline operating performance and provides additional and useful information in analyzing historical and future performance of our business and for planning and forecasting of future periods.
Adjusted Earnings (non-GAAP) is defined as Net Income Attributable to Common Shareholders, excluding the following adjustments: (1) the Columbia Gas acquisition and related transition costs in 2022, 2021 and 2020; (2) charges in 2021 and 2022 related to the acquisition and transition of New England Service Company and Torrington Water Company; (3) charges in 2022 related to the strategic review of our offshore wind investments; and (4) charges in 2021 at The Connecticut Light and Power Company (CL&P) related to a settlement agreement that included credits to customers, funding of various customer assistance initiatives, and a storm performance penalty imposed on CL&P by the Connecticut Public Utilities Regulatory Authority. We believe the impacts of the CL&P settlement agreement and the storm performance penalty imposed on CL&P by PURA, the Columbia Gas acquisition and transition costs, and charges related to the water companies’ acquisition and transition, and the offshore wind strategic review costs are not indicative of our ongoing costs and performance.
With respect to the 2022 EPS performance goal, the Compensation Committee discussed this goal at length at both its December 2022 and February 2023 meetings. The Committee first noted 2022 adjusted earnings to be $4.09 per share, a 6% growth over 2021, substantially above the projected average industry growth of 4.9%. Following those discussions, the Compensation Committee determined that it would assess the earnings per share goal based on Adjusted Earnings. The Compensation Committee considered the fact that the costs of the Columbia Gas asset acquisition and integrations, water companies’ acquisition and transition costs, and the offshore wind strategic review costs, which were for 2022 to be the costs excluded in the calculation of Adjusted Earnings, were appropriate to be excluded. The integration of Columbia Gas was the culmination of a timely significant strategic opportunity for the Company and its customers, completed in an accelerated timeframe, under budget, with constructive regulatory outcomes; the acquisition of additional water company assets is helping to further grow the water delivery business; and the strategic review of our offshore wind investment and associated costs will enable the Company to execute the best outcome relating to this substantial investment.
This non-GAAP financial measure should not be considered as an alternative to reported Net Income Attributable to Common Shareholders or EPS determined in accordance with GAAP as indicators of operating performance.
| | | | | | | | | | | | | | | | | | | | | | | | | | | | | | | | | | | |
| Adjusted Earnings and EPS Reconciliation |
| For the Years Ended December 31, |
| 2022 | | 2021 | | 2020 |
| (Millions of Dollars, Except Per Share Amounts) | Amount | | Per Share | | Amount | | Per Share | | Amount | | Per Share |
| Net Income Attributable to Common Shareholders (GAAP) | $ | 1,404.9 | | | $ | 4.05 | | | $ | 1,220.5 | | | $ | 3.54 | | | $ | 1,205.2 | | | $ | 3.55 | |
| Adjustments (after-tax) to reconcile to Adjusted Earnings: | | | | | | | | | | | |
| CL&P Settlement Agreement Impacting Costs | — | | | — | | | 86.1 | | | 0.25 | | | — | | | — | |
| Columbia Gas Acquisition Transition Costs, Water Company acquisition costs and Strategic Review Costs | 15.0 | | | 0.04 | | | 23.6 | | | 0.07 | | | 32.1 | | | 0.09 | |
| Adjusted Earnings (Non-GAAP) | $ | 1,419.9 | | | $ | 4.09 | | | $ | 1,330.2 | | | $ | 3.86 | | | $ | 1,237.3 | | | $ | 3.64 | |
Item 12. Security Ownership of Certain Beneficial Owners and Management and Related Stockholder Matters
Eversource Energy
In addition to the information below under "Securities Authorized for Issuance Under Equity Compensation Plans," incorporated herein by reference is the information contained in the sections "Common Share"Securities Ownership of Certain Beneficial Owners" and "Common Share Ownership of Trustees and Management" of Eversource Energy's definitive proxy statement for solicitation of proxies, expected to be filed with the SEC on or about March 24, 2023.22, 2024.
CL&P, NSTAR ELECTRICElectric and PSNH
Certain information required by this Item 12 has been omitted for CL&P, NSTAR Electric and PSNH pursuant to Instruction I(2)(c) to Form 10-K, Omission of Information by Certain Wholly-Owned Subsidiaries.
CL&P
COMMON SHARE OWNERSHIP OF DIRECTORS AND MANAGEMENT
Eversource Energy owns 100 percent of the outstanding common stock of CL&P. The table below shows the number of Eversource Energy common shares beneficially owned as of February 15, 2023, by each of CL&P's directors and each Named Executive Officer of CL&P, as well as the number of Eversource Energy common shares beneficially owned by all of CL&P's directors and executive officers as a group. The table also includes information about restricted share units and deferred shares credited to the accounts of CL&P's directors and executive officers under certain compensation and benefit plans. No equity securities of CL&P are owned by any of the Trustees, directors or executive officers of Eversource Energy or CL&P.
| | | | | | | | | | | | | | | | | |
| Name of Beneficial Owner | | Amount and Nature of Beneficial Ownership (1)(2)(3) | | Percent of Class |
| Werner J. Schweiger, Chairman and Chief Executive Officer, and a director of CL&P | | 228,152 | (4) | | * |
| John M. Moreira, Executive Vice President, Chief Financial Officer and Treasurer, and a director of CL&P | | 21,993 | | | * |
| Gregory B. Butler, Executive Vice President and General Counsel, and a director of CL&P | | 91,034 | | | * |
| Christine M. Carmody, Executive Vice President-Human Resources and Information Technology of Eversource Energy | | 52,765 | | | * |
| James W. Hunt, III, Executive Vice President-Corporate Relations and Sustainability and Secretary of Eversource Energy | | 22,410 | | | * |
| Joseph R. Nolan, Jr., Chairman of the Board, President and Chief Executive Officer of Eversource Energy | | 163,205 | | | * |
| Philip J. Lembo, Former Executive Vice President and Chief Financial Officer of CL&P | | 87,044 | (5) | | * |
| Penelope M. Conner, Executive Vice President-Customer Experience and Energy Strategy of Eversource Energy, and a director of CL&P | | 22,111 | | | * |
| Chandler J. Howard, a director of CL&P | | — | | | * |
| Patrick J. McGrath, a director of CL&P | | 1 | | | * |
| Ian G. Nicholson, a director of CL&P | | — | | | * |
| All directors and executive officers as a group (13 persons) | | 719,799 | (6) | | * |
* Less than 1 percent of Eversource Energy common shares outstanding.
1. The persons named in the table have sole voting and investment power with respect to all shares beneficially owned by each of them, except as noted below.
2. Includes restricted share units, deferred restricted share units and/or deferred shares, including dividend equivalents, as to which none of the individuals has voting or investment power, and phantom shares held by executive officers who participate in a deferred compensation plan as follows: Mr. Schweiger: 103,738 shares; Mr. Moreira: 7,868 shares; Mr. Butler: 12,721 shares; Ms. Carmody: 10,270 shares; Mr. Hunt: 8,999 shares; Mr. Nolan: 112,314 shares; Mr. Lembo: 10,347 shares; and Ms. Conner: 17,731 shares.
3. Includes shares held as units in the 401(k) Plan invested in the Eversource Energy Common Shares Fund over which the holder has sole voting and investment power as follows: Mr. Schweiger: 570 shares; Mr. Moreira: 5,344 shares; Mr. Butler: 7,115 shares; Ms. Carmody: 5,600 shares; Mr. Hunt: 1,633 shares; Mr. Nolan: 21,512 shares; Mr. Lembo: 421 shares; and Ms. Conner: 432 shares.
4. Includes 1,346 shares held in a trust of which Mr. Schweiger is the trustee and beneficiary; 437 shares in a trust of which Mr. Schweiger’s spouse is the trustee and beneficiary; 1,352 shares held by Mr. Schweiger’s spouse in a custodial account for grandchild #1; and 500 shares held by Mr. Schweiger’s spouse in a custodial account for grandchild #2.
5. Includes 590 shares held by Mr. Lembo in a custodial account for his grandchild.
6. Includes 302,133 unissued shares (see Note 2) and 42,793 shares held as units in the 401(k) Plan (see Note 3).
SECURITIES AUTHORIZED FOR ISSUANCE UNDER EQUITY COMPENSATION PLANS
The following table sets forth the number of Eversource Energy common shares issuable under Eversource Energy equity compensation plans, as well as their weighted exercise price, as of December 31, 2022,2023, in accordance with the rules of the SEC:
| | | | | | | | | | | |
| Plan Category | Number of securities to be issued upon exercise of outstanding options, warrants and rights (1) | Weighted-average exercise price of outstanding options, warrants and rights (2) | Number of securities remaining available for future issuance under equity compensation plans (excluding securities reflected in column (1)) |
| Equity compensation plans approved by security holders | 1,177,024 | $— | 903,183 |
Equity compensation plans not approved by security holders (3) | — | — | — |
| Total | 1,177,024 | $— | 903,183 |
| | | | | | | | | | | |
| Plan Category | Number of securities to be issued upon exercise of outstanding options, warrants and rights (1) | Weighted-average exercise price of outstanding options, warrants and rights (2) | Number of securities remaining available for future issuance under equity compensation plans (excluding securities reflected in column (1)) |
| Equity compensation plans approved by security holders | 1,336,666 | $— | 4,587,376 |
Equity compensation plans not approved by security holders (3) | — | — | — |
| Total | 1,336,666 | $— | 4,587,376 |
(1) Includes 629,734672,242 common shares for distribution in respect of restricted share units, and 547,290664,424 performance shares issuable at target, all pursuant to the terms of our Incentive Plan.Plans.
(2) The weighted-average exercise price does not take into account restricted share units or performance shares, which have no exercise price.
(3) Securities set forth in this table are authorized for issuance under compensation plans that have been approved by shareholders of Eversource Energy.
For information regarding our Incentive Plans, see Note 11C, "Employee Benefits - Share Based Payments," to the financial statements.
Item 13. Certain Relationships and Related Transactions, and Director Independence
Eversource Energy
Incorporated herein by reference is the information contained in the sections captioned "Trustee Independence" and "Related Person Transactions" of Eversource Energy's definitive proxy statement for solicitation of proxies, expected to be filed with the SEC on or about March 24, 2023.22, 2024.
CL&P, NSTAR ELECTRICElectric and PSNH
Certain information required by this Item 13 has been omitted for CL&P, NSTAR Electric and PSNH pursuant to Instruction I(2)(c) to Form 10-K, Omission of Information by Certain Wholly-Owned Subsidiaries.
CL&P
Eversource Energy's Code of Ethics for Senior Financial Officers applies to the Senior Financial Officers (Chief Executive Officer, Chief Financial Officer and Controller) of Eversource Energy, CL&P and certain other Eversource Energy subsidiaries. Under the Code, one's position as a Senior Financial Officer in the company may not be used to improperly benefit such officer or his or her family or friends. Under the Code, specific activities that may be considered conflicts of interest include, but are not limited to, directly or indirectly acquiring or retaining a significant financial interest in an organization that is a customer, vendor or competitor, or that seeks to do business with the company; serving, without proper safeguards, as an officer or director of, or working or rendering services for an organization that is a customer, vendor or competitor, or that seeks to do business with the company. Waivers of the provisions of the Code of Ethics for Trustees, executive officers or directors must be approved by Eversource Energy's Board of Trustees. Any such waivers will be disclosed pursuant to legal requirements.
Eversource Energy's Code of Conduct, which applies to all Trustees, directors, officers and employees of Eversource Energy and its subsidiaries, including CL&P, contains a Conflict of Interest Policy that requires all such individuals to disclose any potential conflicts of interest. Such individuals are expected to discuss their particular situations with management to ensure appropriate steps are in place to avoid a conflict of interest. All disclosures must be reviewed and approved by management to ensure a particular situation does not adversely impact the individual's primary job and role.
Eversource Energy's Related Persons Transactions Policy is administered by the Corporate Governance Committee of Eversource Energy's Board of Trustees. The Policy generally defines a "Related Persons Transaction" as any transaction or series of transactions in which (i) Eversource Energy or a subsidiary is a participant, (ii) the aggregate amount involved exceeds $120,000 and (iii) any "Related Persons" has a direct or indirect material interest. A "Related Persons" is defined as any Trustee or nominee for Trustee, any executive officer, any shareholder owning more than 5 percent of Eversource Energy's total outstanding shares, and any immediate family member of any such person. Management submits to the Corporate Governance Committee for consideration any Related Persons Transaction into which Eversource Energy or a subsidiary proposes to enter. The Corporate Governance Committee recommends to the Eversource Energy Board of Trustees for approval only those transactions that are in Eversource Energy's best interests. If management causes the company to enter into a Related Persons Transaction prior to approval by the Corporate Governance Committee, the transaction will be subject to ratification by the Eversource Energy Board of Trustees. If the Eversource
Energy Board of Trustees determines not to ratify the transaction, then management will make all reasonable efforts to cancel or annul such transaction.
Each of Mr. Butler, Ms. Conner, and Messrs. Moreira and Schweiger is a director of CL&P and an employee of Eversource Service. Messrs. Howard, McGrath and Nicholson are non-employee directors of CL&P. The Board of Directors elected the three independent directors in 2022 in accordance with the previously noted PURA settlement agreement. CL&P defines independent director as one who does not have any material relationship with the Company, which it determines using the same guidelines as are used by the Eversource Energy Board of Trustees in determining Board members independence. These guidelines are available on the Eversource Energy website at www.eversource.com/content/general/about/investors/corporate-governance/board-independence-guidelines.
Item 14. Principal Accountant Fees and Services
Eversource Energy
Incorporated herein by reference is the information contained in the section "Relationship with Principal Independent Auditors"Registered Public Accounting Firm" of Eversource Energy's definitive proxy statement for solicitation of proxies, expected to be filed with the SEC on or about March 24, 2023.22, 2024.
CL&P, NSTAR ELECTRICElectric and PSNH
Pre-Approval of Services Provided by Principal Auditors
None of CL&P, NSTAR Electric and PSNH is subject to the audit committee requirements of the SEC, the national securities exchanges or the national securities associations. CL&P, NSTAR Electric and PSNH obtain audit services from the independent auditor engaged by the Audit Committee of Eversource Energy's Board of Trustees. Eversource Energy's Audit Committee has established policies and procedures regarding the pre-approval of services provided by the principal auditors. Those policies and procedures delegate pre-approval of services to the Eversource Energy Audit Committee Chair provided that such offices are held by Trustees who are "independent" within the meaning of the Sarbanes-Oxley Act of 2002 and that all such pre-approvals are presented to the Eversource Energy Audit Committee at the next regularly scheduled meeting of the Committee.
The following relates to fees and services for the entire Eversource Energy system, including Eversource Energy, CL&P, NSTAR Electric and PSNH.
Fees Billed By Principal Independent Registered Public Accounting Firm
The aggregate fees billed to the Company and its subsidiaries by Deloitte & Touche LLP, the member firms of Deloitte Touche Tohmatsu, and their respective affiliates (collectively, the Deloitte Entities), for the years ended December 31, 2023 and 2022 totaled $7,070,914 and 2021 totaled $7,029,422, and $6,013,205, respectively. In addition, affiliates of Deloitte & Touche LLP as noted below provide other accounting services to the Company.
| | Audit and Non-Audit Fees | Audit and Non-Audit Fees | 2022 | | 2021 | Audit and Non-Audit Fees | 2023 | | 2022 |
Audit Fees (1) | Audit Fees (1) | $ | 5,323,600 | | | $ | 4,883,791 | |
Audit Related Fees (2) | Audit Related Fees (2) | 1,542,000 | | 918,500 |
Tax Fees (3) | — | | 20,000 |
All Other Fees (4) | 163,822 | | 190,914 |
All Other Fees (3) | |
| TOTAL | TOTAL | $ | 7,029,422 | | | $ | 6,013,205 | |
(1) Audit fees in 2022 and 2021Fees consisted of fees related to the audits of financial statements of Eversource Energy and its subsidiaries in the Annual Report on Form 10-K, reviews of financial statements in the Combined Quarterly reports on Form 10-Q of Eversource Energy and its subsidiaries, consultations with management, regulatory and compliance filings, system conversion quality assurance, out of pocket expenses, and audits of internal controls over financial reporting as offor the years ended December 31, 20222023 and 2021. Audit fees in 2021 also included the audits of pension plan financial statements in connection with the acquisition of CMA.2022.
(2) Audit Related Fees were incurred for procedures performed in the ordinary course of business in support of certain regulatory filings, comfort letters, consents, and other costs related to registration statements and financials for the years ended December 31, 20222023 and 2021.2022. Audit Related Fees for the year ended 2022 also included Eversource’s ATM equity offering program.
(3) The tax service fees for the period ended December 31, 2021 were incurred for procedures performed in the ordinary course of business in support of certain federal rules in 2021. There were no tax fees rendered and no tax fees billed for the year ended December 31, 2022.
(4) All Other Fees for the periodyears ended December 31, 2023 and 2022 related to a system pre-implementation control review, an executive training program and an annual license for access to an accounting standards research tool. All Other Fees for the periodyear ended December 31, 2021 included an advisory benchmarking project2022 also related to operations at a newly acquired business as well assystem pre-implementation control review and an annual license for access to an accounting standards research tool.executive training program.
The Audit Committee pre-approves all auditing services and permitted audit-related or other services (including the fees and terms thereof) to be performed for us by our independent registered public accounting firm, subject to the de minimis exceptions for non-audit services described in Section 10A(i)(1)(B) of the Securities Exchange Act of 1934, which are approved by the Audit Committee prior to the completion of the audit. The Audit Committee may form and delegate its authority to subcommittees consisting of one or more members when appropriate, including the authority to grant pre-approvals of audit and permitted non-audit services, provided that decisions of such subcommittees to grant pre-approvals are presented to the full Audit Committee at its next scheduled meeting. During 2022,2023, all services described above were pre-approved by the Audit Committee or its Chair.
The Audit Committee has considered whether the provision by the Deloitte Entities of the non-audit services described above was allowed under Rule 2-01(c)(4) of Regulation S-X and was compatible with maintaining the independence of the registered public accountants and has concluded that the Deloitte Entities were and are independent of us in all respects.
PART IV
Item 15. Exhibits and Financial Statement Schedules
| | | | | | | | | | | | | | |
| (a) | 1. | Financial Statements: | |
| | | | |
| | | | The financial statements filed as part of this Annual Report on Form 10-K are set forth under Item 8, "Financial Statements and Supplementary Data." | |
| | | | |
| | 2. | Schedules | |
| | | | |
| | | I. | Financial Information of Registrant: | |
| | | | |
| | | Eversource Energy (Parent) Balance Sheets as of December 31, 20222023 and 20212022 | S-1 |
| | | | |
| | | | Eversource Energy (Parent) Statements of Income for the Years Ended December 31, 2023, 2022 2021 and 20202021 | S-2 |
| | | | |
| | | | Eversource Energy (Parent) Statements of Comprehensive Income for the Years Ended December 31, 2023, 2022 2021 and 20202021 | S-2 |
| | | | |
| | | | Eversource Energy (Parent) Statements of Cash Flows for the Years Ended December 31, 2023, 2022 2021 and 20202021 | S-3 |
| | | | |
| | | II. | Valuation and Qualifying Accounts and Reserves for Eversource, CL&P, NSTAR Electric and PSNH for 2023, 2022 2021 and 20202021 | S-4 |
| | | | |
| | | | All other schedules of the companies for which inclusion is required in the applicable regulations of the SEC are permitted to be omitted under the related instructions or are not applicable, and therefore have been omitted. | |
| | | | |
| 3. | | Exhibit Index | E-1 |
Item 16. Form 10-K Summary
Not applicable.
SCHEDULE I
EVERSOURCE ENERGY (PARENT)
FINANCIAL INFORMATION OF REGISTRANT
BALANCE SHEETS
AS OF DECEMBER 31, 20222023 AND 20212022
(Thousands of Dollars)
| | | | 2022 | | 2021 | | 2023 | | 2022 |
| ASSETS | ASSETS | | | | ASSETS | | | |
| Current Assets: | Current Assets: | | | | Current Assets: | | | |
| Cash | Cash | $ | 971 | | | $ | 175 | |
| Accounts Receivable from Subsidiaries | Accounts Receivable from Subsidiaries | 53,338 | | | 43,403 | |
| Notes Receivable from Subsidiaries | Notes Receivable from Subsidiaries | 1,074,800 | | | 1,245,900 | |
| Prepayments and Other Current Assets | Prepayments and Other Current Assets | 23,597 | | | 11,974 | |
| Total Current Assets | Total Current Assets | 1,152,706 | | | 1,301,452 | |
| | Deferred Debits and Other Assets: | Deferred Debits and Other Assets: | | |
| Deferred Debits and Other Assets: | |
| Deferred Debits and Other Assets: | |
| Investments in Subsidiary Companies, at Equity | |
| Investments in Subsidiary Companies, at Equity | |
| Investments in Subsidiary Companies, at Equity | Investments in Subsidiary Companies, at Equity | 18,379,840 | | | 16,108,190 | |
| Notes Receivable from Subsidiaries | Notes Receivable from Subsidiaries | 1,896,500 | | | 1,001,000 | |
| Accumulated Deferred Income Taxes | Accumulated Deferred Income Taxes | — | | | 17,409 | |
| Goodwill | Goodwill | 3,852,524 | | | 3,852,524 | |
| Other Long-Term Assets | Other Long-Term Assets | 108,867 | | | 101,710 | |
| Total Deferred Debits and Other Assets | Total Deferred Debits and Other Assets | 24,237,731 | | | 21,080,833 | |
| | Total Assets | Total Assets | $ | 25,390,437 | | | $ | 22,382,285 | |
| Total Assets | |
| Total Assets | |
| | LIABILITIES AND CAPITALIZATION | LIABILITIES AND CAPITALIZATION | | |
| LIABILITIES AND CAPITALIZATION | |
| LIABILITIES AND CAPITALIZATION | |
| Current Liabilities: | Current Liabilities: | | |
| Current Liabilities: | |
| Current Liabilities: | |
| Notes Payable | |
| Notes Payable | |
| Notes Payable | Notes Payable | $ | 1,442,200 | | | $ | 1,342,950 | |
| Long-Term Debt - Current Portion | Long-Term Debt - Current Portion | 1,207,047 | | | 767,681 | |
| Accounts Payable to Subsidiaries | Accounts Payable to Subsidiaries | 33,530 | | | 37,609 | |
| Accrued Interest | |
| Other Current Liabilities | Other Current Liabilities | 112,807 | | | 87,745 | |
| Total Current Liabilities | Total Current Liabilities | 2,795,584 | | | 2,235,985 | |
| | Deferred Credits and Other Liabilities: | Deferred Credits and Other Liabilities: | |
| Deferred Credits and Other Liabilities: | |
| Deferred Credits and Other Liabilities: | |
| Accumulated Deferred Income Taxes | |
| Accumulated Deferred Income Taxes | |
| Accumulated Deferred Income Taxes | Accumulated Deferred Income Taxes | 8,498 | | | — | |
| Other Long-Term Liabilities | Other Long-Term Liabilities | 140,393 | | | 150,616 | |
| Total Deferred Credits and Other Liabilities | Total Deferred Credits and Other Liabilities | 148,891 | | | 150,616 | |
| | Long-Term Debt | Long-Term Debt | 6,972,804 | | | 5,395,840 | |
| Long-Term Debt | |
| Long-Term Debt | |
| | Common Shareholders' Equity: | |
| Common Shareholders' Equity: | |
| Common Shareholders' Equity: | Common Shareholders' Equity: | | | | | | |
| Common Shares | Common Shares | 1,799,920 | | | 1,789,092 | |
| Capital Surplus, Paid in | Capital Surplus, Paid in | 8,401,731 | | | 8,098,514 | |
| Retained Earnings | Retained Earnings | 5,527,153 | | | 5,005,391 | |
| Accumulated Other Comprehensive Loss | Accumulated Other Comprehensive Loss | (39,421) | | | (42,275) | |
| Treasury Stock | Treasury Stock | (216,225) | | | (250,878) | |
| Common Shareholders' Equity | Common Shareholders' Equity | 15,473,158 | | | 14,599,844 | |
| | Total Liabilities and Capitalization | Total Liabilities and Capitalization | $ | 25,390,437 | | | $ | 22,382,285 | |
| Total Liabilities and Capitalization | |
| Total Liabilities and Capitalization | |
See the Combined Notes to Financial Statements in this Annual Report on Form 10-K for a description of significant accounting matters related to Eversource parent, including Eversource common shares information as described in Note 18, "Common Shares," material obligations and guarantees as described in Note 13, "Commitments and Contingencies," and debt agreements as described in Note 8, "Short-Term Debt," and Note 9, "Long-Term Debt."
SCHEDULE I
EVERSOURCE ENERGY (PARENT)
FINANCIAL INFORMATION OF REGISTRANT
STATEMENTS OF (LOSS)/INCOME
FOR THE YEARS ENDED DECEMBER 31, 2023, 2022 2021 AND 20202021
(Thousands of Dollars, Except Share Information)
| | | | 2022 | | 2021 | | 2020 | | 2023 | | 2022 | | 2021 |
| | Operating Revenues | Operating Revenues | $ | — | | | $ | — | | | $ | — | |
| Operating Revenues | |
| Operating Revenues | |
| | Operating Expenses: | |
| Operating Expenses: | |
| Operating Expenses: | Operating Expenses: | | | | | | | | |
| Other | Other | 26,708 | | | 43,048 | | | 28,645 | |
| Operating Loss | Operating Loss | (26,708) | | | (43,048) | | | (28,645) | |
| Interest Expense | Interest Expense | 237,773 | | | 163,613 | | | 160,887 | |
| | Other Income, Net: | Other Income, Net: | | | | | |
| Equity in Earnings of Subsidiaries | 1,565,474 | | | 1,345,199 | | | 1,309,630 | |
| Other Income, Net: | |
| Other Income, Net: | | | | |
| Equity in (Losses)/Earnings of Subsidiaries | |
| Other, Net | Other, Net | 79,383 | | | 47,802 | | | 38,546 | |
| Other Income, Net | 1,644,857 | | | 1,393,001 | | | 1,348,176 | |
| Income Before Income Tax Benefit | 1,380,376 | | | 1,186,340 | | | 1,158,644 | |
| Other (Loss)/Income, Net | |
| (Loss)/Income Before Income Tax Benefit | |
| Income Tax Benefit | Income Tax Benefit | (24,499) | | | (34,187) | | | (46,523) | |
| Net Income | $ | 1,404,875 | | | $ | 1,220,527 | | | $ | 1,205,167 | |
| Net (Loss)/Income | |
| | Basic Earnings per Common Share | $ | 4.05 | | | $ | 3.55 | | | $ | 3.56 | |
| Basic (Loss)/Earnings per Common Share | |
| Basic (Loss)/Earnings per Common Share | |
| Basic (Loss)/Earnings per Common Share | |
| | Diluted Earnings per Common Share | $ | 4.05 | | | $ | 3.54 | | | $ | 3.55 | |
| Diluted (Loss)/Earnings per Common Share | |
| Diluted (Loss)/Earnings per Common Share | |
| Diluted (Loss)/Earnings per Common Share | |
| | Weighted Average Common Shares Outstanding: | |
| Weighted Average Common Shares Outstanding: | |
| Weighted Average Common Shares Outstanding: | Weighted Average Common Shares Outstanding: | | | | | | | | |
| Basic | Basic | 346,783,444 | | | 343,972,926 | | | 338,836,147 | |
| Diluted | Diluted | 347,246,768 | | | 344,631,056 | | | 339,847,062 | |
STATEMENTS OF COMPREHENSIVE (LOSS)/INCOME
| | | | | | | | | | | | | | | | | |
| (Thousands of Dollars) | 2022 | | 2021 | | 2020 |
| | | | | |
| Net Income | $ | 1,404,875 | | | $ | 1,220,527 | | | $ | 1,205,167 | |
| Other Comprehensive Income/(Loss), Net of Tax: | | | | | |
| Qualified Cash Flow Hedging Instruments | 20 | | | 972 | | | 1,596 | |
| Changes in Unrealized (Losses)/Gains on Marketable Securities | (1,636) | | | (671) | | | 342 | |
| Changes in Funded Status of Pension, SERP and PBOP Benefit Plans | 4,470 | | | 33,835 | | | (13,290) | |
| Other Comprehensive Income/(Loss), Net of Tax | 2,854 | | | 34,136 | | | (11,352) | |
| Comprehensive Income | $ | 1,407,729 | | | $ | 1,254,663 | | | $ | 1,193,815 | |
| | | | | | | | | | | | | | | | | |
| (Thousands of Dollars) | 2023 | | 2022 | | 2021 |
| | | | | |
| Net (Loss)/Income | $ | (442,240) | | | $ | 1,404,875 | | | $ | 1,220,527 | |
| Other Comprehensive Income, Net of Tax: | | | | | |
| Qualified Cash Flow Hedging Instruments | 20 | | | 20 | | | 972 | |
| Changes in Unrealized Gains/(Losses) on Marketable Securities | 1,252 | | | (1,636) | | | (671) | |
| Changes in Funded Status of Pension, SERP and PBOP Benefit Plans | 4,412 | | | 4,470 | | | 33,835 | |
| Other Comprehensive Income, Net of Tax | 5,684 | | | 2,854 | | | 34,136 | |
| Comprehensive (Loss)/Income | $ | (436,556) | | | $ | 1,407,729 | | | $ | 1,254,663 | |
See the Combined Notes to Financial Statements in this Annual Report on Form 10-K for a description of significant accounting matters related to Eversource parent, including Eversource common shares information as described in Note 18, "Common Shares," material obligations and guarantees as described in Note 13, "Commitments and Contingencies," and debt agreements as described in Note 8, "Short-Term Debt," and Note 9, "Long-Term Debt."
SCHEDULE I
EVERSOURCE ENERGY (PARENT)
FINANCIAL INFORMATION OF REGISTRANT
STATEMENTS OF CASH FLOWS
FOR THE YEARS ENDED DECEMBER 31, 2023, 2022 2021 and 20202021
(Thousands of Dollars)
| | | | 2022 | | 2021 | | 2020 | | 2023 | | 2022 | | 2021 |
| Operating Activities: | Operating Activities: | | | | | | Operating Activities: | | | |
| Net Income | $ | 1,404,875 | | | $ | 1,220,527 | | | $ | 1,205,167 | |
| Net (Loss)/Income | |
| Adjustments to Reconcile Net Income to Net Cash Flows Provided by Operating Activities: | Adjustments to Reconcile Net Income to Net Cash Flows Provided by Operating Activities: | | | | | Adjustments to Reconcile Net Income to Net Cash Flows Provided by Operating Activities: | | | | | |
| Equity in Earnings of Subsidiaries | (1,565,474) | | | (1,345,199) | | | (1,309,630) | |
| Equity in Losses/(Earnings) of Subsidiaries | |
| Cash Dividends Received from Subsidiaries | Cash Dividends Received from Subsidiaries | 855,600 | | | 1,037,100 | | | 485,800 | |
| Deferred Income Taxes | Deferred Income Taxes | 25,823 | | | 20,293 | | | (4,667) | |
| Other | Other | 26,455 | | | 36,910 | | | 39,940 | |
| Changes in Current Assets and Liabilities: | Changes in Current Assets and Liabilities: | | | | | Changes in Current Assets and Liabilities: | | | | | |
| Accounts Receivables from Subsidiaries | Accounts Receivables from Subsidiaries | (9,935) | | | (3,758) | | | (14,575) | |
| Taxes Receivable/Accrued, Net | Taxes Receivable/Accrued, Net | (21,627) | | | (19,455) | | | 35,300 | |
| Accounts Payable to Subsidiaries | Accounts Payable to Subsidiaries | (4,079) | | | 19,185 | | | 14,091 | |
| Other Current Assets and Liabilities, Net | Other Current Assets and Liabilities, Net | 35,090 | | | 8,144 | | | 21,284 | |
| Net Cash Flows Provided by Operating Activities | Net Cash Flows Provided by Operating Activities | 746,728 | | | 973,747 | | | 472,710 | |
| | | | | | | |
| Investing Activities: | Investing Activities: | | | | | |
| Investing Activities: | |
| Investing Activities: | | | | |
| Capital Contributions to Subsidiaries | Capital Contributions to Subsidiaries | (1,499,300) | | | (1,033,000) | | | (1,899,340) | |
| Return of Capital from Subsidiaries | Return of Capital from Subsidiaries | 12,000 | | | 178,800 | | | 80,000 | |
| Increase in Notes Receivable from Subsidiaries | Increase in Notes Receivable from Subsidiaries | (724,400) | | | (140,200) | | | (264,300) | |
| Other Investing Activities | Other Investing Activities | (1,289) | | | (3,196) | | | (367) | |
| Net Cash Flows Used in Investing Activities | Net Cash Flows Used in Investing Activities | (2,212,989) | | | (997,596) | | | (2,084,007) | |
| | Financing Activities: | Financing Activities: | | | | | |
| Financing Activities: | |
| Financing Activities: | | | | |
| Issuance of Common Shares, Net of Issuance Costs | Issuance of Common Shares, Net of Issuance Costs | 197,058 | | | — | | | 928,992 | |
| Cash Dividends on Common Shares | Cash Dividends on Common Shares | (860,033) | | | (805,439) | | | (744,665) | |
| Issuance of Long-Term Debt | Issuance of Long-Term Debt | 2,800,000 | | | 1,000,000 | | | 1,550,000 | |
| Retirement of Long-Term Debt | Retirement of Long-Term Debt | (750,000) | | | (450,000) | | | — | |
| Increase/(Decrease) in Notes Payable | 99,250 | | | 288,625 | | | (170,545) | |
| Increase in Notes Payable | |
| Other Financing Activities | Other Financing Activities | (19,193) | | | (9,545) | | | 46,480 | |
| Net Cash Flows Provided by Financing Activities | Net Cash Flows Provided by Financing Activities | 1,467,082 | | | 23,641 | | | 1,610,262 | |
| Net Increase/(Decrease) in Cash and Restricted Cash | 821 | | | (208) | | | (1,035) | |
| Net (Decrease)/Increase in Cash and Restricted Cash | |
| Cash and Restricted Cash - Beginning of Year | Cash and Restricted Cash - Beginning of Year | 226 | | | 434 | | | 1,469 | |
| Cash and Restricted Cash - End of Year | Cash and Restricted Cash - End of Year | $ | 1,047 | | | $ | 226 | | | $ | 434 | |
| | Supplemental Cash Flow Information: | Supplemental Cash Flow Information: | | | | | |
| Supplemental Cash Flow Information: | |
| Supplemental Cash Flow Information: | | | | |
| Cash Paid/(Received) During the Year for: | Cash Paid/(Received) During the Year for: | | | | | | Cash Paid/(Received) During the Year for: | | | |
| Interest | Interest | $ | 215,053 | | | $ | 164,568 | | | $ | 140,694 | |
| Income Taxes | Income Taxes | $ | (20,992) | | | $ | (51,277) | | | $ | (43,158) | |
See the Combined Notes to Financial Statements in this Annual Report on Form 10-K for a description of significant accounting matters related to Eversource parent, including Eversource common shares information as described in Note 18, "Common Shares," material obligations and guarantees as described in Note 13, "Commitments and Contingencies," and debt agreements as described in Note 8, "Short-Term Debt," and Note 9, "Long-Term Debt."
SCHEDULE II
EVERSOURCE ENERGY AND SUBSIDIARIES
VALUATION AND QUALIFYING ACCOUNTS AND RESERVES
FOR THE YEARS ENDED DECEMBER 31, 2023, 2022 2021 AND 20202021
(Thousands of Dollars)
| | Column A | Column A | Column B | Column C | Column D | Column E | Column A | Column B | Column C | Column D | Column E |
| | | | Additions | | | | Additions | |
| | | | (1) | (2) | | | | (1) | (2) | |
| Description: | Description: | Balance as of Beginning of Year | Charged to Costs and Expenses | Charged to Other
Accounts -
Describe (a) | Deductions -Describe (b) | Balance as of End of Year | Description: | Balance as of Beginning of Year | Charged to Costs and Expenses | Charged to Other
Accounts -
Describe (a) | Deductions -Describe (b) | Balance as of End of Year |
Eversource: | Eversource: | | Eversource: | |
| Reserves Deducted from Assets - | Reserves Deducted from Assets - | | Reserves Deducted from Assets - | |
| Reserves for Uncollectible Accounts: | Reserves for Uncollectible Accounts: | | Reserves for Uncollectible Accounts: | |
| | | 2022 | $ | 417,406 | | $ | 61,876 | | $ | 112,533 | | $ | 105,518 | | $ | 486,297 | |
| | | 2021 | 358,851 | | 60,886 | | 110,572 | | 112,903 | | 417,406 | |
| | | 2020 | 224,821 | | 53,461 | | 145,005 | | 64,436 | | 358,851 | |
| CL&P: | CL&P: | | CL&P: | |
| Reserves Deducted from Assets - | Reserves Deducted from Assets - | | Reserves Deducted from Assets - | |
| Reserves for Uncollectible Accounts: | Reserves for Uncollectible Accounts: | | Reserves for Uncollectible Accounts: | |
| | | 2022 | $ | 181,319 | | $ | 15,578 | | $ | 59,485 | | $ | 31,062 | | $ | 225,320 | |
| | | 2021 | 157,447 | | 13,495 | | 57,779 | | 47,402 | | 181,319 | |
| | | 2020 | 97,348 | | 12,882 | | 71,223 | | 24,006 | | 157,447 | |
| NSTAR Electric: | NSTAR Electric: | | NSTAR Electric: | |
| Reserves Deducted from Assets - | Reserves Deducted from Assets - | | Reserves Deducted from Assets - | |
| Reserves for Uncollectible Accounts: | Reserves for Uncollectible Accounts: | | Reserves for Uncollectible Accounts: | |
| | | 2022 | $ | 97,005 | | $ | 21,550 | | $ | 12,412 | | $ | 36,009 | | $ | 94,958 | |
| | | 2021 | 91,583 | | 16,649 | | 20,064 | | 31,291 | | 97,005 | |
| | | 2020 | 75,406 | | 15,293 | | 23,424 | | 22,540 | | 91,583 | |
PSNH: | PSNH: | | PSNH: | |
| Reserves Deducted from Assets - | Reserves Deducted from Assets - | | Reserves Deducted from Assets - | |
| Reserves for Uncollectible Accounts: | Reserves for Uncollectible Accounts: | | Reserves for Uncollectible Accounts: | |
| | | 2022 | $ | 24,331 | | $ | 9,211 | | $ | 2,539 | | $ | 6,845 | | $ | 29,236 | |
| | | 2021 | 17,157 | | 13,113 | | 3,135 | | 9,074 | | 24,331 | |
| | | 2020 | 10,497 | | 5,164 | | 7,692 | | 6,196 | | 17,157 | |
(a) Amounts relate to uncollectible accounts receivables reserved for that are not charged to bad debt expense. CL&P, NSTAR Electric, NSTAR Gas, EGMA and Yankee Gas are allowed to recover in rates, amounts associated with certain uncollectible hardship accounts receivable. CL&P, NSTAR Electric, PSNH, NSTAR Gas and EGMA are also allowed to recover uncollectible energy supply costs through regulatory tracking mechanisms. Amounts in this column in 2020 also include a $24.2 million increase due to the CMA asset acquisition on October 9, 2020 at Eversource, and an increase due to the adoption of the credit loss accounting standard in 2020 of $23.8 million at Eversource, $22.2 million at CL&P, $0.3 million at PSNH, and a decrease of $1.3 million at NSTAR Electric.
(b) Amounts written off, net of recoveries.
EXHIBIT INDEX
Each document described below is incorporated by reference by the registrant(s) listed to the files identified, unless designated with a (*), which exhibits are filed herewith. Management contracts and compensation plans or arrangements are designated with a (+).
Exhibit
Number Description
3. Articles of Incorporation and By-Laws
(A) Eversource Energy
(B) The Connecticut Light and Power Company
(C) NSTAR Electric Company
(D) Public Service Company of New Hampshire
4. Instruments defining the rights of security holders, including indentures
(A) Eversource Energy
4.1.44.1.3 Ninth Supplemental Indenture between Eversource Energy and The Bank of New York Trust Company N.A., as Trustee, dated as of October 1, 2017, relating to $450 million of Senior Notes, Series K, due 2022 and $450 million of Senior Notes, Series L, due 2024 (Exhibit 4.1, Eversource Energy Current Report on Form 8-K filed October 12, 2017, File No. 001-05324)
4.1.64.1.5 Eleventh Supplemental Indenture between Eversource Energy and The Bank of New York Trust Company N.A., as Trustee, dated as of December 1, 2018, relating to $400 million of Senior Notes, Series N, Due 2023 and $500 million of Senior Notes, Series O, Due 2029 (Exhibit 4.1, Eversource Energy Current Report on Form 8-K filed December 18, 2018, File No. 001-05324)
4.1.84.1.7 Thirteenth Supplemental Indenture between Eversource Energy and The Bank of New York Trust Company N.A., as Trustee, dated as of August 1, 2020, relating to $300 million aggregate principal amount of Senior Notes, Series Q, Due 2025 and $600 million aggregate principal amount of Senior Notes, Series R, Due 2030 (Exhibit 4.1, Eversource Energy Current Report on Form 8-K filed August 20, 2020, File No. 001-05324)
4.1.104.1.9 Fifteenth Supplemental Indenture between Eversource Energy and The Bank of New York Trust Company N.A., as Trustee, dated as of August 1, 2021, relating to $350 million aggregate principal amount of Floating Rate Senior Notes, Series T and $300 million aggregate principal amount of Senior Notes, Series U, Due 2026 (Exhibit 4.1, Eversource Energy Current Report on Form 8-K filed August 13, 2021, File No. 001-05324)
4.1.114.1.10 Sixteenth Supplemental Indenture between Eversource Energy and The Bank of New York Trust Company N.A., as Trustee, dated as of February 1, 2022, relating to $650 million aggregate principal amount of Senior Notes, Series V, Due 2027 and $650 million aggregate principal amount of Senior Notes, Series W, Due 2032 (Exhibit 4.1, Eversource Energy Current Report on Form 8-K filed February 25, 2022, File No. 001-05324)
4.1.124.1.11 Seventeenth Supplemental Indenture between Eversource Energy and The Bank of New York Trust Company N.A., as Trustee, dated as of June 1, 2022, relating to $900 million aggregate principal amount of Senior Notes, Series X, Due 2024 and $600 million aggregate principal amount of Senior Notes, Series Y, Due 2027 (Exhibit 4.1, Eversource Energy Current Report on Form 8-K filed June 27, 2022, File No. 001-05324)
4.1.13 Nineteenth Supplemental Indenture between Eversource Energy and The Bank of New York Trust Company N.A., as Trustee, dated as of May 1, 2023, relating to $450 million aggregate principal amount of Senior Notes, Series AA, Due 2026 and $800 million aggregate principal amount of Senior Notes, Series BB, Due 2033 (Exhibit 4.3, Eversource Energy Current Report on Form 8‑K filed May 11, 2023, File No. 001-05324)
4.1.15 Twenty-First Supplemental Indenture between Eversource Energy and The Bank of New York Trust Company N.A., as Trustee, dated as of January 1, 2024, relating to $350 million aggregate principal amount of Senior Notes, Series DD, Due 2027 and $650 million aggregate principal amount of Senior Notes, Series EE, Due 2034 (Exhibit 4.1, Eversource Energy Current Report on Form 8-K filed January 19, 2024, File No. 001-05324)
(B) The Connecticut Light and Power Company
(C) NSTAR Electric Company
4.2.1 First Amendment to Second Amended and Restated Credit Agreement and Extension Agreement, dated October 17, 2022, by and between NSTAR Electric Company and the Banks named therein, pursuant to which Barclays Bank PLC serves as Administrative Agent and Swing Line Lender (Exhibit 4.1, Eversource Form 10-Q filed on November 4, 2022)
(D) Public Service Company of New Hampshire
(F) Eversource Energy, The Connecticut Light and Power Company and Public Service Company of New Hampshire
4.1 Second Amended and Restated Credit Agreement, dated as of October 15, 2021, by and among Eversource, Aquarion Water Company of Connecticut, NSTAR Gas, CL&P, PSNH, Yankee Gas and EGMA and the Banks named therein, pursuant to which Bank of America, N.A. serves as Administrative Agent and Swing Line Lender (Exhibit 10.12,, 2021 2021 Eversource Form 10-K filed on February 17,, 2022 2022)
4.1.1 First Amendment to Second Amended and Restated Credit Agreement and Extension Agreement, dated October 17, 2022, by and among Eversource, Aquarion Water Company of Connecticut, NSTAR Gas, CL&P, PSNH, Yankee Gas and EGMA and the Banks named therein, pursuant to which Bank of America, N.A. serves as Administrative Agent and Swing Line Lender (Exhibit 4, Eversource Form 10-Q10-Q filed on November 4, 2022)
*4.1.2 Second Amendment to Second Amended and Restated Credit Agreement and Extension Agreement, dated November 29, 2023, by and among Eversource, Aquarion Water Company of Connecticut, NSTAR Gas, CL&P, PSNH, Yankee Gas and EGMA and the Banks named therein, pursuant to which Bank of America, N.A. serves as Administrative Agent and Swing Line Lender.
10. Material Contracts
(A) Eversource Energy
(B) Eversource Energy, The Connecticut Light and Power Company, NSTAR Electric Company and Public Service Company of New Hampshire
(C) Eversource Energy, The Connecticut Light and Power Company, Public Service Company of New Hampshire and NSTAR Electric Company
*31. Rule 13a - 14(a)/15 d - 14(a) Certifications
(A) Eversource Energy
(B) The Connecticut Light and Power Company
(C) NSTAR Electric Company
(D) Public Service Company of New Hampshire
*32 18 U.S.C. Section 1350 Certifications
(A) Eversource Energy
(B) The Connecticut Light and Power Company
(C) NSTAR Electric Company
(D) Public Service Company of New Hampshire
*101.INS Inline XBRL Instance Document - the instance document does not appear in the interactive data file because its XBRL tags are embedded within the inline XBRL document
*101.SCH Inline XBRL Taxonomy Extension Schema
*101.CAL Inline XBRL Taxonomy Extension Calculation
*101.DEF Inline XBRL Taxonomy Extension Definition
*101.LAB Inline XBRL Taxonomy Extension Labels
*101.PRE Inline XBRL Taxonomy Extension Presentation
*104 The cover page from the Annual Report on Form 10-K for the year ended December 31, 2022,2023, formatted in Inline XBRL
EVERSOURCE ENERGY
SIGNATURES
Pursuant to the requirements of Section 13 or 15(d) of the Securities Exchange Act of 1934, the Registrant has duly caused this report to be signed on its behalf by the undersigned, thereunto duly authorized.
| | | | | | | | | | | |
| | | EVERSOURCE ENERGY |
| | | |
| | | | |
February 15, 202314, 2024 | By: | /s/ | John M. MoreiraJay S. Buth |
| | | | John M. MoreiraJay S. Buth |
| | | | Executive Vice President, Controller and Chief FinancialAccounting Officer and Treasurer |
Pursuant to the requirements of the Securities Exchange Act of 1934, this report has been signed below by the following persons on behalf of the Registrant and in the capacities and on the dates indicated.
POWER OF ATTORNEY
Each person whose signature appears below constitutes and appoints Gregory B. Butler, and John M. Moreira and Jay S. Buth and each of them, his or her true and lawful attorneys-in-fact and agents, with full power of substitution and resubstitution, for him or her and in his or her name, place and stead, in any and all capacities, to sign any and all amendments to this Annual Report on Form 10-K, and to file the same, with all exhibits thereto, and other documents in connection therewith, with the Securities and Exchange Commission, granting unto said attorneys-in-fact and agents, and each of them, full power and authority to do and perform each and every act and thing requisite and necessary to be done, as fully to all intents and purposes as he or she might or could do in person, hereby ratifying and confirming all that said attorneys-in-fact and agents or any of them, or their or his or her substitute or substitutes, may lawfully do or cause to be done by virtue hereof.
| | | | | | | | | | | | | | | | | |
| Signature | | Title | | Date |
| | | | | |
| | | | | |
| /s/ | Joseph R. Nolan, Jr. | | Chairman of the Board, President and | | February 15, 202314, 2024 |
| Joseph R. Nolan, Jr. | | Chief Executive Officer | | |
| | | (Principal Executive Officer) | | |
| | | | | |
| | | | | |
| /s/ | John M. Moreira | | Executive Vice President, Chief Financial Officer | | February 15, 202314, 2024 |
| John M. Moreira | | and Treasurer | | |
| | | (Principal Financial Officer and Principal Accounting Officer) | | |
| | | | | |
| | | | | |
| /s/ | Jay S. Buth | | Vice President, Controller | | | February 14, 2024 |
| Jay S. Buth | | and Chief Accounting Officer | | | | |
| | | | | | | |
| | | | | |
| | | | | |
| /s/ | Cotton M. Cleveland | | Trustee | | February 15, 202314, 2024 |
| Cotton M. Cleveland | | | | |
| | | | | |
| | | | | |
/s/ | James S. DiStasio | | Trustee | | February 15, 2023 |
| James S. DiStasio | | | | |
| | | | | |
| | | | | |
| /s/ | Francis A. Doyle | | Trustee | | February 15, 202314, 2024 |
| Francis A. Doyle | | | | |
| | | | | |
| | | | | |
| /s/ | Linda Dorcena Forry | | Trustee | | February 14, 2024 |
| Linda Dorcena Forry | | | | |
| | | | | |
| | | | | |
| /s/ | Gregory M. Jones | | Trustee | | February 14, 2024 |
| Gregory M. Jones | | | | | |
| | | | | | | | | | | | | | | | | |
| Signature | | Title | | Date |
| | | | | |
| | | | | |
/s/ | Linda Dorcena Forry | | Trustee | | February 15, 2023 |
| Linda Dorcena Forry | | | | |
| | | | | |
| | | | | |
/s/ | Gregory M. Jones | | Trustee | | February 15, 2023 |
| Gregory M. Jones | | | | |
| | | | | |
| | | | | |
| /s/ | Loretta D. Keane | | Trustee | | February 15, 202314, 2024 |
| Loretta D. Keane | | | | |
| | | | | |
| | | | | |
| /s/ | John Y. Kim | | Trustee | | February 15, 202314, 2024 |
| John Y. Kim | | | | |
| | | | | |
| | | | | |
| /s/ | Kenneth R. Leibler | | Trustee | | February 15, 202314, 2024 |
| Kenneth R. Leibler | | | | |
| | | | | |
| | | | | |
| /s/ | David H. Long | | Trustee | | February 15, 202314, 2024 |
| David H. Long | | | | |
| | | | | |
| | | | | |
| /s/ | Daniel J. Nova | | Trustee | | February 14, 2024 |
| Daniel J. Nova | | | | |
| | | | | |
| | | | | |
| /s/ | William C. Van Faasen | | Trustee | | February 15, 202314, 2024 |
| William C. Van Faasen | | | | |
| | | | | |
| | | | | |
| /s/ | Frederica M. Williams | | Trustee | | February 15, 202314, 2024 |
| Frederica M. Williams | | | | |
| | | | | |
| | | | | |
THE CONNECTICUT LIGHT AND POWER COMPANY
SIGNATURES
Pursuant to the requirements of Section 13 or 15(d) of the Securities Exchange Act of 1934, the Registrant has duly caused this report to be signed on its behalf by the undersigned, thereunto duly authorized.
| | | | | | | | | | | |
| | THE CONNECTICUT LIGHT AND POWER COMPANY |
| | | |
| | | | |
February 15, 202314, 2024 | By: | /s/ | John M. MoreiraJay S. Buth |
| | | | John M. MoreiraJay S. Buth |
| | | | Executive Vice President, Controller and Chief FinancialAccounting Officer and Treasurer |
Pursuant to the requirements of the Securities Exchange Act of 1934, this report has been signed below by the following persons on behalf of the Registrant and in the capacities and on the dates indicated.
POWER OF ATTORNEY
Each person whose signature appears below constitutes and appoints Gregory B. Butler, and John M. Moreira and Jay S. Buth and each of them, his true and lawful attorneys-in-fact and agents, with full power of substitution and resubstitution, for him and in his name, place and stead, in any and all capacities, to sign any and all amendments to this Annual Report on Form 10-K, and to file the same, with all exhibits thereto, and other documents in connection therewith, with the Securities and Exchange Commission, granting unto said attorneys-in-fact and agents, and each of them, full power and authority to do and perform each and every act and thing requisite and necessary to be done, as fully to all intents and purposes as he might or could do in person, hereby ratifying and confirming all that said attorneys-in-fact and agents or any of them, or their or his substitute or substitutes, may lawfully do or cause to be done by virtue hereof.
| | | | | | | | | | | | | | | | | |
| Signature | | Title | | Date |
| | | | | |
| | | | | |
| /s/ | Werner J. SchweigerPaul Chodak III | | Chairman and Chief Executive Officer | | February 15, 202314, 2024 |
| Werner J. SchweigerPaul Chodak III | | and a Director | | |
| | | (Principal Executive Officer) | | | | | |
| | | | | |
| | | | | |
| /s/ | John M. Moreira | | Executive Vice President, Chief Financial Officer | | February 15, 202314, 2024 |
| John M. Moreira | | and Treasurer and a Director | | |
| | | (Principal Financial Officer and Principal Accounting Officer) | | |
| | | | | |
| | | | | |
| /s/ | Gregory B. Butler | | Executive Vice President and General Counsel | | February 15, 202314, 2024 |
| Gregory B. Butler | | and a Director | | |
| | | | | |
| | | | | |
| /s/ | Jay S. Buth | | Vice President, Controller | | | February 14, 2024 |
| Jay S. Buth | | and Chief Accounting Officer | | |
| | | | | |
| | | | | |
| /s/ | Penelope M. Conner | | Director | | February 15, 202314, 2024 |
| Penelope M. Conner | | | | |
| | | | | |
| | | | | |
| /s/ | Chandler J. Howard | | Director | | February 15, 202314, 2024 |
| Chandler J. Howard | | | | |
| | | | | |
| | | | | |
| /s/ | Patrick J. McGrath | | Director | | February 15, 202314, 2024 |
| Patrick J. McGrath | | | | |
| | | | | |
| | | | | |
| /s/ | Ian G. Nicholson | | Director | | February 15, 202314, 2024 |
| Ian G. Nicholson | | | | |
| | | | | | | |
| | | | | |
| | | | | |
NSTAR ELECTRIC COMPANY
SIGNATURES
Pursuant to the requirements of Section 13 or 15(d) of the Securities Exchange Act of 1934, the Registrant has duly caused this report to be signed on its behalf by the undersigned, thereunto duly authorized.
| | | | | | | | | | | |
| | NSTAR ELECTRIC COMPANY |
| | | |
| | | | |
February 15, 202314, 2024 | By: | /s/ | John M. MoreiraJay S. Buth |
| | | | John M. MoreiraJay S. Buth |
| | | | Executive Vice President, Controller and Chief FinancialAccounting Officer and Treasurer |
Pursuant to the requirements of the Securities Exchange Act of 1934, this report has been signed below by the following persons on behalf of the Registrant and in the capacities and on the dates indicated.
POWER OF ATTORNEY
Each person whose signature appears below constitutes and appoints Gregory B. Butler, and John M. Moreira and Jay S. Buth and each of them, his true and lawful attorneys-in-fact and agents, with full power of substitution and resubstitution, for him and in his name, place and stead, in any and all capacities, to sign any and all amendments to this Annual Report on Form 10-K, and to file the same, with all exhibits thereto, and other documents in connection therewith, with the Securities and Exchange Commission, granting unto said attorneys-in-fact and agents, and each of them, full power and authority to do and perform each and every act and thing requisite and necessary to be done, as fully to all intents and purposes as he might or could do in person, hereby ratifying and confirming all that said attorneys-in-fact and agents or any of them, or their or his substitute or substitutes, may lawfully do or cause to be done by virtue hereof.
| | | | | | | | | | | | | | | | | |
| Signature | | Title | | Date |
| | | | | |
| | | | | |
| /s/ | Joseph R. Nolan, Jr. | | Chairman and a Director | | February 15, 202314, 2024 |
| Joseph R. Nolan, Jr. | | (Principal Executive Officer) | | |
| | | | | |
| | | | | |
| /s/ | Werner J. SchweigerPaul Chodak III | | Chief Executive Officer and a Director | | February 15, 202314, 2024 |
| Werner J. SchweigerPaul Chodak III | | | | |
| | | | | |
| | | | | |
| /s/ | John M. Moreira | | Executive Vice President, Chief Financial Officer | | February 15, 202314, 2024 |
| John M. Moreira | | and Treasurer and a Director | | |
| | | (Principal Financial Officer and Principal Accounting Officer) | | |
| | | | | |
| | | | | |
| /s/ | Gregory B. Butler | | Executive Vice President and General Counsel | | February 15, 202314, 2024 |
| Gregory B. Butler | | and a Director | | |
| | | | | |
| | | | | |
| /s/ | Jay S. Buth | | Vice President, Controller | | | February 14, 2024 |
| Jay S. Buth | | and Chief Accounting Officer | | | | |
| | | | | | | |
| | | | | |
| | | | | |
| | | | | |
| | | | | |
PUBLIC SERVICE COMPANY OF NEW HAMPSHIRE
SIGNATURES
Pursuant to the requirements of Section 13 or 15(d) of the Securities Exchange Act of 1934, the Registrant has duly caused this report to be signed on its behalf by the undersigned, thereunto duly authorized.
| | | | | | | | | | | |
| | PUBLIC SERVICE COMPANY OF NEW HAMPSHIRE |
| | | |
| | | | |
February 15, 202314, 2024 | By: | /s/ | John M. MoreiraJay S. Buth |
| | | | John M. MoreiraJay S. Buth |
| | | | Executive Vice President, Controller and Chief FinancialAccounting Officer and Treasurer |
Pursuant to the requirements of the Securities Exchange Act of 1934, this report has been signed below by the following persons on behalf of the Registrant and in the capacities and on the dates indicated.
POWER OF ATTORNEY
Each person whose signature appears below constitutes and appoints Gregory B. Butler, and John M. Moreira and Jay S. Buth and each of them, his true and lawful attorneys-in-fact and agents, with full power of substitution and resubstitution, for him and in his name, place and stead, in any and all capacities, to sign any and all amendments to this Annual Report on Form 10-K, and to file the same, with all exhibits thereto, and other documents in connection therewith, with the Securities and Exchange Commission, granting unto said attorneys-in-fact and agents, and each of them, full power and authority to do and perform each and every act and thing requisite and necessary to be done, as fully to all intents and purposes as he might or could do in person, hereby ratifying and confirming all that said attorneys-in-fact and agents or any of them, or their or his substitute or substitutes, may lawfully do or cause to be done by virtue hereof.
| | | | | | | | | | | | | | | | | |
| Signature | | Title | | Date |
| | | | | |
| | | | | |
| /s/ | Joseph R. Nolan, Jr. | | Chairman and a Director | | February 15, 202314, 2024 |
| Joseph R. Nolan, Jr. | | (Principal Executive Officer) | | |
| | | | | |
| | | | | |
| /s/ | Werner J. SchweigerPaul Chodak III | | Chief Executive Officer and a Director | | February 15, 202314, 2024 |
| Werner J. SchweigerPaul Chodak III | | | | |
| | | | | |
| | | | | |
| /s/ | John M. Moreira | | Executive Vice President, Chief Financial Officer | | February 15, 202314, 2024 |
| John M. Moreira | | and Treasurer and a Director | | |
| | | (Principal Financial Officer and Principal Accounting Officer) | | |
| | | | | |
| | | | | |
| /s/ | Gregory B. Butler | | Executive Vice President and General Counsel | | February 15, 202314, 2024 |
| Gregory B. Butler | | and a Director | | |
| | | | | |
| | | | | | | |
| /s/ | Jay S. Buth | | Vice President, Controller | | | February 14, 2024 |
| Jay S. Buth | | and Chief Accounting Officer | | | | |
| | | | | |