XCEL ENERGY INC000007290312/312021FYFALSEP1YP5YP1YP1YP2YP1YP2YP8YP1YP2YP1YP2YP2YP1YP2YP1YP2YP1YP2YP1YP3YP3YP3YP5Y | | | | | | | | | | | | | | | | | | | | | | | | | | |
| | Quarter Ended |
| (Amounts in millions, except per share data) | | March 31, 2021 | | June 30, 2021 | | Sept. 30, 2021 | | Dec. 31, 2021 |
| Operating revenues | | $ | 2,811 | | | $ | 2,586 | | | $ | 3,182 | | | $ | 2,947 | |
| Operating income | | 455 | | | 422 | | | 813 | | | 426 | |
| Net income | | 295 | | | 287 | | | 603 | | | 288 | |
| EPS total — basic | | $ | 0.56 | | | $ | 0.54 | | | $ | 1.15 | | | $ | 0.54 | |
| EPS total — diluted | | 0.56 | | 0.54 | | 1.14 | | 0.54 |
| Cash dividends declared per common share | | 0.43 | | 0.43 | | 0.43 | | 0.43 |
| | | | | | | | | | | | | | | | | | | | | | | | | | |
| | Quarter Ended |
| (Amounts in millions, except per share data) | | March 31, 2020 | | June 30, 2020 | | Sept. 30, 2020 | | Dec. 31, 2020 |
| Operating revenues | | $ | 2,811 | | | $ | 2,586 | | | $ | 3,182 | | | $ | 2,947 | |
| Operating income | | 455 | | | 422 | | | 813 | | | 426 | |
| Net income | | 295 | | | 287 | | | 603 | | | 288 | |
| EPS total — basic | | $ | 0.56 | | | $ | 0.54 | | | $ | 1.15 | | | $ | 0.54 | |
| EPS total — diluted | | 0.56 | | 0.54 | | 1.14 | | 0.54 |
| Cash dividends declared per common share | | 0.43 | | 0.43 | | 0.43 | | 0.43 |
| | | | | | | | | | | | | | | | | | | | | | | | | | |
| | Quarter Ended |
| (Amounts in millions, except per share data) | | March 31, 2021 | | June 30, 2021 | | Sept. 30, 2021 | | Dec. 31, 2021 |
| Operating revenues | | $ | 2,811 | | | $ | 2,586 | | | $ | 3,182 | | | $ | 2,947 | |
| Operating income | | 455 | | | 422 | | | 813 | | | 426 | |
| Net income | | 295 | | | 287 | | | 603 | | | 288 | |
| EPS total — basic | | $ | 0.56 | | | $ | 0.54 | | | $ | 1.15 | | | $ | 0.54 | |
| EPS total — diluted | | 0.56 | | 0.54 | | 1.14 | | 0.54 |
| Cash dividends declared per common share | | 0.43 | | 0.43 | | 0.43 | | 0.43 |
| | | | | | | | | | | | | | | | | | | | | | | | | | |
| | Quarter Ended |
| (Amounts in millions, except per share data) | | March 31, 2020 | | June 30, 2020 | | Sept. 30, 2020 | | Dec. 31, 2020 |
| Operating revenues | | $ | 2,811 | | | $ | 2,586 | | | $ | 3,182 | | | $ | 2,947 | |
| Operating income | | 455 | | | 422 | | | 813 | | | 426 | |
| Net income | | 295 | | | 287 | | | 603 | | | 288 | |
| EPS total — basic | | $ | 0.56 | | | $ | 0.54 | | | $ | 1.15 | | | $ | 0.54 | |
| EPS total — diluted | | 0.56 | | 0.54 | | 1.14 | | 0.54 |
| Cash dividends declared per common share | | 0.43 | | 0.43 | | 0.43 | | 0.43 |
2,8112,5863,1822,9474554228134262952876032880.560.541.150.540.560.541.140.540.430.430.430.432,8112,5863,1822,9474554228134262952876032880.560.541.150.540.560.541.140.540.430.430.430.43

UNITED STATES
SECURITIES AND EXCHANGE COMMISSION
Washington, D.C. 20549
FORM 10-K
(Mark One)
|
| | | | |
x☒ | ANNUAL REPORT PURSUANT TO SECTION 13 OR 15(d) OF THE SECURITIES EXCHANGE ACT OF 1934 |
For the fiscal year ended December 31, 2017
2021 or
|
| | | | |
¨☐ | TRANSITION REPORT PURSUANT TO SECTION 13 OR 15(d) OF THE SECURITIES EXCHANGE ACT OF 1934 |
Commission File Number: 001-3034
Xcel Energy Inc.
(Exact name of registrant as specified in its charter)
For the transition period from _____ to _____ | | |
| 001-3034 |
| (Commission File Number) |
| | | | | | | | |
| Xcel Energy Inc. |
| (Exact name of registrant as specified in its charter) |
| | |
| | | | | | | | | | | | | | |
| Minnesota | | 41-0448030 |
| (State or Other Jurisdiction of Incorporation or Organization) | | (IRS Employer Identification No.) |
| | |
Minnesota | | 41-0448030 |
(State or other jurisdiction of incorporation or organization) | | (I.R.S. Employer Identification No.) |
| 414 Nicollet Mall |
Minneapolis MN | Minnesota | | 55401 |
(Address of principal executive offices)Principal Executive Offices) | | (Zip Code) |
| | | | | |
612 | 330-5500 |
(Registrant’s telephone number, including area code: 612-330-5500Telephone Number, Including Area Code) |
Securities registered pursuant to Section 12(b) of the Act:
|
| | | | | | | | | | | | | |
| Title of each class | | Trading Symbol(s) | | Name of each exchange on which registered |
| Common Stock, $2.50 par value per share | | XEL | | Nasdaq Stock Market LLC |
Securities registered pursuant to section 12(g) of the Act: None
| | |
Securities registered pursuant to section 12(g) of the Act: None
Indicate by check mark if the registrant is a well-known seasoned issuer, as defined in Rule 405 of the Securities Act. x☒ Yes ¨☐ No
Indicate by check mark if the registrant is not required to file reports pursuant to Section 13 or Section 15(d) of the Act. ¨☐ Yes x☒ No
Indicate by check mark whether the registrant (1) has filed all reports required to be filed by Section 13 or 15(d) of the Securities Exchange Act of 1934 during the preceding 12 months (or for such shorter period that the registrant was required to file such reports), and (2) has been subject to such filing requirements for the past 90 days. x
☒ Yes ¨☐ No
Indicate by check mark whether the registrant has submitted electronically and posted on its corporate Website, if any, every Interactive Data File required to be submitted and posted pursuant to Rule 405 andof Regulation
S-T (§232.405 of this chapter) during the preceding 12 months (or for such shorter period that the registrant was required to submit and post such files). x☒ Yes ¨☐ No
Indicate by check mark if disclosure of delinquent filers pursuant to Item 405 of Regulations S-K (§229.405 of this chapter) is not contained herein, and will not be contained, to the best of the registrant’s knowledge, in definitive proxy or information statements incorporated by reference in Part III of this Form 10-K or any amendment to this Form 10-K. ¨
Indicate by check mark whether the registrant is a large accelerated filer, an accelerated filer, a non-accelerated filer, a smaller reporting company, or an emerging growth company. See the definitions of “large accelerated filer,” “accelerated filer,” “smaller reporting company,” and “emerging growth company” in Rule 12b-2 of the Exchange Act. x☒ Large accelerated filer ¨☐ Accelerated filer ¨☐ Non-accelerated filer (Do not check if a smaller☐ Smaller reporting company) ¨ Smaller Reporting Company ¨company ☐ Emerging growth company
If an emerging growth company, indicate by check mark if the registrant has elected not to use the extended transition period for complying with any new or revised financial accounting standards provided pursuant to Section 13(a) of the Exchange Act. ¨☐
Indicate by check mark whether the registrant has filed a report on and attestation to its management’s assessment of the effectiveness of its internal control over financial reporting under Section 404(b) of the Sarbanes-Oxley Act (15 U.S.C.7262(b)) by the registered public accounting firm that prepared or issued its audit report. ☒ Yes
Indicate by check mark whether the registrant is a shell company (as defined in Rule 12b-2 of the Act). ¨☐ Yes x☒ No
As of June 30, 2017,2021, the aggregate market value of the voting common stock held by non-affiliates of the RegistrantsRegistrant was $23,304,874,235 and$35,463,594,471.
As of Feb. 17, 2022, there were 507,952,795 shares of common stock outstanding.
As of Feb. 19, 2018, there were 508,064,983544,213,730shares of common stock outstanding, $2.50 par value.
DOCUMENTS INCORPORATED BY REFERENCE
ThePortions of the Registrant’s Definitivedefinitive Proxy Statement for its 20182022 Annual Meeting of Shareholders isare incorporated by reference into Part III of this Form 10-K.
TABLE OF CONTENTS
Index
| | | | | | | | |
| PART I | | |
| Item 1 — | | |
| Item 1A — | | |
| Item 1B — | | |
| Item 2 — | | |
| Item 3 — | | |
| Item 4 — | | |
| | |
PART III | | |
Item 1 — | | |
| | |
| | |
| | |
| | |
| | |
| | |
| | |
| | |
| | |
| | |
| | |
| | |
| | |
| | |
| | |
| | |
| | |
| | |
| | |
| | |
Item 1A — | | |
Item 1B — | | |
Item 2 — | | |
Item 3 — | | |
Item 4 — | | |
| | |
PART II | | |
| Item 5 — | | |
| Item 6 — | | |
| Item 7 — | | |
| Item 7A — | | |
| Item 8 — | | |
| Item 9 — | | |
| Item 9A — | | |
| Item 9B — | | |
| Item 9C — | | |
PART III | | |
| PART III | | |
| Item 10 — | | |
| Item 11 — | | |
| Item 12 — | | |
| Item 13 — | | |
| Item 14 — | | |
| | |
| PART IV | | |
| Item 15 — | | |
| Item 16 — | | |
| |
| |
PART I
Item 1 — Business
DEFINITION OF ABBREVIATIONS AND INDUSTRY TERMS
PART I
Definitions of Abbreviations
| | | | | |
| Xcel Energy Inc.’s Subsidiaries and Affiliates (current and former) |
| Capital Services | Capital Services, LLC |
| Eloigne | Eloigne Company |
NCEe prime | New Century Energies, Inc.e prime inc. |
| NSP-Minnesota | Northern States Power Company, a Minnesota corporation |
| NSP System | The electric production and transmission system of NSP-Minnesota and NSP-Wisconsin operated on an integrated basis and managed by NSP-Minnesota |
| NSP-Wisconsin | Northern States Power Company, a Wisconsin corporation |
| Operating companies | NSP-Minnesota, NSP-Wisconsin, PSCo and SPS |
| PSCo | Public Service Company of Colorado |
| SPS | Southwestern Public Service Co. |
| Utility subsidiaries | NSP-Minnesota, NSP-Wisconsin, PSCo and SPS |
| WGI | WestGas InterState, Inc. |
| WYCO | WYCO Development, LLC |
| Xcel Energy | Xcel Energy Inc. and its subsidiaries |
| | | | | |
XETD | Xcel Energy Transmission Development Company, LLC |
XEST | Xcel Energy Southwest Transmission Company, LLC |
XEWT | Xcel Energy West Transmission Company, LLC |
| |
| Federal and State Regulatory Agencies |
| CPUC | |
CFTC | Commodity Futures Trading Commission |
CPUC | Colorado Public Utilities Commission |
| DOC | Minnesota Department of Commerce |
| DOE | United States Department of Energy |
| DOT | United States Department of Transportation |
| EPA | United States Environmental Protection Agency |
| FERC | Federal Energy Regulatory Commission |
| IRS | Internal Revenue Service |
| MPSC | Michigan Public Service Commission |
| MPUC | Minnesota Public Utilities Commission |
| NDPSC | North Dakota Public Service Commission |
| NERC | North American Electric Reliability Corporation |
| NMPRC | New Mexico Public Regulation Commission |
| NRC | Nuclear Regulatory Commission |
| PHMSA | Pipeline and Hazardous Materials Safety Administration |
| PSCW | Public Service Commission of Wisconsin |
| PUCT | Public Utility Commission of Texas |
| SEC | Securities and Exchange Commission |
| TCEQ | Texas Commission on Environmental Quality |
| | | | | |
| Electric, Purchased Gas and Resource Adjustment Clauses |
| CIP | Conservation improvement program |
| DSM | Demand side management |
| ECA | Retail electric commodity adjustment |
| FCA | Fuel clause adjustment |
| GCA | Gas cost adjustment |
| GUIC | Gas utility infrastructure cost rider |
| PSIA | Pipeline system integrity adjustment |
| RES | Renewable energy standard |
| TCR | Transmission cost recovery |
| | | | | |
| Other |
| AFUDC | Allowance for funds used during construction |
| ALJ | Administrative Law Judge |
| ARO | Asset retirement obligation |
| ASC | FASB Accounting Standards Codification |
| ATM | At-the-market |
| BART | Best available retrofit technology |
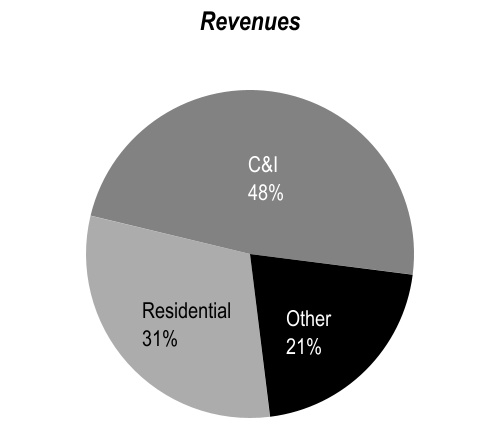
| C&I | Commercial and Industrial |
| CAGR | Corporate annual growth rate |
| CapX2020 | Alliance of electric cooperatives, municipals and investor-owned utilities in the upper Midwest involved in a joint transmission line planning and construction effort |
| CCR | Coal combustion residuals |
| | | | | |
| CCR Rule | Final rule (40 CFR 257.50 - 257.107) published by the EPA regulating the management, storage and disposal of CCRs as a nonhazardous waste |
| CDD | Cooling degree-days |
| CEO | Chief executive officer |
| CFO | Chief financial officer |
| CIG | Colorado Interstate Gas Company, LLC |
| COEO | Colorado Energy Office |
| CON | Certificate of Need |
| COVID-19 | Novel coronavirus |
| CUB | Citizens Utility Board |
| CWA | Clean Water Act |
| CWIP | Construction work in progress |
| D.C. Circuit | United States Court of Appeals for the District of Columbia Circuit |
DOCDECON | Minnesota DepartmentDecommissioning method where radioactive contamination is removed and safely disposed of Commerceat a requisite facility or decontaminated to a permitted level |
DOEDRIP | United States Department of EnergyDividend Reinvestment Program |
DOTEEI | United States Department of TransportationEdison Electric Institute |
EPAEIP | United States Environmental Protection AgencyEnergy Impact Partners |
FERCELG | Federal Energy Regulatory CommissionEffluent limitations guidelines |
| EMANI | European Mutual Association for Nuclear Insurance |
| EPS | Earnings per share |
| ESG | Environmental, Social and Governance |
| ETR | Effective tax rate |
| EVs | Electric Vehicles |
| FASB | Financial Accounting Standards Board |
| Fifth Circuit | United States Court of Appeals for the Fifth Circuit |
IRSFTR | Internal Revenue ServiceFinancial transmission right |
MPSCGAAP | Michigan Public Service CommissionGenerally accepted accounting principles |
MPUCGE | Minnesota Public Utilities CommissionGeneral Electric |
NDPSCGHG | North Dakota Public Service CommissionGreenhouse gas |
NERCHDD | North American Electric Reliability CorporationHeating degree-days |
NMPRCINPO | New Mexico Public Regulation CommissionInstitute of Nuclear Power Operations |
NRCIPCC | Nuclear Regulatory CommissionIntergovernmental Panel on Climate Change |
PHMSAIPP | Pipeline and Hazardous Materials Safety AdministrationIndependent power producing entity |
PSCWISO | Public Service Commission of Wisconsin |
PUCT | Public Utility Commission of Texas |
SDPUC | South Dakota Public Utilities Commission |
SEC | Securities and Exchange Commission |
|
| |
Electric, Purchased Gas and Resource Adjustment Clauses |
CIP | Conservation improvement program |
DCRF | Distribution cost recovery factor |
DSM | Demand side management |
DSMCA | Demand side management cost adjustment |
ECA | Retail electric commodity adjustment |
EE | Energy efficiency |
EECRF | Energy efficiency cost recovery factor |
EIR | Environmental improvement rider (recovers the costs associated with investments in
environmental improvements to fossil fuel generation plants)
|
FCA | Fuel clause adjustment |
FPPCAC | Fuel and purchased power cost adjustment clause |
GCA | Gas cost adjustment |
GUIC | Gas utility infrastructure cost rider |
PCCA | Purchased capacity cost adjustment |
PCRF | Power cost recovery factor (recovers the costs of certain purchased power costs) |
PGA | Purchased gas adjustment |
RDF | Renewable development fund |
RER | Renewable energy rider |
RES | Renewable energy standard |
RESA | Renewable energy standard adjustment (recovers the costs of new renewable generation) |
PSIA | Pipeline system integrity adjustment
|
SCA | Steam cost adjustment |
SEP | State energy policy rider |
TCA | Transmission cost adjustment |
TCR | Transmission cost recovery adjustment |
TCRF | Transmission cost recovery factor (recovers transmission infrastructure improvement costs
and changes in wholesale transmission charges)
|
WCA | Windsource® cost adjustment
|
| |
Other Terms and Abbreviations |
AFUDC | Allowance for funds used during construction |
ALJ | Administrative law judge |
APBO | Accumulated postretirement benefit obligation |
ARO | Asset retirement obligation |
ASC | FASB Accounting Standards Codification |
ASU | FASB Accounting Standards Update |
BART | Best available retrofit technology |
C&I | Commercial and Industrial |
CAA | Clean Air Act |
CACJA | Clean Air Clean Jobs Act |
CAIR | Clean Air Interstate Rule |
CAISO | California Independent System Operator |
CapX2020ITC | Alliance of electric cooperatives, municipals and investor-owned utilities in the upper
Midwest involved in a joint transmission line planning and construction effort
|
CCN | Certificate of convenience and necessity |
CIG | Colorado Interstate Gas Company, LLC |
CO2
| Carbon dioxide |
CON | Certificate of need |
|
| |
CPCN | Certificate of public convenience and necessity |
CPP | Clean Power Plan |
CSAPR | Cross-State Air Pollution Rule |
CWA | Clean Water Act |
CWIP | Construction work in progress |
EEI | Edison Electric Institute |
EGU | Electric generating unit |
EPS | Earnings per share |
EPU | Extended power uprate |
ERCOT | Electric Reliability Council of Texas |
ETR | Effective tax rate |
FASB | Financial Accounting Standards Board |
FTR | Financial transmission right |
FTY | Forecast test year |
GAAP | Generally accepted accounting principles |
GHG | Greenhouse gas |
Golden Spread | Golden Spread Electric Cooperative, Inc. |
HTY | Historic test year |
IM | Integrated market |
IPP | Independent power producing entities |
IRC | Internal Revenue Code |
IRP | Integrated Resource Plan |
ISFSI | Independent Spent Fuel Storage Installation |
ITC | Investment Tax Credit |
LCMLP&L | Life cycle managementLubbock Power & Light |
LLWMEC | Low-level radioactive wasteMankato Energy Center |
LNGMGP | Liquefied natural gas |
MGP | Manufactured gas plant |
| MISO | Midcontinent Independent System Operator, Inc. |
Moody’sNAAQS | Moody’s Investor Services |
MWTG | Mountain West Transmission Group |
NAAQS | National Ambient Air Quality Standard |
| Native load | Customer demandDemand of retail and wholesale customers that a utility has an obligation to serve
under statute or long-term contract |
| NAV | Net asset value |
NOLNEIL | Nuclear Electric Insurance Ltd. |
| NOL | Net operating loss |
NOX
NOPR | Nitrogen oxideNotice of proposed rulemaking |
NTCO&M | Notifications to construct |
O&M | Operating and maintenance |
OATTOAG | Minnesota Office of the Attorney General |
| OATT | Open Access Transmission Tariff |
OCCPFAS | Office of Consumer CounselPer- and PolyFluoroAlkyl Substances |
OCIPI | Other comprehensive income |
PI | Prairie Island nuclear generating plant |
PJMPost-65 | PJM Interconnection, LLCPost-Medicare |
PMPPA | Particulate matter |
PPA | Purchased power agreement |
PRPPre-65 | Potentially responsible partyPre-Medicare |
| PTC | Production tax credit |
PVREC | Photovoltaic |
QF | Qualifying facilities |
R&E | Research and experimentation |
REC | Renewable energy credit |
|
| | | | |
RFPROE | Request for proposal |
ROE | Return on equity |
RPSROU | Renewable portfolio standardsRight-of-use |
| RTO | Regional Transmission Organization |
SIPS&P | State implementationStandard & Poor’s Global Ratings |
| SERP | Supplemental executive retirement plan |
| SMMPA | Southern Minnesota Municipal Power Agency |
SO2 | Sulfur dioxide |
| SPP | Southwest Power Pool, Inc. |
S&PTCJA | Standard & Poor’s Ratings Services |
TCJA | 2017 federal tax reform enacted as Public Law No: 115-97, commonly referred to as the Tax Cuts and Jobs Act
|
TOsTHI | Transmission ownersTemperature-humidity index |
TransCoTO | Transmission-only subsidiaryTransmission owner |
| TSR | Total shareholder return |
VIEVaR | Value at Risk |
| VIE | Variable interest entity |
| | | | | |
| Measurements |
MeasurementsBcf | |
Bcf | Billion cubic feet |
GWhKV | Gigawatt hoursKilovolts |
KVKWh | KilovoltsKilowatt hours |
KWhMMBtu | Kilowatt hours |
Mcf | Thousand cubic feet |
MMBtu | Million British thermal units |
| MW | Megawatts |
| MWh | Megawatt hours |
COMPANY OVERVIEW
| | |
| Where to Find More Information |
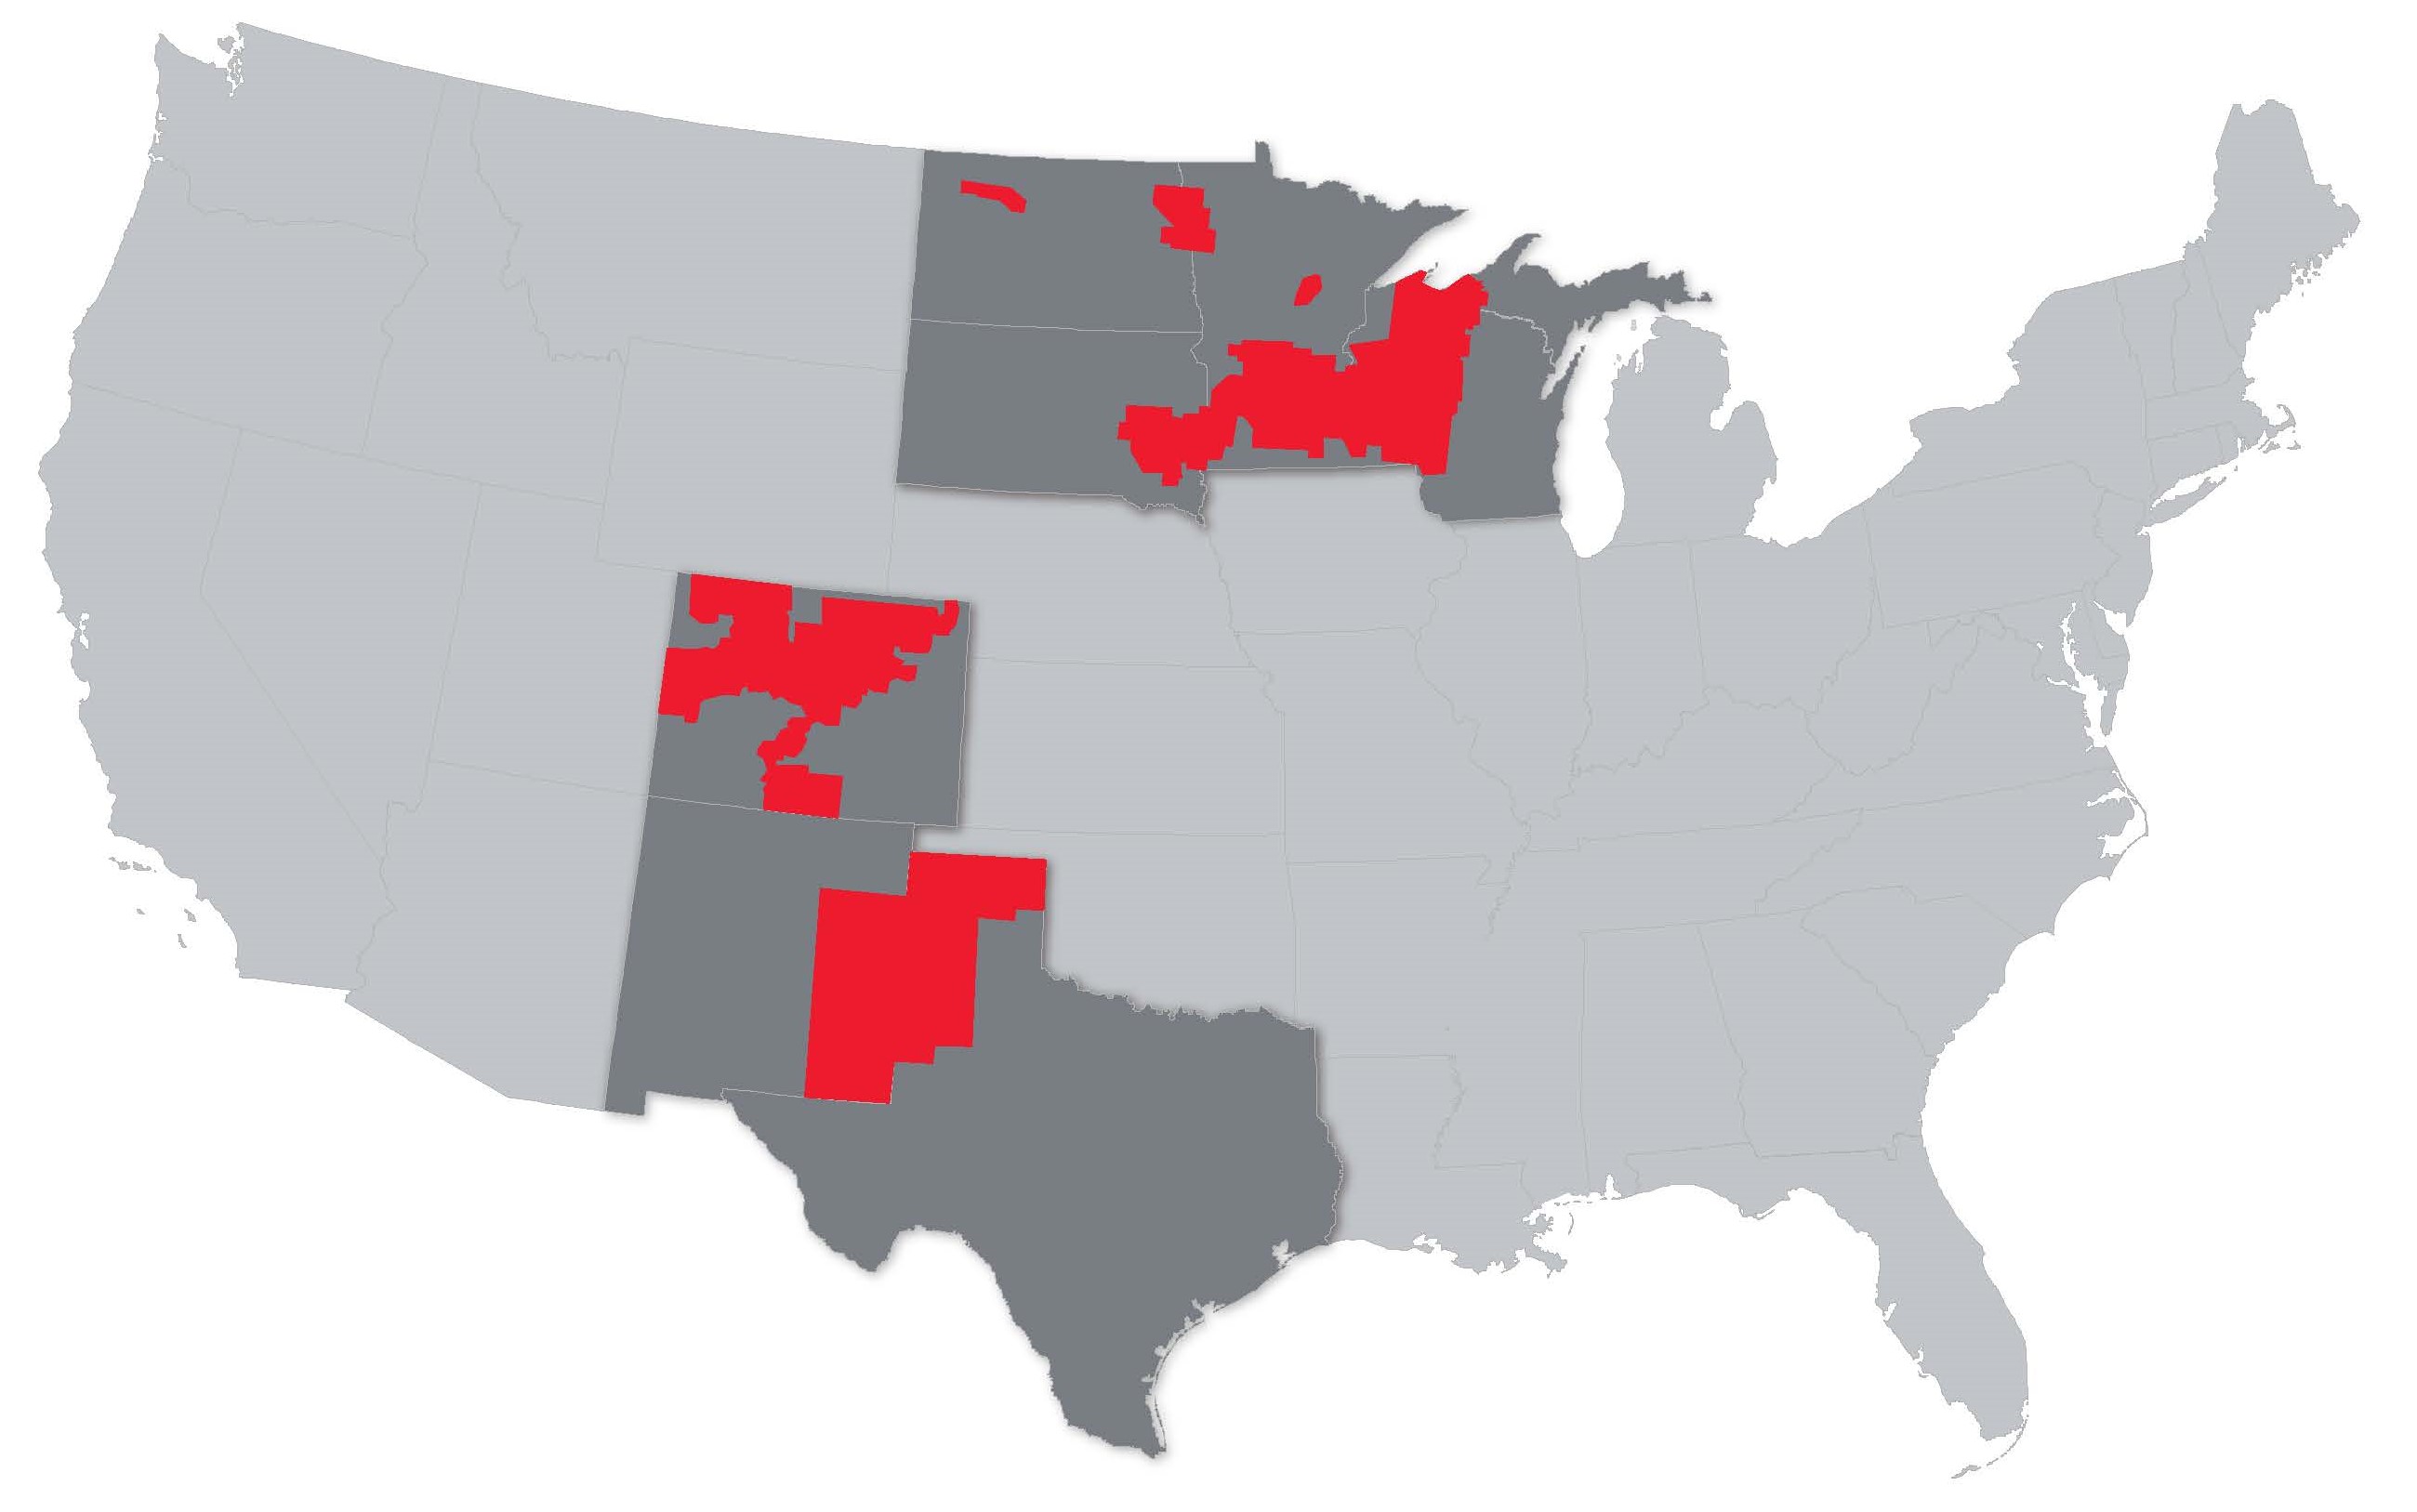
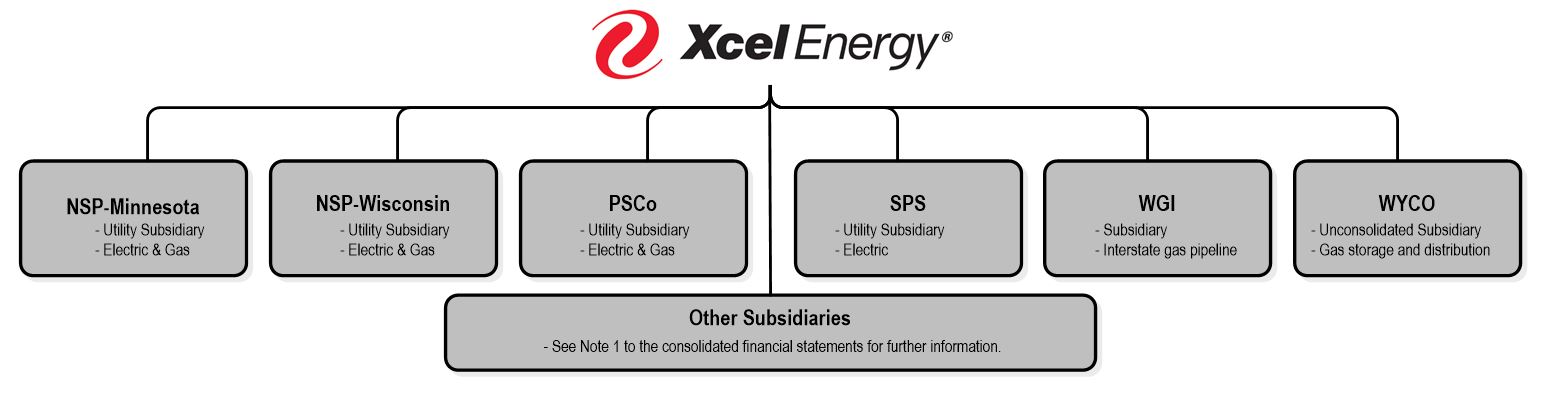
Xcel Energy Inc. is a holding company with subsidiaries engaged primarily in the utility business. In 2017, Xcel Energy Inc.’s continuing operations included the activity of four wholly owned utility subsidiaries that serve electric and natural gas customers in portions of Colorado, Michigan, Minnesota, New Mexico, North Dakota, South Dakota, Texas and Wisconsin. These utility subsidiaries are NSP-Minnesota, NSP-Wisconsin, PSCo and SPS, and serve customers. Along with WYCO, a joint venture formed with CIG to develop and lease natural gas pipelines, storage, and compression facilities, and WGI, an interstate natural gas pipeline company, these companies comprise the regulated utility operations.
Xcel Energy Inc. was incorporated under the laws of Minnesota in 1909. Xcel Energy’s executive offices are located at 414 Nicollet Mall, Minneapolis, Minn. 55401. Its website address is www.xcelenergy.com. Xcel Energy makes available, free of charge through its website, its annual report on Form 10-K, quarterly reports on Form 10-Q, current reports on Form 8-K and all amendments to those reports filed or furnished pursuant to Section 13(a) or 15(d) of the Securities Exchange Act of 1934 as soon as reasonably practicable after the reports are electronically filed with or furnished to the SEC. The public may read and copy any materials that Xcel Energy files with the SEC at the SEC’s Public Reference Room at 100 F Street, N.E., Washington, D.C. 20549. The public may obtain information on the operation of the Public Reference Room by calling the SEC at 1-800-SEC-0330.
The SEC also maintains an internet site that contains reports, proxy and information statements, and other information regarding issuers that file electronically at http://www.sec.gov. The information on Xcel Energy’s website is not a part of, or incorporated by reference in, this annual report on Form 10-K. Xcel Energy intends to make future announcements regarding Company developments and financial performance through its website, www.xcelenergy.com, as well as through press releases, filings with the SEC, at http://www.sec.gov.conference calls and webcasts.
NSP-Minnesota | | |
| Forward-Looking Statements |
Except for the historical statements contained in this report, the matters discussed herein are forward-looking statements that are subject to certain risks, uncertainties and assumptions. Such forward-looking statements, including those relating to 2022 EPS guidance, long-term EPS and dividend growth rate objectives, future sales, future expenses, future tax rates, future operating performance, estimated base capital expenditures and financing plans, projected capital additions and forecasted annual revenue requirements with respect to rider filings, expected rate increases to customers, expectations and intentions regarding regulatory proceedings, and expected impact on our results of operations, financial condition and cash flows of resettlement calculations and credit losses relating to certain energy transactions, as well as assumptions and other statements are intended to be identified in this document by the words “anticipate,” “believe,” “could,” “estimate,” “expect,” “intend,” “may,” “objective,” “outlook,” “plan,” “project,” “possible,” “potential,” “should,” “will,” “would” and similar expressions. Actual results may vary materially. Forward-looking statements speak only as of the date they are made, and we expressly disclaim any obligation to update any forward-looking information. The following factors, in addition to those discussed elsewhere in this Annual Report on Form 10-K for the fiscal year ended Dec. 31, 2021 (including risk factors listed from time to time by Xcel Energy Inc. in reports filed with the SEC, including “Risk Factors” in Item 1A of this Annual Report on Form 10-K hereto), could cause actual results to differ materially from management expectations as suggested by such forward-looking information: uncertainty around the impacts and duration of the COVID-19 pandemic, including potential workforce impacts resulting from vaccination requirements, quarantine policies or government restrictions, and sales volatility; operational safety, including our nuclear generation facilities and other utility operations; successful long-term operational planning; commodity risks associated with energy markets and production; rising energy prices and fuel costs; qualified employee work force and third-party contractor factors; violations of our Codes of Conduct; ability to recover costs; changes in regulation and subsidiaries’ ability to recover costs from customers; reductions in our credit ratings and the cost of maintaining certain contractual relationships; general economic conditions, including inflation rates, monetary fluctuations, supply chain constraints and their impact on capital expenditures and/or the ability of Xcel Energy Inc. and its subsidiaries to obtain financing on favorable terms; availability or cost of capital; our customers’ and counterparties’ ability to pay their debts to us; assumptions and costs relating to funding our employee benefit plans and health care benefits; our subsidiaries’ ability to make dividend payments; tax laws; effects of geopolitical events, including war and acts of terrorism; cyber security threats and data security breaches; seasonal weather patterns; changes in environmental laws and regulations; climate change and other weather; natural disaster and resource depletion, including compliance with any accompanying legislative and regulatory changes; costs of potential regulatory penalties; and regulatory changes and/or limitations related to the use of natural gas as an energy source.
NSP-Minnesota
Xcel Energy (the “Company”) is a utility primarily engaged in the generation, purchase, transmission, distribution and sale of electricity in Minnesota, North Dakota and South Dakota. NSP-Minnesota also purchases, transports, distributes and sells natural gas to retail customers and transports customer-owned natural gas in Minnesota and North Dakota. NSP-Minnesota providesmajor U.S. regulated electric utility service to approximately 1.5 million customers and natural gas utility servicedelivery company headquartered in Minneapolis, Minnesota (incorporated in Minnesota in 1909). Xcel Energy serves customers in eight mid-western and western states, including portions of Colorado, Michigan, Minnesota, New Mexico, North Dakota, South Dakota, Texas and Wisconsin. Xcel Energy provides a comprehensive portfolio of energy-related products and services to approximately 0.53.7 million customers. Approximately 88 percent of NSP-Minnesota’s retail electric operating revenues were derived from operations in Minnesota during 2017customers and 2016. Although NSP-Minnesota’s large C&I electric retail customers are comprised of many diversified industries, a significant portion of NSP-Minnesota’s large C&I electric sales include: petroleum refining and related industries, food products and health services. For small C&I customers, significant electric retail sales include the following industries: real estate and educational services. Generally, NSP-Minnesota’s earnings contribute approximately 35 percent to 45 percent of Xcel Energy’s consolidated net income.
The electric production and transmission costs of the entire NSP System are shared by NSP-Minnesota and NSP-Wisconsin. A FERC-approved Interchange Agreement between the two companies provides for the sharing of all generation and transmission costs of the NSP System.
The wholesale customers served by NSP-Minnesota comprised approximately 14 percent of its total KWh sold in 2017.
NSP-Minnesota owns the following direct subsidiary: United Power and Land Company, which holds real estate.
NSP-Wisconsin
NSP-Wisconsin is a utility primarily engaged in the generation, transmission, distribution and sale of electricity in portions of northwestern Wisconsin and in the western portion of the Upper Peninsula of Michigan. NSP-Wisconsin purchases, transports, distributes and sells2.1 million natural gas to retail customers through four utility subsidiaries (i.e., NSP-Minnesota, NSP-Wisconsin, PSCo and transports customer-owned natural gas in this service territory. NSP-Wisconsin provides electricSPS). Along with the utility service to approximately 259,000 customers and natural gas utility service to approximately 114,000 customers. Approximately 98 percent of NSP-Wisconsin’s retail electric operating revenues were derived from operations in Wisconsin during 2017 and 2016. Although NSP-Wisconsin’s large C&I electric retail customers are comprised of many diversified industries, a significant portion of NSP-Wisconsin’s large C&I electric sales include: food products, paper, allied products and electric, gas and sanitary services. For small C&I customers, significant electric retail sales includesubsidiaries, the following industries: grocery and dining establishments, educational services and health services. Generally, NSP-Wisconsin’s earnings contribute approximately five percent to 10 percent of Xcel Energy’s consolidated net income.
The management of the electric generation and transmission system of NSP-Wisconsin is integrated with NSP-Minnesota.
NSP-Wisconsin owns the following direct subsidiaries: Chippewa and Flambeau Improvement Co., which operates hydro reservoirs; Clearwater Investments Inc., which owns interests in affordable housing; and NSP Lands, Inc., which holds real estate.
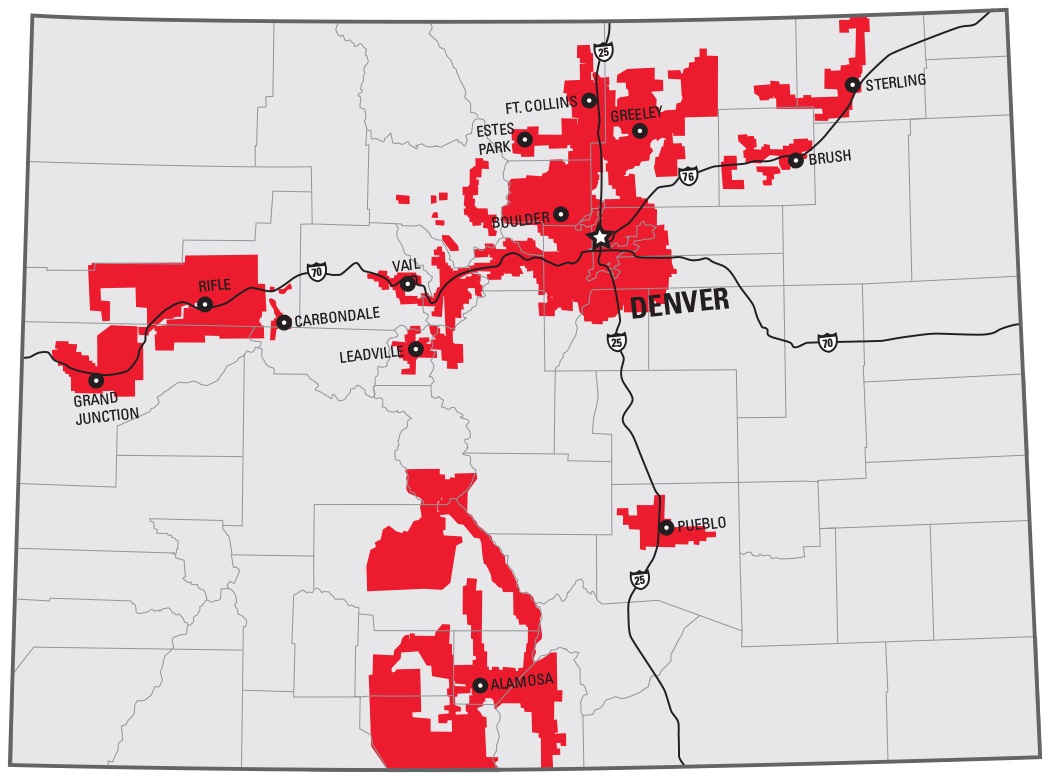
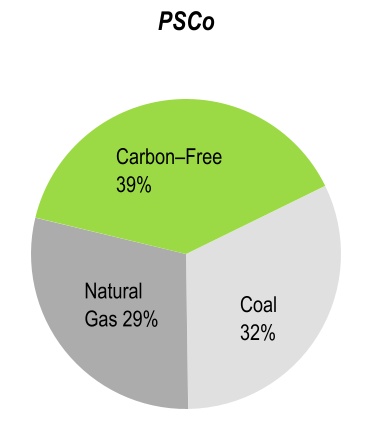
PSCo
PSCo is a utility engaged primarily in the generation, purchase, transmission, distribution and sale of electricity in Colorado. PSCo also purchases, transports, distributes and sells natural gas to retail customers and transports customer-owned natural gas. PSCo provides electric utility service to approximately 1.5 million customers and natural gas utility service to approximately 1.4 million customers. All of PSCo’s retail electric operating revenues were derived from operations in Colorado. Although PSCo’s large C&I electric retail customers are comprised of many diversified industries, a significant portion of PSCo’s large C&I electric sales include: fabricated metal products, communications and health services. For small C&I customers, significant electric retail sales include the following industries: real estate and dining establishments. Generally, PSCo’s earnings contribute approximately 35 percent to 45 percent of Xcel Energy’s consolidated net income.
The wholesale customers served by PSCo comprised approximately 14 percent of its total KWh sold in 2017.
PSCo owns the following direct subsidiaries: 1480 Welton, Inc. and United Water Company, both of which own certain real estate interests; and Green and Clear Lakes Company, which owns water rights and certain real estate interests. PSCo also holds a controlling interest in several other relatively small ditch and water companies.
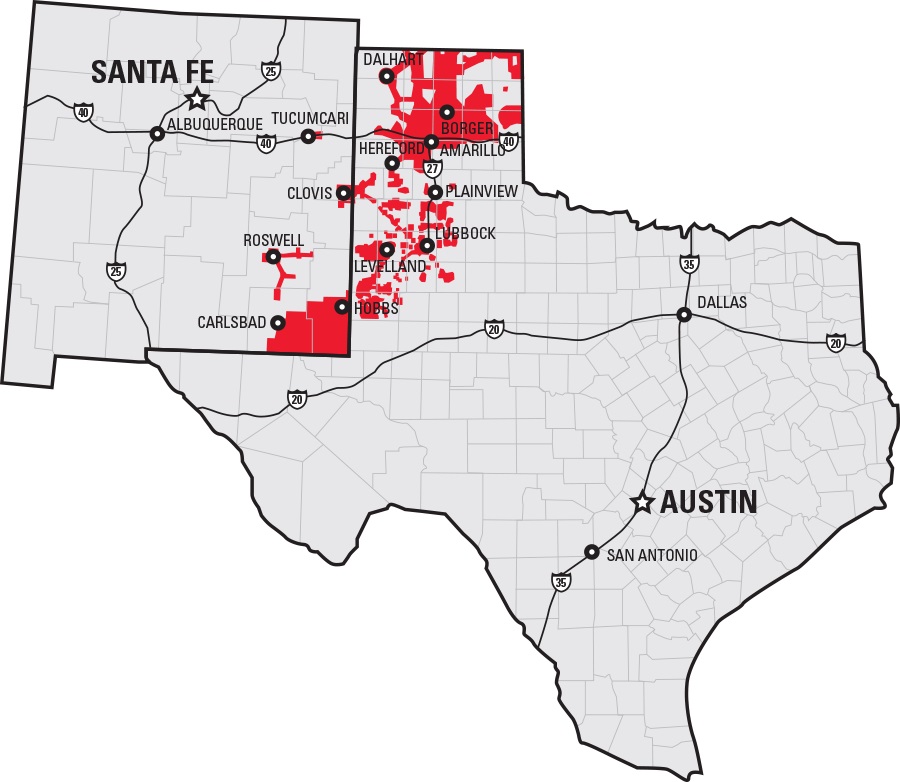
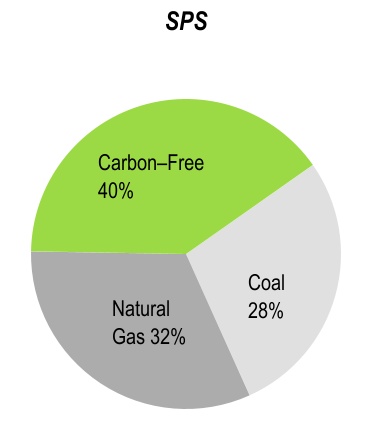
SPS
SPS is a utility engaged primarily in the generation, purchase, transmission, distribution and sale of electricity in portions of Texas and New Mexico. SPS provides electric utility service to approximately 390,000 retail customers in Texas and New Mexico. Approximately 71 percent of SPS’ retail electric operating revenues were derived from operations in Texas during 2017 and 2016. Although SPS’ large C&I electric retail customers are comprised of many diversified industries, a significant portion of SPS’ large C&I electric sales include: oil and gas extraction, as well as petroleum refining and related industries. For small C&I customers, significant electric retail sales include the following industries: oil and gas extraction and grocery establishments. Generally, SPS’ earnings contribute approximately 10 percent to 15 percent of Xcel Energy’s consolidated net income.
The wholesale customers served by SPS comprised approximately 29 percent of its total KWh sold in 2017.
Other Subsidiaries
WGI is a small interstate natural gas pipeline company engaged in transporting natural gas from the PSCo system near Chalk Bluffs, Colo., to Cheyenne, Wyo.
transmission-only subsidiaries, WYCO was formed as a(a joint venture formed with CIG to develop and lease natural gas pipeline,pipelines, storage and compression facilities.facilities) and WGI (an interstate natural gas pipeline company) comprise the regulated utility operations. Xcel Energy’s nonregulated subsidiaries include Eloigne, Capital Services, Venture Holdings and Nicollet Project Holdings.
| | | | | | | | | | | |
| Utility Subsidiaries’ Service Territory | | |
| | | |
| | |
| Electric customers | 3.7 million | |
| Natural gas customers | 2.1 million | |
| Total assets | $57.9 billion | |
| Electric generating capacity | 20,653 MW | |
| Natural gas storage capacity | 53.4 Bcf | |
| Electric transmission lines (conductor miles) | 111,434 miles | |
| Electric distribution lines (conductor miles) | 210,470 miles | |
| Natural gas transmission lines | 2,293 miles | |
| Natural gas distribution lines | 36,510 miles | |
| |
Xcel Energy strives to be the preferred and trusted provider of the energy our customers need, while offering a competitive total return to shareholders. We deliver on our vision through three strategic priorities:
| | | | | | | | |
| LEAD THE CLEAN ENERGY TRANSITION | ENHANCE THE CUSTOMER EXPERIENCE | KEEP BILLS LOW |
Sustainability is embedded in our strategy. We are retiring coal plants, adding renewables, exploring new technologies and helping to electrify other sectors, while maintaining customer affordability and supporting our employees and communities.
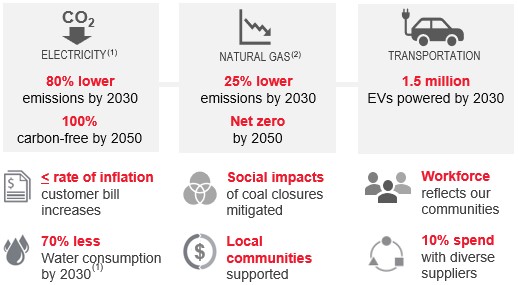
We are the first U.S. energy provider to set aggressive goals for reducing GHG emissions across three large sectors of the economy: electricity, natural gas use in buildings and transportation.
Our sustainability commitments include:
(1)Includes owned and purchased electricity provided to customers.
(2)Spans natural gas supply, distribution and customer use; includes net-zero methane emissions on our natural gas system by 2030.
We demonstrate environmental, social and governance leadership by engaging with stakeholders and mitigating risk, while staying committed to our customers, employees and communities.
Rooted in a culture of compliance and ethical conduct, our decisions and actions are guided by our Code of Conduct and our four values:
| | | | | | | | | | | |
| Connected | Committed | Safe | Trustworthy |
These values are reinforced by policies that govern safety practices, ethical standards and conduct, environmental performance, diversity and inclusion, political contributions, and other aspects of our business.
Our values, culture and Code of Conduct serve as the foundation upon which Xcel Energy’s Board of Directors, employees, contractors and suppliers approach their work in delivering on our three strategic priorities.
Lead the Clean Energy Transition
For more than a decade, Xcel Energy has proactively managed the risk of climate change and worked to meet increasing demand for cleaner energy.
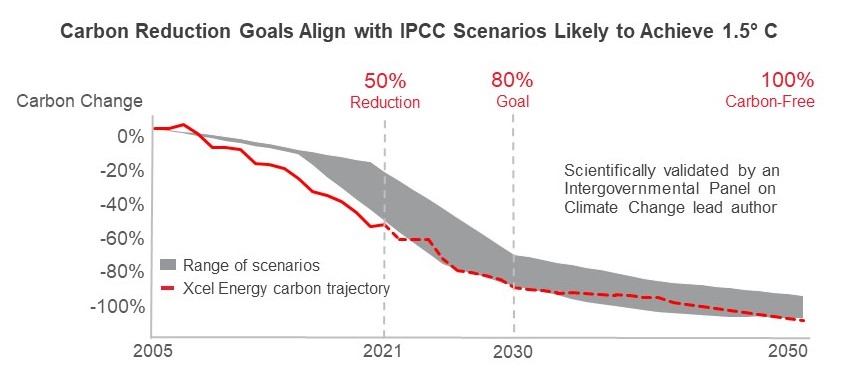
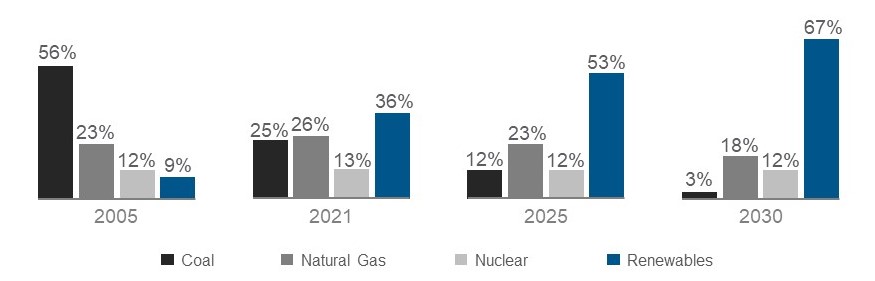
Xcel Energy was the first major U.S. utility to establish a carbon-free vision, targeting 100% carbon-free electricity by 2050 and an interim goal of 80% reduction in carbon emissions by 2030 (from 2005 levels), including owned and purchased power. A lead author for the IPCC confirmed that our vision aligns with science-based scenarios likely to limit global warming to 1.5 degrees Celsius from pre-industrial levels.
Goal includes owned and purchased power.
The pace of achieving a carbon-free vision is governed by reliability and customer affordability. Our filed resource plans outline a clear, transparent path to achieve an 80% carbon reduction using current technologies, while maintaining customer bill increases at or below the rate of inflation. Moving from 80% carbon reduction to 100% carbon-free electricity will require new dispatchable and scalable technologies that are economically viable, as well as supportive public policy. Resiliency and innovation also remain paramount to a successful transition, as does the economic vitality of our communities.
As we prepare for early coal plant retirements, we provide employees advanced notice and offer retraining and relocation opportunities, with no layoffs to date. We also help attract and make investments to offset community economic impacts. Xcel Energy has a 50 percent ownership interestlong track record of working with our communities on energy, climate and environmental initiatives that impact them and has publicly committed to furthering environmental justice.
We consistently set aggressive goals and hold ourselves accountable to our customers, communities and investors, as well as, to our own values. Xcel Energy instituted oversight of environmental performance by the Board of Directors beginning in WYCO. The gas pipeline2000 and storage facilities are leased under a FERC-approved agreementwas among the first U.S. utilities to CIG.tie carbon reduction to executive compensation over fifteen years ago.
Through 2021, we reduced carbon emissions from generation serving customers by an estimated 50% (from 2005 levels) and remain on track to achieve 80% carbon reduction by 2030.
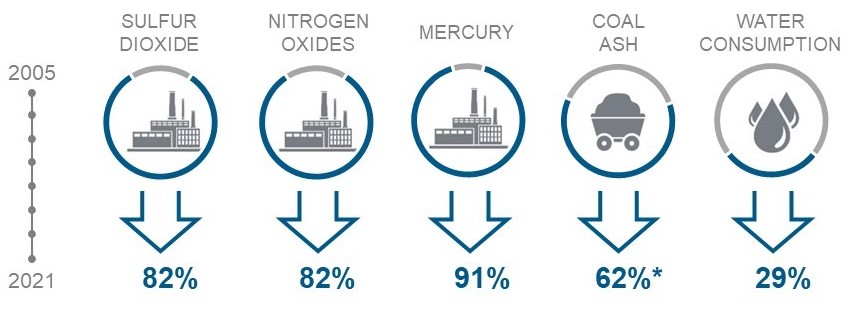
Other notable environmental improvements include:
Results from owned generation except for water, which includes owned and purchased power.
*Coal ash reduction is as of 2020.
Xcel Energy Services Inc.has provided a voluntary, third-party verified annual GHG disclosure since 2005, longer than any other U.S. utility. We are a founding member of The Climate Registry and a supporter of the Task Force on Climate-Related Financial Disclosures. Our disclosures also align with the Global Reporting Initiative, Sustainability Accounting Standards Board and United Nations Sustainable Development Goals frameworks.
Since year-end 2020, we have completed four wind farms, adding ~800 MW (includes the Dakota Range project which went in service in January 2022) of owned wind to our system that provides significant environmental benefits and cost savings for our customers. Xcel Energy’s wind capacity is the service company fornow over 11,000 MW, including nearly 4,500 MW of owned wind.
By 2030, we project that approximately 80% of our energy will come from carbon-free resources.
Based on resource plans filed in Minnesota and Colorado, Xcel Energy Inc.anticipates nearly 10,000 MW of additional renewables over the next decade, and expects to be coal-free by 2034.
Colorado resource plan — settlement pending CPUC approval
XETD•87% carbon reduction by 2030 and XEST are TransCos thatfull coal exit by 2034.
•~3,900 MW of wind and solar additions.
•~1,700 MW of flexible resources and storage.
•~1,200 MW of distributed solar generation.
Minnesota resource plan — approved by MPUC
•85% carbon reduction and full coal exit by 2030.
•4,650 MW of wind and solar additions by 2032; the plan includes an additional 1,100 MW of renewables beyond 2032.
•Transmission infrastructure to connect new renewables to the grid.
•Extension of the Monticello nuclear plant through 2040.
•~3,800 MW of firm peaking capacity for reliability before 2030, including hydrogen-ready combustion turbines, the combustion turbines will respectively, participateneed to go through a CON process.
•Additional ~2,100 MW of firm capacity and storage post 2030, to be addressed in MISOfuture proceedings.
Texas and SPP competitive bidding processesNew Mexico
•Proposed full coal exit by 2034 upon early retirement of our Tolk plant.
•Conversion of our Harrington coal plant to natural gas.
We plan to limit coal usage through dispatching units seasonally where possible. Natural gas and other dispatchable resources will be used as needed for reliability and resiliency as more renewables come on the system.
Significant transmission projects. XEWT is a TransCo formedexpansion will be required to competitively bid onenable future renewables. Our Pathway project (if approved) in Colorado will provide over 560 miles of transmission projectslines and enable nearly 5,500 MW of new renewables, including access to some of the region’s richest wind resources. We also anticipate expansion in the western United States.Upper Midwest over the next decade as part of MISO’s transmission expansion planning effort, creating investment opportunity.
Our clean energy leadership encompasses our natural gas business as well. In 2021, we committed to reduce GHG emissions by 25% by 2030 from 2020 levels and deliver net-zero natural gas service by 2050, including customer use.
Plans include:
•Influencing suppliers - pursue certified low/no net emissions supply.
•Operating the cleanest possible system – incorporate clean fuels.
•Offering customer options – encourage electrification, where beneficial.
Xcel Energy’s leadership also extends beyond our electric and gas businesses to other parts of the economy. In addition to transitioning our own generation fleet, we are helping to decarbonize other sectors, starting with transportation. We aim to enable 1.5 million EVs across our states by 2030, representing a nearly $2 billion investment, 0.6% to 0.7% incremental annual retail sales growth and avoidance of roughly 5 million tons of CO2 emissions annually.
Enhance the Customer Experience
Xcel Energy Inc.’s nonregulated subsidiaries include Eloignehas a comprehensive suite of renewable and Capital Services. Eloigne investsconservation programs that provide customers with clean energy options and help keep their bills low. We are also transforming and expanding our electric grid to accommodate increased load growth, renewable energy and distributed energy resources.
In 2021, Xcel Energy installed over 300,000 smart meters and plans to install more than one million in rental housing2022. Xcel Energy also launched 12 EV programs for residential and commercial customers, received approval of our New Mexico plan, and continued to prepare for increased levels of EV adoption across our states.
For our local communities, we initiated 20 economic development projects that qualifyin 2021, which are projected to lead to over $1 billion in capital investments and 5,000 jobs. Additionally, over 60% of our supply chain spend was local.
Keep Bills Low
Customer affordability is critical to successful strategy execution and we are working to keep bill increases at or below the rate of inflation. Since 2013, we have managed average residential bill growth to below 1% annually, with electric and natural gas bill increases of 0.8% and 0.3%, respectively.
Xcel Energy has invested more than $2 billion over the past decade in a comprehensive suite of conservation programs. We have kept O&M expenses flat since 2014, while adding significant renewables and without compromising safety or reliability.
Xcel Energy continues to prudently invest in appropriate areas consistent with its continuing commitment to minimize costs through ongoing process and technology improvements.
Our geographic advantages in wind and solar also enable customer savings, which we call our “Steel for low-income housingFuel” strategy. High capacity factors, coupled with renewable tax credits and Capital Services procures equipmentavoided fuel costs, enable Xcel Energy to add renewables while saving customers money. To date, we have delivered more than $1.8 billion in customer savings by adding owned wind to our system.
In addition to continued savings from economic renewables, disciplined cost control and future coal plant retirements, we anticipate sales growth from electric vehicles will help keep bills low for constructionall customers in the long term, as well as provide customers with annual fuel savings (equivalent cost per gallon for fueling with electricity vs. gasoline) of renewable generation facilities at other subsidiaries.approximately $1 billion by 2030.
Deliver a Competitive Total Return to Investors
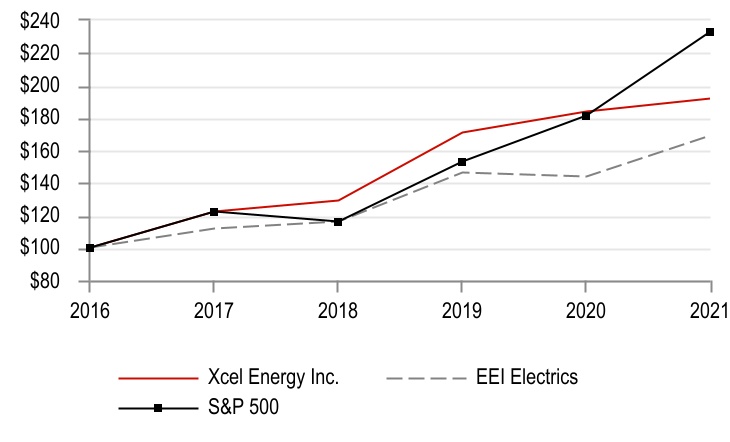
Successful strategy execution, along with our disciplined approach to growth, operations and management of environmental, social and governance issues, positions us to continue delivering a competitive TSR.
We have consistently achieved our financial objectives, meeting or exceeding our initial earnings guidance range for 17 consecutive years and delivering dividend growth for 18 consecutive years.
Over the past five years, GAAP earnings have grown by 6% annually and our annual dividend growth was 6.1%. Xcel Energy works to maintain senior secured debt credit ratings in the A range and senior unsecured debt credit ratings in the BBB+ to A range. Current ratings are consistent with this goal.
Human Capital
Xcel Energy conducts its utilityemployees are the driving force behind our Company’s success. Our strategic, data-driven approach to workforce planning helps ensure we will continue to have the skills and capabilities required to meet the evolving needs of our business, customers and communities. We are also deeply committed to diversity, equity, human rights and safety.
Safety
Continuously elevating the quality and safety of the workplace is a top priority. We are considered a benchmark company for our Safety Always approach, focused on eliminating life-altering injuries through a trusted, transparent culture and the use of critical controls. All employees have “stop work authority” and are expected to keep each other, our customers and the public safe. Employees are encouraged to speak up, share experiences and learn from events to help protect themselves, their coworkers and the public.
The Board of Directors has oversight for employee and public safety through the Operations, Nuclear, Environmental and Safety committee, both of which are also tied to annual incentive compensation.
Benefits
Xcel Energy offers a competitive benefits package, including: performance-based compensation, supported by a management system that emphasizes ongoing coaching conversations. Benefits also include floating holidays and recognition, retirement and holistic well-being programs.
Management continuously evaluates benefits to maintain a market competitive, performance-based, shareholder-aligned total rewards package that supports our ability to attract, engage and retain a talented and diverse workforce, while reinforcing and rewarding strong performance.
Diversity, Equity, Inclusion and Human Rights
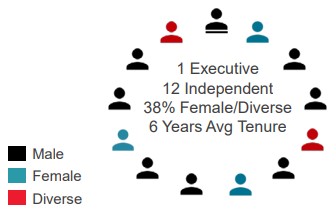
We aim to create an inclusive culture where employees are treated equitably, and diversity is not only accepted but celebrated. This starts with our Board of Directors, of which eight members were elected in the past five years.
The Board of Directors oversees our workforce strategy, including diversity and inclusion initiatives. In 2021, Xcel Energy added an incentive-based metric focused on diverse interview panels, executive sponsorship and employee feedback on inclusion in the workplace. A total of 70% of annual incentive pay was tied to safety, system reliability and diversity, equity and inclusion metrics.
In 2021, nearly all offers made had diverse hiring panels and executive sponsors consistently met with their employee counterparts at least monthly. We have also disclosed our Equal Employment Opportunity Employer Information Report (EEO-1).
Our CEO and senior executives lead by example, fostering an open and inclusive work environment through their interactions, communications and personal sponsorship of diverse talent throughout the organization.
We partner with educational and community organizations to attract and hire diverse employees who reflect the communities we serve and live our values. Workforce demographics as of December 2021 (unless otherwise noted):
| | | | | | | | |
| Female | Ethnically Diverse |
Board of Directors (a) | 23 | % | 15 | % |
CEO direct reports (a) | 36 | % | 18 | % |
| Management | 22 | % | 11 | % |
| Employees | 24 | % | 17 | % |
| New hires | 39 | % | 26 | % |
| Interns (hired throughout 2021) | 34 | % | 27 | % |
(a)Demographics as of Feb. 1, 2022.
Veteran hiring is also a focus, with roughly 10% of employees having served in the military.
To help foster a culture of inclusivity, leaders and employees receive training on microinequities and unconscious bias. The Company hosts 11 business resource groups to support employee interests and obtain diverse perspectives when solving challenges and achieving goals.
Xcel Energy also respects employees’ freedom of association and their right to collectively organize. As of Dec. 31, 2021, approximately 44% of our employees were covered by collective bargaining agreements.
| | | | | | | | |
| Employees Covered by Collective Bargaining Agreements | Total Full-Time Employees |
| NSP-Minnesota | 2,020 | | 3,083 | |
| NSP-Wisconsin | 382 | | 518 | |
| PSCo | 1,818 | | 2,314 | |
| SPS | 736 | | 1,099 | |
| XES | — | | 4,307 | |
| Total | 4,956 | | 11,321 | |
Employee turnover for 2021 and future projected retirement eligibility:
| | | | | | | | | | | | | | |
| Employee Turnover | | Retirement Eligibility |
| Bargaining | 7 | % | | Within next 5 years | 26 | % |
| Non-Bargaining | 15 | % | | Within next 10 years | 40 | % |
Overall (a) | 12 | % | | | |
(a)31% of turnover was due to retirements.
Xcel Energy has publicly confirmed our commitment to the advancement and protection of human rights, consistent with U.S. human rights laws and the general principles in the International Labour Organization Conventions. Code of Conduct training is required for all employees annually and the Board of Directors.
The Company does not tolerate Code violations or other unacceptable behaviors. We expect and offer employees multiple avenues to raise concerns or report wrong-doing and do not permit any retaliation.
Xcel Energy recently received the following reportable segments: regulatedrecognitions:
| | | | | | | | | | | |
| | | |
| Fortune | Human Rights Campaign | GI Jobs | Military Times |
| World’s Most Admired Companies | Best Places to Work for LGBTQ Equality | Military Friendly Employer | Best for Vets |
Utility Subsidiaries | | | | | | | | | | | | | | | | | |
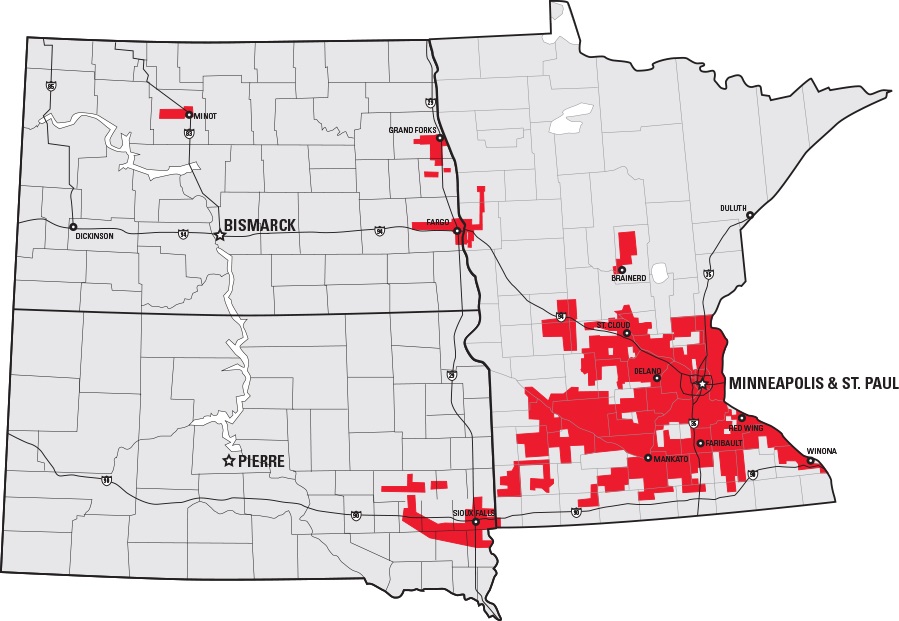
| NSP-Minnesota |
| | | | | |
| Electric customers | 1.5 million | | | NSP-Minnesota conducts business in Minnesota, North Dakota and South Dakota and has electric operations in all three states including the generation, purchase, transmission, distribution and sale of electricity. NSP-Minnesota and NSP-Wisconsin electric operations are managed on the NSP System. NSP-Minnesota also purchases, transports, distributes and sells natural gas to retail customers and transports customer-owned natural gas in Minnesota and North Dakota. |
| Natural gas customers | 0.5 million | | |
| | | |
| Total assets | $22.8 billion | | |
| Rate Base (estimated) | $13.7 billion | | |
| ROE (net income / average stockholder's equity) | 8.45% | | |
| Electric generating capacity | 8,628 MW | | |
| Gas storage capacity | 17.1 Bcf | | |
| Electric transmission lines (conductor miles) | 34,155 miles | | |
| Electric distribution lines (conductor miles) | 81,406 miles | | |
| Natural gas transmission lines | 85 miles | | |
| Natural gas distribution lines | 10,741 miles | | |
| | | | |
| | | | | | | | | | | | | | | | | |
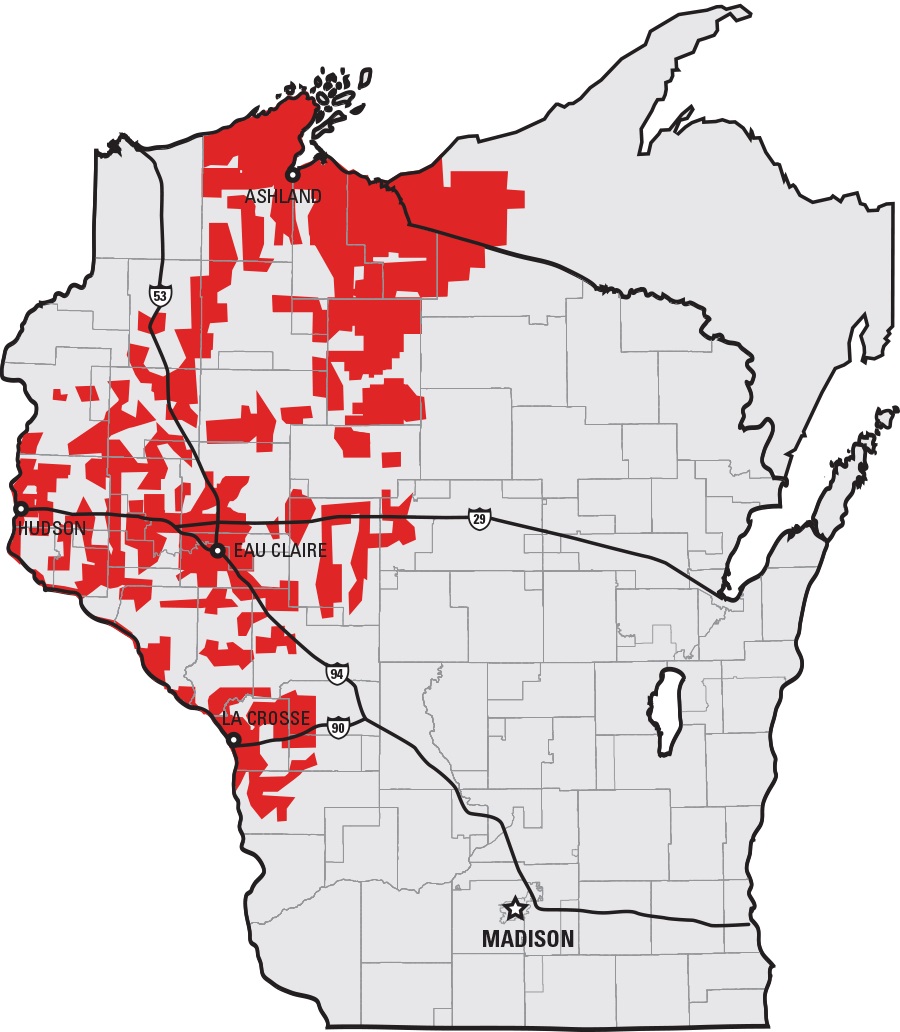
| NSP-Wisconsin |
| | | | | |
| Electric customers | 0.3 million | | | NSP-Wisconsin conducts business in Wisconsin and Michigan and generates, transmits, distributes and sells electricity. NSP-Minnesota and NSP-Wisconsin electric operations are managed on the NSP System. NSP-Wisconsin also purchases, transports, distributes and sells natural gas to retail customers and transports customer-owned natural gas. |
| Natural gas customers | 0.1 million | | |
| | | |
| Total assets | $3.1 billion | | |
| Rate Base (estimated) | $2.0 billion | | |
| ROE (net income / average stockholder's equity) | 9.92% | | |
| Electric generating capacity | 548 MW | | |
| Gas storage capacity | 3.8 Bcf | | |
| Electric transmission lines (conductor miles) | 12,409 miles | | |
| Electric distribution lines (conductor miles) | 27,701 miles | | |
| Natural gas transmission lines | 3 miles | | |
| Natural gas distribution lines | 2,526 miles | | |
| | | | |
| | | | | | | | | | | | | | | | | |
| PSCo |
| | | | | |
| Electric customers | 1.5 million | | | PSCo conducts business in Colorado and generates, purchases, transmits, distributes and sells electricity. PSCo also purchases, transports, distributes and sells natural gas to retail customers and transports customer-owned natural gas. |
| Natural gas customers | 1.5 million | | |
| | | |
| Total assets | $22.0 billion | | |
| Rate Base (estimated) | $14.0 billion | | |
| ROE (net income / average stockholder's equity) | 8.23% | | |
| Electric generating capacity | 6,228 MW | | |
| Gas storage capacity | 32.5 Bcf | | |
| Electric transmission lines (conductor miles) | 24,116 miles | | |
| Electric distribution lines (conductor miles) | 78,712 miles | | |
| Natural gas transmission lines | 2,174 miles | | |
| Natural gas distribution lines | 23,243 miles | | | |
| | | | |
| | | | | | | | | | | | | | | | | |
| SPS |
| | | | | |
| Electric customers | 0.4 million | | | SPS conducts business in Texas and New Mexico and generates, purchases, transmits, distributes and sells electricity. |
| | | |
| Total assets | $9.3 billion | | |
| Rate Base (estimated) | $6.4 billion | | |
| ROE (net income / average stockholder's equity) | 9.22% | | |
| Electric generating capacity | 5,249 MW | | |
| Electric transmission lines (conductor miles) | 40,754 miles | | |
| Electric distribution lines (conductor miles) | 22,651 miles | | |
| | | | |
| | | | |
| | | | |
Utility operations are generally conducted as either electric or gas utilities in our four utility regulated natural gas utilitysubsidiaries.
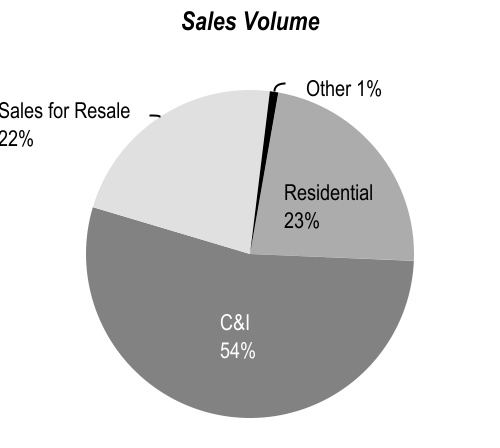
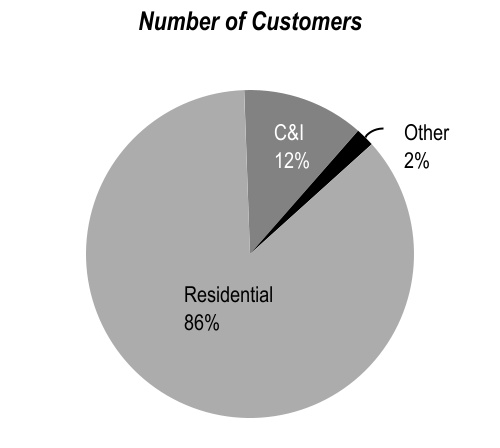
Electric operations consist of energy supply, generation, transmission and distribution activities across all other. four operating companies. Xcel Energy had electric sales volume of 115,474 (millions of KWh), 3.7 million customers and electric revenues of $11,205 (millions of dollars) for 2021.
Retail Sales/Revenue Statistics (a)
| | | | | | | | | | | | | | |
| | 2021 | | 2020 |
| KWh sales per retail customer | | 23,968 | | | 23,910 | |
| Revenue per retail customer | | $ | 2,405 | | | $ | 2,199 | |
| Residential revenue per KWh | | 12.94 | ¢ | | 12.12 | ¢ |
| Large C&I revenue per KWh | | 6.60 | ¢ | | 5.78 | ¢ |
| Small C&I revenue per KWh | | 10.47 | ¢ | | 9.56 | ¢ |
| Total retail revenue per KWh | | 10.03 | ¢ | | 9.20 | ¢ |
(a) See Note 176 to the consolidated financial statements for further discussion relating to comparative segment revenues, income from operationsinformation.
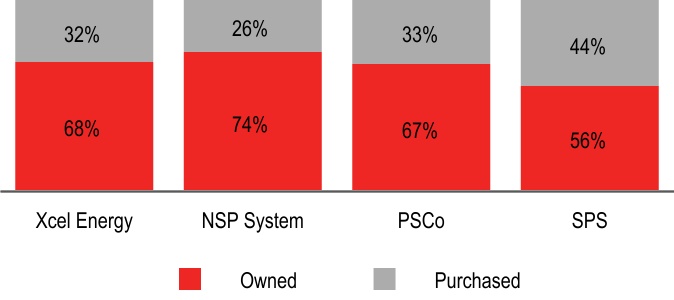
Owned and related financial information.
ELECTRIC UTILITY OPERATIONS
NSP-Minnesota
Public Utility Regulation
Summary of Regulatory Agencies and Areas of Jurisdiction— Retail rates, services and other aspects of NSP-Minnesota’s operations are regulated by the MPUC, the NDPSC and the SDPUC within their respective states. The MPUC also has regulatory authority over security issuances, property transfers, mergers, dispositions of assets and transactions between NSP-Minnesota and its affiliates. In addition, the MPUC reviews and approves NSP-Minnesota’s IRPs for meeting customers’ future energy needs. The MPUC also certifies the need and siting for generating plants greater than 50 MW and transmission lines greater than 100 KV that will be located within the state. No large power plant or transmission line may be constructed in Minnesota except on a site or route designated by the MPUC. The NDPSC and SDPUC have regulatory authority over generation and transmission facilities, along with the siting and routing of new generation and transmission facilities in North Dakota and South Dakota, respectively.
NSP-Minnesota is subject to the jurisdiction of the FERC for its wholesale electric operations, hydroelectric licensing, accounting practices, wholesale sales for resale, transmission of electricity in interstate commerce, compliance with NERC electric reliability standards, asset transfers and mergers, and natural gas transactions in interstate commerce. NSP-Minnesota is a transmission owning member of the MISO RTO and operates within the MISO RTO and MISO wholesale market. NSP-Minnesota and NSP-Wisconsin are jointly authorized by the FERC to make wholesale electric sales at market-based prices.
Fuel, Purchased Energy and Conservation Cost-Recovery MechanismsGeneration — NSP-Minnesota has several retail adjustment clauses that recover fuel, purchased 2021
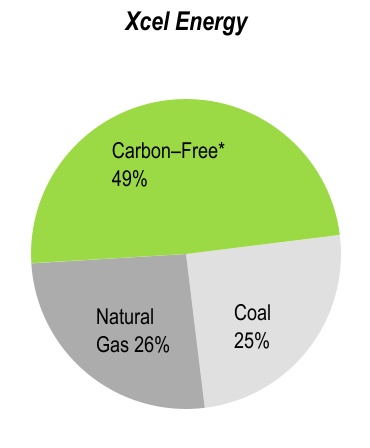
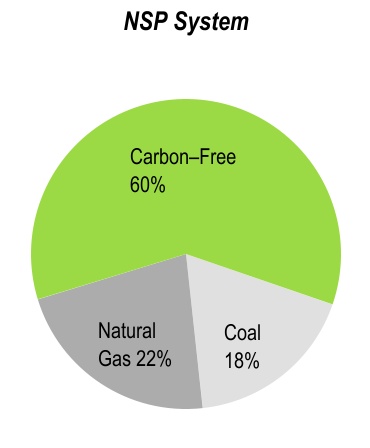
Electric Energy Sources
Total electric energy and other resource costs:generation by source (including energy market purchases) for the year ended Dec. 31, 2021:
* Distributed generation from the Solar*Rewards® program is not included (approximately 666 million KWh for 2021).
CIP rider — Recovers the costs of conservation and demand-side management programs.
EIR — Recovers the costs10
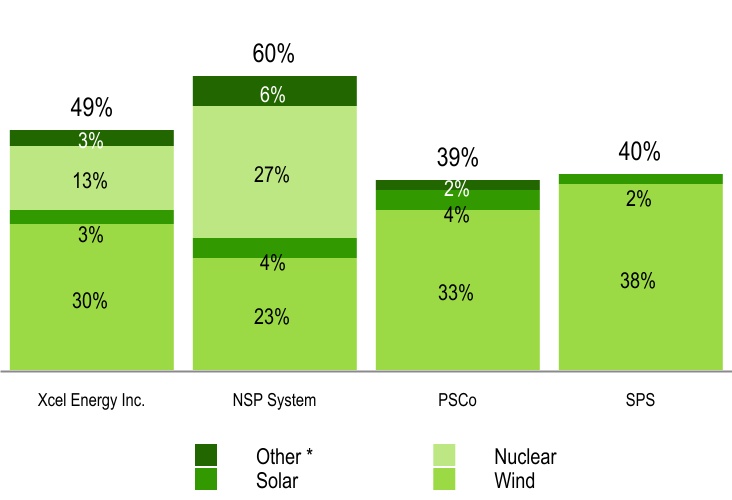
RDF — Allocates money collectedCarbon-Free
Xcel Energy’s carbon-free energy portfolio includes wind, nuclear, hydroelectric, biomass and solar power from retail customers to support the research and development of emerging renewable energy projects and technologies.
RES — Recovers the cost of renewable generation in Minnesota.
RER — Recovers the cost of renewable generation in North Dakota.
SEP — Recovers costs related to various energy policies approved by the Minnesota legislature.
TCR — Recovers costs associated with investments in electric transmission and distribution grid modernization costs.
Infrastructure rider — Recovers costs for investments in generation and incremental property taxes in South Dakota.
NSP-Minnesota’s retail electric rates in Minnesota, North Dakota and South Dakota include a FCA for monthly billing adjustments to recover changes in prudently incurred costs of fuel related items and purchased energy. In general, capacity costs are recovered through base rates and are not recovered through the FCA. In addition, costs associated with MISO are generally recovered through either the FCA or base rates. In 2017, the MPUC voted to change the process in which utilities seek fuel cost recovery under the FCA in Minnesota to be implemented in July 2019. Under the new process, each month utilities would collect amounts equal to the baseline cost of energy set at the start of the plan year. Monthly variations to the baseline costs would be tracked and netted over a 12-month period. Subsequently, utilities would issue refunds above the baseline costs, and could seek recovery of any overage.
Minnesota state law requires NSP-Minnesota to invest two percent of its state electric revenues and half a percent of its state gas revenues in CIP. These costs are recovered through an annual cost-recovery mechanism for electric conservation and energy management program expenditures. Minnesota state law also requires NSP-Minnesota to submit a CIP plan at least every three years.
Capacity and Demand
Uninterrupted system peak demand for the NSP System’s electric utility for each of the last three years and the forecast for 2018, assuming normal weather conditions, is as follows:
|
| | | | | | | | | | | |
| | System Peak Demand (in MW) |
| | 2017 | | 2016 | | 2015 | | 2018 Forecast |
| NSP System | 8,546 |
| | 9,002 |
| | 8,621 |
| | 9,208 |
|
The peak demand for the NSP System typically occurs in the summer. The 2017 system peak demand for the NSP System occurred on July 17, 2017. The decline in peak load from 2016 to 2017 is in part due to considerably cooler weather in 2017. The 2018 forecast assumes normal peak day weather, which is warmer than actual 2017 peak day weather.
Energy Sources and Related Transmission Initiatives
NSP-Minnesota expects to use existing power plants, power purchases, CIP/DSM options, newboth owned generation facilities and expansionPPAs. Carbon-free percentages will vary year-over-year based on system additions, commodity costs, weather, system demand and transmission constraints.
See Item 2 — Properties for further information.
Carbon-free energy as a percentage of total energy for 2021:
* Includes biomass and hydroelectric.
Wind
Owned — Owned and operated wind farms with corresponding capacity:
| | | | | | | | | | | | | | | | | | | | | | | | | | |
| Utility Subsidiary | | 2021 | | 2020 |
| Wind Farms | | Capacity (MW) (a) | | Wind Farms | | Capacity (MW) (b) |
| NSP System | | 14 | | 2,031 | | 11 | | 1,540 |
| PSCo | | 2 | | 1,059 | | 2 | | 1,059 |
| SPS | | 2 | | 984 | | 2 | | 967 |
| Total | | 18 | | 4,075 | | 15 | | 3,566 |
(a) Summer 2021 net dependable capacity.
(b) Summer 2020 net dependable capacity.
PPAs — Number of PPAs with capacity range: | | | | | | | | | | | | | | | | | | | | | | | | | | |
| Utility Subsidiary | | 2021 | | 2020 |
| PPAs | | Range (MW) | | PPAs | | Range (MW) |
| NSP System | | 128 | | 1 — 206 | | 129 | | 1 — 206 |
| PSCo | | 17 | | 23 — 301 | | 17 | | 23 — 301 |
| SPS | | 17 | | 1 — 250 | | 18 | | 1 — 250 |
Capacity — Wind capacity (MW):
| | | | | | | | | | | | | | |
| Utility Subsidiary | | 2021 | | 2020 |
| NSP System | | 3,997 | | 3,348 |
| PSCo | | 4,085 | | 4,085 |
| SPS | | 2,548 | | 2,535 |
Average Cost (Owned) — Average cost per MWh of wind energy from owned generation:
| | | | | | | | | | | | | | |
| Utility Subsidiary | | 2021 | | 2020 |
| NSP System | | $ | 25 | | | $ | 23 | |
| PSCo | | 17 | | | 35 | |
| SPS | | 17 | | | 17 | |
Average Cost (PPAs) — Average cost per MWh of wind energy under existing power plantsPPAs:
| | | | | | | | | | | | | | |
| Utility Subsidiary | | 2021 | | 2020 |
| NSP System | | $ | 37 | | | $ | 38 | |
| PSCo | | 35 | | | 40 | |
| SPS | | 27 | | | 26 | |
Wind Development
Xcel Energy placed approximately 500 MW of owned wind and approximately 255 MW of PPAs into service during 2021:
| | | | | | | | | | | | | | |
| Project | | Utility Subsidiary | | Capacity (MW) |
| Blazing Star 2 | | NSP-Minnesota | | 200 (a)(b) |
| Freeborn | | NSP-Minnesota | | 200 (a)(b) |
| Mower | | NSP-Minnesota | | 91 (a)(b) |
| Various PPAs | | Various | | ~255(c) |
(a) Summer 2021 net dependable capacity.
(b) Values disclosed are the maximum generation levels. Capacity is attainable only when wind conditions are sufficiently available (on-demand net dependable capacity is zero).
(c) Based on contracted capacity.
Xcel Energy currently has approximately 1,050 MW of owned wind under development or being repowered. In addition, we expect to meet its system capacity requirements.add approximately 200 MW of planned PPAs.
| | | | | | | | | | | | | | | | | | | | |
| Project | | Utility Subsidiary | | Capacity (MW) | | Estimated Completion |
| | | | | | |
| | | | | | |
| | | | | | |
| Northern Wind | | NSP-Minnesota | | 100 | | 2022 |
| Nobles | | NSP-Minnesota | | 200 | | 2022 |
| Dakota Range | | NSP-Minnesota | | 300 | | 2022 (a) |
| Grand Meadow | | NSP-Minnesota | | 100 | | 2023 |
| Border Winds | | NSP-Minnesota | | 150 | | 2025 |
| Pleasant Valley | | NSP-Minnesota | | 200 | | 2025 |
| Various PPAs | | Various | | ~200 | | 2022 |
Purchased Power(a) Placed in service in January 2022.
Solar
Solar PPA(s):
| | | | | | | | | | | | | | |
| Type | | Utility Subsidiary | | Capacity (MW) |
| Distributed Generation | | NSP System | | 994 |
| Utility-Scale | | NSP System | | 268 |
| Distributed Generation | | PSCo | | 736 |
| Utility-Scale | | PSCo | | 562 |
| Distributed Generation | | SPS | | 15 |
| Utility-Scale | | SPS | | 192 |
| Total | | | | 2,767 |
Average Cost (PPAs) — NSP-Minnesota has contracts Average cost per MWh of solar energy under existing PPAs:
| | | | | | | | | | | | | | |
| Utility Subsidiary | | 2021 | | 2020 |
| NSP System | | $ | 90 | | | $ | 90 | |
| PSCo | | 67 | | | 89 | |
| SPS | | 61 | | | 59 | |
Solar Development
In June 2021, the PSCW approved NSP-Wisconsin’s request to purchase power from other utilitiesthe 74 MW Western Mustang build-own-transfer solar facility for approximately $100 million. Also, as part of the Minnesota Recovery and IPPs. Generally, long-term dispatchable purchased power contracts require a periodic capacity payment and a charge for the delivered associated energy. Some long-term purchased power contracts only contain a charge for the purchased energy.Relief Recovery docket, NSP-Minnesota also makes short-term purchasesproposed to meet system load and energy requirements, to replace generation from company-owned units under maintenance or during outages, to meet operating reserve obligations, or to obtain energy at a lower cost.
Purchased Transmission Services— NSP-Minnesota and NSP-Wisconsin have contracts with MISO and other regional transmission service providers to deliver power and energy to their customers.
NSP System Resource Plans — In January 2017, the MPUC approved NSP-Minnesota’s IRP that includes:
Retirement of Sherco Unit 2 in 2023 and Sherco Unit 1 in 2026. The resulting need for 750 MW of capacity in 2026 will be addressed in a future CON proceeding;
Acquisition of at least 1,000 MW of wind by 2019. The mix of purchased power and owned facilities was not specified;
Acquisition of 650add 460 MW of solar by 2021 either through the community solar gardens program or other cost-effective resources. The mix of purchased power and owned facilities was not specified;
Acquisition of at least 400 MW of additional demand response by 2023, and a study of the technical and economic achievability of 1,000 MW of additional demand response in total by 2025; and
Achievement of at least 444 GWh of energy efficiency in all planning years.
Minnesota Legislation — In February 2017, the Minnesota governor signed a bill into law allowing NSP-Minnesota to build a natural gas combined-cycle power plant at NSP-Minnesota’s Sherco site. The plant was originally proposed as part of NSP-Minnesota’s resource plan, which enables the retirement of two coal units at the Sherco site. The plant’s in-service datesite with an incremental investment of approximately $575 million. An MPUC decision is anticipated for 2026. Cost recoveryexpected by the third quarter of 2022.
PSCo placed approximately 260 MW of PPAs into service during 2021.
Nuclear
Xcel Energy has two nuclear plants with approximately 1,700 MW of total 2021 net summer dependable capacity that serves the NSP System. Our nuclear fleet has become one of the plant will be subject to MPUC approval.
Wind Development — In July 2017, the MPUC approved NSP-Minnesota’s proposal to add 1,550 MW of new wind generation including ownership of 1,150 MW of wind generation by NSP-Minnesota, which will help achieve NSP-Minnesota’s wind acquisition goal outlinedbest performing and dependable in the IRP. In March 2017, NSP-Minnesota filed an Advanced Determination of Prudence with the NDPSC and reached a settlement with the NDPSC Staff. The timing of a NDPSC order is uncertain. These projects are expected to be completednation, as rated by the end of 2020 and would qualify for 100 percent of the PTC. NSP-Minnesota’s total capital investment for these wind ownership projects is expected to be approximately $1.9 billion.
In September 2017, NSP-Minnesota filed with the MPUC seeking approval to build and own the Dakota Range project, a 300 MW wind project in South Dakota. The project is expected to be placed into service by the end of 2021 and qualify for 80 percent of the PTC. The DOC recommended the MPUC deny the petition on the basis that NSP-Minnesota did not follow the standard regulatory selection process of issuing a new RFP. However, the DOC acknowledged the Dakota Range project would benefit ratepayers and the MPUC could approve the project if it determines the public interest outweighs their concern about the regulatory selection process.
These wind projects are expected to provide significant savings to NSP-Minnesota’s customers and substantial environmental benefits. Projected savings/benefits assume fuel costs and generation mix consistent with various commission approved resource plans. NSP-Minnesota will provide supplemental filings to the MPUC in March 2018, which will estimate impacts of the TCJA on the wind projects.
PPA Terminations and Amendments — In 2017, NSP-Minnesota filed requests with the MPUC and the NDPSC for several initiatives including changes to four PPAs to reduce future costs for customers. These actions include the following:
The termination of a PPA with Benson Power LLC (Benson) for its 55 MW biomass facility in Benson, Minn., including the purchase and closure of the facility. The purchase of the Benson biomass facility requires FERC approval, which was requested in August 2017. The transaction would result in payments of $95 million to terminate the PPA and acquire the facility, as well as additional expenditures of approximately $26 million to temporarily operate and close the facility.
The termination of a PPA with Laurentian Energy Authority I, LLC (Laurentian) for its 35 MW of biomass facilities in Hibbing and Virginia, Minn. The termination of the Laurentian PPA would result in approximately $109 million of contract cancellation payments over six years.
The remaining two requested PPA changes involve a PPA extension of the Hennepin Energy Recovery Center (HERC) 34 MW waste-to-energy facility at a price reflective of current market conditions and termination of the Pine Bend 12 MW waste-to-energy PPA.
In November 2017, the MPUC approved NSP-Minnesota’s request to terminate the Pine Bend PPA but rejected its request to extend the HERC PPA.
In January 2018, the MPUC issued an order approving NSP-Minnesota’s petition to terminate the PPAs with Benson and Laurentian, as well as purchase and close the Benson biomass facility. All approved costs are expected to be recoverable through the FCA, including a return on NSP-Minnesota’s total investment in the Benson transaction through 2028. NSP-Minnesota also reached a settlement agreement with the NDPSC Staff which allows for the termination of the PPAs with Benson, Laurentian and Pine Bend, as well as the purchase and closure of the Benson biomass facility. The NDPSC is expected to issue an order on the settlement in the second quarter of 2018. NSP-Minnesota and NSP-Wisconsin will jointly request FERC approval to modify the Interchange Agreement to share a portion of the termination costs with NSP-Wisconsin.
These terminations and amendments are intended to provide in excess of $600 million in net cost savings to NSP System customers over the next 10 years.
Jurisdictional Cost Recovery Allocation — In December 2016, NSP-Minnesota filed a resource treatment framework with the NDPSC and MPUC. The filing proposed a framework to allow NSP-Minnesota’s operations in North Dakota and Minnesota to gradually become more independent of one another with respect to future generation resource selection while also identifying a path for cost sharing of current resources. NSP-Minnesota’s filing identified two options: a legal separation, creating a separate North Dakota operating company; or a pseudo-separation, which maintains the current corporate structure but directly assigns the costs and benefits of each resource to the jurisdiction that supports it. In October 2017, NDPSC staff filed testimony recommending no change to the current system of proxy pricing and policy-based disallowances claiming there is a likelihood of overall increased costs and potential loss of resource diversity. Hearings are planned for the second quarter of 2018.
Minnesota State Right-Of-First Refusal (ROFR) Statute Complaint — In September 2017, LSP Transmission Holdings, LLC filed a complaint in the U.S. District Court for the District of Minnesota (Minnesota District Court) against the Minnesota Attorney General, the MPUC and the DOC. The complaint was in response to MISO assigning NSP-Minnesota and ITC Midwest, LLC to jointly own a new 345 KV transmission line from near Mankato, Minn. to Winnebago, Minn. The line was estimated by MISO to cost $103 million. The project was assigned to NSP-Minnesota and ITC Midwest as the incumbent utilities, consistent with a Minnesota state ROFR statute. The complaint challenges the constitutionality of the state ROFR statute and is seeking declaratory judgment that the statute violates the Commerce Clause of the U.S. Constitution and should not be enforced. The Minnesota state agencies and NSP-Minnesota filed motions to dismiss. Oral arguments were heard in February 2018, and the matter is now pending before the Minnesota District Court. The timing and outcome of the litigation is uncertain.
Nuclear Power Operations and Waste Disposal
NSP-Minnesota owns two nuclear generating plants: the Monticello plant and the PI plant. Nuclear power plant operations produce gaseous, liquid and solid radioactive wastes which are controlled by federal regulation. High-level radioactive wastes primarily include used nuclear fuel. LLW consists primarily of demineralizer resins, paper, protective clothing, rags, tools and equipment that have become contaminated through use in a plant.
NSP-Minnesota participates with regulators and in industry groups includingboth the NRC the Institute of Nuclear Power Operations and Utilities Service Alliance to stay informed of advancements in nuclear safety, mitigation strategies, performance and operational effectiveness. NSP-Minnesota applies this acquired knowledge by investing in technology and services that improve nuclear operations and detect, mitigate and protect NPS-Minnesota’s nuclear facilities.
NRC Regulation — The NRC regulates nuclear operations. Decisions by the NRC can significantly impact the operations of the nuclear generating plants. The costs of complying with NRC orders and requirements can affect both operating expenses and capital investments of the plants. NSP-Minnesota has obtained recovery of these compliance costs in customer rates, and expects future compliance costs will continue to be recoverable from customers. Estimates of the future nuclear capital expenditures related to costs of NRC compliance are included inINPO. Xcel Energy’s capital forecast for electric generation. See Item 7 for further discussion of capital requirements.
Nuclear Regulatory Performance— The NRC has a Reactor Oversight Process that classifies U.S. nuclear reactors into various categories (referred to as Columns, from 1 to 5). Issues are evaluated as either green, white, yellow, or red based on their safety significance, with green representing the least safety concern and red representing the most concern.
As of Dec. 31, 2017, Monticello and PI Units 1 and 2 were in Column 1 (licensee response) with all green performance indicators and no greater than green findings or violations. Plants in Column 1 are subject to only a pre-defined set of basic NRC inspections.
LLW Disposal— LLW from NSP-Minnesota’s Monticello and PI nuclear plants is currently disposed at the Clive facility located in Utah and the Waste Control Specialists facility located in Texas. If off-site LLW disposal facilities become unavailable, NSP-Minnesota has storage capacity available on-site at PI and Monticello that would allow both plants to continue to operate until the end of their current licensed lives.
High-Level Radioactive Waste Disposal— The federal government has the responsibility to permanently dispose of domestic spent nuclear fuel and other high-level radioactive wastes. The Nuclear Waste Policy Act requires the DOE to implement a program for nuclear high-level waste management. This includes the siting, licensing, construction and operation of a repository for spent nuclear fuel from civilian nuclear power reactors and other high-level radioactive wastes at a permanent federal storage or disposal facility. The federal government has been evaluating a nuclear geologic repository at Yucca Mountain, Nevada for many years. At this time, there are no definitive plans for a permanent federal storage site at Yucca Mountain or any other site.
Review of PI Costs — As part of NSP-Minnesota’s 2016 multi-year electric rate case and IRP the MPUC ordered an investigation into NSP-Minnesota’s PI nuclear investments. The issue was resolved for the 2016 multi-year electric rate case settlement; however the DOC is continuing to investigate costs of operation and performance at PI in anticipation of NSP-Minnesota’s 2019 resource plan.
Nuclear Spent Fuel Storage
NSP-Minnesota has interim on-site storage for spent nuclear fuel at its Monticello and PI nuclear generating plants. As of Dec. 31, 2017, there were 40 casks loaded and stored at the PI plant and 16 canisters loaded and stored at the Monticello plant. An additional 24 casks for PI and 14 canisters for Monticello have been authorized by the State of Minnesota. This currently authorized storage capacity is sufficient to allow NSP-Minnesota to operate until the end of the operating licenses in 2030 for Monticello, 2033 for PI Unit 1, and 2034 for PI Unit 2. Authorizations for additional spent fuel storage capacity may be required at each site to support either continued operation or decommissioning if the federal government does not begin operation of a consolidated interim storage installation.
In 2013, NSP-Minnesota’s Monticello nuclear generating plant loaded and placed five storage canisters (canisters #11-15) in the ISFSI and a sixth canister (canister #16) was loaded but remained in the plant pending resolution of weld inspection issues. Successful pressure and leak testing demonstrated the safety and integrity of all six canisters involved. NSP-Minnesota took several actions to assure compliance with the NRC’s regulations and Monticello’s storage license.
In 2016, the NRC issued an order approving a settlement in which NSP-Minnesota agreed to a timeline for attaining compliance on all six canisters, as well as additional training and communications. During 2016, the NRC approved an exemption request for the completion of canister #16. That canister is now considered in compliance, and was placed in the ISFSI during 2016. In 2017, NSP-Minnesota submitted a plan and request to the NRC to restore Monticello canisters #11-15 to compliance through an exemption request. NSP-Minnesota requested that the NRC grant the exemption by October 2018.
Costs attributable to Monticello canisters #11-15 achieving full regulatory compliance within five years are currently being evaluated. No public safety issues have been raised, or are believed to exist, in this matter.
See Note 14 to the consolidated financial statements for further discussion regarding nuclear related items.
Energy Source Statistics
|
| | | | | | | | | | | | | | | | | |
| | Year Ended Dec. 31 |
| | 2017 | | 2016 | | 2015 |
| NSP System | Millions of KWh | | Percent of Generation | | Millions of KWh | | Percent of Generation | | Millions of KWh | | Percent of Generation |
| Nuclear | 14,167 |
| | 30 | % | | 14,191 |
| | 30 | % | | 12,425 |
| | 27 | % |
| Coal | 14,737 |
| | 30 |
| | 13,681 |
| | 28 |
| | 15,961 |
| | 35 |
|
Wind (a) | 8,893 |
| | 18 |
| | 7,897 |
| | 16 |
| | 6,235 |
| | 14 |
|
| Natural Gas | 5,786 |
| | 12 |
| | 7,810 |
| | 16 |
| | 6,689 |
| | 15 |
|
| Hydroelectric | 3,080 |
| | 6 |
| | 3,203 |
| | 7 |
| | 3,326 |
| | 7 |
|
Other (b) | 2,052 |
| | 4 |
| | 1,480 |
| | 3 |
| | 1,083 |
| | 2 |
|
| Total | 48,715 |
| | 100 | % | | 48,262 |
| | 100 | % | | 45,719 |
| | 100 | % |
| | | | | | | | | | | | |
| Owned generation | 36,640 |
| | 75 | % | | 36,381 |
| | 75 | % | | 33,818 |
| | 74 | % |
| Purchased generation | 12,075 |
| | 25 |
| | 11,881 |
| | 25 |
| | 11,901 |
| | 26 |
|
| Total | 48,715 |
| | 100 | % | | 48,262 |
| | 100 | % | | 45,719 |
| | 100 | % |
| |
(a)
| This category includes wind energy de-bundled from RECs and also includes Windsource® RECs. The NSP System uses RECs to meet or exceed state resource requirements and may sell surplus RECs.
|
| |
(b)
| Includes energy from other sources, including solar, biomass, oil and refuse. Distributed generation from the Solar*Rewards® program is not included, and was approximately 17, 21 and eight million net KWh for 2017, 2016, and 2015, respectively.
|
Fuel Supply and Costs
The following table shows the delivered cost per MMBtu of each significant category of fuel consumed for owned electric generation, the percentage of total fuel requirements represented by each category of fuel and the total weighted average cost of all fuels. |
| | | | | | | | | | | | | | | | | | | | | | | | | |
| | | Coal (a) | | Nuclear | | Natural Gas | | Weighted Average Owned Fuel Cost |
| NSP System Generating Plants | | Cost | | Percent | | Cost | | Percent | | Cost | | Percent | |
| 2017 | | $ | 2.08 |
| | 45 | % | | $ | 0.78 |
| | 45 | % | | $ | 4.10 |
| | 10 | % | | $ | 1.72 |
|
| 2016 | | 2.03 |
| | 42 |
| | 0.80 |
| | 44 |
| | 3.30 |
| | 14 |
| | 1.67 |
|
| 2015 | | 2.15 |
| | 47 |
| | 0.83 |
| | 40 |
| | 3.89 |
| | 13 |
| | 1.85 |
|
| |
(a)
| Includes refuse-derived fuel and wood. |
See Items 1A and 7 for further discussion of fuel supply and costs.
Fuel Sources
Nuclear — NSP-Minnesota secures contracts for uranium concentrates, uranium conversion, uranium enrichment and fuel fabrication to operate its nuclear plants. TheWe use varying contract strategy involves a portfolio of spot purchases and medium and long-term contractslengths as well as multiple producers for uranium concentrates, conversion services and enrichment services with multiple producers and with a focus on diversification to minimize potential impacts caused by supply interruptions due to geographical and world political issues.
Nuclear Fuel Cost
CurrentDelivered cost per MMBtu of nuclear fuel supply contracts cover 100 percentconsumed for owned electric generation and the percentage of uranium concentrates requirements through 2021 and approximately 57 percent of the requirements for 2022 through 2033;
Current contracts for conversion services cover 100 percent of the requirements through 2021 and approximately 50 percent of the requirements for 2022 through 2033; and
Current enrichment service contracts cover 100 percent of the requirements through 2025 and approximately 29 percent of the requirements for 2026 through 2033.
Fabrication services for Monticello and PI are 100 percent committed through 2030 and 2019, respectively.
NSP-Minnesota expects sufficient uranium concentrates, conversion services and enrichment services to be available for the total fuel requirements of its nuclearrequirements:
| | | | | | | | | | | | | | |
| Utility Subsidiary | | Nuclear |
| NSP System | | Cost | | Percent |
| 2021 | | $ | 0.77 | | | 46 | % |
| 2020 | | 0.80 | | | 51 | |
Other
Xcel Energy’s other carbon-free energy portfolio includes hydro from owned generating plants. Some exposure to market price volatility will remain due to index-based pricing structures contained in certain supply contracts.facilities.
See Item 2 — Properties for further information.
Coal — The NSP System normally maintains approximately 41 days ofFossil Fuel
Xcel Energy’s fossil fuel energy portfolio includes coal inventory. Coal supply inventories at Dec. 31, 2017 and 2016 were approximately 53 and 55 days of usage, respectively. Milder weather, purchase commitments and relatively low power and natural gas prices resulted inpower from both owned generating facilities and PPAs.
Coal
Xcel Energy owns and operates coal inventories being above optimal levels. NSP-Minnesota’sunits with approximately 6,500 MW of total 2021 net summer dependable capacity.
Approved early coal plant retirements:
| | | | | | | | | | | | | | | | | | | | |
| Year | | Utility Subsidiary | | Plant Unit | | Capacity (MW) |
| 2022 | | PSCo | | Comanche 1 | | 325 |
| 2023 | | NSP-Minnesota | | Sherco 2 | | 682 |
| 2024 | | SPS | | Harrington (a) | | 1,018 |
| 2025 | | PSCo | | Comanche 2 | | 335 |
| 2025 | | PSCo | | Craig 1 | | 42 (b) |
| 2026 | | NSP-Minnesota | | Sherco 1 | | 680 |
| 2028 | | PSCo | | Craig 2 | | 40 (b) |
| 2028 | | NSP-Minnesota | | A.S. King | | 511 |
| 2030 | | NSP-Minnesota | | Sherco 3 | | 517 (b) |
(a)Reflects expected conversion from coal to natural gas following the TCEQ order that Harrington cease use of coal fuel by Jan. 1, 2025, pending PUCT and NMPRC review.
(b)Based on Xcel Energy’s ownership interest.
| | | | | | | | | | | | | | | | | | | | |
| Proposed |
| Year | | Utility Subsidiary | | Plant Unit | | Capacity (MW) |
| 2025 | | PSCo | | Pawnee (a) | | 505 |
| 2027 | | PSCo | | Hayden 2 | | 98 (b) |
| 2028 | | PSCo | | Hayden 1 | | 135 (c) |
| 2034 | | SPS | | Tolk 1 | | 532 |
| 2034 | | SPS | | Tolk 2 | | 535 |
| 2034 | | PSCo | | Comanche 3 | | 500 (d) |
(a)Reflects conversion from coal to natural gas.
(b)Based on PSCo’s ownership of 37% of Unit 2.
(c)Based on PSCo’s ownership of 76% of Unit 1.
(d)Based on PSCo’s ownership of 67%.
Coal Fuel Cost
Delivered cost per MMBtu of coal consumed for owned electric generation stations use low-sulfur western coal purchased primarily under contracts with suppliers operating in Wyoming and Montana. Coal requirementsthe percentage of fuel requirements:
| | | | | | | | | | | | | | |
| | Coal (a) |
| Utility Subsidiary | | Cost | | Percent |
| NSP System | | | | |
| 2021 | | $ | 1.60 | | | 39 | % |
| 2020 | | 1.97 | | | 31 | |
| PSCo | | | | |
| 2021 | | 1.43 | | | 62 | |
| 2020 | | 1.41 | | | 51 | |
| SPS | | | | |
| 2021 | | 2.07 | | | 66 | |
| 2020 | | 2.28 | | | 40 | |
(a) Includes refuse-derived fuel and wood for the NSP System’s major coal-fired generating plants were approximately 8.0 million tons for 2017 and 7.5 million tons for 2016. Coal requirements for 2017 increased primarily due to slightly higherSystem.
Natural Gas
Xcel Energy has 22 natural gas prices during the year. The estimated coal requirements for 2018 areplants with approximately 8.3 million tons.7,900 MW of total 2021 net summer dependable capacity.
NSP-Minnesota and NSP-Wisconsin have contracted for coal supplies to provide 79 percent of their estimated coal requirements in 2018 and a declining percentage of the requirements in subsequent years. The NSP System’s general coal purchasing objective is to contract for approximately 75 percent of requirements for the first year, 40 percent of requirements in year two and 20 percent of requirements in year three. Remaining requirements will be filled through the procurement process or over-the-counter transactions.
NSP-Minnesota and NSP-Wisconsin have coal transportation contracts that provide for delivery of 100 and 25 percent of their coal requirements in 2018 and 2019, respectively. Coal delivery may be subject to interruptions or reductions due to operation of the mines, transportation problems, weather and availability of equipment.
Natural gas — The NSP System uses both firm and interruptible natural gas supply in combustion turbines and certain boilers. Natural gas supplies, transportation and storage services for power plants are procured under contracts to provide an adequate supply of fuel. However, as natural gas primarily serves intermediate and peak demand, remaining forecastedRemaining requirements are able to be procured through a liquid spot market. Generally, natural gas supply contracts have variable pricing that is tied to various natural gas indices. Most transportation contract pricing is based on FERC approved transportation tariff rates. Certain naturalNatural gas supply and transportation agreements include obligations for the purchase and/or delivery of specified volumes of natural gas or to make payments in lieu of delivery. At Dec. 31, 2017
Natural Gas Cost
Delivered cost per MMBtu of natural gas consumed for owned electric generation and 2016, the NSP System did not have any commitments related to gas supply contracts; however commitments related to gas transportation and storage contracts were approximately $398 million and $382 million, respectively. Commitments related to gas transportation and storage contracts expire in various years from 2018 to 2037.
The NSP System also has limited on-site fuel oil storage facilities and primarily relies on the spot market for incremental supplies.
Renewable Energy Sources
The NSP System’s renewable energy portfolio includes wind, hydroelectric, biomass and solar power from both owned generating facilities and PPAs. As of Dec. 31, 2017, the NSP System was in compliance with mandated RPS, which require generation from renewable resources of 25.0 percent and 12.9 percent of NSP-Minnesota and NSP-Wisconsin electric retail sales, respectively.
Renewable energy as a percentage of the NSP System’s total energy:fuel requirements:
| | | | | | | | | | | | | | |
| | Natural Gas |
| Utility Subsidiary | | Cost | | Percent |
| NSP System | | | | |
2021 (a) | | $ | 4.98 | | | 15 | % |
| 2020 | | 2.67 | | | 17 | |
| PSCo | | | | |
2021 (a) | | 8.38 | | | 38 | |
| 2020 | | 3.01 | | | 49 | |
| SPS | | | | |
2021 (a) | | 6.72 | | | 34 | |
| 2020 | | 1.43 | | | 60 | |
(a)Reflective of Winter Storm Uri.
|
| | | | | | |
| | | 2017 | | 2016 |
| Renewable | | 28.8 | % | | 26.1 | % |
| Wind | | 18.3 |
| | 16.4 |
|
| Hydroelectric | | 6.3 |
| | 6.6 |
|
| Biomass and solar | | 4.2 |
| | 3.1 |
|
The NSP System also offers customer-focused renewable energy initiatives. Windsource allows customers in Minnesota, Wisconsin and Michigan to purchase electricity from renewable sources. The number of customers utilizing Windsource increased to approximately 60,900 in 2017 from 54,000 in 2016.
Additionally, to encourage the growth of solar energy in Minnesota, customers are offered incentives to install solar panels on their homes and businesses under the Solar*Rewards® and Made in Minnesota solar incentive programs. Over 2,800 PV systems with approximately 33.75 MW of aggregate capacity have been installed in Minnesota as of Dec. 31, 2017 and 2,000 PV systems with approximately 25.2 MW of aggregate capacity were installed as of Dec. 31, 2016. The Solar*Rewards® Community® program is another option made available to encourage use of solar energy in Minnesota. This program allows for offsite development of solar and bill credits to customers based on an approved tariffed rate.
Wind—The NSP System acquires the majority of its wind energy from PPAs. Currently, the NSP System has more than 130 of these agreements in place, with facilities ranging in size from under one MW to more than 200 MW. The NSP System owns and operates five wind farms which have the capacity to generate 852 MW.
The NSP System had approximately 2,600 MW of wind energy on its system at the end of 2017 and 2016. In addition to receiving purchased wind energy under these agreements, the NSP System typically receives wind RECs, which are used to meet state renewable resource requirements.
The average cost per MWh of wind energy under existing contracts was approximately $44 for 2017 and $43 for 2016. The cost per MWh of wind energy varies by contract and may be influenced by a number of factors including regulation, state-specific renewable resource requirements and the year of contract execution. Generally, contracts executed in 2017 continued to benefit from improvements in technology, excess capacity among manufacturers and motivation to commence new construction prior to the anticipated expiration of the federal PTCs. In December 2015, the federal PTCs were extended through 2019 with a phase down on sites that began construction in 2017.
Hydroelectric—The NSP System acquires its hydroelectric energy from both owned generation and PPAs. The NSP System owns 20 hydroelectric plants throughout Wisconsin and Minnesota which provide approximately 263 MW of capacity. For 2017, PPAs provided approximately 34 MW of hydroelectric capacity. Additionally, the NSP System purchases approximately 850 MW of generation from Manitoba Hydro, which is sourced primarily from its fleet of hydroelectric facilities.
Wholesale and Commodity Marketing Operations
NSP-Minnesota conducts various wholesale marketing operations, including the purchase and sale of electric capacity, energy, ancillary services and energy-related products. NSP-Minnesota uses physical and financial instruments to minimize commodity price and credit risk and hedge sales and purchases. NSP-Minnesota also engages in trading activity unrelated to hedging and sharing of any margins is determined through state regulatory proceedings as well as the operation of the FERC approved joint operating agreement. NSP-Minnesota does not serve any wholesale requirements customers at cost-based regulated rates. See Item 7 for further discussion.
NSP-Wisconsin
Public Utility Regulation
Summary of Regulatory Agencies and Areas of Jurisdiction— Retail rates, services and other aspects of NSP-Wisconsin’s operations are regulated by the PSCW and the MPSC, within their respective states. In addition, each of the state commissions certifies the need for new generating plants and electric transmission lines before the facilities may be sited and built. NSP-Wisconsin is subject to the jurisdiction of the FERC for its wholesale electric operations, hydroelectric generation licensing, accounting practices, wholesale sales for resale, the transmission of electricity in interstate commerce, compliance with NERC electric reliability standards, asset transactions and mergers and natural gas transactions in interstate commerce. NSP- Wisconsin is a transmission owning member of the MISO RTO and operates within the MISO RTO and wholesale energy market. NSP-Wisconsin and NSP-Minnesota are jointly authorized by the FERC to make wholesale electric sales at market-based prices.
The PSCW has a biennial base rate filing requirement. By June of each odd numbered year, NSP-Wisconsin must submit a rate filing for the test year beginning the following January. In recent years, NSP-Wisconsin has been submitting rate filings each year.
Fuel and Purchased Energy Cost Recovery Mechanisms— NSP-Wisconsin does not have an automatic electric fuel adjustment clause for Wisconsin retail customers. Instead, under Wisconsin rules, utilities submit a forward-looking annual fuel cost plan to the PSCW for approval. Once the PSCW approves the fuel cost plan, utilities defer the amount of any fuel cost under-recovery or over-recovery in excess of a two percent annual tolerance band, for future rate recovery or refund. Approval of a fuel cost plan and any rate adjustment for refund or recovery of deferred costs is determined by the PSCW. Rate recovery of deferred fuel cost is subject to an earnings test based on the utility’s most recently authorized ROE. Fuel cost under-collections that exceed the two percent annual tolerance band may not be recovered if the utility earnings for that year exceed the authorized ROE.
NSP-Wisconsin’s electric fuel costs for 2017 were lower than authorized in rates and outside the two percent annual tolerance band, primarily due to lower purchased power costs coupled with moderate weather and generation sales into the MISO market. Under the fuel cost recovery rules, NSP-Wisconsin may retain approximately $4 million of fuel costs and defer approximately $10 million through Dec. 31, 2017. NSP-Wisconsin will file a reconciliation of 2017 fuel costs with the PSCW. The amount of any potential refund is subject to review and approval by the PSCW, which is not expected until mid-2018.
NSP-Wisconsin’s retail electric rate schedules for Michigan customers include power supply cost recovery factors, which are based on 12-month projections. After each 12-month period, a reconciliation is submitted whereby over-recoveries are refunded and any under-recoveries are collected from the customers over the subsequent 12-month period.
Wisconsin Energy Efficiency Program— In Wisconsin, the primary energy efficiency program is funded by the state’s utilities, but operated by independent contractors subject to oversight by the PSCW and the utilities. NSP-Wisconsin recovers these costs in rates charged to Wisconsin retail customers.
Capacity and Demand
NSP-Wisconsin operates an integrated system with NSP-Minnesota. See NSP-Minnesota Capacity and Demand.
Energy Sources and Related Transmission Initiatives
NSP-Wisconsin operates an integrated system with NSP-Minnesota. See NSP-Minnesota Energy Sources and Related Transmission Initiatives.
NSP-Wisconsin / American Transmission Company, LLC (ATC) - La Crosse to Madison, Wis. Transmission Line — In 2013, NSP-Wisconsin and ATC jointly filed an application with the PSCW for a CPCN for a 345 KV transmission line that would extend from La Crosse, Wis. to Madison, Wis. NSP-Wisconsin’s half of the line will be shared with three co-owners, Dairyland Power Cooperative, WPPI Energy and Southern Minnesota Municipal Power Agency-Wisconsin.
In 2015, the PSCW issued its order approving a CPCN and route for the project. Two groups have appealed the CPCN order to the La Crosse County Circuit Court (Circuit Court). In May 2017, the Circuit Court determined that the project was necessary, allowing construction to continue on a seven mile segment near La Crosse, Wis. The parties have appealed various aspects of the case to the Wisconsin Court of Appeals which is currently pending. The CPCN remains in full effect unless one of the parties seeks and receives a stay from the court and posts a bond to cover damages the utilities may incur due to delay. The 180-mile project is expected to cost approximately $541 million. NSP-Wisconsin’s portion of the investment, which includes AFUDC, is estimated to be approximately $200 million. Construction on the line began in January 2016, with completion anticipated by late 2018.
Fuel Supply and Costs
NSP-Wisconsin operates an integrated system with NSP-Minnesota. See NSP-Minnesota Fuel Supply and Costs.
Wholesale and Commodity Marketing Operations
NSP-Wisconsin operates an integrated system with NSP-Minnesota. NSP-Wisconsin does not serve any wholesale requirements customers at cost-based regulated rates. See NSP-Minnesota Wholesale and Commodity Marketing Operations.
PSCo
Public Utility Regulation
Summary of Regulatory Agencies and Areas of Jurisdiction— PSCo is regulated by the CPUC with respect to its facilities, rates, accounts, services and issuance of securities. PSCo is regulated by the FERC for its wholesale electric operations, accounting practices, hydroelectric licensing, wholesale sales for resale, transmission of electricity in interstate commerce, compliance with the NERC electric reliability standards, asset transactions and mergers and natural gas transactions in interstate commerce. PSCo is not presently a member of an RTO and does not operate within an RTO energy market. PSCo is authorized by the FERC to make wholesale electric sales at market-based prices to customers outside PSCo’s balancing authority area.
Fuel, Purchased Energy and Conservation Cost-Recovery Mechanisms — PSCo has several retail adjustment clauses that recover fuel, purchased energy and other resource costs:
ECA — Recovers fuel and purchased energy costs. Short-term sales margins are shared with retail customers through the ECA. The ECA is revised quarterly.
PCCA — Recovers purchased capacity payments.
SCA — Recovers the difference between PSCo’s actual cost of fuel and the amount of these costs recovered under its base steam service rates. The SCA rate is revised on a quarterly basis.
DSMCA — Recovers DSM, interruptible service costs and performance initiatives for achieving energy savings goals.
RESA — Recovers the incremental costs of compliance with the RES with a maximum of two percent of the customer’s bill.
WCA — Premium service for customers who choose to pay for renewable resources.
TCA — Recovers costs associated with transmission investment outside of rate cases.
CACJA — Recovers costs associated with the CACJA.
PSCo recovers fuel and purchased energy costs from its wholesale electric customers through a fuel cost adjustment clause approved by the FERC. PSCo’s wholesale customers pay the full cost of certain renewable energy purchase and generation costs through a fuel clause and in exchange receive RECs associated with those resources. The wholesale customers pay their jurisdictional allocation of production costs through a fully forecasted formula rate with true-up.
Capacity and Demand
Uninterrupted system peak demand and occurrence date for PSCo’s electric utility for each of the last three yearsregulated utilities:
| | | | | | | | | | | | | | | | | | | | | | | | | | |
| | System Peak Demand (MW) |
| | 2021 | | 2020 |
NSP System | | 8,837 | | | June 9 | | 8,571 | | | July 8 |
| PSCo | | 6,958 | | | July 28 | | 6,899 | | | Aug. 17 |
| SPS | | 4,054 | | | Aug. 9 | | 4,195 | | | July 14 |
Transmission
Transmission lines deliver electricity at high voltages and the forecast for 2018, assuming normal weather conditions, is as follows:
|
| | | | | | | | | | | |
| | System Peak Demand (in MW) |
| | 2017 | | 2016 | | 2015 | | 2018 Forecast |
| PSCo | 6,671 |
| | 6,585 |
| | 6,284 |
| | 6,462 |
|
The peak demand for PSCo’sover long distances from power sources to transmission substations closer to customers. A strong transmission system typically occurs in the summer. The 2017 system peak demand for PSCo occurred on July 19, 2017. The 2017 system peak demand was higher than 2016 due to warmer July summer weather. The forecast of system peak assumes normal weather conditions.
Energy Sourcesensures continued reliable and Related Transmission Initiatives
PSCo expectsaffordable service, ability to meet state and regional energy policy goals, and support for a diverse generation mix, including renewable energy. Xcel Energy owns more than 111,000 conductor miles of transmission lines, serving 22,000 MW of customer load, across its system capacity requirements through existingservice territory.
Transmission projects completed in 2021 include:
| | | | | | | | | | | | | | | | | | | | |
| Project | | Utility Subsidiary | | Miles | | Size (KV) |
| Hibbing Taconite Relocation | | NSP-Minnesota | | 3 | | | 500 | |
| Huntley - Wilmarth | | NSP-Minnesota | | 50 | | | 345 | |
| Helena Scott County | | NSP-Minnesota | | 16 | | | 345 | |
| Centerville to Lincoln County | | NSP-Minnesota | | 14 | | | 69 | |
| Turtle Lake Almena | | NSP-Wisconsin | | 4 | | | 69 | |
| Roadrunner-China Draw | | SPS | | 41 | | | 345 | |
Notable upcoming projects: | | | | | | | | | | | | | | | | | | | | | | | | | | |
| Project | | Utility Subsidiary | | Miles | | Size (KV) | | Completion Date |
| Baytown to Long Lake | | NSP-Minnesota | | 9 | | | 115 | | | 2022 |
| Bird Island - Atwater - Big Swan | | NSP-Minnesota | | 68 | | | 69 | | | 2022 |
| Pipestone - Tracy | | NSP-Minnesota | | 46 | | | 69 | | | 2022 |
| Line Rebuild - Central | | NSP-Minnesota | | 24 | | | 69 | | | 2022 |
| West St. Cloud to Millwood Tap | | NSP-Minnesota | | 24 | | | 69 | | | 2022 |
| Bayfield Second Circuit | | NSP-Wisconsin | | 19 | | | 35 | | | 2022 |
| Colorado Energy Plan | | PSCo | | 15 | | | 345 | | | 2022 |
| | | | | | | | |
| Tolk Plant Substation | | | | | | | | |
| Bus Reconfiguration | | SPS | | n/a | | 345, 230 | | 2022 |
| | | | | | | | |
| | | | | | | | |
| | | | | | | | |
| Twist to Wilco Line | | SPS | | 4 | | | 115 | | 2024 |
| Pathway | | PSCo | | 560 | | | 345 | | 2027 |
See Item 2 - Properties for further information.
Distribution
Distribution lines allow electricity to travel at lower voltages from substations directly to customers. Xcel Energy has a vast distribution network, owning and operating approximately 210,000 conductor miles of distribution lines across our eight-state service territory.
To continue providing reliable, affordable electric generating stations, power purchases,service and enable more flexibility for customers, we are working to digitize the distribution grid, while at the same time keeping it secure. Over the multi-year project that started in 2016, Xcel Energy plans to invest approximately $1.7 billion implementing new generation facilities, DSMnetwork infrastructure, smart meters, advanced software, equipment sensors and related data analytics capabilities. To date, Xcel Energy has spent approximately $568 million on these investments.
Investments of this nature will further improve reliability and reduce outage restoration times for our customers, while at the same time enabling new options and phased expansionopportunities for increased efficiency savings. The new capabilities will also enable integration of existing generation at select power plants.battery storage and other distributed energy resources into the grid, including electric vehicles.
See Item 2 - Properties for further information.
Purchased Power— PSCo has contracts to
Natural gas operations consist of purchase, power from other utilitiestransportation and IPPs. Long-term purchased power contracts for dispatchable resources typically require a periodic capacity charge and an energy charge for energy actually purchased. PSCo also contracts to purchase power for both wind and solar resources. In addition, PSCo makes short-term purchases to meet system load and energy requirements, to replace generation from company-owned units under maintenance or during outages, to meet operating reserve obligations, or to obtain energy at a lower cost.
Purchased Transmission Services— In addition to using its own transmission system, PSCo has contracts with regional transmission service providers to deliver energy to PSCo’s customers.
Rush Creek Wind Ownership Proposal — In 2016, the CPUC granted PSCo a CPCN to build, own and operate a 600 MW wind generation facility in Colorado at Rush Creek. The CPCN includes a hard cost-cap of $1.096 billion (including transmission costs) and a capital cost sharing mechanism between customers and PSCo of 82.5 percent to customers and 17.5 percent to PSCo for every $10 million the project comes in below the cost-cap.
All major contracts required to complete the project have been executed. PTC components for safe harboring the facility have been fabricated and construction began in April 2017.
Investment costs will be recovered through the RESA and ECA riders until PSCo’s next rate case following Rush Creek’s in-service date. The wind generation facility is anticipated to be in service in October 2018.
Colorado Energy Plan (CEP) — In 2016, PSCo filed its 2016 Electric Resource Plan (ERP) which included the estimated need for additional generation resources through spring of 2024. In 2017, PSCo filed an updated capacity need with the CPUC of 450 MW in 2023.
In August 2017, PSCo and various other stakeholders filed a stipulation agreement proposing the CEP, an alternative plan that increases the amount of new resources sought under the ERP. The CEP would increase PSCo’s potential capacity need up to 1,110 MW due to the proposed retirement of two coal units. The major components include:
Early retirement of 660 MWs of coal-fired generation at Comanche Units 1 (2022) and 2 (2025);
Accelerated depreciation for the early retirement of the two Comanche units and establishment of a regulatory asset to collect the incremental depreciation expense and related costs;
A RFP for up to 1,000 MW of wind, 700 MW of solar and 700 MWdistribution of natural gas and/or storage;to end-use residential, C&I and transport customers in NSP-Minnesota, NSP-Wisconsin and PSCo. Xcel Energy had natural gas deliveries of 405,895 (thousands of MMBtu), 2.1 million customers and natural gas revenues of $2,132 (millions of dollars) for 2021.
Utility ownership targets of 50 percent renewable generation resources and 75 percent of natural gas-fired, storage, or renewable with storage generation resources;
Reduction of the RESA rider, from two percent to one percent effective beginning 2021 or 2022; and
Construction of a new transmission switching station to further the development of renewable generating resources.
Hearings were held in February 2018 with two parties opposing both the coal retirements and utility ownership. Fifteen parties in the proceeding support the CEP. The CPUC is expected to rule on the stipulation agreement in March 2018. PSCo is currently evaluating bids from a RFP and anticipates filing its recommended portfolios in April 2018. A CPUC decision on the recommended portfolio is anticipated in the summer of 2018.
Approval of the CEP portfolio could increase capital investment up to $1.5 billion, based on a preliminary estimate. The level of capital investment may decline due to lower renewable pricing and the ultimate composition of assets selected as part of the RFP process. The expected cost and potential capital investment of the CEP will be determined once a recommended portfolio is filed with the CPUC. The CEP portfolio is not included in PSCo and Xcel Energy’s base capital expenditures forecast. See Item 7. Management’s Discussion and Analysis of Financial Condition and Result of Operations - Liquidity and Capital Resources for further discussion of the capital forecast.
Boulder, Colorado Municipalization — In 2011, in the City of Boulder, Colorado (Boulder), voters passed a ballot measure authorizing the formation of an electric municipal utility, subject to certain conditions. Since that time, there have been various legal proceedings in multiple venues with jurisdiction over Boulder’s plan. In 2014, the Boulder City Council passed an ordinance to establish an electric utility. PSCo challenged the formation of this utility as premature and the Colorado Court of Appeals ruled in PSCo’s favor, vacating a lower court decision. Subsequently, the Colorado Supreme Court granted Boulder’s petition to review the Court of Appeals decision and oral arguments were held on Feb. 14, 2018. A ruling on the petition is anticipated in 2018.
In 2015, the Boulder District Court (District Court) affirmed a prior CPUC decision that Boulder cannot serve customers outside its city limits; these customers were included in Boulder’s plan at the time. The District Court also ruled the CPUC has jurisdiction over the transfer of any facilities to Boulder and in determining how the systems are separated. Further, the District Court found that the CPUC must give approval before Boulder files any condemnation proceeding. Boulder does not have authorization to initiate a condemnation proceeding at this time.
Boulder has filed multiple separation applications, the most recent one being in May 2017, which was challenged by PSCo and other intervenors. In September 2017, the CPUC issued a written decision, agreeing with several key aspects of PSCo’s position, stating PSCo is not required to undertake many of Boulder’s proposals, such as acting as a financier and contractor for Boulder. Additionally, the CPUC approved the designation of some electrical distribution assets for transfer, subject to Boulder completing certain items, including:
Filing an agreement between Boulder and PSCo providing permanent rights for PSCo to place and access facilities in Boulder needed to continue to serve its customers;
Filing a complete and accurate revised list of distribution assets desired to be transferred; and
Filing an agreement to address payments from Boulder to PSCo for costs of Boulder’s municipalization efforts.
Boulder has requested that the CPUC grant an extension through March 13, 2018 to complete such filings. Once those filings have been submitted, additional hearings may be held.
In November 2017, Boulder voters passed certain measures regarding Boulder’s pursuit of municipalization, including an extension and increase of the Utility Occupational Tax for funding Boulder’s exploration of municipalization.
MWTG — PSCo, along with nine other electric service providers from the Rocky Mountain region, have been considering creating and operating a joint transmission tariff to increase wholesale market efficiency and improve regional transmission planning. In September 2017, the MWTG determined that membership in the SPP RTO could provide opportunities to reduce customer costs, and maximize resource and electric grid utilization. In October 2017, the MWTG commenced negotiations with SPP through the SPP public stakeholder process.
SPP’s Board of Directors and organizational groups have begun to address the MWTG’s proposed terms for integration into the SPP RTO. Should the MWTG decide to move forward, SPP would make filings with the FERC and PSCo would make filings with the CPUC and the FERC, in the later part of 2018. If approved, MWTG operations within the SPP RTO would not be expected to begin until late 2019 at the earliest. PSCo recently engaged a consultant to conduct an analysis of the benefits associated with membership in the SPP RTO. The analysis assumed gas price forecasts that are lower than gas price forecasts used by the other MWTG utilities in their analysis of the benefits associated with membership in the SPP RTO. PSCo is in the process of evaluating that analysis.
|
| | | | | | | | | | | | | | | | | |
| | Year Ended Dec. 31 |
| | 2017 | | 2016 | | 2015 |
| PSCo | Millions of KWh | | Percent of Generation | | Millions of KWh | | Percent of Generation | | Millions of KWh | | Percent of Generation |
| Coal | 14,609 |
| | 44 | % | | 15,895 |
| | 47 | % | | 18,601 |
| | 54 | % |
| Natural Gas | 9,195 |
| | 28 |
| | 8,632 |
| | 25 |
| | 7,948 |
| | 23 |
|
Wind (a) | 7,804 |
| | 24 |
| | 8,106 |
| | 24 |
| | 6,699 |
| | 19 |
|
| Hydroelectric | 624 |
| | 2 |
| | 1,179 |
| | 3 |
| | 662 |
| | 2 |
|
Other (b) | 670 |
| | 2 |
| | 393 |
| | 1 |
| | 705 |
| | 2 |
|
| Total | 32,902 |
| | 100 | % | | 34,205 |
| | 100 | % | | 34,615 |
| | 100 | % |
| | | | | | | | | | | | |
| Owned generation | 23,053 |
| | 70 | % | | 22,753 |
| | 67 | % | | 22,981 |
| | 66 | % |
| Purchased generation | 9,849 |
| | 30 |
| | 11,452 |
| | 33 |
| | 11,634 |
| | 34 |
|
| Total | 32,902 |
| | 100 | % | | 34,205 |
| | 100 | % | | 34,615 |
| | 100 | % |
| | |
(a)
| This category includes wind energy de-bundled from RECs and also includes Windsource RECs. PSCo uses RECs to meet or exceed state resource requirements and may sell surplus RECs. |
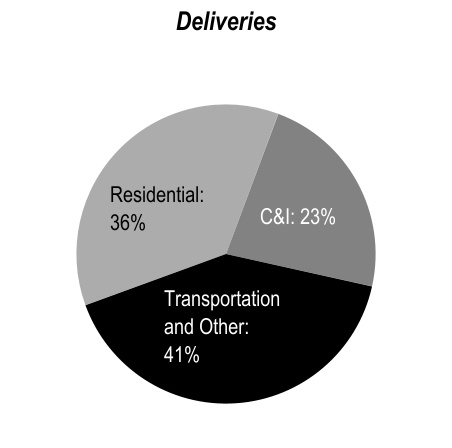
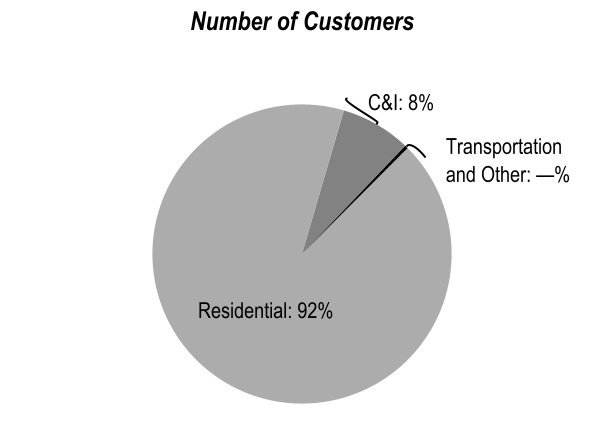
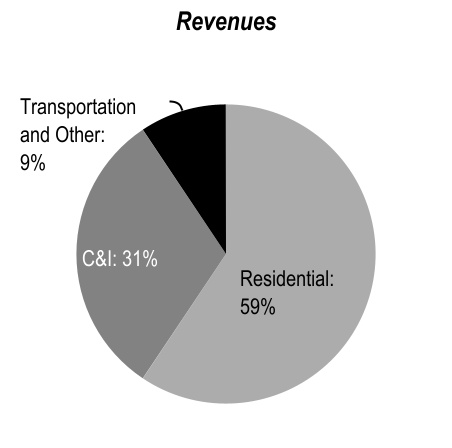
| | |
(b)
| Distributed generation from the Solar*Rewards program is not included, and was approximately 393, 396 and 245 million net KWh for 2017, 2016, and 2015, respectively. |
Fuel Supply and Costs
The following table shows the delivered cost per MMBtu of each significant category of fuel consumed for owned electric generation, the percentage of total fuel requirements represented by each category of fuel and the total weighted average cost of all fuels.
Sales/Revenue Statistics (a)
|
| | | | | | | | | | | | | | | | | | |
| | | Coal | | Natural Gas | | Weighted Average Owned Fuel Cost |
| PSCo Generating Plants | | Cost | | Percent | | Cost | | Percent | |
| 2017 | | $ | 1.56 |
| | 70 | % | | $ | 3.82 |
| | 30 | % | | $ | 2.25 |
|
| 2016 | | 1.75 |
| | 72 |
| | 3.79 |
| | 28 |
| | 2.33 |
|
| 2015 | | 1.75 |
| | 75 |
| | 3.89 |
| | 25 |
| | 2.29 |
|
| | | | | | | | | | | | | | |
| | 2021 | | 2020 |
| MMBtu sales per retail customer | | 114 | | | 118 | |
| Revenue per retail customer | | $ | 917 | | | $ | 720 | |
| Residential revenue per MMBtu | | 8.61 | | | 6.64 | |
| C&I revenue per MMBtu | | 7.20 | | | 5.22 | |
| Transportation and other revenue per MMBtu | | 1.20 | | | 0.67 | |
See Items 1A and 7 for further discussion of fuel supply and costs.
Fuel Sources
Coal— PSCo normally maintains approximately 35 - 50 days of coal inventory. Coal supply inventories at Dec. 31, 2017 and 2016 were approximately 48 and 36 days of usage, respectively. PSCo has contracted for coal supply to provide 75 percent of its 9.1 million tons of estimated coal requirements in 2018, and a declining percentage of requirements in subsequent years. PSCo’s general coal purchasing objective is to contract for approximately 75 percent of requirements for the first year, 40 percent of requirements in year two, and 20 percent of requirements in year three. Remaining requirements will be filled through the procurement process or over-the-counter transactions.
PSCo has coal transportation contracts that provide for delivery of 100 percent its coal requirements in 2018 and 2019. Coal delivery may be subject to interruptions or reductions due to operation of the mines, transportation problems, weather and availability of equipment.
Natural gas— PSCo uses both firm and interruptible natural gas supply in combustion turbines and certain boilers. Natural gas supplies for PSCo’s power plants are procured under contracts to provide an adequate supply of fuel. However, as natural gas primarily serves intermediate and peak demand, any remaining forecasted requirements are able to be procured through a liquid spot market. The majority of natural gas supply under contract is covered by a long-term agreement with Anadarko Energy Services Company and the balance of natural gas supply contracts have variable pricing features tied to changes in various natural gas indices. PSCo hedges a portion of that risk through financial instruments. (a) See Note 116 to the consolidated financial statements for further discussion.information.
Most transportation contract pricing is based on FERC approved transportation tariff rates. Certain natural gas supply and transportation agreements include obligations for the purchase and/or delivery of specified volumes of natural gas or to make payments in lieu of delivery.
At Dec. 31, 2017, PSCo’s commitments related to gas supply contracts, which expire between 2021 through 2023, were approximately $545 million and commitments related to gas transportation and storage contracts, which expire between 2018 through 2040, were approximately $620 million.
At Dec. 31, 2016, PSCo’s commitments related to gas supply contracts were approximately $654 million and commitments related to gas transportation and storage contracts were approximately $573 million.
PSCo has limited on-site fuel oil storage facilities and primarily relies on the spot market for incremental supplies.
Renewable Energy Sources
PSCo’s renewable energy portfolio includes wind, hydroelectric, biomass and solar power from both owned generating facilities and PPAs. As of Dec. 31, 2017, PSCo was in compliance with mandated RPS, which requires generation from renewable resources of 20.0 percent of electric retail sales.
Renewable energy as a percentage of PSCo’ total energy:
|
| | | | | | |
| | | 2017 | | 2016 |
| Renewable | | 27.7 | % | | 28.3 | % |
| Wind | | 23.7 |
| | 23.7 |
|
| Hydroelectric, biomass and solar | | 3.9 |
| | 4.6 |
|
PSCo also offers customer-focused renewable energy initiatives. Windsource® allows customers to purchase electricity from renewable sources. The number of customers utilizing Windsource increased to approximately 50,000 in 2017 from 46,000 in 2016.
Additionally, to encourage the growth of solar energy on the system, customers are offered incentives to install solar panels on their homes and businesses under the Solar*Rewards® program. Over 34,900 PV systems with approximately 310 MW of aggregate capacity have been installed in Colorado as of Dec. 31, 2017 and over 32,500 PV systems with approximately 276 MW of aggregate capacity were installed as of Dec. 31, 2016. Additionally, 33 community solar gardens with 33.5 MW of capacity have been completed in Colorado as of Dec. 31, 2017.
Wind— PSCo acquires the majority of its wind energy from PPAs. Currently, PSCo has 18 of these agreements in place, with facilities ranging in size from two MW to over 300 MW.
PSCo had approximately 2,560 MW of wind energy on its system at the end of 2017 and 2016. In addition to receiving purchased wind energy under these agreements, PSCo typically receives wind RECs which are used to meet state renewable resource requirements.
The average cost per MWh of wind energy under these contracts was approximately $42 in 2017 and 2016. The cost per MWh of wind energy varies by contract and may be influenced by a number of factors including regulation, state-specific renewable resource requirements, and the year of contract execution. Generally, previously executed contracts continued to benefit from improvements in wind technology, excess capacity among manufacturers, and motivation to commence new construction prior to the anticipated expiration of the federal PTCs. In December 2015, the federal PTCs were extended through 2019 with a phase down on sites that began construction in 2017.
Wholesale and Commodity Marketing Operations
PSCo conducts various wholesale marketing operations, including the purchase and sale of electric capacity, energy, ancillary services and energy related products. PSCo uses physical and financial instruments to minimize commodity price and credit risk and hedge sales and purchases. PSCo also engages in trading activity unrelated to hedging and sharing of any margins is determined through state regulatory proceedings as well as the operation of the FERC approved joint operating agreement. See Item 7 for further discussion.
SPS
Public Utility Regulation
Summary of Regulatory Agencies and Areas of Jurisdiction— The PUCT and NMPRC regulate SPS’ retail electric operations and have jurisdiction over its retail rates and services and the construction of transmission or generation in their respective states. The municipalities in which SPS operates in Texas have original jurisdiction over SPS’ rates in those communities. The municipalities’ rate setting decisions are subject to review by the PUCT, which has ultimate authority to set the rates SPS charges in the municipalities. The NMPRC also has jurisdiction over the issuance of securities. SPS is regulated by the FERC for its wholesale electric operations, accounting practices, wholesale sales for resale, the transmission of electricity in interstate commerce, compliance with NERC electric reliability standards, asset transactions and mergers, and natural gas transactions in interstate commerce. As approved by the FERC, SPS is a transmission-owning member of the SPP RTO and operates within the SPP RTO and SPP IM wholesale market. SPS is authorized to make wholesale electric sales at market-based prices.
Fuel, Purchased Energy and Conservation Cost-Recovery Mechanisms— SPS has several retail adjustment clauses that recover fuel, purchased energy and other resource costs:
DCRF — Recovers distribution costs in Texas that are not included in base rates.
EECRF — Recovers costs associated with providing energy efficiency programs in Texas.
EE rider — Recovers costs associated with providing energy efficiency programs in New Mexico.
FPPCAC — Adjusts monthly to recover the actual fuel and purchased power costs.
PCRF — Allows recovery of certain purchased power costs in Texas that are not included in base rates.
RPS — Recovers deferred costs associated with renewable energy programs in New Mexico.
TCRF — Recovers certain transmission infrastructure improvement costs and changes in wholesale transmission charges in Texas that are not included in base rates.
Fuel and purchased energy costs are recovered in Texas through a fixed fuel and purchased energy recovery factor, which is part of SPS’ retail electric tariff. SO2 and NOx allowance revenues and costs are also recovered through the fixed fuel and purchased energy recovery factor. The regulations allow retail fuel factors to change up to three times per year.
The fixed fuel and purchased energy recovery factor provides for the over- or under-recovery of fuel and purchased energy expenses. Regulations also require refunding or surcharging over- or under- recovery amounts, including interest, when they exceed four percent of the utility’s annual fuel and purchased energy costs on a rolling 12-month basis, if this condition is expected to continue.
PUCT regulations require periodic examination of SPS’ fuel and purchased energy costs, the efficient use of fuel and purchased energy, fuel acquisition and management policies and purchased energy commitments. SPS is required to file an application for the PUCT to retrospectively review fuel and purchased energy costs at least every three years. In June 2016, SPS filed its fuel reconciliation application which reconciled fuel and purchased power costs for 2013 through 2015. In March 2017, the PUCT approved the application.
SPS recovers fuel and purchased energy costs from its wholesale customers through a monthly wholesale fuel and purchased economic energy cost adjustment clause accepted for filing by the FERC.
Capacity and Demand
Uninterrupted system peak demand for SPS for each of the last three years and the forecast for 2018, assuming normal weather conditions, is as follows:
|
| | | | | | | | | | | |
| | System Peak Demand (in MW) |
| | 2017 | | 2016 | | 2015 | | 2018 Forecast |
| SPS | 4,374 |
| | 4,836 |
| | 4,678 |
| | 4,483 |
|
The peak demand for the SPS system typically occurs in the summer. The 2017 system peak demand for SPS occurred on July 26, 2017. The decline in peak load from 2016 to 2017 is in part due to cooler weather in 2017. Additionally, the partial requirement contract with Golden Spread ended May 2017, contributing to the lower actual peak demand for SPS. The 2018 forecast assumes normal peak day weather.
Energy Sources and Related Transmission Initiatives
SPS expects to use existing electric generating stations, power purchases, DSM and new generation options to meet its system capacity requirements. In addition, SPS has evaluated water supply issues at its Tolk facility, concluding that additional resource investment will be required to operate the plant through its existing life. The Ogallala aquifer in this region of the country has depleted more rapidly than expected and SPS installed a horizontal water well that could help to delay the need for a more substantial investment solution. As a result of this issue and to a lesser extent, future environmental rules facing the plant, SPS is seeking a decrease to the remaining life of the facility in its current Texas and New Mexico rate case proceedings (see Note 12).
Purchased Power— SPS has contracts to purchase power from other utilities and IPPs. Long-term purchased power contracts typically require a periodic capacity charge and an energy charge for energy actually purchased. SPS also makes short-term purchases to meet system load and energy requirements, to replace generation from company-owned units under maintenance or during outages, to meet operating reserve obligations or to obtain energy at a lower cost.
Purchased Transmission Services— SPS has contractual arrangements with SPP and regional transmission service providers to deliver power and energy to its native load customers.
TUCO Substation to Yoakum County Substation to Hobbs Plant Substation 345 KV Transmission Line— In 2014, SPP evaluated anticipated transmission needs for certain parts of the SPP region which is commonly known as the High Priority Incremental Load Study. As a result, SPS received 44 transmission projects, with an original estimated cost of $557 million. The most significant of these projects are the TUCO Substation to the Yoakum County Substation to the Hobbs Plant Substation and the Hobbs Plant Substation to the China Draw Substation transmission line projects.
In 2016 and 2017, SPS received CCNs for the three segments of the TUCO Substation to Yoakum County Substation to Hobbs Plant Substation 345 KV transmission line, which are expected to be in service in the second quarter of 2020. This 345 KV transmission line is part of a larger project which includes an additional 345 KV transmission line from the Hobbs Plant Substation to the China Draw Substation, which was approved by the NMPRC in 2016 and is anticipated to be in service by June 2018. The estimated total investment for these transmission lines is approximately $402 million.
Wind Proposals — In March 2017, SPS filed proposals with the NMPRC and the PUCT to build, own and operate 1,000 MW of new wind generation through two wind farms for a cost of approximately $1.6 billion. In addition, the proposal includes a PPA for 230 MW of wind.
In December 2017, SPS and parties filed a unanimous stipulation with the NMPRC. The stipulation is subject to approval by the NMPRC. The key terms of the stipulation are listed below:
An investment cap of $1,675 per KW, which is equal to 102.5 percent of the estimated construction costs;
SPS customers would receive a credit to their bills if actual capacity factors fall below 48 percent;
SPS customers would receive 100 percent of the federal PTC; and
SPS can file a HTY rate case and include projected capital additions for the wind farms five months beyond the end of the test year. Interim rates would also be made effective 30 days after filing which will allow SPS to closely match the start of cost recovery for that wind farm with the in service date.
On Feb. 9, 2018, the Hearing Examiner issued a certification of stipulation (certification) recommending approval of all but one aspect of the stipulation, which is the provision for interim rate recovery of SPS’ investment in the two wind farms. On Feb. 19, 2018, SPS filed exceptions to the recommended decision, as did other parties to the stipulation.
In addition, SPS has reached a settlement in principle with parties in Texas and is working towards finalizing a stipulation. SPS has shared an updated analysis with all parties which shows the wind projects remain cost-effective following the passage of the TCJA. The settlements require approval by the NMPRC and PUCT. Both commissions are expected to rule on the settlements by the end of the first quarter of 2018. The Hale wind project in Texas and the Sagamore wind project in New Mexico are scheduled to be in service by mid-2019 and year-end 2020, respectively.
Lubbock Power & Light’s (LP&L’s) Request for Participation in ERCOT — In September 2017, LP&L filed its application with the PUCT and proposed to transition a portion of its load to ERCOT no later than June 2021. As a result of LP&L’s proposal, approximately $18 million in wholesale transmission revenue would be reallocated to remaining SPS transmission customers at the time of the load transition. In November 2017, SPS and various other parties, including the PUCT Staff, filed direct testimony in response to LP&L’s application. SPS proposed an Interconnection Switching Fee to be determined by the PUCT.
In February 2018, SPS, LP&L, the PUCT Staff and various other parties filed a stipulation that provides SPS’ customers with an Interconnection Switching Fee of approximately $24 million to compensate them for the transfer of LP&L’s load from SPP to ERCOT. Under the settlement, SPS would allocate the Interconnection Switching Fee to its Texas and New Mexico retail and wholesale transmission customers through a bill credit following LP&L’s load transition to ERCOT (tentatively, June 2021). A PUCT decision is expected in March 2018. No final decision regarding LP&L’s departure or its potential timing is expected until completion of the PUCT proceedings.
Texas State ROFR Request for Declaratory Order — In February 2017, SPS and SPP filed a joint petition with the PUCT for a declaratory order regarding SPS’ ROFR. SPS contended that Texas law grants an incumbent electric utility, operating in areas outside of ERCOT, the ROFR to construct new transmission facilities located in the utility’s service area. SPP stated that Texas law does not provide a clear statement regarding the ROFR for incumbent utilities and therefore SPP was abiding by the portion of its OATT, which requires competitive solicitation to construct and operate new transmission facilities within areas of Texas’ SPP footprint.
In October 2017, the PUCT issued an order finding that SPS does not possess an exclusive right to construct and operate transmission facilities within its service area. In January 2018, SPS and two other parties filed appeals of the PUCT’s order in the Texas State District Court. The appeals have been consolidated. A schedule has not been set for the case.
Energy Source Statistics
|
| | | | | | | | | | | | | | | | | |
| | Year Ended Dec. 31 |
| | 2017 | | 2016 | | 2015 |
| SPS | Millions of KWh | | Percent of Generation | | Millions of KWh | | Percent of Generation | | Millions of KWh | | Percent of Generation |
| Coal | 10,999 |
| | 40 | % | | 10,990 |
| | 39 | % | | 12,441 |
| | 44 | % |
| Natural Gas | 9,950 |
| | 36 |
| | 10,909 |
| | 38 |
| | 10,514 |
| | 36 |
|
Wind (a) | 5,828 |
| | 21 |
| | 6,120 |
| | 22 |
| | 5,252 |
| | 19 |
|
Other (b) | 770 |
| | 3 |
| | 347 |
| | 1 |
| | 150 |
| | 1 |
|
| Total | 27,547 |
| | 100 | % | | 28,366 |
| | 100 | % | | 28,357 |
| | 100 | % |
| | | | | | | | | | | | |
| Owned generation | 12,845 |
| | 47 | % | | 15,015 |
| | 53 | % | | 16,480 |
| | 58 | % |
| Purchased generation | 14,702 |
| | 53 |
| | 13,351 |
| | 47 |
| | 11,877 |
| | 42 |
|
| Total | 27,547 |
| | 100 | % | | 28,366 |
| | 100 | % | | 28,357 |
| | 100 | % |
| |
(a)
| This category includes wind energy de-bundled from RECs and also includes Windsource RECs. SPS uses RECs to meet or exceed state resource requirements and may sell surplus RECs. |
| |
(b)
| Distributed generation from the Solar*Rewards program is not included, was approximately 26, 14 and 13 million net KWh for 2017, 2016, and 2015, respectively. |
Fuel Supply and Costs
The following table shows the delivered cost per MMBtu of each significant category of fuel consumed for owned electric generation, the percentage of total fuel requirements represented by each category of fuel and the total weighted average cost of all fuels.
|
| | | | | | | | | | | | | | | | | | |
| | | Coal | | Natural Gas | | Weighted Average Owned Fuel Cost |
| SPS Generating Plants | | Cost | | Percent | | Cost | | Percent | |
| 2017 | | $ | 2.18 |
| | 74 | % | | $ | 3.39 |
| | 26 | % | | $ | 2.50 |
|
| 2016 | | 2.12 |
| | 70 |
| | 2.81 |
| | 30 |
| | 2.32 |
|
| 2015 | | 2.12 |
| | 73 |
| | 3.11 |
| | 27 |
| | 2.39 |
|
See Items 1A and 7 for further discussion of fuel supply and costs.
Fuel Sources
Coal— SPS purchases all of the coal requirements for its two coal facilities, Harrington and Tolk electric generating stations, from TUCO. TUCO arranges for the purchase, receiving, transporting, unloading, handling, crushing, weighing and delivery of coal to meet SPS’ requirements. TUCO is responsible for negotiating and administering contracts with coal suppliers, transporters and handlers. The coal supply contract with TUCO expires on Dec. 31, 2022 for both Harrington and Tolk.
SPS normally maintains approximately 35 - 50 days of coal inventory. As of Dec. 31, 2017 and 2016, coal inventories at SPS were approximately 52 and 64 day supply, respectively. Milder weather, purchase commitments and relatively low power and natural gas prices resulted in coal inventories being above optimal levels. SPS’ generation stations primarily use low-sulfur western coal from mines operating in Wyoming. TUCO has coal agreements to supply 79 percent of SPS’ estimated coal requirements in 2018 and a declining percentage of requirements in subsequent years. SPS’ general coal purchasing objective is to contract for approximately 75 percent of requirements for the first year, 40 percent of requirements in year two and 20 percent of requirements in year three.
Natural gas— SPS uses both firm and interruptible natural gas supply in combustion turbines and certain boilers. Natural gas for SPS’ power plants is procured under contracts to provide an adequate supply of fuel, which typically is purchased with terms of one year or less. The transportation and storage contracts expire between 2018 to 2033. All of the natural gas supply contracts have variable pricing that is tied to various natural gas indices.
Most transportation contract pricing is based on FERC and Railroad Commission of Texas approved transportation tariff rates. Certain natural gas supply and transportation agreements include obligations for the purchase and/or delivery of specified volumes of natural gas or to make payments in lieu of delivery. SPS’ commitments related to gas supply contracts were approximately $11 million and $17 million and commitments related to gas transportation and storage contracts were approximately $191 million and $161 million at Dec. 31, 2017 and 2016, respectively.
SPS has limited on-site fuel oil storage facilities and primarily relies on the spot market for incremental supplies.
Renewable Energy Sources
SPS’ renewable energy portfolio includes wind and solar power from PPAs. As of Dec. 31, 2017, SPS is in compliance with mandated RPS, which require generation from renewable resources of 3.7 percent of Texas electric retail sales and 15.0 percent of New Mexico electric retail sales.
Renewable energy as a percentage of SPS’ total energy:
|
| | | | | | |
| | | 2017 | | 2016 |
| Renewable | | 24.0 | % | | 22.8 | % |
| Wind | | 21.2 |
| | 21.6 |
|
| Solar | | 1.8 |
| | 1.2 |
|
SPS also offers customer-focused renewable energy initiatives. Windsource® allows customers in New Mexico to purchase electricity from renewable sources. The number of customers utilizing Windsource increased to approximately 940 in 2017 from 900 in 2016.
Wind— SPS acquires its wind energy from IPP contracts and QF tariffs. SPS currently has 24 of these agreements in place, with facilities ranging in size from under two MW to 250 MW.
SPS had approximately 1,500 MW of wind energy on its system at the end of 2017 and 2016. In addition to receiving purchased wind energy under these agreements, SPS typically receives wind RECs on certain agreements which are used to meet state renewable resource requirements.
The average cost per MWh of wind energy under the IPP contracts and QF tariffs was approximately $27 for 2017 and $25 for 2016. The cost per MWh of wind energy varies by contract and may be influenced by a number of factors including regulation, state-specific renewable resource requirements and the year of contract execution. Generally, contracts executed in 2017 continued to benefit from improvements in technology, excess capacity among manufacturers, and motivation to commence new construction prior to the anticipated expiration of the federal PTCs. In December 2015, the federal PTCs were extended through 2019 with a phase down on sites that began construction in 2017.
Wholesale and Commodity Marketing Operations
SPS conducts various wholesale marketing operations, including the purchase and sale of electric capacity, energy, ancillary services and energy related products. SPS uses physical and financial instruments to minimize commodity price and credit risk and hedge sales and purchases. See Item 7 for further discussion.
Summary of Recent Federal RegulatoryDevelopments
The FERC has jurisdiction over rates for electric transmission service in interstate commerce and electricity sold at wholesale, hydro facility licensing, natural gas transportation, asset transactions and mergers, accounting practices and certain other activities of Xcel Energy Inc.’s utility subsidiaries and TransCos, including enforcement of NERC mandatory electric reliability standards. State and local agencies have jurisdiction over many of Xcel Energy Inc.’s utility subsidiaries’ activities, including regulation of retail rates and environmental matters. In addition to the matters discussed below, see Note 12 to the accompanying consolidated financial statements for a discussion of other regulatory matters.
Xcel Energy attempts to mitigate the risk of regulatory penalties through formal training on prohibited practices and a compliance function that reviews interaction with the markets under FERC and CFTC jurisdictions. Public campaigns are conducted to raise awareness of the public safety issues of interacting with our electric systems. While programs to comply with regulatory requirements are in place, there is no guarantee the compliance programs or other measures will be sufficient to ensure against violations.
FERC Order, ROE Policy — In June 2014, the FERC adopted a two-step ROE methodology for electric utilities in an order issued in a complaint proceeding involving New England Transmission Owners (NETOs). The issue of how to apply the FERC ROE methodology has been contested in various complaint proceedings, including two ROE complaints involving the MISO TOs, which include NSP-Minnesota and NSP-Wisconsin. In April 2017, the District of Columbia Circuit (D.C. Circuit) vacated and remanded the June 2014 ROE order. The D.C. Circuit found that the FERC had not properly determined that the ROE authorized for the NETOs prior to June 2014 was unjust and unreasonable. The D.C. Circuit also found that the FERC failed to justify the new ROE methodology. The FERC has yet to act on the D.C. Circuit’s decision. See Note 12 to the consolidated financial statements for discussion of the D.C. Circuit’s decision and the impact on the MISO ROE Complaints.
DOE Grid Resiliency Notice of Proposed Rule (NOPR) — In September 2017, the DOE requested the FERC to consider and adopt a Grid Resiliency and Pricing Rule to address threats to the U.S. electrical grid. Under the proposed rule, coal and nuclear generation facilities would have to meet certain criteria to qualify for full recovery of their costs including a fair rate of return. In January 2018, the FERC rejected the DOE’s proposal, but alternatively initiated an inquiry into how RTOs and Independent System Operators address grid resilience. Efforts to resolve U.S. grid resilience issues may result from this proceeding and Xcel Energy plans to monitor and respond as necessary.
Public Utility Regulatory Policies Act (PURPA) Enforcement Complaint against CPUC —In December 2016, Sustainable Power Group, LLC (sPower) petitioned the FERC to initiate an enforcement action in federal court against the CPUC under PURPA. The petition asserts that a December 2016 CPUC ruling, which indicated that a QF must be a successful bidder in a PSCo resource acquisition bidding process, violated PURPA and FERC rules. In January 2017, PSCo filed a motion to intervene and protest, arguing that the FERC should decline the petition. The CPUC filed a similar pleading. sPower has proposed to construct 800 MW of solar generation and 700 MW of wind generation in Colorado and seeks to require PSCo to contract for these resources under PURPA.
If sPower were to prevail, PSCo’s ability to select generation resources through competitive bidding would be negatively affected. However, due to a lack of quorum at the FERC, the FERC did not act on that petition within the sixty days contemplated by PURPA.
Subsequently sPower filed a complaint for declaratory and injunctive relief in the United States District Court for the District of Colorado (District Court) requesting that the court find the bidding requirement in the CPUC QF rules to be unlawful. PSCo intervened in that proceeding and the CPUC filed a motion to dismiss. In June 2017, the United States Magistrate Judge issued a recommendation to the District Court that sPower’s complaint be dismissed because sPower failed to establish that it faced a substantial risk of harm. In October 2017, the District Court denied the CPUC’s motion to dismiss and instead allowed sPower to file an amended complaint. The case effectively started over and PSCo intervened. The CPUC filed a motion to dismiss the amended complaint which is currently pending before the District Court. The timing of a resolution in this case is unclear.
Electric Operating Statistics
Electric Sales Statistics |
| | | | | | | | | | | |
| | Year Ended Dec. 31 |
| | 2017 | | 2016 | | 2015 |
| Electric sales (Millions of KWh) | | | | | |
| Residential | 24,216 |
| | 24,726 |
| | 24,498 |
|
| Large C&I | 27,951 |
| | 27,664 |
| | 27,719 |
|
| Small C&I | 35,493 |
| | 35,830 |
| | 35,806 |
|
| Public authorities and other | 1,055 |
| | 1,103 |
| | 1,071 |
|
| Total retail | 88,715 |
| | 89,323 |
| | 89,094 |
|
| Sales for resale | 18,349 |
| | 18,694 |
| | 15,283 |
|
| Total energy sold | 107,064 |
| | 108,017 |
| | 104,377 |
|
| | | | | | |
| Number of customers at end of period | | | | | |
| Residential | 3,082,974 |
| | 3,053,732 |
| | 3,023,494 |
|
| Large C&I | 1,241 |
| | 1,228 |
| | 1,229 |
|
| Small C&I | 433,883 |
| | 432,012 |
| | 429,617 |
|
| Public authorities and other | 69,376 |
| | 68,935 |
| | 68,595 |
|
| Total retail | 3,587,474 |
| | 3,555,907 |
| | 3,522,935 |
|
| Wholesale | 58 |
| | 52 |
| | 47 |
|
| Total customers | 3,587,532 |
| | 3,555,959 |
| | 3,522,982 |
|
| | | | | | |
| Electric revenues (Millions of Dollars) | | | | | |
| Residential | $ | 2,975 |
| | $ | 2,966 |
| | $ | 2,891 |
|
| Large C&I | 1,779 |
| | 1,707 |
| | 1,690 |
|
| Small C&I | 3,463 |
| | 3,328 |
| | 3,304 |
|
| Public authorities and other | 143 |
| | 140 |
| | 137 |
|
| Total retail | 8,360 |
| | 8,141 |
| | 8,022 |
|
| Wholesale | 719 |
| | 693 |
| | 660 |
|
| Other electric revenues | 597 |
| | 666 |
| | 594 |
|
| Total electric revenues | $ | 9,676 |
| | $ | 9,500 |
| | $ | 9,276 |
|
| | | | | | |
| KWh sales per retail customer | 24,729 |
| | 25,120 |
| | 25,290 |
|
| Revenue per retail customer | $ | 2,330 |
| | $ | 2,289 |
| | $ | 2,277 |
|
| Residential revenue per KWh |
| 12.29 | ¢ | |
| 11.99 | ¢ | |
| 11.80 | ¢ |
| Large C&I revenue per KWh | 6.36 |
| | 6.17 |
| | 6.10 |
|
| Small C&I revenue per KWh | 9.76 |
| | 9.29 |
| | 9.23 |
|
| Total retail revenue per KWh | 9.42 |
| | 9.11 |
| | 9.00 |
|
| Wholesale revenue per KWh | 3.92 |
| | 3.71 |
| | 4.32 |
|
|
| | | | | | | | | | | | | | | | | |
| | Year Ended Dec. 31 |
| | 2017 | | 2016 | | 2015 |
| Xcel Energy | Millions of KWh | | Percent of Generation | | Millions of KWh | | Percent of Generation | | Millions of KWh | | Percent of Generation |
| Coal | 40,344 |
| | 36 | % | | 40,566 |
| | 36 | % | | 47,003 |
| | 43 | % |
| Natural Gas | 24,932 |
| | 23 |
| | 27,351 |
| | 25 |
| | 25,151 |
| | 23 |
|
Wind (a) | 22,526 |
| | 21 |
| | 22,123 |
| | 20 |
| | 18,186 |
| | 17 |
|
| Nuclear | 14,168 |
| | 13 |
| | 14,191 |
| | 13 |
| | 12,895 |
| | 12 |
|
| Hydroelectric | 3,866 |
| | 4 |
| | 4,435 |
| | 4 |
| | 4,001 |
| | 4 |
|
Other (b) | 3,329 |
| | 3 |
| | 2,167 |
| | 2 |
| | 1,456 |
| | 1 |
|
| Total | 109,165 |
| | 100 | % | | 110,833 |
| | 100 | % | | 108,692 |
| | 100 | % |
| | | | | | | | | | | | |
| Owned generation | 72,539 |
| | 66 | % | | 74,149 |
| | 67 | % | | 73,279 |
| | 67 | % |
| Purchased generation | 36,626 |
| | 34 |
| | 36,684 |
| | 33 |
| | 35,413 |
| | 33 |
|
| Total | 109,165 |
| | 100 | % | | 110,833 |
| | 100 | % | | 108,692 |
| | 100 | % |
| |
(a)
| This category includes wind energy de-bundled from RECs and also includes Windsource RECs. Xcel Energy uses RECs to meet or exceed state resource requirements and may sell surplus RECs. |
| |
(b)
| Includes energy from other sources, including solar, biomass, oil and refuse. Distributed generation from the Solar*Rewards program is not included, and was approximately 435, 430 and 266 million net KWh for 2017, 2016 and 2015, respectively. |
NATURAL GAS UTILITY OPERATIONS
Overview
Xcel Energy operates natural gas local distribution companies in six states, including Minnesota, Wisconsin, Michigan, South Dakota, North Dakota, and Colorado with PSCo being the largest. The most significant developments in the natural gas operations of the utility subsidiaries are uncertainty regarding political and regulatory developments that impact hydraulic fracturing, safety requirements for natural gas pipelines and the continued trend of declining use per residential and small C&I customer, as a result of improved building construction technologies, higher appliance efficiencies and conservation. From 2000 to 2017, average annual sales to the typical residential customer declined 17 percent, while sales to the typical small C&I customer declined 10 percent, each on a weather-normalized basis. Although wholesale price increases do not directly affect earnings because of natural gas cost-recovery mechanisms, high prices can encourage further efficiency efforts by customers.
The PHMSA
Pipeline Safety Act — The Pipeline Safety, Regulatory Certainty, and Job Creation Act (Pipeline Safety Act) requires additional verification of pipeline infrastructure records by pipeline owners and operators to confirm the maximum allowable operating pressure of lines located in high consequence areas or more-densely populated areas. In April 2016, the PHMSA released proposed rules that address this verification requirement along with a number of other significant changes to gas transmission regulations. These changes include requirements around use of automatic or remote-controlled shut-off valves, testing of certain previously untested transmission lines and expanding integrity management requirements. The Pipeline Safety Act also includes a maximum penalty for violating pipeline safety rules of $2 million per day for related violations.
PHMSA is currently working through the rule with its Pipeline Advisory Committee. Current estimates are the rule will likely go into effect in late 2018 or early 2019.
Xcel Energy has been taking actions that were intended to comply with the Pipeline Safety Act and any related PHMSA regulations as they become effective. PSCo and NSP-Minnesota can generally recover costs to comply with the transmission and distribution integrity management programs through the PSIA and GUIC riders, respectively.
NSP-Minnesota
Public Utility Regulation
Summary of Regulatory Agencies and Areas of Jurisdiction— Retail rates, services and other aspects of NSP-Minnesota’s retail natural gas operations are regulated by the MPUC and the NDPSC within their respective states. The MPUC has regulatory authority over security issuances, certain property transfers, mergers with other utilities and transactions between NSP-Minnesota and its affiliates. In addition, the MPUC reviews and approves NSP-Minnesota’s natural gas supply plans for meeting customers’ future energy needs. NSP-Minnesota is subject to the jurisdiction of the FERC with respect to certain natural gas transactions in interstate commerce. NSP-Minnesota is subject to the DOT, the Minnesota Office of Pipeline Safety, the NDPSC and the SDPUC for pipeline safety compliance, including pipeline facilities used in electric utility operations for fuel deliveries.
Purchased Gas and Conservation Cost-Recovery Mechanisms— NSP-Minnesota’s retail natural gas rates for Minnesota and North Dakota include a PGA clause that provides for prospective monthly rate adjustments to reflect the forecasted cost of purchased natural gas, transportation service and storage service. The annual difference between the natural gas cost revenues collected through PGA rates and the actual natural gas costs is collected or refunded over the subsequent 12-month period.
NSP-Minnesota also recovers costs associated with transmission and distribution pipeline integrity management programs through its GUIC rider. Costs recoverable under the GUIC rider include funding for pipeline assessments as well as deferred costs from NSP-Minnesota’s existing sewer separation and pipeline integrity management programs. The MPUC and NDPSC have the authority to disallow recovery of certain costs if they find the utility was not prudent in its procurement activities.
Minnesota state law requires utilities to invest 0.5 percent of their state natural gas revenues in CIP. These costs are recovered through customer base rates and an annual cost-recovery mechanism for the CIP expenditures.
Capability and Demand
Natural gas supply requirements are categorized as firm or interruptible (customers with an alternate energy supply). The maximum
Maximum daily send-outoutput (firm and interruptible) for NSP-Minnesota was 893,062 MMBtu, which occurred on Dec. 26, 2017 and 800,232 MMBtu, which occurred on Jan. 18, 2016.occurrence date:
| | | | | | | | | | | | | | | | | | | | | | | | | | |
| | 2021 | | 2020 |
| Utility Subsidiary | | MMBtu | | Date (a) | | MMBtu | | Date |
| NSP-Minnesota | | 899,133 | | | Feb. 11 | | 871,921 | | | Jan. 16 |
| NSP-Wisconsin | | 167,656 | | | Feb. 11 | | 150,320 | | | Dec. 24 |
| PSCo | | 2,316,283 | | | Feb. 14 | | 1,931,888 | | | Feb. 4 |
NSP-Minnesota purchases natural gas from independent suppliers, generally based on market indices that reflect current prices. The natural gas is delivered under transportation agreements with interstate pipelines. These agreements provide for firm deliverable pipeline capacity(a)Reflective of 640,489 MMBtu per day. In addition, NSP-Minnesota contracts with providers of underground natural gas storage services. These agreements provide storage for approximately 26 percent of winter natural gas requirements and 29 percent of peak day firm requirements of NSP-Minnesota.Winter Storm Uri.
NSP-Minnesota also owns and operates one LNG plant with a storage capacity of 2.0 Bcf equivalent and three propane-air plants with a storage capacity of 1.3 Bcf equivalent to help meet its peak requirements. These peak-shaving facilities have production capacity equivalent to 246,000 MMBtu of natural gas per day, or approximately 30 percent of peak day firm requirements. LNG and propane-air plants provide a cost-effective alternative to annual fixed pipeline transportation charges to meet the peaks caused by firm space heating demand on extremely cold winter days.
NSP-Minnesota is required to file for a change in natural gas supply contract levels to meet peak demand, to redistribute demand costs among classes, or to exchange one form of demand for another. In February 2017, the MPUC approved NSP-Minnesota’s contract demand levels for the 2016 through 2017 heating season. Demand levels for the 2017 through 2018 heating season were filed with the MPUC in August 2017.
Natural Gas Supply and CostsCost
NSP-Minnesota activelyXcel Energy seeks natural gas supply, transportation and storage alternatives to yield a diversified portfolio, that provides increasedwhich increase flexibility, decreaseddecrease interruption, financial risks and financial risk and economicalcustomer rates. In addition, NSP-Minnesota conductsthe utility subsidiaries conduct natural gas price hedging activity that has beenactivities approved by the MPUC.their states’ commissions.
The following table summarizes the averageAverage delivered cost per MMBtu of natural gas purchased for resale by NSP-Minnesota’s regulated retail natural gas distribution business:distribution:
| | | | | | | | | | | | | | |
| Utility Subsidiary | | 2021 (a) | | 2020 |
| NSP-Minnesota | | $ | 7.48 | | | $ | 3.32 | |
| NSP-Wisconsin | | 7.11 | | | 3.08 | |
| PSCo | | 6.06 | | | 2.52 | |
(a)Reflective of Winter Storm Uri.
|
| | | |
| 2017 | $ | 3.89 |
|
| 2016 | 3.47 |
|
| 2015 | 4.07 |
|
The cost of natural gas in 2017 increased due to higher wholesale commodity prices.
NSP-Minnesota, has firm natural gas transportation contracts with several pipelines, which expire in various years from 2018 through 2033.
NSP-Minnesota has certainNSP-Wisconsin and PSCo have natural gas supply transportation and storage agreements that include obligations for the purchase and/or delivery of specified volumes of natural gas or to make payments in lieu of delivery. At Dec. 31, 2017, NSP-Minnesota was committed
General Economic Conditions
Economic conditions may have a material impact on Xcel Energy’s operating results. Management cannot predict the impact of fluctuating energy prices, pandemics, terrorist activity, war or the threat of war. We could experience a material impact to approximately $439 millionour results of operations, future growth or ability to raise capital resulting from a sustained general slowdown in such obligations under these contracts.
NSP-Minnesota purchases firm natural gas supply utilizing long-term and short-term agreements from approximately 27 domestic and Canadian suppliers. This diversity of suppliers and contract lengths allows NSP-Minnesota to maintain competition from suppliers and minimize supply costs.
See Items 1A and 7 for further discussion of natural gas supply and costs.
NSP-Wisconsin
Public Utility Regulation
Summary of Regulatory Agencies and Areas of Jurisdiction— NSP-Wisconsin is regulated by the PSCW and the MPSC. The PSCW haseconomic growth or a biennial base-rate filing requirement. By June of each odd-numbered year, NSP-Wisconsin must submit a rate filing for the test year period beginning the following January. NSP-Wisconsin is subject to the jurisdiction of the FERC with respect to certain natural gas transactionssignificant increase in interstate commerce. NSP-Wisconsin is subject to the DOT, the PSCW and the MPSC for pipeline safety compliance.
Natural Gas Cost-Recovery Mechanisms— NSP-Wisconsin has a retail PGA cost-recovery mechanism for Wisconsin operations to recover the actual cost of natural gas and transportation and storage services. The PSCW has the authority to disallow certain costs if it finds NSP-Wisconsin was not prudent in its procurement activities.
NSP-Wisconsin’s natural gas rate schedules for Michigan customers include a natural gas cost-recovery factor, which is based on 12-month projections and trued-up to the actual amounts on an annual basis.
Capability and Demand
Natural gas supply requirements are categorized as firminterest rates or interruptible (customers with an alternate energy supply). The maximum daily send-out (firm and interruptible) for NSP-Wisconsin was 160,170 MMBtu, which occurred on Dec. 26, 2017 and 155,583 MMBtu, which occurred on Jan. 18, 2016.
NSP-Wisconsin purchases natural gas from independent suppliers, generally based on market indices that reflect current prices. The natural gas is delivered under transportation agreements with interstate pipelines. These agreements provide for firm deliverable pipeline capacity of approximately 139,293 MMBtu per day. In addition, NSP-Wisconsin contracts with providers of underground natural gas storage services. These agreements provide storage for approximately 33 percent of winter natural gas requirements and 34 percent of peak day firm requirements of NSP-Wisconsin.
NSP-Wisconsin also owns and operates one LNG plant with a storage capacity of 270,000 Mcf equivalent to help meet its peak requirements. This peak-shaving facility has a production capacity equivalent to 18,000 MMBtu of natural gas per day, or approximately 12 percent of peak day firm requirements. LNG plants provide a cost-effective alternative to annual fixed pipeline transportation charges to meet the peaks caused by firm space heating demand on extremely cold winter days.
NSP-Wisconsin is required to file a natural gas supply plan with the PSCW annually to change natural gas supply contract levels to meet peak demand. NSP-Wisconsin’s winter 2017-2018 supply plan was approved by the PSCW in October 2017.
Natural Gas Supply and Costs
NSP-Wisconsin actively seeks natural gas supply, transportation and storage alternatives to yield a diversified portfolio that provides increased flexibility, decreased interruption and financial risk and economical rates. In addition, NSP-Wisconsin conducts natural gas price hedging activity that has been approved by the PSCW.
The following table summarizes the average delivered cost per MMBtu of natural gas purchased for resale by NSP-Wisconsin’s regulated retail natural gas distribution business:
|
| | | |
| 2017 | $ | 3.88 |
|
| 2016 | 3.62 |
|
| 2015 | 4.11 |
|
The cost of natural gas in 2017 increased due to higher commodity prices.
The cost of natural gas supply, transportation service and storage service is recovered through various cost-recovery adjustment mechanisms. NSP-Wisconsin has firm natural gas transportation contracts with several pipelines, which expire in various years from 2018 through 2029.
NSP-Wisconsin has certain natural gas supply, transportation and storage agreements that include obligations for the purchase and/or delivery of specified volumes of natural gas or to make payments in lieu of delivery. At Dec. 31, 2017, NSP-Wisconsin was committed to approximately $84 million in such obligations under these contracts.
NSP-Wisconsin purchased firm natural gas supply utilizing long-term and short-term agreements from approximately 10 domestic and Canadian suppliers. This diversity of suppliers and contract lengths allows NSP-Wisconsin to maintain competition from suppliers and minimize supply costs.
See Items 1A and 7 for further discussion of natural gas supply and costs.
PSCo
Public Utility Regulation
Summary of Regulatory Agencies and Areas of Jurisdiction— PSCo is regulated by the CPUC with respect to its facilities, rates, accounts, services and issuance of securities. PSCo holds a FERC certificate that allows it to transport natural gas in interstate commerce without PSCo becoming subject to full FERC jurisdiction under the Federal Natural Gas Act. PSCo is subject to the DOT and the CPUC with regards to pipeline safety compliance.
Purchased Natural Gas and Conservation Cost-Recovery Mechanisms— PSCo has retail adjustment clauses that recover purchased natural gas and other resource costs:
GCA — Recovers the actual costs of purchased natural gas and transportation to meet the requirements of its customers and is revised quarterly to allow for changes in natural gas rates.
DSMCA — Recovers costs of DSM and performance initiatives to achieve various energy savings goals.
PSIA — Recovers costs associated with transmission and distribution pipeline integrity management programs and two projects to replace large transmission pipelines.
Capability and Demand
Natural gas supply requirements are categorized as firm or interruptible (customers with an alternate energy supply). The maximum daily send-out (firm and interruptible) for PSCo was 1,948,167 MMBtu, which occurred on Jan. 5, 2017 and 1,932,070 MMBtu, which occurred on Dec. 17, 2016.
PSCo purchases natural gas from independent suppliers, generally based on market indices that reflect current prices. The natural gas is delivered under transportation agreements with interstate pipelines. These agreements provide for firm deliverable pipeline capacity of approximately 1,818,151 MMBtu per day, which includes 854,852 MMBtu of natural gas held under third-party underground storage agreements. In addition, PSCo operates three company-owned underground storage facilities, which provide approximately 43,500 MMBtu of natural gas supplies on a peak day. The balance of the quantities required to meet firm peak day sales obligations are primarily purchased at PSCo’s city gate meter stations.
PSCo is required by CPUC regulations to file a natural gas purchase plan each year projecting and describing the quantities of natural gas supplies, upstream services and the costs of those supplies and services for the 12-month period of the following year. PSCo is also required to file a natural gas purchase report by October of each year reporting actual quantities and costs incurred for natural gas supplies and upstream services for the previous 12-month period.
Natural Gas Supply and Costs
PSCo actively seeks natural gas supply, transportation and storage alternatives to yield a diversified portfolio that provides increased flexibility, decreased interruption and financial risk and economical rates. In addition, PSCo conducts natural gas price hedging activities that have been approved by the CPUC.
The following table summarizes the average delivered cost per MMBtu of natural gas purchased for resale by PSCo’s regulated retail natural gas distribution business:
|
| | | |
| 2017 | $ | 3.45 |
|
| 2016 | 3.27 |
|
| 2015 | 3.92 |
|
The cost of natural gas in 2017 increased due to higher wholesale commodity prices.
PSCo has natural gas supply, transportation and storage agreements that include obligations for the purchase and/or delivery of specified volumes of natural gas or to make payments in lieu of delivery. At Dec. 31, 2017, PSCo was committed to approximately $1.4 billion in such obligations under these contracts, which expire in various years from 2018 through 2029.
PSCo purchases natural gas by optimizing a balance of long-term and short-term natural gas purchases, firm transportation and natural gas storage contracts. During 2017, PSCo purchased natural gas from approximately 31 suppliers.
See Items 1A and 7 for further discussion of natural gas supply and costs.
SPS
Natural Gas Facilities Used for Electric Generation
SPS does not provide retail natural gas service, but purchases and transports natural gas for certain of its generation facilities and operates natural gas pipeline facilities connecting the generation facilities to interstate natural gas pipelines. SPS is subject to the jurisdiction of the FERC with respect to certain natural gas transactions in interstate commerce, and to the jurisdiction of the PHMSA and the PUCT for pipeline safety compliance.
See Items 1A and 7 for further discussion of natural gas supply and costs.
Natural Gas Operating Statistics
|
| | | | | | | | | | | |
| | Year Ended Dec. 31 |
| | 2017 | | 2016 | | 2015 |
| Natural gas deliveries (Thousands of MMBtu) | | | | | |
| Residential | 134,189 |
| | 132,853 |
| | 135,394 |
|
| C&I | 87,271 |
| | 84,082 |
| | 86,093 |
|
| Total retail | 221,460 |
| | 216,935 |
| | 221,487 |
|
| Transportation and other | 142,497 |
| | 133,498 |
| | 125,263 |
|
| Total deliveries | 363,957 |
| | 350,433 |
| | 346,750 |
|
| | | | | | |
| Number of customers at end of period | | | | | |
| Residential | 1,856,221 |
| | 1,835,507 |
| | 1,814,321 |
|
| C&I | 157,798 |
| | 157,286 |
| | 156,306 |
|
| Total retail | 2,014,019 |
| | 1,992,793 |
| | 1,970,627 |
|
| Transportation and other | 7,705 |
| | 7,316 |
| | 6,981 |
|
| Total customers | 2,021,724 |
| | 2,000,109 |
| | 1,977,608 |
|
| | | | | | |
| Natural gas revenues (Millions of Dollars) | | | | | |
| Residential | $ | 1,006 |
| | $ | 930 |
| | $ | 1,043 |
|
| C&I | 524 |
| | 469 |
| | 547 |
|
| Total retail | 1,530 |
| | 1,399 |
| | 1,590 |
|
| Transportation and other | 120 |
| | 132 |
| | 82 |
|
| Total natural gas revenues | $ | 1,650 |
| | $ | 1,531 |
| | $ | 1,672 |
|
| | | | | | |
| MMBtu sales per retail customer | 109.96 |
| | 108.86 |
| | 112.39 |
|
| Revenue per retail customer | $ | 760 |
| | $ | 702 |
| | $ | 807 |
|
| Residential revenue per MMBtu | 7.50 |
| | 7.00 |
| | 7.70 |
|
| C&I revenue per MMBtu | 6.00 |
| | 5.58 |
| | 6.36 |
|
| Transportation and other revenue per MMBtu | 0.84 |
| | 0.99 |
| | 0.65 |
|
GENERAL
inflation.
Seasonality
The demandDemand for electric power and natural gas is affected by seasonal differences in the weather. In general, peak sales of electricity occur in the summer months and peak sales of natural gas occur in the winter months. As a result, the overall operating results may fluctuate substantially on a seasonal basis. Additionally, Xcel Energy’s operations have historically generated less revenues and income when weather conditions are milder in the winter and cooler in the summer. See Item 7 for further discussion.
Competition
Xcel Energy is a vertically integrated utility in all of its jurisdictions, subject to traditional cost-of-service regulation by state public utilities commissions. However, Xcel Energy is subject to different public policies that promote competition and the development of energy markets. Xcel Energy’s industrial and large commercial customers have the ability to own or operate facilities to generate their own electricity. In addition, customers may have the option of substituting other fuels such as natural gas, steam or chilled water for heating, cooling and manufacturing purposes, or the option of relocating their facilities to a lower cost region.
Customers also have the opportunity to supply their own power with distributed generation including solar generation and in most jurisdictions can currently avoid paying for most of the fixed production, transmission and distribution costs incurred to serve them.
Several states have policies designed to promoteincentives for the development of rooftop solar, community solar gardens and other distributed energy resources through significant incentive policies; with these incentives and federal tax subsidies, distributedresources. Distributed generating resources are potential competitors to Xcel Energy’s electric service business.
business with these incentives and federal tax subsidies.
The FERC has continued to promote competitive wholesale markets through open access transmission and other means. As a result, Xcel Energy Inc.’s utility subsidiaries and theirEnergy’s wholesale customers can purchase thetheir output from generation resources of competing wholesale suppliers or non-contracted quantities and use the transmission systems of the utility subsidiaries on a comparable basis to serve their native load.
In addition, FERC Order No. 1000 seeks to establishestablished competition for construction and operationownership of certain new electric transmission facilities. State public utilities commissionsfacilities under Federal regulations. Some states have createdstate laws that allow the incumbent a Right of First Refusal to own these transmission facilities.
FERC Order 2222 requires that RTO and ISO markets allow participation of aggregations of distributed energy resources. This order is expected to incentivize distributed energy resource planning programs that promote competition inadoption, however implementation is expected to vary by RTO/ISO and the acquisitionnear, medium, and long-term impacts of electricity generation resources used to provide service to retail customers. Order 2222 remain unclear.
Xcel Energy Inc.’s utility subsidiaries also have franchise agreements with certain cities subject to periodic renewal. Ifrenewal; however, a city elected not to renew the franchise agreement, it could seek alternative means for its citizens to access electric power or gas, such as municipalization.
While each of Xcel Energy Inc.’s utility subsidiariessubsidiary faces these challenges, Xcel Energy believes their rates and services are competitive with alternatives currently available alternatives.available.
ENVIRONMENTAL MATTERSPublic Utility Regulation
See Item 7 for discussion of public utility regulation.
Xcel Energy’sEnvironmental Regulation
Our facilities are regulated by federal and state environmental agencies. These agencies that have jurisdiction over air emissions, water quality, wastewater discharges, solid wastes and hazardous wastes or substances. Various companyCertain Xcel Energy activities require registrations, permits, licenses, inspections and approvals from these agencies.
Xcel Energy has received all necessary authorizations for the construction and continued operation of its generation, transmission and distribution systems. Xcel Energy’sOur facilities have been designed and constructedstrive to operate in compliance with applicable environmental standards. standards and related monitoring and reporting requirements.
However, it is not possible to determine when or to what extent additional facilities or modifications of existing or planned facilities will be required as a result of changes to environmental regulations, interpretations or enforcement policies or what effect future laws or regulations may have upon have. We may be required to incur expenditures in the future for remediation of MGP and other sites.
Xcel Energy’s operations. See Item 7Energy must comply with emission levels in Minnesota, Texas and Notes 12 and 13Wisconsin that may require the purchase of emission allowances. The Denver North Front Range Non-attainment Area does not meet the ozone NAAQS. Colorado will continue to consider further reductions available in the consolidated financial statements fornon-attainment area as it develops plans to meet ozone standards. Natural gas plants which operate in PSCo’s non-attainment area may be required to improve or add controls, implement further discussion.work practices and/or enhanced emissions monitoring as part of future Colorado state plans.
There are significant present and future environmental regulations to encourage the use of clean energy technologies and regulate emissions of GHGs to address climate change. Xcel Energy hasGHGs. We have undertaken a number ofnumerous initiatives to meet current requirements and prepare for potential future regulations, reduce GHG emissions and respond to state renewable and energy efficiency goals. If these futureFuture environmental regulations do not provide creditmay result in substantial costs.
In July 2019, the EPA adopted the Affordable Clean Energy rule, which requires states to develop plans by 2022 for GHG reductions from coal-fired power plants. In January 2021, the U.S. Court of Appeals for the investments we have already madeD.C. Circuit issued a decision vacating and remanding the Affordable Clean Energy rule. That decision would allow the EPA to reduceproceed with alternate regulation of coal-fired power plants. However, the Court of Appeals decision is now before the U.S. Supreme Court, where the Court is expected to rule on the nature and extent of the EPA’s GHG emissions, or if theyregulatory authority. If any new rules require additional initiatives or emission reductions, then their requirements would potentially impose additional substantial costs.investment, Xcel Energy believes that the cost of these initiatives or replacement generation would be recoverable through rates based on prior state commission practice, it would recoverpractices.
In October 2020, the costTCEQ approved an agreement that SPS will convert the Harrington plant from coal to natural gas by Jan. 1, 2025. This conversion is necessary to attain Federal Clean Air Act standards for emissions of these initiatives through rates.
SO2.
Xcel Energy is committedseeks to addressingaddress climate change and potential climate change regulation through efforts to reduce its GHG emissions in a balanced, cost-effective manner. Starting
Emerging Environmental Regulation
New regulations and legislation are being considered to regulate PFAS in 2011,drinking water, water discharges, commercial products, wastes, and other areas. PFAS are man-made chemicals found in many consumer products that can persist and accumulate in the environment. These chemicals have received heightened attention from environmental regulators. Increased regulation of PFAS and other emerging contaminants at the federal, state, and local level could have a potential adverse effect on our operations but at this time, it is uncertain what impact, if any, there will be on our operations, financial condition or cash flows. Xcel Energy began reporting GHG emissionswill continue to monitor these regulatory developments and their potential impact on its operations.
Environmental Costs
Environmental costs include amounts for nuclear plant decommissioning and payments for storage of spent nuclear fuel, disposal of hazardous materials and waste, remediation of contaminated sites, monitoring of discharges to the EPAenvironment and compliance with laws and permits with respect to emissions.
Costs charged to operating expenses for nuclear decommissioning, spent nuclear fuel disposal, environmental monitoring and remediation and disposal of hazardous materials and waste were approximately:
•$365 million in 2021.
•$400 million in 2020.
•$345 million in 2019.
Average annual expense of approximately $425 million from 2022 – 2026 is estimated for similar costs. The precise timing and amount of environmental costs, including those for site remediation and disposal of hazardous materials, are unknown. Additionally, the extent to which environmental costs will be included in and recovered through rates may fluctuate.
Capital expenditures for environmental improvements were approximately:
•$60 million in 2021.
•$30 million in 2020.
•$30 million in 2019.
Other
Our operations are subject to workplace safety standards under the EPA’s mandatory GHG Reporting Program.Federal Occupational Safety and Health Act of 1970 (“OSHA”) and comparable state laws that regulate the protection of worker health and safety. In addition, the Company is subject to other government regulations impacting such matters as labor, competition, data privacy, etc. Based on information to date and because our policies and business practices are designed to comply with all applicable laws, we do not believe the effects of compliance on our operations, financial condition or cash flows are material.
Xcel Energy estimates that in 2017, it reduced the CO2 emissions associated with the electric generating resources used to serve its customers by 35 percent from 2005 levels. This reduction accounts for emissions both from electric generating plants owned by Xcel Energy as well as purchased power. To achieve this goal, Xcel Energy primarily relied on strategies that resulted in:
Development of renewable energy facilities;
Retirement and replacement of existing generating plants; and
Customer energy efficiency programs.
CAPITAL SPENDING AND FINANCING
| | |
| Capital Spending and Financing |
See Item 7 for a discussion of expected capital expenditures and funding sources.
EMPLOYEES
As of Dec. 31, 2017, Xcel Energy had 11,075 full-time employees and 59 part-time employees, of which 5,115 were covered under collective-bargaining agreements. See Note 9 to the consolidated financial statements for further discussion.
| | | | | | | | | | | | | | | | | | | | |
Executive Officers (a) |
| Name | | Age(b) | | Current and Recent Positions | | Time in Position |
| | | | | | |
| | | | |
EXECUTIVE OFFICERS (a)
| |
Name | | Age (b)
| | Current and Recent Positions Held | | |
Ben FowkeRobert C. Frenzel | | 5951 | | Chairman of the Board of Directors, Xcel Energy Inc. | | December 2021 — Present |
| | | | President and Chief Executive Officer and Director, Xcel Energy Inc., | | August 2011 to present. 2021 — Present |
| | | | Chief Executive Officer, NSP-Minnesota, NSP-Wisconsin, PSCo, and SPS January 2015 to present. Previously, | | August 2021 — Present |
| | | | President and Chief Operating Officer, Xcel Energy Inc., | | March 2020 — August 2009 to August 2011.2021 |
Christopher B. Clark | | 51 | | President and Director, NSP-Minnesota, January 2015 to present. Previously, Regional Vice President, Rates and Regulatory Affairs, NSP-Minnesota, October 2012 to December 2014; Managing Director, Government and Regulatory Affairs, NSP-Minnesota, January 2012 to October 2012; Managing Attorney, Xcel Energy Inc., November 2007 to January 2012. |
David L. Eves | | 59 | | President and Director, PSCo, January 2015 to present. Previously, President, Director and Chief Executive Officer, PSCo, December 2009 to December 2014. Effective March 1, 2018 he will serve as Executive Vice President and Group President, Utilities. |
Robert C. Frenzel | | 47 | | Executive Vice President, Chief Financial Officer, Xcel Energy Inc., | | May 2016 to present. Previously, — March 2020 |
| | | | Senior Vice President and Chief Financial Officer, Luminant, a subsidiary of Energy Future Holdings Corp., an electric utility and power generation company, (c) | | February 2012 to— April 2016; Senior Vice President for Corporate Development, Strategy and Mergers and Acquisitions, Energy Future Holdings Corp., February 2009 to February 2012. In April 2014, Energy Future Holdings Corp., the majority of its subsidiaries, including Texas Competitive Energy Holdings (TCEH) the parent company of Luminant, filed a voluntary bankruptcy petition under Chapter 11 of the United States Bankruptcy Code. TCEH emerged from Chapter 11 in October 2016. 2016 |
David T. HudsonBrett C. Carter (d) | | 5755 | | President and Director, SPS, January 2015 to present. Previously, President, Director and Chief Executive Officer, SPS, January 2014 to December 2014; Director, Community Service & Economic Development, SPS, April 2011 to January 2014; Director, Strategic Planning, SPS, May 2008 to April 2011. |
Kent T. Larson | | 58 | | Executive Vice President and Group President Operations, Xcel Energy Inc., January 2015 to present. Previously, Senior Vice President, Group President Operations, Xcel Energy Services Inc., August 2014 to December 2014; Senior Vice President Operations, Xcel Energy Services Inc., September 2011 to August 2014; Chief Energy Supply Officer, Xcel Energy Services Inc., March 2010 to September 2011. |
Marvin E. McDaniel, Jr. | | 58 | | Executive Vice President, Group President, Utilities, and Chief Administrative Officer, Xcel Energy Inc., January 2015 to present. Previously, Senior Vice President, Chief Administrative Officer, Xcel Energy Inc., August 2012 to December 2014; Senior Vice President and Chief Administrative Officer, Xcel Energy Services Inc., September 2011 to August 2012; Vice President and Chief Administrative Officer, Xcel Energy Services Inc., August 2009 to September 2011 and Vice President, Talent and Technology Business Areas, Xcel Energy Services Inc., August 2009 to September 2011. Xcel Energy has previously announced that Marvin E. McDaniel, Jr. will retire in 2018. Effective March 1, 2018 he will serve as Executive Vice President and Chief Administrative Officer.Customer and Innovation Officer, Xcel Energy Inc. | | May 2018 — Present |
| | | | Senior Vice President and Shared Services Executive, Bank of America, an institutional investment bank and financial services company | | October 2015 — May 2018 |
| Patricia Correa | | 48 | | Senior Vice President, Chief Human Resources Officer, Xcel Energy Inc. | | February 2022 — Present |
| | | | Senior Vice President, Human Resources, Eaton Corporation, a power management company | | July 2019 — January 2022 |
| | | | Vice President, Human Resources, Eaton Corporation | | March 2016 — July 2019 |
| | | | Senior Director, Talent & Organization Development, Kellogg Company, a food manufacturing company | | July 2015 — March 2016 |
| Timothy O’Connor | | 5862 | | Executive Vice President, Chief Operations Officer, Xcel Energy Inc. | | August 2021 — Present |
| | | | Executive Vice President, Chief Generation Officer, Xcel Energy Inc. | | March 2020 — August 2021 |
| | | | Senior Vice President, Chief Nuclear Officer, Xcel Energy Services Inc., Inc | | February 2013 to present. Previously, Acting Chief Nuclear Officer, NSP-Minnesota, September 2012 to February 2013; Vice President, Engineering and Nuclear Regulatory Compliance and Licensing July 2012 to September 2012; Monticello Site Vice President, May 2007 to July 2012.— March 2020 |
Judy M. PoferlFrank Prager | | 5859 | | Senior Vice President, Corporate SecretaryStrategy, Planning and Executive Services,External Affairs, Xcel Energy Inc., January 2015 to present. Previously, | | March 2020 — Present |
| | | | Vice President, Corporate Secretary, Xcel Energy Inc., May 2013 to December 2014; President, DirectorPolicy and Chief Executive Officer, NSP-Minnesota, August 2009 to May 2013. |
Jeffrey S. Savage | | 46 | | Senior Vice President, Controller, Xcel Energy Inc., January 2015 to present. Previously, Vice President, Controller, Xcel Energy Inc., September 2011 to December 2014; Senior Director, Financial Reporting, Corporate and Technical Accounting,Federal Affairs, Xcel Energy Services Inc., December 2009 to September 2011. | | January 2015 — March 2020 |
Mark E. StoeringAmanda Rome | | 5741 | | President and Director, NSP-Wisconsin, January 2015 to present. Previously, President, Director and Chief Executive Officer, NSP-Wisconsin, January 2012 to December 2014; Vice President, Portfolio Strategy and Business Development, Xcel Energy Services Inc., August 2000 to December 2011. |
Scott M. Wilensky | | 61 | | Executive Vice President, General Counsel, Xcel Energy Inc., January 2015 to present. Previously, Senior | | June 2020 — Present |
| | | | Vice President and Deputy General Counsel, Xcel Energy Services Inc., September 2011 to December 2014; Vice President, Regulatory and Resource Planning, | | October 2019 — June 2020 |
| | | | Managing Attorney, Xcel Energy Services Inc., | | July 2018 — October 2019 |
| | | | Rotational Position, Xcel Energy Services Inc. | | January 2018 — July 2018 |
| | | | Lead Assistant General Counsel, Xcel Energy Services Inc. | | July 2015 — January 2018 |
Jeffrey S. Savage (e) | | 50 | | Senior Vice President, Controller, Xcel Energy Inc. | | January 2015 — Present |
| Brian J. Van Abel | | 40 | | Executive Vice President, Chief Financial Officer, Xcel Energy Inc. | | March 2020 — Present |
| | | | Senior Vice President, Finance and Corporate Development, Xcel Energy Services Inc. | | September 2009 to2018 — March 2020 |
| | | | Vice President, Treasurer, Xcel Energy Services Inc. | | July 2015 — September 2011.2018 |
(a)No family relationships exist between any of the executive officers or directors.
(b)Ages as of Dec. 31, 2017.Feb. 23, 2022.
(c)In April 2014, Energy Future Holdings Corp., the majority of its subsidiaries, including Texas Competitive Energy Holdings the parent company of Luminant, filed a voluntary bankruptcy petition under Chapter 11 of the United States Bankruptcy Code. Texas Competitive Energy Holdings emerged from Chapter 11 in October 2016.
Item 1A — Risk Factors(d)Effective March 1, 2022, Mr. Carter will assume the role of Executive Vice President, Group President, Utilities, and Chief Customer Officer.
(e)Effective March 1, 2022, Mr. Savage will assume the role of Chief Audit and Financial Services Officer and will no longer be serving as an executive officer.
Xcel Energy is subject to a variety of risks, many of which are beyond our control. Important risksRisks that may adversely affect the business, financial condition, and results of operations or cash flows are further described below. Although the risks are organized by heading, and each risk is described separately, many of the risks are interrelated. These risks should be carefully considered together with the other information set forth in this report and in future reports that Xcel Energy fileswe file with the SEC. You should not interpret the disclosure of any risk factor to imply that the risk has not already materialized.
While we believe we have identified and discussed below the key risk factors affecting our business, there may be additional risks and uncertainties that are not presently known or that are not currently believed to be significant that may adversely affect our business, financial condition, results of operations or cash flows in the future.
Oversight of Risk and Related Processes
A key accountability of theThe Board of Directors is responsible for the oversight of material risk and our Board of Directors employsmaintaining an effective process for doing so.risk monitoring process. Management and eachthe Board of Directors’ committeecommittees have responsibility for overseeing the identification and mitigation of key risks and reporting its assessments and activities to the full Board of Directors.
Xcel Energy maintains a robust compliance program and promotes a culture of compliance beginning with the tone at the top. The risk mitigation process includes adherence to our code of conduct and compliance policies, operation of formal risk management structures and overall business management. Xcel Energy further mitigates inherent risks through formal risk committees and corporate functions such as internal audit, and internal controls over financial reporting and legal.
Management identifies and analyzes risks to determine materiality and other attributes such as timing, probability and controllability. Management broadly considers our business, the utility industry, the domesticIdentification and global economies and the environment when identifying, assessing, managing and mitigating risk. Identification andrisk analysis occurs formally through a key risk assessment process conducted by senior management, the financial disclosure process, the hazard risk management process andprocedures, internal auditingaudit and compliance with financial and operational controls.
Management also identifies and analyzes risk through itsthe business planning process, and development of goals and establishment of key performance indicators, which include riskincluding identification to determineof barriers to implementing Xcel Energy’s strategy. The business planning process also identifies areas in which there is a potential for a business arealikelihood and mitigating factors to takeprevent the assumption of inappropriate risk to meet goals, and determines how to prevent inappropriate risk-taking.
At a threshold level, Xcel Energy has developed a robust compliance program and promotes a culture of compliance, including tone at the top, which mitigates risk. The process for risk mitigation includes adherence to our code of conduct and other compliance policies, operation of formal risk management structures and groups and overall business management to mitigate the risks inherent in the implementation of strategy. Building on this culture of compliance, Xcel Energy manages and further mitigates risks through operation of formal risk management structures and groups, including management councils, risk committees and the services of internal corporate areas such as internal audit, the corporate controller and legal services.
goals.
Management communicates regularly with the Board of Directors and key stakeholders regarding risk. Senior management presents and communicates a periodic risk assessment of key risks to the Board of Directors. The presentation and the discussion of the key risks provides the Board of Directors, withproviding information on the risks that management believes are material, including the earningsfinancial impact, timing, likelihood and controllability. Management also provides information to the Board of Directors in presentations and communications over the course of the year.
mitigating factors. The Board of Directors approaches oversight, management and mitigation of risk as an integral and continuous part of its governance of Xcel Energy. First, the Board of Directors regularly reviews management’s key risk assessment and analyzesassessments, which includes areas of existing and future risksmacroeconomic, financial, operational, policy, environmental and opportunities. In addition,security risks.
The oversight, management and mitigation of risk is an integral and continuous part of the Board of Directors’ governance of Xcel Energy. The Board of Directors assigns oversight of certain critical risks to each of its four standing committees to ensure these risks are well understood and are given focused oversight by the appropriate committee. focus.
The Audit Committee is responsible for reviewing the adequacy of the committee’s risk oversight and affirming that appropriate aggregate oversight occurs. New risks are considered and assigned as appropriate during the annual Board of Directors’ and committee evaluation process, and committee charters and annual work plans are updated accordingly. Committees regularly report on their oversight activities and certain risk issues may be brought to the full Board of Directors for consideration wherewhen deemed appropriate.
New risks are considered and assigned as appropriate to ensure broadduring the annual Board of Directors’ understanding ofDirectors and committee evaluation process, resulting in updates to the nature of the risk. Finally,committee charters and annual work plans. Additionally, the Board of Directors conducts an annual strategy session where Xcel Energy’s future plans and initiatives are reviewed.
Risks Associated with Our Business
EnvironmentalOperational Risks
We are subject to environmental lawsOur natural gas and regulations, with which compliance could be difficultelectric generation/transmission and costly.
We are subject to environmental laws and regulationsdistribution operations involve numerous risks that affect many aspects of our past, present and future operations, including air emissions, water quality, wastewater discharges and the generation, transport and disposal of solid wastes and hazardous substances. These laws and regulations require us to obtain permits, licenses, and other approvals and to comply with a wide variety of environmental requirements including those for protected natural and cultural resources (such as wetlands, endangered species and other protected wildlife, and archaeological and historical resources). Environmental laws and regulations can also require us to restrict or limit the output of certain facilities or the use of certain fuels, shift generation to lower-emitting, but potentially more costly facilities, install pollution control equipment at our facilities, clean up spills and other contamination and correct environmental hazards. Environmental regulations may also lead to shutdown of existing facilities, either due to the difficulty in assuring compliance or that the costs of compliance makes operation of the units no longer economical. Both public officials and private individuals may seek to enforce the applicable environmental laws and regulations against us. We may be required to pay all or a portion of the cost to remediate (i.e., clean-up) sites where our past activities, or the activities of certain other parties, caused environmental contamination.
We are also subject to mandates to provide customers with clean energy, renewable energy and energy conservation offerings. Failure to meet the requirements of these mandates may result in finesaccidents and other operating risks and costs.
Our natural gas transmission and distribution activities include inherent hazards and operating risks, such as leaks, explosions, outages and mechanical problems. Our electric generation, transmission and distribution activities include inherent hazards and operating risks such as contact, fire and outages.
These risks could result in loss of life, significant property damage, environmental pollution, impairment of our operations and substantial financial losses to employees, third-party contractors, customers or penalties, whichthe public. We maintain insurance against most, but not all, of these risks and losses.
The occurrence of these events, if not fully covered by insurance, could have a material effect on our financial condition, results of operations and cash flows as well as potential loss of reputation.
Other uncertainties and risks inherent in operating and maintaining Xcel Energy's facilities include, but are not limited to:
•Risks associated with facility start-up operations, such as whether the facility will achieve projected operating performance on schedule and otherwise as planned.
•Failures in the availability, acquisition or transportation of fuel or other necessary supplies.
•The impact of unusual or adverse weather conditions and natural disasters, including, but not limited to, tornadoes, icing events, floods and droughts.
•Performance below expected or contracted levels of output or efficiency (e.g., performance guarantees).
•Availability of replacement equipment.
•Availability of adequate water resources and ability to satisfy water intake and discharge requirements.
•Inability to identify, manage properly or mitigate equipment defects.
•Use of new or unproven technology.
•Risks associated with dependence on a specific type of fuel or fuel source, such as commodity price risk, availability of adequate fuel supply and transportation and lack of available alternative fuel sources.
•Increased competition due to, among other factors, new facilities, excess supply, shifting demand and regulatory changes.
Additionally, compliance with existing and potential new regulations related to the operation and maintenance of our natural gas infrastructure could result in significant costs. The PHMSA is responsible for administering the DOT’s national regulatory program to assure the safe transportation of natural gas, petroleum and other hazardous materials by pipelines. The PHMSA continues to develop regulations and other approaches to risk management to assure safety in design, construction, testing, operation, maintenance and emergency response of natural gas pipeline infrastructure. We have programs in place to comply with these regulations and systematically monitor and renew infrastructure over time, however, a significant incident or material finding of non-compliance could result in penalties and higher costs of operations.
Our natural gas and electric transmission and distribution operations are dependent upon complex information technology systems and network infrastructure, the failure of which could disrupt our normal business operations, which could have a material adverse effect on our ability to process transactions and provide services.
Our utility operations are subject to long-term planning and project risks.
Most electric utility investments are planned to be used for decades. Transmission and generation investments typically have long lead times and are planned well in advance of in-service dates and typically subject to long-term resource plans. These plans are based on numerous assumptions such as: sales growth, customer usage, commodity prices, economic activity, costs, regulatory mechanisms, customer behavior, available technology and public policy. Xcel Energy’s long-term resource plan is dependent on our ability to obtain required approvals, develop necessary technical expertise, allocate and coordinate sufficient resources and adhere to budgets and timelines.
In addition, the long-term nature of both our planning and our asset lives are subject to risk. The electric utility sector is undergoing significant change (e.g., increases in energy efficiency, wider adoption of distributed generation and shifts away from fossil fuel generation to renewable generation). Customer adoption of these technologies and increased energy efficiency could result in excess transmission and generation resources, downward pressure on sales growth, and potentially stranded costs if we are not able to fully recover costs and investments.
The magnitude and timing of resource additions and changes in customer demand may not coincide with evolving customer preference for generation resources and end-uses, which introduces further uncertainty into long-term planning. Efforts to electrify the transportation and building sectors to reduce GHG emissions may result in higher electric demand and lower natural gas demand over time. Higher electric demand may require us to adopt new technologies and make significant transmission and distribution investments including advanced grid infrastructure, which increases exposure to overall grid instability and technology obsolescence. Evolving stakeholder preference for lower emissions from generation sources and end-uses, like heating, may impact our resource mix and put pressure on our ability to recover capital investments in natural gas generation and delivery. Multiple states may not agree as to the appropriate resource mix, which may lead to costs to comply with one jurisdiction that are not recoverable across all jurisdictions served by the same assets.
We are subject to longer-term availability of inputs such as coal, natural gas, uranium and water to cool our facilities. Lack of availability of these resources could jeopardize long-term operations of our facilities or make them uneconomic to operate.
Our utilities are highly dependent on suppliers to deliver components in accordance with short and long-term project schedules.
Our products contain components that are globally sourced from suppliers who, in turn, source components from their suppliers. A shortage of key components in which an alternative supplier is not identified could significantly impact project plans. Such impacts could include timing of projects, including potential for project cancellation. Failure to adhere to project budgets and timelines could adversely impact our results of operations, financial condition or cash flows.
We are subject to commodity risks and other risks associated with energy markets and energy production.
In the event fuel costs increase, customer demand could decline and bad debt expense may rise, which may have a material impact on our results of operations. IfDespite existing fuel recovery mechanisms in most of our regulators dostates, higher fuel costs could significantly impact our results of operations if costs are not allowrecovered. Delays in the timing of the collection of fuel cost recoveries could impact our cash flows and liquidity.
A significant disruption in supply could cause us to recover allseek alternative supply services at potentially higher costs and supply shortages may not be fully resolved, which could cause disruptions in our ability to provide services to our customers. Failure to provide service due to disruptions may also result in fines, penalties or a partcost disallowances through the regulatory process. Also, significantly higher energy or fuel costs relative to sales commitments could negatively impact our cash flows and results of the costoperations.
We also engage in wholesale sales and purchases of capital investment electric capacity, energy and energy-related products as well as natural gas. In many markets, emission allowances and/or the O&M costs incurredRECs are also needed to comply with various statutes and commission rulings. As a result, we are subject to market supply and commodity price risk.
Commodity price changes can affect the mandatesvalue of our commodity trading derivatives. We mark certain derivatives to estimated fair market value on a daily basis. Settlements can vary significantly from estimated fair values recorded and significant changes from the assumptions underlying our fair value estimates could cause earnings variability. The management of risks associated with hedging and trading is based, in part, on programs and procedures which utilize historical prices and trends.
Due to the inherent uncertainty involved in price movements and potential deviation from historical pricing, Xcel Energy is unable to fully assure that its risk management programs and procedures would be effective to protect against all significant adverse market deviations.
In addition, Xcel Energy cannot fully assure that its controls will be effective against all potential risks, including, without limitation, employee misconduct. If such programs and procedures are not effective, Xcel Energy’s results of operations, financial condition or cash flows could be materially impacted.
Failure to attract and retain a qualified workforce could have an adverse effect on operations.
In 2021, the competition for talent has become increasingly intense as a result of the ongoing “great resignation”, and we may experience increased employee turnover due to this tightening labor market. In addition, specialized knowledge is required of our technical employees for construction and operation of transmission, generation and distribution assets, which may pose additional difficulty for us as we work to recruit, retain and motivate employees in this climate. Failure to hire and adequately train replacement employees, including the transfer of significant internal historical knowledge and expertise to new employees or future availability and cost of contract labor may adversely affect the ability to manage and operate our business. Inability to attract and retain these employees could adversely impact our results of operations, financial condition or cash flows.
Our operations use third-party contractors in addition to employees to perform periodic and ongoing work.
We rely on third-party contractors to perform operations, maintenance and construction work. Our contractual arrangements with these contractors typically include performance standards, progress payments, insurance requirements and security for performance. Poor vendor performance or contractor unavailability could impact ongoing operations, restoration operations, our reputation and could introduce financial risk or risks of fines.
Our employees, directors, third-party contractors, or suppliers may violate or be perceived to violate our Codes of Conduct, which could have an adverse effect on our reputation.
We are exposed to risk of employee or third-party contractor fraud or other environmental requirements,misconduct. All employees and members of the Board of Directors are subject to comply with our Code of Conduct and are required to participate in annual training. Additionally, suppliers are subject to comply with our supplier Code of Conduct.
Xcel Energy does not tolerate discrimination, violations of our Code of Conduct or other unacceptable behaviors. However, it is not always possible to identify and deter misconduct by employees and other third-parties, which may result in governmental investigations, other actions or lawsuits. If such actions are taken against us we may suffer loss of reputation and such actions could have a material effect on our financial condition, results of operations and cash flows.
Our subsidiary, NSP-Minnesota, is subject to the risks of nuclear generation.
NSP-Minnesota has two nuclear generation plants, PI and Monticello. Risks of nuclear generation include:
•Hazards associated with the use of radioactive material in energy production, including management, handling, storage and disposal.
•Limitations on insurance available to cover losses that may arise in connection with nuclear operations, as well as obligations to contribute to an insurance pool in the event of damages at a covered U.S. reactor.
•Technological and financial uncertainties related to the costs of decommissioning nuclear plants may cause our funding obligations to change.
The NRC has authority to impose licensing and safety-related requirements for the operation of nuclear generation facilities, including the ability to impose fines and/or shut down a unit until compliance is achieved. NRC safety requirements could necessitate substantial capital expenditures or an increase in operating expenses. In addition, the INPO reviews NSP-Minnesota’s nuclear operations. Compliance with the INPO’s recommendations could result in substantial capital expenditures or a substantial increase in operating expenses.
If a nuclear incident did occur, it could have a material impact on our results of operations, financial positioncondition or cash flows.
In addition, existing environmental laws Furthermore, non-compliance or regulations may be revised, and new laws or regulations may be adopted or become applicable to us, including but not limited to, regulationthe occurrence of mercury, NOx, SO2, CO2 anda serious incident at other GHGs, particulates, cooling water intakes, water discharges and ash management. We may also incur additional unanticipated obligations or liabilities under existing environmental laws and regulations.
We are subject to physical and financial risks associated with climate change and other weather, natural disaster and resource depletion impacts.
Climate change can create physical and financial risk. Physical risks from climate change can include changes in weather conditions, changes in precipitation and extreme weather events.
Our customers’ energy needs vary with weather conditions, primarily temperature and humidity. For residential customers, heating and cooling represent their largest energy use. To the extent weather conditions are affected by climate change, customers’ energy usenuclear facilities could increase or decrease. Increased energy use due to weather changes may require us to invest in additional generating assets, transmission and other infrastructure to serve increased load. Decreased energy use due to weather changes may result in decreased revenues. Extreme weather conditions in general require more system backup, adding to costs, and can contribute to increased system stress, including service interruptions. Weather conditions could also have an impact on our revenues. We buy and sell electricity depending upon system needs and market opportunities. Extreme weather conditions creating high energy demandindustry regulation, which may raise electricity prices, which would increase the cost of energy we provide to our customers.NSP-Minnesota’s compliance costs.
Severe weather impacts our service territories, primarily when thunderstorms and associated flooding, tornadoes, wildfires and snow or ice storms occur. To the extent the frequency of extreme weather events increases, this could increase our cost of providing service. Changes in precipitation resulting in droughts or water shortages, whether caused by climate change or otherwise, could adversely affect our operations, principally our fossil generating units. A negative impact to water supplies due to long-term drought or water depletion conditions could adversely impact our ability to provide electricity to customers, as well as increase the price they pay for energy. We may not recover all costs related to mitigating these physical and financial risks.
Climate change may impact a region’s economic health, which could impact our revenues. Our financial performance is tied to the health of the regional economies we serve. The price of energy has an impact on the economic health of our communities. The cost of additional regulatory requirements, such as regulation of GHG or additional environmental regulation could impact the availability of goods and prices charged by our suppliers which would normally be borne by consumers through higher prices for energy and purchased goods. To the extent financial markets view climate change and emissions of GHGs as a financial risk, this could negatively affect our ability to access capital markets or cause us to receive less than ideal terms and conditions.
FinancialOperational Risks
Our natural gas and electric generation/transmission and distribution operations involve numerous risks that may result in accidents and other operating risks and costs.
Our profitability dependsnatural gas transmission and distribution activities include inherent hazards and operating risks, such as leaks, explosions, outages and mechanical problems. Our electric generation, transmission and distribution activities include inherent hazards and operating risks such as contact, fire and outages.
These risks could result in part on the abilityloss of life, significant property damage, environmental pollution, impairment of our utility subsidiariesoperations and substantial financial losses to recover their costs from theiremployees, third-party contractors, customers or the public. We maintain insurance against most, but not all, of these risks and there may be changeslosses.
The occurrence of these events, if not fully covered by insurance, could have a material effect on our financial condition, results of operations and cash flows as well as potential loss of reputation.
Other uncertainties and risks inherent in circumstances oroperating and maintaining Xcel Energy's facilities include, but are not limited to:
•Risks associated with facility start-up operations, such as whether the facility will achieve projected operating performance on schedule and otherwise as planned.
•Failures in the availability, acquisition or transportation of fuel or other necessary supplies.
•The impact of unusual or adverse weather conditions and natural disasters, including, but not limited to, tornadoes, icing events, floods and droughts.
•Performance below expected or contracted levels of output or efficiency (e.g., performance guarantees).
•Availability of replacement equipment.
•Availability of adequate water resources and ability to satisfy water intake and discharge requirements.
•Inability to identify, manage properly or mitigate equipment defects.
•Use of new or unproven technology.
•Risks associated with dependence on a specific type of fuel or fuel source, such as commodity price risk, availability of adequate fuel supply and transportation and lack of available alternative fuel sources.
•Increased competition due to, among other factors, new facilities, excess supply, shifting demand and regulatory environment that impairchanges.
Additionally, compliance with existing and potential new regulations related to the abilityoperation and maintenance of our natural gas infrastructure could result in significant costs. The PHMSA is responsible for administering the DOT’s national regulatory program to assure the safe transportation of natural gas, petroleum and other hazardous materials by pipelines. The PHMSA continues to develop regulations and other approaches to risk management to assure safety in design, construction, testing, operation, maintenance and emergency response of natural gas pipeline infrastructure. We have programs in place to comply with these regulations and systematically monitor and renew infrastructure over time, however, a significant incident or material finding of non-compliance could result in penalties and higher costs of operations.
Our natural gas and electric transmission and distribution operations are dependent upon complex information technology systems and network infrastructure, the failure of which could disrupt our normal business operations, which could have a material adverse effect on our ability to process transactions and provide services.
Our utility subsidiaries to recover costs from their customers.
Weoperations are subject to comprehensive regulation by federallong-term planning and stateproject risks.
Most electric utility investments are planned to be used for decades. Transmission and generation investments typically have long lead times and are planned well in advance of in-service dates and typically subject to long-term resource plans. These plans are based on numerous assumptions such as: sales growth, customer usage, commodity prices, economic activity, costs, regulatory agencies. The utility commissions in the states where we operate regulate many aspects of our utility operations, including sitingmechanisms, customer behavior, available technology and construction of facilities, customer service and the rates that we can charge customers. The FERC has jurisdiction, among other things, over wholesale rates for electric transmission service, the sale of electric energy in interstate commerce and certain natural gas transactions in interstate commerce.
The profitability of our utility operationspublic policy. Xcel Energy’s long-term resource plan is dependent on our ability to recoverobtain required approvals, develop necessary technical expertise, allocate and coordinate sufficient resources and adhere to budgets and timelines.
In addition, the costslong-term nature of providing energyboth our planning and utility services to our customers and earn a return on our capital investment. Our utility subsidiaries provide service at rates approved by one or more regulatory commissions. These rates are generally regulated and based on an analysis of the utility’s costs incurred in a test year. Our utility subsidiariesasset lives are subject to both futurerisk. The electric utility sector is undergoing significant change (e.g., increases in energy efficiency, wider adoption of distributed generation and historical test years depending upon the regulatory mechanisms approved in each jurisdiction. Thus, the rates a utility is allowedshifts away from fossil fuel generation to charge may or may not match its costs at any given time. While rate regulation is premised on providing an opportunity to earn a reasonable raterenewable generation). Customer adoption of return on invested capital, in a continued low interest rate environment there has been pressure pushing down ROE. There can also be no assurance that the applicable regulatory commission will judge all the costs of our utility subsidiaries to have been prudent, whichthese technologies and increased energy efficiency could result in cost disallowances, or that the regulatory process in which ratesexcess transmission and generation resources, downward pressure on sales growth, and potentially stranded costs if we are determined will always result in rates that will produce full recovery of such costs. Changes in the long-term cost-effectiveness or changes to the operating conditions of our assets may result in early retirements and while regulation typically provides relief for these types of changes, there is no assurance that regulators would allow full recovery of all remaining costs leaving all or a portion of these asset costs stranded. Higher than expected inflation may increase costs of construction and operations. Rising fuel costs could increase the risk that our utility subsidiaries will not be able to fully recover costs and investments.
The magnitude and timing of resource additions and changes in customer demand may not coincide with evolving customer preference for generation resources and end-uses, which introduces further uncertainty into long-term planning. Efforts to electrify the transportation and building sectors to reduce GHG emissions may result in higher electric demand and lower natural gas demand over time. Higher electric demand may require us to adopt new technologies and make significant transmission and distribution investments including advanced grid infrastructure, which increases exposure to overall grid instability and technology obsolescence. Evolving stakeholder preference for lower emissions from generation sources and end-uses, like heating, may impact our resource mix and put pressure on our ability to recover capital investments in natural gas generation and delivery. Multiple states may not agree as to the appropriate resource mix, which may lead to costs to comply with one jurisdiction that are not recoverable across all jurisdictions served by the same assets.
We are subject to longer-term availability of inputs such as coal, natural gas, uranium and water to cool our facilities. Lack of availability of these resources could jeopardize long-term operations of our facilities or make them uneconomic to operate.
Our utilities are highly dependent on suppliers to deliver components in accordance with short and long-term project schedules.
Our products contain components that are globally sourced from suppliers who, in turn, source components from their suppliers. A shortage of key components in which an alternative supplier is not identified could significantly impact project plans. Such impacts could include timing of projects, including potential for project cancellation. Failure to adhere to project budgets and timelines could adversely impact our results of operations, financial condition or cash flows.
We are subject to commodity risks and other risks associated with energy markets and energy production.
In the event fuel costs from their customers. Furthermore, thereincrease, customer demand could be changes in the regulatory environment that would impair the ability of our utility subsidiaries to recover costs historically collected from their customers, or these factors could cause the operating utilities to exceed commitments made regarding cost capsdecline and result in less than full recovery. Overall, management currently believes prudently incurred costs are generally recoverable given the existing regulatory mechanisms in place.
Adverse regulatory rulings or the imposition of additional regulations couldbad debt expense may rise, which may have an adversea material impact on our results of operations and hence could materially and adversely affect our ability to meet our financial obligations, including debt payments and the payment of dividends on our common stock.
Any reductionsoperations. Despite existing fuel recovery mechanisms in our credit ratings could increase our financing costs and the cost of maintaining certain contractual relationships.
We cannot be assured that anymost of our current ratings orstates, higher fuel costs could significantly impact our subsidiaries’ ratings will remainresults of operations if costs are not recovered. Delays in effect for any given periodthe timing of time, or that a rating will not be lowered or withdrawn entirely by a rating agency. Significant events including a major disallowancethe collection of costs, significantly lower returns on equity or equity ratios or impacts of tax policy changes, among others, mayfuel cost recoveries could impact our cash flows and credit metrics,liquidity.
A significant disruption in supply could cause us to seek alternative supply services at potentially resulting in a changehigher costs and supply shortages may not be fully resolved, which could cause disruptions in our credit ratings. ability to provide services to our customers. Failure to provide service due to disruptions may also result in fines, penalties or cost disallowances through the regulatory process. Also, significantly higher energy or fuel costs relative to sales commitments could negatively impact our cash flows and results of operations.
We also engage in wholesale sales and purchases of electric capacity, energy and energy-related products as well as natural gas. In many markets, emission allowances and/or RECs are also needed to comply with various statutes and commission rulings. As a result, we are subject to market supply and commodity price risk.
Commodity price changes can affect the value of our commodity trading derivatives. We mark certain derivatives to estimated fair market value on a daily basis. Settlements can vary significantly from estimated fair values recorded and significant changes from the assumptions underlying our fair value estimates could cause earnings variability. The management of risks associated with hedging and trading is based, in part, on programs and procedures which utilize historical prices and trends.
Due to the inherent uncertainty involved in price movements and potential deviation from historical pricing, Xcel Energy is unable to fully assure that its risk management programs and procedures would be effective to protect against all significant adverse market deviations.
In addition, our credit ratings may changeXcel Energy cannot fully assure that its controls will be effective against all potential risks, including, without limitation, employee misconduct. If such programs and procedures are not effective, Xcel Energy’s results of operations, financial condition or cash flows could be materially impacted.
Failure to attract and retain a qualified workforce could have an adverse effect on operations.
In 2021, the competition for talent has become increasingly intense as a result of the differing methodologiesongoing “great resignation”, and we may experience increased employee turnover due to this tightening labor market. In addition, specialized knowledge is required of our technical employees for construction and operation of transmission, generation and distribution assets, which may pose additional difficulty for us as we work to recruit, retain and motivate employees in this climate. Failure to hire and adequately train replacement employees, including the transfer of significant internal historical knowledge and expertise to new employees or changefuture availability and cost of contract labor may adversely affect the ability to manage and operate our business. Inability to attract and retain these employees could adversely impact our results of operations, financial condition or cash flows.
Our operations use third-party contractors in the methodologies used by the various rating agencies. Any downgradeaddition to employees to perform periodic and ongoing work.
We rely on third-party contractors to perform operations, maintenance and construction work. Our contractual arrangements with these contractors typically include performance standards, progress payments, insurance requirements and security for performance. Poor vendor performance or contractor unavailability could lead to higher borrowing costsimpact ongoing operations, restoration operations, our reputation and could impactintroduce financial risk or risks of fines.
Our employees, directors, third-party contractors, or suppliers may violate or be perceived to violate our ability to access capital markets. Also,Codes of Conduct, which could have an adverse effect on our utility subsidiaries may enter into certain procurement and derivative contracts that require the posting of collateral or settlement of applicable contracts if credit ratings fall below investment grade.
reputation.
We are exposed to risk of employee or third-party contractor fraud or other misconduct. All employees and members of the Board of Directors are subject to comply with our Code of Conduct and are required to participate in annual training. Additionally, suppliers are subject to comply with our supplier Code of Conduct.
Xcel Energy does not tolerate discrimination, violations of our Code of Conduct or other unacceptable behaviors. However, it is not always possible to identify and deter misconduct by employees and other third-parties, which may result in governmental investigations, other actions or lawsuits. If such actions are taken against us we may suffer loss of reputation and such actions could have a material effect on our financial condition, results of operations and cash flows.
Our subsidiary, NSP-Minnesota, is subject to the risks of nuclear generation.
NSP-Minnesota has two nuclear generation plants, PI and Monticello. Risks of nuclear generation include:
•Hazards associated with the use of radioactive material in energy production, including management, handling, storage and disposal.
•Limitations on insurance available to cover losses that may arise in connection with nuclear operations, as well as obligations to contribute to an insurance pool in the event of damages at a covered U.S. reactor.
•Technological and financial uncertainties related to the costs of decommissioning nuclear plants may cause our funding obligations to change.
The NRC has authority to impose licensing and safety-related requirements for the operation of nuclear generation facilities, including the ability to impose fines and/or shut down a unit until compliance is achieved. NRC safety requirements could necessitate substantial capital market and interest rate risks.expenditures or an increase in operating expenses. In addition, the INPO reviews NSP-Minnesota’s nuclear operations. Compliance with the INPO’s recommendations could result in substantial capital expenditures or a substantial increase in operating expenses.
Utility operations require significant capital investment. AsIf a result, we frequently need to access capital markets. Any disruption in capital marketsnuclear incident did occur, it could have a material impact on our ability to fund our operations. Capital markets are global in nature and are impacted by numerous issues and events throughout the world economy. Capital market disruption events and resulting broad financial market distress could prevent us from issuing short-term commercial paper, issuing new securities or cause us to issue securities with less than ideal terms and conditions, such as higher interest rates.
Higher interest rates on short-term borrowings with variable interest rates could also have an adverse effect on our operating results. Changes in interest rates may also impact the fair value of the debt securities in the nuclear decommissioning fund and master pension trust, as well as our ability to earn a return on short-term investments of excess cash.
We are subject to credit risks.
Credit risk includes the risk that our customers will not pay their bills, which may lead to a reduction in liquidity and an increase in bad debt expense. Credit risk is comprised of numerous factors including the price of products and services provided, the overall economy and local economies in the geographic areas we serve, including local unemployment rates.
Credit risk also includes the risk that various counterparties that owe us money or product will become insolvent and/or breach their obligations. Should the counterparties to these arrangements fail to perform, we may be forced to enter into alternative arrangements. In that event, our financial results could be adversely affected and we could incur losses.
We may at times have direct credit exposure in our short-term wholesale and commodity trading activity to various financial institutions trading for their own accounts or issuing collateral support on behalf of other counterparties. We may also have some indirect credit exposure due to participation in organized markets, such as CAISO, SPP, PJM, MISO and ERCOT, in which any credit losses are socialized to all market participants.
We do have additional indirect credit exposures to various domestic and foreign financial institutions in the form of letters of credit provided as security by power suppliers under various long-term physical purchased power contracts. If any of the credit ratings of the letter of credit issuers were to drop below the designated investment grade rating stipulated in the underlying long-term purchased power contracts, the supplier would need to replace that security with an acceptable substitute. If the security were not replaced, the party could be in technical default under the contract, which would enable us to exercise our contractual rights.
Increasing costs associated with our defined benefit retirement plans and other employee benefits may adversely affect our results of operations, financial positioncondition or liquidity.
We have defined benefit pension and postretirement plans that cover most of our employees. Assumptions related to future costs, return on investments, interest rates and other actuarial assumptions, including mortality tables, have a significant impact on our funding requirements related to these plans. These estimates and assumptions may change based on economic conditions, actual stock and bond market performance, changes in interest rates and changes in governmental regulations. In addition,cash flows. Furthermore, non-compliance or the Pension Protection Act of 2006 changed the minimum funding requirements for defined benefit pension plans with modifications that allowed additional flexibility in the timing of contributions. Therefore, our funding requirements and related contributions may change in the future. Also, the payoutoccurrence of a significant percentage of pension plan liabilitiesserious incident at other nuclear facilities could result in a single year due to high retirements or employees leaving Xcel Energy could trigger settlement accounting and could require Xcel Energy to recognize material incremental pension expense related to unrecognized plan losses in the year these liabilities are paid.
Increasing costs associated with health care plans may adversely affect our results of operations.
Our self-insured costs of health care benefits for eligible employees have increased in recent years. Increasing levels of large individual health care claims and overall health care claims could have an adverse impact on our operating results, financial position and liquidity. We believe that our employee benefit costs, including costs related to health care plans for our employees and former employees, will continue to rise. Changes in industry standards utilized by management in key assumptions (e.g., mortality tables) could have a significant impact on future liabilities and benefit costs. Legislation related to health care could also significantly change our benefit programs and costs.
We must rely on cash from our subsidiaries to make dividend payments.
We are a holding company and our investments in our subsidiaries are our primary assets. Substantially all of our operations are conducted by our subsidiaries. Consequently, our operating cash flow and our ability to service our indebtedness and pay dividends depends upon the operating cash flows of our subsidiaries and the payment of dividends to us. Our subsidiaries are separate legal entities that have no obligation to pay any amounts due pursuant to our obligations or to make any funds available for dividends on our common stock. In addition, each subsidiary’s ability to pay dividends to us depends on any statutory and/or contractual restrictionsregulation, which may include requirements to maintain minimum levels of equity ratios, working capital or assets. Also, our utility subsidiaries are regulated by various state utility commissions, which possess broad powers to ensure that the needs of the utility customers are being met.increase NSP-Minnesota’s compliance costs.
If our utility subsidiaries were to cease making dividend payments, our ability to pay dividends on our common stock or otherwise meet our financial obligations could be adversely affected.
Federal tax law may significantly impact our business.
Xcel Energy’s utility subsidiaries collect through regulated rates its estimated federal, state and local tax payments. There are a number of provisions in federal tax law designed to incentivize capital investments which have benefited our customers by keeping our utility subsidiaries’ rates lower than rates calculated without such provisions. Examples include the use of accelerated depreciation for most of our capital investments, PTCs for wind energy, ITCs for solar energy and R&E tax credits and deductions. Changes to federal tax law may benefit or adversely affect our earnings and customer costs. Changes to tax depreciable lives and the value of various tax credits could change the economics of resources and our resource selections. While regulation allows us to incorporate changes in tax law into the rate-setting process, there could be timing delays before regulated rates provide for realization of the tax changes in revenues. In addition, certain IRS tax policies such as the requirement to utilize normalization may impact our ability to economically deliver certain types of resources relative to market prices.
Operational Risks
Our natural gas and electric generation/transmission and distribution operations involve numerous risks that may result in accidents and other operating risks and costs.
Our natural gas transmission and distribution activities include a variety of inherent hazards and operating risks, such as leaks, explosions, outages and mechanical problems, which could cause substantial financial losses.problems. Our electric generation, transmission and distribution activities also include inherent hazards and operating risks such as contact, fire and widespread outages which could cause substantial financial losses. In addition, these natural gas and electricoutages.
These risks could result in loss of human life, significant property damage, to property, environmental pollution, impairment of our operations and substantial financial losses to us.employees, third-party contractors, customers or the public. We maintain insurance against some,most, but not all, of these risks and losses.
The occurrence of any of these events, if not fully covered by insurance, could have a material effect on our financial position andcondition, results of operations. Foroperations and cash flows as well as potential loss of reputation.
Other uncertainties and risks inherent in operating and maintaining Xcel Energy's facilities include, but are not limited to:
•Risks associated with facility start-up operations, such as whether the facility will achieve projected operating performance on schedule and otherwise as planned.
•Failures in the availability, acquisition or transportation of fuel or other necessary supplies.
•The impact of unusual or adverse weather conditions and natural disasters, including, but not limited to, tornadoes, icing events, floods and droughts.
•Performance below expected or contracted levels of output or efficiency (e.g., performance guarantees).
•Availability of replacement equipment.
•Availability of adequate water resources and ability to satisfy water intake and discharge requirements.
•Inability to identify, manage properly or mitigate equipment defects.
•Use of new or unproven technology.
•Risks associated with dependence on a specific type of fuel or fuel source, such as commodity price risk, availability of adequate fuel supply and transportation and lack of available alternative fuel sources.
•Increased competition due to, among other factors, new facilities, excess supply, shifting demand and regulatory changes.
Additionally, compliance with existing and potential new regulations related to the operation and maintenance of our natural gas transmission or distribution lines located near populated areas,infrastructure could result in significant costs. The PHMSA is responsible for administering the levelDOT’s national regulatory program to assure the safe transportation of potential damages resulting from these risks is greater.
Additionally, for natural gas, the operating orpetroleum and other costs that may be requiredhazardous materials by pipelines. The PHMSA continues to develop regulations and other approaches to risk management to assure safety in order to comply with potential new regulations, including the Pipeline Safety Act, could be significant. The Pipeline Safety Act requires verificationdesign, construction, testing, operation, maintenance and emergency response of natural gas pipeline infrastructure records by pipeline owners and operators to confirm the maximum allowable operating pressure of lines located in high consequence areas or more-densely populated areas.infrastructure. We have programs in place to comply with the Pipeline Safety Actthese regulations and for systematicsystematically monitor and renew infrastructure monitoring and renewal over time. Atime, however, a significant incident or material finding of non-compliance could increase regulatory scrutiny and result in penalties and higher costs of operations.
Our natural gas and electric transmission and distribution operations are dependent upon complex information technology systems and network infrastructure, the failure of which could disrupt our normal business operations, which could have a material adverse effect on our ability to process transactions and provide services.
Our utility operations are subject to long-term planning and project risks.
Most electric utility investments are long-lived and are planned to be used for decades. Transmission and generation investments typically have long lead times and therefore are planned well in advance of when they are brought in-service dates and typically subject to long-term resource plans. These plans are based on numerous assumptions over the planning horizon such as: sales growth, customer usage, commodity prices, economic activity, costs, regulatory mechanisms, customer behavior, available technology and public policy. Xcel Energy’s long-term resource plan is dependent on our ability to obtain required approvals, develop necessary technical expertise, allocate and coordinate sufficient resources and adhere to budgets and timelines.
In addition, the long-term nature of both our planning and our asset lives are subject to risk. The electric utility sector is undergoing a period of significant change. For example, public policy has drivenchange (e.g., increases in appliance and lightingenergy efficiency, and energy efficient buildings, wider adoption and lower cost of renewabledistributed generation and distributed generation, including community solar gardens and customer-sited solar, shifts away from coalfossil fuel generation to decrease CO2 emissions and increasing use of natural gas in electric generation driven by lower natural gas prices. Over time, customerrenewable generation). Customer adoption of these technologies and increased energy efficiency could result in excess transmission and generation resources, as well asdownward pressure on sales growth, and potentially stranded costs if Xcel Energy iswe are not able to fully recover the costs and investments. These changes also introduce additional uncertainty into long-term planning which gives rise to a risk that the
The magnitude and timing of resource additions and growthchanges in customer demand may not coincide and that thewith evolving customer preference for generation resources and end-uses, which introduces further uncertainty into long-term planning. Efforts to electrify the types of additionstransportation and building sectors to reduce GHG emissions may changeresult in higher electric demand and lower natural gas demand over time. Higher electric demand may require us to adopt new technologies and make significant transmission and distribution investments including advanced grid infrastructure, which increases exposure to overall grid instability and technology obsolescence. Evolving stakeholder preference for lower emissions from planninggeneration sources and end-uses, like heating, may impact our resource mix and put pressure on our ability to execution. In addition, werecover capital investments in natural gas generation and delivery. Multiple states may not agree as to the appropriate resource mix, which may lead to costs to comply with one jurisdiction that are alsonot recoverable across all jurisdictions served by the same assets.
We are subject to longer-term availability of the natural resource inputs such as coal, natural gas, uranium and water to cool our facilities. Lack of availability of these resources could jeopardize long-term operations of our facilities or make them uneconomic to operate.
Our utilities are highly dependent on suppliers to deliver components in accordance with short and long-term project schedules.
The resource plans reviewedOur products contain components that are globally sourced from suppliers who, in turn, source components from their suppliers. A shortage of key components in which an alternative supplier is not identified could significantly impact project plans. Such impacts could include timing of projects, including potential for project cancellation. Failure to adhere to project budgets and approved bytimelines could adversely impact our state regulators assume continuationresults of operations, financial condition or cash flows.
We are subject to commodity risks and other risks associated with energy markets and energy production.
In the event fuel costs increase, customer demand could decline and bad debt expense may rise, which may have a material impact on our results of operations. Despite existing fuel recovery mechanisms in most of our states, higher fuel costs could significantly impact our results of operations if costs are not recovered. Delays in the timing of the traditional utilitycollection of fuel cost recoveries could impact our cash flows and liquidity.
A significant disruption in supply could cause us to seek alternative supply services at potentially higher costs and supply shortages may not be fully resolved, which could cause disruptions in our ability to provide services to our customers. Failure to provide service due to disruptions may also result in fines, penalties or cost disallowances through the regulatory process. Also, significantly higher energy or fuel costs relative to sales commitments could negatively impact our cash flows and results of service model underoperations.
We also engage in wholesale sales and purchases of electric capacity, energy and energy-related products as well as natural gas. In many markets, emission allowances and/or RECs are also needed to comply with various statutes and commission rulings. As a result, we are subject to market supply and commodity price risk.
Commodity price changes can affect the value of our commodity trading derivatives. We mark certain derivatives to estimated fair market value on a daily basis. Settlements can vary significantly from estimated fair values recorded and significant changes from the assumptions underlying our fair value estimates could cause earnings variability. The management of risks associated with hedging and trading is based, in part, on programs and procedures which utility costs are recoveredutilize historical prices and trends.
Due to the inherent uncertainty involved in price movements and potential deviation from customers as they receive the benefit of service.historical pricing, Xcel Energy is engagedunable to fully assure that its risk management programs and procedures would be effective to protect against all significant adverse market deviations.
In addition, Xcel Energy cannot fully assure that its controls will be effective against all potential risks, including, without limitation, employee misconduct. If such programs and procedures are not effective, Xcel Energy’s results of operations, financial condition or cash flows could be materially impacted.
Failure to attract and retain a qualified workforce could have an adverse effect on operations.
In 2021, the competition for talent has become increasingly intense as a result of the ongoing “great resignation”, and we may experience increased employee turnover due to this tightening labor market. In addition, specialized knowledge is required of our technical employees for construction and operation of transmission, generation and distribution assets, which may pose additional difficulty for us as we work to recruit, retain and motivate employees in this climate. Failure to hire and adequately train replacement employees, including the transfer of significant internal historical knowledge and expertise to new employees or future availability and cost of contract labor may adversely affect the ability to manage and operate our business. Inability to attract and retain these employees could adversely impact our results of operations, financial condition or cash flows.
Our operations use third-party contractors in addition to employees to perform periodic and ongoing infrastructure investment programswork.
We rely on third-party contractors to accommodate renewable distributed generationperform operations, maintenance and construction work. Our contractual arrangements with these contractors typically include performance standards, progress payments, insurance requirements and security for performance. Poor vendor performance or contractor unavailability could impact ongoing operations, restoration operations, our reputation and could introduce financial risk or risks of fines.
Our employees, directors, third-party contractors, or suppliers may violate or be perceived to maintain high system reliability. Changing customer expectations and changing technologies are requiring significant investments in advanced grid infrastructure. This also increases the exposure to potential outdatingviolate our Codes of technologies and the resultant risks. Xcel Energy is also investing in renewable and natural gas-fired generation to reduce our CO2 emissions profile. The inability of coal mining companies to attract capital could disrupt longer-term supplies. Early plant retirements that may result from these changes could expose us to premature financial obligations,Conduct, which could result in less than full recoveryhave an adverse effect on our reputation.
We are exposed to risk of all remaining costs. Both decreasing use per customer driven by applianceemployee or third-party contractor fraud or other misconduct. All employees and lighting efficiency andmembers of the availabilityBoard of cost-effective distributed generation puts downward pressure on load growth. This could lead to under recovery of costs, excess resources to meet customer demand and increases in electric rates. Finally, multiple states served by a single system may not agree as to the appropriate resource mix and the differing views may lead to costs incurredDirectors are subject to comply with one jurisdiction thatour Code of Conduct and are required to participate in annual training. Additionally, suppliers are subject to comply with our supplier Code of Conduct.
Xcel Energy does not recoverable across alltolerate discrimination, violations of the jurisdictions servedour Code of Conduct or other unacceptable behaviors. However, it is not always possible to identify and deter misconduct by the same assets.
employees and other third-parties, which may result in governmental investigations, other actions or lawsuits. If such actions are taken against us we may suffer loss of reputation and such actions could have a material effect on our financial condition, results of operations and cash flows.
Our subsidiary, NSP-Minnesota, is subject to the risks of nuclear generation.
NSP-Minnesota’sNSP-Minnesota has two nuclear stations,generation plants, PI and Monticello, subject it to the risksMonticello. Risks of nuclear generation which include:
The risks•Hazards associated with the use of radioactive material in theenergy production, of energy, theincluding management, handling, storage and disposal and the current lack of a long-term disposal solution for radioactive materials;disposal.
•Limitations on the amounts and types of insurance available to cover losses that mightmay arise in connection with nuclear operations, as well as obligations to contribute to an insurance pool in the event of damages at a covered U.S. reactor;reactor.
•Technological and
Uncertainties with respect financial uncertainties related to the technological and financial aspectscosts of decommissioning nuclear plants at the end of their licensed lives. For example, similar to pensions, interest rate and other assumptions regarding decommissioning costs may change based on economic conditions and changes in the expected life of the asset may cause our funding obligations to change.
The NRC has authority to impose licensing and safety-related requirements for the operation of nuclear generation facilities. Infacilities, including the event of non-compliance, the NRC has the authorityability to impose fines and/or shut down a unit until compliance is achieved. Revised NRC safety requirements could necessitate substantial capital expenditures or a substantialan increase in operating expenses. In addition, the Institute for Nuclear Power OperationsINPO reviews NSP-Minnesota’s nuclear operations and nuclear generation facilities.operations. Compliance with the Institute for Nuclear Power Operations’INPO’s recommendations could result in substantial capital expenditures or a substantial increase in operating expenses.
If ana nuclear incident did occur, it could have a material effectimpact on our results of operations, financial condition or financial condition.cash flows. Furthermore, the non-compliance of other nuclear facilities operators or the occurrence of a serious nuclear incident at other nuclear facilities could result in increased industry regulation, of the industry, which could thenmay increase NSP-Minnesota’s compliance costs.
Financial Risks
Our profitability depends on the ability of our utility subsidiaries to recover their costs and impactchanges in regulation may impair the resultsability of operations of its facilities.
NSP-Wisconsin’s production and transmission system is operated on an integrated basis with NSP-Minnesota’s production and transmission system, and NSP-Wisconsin may be subjectour utility subsidiaries to risks associated with NSP-Minnesota’s nuclear generation.
recover costs from their customers.
We are subject to commodity riskscomprehensive regulation by federal and other risks associated withstate utility regulatory agencies, including siting and construction of facilities, customer service and the rates that we can charge customers.
The profitability of our utility operations is dependent on our ability to recover the costs of providing energy markets and energy production.utility services and earning a return on capital investment. Our rates are generally regulated and are based on an analysis of the utility’s costs incurred in a test year. The utility subsidiaries are subject to both future and historical test years depending upon the regulatory jurisdiction. Thus, the rates a utility is allowed to charge may or may not match its costs at any given time. Rate regulation is premised on providing an opportunity to earn a reasonable rate of return on invested capital.
There can also be no assurance that our regulatory commissions will judge all the costs of our utility subsidiaries to be prudent, which could result in disallowances, or that the regulatory process will always result in rates that will produce full recovery.
Overall, management believes prudently incurred costs are recoverable given the existing regulatory framework. However, there may be changes in the regulatory environment that could impair the ability of our utility subsidiaries to recover costs historically collected from customers, or these subsidiaries could exceed caps on capital costs required by commissions and result in less than full recovery.
Changes in the long-term cost-effectiveness or to the operating conditions of our assets may result in early retirements of utility facilities. While regulation typically provides cost recovery relief for these types of changes, there is no assurance that regulators would allow full recovery of all remaining costs.
Higher than expected inflation or tariffs may increase costs of construction and operations. Also, rising fuel costs could increase the risk that our utility subsidiaries will not be able to fully recover their fuel costs from their customers.
Adverse regulatory rulings or the imposition of additional regulations could have an adverse impact on our results of operations and materially affect our ability to meet our financial obligations, including debt payments and the payment of dividends on common stock.
Any reductions in our credit ratings could increase our financing costs and the cost of maintaining certain contractual relationships.
We engagecannot be assured that our current credit ratings or our subsidiaries’ ratings will remain in wholesale saleseffect, or that a rating will not be lowered or withdrawn by a rating agency. Significant events including disallowance of costs, use of historic test years, elimination of riders or interim rates, increasing depreciation lives, lower returns on equity, changes to equity ratios and purchasesimpacts of electric capacity, energytax policy may impact our cash flows and energy-related productscredit metrics, potentially resulting in a change in our credit ratings. In addition, our credit ratings may change as well as natural gas. In many marketsa result of the differing methodologies or change in which we operate, emission allowances and/the methodologies used by the various rating agencies.
Any credit ratings downgrade could lead to higher borrowing costs or renewable energy creditslower proceeds from equity issuances. It could also impact our ability to access capital markets. Also, our utility subsidiaries may enter into contracts that require posting of collateral or settlement if credit ratings fall below investment grade.
We are also neededsubject to comply with various statutescapital market and commission rulings associated with energy transactions.interest rate risks.
Utility operations require significant capital investment. As a result, we frequently need to access capital markets. Any disruption in capital markets could have a material impact on our ability to fund our operations. Capital market disruption and financial market distress could prevent us from issuing short-term commercial paper, issuing new securities or cause us to issue securities with unfavorable terms and conditions, such as higher interest rates or lower proceeds from equity issuances. Higher interest rates on short-term borrowings with variable interest rates could also have an adverse effect on our operating results.
The performance of capital markets impacts the value of assets held in trusts to satisfy future obligations to decommission NSP-Minnesota’s nuclear plants and satisfy our defined benefit pension and postretirement benefit plan obligations. These assets are subject to market supplyfluctuations and commodity price risk. Commodity price changes can affectyield uncertain returns, which may fall below expected returns. A decline in the market value of our commodity trading derivatives. We mark certain derivatives to estimated fair market value on a daily basis (mark-to-market accounting). Actual settlements can vary significantly from estimated fair values recorded, and significant changes fromthese assets may increase funding requirements. Additionally, the assumptions underlying our fair value estimates could cause earnings variability.of the debt securities held in the nuclear decommissioning and/or pension trusts may be impacted by changes in interest rates.
We are subject to credit risks.
If we encounter market supply shortagesCredit risk includes the risk that our customers will not pay their bills, which may lead to a reduction in liquidity and an increase in bad debt expense. Credit risk is comprised of numerous factors including the price of products and services provided, the economy and unemployment rates.
Credit risk also includes the risk that counterparties that owe us money or our suppliers are otherwise unableproduct will become insolvent and may breach their obligations. Should the counterparties fail to meet their contractual obligations,perform, we may be unableforced to fulfillenter into alternative arrangements. In that event, our contractual obligationsfinancial results could be adversely affected and incur losses.
Xcel Energy may have direct credit exposure in our short-term wholesale and commodity trading activity to financial institutions trading for their own accounts or issuing collateral support on behalf of other counterparties. We may also have some indirect credit exposure due to participation in organized markets, (e.g., California Independent System Operator, SPP, PJM Interconnection, LLC, MISO and Electric Reliability Council of Texas), in which any credit losses are socialized to all market participants.
We have additional indirect credit exposure to financial institutions from letters of credit provided as security by power suppliers under various purchased power contracts. If any of the credit ratings of the letter of credit issuers were to drop below investment grade, the supplier would need to replace that security with an acceptable substitute. If the security were not replaced, the party could be in default under the contract.
Increasing costs of our customers at previously anticipated costs. Therefore,defined benefit retirement plans and employee benefits may adversely affect our results of operations, financial condition or cash flows.
We have defined benefit pension and postretirement plans that cover most of our employees. Assumptions related to future costs, return on investments, interest rates and other actuarial assumptions have a significant disruptionimpact on our funding requirements of these plans. Estimates and assumptions may change. In addition, the Pension Protection Act sets the minimum funding requirements for defined benefit pension plans. Therefore, our funding requirements and contributions may change in the future. Also, the payout of a significant percentage of pension plan liabilities in a single year, due to high numbers of retirements or employees leaving, would trigger settlement accounting and could cause usrequire Xcel Energy to seek alternative supply services at potentially higher costs or suffer increased liability for unfulfilled contractual obligations. Any significantly higher energy or fuel costs relativerecognize incremental pension expense related to corresponding sales commitmentsunrecognized plan losses in the year liabilities are paid. Changes in industry standards utilized in key assumptions (e.g., mortality tables) could have a negativesignificant impact on future obligations and benefit costs.
Increasing costs associated with health care plans may adversely affect our results of operations.
Increasing levels of large individual health care claims and overall health care claims could have an adverse impact on our results of operations, financial condition or cash flows. Health care legislation could also significantly impact our benefit programs and costs.
We must rely on cash from our subsidiaries to make dividend payments.
Investments in our subsidiaries are our primary assets. Substantially all of our operations are conducted by our subsidiaries. Consequently, our operating cash flow and ability to service our debt and pay dividends depends upon the operating cash flows of our subsidiaries and their payment of dividends.
Our subsidiaries are separate legal entities that have no obligation to pay any amounts due pursuant to our obligations or to make any funds available for dividends on our common stock. In addition, each subsidiary’s ability to pay dividends depends on statutory and/or contractual restrictions which may include requirements to maintain minimum levels of equity ratios, working capital or assets.
If the utility subsidiaries were to cease making dividend payments, our ability to pay dividends on our common stock or otherwise meet our financial obligations could be adversely affected. Our utility subsidiaries are regulated by state utility commissions, which possess broad powers to ensure that the needs of the utility customers are met. We may be negatively impacted by the actions of state commissions that limit the payment of dividends by our utility subsidiaries.
Federal tax law may significantly impact our business.
Our utility subsidiaries collect estimated federal, state and local tax payments through their regulated rates. Changes to federal tax law may benefit or adversely affect our earnings and customer costs. Tax depreciable lives and the value/availability of various tax credits or the timeliness of their utilization may impact the economics or selection of resources. If tax rates are increased, there could be timing delays before regulated rates provide for recovery of such tax increases in revenues. In addition, certain IRS tax policies, such as tax normalization, may impact our ability to economically deliver certain types of resources relative to market prices.
Macroeconomic Risks
Economic conditions impact our business.
Xcel Energy’s operations are affected by local, national and worldwide economic conditions, which correlates to customers/sales growth (decline). Economic conditions may be impacted by insufficient financial sector liquidity leading to potential increased unemployment, which may impact customers’ ability to pay their bills, which could lead to additional bad debt expense.
Our utility subsidiaries face competitive factors, which could have an adverse impact on our financial condition, results of operations and cash flows. Further, worldwide economic activity impacts the demand for basic commodities necessary for utility infrastructure, which may inhibit our ability to acquire sufficient supplies. We operate in a capital-intensive industry and federal trade policy could significantly impact the cost of materials we use. There may be delays before these additional material costs can be recovered in rates.
We face risks related to health epidemics and other outbreaks, which may have a material effect on our financial condition, results of operations and cash flows.
The global outbreak of COVID-19 continues to impact countries, communities, supply chains and markets. A high degree of uncertainty continues to exist regarding the pandemic; the duration and magnitude of business restrictions (domestically and globally); the potential shortages of employees and third-party contractors due to quarantine policies, vaccination requirements or government restrictions; re-shutdowns, if any, and the level and pace of economic recovery.
Xcel Energy has experienced and may continue to experience sales volatility and shifts between residential and C&I sales as a result of COVID-19. Xcel Energy has a decoupling mechanism in Colorado for residential and non-demand small C&I electric customer classes. In Minnesota, Xcel Energy has historically had a sales true-up mechanism for all electric customer classes which has ended in 2021. We are requesting implementation of a new sales true-up mechanism for 2022 - 2024. These mechanisms mitigate the impact of changes to sales levels as compared to a baseline.
Although the financial impact of the pandemic on our financial results has largely been mitigated, we cannot ultimately predict whether it will have a material impact on our future liquidity, financial condition or results of operations. Nor can we predict the impact of the virus on the health of our employees, our supply chain or our ability to recover higher costs associated with managing through the pandemic. The impact of COVID-19 may exacerbate other risks discussed herein, which could have a material effect on us. The situation is evolving and additional impacts may arise.
Operations could be impacted by war, terrorism or other events.
Our generation plants, fuel storage facilities, transmission and distribution facilities and information and control systems may be targets of terrorist activities. Any disruption could impact operations or result in a decrease in revenues and additional costs to repair and insure our assets. These disruptions could have a material impact on our financial condition, results of operations or cash flows.
The potential for terrorism has subjected our operations to increased risks and could have a material effect on our business. We have already incurred increased costs for security and capital expenditures in response to these risks. The insurance industry has also been affected by these events and the availability of insurance may decrease. In addition, insurance may have higher deductibles, higher premiums and more restrictive policy terms.
A disruption of the regional electric transmission grid, interstate natural gas pipeline infrastructure or other fuel sources, could negatively impact our business, brand and reputation. Because our facilities are part of an interconnected system, we face the risk of possible loss of business due to a disruption caused by the actions of a neighboring utility.
We also face the risks of possible loss of business due to significant events such as severe storms, severe temperature extremes, wildfires (particularly in Colorado), widespread pandemic, generator or transmission facility outage, pipeline rupture, railroad disruption, operator error, sudden and significant increase or decrease in wind generation or a workforce disruption.
In addition, major catastrophic events throughout the world may disrupt our business. Xcel Energy participates in a global supply chain, which includes materials and components that are globally sourced. A prolonged disruption could result in the delay of equipment and materials that may impact our ability to reliably serve our customers.
A major disruption could result in a significant decrease in revenues and additional costs to repair assets, which could have a material impact on our results of operations, financial condition or cash flows.
Xcel Energy participates in GridEx, which is the largest grid security exercise in North America. These efforts, led by the NERC, test and further develop the coordination, threat sharing and interaction between utilities and various government agencies relative to potential cyber and physical threats against the nation’s electric grid.
A cyber incident or security breach could have a material effect on our business.
We operate in an industry that requires the continued operation of sophisticated information technology, control systems and network infrastructure. In addition, we use our systems and infrastructure to create, collect, use, disclose, store, dispose of and otherwise process sensitive information, including company data, customer energy usage data, and personal information regarding customers, employees and their dependents, contractors, shareholders and other individuals.
Xcel Energy’s generation, transmission, distribution and fuel storage facilities, information technology systems and other infrastructure or physical assets as well as information processed in our systems (e.g., information regarding our customers, employees, operations, infrastructure and assets) could be affected by cyber security incidents, including those caused by human error.
The utility industry has been the target of several attacks on operational systems and has seen an increased volume and sophistication of cyber security incidents from international activist organizations, Nation States and individuals. During the normal course of business, we have experienced and expect to continue to experience attempts to compromise our information technology and control systems, network infrastructure and other assets. To date, no cybersecurity incident or attack has had a material impact on our business or results of operation.
Cyber security incidents could harm our businesses by limiting our generating, transmitting and distributing capabilities, delaying our development and construction of new facilities or capital improvement projects to existing facilities, disrupting our customer operations or causing the release of customer information, all of which would likely receive state and federal regulatory scrutiny and could expose us to liability.
Xcel Energy’s generation, transmission systems and natural gas pipelines are part of an interconnected system. Therefore, a disruption caused by the impact of a cyber security incident of the regional electric transmission grid, natural gas pipeline infrastructure or other fuel sources of our third-party service providers’ operations, could also negatively impact our business.
Our supply chain for procurement of digital equipment and services may expose software or hardware to these risks and could result in a breach or significant costs of remediation. We are unable to quantify the potential impact of cyber security threats or subsequent related actions. Cyber security incidents and regulatory action could result in a material decrease in revenues and may causesignificant additional costs (e.g., penalties, third-party claims, repairs, insurance or compliance) and potentially result in economic losses. Potential marketdisrupt our supply shortagesand markets for natural gas, oil and other fuels.
We maintain security measures to protect our information technology and control systems, network infrastructure and other assets. However, these assets and the information they process may be vulnerable to cyber security incidents, including asset failure or unauthorized access to assets or information.
A failure or breach of our technology systems or those of our third-party service providers could disrupt critical business functions and may negatively impact our business, our brand, and our reputation. The cyber security threat is dynamic and evolves continually, and our efforts to prioritize network protection may not be fully resolved through alternative supply sourceseffective given the constant changes to threat vulnerability.
Our operating results may fluctuate on a seasonal and may cause short-term disruptions in our ability to providequarterly basis and can be adversely affected by milder weather.
Our electric and/orand natural gas services toutility businesses are seasonal and weather patterns can have a material impact on our customers. The impact of these costoperating performance. Demand for electricity is often greater in the summer and reliability issues vary in magnitude for each operating subsidiary depending upon unique operating conditions such as generation fuels mix, availability of water forwinter months associated with cooling availability of fuel transportation including rail shipments of coal, electric generation capacity, transmission,and heating. Because natural gas pipeline capacity, etc. Failureis heavily used for residential and commercial heating, the demand depends heavily upon weather patterns. A significant amount of natural gas revenues are recognized in the first and fourth quarters related to provide service due to disruptionsthe heating season. Accordingly, our operations have historically generated less revenues and income when weather conditions are milder in the winter and cooler in the summer. Unusually mild winters and summers could also result in fines, penaltieshave an adverse effect on our financial condition, results of operations or cost disallowances through the regulatory process.cash flows.
Public Policy Risks
We may be subject to legislative and regulatory responses to climate change, with which compliance could be difficult and costly.
Increased public awareness and concern regarding climate change may result in more state, regional and/or federal requirements to reduce or mitigate the effects of GHGs. Legislative and regulatory responses related to climate change and new interpretations of existing laws through climate change litigationmay create financial risk as our electric generating facilities may be subject to additional regulation at either the state or federal level in the future. Such regulations could impose substantial costs on our system. International agreements could have an impact to the extent theyadditionally lead to future federal or state regulations.
In 2015, the 21st Conference of the Parties to the United Nations Framework Convention on Climate Change reached consensus among 190 nations on an agreement (the Paris Agreement) that establishes a framework for GHG mitigation actions by all countries, (“nationally determined contributions”), with a goal of holding the increase in global average temperature to below 2o2º Celsius above pre-industrial levels and an aspiration to limit the increase to 1.5o 1.5º Celsius. If implemented,
In April 2021, ahead of the Paris AgreementUnited Nations Climate Change Conference in Glasgow, the Biden Administration committed the U.S. to a Nationally Determined Contribution of 50-52% net GHG emissions reduction economy-wide from 2005 levels. This commitment and other agreements made in Glasgow could result in future additional GHG reductions in the United States. On June 21, 2017, President TrumpIn addition, the Biden Administration has announced that the U.S. would withdraw from the Paris Agreement. Such a withdrawal, under terms of the Agreement, becomes effective in four years. Many state and local government entities, however, have indicated that they intendplans to pursue GHG mitigation with a goal of achieving the GHG reductions in the United States anticipated by the Paris Agreement.
We have been, and in the future may be, subject toimplement new climate change lawsuits. An adverse outcome in anyprograms, including potential regulation of these cases could require substantial capital expenditures and could possibly require payment of substantial penalties or damages. Defense costs associated with such litigation can also be significant. Such payments or expenditures could affect results of operations, cash flows and financial condition if such costs are not recovered through regulated rates.GHG emissions targeting the utility industry.
SomeMany states and localities have indicated a desire to continue to pursue their own climate policies even in the absence of federal mandates. All of thepolicies. The steps that Xcel Energy has taken to date to reduce GHG emissions, including energy efficiency measures, adding renewable generation or retiring or converting coal plants to natural gas, occurred under state-endorsed resource plans, renewable energy standards and other state policies. While those actions likely would have put Xcel Energy in a good position
We may be subject to meet federal standards under the CPPclimate change lawsuits. An adverse outcome could require substantial capital expenditures and possibly require payment of substantial penalties or the Paris Agreement, repealdamages. Defense costs associated with such litigation can also be significant and could affect results of these policies wouldoperations, financial condition or cash flows if such costs are not impact those state-endorsed actions and plans.recovered through regulated rates.
Whether under state or federal programs, an important factor is our ability to recover the costs incurred to comply with any regulatory requirements in a timely manner. If our regulators do not allow us to recover all or a part of the cost of capital investment or the O&M costs incurred to comply with the mandates, it could have a material effect on our results of operations.
operations, financial condition or cash flows.
Increased risks of regulatory penalties could negatively impact our business.
The Energy Act increased civil penalty authority for violation of FERC statutes, rules and orders. The FERC can now impose penalties of up to $1.2$1.3 million per violation per day, particularly as it relates to energy trading activities for both electricity and natural gas. Under statute, the FERC can adjust penalties for inflation. In addition, NERC electric reliability standards and critical infrastructure protection requirements are mandatory and subject to potential financial penalties by regional entities,penalties. Also, the NERC or the FERC for violations. Additionally, the PHMSA, the Occupational Safety and Health Administration and other federal agencies also have penalty authority. the authority to assess penalties.
In the event of serious incidents, these agencies have become more active in pursuingmay pursue penalties. SomeIn addition, certain states have the authority to impose substantial penalties in the event of non-compliance.penalties. If a serious reliability, cyber or safety incident did occur, it could have a material effect on our results of operations, financial condition or financial results.cash flows.
Macroeconomic Risks
Economic conditions impact our business.
Our operations are affected by local, nationalThe continued use of natural gas for both power generation and worldwide economic conditions. Growthgas distribution have increasingly become a public policy advocacy target. These efforts may result in our customer base is correlated with economic conditions. While the numbera limitation of customers is growing, sales growth is relatively modest due tonatural gas as an increased focus on energy efficiency including federal standardssource for applianceboth power generation and lighting efficiency and distributed generation, primarily solar PV. Instability in the financial markets also may affect the cost of capital and our ability to raise capital,heating, which is discussed in the capital market risk factor section above.
Economic conditions may be impacted by insufficient financial sector liquidity leading to potential increased unemployment, which may impact customers’ ability to pay timely, increase customer bankruptcies, and may lead to increased bad debt.
Further, worldwide economic activity has an impact on the demand for basic commodities needed for utility infrastructure, such as steel, copper, aluminum, etc., which maycould impact our ability to acquire sufficient supplies. We operatereliably and affordably serve our customers.
In recent years, there have been various local and state agency proposals within and outside our service territories that would attempt to restrict the use and availability of natural gas. If such policies were to prevail, we may be forced to make new resource investment decisions which could potentially result in a capital intensive industry,stranded costs if we are not able to fully recover costs and federal policy on trade could significantlyinvestments and impact the costsoverall reliability of our service.
Environmental Risks
We are subject to environmental laws and regulations, with which compliance could be difficult and costly.
We are subject to environmental laws and regulations that affect many aspects of our operations, including air emissions, water quality, wastewater discharges and the materials we use.generation, transport and disposal of solid wastes and hazardous substances. Laws and regulations require us to obtain permits, licenses, and approvals and to comply with a variety of environmental requirements.
Environmental laws and regulations can also require us to restrict or limit the output of facilities or the use of certain fuels, shift generation to lower-emitting facilities, install pollution control equipment, clean up spills and other contamination and correct environmental hazards. Failure to meet requirements of environmental mandates may result in fines or penalties. We may be at risk for higher than anticipated inflation both with respectrequired to pay all or a portion of the cost to remediate sites where our own workforce, as well as our materialspast activities, or the activities of other parties, caused environmental contamination.
Changes in environmental policies and labor that we contract for with others. Thereregulations or regulatory decisions may be delays before these higher costs can be recovered in rates.
Our operations could be impacted by war, acts of terrorism, threats of terrorism or disruptions in normal operating conditions due to localized or regional events.
Our generation plants, fuel storage facilities, transmission and distribution facilities and information and control systems may be targets of terrorist activities. Any such disruption could impact operations or result in a decrease in revenuesearly retirements of our generation facilities. While regulation typically provides relief for these types of changes, there is no assurance that regulators would allow full recovery of all remaining costs.
We are subject to mandates to provide customers with clean energy, renewable energy and additional costs to repair and insure our assets. These disruptions could have a material impact on our financial condition and results of operations. The potential for terrorism has subjected our operations to increased risks andenergy conservation offerings. It could have a material effect on our business. We have alreadyresults of operations, financial condition or cash flows if our regulators do not allow us to recover the cost of capital investment or O&M costs incurred increased costs for security and capital expenditures in response to these risks. In addition, we may experience additional capital and operating costs to implement security for our plants, including our nuclear power plants under the NRC’s design basis threat requirements. We have also already incurred increased costs for compliance with NERC reliability standards associated with critical infrastructure protection. In addition, we may experience additional capital and operating costs to comply with the NERC critical infrastructure protection standards as theyrequirements.
In addition, existing environmental laws or regulations may be revised and new laws or regulations may be adopted. We may also incur additional unanticipated obligations or liabilities under existing environmental laws and regulations.
We are implementedsubject to physical and clarified.financial risks associated with climate change and other weather, natural disaster and resource depletion impacts.
The insurance industry has also beenClimate change can create physical and financial risk. Physical risks include changes in weather conditions and extreme weather events. Our customers’ energy needs vary with weather. To the extent weather conditions are affected by these eventsclimate change, customers’ energy use could increase or decrease. Increased energy use due to weather changes may require us to invest in generating assets, transmission and infrastructure. Decreased energy use due to weather changes may result in decreased revenues.
Climate change may impact the economy, which could impact our sales and revenues. The price of energy has an impact on the economic health of our communities. The cost of additional regulatory requirements, such as regulation of GHG, could impact the availability of insurance may decrease. In addition,goods and prices charged by our suppliers which would normally be borne by consumers through higher prices for energy and purchased goods.
To the insurance weextent financial markets view climate change and emissions of GHGs as a financial risk, this could negatively affect our ability to access capital markets or cause us to receive less than ideal terms and conditions.
We have committed to a number of long-term climate change goals, which in part are abledependent on future technologies not currently in existence. Given the long-term nature of these goals, there is an inherent uncertainty due to obtain may have higher deductibles, higher premiumsinternal and more restrictive policy terms.
A disruption ofexternal factors regarding our ability to achieve our stated climate change goals. To the regional electric transmission grid, interstate natural gas pipeline infrastructure or other fuel sources,extent climate change goals are not met, this could negatively impact our business, as well as our brandreputation and reputation. Because our generation, the transmission systems and local natural gas distribution companies are part of an interconnected system, we face the risk of possible loss of business due to a disruption caused by the actions of a neighboring utility or an event (such as severe storm, severe temperature extremes, wildfires, solar storms, generator or transmission facility outage, breakdown or failure of equipment, pipeline rupture, railroad disruption, operator error, sudden and significant increase or decrease in wind generation or any disruption of work force such as may be caused by flu or other epidemic) within our operating systems or on a neighboring system. Any such disruption couldpotentially result in a significant decreasefinancial risk.
Severe weather impacts our service territories, primarily when thunderstorms, flooding, tornadoes, wildfires and snow or ice storms occur. Extreme weather conditions in revenuesgeneral require system backup and significant additional costscan contribute to repair assets, whichincreased system stress, including service interruptions. Extreme weather conditions creating high energy demand may raise electricity prices, increasing the cost of energy we provide to our customers.
To the extent the frequency of extreme weather events increases, this could have a material impact onincrease our financial condition and results.
The degree to which we are able to maintain day-to-day operations in response to unforeseen events will in part determine the financial impactcost of certain events on our financial condition and results. It is difficult to predict the magnitudeproviding service. Periods of such events and associated impacts.
A cyber incident or cyber security breachextreme temperatures could have a material effect on our business.
We operate in an industry that requires the continued operation of sophisticated information technology and control systems and network infrastructure. In addition, we use our systems and infrastructure to create, collect, use, disclose, store, dispose of and otherwise process sensitive information, including company data, customer energy usage data, and personal information regarding customers, employees and their dependents, contractors, shareholders and other individuals.
Our generation, transmission, distribution and fuel storage facilities, information technology systems and other infrastructure or physical assets, as well as the information processed in our systems (such as information about our customers, employees, operations, infrastructure and assets) could be affected by cyber security incidents, including those caused by human error. Our industry has begun to see an increased volume and sophistication of cyber security incidents from international activist organizations, Nation States and individuals. Cyber security incidents could harm our businesses by limiting our generating, transmitting and distributing capabilities, delaying our development and construction of new facilities or capital improvement projects to existing facilities, disrupting our customer operations or exposing us to liability. Our generation, transmission systems and natural gas pipelines are part of an interconnected system. Therefore, a disruption caused by the impact of a cyber security incident of the regional electric transmission grid, natural gas pipeline infrastructure or other fuel sources of our third party service providers’ operations, could also negatively impact our business. Our supply chain for procurement of digital equipment may expose softwareability to meet demand. Changes in precipitation resulting in droughts or hardwarewater shortages could adversely affect our operations. Drought conditions also contribute to these risks and could resultthe increase in a breach or significant costs of remediation. In addition, such an event would likely receive regulatory scrutiny at both the federal and state level. We are unable to quantify the potential impact of cyber security threats or subsequent related actions. These potential cyber security incidents and corresponding regulatory action could result in a material decrease in revenues and may causesignificant additional costs (e.g., penalties, third party claims, repairs, insurance or compliance) and potentially disruptwildfire risk from our supply and markets for natural gas, oil and other fuels.electric generation facilities.
We maintain security measures designed to protect our information technology and control systems, network infrastructure and other assets. However, these assets and the information they process may be vulnerable to cyber security incidents, including the resulting disability, or failures of assets or unauthorized access to assets or information. If our technology systems were to fail or be breached, or those of our third-party service providers, we may be unable to fulfill critical business functions, including effectively maintaining certain internal controls over financial reporting. We are unable to quantify the potential impact of cyber security incidents on our business, our brand, and our reputation. The cyber security threat is dynamic and evolves continually, and our efforts to prioritize network monitoring may not be effective given the constant changes to threat vulnerability.
Rising energy prices could negatively impact our business.
Although commodity prices are currently relatively low, if fuel costs increase, customer demand could decline and bad debt expense may rise, which could have a material impact on our results of operations. While we have fuel clause recovery mechanisms in most ofcarry liability insurance, given an extreme event, if Xcel Energy was found to be liable for wildfire damages, amounts that potentially exceed our states, higher fuel costscoverage could significantlynegatively impact our results of operations, if costs are not recovered. Delays in the timing of the collection of fuel cost recoveries as compared with expenditures for fuel purchases could have an impact on our cash flows. Low fuel costs could have a positive impact on sales, though low oil and natural gas prices could negatively impact oil and gas production activities and subsequently our sales volumes and revenue. We are unable to predict future prices or the ultimate impact of such prices on our results of operationsfinancial condition or cash flows.
Our operating resultsDrought or water depletion could adversely impact our ability to provide electricity to customers, cause early retirement of power plants and increase the cost for energy. Adverse events may fluctuate on a seasonal and quarterly basis and can be adversely affected by milder weather.
Our electric and natural gas utility businesses are seasonal, and weather patterns can have a material impact on our operating performance. Demand for electricity is often greaterresult in the summer and winter months associated with cooling and heating. Because natural gas is heavily used for residential and commercial heating, the demand depends heavily upon weather patterns throughout our service territory, and a significant amount of natural gas revenues are recognized in the first and fourth quartersincreased insurance costs and/or decreased insurance availability. We may not recover all costs related to the heating season. Accordingly, our operations have historically generated less revenuesmitigating these physical and income when weather conditions are milder in the winter and cooler in the summer. Unusually mild winters and summers could have an adverse effect on our financial condition, results of operations, or cash flows.risks.
Our operations use third party contractors in addition to employees to perform periodic and on-going work.
We rely on third party contractors with specific qualifications to perform work both for ongoing operations and maintenance and for capital construction. We have contractual arrangements with these contractors which typically include performance standards, progress payments, insurance requirements and security for performance. Cyber security breaches seen in the news have at times exploited third party equipment or software in order to gain access. Poor vendor performance could impact on going operations, restoration operations, our reputation and could introduce financial risk or risks of fines.
Item 1B — Unresolved Staff Comments
| | |
| ITEM 1B — UNRESOLVED STAFF COMMENTS |
None.
Item 2 — Properties
Virtually all of the utility plant property of NSP-Minnesota, NSP-Wisconsin, PSCo and SPSthe operating companies is subject to the lien of their respective first mortgage bond indentures.
| | | | | | | | | | | | | | | | | | | | | | | |
NSP-Minnesota Station, Location and Unit at Dec. 31, 2021 | | Fuel | | Installed | | MW (a) | |
| Steam: | | | | | | | |
A.S. King-Bayport, MN, 1 Unit (f) | | Coal | | 1968 | | 511 | | |
Sherco-Becker, MN (e) | | | | | | | |
| Unit 1 | | Coal | | 1976 | | 680 | | |
| Unit 2 | | Coal | | 1977 | | 682 | | |
| Unit 3 | | Coal | | 1987 | | 517 | | (b) |
| Monticello, MN, 1 Unit | | Nuclear | | 1971 | | 617 | | |
| PI-Welch, MN | | | | | | | |
| Unit 1 | | Nuclear | | 1973 | | 521 | | |
| Unit 2 | | Nuclear | | 1974 | | 519 | | |
| Various locations, 4 Units | | Wood/Refuse | | Various | | 36 | | (c) |
| Combustion Turbine: | | | | | | | |
| Angus Anson-Sioux Falls, SD, 3 Units | | Natural Gas | | 1994 - 2005 | | 327 | | |
| Black Dog-Burnsville, MN, 3 Units | | Natural Gas | | 1987 - 2018 | | 494 | | |
| Blue Lake-Shakopee, MN, 6 Units | | Natural Gas | | 1974 - 2005 | | 447 | | |
| High Bridge-St. Paul, MN, 3 Units | | Natural Gas | | 2008 | | 530 | | |
| Inver Hills-Inver Grove Heights, MN, 6 Units | | Natural Gas | | 1972 | | 252 | | |
| Riverside-Minneapolis, MN, 3 Units | | Natural Gas | | 2009 | | 454 | | |
| Various locations, 7 Units | | Natural Gas | | Various | | 10 | | |
| Wind: | | | | | | | |
| Blazing Star 1-Lincoln County, MN, 100 Units | | Wind | | 2020 | | 200 | | (d) |
| Blazing Star 2-Lincoln County, MN, 100 Units | | Wind | | 2021 | | 200 | | (d) |
| Border-Rolette County, ND, 75 Units | | Wind | | 2015 | | 148 | | (d) |
| Community Wind North-Lincoln County, MN, 12 Units | | Wind | | 2020 | | 26 | | (d) |
| Courtenay Wind-Stutsman County, ND, 100 Units | | Wind | | 2016 | | 190 | | (d) |
| Crowned Ridge 2-Grant County, SD, 88 Units | | Wind | | 2020 | | 192 | | (d) |
| Foxtail-Dickey County, ND, 75 Units | | Wind | | 2019 | | 150 | | (d) |
| Freeborn-Freeborn County, MN, 100 Units | | Wind | | 2021 | | 200 | | (d) |
| Grand Meadow-Mower County, MN, 67 Units | | Wind | | 2008 | | 99 | | (d) |
| Jeffers-Cottonwood County, MN, 20 Units | | Wind | | 2020 | | 43 | | (d) |
| Lake Benton-Pipestone County, MN, 44 Units | | Wind | | 2019 | | 99 | | (d) |
| Mower-Mower County, MN, 43 Units | | Wind | | 2021 | | 91 | | (d) |
| Nobles-Nobles County, MN, 134 Units | | Wind | | 2010 | | 197 | | (d) |
| Pleasant Valley-Mower County, MN, 100 Units | | Wind | | 2015 | | 196 | | (d) |
| | | | Total | | 8,628 | | |
Electric Utility Generating Stations:(a)Summer 2021 net dependable capacity.
(b)Based on NSP-Minnesota’s ownership of 59%.
(c)Refuse-derived fuel is made from municipal solid waste.
(d)Values disclosed are the generation levels at the point-of-interconnection for these wind units. Capacity is attainable only when wind conditions are sufficiently available (on-demand net dependable capacity is zero).
(e)A.S. King is expected to be retired early in 2028.
(f)Sherco Unit 1, 2, and 3 are expected to be retired early in 2026, 2023 and 2030, respectively.
| | | | | | | | | | | | | | | | | | | | | | | |
NSP-Wisconsin Station, Location and Unit at Dec. 31, 2021 | | Fuel | | Installed | | MW (a) | |
| Steam: | | | | | | | |
| Bay Front-Ashland, WI, 2 Units | | Wood/Natural Gas | | 1948 - 1956 | | 41 | | |
| French Island-La Crosse, WI, 2 Units | | Wood/Refuse | | 1940 - 1948 | | 16 | | (b) |
| Combustion Turbine: | | | | | | | |
| French Island-La Crosse, WI, 2 Units | | Oil | | 1974 | | 122 | | |
| Wheaton-Eau Claire, WI, 5 Units | | Natural Gas/Oil | | 1973 | | 234 | | |
| Hydro: | | | | | | | |
| Various locations, 63 Units | | Hydro | | Various | | 135 | | |
| | | | Total | | 548 | | |
|
| | | | | | | | |
NSP-Minnesota
Station, Location and Unit | | Fuel | | Installed | | Summer 2017 Net Dependable Capability (MW) | |
| Steam: | | | | | | | |
| A.S. King-Bayport, Minn., 1 Unit | | Coal | | 1968 | | 511 |
| |
| Sherco-Becker, Minn. | | | | | | | |
| Unit 1 | | Coal | | 1976 | | 680 |
| |
| Unit 2 | | Coal | | 1977 | | 682 |
| |
| Unit 3 | | Coal | | 1987 | | 517 |
| (a) |
| Monticello-Monticello, Minn., 1 Unit | | Nuclear | | 1971 | | 617 |
| |
| PI-Welch, Minn. | | | | | | | |
| Unit 1 | | Nuclear | | 1973 | | 521 |
| |
| Unit 2 | | Nuclear | | 1974 | | 519 |
| |
| Various locations, 4 Units | | Wood/Refuse-derived fuel | | Various | | 36 |
| (b) |
| Combustion Turbine: | | | | | | | |
| Angus Anson-Sioux Falls, S.D., 3 Units | | Natural Gas | | 1994-2005 | | 327 |
| |
| Black Dog-Burnsville, Minn., 2 Units | | Natural Gas | | 1987-2002 | | 282 |
| |
| Blue Lake-Shakopee, Minn., 6 Units | | Natural Gas | | 1974-2005 | | 453 |
| |
| High Bridge-St. Paul, Minn., 3 Units | | Natural Gas | | 2008 | | 530 |
| |
| Inver Hills-Inver Grove Heights, Minn., 6 Units | | Natural Gas | | 1972 | | 282 |
| |
| Riverside-Minneapolis, Minn., 3 Units | | Natural Gas | | 2009 | | 454 |
| |
| Various locations, 14 Units | | Natural Gas | | Various | | 67 |
| |
| Wind: | | | | | | | |
| Border-Rolette County, N.D., 75 Units | | Wind | | 2015 | | 148 |
| (c) |
| Courtenay Wind, N.D., 100 Units | | Wind | | 2016 | | 195 |
| (c) |
| Grand Meadow-Mower County, Minn., 67 Units | | Wind | | 2008 | | 101 |
| (c) |
| Nobles-Nobles County, Minn., 134 Units | | Wind | | 2010 | | 201 |
| (c) |
| Pleasant Valley-Mower County, Minn., 100 Units | | Wind | | 2015 | | 196 |
| (c) |
| | | | | Total | | 7,319 |
| |
| |
(a)
| Based on NSP-Minnesota’s ownership of 59 percent. |
| |
(b)
| Refuse-derived fuel is made from municipal solid waste. |
| |
(c)
| This capacity is only available when wind conditions are sufficiently high enough to support the noted generation values above. Therefore, the on-demand net dependable capacity is zero. |
(a)Summer 2021 net dependable capacity.
(b)Refuse-derived fuel is made from municipal solid waste. |
| | | | | | | | |
NSP-Wisconsin
Station, Location and Unit | | Fuel | | Installed | | Summer 2017 Net Dependable Capability (MW) | |
| Steam: | | | | | | | |
| Bay Front-Ashland, Wis., 3 Units | | Coal/Wood/Natural Gas | | 1948-1956 | | 56 |
| |
| French Island-La Crosse, Wis., 2 Units | | Wood/Refuse-derived fuel | | 1940-1948 | | 16 |
| (a) |
| Combustion Turbine: | | | | | | | |
| Flambeau Station-Park Falls, Wis., 1 Unit | | Natural Gas | | 1969 | | — |
| (b) |
| French Island-La Crosse, Wis., 2 Units | | Oil | | 1974 | | 122 |
| |
| Wheaton-Eau Claire, Wis., 5 Units | | Natural Gas/Oil | | 1973 | | 238 |
| |
| Hydro: | | | | | | | |
| Various locations, 63 Units | | Hydro | | Various | | 135 |
| |
| | | | | Total | | 567 |
| |
| |
(a)
| Refuse-derived fuel is made from municipal solid waste. |
| |
(b)
| Flambeau Station was retired on Dec. 31, 2017. |
| | | | | | | | | | | | | | | | | | | | | | | |
PSCo Station, Location and Unit at Dec. 31, 2021 | | Fuel | | Installed | | MW (a) | |
| Steam: | | | | | | | |
Comanche-Pueblo, CO (b) | | | | | | | |
| Unit 1 | | Coal | | 1973 | | 325 | | |
| Unit 2 | | Coal | | 1975 | | 335 | | |
| Unit 3 | | Coal | | 2010 | | 500 | | (c) |
Craig-Craig, CO, 2 Units (d) | | Coal | | 1979 - 1980 | | 82 | | (e) |
Hayden-Hayden, CO, 2 Units | | Coal | | 1965 - 1976 | | 233 | | (f) |
| Pawnee-Brush, CO, 1 Unit | | Coal | | 1981 | | 505 | | |
| Cherokee-Denver, CO, 1 Unit | | Natural Gas | | 1968 | | 310 | | |
| Combustion Turbine: | | | | | | | |
| Blue Spruce-Aurora, CO, 2 Units | | Natural Gas | | 2003 | | 264 | | |
| Cherokee-Denver, CO, 3 Units | | Natural Gas | | 2015 | | 576 | | |
| Fort St. Vrain-Platteville, CO, 6 Units | | Natural Gas | | 1972 - 2009 | | 973 | | |
| Rocky Mountain-Keenesburg, CO, 3 Units | | Natural Gas | | 2004 | | 580 | | |
| Various locations, 8 Units | | Natural Gas | | Various | | 251 | | |
| Hydro: | | | | | | | |
| Cabin Creek-Georgetown, CO | | | | | | | |
| Pumped Storage, 2 Units | | Hydro | | 1967 | | 210 | | |
| Various locations, 8 Units | | Hydro | | Various | | 25 | | |
| Wind: | | | | | | | |
| Rush Creek, CO, 300 units | | Wind | | 2018 | | 582 | | (g) |
| Cheyenne Ridge, CO, 229 units | | Wind | | 2020 | | 477 | | (g) |
| | | | Total | | 6,228 | | |
|
| | | | | | | | |
PSCo
Station, Location and Unit | | Fuel | | Installed | | Summer 2017 Net Dependable Capability (MW) | |
| Steam: | | | | | | | |
| Comanche-Pueblo, Colo. | | | | | | | |
| Unit 1 | | Coal | | 1973 | | 325 |
| |
| Unit 2 | | Coal | | 1975 | | 335 |
| |
| Unit 3 | | Coal | | 2010 | | 500 |
| (b) |
| Craig-Craig, Colo., 2 Units | | Coal | | 1979-1980 | | 83 |
| (c) |
| Hayden-Hayden, Colo., 2 Units | | Coal | | 1965-1976 | | 233 |
| (d) |
| Pawnee-Brush, Colo., 1 Unit | | Coal | | 1981 | | 505 |
| |
| Valmont-Boulder, Colo., 1 Unit | | Coal | | 1964 | | — |
| (e) |
| Combustion Turbine: | | | | | | | |
| Blue Spruce-Aurora, Colo., 2 Units | | Natural Gas | | 2003 | | 264 |
| |
| Cherokee-Denver, Colo., 1 Unit | | Natural Gas | | 1968 | | 310 |
| (a) |
| Cherokee-Denver, Colo., 3 Units | | Natural Gas | | 2015 | | 576 |
| |
| Fort St. Vrain-Platteville, Colo., 6 Units | | Natural Gas | | 1972-2009 | | 968 |
| |
| Rocky Mountain-Keenesburg, Colo., 3 Units | | Natural Gas | | 2004 | | 580 |
| |
| Various locations, 6 Units | | Natural Gas | | Various | | 171 |
| |
| Hydro: | | | | | | | |
| Cabin Creek-Georgetown, Colo. | | | | | | | |
| Pumped Storage, 2 Units | | Hydro | | 1967 | | 210 |
| |
| Various locations, 9 Units | | Hydro | | Various | | 26 |
| |
| | | | | Total | | 5,086 |
| |
(a) Cherokee Unit 4 was fuel switched from coal to natural gas(b) In 2018, the CPUC approved early retirement of PSCo’s Comanche Units 1 and 2 in the third quarter of 2017.2022 and 2025, respectively.
(b) (c) Based on PSCo’s ownership interest of 67 percent of67%.
(d) Craig Unit 3.1 and 2 are expected to be retired early in 2025 and 2028, respectively.
(c) (e) Based on PSCo’s ownership interest of 10 percent. Craig10%.
(f) Based on PSCo’s ownership of 76% of Unit 1 and 37% of Unit 2.
(g) Values disclosed are the generation levels at the point-of-interconnection. Capacity is attainable only when wind conditions are sufficiently available (on-demand net dependable capacity is zero).
| | | | | | | | | | | | | | | | | | | | | | | |
SPS Station, Location and Unit at Dec. 31, 2021 | | Fuel | | Installed | | MW (a) | |
| Steam: | | | | | | | |
| Cunningham-Hobbs, NM, 2 Units | | Natural Gas | | 1957 - 1965 | | 225 | | |
Harrington-Amarillo, TX, 3 Units (b) | | Coal | | 1976 - 1980 | | 1,018 | | |
| Jones-Lubbock, TX, 2 Units | | Natural Gas | | 1971 - 1974 | | 486 | | |
| Maddox-Hobbs, NM, 1 Unit | | Natural Gas | | 1967 | | 112 | | |
| Nichols-Amarillo, TX, 3 Units | | Natural Gas | | 1960 - 1968 | | 457 | | |
| Plant X-Earth, TX, 4 Units | | Natural Gas | | 1952 - 1964 | | 298 | | |
Tolk-Muleshoe, TX, 2 Units (d) | | Coal | | 1982 - 1985 | | 1,067 | | |
| Combustion Turbine: | | | | | | | |
| Cunningham-Hobbs, NM, 2 Units | | Natural Gas | | 1997 | | 207 | | |
| Jones-Lubbock, TX, 2 Units | | Natural Gas | | 2011 - 2013 | | 334 | | |
| Maddox-Hobbs, NM, 1 Unit | | Natural Gas | | 1963 - 1976 | | 61 | | |
| Wind: | | | | | | | |
| Hale-Plainview, TX, 239 Units | | Wind | | 2019 | | 477 | | (c) |
| Sagamore-Dora, NM, 240 Units | | Wind | | 2020 | | 507 | | (c) |
| | | | Total | | 5,249 | | |
(a) Summer 2021 net dependable capacity.
(b) Harrington is expected to be early retired in approximately 2025.converted to natural gas by the end of 2024.
(c) Values disclosed are the generation levels at the point-of-interconnection for these wind units. Capacity is attainable only when wind conditions are sufficiently available (on-demand net dependable capacity is zero).
(d) Based on PSCo’s ownership interest of 76 percent ofTolk Unit 1 and 37 percent of Unit 2.
(e) Valmont Unit 5 was2 are proposed to be retired in the third quarter of 2017.2034.
|
| | | | | | | | |
SPS
Station, Location and Unit | | Fuel | | Installed | | Summer 2017 Net Dependable Capability (MW) | |
| Steam: | | | | | | | |
| Cunningham-Hobbs, N.M., 2 Units | | Natural Gas | | 1957-1965 | | 254 |
| |
| Harrington-Amarillo, Texas, 3 Units | | Coal | | 1976-1980 | | 1,018 |
| |
| Jones-Lubbock, Texas, 2 Units | | Natural Gas | | 1971-1974 | | 486 |
| |
| Maddox-Hobbs, N.M., 1 Unit | | Natural Gas | | 1967 | | 112 |
| |
| Nichols-Amarillo, Texas, 3 Units | | Natural Gas | | 1960-1968 | | 457 |
| |
| Plant X-Earth, Texas, 4 Units | | Natural Gas | | 1952-1964 | | 411 |
| |
| Tolk-Muleshoe, Texas, 2 Units | | Coal | | 1982-1985 | | 1,067 |
| |
| Combustion Turbine: | | | | | | | |
| Carlsbad-Carlsbad, N.M., 1 Unit | | Natural Gas | | 1968 | | — |
| (a) |
| Cunningham-Hobbs, N.M., 2 Units | | Natural Gas | | 1998 | | 212 |
| |
| Jones-Lubbock, Texas, 2 Units | | Natural Gas | | 2011-2013 | | 336 |
| |
| Maddox-Hobbs, N.M., 1 Unit | | Natural Gas | | 1963-1976 | | 61 |
| |
| | | | | Total | | 4,414 |
| |
(a) Carlsbad Unit 5 was retired on Dec. 31, 2017.
Electric utility overhead and underground transmissiontransmission and distribution lines (measured in conductor miles) at Dec. 31, 2017:2021:
| | | | | | | | | | | | | | | | | | | | | | | | | | |
| Conductor Miles | | NSP-Minnesota | | NSP-Wisconsin | | PSCo | | SPS |
| Transmission | | | | | | | | |
| 500 KV | | 2,915 | | | — | | | — | | | — | |
| 345 KV | | 13,570 | | | 2,943 | | | 4,978 | | | 11,688 | |
| 230 KV | | 2,300 | | | — | | | 12,141 | | | 9,763 | |
| 161 KV | | 640 | | | 1,778 | | | — | | | — | |
| 138 KV | | — | | | — | | | 92 | | | — | |
| 115 KV | | 8,086 | | | 1,818 | | | 5,075 | | | 14,880 | |
| Less than 115 KV | | 6,644 | | | 5,870 | | | 1,830 | | | 4,423 | |
| Total Transmission | | 34,155 | | | 12,409 | | | 24,116 | | | 40,754 | |
| | | | | | | | |
| Distribution | | | | | | | | |
| Less than 115 KV | | 81,406 | | | 27,701 | | | 78,712 | | | 22,651 | |
| | | | | | | | |
| Total | | 115,561 | | | 40,110 | | | 102,828 | | | 63,405 | |
|
| | | | | | | | | | | | |
| Conductor Miles | | NSP-Minnesota | | NSP-Wisconsin | | PSCo | | SPS |
| 500 KV | | 2,917 |
| | — |
| | — |
| | — |
|
| 345 KV | | 9,040 |
| | 1,153 |
| | 2,630 |
| | 8,516 |
|
| 230 KV | | 2,157 |
| | — |
| | 12,911 |
| | 9,608 |
|
| 161 KV | | 417 |
| | 1,656 |
| | — |
| | — |
|
| 138 KV | | — |
| | — |
| | 92 |
| | — |
|
| 115 KV | | 7,515 |
| | 1,877 |
| | 4,969 |
| | 13,555 |
|
| Less than 115 KV | | 85,458 |
| | 32,600 |
| | 76,988 |
| | 24,795 |
|
Electric utility transmission and distribution substations at Dec. 31, 2017:
|
| | | | | | | | | | | | | |
| | | NSP-Minnesota | | NSP-Wisconsin | | PSCo | | SPS |
| Quantity | | 349 |
| — |
| 203 |
| | 230 |
| | 454 |
|
2021: | | | | | | | | | | | | | | | | | | | | | | | | | | |
| | NSP-Minnesota | | NSP-Wisconsin | | PSCo | | SPS |
| Quantity | | 354 | | | 204 | | | 237 | | | 458 | |
Natural gas utility mains at Dec. 31, 2017:2021:
| | | | | | | | | | | | | | | | | | | | | | | | | | | | | | | | |
| Miles | | NSP-Minnesota | | NSP-Wisconsin | | PSCo | | SPS | | WGI |
| Transmission | | 85 | | | 3 | | | 2,174 | | | 20 | | | 11 | |
| Distribution | | 10,741 | | | 2,526 | | | 23,243 | | | — | | | — | |
|
| | | | | | | | | | | | |
| Miles | | NSP-Minnesota | | NSP-Wisconsin | | PSCo | | WGI |
| Transmission | | 136 |
| | — |
| | 2,315 |
| | 11 |
|
| Distribution | | 11,320 |
| | 2,542 |
| | 22,540 |
| | — |
|
Item 3 — Legal Proceedings
| | |
| ITEM 3 — LEGAL PROCEEDINGS |
Xcel Energy is involved in various litigation matters that are being defended and handled in the ordinary course of business. The assessment of whether a loss is probable or is a reasonable possibility, and whether the loss or a range of loss is estimable, often involves a series of complex judgments about future events. Management maintains accruals for such losses that are probable of being incurred and subject to reasonable estimation.
Management is sometimes unable to estimate an amount or range of a reasonably possible loss in certain situations, including but not limited to when (1) the damages sought are indeterminate, (2) the proceedings are in the early stages, or (3) the matters involve novel or unsettled legal theories. In such cases, there is considerable uncertainty regarding the timing or ultimate resolution of such matters, including a possible eventual loss.
Additional Information
See Note 13 toFor current proceedings not specifically reported herein, management does not anticipate that the ultimate liabilities, if any, would have a material effect on Xcel Energy’s consolidated financial statements for further discussion of legal claims and environmental proceedings. statements. Legal fees are generally expensed as incurred.
See Item 1, Item 7 and Note 12 to the consolidated financial statements, Item 1 and Item 7 for a discussion of proceedings involving utility rates and other regulatory matters.further information.
Item 4 — Mine Safety Disclosures
| | |
| ITEM 4 — MINE SAFETY DISCLOSURES |
None.
PART II
| | |
| ITEM 5 — MARKET FOR REGISTRANT’S COMMON EQUITY, RELATED STOCKHOLDER MATTERS AND ISSUER PURCHASES OF EQUITY SECURITIES. |
Item 5 — Market for Registrant’s Common Equity, Related Stockholder Matters and Issuer Purchases of Equity Securities
Quarterly Stock Data
Xcel Energy Inc.’s common stock wasis listed on the New York Stock Exchange (NYSE) in 2017, but moved to the Nasdaq Global Select Market (Nasdaq) in 2018.. The trading symbol is XEL. The number of common shareholdersstockholders of record as of Dec. 31, 2017Feb. 17, 2022 was approximately 59,270. The following are the intra-day high and low stock prices based on the NYSE Composite Transactions for the quarters of 2017 and 2016 and the dividends declared per share during those quarters. See Item 7 and Note 4 to the consolidated financial statements for further discussion of Xcel Energy Inc.’s dividend policy and restrictions.
|
| | | | | | | | | | | | |
| 2017 | | High | | Low | | Dividends |
| First quarter | | $ | 45.06 |
| | $ | 40.04 |
| | $ | 0.3600 |
|
| Second quarter | | 48.50 |
| | 44.00 |
| | 0.3600 |
|
| Third quarter | | 50.56 |
| | 45.18 |
| | 0.3600 |
|
| Fourth quarter | | 52.22 |
| | 46.86 |
| | 0.3600 |
|
|
| | | | | | | | | | | | |
| 2016 | | High | | Low | | Dividends |
| First quarter | | $ | 41.85 |
| | $ | 35.19 |
| | $ | 0.3400 |
|
| Second quarter | | 44.78 |
| | 38.43 |
| | 0.3400 |
|
| Third quarter | | 45.42 |
| | 40.34 |
| | 0.3400 |
|
| Fourth quarter | | 41.80 |
| | 38.00 |
| | 0.3400 |
|
49,137.
The following compares our cumulative TSR on common stock with the cumulative TSR of the EEI Investor-Owned Electrics Index and the S&P 500 Composite Stock Price Index over the last five years (assuming a $100 investment on Dec. 31, 2012, and the reinvestment of all dividends).
years.
The EEI Investor-Owned Electrics Index (market capitalization-weighted) included 4339 companies at year-end and is a broad measure of industry performance.
Comparison of Five Year Cumulative Total Return*
COMPARISON OF FIVE YEAR CUMULATIVE TOTAL RETURN*
Among Xcel Energy Inc., the EEI Investor-Owned Electrics
and the S&P 500
* $100 invested on Dec. 31, 20122016 in stock or index — including reinvestment of dividends. Fiscal years endingended Dec. 31.
|
| | | | | | | | | | | | | | | | | | | | | | | |
| | 2012 | | 2013 | | 2014 | | 2015 | | 2016 | | 2017 |
| Xcel Energy Inc. | $ | 100 |
| | $ | 109 |
| | $ | 145 |
| | $ | 151 |
| | $ | 177 |
| | $ | 215 |
|
| EEI Investor-Owned Electrics | 100 |
| | 113 |
| | 146 |
| | 140 |
| | 164 |
| | 184 |
|
| S&P 500 | 100 |
| | 132 |
| | 151 |
| | 153 |
| | 171 |
| | 208 |
|
Securities Authorized for Issuance Under Equity Compensation Plans
Information required under Item 5 — Securities Authorized for Issuance Under Equity Compensation Plans is contained in Xcel Energy Inc.’s Proxy Statement for its 2018 Annual Meeting of Shareholders, which is incorporated by reference.
UNREGISTERED SALES OF EQUITY SECURITIES AND USE OF PROCEEDS
Purchases of Equity Securities by the Issuer and Affiliated Purchasers
The following table provides information about our purchases ofFor the quarter ended Dec. 31, 2021, no equity securities that are registered by Xcel Energy Inc. for the fourth quarter of fiscal year 2017, pursuant to Section 12 of the Securities Exchange Act:Act of 1934 were purchased by or on behalf of us or any of our affiliated purchasers.
|
| | | | | | | | | | | | | |
| | Issuer Purchases of Equity Securities |
Period | | Total Number
of Shares
Purchased
| | Average Price
Paid per Share
| | Total Number of
Shares Purchased as
Part of Publicly
Announced Plans or
Programs
| | Maximum Number of Shares That May Yet Be Purchased Under the Plans or Programs |
Oct. 1, 2017ITEM 6 — Dec. 31, 2017 | | — |
| | $ | — |
| | | | |
Total | | — |
| |
|
| | — |
| | — |
[RESERVED] |
Item 6 — Selected Financial Data
Set forth below is selected financial data for Xcel Energy related to the most five recent years ended Dec. 31. This information has been derived from and should be read in conjunction with the consolidated financial statements and notes appearing elsewhere in this annual report on Form 10-K.
|
| | | | | | | | | | | | | | | | | | | | |
| (Millions of Dollars, Millions of Shares, Except Per Share Data) | | 2017 | | 2016 | | 2015 | | 2014 | | 2013 |
| Operating revenues | | $ | 11,404 |
| | $ | 11,107 |
| | $ | 11,024 |
| | $ | 11,686 |
| | $ | 10,915 |
|
| Operating expenses | | 9,214 |
| | 8,893 |
| | 9,024 |
| | 9,738 |
| | 9,067 |
|
| Net income | | 1,148 |
| | 1,123 |
| | 984 |
| | 1,021 |
| | 948 |
|
| Earnings available to common shareholders | | 1,148 |
| | 1,123 |
| | 984 |
| | 1,021 |
| | 948 |
|
| Weighted average common shares outstanding: | | | | | | | | | | |
| Basic | | 509 |
| | 509 |
| | 508 |
| | 504 |
| | 496 |
|
| Diluted | | 509 |
| | 509 |
| | 508 |
| | 504 |
| | 497 |
|
| GAAP EPS: | | | | | | | | | | |
| Basic | | $ | 2.26 |
| | $ | 2.21 |
| | $ | 1.94 |
| | $ | 2.03 |
| | $ | 1.91 |
|
| Diluted | | 2.25 |
| | 2.21 |
| | 1.94 |
| | 2.03 |
| | 1.91 |
|
| Dividends declared per common share | | 1.44 |
| | 1.36 |
| | 1.28 |
| | 1.20 |
| | 1.11 |
|
Total assets (a) (b) | | 43,030 |
| | 41,155 |
| | 38,821 |
| | 36,958 |
| | 33,907 |
|
Long-term debt (b) (c) | | 14,520 |
| | 14,195 |
| | 12,399 |
| | 11,500 |
| | 10,911 |
|
| Book value per share | | 22.56 |
| | 21.73 |
| | 20.89 |
| | 20.20 |
| | 19.21 |
|
| Return on average common equity | | 10.2 | % | | 10.4 | % | | 9.5 | % | | 10.3 | % | | 10.3 | % |
Ratio of earnings to fixed charges (d) | | 3.3 |
| | 3.3 |
| | 3.2 |
| | 3.3 |
| | 3.1 |
|
| | | | | | | | | | | |
| Non-GAAP: | | | | | | | | | | |
Ongoing earnings (e) | | $ | 1,171 |
| | $ | 1,123 |
| | $ | 1,064 |
| | $ | 1,021 |
| | $ | 968 |
|
Ongoing diluted EPS (e) | | 2.30 |
| | 2.21 |
| | 2.09 |
| | 2.03 |
| | 1.95 |
|
| | |
(a)
| As a result of adopting ASU No. 2015-17 (Balance Sheet Classification of Deferred Taxes, Topic 740), $140 million of current deferred income taxes was retrospectively reclassified to long-term deferred income tax liabilities on the consolidated balance sheet as of Dec. 31, 2015.
ITEM 7 — MANAGEMENT’S DISCUSSION AND ANALYSIS OF FINANCIAL CONDITION AND RESULTS OF OPERATIONS |
| |
(b)
| As a result of adopting ASU No. 2015-03 (Simplifying the Presentation of Debt Issuance Costs, Subtopic 835-30), $92 million of deferred debt issuance costs was retrospectively reclassified from other non-current assets to long-term debt on the consolidated balance sheet as of Dec. 31, 2015.
|
| |
(c)
| Includes capital lease obligations. |
| |
(e)
| See Item 7 for reconciliations of ongoing earnings and diluted EPS to GAAP earnings and diluted EPS. |
Item 7 — Management’s Discussion and Analysis ofNon-GAAP Financial Condition and Results of Operations
Business Segments and Organizational Overview
Xcel Energy Inc. is a public utility holding company. Xcel Energy’s operations included the activity of four utility subsidiaries that serve electric and natural gas customers in eight states. These utility subsidiaries are NSP-Minnesota, NSP-Wisconsin, PSCo and SPS. These utilities serve customers in portions of Colorado, Michigan, Minnesota, New Mexico, North Dakota, South Dakota, Texas and Wisconsin. Along with the TransCo subsidiaries, WYCO, a joint venture formed with CIG to develop and lease natural gas pipelines, storage and compression facilities, and WGI, an interstate natural gas pipeline company, these companies comprise the regulated utility operations.
Xcel Energy Inc.’s nonregulated subsidiaries are Eloigne and Capital Services. Eloigne invests in rental housing projects that qualify for low-income housing tax credits, and Capital Services procures equipment for construction of renewable generation facilities at other subsidiaries.
Forward-Looking Statements
Except for the historical statements contained in this report, the matters discussed herein are forward-looking statements that are subject to certain risks, uncertainties and assumptions. Such forward-looking statements, including the 2018 EPS guidance, the TCJA’s impact to Xcel Energy and its customers, long-term earnings per share and dividend growth rate, as well as assumptions and other statements identified in this document by the words “anticipate,” “believe,” “could,” “estimate,” “expect,” “intend,” “may,” “objective,” “outlook,” “plan,” “project,” “possible,” “potential,” “should,” “will,” “would” and similar expressions. Actual results may vary materially. Forward-looking statements speak only as of the date they are made, and we expressly disclaim any obligation to update any forward-looking information. The following factors, in addition to those discussed elsewhere in this Annual Report on Form 10-K for the fiscal year ended Dec. 31, 2017 (including the items described under Factors Affecting Results of Operations; and the other risk factors listed from time to time by Xcel Energy Inc. in reports filed with the SEC, including “Risk Factors” in Item 1A of this Annual Report on Form 10-K and Exhibit 99.01 hereto), could cause actual results to differ materially from management expectations as suggested by such forward-looking information: general economic conditions, including inflation rates, monetary fluctuations and their impact on capital expenditures and the ability of Xcel Energy Inc. and its subsidiaries to obtain financing on favorable terms; business conditions in the energy industry, including the risk of a slow down in the U.S. economy or delay in growth, recovery, trade, fiscal, taxation and environmental policies in areas where Xcel Energy has a financial interest; customer business conditions; actions of credit rating agencies; competitive factors including the extent and timing of the entry of additional competition in the markets served by Xcel Energy and its subsidiaries; unusual weather; effects of geopolitical events, including war and acts of terrorism; cyber security threats and data security breaches; state, federal and foreign legislative and regulatory initiatives that affect cost and investment recovery, have an impact on rates or have an impact on asset operation or ownership or impose environmental compliance conditions; structures that affect the speed and degree to which competition enters the electric and natural gas markets; costs and other effects of legal and administrative proceedings, settlements, investigations and claims; financial or regulatory accounting policies imposed by regulatory bodies; outcomes of regulatory proceedings; availability or cost of capital; and employee work force factors.
Management’s Strategic Priorities
Xcel Energy’s vision is to be the preferred and trusted provider of the energy our customers need. We continually evolve our business to meet the changing needs of our customers, investors and policymakers. We strive to provide our investors an attractive value proposition and our customers with safe, clean and reliable energy services at a competitive price. This mission is enabled via three key strategic priorities:
Lead the clean energy transition;
Enhance the customer experience; and
Keep bills low.
Successful execution of our strategic objectives should allow Xcel Energy to continue to deliver a competitive total return for our shareholders. Below is a discussion of these objectives.
Lead the clean energy transition
For more than a decade, we have managed the risk of climate change and increasing customer demand for renewable energy through a clean energy strategy that consistently reduces carbon emissions and transitions our operations for the future. As a result, we have successfully reduced our carbon emissions by 35 percent from 2005 to 2017. We expect to reduce our carbon footprint by 45 percent by 2021 and by 60 percent by 2030 (over 2005 levels).
Our service territories benefit from the geographic concentration of favorable renewable resources. Strong wind and high solar irradiance yield high generation capacity factors, which lowers the cost of these resources. The combination of high capacity factors, grid options from transmission investment and market operations, improved supply chain, technological improvements and the extension of the renewable tax credits translates into low renewable energy costs for our customers. As a result, we are able to invest in renewable generation, in which the capital costs are largely or completely offset by fuel savings. This provides us the opportunity to lower the emission profile of our generation fleet, grow our renewable portfolio and provide significant fuel savings to our customers. We call this our “Steel for Fuel” strategy.
We are transitioning how we produce, deliver and encourage the efficient use of energy through four primary mechanisms:
Increasing the use of affordable renewable energy;
Offering energy efficiency programs for customers;
Retiring or repowering coals units and modernizing our generating plants; and
Advancing power grid capabilities.
We have announced ambitious plans to add 3,680 MW of wind energy on our system by 2021. This includes:
The 600 MW Rush Creek project in Colorado that is under construction and will be owned entirely by Xcel Energy;
The 1,550 MW of wind generation in Minnesota and the Dakotas. This project has been approved by the MPUC and will include 1,150 MW of ownership and 400 MW of PPAs;
The proposed 1,230 MW of wind projects in Texas and New Mexico, which includes 1,000 MW of ownership and 230 MW of PPAs; and
The proposed 300 MW Dakota Range wind project in South Dakota.
In addition, the proposed CEP encompasses the retirement of 660 MW from two coal-fired units at Comanche and the potential addition of up to 1,000 MW of wind, 700 MW of solar and 700 MW of natural gas and/or storage.
Enhance the customer experience
The utility landscape is changing, and we must continue to thoughtfully anticipate and address the future needs of our stakeholders, including our customers, policymakers, employees and shareholders. Adapting to this changing environment is critical to our long-term success. Our customers expect to have choices, and we are committed to providing options and solutions that they want and value at a competitive price. Our continued investment in clean energy is an example of this commitment to our customers. Environmental stewardship remains foundational to Xcel Energy and our desire is to more broadly impact our customers and communities while creating shareholder value.
We will continue to expand our production of renewable energy, including wind and solar alternatives, and further develop and promote DSM, conservation and renewable programs. We are also in the process of transforming our transmission and distribution systems to accommodate increased levels of renewables, distributed energy resources and corresponding data growth, while maintaining high levels of reliability and security and keeping customer bills affordable. Finally, we are improving our communications to enable customers to interact with us in the way they prefer.
Keep bills low
Xcel Energy is very focused on our customers and the impact our actions have on the bill. Our objective is to keep total bill increases at or below the rate of inflation so our prices remain competitive relative to alternatives. We expect to continue to keep our customer bills low by executing on our Steel for Fuel plan, controlling O&M costs and promoting energy efficiency and conservation.
Xcel Energy is working to keep O&M expense relatively flat without compromising reliability or safety. We intend to accomplish this objective by continually improving our processes, leveraging technology, proactively managing risk and maintaining a workforce that is prepared to meet the needs of our business today and tomorrow. As a result of these actions, Xcel Energy’s 2017 O&M was lower than 2014 levels.
Provide a competitive total return to investors and maintain strong investment grade credit rating
Through our disciplined approach to business growth, financial investment, operations and safety, we plan to:
Deliver long-term annual EPS growth of five percent to six percent;
Deliver annual dividend increases of five percent to seven percent;
Target a dividend payout ratio of 60 to 70 percent of annual ongoing EPS; and
Maintain senior secured debt credit ratings in the A range and senior unsecured debt credit ratings in the BBB+ to A range.
We have consistently achieved our financial objectives, meeting or exceeding our earnings guidance range for thirteen consecutive years, and we believe we are positioned to continue to deliver on our value proposition. Our ongoing earnings have grown approximately 5.9 percent and our dividend has grown approximately 4.4 percent annually from 2005 through 2017. In addition, our current senior unsecured debt credit ratings for Xcel Energy and its utility subsidiaries are in the BBB+ to A range, while our secured operating company debt ratings are in the A range. Although the TCJA placed pressure on our credit metrics, we are taking steps to retain the health of our credit ratings.
Responsible by nature
We understand the important role we play as a member of society: meeting a basic need, taking great care of the investments made in our company and engaging with our communities in ways that helps them thrive. We believe energy is a critical service for all people; one that enhances quality of life and enables economic progress. We know our investors and their customers are putting their faith in us to create economic value for them and their families over the long term, and we will continue to prepare for tomorrow to retain their trust in us. We exist because of the families, businesses and cities that rely on us, and we are privileged to serve them. We see our success not simply as a measure of profit but also as our broader impact on the public good.
Financial Review
Measures
The following discussion includes financial information prepared in accordance with GAAP, as well as certain non-GAAP financial measures such as ongoing ROE, ongoing earnings and ongoing diluted EPS. Generally, a non-GAAP financial measure is a measure of a company’s financial performance, financial position or cash flows that excludes (or includes) amounts that are adjusted from measures calculated and presented in accordance with GAAP.
Xcel Energy’s management uses non-GAAP measures for financial planning and analysis, for reporting of results to the Board of Directors, in determining performance-based compensation and communicating its earnings outlook to analysts and investors. Non-GAAP financial measures are intended to supplement investors’ understanding of our performance and should not be considered alternatives for financial measures presented in accordance with GAAP. These measures are discussed in more detail below and may not be comparable to other companies’ similarly titled non-GAAP financial measures.
Ongoing ROE
Ongoing ROE is calculated by management focuses on those factors that had a material effect on Xcel Energy’s financial condition, results of operations and cash flows duringdividing the periods presented,net income or are expected to have a material impact in the future. It should be read in conjunction with the accompanying consolidated financial statements and the related notes to consolidated financial statements.
The only common equity securities that are publicly traded are common sharesloss of Xcel Energy Inc. The diluted earnings and EPS ofor each subsidiary, as well as the ROEadjusted for certain nonrecurring items, by each entity’s average stockholder’s equity. We use these non-GAAP financial measures to evaluate and provide details of each subsidiary discussed below do not represent a direct legal interest in the assetsearnings results.
Earnings Adjusted for Certain Items (Ongoing Earnings and liabilities allocated to such subsidiary, but rather represent a direct interest in our assets and liabilities as a whole. Ongoing Diluted EPS)
GAAP diluted EPS and ongoing ROE forreflects the potential dilution that could occur if securities or other agreements to issue common stock (i.e., common stock equivalents) were settled. The weighted average number of potentially dilutive shares outstanding used to calculate Xcel Energy and by subsidiary are financial measures not recognized under GAAP.Inc.’s diluted EPS is calculated using the treasury stock method. Ongoing earnings reflect adjustments to GAAP earnings (net income) for certain items. Ongoing diluted EPS is calculated by dividing the net income or loss attributable to the controlling interest of each subsidiary, adjusted for certain nonrecurring items, by the weighted average fully diluted Xcel Energy Inc. common shares outstanding for the period. Ongoing ROEdiluted EPS for each subsidiary is calculated by dividing the net income or loss attributable to the controlling interest of Xcel Energy or eachsuch subsidiary, adjusted for certain nonrecurring items, by each entity’sthe weighted average fully diluted Xcel Energy Inc. common stockholders’ or stockholder’s equity. shares outstanding for the period.
We use these non-GAAP financial measures to evaluate and provide details of Xcel Energy’s core earnings results.and underlying performance. We believe these measurements are useful to investors to evaluate the actual and projected financial performance and contribution of our subsidiaries. These non-GAAP financial measures should not be considered as alternativesFor the years ended Dec. 31, 2021 and 2020, there were no such adjustments to measures calculatedGAAP earnings and reported in accordance with GAAP.therefore GAAP earnings equal ongoing earnings.
Results of Operations
The following tables summarize diluted
Diluted EPS for Xcel Energy at Dec. 31:
| | | | | | | | | | | | | | |
| | 2021 | | 2020 |
| Diluted Earnings (Loss) Per Share | | GAAP and Ongoing Diluted EPS | | GAAP and Ongoing Diluted EPS |
| PSCo | | $ | 1.22 | | | $ | 1.11 | |
| NSP-Minnesota | | 1.12 | | | 1.12 | |
| SPS | | 0.59 | | | 0.56 | |
| NSP-Wisconsin | | 0.20 | | | 0.20 | |
| Earnings from equity method investments — WYCO | | 0.05 | | | 0.05 | |
Regulated utility (a) | | 3.18 | | | 3.04 | |
| Xcel Energy Inc. and Other | | (0.22) | | | (0.25) | |
Total (a) | | $ | 2.96 | | | $ | 2.79 | |
|
| | | | | | | | | | | | | | | | | | | | | | | | | | | | |
| | | 2017 | | 2016 | | 2015 |
| Diluted Earnings (Loss) Per Share | | GAAP Diluted EPS | | Impact of TCJA | | Ongoing Diluted EPS | | GAAP and Ongoing Diluted EPS | | GAAP Diluted EPS | | Loss on Monticello LCM/EPU Project | | Ongoing Diluted EPS (b) |
| NSP-Minnesota | | $ | 0.96 |
| | $ | 0.05 |
| | $ | 1.01 |
| | $ | 0.96 |
| | $ | 0.70 |
| | $ | 0.16 |
| | $ | 0.85 |
|
| PSCo | | 0.97 |
| | (0.03 | ) | | 0.94 |
| | 0.91 |
| | 0.92 |
| | — |
| | 0.92 |
|
| SPS | | 0.31 |
| | (0.01 | ) | | 0.30 |
| | 0.30 |
| | 0.25 |
| | — |
| | 0.25 |
|
| NSP-Wisconsin | | 0.16 |
| | — |
| | 0.16 |
| | 0.14 |
| | 0.15 |
| | — |
| | 0.15 |
|
Equity earnings of unconsolidated subsidiaries (a) | | 0.07 |
| | (0.04 | ) | | 0.03 |
| | 0.05 |
| | 0.04 |
| | — |
| | 0.04 |
|
Regulated utility (b) | | $ | 2.47 |
| | $ | (0.03 | ) | | $ | 2.45 |
| | $ | 2.35 |
| | $ | 2.06 |
| | $ | 0.16 |
| | $ | 2.21 |
|
| Xcel Energy Inc. and other | | (0.22 | ) | | 0.07 |
| | (0.15 | ) | | (0.15 | ) | | (0.11 | ) | | — |
| | (0.11 | ) |
Total (b) | | $ | 2.25 |
| | $ | 0.05 |
| | $ | 2.30 |
| | $ | 2.21 |
| | $ | 1.94 |
| | $ | 0.16 |
| | $ | 2.09 |
|
| |
(a)
| Includes income taxes. |
| |
(b)
| Amounts may not add due to rounding. |
(a) Amounts may not add due to rounding.
Xcel Energy’s management believes that ongoing earnings providereflects management’s performance in operating Xcel Energy and provides a meaningful comparisonrepresentation of earnings results and is representativethe performance of Xcel Energy’s fundamental core earnings power.business. In addition, Xcel Energy’s management uses ongoing earnings internally for financial planning and analysis, for reporting of results to the Board of Directors in determining whether performance targets are met for performance-based compensation and when communicating its earnings outlook to analysts and investors.
2021 Comparison with 2020
2017 Adjustment to GAAP Earnings
Impact of the TCJA — Xcel Energy recognized an estimated one-time, non-cash, income tax expense of approximately $23 million in the fourth quarter of 2017 for net excess deferred tax assets which may not be recovered from customers or not attributable to regulated operations, increased valuation allowances, etc. due to the enactment of the TCJA in December 2017. The income tax expense associated with the TCJA enactment has been excluded from Xcel Energy’s 2017 — GAAP and ongoing earnings given the non-recurring nature of the TCJA’s broad and sweeping reform of the IRC. See Note 6 to the consolidated financial statements for further discussion.
2015 Adjustment to GAAP Earnings
Loss on Monticello LCM/EPU Project — In March 2015, the MPUC approved full recovery, including a return, on $415 million of the project costs, inclusive of AFUDC, but only allowed recovery of the remaining $333 million of costs with no return on this portion of the investment for 2015 and beyond. As a result of this decision, Xcel Energy recorded a pre-tax charge of approximately $129 million, or $79 million net of tax, in the first quarter of 2015. See Note 12 to the consolidated financial statements for further discussion.
Earnings Adjusted for Certain Items
2017 Comparison with 2016
Xcel Energy — GAAP earnings increased $0.04$0.17 per share for 2017. Ongoing earnings increased $0.09 per share, excluding the impact of the TCJA. Earnings were higher as a result of increased2021. The increase was driven by capital investment recovery and other regulatory outcomes, partially offset by increases in depreciation and lower AFUDC. Fluctuations in electric and natural gas margins to recover infrastructure investments, reduced O&M expenses, a lower ETRrevenues associated with changes in fuel and higher AFUDC. These positive factorspurchased power and/or natural gas sold and transported generally do not significantly impact earnings (changes in revenues are offset by the related variation in costs).
PSCo — Earnings increased $0.11 per share for 2021, driven by capital investment recovery and other regulatory outcomes. Higher revenues were partially offset by increased depreciation, expense, interest chargesO&M expenses and property taxes.other taxes (other than income taxes).
NSP-Minnesota — GAAP earningsEarnings were flat for 2017. Ongoing earnings increased $0.05 per share, excluding the impact of the TCJA. The change reflects higher electric margins driven by a 2017 Minnesota rate increase as well as increased gas margins, a lower ETR and reduced O&M expenses. The decrease in the ETR is largely driven by resolution of IRS appeals/audits and an increase in wind PTCs, which are flowed back2021 compared to customers and reduce electric margin. Lower O&M expenses primarily relate to reduced expenses for nuclear refueling outages and overhauls at generation facilities. These positive factors were partially2020, reflecting capital investment recovery offset by higheradditional depreciation expense due to increased invested capital as well as prior year amortization of Minnesota’s excess depreciation reserve and higher property taxes.interest charges.
PSCoSPS — GAAP earnings increased $0.06 per share for 2017. Ongoing earningsEarnings increased $0.03 per share excluding the impact of the TCJA. The increase in earnings was driven by higher electric and natural gas margins, increased AFUDC primarilyfor 2021, largely related to the Rush Creek wind project, a decrease in O&M expenses (timing of generation outages)capital investment recovery, other regulatory outcomes and a lower ETR,higher sales and demand, partially offset by higher depreciation expense, interest charges and the impact of unfavorable weather.decreased AFUDC.
SPSNSP-Wisconsin — GAAP earnings increased $0.01 per share for 2017. Ongoing earningsEarnings were flat excluding the impact of the TCJA. Rate increases in Texas and New Mexico and a lower ETR were offset by higher depreciation expense (representing continued investment), O&M expenses (including the prior year deferrals associated with the Texas 2016 rate case), property taxes and the impact of unfavorable weather.for 2021 compared to 2020.
NSP-Wisconsin — GAAP and ongoing earnings increased $0.02 per share for 2017. The change in ongoing earnings was driven by a rise in electric and natural gas rates, partially offset by additional depreciation expense related to continued transmission and distribution investments and higher O&M expenses.
Equity earnings of unconsolidated subsidiaries — GAAP earnings increased $0.02 per share for 2017. Ongoing earnings of unconsolidated subsidiaries decreased $0.02 per share, excluding the impact of the TCJA. The decline primarily related to lower revenues due to lower rates at our WYCO subsidiary, which develops and leases natural gas pipelines, storage and compression facilities.
2016 Comparison with 2015
Xcel Energy — 2016 GAAP earnings increased due to the 2015 loss on Monticello LCM/EPU project; see Note 12 for further information. Ongoing earnings increased $0.12 per share (GAAP earnings increased $0.28 per share). Increases in electric and natural gas margins were primarily driven by higher rates and riders across various jurisdictions to recover our capital investments and the favorable impact of weather as compared with the previous year. These positive factors and a lower ETR were partially offset by higher depreciation, interest charges and property taxes.
NSP-Minnesota — 2016 GAAP earnings increased due to the 2015 loss on Monticello LCM/EPU project; see Note 12 for further information. Ongoing earnings increased $0.11 per share due to the following: higher electric margins primarily driven by an interim electric rate increase in Minnesota (net of estimated provision for refund); non-fuel riders; the favorable impact of weather; and a lower ETR. These positive factors were partially offset by higher depreciation, O&M expenses, interest charges and property taxes.
PSCo — Earnings decreased $0.01 per share for 2016. The positive impact of higher natural gas margins (primarily due to a rate increase), sales growth and a lower estimated electric earnings test refund, were more than offset by increased depreciation and interest charges.
SPS — Earnings increased $0.05 per share for 2016. Higher electric margins and lower O&M expenses were partially offset by an increase in depreciation and interest charges.
NSP-Wisconsin — Earnings decreased $0.01 per share for 2016. The positive impact of higher electric margins (primarily driven by an electric rate increase) was more than offset by higher O&M expenses and depreciation.
Equity earnings of unconsolidated subsidiaries — Earnings of unconsolidated subsidiaries increased $0.01 per share in 2016 due to facility expansion and increased revenue at WYCO.
Xcel Energy Inc. and other Other— Xcel Energy Inc. and otherPrimarily includes financing costs at the holding company, and other items.offset by earnings from EIP investments.
The decrease in earnings was primarily related to higher long-term debt levels.
ChangesGeneral Economic Conditions
Economic conditions may have a material impact on Xcel Energy’s operating results. Management cannot predict the impact of fluctuating energy prices, pandemics, terrorist activity, war or the threat of war. We could experience a material impact to our results of operations, future growth or ability to raise capital resulting from a sustained general slowdown in Diluted EPSeconomic growth or a significant increase in interest rates or inflation.
Seasonality
Demand for electric power and natural gas is affected by seasonal differences in the weather. In general, peak sales of electricity occur in the summer months and peak sales of natural gas occur in the winter months. As a result, the overall operating results may fluctuate substantially on a seasonal basis. Additionally, Xcel Energy’s operations have historically generated less revenues and income when weather conditions are milder in the winter and cooler in the summer.
Competition
Xcel Energy is subject to public policies that promote competition and development of energy markets. Xcel Energy’s industrial and large commercial customers have the ability to generate their own electricity. In addition, customers may have the option of substituting other fuels or relocating their facilities to a lower cost region.
Customers have the opportunity to supply their own power with distributed generation including solar generation and in most jurisdictions can currently avoid paying for most of the fixed production, transmission and distribution costs incurred to serve them.
Several states have incentives for the development of rooftop solar, community solar gardens and other distributed energy resources. Distributed generating resources are potential competitors to Xcel Energy’s electric service business with these incentives and federal tax subsidies.
The following tables summarizeFERC has continued to promote competitive wholesale markets through open access transmission and other means. Xcel Energy’s wholesale customers can purchase their output from generation resources of competing suppliers or non-contracted quantities and use the transmission systems of the utility subsidiaries on a comparable basis to serve their native load.
FERC Order No. 1000 established competition for ownership of certain new electric transmission facilities under Federal regulations. Some states have state laws that allow the incumbent a Right of First Refusal to own these transmission facilities.
FERC Order 2222 requires that RTO and ISO markets allow participation of aggregations of distributed energy resources. This order is expected to incentivize distributed energy resource adoption, however implementation is expected to vary by RTO/ISO and the near, medium, and long-term impacts of Order 2222 remain unclear.
Xcel Energy Inc.’s utility subsidiaries have franchise agreements with cities subject to periodic renewal; however, a city could seek alternative means to access electric power or gas, such as municipalization.
While each utility subsidiary faces these challenges, Xcel Energy believes their rates and services are competitive with alternatives currently available.
Public Utility Regulation
See Item 7 for discussion of public utility regulation.
Environmental Regulation
Our facilities are regulated by federal and state agencies that have jurisdiction over air emissions, water quality, wastewater discharges, solid and hazardous wastes or substances. Certain Xcel Energy activities require registrations, permits, licenses, inspections and approvals from these agencies.
Xcel Energy has received necessary authorizations for the construction and continued operation of its generation, transmission and distribution systems. Our facilities strive to operate in compliance with applicable environmental standards and related monitoring and reporting requirements.
However, it is not possible to determine what additional facilities or modifications of existing or planned facilities will be required as a result of changes to regulations, interpretations or enforcement policies or what effect future laws or regulations may have. We may be required to incur expenditures in the future for remediation of MGP and other sites.
Xcel Energy must comply with emission levels in Minnesota, Texas and Wisconsin that may require the purchase of emission allowances. The Denver North Front Range Non-attainment Area does not meet the ozone NAAQS. Colorado will continue to consider further reductions available in the non-attainment area as it develops plans to meet ozone standards. Natural gas plants which operate in PSCo’s non-attainment area may be required to improve or add controls, implement further work practices and/or enhanced emissions monitoring as part of future Colorado state plans.
There are significant components contributingenvironmental regulations to encourage use of clean energy technologies and regulate emissions of GHGs. We have undertaken numerous initiatives to meet current requirements and prepare for potential future regulations, reduce GHG emissions and respond to state renewable and energy efficiency goals. Future environmental regulations may result in substantial costs.
In July 2019, the EPA adopted the Affordable Clean Energy rule, which requires states to develop plans by 2022 for GHG reductions from coal-fired power plants. In January 2021, the U.S. Court of Appeals for the D.C. Circuit issued a decision vacating and remanding the Affordable Clean Energy rule. That decision would allow the EPA to proceed with alternate regulation of coal-fired power plants. However, the Court of Appeals decision is now before the U.S. Supreme Court, where the Court is expected to rule on the nature and extent of the EPA’s GHG regulatory authority. If any new rules require additional investment, Xcel Energy believes that the cost of these initiatives or replacement generation would be recoverable through rates based on prior state commission practices.
In October 2020, the TCEQ approved an agreement that SPS will convert the Harrington plant from coal to natural gas by Jan. 1, 2025. This conversion is necessary to attain Federal Clean Air Act standards for emissions of SO2.
Xcel Energy seeks to address climate change and potential climate change regulation through efforts to reduce its GHG emissions in a balanced, cost-effective manner.
Emerging Environmental Regulation
New regulations and legislation are being considered to regulate PFAS in drinking water, water discharges, commercial products, wastes, and other areas. PFAS are man-made chemicals found in many consumer products that can persist and accumulate in the environment. These chemicals have received heightened attention from environmental regulators. Increased regulation of PFAS and other emerging contaminants at the federal, state, and local level could have a potential adverse effect on our operations but at this time, it is uncertain what impact, if any, there will be on our operations, financial condition or cash flows. Xcel Energy will continue to monitor these regulatory developments and their potential impact on its operations.
Environmental Costs
Environmental costs include amounts for nuclear plant decommissioning and payments for storage of spent nuclear fuel, disposal of hazardous materials and waste, remediation of contaminated sites, monitoring of discharges to the changesenvironment and compliance with laws and permits with respect to emissions.
Costs charged to operating expenses for nuclear decommissioning, spent nuclear fuel disposal, environmental monitoring and remediation and disposal of hazardous materials and waste were approximately:
•$365 million in 2017 EPS compared2021.
•$400 million in 2020.
•$345 million in 2019.
Average annual expense of approximately $425 million from 2022 – 2026 is estimated for similar costs. The precise timing and amount of environmental costs, including those for site remediation and disposal of hazardous materials, are unknown. Additionally, the extent to which environmental costs will be included in and recovered through rates may fluctuate.
Capital expenditures for environmental improvements were approximately:
•$60 million in 2021.
•$30 million in 2020.
•$30 million in 2019.
Other
Our operations are subject to workplace safety standards under the Federal Occupational Safety and Health Act of 1970 (“OSHA”) and comparable state laws that regulate the protection of worker health and safety. In addition, the Company is subject to other government regulations impacting such matters as labor, competition, data privacy, etc. Based on information to date and because our policies and business practices are designed to comply with all applicable laws, we do not believe the same period in 2016 and 2016 EPS compared with the same period in 2015:effects of compliance on our operations, financial condition or cash flows are material.
|
| | | | |
| Diluted Earnings (Loss) Per Share | | Dec. 31 |
| GAAP and ongoing diluted EPS — 2016 | | $ | 2.21 |
|
| | | |
| Components of change — 2017 vs. 2016 | | |
Higher electric margins (a) | | 0.16 |
|
Lower ETR (b) | | 0.07 |
|
| Higher natural gas margins | | 0.03 |
|
| Higher AFUDC — equity | | 0.03 |
|
| Lower O&M expenses | | 0.03 |
|
| Higher depreciation and amortization | | (0.21 | ) |
Higher conservation and DSM program expenses (c) | | (0.03 | ) |
| Higher interest charges | | (0.02 | ) |
| Higher taxes (other than income taxes) | | (0.02 | ) |
| Equity earnings of unconsolidated subsidiaries | | (0.02 | ) |
| Other, net | | 0.02 |
|
| GAAP diluted EPS — 2017 | | 2.25 |
|
| Impact of the TCJA | | 0.05 |
|
| Ongoing diluted EPS — 2017 | | $ | 2.30 |
|
| | |
| Capital Spending and Financing |
See Item 7 for discussion of capital expenditures and funding sources.
| | | | | | | | | | | | | | | | | | | | |
Executive Officers (a) |
| Name | | Age(b) | Includes an increase of $23 million | Current and Recent Positions | | Time in revenues from conservation and DSM programs, offset by related expenses, for the twelve months ended Dec. 31, 2017.Position |
| |
(b)
| The ETR includes the impact of an additional $20 million of wind PTCs for the twelve months ended Dec. 31, 2017, which are largely flowed back to customers through electric margin, as well as the impact of the TCJA recorded in the fourth quarter of 2017. |
| |
(c)
| Offset by higher revenues. |
|
| | | | |
| Diluted Earnings (Loss) Per Share | | Dec. 31 |
| GAAP diluted EPS — 2015 | | $ | 1.94 |
|
| Loss on Monticello LCM/EPU project | | 0.16 |
|
Ongoing diluted EPS — 2015(a) | | 2.09 |
|
| | | |
| Components of change — 2016 vs. 2015 | |
|
|
| Higher electric margins | | 0.32 |
|
| Lower ETR | | 0.06 |
|
| Higher natural gas margins | | 0.04 |
|
| Higher depreciation and amortization | | (0.21 | ) |
| Higher interest charges | | (0.06 | ) |
| Higher taxes (other than income taxes) | | (0.02 | ) |
| Other, net | | (0.01 | ) |
| GAAP and ongoing diluted EPS — 2016 | | $ | 2.21 |
|
| |
(a)
| Amounts may not add due to rounding. |
The following tables summarize the ROE for Xcel Energy and its utility subsidiaries at Dec. 31:
|
| | | | | | | | | | | | | | | | | | |
| ROE — 2017 | | NSP-Minnesota | | PSCo | | SPS | | NSP-Wisconsin | | Operating Companies | | Xcel Energy |
| GAAP ROE | | 9.05 | % | | 8.90 | % | | 7.84 | % | | 9.41 | % | | 8.84 | % | | 10.21 | % |
| Impact of the TCJA | | 0.45 |
| | (0.24 | ) | | (0.30 | ) | | 0.09 |
| | 0.03 |
| | 0.21 |
|
| Ongoing ROE | | 9.50 | % | | 8.66 | % | | 7.54 | % | | 9.50 | % | | 8.87 | % | | 10.42 | % |
|
| | | | | | | | | | | | | | | | | | |
| ROE — 2016 | | NSP-Minnesota | | PSCo | | SPS | | NSP-Wisconsin | | Operating Companies | | Xcel Energy |
| GAAP and ongoing ROE | | 9.29 | % | | 8.92 | % | | 8.14 | % | | 8.63 | % | | 8.94 | % | | 10.39 | % |
The following tables provide reconciliations of GAAP earnings (net income) to ongoing earnings and GAAP diluted EPS to ongoing diluted EPS for the years ended Dec. 31:
|
| | | | | | | | | | | | |
| (Millions of Dollars) | | 2017 | | 2016 | | 2015 |
| GAAP earnings | | $ | 1,148 |
| | $ | 1,123 |
| | $ | 985 |
|
| Estimated impact of TCJA | | 23 |
| | — |
| | — |
|
| Loss on Monticello LCM/EPU project | | — |
| | — |
| | 79 |
|
| Ongoing earnings | | $ | 1,171 |
| | $ | 1,123 |
| | $ | 1,064 |
|
|
| | | | | | | | | | | | |
| Diluted Earnings Per Share | | 2017 | | 2016 | | 2015 |
| GAAP diluted EPS | | $ | 2.25 |
| | $ | 2.21 |
| | $ | 1.94 |
|
| Estimated impact of TCJA | | 0.05 |
| | — |
| | — |
|
| Loss on Monticello LCM/EPU project | | — |
| | — |
| | 0.16 |
|
Ongoing diluted EPS (a) | | $ | 2.30 |
| | $ | 2.21 |
| | $ | 2.09 |
|
| |
(a)
| Amounts may not add due to rounding. |
Statement of Income Analysis
The following discussion summarizes the items that affected the individual revenue and expense items reported in the consolidated statements of income.
Estimated Impact of Temperature Changes on Regulated Earnings — Unusually hot summers or cold winters increase electric and natural gas sales, while mild weather reduces electric and natural gas sales. The estimated impact of weather on earnings is based on the number of customers, temperature variances and the amount of natural gas or electricity the average customer historically uses per degree of temperature. Accordingly, deviations in weather from normal levels can affect Xcel Energy’s financial performance.
Degree-day or Temperature-Humidity Index (THI) data is used to estimate amounts of energy required to maintain comfortable indoor temperature levels based on each day’s average temperature and humidity. Heating degree-days (HDD) is the measure of the variation in the weather based on the extent to which the average daily temperature falls below 65° Fahrenheit. Cooling degree-days (CDD) is the measure of the variation in the weather based on the extent to which the average daily temperature rises above 65° Fahrenheit. Each degree of temperature above 65° Fahrenheit is counted as one CDD, and each degree of temperature below 65° Fahrenheit is counted as one HDD. In Xcel Energy’s more humid service territories, a THI is used in place of CDD, which adds a humidity factor to CDD. HDD, CDD and THI are most likely to impact the usage of Xcel Energy’s residential and commercial customers. Industrial customers are less sensitive to weather.
Normal weather conditions are defined as either the 20-year or 30-year average of actual historical weather conditions. The historical period of time used in the calculation of normal weather differs by jurisdiction, based on regulatory practice. To calculate the impact of weather on demand, a demand factor is applied to the weather impact on sales as defined above to derive the amount of demand associated with the weather impact.
The percentage increase (decrease) in normal and actual HDD, CDD and THI are provided in the following table:
|
| | | | | | | | | | | | | | |
| | 2017 vs.
Normal | | 2016 vs.
Normal | | 2017 vs.
2016 | | 2015 vs.
Normal | | 2016 vs.
2015 |
| HDD | (10.0 | )% | | (13.4 | )% | | 2.6 | % | | (7.9 | )% | | (5.5 | )% |
| CDD | 6.5 |
| | 11.1 |
| | (3.5 | ) | | 6.2 |
| | 5.1 |
|
| THI | (11.3 | ) | | 7.7 |
| | (18.5 | ) | | (2.3 | ) | | 10.9 |
|
Weather — The following table summarizes the estimated impact of temperature variations on EPS compared with normal weather conditions:
|
| | | | | | | | | | | | | | | | | | | |
| | 2017 vs.
Normal | | 2016 vs.
Normal | | 2017 vs.
2016 | | 2015 vs. Normal | | 2016 vs. 2015 |
| Retail electric | $ | (0.036 | ) | | $ | 0.004 |
| | $ | (0.040 | ) | | $ | (0.020 | ) | | $ | 0.024 |
|
| Firm natural gas | (0.023 | ) | | (0.025 | ) | | 0.002 |
| | (0.018 | ) | | (0.007 | ) |
| Total (excluding decoupling) | $ | (0.059 | ) | | $ | (0.021 | ) | | $ | (0.038 | ) | | $ | (0.038 | ) | | $ | 0.017 |
|
| Decoupling — Minnesota | 0.022 |
| | (0.002 | ) | | 0.024 |
| | — |
| | (0.002 | ) |
| Total (adjusted for recovery from decoupling) | $ | (0.037 | ) | | $ | (0.023 | ) | | $ | (0.014 | ) | | $ | (0.038 | ) | | $ | 0.015 |
|
Sales Growth(Decline) — The following tables summarize Xcel Energy and its utility subsidiaries’ sales growth (decline) for actual and weather-normalized sales for the years ended Dec. 31, compared with the previous year:
|
| | | | | | | | | | | | | | | |
| | | 2017 vs. 2016 |
| | | NSP-Minnesota | | PSCo | | SPS | | NSP-Wisconsin | | Xcel Energy |
| Actual | | | | | | | | | | |
Electric residential (a) | | (2.1 | )% | | (1.8 | )% | | (3.5 | )% | | (0.8 | )% | | (2.1 | )% |
| Electric C&I | | (1.4 | ) | | (0.1 | ) | | 1.3 |
| | 2.2 |
| | (0.1 | ) |
| Total retail electric sales | | (1.6 | ) | | (0.6 | ) | | 0.2 |
| | 1.3 |
| | (0.7 | ) |
| Firm natural gas sales | | 9.3 |
| | (2.2 | ) | | N/A |
| | 11.3 |
| | 2.1 |
|
|
| | | | | | | | | | | | | | | |
| | | 2017 vs. 2016 |
| | | NSP-Minnesota | | PSCo | | SPS | | NSP-Wisconsin | | Xcel Energy |
| Weather-normalized | | | | | | | | | | |
Electric residential (a) | | (0.7 | )% | | (1.6 | )% | | (1.2 | )% | | 0.3 | % | | (1.0 | )% |
| Electric C&I | | (1.0 | ) | | 0.1 |
| | 1.5 |
| | 2.5 |
| | 0.2 |
|
| Total retail electric sales | | (1.0 | ) | | (0.4 | ) | | 0.9 |
| | 1.8 |
| | (0.2 | ) |
| Firm natural gas sales | | 4.7 |
| | 0.6 |
| | N/A |
| | 5.7 |
| | 2.2 |
|
|
| | | | | | | | | | | | | | | |
| | | 2017 vs. 2016 (Excluding Leap Day) (b) |
| | | NSP-Minnesota | | PSCo | | SPS | | NSP-Wisconsin | | Xcel Energy |
Weather-normalized - adjusted for leap day | | | | | | | | | | |
Electric residential (a) | | (0.5 | )% | | (1.3 | )% | | (1.0 | )% | | 0.6 | % | | (0.8 | )% |
| Electric C&I | | (0.8 | ) | | 0.3 |
| | 1.8 |
| | 2.7 |
| | 0.4 |
|
| Total retail electric sales | | (0.7 | ) | | (0.2 | ) | | 1.1 |
| | 2.1 |
| | 0.1 |
|
| Firm natural gas sales | | 5.2 |
| | 1.1 |
| | N/A |
| | 6.3 |
| | 2.7 |
|
(a) Extreme weather variations, windchill and cloud cover may not be reflected in weather-normalized and actual growth (decline) estimates.
| |
(b)
| The estimated impact of the 2016 leap day is excluded to present a more comparable year-over-year presentation. The estimated impact of the additional day of sales in 2016 was approximately 0.3 percent for retail electric and 0.5 percent for firm natural gas for the twelve months ended. |
Weather-normalized 2017 Electric Sales Growth (Decline) (Excluding Leap Day)
NSP-Minnesota’s residential sales decrease was a result of lower use per customer, partially offset by customer growth. The decline in commercial and industrial (C&I) sales was largely due to reduced usage, which offset an increase in the number of customers. Declines in services more than offset increased sales to large customers in manufacturing and energy industries.
PSCo’s decline in residential sales reflects lower use per customer, partially offset by customer additions. C&I growth was mainly due to an increase in customers and higher use for large C&I customers that support the mining, oil and natural gas industries, partially offset by lower use for the small C&I class.
SPS’ residential sales fell largely due to lower use per customer. The increase in C&I sales reflects customer additions and greater use for large C&I customers driven by the oil and natural gas industry in the Permian Basin.
NSP-Wisconsin’s residential sales increase was primarily attributable to higher use per customer and customer additions. C&I growth was largely due to higher use per customer and increased sales to customers in the sand mining industry and large customers in the energy and manufacturing industries.
Weather-normalized 2017 Natural Gas Sales Growth (Excluding Leap Day)
Across service territories, higher natural gas sales reflect an increase in the number of customers, partially offset by a decline in customer use.
Weather-normalized sales for 2018 are projected to be within a range of 0 percent to 0.5 percent over 2017 levels for retail electric customers and 0 percent to 0.5 percent below 2017 levels for firm natural gas customers.
|
| | | | | | | | | | | | | | | |
| | | 2016 vs. 2015 |
| | | NSP-Minnesota | | PSCo | | SPS | | NSP-Wisconsin | | Xcel Energy |
| Actual | | | | | | | | | | |
Electric residential (a) | | 1.2 | % | | 1.8 | % | | (1.6 | )% | | 0.3 | % | | 0.9 | % |
| Electric C&I | | (0.5 | ) | | (0.4 | ) | | 1.1 |
| | (0.1 | ) | | — |
|
| Total retail electric sales | | — |
| | 0.4 |
| | 0.7 |
| | (0.1 | ) | | 0.3 |
|
| Firm natural gas sales | | (4.1 | ) | | (1.1 | ) | | N/A |
| | (7.4 | ) | | (2.4 | ) |
|
| | | | | | | | | | | | | | | |
| | | 2016 vs. 2015 |
| | | NSP-Minnesota | | PSCo | | SPS | | NSP-Wisconsin | | Xcel Energy |
| Weather-normalized | | | | | | | | | | |
Electric residential (a) | | 0.1 | % | | 1.9 | % | | (1.3 | )% | | (0.2 | )% | | 0.5 | % |
| Electric C&I | | (0.8 | ) | | (0.4 | ) | | 0.8 |
| | (0.2 | ) | | (0.3 | ) |
| Total retail electric sales | | (0.5 | ) | | 0.4 |
| | 0.5 |
| | (0.3 | ) | | — |
|
| Firm natural gas sales | | (0.3 | ) | | (0.2 | ) | | N/A |
| | (4.3 | ) | | (0.5 | ) |
|
| | | | | | | | | | | | | | | |
| | | 2016 vs. 2015 (Excluding Leap Day) (b) |
| | | NSP-Minnesota | | PSCo | | SPS | | NSP-Wisconsin | | Xcel Energy |
| Weather-normalized - adjusted for leap day | | | | | | | | | | |
Electric residential (a) | | (0.2 | )% | | 1.6 | % | | (1.6 | )% | | (0.6 | )% | | 0.3 | % |
| Electric C&I | | (1.0 | ) | | (0.7 | ) | | 0.5 |
| | (0.5 | ) | | (0.5 | ) |
| Total retail electric sales | | (0.8 | ) | | 0.1 |
| | 0.2 |
| | (0.6 | ) | | (0.3 | ) |
| Firm natural gas sales | | (0.8 | ) | | (0.7 | ) | | N/A |
| | (4.8 | ) | | (1.0 | ) |
(a) Extreme weather variations, windchill and cloud cover may not be reflected in weather-normalized and actual growth (decline) estimates.
| |
(b)
| The estimated impact of the 2016 leap day is excluded to present a more comparable year-over-year presentation. The estimated impact of the additional day of sales in 2016 was approximately 0.2 percent to 0.4 percent for retail electric and 0.5 percent for firm natural gas for the twelve months ended. |
Weather-normalized 2016 Electric Sales Growth (Decline) (Excluding Leap Day)
NSP-Minnesota’s residential sales decreased as a result of lower use per customer, partially offset by customer additions. C&I sales declined primarily as a result of lower use by customers in the manufacturing and service industries.
PSCo’s residential growth reflects an increased number of customers. The C&I decline was mainly due to lower sales to certain large customers in the manufacturing, mining, oil and gas industries. The decline was partially offset by an increase in the number of small C&I customers.
SPS’ residential sales decline was primarily the result of lower use per customer, partially offset by an increased number of customers. The increase in C&I sales was driven by energy sector expansion in the Southeastern New Mexico, Permian Basin area as well as greater use by agricultural customers.
NSP-Wisconsin’s residential sales decrease was primarily attributable to lower use per customer, partially offset by customer additions. The C&I decline was largely due to reduced sales to small customers. The overall decrease was partially offset by an increase in the number of C&I customers as well as greater use in the large C&I class for the oil and gas industries.
Weather-normalized 2016 Natural Gas Sales Decline (Excluding Leap Day)
Across natural gas service territories, lower natural gas sales reflect a decline in customer use, partially offset by a slight increase in the number of customers.
Electric Revenues and Margin
Electric revenues and fuel and purchased power expenses are impacted by fluctuation in the price of natural gas, coal and uranium used in the generation of electricity. However, these price fluctuations have minimal impact on electric margin due to fuel recovery mechanisms that recover fuel expenses. The following table details the electric revenues and margin:
|
| | | | | | | | | | | | |
| (Millions of Dollars) | | 2017 | | 2016 | | 2015 |
| Electric revenues | | $ | 9,676 |
| | $ | 9,500 |
| | $ | 9,276 |
|
| Electric fuel and purchased power | | (3,757 | ) | | (3,718 | ) | | (3,763 | ) |
| Electric margin | | $ | 5,919 |
| | $ | 5,782 |
| | $ | 5,513 |
|
The following tables summarize the components of the changes in electric revenues and electric margin for the years ended Dec. 31:
Electric Revenues
|
| | | | |
| (Millions of Dollars) | | 2017 vs. 2016 |
| Retail rate increases (Texas, Minnesota, New Mexico and Wisconsin) | | $ | 123 |
|
| Non-fuel riders | | 33 |
|
| Conservation and DSM program revenues (offset by expenses) | | 23 |
|
| Decoupling (weather portion — Minnesota) | | 18 |
|
| Wholesale transmission revenue | | 10 |
|
| Estimated impact of weather | | (30 | ) |
| Conservation incentive | | (18 | ) |
| Other, net | | 17 |
|
| Total increase in electric revenues | | $ | 176 |
|
Electric Margin
|
| | | | |
| (Millions of Dollars) | | 2017 vs. 2016 |
| Retail rate increases (Texas, Minnesota, New Mexico and Wisconsin) | | $ | 123 |
|
| Non-fuel riders | | 33 |
|
| Conservation and DSM revenues (offset by expenses) | | 23 |
|
| Decoupling (weather portion — Minnesota) | | 18 |
|
| Purchased capacity costs | | 8 |
|
| Wholesale transmission revenue, net of costs | | (38 | ) |
| Estimated impact of weather | | (30 | ) |
| Conservation incentive | | (18 | ) |
| Other, net | | 18 |
|
| Total increase in electric margin | | $ | 137 |
|
Electric Revenues
|
| | | | |
| (Millions of Dollars) | | 2016 vs. 2015 |
Retail rate increases (a) | | $ | 190 |
|
| Transmission revenue | | 71 |
|
| Trading | | 40 |
|
| Non-fuel riders | | 28 |
|
| Estimated impact of weather, excluding decoupling in Minnesota | | 19 |
|
| Fuel and purchased power cost recovery | | (127 | ) |
| Other, net | | 3 |
|
| Total increase in electric revenues | | $ | 224 |
|
(a) Increase is primarily due to interim rates in Minnesota (net of estimated provision for refund) and final rates in Wisconsin and New Mexico.
Electric Margin
|
| | | | |
| (Millions of Dollars) | | 2016 vs. 2015 |
Retail rate increases (a) | | $ | 190 |
|
| Non-fuel riders | | 28 |
|
| Estimated impact of weather, excluding decoupling in Minnesota | | 19 |
|
| Transmission revenue, net of costs | | 14 |
|
| Retail sales growth, excluding weather impact | | 9 |
|
| PSCo earnings test refunds | | 6 |
|
| Conservation incentive | | 3 |
|
| Firm wholesale | | (12 | ) |
| Other, net | | 12 |
|
| Total increase in electric margin | | $ | 269 |
|
(a) Increase is primarily due to interim rates in Minnesota (net of estimated provision for refund) and final rates in Wisconsin and New Mexico.
Natural Gas Revenues and Margin
Total natural gas expense varies with changing sales requirements and the cost of natural gas. However, fluctuations in the cost of natural gas has minimal impact on natural gas margin due to natural gas cost recovery mechanisms. The following table details natural gas revenues and margin:
|
| | | | | | | | | | | | |
| (Millions of Dollars) | | 2017 | | 2016 | | 2015 |
| Natural gas revenues | | $ | 1,650 |
| | $ | 1,531 |
| | $ | 1,672 |
|
| Cost of natural gas sold and transported | | (823 | ) | | (733 | ) | | (905 | ) |
| Natural gas margin | | $ | 827 |
| | $ | 798 |
| | $ | 767 |
|
The following tables summarize the components of the changes in natural gas revenues and natural gas margin for the years ended Dec. 31:
Natural Gas Revenues
|
| | | | |
| (Millions of Dollars) | | 2017 vs. 2016 |
| Purchased natural gas adjustment clause recovery | | $ | 88 |
|
| Infrastructure and integrity riders | | 18 |
|
| Conservation and DSM program revenues (offset by expenses) | | 7 |
|
| Retail sales growth, excluding weather impact | | 7 |
|
| Estimated impact of weather | | 1 |
|
| Other, net | | (2 | ) |
| Total increase in natural gas revenues | | $ | 119 |
|
Natural Gas Margin
|
| | | | |
| (Millions of Dollars) | | 2017 vs. 2016 |
| Infrastructure and integrity riders | | $ | 18 |
|
| Retail sales growth, excluding weather impact | | 7 |
|
| Estimated impact of weather | | 1 |
|
| Other, net | | 3 |
|
| Total increase in natural gas margin | | $ | 29 |
|
Natural Gas Revenues
|
| | | | |
| (Millions of Dollars) | | 2016 vs. 2015 |
| Purchased natural gas adjustment clause recovery | | $ | (177 | ) |
| Estimated impact of weather | | (5 | ) |
| Infrastructure and integrity riders | | (5 | ) |
| Retail rate increases (Colorado) | | 36 |
|
| Conservation and DSM program revenues (offset by expenses) | | 8 |
|
| Other, net | | 2 |
|
| Total decrease in natural gas revenues | | $ | (141 | ) |
Natural Gas Margin
|
| | | | |
| (Millions of Dollars) | | 2016 vs. 2015 |
| Retail rate increases (Colorado) | | $ | 36 |
|
| Conservation and DSM program revenues (offset by expenses) | | 8 |
|
| Estimated impact of weather | | (5 | ) |
| Infrastructure and integrity riders | | (5 | ) |
| Other, net | | (3 | ) |
| Total increase in natural gas margin | | $ | 31 |
|
Non-Fuel Operating Expenses and Other Items
O&M Expenses — O&M expenses decreased $23 million, or 1.0 percent, for 2017 compared with 2016. The significant changes are summarized in the table below:
|
| | | | |
(Millions of Dollars) | | 2017 vs. 2016 |
Nuclear plant operations and amortization | | $ | (27 | ) | | |
Plant generation costsRobert C. Frenzel | | (2351 | ) | Chairman of the Board of Directors, Xcel Energy Inc. | | December 2021 — Present |
Transmission costs | | (2 | ) | President and Chief Executive Officer and Director, Xcel Energy Inc. | | August 2021 — Present |
Employee benefits expense | | 17 |
| Chief Executive Officer, NSP-Minnesota, NSP-Wisconsin, PSCo, and SPS | | August 2021 — Present |
Texas 2016 electric rate case cost deferral | | 16 |
| President and Chief Operating Officer, Xcel Energy Inc. | | March 2020 — August 2021 |
Electric distribution costs | | 2 |
| Executive Vice President, Chief Financial Officer, Xcel Energy Inc. | | May 2016 — March 2020 |
Other, net | | (6 | ) | Senior Vice President and Chief Financial Officer, Luminant, a subsidiary of Energy Future Holdings Corp.(c) | | February 2012 — April 2016 |
Total decrease in O&M expensesBrett C. Carter (d) | | $55 | (23 | )Executive Vice President and Chief Customer and Innovation Officer, Xcel Energy Inc. | | May 2018 — Present |
| | | | Senior Vice President and Shared Services Executive, Bank of America, an institutional investment bank and financial services company | | October 2015 — May 2018 |
| Patricia Correa | | 48 | | Senior Vice President, Chief Human Resources Officer, Xcel Energy Inc. | | February 2022 — Present |
| | | | Senior Vice President, Human Resources, Eaton Corporation, a power management company | | July 2019 — January 2022 |
| | | | Vice President, Human Resources, Eaton Corporation | | March 2016 — July 2019 |
| | | | Senior Director, Talent & Organization Development, Kellogg Company, a food manufacturing company | | July 2015 — March 2016 |
| Timothy O’Connor | | 62 | | Executive Vice President, Chief Operations Officer, Xcel Energy Inc. | | August 2021 — Present |
| | | | Executive Vice President, Chief Generation Officer, Xcel Energy Inc. | | March 2020 — August 2021 |
| | | | Senior Vice President, Chief Nuclear Officer, Xcel Energy Services Inc | | February 2013 — March 2020 |
| Frank Prager | | 59 | | Senior Vice President, Strategy, Planning and External Affairs, Xcel Energy Inc. | | March 2020 — Present |
| | | | Vice President, Policy and Federal Affairs, Xcel Energy Services Inc. | | January 2015 — March 2020 |
| Amanda Rome | | 41 | | Executive Vice President, General Counsel, Xcel Energy Inc. | | June 2020 — Present |
| | | | Vice President and Deputy General Counsel, Xcel Energy Services Inc. | | October 2019 — June 2020 |
| | | | Managing Attorney, Xcel Energy Services Inc. | | July 2018 — October 2019 |
| | | | Rotational Position, Xcel Energy Services Inc. | | January 2018 — July 2018 |
| | | | Lead Assistant General Counsel, Xcel Energy Services Inc. | | July 2015 — January 2018 |
Jeffrey S. Savage (e) | | 50 | | Senior Vice President, Controller, Xcel Energy Inc. | | January 2015 — Present |
| Brian J. Van Abel | | 40 | | Executive Vice President, Chief Financial Officer, Xcel Energy Inc. | | March 2020 — Present |
| | | | Senior Vice President, Finance and Corporate Development, Xcel Energy Services Inc. | | September 2018 — March 2020 |
| | | | Vice President, Treasurer, Xcel Energy Services Inc. | | July 2015 — September 2018 |
Nuclear plant(a)No family relationships exist between any of the executive officers or directors.
(b)Ages as of Feb. 23, 2022.
(c)In April 2014, Energy Future Holdings Corp., the majority of its subsidiaries, including Texas Competitive Energy Holdings the parent company of Luminant, filed a voluntary bankruptcy petition under Chapter 11 of the United States Bankruptcy Code. Texas Competitive Energy Holdings emerged from Chapter 11 in October 2016.
(d)Effective March 1, 2022, Mr. Carter will assume the role of Executive Vice President, Group President, Utilities, and Chief Customer Officer.
(e)Effective March 1, 2022, Mr. Savage will assume the role of Chief Audit and Financial Services Officer and will no longer be serving as an executive officer.
Xcel Energy is subject to a variety of risks, many of which are beyond our control. Risks that may adversely affect the business, financial condition, results of operations or cash flows are described below. Although the risks are organized by heading, and each risk is described separately, many of the risks are interrelated. These risks should be carefully considered together with the other information set forth in this report and future reports that we file with the SEC. You should not interpret the disclosure of any risk factor to imply that the risk has not already materialized.
While we believe we have identified and discussed below the key risk factors affecting our business, there may be additional risks and uncertainties that are not presently known or that are not currently believed to be significant that may adversely affect our business, financial condition, results of operations or cash flows in the future.
Oversight of Risk and Related Processes
The Board of Directors is responsible for the oversight of material risk and maintaining an effective risk monitoring process. Management and the Board of Directors’ committees have responsibility for overseeing the identification and mitigation of key risks and reporting its assessments and activities to the full Board of Directors.
Xcel Energy maintains a robust compliance program and promotes a culture of compliance beginning with the tone at the top. The risk mitigation process includes adherence to our code of conduct and compliance policies, operation of formal risk management structures and overall business management. Xcel Energy further mitigates inherent risks through formal risk committees and corporate functions such as internal audit, and internal controls over financial reporting and legal.
Management identifies and analyzes risks to determine materiality and other attributes such as timing, probability and controllability. Identification and risk analysis occurs formally through risk assessment conducted by senior management, the financial disclosure process, hazard risk procedures, internal audit and compliance with financial and operational controls.
Management also identifies and analyzes risk through the business planning process, development of goals and establishment of key performance indicators, including identification of barriers to implementing Xcel Energy’s strategy. The business planning process also identifies likelihood and mitigating factors to prevent the assumption of inappropriate risk to meet goals.
Management communicates regularly with the Board of Directors and key stakeholders regarding risk. Senior management presents and communicates a periodic risk assessment to the Board of Directors, providing information on the risks that management believes are material, including financial impact, timing, likelihood and mitigating factors. The Board of Directors regularly reviews management’s key risk assessments, which includes areas of existing and future macroeconomic, financial, operational, policy, environmental and security risks.
The oversight, management and mitigation of risk is an integral and continuous part of the Board of Directors’ governance of Xcel Energy. The Board of Directors assigns oversight of critical risks to each of its four committees to ensure these risks are well understood and given appropriate focus.
The Audit Committee is responsible for reviewing the adequacy of the committee’s risk oversight and affirming appropriate aggregate oversight occurs. Committees regularly report on their oversight activities and certain risk issues may be brought to the full Board of Directors for consideration when deemed appropriate.
New risks are considered and assigned as appropriate during the annual Board of Directors and committee evaluation process, resulting in updates to the committee charters and annual work plans. Additionally, the Board of Directors conducts an annual strategy session where Xcel Energy’s future plans and initiatives are reviewed.
Operational Risks
Our natural gas and electric generation/transmission and distribution operations involve numerous risks that may result in accidents and other operating risks and costs.
Our natural gas transmission and distribution activities include inherent hazards and operating risks, such as leaks, explosions, outages and mechanical problems. Our electric generation, transmission and distribution activities include inherent hazards and operating risks such as contact, fire and outages.
These risks could result in loss of life, significant property damage, environmental pollution, impairment of our operations and amortization expensessubstantial financial losses to employees, third-party contractors, customers or the public. We maintain insurance against most, but not all, of these risks and losses.
The occurrence of these events, if not fully covered by insurance, could have a material effect on our financial condition, results of operations and cash flows as well as potential loss of reputation.
Other uncertainties and risks inherent in operating and maintaining Xcel Energy's facilities include, but are lower mostlynot limited to:
•Risks associated with facility start-up operations, such as whether the facility will achieve projected operating performance on schedule and otherwise as planned.
•Failures in the availability, acquisition or transportation of fuel or other necessary supplies.
•The impact of unusual or adverse weather conditions and natural disasters, including, but not limited to, tornadoes, icing events, floods and droughts.
•Performance below expected or contracted levels of output or efficiency (e.g., performance guarantees).
•Availability of replacement equipment.
•Availability of adequate water resources and ability to satisfy water intake and discharge requirements.
•Inability to identify, manage properly or mitigate equipment defects.
•Use of new or unproven technology.
•Risks associated with dependence on a specific type of fuel or fuel source, such as commodity price risk, availability of adequate fuel supply and transportation and lack of available alternative fuel sources.
•Increased competition due to, reduced refueling outageamong other factors, new facilities, excess supply, shifting demand and regulatory changes.
Additionally, compliance with existing and potential new regulations related to the operation and maintenance of our natural gas infrastructure could result in significant costs. The PHMSA is responsible for administering the DOT’s national regulatory program to assure the safe transportation of natural gas, petroleum and other hazardous materials by pipelines. The PHMSA continues to develop regulations and other approaches to risk management to assure safety in design, construction, testing, operation, maintenance and emergency response of natural gas pipeline infrastructure. We have programs in place to comply with these regulations and systematically monitor and renew infrastructure over time, however, a significant incident or material finding of non-compliance could result in penalties and higher costs of operations.
Our natural gas and electric transmission and distribution operations are dependent upon complex information technology systems and network infrastructure, the failure of which could disrupt our normal business operations, which could have a material adverse effect on our ability to process transactions and provide services.
Our utility operations are subject to long-term planning and project risks.
Most electric utility investments are planned to be used for decades. Transmission and generation investments typically have long lead times and are planned well in advance of in-service dates and typically subject to long-term resource plans. These plans are based on numerous assumptions such as: sales growth, customer usage, commodity prices, economic activity, costs, regulatory mechanisms, customer behavior, available technology and public policy. Xcel Energy’s long-term resource plan is dependent on our ability to obtain required approvals, develop necessary technical expertise, allocate and coordinate sufficient resources and adhere to budgets and timelines.
In addition, the long-term nature of both our planning and our asset lives are subject to risk. The electric utility sector is undergoing significant change (e.g., increases in energy efficiency, wider adoption of distributed generation and shifts away from fossil fuel generation to renewable generation). Customer adoption of these technologies and increased energy efficiency could result in excess transmission and generation resources, downward pressure on sales growth, and potentially stranded costs if we are not able to fully recover costs and operating efficiencies;investments.
PlantThe magnitude and timing of resource additions and changes in customer demand may not coincide with evolving customer preference for generation resources and end-uses, which introduces further uncertainty into long-term planning. Efforts to electrify the transportation and building sectors to reduce GHG emissions may result in higher electric demand and lower natural gas demand over time. Higher electric demand may require us to adopt new technologies and make significant transmission and distribution investments including advanced grid infrastructure, which increases exposure to overall grid instability and technology obsolescence. Evolving stakeholder preference for lower emissions from generation sources and end-uses, like heating, may impact our resource mix and put pressure on our ability to recover capital investments in natural gas generation and delivery. Multiple states may not agree as to the appropriate resource mix, which may lead to costs decreasedto comply with one jurisdiction that are not recoverable across all jurisdictions served by the same assets.
We are subject to longer-term availability of inputs such as coal, natural gas, uranium and water to cool our facilities. Lack of availability of these resources could jeopardize long-term operations of our facilities or make them uneconomic to operate.
Our utilities are highly dependent on suppliers to deliver components in accordance with short and long-term project schedules.
Our products contain components that are globally sourced from suppliers who, in turn, source components from their suppliers. A shortage of key components in which an alternative supplier is not identified could significantly impact project plans. Such impacts could include timing of projects, including potential for project cancellation. Failure to adhere to project budgets and timelines could adversely impact our results of operations, financial condition or cash flows.
We are subject to commodity risks and other risks associated with energy markets and energy production.
In the event fuel costs increase, customer demand could decline and bad debt expense may rise, which may have a material impact on our results of operations. Despite existing fuel recovery mechanisms in most of our states, higher fuel costs could significantly impact our results of operations if costs are not recovered. Delays in the timing of the collection of fuel cost recoveries could impact our cash flows and liquidity.
A significant disruption in supply could cause us to seek alternative supply services at potentially higher costs and supply shortages may not be fully resolved, which could cause disruptions in our ability to provide services to our customers. Failure to provide service due to disruptions may also result in fines, penalties or cost disallowances through the regulatory process. Also, significantly higher energy or fuel costs relative to sales commitments could negatively impact our cash flows and results of operations.
We also engage in wholesale sales and purchases of electric capacity, energy and energy-related products as well as natural gas. In many markets, emission allowances and/or RECs are also needed to comply with various statutes and commission rulings. As a result, we are subject to market supply and commodity price risk.
Commodity price changes can affect the value of our commodity trading derivatives. We mark certain derivatives to estimated fair market value on a daily basis. Settlements can vary significantly from estimated fair values recorded and significant changes from the assumptions underlying our fair value estimates could cause earnings variability. The management of risks associated with hedging and trading is based, in part, on programs and procedures which utilize historical prices and trends.
Due to the inherent uncertainty involved in price movements and potential deviation from historical pricing, Xcel Energy is unable to fully assure that its risk management programs and procedures would be effective to protect against all significant adverse market deviations.
In addition, Xcel Energy cannot fully assure that its controls will be effective against all potential risks, including, without limitation, employee misconduct. If such programs and procedures are not effective, Xcel Energy’s results of operations, financial condition or cash flows could be materially impacted.
Failure to attract and retain a qualified workforce could have an adverse effect on operations.
In 2021, the competition for talent has become increasingly intense as a result of lower expensesthe ongoing “great resignation”, and we may experience increased employee turnover due to this tightening labor market. In addition, specialized knowledge is required of our technical employees for construction and operation of transmission, generation and distribution assets, which may pose additional difficulty for us as we work to recruit, retain and motivate employees in this climate. Failure to hire and adequately train replacement employees, including the transfer of significant internal historical knowledge and expertise to new employees or future availability and cost of contract labor may adversely affect the ability to manage and operate our business. Inability to attract and retain these employees could adversely impact our results of operations, financial condition or cash flows.
Our operations use third-party contractors in addition to employees to perform periodic and ongoing work.
We rely on third-party contractors to perform operations, maintenance and construction work. Our contractual arrangements with these contractors typically include performance standards, progress payments, insurance requirements and security for performance. Poor vendor performance or contractor unavailability could impact ongoing operations, restoration operations, our reputation and could introduce financial risk or risks of fines.
Our employees, directors, third-party contractors, or suppliers may violate or be perceived to violate our Codes of Conduct, which could have an adverse effect on our reputation.
We are exposed to risk of employee or third-party contractor fraud or other misconduct. All employees and members of the Board of Directors are subject to comply with our Code of Conduct and are required to participate in annual training. Additionally, suppliers are subject to comply with our supplier Code of Conduct.
Xcel Energy does not tolerate discrimination, violations of our Code of Conduct or other unacceptable behaviors. However, it is not always possible to identify and deter misconduct by employees and other third-parties, which may result in governmental investigations, other actions or lawsuits. If such actions are taken against us we may suffer loss of reputation and such actions could have a material effect on our financial condition, results of operations and cash flows.
Our subsidiary, NSP-Minnesota, is subject to the risks of nuclear generation.
NSP-Minnesota has two nuclear generation plants, PI and Monticello. Risks of nuclear generation include:
•Hazards associated with planned outagesthe use of radioactive material in energy production, including management, handling, storage and overhaulsdisposal.
•Limitations on insurance available to cover losses that may arise in connection with nuclear operations, as well as obligations to contribute to an insurance pool in the event of damages at a numbercovered U.S. reactor.
•Technological and financial uncertainties related to the costs of decommissioning nuclear plants may cause our funding obligations to change.
The NRC has authority to impose licensing and safety-related requirements for the operation of nuclear generation facilities;facilities, including the ability to impose fines and/or shut down a unit until compliance is achieved. NRC safety requirements could necessitate substantial capital expenditures or an increase in operating expenses. In addition, the INPO reviews NSP-Minnesota’s nuclear operations. Compliance with the INPO’s recommendations could result in substantial capital expenditures or a substantial increase in operating expenses.
If a nuclear incident did occur, it could have a material impact on our results of operations, financial condition or cash flows. Furthermore, non-compliance or the occurrence of a serious incident at other nuclear facilities could result in increased industry regulation, which may increase NSP-Minnesota’s compliance costs.
Financial Risks
Our profitability depends on the ability of our utility subsidiaries to recover their costs and changes in regulation may impair the ability of our utility subsidiaries to recover costs from their customers.
Employee benefits expenseWe are subject to comprehensive regulation by federal and state utility regulatory agencies, including siting and construction of facilities, customer service and the rates that we can charge customers.
The profitability of our utility operations is dependent on our ability to recover the costs of providing energy and utility services and earning a return on capital investment. Our rates are generally regulated and are based on an analysis of the utility’s costs incurred in a test year. The utility subsidiaries are subject to both future and historical test years depending upon the regulatory jurisdiction. Thus, the rates a utility is allowed to charge may or may not match its costs at any given time. Rate regulation is premised on providing an opportunity to earn a reasonable rate of return on invested capital.
There can also be no assurance that our regulatory commissions will judge all the costs of our utility subsidiaries to be prudent, which could result in disallowances, or that the regulatory process will always result in rates that will produce full recovery.
Overall, management believes prudently incurred costs are recoverable given the existing regulatory framework. However, there may be changes in the regulatory environment that could impair the ability of our utility subsidiaries to recover costs historically collected from customers, or these subsidiaries could exceed caps on capital costs required by commissions and result in less than full recovery.
Changes in the long-term cost-effectiveness or to the operating conditions of our assets may result in early retirements of utility facilities. While regulation typically provides cost recovery relief for these types of changes, there is no assurance that regulators would allow full recovery of all remaining costs.
Higher than expected inflation or tariffs may increase costs of construction and operations. Also, rising fuel costs could increase the risk that our utility subsidiaries will not be able to fully recover their fuel costs from their customers.
Adverse regulatory rulings or the imposition of additional regulations could have an adverse impact on our results of operations and materially affect our ability to meet our financial obligations, including debt payments and the payment of dividends on common stock.
Any reductions in our credit ratings could increase our financing costs and the cost of maintaining certain contractual relationships.
We cannot be assured that our current credit ratings or our subsidiaries’ ratings will remain in effect, or that a rating will not be lowered or withdrawn by a rating agency. Significant events including disallowance of costs, use of historic test years, elimination of riders or interim rates, increasing depreciation lives, lower returns on equity, changes to equity ratios and impacts of tax policy may impact our cash flows and credit metrics, potentially resulting in a change in our credit ratings. In addition, our credit ratings may change as a result of the differing methodologies or change in the methodologies used by the various rating agencies.
Any credit ratings downgrade could lead to higher borrowing costs or lower proceeds from equity issuances. It could also impact our ability to access capital markets. Also, our utility subsidiaries may enter into contracts that require posting of collateral or settlement if credit ratings fall below investment grade.
We are subject to capital market and interest rate risks.
Utility operations require significant capital investment. As a result, we frequently need to access capital markets. Any disruption in capital markets could have a material impact on our ability to fund our operations. Capital market disruption and financial market distress could prevent us from issuing short-term commercial paper, issuing new securities or cause us to issue securities with unfavorable terms and conditions, such as higher interest rates or lower proceeds from equity issuances. Higher interest rates on short-term borrowings with variable interest rates could also have an adverse effect on our operating results.
The performance of capital markets impacts the value of assets held in trusts to satisfy future obligations to decommission NSP-Minnesota’s nuclear plants and satisfy our defined benefit pension and postretirement benefit plan obligations. These assets are subject to market fluctuations and yield uncertain returns, which may fall below expected returns. A decline in the market value of these assets may increase funding requirements. Additionally, the fair value of the debt securities held in the nuclear decommissioning and/or pension trusts may be impacted by changes in interest rates.
We are subject to credit risks.
Credit risk includes the recognitionrisk that our customers will not pay their bills, which may lead to a reduction in liquidity and an increase in bad debt expense. Credit risk is comprised of numerous factors including the price of products and services provided, the economy and unemployment rates.
Credit risk also includes the risk that counterparties that owe us money or product will become insolvent and may breach their obligations. Should the counterparties fail to perform, we may be forced to enter into alternative arrangements. In that event, our financial results could be adversely affected and incur losses.
Xcel Energy may have direct credit exposure in our short-term wholesale and commodity trading activity to financial institutions trading for their own accounts or issuing collateral support on behalf of other counterparties. We may also have some indirect credit exposure due to participation in organized markets, (e.g., California Independent System Operator, SPP, PJM Interconnection, LLC, MISO and Electric Reliability Council of Texas), in which any credit losses are socialized to all market participants.
We have additional indirect credit exposure to financial institutions from letters of credit provided as security by power suppliers under various purchased power contracts. If any of the credit ratings of the letter of credit issuers were to drop below investment grade, the supplier would need to replace that security with an $8 millionacceptable substitute. If the security were not replaced, the party could be in default under the contract.
Increasing costs of our defined benefit retirement plans and employee benefits may adversely affect our results of operations, financial condition or cash flows.
We have defined benefit pension settlement expenseand postretirement plans that cover most of our employees. Assumptions related to future costs, return on investments, interest rates and other actuarial assumptions have a significant impact on our funding requirements of these plans. Estimates and assumptions may change. In addition, the Pension Protection Act sets the minimum funding requirements for defined benefit pension plans. Therefore, our funding requirements and contributions may change in the fourth quarterfuture. Also, the payout of 2017.
O&M expenses decreased $4 million, or 0.1 percent for 2016 compared with 2015.
Conservation and DSM Program Expenses — Conservation and DSM program expenses increased $28 million, or 11.4 percent, for 2017 compared with 2016. The increase wasa significant percentage of pension plan liabilities in a single year, due to higher customer participationhigh numbers of retirements or employees leaving, would trigger settlement accounting and could require Xcel Energy to recognize incremental pension expense related to unrecognized plan losses in electric conservationthe year liabilities are paid. Changes in industry standards utilized in key assumptions (e.g., mortality tables) could have a significant impact on future obligations and benefit costs.
Increasing costs associated with health care plans may adversely affect our results of operations.
Increasing levels of large individual health care claims and overall health care claims could have an adverse impact on our results of operations, financial condition or cash flows. Health care legislation could also significantly impact our benefit programs and costs.
We must rely on cash from our subsidiaries to make dividend payments.
Investments in our subsidiaries are our primary assets. Substantially all of our operations are conducted by our subsidiaries. Consequently, our operating cash flow and ability to service our debt and pay dividends depends upon the operating cash flows of our subsidiaries and their payment of dividends.
Our subsidiaries are separate legal entities that have no obligation to pay any amounts due pursuant to our obligations or to make any funds available for dividends on our common stock. In addition, each subsidiary’s ability to pay dividends depends on statutory and/or contractual restrictions which may include requirements to maintain minimum levels of equity ratios, working capital or assets.
If the utility subsidiaries were to cease making dividend payments, our ability to pay dividends on our common stock or otherwise meet our financial obligations could be adversely affected. Our utility subsidiaries are regulated by state utility commissions, which possess broad powers to ensure that the needs of the utility customers are met. We may be negatively impacted by the actions of state commissions that limit the payment of dividends by our utility subsidiaries.
Federal tax law may significantly impact our business.
Our utility subsidiaries collect estimated federal, state and local tax payments through their regulated rates. Changes to federal tax law may benefit or adversely affect our earnings and customer costs. Tax depreciable lives and the value/availability of various tax credits or the timeliness of their utilization may impact the economics or selection of resources. If tax rates are increased, there could be timing delays before regulated rates provide for recovery rates, mostlyof such tax increases in Minnesota. Conservationrevenues. In addition, certain IRS tax policies, such as tax normalization, may impact our ability to economically deliver certain types of resources relative to market prices.
Macroeconomic Risks
Economic conditions impact our business.
Xcel Energy’s operations are affected by local, national and DSM expenses, including incentives, are generallyworldwide economic conditions, which correlates to customers/sales growth (decline). Economic conditions may be impacted by insufficient financial sector liquidity leading to potential increased unemployment, which may impact customers’ ability to pay their bills, which could lead to additional bad debt expense.
Our utility subsidiaries face competitive factors, which could have an adverse impact on our financial condition, results of operations and cash flows. Further, worldwide economic activity impacts the demand for basic commodities necessary for utility infrastructure, which may inhibit our ability to acquire sufficient supplies. We operate in a capital-intensive industry and federal trade policy could significantly impact the cost of materials we use. There may be delays before these additional material costs can be recovered in rates.
We face risks related to health epidemics and other outbreaks, which may have a material effect on our major jurisdictions concurrently through ridersfinancial condition, results of operations and base rates. Timingcash flows.
The global outbreak of recovery may not correspondCOVID-19 continues to impact countries, communities, supply chains and markets. A high degree of uncertainty continues to exist regarding the period in which costs were incurred.
Conservationpandemic; the duration and DSM program expenses increased $20 million, or 8.9 percent, for 2016 compared with 2015. The increase is primarily attributable to more customer participation in DSM programs.
Depreciationmagnitude of business restrictions (domestically and Amortization — Depreciationglobally); the potential shortages of employees and amortization increased $176 million, or 13.5 percent, for 2017 compared with 2016. The increase was primarilythird-party contractors due to capital investmentsquarantine policies, vaccination requirements or government restrictions; re-shutdowns, if any, and prior year amortizationthe level and pace of economic recovery.
Xcel Energy has experienced and may continue to experience sales volatility and shifts between residential and C&I sales as a result of COVID-19. Xcel Energy has a decoupling mechanism in Colorado for residential and non-demand small C&I electric customer classes. In Minnesota, Xcel Energy has historically had a sales true-up mechanism for all electric customer classes which has ended in 2021. We are requesting implementation of a new sales true-up mechanism for 2022 - 2024. These mechanisms mitigate the impact of changes to sales levels as compared to a baseline.
Although the financial impact of the excess depreciation reserve in Minnesota.
Depreciation and amortization increased $179 million,pandemic on our financial results has largely been mitigated, we cannot ultimately predict whether it will have a material impact on our future liquidity, financial condition or 15.9 percent, for 2016 compared with 2015. The increase was primarily attributable to capital investments, including Pleasant Valley and Border Wind Farms, reductionresults of the excess depreciation reserve in Minnesota and recognition of the DOE settlement credits in 2015.
Taxes (Other Than Income Taxes) — Taxes (other than income taxes) increased $13 million, or 2.4 percent, for 2017 compared with 2016. The increase was primarily due to higher property taxes in Minnesota and Texas.
Taxes (other than income taxes) increased $20 million, or 4.0 percent, for 2016 compared with 2015. The increase was primarily due to higher property taxes in Minnesota, excludingoperations. Nor can we predict the impact of the tax deferralvirus on the health of our employees, our supply chain or our ability to recover higher costs associated with managing through the pandemic. The impact of COVID-19 may exacerbate other risks discussed herein, which could have a material effect on us. The situation is evolving and additional impacts may arise.
Operations could be impacted by war, terrorism or other events.
Our generation plants, fuel storage facilities, transmission and distribution facilities and information and control systems may be targets of terrorist activities. Any disruption could impact operations or result in a decrease in revenues and additional costs to repair and insure our assets. These disruptions could have a material impact on our financial condition, results of operations or cash flows.
The potential for terrorism has subjected our operations to increased risks and could have a material effect on our business. We have already incurred increased costs for security and capital expenditures in response to these risks. The insurance industry has also been affected by these events and the availability of insurance may decrease. In addition, insurance may have higher deductibles, higher premiums and more restrictive policy terms.
A disruption of the regional electric transmission grid, interstate natural gas pipeline infrastructure or other fuel sources, could negatively impact our business, brand and reputation. Because our facilities are part of an interconnected system, we face the risk of possible loss of business due to a disruption caused by the actions of a neighboring utility.
We also face the risks of possible loss of business due to significant events such as severe storms, severe temperature extremes, wildfires (particularly in Colorado), widespread pandemic, generator or transmission facility outage, pipeline rupture, railroad disruption, operator error, sudden and significant increase or decrease in wind generation or a workforce disruption.
In addition, major catastrophic events throughout the world may disrupt our business. Xcel Energy participates in a global supply chain, which includes materials and components that are globally sourced. A prolonged disruption could result in the delay of equipment and materials that may impact our ability to reliably serve our customers.
A major disruption could result in a significant decrease in revenues and additional costs to repair assets, which could have a material impact on our results of operations, financial condition or cash flows.
Xcel Energy participates in GridEx, which is the largest grid security exercise in North America. These efforts, led by the NERC, test and further develop the coordination, threat sharing and interaction between utilities and various government agencies relative to potential cyber and physical threats against the nation’s electric grid.
A cyber incident or security breach could have a material effect on our business.
We operate in an industry that requires the continued operation of sophisticated information technology, control systems and network infrastructure. In addition, we use our systems and infrastructure to create, collect, use, disclose, store, dispose of and otherwise process sensitive information, including company data, customer energy usage data, and personal information regarding customers, employees and their dependents, contractors, shareholders and other individuals.
Xcel Energy’s generation, transmission, distribution and fuel storage facilities, information technology systems and other infrastructure or physical assets as well as information processed in our systems (e.g., information regarding our customers, employees, operations, infrastructure and assets) could be affected by cyber security incidents, including those caused by human error.
The utility industry has been the target of several attacks on operational systems and has seen an increased volume and sophistication of cyber security incidents from international activist organizations, Nation States and individuals. During the normal course of business, we have experienced and expect to continue to experience attempts to compromise our information technology and control systems, network infrastructure and other assets. To date, no cybersecurity incident or attack has had a material impact on our business or results of operation.
Cyber security incidents could harm our businesses by limiting our generating, transmitting and distributing capabilities, delaying our development and construction of new facilities or capital improvement projects to existing facilities, disrupting our customer operations or causing the release of customer information, all of which would likely receive state and federal regulatory scrutiny and could expose us to liability.
Xcel Energy’s generation, transmission systems and natural gas pipelines are part of an interconnected system. Therefore, a disruption caused by the impact of a cyber security incident of the regional electric transmission grid, natural gas pipeline infrastructure or other fuel sources of our third-party service providers’ operations, could also negatively impact our business.
Our supply chain for procurement of digital equipment and services may expose software or hardware to these risks and could result in a breach or significant costs of remediation. We are unable to quantify the potential impact of cyber security threats or subsequent related actions. Cyber security incidents and regulatory action could result in a material decrease in revenues and may causesignificant additional costs (e.g., penalties, third-party claims, repairs, insurance or compliance) and potentially disrupt our supply and markets for natural gas, oil and other fuels.
We maintain security measures to protect our information technology and control systems, network infrastructure and other assets. However, these assets and the information they process may be vulnerable to cyber security incidents, including asset failure or unauthorized access to assets or information.
A failure or breach of our technology systems or those of our third-party service providers could disrupt critical business functions and may negatively impact our business, our brand, and our reputation. The cyber security threat is dynamic and evolves continually, and our efforts to prioritize network protection may not be effective given the constant changes to threat vulnerability.
Our operating results may fluctuate on a seasonal and quarterly basis and can be adversely affected by milder weather.
Our electric and natural gas utility businesses are seasonal and weather patterns can have a material impact on our operating performance. Demand for electricity is often greater in the summer and winter months associated with cooling and heating. Because natural gas is heavily used for residential and commercial heating, the demand depends heavily upon weather patterns. A significant amount of natural gas revenues are recognized in the first and fourth quarters related to the Minnesota 2016 multi-yearheating season. Accordingly, our operations have historically generated less revenues and income when weather conditions are milder in the winter and cooler in the summer. Unusually mild winters and summers could have an adverse effect on our financial condition, results of operations or cash flows.
Public Policy Risks
We may be subject to legislative and regulatory responses to climate change, with which compliance could be difficult and costly.
Legislative and regulatory responses related to climate change may create financial risk as our facilities may be subject to additional regulation at either the state or federal level in the future. International agreements could additionally lead to future federal or state regulations.
In 2015, the United Nations Framework Convention on Climate Change reached consensus among 190 nations on an agreement (the Paris Agreement) that establishes a framework for GHG mitigation actions by all countries, with a goal of holding the increase in global average temperature to below 2º Celsius above pre-industrial levels and an aspiration to limit the increase to 1.5º Celsius.
In April 2021, ahead of the United Nations Climate Change Conference in Glasgow, the Biden Administration committed the U.S. to a Nationally Determined Contribution of 50-52% net GHG emissions reduction economy-wide from 2005 levels. This commitment and other agreements made in Glasgow could result in future additional GHG reductions in the United States. In addition, the Biden Administration has announced plans to implement new climate change programs, including potential regulation of GHG emissions targeting the utility industry.
Many states and localities continue to pursue their own climate policies. The steps Xcel Energy has taken to date to reduce GHG emissions, including energy efficiency measures, adding renewable generation or retiring or converting coal plants to natural gas, occurred under state-endorsed resource plans, renewable energy standards and other state policies.
We may be subject to climate change lawsuits. An adverse outcome could require substantial capital expenditures and possibly require payment of substantial penalties or damages. Defense costs associated with such litigation can also be significant and could affect results of operations, financial condition or cash flows if such costs are not recovered through regulated rates.
If our regulators do not allow us to recover all or a part of the cost of capital investment or the O&M costs incurred to comply with the mandates, it could have a material effect on our results of operations, financial condition or cash flows.
Increased risks of regulatory penalties could negatively impact our business.
The Energy Act increased civil penalty authority for violation of FERC statutes, rules and orders. The FERC can impose penalties of up to $1.3 million per violation per day, particularly as it relates to energy trading activities for both electricity and natural gas. In addition, NERC electric rate case.reliability standards and critical infrastructure protection requirements are mandatory and subject to potential financial penalties. Also, the PHMSA, Occupational Safety and Health Administration and other federal agencies have the authority to assess penalties.
In the event of serious incidents, these agencies may pursue penalties. In addition, certain states have the authority to impose substantial penalties. If a serious reliability, cyber or safety incident did occur, it could have a material effect on our results of operations, financial condition or cash flows.
The continued use of natural gas for both power generation and Debt — AFUDC increased $23 milliongas distribution have increasingly become a public policy advocacy target. These efforts may result in a limitation of natural gas as an energy source for 2017 comparedboth power generation and heating, which could impact our ability to reliably and affordably serve our customers.
In recent years, there have been various local and state agency proposals within and outside our service territories that would attempt to restrict the use and availability of natural gas. If such policies were to prevail, we may be forced to make new resource investment decisions which could potentially result in stranded costs if we are not able to fully recover costs and investments and impact the overall reliability of our service.
Environmental Risks
We are subject to environmental laws and regulations, with 2016. Thewhich compliance could be difficult and costly.
We are subject to environmental laws and regulations that affect many aspects of our operations, including air emissions, water quality, wastewater discharges and the generation, transport and disposal of solid wastes and hazardous substances. Laws and regulations require us to obtain permits, licenses, and approvals and to comply with a variety of environmental requirements.
Environmental laws and regulations can also require us to restrict or limit the output of facilities or the use of certain fuels, shift generation to lower-emitting facilities, install pollution control equipment, clean up spills and other contamination and correct environmental hazards. Failure to meet requirements of environmental mandates may result in fines or penalties. We may be required to pay all or a portion of the cost to remediate sites where our past activities, or the activities of other parties, caused environmental contamination.
Changes in environmental policies and regulations or regulatory decisions may result in early retirements of our generation facilities. While regulation typically provides relief for these types of changes, there is no assurance that regulators would allow full recovery of all remaining costs.
We are subject to mandates to provide customers with clean energy, renewable energy and energy conservation offerings. It could have a material effect on our results of operations, financial condition or cash flows if our regulators do not allow us to recover the cost of capital investment or O&M costs incurred to comply with the requirements.
In addition, existing environmental laws or regulations may be revised and new laws or regulations may be adopted. We may also incur additional unanticipated obligations or liabilities under existing environmental laws and regulations.
We are subject to physical and financial risks associated with climate change and other weather, natural disaster and resource depletion impacts.
Climate change can create physical and financial risk. Physical risks include changes in weather conditions and extreme weather events. Our customers’ energy needs vary with weather. To the extent weather conditions are affected by climate change, customers’ energy use could increase was primarilyor decrease. Increased energy use due to higher CWIP, particularly the Rush Creek wind projectweather changes may require us to invest in Colorado.
AFUDC increased $5 million for 2016 compared with 2015. The increase was primarilygenerating assets, transmission and infrastructure. Decreased energy use due to weather changes may result in decreased revenues.
Climate change may impact the expansioneconomy, which could impact our sales and revenues. The price of transmission facilitiesenergy has an impact on the economic health of our communities. The cost of additional regulatory requirements, such as regulation of GHG, could impact the availability of goods and otherprices charged by our suppliers which would normally be borne by consumers through higher prices for energy and purchased goods.
To the extent financial markets view climate change and emissions of GHGs as a financial risk, this could negatively affect our ability to access capital expenditures.markets or cause us to receive less than ideal terms and conditions.
We have committed to a number of long-term climate change goals, which in part are dependent on future technologies not currently in existence. Given the long-term nature of these goals, there is an inherent uncertainty due to internal and external factors regarding our ability to achieve our stated climate change goals. To the extent climate change goals are not met, this could negatively impact our reputation and potentially result in financial risk.
Interest Charges — Interest chargesSevere weather impacts our service territories, primarily when thunderstorms, flooding, tornadoes, wildfires and snow or ice storms occur. Extreme weather conditions in general require system backup and can contribute to increased $16 million,system stress, including service interruptions. Extreme weather conditions creating high energy demand may raise electricity prices, increasing the cost of energy we provide to our customers.
To the extent the frequency of extreme weather events increases, this could increase our cost of providing service. Periods of extreme temperatures could impact our ability to meet demand. Changes in precipitation resulting in droughts or 2.5 percent,water shortages could adversely affect our operations. Drought conditions also contribute to the increase in wildfire risk from our electric generation facilities.
While we carry liability insurance, given an extreme event, if Xcel Energy was found to be liable for 2017 compared with 2016. Thewildfire damages, amounts that potentially exceed our coverage could negatively impact our results of operations, financial condition or cash flows.
Drought or water depletion could adversely impact our ability to provide electricity to customers, cause early retirement of power plants and increase wasthe cost for energy. Adverse events may result in increased insurance costs and/or decreased insurance availability. We may not recover all costs related to higher debt levels to fund capital investments, partially offset by refinancings at lower interest rates.mitigating these physical and financial risks.
| | |
| ITEM 1B — UNRESOLVED STAFF COMMENTS |
Interest charges increased $52 million, or 8.7 percent, for 2016 compared with 2015. The increase was related to higher long-term debt levels to fund capital investments, partially offset by refinancings at lower interest rates.None.
Income Taxes — Income tax expense decreased $39 million for 2017 compared with 2016. The decrease was primarily driven by increased wind PTCs, a net tax benefit related
Virtually all of the utility plant property of the operating companies is subject to the lien of their respective first mortgage bond indentures.
| | | | | | | | | | | | | | | | | | | | | | | |
NSP-Minnesota Station, Location and Unit at Dec. 31, 2021 | | Fuel | | Installed | | MW (a) | |
| Steam: | | | | | | | |
A.S. King-Bayport, MN, 1 Unit (f) | | Coal | | 1968 | | 511 | | |
Sherco-Becker, MN (e) | | | | | | | |
| Unit 1 | | Coal | | 1976 | | 680 | | |
| Unit 2 | | Coal | | 1977 | | 682 | | |
| Unit 3 | | Coal | | 1987 | | 517 | | (b) |
| Monticello, MN, 1 Unit | | Nuclear | | 1971 | | 617 | | |
| PI-Welch, MN | | | | | | | |
| Unit 1 | | Nuclear | | 1973 | | 521 | | |
| Unit 2 | | Nuclear | | 1974 | | 519 | | |
| Various locations, 4 Units | | Wood/Refuse | | Various | | 36 | | (c) |
| Combustion Turbine: | | | | | | | |
| Angus Anson-Sioux Falls, SD, 3 Units | | Natural Gas | | 1994 - 2005 | | 327 | | |
| Black Dog-Burnsville, MN, 3 Units | | Natural Gas | | 1987 - 2018 | | 494 | | |
| Blue Lake-Shakopee, MN, 6 Units | | Natural Gas | | 1974 - 2005 | | 447 | | |
| High Bridge-St. Paul, MN, 3 Units | | Natural Gas | | 2008 | | 530 | | |
| Inver Hills-Inver Grove Heights, MN, 6 Units | | Natural Gas | | 1972 | | 252 | | |
| Riverside-Minneapolis, MN, 3 Units | | Natural Gas | | 2009 | | 454 | | |
| Various locations, 7 Units | | Natural Gas | | Various | | 10 | | |
| Wind: | | | | | | | |
| Blazing Star 1-Lincoln County, MN, 100 Units | | Wind | | 2020 | | 200 | | (d) |
| Blazing Star 2-Lincoln County, MN, 100 Units | | Wind | | 2021 | | 200 | | (d) |
| Border-Rolette County, ND, 75 Units | | Wind | | 2015 | | 148 | | (d) |
| Community Wind North-Lincoln County, MN, 12 Units | | Wind | | 2020 | | 26 | | (d) |
| Courtenay Wind-Stutsman County, ND, 100 Units | | Wind | | 2016 | | 190 | | (d) |
| Crowned Ridge 2-Grant County, SD, 88 Units | | Wind | | 2020 | | 192 | | (d) |
| Foxtail-Dickey County, ND, 75 Units | | Wind | | 2019 | | 150 | | (d) |
| Freeborn-Freeborn County, MN, 100 Units | | Wind | | 2021 | | 200 | | (d) |
| Grand Meadow-Mower County, MN, 67 Units | | Wind | | 2008 | | 99 | | (d) |
| Jeffers-Cottonwood County, MN, 20 Units | | Wind | | 2020 | | 43 | | (d) |
| Lake Benton-Pipestone County, MN, 44 Units | | Wind | | 2019 | | 99 | | (d) |
| Mower-Mower County, MN, 43 Units | | Wind | | 2021 | | 91 | | (d) |
| Nobles-Nobles County, MN, 134 Units | | Wind | | 2010 | | 197 | | (d) |
| Pleasant Valley-Mower County, MN, 100 Units | | Wind | | 2015 | | 196 | | (d) |
| | | | Total | | 8,628 | | |
(a)Summer 2021 net dependable capacity.
(b)Based on NSP-Minnesota’s ownership of 59%.
(c)Refuse-derived fuel is made from municipal solid waste.
(d)Values disclosed are the generation levels at the point-of-interconnection for these wind units. Capacity is attainable only when wind conditions are sufficiently available (on-demand net dependable capacity is zero).
(e)A.S. King is expected to be retired early in 2028.
(f)Sherco Unit 1, 2, and 3 are expected to be retired early in 2026, 2023 and 2030, respectively.
| | | | | | | | | | | | | | | | | | | | | | | |
NSP-Wisconsin Station, Location and Unit at Dec. 31, 2021 | | Fuel | | Installed | | MW (a) | |
| Steam: | | | | | | | |
| Bay Front-Ashland, WI, 2 Units | | Wood/Natural Gas | | 1948 - 1956 | | 41 | | |
| French Island-La Crosse, WI, 2 Units | | Wood/Refuse | | 1940 - 1948 | | 16 | | (b) |
| Combustion Turbine: | | | | | | | |
| French Island-La Crosse, WI, 2 Units | | Oil | | 1974 | | 122 | | |
| Wheaton-Eau Claire, WI, 5 Units | | Natural Gas/Oil | | 1973 | | 234 | | |
| Hydro: | | | | | | | |
| Various locations, 63 Units | | Hydro | | Various | | 135 | | |
| | | | Total | | 548 | | |
(a)Summer 2021 net dependable capacity.
(b)Refuse-derived fuel is made from municipal solid waste.
| | | | | | | | | | | | | | | | | | | | | | | |
PSCo Station, Location and Unit at Dec. 31, 2021 | | Fuel | | Installed | | MW (a) | |
| Steam: | | | | | | | |
Comanche-Pueblo, CO (b) | | | | | | | |
| Unit 1 | | Coal | | 1973 | | 325 | | |
| Unit 2 | | Coal | | 1975 | | 335 | | |
| Unit 3 | | Coal | | 2010 | | 500 | | (c) |
Craig-Craig, CO, 2 Units (d) | | Coal | | 1979 - 1980 | | 82 | | (e) |
Hayden-Hayden, CO, 2 Units | | Coal | | 1965 - 1976 | | 233 | | (f) |
| Pawnee-Brush, CO, 1 Unit | | Coal | | 1981 | | 505 | | |
| Cherokee-Denver, CO, 1 Unit | | Natural Gas | | 1968 | | 310 | | |
| Combustion Turbine: | | | | | | | |
| Blue Spruce-Aurora, CO, 2 Units | | Natural Gas | | 2003 | | 264 | | |
| Cherokee-Denver, CO, 3 Units | | Natural Gas | | 2015 | | 576 | | |
| Fort St. Vrain-Platteville, CO, 6 Units | | Natural Gas | | 1972 - 2009 | | 973 | | |
| Rocky Mountain-Keenesburg, CO, 3 Units | | Natural Gas | | 2004 | | 580 | | |
| Various locations, 8 Units | | Natural Gas | | Various | | 251 | | |
| Hydro: | | | | | | | |
| Cabin Creek-Georgetown, CO | | | | | | | |
| Pumped Storage, 2 Units | | Hydro | | 1967 | | 210 | | |
| Various locations, 8 Units | | Hydro | | Various | | 25 | | |
| Wind: | | | | | | | |
| Rush Creek, CO, 300 units | | Wind | | 2018 | | 582 | | (g) |
| Cheyenne Ridge, CO, 229 units | | Wind | | 2020 | | 477 | | (g) |
| | | | Total | | 6,228 | | |
(a) Summer 2021 net dependable capacity.
(b) In 2018, the CPUC approved early retirement of PSCo’s Comanche Units 1 and 2 in 2022 and 2025, respectively.
(c) Based on PSCo’s ownership of 67%.
(d) Craig Unit 1 and 2 are expected to be retired early in 2025 and 2028, respectively.
(e) Based on PSCo’s ownership of 10%.
(f) Based on PSCo’s ownership of 76% of Unit 1 and 37% of Unit 2.
(g) Values disclosed are the generation levels at the point-of-interconnection. Capacity is attainable only when wind conditions are sufficiently available (on-demand net dependable capacity is zero).
| | | | | | | | | | | | | | | | | | | | | | | |
SPS Station, Location and Unit at Dec. 31, 2021 | | Fuel | | Installed | | MW (a) | |
| Steam: | | | | | | | |
| Cunningham-Hobbs, NM, 2 Units | | Natural Gas | | 1957 - 1965 | | 225 | | |
Harrington-Amarillo, TX, 3 Units (b) | | Coal | | 1976 - 1980 | | 1,018 | | |
| Jones-Lubbock, TX, 2 Units | | Natural Gas | | 1971 - 1974 | | 486 | | |
| Maddox-Hobbs, NM, 1 Unit | | Natural Gas | | 1967 | | 112 | | |
| Nichols-Amarillo, TX, 3 Units | | Natural Gas | | 1960 - 1968 | | 457 | | |
| Plant X-Earth, TX, 4 Units | | Natural Gas | | 1952 - 1964 | | 298 | | |
Tolk-Muleshoe, TX, 2 Units (d) | | Coal | | 1982 - 1985 | | 1,067 | | |
| Combustion Turbine: | | | | | | | |
| Cunningham-Hobbs, NM, 2 Units | | Natural Gas | | 1997 | | 207 | | |
| Jones-Lubbock, TX, 2 Units | | Natural Gas | | 2011 - 2013 | | 334 | | |
| Maddox-Hobbs, NM, 1 Unit | | Natural Gas | | 1963 - 1976 | | 61 | | |
| Wind: | | | | | | | |
| Hale-Plainview, TX, 239 Units | | Wind | | 2019 | | 477 | | (c) |
| Sagamore-Dora, NM, 240 Units | | Wind | | 2020 | | 507 | | (c) |
| | | | Total | | 5,249 | | |
(a) Summer 2021 net dependable capacity.
(b) Harrington is expected to be converted to natural gas by the end of 2024.
(c) Values disclosed are the generation levels at the point-of-interconnection for these wind units. Capacity is attainable only when wind conditions are sufficiently available (on-demand net dependable capacity is zero).
(d) Tolk Unit 1 and 2 are proposed to be retired in 2034.
Electric utility overhead and underground transmission and distribution lines at Dec. 31, 2021:
| | | | | | | | | | | | | | | | | | | | | | | | | | |
| Conductor Miles | | NSP-Minnesota | | NSP-Wisconsin | | PSCo | | SPS |
| Transmission | | | | | | | | |
| 500 KV | | 2,915 | | | — | | | — | | | — | |
| 345 KV | | 13,570 | | | 2,943 | | | 4,978 | | | 11,688 | |
| 230 KV | | 2,300 | | | — | | | 12,141 | | | 9,763 | |
| 161 KV | | 640 | | | 1,778 | | | — | | | — | |
| 138 KV | | — | | | — | | | 92 | | | — | |
| 115 KV | | 8,086 | | | 1,818 | | | 5,075 | | | 14,880 | |
| Less than 115 KV | | 6,644 | | | 5,870 | | | 1,830 | | | 4,423 | |
| Total Transmission | | 34,155 | | | 12,409 | | | 24,116 | | | 40,754 | |
| | | | | | | | |
| Distribution | | | | | | | | |
| Less than 115 KV | | 81,406 | | | 27,701 | | | 78,712 | | | 22,651 | |
| | | | | | | | |
| Total | | 115,561 | | | 40,110 | | | 102,828 | | | 63,405 | |
Electric utility transmission and distribution substations at Dec. 31, 2021: | | | | | | | | | | | | | | | | | | | | | | | | | | |
| | NSP-Minnesota | | NSP-Wisconsin | | PSCo | | SPS |
| Quantity | | 354 | | | 204 | | | 237 | | | 458 | |
Natural gas utility mains at Dec. 31, 2021:
| | | | | | | | | | | | | | | | | | | | | | | | | | | | | | | | |
| Miles | | NSP-Minnesota | | NSP-Wisconsin | | PSCo | | SPS | | WGI |
| Transmission | | 85 | | | 3 | | | 2,174 | | | 20 | | | 11 | |
| Distribution | | 10,741 | | | 2,526 | | | 23,243 | | | — | | | — | |
| | |
| ITEM 3 — LEGAL PROCEEDINGS |
Xcel Energy is involved in various litigation matters in the ordinary course of business. The assessment of whether a loss is probable or is a reasonable possibility, and whether the loss or a range of loss is estimable, often involves a series of complex judgments about future events. Management maintains accruals for losses probable of being incurred and subject to reasonable estimation.
Management is sometimes unable to estimate an amount or range of a reasonably possible loss in certain situations, including but not limited to when (1) the damages sought are indeterminate, (2) the proceedings are in the early stages, or (3) the matters involve novel or unsettled legal theories. In such cases, there is considerable uncertainty regarding the timing or ultimate resolution of appeals/audits in 2017, an increase in research and experimentation credits, lower pretax earnings in 2017 andsuch matters, including a rise in permanent plant-related adjustments. PTCs are flowed back to customers and reduce electric margin. The decrease was partially offset bypossible eventual loss.
For current proceedings not specifically reported herein, management does not anticipate that the estimated one-time, non-cash, income tax expense recognized in the fourth quarter related to the TCJA. The ETR was 32.1 percent for 2017 compared with 34.1 percent for 2016. The lower ETR in 2017 was primarily due to the adjustments referenced above. Excluding the impact for the TCJA adjustment, the ETRultimate liabilities, if any, would have been 30.7 percent for 2017. a material effect on Xcel Energy’s consolidated financial statements. Legal fees are generally expensed as incurred.
See Note 612 to the consolidated financial statements, Item 1 and Item 7 for further discussion.information.
Income tax expense | | |
| ITEM 4 — MINE SAFETY DISCLOSURES |
None.
PART II
| | |
| ITEM 5 — MARKET FOR REGISTRANT’S COMMON EQUITY, RELATED STOCKHOLDER MATTERS AND ISSUER PURCHASES OF EQUITY SECURITIES. |
Stock Data
Xcel Energy Inc.’s common stock is listed on the Nasdaq Global Select Market (Nasdaq). The trading symbol is XEL. The number of common stockholders of record as of Feb. 17, 2022 was approximately 49,137.
The following compares our cumulative TSR on common stock with the cumulative TSR of the EEI Investor-Owned Electrics Index and the S&P 500 Composite Stock Price Index over the last five years.
The EEI Investor-Owned Electrics Index (market capitalization-weighted) included 39 companies at year-end and is a broad measure of industry performance.
Comparison of Five Year Cumulative Total Return*
* $100 invested on Dec. 31, 2016 in stock or index — including reinvestment of dividends. Fiscal years ended Dec. 31.
Purchases of Equity Securities by Issuer and Affiliated Purchasers
For the quarter ended Dec. 31, 2021, no equity securities that are registered by Xcel Energy Inc. pursuant to Section 12 of the Securities Exchange Act of 1934 were purchased by or on behalf of us or any of our affiliated purchasers.
| | |
| ITEM 7 — MANAGEMENT’S DISCUSSION AND ANALYSIS OF FINANCIAL CONDITION AND RESULTS OF OPERATIONS |
Non-GAAP Financial Measures
The following discussion includes financial information prepared in accordance with GAAP, as well as certain non-GAAP financial measures such as ongoing ROE, ongoing earnings and ongoing diluted EPS. Generally, a non-GAAP financial measure is a measure of a company’s financial performance, financial position or cash flows that excludes (or includes) amounts that are adjusted from measures calculated and presented in accordance with GAAP.
Xcel Energy’s management uses non-GAAP measures for financial planning and analysis, for reporting of results to the Board of Directors, in determining performance-based compensation and communicating its earnings outlook to analysts and investors. Non-GAAP financial measures are intended to supplement investors’ understanding of our performance and should not be considered alternatives for financial measures presented in accordance with GAAP. These measures are discussed in more detail below and may not be comparable to other companies’ similarly titled non-GAAP financial measures.
Ongoing ROE
Ongoing ROE is calculated by dividing the net income or loss of Xcel Energy or each subsidiary, adjusted for certain nonrecurring items, by each entity’s average stockholder’s equity. We use these non-GAAP financial measures to evaluate and provide details of earnings results.
Earnings Adjusted for Certain Items (Ongoing Earnings and Ongoing Diluted EPS)
GAAP diluted EPS reflects the potential dilution that could occur if securities or other agreements to issue common stock (i.e., common stock equivalents) were settled. The weighted average number of potentially dilutive shares outstanding used to calculate Xcel Energy Inc.’s diluted EPS is calculated using the treasury stock method. Ongoing earnings reflect adjustments to GAAP earnings (net income) for certain items. Ongoing diluted EPS is calculated by dividing the net income or loss of each subsidiary, adjusted for certain items, by the weighted average fully diluted Xcel Energy Inc. common shares outstanding for the period. Ongoing diluted EPS for each subsidiary is calculated by dividing the net income or loss of such subsidiary, adjusted for certain items, by the weighted average fully diluted Xcel Energy Inc. common shares outstanding for the period.
We use these non-GAAP financial measures to evaluate and provide details of Xcel Energy’s core earnings and underlying performance. We believe these measurements are useful to investors to evaluate the actual and projected financial performance and contribution of our subsidiaries. For the years ended Dec. 31, 2021 and 2020, there were no such adjustments to GAAP earnings and therefore GAAP earnings equal ongoing earnings.
Diluted EPS for Xcel Energy at Dec. 31:
| | | | | | | | | | | | | | |
| | 2021 | | 2020 |
| Diluted Earnings (Loss) Per Share | | GAAP and Ongoing Diluted EPS | | GAAP and Ongoing Diluted EPS |
| PSCo | | $ | 1.22 | | | $ | 1.11 | |
| NSP-Minnesota | | 1.12 | | | 1.12 | |
| SPS | | 0.59 | | | 0.56 | |
| NSP-Wisconsin | | 0.20 | | | 0.20 | |
| Earnings from equity method investments — WYCO | | 0.05 | | | 0.05 | |
Regulated utility (a) | | 3.18 | | | 3.04 | |
| Xcel Energy Inc. and Other | | (0.22) | | | (0.25) | |
Total (a) | | $ | 2.96 | | | $ | 2.79 | |
(a) Amounts may not add due to rounding.
Xcel Energy’s management believes that ongoing earnings reflects management’s performance in operating Xcel Energy and provides a meaningful representation of the performance of Xcel Energy’s core business. In addition, Xcel Energy’s management uses ongoing earnings internally for financial planning and analysis, reporting results to the Board of Directors and when communicating its earnings outlook to analysts and investors.
2021 Comparison with 2020
Xcel Energy — GAAP and ongoing earnings increased $38 million$0.17 per share for 2016 compared with 2015.2021. The increase was driven by capital investment recovery and other regulatory outcomes, partially offset by increases in income tax expense was primarily due to higher pretaxdepreciation and lower AFUDC. Fluctuations in electric and natural gas revenues associated with changes in fuel and purchased power and/or natural gas sold and transported generally do not significantly impact earnings (changes in 2016,revenues are offset by the related variation in costs).
PSCo — Earnings increased $0.11 per share for 2021, driven by capital investment recovery and other regulatory outcomes. Higher revenues were partially offset by increased wind PTCs in 2016. The ETR was 34.1 percentdepreciation, O&M expenses and other taxes (other than income taxes).
NSP-Minnesota — Earnings were flat for 20162021 compared with 35.5 percentto 2020, reflecting capital investment recovery offset by additional depreciation and interest charges.
SPS — Earnings increased $0.03 per share for 2015. The lower ETR was primarily due2021, largely related to the wind PTCs in 2016.capital investment recovery, other regulatory outcomes and higher sales and demand, partially offset by decreased AFUDC.
NSP-Wisconsin — Earnings were flat for 2021 compared to 2020.
Xcel Energy Inc. and Other Results
The following tables summarize — Primarily includes financing costs at the net income and diluted EPS contributions of Xcel Energy Inc. and its nonregulated businesses:holding company, offset by earnings from EIP investments.
|
| | | | | | | | | | | | |
| | | Contribution to Xcel Energy’s Earnings |
| (Millions of Dollars) | | 2017 | | 2016 | | 2015 |
| Xcel Energy Inc. financing costs | | $ | (79 | ) | | $ | (71 | ) | | $ | (56 | ) |
Eloigne (a) | | 2 |
| | 1 |
| | — |
|
| Xcel Energy Inc. taxes and other results | | (35 | ) | | (6 | ) | | (3 | ) |
| Total Xcel Energy Inc. and other costs | | $ | (112 | ) | | $ | (76 | ) | | $ | (59 | ) |
|
| | | | | | | | | | | | |
| | | Contribution to Xcel Energy’s GAAP diluted EPS |
| Diluted Earnings (Loss) Per Share | | 2017 | | 2016 | | 2015 |
| Xcel Energy Inc. financing costs | | $ | (0.15 | ) | | $ | (0.14 | ) | | $ | (0.11 | ) |
Eloigne (a) | | — |
| | — |
| | — |
|
| Xcel Energy Inc. taxes and other results | | (0.07 | ) | | (0.01 | ) | | — |
|
| Total Xcel Energy Inc. and other costs | | $ | (0.22 | ) | | $ | (0.15 | ) | | $ | (0.11 | ) |
| |
(a)
| Amounts include gains or losses associated with sales of properties held by Eloigne. |
Xcel Energy Inc.’s results include interest charges, which are incurred at Xcel Energy Inc. and are not directly assigned to individual subsidiaries.
Factors Affecting Results of Operations
Xcel Energy’s utility revenues depend on customer usage, which varies with weather conditions, general business conditions and the cost of energy services. Various regulatory agencies approve the prices for electric and natural gas service within their respective jurisdictions and affect Xcel Energy’s ability to recover its costs from customers. The historical and future trends of Xcel Energy’s operating results have been, and are expected to be, affected by a number of factors, including those listed below.
General Economic Conditions
Economic conditions may have a material impact on Xcel Energy’s operating results. While economic growth has been improving over the past year, management cannot predict whether this trend will be sustained going forward. Other events impact overall economic conditions and managementManagement cannot predict the impact of fluctuating energy prices, pandemics, terrorist activity, war or the threat of war. However, Xcel EnergyWe could experience a material impact to itsour results of operations, future growth or ability to raise capital resulting from a sustained general slowdown in economic growth or a significant increase in interest rates.rates or inflation.
Seasonality
Demand for electric power and natural gas is affected by seasonal differences in the weather. In general, peak sales of electricity occur in the summer months and peak sales of natural gas occur in the winter months. As a result, the overall operating results may fluctuate substantially on a seasonal basis. Additionally, Xcel Energy’s operations have historically generated less revenues and income when weather conditions are milder in the winter and cooler in the summer.
Fuel Supply and Costs
Competition
Xcel Energy Inc.’s operating utilitiesis subject to public policies that promote competition and development of energy markets. Xcel Energy’s industrial and large commercial customers have varying dependence on coal, natural gasthe ability to generate their own electricity. In addition, customers may have the option of substituting other fuels or relocating their facilities to a lower cost region.
Customers have the opportunity to supply their own power with distributed generation including solar generation and uranium. Changes in commodity pricesmost jurisdictions can currently avoid paying for most of the fixed production, transmission and distribution costs incurred to serve them.
Several states have incentives for the development of rooftop solar, community solar gardens and other distributed energy resources. Distributed generating resources are generally recovered through fuel recovery mechanismspotential competitors to Xcel Energy’s electric service business with these incentives and have very little impact on earnings. However, availability of supply, the potential implementation of a carbon tax or emissions-related generation restrictions and unanticipated changes in regulatory recovery mechanisms could impact our operations. See Item 1 for further discussion of fuel supply and costs.
Pension Plan Costs and Assumptions
Xcel Energy has significant net pension and postretirement benefit costs that are measured using actuarial valuations. Inherent in these valuations are key assumptions including discount rates and expected return on plan assets. Xcel Energy evaluates these key assumptions at least annually by analyzing current market conditions, which include changes in interest rates and market returns. Changes in the related net pension and postretirement benefits costs and funding requirements may occur in the future due to changes in assumptions. The payout of a significant percentage of pension plan liabilities in a single year due to high retirements or employees leaving Xcel Energy would trigger settlement accounting and could require Xcel Energy to recognize material incremental pension expense related to unrecognized plan losses in the year these liabilities are paid. For further discussion and a sensitivity analysis on these assumptions, see “Employee Benefits” under Critical Accounting Policies and Estimates.
Tax Reform
On Dec. 22, 2017, the TCJA was signed by the President, enacting significant changes to the IRC. The changes are generally effective for Xcel Energy federal tax returns for years following 2017,subsidies.
The FERC has continued to promote competitive wholesale markets through open access transmission and include a reduction inother means. Xcel Energy’s wholesale customers can purchase their output from generation resources of competing suppliers or non-contracted quantities and use the federal corporate income tax rate from 35 percent to 21 percent. The TCJA recognizes the unique nature of public utilities and contains certain provisions specific to the industry, including continuing certain interest expense deductibility and not allowing 100 percent expensing of capital investments.
2017 Impacts of Tax Reform
Required the revaluation of federal deferred tax assets and liabilities using the new lower tax rate. The majoritytransmission systems of the revaluation relatesutility subsidiaries on a comparable basis to regulated utility activitiesserve their native load.
FERC Order No. 1000 established competition for ownership of certain new electric transmission facilities under Federal regulations. Some states have state laws that allow the incumbent a Right of First Refusal to own these transmission facilities.
FERC Order 2222 requires that RTO and results in the recordingISO markets allow participation of regulatory assets and liabilities, with no estimated income statement impact; and
Xcel Energy recognized approximately $23 millionaggregations of income tax expense associated with the TCJA in the fourth quarter of 2017.distributed energy resources. This amountorder is consideredexpected to be non-recurring and has been excluded from Xcel Energy’s 2017 ongoing earnings.
Future Impacts of Tax Reform
Decreases annual revenue requirementsincentivize distributed energy resource adoption, however implementation is expected to vary by approximately $400 million;
Reduces the tax benefit from holding company interest expense by approximately $20 million in 2018, negatively impacting earnings;
Increases rate base growth for the same level of expected capital expenditures due to lower forecasted deferred tax liabilities; and
Negative impact on cash flow from operations and credit metrics, depending on regulatory actions.
Potential Regulatory Options
The timing of revenue requirements adjustments for both the return of excess deferred taxesRTO/ISO and the lower tax rate are subject to regulatory actions in each of the eight states in which the regulated utilities operate, as well as the FERC. Each regulatory jurisdiction has initiated active proceedings to reflect thenear, medium, and long-term impacts of TCJA. In addition to lower revenue requirements, the TCJA also reduces the pre-tax credit that our customers receive from the federal PTCs; this issue will be reviewed in various resource planning and asset acquisition proceedings. Additionally, Xcel Energy has open rate cases and resource acquisition dockets pending in several states that may be impacted.Order 2222 remain unclear.
Xcel Energy plans to work directly with its regulators to determine the appropriate path forward in each jurisdiction. Potential regulatory options that may be appropriate to consider either as alternatives to or in a combination with flowing back the lower revenue requirements through rates include, but are not limited to:
Accelerating depreciation or amortization for selected assets or asset classes;
Increasing authorized equity ratios at the operating company level;
Modifying capital investments;
Avoiding or deferring future rate cases; and
Funding of certain long-dated obligations.
Xcel Energy believes that regulatory actions that include higher authorized operating company equity ratios and/or accelerated depreciation/amortization can preserve operating company credit metrics that otherwise degrade under the TCJA.
See Notes 6 and 12 to the consolidated financial statements for further discussion.
Regulation
FERC and State Regulation— The FERC and various state and local regulatory commissions regulate Xcel Energy Inc.’s utility subsidiaries TransCo subsidiaries and WGI. Decisions byhave franchise agreements with cities subject to periodic renewal; however, a city could seek alternative means to access electric power or gas, such as municipalization.
While each utility subsidiary faces these regulators can significantly impact Xcel Energy’s results of operations.challenges, Xcel Energy expects to periodically filebelieves their rates and services are competitive with alternatives currently available.
Public Utility Regulation
See Item 7 for rate changes based on changing operating costs, newdiscussion of public utility regulation.
Environmental Regulation
Our facilities are regulated by federal and state agencies that have jurisdiction over air emissions, water quality, wastewater discharges, solid and hazardous wastes or planned investments, fluctuations in energy markets and general economic conditions.
The electric and natural gas rates charged to customers ofsubstances. Certain Xcel Energy Inc.’s utility subsidiaries are approved by the FERC or the regulatory commissions in the states in which they operate. The rates are designed to recover plant investment, operating costsactivities require registrations, permits, licenses, inspections and an allowed return on investment. Rates charged by approvals from these agencies.
Xcel Energy Inc.’s TransCo subsidiarieshas received necessary authorizations for the construction and WGI are approved by the FERC. Xcel Energy Inc.’s utility subsidiaries request changes in rates for utility services through filings with the governing commissions. Changes in operating costs can affect Xcel Energy’s financial results, depending on the timingcontinued operation of filing general rate cases and the implementation of final rates. In addition to changes in operating costs, other factors affecting rate filings are new investments, sales, conservation and DSM efforts, and the cost of capital. In addition, the regulatory commissions authorize the ROE, capital structure and depreciation rates in rate proceedings.
Wholesale Energy Market Regulation— Wholesale energy markets are operated by MISO in the Midwest and SPP in the South Central U.S. to centrally dispatch all regional electricits generation, and apply a regional transmission congestion management system. NSP-Minnesota and NSP-Wisconsin are members of MISO and SPS is a member of SPP. NSP-Minnesota, NSP-Wisconsin and SPS expect to recover RTO energy and other charges through either base rates or various recovery mechanisms. PSCo is evaluating participation in the SPP RTO energy market through the MWTG. See Item 1 and Note 12 to the consolidated financial statements for further discussion.
Capital Expenditure Regulation— Xcel Energy Inc.’s utility subsidiaries make substantial investments in renewable generation, plant additions to build and upgrade power plants, and expand and maintain the energy transmission and distribution systems. Our facilities strive to operate in compliance with applicable environmental standards and related monitoring and reporting requirements.
However, it is not possible to determine what additional facilities or modifications of existing or planned facilities will be required as a result of changes to regulations, interpretations or enforcement policies or what effect future laws or regulations may have. We may be required to incur expenditures in the future for remediation of MGP and other sites.
Xcel Energy Inc.’s utility subsidiariesmust comply with emission levels in Minnesota, Texas and Wisconsin that may require the purchase of emission allowances. The Denver North Front Range Non-attainment Area does not meet the ozone NAAQS. Colorado will continue to recoverconsider further reductions available in the costs associatednon-attainment area as it develops plans to meet ozone standards. Natural gas plants which operate in PSCo’s non-attainment area may be required to improve or add controls, implement further work practices and/or enhanced emissions monitoring as part of future Colorado state plans.
There are significant environmental regulations to encourage use of clean energy technologies and regulate emissions of GHGs. We have undertaken numerous initiatives to meet current requirements and prepare for potential future regulations, reduce GHG emissions and respond to state renewable and energy efficiency goals. Future environmental regulations may result in substantial costs.
In July 2019, the EPA adopted the Affordable Clean Energy rule, which requires states to develop plans by 2022 for GHG reductions from coal-fired power plants. In January 2021, the U.S. Court of Appeals for the D.C. Circuit issued a decision vacating and remanding the Affordable Clean Energy rule. That decision would allow the EPA to proceed with capital investments through rate case filings and through riders (in certain states). These non-fuel rate riders arealternate regulation of coal-fired power plants. However, the Court of Appeals decision is now before the U.S. Supreme Court, where the Court is expected to provide cash flows to enable recoveryrule on the nature and extent of costs incurred on a more timely basis.the EPA’s GHG regulatory authority. If any new rules require additional investment, Xcel Energy has implemented formulabelieves that the cost of these initiatives or replacement generation would be recoverable through rates based on prior state commission practices.
In October 2020, the TCEQ approved an agreement that SPS will convert the Harrington plant from coal to natural gas by Jan. 1, 2025. This conversion is necessary to attain Federal Clean Air Act standards for eachemissions of the utility subsidiaries that will provide annual rate changes as transmission or production investments increaseSO2.
Xcel Energy seeks to address climate change and potential climate change regulation through efforts to reduce its GHG emissions in a manner similarbalanced, cost-effective manner.
Emerging Environmental Regulation
New regulations and legislation are being considered to regulate PFAS in drinking water, water discharges, commercial products, wastes, and other areas. PFAS are man-made chemicals found in many consumer products that can persist and accumulate in the retail rate riders for wholesale electric transmissionenvironment. These chemicals have received heightened attention from environmental regulators. Increased regulation of PFAS and production services. Electric transmission investments owned byother emerging contaminants at the TransCos are recoverable through FERC approved transmission formula rates for XETDfederal, state, and XEST. NSP-Minnesotalocal level could have a potential adverse effect on our operations but at this time, it is uncertain what impact, if any, there will be on our operations, financial condition or cash flows. Xcel Energy will continue to monitor these regulatory developments and NSP-Wisconsin have no cost-based wholesale production customers and therefore have not implemented a production formula rate.
their potential impact on its operations. Environmental Matters
Costs
Environmental costs include accrualsamounts for nuclear plant decommissioning and payments for storage of spent nuclear fuel, disposal of hazardous materials and waste, remediation of contaminated sites, monitoring of discharges to the environment and compliance with laws and permits with respect to emissions. A trend of greater environmental awareness and increasingly stringent regulation may continue to cause higher operating expenses and capital expenditures for environmental compliance.
Costs charged to operating expenses for nuclear decommissioning, and spent nuclear fuel disposal, expenses, environmental monitoring and remediation and disposal of hazardous materials and waste were approximately:
•$303365 million in 2017;2021.
•$304400 million in 2016; and2020.
•$292345 million in 2015.2019.
Xcel Energy estimates an averageAverage annual expense of approximately $349$425 million from 2018 through 2022 – 2026 is estimated for similar costs. The precise timing and amount of environmental costs, including those for site remediation and disposal of hazardous materials, are unknown. Additionally, the extent to which environmental costs will be included in and recovered through rates may fluctuate.
Capital expenditures for environmental improvements at regulated facilities were approximately:
•$6160 million in 2017;2021.
•$9330 million in 2016; and2020.
•$18430 million in 2015. 2019.
Other
Our operations are subject to workplace safety standards under the Federal Occupational Safety and Health Act of 1970 (“OSHA”) and comparable state laws that regulate the protection of worker health and safety. In addition, the Company is subject to other government regulations impacting such matters as labor, competition, data privacy, etc. Based on information to date and because our policies and business practices are designed to comply with all applicable laws, we do not believe the effects of compliance on our operations, financial condition or cash flows are material.
| | |
| Capital Spending and Financing |
See Item 7 —for discussion of capital expenditures and funding sources.
| | | | | | | | | | | | | | | | | | | | |
Executive Officers (a) |
| Name | | Age(b) | | Current and Recent Positions | | Time in Position |
| | | | | | |
| | | | | | |
| | | | | | |
| Robert C. Frenzel | | 51 | | Chairman of the Board of Directors, Xcel Energy Inc. | | December 2021 — Present |
| | | | President and Chief Executive Officer and Director, Xcel Energy Inc. | | August 2021 — Present |
| | | | Chief Executive Officer, NSP-Minnesota, NSP-Wisconsin, PSCo, and SPS | | August 2021 — Present |
| | | | President and Chief Operating Officer, Xcel Energy Inc. | | March 2020 — August 2021 |
| | | | Executive Vice President, Chief Financial Officer, Xcel Energy Inc. | | May 2016 — March 2020 |
| | | | Senior Vice President and Chief Financial Officer, Luminant, a subsidiary of Energy Future Holdings Corp.(c) | | February 2012 — April 2016 |
Brett C. Carter (d) | | 55 | | Executive Vice President and Chief Customer and Innovation Officer, Xcel Energy Inc. | | May 2018 — Present |
| | | | Senior Vice President and Shared Services Executive, Bank of America, an institutional investment bank and financial services company | | October 2015 — May 2018 |
| Patricia Correa | | 48 | | Senior Vice President, Chief Human Resources Officer, Xcel Energy Inc. | | February 2022 — Present |
| | | | Senior Vice President, Human Resources, Eaton Corporation, a power management company | | July 2019 — January 2022 |
| | | | Vice President, Human Resources, Eaton Corporation | | March 2016 — July 2019 |
| | | | Senior Director, Talent & Organization Development, Kellogg Company, a food manufacturing company | | July 2015 — March 2016 |
| Timothy O’Connor | | 62 | | Executive Vice President, Chief Operations Officer, Xcel Energy Inc. | | August 2021 — Present |
| | | | Executive Vice President, Chief Generation Officer, Xcel Energy Inc. | | March 2020 — August 2021 |
| | | | Senior Vice President, Chief Nuclear Officer, Xcel Energy Services Inc | | February 2013 — March 2020 |
| Frank Prager | | 59 | | Senior Vice President, Strategy, Planning and External Affairs, Xcel Energy Inc. | | March 2020 — Present |
| | | | Vice President, Policy and Federal Affairs, Xcel Energy Services Inc. | | January 2015 — March 2020 |
| Amanda Rome | | 41 | | Executive Vice President, General Counsel, Xcel Energy Inc. | | June 2020 — Present |
| | | | Vice President and Deputy General Counsel, Xcel Energy Services Inc. | | October 2019 — June 2020 |
| | | | Managing Attorney, Xcel Energy Services Inc. | | July 2018 — October 2019 |
| | | | Rotational Position, Xcel Energy Services Inc. | | January 2018 — July 2018 |
| | | | Lead Assistant General Counsel, Xcel Energy Services Inc. | | July 2015 — January 2018 |
Jeffrey S. Savage (e) | | 50 | | Senior Vice President, Controller, Xcel Energy Inc. | | January 2015 — Present |
| Brian J. Van Abel | | 40 | | Executive Vice President, Chief Financial Officer, Xcel Energy Inc. | | March 2020 — Present |
| | | | Senior Vice President, Finance and Corporate Development, Xcel Energy Services Inc. | | September 2018 — March 2020 |
| | | | Vice President, Treasurer, Xcel Energy Services Inc. | | July 2015 — September 2018 |
(a)No family relationships exist between any of the executive officers or directors.
(b)Ages as of Feb. 23, 2022.
(c)In April 2014, Energy Future Holdings Corp., the majority of its subsidiaries, including Texas Competitive Energy Holdings the parent company of Luminant, filed a voluntary bankruptcy petition under Chapter 11 of the United States Bankruptcy Code. Texas Competitive Energy Holdings emerged from Chapter 11 in October 2016.
(d)Effective March 1, 2022, Mr. Carter will assume the role of Executive Vice President, Group President, Utilities, and Chief Customer Officer.
(e)Effective March 1, 2022, Mr. Savage will assume the role of Chief Audit and Financial Services Officer and will no longer be serving as an executive officer.
Xcel Energy is subject to a variety of risks, many of which are beyond our control. Risks that may adversely affect the business, financial condition, results of operations or cash flows are described below. Although the risks are organized by heading, and each risk is described separately, many of the risks are interrelated. These risks should be carefully considered together with the other information set forth in this report and future reports that we file with the SEC. You should not interpret the disclosure of any risk factor to imply that the risk has not already materialized.
While we believe we have identified and discussed below the key risk factors affecting our business, there may be additional risks and uncertainties that are not presently known or that are not currently believed to be significant that may adversely affect our business, financial condition, results of operations or cash flows in the future.
Oversight of Risk and Related Processes
The Board of Directors is responsible for the oversight of material risk and maintaining an effective risk monitoring process. Management and the Board of Directors’ committees have responsibility for overseeing the identification and mitigation of key risks and reporting its assessments and activities to the full Board of Directors.
Xcel Energy maintains a robust compliance program and promotes a culture of compliance beginning with the tone at the top. The risk mitigation process includes adherence to our code of conduct and compliance policies, operation of formal risk management structures and overall business management. Xcel Energy further mitigates inherent risks through formal risk committees and corporate functions such as internal audit, and internal controls over financial reporting and legal.
Management identifies and analyzes risks to determine materiality and other attributes such as timing, probability and controllability. Identification and risk analysis occurs formally through risk assessment conducted by senior management, the financial disclosure process, hazard risk procedures, internal audit and compliance with financial and operational controls.
Management also identifies and analyzes risk through the business planning process, development of goals and establishment of key performance indicators, including identification of barriers to implementing Xcel Energy’s strategy. The business planning process also identifies likelihood and mitigating factors to prevent the assumption of inappropriate risk to meet goals.
Management communicates regularly with the Board of Directors and key stakeholders regarding risk. Senior management presents and communicates a periodic risk assessment to the Board of Directors, providing information on the risks that management believes are material, including financial impact, timing, likelihood and mitigating factors. The Board of Directors regularly reviews management’s key risk assessments, which includes areas of existing and future macroeconomic, financial, operational, policy, environmental and security risks.
The oversight, management and mitigation of risk is an integral and continuous part of the Board of Directors’ governance of Xcel Energy. The Board of Directors assigns oversight of critical risks to each of its four committees to ensure these risks are well understood and given appropriate focus.
The Audit Committee is responsible for reviewing the adequacy of the committee’s risk oversight and affirming appropriate aggregate oversight occurs. Committees regularly report on their oversight activities and certain risk issues may be brought to the full Board of Directors for consideration when deemed appropriate.
New risks are considered and assigned as appropriate during the annual Board of Directors and committee evaluation process, resulting in updates to the committee charters and annual work plans. Additionally, the Board of Directors conducts an annual strategy session where Xcel Energy’s future plans and initiatives are reviewed.
Operational Risks
Our natural gas and electric generation/transmission and distribution operations involve numerous risks that may result in accidents and other operating risks and costs.
Our natural gas transmission and distribution activities include inherent hazards and operating risks, such as leaks, explosions, outages and mechanical problems. Our electric generation, transmission and distribution activities include inherent hazards and operating risks such as contact, fire and outages.
These risks could result in loss of life, significant property damage, environmental pollution, impairment of our operations and substantial financial losses to employees, third-party contractors, customers or the public. We maintain insurance against most, but not all, of these risks and losses.
The occurrence of these events, if not fully covered by insurance, could have a material effect on our financial condition, results of operations and cash flows as well as potential loss of reputation.
Other uncertainties and risks inherent in operating and maintaining Xcel Energy's facilities include, but are not limited to:
•Risks associated with facility start-up operations, such as whether the facility will achieve projected operating performance on schedule and otherwise as planned.
•Failures in the availability, acquisition or transportation of fuel or other necessary supplies.
•The impact of unusual or adverse weather conditions and natural disasters, including, but not limited to, tornadoes, icing events, floods and droughts.
•Performance below expected or contracted levels of output or efficiency (e.g., performance guarantees).
•Availability of replacement equipment.
•Availability of adequate water resources and ability to satisfy water intake and discharge requirements.
•Inability to identify, manage properly or mitigate equipment defects.
•Use of new or unproven technology.
•Risks associated with dependence on a specific type of fuel or fuel source, such as commodity price risk, availability of adequate fuel supply and transportation and lack of available alternative fuel sources.
•Increased competition due to, among other factors, new facilities, excess supply, shifting demand and regulatory changes.
Additionally, compliance with existing and potential new regulations related to the operation and maintenance of our natural gas infrastructure could result in significant costs. The PHMSA is responsible for administering the DOT’s national regulatory program to assure the safe transportation of natural gas, petroleum and other hazardous materials by pipelines. The PHMSA continues to develop regulations and other approaches to risk management to assure safety in design, construction, testing, operation, maintenance and emergency response of natural gas pipeline infrastructure. We have programs in place to comply with these regulations and systematically monitor and renew infrastructure over time, however, a significant incident or material finding of non-compliance could result in penalties and higher costs of operations.
Our natural gas and electric transmission and distribution operations are dependent upon complex information technology systems and network infrastructure, the failure of which could disrupt our normal business operations, which could have a material adverse effect on our ability to process transactions and provide services.
Our utility operations are subject to long-term planning and project risks.
Most electric utility investments are planned to be used for decades. Transmission and generation investments typically have long lead times and are planned well in advance of in-service dates and typically subject to long-term resource plans. These plans are based on numerous assumptions such as: sales growth, customer usage, commodity prices, economic activity, costs, regulatory mechanisms, customer behavior, available technology and public policy. Xcel Energy’s long-term resource plan is dependent on our ability to obtain required approvals, develop necessary technical expertise, allocate and coordinate sufficient resources and adhere to budgets and timelines.
In addition, the long-term nature of both our planning and our asset lives are subject to risk. The electric utility sector is undergoing significant change (e.g., increases in energy efficiency, wider adoption of distributed generation and shifts away from fossil fuel generation to renewable generation). Customer adoption of these technologies and increased energy efficiency could result in excess transmission and generation resources, downward pressure on sales growth, and potentially stranded costs if we are not able to fully recover costs and investments.
The magnitude and timing of resource additions and changes in customer demand may not coincide with evolving customer preference for generation resources and end-uses, which introduces further uncertainty into long-term planning. Efforts to electrify the transportation and building sectors to reduce GHG emissions may result in higher electric demand and lower natural gas demand over time. Higher electric demand may require us to adopt new technologies and make significant transmission and distribution investments including advanced grid infrastructure, which increases exposure to overall grid instability and technology obsolescence. Evolving stakeholder preference for lower emissions from generation sources and end-uses, like heating, may impact our resource mix and put pressure on our ability to recover capital investments in natural gas generation and delivery. Multiple states may not agree as to the appropriate resource mix, which may lead to costs to comply with one jurisdiction that are not recoverable across all jurisdictions served by the same assets.
We are subject to longer-term availability of inputs such as coal, natural gas, uranium and water to cool our facilities. Lack of availability of these resources could jeopardize long-term operations of our facilities or make them uneconomic to operate.
Our utilities are highly dependent on suppliers to deliver components in accordance with short and long-term project schedules.
Our products contain components that are globally sourced from suppliers who, in turn, source components from their suppliers. A shortage of key components in which an alternative supplier is not identified could significantly impact project plans. Such impacts could include timing of projects, including potential for project cancellation. Failure to adhere to project budgets and timelines could adversely impact our results of operations, financial condition or cash flows.
We are subject to commodity risks and other risks associated with energy markets and energy production.
In the event fuel costs increase, customer demand could decline and bad debt expense may rise, which may have a material impact on our results of operations. Despite existing fuel recovery mechanisms in most of our states, higher fuel costs could significantly impact our results of operations if costs are not recovered. Delays in the timing of the collection of fuel cost recoveries could impact our cash flows and liquidity.
A significant disruption in supply could cause us to seek alternative supply services at potentially higher costs and supply shortages may not be fully resolved, which could cause disruptions in our ability to provide services to our customers. Failure to provide service due to disruptions may also result in fines, penalties or cost disallowances through the regulatory process. Also, significantly higher energy or fuel costs relative to sales commitments could negatively impact our cash flows and results of operations.
We also engage in wholesale sales and purchases of electric capacity, energy and energy-related products as well as natural gas. In many markets, emission allowances and/or RECs are also needed to comply with various statutes and commission rulings. As a result, we are subject to market supply and commodity price risk.
Commodity price changes can affect the value of our commodity trading derivatives. We mark certain derivatives to estimated fair market value on a daily basis. Settlements can vary significantly from estimated fair values recorded and significant changes from the assumptions underlying our fair value estimates could cause earnings variability. The management of risks associated with hedging and trading is based, in part, on programs and procedures which utilize historical prices and trends.
Due to the inherent uncertainty involved in price movements and potential deviation from historical pricing, Xcel Energy is unable to fully assure that its risk management programs and procedures would be effective to protect against all significant adverse market deviations.
In addition, Xcel Energy cannot fully assure that its controls will be effective against all potential risks, including, without limitation, employee misconduct. If such programs and procedures are not effective, Xcel Energy’s results of operations, financial condition or cash flows could be materially impacted.
Failure to attract and retain a qualified workforce could have an adverse effect on operations.
In 2021, the competition for talent has become increasingly intense as a result of the ongoing “great resignation”, and we may experience increased employee turnover due to this tightening labor market. In addition, specialized knowledge is required of our technical employees for construction and operation of transmission, generation and distribution assets, which may pose additional difficulty for us as we work to recruit, retain and motivate employees in this climate. Failure to hire and adequately train replacement employees, including the transfer of significant internal historical knowledge and expertise to new employees or future availability and cost of contract labor may adversely affect the ability to manage and operate our business. Inability to attract and retain these employees could adversely impact our results of operations, financial condition or cash flows.
Our operations use third-party contractors in addition to employees to perform periodic and ongoing work.
We rely on third-party contractors to perform operations, maintenance and construction work. Our contractual arrangements with these contractors typically include performance standards, progress payments, insurance requirements and security for performance. Poor vendor performance or contractor unavailability could impact ongoing operations, restoration operations, our reputation and could introduce financial risk or risks of fines.
Our employees, directors, third-party contractors, or suppliers may violate or be perceived to violate our Codes of Conduct, which could have an adverse effect on our reputation.
We are exposed to risk of employee or third-party contractor fraud or other misconduct. All employees and members of the Board of Directors are subject to comply with our Code of Conduct and are required to participate in annual training. Additionally, suppliers are subject to comply with our supplier Code of Conduct.
Xcel Energy does not tolerate discrimination, violations of our Code of Conduct or other unacceptable behaviors. However, it is not always possible to identify and deter misconduct by employees and other third-parties, which may result in governmental investigations, other actions or lawsuits. If such actions are taken against us we may suffer loss of reputation and such actions could have a material effect on our financial condition, results of operations and cash flows.
Our subsidiary, NSP-Minnesota, is subject to the risks of nuclear generation.
NSP-Minnesota has two nuclear generation plants, PI and Monticello. Risks of nuclear generation include:
•Hazards associated with the use of radioactive material in energy production, including management, handling, storage and disposal.
•Limitations on insurance available to cover losses that may arise in connection with nuclear operations, as well as obligations to contribute to an insurance pool in the event of damages at a covered U.S. reactor.
•Technological and financial uncertainties related to the costs of decommissioning nuclear plants may cause our funding obligations to change.
The NRC has authority to impose licensing and safety-related requirements for the operation of nuclear generation facilities, including the ability to impose fines and/or shut down a unit until compliance is achieved. NRC safety requirements could necessitate substantial capital expenditures or an increase in operating expenses. In addition, the INPO reviews NSP-Minnesota’s nuclear operations. Compliance with the INPO’s recommendations could result in substantial capital expenditures or a substantial increase in operating expenses.
If a nuclear incident did occur, it could have a material impact on our results of operations, financial condition or cash flows. Furthermore, non-compliance or the occurrence of a serious incident at other nuclear facilities could result in increased industry regulation, which may increase NSP-Minnesota’s compliance costs.
Financial Risks
Our profitability depends on the ability of our utility subsidiaries to recover their costs and changes in regulation may impair the ability of our utility subsidiaries to recover costs from their customers.
We are subject to comprehensive regulation by federal and state utility regulatory agencies, including siting and construction of facilities, customer service and the rates that we can charge customers.
The profitability of our utility operations is dependent on our ability to recover the costs of providing energy and utility services and earning a return on capital investment. Our rates are generally regulated and are based on an analysis of the utility’s costs incurred in a test year. The utility subsidiaries are subject to both future and historical test years depending upon the regulatory jurisdiction. Thus, the rates a utility is allowed to charge may or may not match its costs at any given time. Rate regulation is premised on providing an opportunity to earn a reasonable rate of return on invested capital.
There can also be no assurance that our regulatory commissions will judge all the costs of our utility subsidiaries to be prudent, which could result in disallowances, or that the regulatory process will always result in rates that will produce full recovery.
Overall, management believes prudently incurred costs are recoverable given the existing regulatory framework. However, there may be changes in the regulatory environment that could impair the ability of our utility subsidiaries to recover costs historically collected from customers, or these subsidiaries could exceed caps on capital costs required by commissions and result in less than full recovery.
Changes in the long-term cost-effectiveness or to the operating conditions of our assets may result in early retirements of utility facilities. While regulation typically provides cost recovery relief for these types of changes, there is no assurance that regulators would allow full recovery of all remaining costs.
Higher than expected inflation or tariffs may increase costs of construction and operations. Also, rising fuel costs could increase the risk that our utility subsidiaries will not be able to fully recover their fuel costs from their customers.
Adverse regulatory rulings or the imposition of additional regulations could have an adverse impact on our results of operations and materially affect our ability to meet our financial obligations, including debt payments and the payment of dividends on common stock.
Any reductions in our credit ratings could increase our financing costs and the cost of maintaining certain contractual relationships.
We cannot be assured that our current credit ratings or our subsidiaries’ ratings will remain in effect, or that a rating will not be lowered or withdrawn by a rating agency. Significant events including disallowance of costs, use of historic test years, elimination of riders or interim rates, increasing depreciation lives, lower returns on equity, changes to equity ratios and impacts of tax policy may impact our cash flows and credit metrics, potentially resulting in a change in our credit ratings. In addition, our credit ratings may change as a result of the differing methodologies or change in the methodologies used by the various rating agencies.
Any credit ratings downgrade could lead to higher borrowing costs or lower proceeds from equity issuances. It could also impact our ability to access capital markets. Also, our utility subsidiaries may enter into contracts that require posting of collateral or settlement if credit ratings fall below investment grade.
We are subject to capital market and interest rate risks.
Utility operations require significant capital investment. As a result, we frequently need to access capital markets. Any disruption in capital markets could have a material impact on our ability to fund our operations. Capital Requirementsmarket disruption and financial market distress could prevent us from issuing short-term commercial paper, issuing new securities or cause us to issue securities with unfavorable terms and conditions, such as higher interest rates or lower proceeds from equity issuances. Higher interest rates on short-term borrowings with variable interest rates could also have an adverse effect on our operating results.
The performance of capital markets impacts the value of assets held in trusts to satisfy future obligations to decommission NSP-Minnesota’s nuclear plants and satisfy our defined benefit pension and postretirement benefit plan obligations. These assets are subject to market fluctuations and yield uncertain returns, which may fall below expected returns. A decline in the market value of these assets may increase funding requirements. Additionally, the fair value of the debt securities held in the nuclear decommissioning and/or pension trusts may be impacted by changes in interest rates.
We are subject to credit risks.
Credit risk includes the risk that our customers will not pay their bills, which may lead to a reduction in liquidity and an increase in bad debt expense. Credit risk is comprised of numerous factors including the price of products and services provided, the economy and unemployment rates.
Credit risk also includes the risk that counterparties that owe us money or product will become insolvent and may breach their obligations. Should the counterparties fail to perform, we may be forced to enter into alternative arrangements. In that event, our financial results could be adversely affected and incur losses.
Xcel Energy may have direct credit exposure in our short-term wholesale and commodity trading activity to financial institutions trading for further discussion.their own accounts or issuing collateral support on behalf of other counterparties. We may also have some indirect credit exposure due to participation in organized markets, (e.g., California Independent System Operator, SPP, PJM Interconnection, LLC, MISO and Electric Reliability Council of Texas), in which any credit losses are socialized to all market participants.
We have additional indirect credit exposure to financial institutions from letters of credit provided as security by power suppliers under various purchased power contracts. If any of the credit ratings of the letter of credit issuers were to drop below investment grade, the supplier would need to replace that security with an acceptable substitute. If the security were not replaced, the party could be in default under the contract.
Increasing costs of our defined benefit retirement plans and employee benefits may adversely affect our results of operations, financial condition or cash flows.
We have defined benefit pension and postretirement plans that cover most of our employees. Assumptions related to future costs, return on investments, interest rates and other actuarial assumptions have a significant impact on our funding requirements of these plans. Estimates and assumptions may change. In addition, the Pension Protection Act sets the minimum funding requirements for defined benefit pension plans. Therefore, our funding requirements and contributions may change in the future. Also, the payout of a significant percentage of pension plan liabilities in a single year, due to high numbers of retirements or employees leaving, would trigger settlement accounting and could require Xcel Energy to recognize incremental pension expense related to unrecognized plan losses in the year liabilities are paid. Changes in industry standards utilized in key assumptions (e.g., mortality tables) could have a significant impact on future obligations and benefit costs.
Increasing costs associated with health care plans may adversely affect our results of operations.
Increasing levels of large individual health care claims and overall health care claims could have an adverse impact on our results of operations, financial condition or cash flows. Health care legislation could also significantly impact our benefit programs and costs.
We must rely on cash from our subsidiaries to make dividend payments.
Investments in our subsidiaries are our primary assets. Substantially all of our operations are conducted by our subsidiaries. Consequently, our operating cash flow and ability to service our debt and pay dividends depends upon the operating cash flows of our subsidiaries and their payment of dividends.
Our subsidiaries are separate legal entities that have no obligation to pay any amounts due pursuant to our obligations or to make any funds available for dividends on our common stock. In addition, each subsidiary’s ability to pay dividends depends on statutory and/or contractual restrictions which may include requirements to maintain minimum levels of equity ratios, working capital or assets.
If the utility subsidiaries were to cease making dividend payments, our ability to pay dividends on our common stock or otherwise meet our financial obligations could be adversely affected. Our utility subsidiaries are regulated by state utility commissions, which possess broad powers to ensure that the needs of the utility customers are met. We may be negatively impacted by the actions of state commissions that limit the payment of dividends by our utility subsidiaries.
Federal tax law may significantly impact our business.
Our utility subsidiaries collect estimated federal, state and local tax payments through their regulated rates. Changes to federal tax law may benefit or adversely affect our earnings and customer costs. Tax depreciable lives and the value/availability of various tax credits or the timeliness of their utilization may impact the economics or selection of resources. If tax rates are increased, there could be timing delays before regulated rates provide for recovery of such tax increases in revenues. In addition, certain IRS tax policies, such as tax normalization, may impact our ability to economically deliver certain types of resources relative to market prices.
Macroeconomic Risks
Economic conditions impact our business.
Xcel Energy’s operations are affected by local, national and worldwide economic conditions, which correlates to customers/sales growth (decline). Economic conditions may be impacted by insufficient financial sector liquidity leading to potential increased unemployment, which may impact customers’ ability to pay their bills, which could lead to additional bad debt expense.
Our utility subsidiaries face competitive factors, which could have an adverse impact on our financial condition, results of operations and cash flows. Further, worldwide economic activity impacts the demand for basic commodities necessary for utility infrastructure, which may inhibit our ability to acquire sufficient supplies. We operate in a capital-intensive industry and federal trade policy could significantly impact the cost of materials we use. There may be delays before these additional material costs can be recovered in rates.
We face risks related to health epidemics and other outbreaks, which may have a material effect on our financial condition, results of operations and cash flows.
The global outbreak of COVID-19 continues to impact countries, communities, supply chains and markets. A high degree of uncertainty continues to exist regarding the pandemic; the duration and magnitude of business restrictions (domestically and globally); the potential shortages of employees and third-party contractors due to quarantine policies, vaccination requirements or government restrictions; re-shutdowns, if any, and the level and pace of economic recovery.
Xcel Energy has experienced and may continue to experience sales volatility and shifts between residential and C&I sales as a result of COVID-19. Xcel Energy has a decoupling mechanism in Colorado for residential and non-demand small C&I electric customer classes. In Minnesota, Xcel Energy has historically had a sales true-up mechanism for all electric customer classes which has ended in 2021. We are requesting implementation of a new sales true-up mechanism for 2022 - 2024. These mechanisms mitigate the impact of changes to sales levels as compared to a baseline.
Although the financial impact of the pandemic on our financial results has largely been mitigated, we cannot ultimately predict whether it will have a material impact on our future liquidity, financial condition or results of operations. Nor can we predict the impact of the virus on the health of our employees, our supply chain or our ability to recover higher costs associated with managing through the pandemic. The impact of COVID-19 may exacerbate other risks discussed herein, which could have a material effect on us. The situation is evolving and additional impacts may arise.
Operations could be impacted by war, terrorism or other events.
Our generation plants, fuel storage facilities, transmission and distribution facilities and information and control systems may be targets of terrorist activities. Any disruption could impact operations or result in a decrease in revenues and additional costs to repair and insure our assets. These disruptions could have a material impact on our financial condition, results of operations or cash flows.
The potential for terrorism has subjected our operations to increased risks and could have a material effect on our business. We have already incurred increased costs for security and capital expenditures in response to these risks. The insurance industry has also been affected by these events and the availability of insurance may decrease. In addition, insurance may have higher deductibles, higher premiums and more restrictive policy terms.
A disruption of the regional electric transmission grid, interstate natural gas pipeline infrastructure or other fuel sources, could negatively impact our business, brand and reputation. Because our facilities are part of an interconnected system, we face the risk of possible loss of business due to a disruption caused by the actions of a neighboring utility.
We also face the risks of possible loss of business due to significant events such as severe storms, severe temperature extremes, wildfires (particularly in Colorado), widespread pandemic, generator or transmission facility outage, pipeline rupture, railroad disruption, operator error, sudden and significant increase or decrease in wind generation or a workforce disruption.
In addition, major catastrophic events throughout the world may disrupt our business. Xcel Energy participates in a global supply chain, which includes materials and components that are globally sourced. A prolonged disruption could result in the delay of equipment and materials that may impact our ability to reliably serve our customers.
A major disruption could result in a significant decrease in revenues and additional costs to repair assets, which could have a material impact on our results of operations, financial condition or cash flows.
Xcel Energy participates in GridEx, which is the largest grid security exercise in North America. These efforts, led by the NERC, test and further develop the coordination, threat sharing and interaction between utilities and various government agencies relative to potential cyber and physical threats against the nation’s electric grid.
A cyber incident or security breach could have a material effect on our business.
We operate in an industry that requires the continued operation of sophisticated information technology, control systems and network infrastructure. In addition, we use our systems and infrastructure to create, collect, use, disclose, store, dispose of and otherwise process sensitive information, including company data, customer energy usage data, and personal information regarding customers, employees and their dependents, contractors, shareholders and other individuals.
Xcel Energy’s generation, transmission, distribution and fuel storage facilities, information technology systems and other infrastructure or physical assets as well as information processed in our systems (e.g., information regarding our customers, employees, operations, infrastructure and assets) could be affected by cyber security incidents, including those caused by human error.
The utility industry has been the target of several attacks on operational systems and has seen an increased volume and sophistication of cyber security incidents from international activist organizations, Nation States and individuals. During the normal course of business, we have experienced and expect to continue to experience attempts to compromise our information technology and control systems, network infrastructure and other assets. To date, no cybersecurity incident or attack has had a material impact on our business or results of operation.
Cyber security incidents could harm our businesses by limiting our generating, transmitting and distributing capabilities, delaying our development and construction of new facilities or capital improvement projects to existing facilities, disrupting our customer operations or causing the release of customer information, all of which would likely receive state and federal regulatory scrutiny and could expose us to liability.
Xcel Energy’s generation, transmission systems and natural gas pipelines are part of an interconnected system. Therefore, a disruption caused by the impact of a cyber security incident of the regional electric transmission grid, natural gas pipeline infrastructure or other fuel sources of our third-party service providers’ operations, could also negatively impact our business.
Our supply chain for procurement of digital equipment and services may expose software or hardware to these risks and could result in a breach or significant costs of remediation. We are unable to quantify the potential impact of cyber security threats or subsequent related actions. Cyber security incidents and regulatory action could result in a material decrease in revenues and may causesignificant additional costs (e.g., penalties, third-party claims, repairs, insurance or compliance) and potentially disrupt our supply and markets for natural gas, oil and other fuels.
We maintain security measures to protect our information technology and control systems, network infrastructure and other assets. However, these assets and the information they process may be vulnerable to cyber security incidents, including asset failure or unauthorized access to assets or information.
A failure or breach of our technology systems or those of our third-party service providers could disrupt critical business functions and may negatively impact our business, our brand, and our reputation. The cyber security threat is dynamic and evolves continually, and our efforts to prioritize network protection may not be effective given the constant changes to threat vulnerability.
Our operating results may fluctuate on a seasonal and quarterly basis and can be adversely affected by milder weather.
Our electric and natural gas utility businesses are seasonal and weather patterns can have a material impact on our operating performance. Demand for electricity is often greater in the summer and winter months associated with cooling and heating. Because natural gas is heavily used for residential and commercial heating, the demand depends heavily upon weather patterns. A significant amount of natural gas revenues are recognized in the first and fourth quarters related to the heating season. Accordingly, our operations have historically generated less revenues and income when weather conditions are milder in the winter and cooler in the summer. Unusually mild winters and summers could have an adverse effect on our financial condition, results of operations or cash flows.
Public Policy Risks
We may be subject to legislative and regulatory responses to climate change, with which compliance could be difficult and costly.
Legislative and regulatory responses related to climate change may create financial risk as our facilities may be subject to additional regulation at either the state or federal level in the future. International agreements could additionally lead to future federal or state regulations.
In 2015, the United Nations Framework Convention on Climate Change reached consensus among 190 nations on an agreement (the Paris Agreement) that establishes a framework for GHG mitigation actions by all countries, with a goal of holding the increase in global average temperature to below 2º Celsius above pre-industrial levels and an aspiration to limit the increase to 1.5º Celsius.
In April 2021, ahead of the United Nations Climate Change Conference in Glasgow, the Biden Administration committed the U.S. to a Nationally Determined Contribution of 50-52% net GHG emissions reduction economy-wide from 2005 levels. This commitment and other agreements made in Glasgow could result in future additional GHG reductions in the United States. In addition, the Biden Administration has announced plans to implement new climate change programs, including potential regulation of GHG emissions targeting the utility industry.
Many states and localities continue to pursue their own climate policies. The steps Xcel Energy has taken to date to reduce GHG emissions, including energy efficiency measures, adding renewable generation or retiring or converting coal plants to natural gas, occurred under state-endorsed resource plans, renewable energy standards and other state policies.
We may be subject to climate change lawsuits. An adverse outcome could require substantial capital expenditures and possibly require payment of substantial penalties or damages. Defense costs associated with such litigation can also be significant and could affect results of operations, financial condition or cash flows if such costs are not recovered through regulated rates.
If our regulators do not allow us to recover all or a part of the cost of capital investment or the O&M costs incurred to comply with the mandates, it could have a material effect on our results of operations, financial condition or cash flows.
Increased risks of regulatory penalties could negatively impact our business.
The Energy Act increased civil penalty authority for violation of FERC statutes, rules and orders. The FERC can impose penalties of up to $1.3 million per violation per day, particularly as it relates to energy trading activities for both electricity and natural gas. In addition, NERC electric reliability standards and critical infrastructure protection requirements are mandatory and subject to potential financial penalties. Also, the PHMSA, Occupational Safety and Health Administration and other federal agencies have the authority to assess penalties.
In the event of serious incidents, these agencies may pursue penalties. In addition, certain states have the authority to impose substantial penalties. If a serious reliability, cyber or safety incident did occur, it could have a material effect on our results of operations, financial condition or cash flows.
The continued use of natural gas for both power generation and gas distribution have increasingly become a public policy advocacy target. These efforts may result in a limitation of natural gas as an energy source for both power generation and heating, which could impact our ability to reliably and affordably serve our customers.
In recent years, there have been various local and state agency proposals within and outside our service territories that would attempt to restrict the use and availability of natural gas. If such policies were to prevail, we may be forced to make new resource investment decisions which could potentially result in stranded costs if we are not able to fully recover costs and investments and impact the overall reliability of our service.
Environmental Risks
We are subject to environmental laws and regulations, relatedwith which compliance could be difficult and costly.
We are subject to environmental laws and regulations that affect many aspects of our operations, including air emissions, water quality, wastewater discharges and waste management from various sources. Suchthe generation, transport and disposal of solid wastes and hazardous substances. Laws and regulations require us to obtain permits, licenses, and approvals and to comply with a variety of environmental requirements.
Environmental laws and regulations impose monitoring and reporting requirements and maycan also require Xcel Energyus to obtain pre-approval forrestrict or limit the constructionoutput of facilities or modificationthe use of projects that increase air emissions, water discharges or land disposal of wastes, obtain and comply with permits that contain emission, discharge and operational limitations, orcertain fuels, shift generation to lower-emitting facilities, install or operate pollution control equipment, at facilities. Xcel Energy will likelyclean up spills and other contamination and correct environmental hazards. Failure to meet requirements of environmental mandates may result in fines or penalties. We may be required to incurpay all or a portion of the cost to remediate sites where our past activities, or the activities of other parties, caused environmental contamination.
Changes in environmental policies and regulations or regulatory decisions may result in early retirements of our generation facilities. While regulation typically provides relief for these types of changes, there is no assurance that regulators would allow full recovery of all remaining costs.
We are subject to mandates to provide customers with clean energy, renewable energy and energy conservation offerings. It could have a material effect on our results of operations, financial condition or cash flows if our regulators do not allow us to recover the cost of capital expenditures in the futureinvestment or O&M costs incurred to comply with these requirements for remediation of MGPthe requirements.
In addition, existing environmental laws or regulations may be revised and new laws or regulations may be adopted. We may also incur additional unanticipated obligations or liabilities under existing environmental laws and regulations.
We are subject to physical and financial risks associated with climate change and other legacy sitesweather, natural disaster and various regulationsresource depletion impacts.
Climate change can create physical and financial risk. Physical risks include changes in weather conditions and extreme weather events. Our customers’ energy needs vary with weather. To the extent weather conditions are affected by climate change, customers’ energy use could increase or decrease. Increased energy use due to weather changes may require us to invest in generating assets, transmission and infrastructure. Decreased energy use due to weather changes may result in decreased revenues.
Climate change may impact the economy, which could impact our sales and revenues. The price of energy has an impact on the economic health of our communities. The cost of additional regulatory requirements, such as regulation of GHG, could impact the availability of goods and prices charged by our suppliers which would normally be borne by consumers through higher prices for airenergy and purchased goods.
To the extent financial markets view climate change and emissions water intakeof GHGs as a financial risk, this could negatively affect our ability to access capital markets or cause us to receive less than ideal terms and discharge and waste disposal. Actual expenditures could vary fromconditions.
We have committed to a number of long-term climate change goals, which in part are dependent on future technologies not currently in existence. Given the estimates presented. The scope and timinglong-term nature of these expenditures cannotgoals, there is an inherent uncertainty due to internal and external factors regarding our ability to achieve our stated climate change goals. To the extent climate change goals are not met, this could negatively impact our reputation and potentially result in financial risk.
Severe weather impacts our service territories, primarily when thunderstorms, flooding, tornadoes, wildfires and snow or ice storms occur. Extreme weather conditions in general require system backup and can contribute to increased system stress, including service interruptions. Extreme weather conditions creating high energy demand may raise electricity prices, increasing the cost of energy we provide to our customers.
To the extent the frequency of extreme weather events increases, this could increase our cost of providing service. Periods of extreme temperatures could impact our ability to meet demand. Changes in precipitation resulting in droughts or water shortages could adversely affect our operations. Drought conditions also contribute to the increase in wildfire risk from our electric generation facilities.
While we carry liability insurance, given an extreme event, if Xcel Energy was found to be determined until any newliable for wildfire damages, amounts that potentially exceed our coverage could negatively impact our results of operations, financial condition or revised regulations become finalcash flows.
Drought or until more informationwater depletion could adversely impact our ability to provide electricity to customers, cause early retirement of power plants and increase the cost for energy. Adverse events may result in increased insurance costs and/or decreased insurance availability. We may not recover all costs related to mitigating these physical and financial risks.
| | |
| ITEM 1B — UNRESOLVED STAFF COMMENTS |
None.
Virtually all of the utility plant property of the operating companies is learned aboutsubject to the need for remediationlien of their respective first mortgage bond indentures.
| | | | | | | | | | | | | | | | | | | | | | | |
NSP-Minnesota Station, Location and Unit at Dec. 31, 2021 | | Fuel | | Installed | | MW (a) | |
| Steam: | | | | | | | |
A.S. King-Bayport, MN, 1 Unit (f) | | Coal | | 1968 | | 511 | | |
Sherco-Becker, MN (e) | | | | | | | |
| Unit 1 | | Coal | | 1976 | | 680 | | |
| Unit 2 | | Coal | | 1977 | | 682 | | |
| Unit 3 | | Coal | | 1987 | | 517 | | (b) |
| Monticello, MN, 1 Unit | | Nuclear | | 1971 | | 617 | | |
| PI-Welch, MN | | | | | | | |
| Unit 1 | | Nuclear | | 1973 | | 521 | | |
| Unit 2 | | Nuclear | | 1974 | | 519 | | |
| Various locations, 4 Units | | Wood/Refuse | | Various | | 36 | | (c) |
| Combustion Turbine: | | | | | | | |
| Angus Anson-Sioux Falls, SD, 3 Units | | Natural Gas | | 1994 - 2005 | | 327 | | |
| Black Dog-Burnsville, MN, 3 Units | | Natural Gas | | 1987 - 2018 | | 494 | | |
| Blue Lake-Shakopee, MN, 6 Units | | Natural Gas | | 1974 - 2005 | | 447 | | |
| High Bridge-St. Paul, MN, 3 Units | | Natural Gas | | 2008 | | 530 | | |
| Inver Hills-Inver Grove Heights, MN, 6 Units | | Natural Gas | | 1972 | | 252 | | |
| Riverside-Minneapolis, MN, 3 Units | | Natural Gas | | 2009 | | 454 | | |
| Various locations, 7 Units | | Natural Gas | | Various | | 10 | | |
| Wind: | | | | | | | |
| Blazing Star 1-Lincoln County, MN, 100 Units | | Wind | | 2020 | | 200 | | (d) |
| Blazing Star 2-Lincoln County, MN, 100 Units | | Wind | | 2021 | | 200 | | (d) |
| Border-Rolette County, ND, 75 Units | | Wind | | 2015 | | 148 | | (d) |
| Community Wind North-Lincoln County, MN, 12 Units | | Wind | | 2020 | | 26 | | (d) |
| Courtenay Wind-Stutsman County, ND, 100 Units | | Wind | | 2016 | | 190 | | (d) |
| Crowned Ridge 2-Grant County, SD, 88 Units | | Wind | | 2020 | | 192 | | (d) |
| Foxtail-Dickey County, ND, 75 Units | | Wind | | 2019 | | 150 | | (d) |
| Freeborn-Freeborn County, MN, 100 Units | | Wind | | 2021 | | 200 | | (d) |
| Grand Meadow-Mower County, MN, 67 Units | | Wind | | 2008 | | 99 | | (d) |
| Jeffers-Cottonwood County, MN, 20 Units | | Wind | | 2020 | | 43 | | (d) |
| Lake Benton-Pipestone County, MN, 44 Units | | Wind | | 2019 | | 99 | | (d) |
| Mower-Mower County, MN, 43 Units | | Wind | | 2021 | | 91 | | (d) |
| Nobles-Nobles County, MN, 134 Units | | Wind | | 2010 | | 197 | | (d) |
| Pleasant Valley-Mower County, MN, 100 Units | | Wind | | 2015 | | 196 | | (d) |
| | | | Total | | 8,628 | | |
(a)Summer 2021 net dependable capacity.
(b)Based on NSP-Minnesota’s ownership of 59%.
(c)Refuse-derived fuel is made from municipal solid waste.
(d)Values disclosed are the generation levels at the legacy sites.point-of-interconnection for these wind units. Capacity is attainable only when wind conditions are sufficiently available (on-demand net dependable capacity is zero).
(e)A.S. King is expected to be retired early in 2028.
Pollution control equipment can(f)Sherco Unit 1, 2, and 3 are expected to be required by federalretired early in 2026, 2023 and state regulations, such as those requiring mercury emission reductions, and by state or federal implementation plans, such as those to address visibility impairment, interstate air pollution impacts or attainment2030, respectively.
| | | | | | | | | | | | | | | | | | | | | | | |
NSP-Wisconsin Station, Location and Unit at Dec. 31, 2021 | | Fuel | | Installed | | MW (a) | |
| Steam: | | | | | | | |
| Bay Front-Ashland, WI, 2 Units | | Wood/Natural Gas | | 1948 - 1956 | | 41 | | |
| French Island-La Crosse, WI, 2 Units | | Wood/Refuse | | 1940 - 1948 | | 16 | | (b) |
| Combustion Turbine: | | | | | | | |
| French Island-La Crosse, WI, 2 Units | | Oil | | 1974 | | 122 | | |
| Wheaton-Eau Claire, WI, 5 Units | | Natural Gas/Oil | | 1973 | | 234 | | |
| Hydro: | | | | | | | |
| Various locations, 63 Units | | Hydro | | Various | | 135 | | |
| | | | Total | | 548 | | |
(a)Summer 2021 net dependable capacity.
(b)Refuse-derived fuel is made from municipal solid waste.
| | | | | | | | | | | | | | | | | | | | | | | |
PSCo Station, Location and Unit at Dec. 31, 2021 | | Fuel | | Installed | | MW (a) | |
| Steam: | | | | | | | |
Comanche-Pueblo, CO (b) | | | | | | | |
| Unit 1 | | Coal | | 1973 | | 325 | | |
| Unit 2 | | Coal | | 1975 | | 335 | | |
| Unit 3 | | Coal | | 2010 | | 500 | | (c) |
Craig-Craig, CO, 2 Units (d) | | Coal | | 1979 - 1980 | | 82 | | (e) |
Hayden-Hayden, CO, 2 Units | | Coal | | 1965 - 1976 | | 233 | | (f) |
| Pawnee-Brush, CO, 1 Unit | | Coal | | 1981 | | 505 | | |
| Cherokee-Denver, CO, 1 Unit | | Natural Gas | | 1968 | | 310 | | |
| Combustion Turbine: | | | | | | | |
| Blue Spruce-Aurora, CO, 2 Units | | Natural Gas | | 2003 | | 264 | | |
| Cherokee-Denver, CO, 3 Units | | Natural Gas | | 2015 | | 576 | | |
| Fort St. Vrain-Platteville, CO, 6 Units | | Natural Gas | | 1972 - 2009 | | 973 | | |
| Rocky Mountain-Keenesburg, CO, 3 Units | | Natural Gas | | 2004 | | 580 | | |
| Various locations, 8 Units | | Natural Gas | | Various | | 251 | | |
| Hydro: | | | | | | | |
| Cabin Creek-Georgetown, CO | | | | | | | |
| Pumped Storage, 2 Units | | Hydro | | 1967 | | 210 | | |
| Various locations, 8 Units | | Hydro | | Various | | 25 | | |
| Wind: | | | | | | | |
| Rush Creek, CO, 300 units | | Wind | | 2018 | | 582 | | (g) |
| Cheyenne Ridge, CO, 229 units | | Wind | | 2020 | | 477 | | (g) |
| | | | Total | | 6,228 | | |
(a) Summer 2021 net dependable capacity.
(b) In 2018, the CPUC approved early retirement of NAAQS. In 2016, the EPA adopted a federal visibility plan for Texas which imposes SO2 emission limitations that reflect installation of dry scrubbers on TolkPSCo’s Comanche Units 1 and 2 with compliance required byin 2022 and 2025, respectively.
(c) Based on PSCo’s ownership of 67%.
(d) Craig Unit 1 and 2 are expected to be retired early 2021. This rule has been stayedin 2025 and 2028, respectively.
(e) Based on PSCo’s ownership of 10%.
(f) Based on PSCo’s ownership of 76% of Unit 1 and 37% of Unit 2.
(g) Values disclosed are the generation levels at the point-of-interconnection. Capacity is attainable only when wind conditions are sufficiently available (on-demand net dependable capacity is zero).
| | | | | | | | | | | | | | | | | | | | | | | |
SPS Station, Location and Unit at Dec. 31, 2021 | | Fuel | | Installed | | MW (a) | |
| Steam: | | | | | | | |
| Cunningham-Hobbs, NM, 2 Units | | Natural Gas | | 1957 - 1965 | | 225 | | |
Harrington-Amarillo, TX, 3 Units (b) | | Coal | | 1976 - 1980 | | 1,018 | | |
| Jones-Lubbock, TX, 2 Units | | Natural Gas | | 1971 - 1974 | | 486 | | |
| Maddox-Hobbs, NM, 1 Unit | | Natural Gas | | 1967 | | 112 | | |
| Nichols-Amarillo, TX, 3 Units | | Natural Gas | | 1960 - 1968 | | 457 | | |
| Plant X-Earth, TX, 4 Units | | Natural Gas | | 1952 - 1964 | | 298 | | |
Tolk-Muleshoe, TX, 2 Units (d) | | Coal | | 1982 - 1985 | | 1,067 | | |
| Combustion Turbine: | | | | | | | |
| Cunningham-Hobbs, NM, 2 Units | | Natural Gas | | 1997 | | 207 | | |
| Jones-Lubbock, TX, 2 Units | | Natural Gas | | 2011 - 2013 | | 334 | | |
| Maddox-Hobbs, NM, 1 Unit | | Natural Gas | | 1963 - 1976 | | 61 | | |
| Wind: | | | | | | | |
| Hale-Plainview, TX, 239 Units | | Wind | | 2019 | | 477 | | (c) |
| Sagamore-Dora, NM, 240 Units | | Wind | | 2020 | | 507 | | (c) |
| | | | Total | | 5,249 | | |
(a) Summer 2021 net dependable capacity.
(b) Harrington is expected to be converted to natural gas by the Fifth Circuit.end of 2024.
(c) Values disclosed are the generation levels at the point-of-interconnection for these wind units. Capacity is attainable only when wind conditions are sufficiently available (on-demand net dependable capacity is zero).
(d) Tolk Unit 1 and 2 are proposed to be retired in 2034.
Electric utility overhead and underground transmission and distribution lines at Dec. 31, 2021:
| | | | | | | | | | | | | | | | | | | | | | | | | | |
| Conductor Miles | | NSP-Minnesota | | NSP-Wisconsin | | PSCo | | SPS |
| Transmission | | | | | | | | |
| 500 KV | | 2,915 | | | — | | | — | | | — | |
| 345 KV | | 13,570 | | | 2,943 | | | 4,978 | | | 11,688 | |
| 230 KV | | 2,300 | | | — | | | 12,141 | | | 9,763 | |
| 161 KV | | 640 | | | 1,778 | | | — | | | — | |
| 138 KV | | — | | | — | | | 92 | | | — | |
| 115 KV | | 8,086 | | | 1,818 | | | 5,075 | | | 14,880 | |
| Less than 115 KV | | 6,644 | | | 5,870 | | | 1,830 | | | 4,423 | |
| Total Transmission | | 34,155 | | | 12,409 | | | 24,116 | | | 40,754 | |
| | | | | | | | |
| Distribution | | | | | | | | |
| Less than 115 KV | | 81,406 | | | 27,701 | | | 78,712 | | | 22,651 | |
| | | | | | | | |
| Total | | 115,561 | | | 40,110 | | | 102,828 | | | 63,405 | |
Electric utility transmission and distribution substations at Dec. 31, 2021: | | | | | | | | | | | | | | | | | | | | | | | | | | |
| | NSP-Minnesota | | NSP-Wisconsin | | PSCo | | SPS |
| Quantity | | 354 | | | 204 | | | 237 | | | 458 | |
Natural gas utility mains at Dec. 31, 2021:
| | | | | | | | | | | | | | | | | | | | | | | | | | | | | | | | |
| Miles | | NSP-Minnesota | | NSP-Wisconsin | | PSCo | | SPS | | WGI |
| Transmission | | 85 | | | 3 | | | 2,174 | | | 20 | | | 11 | |
| Distribution | | 10,741 | | | 2,526 | | | 23,243 | | | — | | | — | |
| | |
| ITEM 3 — LEGAL PROCEEDINGS |
Xcel Energy is involved in various litigation matters in the ordinary course of business. The assessment of whether a loss is probable or is a reasonable possibility, and whether the loss or a range of loss is estimable, often involves a series of complex judgments about future events. Management maintains accruals for losses probable of being incurred and subject to reasonable estimation.
Management is sometimes unable to estimate an amount or range of a reasonably possible loss in certain situations, including but not limited to when (1) the damages sought are indeterminate, (2) the proceedings are in the early stages, or (3) the matters involve novel or unsettled legal theories. In March 2017,such cases, there is considerable uncertainty regarding the Fifth Circuit remandedtiming or ultimate resolution of such matters, including a possible eventual loss.
For current proceedings not specifically reported herein, management does not anticipate that the rule to the EPA for reconsideration, while leaving the stay in effect. The Fifth Circuit is now holding the case in abeyance until the EPA completes its reconsideration of the rule.
ultimate liabilities, if any, would have a material effect on Xcel Energy’s consolidated financial statements. Legal fees are generally expensed as incurred.
See Note 1312 to the consolidated financial statements, Item 1 and Item 7 for further information.
| | |
| ITEM 4 — MINE SAFETY DISCLOSURES |
None.
PART II
| | |
| ITEM 5 — MARKET FOR REGISTRANT’S COMMON EQUITY, RELATED STOCKHOLDER MATTERS AND ISSUER PURCHASES OF EQUITY SECURITIES. |
Stock Data
Xcel Energy Inc.’s common stock is listed on the Nasdaq Global Select Market (Nasdaq). The trading symbol is XEL. The number of common stockholders of record as of Feb. 17, 2022 was approximately 49,137.
The following compares our cumulative TSR on common stock with the cumulative TSR of the EEI Investor-Owned Electrics Index and the S&P 500 Composite Stock Price Index over the last five years.
The EEI Investor-Owned Electrics Index (market capitalization-weighted) included 39 companies at year-end and is a broad measure of industry performance.
Comparison of Five Year Cumulative Total Return*
* $100 invested on Dec. 31, 2016 in stock or index — including reinvestment of dividends. Fiscal years ended Dec. 31.
Purchases of Equity Securities by Issuer and Affiliated Purchasers
For the quarter ended Dec. 31, 2021, no equity securities that are registered by Xcel Energy Inc. pursuant to Section 12 of the Securities Exchange Act of 1934 were purchased by or on behalf of us or any of our affiliated purchasers.
| | |
| ITEM 7 — MANAGEMENT’S DISCUSSION AND ANALYSIS OF FINANCIAL CONDITION AND RESULTS OF OPERATIONS |
Non-GAAP Financial Measures
The following discussion includes financial information prepared in accordance with GAAP, as well as certain non-GAAP financial measures such as ongoing ROE, ongoing earnings and ongoing diluted EPS. Generally, a non-GAAP financial measure is a measure of a company’s financial performance, financial position or cash flows that excludes (or includes) amounts that are adjusted from measures calculated and presented in accordance with GAAP.
Xcel Energy’s management uses non-GAAP measures for financial planning and analysis, for reporting of results to the Board of Directors, in determining performance-based compensation and communicating its earnings outlook to analysts and investors. Non-GAAP financial measures are intended to supplement investors’ understanding of our performance and should not be considered alternatives for financial measures presented in accordance with GAAP. These measures are discussed in more detail below and may not be comparable to other companies’ similarly titled non-GAAP financial measures.
Ongoing ROE
Ongoing ROE is calculated by dividing the net income or loss of Xcel Energy or each subsidiary, adjusted for certain nonrecurring items, by each entity’s average stockholder’s equity. We use these non-GAAP financial measures to evaluate and provide details of earnings results.
Earnings Adjusted for Certain Items (Ongoing Earnings and Ongoing Diluted EPS)
GAAP diluted EPS reflects the potential dilution that could occur if securities or other agreements to issue common stock (i.e., common stock equivalents) were settled. The weighted average number of potentially dilutive shares outstanding used to calculate Xcel Energy Inc.’s diluted EPS is calculated using the treasury stock method. Ongoing earnings reflect adjustments to GAAP earnings (net income) for certain items. Ongoing diluted EPS is calculated by dividing the net income or loss of each subsidiary, adjusted for certain items, by the weighted average fully diluted Xcel Energy Inc. common shares outstanding for the period. Ongoing diluted EPS for each subsidiary is calculated by dividing the net income or loss of such subsidiary, adjusted for certain items, by the weighted average fully diluted Xcel Energy Inc. common shares outstanding for the period.
We use these non-GAAP financial measures to evaluate and provide details of Xcel Energy’s core earnings and underlying performance. We believe these measurements are useful to investors to evaluate the actual and projected financial performance and contribution of our subsidiaries. For the years ended Dec. 31, 2021 and 2020, there were no such adjustments to GAAP earnings and therefore GAAP earnings equal ongoing earnings.
Diluted EPS for Xcel Energy at Dec. 31:
| | | | | | | | | | | | | | |
| | 2021 | | 2020 |
| Diluted Earnings (Loss) Per Share | | GAAP and Ongoing Diluted EPS | | GAAP and Ongoing Diluted EPS |
| PSCo | | $ | 1.22 | | | $ | 1.11 | |
| NSP-Minnesota | | 1.12 | | | 1.12 | |
| SPS | | 0.59 | | | 0.56 | |
| NSP-Wisconsin | | 0.20 | | | 0.20 | |
| Earnings from equity method investments — WYCO | | 0.05 | | | 0.05 | |
Regulated utility (a) | | 3.18 | | | 3.04 | |
| Xcel Energy Inc. and Other | | (0.22) | | | (0.25) | |
Total (a) | | $ | 2.96 | | | $ | 2.79 | |
(a) Amounts may not add due to rounding.
Xcel Energy’s management believes that ongoing earnings reflects management’s performance in operating Xcel Energy and provides a meaningful representation of the performance of Xcel Energy’s core business. In addition, Xcel Energy’s management uses ongoing earnings internally for financial planning and analysis, reporting results to the Board of Directors and when communicating its earnings outlook to analysts and investors.
2021 Comparison with 2020
Xcel Energy — GAAP and ongoing earnings increased $0.17 per share for 2021. The increase was driven by capital investment recovery and other regulatory outcomes, partially offset by increases in depreciation and lower AFUDC. Fluctuations in electric and natural gas revenues associated with changes in fuel and purchased power and/or natural gas sold and transported generally do not significantly impact earnings (changes in revenues are offset by the related variation in costs).
PSCo — Earnings increased $0.11 per share for 2021, driven by capital investment recovery and other regulatory outcomes. Higher revenues were partially offset by increased depreciation, O&M expenses and other taxes (other than income taxes).
NSP-Minnesota — Earnings were flat for 2021 compared to 2020, reflecting capital investment recovery offset by additional depreciation and interest charges.
SPS — Earnings increased $0.03 per share for 2021, largely related to capital investment recovery, other regulatory outcomes and higher sales and demand, partially offset by decreased AFUDC.
NSP-Wisconsin — Earnings were flat for 2021 compared to 2020.
Xcel Energy Inc. and Other — Primarily includes financing costs at the holding company, offset by earnings from EIP investments.
Changes in Diluted EPS
Components significantly contributing to changes in EPS:
| | | | | | | | |
| 2021 vs. 2020 |
| Diluted Earnings (Loss) Per Share | | Dec. 31 |
| GAAP and ongoing diluted EPS — 2020 | | $ | 2.79 | |
| | |
| Components of change — 2021 vs. 2020 | | |
| Higher electric revenues, net of electric fuel and purchased power | | 0.26 | |
Lower ETR (a) | | 0.17 | |
| Higher natural gas revenues, net of cost of natural gas sold and transported | | 0.15 | |
| | |
| Changes in taxes (other than income taxes) | | (0.03) | |
| Lower AFUDC | | (0.10) | |
| Higher depreciation and amortization | | (0.24) | |
| | |
| Other (net) | | (0.04) | |
| GAAP and ongoing diluted EPS — 2021 | | $ | 2.96 | |
(a)Includes PTCs and plant regulatory amounts, which are primarily offset as a reduction to electric revenues.
ROE for Xcel Energy and its utility subsidiaries:
| | | | | | | | | | | | | | |
| | 2021 | | 2020 |
| ROE | | GAAP and Ongoing ROE | | GAAP and Ongoing ROE |
| NSP-Minnesota | | 8.45 | % | | 9.20 | % |
| PSCo | | 8.23 | | | 8.06 | |
| SPS | | 9.22 | | | 9.54 | |
| NSP-Wisconsin | | 9.92 | | | 10.52 | |
| Operating Companies | | 8.58 | | | 8.87 | |
| Xcel Energy | | 10.58 | | | 10.59 | |
Statement of Income Analysis
The following summarizes the items that affected the individual revenue and expense items reported in the consolidated statements of income.
Estimated Impact of Temperature Changes on Regulated Earnings — Unusually hot summers or cold winters increase electric and natural gas sales, while mild weather reduces electric and natural gas sales. The estimated impact of weather on earnings is based on the number of customers, temperature variances, the amount of natural gas or electricity historically used per degree of temperature and excludes any incremental related operating expenses that could result due to storm activity or vegetation management requirements. As a result, weather deviations from normal levels can affect Xcel Energy’s financial performance. However, sales true-up and decoupling mechanisms in Minnesota and Colorado predominately mitigate the positive and adverse impacts of weather.
Degree-day or THI data is used to estimate amounts of energy required to maintain comfortable indoor temperature levels based on each day’s average temperature and humidity. HDD is the measure of the variation in the weather based on the extent to which the average daily temperature falls below 65° Fahrenheit. CDD is the measure of the variation in the weather based on the extent to which the average daily temperature rises above 65° Fahrenheit. Each degree of temperature above 65° Fahrenheit is counted as one CDD, and each degree of temperature below 65° Fahrenheit is counted as one HDD. In Xcel Energy’s more humid service territories, a THI is used in place of CDD, which adds a humidity factor to CDD. HDD, CDD and THI are most likely to impact the usage of Xcel Energy’s residential and commercial customers. Industrial customers are less sensitive to weather.
Normal weather conditions are defined as either the 10, 20 or 30-year average of actual historical weather conditions. The historical period of time used in the calculation of normal weather differs by jurisdiction, based on regulatory practice. To calculate the impact of weather on demand, a demand factor is applied to the weather impact on sales. Extreme weather variations, windchill and cloud cover may not be reflected in weather-normalized estimates.
Percentage (decrease) increase in normal and actual HDD, CDD and THI:
| | | | | | | | | | | | | | | | | |
| 2021 vs.
Normal | | 2020 vs.
Normal | | 2021 vs. 2020 |
| HDD | (6.6) | % | | (3.1) | % | | (4.3) | % |
| CDD | 12.2 | | | 22.2 | | | (9.2) | |
| THI | 26.8 | | | 6.3 | | | 20.7 | |
Weather — Estimated impact of temperature variations on EPS compared with normal weather conditions: | | | | | | | | | | | | | | | | | |
| 2021 vs.
Normal | | 2020 vs.
Normal | | 2021 vs. 2020 |
| Retail electric | $ | 0.096 | | | $ | 0.090 | | | $ | 0.006 | |
| Decoupling and sales true-up | (0.066) | | | (0.041) | | | (0.025) | |
| Electric total | $ | 0.030 | | | $ | 0.049 | | | $ | (0.019) | |
| Firm natural gas | (0.025) | | | (0.011) | | | (0.014) | |
| Total | $ | 0.005 | | | $ | 0.038 | | | $ | (0.033) | |
Sales — Sales growth (decline) for actual and weather-normalized sales:
| | | | | | | | | | | | | | | | | | | | | | | | | | | | | | | | |
| | 2021 vs. 2020 |
| | PSCo | | NSP-Minnesota | | SPS | | NSP-Wisconsin | | Xcel Energy |
| Actual | | | | | | | | | | |
| Electric residential | | — | % | | 2.2 | % | | (4.7) | % | | 0.5 | % | | 0.3 | % |
| Electric C&I | | 0.4 | | | 2.3 | | | 2.9 | | | 3.6 | | | 2.0 | |
| Total retail electric sales | | 0.3 | | | 2.2 | | | 1.4 | | | 2.7 | | | 1.4 | |
| Firm natural gas sales | | (1.1) | | | (4.0) | | | N/A | | (5.0) | | | (2.2) | |
| | | | | | | | | | | | | | | | | | | | | | | | | | | | | | | | |
| | 2021 vs. 2020 |
| | PSCo | | NSP-Minnesota | | SPS | | NSP-Wisconsin | | Xcel Energy |
| Weather-normalized | | | | | | | | |
| Electric residential | | 1.5 | % | | 0.3 | % | | (1.0) | % | | (0.2) | % | | 0.5 | % |
| Electric C&I | | 0.4 | | | 1.7 | | | 3.3 | | | 3.3 | | | 1.9 | |
| Total retail electric sales | | 0.8 | | | 1.2 | | | 2.5 | | | 2.2 | | | 1.4 | |
| Firm natural gas sales | | 1.3 | | | (2.2) | | | N/A | | (4.1) | | | (0.1) | |
| | | | | | | | | | | | | | | | | | | | | | | | | | | | | | | | |
| | 2021 vs. 2020 (2020 Leap Year Adjusted) |
| | PSCo | | NSP-Minnesota | | SPS | | NSP-Wisconsin | | Xcel Energy |
| Weather-normalized | | | | | | | | |
| Electric residential | | 1.7 | % | | 0.6 | % | | (0.7) | % | | 0.1 | % | | 0.8 | % |
| Electric C&I | | 0.7 | | | 1.9 | | | 3.6 | | | 3.6 | | | 2.1 | |
| Total retail electric sales | | 1.1 | | | 1.5 | | | 2.7 | | | 2.5 | | | 1.7 | |
| Firm natural gas sales | | 1.8 | | | (1.7) | | | N/A | | (3.6) | | | 0.4 | |
Weather-normalized and leap-year adjusted electric sales growth (decline) — year-to-date
Weather-adjusted sales results for each of our utility subsidiaries in 2021 reflect improving economies as the adverse effects of COVID-19 lessen. The recovery reflects increased sales in the C&I sector as businesses return to a more normal level. Residential sales remain elevated from pre-pandemic levels due to continuance of individuals working from home.
•PSCo — Residential sales rose based on a 1.2% increase in customers, combined with higher use per customer. The growth in C&I sales was due to a 1.2% increase in customers, partially offset by slightly lower use per customer, primarily in the services sector.
•NSP-Minnesota — Residential sales growth reflects a 1.2% increase in customers, partially offset by a lower use per customer. The growth in C&I sales was due to a 0.9% increase in customers and higher use per customer, primarily in the manufacturing, retail and services sectors.
•SPS — Residential sales declined as lower use per customer offset a 0.9% increase in customers. C&I sales increased due to a 0.5% increase in customers and higher use per customer, primarily driven by the oil and gas and professional services sectors.
•NSP-Wisconsin — Residential sales growth was attributable to a 0.8% increase in customer additions, partially offset by slightly lower use per customer. The growth in C&I sales was due to a 1.1% increase in customers, primarily led by increases in the manufacturing, health care and retail trade sectors.
Weather-normalized and leap-year adjusted natural gas sales growth (decline) — year-to-date
•Natural gas sales primarily reflect a 1.2% increase in residential customers and a 0.5% increase in C&I customers, partially offset by a decrease in use per customer.
Electric Margin
Electric margin is presented as electric revenues less electric fuel and purchased power expenses. Expenses incurred for electric fuel and purchased power are generally recovered through various regulatory recovery mechanisms. As a result, changes in these expenses are generally offset in operating revenues.
Electric revenues and fuel and purchased power expenses are impacted by fluctuations in the price of natural gas, coal and uranium. However, these price fluctuations generally have minimal impact on earnings impact due to fuel recovery mechanisms. In addition, electric customers receive a credit for PTCs generated, which reduce electric revenue and income taxes.
Electric Revenues, Fuel and Purchased Power and Electric Margin
| | | | | | | | | | | | | | |
| (Millions of Dollars) | | 2021 | | 2020 |
| Electric revenues | | $ | 11,205 | | | $ | 9,802 | |
| Electric fuel and purchased power | | (4,733) | | | (3,512) | |
| Electric margin | | $ | 6,472 | | | $ | 6,290 | |
Changes in Electric Margin
| | | | | | | | |
| (Millions of Dollars) | | 2021 vs. 2020 |
| Non-fuel riders | | $ | 221 | |
| Regulatory rate outcomes (Texas, Wisconsin, Colorado, New Mexico and North Dakota) | | 114 | |
Proprietary commodity trading, net of sharing (a) | | 40 | |
Sales and demand (b) | | 29 | |
| PTCs flowed back to customers (offset by lower ETR) | | (149) | |
Texas 2019 rate case surcharge (c) | | (70) | |
| Estimated impact of weather (net of decoupling/sales true-up) | | (12) | |
| Other (net) | | 9 | |
| | |
| | |
| Increase in electric margin | | $ | 182 | |
(a)Includes $27 million of net gains recognized in the first quarter of 2021, driven by market changes associated with Winter Storm Uri. Additional amounts are primarily related to long-term physical generation contracts, which have increased in value as a result of higher energy prices.
(b)Sales excludes weather impact, net of decoupling/sales true-up, and demand is net of sales true-up.
(c)Impact is due to the Texas rate case outcome, which resulted in a revenue increase that was recognized in the third quarter of 2020 (largely offset by recognition of previously deferred costs).
Natural Gas Margin
Natural gas margin is presented as natural gas revenues less the cost of natural gas sold and transported. Expenses incurred for the cost of natural gas sold are generally recovered through various regulatory recovery mechanisms. As a result, changes in these expenses are generally offset in operating revenues.
Natural gas expense varies with changing sales and the cost of natural gas. However, fluctuations in the cost of natural gas generally have minimal earnings impact due to cost recovery mechanisms.
Natural Gas Revenues, Cost of Natural Gas Sold and Transported and Natural Gas Margin
| | | | | | | | | | | | | | |
| (Millions of Dollars) | | 2021 | | 2020 |
| Natural gas revenues | | $ | 2,132 | | | $ | 1,636 | |
| Cost of natural gas sold and transported | | (1,081) | | | (689) | |
| Natural gas margin | | $ | 1,051 | | | $ | 947 | |
Changes in Natural Gas Margin
| | | | | | | | |
| (Millions of Dollars) | | 2021 vs. 2020 |
| Regulatory rate outcomes (Colorado and North Dakota) | | $ | 90 | |
| Infrastructure and integrity riders | | 12 | |
| Conservation incentive | | 3 | |
| Estimated impact of weather | | (10) | |
| | |
| | |
| Other (net) | | 9 | |
| Increase in natural gas margin | | $ | 104 | |
Non-Fuel Operating Expenses and Other Items
O&M Expenses — O&M expenses decreased $3 million year-to-date. Increases for distribution, wind farm maintenance and technology costs were offset by a decrease in employee benefits expense (e.g., long term incentives), additional Texas 2021 rate case deferrals and the year-over-year impact of amounts associated with the Texas 2019 rate case surcharge.
Depreciation and Amortization — Depreciation and amortization increased $173 million year-to-date. The increase was primarily driven by several wind farms going into service, normal system expansion and the implementation of new depreciation rates in various states.
Other Income (Expense) — Other income (expense) increased $11 million year-to-date. The change was largely related to gains associated with rabbi trust performance (offset in O&M expenses).
AFUDC, Equity and Debt — AFUDC decreased $58 million year-to-date. The decrease was driven by completion of various wind projects throughout 2020 and 2021.
Interest Charges — Interest charges increased $2 million year-to-date. The increase was largely due to higher debt levels to fund capital investments, partially offset by lower long-term and short-term interest rates.
Earnings from Equity Method Investments — Earnings from equity method investments increased $22 million year-to-date. The year-to-date change was largely attributable to the performance of the EIP funds, which invest in energy technology companies.
Income Taxes — Income tax benefit increased $64 million year-to-date. The change was driven by an increase in wind PTCs due to additional wind facilities going into service. Impact of PTCs was partially offset by an increase in pretax earnings, lower plant regulatory differences and lower non-plant accumulated deferred income tax amortization.
Xcel Energy Inc. and Other Results
Net income and diluted EPS contributions of Xcel Energy Inc. and its nonregulated businesses:
| | | | | | | | | | | | | | |
| | Contribution (Millions of Dollars) |
| | 2021 | | 2020 |
| Xcel Energy Inc. financing costs | | $ | (129) | | | $ | (147) | |
MEC (a) | | — | | | 15 | |
| | | | |
Venture Holdings (b) | | 21 | | | 4 | |
| Xcel Energy Inc. taxes and other results | | (12) | | | (5) | |
| Total Xcel Energy Inc. and other costs | | $ | (120) | | | $ | (133) | |
| | | | | | | | | | | | | | |
| | Contribution (Diluted Earnings (Loss) Per Share) |
| | 2021 | | 2020 |
| Xcel Energy Inc. financing costs | | $ | (0.24) | | | $ | (0.28) | |
MEC (a) | | — | | | 0.03 | |
| | | | |
Venture Holdings (b) | | 0.04 | | | 0.01 | |
| Xcel Energy Inc. taxes and other results | | (0.02) | | | (0.01) | |
| Total Xcel Energy Inc. and other costs | | $ | (0.22) | | | $ | (0.25) | |
(a)MEC was sold in the third quarter of 2020.
(b)Amounts include gains or losses associated with EIP investments.
Xcel Energy Inc.’s results include interest charges, which are incurred at Xcel Energy Inc. and are not directly assigned to individual subsidiaries.
2020 Comparison with 2019
A discussion of changes in Xcel Energy’s results of operations, cash flows and liquidity and capital resources from the year ended Dec. 31, 2019 to Dec. 31, 2020 can be found in Part II, “Item 7, Management’s Discussion and Analysis of Financial Condition and Results of Operations” of our Annual Report on Form 10-K for the fiscal year 2020, which was filed with the SEC on Feb. 17, 2021. However, such discussion is not incorporated by reference into, and does not constitute a part of, this Annual Report on Form 10-K. | | |
| Public Utility Regulation |
The FERC and various state and local regulatory commissions regulate Xcel Energy Inc.’s utility subsidiaries and West Gas Interstate. Xcel Energy is subject to rate regulation by state utility regulatory agencies, which have jurisdiction with respect to the rates of electric and natural gas distribution companies in Minnesota, North Dakota, South Dakota, Wisconsin, Michigan, Colorado, New Mexico and Texas.
Rates are designed to recover plant investment, operating costs and an allowed return on investment. Our utility subsidiaries request changes in utility rates through commission filings. Changes in operating costs can affect Xcel Energy’s financial results, depending on the timing of rate cases and implementation of final rates. Other factors affecting rate filings are new investments, sales, conservation and DSM efforts, and the cost of capital.
In addition, the regulatory commissions authorize the ROE, capital structure and depreciation rates in rate proceedings. Decisions by these regulators can significantly impact Xcel Energy’s results of operations.
See Rate Matters within Note 12 to the consolidated financial statements for further discussioninformation.
NSP-Minnesota
Summary of Xcel Energy’s environmental contingencies.Regulatory Agencies / RTO and Areas of Jurisdiction
| | | | | | | | |
| Regulatory Body / RTO | | Additional Information |
| MPUC | | Retail rates, services, security issuances, property transfers, mergers, disposition of assets, affiliate transactions, and other aspects of electric and natural gas operations. Reviews and approves Integrated Resource Plans for meeting future energy needs. Certifies the need and siting for generating plants greater than 50 MW and transmission lines greater than 100 KV in Minnesota. Reviews and approves natural gas supply plans. Pipeline safety compliance. |
| NDPSC | | Retail rates, services and other aspects of electric and natural gas operations. Regulatory authority over generation and transmission facilities, along with the siting and routing of new generation and transmission facilities in North Dakota. Pipeline safety compliance. |
| South Dakota Public Utilities Commission | | Retail rates, services and other aspects of electric operations. Regulatory authority over generation and transmission facilities, along with the siting and routing of new generation and transmission facilities in South Dakota. Pipeline safety compliance. |
| FERC | | Wholesale electric operations, hydroelectric licensing, accounting practices, wholesale sales for resale, transmission of electricity in interstate commerce, compliance with NERC electric reliability standards, asset transfers and mergers, and natural gas transactions in interstate commerce. |
| MISO | | NSP-Minnesota is a transmission owning member of the MISO RTO and operates within the MISO RTO and wholesale markets. NSP-Minnesota makes wholesale sales in other RTO markets at market-based rates. NSP-Minnesota and NSP-Wisconsin also make wholesale electric sales at market-based prices to customers outside of their balancing authority as jointly authorized by the FERC. |
| DOT | | Pipeline safety compliance. |
| Minnesota Office of Pipeline Safety | | Pipeline safety compliance. |
InflationRecovery Mechanisms
| | | | | | | | |
| Mechanism | | Additional Information |
CIP Rider (a) | | Recovers costs of conservation and DSM programs in Minnesota. |
| Environmental Improvement Rider | | Recovers costs of environmental improvement projects in Minnesota. |
| Renewable Development Fund | | Allocates money collected from customers to support research and development of emerging renewable energy projects and technologies in Minnesota. |
| RES | | Recovers cost of renewable generation in Minnesota. |
| Renewable Energy Rider | | Recovers cost of renewable generation in North Dakota. |
| State Energy Policy Rider | | Recovers costs related to various energy policies approved by the Minnesota legislature. |
| TCR | | Recovers costs for investments in electric transmission and distribution grid modernization. |
| Infrastructure Rider | | Recovers costs for investments in generation and incremental property taxes in South Dakota. |
FCA (b) | | Minnesota, North Dakota and South Dakota include a FCA for monthly billing adjustments to recover changes in prudently incurred costs of fuel related items and purchased energy. Capacity costs are recovered through base rates and are not recovered through the FCA. MISO costs are generally recovered through either the FCA or base rates. |
| Purchased Gas Adjustment | | Provides for prospective monthly rate adjustments for costs of purchased natural gas, transportation and storage service. Includes a true-up process for difference between projected and actual costs. |
| GUIC Rider | | Recovers costs for transmission and distribution pipeline integrity management programs, including funding for pipeline assessments, deferred costs for sewer separation and pipeline integrity management programs in Minnesota. |
| Sales True-up | | In February 2022, NSP-Minnesota filed the 2021 sales true-up compliance report, resulting in a total surcharge of $59 million. An MPUC ruling is anticipated in the second quarter of 2022. In their current rate case, NSP-Minnesota has proposed a sales true-up mechanism for 2022 and beyond that would operate similarly to the 2021 sales true-up. Under the stay-out petition, 2021 NSP-Minnesota jurisdictional earnings was capped at a 9.06% ROE. Any excess earnings are required to be refunded to customers. |
Inflation(a)Minnesota state law requires NSP-Minnesota to spend 2% of its state electric revenues and 0.5% of its state natural gas revenues on CIP. These costs are recovered through an annual cost-recovery mechanism.
(b)The MPUC changed the FCA process in Minnesota (effective in 2020). Each month, utilities collect amounts equal to baseline cost of energy set at the start of the plan year (base would be reset annually). Monthly variations to baseline costs are tracked and netted over a 12-month period. Utilities issue refunds above the baseline costs and can seek recovery of any overage.
Pending and Recently Concluded Regulatory Proceedings
2022 Minnesota Natural Gas Rate Case—In November 2021, NSP-Minnesota filed a request with the MPUC for an annual natural gas rate increase of $36 million, or 6.6%. The filing is based on a 2022 forecast test year and includes a requested ROE of 10.5%, rate base of $934 million and an equity ratio of 52.50%.
In December 2021, the MPUC approved the requested interim rates of $25 million, subject to refund, beginning on Jan. 1, 2022.
The next steps in the procedural schedule are expected to be as follows:
•Intervenor testimony: Aug. 30, 2022.
•Rebuttal testimony: Oct. 4, 2022.
•Public hearing: Nov. 1-4, 2022.
•ALJ Report: Feb. 6, 2023.
•MPUC Order: April 26, 2023.
2022 Minnesota Electric Rate Case — In October 2021, NSP-Minnesota filed a three-year electric rate case with the MPUC. The rate case is based on a requested ROE of 10.2%, a 52.50% equity ratio and forward test years.
The request is detailed as follows:
| | | | | | | | | | | | | | | | | | | | | | | | | | |
| (Amounts in Millions, Except Percentages) | | 2022 | | 2023 | | 2024 | | Total |
| Rate request | | $ | 396 | | | $ | 150 | | | $ | 131 | | | $ | 677 | |
| Increase percentage | | 12.2 | % | | 4.8 | % | | 4.2 | % | | 21.2 | % |
| Rate base | | $ | 10,931 | | | $ | 11,446 | | | $ | 11,918 | | | N/A |
In addition, NSP-Minnesota requested interim rates, subject to refund, of $288 million to be implemented in January 2022 and an incremental $135 million to be implemented in January 2023. In December 2021, the MPUC approved rates of $247 million to begin on Jan. 1, 2022. The adjusted level reflects exigent circumstances from the COVID-19 pandemic.
The next steps in the procedural schedule are expected to be as follows:
•Intervenor testimony: Oct. 3, 2022.
•Rebuttal testimony: Nov. 8, 2022.
•Public hearing: Dec. 13-16, 2022.
•ALJ Report: March 31, 2023.
•MPUC Order: June 30, 2023.
2021 North Dakota Natural Gas Rate Case — In September 2021, NSP-Minnesota filed a request with the NDPSC for a natural gas rate increase of $7 million, or 10.49%. The filing is based on a requested ROE of 10.5%, an equity ratio of 52.54%, a 2022 forecast test year and a rate base of approximately $140 million. Interim rates of $7 million, subject to refund, were implemented on Nov. 1, 2021. An NDPSC decision is expected in early fall 2022.
The next steps in the procedural schedule are expected to be as follows:
•Intervenor testimony: March 1, 2022
•Rebuttal testimony: April 1, 2022
•Hearings: June 1-3, 2022
2020 North Dakota Electric Rate Case — In November 2020, NSP-Minnesota filed a rate case with the NDPSC seeking a rate increase of $19 million based on a ROE of 10.2%, an equity ratio of 52.5% and rate base of $677 million.
In August 2021, the NDPSC approved a settlement between NSP-Minnesota and various parties, which includes the following, effective Jan. 1, 2021:
•Base revenue increase of $7 million.
•ROE of 9.5%.
•Equity ratio of 52.5%.
•Deferral of advanced grid intelligence and security initiative capital and O&M expenses.
•An earnings cap mechanism, which would return to customers 100% of earnings equal to or in excess of 9.75% ROE, effective until the next rate case.
Minnesota Relief and Recovery— In 2020, the MPUC opened a docket and invited utilities in the state to submit potential projects that would create jobs and help jump start the economy to offset the impacts of COVID-19.
The status of the various proposals is listed below:
•In January 2021, the MPUC approved NSP-Minnesota’s request for the repowering of 651 MW of owned wind projects and 20 MW of wind projects under PPAs. These projects are estimated to save customers approximately $160 million over the next 25 years.
•In April 2021, NSP-Minnesota proposed to add 460 MW of solar facilities at the Sherco site with an incremental investment of approximately $575 million. An MPUC decision is expected by the third quarter of 2022.
•In June 2021, the MPUC approved NSP-Minnesota’s proposal to acquire a repowered wind farm from ALLETE, Inc.
•The MPUC is also considering NSP-Minnesota’s revised proposal to provide $40 million of incremental electric vehicle rebates.
Minnesota Resource Plan—In July 2019, NSP-Minnesota filed its Minnesota resource plan, which runs through 2034.
On Feb. 8, 2022, the MPUC approved the following:
•10-year extension for the Monticello nuclear facility.
•Retirement of the A.S. King plant in 2028 and Sherco 3 in 2030.
•NSP-Minnesota ownership of Sherco and A.S. King gen-tie lines plus additional renewable resources on the lines up to its current interconnection rights (2,000 MW for Sherco and 600 MW for A.S. King).
•The need for 2,150 MW of new wind and 2,500 MW of new solar by 2032, as well as additional renewable generation of 1,100 MW beyond 2032.
•Recognition of the need for 800 MW of additional firm dispatchable resources between 2027 and 2029. The dispatchable generation will need to be approved through a CON process.
The next Minnesota resource plan is due on Feb. 1, 2024.
2022 RES Electric Rider — In November 2021, NSP-Minnesota filed the RES Rider. The requested amount of $264 million includes a true-up (2020 and 2021 riders) of $154 million and the 2022 requested amount of $110 million. The filing included a ROE of 9.06%. An MPUC decision is pending.
2021 RES Electric Rider — In November 2020, NSP-Minnesota filed the RES Rider. The requested amount of $189 million includes a true-up (2019 and 2020 riders) of $96 million and the 2021 requested amount of $93 million. The filing included a ROE of 9.06%. An MPUC decision is pending.
2022 GUIC Natural Gas Rider — In October 2021, NSP-Minnesota filed the GUIC Rider for an amount of $27 million based on a ROE of 9.04%. An MPUC decision is pending.
2021 GUIC Natural Gas Rider — In October 2020, NSP-Minnesota filed the GUIC Rider for an amount of $27 million based on a ROE of 9.04%. An MPUC decision is pending.
2022 TCR Electric Rider — In November 2021, NSP-Minnesota filed the TCR Rider for an amount of $105 million based on a ROE of 9.06%. An MPUC decision is pending.
2020 TCR Electric Rider — In November 2019, NSP-Minnesota filed the TCR Rider for an amount of $82 million based on a ROE of 9.06%, which was approved by the MPUC in December 2021.
FERC NOPR on ROE Incentive Adders — In April 2021, the FERC issued a NOPR proposing to limit collection of ROE incentive adders for RTO membership to the first three years after an entity begins participation in an RTO. If adopted as a final rule, NSP-Minnesota (as well as NSP-Wisconsin and SPS) would prospectively discontinue charging their current 50 basis point ROE incentive adders. Amounts related to a discontinuance of the adder would ultimately be offset by an increase in retail rates, subject to future rate cases.
Purchased Power Arrangements and Transmission Service Provider
NSP-Minnesota expects to use power plants, power purchases, CIP/DSM options, new generation facilities and expansion of power plants to meet its system capacity requirements.
Purchased Power — NSP-Minnesota has contracts to purchase power from other utilities and IPPs. Long-term purchased power contracts for dispatchable resources typically require a capacity and an energy charge.
NSP-Minnesota makes short-term purchases to meet system requirements, replace company owned generation, meet operating reserve obligations or obtain energy at a lower cost.
Purchased Transmission Services — NSP-Minnesota and NSP-Wisconsin have contracts with MISO and other regional transmission service providers to deliver power and energy to their customers.
Nuclear Power Operations
Nuclear power plant operations produce gaseous, liquid and solid radioactive wastes, which are covered by federal regulation. High-level radioactive wastes primarily include used nuclear fuel. Low-level waste consists primarily of demineralizer resins, paper, protective clothing, rags, tools and equipment contaminated through use.
NRC Regulation — The NRC regulates nuclear operations. Costs of complying with NRC requirements can affect both operating expenses and capital investments of the plants. NSP-Minnesota has obtained recovery of these compliance costs and expects to recover future compliance costs.
Low-Level Waste Disposal — Low level waste disposal from Monticello and PI is disposed at the Clive facility located in Utah and the Waste Control Specialists facility in Texas. NSP-Minnesota has storage capacity available on-site at PI and Monticello which would allow both plants to continue to operate until the end of their current licensed lives if off-site low-level waste disposal facilities become unavailable.
High-Level Radioactive Waste Disposal — The federal government has responsibility to permanently dispose domestic spent nuclear fuel and other high-level radioactive wastes. The Nuclear Waste Policy Act requires the DOE to implement a program for nuclear high-level waste management. This includes the siting, licensing, construction and operation of a repository for spent nuclear fuel from civilian nuclear power reactors and other high-level radioactive wastes at a permanent federal storage or disposal facility. Currently, there are no definitive plans for a permanent federal storage facility site.
Nuclear Spent Fuel Storage — NSP-Minnesota has interim on-site storage for spent nuclear fuel at its current levelMonticello and PI nuclear generating plants. Authorized storage capacity is sufficient to allow NSP-Minnesota to operate until the end of the operating licenses in 2030 for Monticello, 2033 for PI Unit 1, and 2034 for PI Unit 2. Authorizations for additional spent fuel storage capacity may be required at each site to support either continued operation or decommissioning if the federal government does not commence storage operations.
Monticello CON — In September 2021, NSP-Minnesota filed an application for a CON for additional spent fuel storage (existing independent spent fuel storage installation) at the Monticello Nuclear Power Generating Plant. The CON requests sufficient additional spent fuel storage at the existing independent spent fuel storage installation to allow continued operation of the Monticello Plant until 2040. The filing passed completeness review and has been referred to an ALJ. A decision is expected in late 2023.
Wholesale and Commodity Marketing Operations
NSP-Minnesota conducts wholesale marketing operations, including the purchase and sale of electric capacity, energy, ancillary services and energy-related products. NSP-Minnesota uses physical and financial instruments to minimize commodity price and credit risk and to hedge sales and purchases.
NSP-Minnesota also engages in trading activity unrelated to hedging. Sharing of any margins is determined through state regulatory proceedings as well as the operation of the FERC approved joint operating agreement. NSP-Minnesota does not serve any wholesale requirements customers at cost-based regulated rates.
NSP-Wisconsin
Summary of Regulatory Agencies / RTO and Areas of Jurisdiction
| | | | | | | | |
| Regulatory Body / RTO | | Additional Information |
| PSCW | | Retail rates, services and other aspects of electric and natural gas operations. Certifies the need for new generating plants and electric transmission lines before the facilities may be sited and built. The PSCW has a biennial base rate filing requirement. By June of each odd numbered year, NSP-Wisconsin must submit a rate filing for the test year beginning the following January. Pipeline safety compliance. |
| MPSC | | Retail rates, services and other aspects of electric and natural gas operations. Certifies the need for new generating plants and electric transmission lines before the facilities may be sited and built. Pipeline safety compliance. |
| FERC | | Wholesale electric operations, hydroelectric generation licensing, accounting practices, wholesale sales for resale, transmission of electricity in interstate commerce, compliance with NERC electric reliability standards, asset transactions and mergers and natural gas transactions in interstate commerce. |
| MISO | | NSP-Wisconsin is a transmission owning member of the MISO RTO that operates within the MISO RTO and wholesale energy market. NSP-Wisconsin and NSP-Minnesota are jointly authorized by the FERC to make wholesale electric sales at market-based prices. |
| DOT | | Pipeline safety compliance. |
Recovery Mechanisms
| | | | | | | | |
| Mechanism | | Additional Information |
| Annual Fuel Cost Plan | | NSP-Wisconsin does not have an automatic electric fuel adjustment clause. Under Wisconsin rules, utilities submit a forward-looking annual fuel cost plan to the PSCW. Once the PSCW approves the plan, utilities defer the amount of any fuel cost under-recovery or over-recovery in excess of a 2% annual tolerance band, for future rate recovery or refund. Approval of a fuel cost plan and any rate adjustment for refund or recovery of deferred costs is determined by the PSCW. Rate recovery of deferred fuel cost is subject to an earnings test based on the most recently authorized ROE. Under-collections that exceed the 2% annual tolerance band may not be recovered if the utility earnings for that year exceed the authorized ROE. |
| Power Supply Cost Recovery Factors | | NSP-Wisconsin’s retail electric rate schedules for Michigan customers include power supply cost recovery factors, based on 12-month projections. After each 12-month period, a reconciliation is submitted whereby over-recoveries are refunded and any under-recoveries are collected from customers. |
| Wisconsin Energy Efficiency Program | | The primary energy efficiency program is funded by the utilities, but operated by independent contractors subject to oversight by the PSCW and utilities. NSP-Wisconsin recovers these costs from customers. |
| Purchased Gas Adjustment | | A retail cost-recovery mechanism to recover the actual cost of natural gas, transportation, and storage services. |
| Natural Gas Cost-Recovery Factor (MI) | | NSP-Wisconsin’s natural gas rates for Michigan customers include a natural gas cost-recovery factor, based on 12-month projections and trued-up to actual amounts on an annual basis. |
Pending and Recently Concluded Regulatory Proceedings
Wisconsin Electric and Natural Gas Settlement — In December 2021, the PSCW approved a rate case settlement agreement and 2022 fuel cost plan without modification. New rates and tariffs were effective Jan. 1, 2022. Key elements of the settlement:
•An increase in electric rates of $35 million (4.9%) for 2022 and an incremental $18 million increase (2.5%) for 2023.
•An increase in natural gas rates of $10 million (8.4%) for 2022 and an incremental $3 million (2.3%) for 2023.
•ROE of 9.80% for 2022 and 10.00% for 2023.
•Equity ratio of 52.5% for both 2022 and 2023.
•Returning $9 million in various net regulatory liabilities to offset customer impacts in 2023.
•Deferring certain pension and other post-employment benefit expense in 2021 through 2023.
•Incorporating an earnings sharing mechanism for 2022 and 2023.
Michigan Electric Rate Case —In January 2022, NSP-Wisconsin reached an electric rate case settlement in principle with the MPSC staff and others. The settlement grants NSP-Wisconsin an electric revenue increase of $1.6 million in 2022, based on a ROE of 9.7% and an equity ratio of 52.5%. The MPSC is expected to materially affect Xcel Energy’s pricesrule on the settlement in the first quarter of 2022.
Purchased Power and Transmission Services
The NSP System expects to use power plants, power purchases, conservation and DSM options, new generation facilities and expansion of power plants to meet its system capacity requirements.
Purchased Power — Through the Interchange Agreement, NSP-Wisconsin receives power purchased by NSP-Minnesota from other utilities and independent power producers. Long-term purchased power contracts for dispatchable resources typically require a capacity charge and an energy charge. NSP-Minnesota makes short-term purchases to meet system requirements, replace company owned generation, meet operating reserve obligations or returnsobtain energy at a lower cost.
Purchased Transmission Services— NSP-Minnesota and NSP-Wisconsin have contracts with MISO and other regional transmission service providers to shareholders. deliver power and energy to their customers.
Wholesale and Commodity Marketing Operations
NSP-Wisconsin does not serve any wholesale requirements customers at cost-based regulated rates.
PSCo
Summary of Regulatory Agencies / RTO and Areas of Jurisdiction
| | | | | | | | |
| Regulatory Body / RTO | | Additional Information on Regulatory Authority |
| CPUC | | Retail rates, accounts, services, issuance of securities and other aspects of electric, natural gas and steam operations. Pipeline safety compliance. |
| FERC | | Wholesale electric operations, accounting practices, hydroelectric licensing, wholesale sales for resale, transmission of electricity in interstate commerce, compliance with the NERC electric reliability standards, asset transactions and mergers and natural gas transactions in interstate commerce. Wholesale electric sales at cost-based prices to customers inside PSCo’s balancing authority area and at market-based prices to customers outside PSCo’s balancing authority area. PSCo holds a FERC certificate that allows it to transport natural gas in interstate commerce without PSCo becoming subject to full FERC jurisdiction. |
| RTO | | PSCo is not presently a member of an RTO and does not operate within an RTO energy market. However, PSCo does make certain sales to other RTO’s, including SPP and participates in a joint dispatch agreement with neighboring utilities. |
| DOT | | Pipeline safety compliance. |
| SPP Western Energy Imbalance Service Market | | Balances generation and load regionally and in real time for participants in the Western Interconnection |
Recovery Mechanisms
| | | | | | | | |
| Mechanism | | Additional Information |
| ECA | | Recovers fuel and purchased energy costs. Short-term sales margins are shared with customers. The ECA is revised quarterly. |
| Purchased Capacity Cost Adjustment | | Recovers purchased capacity payments. |
| Steam Cost Adjustment | | Recovers fuel costs to operate the steam system. The Steam Cost Adjustment rate is revised quarterly. |
| DSM Cost Adjustment | | Recovers electric and gas DSM, interruptible service costs and performance initiatives for achieving energy savings goals. |
| RES Adjustment | | Recovers the incremental costs of compliance with the RES with a maximum of 1% of the customer’s bill. |
| Colorado Energy Plan Adjustment | | Recovers the early retirement costs of Comanche units 1 and 2 to a maximum of 1% of the customer’s bill. |
| Wind Cost Adjustment | | Recovers costs for customers who choose renewable resources. |
| Transmission Cost Adjustment | | Recovers costs for transmission investment between rate cases. |
| Clean Air Clean Jobs Act | | Recovers costs associated with the Clean Air Clean Jobs Act. |
| FCA | | PSCo recovers fuel and purchased energy costs from wholesale electric customers through a fuel cost adjustment clause approved by the FERC. Wholesale customers pay production costs through a forecasted formula rate subject to true-up. |
| GCA | | Recovers costs of purchased natural gas and transportation and is revised quarterly to allow for changes in natural gas rates. |
| PSIA | | Recovers costs for transmission and distribution pipeline integrity management programs. |
| Decoupling | | Mechanism to true-up revenue to a baseline amount for residential (excluding lighting and demand) and metered non-demand small C&I classes. |
| Transportation Electrification Plan | | Recovers costs associated with the investment in and adoption of transportation electrification infrastructure. |
Pending and Recently Concluded Regulatory Proceedings
Colorado Natural Gas Rate Case —In January 2022, PSCo filed a request with the CPUC seeking a net increase to retail natural gas rates of $107 million. The total change to base rates is $215 million, reflecting the transfer of $108 million previously recovered from customers through the PSIA rider, which was closed to new investments at the end of 2021. The request is based on a 10.25% ROE, an equity ratio of 55.66% and a 2022 current test year. PSCo has requested a proposed effective date of Nov. 1, 2022.
Additionally, PSCo’s request includes step revenue increases of $40 million in 2023 (effective Nov. 1, 2023) and $41 million in 2024 (effective Nov. 1, 2024) related to continued capital investment. Under this proposal, PSCo would not request another base rate change prior to Nov. 1, 2025. An informational historical test year, including a 10.75% ROE, was also filed as required by the CPUC.
| | | | | | | | |
| Revenue Request (millions of dollars) | | 2022 |
| Changes since 2020 rate case: | | |
Plant related investments (a) | | $ | 210 | |
| Operations and maintenance, amortization and other expenses | | 11 | |
| Property tax expense | | 11 | |
| Sales growth | | (17) | |
| Net increase to revenue | | 215 | |
| Previously authorized costs: | | |
| Transfer of costs previously recovered through the PSIA rider | | (108) | |
| Total base revenue request | | $ | 107 | |
| | |
| Projected 2022 year-end rate base (billions of dollars) | | $ | 3.6 | |
(a) Includes approximately $28 million as a result of the increase in ROE from 9.2% to 10.25%.
Colorado Electric Rate Request— In July 2021, PSCo filed a request with the CPUC seeking a net electric rate increase of $343 million (or 12.4%). The total request reflects a $470 million increase, which includes $127 million of previously authorized costs currently recovered through various rider mechanisms. The request is based on a 10.0% ROE, an equity ratio of 55.64%, a 2022 forecast test year, a rate base of $10.3 billion and impacts of a new depreciation study.
In January 2022, PSCo reached an unopposed comprehensive settlement. The CPUC is expected to rule on the settlement in March 2022 with final rates expected to be effective in April 2022. Key settlement terms include:
•A net electric rate increase of $177 million. The total change in base rates is $299 million, which includes $122 million of revenue previously collected through various rider mechanisms.
•A ROE of 9.3% and an equity ratio of 55.69%.
•A current 2021 test year (average rate base) with the transfer of Cheyenne Ridge, Wildfire Mitigation Plan and Advanced Grid Intelligence and Security investments at year-end rate base.
•Approval of all of PSCo’s proposed depreciation adjustments.
•Continuation of the property tax, qualified pension, and non-qualified pension trackers.
•Continuation of Advanced Grid Intelligence and Security deferral including interest equivalent to PSCo's weighted average cost of capital once the balance exceeds $50 million.
•Continuation of the Wildfire Mitigation Plan deferral, with a debt return.
PSIA Rider Extension — In October 2021, the CPUC approved a settlement agreement to allow the rider to end on Dec. 31, 2021, transfer the investments recovered under the rider to base rates Jan. 1, 2022, and defer $9 million of depreciation expense and return on $143 million in project costs in 2022.
Pathway Transmission Expansion Settlement— In November 2021, PSCo filed a non-unanimous settlement agreement with Staff and several other parties regarding its CPCN request for the Pathway Transmission project.
Key settlement terms include:
•The parties agreed that PSCo met the burden of proof demonstrating that the project was needed to facilitate the renewables in the Integrated Resource Plan and is in the public interest.
•Agreed to a cost estimate of $1.7 billion and recovery through the transmission rider.
•The Pathway project will also include a Performance Incentive Mechanism such that applicable costs in a given year above or below a 5% dead band would allow for a ROE penalty or adder.
•Parties agreed to conditional CPCN approval for 345 kV extension project subject to the project being included in the final approved Integrated Resource Plan with a cost estimate of $247 million.
The settlement agreement is currently being deliberated by the CPUC.
Resource Plan Settlement— In November 2021, PSCo and intervenors filed a partial settlement of the resource plan, which will result in an expected 87% carbon reduction and an 80% renewable mix by 2030. A CPUC decision is expected in the first quarter of 2022. Key settlement terms include:
•Early retirement of Hayden: Unit 2 in 2027 (was 2036); and Unit 1 in 2028 (was 2030).
•Conversion of Pawnee to burn natural gas by 2026.
•Early retirement of Comanche 3 in 2034 with reduced operations beginning in 2025.
•Addition of ~2,300 MW of wind.
•Addition of ~1,600 MW of utility-scale solar.
•Addition of 400 MW of storage.
•Addition of 1,300 MW of flexible, dispatchable generation.
•Addition of ~1,200 MW of distributed solar resources through our renewable energy programs.
Partial Settlement — In October 2021, PSCo filed a comprehensive settlement with the CPUC Staff and the COEO, which proposed to address four outstanding regulatory items, including recovery of fuel costs related to Winter Storm Uri, disputed revenue associated with the 2020 electric decoupling pilot program year, replacement power costs associated with an extended outage at Comanche Unit 3 during 2020 and deferred customer bad debt balances associated with COVID-19. The Utility Consumer Advocate has not signed the settlement. A hearing and a CPUC decision on the settlement is expected in the first quarter of 2022.
Key terms of the proposed settlement:
•PSCo would fully recover Winter Storm Uri deferred net natural gas, fuel and purchased energy costs of $263 million (electric utility) and $287 million (natural gas utility) over a 24-month and 30-month period, respectively, with no carrying charges through a rider mechanism. Recovery would commence Jan. 1, 2022 for electric costs and April 1, 2022 for natural gas costs.
•PSCo will refund electric customers $41 million (previously deferred) related to the 2020 electric decoupling pilot program.
•PSCo agreed to forego recovery of $14 million for replacement power costs due to an extended outage at Comanche Unit 3 during 2020 (approved by the CPUC in February 2022 as part of the 2020 ECA settlement agreement).
•PSCo also agreed to not seek recovery of COVID-19 related bad debt expense, previously deferred as a regulatory asset, and recorded an additional $11 million of incremental bad debt expense for the period ended Dec. 31, 2021.
Decoupling Filing— PSCo's 2019 Electric Rate Case included a decoupling program, effective April 1, 2020 through Dec. 31, 2023. The program applies to Residential and metered small C&I customers who do not pay a demand charge. The program includes a refund and surcharge cap not to exceed 3% of forecasted base rate revenue for a specified period.
In April 2021, PSCo made its annual filing for 2020, and the revised tariff went into effect by operation of law on June 1, 2021. In the annual filing review, the CPUC indicated they may pursue reopening the case in order to revisit the cap. As of Dec. 31, 2021, PSCo has recognized a refund for Residential customers and a surcharge for C&I customers based on 2020 and 2021 results.
In October 2021, a settlement was reached on Winter Storm Uri costs and also addressed certain components of decoupling. See Partial Settlement disclosure above for further discussion.
Comanche Unit 3 — PSCo is part owner and operator of Comanche Unit 3, a 750 MW, coal-fueled electric generating unit. In January 2020, the unit experienced a turbine failure causing the unit to be taken offline for repairs, which were completed in June 2020. During start-up, the unit experienced a loss of turbine oil, which damaged the unit. Comanche Unit 3 recommenced operations in January 2021. Replacement and repair of damaged systems in excess of a $2 million deductible are expected to be recovered through insurance policies. PSCo incurred replacement power costs of approximately $16 million during the outage.
In October 2020, the CPUC initiated a review of Comanche Unit 3’s performance. In March 2021, the CPUC Staff issued a report, which noted higher-than average outages and included criticisms of PSCo’s operations of Comanche Unit 3 over the last ten years. The report recommended thorough explanation of the future of Comanche Unit 3 operations in the next resource plan, performance standards for all company-owned generation and a review of outage and repair costs in upcoming ECA proceedings.
In October 2021, a comprehensive settlement was reached, which addressed treatment of 2020 Comanche Unit 3 replacement power costs. See Partial Settlement disclosure above for further discussion.
2019 Electric Rate Case Appeal — In August 2020, PSCo filed an appeal with the Denver District Court seeking a review of CPUC decisions on gains and losses on sales of assets, oil and gas royalty revenues, Board of Directors equity compensation and a true-up surcharge to collect the difference between rates from February through August 2020 based onthe CPUC’s decision on the Company’s Application for Reconsideration, Rehearing or Reargument and rates that were actually in place. In January 2022, the Denver District Court issued its decision that the CPUC’s approach to gains and losses on certain sales of assets was legally erroneous and confiscatory to PSCo and set aside and remanded the issue for further consideration. The District Court affirmed the CPUC with respect to the remaining decisions.
GCA NOPR— In June 2021, the CPUC issued a NOPR addressing the recovery of costs through the GCA. The proposed rule would establish an annual forecast of GCA costs for each utility and allow each utility to recover only 90%-95% of any costs in excess of the forecasted amount. The proposed rule would allow utilities to earn an incentive equal to an undefined portion of any savings relative to forecasted costs. Comments were filed and requested that the CPUC delay the rule making process until after the 2021 - 2022 heating season; in part because utilities have already proceeded with purchasing gas for the upcoming heating season in accordance with prior CPUC decisions. The CPUC has reopened the GCA NOPR matter and the parties will submit follow-up comments during the first quarter of 2022.
Purchased Power and Transmission Service Providers
PSCo expects to meet its system capacity requirements through electric generating stations, power purchases, new generation facilities, DSM options and expansion of generation plants.
Purchased Power — PSCo purchases power from other utilities and IPPs. Long-term purchased power contracts for dispatchable resources typically require capacity and energy charges. It also contracts to purchase power for both wind and solar resources. PSCo makes short-term purchases to meet system load and energy requirements, replace owned generation, meet operating reserve obligations, or obtain energy at a lower cost.
Energy Markets — PSCo plans to join the SPP Western Energy Imbalance Service Market in April 2023. This market is an incremental step in the participation in the organized wholesale market. Energy imbalance markets allow participants to buy and sell power close to the time electricity is consumed and gives system operators real-time visibility across neighboring grids. The result improves balancing supply and demand at a lower cost.
Purchased Transmission Services — In addition to using its own transmission system, PSCo has contracts with regional transmission service providers to deliver energy to its customers.
Wholesale and Commodity Marketing Operations
PSCo conducts various wholesale marketing operations, including the purchase and sale of electric capacity, energy, ancillary services and energy related products. PSCo uses physical and financial instruments to minimize commodity price and credit risk and hedge sales and purchases. PSCo also engages in trading activity unrelated to hedging. Sharing of any margin is determined through state regulatory proceedings as well as the operation of the FERC approved joint operating agreement.
SPS
Summary of Regulatory Agencies / RTO and Areas of Jurisdiction
| | | | | | | | |
| Regulatory Body / RTO | | Additional Information |
| PUCT | | Retail electric operations, rates, services, construction of transmission or generation and other aspects of SPS’ electric operations. The municipalities in which SPS operates in Texas have original jurisdiction over rates in those communities. The municipalities’ rate setting decisions are subject to PUCT review. |
| NMPRC | | Retail electric operations, retail rates and services and the construction of transmission or generation. |
| FERC | | Wholesale electric operations, accounting practices, wholesale sales for resale, the transmission of electricity in interstate commerce, compliance with NERC electric reliability standards, asset transactions and mergers, and natural gas transactions in interstate commerce. |
| SPP RTO and SPP Integrated and Wholesale Markets | | SPS is a transmission owning member of the SPP RTO and operates within the SPP RTO and SPP integrated and wholesale markets. SPS is authorized to make wholesale electric sales at market-based prices. |
Recovery Mechanisms
| | | | | | | | |
| Mechanism | | Additional Information |
| Distribution Cost Recovery Factor | | Recovers distribution costs not included in rates in Texas. |
| Energy Efficiency Cost Recovery Factor | | Recovers costs for energy efficiency programs in Texas. |
| Energy Efficiency Rider | | Recovers costs for energy efficiency programs in New Mexico. |
| Fuel and Purchased Power Cost Adjustment Clause | | Adjusts monthly to recover actual fuel and purchased power costs in New Mexico. |
| Power Cost Recovery Factor | | Allows recovery of purchased power costs not included in Texas rates. |
| Renewable Portfolio Standards | | Recovers deferred costs for renewable energy programs in New Mexico. |
| TCR Factor | | Recovers certain transmission infrastructure improvement costs and changes in wholesale transmission charges not included in Texas base rates. |
| Fixed Fuel and Purchased Recovery Factor | | Provides for the over- or under-recovery of energy expenses in Texas. Regulations require refunding or surcharging over- or under- recovery amounts, including interest, when they exceed 4% of the utility’s annual fuel and purchased energy costs on a rolling 12-month basis if this condition is expected to continue. |
| Wholesale Fuel and Purchased Energy Cost Adjustment | | SPS recovers fuel and purchased energy costs from its wholesale customers through a monthly wholesale fuel and purchased energy cost adjustment clause accepted by the FERC. Wholesale customers also pay the jurisdictional allocation of production costs. |
Pending and Recently Concluded Regulatory Proceedings
2021 New Mexico Electric Rate Case — In January 2021, SPS filed an electric rate case with the NMPRC with a current requested base rate increase of approximately $84 million.
In June 2021, SPS and various parties filed an uncontested stipulation with the NMPRC, which reflected a $62 million rate increase, a change in the depreciation life of the Tolk coal plant to 2032, an equity ratio of 54.72% and ROE of 9.35% for reconciliation statements and determining the revenue requirements for the Sagamore and Hale wind projects. In December 2021, the Hearing Examiner issued a recommendation that the NMPRC approve the rate case settlement agreement without modification.
On Feb. 2, 2022, the NMPRC voted 3-2 to reject the uncontested stipulation as filed. The NMPRC then approved a modified settlement, which would maintain the proposed revenue requirement increase of $62 million, but would adjust the class cost allocation such that all rate classes would have a uniform increase of 4.89%. The NMPRC required the parties to either file their acceptance or opposition to the modified settlement.
On Feb. 9, 2022, the signatories informed the NMPRC they did not unanimously support the modifications. Accordingly, the Hearing Examiner will issue a procedural order for further proceedings on SPS’ originally filed application.
On Feb. 10, 2022, SPS filed a motion requesting the NMPRC either approve the original settlement or approve the modified settlement.
On Feb. 16, 2022, the NMPRC voted to reconsider its order and voted 3-2 to approve the stipulation without modification. New rates will go into effect on Feb. 26, 2022.
2021 Texas Rate Case — In February 2021, SPS filed an electric rate case with the PUCT and its municipalities, seeking an increase in base rates of approximately $140 million. SPS’ proposed net rate increase to Texas customers was approximately $71 million, or 9.2%, as a result of the offsetting $69 million in fuel cost reductions and PTCs from the Sagamore wind project.
The request was based on a ROE of 10.35%, an equity ratio of 54.60%, a rate base of approximately $3.3 billion and a historic test year based on the 12-month period ended Dec. 31, 2020. The request included the effect of losing approximately 400 MW from a wholesale transmission customer and changes to depreciation lives of SPS’ Tolk power plant (from 2037 to 2032) and coal handling assets at the Harrington facility (to 2024).
In January 2022, SPS and intervenors filed a blackbox settlement. Key terms include:
•A base rate increase of approximately $89 million effective back to March 15, 2021.
•A 9.35% ROE and 7.01% weighted average cost of capital for AFUDC purposes only.
•The depreciation lives for Tolk moved up to 2034 and Harrington coal assets moved up to 2024.
In February 2022, the ALJ issued an order approving interim rates to be effective on March 1, 2022. A PUCT decision is expected in the first quarter of 2022.
Purchased Power Arrangements and Transmission Service Providers
SPS expects to use electric generating stations, power purchases, DSM and new generation options to meet its system capacity requirements.
Purchased Power — SPS purchases power from other utilities and IPPs. Long-term purchased power contracts typically require periodic capacity and energy charges. SPS also makes short-term purchases to meet system load and energy requirements to replace owned generation, meet operating reserve obligations or obtain energy at a lower cost.
Purchased Transmission Services — SPS has contractual arrangements with SPP and regional transmission service providers to deliver power and energy to its native load customers.
Natural Gas
SPS does not provide retail natural gas service, but purchases and transports natural gas for its generation facilities and operates limited natural gas pipeline facilities connecting the generation facilities to interstate natural gas pipelines. SPS is subject to the jurisdiction of the FERC with respect to natural gas transactions in interstate commerce and the PHMSA and PUCT for pipeline safety compliance.
Wholesale and Commodity Marketing Operations
SPS conducts various wholesale marketing operations, including the purchase and sale of electric capacity, energy, ancillary services and energy related products. SPS uses physical and financial instruments to minimize commodity price and credit risk and to hedge sales and purchases.
| | |
| Other Public Utility Matters |
Comanche Unit 3 Outage
In January 2022, PSCo experienced an incident at the Comanche Unit 3 plant (750 MW, coal-fueled electric generating unit) resulting in damage and an outage that is expected to last approximately two months.PSCo has notified the CPUC and informed them that it will not seek recovery of any replacement power costs above the expected costs if Comanche 3 had been in service. The estimated incremental replacement power costs could be approximately $10 million, assuming a two month outage, normal weather and current market pricing.
Marshall Wildfire
In December 2021, a wildfire ignited in Boulder County, Colorado (the “Marshall Fire”), which burned over 6,000 acres and destroyed or damaged over 1,000 structures. While there were no downed power lines in the ignition area, the determination of the cause of the Marshall Fire is pending.
In Colorado, the standard of review governing liability differs from the “inverse condemnation” or strict liability standard utilized in California. In Colorado, courts look to whether electric power companies have operated their system with a heightened duty of care consistent with the practical conduct of its business, and liability does not extend to occurrences that cannot be reasonably anticipated. In addition, PSCo has been operating under a commission approved wildfire mitigation plan and carries wildfire liability insurance.
However, potential future inflationin the unlikely event we were found liable, the damages awarded could result from economicexceed our coverage and negatively impact our results of operations, financial conditions or cash flows.
Winter Storm Uri
In February 2021, the economicUnited States experienced Winter Storm Uri. Extreme cold temperatures impacted certain operational assets as well as the availability of renewable generation. The cold weather also affected the country’s supply and monetary policiesdemand for natural gas. These factors contributed to extremely high market prices for natural gas and electricity. As a result of the U.S. Governmentextremely high market prices, Xcel Energy incurred net natural gas, fuel and purchased energy costs of approximately $1 billion (largely deferred as regulatory assets).
Regulatory Overview —Xcel Energy has natural gas, fuel and purchased energy mechanisms in each jurisdiction for recovering incurred costs. However, the Federal Reserve. This could lead to future priceutility subsidiaries have deferred February 2021 cost increases for materialsfuture recovery and services required to deliver electric and natural gas services to customers. These potentialsought recovery of the cost increases couldover a period of up to 63 months to mitigate the impact to customer bills. Additionally, we did not request recovery of financing costs in turn leadorder to increased pricesfurther limit the impact to our customers. Likewise, lower oil and natural gas prices could lead to sustained deflation,
Proceedings initiated:
| | | | | | | | |
| Utility Subsidiary | Jurisdiction | Regulatory Status |
| NSP-Minnesota | Minnesota | NSP-Minnesota filed with the MPUC seeking recovery of $215 million in incremental costs from natural gas customers. In August 2021, the MPUC allowed recovery of $179 million of costs deemed to be extraordinary beginning in September 2021 over 27 months (no financing charge) and $36 million of ordinary costs over 12 months through the monthly Purchased Gas Adjustment. The $179 million in extraordinary cost recovery is subject to refund pending the outcome of a contested case before an ALJ.
In December 2021, the MPUC approved extending recovery of Winter Storm Uri costs for the residential class (approximately $97 million) from a 27-month recovery period to a 63-month recovery period. New residential Winter Storm Uri rates were effective Jan. 1, 2022.
In December 2021, direct testimony was received from intervenors. The DOC recommended a $127 million disallowance based on allegations including peaking plant usage, load forecasting, natural gas supply/storage and related purchases. Alternatively, the DOC recommended a $42 million disallowance if NSP-Minnesota proves it prudently managed its peaking plants. The OAG recommended a disallowance of $179 million based on allegations that NSP-Minnesota could have fully hedged its exposure to spot market prices. Alternatively, the OAG recommended a $25 million disallowance based on allegations related to specific hedges allegedly available in the market during February 2021. The CUB recommended a $69 million disallowance based on allegations related to the unavailability of NSP-Minnesota’s peaking plants, inaccuracy of load forecasting and inadequate curtailment of interruptible customers.
Xcel Energy strongly disagrees with the recommendations of the DOC, OAG and CUB and believes that it acted prudently and according to MPUC approved procedures for the best interest of its customers and stakeholders. NSP-Minnesota filed rebuttal testimony in January 2022. A hearing before the ALJs assigned to the matter is scheduled for Feb. 17-23, 2022. An MPUC decision is expected in the summer of 2022.
See Rate Matters and Other within Note 12 to the consolidated financial statements for further information. |
| South Dakota | Winter Storm Uri had no impact on South Dakota electric costs as NSP-Minnesota was a net seller in the electric market. |
| North Dakota | In June, the NDPSC approved recovery of $32 million in natural gas costs over 15 months (starting July 2021) with no financing charge. |
| NSP-Wisconsin | Wisconsin | In March, the PSCW approved NSP-Wisconsin’s proposal to recover $45 million of Winter Storm Uri natural gas costs over nine months through December 2021 with no financing charge. |
| Michigan | In May, the MPSC approved recovery of $2 million in natural gas costs over 10 months with no financing charge. |
| PSCo | Colorado | In May, PSCo filed a request with the CPUC to recover $263 million in weather-related electric costs, $287 million in incremental natural gas costs and $4 million in incremental steam costs over 24 months with no financing charge.
In September, intervenors filed testimony. The CPUC Staff recommended disallowances of approximately $99 million (electric) and $105 million (natural gas). Additionally, they proposed to net approximately $50 million of regulatory liabilities (decoupling related) from electric costs. The Utility Consumer Advocate recommended disallowances of approximately $131 million. The COEO recommended disallowances of approximately $46 million for not utilizing demand response programs during the event.
In October, a partial settlement was reached with the CPUC Staff and the COEO, allowing full recovery of Winter Storm Uri deferred net natural gas, fuel and purchased energy costs of $263 million (electric utility) and $287 million (natural gas utility) over a 24-month and 30-month period, respectively, with no carrying charges through a rider mechanism.
A decision is expected in the first quarter of 2022. In addition, the CPUC is considering prospective changes in fuel cost recovery. |
| SPS | Texas | As part of the Texas fuel surcharge filing, SPS filed for recovery of $76 million, over 24 months, in under-collected purchased power and fuel costs through March 2021, subject to revision due to re-settlements. Of this amount, $62 million was attributed to Winter Storm Uri.
In the third quarter, SPS filed a supplemental application and testimony to recover an additional $26 million in under-collected purchased power and fuel costs through June 2021 resulting primarily from SPP resettlements and continued increases in natural gas prices.
In November 2021, the ALJ abated the hearing schedule to allow the parties to continue settlement negotiations.
In December 2021, SPS filed its triennial Fuel Reconciliation, under which the PUCT will consider prudence of SPS’ fuel costs for the period July 2018 - June 2021, including Winter Storm Uri.
In January 2022, SPS and other parties filed a stipulation/motion for interim rates. The filing covers all fuel under-collections occurring between January 2020 and August 2021, totaling $121 million. The settlement does not address the prudence of Winter Storm Uri costs nor the retention of $11 million related to market sales during the event. These items will be reviewed through the triennial Fuel Reconciliation proceeding and are subject to a final PUCT decision. Interim rates, designed to collect up to $110 million over a period of 30 months, will begin on Feb. 1, 2022. |
| New Mexico | In March 2021, the NMPRC approved SPS' request to recover $26 million of fuel costs over 24 months with no financing charge, subject to NMPRC review. |
The U.S. Congress is currently discussing potential proposals that could also reduce general economic activity althoughmay impact federal tax law. At this time, it is unknown what, if any, changes may lead to lower electric and natural gas prices to customers. Additionally, under statute, federal agencies suchultimately occur. Based on provisions passed by the U.S. House of Representatives in November 2021, known as the FERC now can adjust statutory penalties for inflation.Build Back Better Act, if any of such provisions were to be enacted into law, we would not expect the impact of such changes to have a material impact on our earnings.
CRITICAL ACCOUNTING POLICIES AND ESTIMATES
| | |
| Critical Accounting Policies and Estimates |
Preparation of the consolidated financial statements and related disclosures in compliance with GAAP requires the application of accounting rules and guidance, as well as the use of estimates. The applicationApplication of these policies involves judgments regarding future events, including the likelihood of success of particular projects, legal and regulatory challenges and anticipated recovery of costs. These judgments could materially impact the consolidated financial statements, and disclosures, based on varying assumptions. In addition, the financial and operating environment also may have a significant effect on the operation of the business and on the results reported. The following is a list of accounting
Accounting policies and estimates that are most significant to the portrayal of Xcel Energy’s results of operations, financial condition and results,or cash flows, and require management’s most difficult, subjective or complex judgments.judgments are outlined below. Each of these has a higher likelihood of resulting in materially different reported amounts under different conditions or using different assumptions. Each critical accounting policy has been reviewed and discussed with the Audit Committee of Xcel Energy Inc.’s Board of Directors on a quarterly basis.
Regulatory Accounting
Xcel Energy Inc. is a holding company with rate-regulated subsidiaries that are subject to the accounting for Regulated Operations, which provides that rate-regulated entities report assets and liabilities consistent with the recovery of those incurred costs in rates, if the competitive environment makes it is probable that such rates will be charged and collected. Xcel Energy’sOur rates are derived through the ratemaking process, which results in the recording of regulatory assets and liabilities based on the probability of future cash flows.
Regulatory assets generally represent incurred or accrued costs that have been deferred because future recovery from customers is probable. Regulatory liabilities generally represent amounts that are expected to be refunded to customers in future rates or amounts collected in current rates for future costs. In other businesses or industries, regulatory assets and regulatory liabilities would generally be charged to net income or OCI.
other comprehensive income.
Each reporting period Xcel Energy assesseswe assess the probability of future recoveries and obligations associated with regulatory assets and liabilities. Factors such as the current regulatory environment, recently issued rate orders and historical precedents are considered. Decisions made by regulatory agencies can directly impact the amount and timing of cost recovery as well as the rate of return on invested capital, and may materially impact Xcel Energy’sour results of operations, financial condition or cash flows.
As of Dec. 31, 20172021 and 2016,2020, Xcel Energy has recordedhad regulatory assets of $3.8 billion and $3.4 billion, for both periods,respectively and regulatory liabilities of $5.3$5.7 billion and $1.6$5.6 billion, respectively. Each subsidiary is subject to regulation that varies from jurisdiction to jurisdiction. If future recovery of costs in any such jurisdiction ceases to beis no longer probable, Xcel Energy would be required to charge these assets to current net income or OCI. Inother comprehensive income.
At Dec. 31, 2021, in assessing the probability of recovery of recognized regulatory assets, unless otherwise disclosed, Xcel Energy noted no current or anticipated proposals or changes in the regulatory environment that it expects will materially impact the probability of recovery of the assets.
See Note 15 to the consolidated financial statements for further discussion of regulatory assetsNotes 4 and liabilities and Note 12 to the consolidated financial statements for further discussion of rate matters.information.
Income Tax Accruals
Judgment, uncertainty and estimates are a significant aspect of the income tax accrual process that accounts for the effects of current and deferred income taxes. Uncertainty associated with the application of tax statutes and regulations and the outcomes of tax audits and appeals require that judgment and estimates be made in the accrual process and in the calculation of the ETR.
Changes in tax laws and rates may affect recorded deferred tax assets and liabilities and our future ETR. The TCJA reduced the federal income tax rate from 35 percent to 21 percent, significantly impacting the recorded amounts of deferred tax assets and liabilities and reducing the ETR applicable to future periods. See Item 7. Management’s Discussion and Analysis of Financial Condition and Results of Operations - Tax Reform and Notes 6 and 12 to the consolidated financial statements for further discussion.
ETRs are highly impacted by assumptions. ETR calculations are revised every quarter based on best available year-end tax assumptions, (income levels, deductions, credits, etc.); adjusted in the following year after returns are filed, with the taxfiled. Tax accrual estimates beingare trued-up to the actual amounts claimed on the tax returns;returns and further adjusted after examinations by taxing authorities, have been completed.
as needed.
In accordance with the interim period reporting guidance, income tax expense for the first three quarters in a year is based on the forecasted annual ETR. The forecasted ETR reflects a number of estimates, including forecasted annual income, permanent tax adjustments and tax credits.
Valuation allowances are applied to deferred tax assets if it is more likely than not that at least a portion may not be realized based on an evaluation of expected future taxable income.
Accounting for income taxes also requires that only tax benefits that meet the more likely than not recognition threshold can be recognized or continue to be recognized. The change in the unrecognized tax benefits needs to be reasonably estimated based on evaluation of the nature of uncertainty, the nature of event that could cause the change and an estimated range of reasonably possible changes.
Management will use prudent business judgment to derecognize appropriate amounts of tax benefits at any period end, and as new developments occur. Unrecognized tax benefits can be recognized as issues are favorably resolved and loss exposures decline. We may adjust our unrecognized tax benefits and interest accruals to the updated estimates as disputes with the IRS and state tax authorities are resolved.resolved, and as new developments occur. These adjustments may increase or decrease earnings.
See Note 67 to the consolidated financial statements for further discussion.information.
Employee Benefits
Xcel Energy’sWe sponsor several noncontributory, defined benefit pension plans and other postretirement benefit plans that cover almost all employees and certain retirees. Projected benefit costs are based on anhistorical information and actuarial calculationcalculations that includes a number ofinclude key assumptions most notably the annual(annual return level thaton pension and postretirement health care investment assets, are expected to earn in the futurediscount rates, mortality rates and the interest rate used to discount future pension benefit payments to a present value obligation.health care cost trend rates, etc.). In addition, the pension cost calculation uses an asset-smoothinga methodology to reduce the volatility of varying investment performance over time. See Note 9 to the consolidated financial statements for further discussion onPension assumptions are continually reviewed.
At Dec. 31, 2021, Xcel Energy set the rate of return on assets used to measure pension costs at 6.49%, which is consistent with the rate set in 2020. The rate of return used to measure postretirement health care costs is 4.10% at Dec. 31, 2021, which is consistent with the rate set in 2020.
Xcel Energy’s pension investment strategy is based on plan-specific investments that seek to minimize investment and interest rate risk as a plan’s funded status increases over time. This strategy results in a greater percentage of interest rate sensitive securities being allocated to plans with higher funded status ratios and a greater percentage of growth assets being allocated to plans having lower funded status ratios.
Xcel Energy set the discount rates used to value the pension obligations at 3.08% and postretirement health care obligations at 3.09% at Dec. 31, 2021. This represents a 37 basis point and 44 basis point decrease, respectively, from 2020. Xcel Energy uses a bond matching study as its primary basis for determining the discount rate used to value pension and postretirement health care obligations. The bond matching study utilizes a portfolio of high grade (Aa or higher) bonds that matches the expected cash flows of Xcel Energy’s benefit plans in amount and duration.
The effective yield on this cash flow matched bond portfolio determines the discount rate for the individual plans. The bond matching study is validated for reasonableness against the Merrill Lynch Corporate 15+ Bond Index. In addition, Xcel Energy reviews general actuarial survey data to assess the reasonableness of the discount rate selected.
If Xcel Energy were to use alternative assumptions, a 1% change would result in the calculationfollowing impact on 2021 pension costs:
| | | | | | | | | | | | | | |
| | Pension Costs |
| (Millions of Dollars) | | +1% | | -1% |
| Rate of return | | $ | (13) | | | $ | 23 | |
Discount rate (a) | | $ | 1 | | | $ | 15 | |
(a)These costs include the effects of regulation.
Mortality rates are developed from actual and projected plan experience for pension costsplan and obligations.postretirement benefits. Xcel Energy’s actuary conducts an experience study periodically to determine an estimate of mortality. Xcel Energy considers standard mortality tables, improvement factors and the plans actual experience when selecting a best estimate.
As of Dec. 31, 2021, the initial medical trend cost claim assumptions for Pre-65 was 5.3% and Post-65 was 4.9%. The ultimate trend assumption remained at 4.5% for both Pre-65 and Post-65 claims costs. Xcel Energy bases its medical trend assumption on the long-term cost inflation expected in the health care market, considering the levels projected and recommended by industry experts, as well as recent actual medical cost experienced by Xcel Energy’s retiree medical plan.
Pension costsFunding contributions in 2021 were $131 million and are expected to decrease in 2018 and continue to decline in the following few years. Funding requirements in 2018 are expected to be consistent with 2017 and continue at that level in the following years. While investmentInvestment returns were below theexceeded assumed levels in 20152021, 2020 and 2016, investment returns exceeded the assumed levels in 2017. 2019.
The pension cost calculation uses a market-related valuation of pension assets. Xcel Energy uses a calculated value method to determine the market-related value of the plan assets. The market-related value is determined by adjusting the fair market value of assets at the beginning of the year to reflect the investment gains and losses (the difference between the actual investment return and the expected investment return on the market-related value) during each of the previous five years at the rate of 20 percent20% per year. As these differences between the actual investment returns and the expected investment returns are incorporated into the market-related value, the differencesamounts are recognized in pension cost over the expected average remaining years of service for active employees which was approximately 12(approximately 13 years in 2017.2021).
Based on current assumptions and the recognition of past investment gains and losses, Xcel Energy currently projects the pension costs recognized for financial reporting purposes will be $119$77 million in 20182022 and $105$60 million in 2019,2023, while the actual pension costs were $139$121 million in 20172021 and $122$117 million in 2016.2020. The expected decrease in 20182022 and future year costs is primarily due primarily to the reductions in loss amortizations, plan design changes and an increase in expected return on assets due to planned future contributions and expected return of current assets. amortizations.
In 2014, the Society of Actuaries published a new mortality table (RP-2014) that increased the overall life expectancy of males and females. In 2014, Xcel Energy adopted this mortality table, with modifications, based on its population and specific experience. During 2017, a new projection table was released (MP-2017). Xcel Energy evaluated the updated projection table and concluded that the methodology currently in use and adopted in 2016 is consistent with the recently updated 2017 table and continues to be representative of Xcel Energy’s population.
At Dec. 31, 2017, Xcel Energy set the rate of return on assets used to measure pension costs at 6.87 percent, which is consistent with the rate set at Dec. 31, 2016. The rate of return used to measure postretirement health care costs is 5.80 percent at Dec. 31, 2017 and this is consistent with Dec. 31, 2016. Xcel Energy’s ongoing pension investment strategy is based on plan-specific investments that seek to minimize potential investment and interest rate risk as a plan’s funded status increases over time. The investments result in a greater percentage of interest rate sensitive securities being allocated to specific plans having relatively higher funded status ratios and a greater percentage of growth assets being allocated to plans having relatively lower funded status ratios.
Xcel Energy set the discount rates used to value the Dec. 31, 2017 pension at 3.63 percent and postretirement health care obligations at 3.62 percent, which represents a 50 basis point and a 51 basis point decrease from Dec. 31, 2016, respectively. Xcel Energy uses a bond matching study as its primary basis for determining the discount rate used to value pension and postretirement health care obligations. The bond matching study utilizes a portfolio of high grade (Aa or higher) bonds that matches the expected cash flows of Xcel Energy’s benefit plans in amount and duration. The effective yield on this cash flow matched bond portfolio determines the discount rate for the individual plans. The bond matching study is validated for reasonableness against the Merrill Lynch Corporate 15+ Bond Index. At Dec. 31, 2017, this reference point supported the selected rate. In addition to this reference point, Xcel Energy also reviews general actuarial survey data to assess the reasonableness of the discount rate selected.
The following are the pensionPension funding contributions across all four of Xcel Energy’s pension plans, both voluntary and required, for 2015 through 2018:2019 - 2022:
•$50 million in January 2022.
•$131 million in 2021.
•$150 million in January 2018;2020.
•$162154 million in 2017;2019.
$125 million in 2016; and
$90 million in 2015.
For future years, we anticipate contributions will be made as necessary. These contributions are summarized in Note 9 to the consolidated financial statements. Future year amounts are estimates and may change based on actual market performance, changes in interest rates and any changes in governmental regulations. Therefore, additional contributions could be required in the future.
If Xcel Energy were to use alternative assumptions at Dec. 31, 2017, a one-percent change would result in the following impact on 2017 pension costs:
|
| | | | | | | | |
| | | Pension Costs |
| (Millions of Dollars) | | +1% | | -1% |
| Rate of return | | $ | (17 | ) | | $ | 18 |
|
Discount rate (a) | | (6 | ) | | 9 |
|
| |
(a)
| These costs include the effects of regulation. |
Beginning with the Dec. 31, 2017 measurement date, Xcel Energy separated its initial medical trend assumption for pre-Medicare (Pre-65) and post-Medicare (Post-65) claims costs, and assumed 7.0 percent and 5.5 percent, respectively. Xcel Energy separated the trends in order to reflect different short-term expectations based on recent experiences with Pre-65 and Post-65 claims cost increases for Xcel Energy’s retiree medical plan. The ultimate trend assumption remained at 4.5 percent for both Pre-65 and Post-65 claims costs as similar long-term trend rates are expected for both populations. The period from initial trend rate until the ultimate rate is reached is five years. Xcel Energy bases its medical trend assumption on the long-term cost inflation expected in the health care market, considering the levels projected and recommended by industry experts, as well as recent actual medical cost experienced by Xcel Energy’s retiree medical plan.
Xcel Energy contributed $20$15 million, $18$11 million and $18$15 million during 2017, 20162021, 2020 and 2015,2019, respectively, to the postretirement health care plans.
Xcel Energy expects to contribute approximately $12$9 million during 2018.
2022. Xcel Energy recovers employee benefits costs in its regulated utility operations consistent with accounting guidance with the exception of the areas noted below.
•NSP-Minnesota recognizes pension expense in all regulatory jurisdictions as calculated using the aggregate normal cost actuarial method. Differences between aggregate normal cost and expense as calculated by pension accounting standards are deferred as a regulatory liability.
•In 2017,2021, the PSCW approved NSP-Wisconsin’s request for deferred accounting treatment of the 20172021 pension settlement accounting expense. In addition, the Commission order approved escrow accounting treatment for pension and other post-employment benefit expenses.
•Regulatory Commissions in Colorado, Texas, New Mexico and FERC jurisdictions allow the recovery of other postretirement benefit costs only to the extent that recognized expense is matched by cash contributions to an irrevocable trust. Xcel Energy has consistently funded at a level to allow full recovery of costs in these jurisdictions.
•PSCo and SPS recognize pension expense in all regulatory jurisdictions based on expense consistent with accounting guidance.GAAP. The Texas and Colorado electric retail jurisdictions and the Colorado gas retail jurisdiction, each record the difference between annual recognized pension expense and the annual amount of pension expense approved in their last respective general rate case as a deferral to a regulatory asset.
•In 2018, PSCo was required to create a regulatory liability to adjust postretirement health care costs to zero in order to match the amounts collected in rates in the Colorado Gas retail jurisdiction. In 2020, this requirement was extended to the Colorado Electric retail jurisdiction.
See Note 911 to the consolidated financial statements for further discussion.information.
Nuclear Decommissioning
Xcel Energy recognizes liabilities for the expected cost of retiring tangible long-lived assets for which a legal obligation exists. These AROs are recognized at fair value as incurred and are capitalized as part of the cost of the related long-lived assets. In the absence of quoted market prices, Xcel Energy estimates the fair value of its AROs using present value techniques, in which it makes various assumptions including estimates of the amounts and timing of future cash flows associated with retirement activities, credit-adjusted risk free rates and cost escalation rates. When Xcel Energy revises any assumptions, used to estimate AROs, it adjusts the carrying amount of both the ARO liability and the related long-lived asset. Xcel Energy accretes ARO liabilities are accreted to reflect the passage of time using the interest method.
A significant portion of Xcel Energy’s AROs relates to the future decommissioning of NSP-Minnesota’s nuclear facilities. The total obligation for nuclear decommissioning obligation is expected to be funded by the external decommissioning trust fund. The differenceDifference between regulatory funding (including depreciation expense less returns from the external trust fund) and expense recognized under current accounting guidance is deferred as a regulatory asset. The amounts recorded for AROs related to future nuclear decommissioning were $1.874$2.1 billion in 2021 and $2.249$2.0 billion as of Dec. 31, 2017 and 2016, respectively. Based on their significance, the following discussion relates specifically to the AROs associated with nuclear decommissioning.
in 2020.
NSP-Minnesota obtains periodic independent cost studies in order to estimate the cost and timing of planned nuclear decommissioning activities. These independent cost studies are based on relevant information available at the time performed. Estimates of future cash flows for extended periods of time are by nature highly uncertain and may vary significantly from actual results. NSP-Minnesota is required to file a nuclear decommissioning filing every three years. The filing covers all expenses overfor the decommissioning period of the nuclear plants, including decontamination and removal of radioactive material.
The MPUCcurrently approved NSP-Minnesota’s currently effective decommissioning filing in October 2015. The most recenttriennial filing was submittedordered by the MPUC in January 2019. This approval did not result in a change to the ARO liability. In December 2020, the MPUC ordered Xcel Energy to maintain the current accrual through 2021 to align with the approved one year stay out of the previously filed multi-year electric rate case. Also, in December 2017 and is currently pending2020, Xcel Energy filed an accrual proposal with the MPUC withto be effective in 2022 based on an order expectedupdated independent cost study. In December 2021, Xcel Energy submitted its petition for approval of the 2022-2024 NSP-Minnesota’s Nuclear Decommission Study and Assumptions. Xcel Energy anticipates the MPUC to deliberate on this filing in 2018. See Note 13 for further discussion.
February 2022.
The following key assumptions have a significant effect on the estimated nuclear obligation:
Timing— Decommissioning cost estimates are impacted by each facility’s retirement date and the expected timing of the actual decommissioning activities. Currently, the estimatedEstimated retirement dates coincide with the expiration of each unit’s operating license with the NRC (i.e., 2030 for Monticello and 2033 and 2034 for PI’s Unit 1 and 2, respectively). The estimated timing of the decommissioning activities is based upon the DECON method (required by the MPUC), which assumes prompt removal and dismantlement. The use of the DECON method is required by the MPUC. By utilizing this method, decommissioningDecommissioning activities are expected to begin at the end of the license date and be completed for both facilities by 2091.
Technology and Regulation — There is limited experience with actual decommissioning of large nuclear facilities. Changes in technology, experience and experience as well as changes in regulations regarding nuclear decommissioning could cause cost estimates to change significantly. NSP-Minnesota’s most recent nuclear decommissioning filing assumed current technology and regulations.
Escalation Rates — Escalation rates represent projected cost increases over time due to both general inflation and increases in the cost of specific decommissioning activities. NSP-Minnesota used an escalation rate of 3.42 percent3.2% in calculating the ARO related tofor nuclear decommissioning for the Monticello facility, a rate of 3.40 percent for PI Unit 1, and a rate of 3.40 percent for PI Unit 2. These rates areits nuclear facilities, based on weighted averages of labor and non-labor escalation factors calculated by Goldman Sachs Asset Management.
Discount Rates — Changes in timing or estimated expected cash flows that result in upward revisions to the ARO are calculated using the then-current credit-adjusted risk-free interest rate. The credit-adjusted risk-free rate in effect when the change occurs is used to discount the revised estimate of the incremental expected cash flows of the retirement activity.
If the change in timing or estimated expected cash flows results in a downward revision of the ARO, the undiscounted revised estimate of expected cash flows is discounted using the credit-adjusted risk-free rate in effect at the date of initial measurement and recognition of the original ARO. Discount rates ranging from approximately four3% to seven percent7% have been used to calculate the net present value of the expected future cash flows over time.
Significant uncertainties exist in estimating the future cost of nuclear decommissioningcosts including the method to be utilized, the ultimate costs to decommission and the planned method of disposing spent fuel. If different cost estimates, life assumptions or cost escalation rates were utilized, the AROs could change materially.
However, changes in estimates have minimal impact on results of operations as NSP-Minnesota expects to continue to recover all costs in future rates.
Xcel Energy continually makes judgments and estimates related to these critical accounting policy areas, based on an evaluation of the varying assumptions and uncertainties for each area. The information and assumptions underlying many of these judgments and estimates will be affected by events beyond the control of Xcel Energy, or otherwise change over time. This may require adjustments to recorded results to better reflect the events and updated information that becomes available. The accompanying financial statements reflect management’s best estimates and judgments of the impact of these factors as of Dec. 31, 2017.2021.
See Note 12 to the consolidated financial statements for further information.
| | |
| Derivatives, Risk Management and Market Risk |
Xcel Energy Inc. and its subsidiariesWe are exposed to a variety of market risks in the normal course of business. Market risk is the potential loss that may occur as a result of adverse changes in the market or fair value of a particular instrument or commodity. All financial and commodity-related instruments, including derivatives, are subject to market risk. See Note 11 to the consolidated financial statements for further discussion of market risks associated with derivatives.
Xcel Energy is exposed to the impact of adverse changes in price for energy and energy-related products, which is partially mitigated by the use of commodity derivatives. In addition to ongoing monitoring and maintaining credit policies intended to minimize overall credit risk, when necessary, management takes steps to mitigate changes in credit and concentration risks associated with its derivatives and other contracts, including parental guarantees and requests of collateral. While Xcel Energy expectswe expect that the counterparties will perform under the contracts underlying its derivatives, the contracts expose Xcel Energyus to some credit and non-performance risk.
Though no material non-performance risk currently exists with the counterparties to Xcel Energy’s commodity derivative contracts, distress in the financial markets may in the future impact that risk to the extent it impacts those counterparties. Distress in the financial markets may also impact counterparty risk, the fair value of the securities in the nuclear decommissioning fund and master pension trust, as well asfund and Xcel Energy’s ability to earn a return on short-term investments of excess cash.investments.
Commodity Price Risk — Xcel Energy Inc.’s utility subsidiaries We are exposed to commodity price risk in theirour electric and natural gas operations. Commodity price risk is managed by entering into long- and short-term physical purchase and sales contracts for electric capacity, energy and energy-related products and for various fuels used in generation and distribution activities. Commodity price risk is also managed through the use of financial derivative instruments. Xcel Energy’sOur risk management policy allows itus to manage commodity price risk within each rate-regulated operation per commission approved hedge plans.
Wholesale and Commodity Trading Risk — Xcel Energy Inc.’s utility subsidiaries conductconducts various wholesale and commodity trading activities, including the purchase and sale of electric capacity, energy, energy-related instruments and natural gas-related instruments, including derivatives. Xcel Energy’sOur risk management policy allows management to conduct these activities within guidelines and limitations as approved by itsour risk management committee, which is made upcommittee.
Fair value of management personnel not directly involved in the activities governed by this policy.
At Dec. 31, 2017, the fair values by source for net commodity trading
contract assets werecontracts as
follows:of Dec. 31, 2021: | | | | | | | | | | | | | | | | | | | | | | | | | | | | | | | | |
| Futures / Forwards Maturity |
| (Millions of Dollars) | | Less Than 1 Year | | 1 to 3 Years | | 4 to 5 Years | | Greater Than 5 Years | | Total Fair Value |
NSP-Minnesota (a) | | $ | (4) | | | $ | (7) | | | $ | — | | | $ | (1) | | | $ | (12) | |
NSP-Minnesota (b) | | (1) | | | 3 | | | (9) | | | (8) | | | (15) | |
PSCo (a) | | 6 | | | 6 | | | 1 | | | 1 | | | 14 | |
PSCo (b) | | (37) | | | (48) | | | — | | | — | | | (85) | |
| | $ | (36) | | | $ | (46) | | | $ | (8) | | | $ | (8) | | | $ | (98) | |
| | | | | | | | | | | | | | | | | | | | | | | | | | | | | | | | |
| Options Maturity |
| (Millions of Dollars) | | Less Than 1 Year | | 1 to 3 Years | | 4 to 5 Years | | Greater Than 5 Years | | Total Fair Value |
NSP-Minnesota (b) | | $ | 1 | | | $ | — | | | $ | — | | | $ | 8 | | | $ | 9 | |
PSCo (b) | | 27 | | | 29 | | | — | | | — | | | 56 | |
| | $ | 28 | | | $ | 29 | | | $ | — | | | $ | 8 | | | $ | 65 | |
|
| | | | | | | | | | | | | | | | | | | | | | | |
| | | Futures / Forwards |
| (Millions of Dollars) | | Source of Fair Value | | Maturity
Less Than 1 Year | | Maturity 1 to 3 Years | | Maturity 4 to 5 Years | | Maturity
Greater Than 5 Years | | Total Futures /
Forwards Fair Value |
| NSP-Minnesota | | 1 |
| | $ | 4 |
| | $ | 4 |
| | $ | 3 |
| | $ | — |
| | $ | 11 |
|
| | | | | | | | | | | | | |
| | | Options |
| (Thousands of Dollars) | | Source of Fair Value | | Maturity
Less Than 1 Year | | Maturity 1 to 3 Years | | Maturity 4 to 5 Years | | Maturity
Greater Than 5 Years | | Total Options Fair Value |
| NSP-Minnesota | | 2 |
| | $ | — |
| | $ | 4 |
| | $ | 1 |
| | $ | — |
| | $ | 5 |
|
1 — (a)Prices actively quoted or based on actively quoted prices.
2 — (b)Prices based on models and other valuation methods.
Changes in the fair value of commodity trading contracts before the impacts of margin-sharing mechanisms for the years ended Dec. 31, were as follows:31:
| | | (Millions of Dollars) | | 2017 | | 2016 | (Millions of Dollars) | | 2021 | | 2020 |
| Fair value of commodity trading net contract assets outstanding at Jan. 1 | | $ | 10 |
| | $ | 11 |
| |
| Fair value of commodity trading net contracts outstanding at Jan. 1 | | Fair value of commodity trading net contracts outstanding at Jan. 1 | | $ | (54) | | | $ | (59) | |
| Contracts realized or settled during the period | | (5 | ) | | (5 | ) | Contracts realized or settled during the period | | (54) | | | (9) | |
| Commodity trading contract additions and changes during the period | | 11 |
| | 4 |
| Commodity trading contract additions and changes during the period | | 75 | | | 14 | |
| Fair value of commodity trading net contract assets outstanding at Dec. 31 | | $ | 16 |
| | $ | 10 |
| |
| Fair value of commodity trading net contracts outstanding at Dec. 31 | | Fair value of commodity trading net contracts outstanding at Dec. 31 | | $ | (33) | | | $ | (54) | |
At Dec. 31, 2017,2021, a 10 percent10% increase or decrease in market prices for commodity trading contracts through the forward curve would have an immaterial impact.increase pretax income from continuing operations by approximately $13 million, whereas a 10% decrease would decrease pretax income from continuing operations by approximately $13 million. At Dec. 31, 2016,2020, a 10 percent10% increase in market prices for commodity trading contracts would increase pretax income from continuing operations by approximately $13 million, whereas a 10% decrease would decrease pretax income from continuing operations by approximately $1 million, whereas a 10 percent decrease would increase pretax income from continuing operations by approximately $1$13 million. Market price movements can exceed 10% under abnormal circumstances.
Xcel Energy Inc.’sThe utility subsidiaries’ wholesale and commodity trading operations measure the outstanding risk exposure to price changes on transactions, contracts and obligations that have been entered into, but not closed, using an industry standard methodology known as Value at Risk (VaR).VaR. VaR expresses the potential change in fair value on the outstanding transactions, contracts and obligations over a particular period of time under normal market conditions.
The VaRs for the NSP-Minnesota and PSCo commodity trading operations, excluding both non-derivative transactions and derivative transactions designated as normal purchase and normal sales, calculated on a consolidated basis using a Monte Carlo simulation with a 95 percent95% confidence level and a one-day holding period, were as follows:
| | | | | | | | | | | | | | | | | | | | | | | | | | | | | | | | |
| (Millions of Dollars) | | Year Ended
Dec. 31 | | VaR Limit | | Average | | High | | Low |
| 2021 | | $ | 1 | | | $ | 3 | | | $ | 2 | | | $ | 52 | | | $ | 1 | |
| 2020 | | 1 | | | 3 | | | 1 | | | 2 | | | 1 | |
|
| | | | | | | | | | | | | | | | | | | | |
| (Millions of Dollars) | | Year Ended Dec. 31 | | VaR Limit | | Average | | High | | Low |
| 2017 | | $ | 0.18 |
| | $ | 3.00 |
| | $ | 0.21 |
| | $ | 0.66 |
| | $ | 0.04 |
|
| 2016 | | 0.09 |
| | 3.00 |
| | 0.16 |
| | 0.38 |
| | | 0.05 |
|
Nuclear Fuel Supply — NSP-Minnesota is scheduled to take delivery ofhas contracted for approximately 58 percent78% of its 2018 and approximately 24 percent of its 20192022 enriched nuclear material requirements from sources that could be impacted by events in Ukraine and extended sanctions against Russia. Alternate potential sources are expected to provideentities doing business with Iran. Those sanctions may impact the flexibility to manage NSP-Minnesota’ssupply of enriched nuclear fuel supply to ensure that plant availability and reliability will not be negatively impacted in the near-term.material supplied from Russia. Long-term, through 2024,2030, NSP-Minnesota is scheduled to take delivery of approximately 35 percent30% of its average enriched nuclear material requirements from sources that could be impacted by events in Ukraine and extended sanctions against Russia.these sources. NSP-Minnesota is closely following the progression of these events and willable to manage nuclear fuel supply with alternate potential sources. NSP-Minnesota periodically assessassesses if further actions are required to assure a secure supply of enriched nuclear material.
Separately, NSP-Minnesota has enriched nuclear fuel materials in process with Westinghouse Electric Corporation (Westinghouse). Westinghouse filed for Chapter 11 bankruptcy protection in March 2017. NSP-Minnesota owns materials in Westinghouse’s inventory and has contracts in place under which Westinghouse will provide certain services during an upcoming outage at Prairie Island (PI). Westinghouse will provide nuclear fuel assemblies for the upcoming PI outage under the current nuclear fuel fabrication contract. Westinghouse has indicated its intention to continue to perform under the arrangements. Based on Westinghouse’s stated intent and the interim financing secured to fund its on-going operations, NSP-Minnesota does not expect the bankruptcy to materially impact NSP-Minnesota’s operational or financial performance. Westinghouse announced on Jan. 4, 2018 it has agreed to be acquired by Brookfield Business Partners LP and other institutional partners. Brookfield’s acquisition of Westinghouse is expected to close in the third quarter of 2018, subject to bankruptcy court and regulatory approvals. NSP-Minnesota will continue to monitor the Westinghouse acquisition process.
Interest Rate Risk — Xcel Energy is subject to the risk of fluctuating interest rates in the normal course of business. Xcel Energy’srate risk. Our risk management policy allows interest rate risk to be managed through the use of fixed rate debt, floating rate debt and interest rate derivatives such as swaps, caps, collars and put or call options.
At Dec. 31, 2017 and 2016, aA 100 basis point change in the benchmark rate on Xcel Energy’s variable rate debt would impact annual pretax interest expense annually by approximately $9$11 million and $4$6 million respectively. See Note 11 to the consolidated financial statements for a discussion of Xcel Energy Inc.in 2021 and its subsidiaries’ interest rate derivatives.
2020, respectively.
NSP-Minnesota maintains a nuclear decommissioning fund, as required by the NRC. The nuclear decommissioning fund is subject to interest rate risk and equity price risk. At Dec. 31, 2017, theThe fund wasis invested in a diversified portfolio of cash equivalents, debt securities, equity securities and other investments. These investments may be used only for activities related to nuclear decommissioning. Given the purpose and legal restrictions on the use of decommissioning NSP-Minnesota’s nuclear decommissioning fund assets, realizedgenerating plants.
Realized and unrealized gains on the decommissioning fund investments over the life of the fund are deferred as an offset of NSP-Minnesota’s regulatory asset for nuclear decommissioning costs. Consequently, any realized and unrealized gains and losses on securities in the nuclear decommissioning fund, including any other-than-temporary impairments, are deferred as a component of the regulatory asset for nuclear decommissioning. Since the accounting for nuclear decommissioning recognizes that costs are recovered through rates, fluctuationsFluctuations in equity prices or interest rates affecting the nuclear decommissioning fund do not have a direct impact on earnings.
earnings due to the application of regulatory accounting.
Changes in discount rates and expected return on plan assets impact the value of pension and postretirement plan assets as well asand/or benefit costs. For further information, see “Employee Benefits” under Critical Accounting Policies and Estimates.
Credit Risk — Xcel Energy Inc. and its subsidiaries areis also exposed to credit risk. Credit risk relates to the risk of loss resulting from counterparties’ nonperformance on their contractual obligations. Xcel Energy Inc. and its subsidiaries maintainmaintains credit policies intended to minimize overall credit risk and actively monitormonitors these policies to reflect changes and scope of operations.
At Dec. 31, 2017,2021, a 10 percent10% increase in commodity prices would have resulted in an increase in credit exposure of $26$36 million, while a decrease in prices of 10 percent10% would have resulted in an increasea decrease in credit exposure of $7$26 million. At Dec. 31, 2016,2020, a 10 percent10% increase in commodity prices would have resulted in an increase in credit exposure of $6$11 million, while a decrease in prices of 10 percent10% would have resulted in an immaterial increase in credit exposureexposure.
Xcel Energy Inc. and its subsidiaries conduct standardconducts credit reviews for all counterparties. Xcel Energycounterparties and employs additional credit risk control mechanisms when appropriate,controls, such as letters of credit, parental guarantees, standardized master netting agreements and termination provisions that allow for offsetting of positive and negative exposures.provisions. Credit exposure is monitored, and when necessary, the activity with a specific counterparty is limited until credit enhancement is provided. Distress in the financial markets could increase Xcel Energy’sour credit risk.
Fair Value Measurements
Xcel Energy uses derivative contracts such as futures, forwards, interest rate swaps, options and FTRs to manage commodity price and interest rate risk. Derivative contracts, with the exception of those designated as normal purchase and normal sale contracts, are reported at fair value.
Xcel Energy follows accountingEnergy’s investments held in the nuclear decommissioning fund, rabbi trusts, pension and disclosure guidance onother postretirement funds are also subject to fair value measurements that contains a hierarchy for inputs used in measuring fair value and requires disclosure of the observability of the inputs used in these measurements. See Note 11 to the consolidated financial statements for further discussion of the fair value hierarchy and the amounts of assets and liabilities measured at fair value that have been assigned to Level 3.accounting.
Commodity Derivatives — Xcel Energy continuously monitors the creditworthiness of the counterparties to its commodity derivative contracts and assesses each counterparty’s ability to perform on the transactions set forth in the contracts. Given this assessment and the typically short duration of these contracts, thetransactions. The impact of discounting commodity derivative assets for counterparty credit risk was not material to the fair value of commodity derivative assets at Dec. 31, 2017. 2021.
Adjustments to fair value for credit risk of commodity trading instruments are recorded in electric revenues. Credit risk adjustments for other commodity derivative instruments are recorded as other comprehensive income or deferred as OCI or regulatory assets and liabilities. The classificationClassification as a regulatory asset or liability is based on commission approved regulatory recovery mechanisms. Xcel Energy also assesses the impact of its own credit risk when determining the fair value of commodity derivative liabilities. The impact of discounting commodity derivative liabilities for credit risk was immaterial to the fair value of commodity derivative liabilities at Dec. 31, 2017.2021.
See Notes 10 and 11 to the consolidated financial statements for further information.
Commodity derivative assets and liabilities assigned to Level 3 typically consist of FTRs, as well as forward and option contracts that are long-term in nature or relate to inactive delivery locations. Level 3 commodity derivative assets and liabilities represent 1.7 percent and 4.3 percent of gross assets and liabilities, respectively, measured at fair value at Dec. 31, 2017.
| | |
| Liquidity and Capital Resources |
Determining the fair value of FTRs requires numerous management forecasts that vary in observability, including various forward commodity prices, retail and wholesale demand, generation and resulting transmission system congestion. Given the limited observability of management’s forecasts for several of these inputs, these instruments have been assigned a Level 3. Level 3 commodity derivatives assets and liabilities included $32 million and $2 million of estimated fair values, respectively, for FTRs held at Dec. 31, 2017.
Determining the fair value of certain commodity forwards and options can require management to make use of subjective price and volatility forecasts for inactive delivery locations and for contracts that extend to periods beyond those readily observable on active exchanges or quoted by brokers. When less observable forward price and volatility forecasts are significant to determining the value of commodity forwards and options, these instruments are assigned to Level 3. There were $5 million in Level 3 commodity derivative assets and no liabilities for options held at Dec. 31, 2017. There were immaterial Level 3 commodity derivative assets and liabilities for forwards held at Dec. 31, 2017.
Liquidity and Capital Resources
Cash Flows
|
| | | | | | | | | | | | |
| (Millions of Dollars) | | 2017 | | 2016 | | 2015 |
| Net cash provided by operating activities | | $ | 3,126 |
| | $ | 3,052 |
| | $ | 3,038 |
|
| | | | | | | | |
| (Millions of Dollars) | | Twelve Months Ended Dec. 31 |
| Cash provided by operating activities — 2020 | | $ | 2,848 | |
| | |
| Components of change — 2021 vs. 2020 | | |
| Higher net income | | 124 | |
Non-cash transactions (a) | | 52 | |
Changes in working capital (b) | | (50) | |
| Changes in net regulatory and other assets and liabilities | | (785) | |
| Cash provided by operating activities — 2021 | | $ | 2,189 | |
(a) Non-cash transactions applicable to net income (e.g., depreciation, nuclear fuel amortization, changes in deferred income taxes, allowance for equity funds used during construction, etc.).
(b) Working capital includes accounts receivable, accrued unbilled revenues, inventories, accounts payable, other current assets and other current liabilities.
Net cash provided by operating activities increaseddecreased by $74$659 million for 20172021 as compared to 2016.2020. The increasedecrease was primarily due to higherthe deferral of net income, excluding amountsnatural gas, fuel and purchased energy costs related to non-cash operating activities (e.g., depreciation and deferred tax expenses) andWinter Storm Uri in the timing of customer receipts, partially offset by higher interest payments and pension contributions, refunds, timing of vendor payments and lower income tax refunds received.first quarter.
Net cash provided by operating activities increased by $14 million for 2016 as compared to 2015. The increase was primarily due to timing of vendor payments and higher net income, excluding amounts related to non-cash operating activities (e.g., depreciation, deferred tax expenses and a charge related to the Monticello LCM/EPU project in 2015), partially offset by timing of customer receipts, refunds and recovery of certain electric and natural gas riders and incentive programs.
|
| | | | | | | | | | | | |
| (Millions of Dollars) | | 2017 | | 2016 | | 2015 |
| Net cash used in investing activities | | $ | (3,296 | ) | | $ | (3,261 | ) | | $ | (3,623 | ) |
Net cash used in investing activities increased by $35 million for 2017 as compared to 2016. The increase was mainly attributable to higher capital expenditures related to the Rush Creek wind generation facility, partially offset by lower capital expenditures related to the Courtenay wind farm and fewer rabbi trust investments.
| | | | | | | | |
| (Millions of Dollars) | | Twelve Months Ended Dec. 31 |
| Cash used in investing activities — 2020 | | $ | (4,740) | |
| | |
| Components of change — 2021 vs. 2020 | | |
| Decreased capital expenditures | | 1,125 | |
| Sale of MEC in 2020 | | (684) | |
| Other investing activities | | 12 | |
| Cash used in investing activities — 2021 | | $ | (4,287) | |
Net cash used in investing activities decreased by $362$453 million for 20162021 as compared to 2015.2020. The decrease in capital expenditures was primarily attributablelargely due to the acquisitionpurchase of twoMEC in January 2020, which was subsequently sold in July 2020, as well as the completion of various wind projects in 2015, partially offset by the establishment of rabbi trusts in 2016 and higher insurance proceeds received in 2015.projects.
Financing Cash Flows
|
| | | | | | | | | | | | |
| (Millions of Dollars) | | 2017 | | 2016 | | 2015 |
| Net cash provided by financing activities | | $ | 168 |
| | $ | 209 |
| | $ | 590 |
|
| | | | | | | | |
| (Millions of Dollars) | | Twelve Months Ended Dec. 31 |
| Cash provided by financing activities — 2020 | | $ | 1,773 | |
| | |
| Components of change — 2021 vs. 2020 | | |
| Higher debt issuances | | 202 | |
| Lower repayments of long-term debt | | 584 | |
| Lower proceeds from issuance of common stock | | (361) | |
| Higher dividends paid to shareholders | | (79) | |
| Other financing activities | | 16 | |
| Cash provided by financing activities — 2021 | | $ | 2,135 | |
Net cash provided by financing activities decreasedincreased by $41$362 million for 20172021 as compared to 2016.2020. The decreaseincrease was primarily dueattributable to lowerthe amount/timing of debt issuances and higher dividend payments, partially offset by higher short-term debt proceedsrepayments, changes in capital investment and lower repurchases of common stock in 2017.
Net cash provided byincremental financing activities decreased by $381 million for 2016 as compared to 2015. The decrease was primarily due to higher repayments of long-term and short-term debt, higher dividend payments and repurchases of common stock, partially offset by higher debt issuancesthe lag in 2016.
recovery costs associated with Winter Storm Uri.
See discussion of trends, commitments and uncertainties, andNote 5 to the potential future impact on cash flow and liquidity under Capital Sources.consolidated financial statements for further information.
Capital Requirements
Xcel Energy has contractual obligations and other commitments that will need to be funded in the future. The Company expects to have adequate amounts of cash from operating and/or financing activities to meet both its short-term and long-term cash requirements. Xcel Energy’s financing requirements are dependent on both existing contractual obligations and other commitments, as well as projected capital forecasts. Xcel Energy expects to meet future financing requirements by periodically issuing short-term debt, long-term debt, common stock, hybrid and other securities to maintain desired capitalization ratios. Projected future financing requirements can be impacted by various factors including constraints to supply chain and labor, as well as inflation.
Recovery of the effects of inflation through higher customer rates is dependent upon receiving adequate and timely rate increases. Rate increases may not be retroactive and often lag increases in costs caused by inflation. On occasion, the Company may enter into rate settlement agreements, which require us to wait for a period of time to file the next base rate increase request. These agreements may result in regulatory lag whereby the impact of inflation may not yet be reflected in rates, or a delay may occur between capital project completion and the start of rate recovery. Xcel Energy attempts to mitigate the potential impact of inflation through the use of fuel, energy and other cost adjustment clauses and bill riders, by employing prudent risk management and hedging strategies and by considering, among other areas, its impact on purchases of energy, operating expenses, materials and equipment costs, contract negotiations, future capital spending programs and long-term debt issuances.
Contractual Obligations and Other Commitments
| | | | | | | | | | | | | | | | | | | | | | | | | | | | | | | | |
| | Payments Due by Period (as of Dec. 31, 2021) |
| (Millions of Dollars) | | Total | | Less than 1 Year | | 1 to 3 Years | | 3 to 5 Years | | After 5 Years |
| Long-term debt, principal and interest payments | $ | 37,014 | | | $ | 1,419 | | | $ | 3,323 | | | $ | 3,175 | | | $ | 29,097 | |
| Finance lease obligations | 242 | | | 12 | | | 24 | | | 19 | | | 187 | |
Operating leases obligations (a) | 1,594 | | | 256 | | | 478 | | | 363 | | | 497 | |
Unconditional purchase obligations (b) | 4,837 | | | 1,718 | | | 1,538 | | | 617 | | | 964 | |
Other long-term obligations, including current portion (c) | 40 | | | 36 | | | 4 | | | — | | | — | |
| Other short-term obligations | 455 | | | 455 | | | — | | | — | | | — | |
| Short-term debt | 1,005 | | | 1,005 | | | — | | | — | | | — | |
| Total contractual cash obligations | $ | 45,187 | | | $ | 4,901 | | | $ | 5,367 | | | $ | 4,174 | | | $ | 30,745 | |
(a)Included in operating lease obligations are $229 million, $430 million, $335 million and $416 million, for the less than 1 year, 1 - 3 years, 3 - 5 years and after 5 years categories, respectively, pertaining to PPAs that were accounted for as operating leases.
(b)Xcel Energy Inc. and its subsidiaries have contracts providing for the purchase and delivery of a significant portion of its fuel (nuclear, natural gas and coal) requirements. Additionally, the utility subsidiaries of Xcel Energy Inc. have entered into non-lease purchase power agreements. Certain contractual purchase obligations are adjusted on indices. Effects of price changes are mitigated through cost of energy adjustment mechanisms.
(c)Primarily consists of contracts for information technology services.
Capital Expenditures — Base capital expenditures and incremental capital forecasts:
| | | | | | | | | | | | | | | | | | | | | | | | | | | | | | | | | | | | | | | | | | | | |
| | Actual | | Base Capital Forecast (Millions of Dollars) |
| By Regulated Utility | | 2021 | | 2022 | | 2023 | | 2024 | | 2025 | | 2026 | | 2022 - 2026 Total |
| PSCo | | $ | 1,625 | | | $ | 1,930 | | | $ | 1,850 | | | $ | 2,070 | | | $ | 2,220 | | | $ | 1,860 | | | $ | 9,930 | |
| NSP-Minnesota | | 1,885 | | | 2,250 | | | 2,030 | | | 1,830 | | | 2,130 | | | 2,010 | | | 10,250 | |
| SPS | | 555 | | | 630 | | | 660 | | | 690 | | | 780 | | | 790 | | | 3,550 | |
| NSP-Wisconsin | | 290 | | | 480 | | | 420 | | | 540 | | | 460 | | | 390 | | | 2,290 | |
Other (a) | | 25 | | | (10) | | | — | | | 10 | | | (30) | | | 10 | | | (20) | |
| Total base capital expenditures | | $ | 4,380 | | | $ | 5,280 | | | $ | 4,960 | | | $ | 5,140 | | | $ | 5,560 | | | $ | 5,060 | | | $ | 26,000 | |
| | | | | | | | | | | | | | | | | | | | | | | | | | | | | | | | | | | | | | | | | | | | |
| | Actual | | Base Capital Forecast (Millions of Dollars) |
| By Function | | 2021 | | 2022 | | 2023 | | 2024 | | 2025 | | 2026 | | 2022 - 2026 Total |
| Electric distribution | | $ | 1,110 | | | $ | 1,485 | | | $ | 1,600 | | | $ | 1,520 | | | $ | 1,605 | | | $ | 1,720 | | | $ | 7,930 | |
| Electric transmission | | 830 | | | 1,105 | | | 1,220 | | | 1,575 | | | 1,965 | | | 1,555 | | | 7,420 | |
| Electric generation | | 575 | | | 645 | | | 580 | | | 670 | | | 650 | | | 650 | | | 3,195 | |
| Natural gas | | 655 | | | 655 | | | 670 | | | 695 | | | 660 | | | 660 | | | 3,340 | |
| Other | | 610 | | | 725 | | | 545 | | | 450 | | | 340 | | | 450 | | | 2,510 | |
| Renewables | | 600 | | | 665 | | | 345 | | | 230 | | | 340 | | | 25 | | | 1,605 | |
| Total base capital expenditures | | $ | 4,380 | | | $ | 5,280 | | | $ | 4,960 | | | $ | 5,140 | | | $ | 5,560 | | | $ | 5,060 | | | $ | 26,000 | |
(a) Other category includes intercompany transfers for safe harbor wind turbines.
The current estimated basefive-year capital expenditure programs of Xcel Energy’s operating companies forforecast includes the years 2018 through 2022 are shownproposed Colorado Pathway transmission expansion (approximately $1.7 billion) and the proposed 460 MW Sherco solar facility (approximately $600 million).
Additional capital investment in renewable generation and transmission may be needed in the table below:five-year forecast pending approval of regulatory filings in Minnesota and Colorado. The approval of the proposed resource plans could result in up to 2,000 MW of renewable generation being needed between 2024 - 2026, resulting in potential capital expenditures estimated between $1.0 to $1.5 billion (assuming Xcel Energy were to own ~50% of the renewables). Additionally, the associated $0.5 billion to $1.0 billion of network upgrades, voltage support and interconnection work related to the Colorado Power Pathway could also be needed during this five-year forecast depending on resource mix, location and timing. Any additional capital investment would likely be funded with approximately 50% equity and 50% debt.
|
| | | | | | | | | | | | | | | | | | | | | | | | |
| | | Capital Forecast |
| (Millions of Dollars) | | 2018 | | 2019 | | 2020 | | 2021 | | 2022 | | 2018 - 2022 Total |
| By Subsidiary | | | | | | | | | | | | |
| NSP-Minnesota | | $ | 1,370 |
| | $ | 1,910 |
| | $ | 1,450 |
| | $ | 1,590 |
| | $ | 1,500 |
| | $ | 7,820 |
|
| PSCo | | 1,650 |
| | 1,020 |
| | 950 |
| | 1,150 |
| | 1,410 |
| | 6,180 |
|
| SPS | | 1,020 |
| | 1,140 |
| | 710 |
| | 470 |
| | 540 |
| | 3,880 |
|
| NSP-Wisconsin | | 250 |
| | 250 |
| | 240 |
| | 280 |
| | 290 |
| | 1,310 |
|
Other (a) | | 20 |
| | (90 | ) | | (90 | ) | | (30 | ) | | — |
| | (190 | ) |
Estimated capital reduction (b) | | (100 | ) | | (100 | ) | | (100 | ) | | (100 | ) | | (100 | ) | | (500 | ) |
| Total capital expenditures | | $ | 4,210 |
| | $ | 4,130 |
| | $ | 3,160 |
| | $ | 3,360 |
| | $ | 3,640 |
| | $ | 18,500 |
|
|
| | | | | | | | | | | | | | | | | | | | | | | | |
| | | Capital Forecast |
| (Millions of Dollars) | | 2018 | | 2019 | | 2020 | | 2021 | | 2022 | | 2018 - 2022 Total |
| By Function | | | | | | | | | | | | |
| Electric distribution | | $ | 750 |
| | $ | 810 |
| | $ | 870 |
| | $ | 1,110 |
| | $ | 1,380 |
| | $ | 4,920 |
|
| Renewables | | 1,410 |
| | 1,860 |
| | 880 |
| | 270 |
| | — |
| | 4,420 |
|
| Electric transmission | | 770 |
| | 540 |
| | 570 |
| | 860 |
| | 980 |
| | 3,720 |
|
| Electric generation | | 520 |
| | 370 |
| | 290 |
| | 520 |
| | 530 |
| | 2,230 |
|
| Natural gas | | 460 |
| | 400 |
| | 410 |
| | 420 |
| | 510 |
| | 2,200 |
|
Other (c)
| | 400 |
| | 250 |
| | 240 |
| | 280 |
| | 340 |
| | 1,510 |
|
Estimated capital reduction (b) | | (100 | ) | | (100 | ) | | (100 | ) | | (100 | ) | | (100 | ) | | (500 | ) |
| Total capital expenditures | | $ | 4,210 |
| | $ | 4,130 |
| | $ | 3,160 |
| | $ | 3,360 |
| | $ | 3,640 |
| | $ | 18,500 |
|
| |
(a)
| Other category includes intercompany transfers for safe harbor wind turbines. |
| |
(b)
| Xcel Energy has reduced its capital forecast by $500 million due to the potential impact of tax reform on cash flows and credit metrics. |
| |
(c)
| Amounts in other category are net of intercompany transfers. |
The baseXcel Energy’s capital expenditure forecast does not include the CEP, which if approved could increase the total capital investment by up to $1.5 billion, based on a preliminary estimate. The level of capital investment may decline due to lower renewable pricing and the ultimate composition of assets selected as part of the RFP process. The expected cost and potential capital investment of the CEP will be determined once a recommended portfolio is filed with the CPUC.
The capital expenditure programs of Xcel Energy are subject to continuing review and modification. Actual capital expenditures may vary from estimates due to changes in electric and natural gas projected load growth, safety and reliability needs, regulatory decisions, legislative initiatives (e.g., federal clean energy and tax policy), reserve margin requirements, the availability of purchased power, alternative plans for meeting long-term energy needs, compliance with environmental requirements, RPSinitiatives and regulation, and merger, acquisition and divestiture opportunities.
Financing for Capital Expenditures through 2026 — Xcel Energy issues debt and equity securities to refinance retiring maturities, reduce short-term debt, fund capital programs, infuse equity in subsidiaries, fund asset acquisitions and for other general corporate purposes.
Contractual Obligations and Other Commitments — In addition to its capital expenditure programs,Current estimated financing plans of Xcel Energy has contractual obligations and other commitments that will need to be funded in the future. The following is a summarized table of contractual obligations and other commercial commitments at Dec. 31, 2017. See the statements of capitalization and additional discussion in Notes 4 and 13 to the consolidated financial statements.
|
| | | | | | | | | | | | | | | | | | | | |
| | | Payments Due by Period |
| (Millions of Dollars) | | Total | | Less than 1 Year | | 1 to 3 Years | | 3 to 5 Years | | After 5 Years |
Long-term debt, principal and interest payments (a) | $ | 25,510 |
| | $ | 1,073 |
| | $ | 2,808 |
| | $ | 2,368 |
| | $ | 19,261 |
|
| Capital lease obligations | 302 |
| | 15 |
| | 28 |
| | 26 |
| | 233 |
|
Operating leases (b)(c) | 3,123 |
| | 238 |
| | 528 |
| | 527 |
| | 1,830 |
|
Unconditional purchase obligations (d) | 7,367 |
| | 1,596 |
| | 1,965 |
| | 1,565 |
| | 2,241 |
|
Other long-term obligations, including current portion (e) | 111 |
| | 43 |
| | 57 |
| | 11 |
| | — |
|
| Payments to vendors in process | 322 |
| | 322 |
| | — |
| | — |
| | — |
|
| Short-term debt | 814 |
| | 814 |
| | — |
| | — |
| | — |
|
Total contractual cash obligations (f)(g)(h) | $ | 37,549 |
| | $ | 4,101 |
| | $ | 5,386 |
| | $ | 4,497 |
| | $ | 23,565 |
|
for 2022 through 2026: | | | | | | | | |
| (Millions of Dollars) | | |
| Funding Capital Expenditures | | |
Cash from operations(a) | Includes interest payments over | $ | 17,640 | |
New debt (b) | | 7,110 | |
Equity through the terms of the debt. Interest is calculated using the applicable interest rate at Dec. 31, 2017,DRIP and outstanding principal for each investment with the terms ending at each instrument’s maturity.benefit program | | 450 | |
| Other equity | | 800 | |
| Base capital expenditures 2021 - 2025 | | $ | 26,000 | |
| | |
(b)
Maturing Debt | Under some leases, Xcel Energy would have to sell or purchase the property that it leases if it chose to terminate before the scheduled lease expiration date. Most of Xcel Energy’s railcar, vehicle and equipment and aircraft leases have these terms. At Dec. 31, 2017, the amount that Xcel Energy would have to pay if it chose to terminate these leases was approximately $28 million. In addition, at the end of the equipment lease terms, each lease must be extended, equipment purchased for the greater of the fair value or unamortized value of equipment sold to a third party with Xcel Energy making up any deficiency between the sales price and the unamortized value. |
| $ | 3,900 | |
(c)
| Included in operating lease payments are $213 million, $474 million, $481 million and $1.7 billion, for the less than 1 year, 1-3 years, 3-5 years and after 5 years categories, respectively, pertaining to PPAs that were accounted for as operating leases. |
| |
(d)
| Xcel Energy Inc. and its subsidiaries have contracts providing for the purchase and delivery of a significant portion of its current coal, nuclear fuel and natural gas requirements. Additionally, the utility subsidiaries of Xcel Energy Inc. have entered into agreements with utilities and other energy suppliers for purchased power to meet system load and energy requirements, replace generation from company-owned units under maintenance and during outages, and meet operating reserve obligations. Certain contractual purchase obligations are adjusted on indices. The effects of price changes are mitigated through cost of energy adjustment mechanisms. |
| |
(e)
| Other long-term obligations relate primarily to amounts associated with technology agreements as well as uncertain tax positions. |
| |
(f)
| Xcel Energy also has outstanding authority under O&M contracts to purchase up to approximately $4.8 billion of goods and services through the year 2037, in addition to the amounts disclosed in this table. |
| |
(g)
| In January 2018, contributions of $150 million were made across four of Xcel Energy’s pension plans. Obligations of this type are dependent on several factors, including management discretion and various minimum contribution requirements determined by the Pension Protection Act, and therefore, are not included in the table. |
| |
(h)
| Xcel Energy expects to contribute approximately $12 million to the postretirement health care plans during 2018. Obligations of this type are dependent on several factors, including management discretion, and therefore, are not included in the table. |
(a) Net of dividends and pension funding. (b) Reflects a combination of short and long-term debt; net of refinancing.
Off-Balance Sheet Arrangements
Xcel Energy does not have any off-balance-sheet arrangements, other than those currently disclosed, that have or are reasonably likely to have a current or future effect on financial condition, changes in financial condition, revenues or expenses, results of operations, liquidity, capital expenditures or capital resources that is material to investors.
Common Stock Dividends — Future dividend levels will be dependent on Xcel Energy’s results of operations, financial position,condition, cash flows, reinvestment opportunities and other factors, and will be evaluated by the Xcel Energy Inc. Board of Directors. In February 2018,2022, Xcel Energy announced a quarterlyan increase in the annual dividend of $0.3812 cents per share, which represents an increase of 5.6 percent. 6.6%.
Xcel Energy’s dividend policy balances the following:
•Projected cash generation;generation.
•Projected capital investment;investment.
•A reasonable rate of return on shareholder investment; andinvestment.
•The impact on Xcel Energy’s capital structure and credit ratings.
In addition, there are certain statutory limitations that could affect dividend levels. Federal law places certain limits on the ability of public utilities within a holding company system to declare dividends.
Specifically, under Under the Federal Power Act, a public utility may not pay dividends from any funds properly included in a capital account. The utility subsidiaries’ dividends may be limited directly or indirectly by state regulatory commissions or bond indenture covenants.
See Note 45 to the consolidated financial statements for further discussion of restrictions on dividend payments.information.
Regulation of Derivatives — In 2010, financial reform legislation was passed that provides for the regulation of derivative transactions amongst other provisions. The CFTC ruled that swap dealing activity conducted by entities for the preceding 12 months under a notional limit, initially set at $8 billion, will fall under the general de minimis threshold and will not subject an entity to registering as a swap dealer. The de minimis threshold is scheduled to be reduced to $3 billion in 2018. Xcel Energy’s current and projected swap activity is well below these de minimis thresholds. The bill also contains provisions that exempt certain derivatives end users from much of the clearing and margin requirements and Xcel Energy’s Board of Directors has renewed the end-user exemption on an annual basis. Xcel Energy is currently meeting all reporting requirements and transaction restrictions.
Pension Fund— Xcel Energy’s pension assets are invested in a diversified portfolio of domestic and international equity securities, short-term to long-duration fixed income securities and alternative investments, including private equity, real estate and hedge funds.
The fundedFunded status and pension assumptions are summarized in the following tables:assumptions:
| | | | | | | | | | | | | | |
| (Millions of Dollars) | | Dec. 31, 2021 | | Dec. 31, 2020 |
| Fair value of pension assets | | $ | 3,670 | | | $ | 3,599 | |
Projected pension obligation (a) | | 3,718 | | | 3,964 | |
| Funded status | | $ | (48) | | | $ | (365) | |
(a)Excludes non-qualified plan of $43 million and $43 million at Dec. 31, 2021 and 2020, respectively.
| | | | | | | | | | | | | | |
| Pension Assumptions | | 2021 | | 2020 |
| Discount rate | | 3.08 | % | | 2.71 | % |
| Expected long-term rate of return | | 6.49 | | | 6.49 | |
|
| | | | | | | | |
| (Millions of Dollars) | | Dec. 31, 2017 | | Dec. 31, 2016 |
| Fair value of pension assets | | $ | 3,088 |
| | $ | 2,856 |
|
Projected pension obligation (a) | | 3,828 |
| | 3,682 |
|
| Funded status | | $ | (740 | ) | | $ | (826 | ) |
| |
(a)
| Excludes nonqualified plan of $37 million and $44 million at Dec. 31, 2017 and 2016, respectively. |
|
| | | | | | |
| Pension Assumptions | | 2017 | | 2016 |
| Discount rate | | 3.63 | % | | 4.13 | % |
| Expected long-term rate of return | | 6.87 |
| | 6.87 |
|
Capital Sources
Short-Term Funding Sources — Xcel Energy uses a number of sources to fulfillgenerally funds short-term funding needs, includingthrough operating cash flow,flows, notes payable, commercial paper and bank lines of credit. The amount and timing of short-term funding needs depend in large part on financing needs for construction expenditures, working capital and dividend payments.
Short-Term Investments — Xcel Energy Inc., NSP-Minnesota, NSP-Wisconsin, PSCo and SPS maintain cash operating and short-term investment accounts. At Dec. 31, 2017 and 2016, there was $3 million and $4 million of cash held in these accounts, respectively.
Short-Term Debt — Xcel Energy Inc., NSP-Minnesota, NSP-Wisconsin, PSCo and SPS each have individual commercial paper programs. The authorizedAuthorized levels for these commercial paper programs are:
•$11.25 billion for Xcel Energy Inc.;
•$700 million for PSCo;PSCo.
•$500 million for NSP-Minnesota;NSP-Minnesota.
•$400500 million for SPS; andSPS.
•$150 million for NSP-Wisconsin.
In addition, Xcel Energy Inc. has a 364-day term loan agreement to borrow up to $500 million. At Dec. 31, 2017, repaid its $1.2 billion 364-Day Term Loan Agreement in the fourth quarter.
Xcel Energy Inc. had drawn $250 million on the term loan.Energy’s outstanding short-term debt:
| | | | | | | | |
| (Amounts in Millions, Except Interest Rates) | | Three Months Ended Dec. 31, 2021 |
| Borrowing limit | | $ | 3,100 | |
| Amount outstanding at period end | | 1,005 | |
| Average amount outstanding | | 1,200 | |
| Maximum amount outstanding | | 1,774 | |
| Weighted average interest rate, computed on a daily basis | | 0.54 | % |
| Weighted average interest rate at end of period | | 0.31 | |
Short-term debt outstanding for Xcel Energy was as follows: | | | | | | | | | | | | | | | | |
| (Amounts in Millions, Except Interest Rates) | | Year Ended Dec. 31, 2021 | | Year Ended Dec. 31, 2020 | | |
| Borrowing limit | | $ | 3,100 | | | $ | 3,100 | | | |
| Amount outstanding at period end | | 1,005 | | | 584 | | | |
| Average amount outstanding | | 1,399 | | | 1,126 | | | |
| Maximum amount outstanding | | 2,054 | | | 2,080 | | | |
| Weighted average interest rate, computed on a daily basis | | 0.57 | % | | 1.45 | % | | |
| Weighted average interest rate at end of period | | 0.31 | | | 0.23 | | | |
|
| | | | |
| (Amounts in Millions, Except Interest Rates) | | Three Months Ended Dec. 31, 2017 |
| Borrowing limit | | $ | 3,250 |
|
| Amount outstanding at period end | | 814 |
|
| Average amount outstanding | | 560 |
|
| Maximum amount outstanding | | 814 |
|
| Weighted average interest rate, computed on a daily basis | | 1.63 | % |
| Weighted average interest rate at end of period | | 1.90 |
|
|
| | | | | | | | | | | | |
| (Amounts in Millions, Except Interest Rates) | | Year Ended Dec. 31, 2017 | | Year Ended Dec. 31, 2016 | | Year Ended Dec. 31, 2015 |
| Borrowing limit | | $ | 3,250 |
| | $ | 2,750 |
| | $ | 2,750 |
|
| Amount outstanding at period end | | 814 |
| | 392 |
| | 846 |
|
| Average amount outstanding | | 644 |
| | 485 |
| | 601 |
|
| Maximum amount outstanding | | 1,247 |
| | 1,183 |
| | 1,360 |
|
| Weighted average interest rate, computed on a daily basis | | 1.35 | % | | 0.74 | % | | 0.48 | % |
| Weighted average interest rate at end of period | | 1.90 |
| | 0.95 |
| | 0.82 |
|
Credit Facility Agreements— Xcel Energy Inc., NSP-Minnesota, PSCo and SPS each have the right to request an extension of the revolving credit facility June 2021 termination date for two additional one-year periods.periods beyond the June 2024 termination date. NSP-Wisconsin has the right to request an extension of the revolving credit facility termination date for an additional one-year period.year. All extension requests are subject to majority bank group approval.
Xcel Energy Inc. entered into a 364-Day Term Loan Agreement on Dec. 5, 2017 to borrow up to $500 million. As of Dec. 31, 2017, Xcel Energy Inc. had borrowed $250 million of the Term Loan. Xcel Energy Inc. may recommit for one additional 364-day period from the December 2018 maturity date, subject to majority consent from lenders.
As of Feb. 20, 2018,18, 2022, Xcel Energy Inc. and its utility subsidiaries had the following committed credit facilities available to meet liquidity needs:
| | | | | | | | | | | | | | | | | | | | | | | | | | | | | | | | |
| (Millions of Dollars) | | Facility (a) | | Drawn (b) | | Available | | Cash | | Liquidity |
| Xcel Energy Inc. | | $ | 1,250 | | | $ | 757 | | | $ | 493 | | | $ | 2 | | | $ | 495 | |
| PSCo | | 700 | | | 26 | | | 674 | | | 22 | | | 696 | |
| NSP-Minnesota | | 500 | | | 11 | | | 489 | | | 13 | | | 502 | |
| SPS | | 500 | | | 235 | | | 265 | | | 3 | | | 268 | |
| NSP-Wisconsin | | 150 | | | — | | | 150 | | | 3 | | | 153 | |
| Total | | $ | 3,100 | | | $ | 1,029 | | | $ | 2,071 | | | $ | 43 | | | $ | 2,114 | |
(a)Credit facilities expire in June 2024.
(b)Includes outstanding commercial paper and letters of credit.
|
| | | | | | | | | | | | | | | | | | | | |
| (Millions of Dollars) | | Facility (a) | | Drawn (b) | | Available | | Cash | | Liquidity |
| Xcel Energy Inc. | | $ | 1,500 |
| | $ | 877 |
| | $ | 623 |
| | $ | — |
| | $ | 623 |
|
| PSCo | | 700 |
| | 21 |
| | 679 |
| | 1 |
| | 680 |
|
| NSP-Minnesota | | 500 |
| | 81 |
| | 419 |
| | 2 |
| | 421 |
|
| SPS | | 400 |
| | 31 |
| | 369 |
| | 1 |
| | 370 |
|
| NSP-Wisconsin | | 150 |
| | 3 |
| | 147 |
| | 1 |
| | 148 |
|
| Total | | $ | 3,250 |
| | $ | 1,013 |
| | $ | 2,237 |
| | $ | 5 |
| | $ | 2,242 |
|
44
| |
(a)
| These credit facilities mature in June 2021, with the exception of Xcel Energy Inc.’s $500 million 364-day term loan agreement entered into in December 2017. |
| |
(b)
| Includes outstanding commercial paper, term loan borrowings and letters of credit. |
Money Pool — Xcel Energy received FERC approval to establish a utility money pool arrangement with the utility subsidiaries, subject to receipt of required state regulatory approvals. The utility money pool allows for short-term investments in and borrowings between the utility subsidiaries. Xcel Energy Inc. may make investments in the utility subsidiaries at market-based interest rates; however, the money pool arrangement does not allow the utility subsidiaries to make investments in Xcel Energy Inc. The money pool balances are eliminated in consolidation.
NSP-Minnesota, PSCo and SPS participate in the money pool pursuant to approval from their respective state regulatory commissions. NSP-Wisconsin does not participate in the money pool.
Registration Statements — Xcel Energy Inc.’s Articles of Incorporation authorize the issuance of one billion shares of $2.50 par value common stock. As of Dec. 31, 20172021 and 2016,2020, Xcel Energy Inc. had approximately 508 544 million shares and 507537 million shares of common stock outstanding, respectively. In addition, Xcel Energy Inc.’s Articles of Incorporation authorize the issuance of seven million shares of $100 par value preferred stock. Xcel Energy Inc. had no shares of preferred stock outstanding on Dec. 31, 2017 and 2016.
Xcel Energy Inc. and its utility subsidiaries have registration statements on file with the SEC pursuant to which they may sell securities from time to time. These registration statements, which are uncapped, permit Xcel Energy Inc. and its utility subsidiaries to issue debt and other securities in the future at amounts, prices and with terms to be determined at the time of future offerings, and in the case of our utility subsidiaries, subject to commission approval.
Planned Financing PlansActivity— Xcel Energy Inc. and its utility subsidiaries’ 2018 debtEnergy’s 2022 financing plans reflect the following:
•Xcel Energy Inc. plans to issue— approximately $600 million in unsecured bonds during Q2.
•PSCo — approximately $750 million of senior unsecured bonds;
NSP-Minnesota plans to issue approximately $300$650 million of first mortgage bonds;bonds during Q2.
NPS-Wisconsin plans to issue•SPS — approximately $200$150 million of first mortgage bonds;bonds during Q2.
PSCo plans to issue•NSP-Minnesota — approximately $750$500 million of first mortgage bonds; andbonds during Q2.
SPS plans to issue•NSP-Wisconsin — approximately $350$100 million of first mortgage bonds.bonds during Q3.
Equity through DRIP and Benefits Program —Xcel Energy also plans to issueissue approximately $300 million of incremental equity in addition to $385$90 million of equity to be issuedannually through the DRIP and benefit programs during the five-year forecast time period.
ATM Equity Offering — In November 2021, Xcel Energy Inc. filed a prospectus supplement under which it may sell up to $800 million of its common stock through an ATM program. As of Dec. 31, 2021, Xcel Energy Inc. issued 5.33 million shares of common stock with net proceeds of $347 million through the ATM program.
Financing plans are subject to change, depending on capital expenditures, regulatory outcomes, internal cash generation, market conditions and other factors.
Long-Term Borrowings and Other Financing Instruments— See the consolidated statements of capitalization and a discussion of the long-term borrowings in Note 45 to the consolidated financial statements.statements for further information.
Off-Balance-Sheet Arrangements
Xcel Energy does not have any off-balance-sheet arrangements, other than those currently disclosed, that have or are reasonably likely to have a current or future effect on financial condition, changes in financial condition, revenues or expenses, results of operations, liquidity, capital expenditures or capital resources that is material to investors.
Earnings Guidance and Long-Term EPS and Dividend Growth Rate Objectives
Xcel Energy 2022 Earnings Guidance — Xcel Energy’s 20182022 GAAP and ongoing earnings guidance is $2.37a range of $3.10 to $2.47$3.20 per share.(a)
Key assumptions:assumptions as compared with 2021 levels unless noted:
•Constructive outcomes in all rate case and regulatory proceedings.
•Normal weather patterns.patterns for the year.
•Weather-normalized retail electric sales are projected to be within a range of 0 percent to 0.5 percent over 2017 levels.increase ~1%.
•Weather-normalized retail firm natural gas sales are projected to be within a range of 0 percent0% to 0.5 percent below 2017 levels.1%.
•Capital rider revenue is projected to increase by $30$35 million to $40$45 million over 2017 levels.(net of PTCs). PTCs are flowed backcredited to customers, primarily through capital riders and reductions to electric margin.other regulatory mechanisms.
•O&M expenses are projected to be flat.increase approximately 1% to 2%.
•Depreciation expense is projected to increase approximately $150$255 million to $160 million over 2017 levels. Approximately $20 million of the increase in depreciation expense reflects an increased renewable development fund, which is recovered in revenue and will not have an impact on earnings.$265 million.
•Property taxes are projected to increase approximately $30$40 million to $40 million over 2017 levels.$50 million.
•Interest expense (net of AFUDC —- debt) is projected to increase $20$55 million to $30 million over 2017 levels.$65 million.
•AFUDC —- equity is projected to increase approximately $20 million to $30 million from 2017 levels.be relatively flat.
The •ETR is projected to be approximately 8 percent~(3%) to 10 percent.(5%). The lower ETR for 2018 compared to 2017 reflects the lower tax rate as partbenefits of the TCJA, including excess deferred taxes and PTCs which are flowed backcredited to customers through margin. The ETR would be approximately 21 percentelectric margin and will not have a material impact on net income.
(a) Ongoing earnings is calculated using net income and adjusting for certain nonrecurring or infrequent items that are, in management’s view, not reflective of ongoing operations. Ongoing earnings could differ from those prepared in accordance with GAAP for unplanned and/or unknown adjustments. Xcel Energy is unable to 23 percent excluding excess deferred taxes and PTCs.forecast if any of these items will occur or provide a quantitative reconciliation of the guidance for ongoing EPS to corresponding GAAP EPS.
| |
(a)
| Ongoing earnings is calculated using net income and adjusting for certain nonrecurring or infrequent items that are, in management’s view, not reflective of ongoing operations. Ongoing earnings could differ from those prepared in accordance with GAAP for unplanned and/or unknown adjustments. Xcel Energy is unable to forecast if any of these items will occur or provide a quantitative reconciliation of the guidance for ongoing diluted EPS to corresponding GAAP diluted EPS. |
Long-Term EPS and Dividend Growth Rate Objectives
Long-Term EPS and Dividend Growth Rate Objectives —Xcel Energy expects to deliver an attractive total return to our shareholders through a combination of earnings growth and dividend yield, based on the following long-term objectives:
• Deliver long-term annual EPS growth of 5 percent5% to 6 percent7% based off of a 20172021 base of $2.30$2.96 per share;share, which represents the mid-point of the revised 2021 guidance range of $2.94 to $2.98 per share.
• Deliver annual dividend increases of 5 percent5% to 7 percent;7%.
• Target a dividend payout ratio of 60 percent60% to 70 percent; and70%.
• Maintain senior secured debt credit ratings in the A rangerange.
| | |
| ITEM 7A — QUANTITATIVE AND QUALITATIVE DISCLOSURES ABOUT MARKET RISK |
See the “Derivatives, Risk Management and senior unsecured debt credit ratingsMarket Risk” section in the BBB+ to A range.
Item 7A — Quantitative and Qualitative Disclosures About Market Risk
See Item 7, incorporated by reference.
Item 8 — Financial Statements and Supplementary Data
| | |
| ITEM 8 — FINANCIAL STATEMENTS AND SUPPLEMENTARY DATA |
See Item 15-1 for an index of financial statements included herein.
See Note 1815 to the consolidated financial statements for summarized quarterly financial data.further information.
Management Report on Internal ControlsControl Over Financial Reporting
The management of Xcel Energy Inc. is responsible for establishing and maintaining adequate internal control over financial reporting. Xcel Energy Inc.’s internal control system was designed to provide reasonable assurance to Xcel Energy Inc.’s management and boardBoard of directorsDirectors regarding the preparation and fair presentation of published financial statements.
All internal control systems, no matter how well designed, have inherent limitations. Therefore, even those systems determined to be effective can provide only reasonable assurance with respect to financial statement preparation and presentation.
In 2016, Xcel Energy Inc. implemented the general ledger modules, as well as initiated deployment of work management systems modules, of a new enterprise resource planning system. Xcel Energy Inc. implemented additional work management systems modules in 2017. Xcel Energy Inc. does not believe this implementation had an adverse effect on its internal control over financial reporting.
Xcel Energy Inc. management assessed the effectiveness of Xcel Energy Inc.’s internal control over financial reporting as of Dec. 31, 2017.2021. In making this assessment, it used the criteria set forth by the Committee of Sponsoring Organizations of the Treadway Commission (COSO) in Internal Control — Integrated Framework (2013). Based on our assessment, we believe that, as of Dec. 31, 2017,2021, Xcel Energy Inc.’s internal control over financial reporting is effective at the reasonable assurance level based on those criteria.
Xcel Energy Inc.’s independent registered public accounting firm has issued an auditattestation report on the Xcel Energy Inc.’s internal control over financial reporting. Its report appears herein.
|
| | | | | | | | | | | | | |
/s/ BEN FOWKE | | /s/ ROBERT C. FRENZEL | | | /s/ BRIAN J. VAN ABEL | |
Ben Fowke | | Robert C. Frenzel | | | Brian J. Van Abel | |
Chairman, President, and Chief Executive Officer and Director | | Executive Vice President, Chief Financial Officer |
Feb. 23, 20182022 | | | Feb. 23, 20182022 | |
| | | | |
REPORT OF INDEPENDENT REGISTERED PUBLIC ACCOUNTING FIRM
To the stockholders and the Board of Directors and Stockholders of
Xcel Energy Inc.
OpinionOpinions on the Financial Statements and Internal Control over Financial Reporting
We have audited the accompanying consolidated balance sheets of Xcel Energy Inc. and subsidiaries (the "Company") as of December 31, 20172021 and 2016,2020, the related consolidated statements of income, comprehensive income, stockholders' equity, and cash flows, and common stockholders' equity, for each of the three years in the period ended December 31, 2017,2021, and the related notes and the schedules listed in the Index at Item 15 (collectively referred to as the "financial statements"). We also have audited the Company’s internal control over financial reporting as of December 31, 2021, based on criteria established in Internal Control — Integrated Framework (2013) issued by the Committee of Sponsoring Organizations of the Treadway Commission (COSO).
In our opinion, the financial statements referred to above present fairly, in all material respects, the financial position of the Company as of December 31, 20172021 and 2016,2020, and the results of its operations and its cash flows for each of the three years in the period ended December 31, 2017,2021, in conformity with accounting principles generally accepted in the United States of America.
We have also audited, Also, in accordance withour opinion, the standards of the Public Company Accounting Oversight Board (United States) (PCAOB), the Company'smaintained, in all material respects, effective internal control over financial reporting as of December 31, 2017,2021, based on criteria established in Internal Control -— Integrated Framework (2013) issued by the Committee of Sponsoring Organizations of the Treadway Commission and our report dated February 23, 2018, expressed an unqualified opinion on the Company'sCOSO.
Basis for Opinions
The Company’s management is responsible for these financial statements, for maintaining effective internal control over financial reporting.
Basisreporting, and for Opinion
These financial statements are the responsibilityits assessment of the Company's management.effectiveness of internal control over financial reporting, included in the accompanying Management Report on Internal Controls over Financial Reporting. Our responsibility is to express an opinion on the Company'sthese financial statements and an opinion on the Company’s internal control over financial reporting based on our audits. We are a public accounting firm registered with the PCAOBPublic Company Accounting Oversight Board (United States) (PCAOB) and are required to be independent with respect to the Company in accordance with the U.S. federal securities laws and the applicable rules and regulations of the Securities and Exchange Commission and the PCAOB.
We conducted our audits in accordance with the standards of the PCAOB. Those standards require that we plan and perform the auditaudits to obtain reasonable assurance about whether the financial statements are free of material misstatement, whether due to error or fraud. fraud, and whether effective internal control over financial reporting was maintained in all material respects.
Our audits of the financial statements included performing procedures to assess the risks of material misstatement of the financial statements, whether due to error or fraud, and performing procedures thatto respond to those risks. Such procedures included examining, on a test basis, evidence regarding the amounts and disclosures in the financial statements. Our audits also included evaluating the accounting principles used and significant estimates made by management, as well as evaluating the overall presentation of the financial statements. We believe that our audits provide a reasonable basis for our opinion.
/s/ DELOITTE & TOUCHE LLP
Minneapolis, Minnesota
February 23, 2018
We have served as the Company's auditor since 2002.
REPORT OF INDEPENDENT REGISTERED PUBLIC ACCOUNTINGFIRM
To the Board of Directors and Stockholders of
Xcel Energy Inc.
Opinion on Internal Control over Financial Reporting
We have audited the internal control over financial reporting of Xcel Energy Inc. and subsidiaries (the “Company”) as of December 31, 2017, based on criteria established in Internal Control - Integrated Framework (2013) issued by the Committee of Sponsoring Organizations of the Treadway Commission (COSO). In our opinion, the Company maintained, in all material respects, effective internal control over financial reporting as of December 31, 2017, based on criteria established in Internal Control - Integrated Framework (2013) issued by COSO.
We have also audited, in accordance with the standards of the Public Company Accounting Oversight Board (United States) (PCAOB), the consolidated financial statements as of and for the year ended December 31, 2017, of the Company and our report dated February 23, 2018, expressed an unqualified opinion on those financial statements.
Basis for Opinion
The Company’s management is responsible for maintaining effective internal control over financial reporting and for its assessment of the effectivenessOur audit of internal control over financial reporting included in the accompanying Management Report on Internal Controls over Financial Reporting. Our responsibility is to express an opinion on the Company’s internal control over financial reporting based on our audit. We are a public accounting firm registered with the PCAOB and are required to be independent with respect to the Company in accordance with the U.S. federal securities laws and the applicable rules and regulations of the Securities and Exchange Commission and the PCAOB.
We conducted our audit in accordance with the standards of the PCAOB. Those standards require that we plan and perform the audit to obtain reasonable assurance about whether effective internal control over financial reporting was maintained in all material respects. Our audit included obtaining an understanding of internal control over financial reporting, assessing the risk that a material weakness exists, and testing and evaluating the design and operating effectiveness of internal control based on the assessed risk, andrisk. Our audits also included performing such other procedures as we considered necessary in the circumstances. We believe that our audit providesaudits provide a reasonable basis for our opinion.opinions.
Definition and Limitations of Internal Control over Financial Reporting
A company’s internal control over financial reporting is a process designed to provide reasonable assurance regarding the reliability of financial reporting and the preparation of financial statements for external purposes in accordance with generally accepted accounting principles. A company’s internal control over financial reporting includes those policies and procedures that (1) pertain to the maintenance of records that, in reasonable detail, accurately and fairly reflect the transactions and dispositions of the assets of the company; (2) provide reasonable assurance that transactions are recorded as necessary to permit preparation of financial statements in accordance with generally accepted accounting principles, and that receipts and expenditures of the company are being made only in accordance with authorizations of management and directors of the company; and (3) provide reasonable assurance regarding prevention or timely detection of unauthorized acquisition, use, or disposition of the company’s assets that could have a material effect on the financial statements.
Because of its inherent limitations, internal control over financial reporting may not prevent or detect misstatements. Also, projections of any evaluation of effectiveness to future periods are subject to the risk that controls may become inadequate because of changes in conditions, or that the degree of compliance with the policies or procedures may deteriorate.
Critical Audit Matter
/s/ DELOITTE & TOUCHE LLP
Minneapolis, Minnesota
February 23, 2018
The critical audit matter communicated below is a matter arising from the current-period audit of the financial statements that was communicated or required to be communicated to the audit committee and that (1) relates to accounts or disclosures that are material to the financial statements and (2) involved our especially challenging, subjective, or complex judgments. The communication of critical audit matters does not alter in any way our opinion on the financial statements, taken as a whole, and we are not, by communicating the critical audit matter below, providing a separate opinion on the critical audit matter or on the accounts or disclosures to which it relates.
XCEL ENERGY INC. AND SUBSIDIARIES CONSOLIDATED STATEMENTS OF INCOME (amounts in millions, except per share data)
|
| | | | | | | | | | | | |
| | | Year Ended Dec. 31 |
| | | 2017 | | 2016 | | 2015 |
| Operating revenues | | | | | | |
| Electric | | $ | 9,676 |
| | $ | 9,500 |
| | $ | 9,276 |
|
| Natural gas | | 1,650 |
| | 1,531 |
| | 1,672 |
|
| Other | | 78 |
| | 76 |
| | 76 |
|
| Total operating revenues | | 11,404 |
| | 11,107 |
| | 11,024 |
|
| | | | | | | |
| Operating expenses | | | | | | |
| Electric fuel and purchased power | | 3,757 |
| | 3,718 |
| | 3,763 |
|
| Cost of natural gas sold and transported | | 823 |
| | 733 |
| | 905 |
|
| Cost of sales — other | | 34 |
| | 36 |
| | 36 |
|
| Operating and maintenance expenses | | 2,303 |
| | 2,326 |
| | 2,330 |
|
| Conservation and demand side management program expenses | | 273 |
| | 245 |
| | 225 |
|
| Depreciation and amortization | | 1,479 |
| | 1,303 |
| | 1,124 |
|
| Taxes (other than income taxes) | | 545 |
| | 532 |
| | 512 |
|
| Loss on Monticello life cycle management/extended power uprate project | | — |
| | — |
| | 129 |
|
| Total operating expenses | | 9,214 |
| | 8,893 |
| | 9,024 |
|
| | | | | | | |
| Operating income | | 2,190 |
| | 2,214 |
| | 2,000 |
|
| | | | | | | |
| Other income, net | | 23 |
| | 8 |
| | 6 |
|
| Equity earnings of unconsolidated subsidiaries | | 30 |
| | 42 |
| | 34 |
|
| Allowance for funds used during construction — equity | | 75 |
| | 60 |
| | 56 |
|
| | | | | | | |
| Interest charges and financing costs | | | | | | |
Interest charges — includes other financing costs of $24, $25 and $24, respectively | | 663 |
| | 647 |
| | 595 |
|
| Allowance for funds used during construction — debt | | (35 | ) | | (27 | ) | | (26 | ) |
| Total interest charges and financing costs | | 628 |
| | 620 |
| | 569 |
|
| | | | | | | |
| Income before income taxes | | 1,690 |
| | 1,704 |
| | 1,527 |
|
| Income taxes | | 542 |
| | 581 |
| | 543 |
|
| Net income | | $ | 1,148 |
| | $ | 1,123 |
| | $ | 984 |
|
| | | | | | | |
| Weighted average common shares outstanding: | | | | | | |
| Basic | | 509 |
| | 509 |
| | 508 |
|
| Diluted | | 509 |
| | 509 |
| | 508 |
|
| | | | | | | |
| Earnings per average common share: | | | | | | |
| Basic | | $ | 2.26 |
| | $ | 2.21 |
| | $ | 1.94 |
|
| Diluted | | 2.25 |
| | 2.21 |
| | 1.94 |
|
| | | | | | | |
| Cash dividends declared per common share | | $ | 1.44 |
| | $ | 1.36 |
| | $ | 1.28 |
|
| | | | | | | |
| See Notes to Consolidated Financial Statements |
Critical Audit Matter Description
The Company is subject to rate regulation by state utility regulatory agencies, which have jurisdiction with respect to the rates of electric and natural gas distribution companies in Minnesota, North Dakota, South Dakota, Wisconsin, Michigan, Colorado, New Mexico, and Texas. The Company is also subject to the jurisdiction of the Federal Energy Regulatory Commission for its wholesale electric operations, hydroelectric generation licensing, accounting practices, wholesale sales for resale, transmission of electricity in interstate commerce, compliance with North American Electric Reliability Corporation standards, asset transactions and mergers and natural gas transactions in interstate commerce, (collectively with state utility regulatory agencies, the “Commissions”). Management has determined it meets the requirements under accounting principles generally accepted in the United States of America to prepare its financial statements applying the specialized rules to account for the effects of cost-based rate regulation. Accounting for the economics of rate regulation affects multiple financial statement line items and disclosures, including property, plant and equipment, regulatory assets and liabilities, operating revenues and expenses, and income taxes. XCEL ENERGY INC. AND SUBSIDIARIES CONSOLIDATED STATEMENTS OF COMPREHENSIVE INCOME (amounts in millions)
|
| | | | | | | | | | | | |
| | | Year Ended Dec. 31 |
| | | 2017 | | 2016 | | 2015 |
| | | | | | | |
| Net income | | $ | 1,148 |
| | $ | 1,123 |
| | $ | 984 |
|
| | | | | | | |
| Other comprehensive income (loss) | | | | | | |
| | | | | | | |
| Pension and retiree medical benefits: | | | | | | |
| Net pension and retiree medical losses arising during the period, net of tax of $(2), $(5), and $(5), respectively | | (3 | ) | | (8 | ) | | (8 | ) |
| Amortization of losses included in net periodic benefit cost, net of tax of $5, $2, and $2, respectively | | 7 |
| | 4 |
| | 3 |
|
| | | 4 |
| | (4 | ) | | (5 | ) |
| Derivative instruments: | | | | | | |
| Reclassification of losses to net income, net of tax of $2, $2, and $2, respectively | | 3 |
| | 4 |
| | 3 |
|
| | | | | | | |
| Other comprehensive income (loss) | | 7 |
| | — |
| | (2 | ) |
| Comprehensive income | | $ | 1,155 |
| | $ | 1,123 |
| | $ | 982 |
|
| | | | | | | |
| See Notes to Consolidated Financial Statements |
We identified the impact of rate regulation as a critical audit matter due to the significant judgments made by management to support its assertions about impacted account balances and disclosures and the high degree of subjectivity involved in assessing the impact of future regulatory orders on the financial statements. Management judgments include assessing the likelihood of (1) recovery in future rates of incurred costs, (2) a disallowance of part of the cost of recently completed plant, and 3) a refund due to customers. Given that management’s accounting judgments are based on assumptions about the outcome of future decisions by the Commissions, auditing these judgments required specialized knowledge of accounting for rate regulation and the rate setting process due to its inherent complexities.
How the Critical Audit Matter Was Addressed in the Audit
Our audit procedures related to the uncertainty of future decisions by the Commissions included the following, among others:
•We tested the effectiveness of management’s controls over the evaluation of the likelihood of (1) the recovery in future rates of costs deferred as regulatory assets, and (2) a refund or a future reduction in rates that should be reported as regulatory liabilities. We also tested the effectiveness of management’s controls over the recognition of regulatory assets or liabilities and the monitoring and evaluation of regulatory developments that may affect the likelihood of recovering costs in future rates or of a future reduction in rates. XCEL ENERGY INC. AND SUBSIDIARIES CONSOLIDATED STATEMENTS OF CASH FLOWS (amounts in millions) |
| | | | | | | | | | | |
| | Year Ended Dec. 31 |
| | 2017 | | 2016 | | 2015 |
| Operating activities | | | |
| | |
| Net income | $ | 1,148 |
| | $ | 1,123 |
| | $ | 984 |
|
| Adjustments to reconcile net income to cash provided by operating activities: | | | | | |
| Depreciation and amortization | 1,495 |
| | 1,319 |
| | 1,143 |
|
| Conservation and demand side management program amortization | 2 |
| | 4 |
| | 5 |
|
| Nuclear fuel amortization | 114 |
| | 117 |
| | 106 |
|
| Deferred income taxes | 640 |
| | 587 |
| | 536 |
|
| Amortization of investment tax credits | (5 | ) | | (5 | ) | | (5 | ) |
| Allowance for equity funds used during construction | (75 | ) | | (60 | ) | | (56 | ) |
| Equity earnings of unconsolidated subsidiaries | (30 | ) | | (42 | ) | | (34 | ) |
| Dividends from unconsolidated subsidiaries | 41 |
| | 46 |
| | 40 |
|
| Provision for bad debts | 39 |
| | 39 |
| | 36 |
|
| Share-based compensation expense | 57 |
| | 41 |
| | 45 |
|
| Loss on Monticello life cycle management/extended power uprate project | — |
| | — |
| | 129 |
|
| Net realized and unrealized hedging and derivative transactions | 2 |
| | 8 |
| | 22 |
|
| Other, net | (3 | ) | | (1 | ) | | (1 | ) |
| Changes in operating assets and liabilities: | | | | | |
| Accounts receivable | (60 | ) | | (83 | ) | | 66 |
|
| Accrued unbilled revenues | (34 | ) | | (75 | ) | | 74 |
|
| Inventories | (3 | ) | | 1 |
| | (11 | ) |
| Other current assets | 9 |
| | 61 |
| | 9 |
|
| Accounts payable | 43 |
| | 118 |
| | (120 | ) |
| Net regulatory assets and liabilities | (16 | ) | | (19 | ) | | 102 |
|
| Other current liabilities | (38 | ) | | 20 |
| | 78 |
|
| Pension and other employee benefit obligations | (133 | ) | | (91 | ) | | (69 | ) |
| Change in other noncurrent assets | (1 | ) | | (16 | ) | | 11 |
|
| Change in other noncurrent liabilities | (66 | ) | | (40 | ) | | (52 | ) |
| Net cash provided by operating activities | 3,126 |
| | 3,052 |
| | 3,038 |
|
| | | | | | |
| Investing activities | |
| | |
| | |
| Utility capital/construction expenditures | (3,319 | ) | | (3,256 | ) | | (3,683 | ) |
| Allowance for equity funds used during construction | 75 |
| | 61 |
| | 56 |
|
| Proceeds from insurance recoveries | — |
| | 5 |
| | 27 |
|
| Purchases of investment securities | (1,697 | ) | | (547 | ) | | (1,258 | ) |
| Proceeds from the sale of investment securities | 1,669 |
| | 479 |
| | 1,237 |
|
| Investments in unconsolidated subsidiaries and other | (17 | ) | | (4 | ) | | (2 | ) |
| Other, net | (7 | ) | | 1 |
| | — |
|
| Net cash used in investing activities | (3,296 | ) | | (3,261 | ) | | (3,623 | ) |
| | | | | | |
| Financing activities | | | | | |
| Proceeds from (repayments of) short-term borrowings, net | 422 |
| | (454 | ) | | (174 | ) |
| Proceeds from issuance of long-term debt | 1,518 |
| | 2,424 |
| | 1,626 |
|
| Repayments of long-term debt, including reacquisition premiums | (1,030 | ) | | (1,036 | ) | | (251 | ) |
| Proceeds from issuance of common stock | — |
| | — |
| | 7 |
|
| Repurchases of common stock | (3 | ) | | (32 | ) | | — |
|
| Dividends paid | (721 | ) | | (681 | ) | | (607 | ) |
| Other | (18 | ) | | (12 | ) | | (11 | ) |
| Net cash provided by financing activities | 168 |
| | 209 |
| | 590 |
|
| | | | | | |
| Net change in cash and cash equivalents | (2 | ) | | — |
| | 5 |
|
| Cash and cash equivalents at beginning of period | 85 |
| | 85 |
| | 80 |
|
| Cash and cash equivalents at end of period | $ | 83 |
| | $ | 85 |
| | $ | 85 |
|
| | | | | | |
| Supplemental disclosure of cash flow information: | |
| | |
| | |
| Cash paid for interest (net of amounts capitalized) | $ | (616 | ) | | $ | (592 | ) | | $ | (543 | ) |
| Cash received for income taxes, net | 44 |
| | 62 |
| | 58 |
|
| Supplemental disclosure of non-cash investing and financing transactions: | | | |
| | |
|
| Property, plant and equipment additions in accounts payable | $ | 415 |
| | $ | 254 |
| | $ | 322 |
|
| Issuance of common stock for reinvested dividends and equity awards | 31 |
| | 29 |
| | 53 |
|
| | | | | | |
| See Notes to Consolidated Financial Statements |
•We read relevant regulatory orders issued by the Commissions for the Company, regulatory statutes, interpretations, procedural schedules and memorandums, filings made by intervenors, experts’ testimony and other publicly available information to assess the likelihood of recovery in future rates or of a future reduction in rates based on precedents of the Commissions’ treatment of similar costs under similar circumstances. We also evaluated regulatory filings for any evidence that intervenors are challenging full recovery of the cost of any capital projects. If the full recovery of project costs is being challenged by intervenors, we evaluated management’s assessment of the probability of a disallowance. We evaluated the external information and compared to the Company’s recorded regulatory assets and liabilities for completeness.
•We obtained management’s analysis and correspondence from counsel, as appropriate, regarding regulatory assets or liabilities not yet addressed in a regulatory order to assess management’s assertion that amounts are probable of recovery or a future reduction in rates. XCEL ENERGY INC. AND SUBSIDIARIES CONSOLIDATED BALANCE SHEETS (amounts in millions, except share and per share data)
|
| | | | | | | | |
| | | Dec. 31 |
| | | 2017 | | 2016 |
| Assets | | | | |
| Current assets | | | | |
| Cash and cash equivalents | | $ | 83 |
| | $ | 85 |
|
| Accounts receivable, net | | 797 |
| | 776 |
|
| Accrued unbilled revenues | | 764 |
| | 730 |
|
| Inventories | | 610 |
| | 604 |
|
| Regulatory assets | | 424 |
| | 364 |
|
| Derivative instruments | | 44 |
| | 38 |
|
| Prepaid taxes | | 68 |
| | 107 |
|
| Prepayments and other | | 183 |
| | 138 |
|
| Total current assets | | 2,973 |
| | 2,842 |
|
| | | | | |
| Property, plant and equipment, net | | 34,329 |
| | 32,842 |
|
| | | | | |
| Other assets | | | | |
| Nuclear decommissioning fund and other investments | | 2,397 |
| | 2,092 |
|
| Regulatory assets | | 3,005 |
| | 3,081 |
|
| Derivative instruments | | 48 |
| | 50 |
|
| Deposits and other | | 278 |
| | 248 |
|
| Total other assets | | 5,728 |
| | 5,471 |
|
| Total assets | | $ | 43,030 |
| | $ | 41,155 |
|
| | | | | |
| Liabilities and Equity | | | | |
| Current liabilities | | | | |
| Current portion of long-term debt | | $ | 457 |
| | $ | 255 |
|
| Short-term debt | | 814 |
| | 392 |
|
| Accounts payable | | 1,243 |
| | 1,045 |
|
| Regulatory liabilities | | 239 |
| | 221 |
|
| Taxes accrued | | 448 |
| | 457 |
|
| Accrued interest | | 174 |
| | 173 |
|
| Dividends payable | | 183 |
| | 172 |
|
| Derivative instruments | | 29 |
| | 27 |
|
| Other | | 501 |
| | 505 |
|
| Total current liabilities | | 4,088 |
| | 3,247 |
|
| | | | | |
| Deferred credits and other liabilities | | | | |
| Deferred income taxes | | 3,845 |
| | 6,784 |
|
| Deferred investment tax credits | | 58 |
| | 63 |
|
| Regulatory liabilities | | 5,083 |
| | 1,383 |
|
| Asset retirement obligations | | 2,475 |
| | 2,782 |
|
| Derivative instruments | | 126 |
| | 148 |
|
| Customer advances | | 193 |
| | 195 |
|
| Pension and employee benefit obligations | | 1,042 |
| | 1,112 |
|
| Other | | 145 |
| | 225 |
|
| Total deferred credits and other liabilities | | 12,967 |
| | 12,692 |
|
| | | | | |
| Commitments and contingencies | |
|
| |
|
|
| Capitalization | | | | |
| Long-term debt | | 14,520 |
| | 14,195 |
|
| Common stock — 1,000,000,000 shares authorized of $2.50 par value; 507,762,881 and 507,222,795 shares outstanding at Dec. 31, 2017 and 2016, respectively | | 1,269 |
| | 1,268 |
|
| Additional paid in capital | | 5,898 |
| | 5,881 |
|
| Retained earnings | | 4,413 |
| | 3,982 |
|
| Accumulated other comprehensive loss | | (125 | ) | | (110 | ) |
| Total common stockholders’ equity | | 11,455 |
| | 11,021 |
|
| Total liabilities and equity | | $ | 43,030 |
| | $ | 41,155 |
|
| | | | | |
| See Notes to Consolidated Financial Statements |
XCEL ENERGY INC. AND SUBSIDIARIES CONSOLIDATED STATEMENTS OF COMMON STOCKHOLDERS’ EQUITY (amounts in millions, shares in thousands)
|
| | | | | | | | | | | | | | | | | | | | | | |
| | Common Stock Issued | | | | Accumulated Other Comprehensive Loss | | Total Common Stockholders’ Equity |
| | Shares | | Par Value | | Additional Paid In Capital | | Retained Earnings | | |
| | | | | | | | | | | | |
| Balance at Dec. 31, 2014 | 505,733 |
| | $ | 1,264 |
| | $ | 5,837 |
| | $ | 3,221 |
| | $ | (108 | ) | | $ | 10,214 |
|
| | | | | | | | | | | | |
| Net income | | | | | | | 984 |
| | | | 984 |
|
| Other comprehensive loss | | | | | | | | | (2 | ) | | (2 | ) |
| Dividends declared on common stock | | | | | | | (652 | ) | | | | (652 | ) |
| Issuances of common stock | 1,803 |
| | 5 |
| | 28 |
| | | | | | 33 |
|
| Share-based compensation | |
| | |
| | 24 |
| | | | | | 24 |
|
| Balance at Dec. 31, 2015 | 507,536 |
| | $ | 1,269 |
| | $ | 5,889 |
| | $ | 3,553 |
| | $ | (110 | ) | | $ | 10,601 |
|
| | | | | | | | | | | | |
| Net income | | | | | | | 1,123 |
| | | | 1,123 |
|
| Dividends declared on common stock | | | | | | | (694 | ) | | | | (694 | ) |
| Issuances of common stock | 486 |
| | 1 |
| | 15 |
| | | | | | 16 |
|
Repurchases of common stock
| (799 | ) | | (2 | ) | | (30 | ) | | | | | | (32 | ) |
| Share-based compensation | | | | | 7 |
| | | | | | 7 |
|
| Balance at Dec. 31, 2016 | 507,223 |
| | $ | 1,268 |
| | $ | 5,881 |
| | $ | 3,982 |
| | $ | (110 | ) | | $ | 11,021 |
|
| | | | | | | | | | | | |
| Net income | | | | | | | 1,148 |
| | | | 1,148 |
|
| Other comprehensive income | | | | | | | | | 7 |
| | 7 |
|
| Dividends declared on common stock | | | | | | | (736 | ) | | | | (736 | ) |
| Issuances of common stock | 611 |
| | 1 |
| | 4 |
| | | | | | 5 |
|
| Repurchases of common stock | (71 | ) | | — |
| | (3 | ) | | | | | | (3 | ) |
| Share-based compensation | | | | | 16 |
| | (3 | ) | | | | 13 |
|
| Adoption of ASU No. 2018-02 | | | | | | | 22 |
| | (22 | ) | | — |
|
| Balance at Dec. 31, 2017 | 507,763 |
| | $ | 1,269 |
| | $ | 5,898 |
| | $ | 4,413 |
| | $ | (125 | ) | | $ | 11,455 |
|
| | | | | | | | | | | | |
See Notes to Consolidated Financial Statements
|
XCEL ENERGY INC. AND SUBSIDIARIES CONSOLIDATED STATEMENTS OF CAPITALIZATION (amounts in millions, except share and per share data) |
| | | | | | | | |
| | | Dec. 31 |
| | | 2017 | | 2016 |
| Long-Term Debt | | | | |
| NSP-Minnesota | | | | |
| First Mortgage Bonds, Series due: | | | | |
| March 1, 2018, 5.25% | | $ | — |
| | $ | 500 |
|
| Aug. 15, 2020, 2.2% | | 300 |
| | 300 |
|
| Aug. 15, 2022, 2.15% | | 300 |
| | 300 |
|
| May 15, 2023, 2.6% | | 400 |
| | 400 |
|
| July 1, 2025, 7.125% | | 250 |
| | 250 |
|
| March 1, 2028, 6.5% | | 150 |
| | 150 |
|
| July 15, 2035, 5.25% | | 250 |
| | 250 |
|
| June 1, 2036, 6.25% | | 400 |
| | 400 |
|
| July 1, 2037, 6.2% | | 350 |
| | 350 |
|
| Nov. 1, 2039, 5.35% | | 300 |
| | 300 |
|
| Aug. 15, 2040, 4.85% | | 250 |
| | 250 |
|
| Aug. 15, 2042, 3.4% | | 500 |
| | 500 |
|
| May 15, 2044, 4.125% | | 300 |
| | 300 |
|
| Aug. 15, 2045, 4.0% | | 300 |
| | 300 |
|
| May 15, 2046, 3.6% | | 350 |
| | 350 |
|
Sept. 15, 2047, 3.6%
| | 600 |
| | — |
|
| Unamortized discount | | (22 | ) | | (17 | ) |
| Unamortized debt expense | | (45 | ) | | (40 | ) |
| Total NSP-Minnesota long-term debt | | $ | 4,933 |
| | $ | 4,843 |
|
| | | | | |
| PSCo | |
|
| |
|
|
| First Mortgage Bonds, Series due: | |
|
| |
|
|
| Aug. 1, 2018, 5.8% | | $ | 300 |
| | $ | 300 |
|
| June 1, 2019, 5.125% | | 400 |
| | 400 |
|
| Nov. 15, 2020, 3.2% | | 400 |
| | 400 |
|
| Sept. 15, 2022, 2.25% | | 300 |
| | 300 |
|
| March 15, 2023, 2.5% | | 250 |
| | 250 |
|
| May 15, 2025, 2.9% | | 250 |
| | 250 |
|
| Sept. 1, 2037, 6.25% | | 350 |
| | 350 |
|
| Aug. 1, 2038, 6.5% | | 300 |
| | 300 |
|
| Aug. 15, 2041, 4.75% | | 250 |
| | 250 |
|
| Sept. 15, 2042, 3.6% | | 500 |
| | 500 |
|
| March 15, 2043, 3.95% | | 250 |
| | 250 |
|
| March 15, 2044, 4.30% | | 300 |
| | 300 |
|
| June 15, 2046, 3.55% | | 250 |
| | 250 |
|
June 15, 2047, 3.8%
| | 400 |
| | — |
|
| Capital lease obligations, through 2060, 11.2% — 14.3% | | 151 |
| | 156 |
|
| Unamortized discount | | (13 | ) | | (13 | ) |
| Unamortized debt expense | | (29 | ) | | (27 | ) |
| Total | | 4,609 |
| | 4,216 |
|
| Less current maturities | | 306 |
| | 5 |
|
| Total PSCo long-term debt | | $ | 4,303 |
| | $ | 4,211 |
|
| | | | | |
| SPS | |
|
| |
|
|
| First Mortgage Bonds, Series due: | | | | |
| June 15, 2024, 3.3% | | $ | 350 |
| | $ | 350 |
|
| Aug. 15, 2041, 4.5% | | 400 |
| | 400 |
|
| Aug. 15, 2046, 3.4% | | 300 |
| | 300 |
|
| Aug. 15, 2047, 3.7% | | 450 |
| | — |
|
| Unsecured Senior G Notes, due Dec. 1, 2018, 8.75% | | — |
| | 250 |
|
| Unsecured Senior C and D Notes, due Oct. 1, 2033, 6% | | 100 |
| | 100 |
|
| Unsecured Senior F Notes, due Oct. 1, 2036, 6% | | 250 |
| | 250 |
|
| Unamortized discount | | (2 | ) | | — |
|
| Unamortized debt expense | | (18 | ) | | (14 | ) |
| Total SPS long-term debt | | $ | 1,830 |
| | $ | 1,636 |
|
| | | | | |
| | | | | |
| | | | | |
XCEL ENERGY INC. AND SUBSIDIARIES CONSOLIDATED STATEMENTS OF CAPITALIZATION — (Continued) (amounts in millions, except share and per share data) |
| | | | | | | | |
| | | Dec. 31 |
| | | 2017 | | 2016 |
| | | | | |
| NSP-Wisconsin | | | | |
| First Mortgage Bonds, Series due: | | | | |
| Oct. 1, 2018, 5.25% | | $ | 150 |
| | $ | 150 |
|
| June 15, 2024, 3.3% | | 200 |
| | 200 |
|
| Sept. 1, 2038, 6.375% | | 200 |
| | 200 |
|
| Oct. 1, 2042, 3.7% | | 100 |
| | 100 |
|
| Dec. 1, 2047, 3.75% | | 100 |
| | — |
|
City of La Crosse Resource Recovery Bond, Series due Nov. 1, 2021, 6% (a) | | 19 |
| | 19 |
|
| Other | | 2 |
| | 2 |
|
| Unamortized discount | | (3 | ) | | (3 | ) |
| Unamortized debt expense | | (7 | ) | | (5 | ) |
| Total | | 761 |
| | 663 |
|
| Less current maturities | | 151 |
| | 1 |
|
| Total NSP-Wisconsin long-term debt | | $ | 610 |
| | $ | 662 |
|
| | | | | |
| Other Subsidiaries | | | | |
| Various Eloigne Co. Affordable Housing Project Notes, due 2018-2052, 0% — 7.05% | | $ | 28 |
| | $ | 31 |
|
| Less current maturities | | 2 |
| | 1 |
|
| Total other subsidiaries long-term debt | | $ | 26 |
| | $ | 30 |
|
| | | | | |
| Xcel Energy Inc. | | | | |
| Unsecured Senior Notes, Series due: | | | | |
| June 1, 2017, 1.2% | | $ | — |
| | $ | 250 |
|
| May 15, 2020, 4.7% | | 550 |
| | 550 |
|
| March 15, 2021, 2.4% | | 400 |
| | 400 |
|
| March 15, 2022, 2.6% | | 300 |
| | 300 |
|
| June 1, 2025, 3.3% | | 600 |
| | 600 |
|
| Dec. 1, 2026, 3.35% | | 500 |
| | 500 |
|
| July 1, 2036, 6.5% | | 300 |
| | 300 |
|
| Sept. 15, 2041, 4.8% | | 250 |
| | 250 |
|
| Elimination of PSCo capital lease obligation with affiliates | | (62 | ) | | (64 | ) |
| Unamortized discount | | (2 | ) | | (2 | ) |
| Unamortized debt expense | | (20 | ) | | (23 | ) |
| Total | | 2,816 |
| | 3,061 |
|
| Less current maturities (including elimination of PSCo capital lease obligation) | | (2 | ) | | 248 |
|
| Total Xcel Energy Inc. long-term debt | | 2,818 |
| | 2,813 |
|
| Total long-term debt | | $ | 14,520 |
| | $ | 14,195 |
|
| | | | | |
| Common Stockholders’ Equity | | | | |
Common stock — 1,000,000,000 shares authorized of $2.50 par value; 507,762,881 and
507,222,795 shares outstanding at Dec. 31, 2017 and 2016, respectively | | $ | 1,269 |
| | $ | 1,268 |
|
| Additional paid in capital | | 5,898 |
| | 5,881 |
|
| Retained earnings | | 4,413 |
| | 3,982 |
|
| Accumulated other comprehensive loss | | (125 | ) | | (110 | ) |
| Total common stockholders’ equity | | $ | 11,455 |
| | $ | 11,021 |
|
| | |
(a)
/s/ DELOITTE & TOUCHE LLP |
Resource recovery financing.Minneapolis, Minnesota |
| February 23, 2022 |
|
| We have served as the Company’s auditor since 2002. |
See Notes to Consolidated Financial Statements
XCEL ENERGY INC. AND SUBSIDIARIES
CONSOLIDATED STATEMENTS OF INCOME
(amounts in millions, except per share data)
| | | | | | | | | | | | | | | | | | | | |
| | Year Ended Dec. 31 |
| | 2021 | | 2020 | | 2019 |
| Operating revenues | | | | | | |
| Electric | | $ | 11,205 | | | $ | 9,802 | | | $ | 9,575 | |
| Natural gas | | 2,132 | | | 1,636 | | | 1,868 | |
| Other | | 94 | | | 88 | | | 86 | |
| Total operating revenues | | 13,431 | | | 11,526 | | | 11,529 | |
| | | | | | |
| Operating expenses | | | | | | |
| Electric fuel and purchased power | | 4,733 | | | 3,512 | | | 3,510 | |
| Cost of natural gas sold and transported | | 1,081 | | | 689 | | | 918 | |
| Cost of sales — other | | 38 | | | 37 | | | 40 | |
| Operating and maintenance expenses | | 2,321 | | | 2,324 | | | 2,338 | |
| Conservation and demand side management expenses | | 304 | | | 288 | | | 285 | |
| Depreciation and amortization | | 2,121 | | | 1,948 | | | 1,765 | |
| Taxes (other than income taxes) | | 630 | | | 612 | | | 569 | |
| Total operating expenses | | 11,228 | | | 9,410 | | | 9,425 | |
| | | | | | |
| Operating income | | 2,203 | | | 2,116 | | | 2,104 | |
| | | | | | |
| Other income (expense), net | | 5 | | | (6) | | | 16 | |
| Earnings from equity method investments | | 62 | | | 40 | | | 39 | |
| Allowance for funds used during construction — equity | | 73 | | | 115 | | | 77 | |
| | | | | | |
| Interest charges and financing costs | | | | | | |
| Interest charges — includes other financing costs of $29, $28 and $26, respectively | | 842 | | | 840 | | | 773 | |
| Allowance for funds used during construction — debt | | (26) | | | (42) | | | (37) | |
| Total interest charges and financing costs | | 816 | | | 798 | | | 736 | |
| | | | | | |
| Income before income taxes | | 1,527 | | | 1,467 | | | 1,500 | |
| Income tax (benefit) expense | | (70) | | | (6) | | | 128 | |
| Net income | | $ | 1,597 | | | $ | 1,473 | | | $ | 1,372 | |
| | | | | | |
| Weighted average common shares outstanding: | | | | | | |
| Basic | | 539 | | | 527 | | | 519 | |
| Diluted | | 540 | | | 528 | | | 520 | |
| | | | | | |
| Earnings per average common share: | | | | | | |
| Basic | | $ | 2.96 | | | $ | 2.79 | | | $ | 2.64 | |
| Diluted | | 2.96 | | | 2.79 | | | 2.64 | |
| | | | | | |
| See Notes to Consolidated Financial Statements |
XCEL ENERGY INC. AND SUBSIDIARIES
CONSOLIDATED STATEMENTS OF COMPREHENSIVE INCOME
(amounts in millions)
| | | | | | | | | | | | | | | | | | | | |
| | Year Ended Dec. 31 |
| | 2021 | | 2020 | | 2019 |
| | | | | | |
| Net income | | $ | 1,597 | | | $ | 1,473 | | | $ | 1,372 | |
| Other comprehensive income (loss) | | | | | | |
| Pension and retiree medical benefits: | | | | | | |
| Net pension and retiree medical losses arising during the period, net of tax of $—, $(2) and $—, respectively | | — | | | (5) | | | — | |
| Reclassification of losses to net income, net of tax of $3, $3 and $1, respectively | | 8 | | | 10 | | | 3 | |
| Derivative instruments: | | | | | | |
| Net fair value increase (decrease), net of tax of $1, $(3) and $(8), respectively | | 4 | | | (10) | | | (23) | |
| Reclassification of losses to net income, net of tax of $2, $2 and $1, respectively | | 6 | | | 5 | | | 3 | |
| | | | | | |
| Total other comprehensive income (loss) | | 18 | | | — | | | (17) | |
| Total comprehensive income | | $ | 1,615 | | | $ | 1,473 | | | $ | 1,355 | |
| See Notes to Consolidated Financial Statements |
XCEL ENERGY INC. AND SUBSIDIARIES
CONSOLIDATED STATEMENTS OF CASH FLOWS
(amounts in millions)
| | | | | | | | | | | | | | | | | |
| | Year Ended Dec. 31 |
| | 2021 | | 2020 | | 2019 |
| Operating activities | | | | | |
| Net income | $ | 1,597 | | | $ | 1,473 | | | $ | 1,372 | |
| Adjustments to reconcile net income to cash provided by operating activities: | | | | | |
| Depreciation and amortization | 2,143 | | | 1,959 | | | 1,785 | |
| Nuclear fuel amortization | 114 | | | 123 | | | 119 | |
| Deferred income taxes | (79) | | | (8) | | | 143 | |
| Allowance for equity funds used during construction | (73) | | | (115) | | | (77) | |
| Earnings from equity method investments | (62) | | | (40) | | | (39) | |
| Dividends from equity method investments | 42 | | | 42 | | | 40 | |
| Provision for bad debts | 60 | | | 60 | | | 42 | |
| Share-based compensation expense | 31 | | | 73 | | | 58 | |
| Net realized and unrealized hedging and derivative transactions | (57) | | | (27) | | | 45 | |
| Changes in operating assets and liabilities: | | | | | |
| Accounts receivable | (164) | | | (154) | | | (20) | |
| Accrued unbilled revenues | (149) | | | (3) | | | 42 | |
| Inventories | (126) | | | (80) | | | (84) | |
| Other current assets | (34) | | | (45) | | | 25 | |
| Accounts payable | 138 | | | (33) | | | (12) | |
| Net regulatory assets and liabilities | (973) | | | (144) | | | (66) | |
| Other current liabilities | (1) | | | 29 | | | (15) | |
| Pension and other employee benefit obligations | (135) | | | (125) | | | (135) | |
| Other, net | (83) | | | (137) | | | 40 | |
| Net cash provided by operating activities | 2,189 | | | 2,848 | | | 3,263 | |
| | | | | |
| Investing activities | | | | | |
| Capital/construction expenditures | (4,244) | | | (5,369) | | | (4,225) | |
| Sale of MEC | — | | | 684 | | | — | |
| Purchase of investment securities | (757) | | | (1,398) | | | (995) | |
| Proceeds from the sale of investment securities | 743 | | | 1,378 | | | 975 | |
| Other, net | (29) | | | (35) | | | (98) | |
| Net cash used in investing activities | (4,287) | | | (4,740) | | | (4,343) | |
| | | | | |
| Financing activities | | | | | |
| Proceeds from (repayments of) short-term borrowings, net | 421 | | | (11) | | | (443) | |
| Proceeds from issuances of long-term debt | 2,710 | | | 2,940 | | | 2,920 | |
| Repayments of long-term debt, including reacquisition premiums | (417) | | | (1,001) | | | (949) | |
| Proceeds from issuance of common stock | 366 | | | 727 | | | 458 | |
| Dividends paid | (935) | | | (856) | | | (791) | |
| Other, net | (10) | | | (26) | | | (14) | |
| Net cash provided by financing activities | 2,135 | | | 1,773 | | | 1,181 | |
| | | | | |
| Net change in cash and cash equivalents | 37 | | | (119) | | | 101 | |
| Cash, cash equivalents and restricted cash at beginning of period | 129 | | | 248 | | | 147 | |
| Cash, cash equivalents and restricted cash at end of period | $ | 166 | | | $ | 129 | | | $ | 248 | |
| | | | | |
| Supplemental disclosure of cash flow information: | | | | | |
| Cash paid for interest (net of amounts capitalized) | $ | (788) | | | $ | (758) | | | $ | (698) | |
| Cash (paid) received for income taxes, net | (4) | | | 12 | | | 53 | |
| | | | | |
| Supplemental disclosure of non-cash investing and financing transactions: | | | | | |
| Accrued property, plant and equipment additions | $ | 501 | | | $ | 400 | | | $ | 421 | |
| Inventory transfers to property, plant and equipment | 87 | | | 275 | | | 88 | |
| Operating lease right-of-use assets | 8 | | | 369 | | | 1,843 | |
| Allowance for equity funds used during construction | 73 | | | 115 | | | 77 | |
| Issuance of common stock for reinvested dividends and/or equity awards | 60 | | | 67 | | | 63 | |
| See Notes to Consolidated Financial Statements |
XCEL ENERGY INC. AND SUBSIDIARIES
CONSOLIDATED BALANCE SHEETS
(amounts in millions, except share and per share)
| | | | | | | | | | | | | | |
| | Dec. 31 |
| | 2021 | | 2020 |
| Assets | | | | |
| Current assets | | | | |
| Cash and cash equivalents | | $ | 166 | | | $ | 129 | |
| Accounts receivable, net | | 1,018 | | | 916 | |
| Accrued unbilled revenues | | 862 | | | 714 | |
| Inventories | | 631 | | | 535 | |
| Regulatory assets | | 1,106 | | | 640 | |
| Derivative instruments | | 123 | | | 49 | |
| Prepaid taxes | | 44 | | | 42 | |
| Prepayments and other | | 289 | | | 250 | |
| Total current assets | | 4,239 | | | 3,275 | |
| | | | |
| Property, plant and equipment, net | | 45,457 | | | 42,950 | |
| | | | |
| Other assets | | | | |
| Nuclear decommissioning fund and other investments | | 3,628 | | | 3,096 | |
| Regulatory assets | | 2,738 | | | 2,737 | |
| Derivative instruments | | 67 | | | 30 | |
| Operating lease right-of-use assets | | 1,291 | | | 1,490 | |
| Other | | 431 | | | 379 | |
| Total other assets | | 8,155 | | | 7,732 | |
| Total assets | | $ | 57,851 | | | $ | 53,957 | |
| | | | |
| Liabilities and Equity | | | | |
| Current liabilities | | | | |
| Current portion of long-term debt | | $ | 601 | | | $ | 421 | |
| Short-term debt | | 1,005 | | | 584 | |
| Accounts payable | | 1,409 | | | 1,237 | |
| Regulatory liabilities | | 271 | | | 311 | |
| Taxes accrued | | 569 | | | 578 | |
| Accrued interest | | 209 | | | 203 | |
| Dividends payable | | 249 | | | 231 | |
| Derivative instruments | | 69 | | | 53 | |
| Operating lease liabilities | | 205 | | | 214 | |
| Other | | 459 | | | 407 | |
| Total current liabilities | | 5,046 | | | 4,239 | |
| | | | |
| Deferred credits and other liabilities | | | | |
| Deferred income taxes | | 4,894 | | | 4,746 | |
| Deferred investment tax credits | | 53 | | | 45 | |
| Regulatory liabilities | | 5,405 | | | 5,302 | |
| Asset retirement obligations | | 3,151 | | | 2,884 | |
| Derivative instruments | | 105 | | | 131 | |
| Customer advances | | 196 | | | 197 | |
| Pension and employee benefit obligations | | 306 | | | 666 | |
| Operating lease liabilities | | 1,146 | | | 1,344 | |
| Other | | 158 | | | 183 | |
| Total deferred credits and other liabilities | | 15,414 | | | 15,498 | |
| | | | |
| Commitments and contingencies | | 0 | | 0 |
| Capitalization | | | | |
| Long-term debt | | 21,779 | | | 19,645 | |
| Common stock — 1,000,000,000 shares authorized of $2.50 par value; 544,025,269 and 537,438,394 shares outstanding at Dec. 31, 2021 and Dec. 31, 2020, respectively | | 1,360 | | | 1,344 | |
| Additional paid in capital | | 7,803 | | | 7,404 | |
| Retained earnings | | 6,572 | | | 5,968 | |
| Accumulated other comprehensive loss | | (123) | | | (141) | |
| Total common stockholders’ equity | | 15,612 | | | 14,575 | |
| Total liabilities and equity | | $ | 57,851 | | | $ | 53,957 | |
| | | | |
| See Notes to Consolidated Financial Statements |
XCEL ENERGY INC. AND SUBSIDIARIES
CONSOLIDATED STATEMENTS OF COMMON STOCKHOLDERS’ EQUITY
(amounts in millions, except per share data; shares in actual amounts)
| | | | | | | | | | | | | | | | | | | | | | | | | | | | | | | | | | | |
| Common Stock Issued | | Retained Earnings | | Accumulated Other Comprehensive Loss | | Total Common Stockholders’ Equity |
| Shares | | Par Value | | Additional Paid
In Capital | | | |
| | | | | | | | | | | |
| Balance at Dec. 31, 2018 | 514,036,787 | | | $ | 1,285 | | | $ | 6,168 | | | $ | 4,893 | | | $ | (124) | | | $ | 12,222 | |
| | | | | | | | | | | |
| Net income | | | | | | | 1,372 | | | | | 1,372 | |
| Other comprehensive income | | | | | | | | | (17) | | | (17) | |
| Dividends declared on common stock ($1.62 per share) | | | | | | | (846) | | | | | (846) | |
| Issuances of common stock | 10,507,943 | | | 26 | | | 468 | | | | | | | 494 | |
| Repurchases of common stock | (5,730) | | | — | | | — | | | | | | | — | |
| Share-based compensation | | | | | 20 | | | (6) | | | | | 14 | |
| Balance at Dec. 31, 2019 | 524,539,000 | | | $ | 1,311 | | | $ | 6,656 | | | $ | 5,413 | | | $ | (141) | | | $ | 13,239 | |
| | | | | | | | | | | |
| Net Income | | | | | | | 1,473 | | | | | 1,473 | |
| | | | | | | | | | | |
| Dividends declared on common stock ($1.72 per share) | | | | | | | (909) | | | | | (909) | |
| Issuances of common stock | 12,953,869 | | | 33 | | | 731 | | | | | | | 764 | |
| Repurchase of common stock | (54,475) | | | — | | | (4) | | | | | | | (4) | |
| Share-based compensation | | | | | 21 | | | (7) | | | | | 14 | |
| Adoption of ASC Topic 326 | | | | | | | (2) | | | | | (2) | |
| Balance at Dec. 31, 2020 | 537,438,394 | | | $ | 1,344 | | | $ | 7,404 | | | $ | 5,968 | | | $ | (141) | | | $ | 14,575 | |
| | | | | | | | | | | |
| Net income | | | | | | | 1,597 | | | | | 1,597 | |
| Other comprehensive income | | | | | | | | | 18 | | | 18 | |
| Dividends declared on common stock ($1.83 per share) | | | | | | | (989) | | | | | (989) | |
| Issuances of common stock | 6,586,875 | | | 16 | | | 387 | | | | | | | 403 | |
| | | | | | | | | | | |
| Share-based compensation | | | | | 12 | | | (4) | | | | | 8 | |
| | | | | | | | | | | |
| Balance at Dec. 31, 2021 | 544,025,269 | | | $ | 1,360 | | | $ | 7,803 | | | $ | 6,572 | | | $ | (123) | | | $ | 15,612 | |
| | | | | | | | | | | |
| See Notes to Consolidated Financial Statements |
XCEL ENERGY INC. AND SUBSIDIARIES
Notes to Consolidated Financial Statements
| | |
| 1. | Summary of Significant Accounting Policies |
Business and System of Accounts General — Xcel Energy Inc.’s utility subsidiaries are engaged in the regulated generation, purchase, transmission, distribution and sale of electricity and in the regulated purchase, transportation, distribution and sale of natural gas.
Xcel Energy’s consolidated financial statements and disclosures are presented in accordance with GAAP. All ofregulated operations include the utility subsidiaries’ underlying accounting records also conform to the FERC uniform system of accounts or to systems required by various state regulatory commissions, which are the same in all material respects.
Principles of Consolidation — In 2017, Xcel Energy’s operations included the activityactivities of NSP-Minnesota, NSP-Wisconsin, PSCo and SPS. These utility subsidiaries serve electric and natural gas customers in portions of Colorado, Michigan, Minnesota, New Mexico, North Dakota, South Dakota, Texas and Wisconsin. Also included in Xcel Energy’sregulated operations are WGI, an interstate natural gas pipeline company, and WYCO, a joint venture with CIG to develop and lease natural gas pipelines,pipeline, storage and compression facilities.
Xcel Energy Inc.’s nonregulated subsidiaries include Eloigne, Capital Services, Venture Holdings and Capital Services.Nicollet Project Holdings. Eloigne invests in rental housing projects that qualify for low-income housing tax credits. Capital Services procures equipment for construction of renewable generation facilities at other subsidiaries. Venture Holdings invests in limited partnerships, including EIP funds with portfolios of investments in energy technology companies. Nicollet Project Holdings invests in nonregulated assets such as the MEC generating facility (through July 2020) and Minnesota community solar gardens. Xcel Energy Inc. owns the following additional direct subsidiaries, some of which are intermediate holding companies with additional subsidiaries: Xcel Energy Wholesale Group Inc., Xcel Energy Markets Holdings Inc., Xcel Energy Ventures Inc., Xcel Energy Retail Holdings Inc., Xcel Energy Communications Group, Inc., Xcel Energy International Inc., Xcel Energy Transmission Holding Company, LLC, Nicollet Holdings Company, LLC, Nicollet ProjectXcel Energy Nuclear Services Holdings, LLC and Xcel Energy Services Inc. Xcel Energy Inc. and its subsidiaries collectively are referred to as Xcel Energy.
Xcel Energy’s consolidated financial statements include its wholly-owned subsidiaries and VIEs for which it is the primary beneficiary. In the consolidation process, allAll intercompany transactions and balances are eliminated.eliminated unless a different treatment is appropriate for rate regulated transactions. Xcel Energy uses the equity method of accounting for its investmentinvestments in EIP funds and WYCO. Xcel Energy’s equity earnings in WYCO are included on the consolidated statements of income as equity earnings of unconsolidated subsidiaries.
Xcel Energy has investments in severalcertain plants and transmission facilities jointly owned with nonaffiliated utilities. Xcel Energy’s proportionate share of jointly owned facilities is recorded as property, plant and equipment on the consolidated balance sheets, and Xcel Energy’s proportionate share of the operating costs associated with these facilities is included in its consolidated statements of income. See Note 5
Xcel Energy’s consolidated financial statements are presented in accordance with GAAP. All of the utility subsidiaries’ underlying accounting records also conform to the FERC uniform system of accounts. Certain amounts in the consolidated financial statements or notes have been reclassified for further discussion of jointly owned generation, transmission and gas facilities, and related ownership percentages.
comparative purposes; however, such reclassifications did not affect net income, total assets, liabilities, equity or cash flows.
Xcel Energy evaluates its arrangementshas evaluated events occurring after Dec. 31, 2021 up to the date of issuance of these consolidated financial statements. These statements contain all necessary adjustments and contracts with other entities, including investments, PPAs and fuel contracts, to determine if the other party is a VIE, if Xcel Energy has a variable interest and if Xcel Energy is the primary beneficiary. Xcel Energy follows accounting guidance for VIEs which requires consideration of the activitiesdisclosures resulting from that most significantly impact an entity’s financial performance and power to direct those activities, when determining whether Xcel Energy is a VIE’s primary beneficiary. See Note 13 for further discussion of VIEs.evaluation.
Use of Estimates — In recording transactions and balances resulting from business operations, Xcel Energy uses estimates based on the best information available. available in recording transactions and balances resulting from business operations.
Estimates are used for items such items as plant depreciable lives or potential disallowances, AROs, certain regulatory assets and liabilities, tax provisions, uncollectible amounts, environmental costs, unbilled revenues, jurisdictional fuel and energy cost allocations and actuarially determined benefit costs. The recordedRecorded estimates are revised when better information becomes available or when actual amounts can be determined. Those revisionsRevisions can affect operating results.
Regulatory Accounting — Our Xcel Energy Inc.’s regulated utility subsidiaries account for certain income and expense items in accordance with accounting guidance for regulated operations. Under this guidance:
•Certain costs, which would otherwise be charged to expense or OCI,other comprehensive income, are deferred as regulatory assets based on the expected ability to recover the costs in future rates; andrates.
•Certain credits, which would otherwise be reflected as income or OCI,other comprehensive income, are deferred as regulatory liabilities based on the expectation the amounts will be returned to customers in future rates, or because the amounts were collected in rates prior to the costs being incurred.
Estimates of recovering deferred costs and returning deferred credits are based on specific ratemaking decisions or precedent for each item. Regulatory assets and liabilities are amortized consistent with the treatment in the rate setting process.
If restructuring or other changes in the regulatory environment occur, regulatedthe utility subsidiaries may no longer be eligible to apply this accounting treatment and may be required to eliminate regulatory assets and liabilities from their balance sheets. Such changes could have a material effect on Xcel Energy’s financial condition, results of operations, financial condition and cash flows.
See Note 154 for further discussioninformation.
Income Taxes — Xcel Energy accounts for income taxes using the asset and liability method, which requires recognition of deferred tax assets and liabilities for the expected future tax consequences of events that have been included in the financial statements. Xcel Energy defers income taxes for all temporary differences between pretax financial and taxable income and between the book and tax bases of assets and liabilities.
Xcel Energy uses rates that are scheduled to be in effect when the temporary differences are expected to reverse. The effect of a change in tax rates on deferred tax assets and liabilities is recognized in the period that includes the enactment date.
The effects of tax rate changes that are attributable to the utility subsidiaries are generally subject to a normalization method of accounting. Therefore, the revaluation of most of the utility subsidiaries’ net deferred taxes upon a tax rate reduction results in the establishment of a net regulatory liability, which would be refundable to utility customers over the remaining life of the related assets. Xcel Energy anticipates that a tax rate increase would result in the establishment of a regulatory asset, subject to an evaluation of whether future recovery is expected.
Reversal of certain temporary differences are accounted for as current income tax expense due to the effects of past regulatory practices when deferred taxes were not required to be recorded due to the use of flow through accounting for ratemaking purposes. Tax credits are recorded when earned unless there is a requirement to defer the benefit and amortize it over the book depreciable lives of the related property. The requirement to defer and amortize tax credits only applies to federal ITCs related to public utility property. Utility rate regulation also has resulted in the recognition of regulatory assets and liabilities.
Revenue Recognition — Revenuesliabilities related to the sale of energyincome taxes. Deferred tax assets are generally recorded when servicereduced by a valuation allowance if it is renderedmore likely than not that some portion or energy is delivered to customers. However, the determinationall of the energy salesdeferred tax asset will not be realized.
Xcel Energy follows the applicable accounting guidance to individual customersmeasure and disclose uncertain tax positions that it has taken or expects to take in its income tax returns. Xcel Energy recognizes a tax position in its consolidated financial statements when it is more likely than not that the position will be sustained upon examination based on the reading of their meter, which occurs on a systematic basis throughout the month. At the end of each month, amounts of energy delivered to customers since the datetechnical merits of the last meter readingposition. Recognition of changes in uncertain tax positions are estimated and the corresponding unbilled revenue is recognized. reflected as a component of income tax expense.
Xcel Energy presents its revenues net of any excise or other fiduciary-type taxes or fees.
NSP-Minnesota participates in MISO,reports interest and SPS participates in SPP. Xcel Energy’s utility subsidiaries recognize sales to both native load and other end use customers on a gross basis. Revenues and charges for short term wholesale sales of excess energy transacted through RTOs are recorded on a gross basis in electric revenues and cost of sales. Other revenues and chargespenalties related to participating and transactingincome taxes within other (expense) income or interest charges in RTOs are recorded on a net basis in costthe consolidated statements of sales.
income.
Xcel Energy Inc.’s utility and its subsidiaries have various rate-adjustment mechanisms in place that provide for the recovery of natural gas, electric fuel and purchased energy costs. These cost-adjustment tariffs may increase or decrease the level of revenue collected from customers and are revised periodically for differences between the total amount collected under the clauses and the costs incurred. When applicable, under governing regulatory commission rate orders, fuel cost over-recoveries (the excess of fuel revenue billed to customers over fuel costs incurred) are deferred as regulatory liabilities and under-recoveries (the excess of fuel costs incurred over fuel revenues billed to customers) are deferred as regulatory assets.
Certain rate rider mechanisms qualify as alternative revenue programs under GAAP. These mechanisms arise from costs imposed upon the utility by action of a regulator or legislative body related to an environmental, public safety or other mandate. When certain criteria are met, revenue is recognized equal to the revenue requirement, including return on rate base items, for the qualified mechanisms. The mechanisms are revised periodically for differences between the total amount collected under the riders and the revenue recognized, which may increase or decrease the level of revenue collected from customers.
Conservation Programs —Xcel Energy Inc.’s utility subsidiaries have implemented programs in many of their retail jurisdictions to assist customers in reducing peak demand and conserving energy on the electric and natural gas systems. These programs include efficiency and redesign programs,file consolidated federal income tax returns as well as rebatesconsolidated or separate state income tax returns. Federal income taxes paid by Xcel Energy Inc. are allocated to its subsidiaries based on separate company computations. A similar allocation is made for the purchase of items such as high efficiency lighting.state income taxes paid by Xcel Energy Inc. in connection with consolidated state filings. Xcel Energy Inc. also allocates its own income tax benefits to its direct subsidiaries.
See Note 7 for further information.
The costs incurred for DSM and CIP programs are deferred if it is probable future revenue will be provided to permit recovery of the incurred cost. Recorded revenues for incentive programs designed for recovery of lost margins and/or conservation performance incentives are limited to amounts expected to be collected within 24 months from the annual period in which they are earned.
For PSCo, SPS and NSP-Minnesota, DSM and CIP program costs are recovered through a combination of base rate revenue and rider mechanisms. The revenue billed to customers recovers incurred costs for conservation programs and also incentive amounts that are designed to encourage Xcel Energy’s achievement of energy conservation goals and compensate for related lost sales margin. For these utility subsidiaries, regulatory assets are recognized to reflect the amount of costs or earned incentives that have not yet been collected from customers. NSP-Wisconsin recovers approved conservation program costs in base rate revenue.
Property, Plant and Equipment and Depreciation in Regulated Operations — Property, plant and equipment is stated at original cost. The cost of plant includes direct labor and materials, contracted work, overhead costs and AFUDC. The cost of plant retired is charged to accumulated depreciation and amortization. Amounts recovered in rates for future removal costs are recorded as regulatory liabilities. Significant additions or improvements extending asset lives are capitalized, while repairs and maintenance costs are charged to expense as incurred. Maintenance and replacement of items determined to be less than a unit of property are charged to operating expenses as incurred. Planned major maintenance activities are charged to operating expense unless the cost represents the acquisition of an additional unit of property or the replacement of an existing unit of property. Property, plant and equipment also includes costs associated with property held for future use. The depreciable lives of certain plant assets are reviewed annually and revised, if appropriate.
Property, plant and equipment is tested for impairment when it is determined that the carrying value of the assets may not be recoverable. A loss is recognized in the current period if it becomes probable that part of a cost of a plant under construction or recently completed plant will be disallowed for recovery from customers and a reasonable estimate of the disallowance can be made. See Note 12 for a discussion of the loss recognized in 2015 related to the Monticello LCM/EPU project. For investments in property, plant and equipment that are abandoned and not expected to go into service, incurred costs and related deferred tax amounts are compared to the discounted estimated future rate recovery, and a loss is recognized, if necessary.
Xcel Energy records depreciation expense related to its plant using the straight-line method over the plant’s commission approved useful life. Actuarial life studies are performed and submitted to the state and federal commissions for review. Upon acceptance by the various commissions, the resulting lives and net salvage rates are used to calculate depreciation. Plant removal costs of Xcel Energy’s utility subsidiaries are recovered in rates as authorized by the appropriate regulatory entities. The amount of removal costs is based on current factors used in existing depreciation rates. Accumulated removal costs are reflected in the consolidated balance sheet as a regulatory liability. Depreciation expense, expressed as a percentage of average depreciable property, was approximately 3.1, 2.9, 3.5% for 2021, 3.4% for 2020 and 2.8 percent3.3% for the years ended Dec. 31, 2017, 2016 and 2015, respectively.2019.
See Note 3 for further information.
LeasesAROs —Xcel Energy evaluates a variety of contracts for lease classification at inception, including PPAs and rental arrangements for office space, vehicles and equipment. Contracts determined to contain a lease because of per unit pricing that is other than fixed or market price, terms regarding the use of a particular asset, and other factors are evaluated further to determine if the arrangement is a capital lease. See Note 13 for further discussion of leases.
AFUDC — AFUDC represents the cost of capital used to finance utility construction activity. AFUDC is computed by applying a composite financing rate to qualified CWIP. The amount of AFUDC capitalized as a utility construction cost is credited to other nonoperating income (for equity capital) and interest charges (for debt capital). AFUDC amounts capitalized are included in Xcel Energy’s rate base for establishing utility service rates.
Generally, AFUDC costs are recovered from customers as the related property is depreciated. However, in some cases commissions have approved a more current recovery of the cost of capital associated with large capital projects, resulting in a lower recognition of AFUDC. In other cases, some commissions have allowed an AFUDC calculation greater than the FERC-defined AFUDC rate, resulting in higher recognition of AFUDC.
AROs— Xcel Energy Inc.’s utility subsidiaries accountaccounts for AROs under accounting guidance that requires a liability for the fair value of an ARO to be recognized in the period in which it is incurred if it can be reasonably estimated, with the offsetting associated asset retirement costs capitalized as a long-lived asset. The liability is generally increased over time by applying the effective interest method of accretion, and the capitalized costs are depreciated over the useful life of the long-lived asset. Changes resulting from revisions to the timing or amount of expected asset retirement cash flows are recognized as an increase or a decrease in the ARO. Xcel Energy Inc.’s utility subsidiaries also recover through rates certain future plant removal costs in addition to AROs. The accumulated removal costs for these obligations are reflected in the balance sheets as a regulatory liability.
See Note 1312 for further discussion of AROs.information.
Nuclear Decommissioning — Nuclear decommissioning studies that estimate NSP-Minnesota’s ultimate costs of decommissioning its nuclear power plants and are performed at least every three3 years and submitted to the MPUC and other state commissions for approval. NSP-Minnesota’s most recent triennial nuclear decommissioning studies were filed with the MPUC in December 2017. These studies reflect NSP-Minnesota’s plans for dismantlement of the Monticello and PI facilities. These studies assume that NSP-Minnesota will store spent fuel on site pending removal to a U.S. government facility.
For rate making purposes, NSP-Minnesota recovers the totalregulator-approved decommissioning costs related toof its nuclear power plants over each facility’s expected service life, typically based on the triennial decommissioning studies filed with the MPUC and other state commissions.studies. The studies consider estimated future costs of decommissioning and the market value of investments in trust funds and recommend annual funding amounts. Amounts collected in rates are deposited in the trust funds. See Note 14 for further discussion of the approved nuclear decommissioning studies and funded amounts. For financial reporting purposes, NSP-Minnesota accounts for nuclear decommissioning as an ARO as described above.
ARO.
Restricted funds for the payment of future decommissioning expenditures for NSP-Minnesota’s nuclear facilities are included in nuclear decommissioning fund and other assets on the consolidated balance sheets.
See Note 11Notes 10 and 12 for further discussion of the nuclear decommissioning fund.information.
Nuclear Fuel ExpenseBenefit Plans and Other Postretirement Benefits — Nuclear fuel expense, which is recorded as NSP-Minnesota’s nuclear generating plants use fuel, includes Xcel Energy maintains pension and postretirement benefit plans for eligible employees. Recognizing the cost of fuel used inproviding benefits and measuring the current period (including AFUDC)projected benefit obligation of these plans requires management to make various assumptions and estimates.
Certain unrecognized actuarial gains and losses and unrecognized prior service costs associated with the end-of-life fuel segments.
Nuclear Refueling Outage Costs— Xcel Energy uses a deferral and amortization method for nuclear refueling O&M costs. This method amortizes refueling outage costs over the period between refueling outages consistent with how the costs are recovered ratably in electric rates.
Income Taxes — Xcel Energy accounts for income taxes using the asset and liability method, which requires the recognition of deferred tax assets and liabilities for the expected future tax consequences of events that have been included in the financial statements. Xcel Energy defers income taxes for all temporary differences between pretax financial and taxable income, and between the book and tax bases of assets and liabilities. Xcel Energy uses the tax rates that are scheduled to be in effect when the temporary differences are expected to reverse. The effect of a change in tax rates on deferred tax assets and liabilities is recognized in the period that includes the enactment date.
The effects of tax rate changes that are attributable to the regulated utility subsidiaries are generally subject to a normalization method of accounting. Therefore, the revaluation of most of the utility subsidiaries’ net deferred taxes upon a tax rate reduction results in the establishment of a net regulatory liability which will be refundable to utility customers over the remaining life of the related assets. A tax rate increase would result in the establishment of a similar regulatory asset. Due to the effects of past regulatory practices, when deferred taxes were not required to be recorded due to the use of flow through accounting for ratemaking purposes, the reversal of some temporary differences are accounted for as current income tax expense. Taxor credits are recorded when earned unless there is a requirement to defer the benefit and amortize it over the book depreciable lives of the related property. The requirement to defer and amortize tax credits only applies to federal ITCs related to public utility property. Utility rate regulation also has resulted in the recognition of certaindeferred as regulatory assets and liabilities, related torather than recorded as other comprehensive income, taxes, which are summarized in Note 15.
Deferred tax assets are reduced by a valuation allowance if it is more likely than not that some portion or all of the deferred tax asset will not be realized. In making such a determination, all available evidence is considered, including scheduled reversals of deferred tax liabilities, projected future taxable income, tax planning strategies and recent financial operations.
Xcel Energy follows the applicable accounting guidance to measure and disclose uncertain tax positions that it has taken or expects to take in its income tax returns. Xcel Energy recognizes a tax position in its consolidated financial statements when it is more likely than not that the position will be sustained upon examination based on the technical merits of the position. Recognition of changes in uncertain tax positions are reflected as a component of income tax.
Xcel Energy reports interest and penalties related to income taxes within the other income and interest charges sections in the consolidated statements of income.
Xcel Energy Inc. and its subsidiaries file consolidated federal income tax returns as well as combined or separate state income tax returns. Federal income taxes paid by Xcel Energy Inc. are allocated to Xcel Energy Inc.’s subsidiaries based on separate company computations of tax. A similar allocation is made for state income taxes paid by Xcel Energy Inc. in connection with combined state filings. Xcel Energy Inc. also allocates its own income tax benefits to its direct subsidiaries based on the relative positive tax liabilities of the subsidiaries.
See Note 6 for further discussion of income taxes.
Types of and Accounting for Derivative Instruments — Xcel Energy uses derivative instruments in connection with its interest rate, utility commodity price, vehicle fuel price and commodity trading activities, including forward contracts, futures, swaps and options. All derivative instruments not designated and qualifying for the normal purchases and normal sales exception, as defined by the accounting guidance for derivatives and hedging, are recorded on the consolidated balance sheets at fair value as derivative instruments. This includes certain instruments used to mitigate market risk for the utility operations including transmission in organized markets and all instruments related to the commodity trading operations. The classification of changes in fair value for those derivative instruments is dependent on the designation of a qualifying hedging relationship. Changes in fair value of derivative instruments not designated in a qualifying hedging relationship are reflected in current earnings or as a regulatory asset or liability. The classification as a regulatory asset or liability is based on commission approved regulatory recovery mechanisms.
Gains or losses on commodity trading transactions are recorded as a component of electric operating revenues; hedging transactions for vehicle fuel costs are recorded as a component of capital projects and O&M costs; and interest rate hedging transactions are recorded as a component of interest expense. Certain utility subsidiaries are allowed to recover in electric or natural gas rates the costs of certain financial instruments purchased to reduce commodity cost volatility. For further information on derivatives entered to mitigate commodity price risk on behalf of electric and natural gas customers, see Note 11.
Cash Flow Hedges — Certain qualifying hedging relationships are designated as a hedge of a forecasted transaction, or future cash flow (cash flow hedge). Changes in the fair value of a derivative designated as a cash flow hedge, to the extent effective, are included in OCI or deferred as a regulatory asset or liability based on recovery mechanisms until earnings are affected by the hedged transaction.
Normal Purchases and Normal Sales — Xcel Energy enters into contracts for the purchase and sale of commodities for use in its business operations. Derivatives and hedging accounting guidance requires a company to evaluate these contracts to determine whether the contracts are derivatives. Certain contracts that meet the definition of a derivative may be exempted from derivative accounting if designated as normal purchases or normal sales.
Xcel Energy evaluates all of its contracts at inception to determine if they are derivatives and if they meet the normal purchases and normal sales designation requirements. None of the contracts entered into within the commodity trading operations qualify for a normal purchases and normal sales designation.
See Note 11 for further discussioninformation.
Commodity Trading Operations — All applicable gains and losses related to commodity trading activities, whether or not settled physically, are shown on a net basis in electric operating revenues in the consolidated statements of income.
Xcel Energy’s commodity trading operations are primarily conducted by NSP-Minnesota and PSCo. Commodity trading activities are not associated with energy produced from Xcel Energy’s generation assets or energy and capacity purchased to serve native load. Commodity trading contracts are recorded at fair market value and commodity trading results include the impact of all margin-sharing mechanisms. See Note 11 for further discussion.
Fair Value Measurements — Xcel Energy presents cash equivalents, interest rate derivatives, commodity derivatives and nuclear decommissioning fund assets at estimated fair values in its consolidated financial statements. Cash equivalents are recorded at cost plus accrued interest; money market funds are measured using quoted NAVs. For interest rate derivatives, quoted prices based primarily on observable market interest rate curves are used as a primary input to establish fair value. For commodity derivatives, the most observable inputs available are generally used to determine the fair value of each contract. In the absence of a quoted price for an identical contract in an active market, Xcel Energy may use quoted prices for similar contracts or internally prepared valuation models to determine fair value. For the pension and postretirement plan assets and the nuclear decommissioning fund, published trading data and pricing models, generally using the most observable inputs available, are utilized to estimate fair value for each security. See Notes 9 and 11 for further discussion.
Cash and Cash Equivalents — Xcel Energy considers investments in certain instruments, including commercial paper and money market funds, with a remaining maturity of three months or less at the time of purchase, to be cash equivalents.
Accounts Receivable and Allowance for Bad Debts — Accounts receivable are stated at the actual billed amount net of an allowance for bad debts. Xcel Energy establishes an allowance for uncollectible receivables based on a policy that reflects its expected exposure to the credit risk of customers.
Inventory — All inventory is recorded at average cost.
RECs — RECs are marketable environmental instruments that represent proof that energy was generated from eligible renewable energy sources. RECs are awarded upon delivery of the associated energy and can be bought and sold. RECs are typically used as a form of measurement of compliance to RPS enacted by those states that are encouraging construction and consumption from renewable energy sources, but can also be sold separately from the energy produced. Utility subsidiaries acquire RECs from the generation or purchase of renewable power.
When RECs are purchased or acquired in the course of generation they are recorded as inventory at cost. The cost of RECs that are utilized for compliance purposes is recorded as electric fuel and purchased power expense. In certain jurisdictions, as a result of state regulatory orders, Xcel Energy reduces recoverable fuel costs for the cost of certain RECs and records that cost as a regulatory asset when the amount is recoverable in future rates.
Sales of RECs that are purchased or acquired in the course of generation are recorded in electric utility operating revenues on a gross basis. The cost of these RECs, related transaction costs, and amounts credited to customers under margin-sharing mechanisms are recorded in electric fuel and purchased power expense.
Emission Allowances — Emission allowances, including the annual SO2 and NOx emission allowance entitlement received from the EPA, are recorded at cost plus associated broker commission fees. Xcel Energy follows the inventory accounting model for all emission allowances. Sales of emission allowances are included in electric utility operating revenue and the operating activities section of the consolidated statements of cash flows.
Environmental Costs — Environmental costs are recorded when it is probable Xcel Energy is liable for remediation costs and the liability can be reasonably estimated. Costs are deferred as a regulatory asset if it is probable that the costs will be recovered from customers in future rates. Otherwise, the costs are expensed. If anFor certain environmental expense iscosts related to facilities currently in use, such as for emission-control equipment, the cost is capitalized and depreciated over the life of the plant.
Estimated remediation costs, excluding inflationary increases, are recorded based on experience, an assessment of the current situation and the technology currently available for use in the remediation. The recorded costs are regularly adjusted as estimates are revised and remediation proceeds. If other participating PRPspotentially responsible parties exist and acknowledge their potential involvement with a site, costs are estimated and recorded only for Xcel Energy’s expected share of the cost.
Any futureFuture costs of restoring sites where operation may extend indefinitely are treated as a capitalized cost of plant retirement. The depreciation expense levels recoverable in rates include a provision for removal expenses, which may include final remediation costs.expenses. Removal costs recovered in rates before the related costs are incurred are classified as a regulatory liability.
See Note 1312 for further discussion of environmental costs.information.
Benefit Plans and Other Postretirement Benefits — Xcel Energy maintains pension and postretirement benefit plans for eligible employees. Recognizing the cost of providing benefits and measuring the projected benefit obligation of these plans under applicable accounting guidance requires management to make various assumptions and estimates.
Based on the regulatory recovery mechanisms of Xcel Energy Inc.’s utility subsidiaries, certain unrecognized actuarial gains and losses and unrecognized prior service costs or credits are recorded as regulatory assets and liabilities, rather than OCI.
See Note 9 for further discussion of benefit plans and other postretirement benefits.
Guarantees — Xcel Energy recognizes, upon issuance or modification of a guarantee, a liability for the fair market value of the obligation that has been assumed in issuing the guarantee. This liability includes consideration of specific triggering events and other conditions which may modify the ongoing obligation to perform under the guarantee.
The obligation recognized is reduced over the term of the guarantee as Xcel Energy is released from risk under the guarantee. See Note 13 for specific details of issued guarantees.
Subsequent Events— Management has evaluated the impact of events occurring after Dec. 31, 2017 up to the date of issuance of these consolidated financial statements. These statements contain all necessary adjustments and disclosures resulting from that evaluation.
2. Accounting Pronouncements
Recently Issued
Revenue Recognition— In May 2014, the FASB issued Revenue from Contracts with Customers Topic 606 (ASU No. 2014-09), which provides a new framework for— Performance obligations related to the recognitionsale of revenue. Asenergy are satisfied as energy is delivered to customers. Xcel Energy recognizes revenue that corresponds to the appropriate timingprice of recognitionthe energy delivered to the customer. The measurement of revenue from contracts withenergy sales to customers in our regulated operations continues tois generally be based on the deliveryreading of electricitytheir meters, which occurs systematically throughout the month. At the end of each month, amounts of energy delivered to customers since the date of the last meter reading are estimated, and natural gas, Xcel Energy’s adoption will primarily result in increased disclosures regarding sources of revenues, including alternativethe corresponding unbilled revenue programs. The guidance is effective for interim and annual periods beginning after Dec. 15, 2017. recognized.
Xcel Energy is implementing the standarddoes not recognize a separate financing component of its collections from customers as contract terms are short-term in nature. Xcel Energy presents its revenues net of any excise or sales taxes or fees. The utility subsidiaries recognize physical sales to customers (native load and wholesale) on a modified retrospectivegross basis which requires application to contracts with customers effective Jan. 1, 2018.in electric revenues and cost of sales. Revenues and charges for short-term physical wholesale sales of excess energy transacted through RTOs are also recorded on a gross basis. Other revenues and charges settled/facilitated through an RTO are recorded on a net basis in cost of sales.
See Note 6 for further information.
ClassificationCash and Measurement of Financial Instruments Cash Equivalents — In January 2016, the FASB issued Recognition and Measurement of Financial Assets and Financial Liabilities, Subtopic 825-10 (ASU No. 2016-01), which eliminates the available-for-sale classification for marketable equity securities and also replaces the cost method of accounting for non-marketable equity securities Xcel Energy considers investments in instruments with a modelremaining maturity of 3 months or less at the time of purchase to be cash equivalents.
Accounts Receivable and Allowance for recognizing impairmentsBad Debts — Accounts receivable are stated at the actual billed amount net of an allowance for bad debts. Xcel Energy establishes an allowance for uncollectible receivables based on a policy that reflects its expected exposure to the credit risk of customers.
As of Dec. 31, 2021 and observable price changes. Under2020, the new standard, other than whenallowance for bad debts was $106 million and $79 million, respectively.
Inventory — Inventory is recorded at average cost and consisted of the consolidation orfollowing:
| | | | | | | | | | | | | | |
| (Millions of Dollars) | | Dec. 31, 2021 | | Dec. 31, 2020 |
| Inventories | | | | |
| Materials and supplies | | $ | 289 | | | $ | 275 | |
| Fuel | | 182 | | | 176 | |
| Natural gas | | 160 | | | 84 | |
| Total inventories | | $ | 631 | | | $ | 535 | |
Equity Method Investments —The equity method of accounting is utilized, changesused for investments in WYCO and EIP funds, which results in Xcel Energy’s recognition of its share of these investees’ GAAP pretax earnings, based on Xcel Energy’s proportional ownership interest. For investments in EIP funds, this includes Xcel Energy’s share of fund expenses and realized gains and losses, as well as unrealized gains and losses resulting from valuations of the funds’ investments in emerging energy technology companies.
Fair Value Measurements — Xcel Energy presents cash equivalents, interest rate derivatives, commodity derivatives and nuclear decommissioning fund assets at estimated fair values in its consolidated financial statements.
Cash equivalents are recorded at cost plus accrued interest; money market funds are measured using quoted NAVs. For interest rate derivatives, quoted prices based primarily on observable market interest rate curves are used to establish fair value. For commodity derivatives, the most observable inputs available are generally used to determine the fair value of equity securitieseach contract. In the absence of a quoted price, Xcel Energy may use quoted prices for similar contracts or internally prepared valuation models to determine fair value.
For the pension and postretirement plan assets and nuclear decommissioning fund, published trading data and pricing models, generally using the most observable inputs available, are utilized to be recognizedestimate fair value for each security.
See Notes 10 and 11 for further information.
Derivative Instruments — Xcel Energy uses derivative instruments in earnings. This guidance is effectiveconnection with its interest rate, utility commodity price and commodity trading activities, including forward contracts, futures, swaps and options. Any derivative instruments not qualifying for interimthe normal purchases and annual reporting periods beginning after Dec. 15, 2017. As a resultnormal sales exception are recorded on the consolidated balance sheets at fair value as derivative instruments. Classification of application of accounting principles for rate regulated entities, changes in fair value for those derivative instruments is dependent on the designation of a qualifying hedging relationship. Changes in fair value of the securitiesderivative instruments not designated in the nuclear decommissioning fund, historically classifieda qualifying hedging relationship are reflected in current earnings or as available-for-sale, will continue to be deferred to a regulatory asset or liability. Classification as a regulatory asset or liability is based on commission approved regulatory recovery mechanisms.
Gains or losses on commodity trading transactions are recorded as a component of electric operating revenues and the overall impactsinterest rate hedging transactions are recorded as a component of the Jan. 1, 2018 adoption will not be material.interest expense.
LeasesNormal Purchases and Normal Sales —In February 2016, the FASB issued Leases, Topic 842 (ASU No. 2016-02), which for lessees requires balance sheet recognition of right-of-use assets and lease liabilities for most leases. This guidance will be effective for interim and annual reporting periods beginning after Dec. 15, 2018. Xcel Energy hasenters into contracts for purchases and sales of commodities for use in its operations. At inception, contracts are evaluated to determine whether a derivative exists and/or whether an instrument may be exempted from derivative accounting if designated as a normal purchase or normal sale.
See Note 10 for further information.
Commodity Trading Operations — All applicable gains and losses related to commodity trading activities are shown on a net basis in electric operating revenues in the consolidated statements of income.
Commodity trading activities are not associated with energy produced from Xcel Energy’s generation assets or energy and capacity purchased to serve native load. Commodity trading contracts are recorded at fair market value and commodity trading results include the impact of all margin-sharing mechanisms.
See Note 10 for further information.
Other Utility Items
AFUDC — AFUDC represents the cost of capital used to finance utility construction activity. AFUDC is computed by applying a composite financing rate to qualified CWIP. The amount of AFUDC capitalized as a utility construction cost is credited to other nonoperating income (for equity capital) and interest charges (for debt capital). AFUDC amounts capitalized are included in Xcel Energy’s rate base for establishing utility rates.
Alternative Revenue — Certain rate rider mechanisms (including decoupling/sales true up and CIP/DSM programs) qualify as alternative revenue programs. These mechanisms arise from costs imposed upon the utility by action of a regulator or legislative body related to an environmental, public safety or other mandate or from other instances where the regulator authorizes a future surcharge in response to past activities or completed events. When certain criteria are met, including expected collection within 24 months, revenue is recognized equal to the revenue requirement, which may include incentives and return on rate base items. Billing amounts are revised periodically for differences between total amount collected and revenue earned, which may increase or decrease the level of revenue collected from customers. Alternative revenues arising from these programs are presented on a gross basis and disclosed separately from revenue from contracts with customers.
See Note 6 for further information.
Conservation Programs —Costs incurred for DSM and CIP programs are deferred if it is probable future revenue will recover the incurred cost. Revenues recognized for incentive programs for the recovery of lost margins and/or conservation performance incentives are limited to amounts expected to be collected within 24 months from the year they are earned. Regulatory assets are recognized to reflect the amount of costs or earned incentives that have not yet fully determinedbeen collected from customers.
Emission Allowances — Emission allowances are recorded at cost, including broker commission fees. The inventory accounting model is utilized for all emission allowances and sales of these allowances are included in electric revenues.
Nuclear Refueling Outage Costs — Xcel Energy uses a deferral and amortization method for nuclear refueling costs. This method amortizes costs over the impactsperiod between refueling outages consistent with rate recovery.
RECs — Cost of implementation. However, adoption is expected to occur on Jan. 1, 2019 utilizing the practical expedients provided by the standard and proposed in Targeted Improvements, Topic 842 (Proposed ASU 2018-200). As such, agreements entered prior to Jan. 1, 2019RECs that are currently considered leases are expectedutilized for compliance is recorded as electric fuel and purchased power expense. In certain jurisdictions, Xcel Energy reduces recoverable fuel and purchased power costs for the cost of RECs received. An inventory accounting model is used to beaccount for RECs recognized on the consolidated balance sheet, including contracts for usesheets, however these assets are classified as regulatory assets if amounts are recoverable in future rates.
Sales of office space, equipmentRECs are recorded in electric revenues on a gross basis. The cost of these RECs and natural gas storage assets, as well as certainamounts credited to customers under margin-sharing mechanisms are recorded in electric fuel and purchased power agreements (PPAs) for natural gas-fueled generating facilities. Xcel Energy expectsexpense.
Cost of RECs that similar agreements entered after Dec. 31, 2018 will generally qualify as leases under the new standard.
Presentation of Net Periodic Benefit Cost —In March 2017, the FASB issued Improving the Presentation of Net Periodic Pension Cost and Net Periodic Postretirement Benefit Cost, Topic 715 (ASU No. 2017-07), which establishes that only the service cost element of pension cost may be presented as a component of operating incomeare utilized to support commodity trading activities are recorded in the income statement. Also under the guidance, only the service cost component of pension cost is eligible for capitalization. As a result of application of accounting principles for rate regulated entities, a similar amount of pension cost, including non-service components, will be recognized consistent withmanner as the historical ratemaking treatmentassociated commodities and the impacts of adoption will be limited to changesare shown on a net basis in classification of non-service costselectric operating revenues in the consolidated statementstatements of income. This guidance is effective for interim and annual reporting periods beginning after Dec. 15, 2017.
| | |
| 2. Accounting Pronouncements |
Recently Adopted
Stock Compensation Credit Losses— In March 2016, the FASB issued Improvements to Employee Share-Based Payment Accounting,Financial Instruments - Credit Losses, Topic 718 (ASU No. 2016-09)326 (ASC Topic 326),which simplifies accountingchanges how entities account for losses on receivables and financial statement presentation for share-based payment transactions.certain other assets. The guidance requires that the difference between the tax deduction available upon settlementuse of share-based equity awards and the tax benefit accumulated over the vesting period be recognized as an adjustment to income tax expense. a current expected credit loss model, which may result in earlier recognition of credit losses than under previous accounting standards.
Xcel Energy adoptedimplemented the guidance in 2016, resulting in immaterial 2016 adjustmentsusing a modified-retrospective approach, recognizing a cumulative effect charge of $2 million (after tax) to income tax expense and changes in classificationretained earnings on Jan. 1, 2020. Other than first-time recognition of cash flows related to tax withholding inan allowance for bad debts on accrued unbilled revenues, the consolidated statements of cash flows for 2016 and prior presented periods.
Accounting for the TCJA— In December 2017, the SEC staff issued Staff Accounting Bulletin No. 118 Income Tax Accounting Implications of the Tax Cuts and Jobs Act (SAB 118), to supplement the accounting requirementsJan. 1, 2020, adoption of ASC Topic 740 Income Taxes (ASC Topic 740) as it relates to assessing and recognizing the impacts of the TCJA in the period of enactment. SAB 118 allows an entity to recognize provisional amounts in its financial statements in circumstances in which the entity’s assessment is incomplete, but for which326 did not have a reasonable estimate can be made. Provisional amounts recognized are subject to adjustment for up to one year from the enactment date. For further details, see Note 6 to thesignificant impact on Xcel Energy’s consolidated financial statements.
Reporting Comprehensive Income — In February 2018, the FASB issued Reclassification of Certain Tax Effects from Accumulated Other Comprehensive Income, Topic 220 (ASU No. 2018-02), which addresses the stranded amounts of accumulated OCI which may result from enactment of a new tax law. Though accumulated OCI is presented on a net-of-tax basis, ASC Topic 740 requires that the effects of new tax laws on items in accumulated OCI be recognized without a corresponding adjustment to accumulated OCI, and instead recorded to income tax expense. ASU No. 2018-02 permits stranded amounts of accumulated OCI specifically resulting from the TCJA to be removed from accumulated OCI and reclassified to retained earnings, if elected. Xcel Energy adopted the guidance in the fourth quarter of 2017, and elected to recognize a $22 million increase to accumulated other comprehensive loss and retained earnings in the consolidated financial statements for the year ended Dec. 31, 2017, related to a revaluation of deferred income tax assets and liabilities for items in accumulated other comprehensive loss, at the TCJA federal tax rate.
| | |
| 3. | Selected Balance Sheet Data Property, Plant and Equipment |
Major classes of property, plant and equipment
| | | | | | | | | | | | | | |
| (Millions of Dollars) | | Dec. 31, 2021 | | Dec. 31, 2020 |
| Property, plant and equipment, net | | | | |
| Electric plant | | $ | 48,680 | | | $ | 47,104 | |
| Natural gas plant | | 7,758 | | | 7,135 | |
| Common and other property | | 2,602 | | | 2,503 | |
Plant to be retired (a) | | 1,200 | | | 677 | |
| CWIP | | 1,969 | | | 1,877 | |
| Total property, plant and equipment | | 62,209 | | | 59,296 | |
| Less accumulated depreciation | | (17,060) | | | (16,657) | |
| Nuclear fuel | | 3,081 | | | 2,970 | |
| Less accumulated amortization | | (2,773) | | | (2,659) | |
| Property, plant and equipment, net | | $ | 45,457 | | | $ | 42,950 | |
(a)Includes regulator-approved retirements of Comanche Units 1 and 2 and jointly owned Craig Unit 1 for PSCo, and Sherco Units 1, 2 and 3 and A.S. King for NSP-Minnesota. Also includes SPS’ expected retirement of Tolk and conversion of Harrington to natural gas, and PSCo’s planned retirement of jointly owned Craig Unit 2.
Joint Ownership of Generation, Transmission and Gas Facilities
The utility subsidiaries’ jointly owned assets as of Dec. 31, 2021:
| | | | | | | | | | | | | | | | | | | | | | |
| (Millions of Dollars, Except Percent Owned) | | Plant in Service | | Accumulated Depreciation | | | | Percent Owned |
| NSP-Minnesota | | | | | | | | |
| Electric generation: | | | | | | | | |
| Sherco Unit 3 | | $ | 620 | | | $ | 451 | | | | | 59 | % |
| Sherco common facilities | | 178 | | | 108 | | | | | 80 | |
| Sherco substation | | 5 | | | 4 | | | | | 59 | |
| Electric transmission: | | | | | | | | |
| Grand Meadow | | 11 | | | 3 | | | | | 50 | |
| Huntley Wilmarth | | 48 | | | 1 | | | | | 50 | |
| CapX2020 | | 952 | | | 127 | | | | | 51 | |
Total NSP-Minnesota (a) | | $ | 1,814 | | | $ | 694 | | | | | |
(a)Projects additionally include $7 million in CWIP.
| | | | | | | | | | | | | | | | | | | | | | |
| (Millions of Dollars, Except Percent Owned) | | Plant in Service | | Accumulated Depreciation | | | | Percent Owned |
| NSP-Wisconsin | | | | | | | | |
| Electric transmission: | | | | | | | | |
| La Crosse, WI to Madison, WI | | $ | 177 | | | $ | 15 | | | | | 37 | % |
| CapX2020 | | 169 | | | 28 | | | | | 80 | |
Total NSP-Wisconsin (a) | | $ | 346 | | | $ | 43 | | | | | |
(a)Projects additionally include $2 million in CWIP.
| | | | | | | | | | | | | | | | | | | | | | |
| (Millions of Dollars, Except Percent Owned) | | Plant in Service | | Accumulated Depreciation | | | | Percent Owned |
| PSCo | | | | | | | | |
| Electric generation: | | | | | | | | |
| Hayden Unit 1 | | $ | 156 | | | $ | 99 | | | | | 76 | % |
| Hayden Unit 2 | | 151 | | | 78 | | | | | 37 | |
| Hayden common facilities | | 42 | | | 27 | | | | | 53 | |
| Craig Units 1 and 2 | | 81 | | | 48 | | | | | 10 | |
| Craig common facilities | | 39 | | | 25 | | | | | 7 | |
| Comanche Unit 3 | | 917 | | | 154 | | | | | 67 | |
| Comanche common facilities | | 28 | | | 2 | | | | | 82 | |
| Electric transmission: | | | | | | | | |
| Transmission and other facilities | | 182 | | | 63 | | | | | Various |
| Gas transmission: | | | | | | | | |
| Rifle, CO to Avon, CO | | 22 | | | 8 | | | | | 60 | |
| Gas transmission compressor | | 8 | | | 2 | | | | | 50 | |
Total PSCo (a) | | $ | 1,626 | | | $ | 506 | | | | | |
(a)Projects additionally include $4 million in CWIP.
Each company’s share of operating expenses and construction expenditures is included in the applicable utility accounts. Respective owners are responsible for providing their own financing.
|
| | | | | | | | |
| (Millions of Dollars) | | Dec. 31, 2017 | | Dec. 31, 2016 |
| Accounts receivable, net | | | | |
| Accounts receivable | | $ | 849 |
| | $ | 827 |
|
| Less allowance for bad debts | | (52 | ) | | (51 | ) |
| | | $ | 797 |
| | $ | 776 |
|
|
| | | | | | | | |
| (Millions of Dollars) | | Dec. 31, 2017 | | Dec. 31, 2016 |
| Inventories | | | | |
| Materials and supplies | | $ | 311 |
| | $ | 312 |
|
| Fuel | | 186 |
| | 182 |
|
| Natural gas | | 113 |
| | 110 |
|
| | | $ | 610 |
| | $ | 604 |
|
|
| | | | | | | | |
| (Millions of Dollars) | | Dec. 31, 2017 | | Dec. 31, 2016 |
| Property, plant and equipment, net | | | | |
| Electric plant | | $ | 39,016 |
| | $ | 38,221 |
|
| Natural gas plant | | 5,800 |
| | 5,318 |
|
| Common and other property | | 2,013 |
| | 1,888 |
|
Plant to be retired (a) | | 11 |
| | 32 |
|
| CWIP | | 2,087 |
| | 1,373 |
|
| Total property, plant and equipment | | 48,927 |
| | 46,832 |
|
| Less accumulated depreciation | | (15,000 | ) | | (14,381 | ) |
| Nuclear fuel | | 2,697 |
| | 2,572 |
|
| Less accumulated amortization | | (2,295 | ) | | (2,181 | ) |
| | | $ | 34,329 |
| | $ | 32,842 |
|
| |
(a)
| In the third quarter of 2017, PSCo early retired Valmont Unit 5 and converted Cherokee Unit 4 from a coal-fueled generating facility to natural gas. PSCo also expects Craig Unit 1 to be early retired in approximately 2025. Amounts are presented net of accumulated depreciation. |
| |
| 4. Regulatory Assets and Liabilities |
Regulatory assets and liabilities are created for amounts that regulators may allow to be collected or may require to be paid back to customers in future electric and natural gas rates. Xcel Energy would be required to recognize the write-off of regulatory assets and liabilities in net income or other comprehensive income if changes in the utility industry no longer allow for the application of regulatory accounting guidance under GAAP.
Components of regulatory assets:
| | | | | | | | | | | | | | | | | | | | | | | | | | | | | | | | | | | | | | |
| (Millions of Dollars) | | See Note(s) | | Remaining Amortization Period | | Dec. 31, 2021 | | Dec. 31, 2020 |
| Regulatory Assets | | | | | | Current | | Noncurrent | | Current | | Noncurrent |
| Pension and retiree medical obligations | | 11 | | Various | | $ | 77 | | | $ | 944 | | | $ | 82 | | | $ | 1,268 | |
| Deferred natural gas, electric, steam energy/fuel costs | | | | One to five years | | 504 | | | 543 | | | 14 | | | 18 | |
| Recoverable deferred taxes on AFUDC | | | | Plant lives | | — | | | 289 | | | — | | | 283 | |
| Excess deferred taxes — TCJA | | 7 | | Various | | 14 | | | 219 | | | 16 | | | 229 | |
| Depreciation differences | | | | One to 10 years | | 16 | | | 173 | | | 16 | | | 154 | |
| Environmental remediation costs | | 1, 12 | | Various | | 14 | | | 92 | | | 16 | | | 113 | |
| Texas revenue surcharges | | | | One to two years | | 20 | | | 64 | | | 54 | | | 17 | |
| Sales true-up and revenue decoupling | | | | One to two years | | 33 | | | 56 | | | 101 | | | 28 | |
| Benson biomass PPA termination and asset purchase | | | | Eight years | | 10 | | | 55 | | | 10 | | | 65 | |
| Renewable resources and environmental initiatives | | | | One to two years | | 170 | | | 48 | | | 129 | | | 12 | |
| PI extended power uprate | | | | 13 years | | 4 | | | 46 | | | 3 | | | 49 | |
| Purchased power contract costs | | | | Term of related contract | | 9 | | | 45 | | | 7 | | | 54 | |
Conservation programs (a) | | 1 | | One to two years | | 21 | | | 35 | | | 26 | | | 36 | |
| Losses on reacquired debt | | | | Term of related debt | | 3 | | | 35 | | | 4 | | | 38 | |
Contract valuation adjustments (b) | | 1, 10 | | Term of related contract | | 22 | | | 34 | | | 23 | | | 48 | |
| State commission adjustments | | | | Plant lives | | 1 | | | 32 | | | 1 | | | 32 | |
| Laurentian biomass PPA termination | | | | Two years | | 18 | | | 18 | | | 18 | | | 36 | |
| Nuclear refueling outage costs | | 1 | | One to two years | | 37 | | | 16 | | | 28 | | | 10 | |
| Property tax | | | | Various | | 16 | | | 16 | | | 16 | | | 21 | |
| Gas pipeline inspection and remediation costs | | | | One to two years | | 33 | | | 12 | | | 26 | | | 9 | |
Net AROs (c) | | 1, 12 | | Various | | — | | | (112) | | | — | | | 139 | |
| Other | | | | Various | | 84 | | | 78 | | | 50 | | | 78 | |
| Total regulatory assets | | | | | | $ | 1,106 | | | $ | 2,738 | | | $ | 640 | | | $ | 2,737 | |
(a)Includes costs for conservation programs, as well as incentives allowed in certain jurisdictions.
(b)Includes the fair value of certain long-term PPAs used to meet energy capacity requirements and valuation adjustments on natural gas commodity purchases.
(c)Includes amounts recorded for future recovery of AROs, less amounts recovered through nuclear decommissioning accruals and gains from decommissioning investments.
Components of regulatory liabilities:
| | | | | | | | | | | | | | | | | | | | | | | | | | | | | | | | | | | | | | |
| (Millions of Dollars) | | See Note(s) | | Remaining Amortization Period | | Dec. 31, 2021 | | Dec. 31, 2020 |
| Regulatory Liabilities | | | | | | Current | | Noncurrent | | Current | | Noncurrent |
Deferred income tax adjustments and TCJA refunds (a) | | 7 | | Various | | $ | 26 | | | $ | 3,230 | | | $ | 20 | | | $ | 3,368 | |
| Plant removal costs | | 1, 12 | | Various | | — | | | 1,655 | | | — | | | 1,520 | |
Effects of regulation on employee benefit costs (b) | | | | Various | | — | | | 235 | | | — | | | 221 | |
| Renewable resources and environmental initiatives | | | | Various | | 1 | | | 101 | | | 5 | | | 59 | |
| ITC deferrals | | 1 | | Various | | — | | | 53 | | | — | | | 51 | |
| Revenue decoupling | | | | One to two years | | 9 | | | 41 | | | 10 | | | 41 | |
Contract valuation adjustments (c) | | 1, 10 | | One to three years | | 56 | | | 1 | | | 19 | | | — | |
| Deferred natural gas, electric, steam energy/fuel costs | | | | Less than one year | | 50 | | | — | | | 84 | | | — | |
Conservation programs (d) | | 1 | | Less than one year | | 42 | | | — | | | 49 | | | — | |
| DOE settlement | | | | Less than one year | | 14 | | | 14 | | | 23 | | | — | |
| Other | | | | Various | | 73 | | | 75 | | | 101 | | | 42 | |
Total regulatory liabilities (e) | | | | | | $ | 271 | | | $ | 5,405 | | | $ | 311 | | | $ | 5,302 | |
(a)Includes the revaluation of recoverable/regulated plant accumulated deferred income taxes and revaluation impact of non-plant accumulated deferred income taxes due to the TCJA.
(b)Includes regulatory amortization and certain 2018 TCJA benefits approved by the CPUC to offset the PSCo prepaid pension asset.
(c)Includes the fair value of certain long-term PPAs used to meet energy capacity requirements and valuation adjustments on natural gas commodity purchases.
(d)Includes costs for conservation programs, as well as incentives allowed in certain jurisdictions.
(e)Revenue subject to refund of $17 million for both 2021 and 2020 is included in other current liabilities.
At Dec. 31, 2021 and 2020, Xcel Energy’s regulatory assets not earning a return primarily included the unfunded portion of pension and retiree medical obligations and net AROs. In addition, regulatory assets included $1,718 million and $812 million at Dec. 31, 2021 and 2020, respectively, of past expenditures not earning a return. Amounts are related to funded pension obligations, sales true-up and revenue decoupling, purchased natural gas and electric energy costs (including those related to Winter Storm Uri), various renewable resources and certain environmental initiatives.
| | |
| 5. Borrowings and Other Financing Instruments |
Short-Term Borrowings
Money PoolShort-Term Debt — Xcel Energy Inc. andmeets its utility subsidiaries have established a money pool arrangement that allows for short-term investments in and borrowings between the utility subsidiaries. NSP-Wisconsin does not participate in the money pool. Xcel Energy Inc. may make investments in the utility subsidiaries at market-based interest rates; however, the money pool arrangement does not allow the utility subsidiaries to make investments in Xcel Energy Inc. The money pool balances are eliminated in consolidation.
Short-Term Debt — Xcel Energy Inc. and its utility subsidiaries meet their short-term liquidity requirements primarily through the issuance of commercial paper and borrowings under their credit facilities and term loan. loan agreements.
Commercial paper and term loan borrowings outstanding foroutstanding:
| | | | | | | | | | | | | | | | | | | | | | | | | | |
| (Millions of Dollars, Except Interest Rates) | | Three Months Ended Dec. 31, 2021 | | Year Ended Dec. 31 |
| | 2021 | | 2020 | | 2019 |
| Borrowing limit | | $ | 3,100 | | | $ | 3,100 | | | $ | 3,100 | | | $ | 3,600 | |
| Amount outstanding at period end | | 1,005 | | | 1,005 | | | 584 | | | 595 | |
| Average amount outstanding | | 1,200 | | | 1,399 | | | 1,126 | | | 1,115 | |
| Maximum amount outstanding | | 1,774 | | | 2,054 | | | 2,080 | | | 1,780 | |
| Weighted average interest rate, computed on a daily basis | | 0.54 | % | | 0.57 | % | | 1.45 | % | | 2.72 | % |
| Weighted average interest rate at period end | | 0.31 | | | 0.31 | | | 0.23 | | | 2.34 | |
Term Loan Agreements —In the fourth quarter of 2021, Xcel Energy were as follows:repaid its $1.2 billion 364-Day Term Loan Agreement.
Bilateral Credit Agreement —In April 2021, NSP-Minnesota’s uncommitted bilateral credit agreement was renewed for an additional one-year term. The credit agreement is limited in use to support letters of credit. |
| | | | |
| (Amounts in Millions, Except Interest Rates) | | Three Months Ended Dec. 31, 2017 |
| Borrowing limit | | $ | 3,250 |
|
| Amount outstanding at period end | | 814 |
|
| Average amount outstanding | | 560 |
|
| Maximum amount outstanding | | 814 |
|
| Weighted average interest rate, computed on a daily basis | | 1.63 | % |
| Weighted average interest rate at period end | | 1.90 |
|
|
| | | | | | | | | | | | |
| | | Year Ended Dec. 31 |
| (Amounts in Millions, Except Interest Rates) | | 2017 | | 2016 | | 2015 |
| Borrowing limit | | $ | 3,250 |
| | $ | 2,750 |
| | $ | 2,750 |
|
| Amount outstanding at period end | | 814 |
| | 392 |
| | 846 |
|
| Average amount outstanding | | 644 |
| | 485 |
| | 601 |
|
| Maximum amount outstanding | | 1,247 |
| | 1,183 |
| | 1,360 |
|
| Weighted average interest rate, computed on a daily basis | | 1.35 | % | | 0.74 | % | | 0.48 | % |
| Weighted average interest rate at end of period | | 1.90 |
| | 0.95 |
| | 0.82 |
|
Letters of Credit— Xcel Energy Inc. and its subsidiaries useuses letters of credit, generallytypically with terms of one year, to provide financial guarantees for certain operating obligations. As of Dec. 31, 20172021 and 2016,2020, there were $30$19 million and $19$20 million of letters of credit outstanding respectively, under the credit facilities. The contract amounts of these letters of creditfacilities, respectively. Amounts approximate their fair value and are subject to fees.value.
Credit Facilities —In order to use their commercial paper programs to fulfill short-term funding needs, Xcel Energy Inc. and its utility subsidiaries must have revolving credit facilities in place at least equal to the amount of their respective commercial paper borrowing limits and cannot issue commercial paper in an aggregate amount exceeding available capacity under these credit facilities. The lines of credit provide short-term financing in the form of notes payable to banks, letters of credit and back-up support for commercial paper borrowings.
NSP-Minnesota, PSCo, SPS, and Terms of Credit Agreements— Xcel Energy Inc. each have, NSP-Minnesota, NSP-Wisconsin, PSCo and SPS entered five-year credit agreements with a syndicate of banks. The total borrowing limit under the rightamended credit agreements is $3.1 billion, with a swingline subfacility for Xcel Energy up to request an extension of the$75 million. The amended credit agreements mature in June 2021 termination date for two additional one-year periods. NSP-Wisconsin has the right to request an extension of the termination date for an additional one-year period. All extension requests are subject to majority bank group approval.2024.
Other featuresFeatures of the credit facilities include:facilities:
| | | | | | | | | | | | | | | | | | | | | | | | | | |
| | Debt-to-Total Capitalization Ratio (a) | | Amount Facility May Be Increased (millions of dollars) | | Additional Periods for Which a One-Year Extension May Be Requested (b) |
| | 2021 | | 2020 | | | | |
Xcel Energy Inc. (c) | | 60 | % | | 59 | % | | $ | 250 | | | 2 | |
| NSP-Wisconsin | | 49 | | | 46 | | | N/A | | 1 | |
| NSP-Minnesota | | 47 | | | 47 | | | 100 | | | 2 | |
| SPS | | 47 | | | 48 | | | 50 | | | 2 | |
| PSCo | | 44 | | | 44 | | | 100 | | | 2 | |
Xcel Energy Inc. may increase its credit facility by up to $200 million, NSP-Minnesota and PSCo may each increase their credit facilities by $100 million and SPS may increase its credit facility by $50 million. The NSP-Wisconsin credit facility cannot be increased.
(a) Each credit facility has a financial covenant requiring that the debt-to-total capitalization ratio of each entity be less than or equal to 65 percent. Each entity was65%.
(b) All extension requests are subject to majority bank group approval.
(c)The Xcel Energy Inc. credit facility has a cross-default provision that Xcel Energy Inc. would be in compliancedefault on its borrowings under the facility if it or any of its subsidiaries (except NSP-Wisconsin as long as its total assets do not comprise more than 15% of Dec. 31, 2017 and 2016, respectively, as evidenced by the table below:Xcel Energy’s consolidated total assets) default on indebtedness in an aggregate principal amount exceeding $75 million.
|
| | | | | | |
| | | Debt-to-Total Capitalization Ratio |
| | | 2017 | | 2016 |
| Xcel Energy Inc. | | 58 | % | | 57 | % |
| NSP-Wisconsin | | 47 |
| | 47 |
|
| NSP-Minnesota | | 48 |
| | 48 |
|
| SPS | | 46 |
| | 47 |
|
| PSCo | | 44 |
| | 45 |
|
If Xcel Energy Inc. or any of its utility subsidiaries do not comply with the covenant, an event of default may be declared, and if not remedied, any outstanding amounts due under the facility can be declared due by the lender.
The Xcel Energy Inc. credit facility has a cross-default provision that provides Xcel Energy Inc. will be in default on its borrowings under the facility if it or anyAs of its subsidiaries, except NSP-Wisconsin as long as its total assets do not comprise more than 15 percent of Xcel Energy’s consolidated total assets, default on certain indebtedness in an aggregate principal amount exceeding $75 million.
Dec. 31, 2021, Xcel Energy Inc. and its subsidiaries were in compliance with all financial covenants in their debt agreements as of Dec. 31, 2017 and 2016.covenants.
Xcel Energy Inc. entered into a 364-day term loan agreement on Dec. 5, 2017 to borrow up to $500 million. As of Dec. 31, 2017, Xcel Energy Inc. had borrowed $250 million of the Term Loan. Xcel Energy Inc. may recommit for one additional 364-day period from the December 2018 maturity date, subject to majority consent from lenders.
As of Dec. 31, 2017, Xcel Energy Inc. and its utility subsidiaries had the following committed credit facilities available:available as of Dec. 31, 2021:
| | | | | | | | | | | | | | | | | | | | |
| (Millions of Dollars) | | Credit Facility (a) | | Drawn (b) | | Available |
| Xcel Energy Inc. | | $ | 1,250 | | | $ | 638 | | | $ | 612 | |
| PSCo | | 700 | | | 155 | | | 545 | |
| NSP-Minnesota | | 500 | | | 9 | | | 491 | |
| SPS | | 500 | | | 139 | | | 361 | |
| NSP-Wisconsin | | 150 | | | 83 | | | 67 | |
| Total | | $ | 3,100 | | | $ | 1,024 | | | $ | 2,076 | |
|
| | | | | | | | | | | | |
| (Millions of Dollars) | | Credit Facility (a) | | Drawn (b) | | Available |
| Xcel Energy Inc. | | $ | 1,500 |
| | $ | 783 |
| | $ | 717 |
|
| PSCo | | 700 |
| | 3 |
| | 697 |
|
| NSP-Minnesota | | 500 |
| | 44 |
| | 456 |
|
| SPS | | 400 |
| | 2 |
| | 398 |
|
| NSP-Wisconsin | | 150 |
| | 11 |
| | 139 |
|
| Total | | $ | 3,250 |
| | $ | 843 |
| | $ | 2,407 |
|
| |
(a)
| These credit facilities mature in June 2021, with the exception of Xcel Energy Inc.’s $500 million 364-day term loan agreement entered into in December 2017. |
| |
(b)
| Includes outstanding commercial paper, term loan borrowings and letters of credit. |
(a)These credit facilities mature in June 2024.
(b)Includes outstanding commercial paper and letters of credit.
All credit facility bank borrowings, outstanding letters of credit term loan borrowings and outstanding commercial paper reduce the available capacity under the respective credit facilities. Xcel Energy Inc. and its utility subsidiaries had no direct advances on the credit facilities outstanding as of Dec. 31, 20172021 and 2016.
2020.
Long-Term Borrowings and Other Financing Instruments
Generally, all real and personal property of NSP-Minnesota, NSP-Wisconsin, PSCo and SPS are subject to the liens of their first mortgage indentures. Debt premiums, discounts and expenses are amortized over the life of the related debt. The premiums, discounts and expenses associated withfor refinanced debt are deferred and amortized over the life of the related new issuance, in accordance with regulatory guidelines.issuance.
Maturities of long-termLong-term debt are as follows:
|
| | | | |
| (Millions of Dollars) | | |
| 2018 | | $ | 457 |
|
| 2019 | | 405 |
|
| 2020 | | 1,256 |
|
| 2021 | | 425 |
|
| 2022 | | 905 |
|
During 2017,obligations for Xcel Energy Inc. and its utility subsidiaries completed the following financings:as of Dec. 31 (in millions of dollars):
| | | | | | | | | | | | | | | | | | | | | | | | | | |
| Xcel Energy Inc. |
| Financing Instrument | | Interest Rate | | Maturity Date | | 2021 | | 2020 |
| Unsecured senior notes | | 2.40 | % | | March 15, 2021 | | $ | — | | | $ | 400 | |
Unsecured senior notes (b) | | 0.50 | | | Oct. 15, 2023 | | 500 | | | 500 | |
| Unsecured senior notes | | 3.30 | | | June 1, 2025 | | 250 | | | 250 | |
| Unsecured senior notes | | 3.30 | | | June 1, 2025 | | 350 | | | 350 | |
| Unsecured senior notes | | 3.35 | | | Dec. 1, 2026 | | 500 | | | 500 | |
Unsecured senior notes (a) | | 1.75 | | | March 15,2027 | | 500 | | | — | |
| Unsecured senior notes | | 4.00 | | | June 15, 2028 | | 130 | | | 130 | |
| Unsecured senior notes | | 4.00 | | | June 15, 2028 | | 500 | | | 500 | |
| Unsecured senior notes | | 2.60 | | | Dec. 1, 2029 | | 500 | | | 500 | |
Unsecured senior notes (b) | | 3.40 | | | June 1, 2030 | | 600 | | | 600 | |
Unsecured senior notes (a) | | 2.35 | | | Nov. 15, 2031 | | 300 | | | — | |
| Unsecured senior notes | | 6.50 | | | July 1, 2036 | | 300 | | | 300 | |
| Unsecured senior notes | | 4.80 | | | Sep. 15, 2041 | | 250 | | | 250 | |
| Unsecured senior notes | | 3.50 | | | Dec. 1, 2049 | | 500 | | | 500 | |
| Unamortized discount | | | | | | (8) | | | (7) | |
| Unamortized debt issuance cost | | | | | | (33) | | | (32) | |
| Current maturities | | | | | | — | | | (400) | |
| Total long-term debt | | | | | | $ | 5,139 | | | $ | 4,341 | |
PSCo issued $400 million(a)2021 financing.
(b)2020 financing.
| | | | | | | | | | | | | | | | | | | | | | | | | | |
| NSP-Minnesota |
| Financing Instrument | | Interest Rate | | Maturity Date | | 2021 | | 2020 |
| First mortgage bonds | | 2.15 | % | | Aug. 15, 2022 | | $ | 300 | | | $ | 300 | |
| First mortgage bonds | | 2.60 | | | May 15, 2023 | | 400 | | | 400 | |
| First mortgage bonds | | 7.125 | | | July 1, 2025 | | 250 | | | 250 | |
| First mortgage bonds | | 6.50 | | | March 1, 2028 | | 150 | | | 150 | |
First mortgage bonds (a) | | 2.25 | | | April 1, 2031 | | 425 | | | — | |
| First mortgage bonds | | 5.25 | | | July 15, 2035 | | 250 | | | 250 | |
| First mortgage bonds | | 6.25 | | | June 1, 2036 | | 400 | | | 400 | |
| First mortgage bonds | | 6.20 | | | July 1, 2037 | | 350 | | | 350 | |
| First mortgage bonds | | 5.35 | | | Nov. 1, 2039 | | 300 | | | 300 | |
| First mortgage bonds | | 4.85 | | | Aug. 15, 2040 | | 250 | | | 250 | |
| First mortgage bonds | | 3.40 | | | Aug. 15, 2042 | | 500 | | | 500 | |
| First mortgage bonds | | 4.125 | | | May 15, 2044 | | 300 | | | 300 | |
| First mortgage bonds | | 4.00 | | | Aug. 15, 2045 | | 300 | | | 300 | |
| First mortgage bonds | | 3.60 | | | May 15, 2046 | | 350 | | | 350 | |
| First mortgage bonds | | 3.60 | | | Sep. 15, 2047 | | 600 | | | 600 | |
| First mortgage bonds | | 2.90 | | | March 1, 2050 | | 600 | | | 600 | |
First mortgage bonds (b) | | 2.60 | | | June 1, 2051 | | 700 | | | 700 | |
First mortgage bonds (a) | | 3.20 | | | April 1,2052 | | 425 | | | — | |
| Other long-term debt | | | | | | 3 | | | — | |
| Unamortized discount | | | | | | (44) | | | (42) | |
| Unamortized debt issuance cost | | | | | | (62) | | | (54) | |
| Current maturities | | | | | | (300) | | | — | |
| Total long-term debt | | | | | | $ | 6,447 | | | $ | 5,904 | |
(a)2021 financing.
(b)2020 financing.
| | | | | | | | | | | | | | | | | | | | | | | | | | |
| NSP-Wisconsin |
| Financing Instrument | | Interest Rate | | Maturity Date | | 2021 | | 2020 |
| City of La Crosse resource recovery bond | | 6.00 | % | | Nov. 1, 2021 | | $ | — | | | $ | 19 | |
| First mortgage bonds | | 3.30 | | | June 15, 2024 | | 100 | | | 100 | |
| First mortgage bonds | | 3.30 | | | June 15, 2024 | | 100 | | | 100 | |
| First mortgage bonds | | 6.375 | | | Sept. 1, 2038 | | 200 | | | 200 | |
| First mortgage bonds | | 3.70 | | | Oct. 1, 2042 | | 100 | | | 100 | |
| First mortgage bonds | | 3.75 | | | Dec. 1, 2047 | | 100 | | | 100 | |
| First mortgage bonds | | 4.20 | | | Sept. 1, 2048 | | 200 | | | 200 | |
First mortgage bonds (b) | | 3.05 | | | May 1, 2051 | | 100 | | | 100 | |
First mortgage bonds (a) | | 2.82 | | | May 1, 2051 | | 100 | | | — | |
| Other long-term debt | | | | | | 1 | | | — | |
| Unamortized discount | | | | | | (4) | | | (4) | |
| Unamortized debt issuance cost | | | | | | (10) | | | (9) | |
| Current maturities | | | | | | — | | | (19) | |
| Total long-term debt | | | | | | $ | 987 | | | $ | 887 | |
(a)2021 financing.
(b)2020 financing.
SPS issued $450 million | | | | | | | | | | | | | | | | | | | | | | | | | | |
| PSCo |
| Financing Instrument | | Interest Rate | | Maturity Date | | 2021 | | 2020 |
| First mortgage bonds | | 2.25 | % | | Sept. 15, 2022 | | $ | 300 | | | $ | 300 | |
| First mortgage bonds | | 2.50 | | | March 15, 2023 | | 250 | | | 250 | |
| First mortgage bonds | | 2.90 | | | May 15, 2025 | | 250 | | | 250 | |
| First mortgage bonds | | 3.70 | | | June 15, 2028 | | 350 | | | 350 | |
First mortgage bonds (b) | | 1.90 | | | Jan. 15, 2031 | | 375 | | | 375 | |
First mortgage bonds (a) | | 1.875 | | | June 15, 2031 | | 750 | | | — | |
| First mortgage bonds | | 6.25 | | | Sept. 1, 2037 | | 350 | | | 350 | |
| First mortgage bonds | | 6.50 | | | Aug. 1, 2038 | | 300 | | | 300 | |
| First mortgage bonds | | 4.75 | | | Aug. 15, 2041 | | 250 | | | 250 | |
| First mortgage bonds | | 3.60 | | | Sept. 15, 2042 | | 500 | | | 500 | |
| First mortgage bonds | | 3.95 | | | March 15, 2043 | | 250 | | | 250 | |
| First mortgage bonds | | 4.30 | | | March 15, 2044 | | 300 | | | 300 | |
| First mortgage bonds | | 3.55 | | | June 15, 2046 | | 250 | | | 250 | |
| First mortgage bonds | | 3.80 | | | June 15, 2047 | | 400 | | | 400 | |
| First mortgage bonds | | 4.10 | | | June 15, 2048 | | 350 | | | 350 | |
| First mortgage bonds | | 4.05 | | | Sept. 15, 2049 | | 400 | | | 400 | |
| First mortgage bonds | | 3.20 | | | March 1, 2050 | | 550 | | | 550 | |
First mortgage bonds (b) | | 2.70 | | | Jan. 15, 2051 | | 375 | | | 375 | |
| Unamortized discount | | | | | | (33) | | | (30) | |
| Unamortized debt issuance cost | | | | | | (50) | | | (46) | |
| Current maturities | | | | | | (300) | | | — | |
| Total long-term debt | | | | | | $ | 6,167 | | | $ | 5,724 | |
(a)2021 financing.
(b)2020 financing.
| | | | | | | | | | | | | | | | | | | | | | | | | | |
| SPS |
| Financing Instrument | | Interest Rate | | Maturity Date | | 2021 | | 2020 |
| First mortgage bonds | | 3.30 | % | | June 15, 2024 | | $ | 150 | | | $ | 150 | |
| First mortgage bonds | | 3.30 | | | June 15, 2024 | | 200 | | | 200 | |
| Unsecured senior notes | | 6.00 | | | Oct. 1, 2033 | | 100 | | | 100 | |
| Unsecured senior notes | | 6.00 | | | Oct. 1, 2036 | | 250 | | | 250 | |
| First mortgage bonds | | 4.50 | | | Aug. 15, 2041 | | 200 | | | 200 | |
| First mortgage bonds | | 4.50 | | | Aug. 15, 2041 | | 100 | | | 100 | |
| First mortgage bonds | | 4.50 | | | Aug. 15, 2041 | | 100 | | | 100 | |
| First mortgage bonds | | 3.40 | | | Aug. 15, 2046 | | 300 | | | 300 | |
| First mortgage bonds | | 3.70 | | | Aug. 15, 2047 | | 450 | | | 450 | |
| First mortgage bonds | | 4.40 | | | Nov. 15, 2048 | | 300 | | | 300 | |
| First mortgage bonds | | 3.75 | | | June 15, 2049 | | 300 | | | 300 | |
First mortgage bonds (b) | | 3.15 | | | May 1, 2050 | | 350 | | | 350 | |
First mortgage bonds (a) | | 3.15 | | | May 1, 2050 | | 250 | | | — | |
| Unamortized discount | | | | | | (9) | | | (10) | |
| Unamortized debt issuance cost | | | | | | (28) | | | (26) | |
| Total long-term debt | | | | | | $ | 3,013 | | | $ | 2,764 | |
(a)2020 financing re-opened in 2021.
(b)2020 financing.
| | | | | | | | | | | | | | | | | | | | | | | | | | |
| Other Subsidiaries |
| Financing Instrument | | Interest Rate | | Maturity Date | | 2021 | | 2020 |
| Various Eloigne affordable housing project notes | | 0.00% - 6.50% | | 2022 — 2055 | | $ | 27 | | | $ | 27 | |
| Current maturities | | | | | | (1) | | | (2) | |
| Total long-term debt | | | | | | $ | 26 | | | $ | 25 | |
Maturities of 3.70 percent first mortgage bonds due Aug. 15, 2047;long-term debt:
NSP-Minnesota issued $600 million of 3.60 percent first mortgage bonds due Sept. 15, 2017; | | | | | | | | |
| (Millions of Dollars) | | |
| 2022 | | $ | 601 | |
| 2023 | | 1,150 | |
| 2024 | | 552 | |
| 2025 | | 1,102 | |
| 2026 | | 501 | |
NSP-Wisconsin issued $100 million of 3.75 percent first mortgage bonds due Dec. 1, 2047; and
Xcel Energy Inc. entered into a $500 million 364-Day Term Loan Agreement.
During 2016, Xcel Energy Inc. and its utility subsidiaries completed the following financings:
Xcel Energy Inc. issued $400 million of 2.40 percent senior notes due March 15, 2021 and $350 million of 3.30 percent senior notes due June 1, 2025;
NSP-Minnesota issued $350 million of 3.60 percent first mortgage bonds due May 15, 2046;
PSCo issued $250 million of 3.55 percent first mortgage bonds due June 15, 2046;
SPS issued $300 million of 3.40 percent first mortgage bonds due Aug. 15, 2046; and
Xcel Energy Inc. issued $300 million of 2.60 percent senior notes due March 15, 2022 and $500 million of 3.35 percent senior notes due Dec. 1, 2026.
Deferred Financing Costs — Deferred financing costs of approximately $119$184 million and $109$167 million, net of amortization, are presented as a deduction from the carrying amount of long-term debt as of Dec. 31, 20172021 and 2016,2020, respectively. Xcel Energy is amortizing these financing costs over the remaining maturity periods of the related debt.
Capital Stock ATM Equity Offering —In November 2021, Xcel Energy Inc. has 7,000,000 sharesfiled a prospectus supplement under which it may sell up to $800 million of preferredits common stock authorized to be issued with a $100 par value.through an ATM program. As of Dec. 31, 2017 and 2016, there were no2021, Xcel Energy Inc. had issued 5.33 million shares of preferred stock outstanding.
The charters of PSCo and SPS authorize each subsidiary to issue 10,000,000 shares of preferredcommon stock with par valuesnet proceeds of $0.01 and $1.00 per share, respectively. As of Dec. 31, 2017 and 2016, there were no preferred shares of subsidiaries outstanding.$347 million through the ATM program.
Capital Stock — Preferred stock authorized/outstanding:
| | | | | | | | | | | | | | | | | | | | |
| | Preferred Stock Authorized (Shares) | | Par Value of Preferred Stock | | Preferred Stock Outstanding (Shares) 2021 and 2020 |
| Xcel Energy Inc. | | 7,000,000 | | | $ | 100 | | | — | |
| PSCo | | 10,000,000 | | | 0.01 | | | — | |
| SPS | | 10,000,000 | | | 1.00 | | | — | |
Xcel Energy Inc. has 1 billion shares ofhad the following common stock authorized to be issued with a $2.50 par value. Outstanding shares as of Dec. 31, 2017 and 2016 were 507,762,881 and 507,222,795, respectively.authorized/outstanding:
| | | | | | | | | | | | | | | | | | | | |
| Common Stock Authorized (Shares) | | Par Value of Common Stock | | Common Stock Outstanding (Shares) as of Dec. 31, 2021 | | Common Stock Outstanding (Shares) as of Dec. 31, 2020 |
| 1,000,000,000 | | | $ | 2.50 | | | 544,025,269 | | | 537,438,394 | |
Dividend and Other Capital-Related Restrictions — Xcel Energy depends on its utility subsidiaries to pay dividends. All of Xcel Energy Inc.’s utility subsidiaries’ dividends are subject to the FERC’s jurisdiction, which prohibits the payment of dividends out of capital accounts; payment of dividends is allowed out ofaccounts. Dividends are solely to be paid from retained earnings only. Due to certain restrictiveearnings. Certain covenants also require Xcel Energy Inc. is required to be current on particular interest payments before dividends can be paid.prior to dividend disbursements.
The most restrictiveState regulatory commissions impose dividend limitations for NSP-Minnesota, NSP-Wisconsin and SPS, which are more restrictive than those imposed by their respective state regulatory commission. PSCo’s dividends are subject to the FERC’s jurisdiction.
Only NSP-Minnesota has a first mortgage indenture which places certain restrictions on the amount of cash dividends it can pay to Xcel Energy Inc., the holder of its common stock. Even with this restriction, NSP-Minnesota could have paid more than $1.9 billionFERC. Requirements and $1.7 billion in additional cash dividends to Xcel Energy Inc.actuals as of Dec. 31, 2017 and 2016, respectively.2021:
| | | | | | | | | | | | | | | | | | | | |
| | Equity to Total
Capitalization Ratio
Required Range | | Equity to Total Capitalization Ratio Actual |
| | Low | | High | | 2021 |
| NSP-Minnesota | | 47.2 | % | | 57.6 | % | | 52.9 | % |
| NSP-Wisconsin | | 52.5 | | | N/A | | 52.8 | |
SPS (a) | | 45.0 | | | 55.0 | | | 54.5 | |
NSP-Minnesota’s state regulatory commissions indirectly limit the amount(a) Excludes short-term debt.
| | | | | | | | | | | | | | | | | | | | |
| (Amounts in Millions) | | Unrestricted Retained Earnings | | Total Capitalization | | Limit on Total Capitalization |
| NSP-Minnesota | | $ | 1,558 | | | $ | 14,321 | | | $ | 15,332 | |
NSP-Wisconsin (a) | | 11 | | | 2,091 | | | N/A |
SPS (b) | | 513 | | | 6,615 | | | N/A |
NSP-Wisconsin cannot(a)Cannot pay annual dividends in excess of approximately $53 millionforecasted levels if its calendar year average equity-to-total capitalization ratio is or falls below the state commission authorized level as calculated by PSCW requirements. NSP-Wisconsin’s calendar year average equity ratio calculated on this basis was 53.1 percent as of Dec. 31, 2017 and $19 million in retained earnings was not restricted. NSP-Wisconsin’s authorized equity ratio was 52.5 percent for 2016 and 2017, but will be 51.5 percent for 2018.level.
SPS’ state regulatory commissions indirectly limit the amount of dividends that SPS can pay Xcel Energy Inc. by requiring an equity-to-total capitalization ratio (excluding short-term debt) between 45.0 percent and 55.0 percent. In addition, SPS may(b)May not pay a dividend that would cause it to losea loss of its investment grade bond rating. SPS’ equity ratio (excluding short-term debt) was 53.8 percent as of Dec. 31, 2017 and $542 million in retained earnings was not restricted.
The issuanceIssuance of securities by Xcel Energy Inc. generally is not generally subject to regulatory approval. However, utility financings and certain intra-system financings are subject to the jurisdiction of the applicable state regulatory commissions and/or the FERC. AsXcel Energy may seek additional authorization as necessary.
Amounts authorized to issue as of Dec. 31, 2017:2021:
| | | | | | | | | | | | | | | | | |
| (Millions of Dollars) | | Long-Term Debt | | Short-Term Debt | |
| NSP-Minnesota | | 52.8% of total capitalization | (a) | $ | 2,300 | | (a) |
| NSP-Wisconsin | | $ | 150 | | | 150 | | |
| SPS | | — | | | 600 | | |
| PSCo | | 700 | | (b) | 800 | | |
PSCo has authorization to issue up to an additional $1.8 billion of long-term debt and up to $800 million of short-term debt.
SPS has authorization to issue up to $500 million of short-term debt and SPS will file for additional long-term debt authorization.
NSP-Wisconsin has authorization to issue an additional $250 million of long-term debt and up to $150 million of short-term debt.
(a) NSP-Minnesota has authorization to issue long-term securities provided the equity-to-total capitalization ratio remains between 47.2 percent and 57.6 percentwithin the required range, and to issue short-term debt provided it does not exceed 15 percent15% of total capitalization. Total capitalization
(b) PSCo filed for NSP-Minnesota cannot exceed $11.2 billion.additional long-term debt authorization in December 2021.
Xcel Energy believes these authorizations are adequate and seeks additional authorization as necessary.
| |
5. | Joint Ownership of Generation, Transmission and Gas Facilities |
Following are the investments by Xcel Energy Inc.’s utility subsidiaries in jointly owned generation, transmission and gas facilities and the related ownership percentages as of Dec. 31, 2017:
|
| | | | | | | | | | | | | | | |
| (Millions of Dollars) | | Plant in Service | | Accumulated Depreciation | | CWIP | | Ownership % |
| NSP-Minnesota | | | | | | | | |
| Electric Generation: | | | | | | | | |
| Sherco Unit 3 | | $ | 612 |
| | $ | 411 |
| | $ | 1 |
| | 59 | % |
| Sherco Common Facilities Units 1, 2 and 3 | | 145 |
| | 99 |
| | 1 |
| | 80 |
|
| Sherco Substation | | 5 |
| | 3 |
| | — |
| | 59 |
|
| Electric Transmission: | | | | | | | | |
| Grand Meadow Line and Substation | | 11 |
| | 2 |
| | — |
| | 50 |
|
| CapX2020 Transmission | | 1,039 |
| | 138 |
| | 2 |
| | 51 |
|
| Total NSP-Minnesota | | $ | 1,812 |
| | $ | 653 |
| | $ | 4 |
| | |
|
| | | | | | | | | | | | | | | |
| (Millions of Dollars) | | Plant in Service | | Accumulated Depreciation | | CWIP | | Ownership % |
| NSP-Wisconsin | | | | | | | | |
| Electric Transmission: | | | | | | | | |
| CapX2020 Transmission | | $ | 162 |
| | $ | 12 |
| | $ | 103 |
| | 81 | % |
| La Crosse, Wis. to Madison, Wis. | | — |
| | — |
| | 102 |
| | 37 |
|
| Total NSP-Wisconsin | | $ | 162 |
| | $ | 12 |
| | $ | 205 |
| | |
|
| | | | | | | | | | | | | | | |
| (Millions of Dollars) | | Plant in Service | | Accumulated Depreciation | | CWIP | | Ownership % |
| PSCo | | | | | | | | |
| Electric Generation: | | | | | | | | |
| Hayden Unit 1 | | $ | 150 |
| | $ | 72 |
| | $ | 1 |
| | 76 | % |
| Hayden Unit 2 | | 149 |
| | 65 |
| | — |
| | 37 |
|
| Hayden Common Facilities | | 39 |
| | 20 |
| | — |
| | 53 |
|
| Craig Units 1 and 2 | | 81 |
| | 39 |
| | — |
| | 10 |
|
| Craig Common Facilities 1, 2 and 3 | | 39 |
| | 20 |
| | — |
| | 7 |
|
| Comanche Unit 3 | | 890 |
| | 118 |
| | — |
| | 67 |
|
| Comanche Common Facilities | | 24 |
| | 2 |
| | 3 |
| | 82 |
|
| Electric Transmission: | | | | | | | | |
| Transmission and other facilities, including substations | | 177 |
| | 67 |
| | 1 |
| | Various |
|
| Gas Transportation: | | | | | | | | |
| Rifle, Colo. to Avon, Colo. | | 22 |
| | 8 |
| | — |
| | 60 |
|
| Gas Transportation Compressor | | 8 |
| | 1 |
| | — |
| | 50 |
|
| Total PSCo | | $ | 1,579 |
| | $ | 412 |
| | $ | 5 |
| | |
NSP-Minnesota and PSCo have approximately 517 MW and 816 MW of jointly owned generating capacity, respectively. Each Company’s share of operating expenses and construction expenditures are included in the applicable utility accounts. Each of the respective owners is responsible for providing its own financing.
Revenue is classified by the type of goods/services rendered and market/customer type. Xcel Energy’s operating revenues consisted of the following:
| | | | | | | | | | | | | | | | | | | | | | | | | | |
| | Year Ended Dec. 31, 2021 |
| (Millions of Dollars) | | Electric | | Natural Gas | | All Other | | Total |
| Major revenue types | | | | | | | | |
| Revenue from contracts with customers: |
| Residential | | $ | 3,194 | | | $ | 1,222 | | | $ | 45 | | | $ | 4,461 | |
| C&I | | 5,050 | | | 640 | | | 30 | | | 5,720 | |
| Other | | 127 | | | — | | | 7 | | | 134 | |
| Total retail | | 8,371 | | | 1,862 | | | 82 | | | 10,315 | |
| Wholesale | | 1,540 | | | — | | | — | | | 1,540 | |
| Transmission | | 604 | | | — | | | — | | | 604 | |
| Other | | 61 | | | 148 | | | — | | | 209 | |
| Total revenue from contracts with customers | | 10,576 | | | 2,010 | | | 82 | | | 12,668 | |
| Alternative revenue and other | | 629 | | | 122 | | | 12 | | | 763 | |
| Total revenues | | $ | 11,205 | | | $ | 2,132 | | | $ | 94 | | | $ | 13,431 | |
| | | | | | | | | | | | | | | | | | | | | | | | | | |
| | Year Ended Dec. 31, 2020 |
| (Millions of Dollars) | | Electric | | Natural Gas | | All Other | | Total |
| Major revenue types | | | | | | | | |
| Revenue from contracts with customers: |
| Residential | | $ | 3,066 | | | $ | 975 | | | $ | 42 | | | $ | 4,083 | |
| C&I | | 4,596 | | | 462 | | | 27 | | | 5,085 | |
| Other | | 125 | | | — | | | 6 | | | 131 | |
| Total retail | | 7,787 | | | 1,437 | | | 75 | | | 9,299 | |
| Wholesale | | 759 | | | — | | | — | | | 759 | |
| Transmission | | 579 | | | — | | | — | | | 579 | |
| Other | | 73 | | | 137 | | | — | | | 210 | |
| Total revenue from contracts with customers | | 9,198 | | | 1,574 | | | 75 | | | 10,847 | |
| Alternative revenue and other | | 604 | | | 62 | | | 13 | | | 679 | |
| Total revenues | | $ | 9,802 | | | $ | 1,636 | | | $ | 88 | | | $ | 11,526 | |
| | | | | | | | | | | | | | | | | | | | | | | | | | |
| | Year Ended Dec. 31, 2019 |
| (Millions of Dollars) | | Electric | | Natural Gas | | All Other | | Total |
| Major revenue types | | | | | | | | |
| Revenue from contracts with customers: |
| Residential | | $ | 2,877 | | | $ | 1,127 | | | $ | 41 | | | $ | 4,045 | |
| C&I | | 4,844 | | | 567 | | | 29 | | | 5,440 | |
| Other | | 130 | | | — | | | 4 | | | 134 | |
| Total retail | | 7,851 | | | 1,694 | | | 74 | | | 9,619 | |
| Wholesale | | 737 | | | — | | | — | | | 737 | |
| Transmission | | 507 | | | — | | | — | | | 507 | |
| Other | | 49 | | | 120 | | | — | | | 169 | |
| Total revenue from contracts with customers | | 9,144 | | | 1,814 | | | 74 | | | 11,032 | |
| Alternative revenue and other | | 431 | | | 54 | | | 12 | | | 497 | |
| Total revenues | | $ | 9,575 | | | $ | 1,868 | | | $ | 86 | | | $ | 11,529 | |
Federal Tax Reform— In December 2017, the TCJA was signed into law. While the legislation will require interpretations and regulations to be issued by the IRS, the key provisions impacting Xcel Energy, generally beginning in 2018, include:
Corporate federal tax rate reduction from 35 percent to 21 percent;
Normalization of resulting plant-related excess deferred taxes;
Elimination of the corporate alternative minimum tax;
Continued interest expense deductibility and discontinued bonus depreciation for regulated public utilities;
Limitations on certain executive compensation deductions;
Limitations on certain deductions for NOLs arising after Dec. 31, 2017 (limited to 80 percent of taxable income);
Repeal of the section 199 manufacturing deduction; and
Reduced deductions for meals and entertainment as well as state and local lobbying.
Entities are required under ASC Topic 740 to recognize the accounting impacts of a tax law change, including the impacts of a change in tax rates on deferred tax assets and liabilities, in the period including the date of the tax law enactment. The SEC staff issued guidance in SAB 118 that supplements the accounting requirements of ASC Topic 740 if elements of the TCJA assessment are not complete, and provides for up to a one year period to finalize the required accounting. Xcel Energy has estimated the effects of the TCJA, which have been reflected in the Dec. 31, 2017 consolidated financial statements. Issuance of U.S. Treasury regulations interpreting the TCJA, other U.S. Treasury and IRS guidance or interpretations of the application of ASC Topic 740 may result in changes to these estimates.
Overall for Xcel Energy, reductions in deferred tax assets and liabilities due to the reduction in corporate federal tax rates result in a net tax benefit. However, as a result of IRS requirements and past regulatory treatment of deferred taxes in the determination of regulated rates of the utility subsidiaries, including deferred taxes related to regulated plant and certain other deferred tax assets and liabilities, the impact was primarily recognized as a regulatory liability refundable to utility customers.
The fourth quarter 2017 estimated accounting impacts of the December 2017 enactment of the new tax law at Xcel Energy included:
$2.7 billion ($3.8 billion grossed-up for tax) of reclassifications of plant-related excess deferred taxes to regulatory liabilities upon valuation at the new 21 percent federal rate. The regulatory liabilities will be amortized consistent with IRS normalization requirements, resulting in customer refunds over an estimated weighted average period of approximately 30 years;
$254 million and $174 million of reclassifications (grossed-up for tax) of excess deferred taxes for non-plant related deferred tax assets and liabilities, respectively, to regulatory assets and liabilities; and
$23 million of total estimated income tax expense related to the tax rate change on certain non-plant deferred taxes and all other 2017 income statement impacts of the federal tax reform.
Xcel Energy has accounted for the state tax impacts of federal tax reform based on currently enacted state tax laws. Any future state tax law changes related to the TCJA will be accounted for in the periods state laws are enacted.
Consolidated Appropriations Act, 2016—In December 2015, the Consolidated Appropriations Act, 2016 (Act) was signed into law. The Act provided for the following:
Immediate expensing, or “bonus depreciation,” of 50 percent for property placed in service in 2015, 2016, and 2017;
PTCs at 100 percent of the applicable rate for wind energy projects that begin construction by the end of 2016; 80 percent of the credit rate for projects that begin construction in 2017; 60 percent of the credit rate for projects that begin construction in 2018; and 40 percent of the credit rate for projects that begin construction in 2019. The wind energy PTC was not extended for projects that begin construction after 2019;
ITCs at 30 percent for commercial solar projects that begin construction by the end of 2019; 26 percent for projects that begin construction in 2020; 22 percent for projects that begin construction in 2021; and 10 percent for projects thereafter;
R&E credit was permanently extended; and
Delay of two years (until 2020) of the excise tax on certain employer-provided health insurance plans.
The accounting related to the Act was recorded beginning in the fourth quarter of 2015 because a change in tax law is accounted for beginning in the period of enactment. The fourth quarter 2015 accounting impacts included:
Recognition of additional tax deductions for bonus depreciation of $1.2 billion, and as a result, recognition of $5 million benefit related to a carryback claim (see additional discussion below) and $4 million expense related to valuation allowances and expirations of charitable contribution carryforwards; and
Recognition of $7 million benefit for federal R&E credits.
Federal Tax Loss Carryback Claims — - In 2012-2015,2020, Xcel Energy identified certain expensesexpense related to tax years 2009 2010,- 2011 2013, 2014 and 2015 that qualify for an extended carryback beyond the typical two-year carryback period.claim. As a result, of a higher tax rate in prior years, Xcel Energy recognized a tax benefit of approximately $5$13 million was recognized in 2015, $17 million in 2014, $12 million in 2013 and $15 million in 2012.2020.
Federal Audit— Xcel Energy files a consolidated federal income tax return. The statute Statute of limitations applicable to Xcel Energy’s consolidated federal income tax returns expire as follows:
|
| | | | | | | |
| Tax Year(s) | | Expiration |
20092014 - 20112016 | | June 2018December 2022 |
2012 - 20132018 | | October 2018 |
2014 | | September 2018 |
2015 | | September 2019 |
2016 | | September 20202022 |
In 2012,Additionally, the IRS commenced an examinationstatute of tax years 2010 and 2011, including the 2009 carryback claim. The IRS proposed an adjustmentlimitations related to the federal tax loss carryback claims that would have resultedcredit carryforwards will remain open until those credits are utilized in $14 millionsubsequent returns. Further, the statute of income tax expense for the 2009 through 2011 claims, and the 2013 through 2015 claims. In the fourth quarter of 2015, the IRS forwarded the issue to the Office of Appeals (“Appeals”). In the third quarter of 2017, Xcel Energy and Appeals reached an agreement and the benefitlimitations related to the agreed upon portions was recognized. As of Dec. 31, 2017, the caseadditional federal tax loss carryback claim filed in 2020 has been forwarded to the Joint Committee on Taxation.
In the third quarter of 2015, the IRS commenced an examination of tax years 2012 and 2013. In the third quarter of 2017, the IRS concluded the audit of tax years 2012 and 2013 and proposed an adjustment that would impact Xcel Energy’s NOL and ETR. After evaluating the proposed adjustment, Xcel Energy filed a protest with the IRS. Xcel Energy anticipates the issue will be forwarded to Appeals. As of Dec. 31, 2017,extended. Xcel Energy has recognized its best estimate of income tax expense that will result from a final resolution of this issue; however, the outcome and timing of a resolution is uncertain.unknown.
State Audits—Xcel Energy files consolidated state tax returns based on income in its major operating jurisdictions of Colorado, Minnesota, Texas, and Wisconsin, and various other state income-based tax returns.
As of Dec. 31, 2017,2021, Xcel Energy’s earliest open tax years that are subject(subject to examination by state taxing authorities in its major operating jurisdictionsjurisdictions) were as follows:
|
| | | | | | | |
| State | | Year |
| Colorado | | 20092014 |
| Minnesota | | 20092014 |
| Texas | | 20092016 |
| Wisconsin | | 20122016 |
•In April 2021, Texas began an audit of tax years 2016-2019. As of Dec. 31, 2021, 0 material adjustments have been proposed.
•In March 2021, Wisconsin began an audit of tax years 2016 - 2019. As of Dec. 31, 2021, 0 material adjustments have been proposed.
•In July 2020, Minnesota began an audit of tax years 2010 through 2014.2015 - 2018. As of Dec. 31, 2017, Minnesota had not proposed any2021, 0 material adjustments.adjustments have been proposed.
In 2016, Texas began an audit of years 2009 and 2010, and in September 2017, began an audit of year 2011. In the fourth quarter of 2017, Texas concluded these audits and Xcel Energy recognized the related benefit.
In 2016, Wisconsin began an audit of years 2012 and 2013. As of Dec. 31, 2017, Wisconsin had not proposed any material adjustments.
As of Dec. 31, 2017, there were no•NaN other state income tax audits in progress.progress for its major operating jurisdictions as of Dec. 31, 2021.
Unrecognized Tax Benefits — The unrecognizedUnrecognized tax benefit balance includes permanent tax positions, which if recognized would affect the annual ETR. In addition, the unrecognized tax benefit balance includes temporary tax positions for which the ultimate deductibility is highly certain, but for which there is uncertainty about the timing of such deductibility.timing. A change in the period of deductibility would not affect the ETR but would accelerate the payment of cash to the taxing authority to an earlier period.authority.
Unrecognized tax benefits - permanent vs. temporary:
A reconciliation of the amount of | | | | | | | | | | | | | | |
| (Millions of Dollars) | | Dec. 31, 2021 | | Dec. 31, 2020 |
| Unrecognized tax benefit — Permanent tax positions | | $ | 47 | | | $ | 41 | |
| Unrecognized tax benefit — Temporary tax positions | | 11 | | | 11 | |
| Total unrecognized tax benefit | | $ | 58 | | | $ | 52 | |
Changes in unrecognized tax benefit is as follows:benefits:
| | | | | | | | | | | | | | | | | | | | |
| (Millions of Dollars) | | 2021 | | 2020 | | 2019 |
| Balance at Jan. 1 | | $ | 52 | | | $ | 44 | | | $ | 37 | |
| Additions based on tax positions related to the current year | | 5 | | | 9 | | | 10 | |
| Reductions based on tax positions related to the current year | | — | | | (2) | | | (4) | |
| Additions for tax positions of prior years | | 2 | | | 35 | | | 1 | |
| Reductions for tax positions of prior years | | (1) | | | (34) | | | — | |
| Balance at Dec. 31 | | $ | 58 | | | $ | 52 | | | $ | 44 | |
|
| | | | | | | | |
| (Millions of Dollars) | | Dec. 31, 2017 | | Dec. 31, 2016 |
| Unrecognized tax benefit — Permanent tax positions | | $ | 20 |
| | $ | 30 |
|
| Unrecognized tax benefit — Temporary tax positions | | 19 |
| | 104 |
|
| Total unrecognized tax benefit | | $ | 39 |
| | $ | 134 |
|
A reconciliation of the beginning and ending amount of unrecognizedUnrecognized tax benefit is as follows:
|
| | | | | | | | | | | | |
| (Millions of Dollars) | | 2017 | | 2016 | | 2015 |
| Balance at Jan. 1 | | $ | 134 |
| | $ | 121 |
| | $ | 67 |
|
| Additions based on tax positions related to the current year | | 6 |
| | 8 |
| | 27 |
|
| Reductions based on tax positions related to the current year | | (4 | ) | | — |
| | (5 | ) |
| Additions for tax positions of prior years | | 15 |
| | 10 |
| | 35 |
|
| Reductions for tax positions of prior years | | (105 | ) | | (5 | ) | | (3 | ) |
| Settlements with taxing authorities | | (7 | ) | | — |
| | — |
|
| Balance at Dec. 31 | | $ | 39 |
| | $ | 134 |
| | $ | 121 |
|
The unrecognized tax benefit amountsbenefits were reduced by the tax benefits associated with NOL and tax credit carryforwards. The amounts of tax benefits associated with NOL and tax credit carryforwards are as follows:carryforwards:
| | | | | | | | | | | | | | |
| (Millions of Dollars) | | Dec. 31, 2021 | | Dec. 31, 2020 |
| NOL and tax credit carryforwards | | $ | (36) | | | $ | (31) | |
|
| | | | | | | | |
| (Millions of Dollars) | | Dec. 31, 2017 | | Dec. 31, 2016 |
| NOL and tax credit carryforwards | | $ | (31 | ) | | $ | (44 | ) |
It is reasonably possible that Xcel Energy’s amount of unrecognized tax benefits could significantly change in the next 12 months as the IRS Appeals progresses and audits resume, the Minnesota and Wisconsin audits progress, and other state audits resume. As the IRS Appeals, Minnesotaprogresses its review of the tax loss carryback claims and Wisconsinas state audits progress, it is reasonably possible that the amount of unrecognized tax benefit could decrease up to approximately $15 million.$28 million in the next 12 months.
The payablePayable for interest related to unrecognized tax benefits is partially offset by the interest benefit associated with NOL and tax credit carryforwards. A reconciliation of the beginning and ending amount of the
Interest payable for interest related to unrecognized tax benefits reported are as follows:benefits:
| | | | | | | | | | | | | | | | | | | | |
| (Millions of Dollars) | | 2021 | | 2020 | | 2019 |
| Payable for interest related to unrecognized tax benefits at Jan. 1 | | $ | (3) | | | $ | — | | | $ | — | |
| Interest expense related to unrecognized tax benefits | | — | | | (3) | | | — | |
| Payable for interest related to unrecognized tax benefits at Dec. 31 | | $ | (3) | | | $ | (3) | | | $ | — | |
|
| | | | | | | | |
| (Millions of Dollars) | | 2017 | | 2016 |
| Payable for interest related to unrecognized tax benefits at Jan. 1 | | $ | (3 | ) | | $ | — |
|
| Interest income (expense) income related to unrecognized tax benefits | | 3 |
| | (3 | ) |
| Payable for interest related to unrecognized tax benefits at Dec. 31 | | $ | — |
| | $ | (3 | ) |
The payable for interest related to unrecognized tax benefits was immaterial for 2015.
No amountsNaN penalties were accrued for penalties related to unrecognized tax benefits as of Dec. 31, 2017, 20162021, 2020 or 2015.2019.
Other Income Tax Matters — NOL amounts represent the amount of the tax loss that is carried forward and tax credits represent the deferred tax asset. NOL and tax credit carryforwards as of Dec. 31:
| | | | | | | | | | | | | | |
| (Millions of Dollars) | | 2021 | | 2020 |
| Federal NOL carryforward | | $ | 765 | | | $ | — | |
| Federal tax credit carryforwards | | 1,172 | | | 791 | |
| State NOL carryforwards | | 1,648 | | | 839 | |
| Valuation allowances for state NOL carryforwards | | (3) | | | (4) | |
State tax credit carryforwards, net of federal detriment (a) | | 89 | | | 89 | |
Valuation allowances for state credit carryforwards, net of federal benefit (b) | | (64) | | | (64) | |
(a)State tax credit carryforwards are net of federal detriment of $24 million as of Dec. 31, 2021 and 2020.
(b)Valuation allowances for state tax credit carryforwards were net of federal benefit of $17 million as follows:of Dec. 31, 2021 and 2020.
|
| | | | | | | | |
| (Millions of Dollars) | | 2017 | | 2016 |
| Federal NOL carryforward | | $ | 1,072 |
| | $ | 1,916 |
|
| Federal tax credit carryforwards | | 517 |
| | 424 |
|
| Valuation allowances for federal credit carryforwards | | (5 | ) | | — |
|
| State NOL carryforwards | | 1,592 |
| | 1,949 |
|
| Valuation allowances for state NOL carryforwards | | (55 | ) | | (59 | ) |
State tax credit carryforwards, net of federal detriment (a) | | 90 |
| | 74 |
|
Valuation allowances for state credit carryforwards, net of federal benefit (b) | | (68 | ) | | (54 | ) |
| |
(a)
| State tax credit carryforwards are net of federal detriment of $24 million and $40 million as of Dec. 31, 2017 and 2016, respectively. |
| |
(b)
| Valuation allowances for state tax credit carryforwards were net of federal benefit of $18 million and $29 million as of Dec. 31, 2017 and 2016, respectively. |
The federalFederal carryforward periods expire between 20212031 and 2037. The2041 and state carryforward periods expire between 2018 and 2037.
starting 2022.
Total income tax expense from operations differs from the amount computed by applying the statutory federal income tax rate to income before income tax expense. The following reconciles such
Effective income tax rate for years ended Dec. 31:
| | | | | | | | | | | | | | | | | | | | |
| | 2021 | | 2020 | | 2019 |
| Federal statutory rate | | 21.0 | % | | 21.0 | % | | 21.0 | % |
| State income tax on pretax income, net of federal tax effect | | 5.0 | | | 4.9 | | | 4.9 | |
| (Decreases) increases in tax from: | | | | | | |
| Wind PTCs | | (23.4) | | | (15.7) | | | (9.4) | |
Plant regulatory differences (a) | | (6.2) | | | (7.6) | | | (5.8) | |
| Other tax credits, net NOL & tax credit allowances | | (1.1) | | | (1.2) | | | (1.7) | |
| NOL Carryback | | — | | | (0.9) | | | — | |
| Change in unrecognized tax benefits | | 0.4 | | | 0.5 | | | 0.5 | |
| Other, net | | (0.3) | | | (1.4) | | | (1.0) | |
| Effective income tax rate | | (4.6) | % | | (0.4) | % | | 8.5 | % |
(a)Regulatory differences for income tax primarily relate to the years ending Dec. 31:credit of excess deferred taxes to customers through the average rate assumption method. Income tax benefits associated with the credit of excess deferred credits are offset by corresponding revenue reductions and additional prepaid pension asset amortization.
|
| | | | | | | | |
| | 2017 | | 2016 (b) | | 2015 (b) |
| Federal statutory rate | 35.0 | % | | 35.0 | % | | 35.0 | % |
| State income tax on pretax income, net of federal tax effect | 3.9 | % | | 3.9 | % | | 3.9 | % |
| Increases (decreases) in tax from: | | | | | |
| Wind production tax credits recognized | (4.7 | ) | | (3.4 | ) | | (1.8 | ) |
| Other tax credits recognized, net of federal income tax expense | (1.0 | ) | | (0.8 | ) | | (0.9 | ) |
| Tax reform | 1.4 |
| | — |
| | — |
|
Regulatory differences - effects of rate changes (a) | (0.1 | ) | | (0.1 | ) | | (0.1 | ) |
| Regulatory differences - other utility plant items | (0.7 | ) | | (0.5 | ) | | (0.9 | ) |
| Change in unrecognized tax benefits | (0.6 | ) | | 0.2 |
| | 0.6 |
|
| NOL carryback | — |
| | — |
| | (0.3 | ) |
| Other, net | (1.1 | ) | | (0.2 | ) | | — |
|
| Effective income tax rate | 32.1 | % | | 34.1 | % | | 35.5 | % |
| |
(a)
| The amortizationComponents of excess deferred taxes. |
| |
(b)
| The prior periods included in this footnote have been reclassified to conform to current year presentation. |
The components of Xcel Energy’s income tax expense for the years endingended Dec. 31 were:31:
| | | | | | | | | | | | | | | | | | | | |
| (Millions of Dollars) | | 2021 | | 2020 | | 2019 |
| Current federal tax expense (benefit) | | $ | 15 | | | $ | (13) | | | $ | (16) | |
| Current state tax (benefit) expense | | (2) | | | 2 | | | 4 | |
| Current change in unrecognized tax expense | | 1 | | | 18 | | | 2 | |
| Deferred federal tax (benefit) expense | | (183) | | | (89) | | | 55 | |
| Deferred state tax expense | | 99 | | | 91 | | | 83 | |
| Deferred change in unrecognized tax expense (benefit) | | 5 | | | (10) | | | 5 | |
| Deferred ITCs | | (5) | | | (5) | | | (5) | |
| Total income tax (benefit) expense | | $ | (70) | | | $ | (6) | | | $ | 128 | |
|
| | | | | | | | | | | | |
| (Millions of Dollars) | | 2017 | | 2016 | | 2015 |
| Current federal tax expense (benefit) | | $ | 1 |
| | $ | (3 | ) | | $ | (36 | ) |
| Current state tax (benefit) expense | | (11 | ) | | (4 | ) | | 2 |
|
| Current change in unrecognized tax (benefit) expense | | (83 | ) | | 6 |
| | 46 |
|
| Deferred federal tax expense | | 460 |
| | 477 |
| | 480 |
|
| Deferred state tax expense | | 107 |
| | 112 |
| | 92 |
|
| Deferred change in unrecognized tax expense (benefit) | | 73 |
| | (2 | ) | | (36 | ) |
Deferred investment tax credits
| | (5 | ) | | (5 | ) | | (5 | ) |
| Total income tax expense | | $ | 542 |
| | $ | 581 |
| | $ | 543 |
|
The componentsComponents of deferred income tax expense for the years endingas of Dec. 31 were:31:
| | | | | | | | | | | | | | | | | | | | |
| (Millions of Dollars) | | 2021 | | 2020 | | 2019 |
| Deferred tax expense excluding items below | | $ | 148 | | | $ | 237 | | | $ | 344 | |
| Amortization and adjustments to deferred income taxes on income tax regulatory assets and liabilities | | (221) | | | (247) | | | (206) | |
| Tax (benefit) expense allocated to other comprehensive income, adoption of ASC Topic 326, and other | | (6) | | | 2 | | | 5 | |
| Deferred tax (benefit) expense | | $ | (79) | | | $ | (8) | | | $ | 143 | |
|
| | | | | | | | | | | | |
| (Millions of Dollars) | | 2017 | | 2016 | | 2015 |
| Deferred tax (benefit) expense excluding items below | | $ | (2,939 | ) | | $ | 631 |
| | $ | 547 |
|
| Amortization and adjustments to deferred income taxes on income tax regulatory assets and liabilities | | 3,583 |
| | (45 | ) | | (12 | ) |
| Tax (expense) benefit allocated to other comprehensive income, net of adoption of ASU No. 2018-02, and other | | (4 | ) | | 1 |
| | 1 |
|
| Deferred tax expense | | $ | 640 |
| | $ | 587 |
| | $ | 536 |
|
The componentsComponents of Xcel Energy’s net deferred tax liability atas of Dec. 31 were as follows:31:
| | | | | | | | | | | | | | |
| (Millions of Dollars) | | 2021 | | 2020 (a) |
| Deferred tax liabilities: | | | | |
| Differences between book and tax bases of property | | $ | 6,231 | | | $ | 5,810 | |
| Operating lease assets | | 351 | | | 400 | |
| Regulatory assets | | 598 | | | 603 | |
| Deferred fuel costs | | 262 | | | (6) | |
| Pension expense | | 175 | | | 176 | |
| Other | | 93 | | | 74 | |
| Total deferred tax liabilities | | $ | 7,710 | | | $ | 7,057 | |
| | | | |
| Deferred tax assets: | | | | |
| Regulatory liabilities | | $ | 780 | | | $ | 806 | |
| Operating lease liabilities | | 351 | | | 400 | |
| Tax credit carryforward | | 1,261 | | | 880 | |
| NOL carryforward | | 247 | | | 37 | |
| NOL and tax credit valuation allowances | | (64) | | | (64) | |
| Other employee benefits | | 119 | | | 141 | |
| Deferred ITCs | | 15 | | | 13 | |
| Other | | 107 | | | 98 | |
| Total deferred tax assets | | $ | 2,816 | | | $ | 2,311 | |
| Net deferred tax liability | | $ | 4,894 | | | $ | 4,746 | |
(a) Prior periods have been reclassified to conform to current year presentation.
|
| | | | | | | | |
| (Millions of Dollars) | | 2017 | | 2016 (a) |
| Deferred tax liabilities: | | |
| | |
|
| Differences between book and tax bases of property | | $ | 4,989 |
| | $ | 7,697 |
|
| Regulatory assets | | 565 |
| | 152 |
|
| Pension expense | | 199 |
| | 298 |
|
| Other | | 69 |
| | 89 |
|
| Total deferred tax liabilities | | $ | 5,822 |
| | $ | 8,236 |
|
| | | | | |
| Deferred tax assets: | | |
| | |
|
| Regulatory liabilities | | $ | 886 |
| | $ | (132 | ) |
| Tax credit carryforward | | 607 |
| | 498 |
|
| NOL carryforward | | 293 |
| | 754 |
|
| NOL and tax credit valuation allowances | | (77 | ) | | (57 | ) |
| Other employee benefits | | 132 |
| | 205 |
|
| Deferred investment tax credits | | 17 |
| | 27 |
|
| Deferred fuel costs | | 12 |
| | 11 |
|
| Rate refund | | 10 |
| | 33 |
|
| Other | | 97 |
| | 113 |
|
| Total deferred tax assets | | $ | 1,977 |
| | $ | 1,452 |
|
| Net deferred tax liability | | $ | 3,845 |
| | $ | 6,784 |
|
| |
(a)
| The prior period included in this footnote has been reclassified to conform to current year presentation. |
Basic EPS was computed by dividing the earnings available to Xcel Energy Inc.’s common shareholders by the weighted average number of common shares outstanding during the period. Diluted EPS was computed by dividing the earnings available to Xcel Energy Inc.’s common shareholders by the diluted weighted average number of common shares outstanding during the period. Diluted EPS reflects the potential dilution that could occur if securities or other agreements to issue common stock (i.e., common stock equivalents) were settled. The weighted average number of potentially dilutive shares outstanding used to calculate Xcel Energy Inc.’s diluted EPS is calculated using the treasury stock method.
Common Stock Equivalents— Xcel Energy Inc. currently has common stock equivalents related to certain equity awards in share-based compensation arrangements. Common stock equivalents causing a dilutive impact to EPS include commitments to issue common stock related to time based equity compensation awards. Effective August 2015, 401(k) matching contributions are settled in cash for all Xcel Energy employee groups.
Stock equivalent units granted to Xcel Energy Inc.’s Board of Directors are included in common shares outstanding upon grant date as there is no further service, performance or market condition associated with these awards. Restricted stock, granted to settle amounts due to certain employees under the Xcel Energy Inc. Executive Annual Incentive Award Plan, is included in common shares outstanding when granted.
Share-based compensation arrangements for which there is currently no dilutive impact to EPS include the following:
Equity awards subject to a performance condition; included in common shares outstanding when all necessary conditions for settlement have been satisfied by the end of the reporting period.
Liability awards subject to a performance condition; any portions settled in shares are included in common shares outstanding upon settlement.
The dilutive impact of common stock equivalents affecting EPS was as follows:
|
| | | | | | | | | | | | | | | | | | | | | | | | | | | | | | | | | |
| | | 2017 | | 2016 | | 2015 |
| (Amounts in millions, except per share data) | | Income | | Shares | | Per Share Amount | | Income | | Shares | | Per Share Amount | | Income | | Shares | | Per Share Amount |
| Net income | | $ | 1,148 |
| | | | | | $ | 1,123 |
| | | | | | $ | 984 |
| | | | |
| Basic EPS: | | | | | | | | | | | | | | | | | | |
| Earnings available to common shareholders | | 1,148 |
| | 508.5 |
| | $ | 2.26 |
| | 1,123 |
| | 508.8 |
| | $ | 2.21 |
| | 984 |
| | 507.8 |
| | $ | 1.94 |
|
| Effect of dilutive securities: | | | | | | | | | | | | | | | | | | |
| Equity awards | | — |
| | 0.6 |
| | | | — |
| | 0.7 |
| | | | — |
| | 0.4 |
| | |
| Diluted EPS: | | | | | | | | | | | | | | | | | | |
| Earnings available to common shareholders | | $ | 1,148 |
| | 509.1 |
| | $ | 2.25 |
| | $ | 1,123 |
| | 509.5 |
| | $ | 2.21 |
| | $ | 984 |
| | 508.2 |
| | $ | 1.94 |
|
Dividend Reinvestment and Stock Purchase Plan and Stock Compensation Settlements — In 2015, the Xcel Energy Inc. Board of Directors authorized open market purchases by the plan administrator as the source of shares for the dividend reinvestment program as well as market purchases of up to 3.0 million shares for stock compensation plan settlements. In 2017, Xcel Energy Inc. repurchased approximately 0.1 million shares of common stock in the open market at a total cost of approximately $3 million.
| |
| 8. | Share-Based Compensation |
Incentive Plan Including Share-Based Compensation — Xcel Energy has an incentive plan which includes share-based payment elements, the Amended and Restated 2015 Omnibus Incentive Plan with 7.0 million equity shares authorized.
Restricted Stock — CertainThe Amended and Restated 2015 Omnibus Incentive Plan allows certain employees mayto elect to receive shares of common or restricted stock under the Xcel Energy Inc. Executive Annual Incentive Award Plan and the 2015 Omnibus Incentive Plan (effective May 20, 2015).stock. Restricted stock is treated as an equity award and vests and settles in equal annual installments over a three-yearthree-year period. Xcel Energy Inc. reinvests dividends on the restricted stock while restrictions are in place. Restrictions also apply to the additional shares of restricted stock acquired through dividend reinvestment. If the restricted shares are forfeited, the employee is not entitled to the dividends on those shares. Restricted stock has a fair value equal to the market trading price of Xcel Energy Inc.’s stock at the grant date.
Xcel Energy Inc. granted sharesShares of restricted stock for the years endedgranted at Dec. 31 as follows:31:
| | | | | | | | | | | | | | | | | | | | |
| (Shares in Thousands) | | 2021 | | 2020 | | 2019 |
| Granted shares | | 2 | | | 1 | | | 13 | |
| Grant date fair value | | $ | 61.54 | | | $ | 70.26 | | | $ | 53.46 | |
|
| | | | | | | | | | | | |
| (Shares in Thousands) | | 2017 | | 2016 | | 2015 |
| Granted shares | | 15 |
| | 20 |
| | 42 |
|
| Grant date fair value | | $ | 42.00 |
| | $ | 38.82 |
| | $ | 35.00 |
|
A summary of the changes ofChanges in nonvested restricted stock for the year ended 2017 were as follows:stock:
| | | | | | | | | | | | | | |
| (Shares in Thousands) | | Shares | | Weighted Average
Grant Date Fair Value |
| Nonvested restricted stock at Jan. 1, 2021 | | 15 | | | $ | 56.68 | |
| Granted | | 2 | | | 61.54 | |
| Forfeited | | — | | | 70.26 | |
| Vested | | (9) | | | 49.71 | |
| Dividend equivalents | | — | | | 66.73 | |
| Nonvested restricted stock at Dec. 31, 2021 | | 8 | | | 67.26 | |
|
| | | | | | | |
| (Shares in Thousands) | | Shares | | Weighted Average
Grant Date Fair Value |
| Nonvested restricted stock at Jan. 1, 2017 | | 67 |
| | $ | 35.43 |
|
| Granted | | 15 |
| | 42.00 |
|
| Forfeited | | — |
| | — |
|
| Vested | | (40 | ) | | 33.36 |
|
| Dividend equivalents | | 2 |
| | 44.69 |
|
| Nonvested restricted stock at Dec. 31, 2017 | | 44 |
| | 39.71 |
|
Other Equity Awards — Xcel Energy Inc.’sEnergy‘s Board of Directors has granted equity awards under the Xcel Energy Inc. 2005 Long-Term Incentive Plan (as amendedAmended and restated in 2010) and theRestated 2015 Omnibus Incentive Plan, (effective May 20, 2015). These plans allow the attachment ofwhich includes various vesting conditions and performance goals to the awards granted. The vesting conditions and performance goals may vary by plan year.goals. At the end of the restricted period, such grants will be awarded if the vesting conditions and/or performance goals are met.
Commencing in 2014, certainCertain employees wereare granted equity awards with onea portion of shares subject only to service conditions, and the other portion subject to performance conditions. InclusiveA total of other grants of time-based awards, a total of0.2 million, 0.2 million, and 0.3 million time-based equity shares subject only to service conditions were granted annually in 2017, 2016,2021, 2020 and 2015,2019, respectively. Other than shares associated with these time-based awards and restricted stock, payout of all other employee equity awards and the lapsing of restrictions on the transfer of units are based on the achievement of performance criteria.
The performance conditions for a portion of the awards granted from 20152019 to 20172021 are based on relative TSR measured identically to TSR liability awards granted in those years, and measurement of performance for a portion of units awarded from 2011 to 2013 is based on EPS growth with an additional condition that Xcel Energy Inc.’s annual dividend paid on its common stock remains at a specified amount per share or greater. The performance conditions for the remaining employee equity awards are based on environmental goals. Equity awards with performance conditions awarded from 2011 to 2017, plus associated dividend equivalents, will be settled or forfeited and the restricted period will lapse after three years, with potential payouts ranging from zero to 150 percent for 2011 to 2013 grants, and zero to 200 percent for 2014 to 2017 grants,200% depending on the level of achievement.
The 2012 awards measured on EPS growth and the 2012 environmental awards met their targets as of Dec. 31, 2014, and were settled in shares in February 2015.
The 2013 awards measured on EPS growth, the 2013 environmental awards and the 2013 time-based awards met their targets as of Dec. 31, 2015, and were settled in shares in February 2016.
The 2014 environmental awards and the 2014 time-based awards met their targets as of Dec. 31, 2016, and were settled in shares in February 2017.
The 2015 environmental awards and the 2015 time-based awards met their targets as of Dec. 31, 2017, and will be settled in shares in February 2018.
Equity award units granted to employees excluding(excluding restricted stock, for the years ended Dec. 31 were as follows:stock):
| | | | | | | | | | | | | | | | | | | | |
| (Units in Thousands) | | 2021 | | 2020 | | 2019 |
| Granted units | | 421 | | | 411 | | | 483 | |
| Weighted average grant date fair value | | $ | 66.03 | | | $ | 62.92 | | | $ | 49.67 | |
|
| | | | | | | | | | | | |
| (Units in Thousands) | | 2017 | | 2016 | | 2015 |
| Granted units | | 503 |
| | 522 |
| | 496 |
|
| Weighted average grant date fair value | | $ | 41.02 |
| | $ | 36.00 |
| | $ | 36.09 |
|
| | | | | | | | | | | | | | | | | | | | |
| (Units in Thousands, Fair Value in Millions) | | 2021 | | 2020 | | 2019 |
| Vested Units | | 392 | | | 442 | | | 464 | |
| Total Fair Value | | $ | 27 | | | $ | 29 | | | $ | 29 | |
Approximately 0.5 million of these units vested during 2017 at a total fair value of $22 million. Approximately 0.5 million of these units vested during 2016 at a total fair value of $22 million. Approximately 0.8 million of these units vested during 2015 at a total fair value of $27 million.
A summary of the changesChanges in the nonvested portion of these equity award units for the year ended 2017, were as follows:units:
| | | | | | | | | | | | | | |
| (Units in Thousands) | | Units | | Weighted Average
Grant Date Fair Value |
| Nonvested Units at Jan. 1, 2021 | | 780 | | | $ | 55.68 | |
| Granted | | 421 | | | 66.03 | |
| Forfeited | | (146) | | | 61.76 | |
| Vested | | (392) | | | 48.91 | |
| Dividend equivalents | | 32 | | | 58.00 | |
| Nonvested Units at Dec. 31, 2021 | | 695 | | | 64.59 | |
|
| | | | | | | |
| (Units in Thousands) | | Units | | Weighted Average
Grant Date Fair Value |
| Nonvested Units at Jan. 1, 2017 | | 984 |
| | $ | 36.05 |
|
| Granted | | 503 |
| | 41.02 |
|
| Forfeited | | (70 | ) | | 37.12 |
|
| Vested | | (467 | ) | | 36.17 |
|
| Dividend equivalents | | 45 |
| | 37.20 |
|
| Nonvested Units at Dec. 31, 2017 | | 995 |
| | 38.48 |
|
The total fair value of these nonvested equity awards as of Dec. 31, 2017 was $48 million and the weighted average remaining contractual life was 1.7 years.
Stock Equivalent Units — Non-employee members of the Xcel Energy Inc.Energy‘s Board of Directors may elect to receive their annual awards ofequity grant as stock equivalent units with each unit having ain lieu of common stock. Each unit’s value is equal to one1 share of Xcel Energy Inc. common stock. The annual grants areequity grant is vested as of the date of each member’s election to the Board of Directors; there is no further service or other condition attached to the annual grants. Additionally, directorscondition. Directors may also elect to receive their cash fees inas stock equivalent units in lieu of cash. Dividends on Xcel Energy Inc.’s common stock are converted to stock equivalent units and granted based on the number of stock equivalent units held by each participant as of the dividend date. The stockStock equivalent units are payable as a distribution of Xcel Energy Inc.’s common stock upon a director’s termination of service.
Stock equivalent units granted:
The | | | | | | | | | | | | | | | | | | | | |
| (Units in Thousands) | | 2021 | | 2020 | | 2019 |
| Granted units | | 31 | | | 33 | | | 29 | |
| Weighted average grant date fair value | | $ | 68.15 | | | $ | 61.61 | | | $ | 58.44 | |
Changes in stock equivalent units granted for the years ended Dec. 31 were as follows:units:
| | | | | | | | | | | | | | |
| (Units in Thousands) | | Units | | Weighted Average
Grant Date Fair Value |
| Stock equivalent units at Jan. 1, 2021 | | 630 | | | $ | 36.28 | |
| Granted | | 31 | | | 68.15 | |
| Units distributed | | (73) | | | 31.47 | |
| Dividend equivalents | | 16 | | | 66.98 | |
| Stock equivalent units at Dec. 31, 2021 | | 604 | | | 39.27 | |
|
| | | | | | | | | | | | |
| (Units in Thousands) | | 2017 | | 2016 | | 2015 |
| Granted units | | 51 |
| | 49 |
| | 60 |
|
| Grant date fair value | | $ | 46.05 |
| | $ | 40.68 |
| | $ | 34.58 |
|
A summary of the stock equivalent unit changes for the year ended 2017 are as follows:
|
| | | | | | | |
| (Units in Thousands) | | Units | | Weighted Average
Grant Date Fair Value |
| Stock equivalent units at Jan. 1, 2017 | | 750 |
| | $ | 27.39 |
|
| Granted | | 51 |
| | 46.05 |
|
| Units distributed | | (71 | ) | | 20.52 |
|
| Dividend equivalents | | 23 |
| | 45.24 |
|
| Stock equivalent units at Dec. 31, 2017 | | 753 |
| | 29.83 |
|
TSR Liability Awards — Xcel Energy Inc.’s Board of Directors has granted TSR liability awards under the Xcel Energy Inc. 2005 Long-Term Incentive Plan (as amendedAmended and restated effective in 2010) andRestated 2015 Omnibus Incentive Plan. The plans allowThis plan allows Xcel Energy to attach various performance goals to the awards granted. The liability awards granted have been historically dependent on a single measure of performance, Xcel Energy Inc.’s relative TSR measured over a three-yearthree-year period. For 2017, 2016 and 2015 awards, Xcel Energy Inc.’s TSR is compared to the TSRa peer group of other companies in a 22-member utilities peer group. At the end of the three-year period, potentialutility companies. Potential payouts of the awards range from zero to 200 percent, depending on Xcel Energy Inc.’s TSR compared to the applicable peer group or index.200%.
The TSR liability awards granted for the years ended Dec. 31 were as follows:granted:
| | | | | | | | | | | | | | | | | | | | |
| (In Thousands) | | 2021 | | 2020 | | 2019 |
| Awards granted | | 221 | | | 212 | | | 225 | |
|
| | | | | | | | | |
| (In Thousands) | | 2017 | | 2016 | | 2015 |
| Awards granted | | 240 |
| | 264 |
| | 224 |
|
The total amounts of TSR liability awards settled during the years ended Dec. 31 were as follows:settled:
| | | | | | | | | | | | | | | | | | | | |
| (Units In Thousands, Settlement Amount in Millions) | | 2021 | | 2020 | | 2019 |
| Awards settled | | 446 | | | 476 | | | 466 | |
| Settlement amount (cash, common stock and deferred amounts) | | $ | 27 | | | $ | 33 | | | $ | 25 | |
|
| | | | | | | | | | | | |
| (In Thousands) | | 2017 | | 2016 | | 2015 |
| Awards settled | | 454 |
| | 354 |
| | — |
|
| Settlement amount (cash, common stock and deferred amounts) | | $ | 19,083 |
| | $ | 13,724 |
| | $ | — |
|
The amount of cash used to settle Xcel Energy’s TSR liability awards was $7of $22 million were settled in 2017.cash in 2021.
Share-Based Compensation Expense — Other than for restricted stock, the vesting of employee equity awards is generallytypically predicated on the achievement of a performance condition, which is the achievement of a TSR EPS or environmental measures target. Additionally, approximately 0.2 million, 0.2 million, and 0.3 million of equity award units were granted annually in 2017, 2016,2021, 2020, and 2015,2019, respectively, with vesting subject only to service conditions for periods of three years.
Generally, all of these instruments are considered to be equity awards sinceas the planaward settlement determination (shares or cash) resides withis made by Xcel Energy, and not the participants. In addition, these awards have not been previously settled in cash and Xcel Energy plans to continue electing share settlement. The grant
Grant date fair value of equity awards is expensed over the service period as employees vest in their rights to those awards.
Theperiod. TSR liability awards have been historically settled partially in cash, and do not qualify as equity awards, but rather are accounted for as liabilities. As liability awards, the fair value on which ratable expense is based, as employees vest in their rights to those awards, is remeasured each period based on the current stock price and performance achievement, and final expense is based on the market value of the shares on the date the award is settled.
The compensationCompensation costs related to share-based awardsawards:
| | | | | | | | | | | | | | | | | | | | |
| (Millions of Dollars) | | 2021 | | 2020 | | 2019 |
Compensation cost for share-based awards (a) | | $ | 31 | | | $ | 73 | | | $ | 58 | |
| Tax benefit recognized in income | | 8 | | | 19 | | | 15 | |
(a)Compensation costs for the years ended Dec. 31 were as follows:share-based payments are included in O&M expense.
|
| | | | | | | | | | | | |
| (Millions of Dollars) | | 2017 | | 2016 | | 2015 |
Compensation cost for share-based awards (a) | | $ | 57 |
| | $ | 41 |
| | $ | 45 |
|
| Tax benefit recognized in income | | 22 |
| | 16 |
| | 18 |
|
| |
(a)
| Compensation costs for share-based payment arrangements are included in O&M expense in the consolidated statements of income. |
The maximum aggregate number of shares of common stock available for issuance under the Xcel Energy Inc. 2015 Omnibus Incentive Plan (effective May 20, 2015) is 7.0 million shares. The maximum aggregate number of shares of common stock available for issuance under the Xcel Energy Inc. 2005 Long-Term Incentive Plan (as amended and restated effective Feb. 17, 2010) is 8.3 million shares. Under the Xcel Energy Inc. Executive Annual Incentive Award Plan (as amended and restated effective Feb. 17, 2010), the total number of shares approved for issuance is 1.2 million shares.
As of Dec. 31, 2017 and 2016, thereThere was approximately $44$28 million in 2021 and $29$51 million respectively,in 2020 of total unrecognized compensation cost related to nonvested share-based compensation awards. Xcel Energy expects to recognize the amount unrecognized at Dec. 31, 2017amount over a weighted average period of 1.71.6 years.
9. Benefit Plans and Other Postretirement Benefits
Xcel Energy offers various benefit plans to its employees. Approximately 46 percent of employees that receive benefits are represented by several local labor unions under several collective-bargaining agreements. As of Dec. 31, 2017:
NSP-Minnesota had 1,858 and NSP-Wisconsin had 383bargaining employees covered under a collective-bargaining agreement, which expires in December 2019. NSP-Minnesota also had an additional 248 nuclear operation bargaining employees covered under several collective-bargaining agreements. These agreements expire in 2018 and 2019.
PSCo had 1,835 bargaining employees covered under a collective-bargaining agreement, which expired in May 2017. While collective bargaining is ongoing, the terms and conditions of the agreement are automatically extended.
SPS had 791 bargaining employees covered under a collective-bargaining agreement, which expires in October 2019.
The plans invest in various instruments which are disclosed under the accounting guidance for fair value measurements which establishes a hierarchical framework for disclosing the observability of the inputs utilized in measuring fair value. The three levels in the hierarchy and examples of each level are as follows:
Level 1 — Quoted prices are available in active markets for identical assets as of the reporting date. The types of assets included in Level 1 are highly liquid and actively traded instruments with quoted prices.
Level 2 — Pricing inputs are other than quoted prices in active markets, but are either directly or indirectly observable as of the reporting date. The types of assets included in Level 2 are typically either comparable to actively traded securities or contracts, or priced with models using highly observable inputs.
Level 3 — Significant inputs to pricing have little or no observability as of the reporting date. The types of assets included in Level 3 are those with inputs requiring significant management judgment or estimation.
Specific valuation methods include the following:
Cash equivalents —The fair values of cash equivalents are generally based on cost plus accrued interest; money market funds are measured using quoted NAVs.
Insurance contracts — Insurance contract fair values take into consideration the value of the investments in separate accounts of the insurer, which are priced based on observable inputs.
Investments in commingled funds, equity securities and other funds — Equity securities are valued using quoted prices in active markets. The fair values for commingled funds are measured using NAVs, which take into consideration the value of underlying fund investments, as well as the other accrued assets and liabilities of a fund, in order to determine a per share market value. The investments in commingled funds may be redeemed for NAV with proper notice. Proper notice varies by fund and can range from daily with a few days’ notice to annually with 90 days’ notice. Private equity investments require approval of the fund for any unscheduled redemption, and such redemptions may be approved or denied by the fund at its sole discretion. Depending on the fund, unscheduled distributions from real estate investments may require approval of the fund or may be redeemed with proper notice, which is typically quarterly with 45-90 days’ notice; however, withdrawals from real estate investments may be delayed or discounted as a result of fund illiquidity.
Investments in debt securities — Fair values for debt securities are determined by a third party pricing service using recent trades and observable spreads from benchmark interest rates for similar securities.
Derivative Instruments —Fair values for foreign currency derivatives are determined using pricing models based on the prevailing forward exchange rate of the underlying currencies. The fair values of interest rate derivatives are based on broker quotes that utilize current market interest rate forecasts.
Pension Benefits
Xcel Energy has several noncontributory, defined benefit pension plans that cover almost all employees. Generally, benefits are based on a combination of years of service, the employee’s average pay and, in some cases, social security benefits. Xcel Energy’s policy is to fully fund into an external trust the actuarially determined pension costs recognized for ratemaking and financial reporting purposes, subject to the limitations of applicable employee benefit and tax laws.
In addition to the qualified pension plans, Xcel Energy maintains a supplemental executive retirement plan (SERP) and a nonqualified pension plan. The SERP is maintained for certain executives that were participants in the plan in 2008, when the SERP was closed to new participants. The nonqualified pension plan provides unfunded, nonqualified benefits for compensation that is in excess of the limits applicable to the qualified pension plans, with distributions funded by Xcel Energy’s consolidated operating cash flows. The total obligations of the SERP and nonqualified plan as of Dec. 31, 2017 and 2016 were $37 million and $44 million, respectively. In 2017 and 2016, Xcel Energy recognized net benefit cost for financial reporting for the SERP and nonqualified plans of $5 million and $8 million, respectively.
In 2016, Xcel Energy established rabbi trusts to provide partial funding for future distributions of the SERP and its deferred compensation plan, supplemented by Xcel Energy’s consolidated operating cash flows as determined necessary. For more information regarding the funding of rabbi trusts, see Note 11 to the consolidated financial statements. Also in 2016, Xcel Energy amended the deferred compensation plan to provide eligible participants the ability to diversify deferred settlements of equity awards, other than time-based equity awards, into various fund options.
Xcel Energy bases the investment-return assumption on expected long-term performance for each of the investment types included in its pension asset portfolio. Xcel Energy considers the historical returns achieved by its asset portfolio over the past 20-year or longer period, as well as the long-term return levels projected and recommended by investment experts. Xcel Energy continually reviews its pension assumptions. The pension cost determination assumes a forecasted mix of investment types over the long-term.
Investment returns in 2017 were above the assumed level of 6.87 percent;
Investment returns in 2016 were below the assumed level of 6.87 percent;
Investment returns in 2015 were below the assumed level of 7.09 percent; and
In 2018, Xcel Energy’s expected investment-return assumption is 6.87 percent.
The assets are invested in a portfolio according to Xcel Energy’s return, liquidity and diversification objectives to provide funding for plan obligations and minimize contributions to the plan, within appropriate levels of risk. The principal mechanism for achieving these objectives is the projected asset allocation given the long-term risk, return, and liquidity characteristics of each particular asset class. There were no significant concentrations of risk in any particular industry, index, or entity. Market volatility can impact even well-diversified portfolios and significantly affect the return levels achieved by pension assets in any year.
The following table presents the target pension asset allocations for Xcel Energy at Dec. 31 for the upcoming year:
|
| | | | | | |
| | | 2017 | | 2016 |
| Domestic and international equity securities | | 36 | % | | 38 | % |
| Long-duration fixed income and interest rate swap securities | | 27 |
| | 27 |
|
| Short-to-intermediate fixed income securities | | 20 |
| | 16 |
|
| Alternative investments | | 15 |
| | 17 |
|
| Cash | | 2 |
| | 2 |
|
| Total | | 100 | % | | 100 | % |
Xcel Energy’s ongoing investment strategy is based on plan-specific investment recommendations that seek to minimize potential investment and interest rate risk as a plan’s funded status increases over time. The investment recommendations result in a greater percentage of long-duration fixed income securities being allocated to specific plans having relatively higher funded status ratios and a greater percentage of growth assets being allocated to plans having relatively lower funded status ratios. The aggregate projected asset allocation presented in the table above for the master pension trust results from the plan-specific strategies.
Pension Plan Assets
The following tables present, for each of the fair value hierarchy levels, Xcel Energy’s pension plan assets that are measured at fair value as of Dec. 31, 2017 and 2016:
|
| | | | | | | | | | | | | | | | | | | | |
| | | Dec. 31, 2017 |
| (Millions of Dollars) | | Level 1 | | Level 2 | | Level 3 | | Investments Measured at NAV | | Total |
| Cash equivalents | | $ | 196 |
| | $ | — |
| | $ | — |
| | $ | — |
| | $ | 196 |
|
| Commingled funds: | | | | | | | | | | |
| U.S. equity funds | | 513 |
| | — |
| | — |
| | — |
| | 513 |
|
| Non U.S. equity funds | | 92 |
| | — |
| | — |
| | 199 |
| | 291 |
|
| U.S. corporate bond funds | | 369 |
| | — |
| | — |
| | — |
| | 369 |
|
| Emerging market equity funds | | — |
| | — |
| | — |
| | 314 |
| | 314 |
|
| Emerging market debt funds | | 75 |
| | — |
| | — |
| | 166 |
| | 241 |
|
| Private equity investments | | — |
| | — |
| | — |
| | 84 |
| | 84 |
|
| Real estate | | — |
| | — |
| | — |
| | 195 |
| | 195 |
|
| Other commingled funds | | 5 |
| | — |
| | — |
| | 117 |
| | 122 |
|
| Debt securities: | | | | | | | | | | |
| Government securities | | — |
| | 356 |
| | — |
| | — |
| | 356 |
|
| U.S. corporate bonds | | — |
| | 272 |
| | — |
| | — |
| | 272 |
|
| Non U.S. corporate bonds | | — |
| | 45 |
| | — |
| | — |
| | 45 |
|
| Equity securities: | | | | | | | | | | |
| U.S. equities | | 114 |
| | — |
| | — |
| | — |
| | 114 |
|
| Other | | (29 | ) | | 4 |
| | — |
| | 1 |
| | (24 | ) |
| Total | | $ | 1,335 |
| | $ | 677 |
| | $ | — |
| | $ | 1,076 |
| | $ | 3,088 |
|
|
| | | | | | | | | | | | | | | | | | | | | |
| | | Dec. 31, 2016 |
| (Millions of Dollars) | | Level 1 | | Level 2 | | Level 3 | | Investments Measured at NAV | | Total |
| Cash equivalents | | $ | 113 |
| | $ | — |
| | $ | — |
| | $ | — |
| | $ | 113 |
|
| U.S. equity funds | | 491 |
| | — |
| | — |
| | — |
| | 491 |
|
| Non U.S. equity funds | | 167 |
| | — |
| | — |
| | 202 |
| | 369 |
|
| U.S. corporate bond funds | | 268 |
| | — |
| | — |
| | — |
| | 268 |
|
| Emerging market equity funds | | — |
| | — |
| | — |
| | 194 |
| | 194 |
|
| Emerging market debt funds | | 79 |
| | — |
| | — |
| | 85 |
| | 164 |
|
| Commodity funds | | — |
| | — |
| | — |
| | 21 |
| | 21 |
|
| Private equity investments | | — |
| | — |
| | — |
| | 101 |
| | 101 |
|
| Real estate | | — |
| | — |
| | — |
| | 184 |
| — |
| 184 |
|
| Other commingled funds | | — |
| | — |
| | — |
| | 210 |
| | 210 |
|
| Debt securities: | | | | | | | | | | |
| Government securities | | — |
| | 364 |
| | — |
| | — |
| | 364 |
|
| U.S. corporate bonds | | — |
| | 238 |
| | — |
| | — |
| | 238 |
|
| Non U.S. corporate bonds | | — |
| | 38 |
| | — |
| | — |
| | 38 |
|
| Mortgage-backed securities | | — |
| | 6 |
| | — |
| | — |
| | 6 |
|
| Asset-backed securities | | — |
| | 3 |
| | — |
| | — |
| | 3 |
|
| Equity securities: | | | | | | | | | | |
| U.S. equities | | 89 |
| | — |
| | — |
| | — |
| | 89 |
|
| Other | | — |
| | 3 |
| | — |
| | — |
| | 3 |
|
| Total | | $ | 1,207 |
| | $ | 652 |
| | $ | — |
| | $ | 997 |
| | $ | 2,856 |
|
There were no assets transferred in or out of Level 3 for the years ended Dec. 31, 2017, 2016 or 2015.
Benefit Obligations — A comparison of the actuarially computed pension benefit obligation and plan assets for Xcel Energy is presented in the following table:
|
| | | | | | | | |
| (Millions of Dollars) | | 2017 | | 2016 |
| Accumulated Benefit Obligation at Dec. 31 | | $ | 3,612 |
| | $ | 3,489 |
|
| Change in Projected Benefit Obligation: | |
|
| |
|
|
| Obligation at Jan. 1 | | $ | 3,682 |
| | $ | 3,568 |
|
| Service cost | | 94 |
| | 92 |
|
| Interest cost | | 147 |
| | 160 |
|
| Plan amendments | | (13 | ) | | 2 |
|
| Actuarial loss | | 259 |
| | 186 |
|
Benefit payments (a) | | (341 | ) | | (326 | ) |
| Obligation at Dec. 31 | | $ | 3,828 |
| | $ | 3,682 |
|
|
| | | | | | | | |
| (Millions of Dollars) | | 2017 | | 2016 |
| Change in Fair Value of Plan Assets: | | | | |
| Fair value of plan assets at Jan. 1 | | $ | 2,856 |
| | $ | 2,884 |
|
| Actual return on plan assets | | 411 |
| | 172 |
|
| Employer contributions | | 162 |
| | 125 |
|
Benefit payments (a) | | (341 | ) | | (325 | ) |
| Fair value of plan assets at Dec. 31 | | $ | 3,088 |
| | $ | 2,856 |
|
|
| | | | | | | | |
| (Millions of Dollars) | | 2017 | | 2016 |
| Funded Status of Plans at Dec. 31: | | | | |
Funded status (b) | | $ | (740 | ) | | $ | (826 | ) |
| |
(a)
| 2017 amount includes approximately $174 million of lump-sum benefit payments used in the determination of a settlement charge. |
| |
(b)
| Amounts are recognized in noncurrent liabilities on Xcel Energy’s consolidated balance sheets. |
|
| | | | | | | | |
| (Millions of Dollars) | | 2017 | | 2016 |
| Amounts Not Yet Recognized as Components of Net Periodic Benefit Cost: | | | | |
| Net loss | | $ | 1,709 |
| | $ | 1,836 |
|
| Prior service credit | | (25 | ) | | (5 | ) |
| Total | | $ | 1,684 |
| | $ | 1,831 |
|
|
| | | | | | | | |
| (Millions of Dollars) | | 2017 | | 2016 |
| Amounts Not Yet Recognized as Components of Net Periodic Benefit Cost Have Been Recorded as Follows Based Upon Expected Recovery in Rates: | | | | |
| Current regulatory assets | | $ | 100 |
| | $ | 101 |
|
| Noncurrent regulatory assets | | 1,511 |
| | 1,650 |
|
| Deferred income taxes | | 19 |
| | 31 |
|
| Net-of-tax accumulated OCI | | 54 |
| | 49 |
|
| Total | | $ | 1,684 |
| | $ | 1,831 |
|
|
| | | | |
Measurement date | | Dec. 31, 2017 | | Dec. 31, 20169. Earnings Per Share |
|
| | | | | | |
| | | 2017 | | 2016 |
| Significant Assumptions Used to Measure Benefit Obligations: | | | | |
| Discount rate for year-end valuation | | 3.63 | % | | 4.13 | % |
| Expected average long-term increase in compensation level | | 3.75 |
| | 3.75 |
|
| Mortality table | | RP-2014 |
| | RP-2014 |
|
Mortality — In 2014,Basic EPS was computed by dividing the Society of Actuaries published a new mortality table (RP-2014) that increased the overall life expectancy of males and females. In 2014, Xcel Energy adopted this mortality table, with modifications, based on its population and specific experience. During 2017, a new projection table was released (MP-2017). Xcel Energy evaluated the updated projection table and concluded that the methodology currently in use and adopted in 2016 is consistent with the recently updated 2017 table and continuesearnings available to be representative of Xcel Energy’s population.
Cash Flows — Cash funding requirements can be impacted by changes to actuarial assumptions, actual asset levels and other calculations prescribedcommon shareholders by the funding requirementsweighted average number of income tax andcommon shares outstanding. Diluted EPS was computed by dividing the earnings available to common shareholders by the diluted weighted average number of common shares outstanding.
Diluted EPS reflects the potential dilution that could occur if securities or other pension-related regulations. Required contributionsagreements to issue common stock (i.e., common stock equivalents) were made in 2015 through 2018settled. The weighted average number of potentially dilutive shares outstanding used to meet minimum funding requirements.calculate diluted EPS is calculated using the treasury stock method.
Total voluntary and required pension funding contributions across all four of Xcel Energy’s pension plans were as follows:
$150 million in January 2018;
$162 million in 2017;
$125 million in 2016; and
$90 million in 2015.
For future years, Xcel Energy anticipates contributions will be made as necessary.
Plan AmendmentsCommon Stock Equivalents —Xcel Energy amended the Xcel Energy Pension Plan and Xcel Energy Inc. Nonbargaining Pension Plan (South) in 2017 to reduce supplemental benefits for non-bargaining participants as well as to allow the transfer of a portion of non-qualified pension obligations into the qualified plans. In 2016, the Xcel Energy Pension Plan was amended to change the discount rate basis for lump-sum conversion to annuity participants and annuity conversion to lump-sum participants. Additionally in 2016, the annual credits contributed to the PSCo Bargaining Plan retirement spending account increased.
Benefit Costs — The components of Xcel Energy’s net periodic pension cost were:
|
| | | | | | | | | | | | |
| (Millions of Dollars) | | 2017 | | 2016 | | 2015 |
| Service cost | | $ | 94 |
| | $ | 92 |
| | $ | 99 |
|
| Interest cost | | 147 |
| | 160 |
| | 149 |
|
| Expected return on plan assets | | (209 | ) | | (210 | ) | | (214 | ) |
| Amortization of prior service credit | | (2 | ) | | (2 | ) | | (2 | ) |
| Amortization of net loss | | 107 |
| | 97 |
| | 125 |
|
Settlement charge (a) | | 81 |
| | — |
| | — |
|
| Net periodic pension cost | | 218 |
| | 137 |
|
| 157 |
|
| Costs not recognized due to effects of regulation | | (79 | ) | | (15 | ) | | (29 | ) |
| Net benefit cost recognized for financial reporting | | $ | 139 |
| | $ | 122 |
| | $ | 128 |
|
| |
(a)
| A settlement charge is required when the amount of all lump-sum distributions during the year is greater than the sum of the service and interest cost components of the annual net periodic pension cost. In the fourth quarter of 2017 as a result of lump-sum distributions during the 2017 plan year, Xcel Energy recorded a total pension settlement charge of $81 million, the majority of which was not recognized due to the effects of regulation. A total of $8 million of that amount was recorded in O&M expenses in the fourth quarter of 2017. |
|
| | | | | | | | | |
| | | 2017 | | 2016 | | 2015 |
| Significant Assumptions Used to Measure Costs: | | | | | | |
| Discount rate | | 4.13 | % | | 4.66 | % | | 4.11 | % |
| Expected average long-term increase in compensation level | | 3.75 |
| | 4.00 |
| | 3.75 |
|
| Expected average long-term rate of return on assets | | 6.87 |
| | 6.87 |
| | 7.09 |
|
Pension costs include an expected return impact for the current year that may differ from actual investment performance in the plan. The return assumption used for 2018 pension cost calculations is 6.87 percent.
Defined Contribution Plans
Xcel Energy maintains 401(k) and other defined contribution plans that cover substantially all employees. Total expense to these plans was approximately $37 million in 2017, $36 million in 2016 and $34 million in 2015.
Postretirement Health Care Benefits
Xcel Energy has a contributory health and welfare benefit plan that provides health care and death benefits to certain Xcel Energy retirees.
NSP-Minnesota and NSP-Wisconsin discontinued contributing toward health care benefits for non-bargaining employees retiring after 1998 and for bargaining employees who retired after 1999.
Xcel Energy discontinued contributing toward health care benefits for nonbargaining employees of the former NCE who retired after June 30, 2003 and for PSCo bargaining employees hired on or after July 1, 2003.
Xcel Energy discontinued contributing toward health care benefits for SPS bargaining employees hired on or after Jan. 1, 2012.
Plan Assets — Certain state agencies that regulate Xcel Energy Inc.’s utility subsidiaries also have issued guidelinescommon stock equivalents related to the funding of postretirement benefit costs. SPS is requiredforward equity agreements and certain equity awards in share-based compensation arrangements. Common stock equivalents include commitments to fund postretirement benefit costs for Texas and New Mexico jurisdictional amounts collected in rates. PSCo is requiredissue common stock related to fund postretirement benefit costs in irrevocable external trusts that are dedicated to the payment of these postretirement benefits. These assets are invested in a manner consistent with the investment strategy for the pension plan.time-based equity compensation awards.
The following table presents the target postretirement asset allocations for Xcel Energy at Dec. 31 for the upcoming year:
|
| | | | | | |
| | | 2017 | | 2016 |
| Domestic and international equity securities | | 24 | % | | 25 | % |
| Short-to-intermediate fixed income securities | | 60 |
| | 57 |
|
| Alternative investments | | 9 |
| | 13 |
|
| Cash | | 7 |
| | 5 |
|
| Total | | 100 | % | | 100 | % |
Xcel Energy bases its investment-return assumption for the postretirement health care fund assets on expected long-term performance for each of the investment types included in its asset portfolio. The assets are invested in a portfolio accordingStock equivalent units granted to Xcel Energy’s return, liquidity and diversification objectivesBoard of Directors are included in common shares outstanding upon grant date as there is no further service, performance or market condition associated with these. Restricted stock issued to provideemployees under the Executive Annual Incentive Award Plan is included in common shares outstanding when granted.
Share-based compensation arrangements for which there is currently no dilutive impact to EPS include the following:
•Equity awards subject to a source of fundingperformance condition; included in common shares outstanding when all necessary conditions for plan obligations and minimize contributions tosettlement have been satisfied by the plan, within appropriate levels of risk. The principal mechanism for achieving these objectives is the projected asset allocation given the long-term risk, return, correlation and liquidity characteristics of each particular asset class. There were no significant concentrations of risk in any particular industry, index, or entity. Market volatility can impact even well-diversified portfolios and significantly affect the return levels achieved by postretirement health care assets in any year.
The following tables present, for eachend of the fair value hierarchy levels, Xcel Energy’s postretirement benefit plan assets thatreporting period.
•Liability awards subject to a performance condition; any portions settled in shares are measured at fair value as of Dec. 31, 2017 and 2016:included in common shares outstanding upon settlement.
|
| | | | | | | | | | | | | | | | | | | | |
| | | Dec. 31, 2017 |
| (Millions of Dollars) | | Level 1 | | Level 2 | | Level 3 | | Investments Measured at NAV | | Total |
| Cash equivalents | | $ | 29 |
| | $ | — |
| | $ | — |
| | $ | — |
| | $ | 29 |
|
| Insurance contracts | | — |
| | 50 |
| | — |
| | — |
| | 50 |
|
| Commingled funds: | | | | | | | | | | |
| U.S. equity funds | | 74 |
| | — |
| | — |
| | — |
| | 74 |
|
| U.S fixed income funds | | 34 |
| | — |
| | — |
| | — |
| | 34 |
|
| Emerging market debt funds | | 40 |
| | — |
| | — |
| | — |
| | 40 |
|
| Debt securities: | | | | | | | | | | |
| Government securities | | — |
| | 57 |
| | — |
| | — |
| | 57 |
|
| U.S. corporate bonds | | — |
| | 63 |
| | — |
| | — |
| | 63 |
|
| Non U.S. corporate bonds | | — |
| | 21 |
| | — |
| | — |
| | 21 |
|
| Asset-backed securities | | — |
| | 23 |
| | — |
| | — |
| | 23 |
|
| Mortgage-backed securities | | — |
| | 34 |
| | — |
| | — |
| | 34 |
|
| Equity securities: | | | | | | | | | | |
| Non U.S. equities | | 35 |
| | — |
| | — |
| | — |
| | 35 |
|
| Other | | — |
| | 1 |
| | — |
| | — |
| | 1 |
|
| Total | | $ | 212 |
| | $ | 249 |
| | $ | — |
| | $ | — |
| | $ | 461 |
|
|
| | | | | | | | | | | | | | | | | | | | |
| | | Dec. 31, 2016 |
| (Millions of Dollars) | | Level 1 | | Level 2 | | Level 3 | | Investments Measured at NAV | | Total |
| Cash equivalents | | $ | 21 |
| | $ | — |
| | $ | — |
| | $ | — |
| | $ | 21 |
|
| Insurance contracts | | — |
| | 47 |
| | — |
| | — |
| | 47 |
|
| Commingled funds: | | | | | | | | | | |
| U.S. equity funds | | 54 |
| | — |
| | — |
| | — |
| | 54 |
|
| U.S fixed income funds | | 27 |
| | — |
| | — |
| | — |
| | 27 |
|
| Emerging market debt funds | | 30 |
| | — |
| | — |
| | — |
| | 30 |
|
| Other commingled funds | | — |
| | — |
| | — |
| | 55 |
| | 55 |
|
| Debt securities: | | | | | | | | | | |
| Government securities | | — |
| | 38 |
| | — |
| | — |
| | 38 |
|
| U.S. corporate bonds | | — |
| | 62 |
| | — |
| | — |
| | 62 |
|
| Non U.S. corporate bonds | | — |
| | 17 |
| | — |
| | — |
| | 17 |
|
| Asset-backed securities | | — |
| | 19 |
| | — |
| | — |
| | 19 |
|
| Mortgage-backed securities | | — |
| | 29 |
| | — |
| | — |
| | 29 |
|
| Equity securities: | | | | | | | | | | |
| Non U.S. equities | | 41 |
| | — |
| | — |
| | — |
| | 41 |
|
| Other | | — |
| | 2 |
| | — |
| | — |
| | 2 |
|
| Total | | $ | 173 |
| | $ | 214 |
| | $ | — |
| | $ | 55 |
| | $ | 442 |
|
There were no assets transferred in or out of Level 3 for the years ended Dec. 31, 2017, 2016 or 2015.
Benefit Obligations — A comparison of the actuarially computed benefit obligation and plan assets for Xcel Energy is presentedCommon shares outstanding used in the following table:basic and diluted EPS computation:
| | | | | | | | | | | | | | | | | | | | |
| (Shares in Millions) | | 2021 | | 2020 | | 2019 |
| Basic | | 539 | | 527 | | 519 |
Diluted (a) | | 540 | | | 528 | | | 520 | |
(a)Diluted common shares outstanding included common stock equivalents of 0.3 million, 1.1 million and 1.3 million shares for 2021, 2020 and 2019, respectively.
|
| | | | | | | | |
| (Millions of Dollars) | | 2017 | | 2016 |
| Change in Projected Benefit Obligation: | | | | |
| Obligation at Jan. 1 | | $ | 603 |
| | $ | 584 |
|
| Service cost | | 2 |
| | 2 |
|
| Interest cost | | 24 |
| | 26 |
|
| Medicare subsidy reimbursements | | 1 |
| | 2 |
|
| Plan participants’ contributions | | 8 |
| | 7 |
|
| Actuarial loss | | 33 |
| | 33 |
|
| Benefit payments | | (50 | ) | | (51 | ) |
| Obligation at Dec. 31 | | $ | 621 |
| | $ | 603 |
|
|
| | | | | | | | |
| (Millions of Dollars) | | 2017 | | 2016 |
| Change in Fair Value of Plan Assets: | | | | |
| Fair value of plan assets at Jan. 1 | | $ | 442 |
| | $ | 448 |
|
| Actual return on plan assets | | 41 |
| | 20 |
|
| Plan participants’ contributions | | 8 |
| | 7 |
|
| Employer contributions | | 20 |
| | 18 |
|
| Benefit payments | | (50 | ) | | (51 | ) |
| Fair value of plan assets at Dec. 31 | | $ | 461 |
| | $ | 442 |
|
|
| | | | | | | | |
| (Millions of Dollars) | | 2017 | | 2016 |
| Funded Status of Plans at Dec. 31: | | | | |
| Funded status | | $ | (160 | ) | | $ | (161 | ) |
| Current liabilities | | (3 | ) | | (6 | ) |
| Noncurrent liabilities | | (157 | ) | | (155 | ) |
| Net postretirement amounts recognized on consolidated balance sheets | | $ | (160 | ) | | $ | (161 | ) |
|
| | | | | | | | |
| (Millions of Dollars) | | 2017 | | 2016 |
| Amounts Not Yet Recognized as Components of Net Periodic Benefit Cost: | | | | |
| Net loss | | $ | 147 |
| | $ | 136 |
|
| Prior service credit | | (44 | ) | | (54 | ) |
| Total | | $ | 103 |
| | $ | 82 |
|
|
| | | | | | | | |
| (Millions of Dollars) | | 2017 | | 2016 |
| Amounts Not Yet Recognized as Components of Net Periodic Benefit Cost Have Been Recorded as Follows Based Upon Expected Recovery in Rates: | | | | |
| Noncurrent regulatory assets | | $ | 107 |
| | $ | 91 |
|
| Current regulatory liabilities | | (1 | ) | | (1 | ) |
| Noncurrent regulatory liabilities | | (10 | ) | | (14 | ) |
| Deferred income taxes | | 2 |
| | 2 |
|
| Net-of-tax accumulated OCI | | 5 |
| | 4 |
|
| Total | | $ | 103 |
| | $ | 82 |
|
|
| | | | |
Measurement date | | Dec. 31, 2017 | | Dec. 31, 201610. Fair Value of Financial Assets and Liabilities |
|
| | | | | | |
| | | 2017 | | 2016 |
| Significant Assumptions Used to Measure Benefit Obligations: | | | | |
| Discount rate for year-end valuation | | 3.62 | % | | 4.13 | % |
| Mortality table | | RP 2014 |
| | RP 2014 |
|
| Health care costs trend rate — initial: Pre-65 | | 7.00 | % | | 5.50 | % |
| Health care costs trend rate — initial: Post-65 | | 5.50 | % | | 5.50 | % |
Beginning with the Dec. 31, 2017 measurement, Xcel Energy Inc. separated its initial medical trend assumption for pre-Medicare (Pre-65) and post-Medicare (Post-65) claims costs in order to reflect different short-term expectations based on recent experience differences. The Post-65 initial medical trend rate was set at 5.5 percent. The Pre-65 initial medical trend rate was set at 7.0 percent. The ultimate trend assumption remained at 4.5 percent for both groups. The period until the ultimate rate is reached is five years. Xcel Energy bases its medical trend assumption on the long-term cost inflation expected in the health care market, considering the levels projected and recommended by industry experts, as well as recent actual medical cost increases experienced by Xcel Energy’s retiree medical plan.
A one-percent change in the assumed health care cost trend rate would have the following effects on Xcel Energy:
|
| | | | | | | | |
| | | One-Percentage Point |
| (Millions of Dollars) | | Increase | | Decrease |
| APBO | | $ | 60 |
| | $ | (51 | ) |
| Service and interest components | | 3 |
| | (2 | ) |
Cash Flows — The postretirement health care plans have no funding requirements under income tax and other retirement-related regulations other than fulfilling benefit payment obligations, when claims are presented and approved under the plans. Additional cash funding requirements are prescribed by certain state and federal rate regulatory authorities. Xcel Energy contributed $20 million during 2017, $18 million during 2016, $18 million during 2015 and expects to contribute approximately $12 million during 2018.
Plan Amendments — In 2017 and 2016, there were no plan amendments made which affected the benefit obligation.
Benefit Costs — The components of Xcel Energy’s net periodic postretirement benefit costs were:
|
| | | | | | | | | | | | |
| (Millions of Dollars) | | 2017 | | 2016 | | 2015 |
| Service cost | | $ | 2 |
| | $ | 2 |
| | $ | 2 |
|
| Interest cost | | 24 |
| | 26 |
| | 25 |
|
| Expected return on plan assets | | (25 | ) | | (25 | ) | | (26 | ) |
| Amortization of prior service credit | | (11 | ) | | (11 | ) | | (11 | ) |
| Amortization of net loss | | 7 |
| | 4 |
| | 6 |
|
| Net periodic postretirement (credit) cost | | $ | (3 | ) | | $ | (4 | ) | | $ | (4 | ) |
|
| | | | | | | | | |
| | | 2017 | | 2016 | | 2015 |
| Significant Assumptions Used to Measure Costs: | | | | | | |
| Discount rate | | 4.13 | % | | 4.65 | % | | 4.08 | % |
| Expected average long-term rate of return on assets | | 5.80 |
| | 5.80 |
| | 5.80 |
|
Projected Benefit Payments
The following table lists Xcel Energy’s projected benefit payments for the pension and postretirement benefit plans:
|
| | | | | | | | | | | | | | | | |
| (Millions of Dollars) | | Projected
Pension Benefit
Payments | | Gross Projected
Postretirement
Health Care
Benefit Payments | | Expected
Medicare Part D
Subsidies | | Net Projected
Postretirement
Health Care
Benefit Payments |
| 2018 | | $ | 307 |
| | $ | 47 |
| | $ | 2 |
| | $ | 45 |
|
| 2019 | | 262 |
| | 47 |
| | 2 |
| | 45 |
|
| 2020 | | 261 |
| | 47 |
| | 2 |
| | 45 |
|
| 2021 | | 261 |
| | 47 |
| | 3 |
| | 44 |
|
| 2022 | | 266 |
| | 46 |
| | 3 |
| | 43 |
|
| 2023-2027 | | 1,274 |
| | 212 |
| | 14 |
| | 198 |
|
Multiemployer Plans
NSP-Minnesota and NSP-Wisconsin each contribute to several union multiemployer pension and other postretirement benefit plans, none of which are individually significant. These plans provide pension and postretirement health care benefits to certain union employees who may perform services for multiple employers and do not participate in the NSP-Minnesota and NSP-Wisconsin sponsored pension and postretirement health care plans. Contributing to these types of plans creates risk that differs from providing benefits under NSP-Minnesota and NSP-Wisconsin sponsored plans, in that if another participating employer ceases to contribute to a multiemployer plan, additional unfunded obligations may need to be funded over time by remaining participating employers.
Contributions to multiemployer plans were as follows for the years ended Dec. 31, 2017, 2016 and 2015. The average number of NSP-Minnesota union employees covered by the multiemployer pension plans decreased to approximately 576 in 2017 from 700 in 2016. There were no other significant changes to the nature or magnitude of the participation of NSP-Minnesota and NSP-Wisconsin in multiemployer plans for the years presented:
|
| | | | | | | | | | | | |
| (Millions of Dollars) | | 2017 | | 2016 | | 2015 |
| Multiemployer pension contributions: | | | | | | |
| NSP-Minnesota | | $ | 12 |
| | $ | 14 |
| | $ | 17 |
|
| NSP-Wisconsin | | — |
| | 1 |
| | 1 |
|
| Total | | $ | 12 |
| | $ | 15 |
| | $ | 18 |
|
Other income, net for the years ended Dec. 31 consisted of the following:
|
| | | | | | | | | | | | |
| (Millions of Dollars) | | 2017 | | 2016 | | 2015 |
| Interest income | | $ | 19 |
| | $ | 8 |
| | $ | 6 |
|
| Other nonoperating income | | 7 |
| | 3 |
| | 4 |
|
| Insurance policy expense | | (3 | ) | | (3 | ) | | (4 | ) |
| Other income, net | | $ | 23 |
| | $ | 8 |
| | $ | 6 |
|
11. Fair Value of Financial Assets and Liabilities
Fair Value Measurements
The accountingAccounting guidance for fair value measurements and disclosures provides a single definition of fair value and requires certain disclosures about assets and liabilities measured at fair value. A hierarchical framework for disclosing the observability of the inputs utilized in measuring assets and liabilities at fair value is established by this guidance. The three levels in the hierarchy are as follows:
•Level 1 — Quoted prices are available in active markets for identical assets or liabilities as of the reporting date. The types of assets and liabilities included in Level 1 are highly liquid and actively traded instruments with quoted prices.
•Level 2 — Pricing inputs are other than quoted prices in active markets but are either directly or indirectly observable as of the reporting date. The types of assets and liabilities included in Level 2 are typically either comparable to actively traded securities or contracts or priced with models using highly observable inputs.
•Level 3 — Significant inputs to pricing have little or no observability as of the reporting date. The types of assets and liabilities included in Level 3 are those valued with models requiring significant management judgment or estimation.
Specific valuation methods include the following:include:
Cash equivalents— The fair values of cash equivalents are generally based on cost plus accrued interest; money market funds are measured using quoted NAV.
Investments in equity securities and other funds— Equity securities are valued using quoted prices in active markets. The fair values for commingled funds are measured using NAVs, which take into consideration the value of underlying fund investments, as well as the other accrued assets and liabilities of a fund, in order to determine a per-share market value.NAVs. The investments in commingled funds may be redeemed for NAV with proper notice. Proper notice varies by fund and can range from daily with one or two days notice to annually with 90 days notice. Private equity commingled fund investments require approval of the fund for any unscheduled redemption, and such redemptions may be approved or denied by the fund at its sole discretion. Unscheduled distributions from real estate commingled fund investments may be redeemed with proper notice, which is typically quarterly with 45-90 days notice; however, withdrawals from real estate investments may be delayed or discounted as a result of fund illiquidity.
Investments in debt securities— Fair values for debt securities are determined by a third partythird-party pricing service using recent trades and observable spreads from benchmark interest rates for similar securities.
Interest rate derivatives— The fair Fair values of interest rate derivatives are based on broker quotes that utilize current market interest rate forecasts.
Commodity derivatives— The methods Methods used to measure the fair value of commodity derivative forwards and options utilize forward prices and volatilities, as well as pricing adjustments for specific delivery locations, and are generally assigned a Level 2 classification. When contractual settlements relate to inactive delivery locations or extend to periods beyond those readily observable on active exchanges or quoted by brokers, the significance of the use of less observable forecasts of forward prices and volatilities on a valuation is evaluated and may result in Level 3 classification.
Electric commodity derivatives held by NSP-Minnesota and SPS include transmission congestion instruments, generally referred to as FTRs. FTRs purchased from aan RTO are financial instruments that entitle or obligate the holder to monthly revenues or charges based on transmission congestion across a given transmission path.
The value of an FTR is derived from, and designed to offset, the cost of transmission congestion. In addition to overall transmission load, congestion is also influenced by the operating schedules of power plants and the consumption of electricity pertinent to a given transmission path. Unplanned plant outages, scheduled plant maintenance, changes in the relative costs of fuels used in generation, weather and overall changes in demand for electricity can each impact the operating schedules of the power plants on the transmission grid and the value of an FTR.
If forecasted costs of electric transmission congestion increase or decrease for a given FTR path, the value of that particular FTR instrument will likewise increase or decrease. Given the limited observability of importantcertain inputs to the value of FTRs between auction processes, including expected plant operating schedules and retail and wholesale demand, fair value measurements for FTRs have been assigned a Level 3.
Non-trading monthly FTR settlements are included in fuel and purchased energy cost recovery mechanisms as applicable in each jurisdiction, and therefore changes in the fair value of the yet to be settled portions of most FTRs are deferred as a regulatory asset or liability. Given this regulatory treatment and the limited magnitude of FTRs relative to the electric utility operations of NSP-Minnesota and SPS, the numerous unobservable quantitative inputs pertinent to the value of FTRs are insignificantimmaterial to the consolidated financial statements of Xcel Energy.statements.
Non-Derivative Instruments Fair Value Measurements
Nuclear Decommissioning Fund
The NRC requires NSP-Minnesota to maintain a portfolio of investments to fund the costs of decommissioning its nuclear generating plants. Together with all accumulated earnings or losses, the assetsAssets of the nuclear decommissioning fund are legally restricted for the purpose of decommissioning the Monticello and PI nuclear generating plants.these facilities. The fund contains cash equivalents, debt securities, equity securities and other investments – all classified as available-for-sale. NSP-Minnesota plans to reinvest matured securities until decommissioning begins.investments. NSP-Minnesota uses the MPUC approved asset allocation for the escrow and investment targets by asset class for both the escrow and qualified trust.
NSP-Minnesota recognizes the costs of funding the decommissioning of its nuclear generating plants over the lives of the nuclear plants, assuming rate recovery of all costs. Given the purpose and legal restrictions on the use of nuclear decommissioning fund assets, realizedRealized and unrealized gains on fund investments over the life of the fund are deferred as an offset of NSP-Minnesota’s regulatory asset for nuclear decommissioning costs. Consequently, any realized and unrealized gains and losses on securities in the nuclear decommissioning fund including any other-than-temporary impairments, are deferred as a component of the regulatory asset for nuclear decommissioning.
asset.
Unrealized gains for the nuclear decommissioning fund were $560 million$1.3 billion and $379$981 million as of Dec. 31, 20172021 and 2016,2020, respectively, and unrealized losses and amounts recorded as other-than-temporary impairments were $7 million and $47$5 million as of Dec. 31, 20172021 and 2016,2020, respectively.
The following tables present the cost and fair value of Xcel Energy’s non-derivativeNon-derivative instruments with recurring fair value measurementsmeasurements:
| | | | | | | | | | | | | | | | | | | | | | | | | | | | | | | | | | | | | | |
| | Dec. 31, 2021 |
| | | | Fair Value |
| (Millions of Dollars) | | Cost | | Level 1 | | Level 2 | | Level 3 | | NAV | | Total |
Nuclear decommissioning fund (a) | | | | | | | | |
| Cash equivalents | | $ | 64 | | | $ | 64 | | | $ | — | | | $ | — | | | $ | — | | | $ | 64 | |
| Commingled funds | | 856 | | | — | | | — | | | — | | | 1,294 | | | 1,294 | |
| Debt securities | | 631 | | | — | | | 666 | | | 9 | | | — | | | 675 | |
| Equity securities | | 411 | | | 1,222 | | | 1 | | | — | | | — | | | 1,223 | |
| Total | | $ | 1,962 | | | $ | 1,286 | | | $ | 667 | | | $ | 9 | | | $ | 1,294 | | | $ | 3,256 | |
(a)Reported in nuclear decommissioning fund and other investments on the consolidated balance sheet, which also includes $208 million of equity investments in unconsolidated subsidiaries and $164 million of rabbi trust assets and miscellaneous investments.
| | | | | | | | | | | | | | | | | | | | | | | | | | | | | | | | | | | | | | |
| | Dec. 31, 2020 |
| | | | Fair Value |
| (Millions of Dollars) | | Cost | | Level 1 | | Level 2 | | Level 3 | | NAV | | Total |
Nuclear decommissioning fund (a) | | | | | | | | |
| Cash equivalents | | $ | 40 | | | $ | 40 | | | $ | — | | | $ | — | | | $ | — | | | $ | 40 | |
| Commingled funds | | 787 | | | — | | | — | | | — | | | 1,041 | | | 1,041 | |
| Debt securities | | 528 | | | — | | | 572 | | | 13 | | | — | | | 585 | |
| Equity securities | | 446 | | | 1,109 | | | 2 | | | — | | | — | | | 1,111 | |
| Total | | $ | 1,801 | | | $ | 1,149 | | | $ | 574 | | | $ | 13 | | | $ | 1,041 | | | $ | 2,777 | |
(a)Reported in nuclear decommissioning fund and other investments on the consolidated balance sheet, which also includes $165 million of equity investments in unconsolidated subsidiaries and $154 million of rabbi trust assets and miscellaneous investments.
For the years ended Dec. 31, 2021 and 2020, there were immaterial Level 3 nuclear decommissioning fund investments or transfer of amounts between levels.
Contractual maturity dates of debt securities in the nuclear decommissioning fund as of Dec. 31, 2017 and 2016:2021:
|
| | | | | | | | | | | | | | | | | | | | | | | | |
| | | Dec. 31, 2017 |
| | | | | Fair Value |
| (Millions of Dollars) | | Cost | | Level 1 | | Level 2 | | Level 3 | | Investments Measured at NAV | | Total |
Nuclear decommissioning fund (a) | | | | | | | | | | | | |
| Cash equivalents | | $ | 29 |
| | $ | 29 |
| | $ | — |
| | $ | — |
| | $ | — |
| | $ | 29 |
|
| Commingled funds: | | | | | | | | | | | | |
| Non U.S. equities | | 264 |
| | 217 |
| | — |
| | — |
| | 90 |
| | 307 |
|
| Emerging market debt funds | | 156 |
| | — |
| | — |
| | — |
| | 166 |
| | 166 |
|
| Private equity investments | | 141 |
| | — |
| | — |
| | — |
| | 198 |
| | 198 |
|
| Real estate | | 131 |
| | — |
| | — |
| | — |
| | 202 |
| | 202 |
|
| Other commingled funds | | 9 |
| | 6 |
| | — |
| | — |
| | 3 |
| | 9 |
|
| Debt securities: | | | | | | | | | | | | |
| Government securities | | 68 |
| | — |
| | 69 |
| | — |
| | — |
| | 69 |
|
| U.S. corporate bonds | | 320 |
| | — |
| | 322 |
| | — |
| | — |
| | 322 |
|
| Non U.S. corporate bonds | | 50 |
| | — |
| | 50 |
| | — |
| | — |
| | 50 |
|
| Equity securities: | | | | | | | | | | | | |
| U.S. equities | | 271 |
| | 557 |
| | — |
| | — |
| | — |
| | 557 |
|
| Non U.S. equities | | 152 |
| | 234 |
| | — |
| | — |
| | — |
| | 234 |
|
| Total | | $ | 1,591 |
| | $ | 1,043 |
| | $ | 441 |
| | $ | — |
| | $ | 659 |
| | $ | 2,143 |
|
| |
(a)
| Reported in nuclear decommissioning fund and other investments on the consolidated balance sheet, which also includes $140 million of equity investments in unconsolidated subsidiaries and $114 million of rabbi trust assets and miscellaneous investments. |
|
| | | | | | | | | | | | | | | | | | | | | | | | |
| | | Dec. 31, 2016 |
| | | | | Fair Value |
| (Millions of Dollars) | | Cost | | Level 1 | | Level 2 | | Level 3 | | Investments Measured at NAV | | Total |
Nuclear decommissioning fund (a) | | | | | | | | | | | | |
| Cash equivalents | | $ | 20 |
| | $ | 20 |
| | $ | — |
| | $ | — |
| | $ | — |
| | $ | 20 |
|
| Commingled funds: | | | | | | | | | | | | |
| Non U.S. equities | | 261 |
| | 133 |
| | — |
| | — |
| | 112 |
| | 245 |
|
| Emerging market debt funds | | 93 |
| | — |
| | — |
| | — |
| | 98 |
| | 98 |
|
| Commodity funds | | 106 |
| | — |
| | — |
| | — |
| | 92 |
| | 92 |
|
| Private equity investments | | 132 |
| | — |
| | — |
| | — |
| | 190 |
| | 190 |
|
| Real estate | | 129 |
| | — |
| | — |
| | — |
| | 188 |
| | 188 |
|
| Other commingled funds | | 151 |
| | — |
| | — |
| | — |
| | 160 |
| | 160 |
|
| Debt securities: | | | | | | | | | | | | |
| Government securities | | 33 |
| | — |
| | 32 |
| | — |
| | — |
| | 32 |
|
| U.S. corporate bonds | | 105 |
| | — |
| | 106 |
| | — |
| | — |
| | 106 |
|
| Non U.S. corporate bonds | | 22 |
| | — |
| | 21 |
| | — |
| | — |
| | 21 |
|
| Municipal bonds | | 14 |
| | — |
| | 14 |
| | — |
| | — |
| | 14 |
|
| Mortgage-backed securities | | 3 |
| | — |
| | 3 |
| | — |
| | — |
| | 3 |
|
| Equity securities: | | | | | | | | | | | | |
| U.S. equities | | 271 |
| | 474 |
| | — |
| | — |
| | — |
| | 474 |
|
| Non U.S. equities | | 189 |
| | 218 |
| | — |
| | — |
| | — |
| | 218 |
|
| Total | | $ | 1,529 |
| | $ | 845 |
| | $ | 176 |
| | $ | — |
| | $ | 840 |
| | $ | 1,861 |
|
| |
(a)
| Reported in nuclear decommissioning fund and other investments on the consolidated balance sheet, which also includes $133 million of equity investments in unconsolidated subsidiaries and $98 million of rabbi trust assets and miscellaneous investments. |
For the years ended Dec. 31, 2017 and 2016 there were no Level 3 nuclear decommissioning fund investments and no transfers of amounts between levels.
The following table summarizes the final contractual maturity dates of the debt securities in the nuclear decommissioning fund, by asset class, as of Dec. 31, 2017:
|
| | | | | | | | | | | | | | | | | | | | |
| | | Final Contractual Maturity |
| (Millions of Dollars) | | Due in 1 Year or Less | | Due in 1 to 5 Years | | Due in 5 to 10 Years | | Due after 10 Years | | Total |
| Government securities | | $ | — |
| | $ | 2 |
| | $ | — |
| | $ | 67 |
| | $ | 69 |
|
| U.S. corporate bonds | | 5 |
| | 85 |
| | 174 |
| | 58 |
| | 322 |
|
| Non U.S. corporate bonds | | — |
| | 15 |
| | 31 |
| | 4 |
| | 50 |
|
| Debt securities | | $ | 5 |
| | $ | 102 |
| | $ | 205 |
| | $ | 129 |
| | $ | 441 |
|
| | | | | | | | | | | | | | | | | | | | | | | | | | | | | | | | |
| | Final Contractual Maturity |
| (Millions of Dollars) | | Due in 1 year or Less | | Due in 1 to 5 Years | | Due in 5 to 10 Years | | Due after 10 years | | Total |
| Debt securities | | $ | 4 | | | $ | 149 | | | $ | 208 | | | $ | 314 | | | $ | 675 | |
Rabbi Trusts
In June 2016, Xcel Energy has established rabbi trusts to provide partial funding for future distributions of its supplemental executive retirement planSERP and deferred compensation plan. The following table presents the cost
Cost and fair value of the assets held in rabbi trusts as of Dec. 31, 2017trusts:
| | | | | | | | | | | | | | | | | | | | | | | | | | | | | | | | |
| | Dec. 31, 2021 |
| | | | Fair Value |
| (Millions of Dollars) | | Cost | | Level 1 | | Level 2 | | Level 3 | | Total |
Rabbi Trusts (a) | | | | | | | | | | |
| Cash equivalents | | $ | 20 | | | $ | 20 | | | $ | — | | | $ | — | | | $ | 20 | |
| Mutual funds | | 75 | | | 89 | | | — | | | — | | | 89 | |
| Total | | $ | 95 | | | $ | 109 | | | $ | — | | | $ | — | | | $ | 109 | |
(a) Reported in nuclear decommissioning fund and 2016:other investments on the consolidated balance sheet.
| | | | | | | | | | | | | | | | | | | | | | | | | | | | | | | | |
| | Dec. 31, 2020 |
| | | | Fair Value |
| (Millions of Dollars) | | Cost | | Level 1 | | Level 2 | | Level 3 | | Total |
Rabbi Trusts (a) | | | | | | | | | | |
| Cash equivalents | | $ | 32 | | | $ | 32 | | | $ | — | | | $ | — | | | $ | 32 | |
| Mutual funds | | 60 | | | 70 | | | — | | | — | | | 70 | |
| Total | | $ | 92 | | | $ | 102 | | | $ | — | | | $ | — | | | $ | 102 | |
|
| | | | | | | | | | | | | | | | | | | | |
| | | Dec. 31, 2017 |
| | | | | Fair Value |
| (Millions of Dollars) | | Cost | | Level 1 | | Level 2 | | Level 3 | | Total |
Rabbi Trusts (a) | | | | | | | | | | |
| Cash equivalents | | $ | 12 |
| | $ | 12 |
| | $ | — |
| | $ | — |
| | $ | 12 |
|
| Mutual funds | | 47 |
| | 50 |
| | — |
| | — |
| | 50 |
|
| Total | | $ | 59 |
| | $ | 62 |
| | $ | — |
| | $ | — |
| | $ | 62 |
|
|
| | | | | | | | | | | | | | | | | | | | |
| | | Dec. 31, 2016 |
| | | | | Fair Value |
| (Millions of Dollars) | | Cost | | Level 1 | | Level 2 | | Level 3 | | Total |
Rabbi Trusts (a) | | | | | | | | | | |
| Cash equivalents | | $ | 48 |
| | $ | 48 |
| | $ | — |
| | $ | — |
| | $ | 48 |
|
| Mutual funds | | 2 |
| | 2 |
| | — |
| | — |
| | 2 |
|
| Total | | $ | 50 |
| | $ | 50 |
| | $ | — |
| | $ | — |
| | $ | 50 |
|
| |
(a)
| Reported in nuclear decommissioning fund and other investments on the consolidated balance sheet. |
Derivative Instruments Fair Value Measurements
Xcel Energy enters into derivative instruments, including forward contracts, futures, swaps and options, for trading purposes and to manage risk in connection with changes in interest rates, utility commodity prices and vehicle fuel prices.
Interest Rate Derivatives — Xcel Energy enters into various instruments that effectively fix the interest payments on certain floating rate debt obligations or effectively fix the yield or price on a specified benchmark interest rate for an anticipated debt issuance for a specific period. These derivative instruments are generally designated as cash flow hedges for accounting purposes.
purposes, with changes in fair value prior to settlement recorded as other comprehensive income.
As of Dec. 31, 2017,2021, accumulated other comprehensive lossesloss related to settled interest rate derivatives included $3$5 million of net losses expected to be reclassified into earnings during the next 12 months as the related hedged transactions impact earnings. As of Dec. 31, 2021, Xcel Energy had no unsettled interest rate transactions impact earnings, including forecasted amounts for unsettled hedges, as applicable.derivatives.
Wholesale and Commodity Trading Risk — Xcel Energy Inc.’s utility subsidiaries conduct various wholesale and commodity trading activities, including the purchase and sale of electric capacity, energy, energy-related instruments and natural gas-related instruments, including derivatives. Xcel Energy’s risk management policy allows managementEnergy is allowed to conduct these activities within guidelines and limitations as approved by its risk management committee, which is made upcomprised of management personnel not directly involved in the activities governed by this policy.
Commodity Derivatives — Xcel Energy enters into derivative instruments to manage variability of future cash flows from changes in commodity prices in its electric and natural gas operations, as well as for trading purposes. This could include the purchase or sale of energy or energy-related products, natural gas to generate electric energy, natural gas for resale, FTRs, vehicle fuel and weather derivatives.
As of Dec. 31, 2017, Xcel Energy had various vehicle fuel contracts designated as cash flow hedges extending through December 2018. Xcel Energy entersmay enter into derivative instruments that mitigate commodity price risk on behalf of electric and natural gas customers but may not be designated as qualifying hedging transactions. Changes in the fair valueThe classification of non-trading commodity derivativeunrealized losses or gains on these instruments are recorded in OCI or deferred as a regulatory asset or liability. The classification as a regulatory asset or liability, if applicable, is based on commission approved regulatory recovery mechanisms. Xcel Energy recorded immaterial amounts to income related to the ineffectiveness of cash flow hedges for the years ended Dec. 31, 2017 and 2016.
As of Dec. 31, 2017, net gains related to2021, Xcel Energy had no commodity derivativecontracts designated as cash flow hedges recorded as a component of accumulated other comprehensive losses included immaterial net gains expected to be reclassified into earnings during the next 12 months as the hedged transactions occur.hedges.
Additionally, Xcel Energy enters into commodity derivative instruments for trading purposes not directly related to commodity price risks associated with serving its electric and natural gas customers. Changes in the fair value of these commodity derivatives are recorded in electric operating revenues, net of amounts credited to customers under margin-sharing mechanisms.
The following table details the grossGross notional amounts of commodity forwards, options and FTRs asFTRs:
| | | | | | | | | | | | | | |
(Amounts in Millions) (a)(b) | | Dec. 31, 2021 | | Dec. 31, 2020 |
| MWh of electricity | | 80 | | | 87 | |
| MMBtu of natural gas | | 156 | | | 175 | |
(a)Not reflective of Dec. 31:net positions in the underlying commodities.
(b)Notional amounts for options included on a gross basis but weighted for the probability of exercise. |
| | | | | | |
(Amounts in Millions) (a)(b) | | 2017 | | 2016 |
| MWh of electricity | | 68 |
| | 47 |
|
| MMBtu of natural gas | | 37 |
| | 122 |
|
| |
(a)
| Amounts are not reflective of net positions in the underlying commodities. |
| |
(b)
| Notional amounts for options are included on a gross basis, but are weighted for the probability of exercise. |
Consideration of Credit Risk and Concentrations — Xcel Energy continuously monitors the creditworthiness of the counterparties to its interest rate derivatives and commodity derivative contracts prior to settlement and assesses each counterparty’s ability to perform on the transactions set forth in the contracts. Given this assessment, as well as an assessment of the impact of Xcel Energy’s own credit risk when determining the fair value of derivative liabilities, the impactImpact of credit risk was immaterial to the fair value of unsettled commodity derivatives presented inon the consolidated balance sheets.
Xcel Energy Inc. and its subsidiaries employ additional credit risk control mechanisms when appropriate, such as letters of credit, parental guarantees, standardized master netting agreements and termination provisions that allow for offsetting of positive and negative exposures. Credit exposure is monitored and, when necessary, the activity with a specific counterparty is limited until credit enhancement is provided.
Xcel Energy’s utility subsidiaries’ most significant concentrations of credit risk with particular entities or industries are contracts with counterparties to their wholesale, trading and non-trading commodity activities.
As of Dec. 31, 2017, four2021, 6 of Xcel Energy’s 10 most significant counterparties for these activities, comprising $45$83 million or 29 percent38% of this credit exposure, had investment grade credit ratings from S&P’s,&P, Moody’s Investor Services or Fitch Ratings. FiveNaN of the 10 most significant counterparties, comprising $30$44 million or 19 percent20% of this credit exposure, were not rated by these external agencies, but based on Xcel Energy’s internal analysis, had credit quality consistent with investment grade. AnotherNaN of these significant counterparties, comprising $7$38 million or 5 percent18% of this credit exposure, had credit quality less than investment grade, based on ratings from externalinternal analysis. EightNaN of these significant counterparties are municipal or cooperative electric entities, RTOs or other utilities.
Financial Impact of Qualifying Cash Flow Hedges — The Financial impact of qualifying interest rate and vehicle fuel cash flow hedges on Xcel Energy’s accumulated other comprehensive loss, included in the consolidated statements of common stockholders’ equity and in the consolidated statements of comprehensive income, is detailed in the following table:income:
| | | | | | | | | | | | | | | | | | | | |
| (Millions of Dollars) | | 2021 | | 2020 | | 2019 |
| Accumulated other comprehensive loss related to cash flow hedges at Jan. 1 | | $ | (85) | | | $ | (80) | | | $ | (60) | |
| After-tax net unrealized gains (losses) related to derivatives accounted for as hedges | | 4 | | | (10) | | | (23) | |
| After-tax net realized losses on derivative transactions reclassified into earnings | | 6 | | | 5 | | | 3 | |
| Accumulated other comprehensive loss related to cash flow hedges at Dec. 31 | | $ | (75) | | | $ | (85) | | | $ | (80) | |
|
| | | | | | | | | | | | |
| (Millions of Dollars) | | 2017 | | 2016 | | 2015 |
| Accumulated other comprehensive loss related to cash flow hedges at Jan. 1 | | $ | (51 | ) | | $ | (55 | ) | | $ | (58 | ) |
| After-tax net realized losses on derivative transactions reclassified into earnings | | 3 |
| | 4 |
| | 3 |
|
| Accumulated other comprehensive loss related to cash flow hedges at Dec. 31 | | $ | (48 | ) | | $ | (51 | ) | | $ | (55 | ) |
The following tables detail the impactImpact of derivative activity during the years ended Dec. 31, 2017, 2016 and 2015, on accumulated other comprehensive loss, regulatory assets and liabilities, and income:activity:
|
| | | | | | | | | | | | | | | | | | | | | |
| | | Year Ended Dec. 31, 2017 | |
| | | Pre-Tax Fair Value Gains (Losses) Recognized During the Period in: | | Pre-Tax (Gains) Losses Reclassified into Income During the Period from: | | Pre-Tax Gains (Losses) Recognized
During the Period in Income | |
| (Millions of Dollars) | | Accumulated
Other
Comprehensive Loss | | Regulatory
(Assets) and Liabilities | | Accumulated
Other
Comprehensive Loss | | Regulatory
Assets and (Liabilities) | | |
| Derivatives designated as cash flow hedges | | | | | | | | | | | |
| Interest rate | | $ | — |
| | $ | — |
| | $ | 5 |
| (a) | $ | — |
| | $ | — |
| |
| Total | | $ | — |
| | $ | — |
| | $ | 5 |
| | $ | — |
| | $ | — |
| |
| Other derivative instruments | | | | | | | | | | | |
| Commodity trading | | $ | — |
| | $ | — |
| | $ | — |
| | $ | — |
| | $ | 10 |
| (b) |
| Electric commodity | | — |
| | 10 |
| | — |
| | (15 | ) | (c) | — |
| |
| Natural gas commodity | | — |
| | (13 | ) | | — |
| | 3 |
| (d) | (6 | ) | (d) |
| Total | | $ | — |
| | $ | (3 | ) | | $ | — |
| | $ | (12 | ) | | $ | 4 |
| |
|
| | | | | | | | | | | | | | | | | | | | | |
| | | Year Ended Dec. 31, 2016 | |
| | | Pre-Tax Fair Value Gains Recognized During the Period in: | | Pre-Tax (Gains) Losses Reclassified into Income During the Period from: | | Pre-Tax Gains (Losses) Recognized
During the Period in Income | |
| (Millions of Dollars) | | Accumulated
Other
Comprehensive Loss | | Regulatory
(Assets) and Liabilities | | Accumulated
Other
Comprehensive Loss | | Regulatory
Assets and (Liabilities) | | |
| Derivatives designated as cash flow hedges | | | | | | | | | | | |
| Interest rate | | $ | — |
| | $ | — |
| | $ | 6 |
| (a) | $ | — |
| | $ | — |
| |
| Total | | $ | — |
| | $ | — |
| | $ | 6 |
| | $ | — |
| | $ | — |
| |
| Other derivative instruments | | | | | | | | | | | |
| Commodity trading | | $ | — |
| | $ | — |
| | $ | — |
| | $ | — |
| | $ | 2 |
| (b) |
| Electric commodity | | — |
| | 17 |
| | — |
| | (8 | ) | (c) | — |
| |
| Natural gas commodity | | — |
| | 1 |
| | — |
| | 15 |
| (d) | (8 | ) | (d) |
| Total | | $ | — |
| | $ | 18 |
| | $ | — |
| | $ | 7 |
| | $ | (6 | ) | |
|
| | | | | | | | | | | | | | | | | | | | | |
| | | Year Ended Dec. 31, 2015 | |
| | | Pre-Tax Fair Value Losses Recognized During the Period in: | | Pre-Tax Losses Reclassified into Income During the Period from: | | Pre-Tax Losses Recognized
During the Period in Income | |
| (Millions of Dollars) | | Accumulated
Other
Comprehensive Loss | | Regulatory
(Assets) and Liabilities | | Accumulated
Other
Comprehensive Loss | | Regulatory
Assets and (Liabilities) | | |
| Derivatives designated as cash flow hedges | | | | | | | | | | | |
| Interest rate | | $ | — |
| | $ | — |
| | $ | 5 |
| (a) | $ | — |
| | $ | — |
| |
| Total | | $ | — |
| | $ | — |
| | $ | 5 |
| | $ | — |
| | $ | — |
| |
| Other derivative instruments | | | | | | | | | | | |
| Commodity trading | | $ | — |
| | $ | — |
| | $ | — |
| | $ | — |
| | $ | (7 | ) | (b) |
| Electric commodity | | — |
| | (19 | ) | | — |
| | 16 |
| (c) | — |
| |
| Natural gas commodity | | — |
| | (16 | ) | | — |
| | 16 |
| (d) | (12 | ) | (d) |
| Total | | $ | — |
| | $ | (35 | ) | | $ | — |
| | $ | 32 |
| | $ | (19 | ) | |
| | | | | | | | | | | | | | |
(a)
| Amounts are recorded to interest charges. | Pre-Tax Fair Value
Gains (Losses) Recognized
During the Period in: |
| (Millions of Dollars) | | Accumulated
Other
Comprehensive Loss | | Regulatory
(Assets) and Liabilities |
| Year Ended Dec. 31, 2021 | | | | |
(b)
Derivatives designated as cash flow hedges | Amounts are recorded to electric operating revenues. Portions of these gains and losses are subject to sharing with electric customers through margin-sharing mechanisms and deducted from gross revenue, as appropriate. |
| | |
(c)
Interest rate | Amounts are recorded to electric fuel and purchased power. These | $ | 5 | | | $ | — | |
| Total | | $ | 5 | | | $ | — | |
Other derivative settlement gains and losses are shared with electric customers through fuel and purchased energy cost-recovery mechanisms, and reclassified out of income as regulatory assets or liabilities, as appropriate.instruments |
| | | |
(d)
Electric commodity | Certain derivatives are utilized to mitigate natural | $ | — | | | $ | 32 | |
Natural gas price risk for electric generation and are recorded to electric fuel and purchased power, subject to cost-recovery mechanisms and reclassified to a regulatory asset, as appropriate. Amounts for the years endedcommodity | | — | | | (4) | |
| Total | | $ | — | | | $ | 28 | |
| | | | |
Year Ended Dec. 31, 2017 and2020 | | | | |
| Interest rate | | $ | (13) | | | $ | — | |
| Total | | $ | (13) | | | $ | — | |
| Other derivative instruments | | | | |
| Electric commodity | | $ | — | | | $ | (5) | |
| Natural gas commodity | | — | | | (13) | |
| Total | | $ | — | | | $ | (18) | |
| | | | |
Year Ended Dec. 31, 2016 included immaterial settlement gains and losses. Amounts for the year ended Dec. 31, 2015 included $1 million of settlement losses. The remaining settlement losses for the years ended Dec. 31, 2017, 2016 and 2015 relate to natural2019 | | | | |
| Interest rate | | $ | (30) | | | $ | — | |
| Total | | $ | (30) | | | $ | — | |
| Other derivative instruments | | | | |
| Electric commodity | | $ | — | | | $ | 8 | |
Natural gas operations and are recorded to cost of natural gas sold and transported. These losses are subject to cost-recovery mechanisms and reclassified out of income to a regulatory asset, as appropriate.commodity | | — | | | (9) | |
| Total | | $ | — | | | $ | (1) | |
| | | | | | | | | | | | | | | | | | | | | | | |
| | Pre-Tax (Gains) Losses
Reclassified into Income
During the Period from: | | Pre-Tax Gains (Losses) Recognized During the Period in Income | |
| (Millions of Dollars) | | Accumulated
Other
Comprehensive Loss | | Regulatory
Assets and (Liabilities) | | |
| Year Ended Dec. 31, 2021 | | | | | | | |
| Derivatives designated as cash flow hedges | | | |
| Interest rate | | $ | 8 | | (a) | $ | — | | | $ | — | | |
| Total | | $ | 8 | | | $ | — | | | $ | — | | |
| Other derivative instruments | | | |
| Commodity trading | | $ | — | | | $ | — | | | $ | 63 | | (b) |
| Electric commodity | | — | | | (23) | | (c) | — | | |
| Natural gas commodity | | — | | | 5 | | (d) | (22) | | (d) |
| Total | | $ | — | | | $ | (18) | | | $ | 41 | | |
| | | | | | | |
| Year Ended Dec. 31, 2020 | | | | | | | |
| Derivatives designated as cash flow hedges | | | |
| Interest rate | | $ | 7 | | (a) | $ | — | | | $ | — | | |
| Total | | $ | 7 | | | $ | — | | | $ | — | | |
| Other derivative instruments | | | |
| Commodity trading | | $ | — | | | $ | — | | | $ | (1) | | (b) |
| Electric commodity | | — | | | (3) | | (c) | — | | |
| Natural gas commodity | | — | | | 10 | | (d) | (13) | | (d) |
| Total | | $ | — | | | $ | 7 | | | $ | (14) | | |
| | | | | | | |
| Year Ended Dec. 31, 2019 | | | | | | | |
| Derivatives designated as cash flow hedges | | | |
| Interest rate | | $ | 4 | | (a) | $ | — | | | $ | — | | |
| Total | | $ | 4 | | | $ | — | | | $ | — | | |
| Other derivative instruments | | | |
| Commodity trading | | $ | — | | | $ | — | | | $ | 2 | | (b) |
| Electric commodity | | — | | | (5) | | (c) | — | | |
| Natural gas commodity | | — | | | 2 | | (d) | (7) | | (d) |
| Total | | $ | — | | | $ | (3) | | | $ | (5) | | |
(a)Recorded to interest charges.
(b)Recorded to electric operating revenues. Portions of these gains and losses are subject to sharing with electric customers through margin-sharing mechanisms and deducted from gross revenue, as appropriate.
(c)Recorded to electric fuel and purchased power. These derivative settlement gains and losses are shared with electric customers through fuel and purchased energy cost-recovery mechanisms and reclassified out of income as regulatory assets or liabilities, as appropriate.
(d)Settlement losses related to natural gas operations are recorded to cost of natural gas sold and transported. These losses are subject to cost-recovery mechanisms and reclassified out of income to a regulatory asset, as appropriate.
Xcel Energy had no derivative instruments designated as fair value hedges during the years ended Dec. 31, 2017, 20162021, 2020 and 2015. Therefore, no gains or losses from fair value hedges or related hedged transactions were recognized for these periods.2019.
Credit Related Contingent Features—Contract provisions for derivative instruments that the utility subsidiaries enter, including those accounted for as normal purchase-normalpurchase and normal sale contracts and therefore not reflected on the consolidated balance sheets, may require the posting of collateral or settlement of the contracts for various reasons, including if the applicable utility subsidiary’s credit ratings are downgraded below its investment grade credit rating by any of the major credit rating agencies or foragencies. As of Dec. 31, 2021 and 2020, there were $3 million and $4 million of derivative instruments in a liability position with such underlying contract provisions, respectively. Certain contracts also contain cross default contractual provisions that could result inmay require the posting of collateral or settlement of suchthe contracts if there was a failure under the other financing arrangements related to payment terms or other covenants.
As of Dec. 31, 20172021 and 2016,2020, there were noapproximately $64 million and $60 million of derivative instruments in a material liability position with such underlying contract provisions.
provisions, respectively.
Certain derivative instruments are also subject to contract provisions that contain adequate assurance clauses. These provisionsProvisions allow counterparties to seek performance assurance, including cash collateral, in the event that a given utility subsidiary’s ability to fulfill its contractual obligations is reasonably expected to be impaired. Xcel Energy had no collateral posted related to adequate assurance clauses in derivative contracts as of Dec. 31, 20172021 and 2016.2020.
Recurring Fair Value Measurements — The following table presents for each of the fair value hierarchy levels, Xcel Energy’s derivativeDerivative assets and liabilities measured at fair value on a recurring basis were as follows:
| | | | | | | | | | | | | | | | | | | | | | | | | | | | | | | | | | | | | | | | | | | | | | | | | | | | | | | | | | | | | | | | | | | | | | | | | | |
| | Dec. 31, 2021 | | Dec. 31, 2020 |
| | Fair Value | | Fair Value Total | | Netting (a) | | Total | | Fair Value | | Fair Value Total | | Netting (a) | | Total |
| (Millions of Dollars) | | Level 1 | | Level 2 | | Level 3 | | | | | Level 1 | | Level 2 | | Level 3 | | | |
| Current derivative assets | | | | | | | | | | | | | | | | | | | | | | | | |
| Other derivative instruments: | | | | | | | | | | | | | | | | | | | | | | | | |
| Commodity trading | | $ | 22 | | | $ | 137 | | | $ | 21 | | | $ | 180 | | | $ | (134) | | | $ | 46 | | | $ | 2 | | | $ | 67 | | | $ | 1 | | | $ | 70 | | | $ | (52) | | | $ | 18 | |
| Electric commodity | | — | | | — | | | 57 | | | 57 | | | (1) | | | 56 | | | — | | | — | | | 20 | | | 20 | | | (1) | | | 19 | |
| Natural gas commodity | | — | | | 18 | | | — | | | 18 | | | — | | | 18 | | | — | | | 9 | | | — | | | 9 | | | — | | | 9 | |
| Total current derivative assets | | $ | 22 | | | $ | 155 | | | $ | 78 | | | $ | 255 | | | $ | (135) | | | 120 | | | $ | 2 | | | $ | 76 | | | $ | 21 | | | $ | 99 | | | $ | (53) | | | 46 | |
PPAs (b) | | | | | | | | | | | | 3 | | | | | | | | | | | | | 3 | |
| Current derivative instruments | | | | | | | | | | | | $ | 123 | | | | | | | | | | | | | $ | 49 | |
| Noncurrent derivative assets | | | | | | | | | | | | | | | | | | | | | | | | |
| Other derivative instruments: | | | | | | | | | | | | | | | | | | | | | | | | |
| Commodity trading | | $ | 16 | | | $ | 63 | | | $ | 89 | | | $ | 168 | | | $ | (107) | | | $ | 61 | | | $ | 8 | | | $ | 66 | | | $ | 8 | | | $ | 82 | | | $ | (62) | | | $ | 20 | |
| Total noncurrent derivative assets | | $ | 16 | | | $ | 63 | | | $ | 89 | | | $ | 168 | | | $ | (107) | | | 61 | | | $ | 8 | | | $ | 66 | | | $ | 8 | | | $ | 82 | | | $ | (62) | | | 20 | |
PPAs (b) | | | | | | | | | | | | 6 | | | | | | | | | | | | | 10 | |
| Noncurrent derivative instruments | | | | | | | | | | | | $ | 67 | | | | | | | | | | | | | $ | 30 | |
| | | | | | | | | | | | | | | | | | | | | | | | | | | | | | | | | | | | | | | | | | | | | | | | | | | | | | | | | | | | | | | | | | | | | | | | | | |
| | Dec. 31, 2021 | | Dec. 31, 2020 |
| | Fair Value | | Fair Value Total | | Netting (a) | | Total | | Fair Value | | Fair Value Total | | Netting (a) | | Total |
| (Millions of Dollars) | | Level 1 | | Level 2 | | Level 3 | | | | | Level 1 | | Level 2 | | Level 3 | | | |
| Current derivative liabilities | | | | | | | | | | | | | | | | | | | | | | | | |
| | | | | | | | | | | | | | | | | | | | | | | | |
| | | | | | | | | | | | | | | | | | | | | | | | |
| Other derivative instruments: | | | | | | | | | | | | | | | | | | | | | | | | |
| Commodity trading | | $ | 19 | | | $ | 148 | | | $ | 20 | | | $ | 187 | | | $ | (143) | | | $ | 44 | | | $ | 4 | | | $ | 64 | | | $ | 17 | | | $ | 85 | | | $ | (58) | | | $ | 27 | |
| Electric commodity | | — | | | — | | | 1 | | | 1 | | | (1) | | | — | | | — | | | — | | | 1 | | | 1 | | | (1) | | | — | |
| Natural gas commodity | | — | | | 8 | | | — | | | 8 | | | — | | | 8 | | | — | | | 9 | | | — | | | 9 | | | — | | | 9 | |
| Total current derivative liabilities | | $ | 19 | | | $ | 156 | | | $ | 21 | | | $ | 196 | | | $ | (144) | | | 52 | | | $ | 4 | | | $ | 73 | | | $ | 18 | | | $ | 95 | | | $ | (59) | | | 36 | |
PPAs (b) | | | | | | | | | | | | 17 | | | | | | | | | | | | | 17 | |
| Current derivative instruments | | | | | | | | | | | | $ | 69 | | | | | | | | | | | | | $ | 53 | |
| Noncurrent derivative liabilities | | | | | | | | | | | | | | | | | | | | | | | | |
| Other derivative instruments: | | | | | | | | | | | | | | | | | | | | | | | | |
| Commodity trading | | $ | 18 | | | $ | 48 | | | $ | 127 | | | $ | 193 | | | $ | (128) | | | $ | 65 | | | $ | 3 | | | $ | 58 | | | $ | 60 | | | $ | 121 | | | $ | (47) | | | $ | 74 | |
| Total noncurrent derivative liabilities | | $ | 18 | | | $ | 48 | | | $ | 127 | | | $ | 193 | | | $ | (128) | | | 65 | | | $ | 3 | | | $ | 58 | | | $ | 60 | | | $ | 121 | | | $ | (47) | | | 74 | |
PPAs (b) | | | | | | | | | | | | 40 | | | | | | | | | | | | | 57 | |
| Noncurrent derivative instruments | | | | | | | | | | | | $ | 105 | | | | | | | | | | | | | $ | 131 | |
(a)Xcel Energy nets derivative instruments and related collateral on its consolidated balance sheets when supported by a legally enforceable master netting agreement and all derivative instruments and related collateral amounts were subject to master netting agreements as of Dec. 31, 2017:
|
| | | | | | | | | | | | | | | | | | | | | | | | |
| | | Dec. 31, 2017 |
| | | Fair Value | | Fair Value Total | | Counterparty Netting (b) | | |
| (Millions of Dollars) | | Level 1 | | Level 2 | | Level 3 | | | | Total |
| Current derivative assets | | | | | | | | | | | | |
| Commodity trading | | $ | 2 |
| | $ | 22 |
| | $ | — |
| | $ | 24 |
| | $ | (15 | ) | | $ | 9 |
|
| Electric commodity | | — |
| | — |
| | 32 |
| | 32 |
| | (2 | ) | | 30 |
|
| Total current derivative assets | | $ | 2 |
| | $ | 22 |
| | $ | 32 |
| | $ | 56 |
| | $ | (17 | ) | | 39 |
|
PPAs (a) | | | | | | | | | | | | 5 |
|
| Current derivative instruments | | | | | | | | | | | | $ | 44 |
|
| Noncurrent derivative assets | | | | | | | | | | | | |
| Other derivative instruments: | | | | | | | | | | | | |
| Commodity trading | | $ | — |
| | $ | 31 |
| | $ | 5 |
| | $ | 36 |
| | $ | (7 | ) | | $ | 29 |
|
| Total noncurrent derivative assets | | $ | — |
| | $ | 31 |
| | $ | 5 |
| | $ | 36 |
| | $ | (7 | ) | | 29 |
|
PPAs (a) | | | | | | | | | | | | 19 |
|
| Noncurrent derivative instruments | | | | | | | | | | | | $ | 48 |
|
|
| | | | | | | | | | | | | | | | | | | | | | | | |
| | | Dec. 31, 2017 |
| | | Fair Value | | Fair Value Total | | Counterparty Netting (b) | | |
| (Millions of Dollars) | | Level 1 | | Level 2 | | Level 3 | | | | Total |
| Current derivative liabilities | | | | | | | | | | | | |
| Other derivative instruments: | | | | | | | | | | | | |
| Commodity trading | | $ | 2 |
| | $ | 18 |
| | $ | — |
| | $ | 20 |
| | $ | (15 | ) | | $ | 5 |
|
| Electric commodity | | — |
| | — |
| | 2 |
| | 2 |
| | (2 | ) | | — |
|
| Natural gas commodity | | — |
| | 1 |
| | — |
| | 1 |
| | — |
| | 1 |
|
| Total current derivative liabilities | | $ | 2 |
| | $ | 19 |
| | $ | 2 |
| | $ | 23 |
| | $ | (17 | ) | | 6 |
|
PPAs (a) | | | | | | | | | | | | 23 |
|
| Current derivative instruments | | | | | | | | | | | | $ | 29 |
|
| Noncurrent derivative liabilities | | | | | | | | | | | | |
| Other derivative instruments: | | | | | | | | | | | | |
| Commodity trading | | $ | — |
| | $ | 24 |
| | $ | — |
| | $ | 24 |
| | $ | (10 | ) | | $ | 14 |
|
| Total noncurrent derivative liabilities | | $ | — |
| | $ | 24 |
| | $ | — |
| | $ | 24 |
| | $ | (10 | ) | | 14 |
|
PPAs (a) | | | | | | | | | | | | 112 |
|
| Noncurrent derivative instruments | | | | | | | | | | | | $ | 126 |
|
| |
(a)
| During 2006, Xcel Energy qualified these contracts under the normal purchase exception. Based on this qualification, the contracts are no longer adjusted to fair value and the previous carrying value of these contracts will be amortized over the remaining contract lives along with the offsetting regulatory assets and liabilities. |
| |
(b)
| Xcel Energy nets derivative instruments and related collateral in its consolidated balance sheet when supported by a legally enforceable master netting agreement, and all derivative instruments and related collateral amounts were subject to master netting agreements as of Dec. 31, 2017. At Dec. 31, 2017, derivative assets and liabilities include no obligations to return cash collateral and rights to reclaim cash collateral of $3 million. The counterparty netting amounts presented exclude settlement receivables and payables and non-derivative amounts that may be subject to the same master netting agreements. |
The following table presents for each of the fair value hierarchy levels, Xcel Energy’s2021 and 2020. At Dec. 31, 2021, derivative assets and liabilities measured atinclude 0 obligations to return cash collateral. At Dec. 31, 2020, derivative assets and liabilities include $15 million of obligations to return cash collateral. At Dec. 31, 2021 and 2020, derivative assets and liabilities include rights to reclaim cash collateral of $30 million and $6 million, respectively. Counterparty netting amounts presented exclude settlement receivables and payables and non-derivative amounts that may be subject to the same master netting agreements.
(b)During 2006, Xcel Energy qualified these contracts under the normal purchase exception. Based on this qualification, contracts are no longer adjusted to fair value on a recurring basis asand the previous carrying value of Dec. 31, 2016:these contracts is being amortized over the remaining contract lives along with the offsetting regulatory assets and liabilities.
|
| | | | | | | | | | | | | | | | | | | | | | | | |
| | | Dec. 31, 2016 |
| | | Fair Value | | Fair Value Total | | Counterparty Netting (b) | | |
| (Millions of Dollars) | | Level 1 | | Level 2 | | Level 3 | | | | Total |
| Current derivative assets | | | | | | | | | | | | |
| Other derivative instruments: | | | | | | | | | | | | |
| Commodity trading | | $ | 13 |
| | $ | 14 |
| | $ | — |
| | $ | 27 |
| | $ | (20 | ) | | $ | 7 |
|
| Electric commodity | | — |
| | — |
| | 19 |
| | 19 |
| | (2 | ) | | 17 |
|
| Natural gas commodity | | — |
| | 9 |
| | — |
| | 9 |
| | — |
| | 9 |
|
| Total current derivative assets | $ | 13 |
| | $ | 23 |
| | $ | 19 |
| | $ | 55 |
| | $ | (22 | ) | | 33 |
|
PPAs (a) | | | | | | | | | | | | 5 |
|
| Current derivative instruments | | | | | | | | | | | | $ | 38 |
|
| Noncurrent derivative assets | | | | | | | | | | | | |
| Other derivative instruments: | | | | | | | | | | | | |
| Commodity trading | | $ | — |
| | $ | 31 |
| | $ | — |
| | $ | 31 |
| | $ | (7 | ) | | $ | 24 |
|
| Natural gas commodity | | — |
| | 2 |
| | — |
| | 2 |
| | — |
| | 2 |
|
| Total noncurrent derivative assets | $ | — |
| | $ | 33 |
| | $ | — |
| | $ | 33 |
| | $ | (7 | ) | | 26 |
|
PPAs (a) | | | | | | | | | | | | 24 |
|
| Noncurrent derivative instruments | | | | | | | | | | | | $ | 50 |
|
|
| | | | | | | | | | | | | | | | | | | | | | | | |
| | | Dec. 31, 2016 |
| | | Fair Value | | Fair Value Total | | Counterparty Netting (b) | | |
| (Millions of Dollars) | | Level 1 | | Level 2 | | Level 3 | | | | Total |
| Current derivative liabilities | | | | | | | | | | | | |
| Other derivative instruments: | | | | | | | | | | | | |
| Commodity trading | | $ | 14 |
| | $ | 11 |
| | $ | — |
| | $ | 25 |
| | $ | (21 | ) | | $ | 4 |
|
| Electric commodity | | — |
| | — |
| | 2 |
| | 2 |
| | (2 | ) | | — |
|
| Total current derivative liabilities | | $ | 14 |
| | $ | 11 |
| | $ | 2 |
| | $ | 27 |
| | $ | (23 | ) | | 4 |
|
PPAs (a) | | | | | | | | | | | | 23 |
|
| Current derivative instruments | | | | | | | | | | | | $ | 27 |
|
| Noncurrent derivative liabilities | | | | | | | | | | | | |
| Other derivative instruments: | | | | | | | | | | | | |
| Commodity trading | | $ | — |
| | $ | 24 |
| | $ | — |
| | $ | 24 |
| | $ | (11 | ) | | $ | 13 |
|
| Total noncurrent derivative liabilities | | $ | — |
| | $ | 24 |
| | $ | — |
| | $ | 24 |
| | $ | (11 | ) | | 13 |
|
PPAs (a) | | | | | | | | | | | | 135 |
|
| Noncurrent derivative instruments | | | | | | | | | | | | $ | 148 |
|
69
| |
(a)
| During 2006, Xcel Energy qualified these contracts under the normal purchase exception. Based on this qualification, the contracts are no longer adjusted to fair value and the previous carrying value of these contracts will be amortized over the remaining contract lives along with the offsetting regulatory assets and liabilities. |
| |
(b)
| Xcel Energy nets derivative instruments and related collateral in its consolidated balance sheet when supported by a legally enforceable master netting agreement, and all derivative instruments and related collateral amounts were subject to master netting agreements as of Dec. 31, 2016. At Dec. 31, 2016, derivative assets and liabilities include no obligations to return cash collateral and rights to reclaim cash collateral of $4 million. The counterparty netting amounts presented exclude settlement receivables and payables and non-derivative amounts that may be subject to the same master netting agreements. |
The following table presents the changesChanges in Level 3 commodity derivatives forderivatives:
| | | | | | | | | | | | | | | | | | | | |
| | Year Ended Dec. 31 |
| (Millions of Dollars) | | 2021 | | 2020 | | 2019 |
| Balance at Jan. 1 | | $ | (49) | | | $ | 4 | | | $ | 29 | |
| Purchases | | 65 | | | 51 | | | 44 | |
| Settlements | | (158) | | | (73) | | | (64) | |
| Net transactions recorded during the period: | | | | | | |
Gains (losses) recognized in earnings (a) | | 49 | | | (39) | | | (8) | |
| Net gains recognized as regulatory assets and liabilities | | 112 | | | 8 | | | 3 | |
| Balance at Dec. 31 | | $ | 19 | | | $ | (49) | | | $ | 4 | |
(a)Level 3 losses recognized in earnings are subject to offsetting gains of derivative instruments categorized as levels 1 and 2 in the years ended Dec. 31, 2017, 2016 and 2015:
|
| | | | | | | | | | | | |
| | | Year Ended Dec. 31 |
| (Millions of Dollars) | | 2017 | | 2016 | | 2015 |
| Balance at Jan. 1 | | $ | 17 |
| | $ | 18 |
| | $ | 56 |
|
| Purchases | | 82 |
| | 35 |
| | 64 |
|
| Settlements | | (97 | ) | | (89 | ) | | (70 | ) |
| Net transactions recorded during the period: | | | | | | |
Gains recognized in earnings (a) | | 5 |
| | — |
| | 2 |
|
| Net gains (losses) recognized as regulatory assets and liabilities | | 28 |
| | 53 |
| | (34 | ) |
| Balance at Dec. 31 | | $ | 35 |
| | $ | 17 |
| | $ | 18 |
|
| |
(a)
| These amounts relate to commodity derivatives held at the end of the period. |
income statement.
Xcel Energy recognizes transfers between levels as of the beginning of each period. There were no transfers of amounts between levels for derivative instruments for the years ended Dec. 31, 2017, 20162021, 2020 and 2015.2019.
Fair Value of Long-Term Debt
As of Dec. 31, 2017 and 2016, other financial instruments for which the carrying amount did not equal fair value were as follows:value:
| | | | | | | | | | | | | | | | | | | | | | | | | | |
| | 2021 | | 2020 |
| (Millions of Dollars) | | Carrying Amount | | Fair Value | | Carrying Amount | | Fair Value |
| Long-term debt, including current portion | | $ | 22,380 | | | $ | 25,232 | | | $ | 20,066 | | | $ | 24,412 | |
|
| | | | | | | | | | | | | | | | |
| | | 2017 | | 2016 |
| (Millions of Dollars) | | Carrying Amount | | Fair Value | | Carrying Amount | | Fair Value |
| Long-term debt, including current portion | | $ | 14,976 |
| | $ | 16,531 |
| | $ | 14,450 |
| | $ | 15,513 |
|
The fairFair value of Xcel Energy’s long-term debt is estimated based on recent trades and observable spreads from benchmark interest rates for similar securities. The fairFair value estimates are based on information available to management as of Dec. 31, 20172021 and 2016,2020, and given the observability of the inputs, to these estimates, the fair values presented for long-term debt have beenwere assigned aas Level 2.
| | |
| 11. Benefit Plans and Other Postretirement Benefits |
12. Rate MattersPension and Postretirement Health Care Benefits
Tax Reform — Regulatory Proceedings
The specific impacts of the TCJA on retail customer rates are subject to regulatory approval. Xcel Energy has several noncontributory, qualified, defined benefit pension plans that cover almost all employees. All newly hired or rehired employees participate under the Cash Balance formula, which is based on pay credits using a percentage of annual eligible pay and annual interest credits. The average annual interest crediting rates for these plans was 2.03, 1.89 and 2.82% in the process of quantifying the rate impacts of the TCJA2021, 2020, and addressing these impacts in its open and recently concluded proceedings focused on retail base rate impacts for its utility subsidiaries. In addition, several states have opened dockets on the impact of tax reform, with the expectation that currently effective rates in those jurisdictions will be adjusted.
NSP-Minnesota — A docket has been opened in Minnesota. NSP-Minnesota will provide a detailed filing to the MPUC by March 2, 2018, which will estimate the impact of the TCJA on the latest electric and natural gas rate case filings and corporate forecasts.
Dockets have also been opened in North Dakota and South Dakota. In February 2018, NSP-Minnesota provided the NDPSC a preliminary quantification of the impact of the TCJA on electric and natural gas revenue requirements. NSP-Minnesota proposed multi-year moratoriums on electric and natural gas rate case filings. NSP-Minnesota also filed comments with the SDPUC and proposed using the reduced revenue requirements from the TCJA to defer planned future rate filings.
NSP-Wisconsin — In January 2018, the PSCW issued an order requiring public utilities to apply deferred accounting for the impacts of the TCJA. The PSCW has also requested that utilities provide responses to questions on tax reform and its impact on electric and natural gas revenue requirements. In February 2018, NSP-Wisconsin proposed levelizing upcoming rate cases, advancing infrastructure investments and buying down assets2019, respectively. Some employees may participate under legacy formulas such as the regulatorytraditional final average pay or pension equity. Xcel Energy’s policy is to fully fund into an external trust the actuarially determined pension costs subject to the limitations of applicable employee benefit and tax laws.
In addition to the qualified pension plans, Xcel Energy maintains a SERP and a nonqualified pension plan. The SERP is maintained for certain executives who participated in the plan in 2008, when the SERP was closed to new participants.
The nonqualified pension plan provides benefits for compensation that is in excess of the limits applicable to the qualified pension plans, with distributions funded by Xcel Energy’s consolidated operating cash flows.
Obligations of the SERP and nonqualified plan as of Dec. 31, 2021 and 2020 were $43 million and $43 million, respectively. Xcel Energy recognized net benefit cost for the SERP and nonqualified plans of $4 million in 2021 and $6 million in 2020.
Xcel Energy’s investment-return assumption considers the expected long-term performance for each of the asset classes in its pension and postretirement health care portfolio. Xcel Energy considers the historical returns achieved by its asset portfolios over long time periods, as well as long-term projected return levels.
Pension cost determination assumes a forecasted mix of investment types over the long-term.
•Investment returns in 2021 were above the assumed level of 6.49%.
•Investment returns in 2020 were above the assumed level of 6.87%.
•Investment returns in 2019 were above the assumed level of 6.87%.
•In 2022, expected investment-return assumption is 6.49%.
Pension plan and postretirement benefit assets are invested in a portfolio according to Xcel Energy’s return, liquidity and diversification objectives to provide a source of funding for Ashland clean-up.plan obligations and minimize contributions to the plan, within appropriate levels of risk. The principal mechanism for achieving these objectives is the asset allocation given the long-term risk, return, correlation and liquidity characteristics of each particular asset class.
There were no significant concentrations of risk in any industry, index, or entity. Market volatility can impact even well-diversified portfolios and significantly affect the return levels achieved by the assets in any year.
State agencies also have issued guidelines to the funding of postretirement benefit costs. SPS is required to fund postretirement benefit costs for Texas and New Mexico amounts collected in rates. PSCo — The impacts associatedis required to fund postretirement benefit costs in irrevocable external trusts that are dedicated to the payment of these postretirement benefits. These assets are invested in a manner consistent with the TCJAinvestment strategy for the pension plan.
Xcel Energy’s ongoing investment strategy is based on PSCO’s retail customerplan-specific investment recommendations that seek to minimize potential investment and interest rate risk as a plan’s funded status increases over time. The investment recommendations consider many factors and generally result in a greater percentage of long-duration fixed income securities being allocated to specific plans having relatively higher funded status ratios and a greater percentage of growth assets being allocated to plans having relatively lower funded status ratios.
Plan Assets
For each of the fair value hierarchy levels, Xcel Energy’s pension plan assets measured at fair value:
| | | | | | | | | | | | | | | | | | | | | | | | | | | | | | | | | | | | | | | | | | | | | | | | | | | | | | | | | | | | | | |
| | Dec. 31, 2021 (a) | | Dec. 31, 2020 (a) |
| (Millions of Dollars) | | Level 1 | | Level 2 | | Level 3 | | Measured at NAV | | Total | | Level 1 | | Level 2 | | Level 3 | | Measured at NAV | | Total |
| Cash equivalents | | $ | 133 | | | $ | — | | | $ | — | | | $ | — | | | $ | 133 | | | $ | 209 | | | $ | — | | | $ | — | | | $ | — | | | $ | 209 | |
| Commingled funds | | 1,324 | | | — | | | — | | | 1,143 | | | 2,467 | | | 1,462 | | | — | | | — | | | 1,115 | | | 2,577 | |
| Debt securities | | — | | | 959 | | | 5 | | | — | | | 964 | | | — | | | 714 | | | 4 | | | — | | | 718 | |
| Equity securities | | 67 | | | — | | | — | | | — | | | 67 | | | 77 | | | — | | | — | | | — | | | 77 | |
| Other | | — | | | 7 | | | — | | | 32 | | | 39 | | | 13 | | | 5 | | | — | | | — | | | 18 | |
| Total | | $ | 1,524 | | | $ | 966 | | | $ | 5 | | | $ | 1,175 | | | $ | 3,670 | | | $ | 1,761 | | | $ | 719 | | | $ | 4 | | | $ | 1,115 | | | $ | 3,599 | |
(a)See Note 10 for further information regarding fair value measurement inputs and methods.
For each of the fair value hierarchy levels, Xcel Energy’s postretirement benefit plan assets that were measured at fair value:
| | | | | | | | | | | | | | | | | | | | | | | | | | | | | | | | | | | | | | | | | | | | | | | | | | | | | | | | | | | | | | |
| | Dec. 31, 2021 (a) | | Dec. 31, 2020 (a) |
| (Millions of Dollars) | | Level 1 | | Level 2 | | Level 3 | | Measured at NAV | | Total | | Level 1 | | Level 2 | | Level 3 | | Measured at NAV | | Total |
| Cash equivalents | | $ | 28 | | | $ | — | | | $ | — | | | $ | — | | | $ | 28 | | | $ | 27 | | | $ | — | | | $ | — | | | $ | — | | | $ | 27 | |
| Insurance contracts | | — | | | 52 | | | — | | | — | | | 52 | | | — | | | 50 | | | — | | | — | | | 50 | |
| Commingled funds | | 64 | | | — | | | — | | | 77 | | | 141 | | | 72 | | | — | | | — | | | 69 | | | 141 | |
| Debt securities | | — | | | 218 | | | 1 | | | — | | | 219 | | | — | | | 232 | | | — | | | — | | | 232 | |
| Other | | — | | | 2 | | | — | | | — | | | 2 | | | — | | | 2 | | | — | | | — | | | 2 | |
| Total | | $ | 92 | | | $ | 272 | | | $ | 1 | | | $ | 77 | | | $ | 442 | | | $ | 99 | | | $ | 284 | | | $ | — | | | $ | 69 | | | $ | 452 | |
(a)See Note 10 for further information on fair value measurement inputs and methods.
NaN assets were transferred in or out of Level 3 for 2021 or 2020.
Funded Status — Benefit obligations for both pension and postretirement plans decreased from Dec. 31, 2020 to Dec. 31, 2021, due primarily to benefit payments and increases in discount rates used in actuarial valuations. Comparisons of the actuarially computed benefit obligation, changes in plan assets and funded status of the pension and postretirement health care plans for Xcel Energy are being addressedas follows:
| | | | | | | | | | | | | | | | | | | | | | | | | | |
| | Pension Benefits | | Postretirement Benefits |
| (Millions of Dollars) | | 2021 | | 2020 | | 2021 | | 2020 |
| Change in Benefit Obligation: | | | | | | | | |
| Obligation at Jan. 1 | | $ | 3,964 | | | $ | 3,701 | | | $ | 574 | | | $ | 547 | |
| Service cost | | 104 | | | 95 | | | 2 | | | 1 | |
| Interest cost | | 104 | | | 125 | | | 15 | | | 18 | |
| Plan amendments | | 5 | | | — | | | — | | | — | |
| Actuarial (gain) loss | | (94) | | | 328 | | | (41) | | | 50 | |
| Plan participants’ contributions | | — | | | — | | | 8 | | | 8 | |
| Medicare subsidy reimbursements | | — | | | — | | | 2 | | | 1 | |
Benefit payments (a) | | (365) | | | (285) | | | (49) | | | (51) | |
| Obligation at Dec. 31 | | $ | 3,718 | | | $ | 3,964 | | | $ | 511 | | | $ | 574 | |
| Change in Fair Value of Plan Assets: | | | | | | | | |
| Fair value of plan assets at Jan. 1 | | $ | 3,599 | | | $ | 3,184 | | | $ | 452 | | | $ | 449 | |
| Actual return on plan assets | | 305 | | | 550 | | | 16 | | | 35 | |
| Employer contributions | | 131 | | | 150 | | | 15 | | | 11 | |
| Plan participants’ contributions | | — | | | — | | | 8 | | | 8 | |
| Benefit payments | | (365) | | | (285) | | | (49) | | | (51) | |
| Fair value of plan assets at Dec. 31 | | $ | 3,670 | | | $ | 3,599 | | | $ | 442 | | | $ | 452 | |
| Funded status of plans at Dec. 31 | | $ | (48) | | | $ | (365) | | | $ | (69) | | | $ | (122) | |
| Amounts recognized in the Consolidated Balance Sheet at Dec. 31: | | | | | | | | |
| Noncurrent assets | | $ | 19 | | | $ | — | | | $ | 33 | | | $ | 6 | |
| Current liabilities | | — | | | — | | | (4) | | | (7) | |
| Noncurrent liabilities | | (67) | | | (365) | | | (98) | | | (121) | |
| Net amounts recognized | | $ | (48) | | | $ | (365) | | | $ | (69) | | | $ | (122) | |
(a)Includes approximately $197 million in several proceedings, which include2021 and $0 million in 2020 of lump-sum benefit payments used in the following:
determination of a settlement charge.
Colorado Statewide TCJA Proceeding— On Jan.71
| | | | | | | | | | | | | | | | | | | | | | | | | | |
| | Pension Benefits | | Postretirement Benefits |
| Significant Assumptions Used to Measure Benefit Obligations: | | 2021 | | 2020 | | 2021 | | 2020 |
| Discount rate for year-end valuation | | 3.08 | % | | 2.71 | % | | 3.09 | % | | 2.65 | % |
| Expected average long-term increase in compensation level | | 3.75 | | | 3.75 | | | N/A | | N/A |
| Mortality table | | PRI-2012 | | PRI-2012 | | PRI-2012 | | PRI-2012 |
| Health care costs trend rate — initial: Pre-65 | | N/A | | N/A | | 5.30 | % | | 5.50 | % |
| Health care costs trend rate — initial: Post-65 | | N/A | | N/A | | 4.90 | % | | 5.00 | % |
| Ultimate trend assumption — initial: Pre-65 | | N/A | | N/A | | 4.50 | % | | 4.50 | % |
| Ultimate trend assumption — initial: Post-65 | | N/A | | N/A | | 4.50 | % | | 4.50 | % |
| Years until ultimate trend is reached | | N/A | | N/A | | 4 | | 5 |
Accumulated benefit obligation for the pension plan was $3,469 million and $3,693 million as of Dec. 31, 2018,2021 and 2020, respectively.
Net Periodic Benefit Cost (Credit) —Net periodic benefit cost (credit), other than the CPUC openedservice cost component, is included in other income (expense) in the consolidated statements of income.
Components of net periodic benefit cost (credit) and amounts recognized in other comprehensive income and regulatory assets and liabilities:
| | | | | | | | | | | | | | | | | | | | | | | | | | | | | | | | | | | | | | |
| | Pension Benefits | | Postretirement Benefits |
| (Millions of Dollars) | | 2021 | | 2020 | | 2019 | | 2021 | | 2020 | | 2019 |
| Service cost | | $ | 104 | | | $ | 95 | | | $ | 86 | | | $ | 2 | | | $ | 1 | | | $ | 2 | |
| Interest cost | | 104 | | | 125 | | | 145 | | | 15 | | | 18 | | | 22 | |
| Expected return on plan assets | | (206) | | | (208) | | | (203) | | | (18) | | | (19) | | | (21) | |
| Amortization of prior service credit | | (1) | | | (4) | | | (5) | | | (8) | | | (8) | | | (10) | |
| Amortization of net loss | | 107 | | | 100 | | | 87 | | | 5 | | | 4 | | | 5 | |
Settlement charge (a) | | 59 | | | — | | | 6 | | | — | | | — | | | — | |
| Net periodic pension cost (credit) | | 167 | | | 108 | | | 116 | | | (4) | | | (4) | | | (2) | |
| Effects of regulation | | (46) | | | 9 | | | (1) | | | 2 | | | 3 | | | 1 | |
| Net benefit cost (credit) recognized for financial reporting | | $ | 121 | | | $ | 117 | | | $ | 115 | | | $ | (2) | | | $ | (1) | | | $ | (1) | |
| Significant Assumptions Used to Measure Costs: | | | | | | | | | | | | |
| Discount rate | | 2.71 | % | | 3.49 | % | | 4.31 | % | | 2.65 | % | | 3.47 | % | | 4.32 | % |
| Expected average long-term increase in compensation level | | 3.75 | | | 3.75 | | | 3.75 | | | — | | | — | | | — | |
| Expected average long-term rate of return on assets | | 6.49 | | | 6.87 | | | 6.87 | | | 4.10 | | | 4.50 | | | 4.50 | |
(a)A settlement charge is required when the amount of all lump-sum distributions during the year is greater than the sum of the service and interest cost components of the annual net periodic pension cost. In 2021 and 2019, as a statewide TCJA proceedingresult of lump-sum distributions during each plan year, Xcel Energy recorded a total pension settlement charge of $59 million and ordered deferred accounting for all investor-owned utilities. On Feb. 21, 2017, PSCo filed a response with$6 million, respectively, the CPUC relatedmajority of which was not recognized due to the deferred accounting ordereffects of regulation. A total of $7 million and statewide TCJA proceeding, addressing the estimated impacts along with other considerations given PSCo’s pending natural gas and electric rate cases.
Colorado 2017 Multi-Year Natural Gas Rate Case— On Feb. 14, 2018, the ALJ approved PSCo and CPUC Staff’s non-unanimous settlement agreement which addresses the impacts of the TCJA in 2018. This settlement agreement includes a $20$1 million reduction to provisional rates effective March 1, 2018, with future true-ups to be determined later in 2018 once a full analysis of the comprehensive impacts of tax reform is performed, including any outcomes associated with statewide proceeding. The final true-up would provide customers the full net benefit of the TCJA effective Jan. 1, 2018.
Colorado 2017 Multi-Year Electric Rate Case— On Feb. 16, 2018, the CPUC denied the proposed settlement agreement between PSCo and several intervenors, in favor of the state TCJA proceeding. In the second quarter of 2018, PSCo plans to file a revised rate request that will include the impacts of the TCJA. Provisional rates, subject to refund with interest, are expected to be effective June 1, 2018. The appropriate test year and the final approved revenue requirement will be determinedwas recorded in the pendingconsolidated statements of income in 2021 and 2019, respectively. There were 0 settlement charges recorded for the qualified pension plans in 2020.
| | | | | | | | | | | | | | | | | | | | | | | | | | |
| | Pension Benefits | | Postretirement Benefits |
| (Millions of Dollars) | | 2021 | | 2020 | | 2021 | | 2020 |
| Amounts Not Yet Recognized as Components of Net Periodic Benefit Cost: | | | | | | | | |
| Net loss | | $ | 978 | | | $ | 1,333 | | | $ | 81 | | | $ | 126 | |
| Prior service credit | | (9) | | | (11) | | | (7) | | | (15) | |
| Total | | $ | 969 | | | $ | 1,322 | | | $ | 74 | | | $ | 111 | |
| Amounts Not Yet Recognized as Components of Net Periodic Benefit Cost Have Been Recorded as Follows Based Upon Expected Recovery in Rates: | | | | | | | | |
| Current regulatory assets | | $ | 74 | | | $ | 82 | | | $ | — | | | $ | — | |
| Noncurrent regulatory assets | | 846 | | | 1,181 | | | 90 | | | 125 | |
| Current regulatory liabilities | | — | | | — | | | (1) | | | (1) | |
| Noncurrent regulatory liabilities | | — | | | — | | | (19) | | | (18) | |
| Deferred income taxes | | 13 | | | 15 | | | 1 | | | 1 | |
| Net-of-tax accumulated other comprehensive income | | 36 | | | 44 | | | 3 | | | 4 | |
| Total | | $ | 969 | | | $ | 1,322 | | | $ | 74 | | | $ | 111 | |
| | | | | | | | | | | | | | | | | | | | | | | | | | |
| Measurement date | | Dec. 31, 2021 | | Dec. 31, 2020 | | Dec. 31, 2021 | | Dec. 31, 2020 |
Cash Flows — Funding requirements can be impacted by changes to actuarial assumptions, actual asset levels and other calculations prescribed by the requirements of income tax and other pension-related regulations. Required contributions were made in 2019 - 2022 to meet minimum funding requirements.
Voluntary and required pension funding contributions:
•$50 million in January 2022.
•$131 million in 2021.
•$150 million in 2020.
•$154 million in 2019.
The postretirement health care plans have no funding requirements other than fulfilling benefit payment obligations when claims are presented and approved. Additional cash funding requirements are prescribed by certain state and federal rate case, discussed below. PSCo expectsregulatory authorities.
Voluntary postretirement funding contributions:
•Expects to defercontribute approximately $9 million during 2022.
•$15 million during 2021.
•$11 million during 2020.
•$15 million during 2019.
Targeted asset allocations:
| | | | | | | | | | | | | | | | | | | | | | | | | | |
| | Pension Benefits | | Postretirement Benefits |
| | 2021 | | 2020 | | 2021 | | 2020 |
| Domestic and international equity securities | | 33 | % | | 35 | % | | 15 | % | | 15 | % |
| Long-duration fixed income securities | | 37 | | | 35 | | | — | | | — | |
| Short-to-intermediate fixed income securities | | 11 | | | 13 | | | 71 | | | 72 | |
| Alternative investments | | 17 | | | 15 | | | 8 | | | 9 | |
| Cash | | 2 | | | 2 | | | 6 | | | 4 | |
| Total | | 100 | % | | 100 | % | | 100 | % | | 100 | % |
The asset allocations above reflect target allocations approved in the TCJA netcalendar year to take effect in the subsequent year.
Plan Amendments —
In 2019, the Pension Protection Act measurement concept was extended beyond 2019 for NSP bargaining terminations and retirements to Dec. 31, 2022.
There were 0 significant plan amendments made in 2020 which affected the postretirement benefit obligation.
In 2021, Xcel Energy amended the Xcel Energy Pension Plan and Xcel Energy Inc. Nonbargaining Pension Plan (South) to reduce supplemental benefits for non-bargaining participants as well as to allow the first five monthstransfer of 2018, prior to provisional rates.
The CPUC is expected to rule on the regulatory treatmenta portion of the TCJA, the natural gas rate case and the electric rate case later in 2018.
SPS — On Jan. 25, 2018, the PUCT issued an order requiring utilities to apply deferred accounting for the impacts of the TCJA. On Feb. 16, 2018, SPS provided the PUCT supplemental testimony on the impacts of the TCJA for its ongoing Texas 2017 electric rate case, including increasing its equity ratio to 58 percent to offset the negative impact of the TCJA on its credit metrics and potentially its credit ratings.
In February 2018, SPS provided the NMPRC a preliminary quantification of the impacts of the TCJA on its ongoing New Mexico 2017 electric rate case. SPS also recommended increasing its equity ratio to 58 percent to offset the negative impact of the TCJA on its credit metrics and potentially its credit ratings. In a separate NMPRC investigationnon-qualified pension obligations into the impacts of the TCJA on regulated utilitiesqualified plans.
Projected Benefit Payments
Xcel Energy’s projected benefit payments:
| | | | | | | | | | | | | | | | | | | | | | | | | | |
| (Millions of Dollars) | | Projected
Pension Benefit
Payments | | Gross Projected
Postretirement
Health Care
Benefit Payments | | Expected
Medicare Part D
Subsidies | | Net Projected
Postretirement
Health Care
Benefit Payments |
| 2022 | | $ | 323 | | | $ | 42 | | | $ | 2 | | | $ | 40 | |
| 2023 | | 257 | | | 41 | | | 2 | | | 39 | |
| 2024 | | 253 | | | 40 | | | 2 | | | 38 | |
| 2025 | | 251 | | | 38 | | | 2 | | | 36 | |
| 2026 | | 245 | | | 37 | | | 2 | | | 35 | |
| 2027-2031 | | 1,156 | | | 165 | | | 13 | | | 152 | |
Defined Contribution Plans
Xcel Energy maintains 401(k) and other defined contribution plans that cover most employees. Total expense to these plans was approximately $43 million in New Mexico, SPS provided additional information on the impacts of the TCJA on 2018 operations on Feb. 23, 2018.2021, $42 million in 2020 and $39 million in 2019.
FERC Formula Rates — The FERC has not yet issued guidance on how and when utilities should reflect the impacts of the TCJA in formula rates. However, FERC-approved formula rates for wholesale customers are generally adjusted on an annual basis for certain changes in rate base and actual operating expenses, including income taxes. As a result, these revenues would be subject to an automatic reduction for the effect of the TCJA tax rate change, absent specific FERC action.
Multiemployer Plans
NSP-Minnesota and NSP-Wisconsin each contribute to several union multiemployer pension and other postretirement benefit plans, none of which are individually significant. These plans provide pension and postretirement health care benefits to certain union employees who may perform services for multiple employers and do not participate in the NSP-Minnesota and NSP-Wisconsin sponsored pension and postretirement health care plans.
Contributing to these types of plans creates risk that differs from providing benefits under NSP-Minnesota and NSP-Wisconsin sponsored plans, in that if another participating employer ceases to contribute to a multiemployer plan, additional unfunded obligations may need to be funded over time by remaining participating employers.
| | |
| 12. Commitments and Contingencies |
Legal
Xcel Energy is involved in various litigation matters in the ordinary course of business. The assessment of whether a loss is probable or is a reasonable possibility, and whether the loss or a range of loss is estimable, often involves a series of complex judgments about future events. Management maintains accruals for losses probable of being incurred and subject to reasonable estimation. Management is sometimes unable to estimate an amount or range of a reasonably possible loss in certain situations, including but not limited to when (1) the damages sought are indeterminate, (2) the proceedings are in the early stages, or (3) the matters involve novel or unsettled legal theories.
In such cases, there is considerable uncertainty regarding the timing or ultimate resolution, including a possible eventual loss. For current proceedings not specifically reported herein, management does not anticipate that the ultimate liabilities, if any, would have a material effect on Xcel Energy’s consolidated financial statements. Legal fees are generally expensed as incurred.
Gas Trading Litigation —e prime is a wholly owned subsidiary of Xcel Energy. e prime was in the business of natural gas trading and marketing but has not engaged in natural gas trading or marketing activities since 2003. Multiple lawsuits involving multiple plaintiffs seeking monetary damages were commenced against e prime and its affiliates, including Xcel Energy, between 2003 and 2009 alleging fraud and anticompetitive activities in conspiring to restrain the trade of natural gas and manipulate natural gas prices. Cases were all consolidated in the U.S. District Court in Nevada.
NaN case remains active which includes a multi-district litigation matter consisting of a Wisconsin purported class (Arandell Corp.).
Arandell Corp. — The trial has been vacated and will be rescheduled after the court rules on the pending motions for reconsideration and for class certification. Xcel Energy has concluded that a loss is remote for the remaining lawsuit.
Breckenridge/Colorado — In February 2019, the MDL panel remanded Breckenridge back to the U.S. District Court in Colorado. Settlement of approximately $3 million was reached in February 2021. In July 2021, the settlement was approved.
Rate Matters and Other
Xcel Energy’s operating subsidiaries are involved in various regulatory proceedings arising in the ordinary course of business. Until resolution, typically in the form of a rate order, uncertainties may exist regarding the ultimate rate treatment for certain activities and transactions. Amounts have been recognized for probable and reasonably estimable losses that may result. Unless otherwise disclosed, any reasonably possible range of loss in excess of any recognized amount is not expected to have a material effect on the consolidated financial statements.
Minnesota Winter Storm Uri Costs — In its Minnesota jurisdiction, NSP-Minnesota is participating in a contested case regarding the prudency of incremental natural gas costs incurred during Winter Storm Uri. Other parties to a February 2018 FERC filing by MISOthe case have recommended significant cost disallowances, and MISO TOs proposing to early commence reductions to transmission formula rates in 2018 for tax rate impactswhile ultimate resolution of the TCJA. Alsomatter is uncertain, it is reasonably possible that the MPUC could disallow certain deferred costs, resulting in February 2018, PSCo made a filingearnings losses. The OAG recommended the MPUC deny recovery of up to $179 million, the largest recommendation among the intervenor positions.
NSP-Minnesota strongly disagrees with FERC similarly requesting early reductions in its transmission and production formula rates in 2018 for tax rate impactsthe recommendations of the TCJA. For SPS, as the TCJA tax rate change largely offsets a depreciation rate change that was effective Jan. 1, 2018 in its wholesale production rates, SPS has notified FERCDOC, OAG and CUB, and believes that it will continueacted prudently and according to charge rates establishedMPUC approved procedures for the best interest of its customers and stakeholders.
NSP-Minnesota filed rebuttal testimony in 2017, subject to refund. FERC has not issuedJanuary 2022 detailing its position that the disallowances recommended by other parties lack any orders on these matters, or commenced any formula rate proceedings related the impacts of the TCJA.
NSP-Minnesota
Pending and Recently Concluded Regulatory Proceedings — MPUC
Minnesota 2016 Multi-Year Electric Rate Case — In June 2017, the MPUC issued a written order approving an estimated total rate increase of approximately $240 million over the four-year period covering 2016-2019.
Key terms:
Four-year period covering 2016-2019;
Annual sales true-up with decoupling subject to a 3 percent cap on surcharges;
In February 2018, NSP-Minnesota reported the 2017 sales true-up and revenue decoupling surcharge amounts of $22 million and $27 million, respectively, to be collected beginning April 1, 2018 through March 31, 2019.
ROE of 9.2 percent and an equity ratio of 52.5 percent;
Nuclear related costs will not be considered provisional;
Continued use of all existing electric riders, however no new electric riders may be utilized during the four-year term;
Deferral of incremental 2016 property tax expense above a fixed threshold to 2018 and 2019;
Four-year stay out provision for rate cases;
Property tax true-up mechanism for 2017-2019; and
Capital expenditure true-up mechanism for 2016-2019.
|
| | | | | | | | | | | | | | | | | | | | |
| (Millions of Dollars, incremental) | | 2016 | | 2017 | | 2018 | | 2019 | | Total |
| Revenues | | $ | 75 |
| | $ | 55 |
| | $ | — |
| | $ | 50 |
| | $ | 180 |
|
| NSP-Minnesota’s sales true-up | | 60 |
| | — |
| | — |
| | — |
| | 60 |
|
| Total rate impact | | $ | 135 |
| | $ | 55 |
| | $ | — |
| | $ | 50 |
| | $ | 240 |
|
| | | | | | | | | | | |
Monticello Prudence Investigation — In 2013, NSP-Minnesota completed the Monticello LCM/EPU project. The multi-year project extended the life of the facility and increased the capacity from 600 to 671 MW in 2015. The Monticello LCM/EPU project expenditures were approximately $665 million. Total capitalized costs were approximately $748 million, which includes AFUDC. In 2008, project expenditures were initially estimated at approximately $320 million, excluding AFUDC.
In 2015, the MPUC voted to allow for full recovery, including a return, on $415 million of the total plant costs (inclusive of AFUDC), but only allow recovery of the remaining $333 million of costs with no return on this portion of the investment. As a result, Xcel Energy recorded a pre-tax loss of $129 millionmerit in the first quarter of 2015,prudency review given the pertinent facts regarding NSP-Minnesota’s actions before, during and after which the remaining book value of the Monticello project represented the present value of the estimated future cash flows.
2017 and 2018 TCR Filing — In November 2017, NSP-Minnesota submitted a TCR filing with the MPUC, requesting a combined recovery of approximately $110 million of transmission investment costs not included in electric base rates for 2017 and 2018. In accordance with NSP-Minnesota’s most recent electric rate case, three CapX2020 transmission projects currently included in the TCR rider remain in the rider through the multi-year plan period. NSP-Minnesota has also proposed recovery of one additional project related to grid modernization.storm event. An MPUC decision is expected in 2018.the summer of 2022.
Sherco — In 2018, NSP-Minnesota and Southern Minnesota Municipal Power Agency (Co-owner of Sherco Unit 3) reached a settlement with GE related to a 2011 incident, which damaged the turbine at Sherco Unit 3 and resulted in an extended outage for repair. NSP-Minnesota notified the MPUC of its proposal to refund settlement proceeds to customers through the FCA.
Electric, Purchased Gas and Resource Adjustment Clauses
CIP and CIP Rider — CIP expenses are recovered through base rates and a rider that is adjusted annually. The estimated electric and natural gas incentives for 2017 are expected to be $32 million and $3 million, respectively, based on the approved savings goals in NSP-Minnesota’s CIP Triennial Plan. The plan sets an annual electric goal of saving the equivalent of 1.5 percent of the volume of electric energy sales and an annual natural gas goal of saving 1.0 percent of the volume of gas energy sales. In 2017March 2019, the MPUC approved NSP-Minnesota’s settlement refund proposal. Additionally, the following for NSP-Minnesota:
The 2016 CIP electricMPUC decided to withhold any decision as to NSP-Minnesota’s prudence in connection with the incident at Sherco Unit 3 until after conclusion of an appeal pending between GE and natural gas financial incentives totaling $48 million and $6 million, respectively; and
The proposed 2017 electric and natural gas CIP riders with estimated 2017 recovery of $59 million of electric CIP expenses and $18 million of natural gas CIP expenses. The proposed recovery through the riders is in addition to an estimated $89 million and $4 million through electric and gas base rates, respectively.
GUIC Rider —NSP-Minnesota’s insurers. In February 2018,2020, the MPUC approvedMinnesota Court of Appeals affirmed the district court’s judgment in favor of GE. In March 2020, NSP-Minnesota’s insurers filed a 2017 revenue requirement ofpetition seeking additional review by the Minnesota Supreme Court.
In April 2020, the Minnesota Supreme Court denied the insurers’ petition for further review, ending the litigation.
In January 2021, the OAG and DOC recommended that NSP-Minnesota refund approximately $20 million for GUIC investments. New rates are expected to be in effect in March 2018. In November 2017, NSP-Minnesota filed the 2018 GUIC rider with the MPUC requesting recovery of approximately $28 million from Minnesota gas utility customers. Costs in both filings include funding for pipeline assessments as well as deferred costs from NSP-Minnesota’s existing sewer separation and pipeline integrity management programs. The MPUC is currently considering the 2018 petition.
Annual Automatic Adjustment of Fuel Clause Charges — In May 2017, the MPUC voted to disallow approximately $4$17 million of replacement energypower costs previously recovered through the FCA. NSP-Minnesota subsequently filed its response, asserting that it acted prudently in connection with the Sherco Unit 3 outage, the MPUC has previously disallowed $22 million of related costs and no additional refund or disallowance is appropriate. A final decision by the MPUC is pending. A loss related to this matter is deemed remote.
Westmoreland Arbitration —In November 2014, insurers of the Westmoreland Coal Company filed an arbitration demand against NSP-Minnesota, Southern Minnesota Municipal Power Agency and Western Fuels Association, seeking recovery of alleged $36 million of business losses due to a turbine failure at Sherco Unit 3. The Westmoreland insurers claim NSP-Minnesota’s invocation of the force majeure clause to stop the supply of coal was improper because the incident was allegedly caused by NSP-Minnesota’s failure to conform to industry maintenance standards.
NSP-Minnesota denies the claims asserted by the Westmoreland insurers and believes it properly stopped the supply of coal based upon the force majeure provision. A final hearing has been scheduled for October 2022. The parties are also required to participate in mediation, which has been scheduled for the PI nuclear facility outages allocated to the Minnesota jurisdiction in 2015. This disallowance was recognized in the secondfirst quarter of 2017. In December 2017, the MPUC issued an order to hold utilities responsible for incremental costs of replacement power incurred due to unplanned outages under certain circumstances. In January 2018, NSP-Minnesota filed a petition for clarification2022. At this stage of the order. The outcomeproceeding, a reasonable estimate of the petition is uncertain.damages or range of damages cannot be determined.
NSP-Wisconsin
Recently Concluded Regulatory Proceedings — PSCW
Wisconsin 2018 Electric and Gas Rate Case — In May 2017, NSP-Wisconsin filed a request with the PSCW to increase electric rates by $25 million, or 3.6 percent, and natural gas rates by $12 million, or 10.1 percent, effective Jan. 1, 2018. The rate filing was based on a 2018 FTY, a ROE of 10.0 percent, an equity ratio of 52.53 percent and a forecasted rate base of approximately $1.2 billion for the electric utility and $138 million for the natural gas utility.
In December 2017, the PSCW approved electric and natural gas rate increases of approximately $9 million, or 1.4 percent, and $10 million, or 8.3 percent, respectively, based on a 9.8 percent ROE and an equity ratio of 51.45 percent. New rates went into effect on Jan. 1, 2018.
PSCo
Pending Regulatory Proceedings — CPUC
Colorado 2017 Multi-Year Electric Rate Case — In October 2017, PSCo filed a multi-year request with the CPUC seeking to increase electric rates approximately $245 million over four years. The request, summarized below, is based on FTY ending Dec. 31, a 10.0 percent ROE and an equity ratio of 55.25 percent.
|
| | | | | | | | | | | | | | | | | | | | |
| Revenue Request (Millions of Dollars) | | 2018 | | 2019 | | 2020 | | 2021 | | Total |
| Revenue request | | $ | 74 |
| | $ | 75 |
| | $ | 60 |
| | $ | 36 |
| | $ | 245 |
|
CACJA revenue conversion to base rates (a) | | 90 |
| | — |
| | — |
| | — |
| | 90 |
|
TCA revenue conversion to base rates (a) | | 43 |
| | — |
| | — |
| | — |
| | 43 |
|
Total (b) | | $ | 207 |
| | $ | 75 |
| | $ | 60 |
| | $ | 36 |
| | $ | 378 |
|
| | | | | | | | | | | |
Expected year-end rate base (billions of dollars) (b) | | $ | 6.8 |
| | $ | 7.1 |
| | $ | 7.3 |
| | $ | 7.4 |
| | |
| |
(a)
| The roll-in of the TCA and CACJA rider revenues into base rates will not have an impact on customer bills or revenue as these costs are already being recovered through a rider. Transmission investments for 2019-2021 will be recovered through the TCA rider. |
| |
(b)
| This base rate request does not include the impacts of the RESA and ECA for the Rush Creek wind investments or the proposed CEP. |
Key dates in the procedural schedule are as follows:
Supplemental direct testimony — April 16, 2018;
Answer testimony — May 31, 2018;
Rebuttal and cross-answer testimony — July 10, 2018;
Hearings — Aug. 21 - 31, 2018; and
Statement of position — Sept. 28, 2018.
Interim rates, subject to refund and interest, are to be effective on June 1, 2018. PSCo also proposed a stay-out provision and earnings test through 2021. On Jan. 31, 2018, the CPUC ordered deferred accounting for the impacts of TCJA and opened a statewide TCJA proceeding, as discussed above. In the second quarter of 2018, PSCo plans to file a revised rate request that will include the impacts of the TCJA. The CPUC is expected to rule on the regulatory treatment of the TCJA and the electric rate case later in 2018.
Colorado 2017 Multi-Year Natural Gas Rate Case — In June 2017, PSCo filed a multi-year request with the CPUC seeking to increase retail natural gas rates approximately $139 million over three years. The request, detailed below, is based on FTYs, a 10.0 percent ROE and an equity ratio of 55.25 percent.
|
| | | | | | | | | | | | | | | | |
| Revenue Request (Millions of Dollars) | | 2018 | | 2019 | | 2020 | | Total |
| Revenue request | | $ | 63 |
| | $ | 33 |
| | $ | 43 |
| | $ | 139 |
|
PSIA revenue conversion to base rates (a) | | — |
| | 94 |
| | — |
| | 94 |
|
| Total | | $ | 63 |
| | $ | 127 |
| | $ | 43 |
| | $ | 233 |
|
| | | | | | | | | |
Expected year-end rate base (billions of dollars) (b) | | $ | 1.5 |
| | $ | 2.3 |
| | $ | 2.4 |
| | |
| |
(a)
| The roll-in of PSIA rider revenue into base rates will not have an impact on customer bills or revenue as these costs are already being recovered through the rider. The recovery of incremental PSIA related investments in 2019 and 2020 are included in the base rate request. |
| |
(b)
| The additional rate base in 2019 predominantly reflects the roll-in of capital associated with the PSIA rider. |
In October 2017, several parties filed answer testimony. The CPUC Staff (Staff) and the OCC, recommended a single 2016 HTY, based on an average 13-month rate base, and opposed a multi-year request. The Staff and OCC recommended an equity capital structure of 48.73 percent and 51.2 percent, respectively. Both the Staff and the OCC recommended the existing PSIA rider expire with the 2018 rates rolled into base rates beginning Jan. 1, 2019. Planned investments in 2019 and 2020 would be recoverable through base rates, subject to a future rate case. The final positions of the Staff and OCC provide for a recommended 2018 rate increase of approximately $30 million and $39 million, respectively.
In December 2017, hearings before an ALJ were held and the evidentiary record for the case was closed. Provisional rates, subject to refund, were implemented on Jan. 1, 2018. As discussed above, PSCo and the CPUC Staff filed a non-unanimous settlement agreement to address the impacts of the TCJA on rates to be effective in 2018, which was approved by the ALJ. On Jan. 31, 2018, the CPUC ordered deferred accounting for the impacts of TCJA and opened a statewide TCJA proceeding, as discussed above. The CPUC is expected to rule on the regulatory treatment of the TCJA and the natural gas rate case later in 2018.
Annual Electric Earnings Test — PSCo must share with customers earnings that exceed the authorized ROE of 9.83 percent for 2015 through 2017, as part of an annual earnings test. PSCo estimates the 2017 earnings test will not result in a customer refund obligation. PSCo will file its 2017 earnings test with the CPUC in April 2018. The final sharing obligation, if any, will be based on the CPUC approved tariff and could vary from the current estimate.
Electric, Purchased Gas and Resource Adjustment Clauses
DSM and the DSMCA riders — Energy efficiency and DSM costs are recovered through a combination of the DSMCA riders and base rates. DSMCA riders are adjusted biannually to capture program costs, performance incentives, and any over- or under-recoveries are trued-up in the following year. Performance incentives are awarded in the year following plan achievements. PSCo is able to earn $5 million upon reaching its annual savings goal along with an incentive on five percent of net economic benefits up to a maximum annual incentive of $30 million. In 2017, PSCo earned an electric and natural gas DSM incentive of $11 million and $3 million, respectively, for achieving its 2016 electric and natural gas savings goals. For 2018, the electric energy savings goal is 400 GWh with a spending limit of $84 million.
SPS
Pending and Recently Concluded Regulatory Proceedings — PUCT
Appeal of the Texas 2015 Electric Rate Case Decision — In 2014, SPS had requested an overall retail electric revenue rate increase of $42 million. In 2015, the PUCT approved an overall rate decrease of approximately $4 million, net of rate case expenses. In April 2016, SPS filed an appeal with the Texas State District Court (District Court) challenging the PUCT’s order that had denied SPS’ request for rehearing on certain items in SPS’ Texas 2015 electric rate case related to capital structure, incentive compensation and wholesale load reductions. In March 2017, the District Court denied SPS’ appeal. In April 2017, SPS appealed the District Court’s decision to the Court of Appeals. A decision is pending.
Texas 2017 Electric Rate Case — In 2017, SPS filed a $55 million, or 5.8 percent, retail electric, non-fuel base rate increase case in Texas with each of its Texas municipalities and the PUCT. The request was based on the 12-month period ended June 30, 2017, with the final three months based on estimates, a requested ROE of 10.25 percent, a Texas retail electric rate base of approximately $1.9 billion and an equity ratio of 53.97 percent.
The following table summarizes SPS’ rate increase request:
|
| | | | |
| Revenue Request (Millions of Dollars) | | |
| Incremental revenue request | | $ | 69 |
|
TCRF revenue conversion to base rates (a) | | (14 | ) |
| Net revenue increase request | | $ | 55 |
|
| |
(a)
| The roll-in of the TCRF rider revenue into base rates will not have an impact on customer bills or revenue as these costs are already being recovered through the rider. SPS can request another TCRF rider after the conclusion of this rate case to recover transmission investments subsequent to June 30, 2017. |
Key dates in the revised procedural schedule are as follows:
Intervenors’ direct testimony — April 25, 2018;
PUCT Staff direct testimony — May 2, 2018;
PUCT Staff and intervenors’ cross-rebuttal testimony — May 14, 2018;
SPS’ rebuttal testimony — May 23, 2018; and
Hearings — June 4 - 14, 2018.
The final rates are expected to be effective retroactive to Jan. 23, 2018 through a customer surcharge. A PUCT decision is expected in the fourth quarter of 2018. As discussed above, the PUCT has opened a docket on the impact of the TCJA, which may have a significant impact on this rate case. On Feb. 16, 2018, SPS provided additional information on the impacts of the TCJA.
Pending Regulatory Proceedings — NMPRC
Appeal of the New Mexico 2016 Electric Rate Case Dismissal — In November 2016, SPS filed an electric rate case with the NMPRC seeking an increase in base rates of approximately $41 million, representing a total revenue increase of approximately 10.9 percent. The rate filing was based on a requested ROE of 10.1 percent, an equity ratio of 53.97 percent, an electric rate base of approximately $832 million and a FTY ending June 30, 2018. In April 2017, the NMPRC dismissed SPS’ rate case. In May 2017, SPS filed a notice of appeal to the New Mexico Supreme Court. A decision is pending.
New Mexico 2017 Electric Rate Case — In October 2017, SPS filed an electric rate case with the NMPRC seeking an increase in retail electric base rates of approximately $43 million. The request is based on a HTY ended June 30, 2017, a ROE of 10.25 percent, an equity ratio of 53.97 percent and a jurisdictional rate base of approximately $885 million, including rate base additions through Nov. 30, 2017. This rate case also takes into account the decline in sales of 380 MW in 2017 from certain wholesale customers and seeks to adjust the life of SPS’ Tolk power plant (Unit 1 from 2042 to 2032 and Unit 2 from 2045 to 2032).
Key dates in the procedural schedule are as follows:
Staff and intervenor direct testimony — April 13, 2018;
SPS’ rebuttal testimony — May 2, 2018; and
Hearings — May 15 - 25, 2018.
SPS anticipates a decision and implementation of final rates in the second half of 2018. As discussed above, the NMPRC has opened a docket on the impact of the TCJA, which may have a significant impact on this rate case.
Pending Regulatory Proceedings — FERC
MISO ROE Complaints/ROE AdderComplaints — In November 2013 a group of customersand February 2015, customer groups filed a complaint at the FERCtwo ROE complaints against MISO TOs, includingwhich includes NSP-Minnesota and NSP-Wisconsin. The first complaint argued forrequested a reduction in thebase ROE in transmission formula rates infrom 12.38% to 9.15% for the MISO region from 12.38 percenttime period of Nov. 12, 2013 to 9.15 percent,Feb. 11, 2015, and the removal of ROE adders (including those for RTO membership), effective Nov. 12, 2013.
In December 2015, an ALJ recommended the FERC approve.The second complaint requested, for a subsequent time period, a base ROE of 10.32 percentreduction from 12.38% to 8.67%.
In September 2016, the FERC issued an order (Opinion No. 551) granting a 10.32% base ROE effective for the MISO TOs. The ALJ found the existing 12.38 percent ROE to be unjust and unreasonable. The recommended 10.32 percent ROE applied a FERC ROE policy adopted in a June 2014 order (Opinion 531). The FERC approved the ALJ recommended 10.32 percent base ROE in an order issued in September 2016. This ROE would be applicable forfirst complaint period of Nov. 12, 2013 to Feb. 11, 2015 and prospectively fromsubsequent to the date of the FERC order. The total prospective ROE would be 10.82 percent, including a 50 basis point adder for RTO membership. Various parties requested rehearing of the September 2016 order. The requests are pending FERC action.
In February 2015, a second complaint seeking to reduce the MISO ROE from 12.38 percent to 8.67 percent prior to any adder was filed with the FERC, resulting in a second period of potential refund from Feb. 12, 2015 to May 11, 2016. In June 2016, the ALJ recommended a ROE of 9.7 percent, applying the methodology adopted by the FERC in Opinion 531. In April 2017, the D.C.D.C Circuit subsequently vacated and remanded Opinion 531. It is unclear howNo. 551.
In November 2019, the D.C. Circuit’s opinion to vacateFERC issued an order (Opinion No. 569), which set the MISO base ROE at 9.88%, effective Sept. 28, 2016 and remand Opinion 531 will affectfor the September 2016first complaint period. The FERC order or the timing and outcome ofalso dismissed the second ROE complaint. In September 2017, certainDecember 2019, MISO TOs (not including NSP-Minnesota and NSP-Wisconsin) filed a motionrequest for rehearing regarding the new ROE methodology announced in Opinion No. 569. Customers also filed requests for rehearing claiming, among other points, that the FERC erred by dismissing the second complaint without refunds.
In May 2020, the FERC issued an order (Opinion No. 569-A) which granted rehearing in part to Opinion 569 and further refined the FERC’s ROE methodology, most significantly to incorporate the risk premium model (in addition to the discounted cash flow and capital asset pricing models), resulting in a new base ROE of 10.02%, effective Sept. 28, 2016 and for the first complaint period. The FERC also affirmed its decision in Opinion No. 569 to dismiss the second complaint.
In November 2020, the FERC issued an order (Opinion No. 569-B) in response to rehearing requests. The FERC corrected certain inputs to its ROE complaint. The motioncalculation model, did not change the ROE effective Sept. 28, 2016, and for the first MISO complaint period and upheld its decision to dismiss is pending FERC action.
As of Dec. 31, 2017, NSP-Minnesota has processed thedeny refunds for the Nov. 12, 2013 to Feb. 11, 2015second complaint period based on the 10.32 percent ROE. period. NSP-Minnesota has also recognized a current refund liability consistent with thefor its best estimate of the final refunds to customers. Each 10 basis point reduction in ROE for the Feb. 12, 2015first complaint period, second complaint period and subsequent period relative to May 11, 2016 complaint period.amounts accrued would reduce Xcel Energy’s net income by $1 million, $1 million and $2 million, respectively.
The MISO TOs and various parties have filed petitions for review of Opinion Nos. 569, 569-A and 569-B at the D.C. Circuit. Oral arguments were held in late 2021 and a decision is expected by the end of the third quarter of 2022.
SPP OATT Upgrade Costs — Under the SPP OATT, costsCosts of participant-funded, or “sponsored,” transmission upgrades may be recovered from other SPP customers whose transmission service depends on capacity enabled by the upgrade. Theupgrade under the SPP OATT has allowed SPP to charge for these upgrades since 2008, butOATT. SPP had not been charging its customers for these upgrades.upgrades, even though the SPP OATT had allowed SPP to do so since 2008. In 2016, the FERC granted SPP’s request to recover thethese previously unbilled charges not billed since 2008.and SPP subsequently billed SPS approximately $13 millionmillion.
In July 2018, SPS’ appeal to the D.C. Circuit over the FERC rulings granting SPP the right to recover previously unbilled charges was remanded to the FERC. In February 2019, the FERC reversed its 2016 decision and ordered SPP to refund charges retroactively collected from its transmission customers, including SPS, related to periods before September 2015.
In March 2020, SPP and Oklahoma Gas & Electric separately filed petitions for review of the FERC’s orders at the D.C. Circuit. In August 2021, the D.C Circuit issued a decision denying these charges. SPP is also billingappeals and upholding the FERC’s orders. Refunds received by SPS ongoing charges of approximately $0.5 million per month.are expected to be given back to SPS is currently seeking recoverycustomers through future rates. The timing of these SPP charges in its pending Texas and New Mexico base rate cases.
refunds is uncertain.
In October 2017, SPS filed a separate related complaint againstasserting SPP regarding the amounts billed asserting that SPP has assessed upgrade charges to SPS even where SPS’ transmission service was not dependent upon the upgrade as required byin violation of the SPP OATT. In March 2018, the FERC issued an order denying the SPS complaint. SPS filed a request for rehearing in April 2018. The FERC issued a tolling order granting a rehearing for further consideration in May 2018. If SPS’ complaint results in additional charges or refunds, SPS will seek to recover or refund the differentialamount through future SPS customer rates. In October 2020, SPS filed a petition for review of the FERC’s March 2018 order and May 2018 tolling order at the D.C. Circuit. FERC has asked that this appeal be stayed until early 2022, in future rate proceedings.order to provide FERC with time to issue an order on SPS’ April 2018 rehearing request. FERC’s order is expected in the first quarter of 2022. The D.C. Circuit appeal may resume after that FERC order is issued.
13.Wind Operating Commitments — PUCT and Contingencies
Commitments
Capital Commitments — Xcel Energy has made commitments in connection with a portion of its projected capital expenditures. Xcel Energy’s capital commitments primarily relateNMPRC orders related to the following major projects:
NSP-Minnesota Upper Midwest Wind Projects— NSP-Minnesota has gained approval to buildHale and own 1,150 MW of newSagamore wind generation in the Upper Midwest. NSP-Minnesota is also seeking approval from the MPUC to buildprojects included certain operating and own the Dakota Range project, a 300 MW wind project in South Dakota.
PSCo Advanced Grid Intelligence and Security Initiative — PSCo is pursuing projects to update and advance its electric distribution grid to increase reliability and security standards, meet customer expectations, offer additional customer choice and control over energy usage and implement new rate structures.
PSCo Rush Creek Wind Farm — PSCo has gained approval to build, own and operate a 600 MW wind generation facility and proposed transmission line in Colorado.
PSCo Gas Transmission Integrity Management Programs — PSCo is proactively identifying and addressing the safety and reliability of natural gas transmission pipelines. The pipeline integrity efforts include primarily pipeline assessment and maintenance projects.
PSCo Electric Distribution Integrity Management Programs — PSCo is assessing aging infrastructure for distribution assets and replacing worn components to increase system performance.
SPS Transmission NTC— SPS has accepted NTCs for several hundred miles of transmission line and related substation projects based on needs identified through SPP’s various planning processes, including those associated with economics, reliability, generator interconnection and the load addition processes. Most significant are the 345 KV transmission line from TUCO to Yoakum County to Hobbs Plant and the Hobbs Plant to China Draw 345 KV transmission lines.
SPS New Mexico and Texas Wind Projects — SPS is seeking approval from the NMPRC and the PUCT to build, own and operate 1,000 MW of new wind generation through the addition of two wind generation facilities in New Mexico and Texas.
Fuel Contracts — Xcel Energy has entered into various long-term commitments for the purchase and delivery of a significant portion of its current coal, nuclear fuel and natural gas requirements. These contracts expire in various years between 2018 and 2060. Xcel Energy is required to pay additional amounts depending on actual quantities shipped under these agreements.
The estimated minimum purchases for Xcel Energy under these contracts as of Dec. 31, 2017 are as follows:
|
| | | | | | | | | | | | | | | | |
| (Millions of Dollars) | | Coal | | Nuclear fuel | | Natural gas supply | | Natural gas storage and transportation |
| 2018 | | $ | 655 |
| | $ | 61 |
| | $ | 391 |
| | $ | 263 |
|
| 2019 | | 255 |
| | 118 |
| | 288 |
| | 251 |
|
| 2020 | | 146 |
| | 34 |
| | 277 |
| | 237 |
|
| 2021 | | 59 |
| | 85 |
| | 280 |
| | 227 |
|
| 2022 | | 59 |
| | 66 |
| | 127 |
| | 217 |
|
| Thereafter | | 186 |
| | 379 |
| | 57 |
| | 1,046 |
|
| Total | | $ | 1,360 |
| | $ | 743 |
| | $ | 1,420 |
| | $ | 2,241 |
|
Additional expenditures for fuel and natural gas storage and transportation will be required to meet expected future electric generation and natural gas needs. Xcel Energy’s risk of loss, in the form of increased costs from market price changes in fuel, is mitigated through the use of natural gas and energy cost-rate adjustment mechanisms, which provide for pass-through of most fuel, storage and transportation costs to customers.
PPAs— NSP Minnesota, PSCo and SPS have entered into PPAs with other utilities and energy suppliers with expiration dates through 2039 for purchased power to meet system load and energy requirements and meet operating reserve obligations.savings minimums. In general, these agreements provide for energy payments, based on actual energy delivered andannual generation must exceed a net capacity payments. Certain PPAs accounted for as executory contracts also contain minimum energy purchase commitments. Capacity and energy payments are typically contingent onfactor of 48%. If annual generation is below the IPPs meeting contract obligations, including plant availability requirements. Contractual payments are adjusted based on market indices. The effects of price adjustments on our financial results are mitigated through purchased energy cost recovery mechanisms.
Included in electric fuel and purchased power expenses for PPAs accounted for as executory contracts were payments for capacity of $168 million, $191 million and $231 million in 2017, 2016 and 2015, respectively. At Dec. 31, 2017, the estimated future payments for capacity and energy that the utility subsidiaries of Xcel Energy are obligated to purchase pursuant to these executory contracts, subject to availability, are as follows:
|
| | | | | | | | |
| (Millions of Dollars) | | Capacity | | Energy (a) |
| 2018 | | $ | 133 |
| | $ | 93 |
|
| 2019 | | 87 |
| | 99 |
|
| 2020 | | 68 |
| | 105 |
|
| 2021 | | 73 |
| | 140 |
|
| 2022 | | 77 |
| | 155 |
|
| Thereafter | | 205 |
| | 368 |
|
| Total | | $ | 643 |
| | $ | 960 |
|
| |
(a)
| Excludes contingent energy payments for renewable energy PPAs. |
Additional energy payments under these PPAs and PPAs accounted for as operating leases will be required to meet expected future electric demand.
Leases — Xcel Energy leases a variety of equipment and facilities. Three of these leases are accounted for as capital leases. The assets and liabilities at the inception of a capital lease are recorded at the lower of fair market value or the present value of future lease payments and are amortized over the term of the contract.
WYCO is a joint venture with CIG to develop and lease natural gas pipeline, storage, and compression facilities. Xcel Energy Inc. has a 50 percent ownership interest in WYCO. WYCO generally leases its facilities to CIG, and CIG operates the facilities, providing natural gas storage services to PSCo under separate service agreements.
PSCo accounts for its Totem natural gas storage service arrangement with CIG as a capital lease. As a result, PSCo had $124 million and $127 million of capital lease obligations as of Dec. 31, 2017 and 2016, respectively. Xcel Energy Inc. eliminates 50 percent of the capital lease obligation related to WYCO in the consolidated balance sheet along with an equal amount of Xcel Energy Inc.’s equity investment in WYCO.
PSCo records amortization for its capital leases as cost of natural gas sold and transported on the consolidated statements of income. Total amortization expenses under capital lease assets were approximately $5 million, $8 million and $8 million for 2017, 2016 and 2015, respectively. Following is a summary of property held under capital leases:
|
| | | | | | | | |
| (Millions of Dollars) | | Dec. 31, 2017 | | Dec. 31, 2016 |
| Gas storage facilities | | $ | 201 |
| | $ | 201 |
|
| Gas pipeline | | 21 |
| | 21 |
|
| Property held under capital leases | | 222 |
| | 222 |
|
| Accumulated depreciation | | (71 | ) | | (66 | ) |
| Total property held under capital leases, net | | $ | 151 |
| | $ | 156 |
|
The remainder of the leases, primarily for office space, railcars, generating facilities, natural gas pipeline transportation, vehicles, aircraft and power-operated equipment, are accounted for as operating leases. Total expenses under operating lease obligations for Xcel Energy were approximately $246 million, $255 million and $265 million for 2017, 2016 and 2015, respectively. These expenses include capacity payments for PPAs accounted for as operating leases of $210 million, $216 million and $224 million in 2017, 2016 and 2015, respectively, recorded to electric fuel and purchased power expenses.
Included in the future commitments under operating leases are estimated future capacity payments under PPAs that have been accounted for as operating leases in accordance with the applicable accounting guidance. Future commitments under operating and capital leases are:
|
| | | | | | | | | | | | | | | | | |
| (Millions of Dollars) | | Operating Leases | | PPA (a) (b) Operating Leases | | Total
Operating Leases | | Capital Leases | |
| 2018 | | $ | 25 |
| | $ | 213 |
| | $ | 238 |
| | $ | 15 |
| |
| 2019 | | 30 |
| | 230 |
| | 260 |
| | 14 |
| |
| 2020 | | 24 |
| | 244 |
| | 268 |
| | 14 |
| |
| 2021 | | 24 |
| | 246 |
| | 270 |
| | 14 |
| |
| 2022 | | 22 |
| | 235 |
| | 257 |
| | 12 |
| |
| Thereafter | | 148 |
| | 1,682 |
| | 1,830 |
| | 233 |
| |
| Total minimum obligation | | | | | | | | 302 |
| |
| Interest component of obligation | | | | | | | | (213 | ) | |
| Present value of minimum obligation | | | | | | | | $ | 89 |
| (c) |
| |
(a)
| Amounts do not include PPAs accounted for as executory contracts. |
| |
(b)
| PPA operating leases contractually expire through 2039. |
| |
(c)
| Future commitments exclude certain amounts related to Xcel Energy’s 50 percent ownership interest in WYCO. |
Variable Interest Entities— The accounting guidance for consolidation of VIEs requires enterprises to consider the activities that most significantly impact an entity’s financial performance, and power to direct those activities, when determining whether an enterprise is a VIE’s primary beneficiary.
PPAs— Under certain PPAs, NSP-Minnesota, PSCo andguaranteed level, SPS purchase power from IPPs for which the utility subsidiaries are required to reimburse natural gas or biomass fuel costs, or to participate in tolling arrangements under which the utility subsidiaries procure the natural gas required to produce the energy that they purchase. In addition, certain solar PPAs provide the utility subsidiaries with an option to purchase emission allowances or sharing provisions related to production credits generated by the solar facility under contract. These specific PPAs create a variable interest in the IPP.
Xcel Energy has determined that certain IPPs are VIEs. Xcel Energy is not subject to risk of loss from the operations of these entities, and no significant financial support has been, or is required to be provided other than contractual payments for energy and capacity set forth in the PPAs.
Xcel Energy has evaluated each of these VIEs for possible consolidation, including review of qualitative factors such as the length and terms of the contract, control over O&M, control over dispatch of electricity, historical and estimated future fuel and electricity prices, and financing activities. Xcel Energy has concluded that these entities are not required to be consolidated in its consolidated financial statements because it does not have the power to direct the activities that most significantly impact the entities’ economic performance. Xcel Energy’s utility subsidiaries had approximately 3,537 MW of capacity under long-term PPAs at both Dec. 31, 2017 and 2016 with entities that have been determined to be VIEs. These agreements have expiration dates through the year 2041.
Fuel Contracts — SPS purchases all of its coal requirements for its Harrington and Tolk electric generating stations from TUCO under contracts for those facilities that will expire in December 2022. TUCO arranges for the purchase, receiving, transporting, unloading, handling, crushing, weighing, and delivery of coal to meet SPS’ requirements. TUCO is responsible for negotiating and administering contracts with coal suppliers, transporters and handlers.
No significant financial support has been, or is required to be provided to TUCO by SPS, other than contractual payments for delivered coal. However, the fuel contracts create a variable interest in TUCO due to SPS’ reimbursement of certain fuel procurement costs. SPS has determined that TUCO is a VIE. SPS has concluded that it is not the primary beneficiary of TUCO because SPS does not have the power to direct the activities that most significantly impact TUCO’s economic performance.
Low-Income Housing Limited Partnerships — Eloigne and NSP-Wisconsin have entered into limited partnerships for the construction and operation of affordable rental housing developments which qualify for low-income housing tax credits. Xcel Energy Inc. has determined Eloigne and NSP-Wisconsin’s low-income housing limited partnerships to be VIEs primarily due to contractual arrangements within each limited partnership that establish sharing of ongoing voting control and profits and losses that does not consistently align with the partners’ proportional equity ownership. Xcel Energy Inc. has determined that Eloigne and NSP-Wisconsin have the power to direct the activities that most significantly impact these entities’ economic performance, and therefore Xcel Energy Inc. consolidates these limited partnerships in its consolidated financial statements.
Equity financing for these entities has been provided by Eloigne, NSP-Wisconsin and the general partner of each limited partnership. Xcel Energy’s risk of loss is limited to its capital contributions, adjusted for any distributions and its share of undistributed profits and losses; no significant additional financial support has been, or is required to be provided to the limited partnerships by Eloigne or NSP-Wisconsin. Obligations of the limited partnerships are generally secured by the housing properties of each limited partnership, and the creditors of each limited partnership have no significant recourse to Xcel Energy Inc. or its subsidiaries. Likewise, the assets of the limited partnerships may only be used to settle obligations of the limited partnerships, and not those of Xcel Energy Inc. or its subsidiaries.
Amounts reflected in Xcel Energy’s consolidated balance sheets for the Eloigne and NSP-Wisconsin low-income housing limited partnerships include the following:
|
| | | | | | | | |
| (Millions of Dollars) | | Dec. 31, 2017 | | Dec. 31, 2016 |
| Current assets | | $ | 6 |
| | $ | 7 |
|
| Property, plant and equipment, net | | 46 |
| | 50 |
|
| Other noncurrent assets | | 1 |
| | 1 |
|
| Total assets | | $ | 53 |
| | $ | 58 |
|
| | | | | |
| Current liabilities | | $ | 9 |
| | $ | 8 |
|
| Mortgages and other long-term debt payable | | 26 |
| | 30 |
|
| Other noncurrent liabilities | | 1 |
| | 1 |
|
| Total liabilities | | $ | 36 |
| | $ | 39 |
|
Technology Agreements — Xcel Energy has a contract that extends through December 2022 with International Business Machines Corp. (IBM) for information technology services. The contract is cancelable at Xcel Energy’s option, although Xcel Energy would be obligated to pay 50 percentrefund an amount equal to foregone PTCs and fuel savings. Additionally, retail customer savings must exceed project costs included in base rates over the first ten years of the contract value for early termination. Xcel Energy capitalized or expensed $98 million, $119 million and $109 million associated with the IBM contract in 2017, 2016 and 2015, respectively.
Xcel Energy’s contract with Accenture for information technology services extends through December 2020. The contract is cancelable at Xcel Energy’s option, although there are financial penalties for early termination. Xcel Energy capitalized or expensed $16 million, $35 million and $17 million associated with the Accenture contract in 2017, 2016 and 2015, respectively.
Committed minimum payments under these obligations are as follows:
|
| | | | | | | | |
| (Millions of Dollars) | | IBM Agreement | | Accenture Agreement |
| 2018 | | $ | 26 |
| | $ | 11 |
|
| 2019 | | 26 |
| | 11 |
|
| 2020 | | 8 |
| | 11 |
|
| 2021 | | 8 |
| | — |
|
| 2022 | | 3 |
| | — |
|
| Thereafter | | — |
| | — |
|
Guarantees and Indemnifications
Xcel Energy Inc. and its subsidiaries provide guarantees and bond indemnities under specified agreements or transactions, which guarantee payment or performance. Xcel Energy Inc.’s exposure is based upon the net liabilityoperations. SPS would be required to refund excess costs, if any, after ten years of the relevant subsidiary under the specified agreements or transactions. Most of the guarantees and bond indemnities issued by Xcel Energy Inc. and its subsidiaries limit the exposure to a maximum stated amount.operations. As of Dec. 31, 20172021, the full-year net capacity factor was 48.4%, resulting in no refund liability for 2021.
Contract Termination —SPS and 2016, Xcel Energy Inc.LP&L are parties to a 25-year, 170 MW partial requirements contract. In May 2021, SPS and its subsidiaries had no assets heldLP&L finalized a settlement which would terminate the contract upon LP&L’s move from the SPP to the Electric Reliability Council of Texas (expected in 2023). The settlement agreement requires LP&L to pay SPS $78 million (lump sum or annual installments), to the benefit of SPS’ remaining customers. LP&L would remain obligated to pay for SPP transmission charges associated with LP&L’s load in SPP. The settlement agreement is subject to approval by the PUCT and FERC.
Comanche Unit 3 Litigation — In February 2021, the joint owners of Comanche Unit 3 (CORE Electric Cooperative, formerly known as collateralIntermountain Rural Electrical Association, and Holy Cross Electric) served PSCo with a notice of claim related to Comanche Unit 3's operation and availability.
In September 2021, CORE Electric Cooperative filed a lawsuit in Colorado state court seeking an unspecified amount of damages. CORE Electric Cooperative alleges PSCo breached ownership agreement terms by failing to operate Comanche Unit 3 in accordance with prudent utility practices. PSCo filed a Motion to Dismiss several of CORE’s claims. In January 2022 the Court granted PSCo’s Motion to Dismiss CORE’s claim for damages for replacement power costs, claims for unjust enrichment and declaratory judgment. CORE’s claims for breach of contract, breach of the duty of good faith and fair dealing, and waste remain pending.
In November 2021, PSCo resolved all differences with Holy Cross Electric related to their guarantees, bond indemnities and indemnification agreements.claim.
Guarantees and Surety Bonds
The following table presents guarantees and bond indemnities issued and outstanding as of Dec. 31, 2017:
|
| | | | | | | | | | | | |
| (Millions of Dollars) | | Guarantor | | Guarantee Amount | | Current Exposure | | Triggering Event |
Guarantee of customer loans for the Farm Rewiring Program (a) | | NSP-Wisconsin | | $ | 1.0 |
| | $ | — |
| | (f) |
Guarantee of the indemnification obligations of Xcel Energy Services Inc. under the aircraft leases (b) | | Xcel Energy Inc. | | 12.0 |
| | — |
| | (g) |
Guarantee of residual value of assets under the Bank of Tokyo-Mitsubishi Capital Corporation Equipment Leasing Agreement (c) | | NSP-Minnesota | | 4.8 |
| | — |
| | (h) |
Guarantee of loan for Hiawatha Collegiate High School (d) | | Xcel Energy Inc. | | 1.0 |
| | — |
| | (g) |
| Total guarantees issued | | | | $ | 18.8 |
| | $ | — |
| | |
Guarantee performance and payment of surety bonds for Xcel Energy Inc.’s utility subsidiaries (e) | | Xcel Energy Inc. | | $ | 53.1 |
| | (j) | | (i) |
| |
(a)
| The term of this guarantee expires in 2020, which is the final scheduled repayment date for the loans. As of Dec. 31, 2017, no claims had been made by the lender. |
| |
(b)
| The terms of this guarantee expires in 2021 and 2023 when the associated leases expire. |
| |
(c)
| The term of this guarantee expires in 2019 when the associated lease expires. |
| |
(d)
| The term of this guarantee expires the earlier of 2024 or full repayment of the loan. |
| |
(e)
| The surety bonds primarily relate to workers compensation benefits and utility projects. The workers compensation bonds are renewed annually and the project based bonds expire in conjunction with the completion of the related projects. |
| |
(f)
| The debtor becomes the subject of bankruptcy or other insolvency proceedings. |
| |
(g)
| Nonperformance and/or nonpayment. |
| |
(h)
| Actual fair value of leased assets is less than the guaranteed residual value amount at the end of the lease term. |
| |
(i)
| Failure of any one of Xcel Energy Inc.’s utility subsidiaries to perform under the agreement that is the subject of the relevant bond. In addition, per the indemnity agreement between Xcel Energy Inc. and the various surety companies, the surety companies have the discretion to demand that collateral be posted. |
| |
(j)
| Due to the magnitude of projects associated with the surety bonds, the total current exposure of this indemnification cannot be determined. Xcel Energy Inc. believes the exposure to be significantly less than the total amount of the outstanding bonds. |
Indemnification Agreements
Xcel Energy Inc. and its subsidiaries provide indemnifications through contracts entered into in the normal course of business. These are primarily indemnifications against adverse litigation outcomes in connection with underwriting agreements, as well as breaches of representations and warranties, including corporate existence, transaction authorization and income tax matters with respect to assets sold. Xcel Energy Inc.’s and its subsidiaries’ obligations under these agreements may be limited in terms of duration and amount. The maximum future payments under these indemnifications cannot be reasonably estimated as the dollar amounts are often not explicitly stated.
Environmental Contingencies
Xcel Energy has been or is currently involved with the cleanup of contamination from certain hazardous substances at several sites. In many situations, the subsidiary involved believes it will recover some portion of these costs through insurance claims. Additionally, where applicable, the subsidiary involved is pursuing, or intends to pursue, recovery from other PRPs and through the regulated rate process. New and changing federal and state environmental mandates can also create added financial liabilities for Xcel Energy, which are normally recovered through the regulated rate process. To the extent any costs are not recovered through the options listed above, Xcel Energy would be required to recognize an expense.
Site Remediation—
Various federal and state environmental laws impose liability without regard to the legality of the original conduct, where hazardous substances or other regulated materials have been released to the environment. Xcel Energy Inc.’s subsidiaries may sometimes pay all or a portion of the cost to remediate sites where past activities of their predecessors or other parties have caused environmental contamination.
Environmental contingencies could arise from various situations, including sites of former MGPs operated by Xcel Energy Inc.’s subsidiaries or their predecessors, or other entities;MGPs; and third-party sites, such as landfills, for which one or more of Xcel Energy Inc.’s subsidiaries are alleged to be a PRP thathave sent wastes to that site.
Historical MGP, Landfill and Disposal Sites
Ashland MGP Site — NSP-Wisconsin was named a PRP for contamination at a site in Ashland, Wis. The Ashland/Northern States Power Lakefront Superfund Site (the Site) includes NSP-Wisconsin property, previously operated as a MGP facility (the Upper Bluff), and two other properties: an adjacent city lakeshore park area (Kreher Park); and an area of Lake Superior’s Chequamegon Bay adjoining the park.
In 2012, NSP-Wisconsin agreed to remediate the Phase I Project Area (which includes the Upper Bluff and Kreher Park areas of the Site), under a settlement agreement with the EPA. In January 2017, NSP-Wisconsin agreed to remediate the Phase II Project Area (the Sediments), under a settlement agreement with the EPA. The settlement agreements were approved by the U.S. District Court for the Western District of Wisconsin. NSP-Wisconsin initiated a full scale wet dredge remedy of the Sediments in 2017. Going forward, NSP-Wisconsin anticipates completion of restoration activities of the Sediments in 2018 with finalization of Phase I Project Area construction and restoration activities in 2019. Groundwater treatment activities at the Site will continue.
The current cost estimate for the entire site (both Phase I Project Area and the Sediments) is approximately $168 million, of which approximately $138 million has been spent. As of Dec. 31, 2017 and 2016, NSP-Wisconsin had recorded a total liability of $30 million and $64 million, respectively, for the entire site.
NSP-Wisconsin has deferred the unrecovered portion of the estimated Site remediation costs as a regulatory asset. The PSCW has authorized NSP-Wisconsin rate recovery for all remediation costs incurred at the Site. In 2012, the PSCW agreed to allow NSP-Wisconsin to pre-collect certain costs, to amortize costs over a ten-year period and to apply a three percent carrying cost to the unamortized regulatory asset. In December 2017, the PSCW approved an NSP-Wisconsin natural gas rate case, which included recovery of additional expenses associated with remediating the Site. The annual recovery of MGP clean-up costs will increase from $12 million in 2017 to $18 million in 2018.
Fargo, N.D. MGP Site — In May 2015, underground pipes, tars and impacted soils were discovered in a right-of-way in Fargo, N.D. that appeared to be associated with a former MGP operated by NSP-Minnesota or prior companies. NSP-Minnesota removed impacted soils and other materials and commenced an investigation of the historic MGP and adjacent properties (the Fargo MGP Site). The North Dakota Department of Health approved NSP-Minnesota’s proposed cleanup plan in January 2017, which involves targeted source removal of impacted soils and historic MGP infrastructure. It is anticipated that remediation activities will be performed in 2018. NSP-Minnesota has also initiated insurance recovery litigation in North Dakota. The U.S. District Court for the District of North Dakota agreed to the parties’ request for a stay of the litigation until May 31, 2018.
NSP-Minnesota had recorded an estimated liability of $16 million as of Dec. 31, 2017, and $11 million as of Dec. 31, 2016, for the Fargo MGP Site. The current cost estimate for the remediation of the site is approximately $23 million, of which approximately $7 million has been spent. NSP-Minnesota has deferred Fargo MGP Site costs allocable to the North Dakota jurisdiction, or approximately 88 percent of all remediation costs, as approved by the NDPSC. In December 2017, NSP-Minnesota filed a request with the MPUC to defer post-2017 expenditures allocable to the Minnesota jurisdiction.
Other MGP, Landfill or Disposal Sites—Xcel Energy is currently involved in investigating, and/remediating or remediating severalperforming post-closure actions at 16 historical MGP, landfill or other disposal sites. Xcel Energy has identified twelve sites across its service territories, in addition to theexcluding sites in Ashland and Fargo, where contamination is present and where investigation and/or remediation activities are currently underway. Other parties may have responsibility for some portion of the investigation and/or remediation activities that are underway. being addressed under current coal ash regulations (see below).
Xcel Energy anticipates that these investigation or remediation activities will continue through at least 2018. Xcel Energy had accrued $4 million ashas recognized its best estimate of Dec. 31, 2017 and $2 million as of Dec. 31, 2016 for allcosts/liabilities from final resolution of these sites. Thereissues; however, the outcome and timing are unknown. In addition, there may be insurance recovery and/or recovery from other PRPs that will offset anypotentially responsible parties, offsetting a portion of costs incurred. Xcel Energy anticipates that any amounts spent will be fully recovered from customers.
Environmental Requirements
—Water and Waste
Asbestos Removal — Some of Xcel Energy’s facilities contain asbestos. Most asbestos will remain undisturbed until the facilities that contain it are demolished or removed. Xcel Energy has recorded an estimate for final removal of the asbestos as an ARO. It may be necessary to remove some asbestos to perform maintenance or make improvements to other equipment. The cost of removing asbestos as part of other work is not expected to be material and is recorded as incurred as operating expenses for maintenance projects, capital expenditures for construction projects or removal costs for demolition projects.
Coal Ash Regulation—Xcel Energy’s operations are subject to federal and state lawsregulations that impose requirements for handling, storage, treatment and disposal of solid waste. In 2015, the EPA published a final rule regulating the management, storage, and disposal of coal combustion residuals (CCRs) as a nonhazardous waste (CCR Rule). Industry and environmental non-governmental organizations sought judicial review of the final CCR Rule, but a final decision has not been issued in that litigation. The EPA announced in late 2017 its intent to revise the CCR Rule. It is anticipated that the EPA will publish the revised rule in the first quarter of 2018.
Under the CCR Rule, utilities wereare required to complete groundwater sampling around their CCR landfills and surface impoundments and to analyze the results by early 2018 to determine if there were any statistically significant increases (SSIs) above background levels of certain constituents in the groundwater.impoundments. Currently, Xcel Energy has identified SSIs at several sites located8 regulated ash units in Colorado and one site in Minnesota. Going forward, operation.
Xcel Energy will either conduct additionalis conducting groundwater sampling to determine whether another source besides plant operationsand monitoring and implementing assessment of corrective measures at certain CCR landfills and surface impoundments. In NSP-Minnesota, no results above the groundwater protection standards in the rule were identified. In PSCo, increases above background concentrations were detected at 4 locations. Based on further assessments, PSCo is impacting groundwater and/or to determine ifevaluating options for corrective action at 2 locations, 1 of which indicates potential offsite impacts to groundwater. The total cost is needed. Severaluncertain, but could be up to $35 million. PSCo is continuing to assess the financial and regulatory impacts.
In August 2020, the EPA published its final rule to implement closure by April 2021 for all CCR impoundments affected by the August 2018 D.C. Circuit ruling. This final rule required Xcel Energy sites where SSIs were identified were already undergoing cessationto expedite closure plans for 2 impoundments.
In October 2020, NSP-Minnesota completed construction and placed in service a new impoundment to replace the clay lined impoundment. With the new ash pond in service, NSP-Minnesota has initiated closure activities for the existing ash pond at an estimated cost of coal operations$4 million. NSP-Minnesota has five years to complete closure activities.
PSCo also built an alternative collection and treatment system to remove the Comanche Station bottom ash pond from service. The total cost of the alternate treatment system is approximately $25 million. PSCo worked expeditiously to meet the April 11, 2021 deadline, but was not able to remove the pond from service until June 18, 2021. PSCo expects to negotiate a compliance order with the EPA addressing the closure deadline as well as other potential issues. PSCo will also now proceed with closure of the on-site coal units and therefore no further corrective action is expectedpond, at those sites.an estimated cost of $3 million.
Until a final decision is reachedClosure costs for existing impoundments are included in the litigation,calculation of the EPA publishes its revised rule, and Xcel Energy completes additional groundwater sampling, it is uncertain what impact, if any, there will be on the operations, financial position or cash flows of Xcel Energy. Xcel Energy believes that any associated costs would be recoverable through regulatory mechanisms.ARO.
Federal CWA Waters of the United StatesU.S. Rule —In 2015,Xcel Energy is monitoring ongoing changes to the EPA anddefinition of Waters of the U.S. Army Corps of Engineers (Corps) published a final rule that significantly expanded the types of water bodies regulated under the CWA and broadenedCWA. Regardless of which definition is applicable in the scope of waters subject to federal jurisdiction. In October 2015, the U.S. Court of Appeals for the Sixth Circuit issued a nationwide stay of the final rule and subsequently ruledstates in which we operate, Xcel Energy does not anticipate that it, rather than the federal district courts, had jurisdiction over challenges to the rule. In January 2017, the U.S. Supreme Court agreed to resolve the dispute as to which court should hear challenges to the rule. A ruling is expected in 2018.compliance costs will be material.
In February 2017, President Trump issued an executive order requiring the EPA and the Corps to review and revise the final rule. In June 2017, the agencies issued a proposed rule that rescinds the final rule and reinstates the prior definition of “Water of the U.S.” The agencies are also undertaking a rulemaking to develop a new definition of “Waters of the U.S.”
Federal CWA Effluent Limitations Guidelines (ELG) ELG — In 2015, the EPA issued a final ELG rule for power plants that use coal, natural gas, oil or nuclear materials as fuel and discharge treated effluent to surface waters as well as utility-owned landfills that receive coal combustion residuals.CCRs. In 2017,October 2020, the EPA delayedpublished a final rule revising the regulations.
The retirement of units affected by the final ELG rule is subject to regulatory approval. The exact total cost of ELG compliance date for flue gas desulfurization wastewater and bottom ash transport until November 2020 while the agency conducts a rulemaking process to potentially revise the effluent limitations and pretreatment standards for these waste streams.is therefore uncertain but Xcel Energy does not anticipate that compliance costs will be material.
Federal CWA Section 316(b) — The federal CWA requires the EPA to regulate cooling water intake structures to assure that these structures reflect the best technology available for minimizing adverse environmental impacts toimpingement and entrainment of aquatic species. The EPA published the final 316(b) rule in 2014. The rule prescribes technology for protecting fish that get stuck on plant intake screens (known as impingement) and describes a process for site-specific determinations by each state for sites that must protect the small aquatic organisms that pass through the intake screens into the plant cooling systems (known as entrainment). For Xcel Energy, these requirements will primarily impact plants at NSP-Minnesota. Xcel Energy estimates the likely future cost for complying with impingement and entrainment requirements mayis approximately $39 million, to be incurred between 20182022 and 2027 and is approximately $41 million with the majority needed for NSP-Minnesota.2028. Xcel Energy believes at least six6 NSP-Minnesota plants and two2 NSP-Wisconsin plants could be required by state regulators to make improvements to reduce impingement and entrainment. The exact total cost of the impingement and entrainment improvements is uncertain, but could be up to $192 million. Xcel Energy anticipates these costs will be fully recoverable in rates.through regulatory mechanisms.
Environmental Requirements — Air
Air
GHG Emission Standard for Existing Sources (CPP) — In 2015, the EPA issued its final CPP rule for existing power plants. Among other things, the CPP requires that state plans include enforceable measures to ensure emissions from existing power plants achieve the EPA’s state-specific interim and final emission performance targets.
The CPP was challenged by multiple parties in the D.C. Circuit Court. In February 2016, the U.S. Supreme Court issued an order staying the final CPP rule. The stay will remain in effect until the D.C. Circuit Court reaches its decision and the U.S. Supreme Court either declines to review the lower court’s decision or reaches a decision of its own.
In March 2017, President Trump signed an executive order requiring the EPA Administrator to review the CPP rule and if appropriate publish proposed rules suspending, revising or rescinding it. Accordingly, the EPA requested that the D.C. Circuit Court hold the litigation in abeyance until the EPA completes its work under the executive order. The D.C. Circuit granted the EPA’s request and is holding the litigation in abeyance, while considering briefs by the parties on whether the court should remand the challenges to the EPA rather than holding them in abeyance, determining whether and how the court continues or ends the stay that currently applies to the CPP.
In October 2017, the EPA published a proposed rule to repeal the CPP, based on an analysis that the CPP exceeds the EPA’s statutory authority under the CAA. In the proposal, the EPA stated it has not yet determined whether it will promulgate a new rule to regulate GHG emissions from existing EGUs. In December 2017, the EPA issued an Advanced Notice of Proposed Rulemaking to take and consider comments on whether to issue a future rule and what such a rule should include.
CSAPR — CSAPR addresses long range transport of PM and ozone by requiring reductions in SO2 and NOx from utilities in the eastern half of the United States using an emissions trading program. For Xcel Energy, the rule applies in Minnesota, Wisconsin and Texas.
CSAPR was adopted to address interstate emissions impacting downwind states’ attainment of the ozone and particulate NAAQS. As the EPA revises NAAQS, it will consider whether to make any further reductions to CSAPR emission budgets and whether to change which states are included in the emissions trading program.
In September 2017, the EPA adopted a final rule that withdraws Texas from the CSAPR particle program and determines that further emission reductions in Texas are not needed to address interstate particle transport. Texas is no longer subject to the annual SO2 and NOX emission budgets under CSAPR. In November 2017, the National Parks Conservation Association and Sierra Club appealed this rule to the D.C. Circuit Court. In January 2018, the Court granted SPS’ motion to intervene in support of the EPA’s final rule.
Regional Haze Rules — The regional haze program requires SO2, NOXnitrogen oxide and PMparticulate matter emission controls at power plants and other industrial facilities to reduce visibility impairment in national parks and wilderness areas. The program is divided into two parts:includes BART and reasonable further progress. The requirements of the first regional haze plansfirst planning period requirements developed by Minnesota and Colorado that apply to NSP-Minnesotawere approved by the EPA in 2012 and PSCo have been fully approvedimplemented by 2014 and implemented.2016, respectively. Texas’ first regional haze plan has undergone federal review as described below.review.
All states are now subject to a second round of regional haze planning/rulemaking, focusing on additional reductions to meet reasonable progress requirements. Any additional impacts to Xcel Energy facilities are expected to be minimal.
BART Determination for Texas:The EPA published a proposed BART rule for Texas in January 2017 that could have required installation of dry scrubbers to reduce SO2 emissions from Harrington Units 1 and 2. Investment costs associated with dry scrubbers for Harrington Units 1 and 2 could have been approximately $400 million. In October 2017, the EPAhas issued a revised final rule adopting a BART alternative Texas only SO2 trading program that applies to all Harrington and Tolk units. Under the trading program, SPS expects the allowance allocations to be sufficient for SO2 emissions from units in 2019 and future years. emissions. The anticipated costs of compliance are not expected to have a material impact on the results of operations, financial position or cash flows;impact; and SPS believes that compliance costs would be recoverable through regulatory mechanisms.
Several parties have challenged whether the final rule issued by the EPA should be considered to have met the requirements imposed in a Consent Decree entered by the United States District Court for the District of ColumbiaD.C. Circuit that established deadlines for the EPA to take final action on state regional haze plan submissions. The matter is now submitted tocourt has required status reports from the court.
parties while the EPA works on the reconsideration rulemaking.
In December 2017, the National Parks Conservation Association, Sierra Club, and Environmental Defense Fund appealed the EPA’s October 2017 final BART rule to the Fifth Circuit and filed a petition for administrative reconsideration ofreconsideration. The court has held the final rule withlitigation in abeyance while the EPA.EPA decided whether to reconsider the rule. In JanuaryAugust 2018, the court granted SPS’ motion to interveneEPA started a reconsideration rulemaking. The EPA reaffirmed the rule in August 2020 with minor changes.
The 2020 EPA Action has been challenged. All pending actions could be consolidated and may proceed in the Fifth Circuit litigation in supportor the D.C. Circuit, where a parallel challenge has been filed. The timing of the EPA’s final rule.decisions is unclear.
Reasonable Progress Rule: In January 2016, the EPA adopted a final rule establishing a federal implementation plan for reasonable further progress under the regional haze program for the state of Texas. The rule imposes SO2 emission limitations that would require the installation of dry scrubbers on Tolk Units 1 and 2, with2; compliance would have been required by February 2021. Investment costs associated with dry scrubbers could be approximately $600 million. SPS appealed the EPA’s decision and obtained a stay of the final rule.
In March 2017, the Fifth Circuit remanded the rule to the EPA for reconsideration, leaving the stay in effect. In a future rulemaking, the EPA will address whether SO2 emission reductions beyond those required in the BART alternative rule referenced above are needed at Tolk under the “reasonable progress” requirements ofrequirements. As states are now proceeding with the second regional haze program. The risk of these controls being imposed along withplanning period, the risk of investmentsEPA may choose not to provide additional cooling water to Tolk have caused SPS to seek to decrease the remaining depreciable life of the Tolk units. The EPA has not announced a schedule for actingact on the remanded rule.
Implementation of the NAAQS for SO2 — The EPA adopted a more stringent NAAQS for SO2 in 2010, and evaluated areas in three phases. In December 2017, the EPA adopted a final rule that completed its initial designations of areas attaining or not attaining the standard. The EPA’s final actions designatehas designated all areas near Xcel Energy’sSPS’ generating plants as meetingattaining the SO2 NAAQS with two exceptions. In June 2016, the1 exception. The EPA issued final designations, which found the areasarea near the SPS Harrington and PSCo Pawnee plantsplant as “unclassifiable.” The area near the Harrington plant iswas monitored for the three years ending in 2019 and the monitoring showed the area to be monitoredexceeding the standard.
To address this issue, SPS negotiated an order with the TCEQ providing for three yearsthe end of coal combustion and a final designation is expected to be made by December 2020. Since the 2016 “unclassifiable” designation, the Colorado Departmentconversion of Public Health and Environment has prepared and submitted air dispersion modeling to the EPA demonstrating that the area near the Pawnee plant meets the SO2 NAAQS. The EPA has not yet completed its evaluation of the Pawnee plant.
If the area near the Harrington plant is designated nonattainment in 2020, the Texas Commission on Environmental Quality (TCEQ) will need to develop an implementation plan, which would be duea natural gas fueled facility by 2022, designed to achieve the NAAQS byJan. 1, 2025. The TCEQ could require additional SO2 controls at Harrington as part of such a plan. Xcel Energy cannot evaluate the impacts until the final designation is made and any required state plans are developed.
Xcel Energy believes that should SO2 control systems be required or require upgrades for a plant, compliance costs or the costs of alternative cost-effective generation will be recoverable through regulatory mechanisms and therefore does not expect a material impact on results of operations, financial positioncondition or cash flows.
Revisions to the NAAQS for Ozone— In 2015, the EPA revised the NAAQS for ozone by lowering the eight-hour standard from 75 parts per billion (ppb) to 70 ppb. In November 2017, the EPA published final designations of areas that meet the 2015 ozone standard. Xcel Energy meets the 2015 ozone standard in all areas where its generating units operate, except for the Denver Metropolitan Area. PSCo’s scheduled retirement of coal fired plants in Denver that began in 2011 and was completed in August 2017, should help in any plan to mitigate non-attainment. The EPA has not yet taken final action on the designation, but notified the State of Colorado in December 2017 that it intends to designate the parts of the Denver Metropolitan Area that currently do not attain the 2008 ozone standards as also not attaining the more stringent 2015 ozone standard.
Asset Retirement Obligations
Recorded AROs — AROs have been recorded for property related to the following: electric production (nuclear, steam, wind, other and hydro), electric distribution and transmission, natural gas production, natural gas transmission and distribution, natural gas storage, thermal and general property. The electric production obligations include asbestos, processed water and ash-containment facilities, radiation sources, storage tanks, control panels and decommissioning. The asbestos recognition associated with electric production includes certain plants at NSP-Minnesota, NSP-Wisconsin, PSCo and SPS. AROs also have been recorded for NSP-Minnesota, NSP-Wisconsin, PSCo and SPS steam production related to processed water and ash-containment facilities such as ash ponds, evaporation ponds and solid waste landfills. NSP-Minnesota and PSCo have also recorded AROs for the retirement and removal of assets at certain wind production facilities for which the land is leased and removal is required by contract.
Xcel Energy has recognized AROs for the retirement costs of natural gas mains and lines at NSP-Minnesota, NSP-Wisconsin and PSCo and AROs for the retirement of above ground gas gathering equipment, impoundments at gas extraction sites and wells related to gas storage facilities at PSCo. In addition, an ARO was recognized for the removal of electric transmission and distribution equipment at NSP-Minnesota, NSP-Wisconsin, PSCo and SPS, which consists of obligations associated with polychlorinated biphenyl, mineral oil, lithium batteries, mercury and street lighting lamps. The common general AROs include obligations related to storage tanks, radiation sources and office buildings.
Energy’s assets. For the nuclear assets, the ARO is associated with the decommissioning of the NSP-Minnesota nuclear generating plants, Monticello and PI. See Note 14 for further discussionplants.
A reconciliation of Xcel Energy’s AROs for the years ended Dec. 31, 2017 and 2016 is as follows:
|
| | | | | | | | | | | | | | | | | | | | | | | | |
| (Millions of Dollars) | | Beginning
Balance Jan. 1, 2017 | | Liabilities Recognized | | Liabilities Settled (a) | | Accretion | | Cash Flow Revisions (b) | | Ending
Balance Dec. 31, 2017 |
| Electric plant | | | | | | | | | | | | |
| Nuclear production decommissioning | | $ | 2,249 |
| | $ | — |
| | $ | — |
| | $ | 114 |
| | $ | (489 | ) | | $ | 1,874 |
|
| Steam and other production ash containment | | 117 |
| | — |
| | (16 | ) | | 5 |
| | 9 |
| | 115 |
|
| Wind production | | 92 |
| | — |
| | — |
| | 4 |
| | — |
| | 96 |
|
| Steam, hydro and other production asbestos | | 88 |
| | 1 |
| | (13 | ) | | 4 |
| | (3 | ) | | 77 |
|
| Electric distribution | | 20 |
| | — |
| | — |
| | 1 |
| | — |
| | 21 |
|
| Other | | 5 |
| | — |
| | — |
| | — |
| | — |
| | 5 |
|
| Natural gas plant | | | | | | | | | | | | |
| Gas transmission and distribution | | 205 |
| | — |
| | — |
| | 8 |
| | 69 |
| | 282 |
|
| Other | | 4 |
| | — |
| | — |
| | — |
| | — |
| | 4 |
|
| Common and other property | | | | | | | | | | | | |
| Common general plant asbestos | | 1 |
| | — |
| | (1 | ) | | — |
| | — |
| | — |
|
| Common miscellaneous | | 1 |
| | — |
| | — |
| | — |
| | — |
| | 1 |
|
| Total liability | | $ | 2,782 |
| | $ | 1 |
| | $ | (30 | ) | | $ | 136 |
| | $ | (414 | ) | | $ | 2,475 |
|
| |
(a)
| The liabilities settled relate to asbestos abatement projects, the closure of certain ash containment facilities, and removal and proper disposal of storage tanks and other above ground equipment. |
| |
(b)
| In 2017, AROs were revised for changes in estimated cash flows and the timing of those cash flows. The nuclear decommissioning ARO decreased due to updated assumptions in the nuclear triennial filing. Changes in the gas transmission and distribution AROs were mainly related to increased labor costs. |
The aggregateAggregate fair value of NSP-Minnesota’s legally restricted assets, for purposes of funding future nuclear decommissioning was $2.1$3.3 billion and $2.8 billion for 2021 and 2020, respectively.
Xcel Energy’s AROs were as follows:
| | | | | | | | | | | | | | | | | | | | | | | | | | | | | | | | | | |
(Millions
of Dollars) | | Jan. 1, 2021 | | Amounts Incurred (a) | | | | Accretion | | Cash Flow Revisions (b) | | Dec. 31, 2021 (c) |
| Electric | | | | | | | | | | | | |
| Nuclear | | $ | 1,957 | | | $ | — | | | | | $ | 99 | | | $ | — | | | $ | 2,056 | |
| Wind | | 360 | | | 101 | | | | | 17 | | | — | | | 478 | |
| Steam, hydro and other production | | 264 | | | 6 | | | | | 10 | | | 8 | | | 288 | |
| Distribution | | 46 | | | — | | | | | 1 | | | — | | | 47 | |
| Natural gas | | | | | | | | | | | | |
| Transmission and distribution | | 252 | | | — | | | | | 10 | | | 9 | | | 271 | |
| Miscellaneous | | 3 | | | — | | | | | — | | | 5 | | | 8 | |
| Common | | | | | | | | | | | | |
| Miscellaneous | | 1 | | | — | | | | | — | | | — | | | 1 | |
| Non-utility | | | | | | | | | | | | |
| Miscellaneous | | 1 | | | — | | | | | 1 | | | — | | | 2 | |
| Total liability | | $ | 2,884 | | | $ | 107 | | | | | $ | 138 | | | $ | 22 | | | $ | 3,151 | |
(a)Amounts incurred related to the wind farms placed in service in 2021 for NSP-Minnesota (Blazing Star 2, Mower and Freeborn) and removal of Dec. 31, 2017, consistinga utility scale battery asset in NSP-Minnesota.
(b)In 2021, AROs were revised for changes in timing and estimates of external investment funds.cash flows. Revisions in steam, hydro and other production AROs were primarily related to changes in cost estimates for remediation of ash containment facilities. Changes in gas transmission and distribution AROs were primarily related to changes in labor rates coupled with increased gas line mileage and number of services.
(c)There were no ARO amounts settled in 2021.
| | | | | | | | | | | | | | | | | | | | | | | | | | | | | | | | | | | | | | |
(Millions
of Dollars) | | Jan. 1, 2020 | | Amounts Incurred (a) | | Amounts Settled (b) | | Accretion | | Cash Flow Revisions (c) | | Dec. 31, 2020 |
| Electric | | | | | | | | | | | | |
| Nuclear | | $ | 2,068 | | | $ | — | | | $ | — | | | $ | 105 | | | $ | (216) | | | $ | 1,957 | |
| Steam, hydro and other production | | 202 | | | — | | | (5) | | | 9 | | | 58 | | | 264 | |
| Wind | | 146 | | | 149 | | | (3) | | | 8 | | | 60 | | | 360 | |
| Distribution | | 44 | | | — | | | — | | | 2 | | | — | | | 46 | |
| Natural gas | | | | | | | | | | | | |
| Transmission and distribution | | 236 | | | — | | | — | | | 10 | | | 6 | | | 252 | |
| Miscellaneous | | 3 | | | — | | | — | | | — | | | — | | | 3 | |
| Common | | | | | | | | | | | | |
| Miscellaneous | | 1 | | | — | | | — | | | — | | | — | | | 1 | |
| Non-utility | | | | | | | | | | | | |
| Miscellaneous | | 1 | | | — | | | — | | | — | | | — | | | 1 | |
| Total liability | | $ | 2,701 | | | $ | 149 | | | $ | (8) | | | $ | 134 | | | $ | (92) | | | $ | 2,884 | |
(a)Amounts incurred related to the wind farms placed in service in 2020 for NSP-Minnesota (Blazing Star 1, Crowned Ridge 2, Jeffers and Community Wind North), PSCo (Cheyenne Ridge) and SPS (Sagamore).
(b)Amounts settled primarily related to closure of certain ash containment facilities, removal of wind facilities and asbestos abatement projects.
(c)In 2020, AROs were revised for changes in timing and estimates of cash flows. Revisions in the nuclear AROs were driven by reductions in spent fuel cooling time requirements in the nuclear triennial filing coupled with decreasing interest rates. Changes in wind AROs were driven by new dismantling studies. Revisions in steam, hydro and other production AROs were primarily related to changes in cost estimates for remediation of ash containment facilities.
|
| | | | | | | | | | | | | | | | | | | | | | | | |
| (Millions of Dollars) | | Beginning
Balance Jan. 1, 2016 | | Liabilities Recognized | | Liabilities Settled | | Accretion | | Cash Flow Revisions (b) | | Ending
Balance Dec. 31, 2016 |
| Electric plant | | | | | | | | | | | | |
| Nuclear production decommissioning | | $ | 2,141 |
| | $ | — |
| | $ | — |
| | $ | 108 |
| | $ | — |
| | $ | 2,249 |
|
| Steam and other production ash containment | | 132 |
| | — |
| | (6 | ) | | 5 |
| | (14 | ) | | 117 |
|
| Steam, hydro and other production asbestos | | 84 |
| | — |
| | — |
| | 4 |
| | — |
| | 88 |
|
| Wind production | | 72 |
| | 17 |
| (a) | — |
| | 3 |
| | — |
| | 92 |
|
| Electric distribution | | 13 |
| | — |
| | — |
| | 1 |
| | 6 |
| | 20 |
|
| Other | | 4 |
| | 1 |
| | — |
| | — |
| | — |
| | 5 |
|
| Natural gas plant | | | | | | | | | | | | |
| Gas transmission and distribution | | 156 |
| | — |
| | — |
| | 7 |
| | 42 |
| | 205 |
|
| Other | | 4 |
| | — |
| | — |
| | — |
| | — |
| | 4 |
|
| Common and other property | | | | | | | | | | | | |
| Common general plant asbestos | | 1 |
| | — |
| | — |
| | — |
| | — |
| | 1 |
|
| Common miscellaneous | | 2 |
| | — |
| | — |
| | — |
| | (1 | ) | | 1 |
|
| Total liability | | $ | 2,609 |
| | $ | 18 |
| | $ | (6 | ) | | $ | 128 |
| | $ | 33 |
| | $ | 2,782 |
|
| |
(a)
| The liability recognized relates to the NSP-Minnesota Courtenay Wind Farm which was placed in service during 2016. |
| |
(b)
| In 2016, AROs were revised for changes in estimated cash flows and the timing of those cash flows. Changes in the gas transmission and distribution AROs were mainly related to increased miles of gas mains. |
The aggregate fair value of NSP-Minnesota’s legally restricted assets, for purposes of funding future nuclear decommissioning, was $1.9 billion as of Dec. 31, 2016, consisting of external investment funds.
Indeterminate AROs — Outside of the known and recorded asbestos AROs, other Other plants or buildings may contain asbestos due to the age of many of Xcel Energy’s facilities, but no confirmation or measurement of the amount of asbestos or cost of removal could be determined as of Dec. 31, 2017.2021. Therefore, an ARO haswas not been recorded for these facilities.
Removal Costs — Xcel Energy records a regulatory liability for the plant removal costs of generation, transmission and distribution facilities of its utility subsidiaries that are recovered currently in rates. Generally, the accrual of future non-ARO removal obligations is not required. However, long-standing ratemaking practices approved by applicable state and federal regulatory commissions have allowed provisions for such costs in historical depreciation rates. These removal costs have accumulated over a number of years based on varying rates as authorized by the appropriate regulatory entities. Given the long time periods over which the amounts were accrued and the changing of rates over time, the utility subsidiaries have estimated the amount of removal costs accumulated through historic depreciation expense based on current factors used in the existing depreciation rates.
The accumulated balances by entity were as follows at Dec. 31:
|
| | | | | | | | |
| (Millions of Dollars) | | 2017 | | 2016 |
| NSP-Minnesota | | $ | 442 |
| | $ | 419 |
|
| PSCo | | 346 |
| | 367 |
|
| SPS | | 197 |
| | 209 |
|
| NSP-Wisconsin | | 146 |
| | 140 |
|
| Total Xcel Energy | | $ | 1,131 |
| | $ | 1,135 |
|
Nuclear
Nuclear Insurance
— NSP-Minnesota’s public liability for claims resulting from any nuclear incident is limited to $13.4$13.5 billion under the Price-Anderson amendment to the Atomic Energy Act. NSP-Minnesota has secured $450 million of coverage for its public liability exposure with a pool of insurance companies. The remaining $13.0 billion of exposure is funded by the Secondary Financial Protection Program available from assessments by the federal government in case of a nuclear incident. government.
NSP-Minnesota is subject to assessments of up to $127$138 million per reactor-incident for each of its three licensed3 reactors, to be applied for public liability arising from a nuclear incident at any licensed nuclear facility in the United States. The maximum funding requirement is $19$21 million per reactor per incidentreactor-incident during any one year. These maximum assessment amountsMaximum assessments are both subject to inflation adjustment by the NRC and state premium taxes. The NRC’s last adjustment was effective September 2013.
adjustments.
NSP-Minnesota purchases insurance for property damage and site decontamination cleanup costs from Nuclear Electric Insurance Ltd. (NEIL)NEIL and European Mutual Association for Nuclear Insurance (EMANI).EMANI. The coverage limits are $2.3$2.8 billion for each of NSP-Minnesota’s two2 nuclear plant sites. NEIL also provides business interruption insurance coverage up to $350 million, including the cost of replacement power obtained during certain prolonged accidental outages of nuclear generating units. Premiums are expensed over the policy term.
All companies insured with NEIL are subject to retroactive premium adjustments if losses exceed accumulated reserve funds. Capital has been accumulated in the reserve funds of NEIL and EMANI to the extent that NSP-Minnesota would have no exposure for retroactive premium assessments in case of a single incident under the business interruption and the property damage insurance coverage. However, in each calendar year,
NSP-Minnesota could be subject to annual maximum assessments of approximately $19$11 million for business interruption insurance and $41$33 million for property damage insurance if losses exceed accumulated reserve funds.
Legal Contingencies
Xcel Energy is involved in various litigation matters that are being defended and handled in the ordinary course of business. The assessment of whether a loss is probable or is a reasonable possibility, and whether the loss or a range of loss is estimable, often involves a series of complex judgments about future events. Management maintains accruals for such losses that are probable of being incurred and subject to reasonable estimation. Management is sometimes unable to estimate an amount or range of a reasonably possible loss in certain situations, including but not limited to when (1) the damages sought are indeterminate, (2) the proceedings are in the early stages, or (3) the matters involve novel or unsettled legal theories. In such cases, there is considerable uncertainty regarding the timing or ultimate resolution of such matters, including a possible eventual loss. For current proceedings not specifically reported herein, management does not anticipate that the ultimate liabilities, if any, arising from such current proceedings would have a material effect on Xcel Energy’s financial statements. Unless otherwise required by GAAP, legal fees are expensed as incurred.
Employment, Tort and Commercial Litigation
Gas Trading Litigation — e prime inc. (e prime) is a wholly owned subsidiary of Xcel Energy Inc. e prime was in the business of natural gas trading and marketing but has not engaged in natural gas trading or marketing activities since 2003. Thirteen lawsuits were commenced against e prime and Xcel Energy (and NSP-Wisconsin, in two instances) between 2003 and 2009 alleging fraud and anticompetitive activities in conspiring to restrain the trade of natural gas and manipulate natural gas prices.
e prime, Xcel Energy Inc. and its other affiliates were sued along with several other gas marketing companies. These cases were all consolidated in the U.S. District Court in Nevada. Six of the cases remain active, which includes a multi-district litigation (MDL) matter consisting of a Colorado class (Breckenridge), a Wisconsin class (Arandell Corp.), a Missouri class, a Kansas class, and two other cases identified as “Sinclair Oil” and “Farmland.” In March 2017, summary judgment was granted by the MDL judge in favor of Xcel Energy and e prime in the Sinclair Oil and Farmland cases. In November 2017, the U.S District Court in Nevada granted summary judgment against two plaintiffs in the Arandell Corp. case in favor of Xcel Energy and NSP-Wisconsin, leaving only three individual plaintiffs remaining in the litigation. In addition, the plaintiffs’ motions for class certification and remand back to originating courts in these cases were denied in March 2017. Plaintiffs have appealed the summary judgment motions granted in the Farmland and Sinclair Oil cases and the denial of class certification and remand to the U.S. Court of Appeals for the Ninth Circuit (Ninth Circuit). Oral arguments were heard before the Ninth Circuit in February 2018. A final decision is expected by the end of the first quarter of 2019. Xcel Energy, NSP-Wisconsin and e prime have concluded that a loss is remote.
Line Extension Disputes — In December 2015, Development Recovery Company (DRC) filed a lawsuit in the Denver District Court, stating PSCo failed to award proper allowances and refunds for line extensions to new developments pursuant to the terms of electric and gas service agreements entered into by PSCo and various developers. The dispute involves claims by over fifty developers. In May 2016, the Denver District Court granted PSCo’s motion to dismiss the lawsuit, concluding that jurisdiction over this dispute resides with the CPUC. In June 2016, DRC appealed the Denver District Court’s dismissal of the lawsuit, and the Colorado Court of Appeals affirmed the lower court decision in favor of PSCo. In July 2017, DRC filed a petition to appeal the decision with the Colorado Supreme Court. In February 2018, the Colorado Supreme Court denied DRC’s petition effectively terminating this litigation.
In January 2018, DRC filed a new lawsuit in Boulder County District Court, asserting a single claim that PSCo was required to file its line extension agreements with the CPUC but failed to do so. This claim is substantially similar to the arguments previously raised by DRC. Dates for this proceeding have not been scheduled.
PSCo has concluded that a loss is remote with respect to both of these matters as the service agreements were developed to implement CPUC approved tariffs and PSCo has complied with the tariff provisions. Also, if a loss were sustained, PSCo believes it would be allowed to recover these costs through traditional regulatory mechanisms. The amount or range in dispute is presently unknown and no accrual has been recorded for this matter.
Other Contingencies
See Note 12 for further discussion.
Fuel Disposal — NSP-Minnesota is responsible for temporarily storing used or spent nuclear fuel from its nuclear plants. The DOE is responsible for permanently storing spent fuel from U.S. nuclear plants, but no such facility is yet available.
NSP-Minnesota has funded its portion of the DOE’s permanent disposal program since 1981. Through May 2014, the fuel disposal fees were based on a charge of 0.1 cent per KWh sold to customers from nuclear generation. Since that time, the DOE has set the fee to zero. There were no DOE fuel disposal assessments in 2017 or 2016.
NSP-Minnesota has its ownowns temporary on-site storage facilities for spent fuel at its Monticello and PI nuclear plants, which consist of storage pools and dry cask facilities at both sites. The amount of spent fuel storage capacity is determined by the NRC and the MPUC.facilities. The Monticello dry-cask storage facility currently stores 16all 30 of the 30 authorized canisters, and thecanisters. The PI dry-cask storage facility currently stores 4047 of the 64 authorized casks. Monticello’s future spent fuel will continue to be placed in its spent fuel pool. The decommissioning plan addresses the disposition of spent fuel at the end of the licensed life. A CON for additional storage at the Monticello site has been filed with the MPUC, to support possible life extension.NSP-Minnesota expects a decision by year-end 2023.
Regulatory Plant Decommissioning Recovery — Decommissioning activities related tofor NSP-Minnesota’s nuclear facilities are planned to begin at the end of each unit’s operating license and be completed by 2091. NSP-Minnesota’s current operating licenses allow continued use of its Monticello nuclear plant until 2030 and its PI nuclear plant until 2033 for Unit 1 and 2034 for Unit 2.
Future decommissioning costs of nuclear facilities are estimated through triennial periodic studies that assess the costs and timing of planned nuclear decommissioning activities for each unit. The MPUC most recently approved NSP-Minnesota’s 2014 nuclear decommissioning study in October 2015. This cost study quantified decommissioning costs in 2014 dollars and utilized escalation rates of 4.36 percent per year for plant removal activities, and 3.36 percent for spent fuel management and site restoration activities over a 60-year decommissioning scenario.
The total obligationObligations for decommissioning isare expected to be funded 100 percent100% by the external decommissioning trust fund when decommissioning commences. NSP-Minnesota’s most recently approved decommissioning study resulted in an annual funding requirement of $14 million to be recovered in utility customer rates which started in 2016. Thisfund. The cost study assumes the external decommissioning fund will earn an after-tax return between 5.23 percent5.23% and 6.30 percent. 6.30%.
Realized and unrealized gains on fund investments are deferred as an offset of NSP-Minnesota’s regulatory asset for nuclear decommissioning costs. Decommissioning costs are quantified in 2014 dollars. Escalation rates are 4.36% for plant removal activities and 3.36% for fuel management and site restoration activities.
As of Dec. 31, 2017, NSP-Minnesota has accumulated $2.1had $3.3 billion of assets held in external decommissioning trusts.trusts at Dec. 31, 2021. The following table summarizes the funded status of NSP-Minnesota’s decommissioning obligation based on parameters established in the most recently approved decommissioning study.obligation. Xcel Energy believes future decommissioning costs if necessary, will continue to be recovered in customer rates. The following amounts presented below were prepared on a regulatory basis and are not directly recorded in the financial statements for theas an ARO.
| | | | | Regulatory Basis | | Regulatory Basis |
| (Millions of Dollars) | | 2017 | | 2016 | (Millions of Dollars) | | 2021 | | 2020 |
| Estimated decommissioning cost obligation from most recently approved study (in 2014 dollars) | | $ | 3,012 |
| | $ | 3,012 |
| Estimated decommissioning cost obligation from most recently approved study (in 2014 dollars) | | $ | 3,012 | | | $ | 3,012 | |
| Effect of escalating costs (to 2017 and 2016 dollars, respectively, at 4.36/3.36 percent) | | 396 |
| | 258 |
| |
| Effect of escalating costs | | Effect of escalating costs | | 1,006 | | | 844 | |
| Estimated decommissioning cost obligation (in current dollars) | | 3,408 |
| | 3,270 |
| Estimated decommissioning cost obligation (in current dollars) | | 4,018 | | | 3,856 | |
| Effect of escalating costs to payment date (4.36/3.36 percent) | | 7,797 |
| | 7,935 |
| |
| Effect of escalating costs to payment date | | Effect of escalating costs to payment date | | 7,187 | | | 7,349 | |
| Estimated future decommissioning costs (undiscounted) | | 11,205 |
| | 11,205 |
| Estimated future decommissioning costs (undiscounted) | | 11,205 | | | 11,205 | |
| Effect of discounting obligation (using average risk-free interest rate of 2.80 percent and 3.25 percent for 2017 and 2016, respectively) | | (6,398 | ) | | (7,068 | ) | |
| Effect of discounting obligation (using average risk-free interest rate of 1.96% and 1.64% for 2021 and 2020, respectively) | | Effect of discounting obligation (using average risk-free interest rate of 1.96% and 1.64% for 2021 and 2020, respectively) | | (4,651) | | | (4,181) | |
| Discounted decommissioning cost obligation | | $ | 4,807 |
| | $ | 4,137 |
| Discounted decommissioning cost obligation | | $ | 6,554 | | | $ | 7,024 | |
| | | | | | |
| Assets held in external decommissioning trust | | $ | 2,143 |
| | $ | 1,861 |
| Assets held in external decommissioning trust | | $ | 3,256 | | | $ | 2,777 | |
| Underfunding of external decommissioning fund compared to the discounted decommissioning obligation | | 2,664 |
| | 2,276 |
| Underfunding of external decommissioning fund compared to the discounted decommissioning obligation | | 3,298 | | | 4,247 | |
Calculations and data used by the regulator in approving NSP-Minnesota’s rates are useful in assessing future cash flows. The regulatoryRegulatory basis information is a means to reconcile amounts previously provided to the MPUC and utilized for regulatory purposes to amounts used for financial reporting. The following table provides a reconciliation
Reconciliation of the discounted decommissioning cost obligation - regulated basis to the ARO recorded in accordance with GAAP:
| | | (Millions of Dollars) | | 2017 | | 2016 | (Millions of Dollars) | | 2021 | | 2020 |
| Discounted decommissioning cost obligation - regulated basis | | $ | 4,807 |
| | $ | 4,137 |
| Discounted decommissioning cost obligation - regulated basis | | $ | 6,554 | | | $ | 7,024 | |
| Differences in discount rate and market risk premium | | (1,403 | ) | | (1,044 | ) | Differences in discount rate and market risk premium | | (2,209) | | | (2,628) | |
| O&M costs not included for GAAP | | (1,041 | ) | | (844 | ) | O&M costs not included for GAAP | | (1,584) | | | (1,734) | |
| ARO differences between 2017 and 2014 cost studies | | (489 | ) | | — |
| |
| ARO differences between 2020 and 2014 cost studies | | ARO differences between 2020 and 2014 cost studies | | (705) | | | (705) | |
| Nuclear production decommissioning ARO - GAAP | | $ | 1,874 |
| | $ | 2,249 |
| Nuclear production decommissioning ARO - GAAP | | $ | 2,056 | | | $ | 1,957 | |
Decommissioning expenses recognized as a result of regulation forregulation:
| | | | | | | | | | | | | | | | | | | | |
| (Millions of Dollars) | | 2021 | | 2020 | | 2019 |
Annual decommissioning recorded as depreciation expense: (a) (b) | | $ | 22 | | | $ | 20 | | | $ | 20 | |
(a)Decommissioning expense does not include depreciation of the years ending Dec. 31 were:capitalized nuclear asset retirement costs.
(b)Decommissioning expenses in 2021, 2020 and 2019 include Minnesota’s retail jurisdiction annual funding requirement of approximately $14 million.
|
| | | | | | | | | | | | |
| (Millions of Dollars) | | 2017 | | 2016 | | 2015 |
Annual decommissioning recorded as depreciation expense: (a) (b) | | $ | 20 |
| | $ | 20 |
| | $ | 7 |
|
| |
(a)
| Decommissioning expense does not include depreciation of the capitalized nuclear asset retirement costs. |
| |
(b)
| Decommissioning expenses inThe 2017 and 2016 include Minnesota’s retail jurisdiction annual funding requirement of approximately $14 million. The 2015 expense was offset by the DOE settlement refund. |
The 2014 nuclear decommissioning filing, approved in 2015effective Jan. 1, 2019, has been usedapproved by the MPUC. In March 2020, the MPUC approved for NSP-Minnesota to delay any increase to the regulatory presentationannual funding requirement until 2021. In December 2020, the MPUC verbally approved for both 2017NSP-Minnesota to delay any increase to the annual funding requirement until 2022. In December 2021, NSP-Minnesota submitted a Petition for approval of the 2022 - 2024 Nuclear Decommissioning Study and 2016. The most recent triennialAssumptions. Contemplated but not proposed in this filing, was submitted in December 2017 and is currently pending withthe 10-year extension of the license to operate the Monticello Plant, moving the planned retirement date from 2030 to 2040. The 2019 Preferred Integrated Resource Plan Supplement does include a 10-year extension of the license.On Feb. 8, 2022, the MPUC with an order expected in 2018.approved the 10-year extension.
| |
15. | Regulatory Assets and Liabilities |
Leases
Xcel Energy preparesevaluates contracts that may contain leases, including PPAs and arrangements for the use of office space and other facilities, vehicles and equipment. A contract contains a lease if it conveys the exclusive right to control the use of a specific asset. A contract determined to contain a lease is evaluated further to determine if the arrangement is a finance lease.
ROU assets represent Xcel Energy's rights to use leased assets. The present value of future operating lease payments is recognized in other current liabilities and noncurrent operating lease liabilities. These amounts, adjusted for any prepayments or incentives, are recognized as operating lease ROU assets.
Most of Xcel Energy’s leases do not contain a readily determinable discount rate. Therefore, the present value of future lease payments is generally calculated using the applicable Xcel Energy subsidiary’s estimated incremental borrowing rate (weighted average of 4.0%). Xcel Energy has elected the practical expedient under which non-lease components, such as asset maintenance costs included in payments, are not deducted from minimum lease payments for the purposes of lease accounting and disclosure.
Leases with an initial term of 12 months or less are classified as short-term leases and are not recognized on the consolidated balance sheet.
Operating lease ROU assets:
| | | | | | | | | | | | | | |
| (Millions of Dollars) | | Dec. 31, 2021 | | Dec. 31, 2020 |
| PPAs | | $ | 1,656 | | | $ | 1,650 | |
| Other | | 225 | | | 212 | |
| Gross operating lease ROU assets | | 1,881 | | | 1,862 | |
| Accumulated amortization | | (590) | | | (372) | |
| Net operating lease ROU assets | | $ | 1,291 | | | $ | 1,490 | |
ROU assets for finance leases are included in other noncurrent assets, and the present value of future finance lease payments is included in other current liabilities and other noncurrent liabilities.
Xcel Energy’s most significant finance lease activities are related to WYCO, a joint venture with CIG, to develop and lease natural gas pipeline, storage and compression facilities. Xcel Energy Inc. has a 50% ownership interest in WYCO. WYCO leases its facilities to CIG, and CIG operates the facilities, providing natural gas storage and transportation services to PSCo under separate service agreements.
PSCo accounts for its Totem natural gas storage service and Front Range pipeline arrangements with CIG and WYCO, respectively, as finance leases. Xcel Energy Inc. eliminates 50% of the finance lease obligation related to WYCO in the consolidated balance sheet along with an equal amount of Xcel Energy Inc.’s equity investment in WYCO.
Finance lease ROU assets:
| | | | | | | | | | | | | | |
| (Millions of Dollars) | | Dec. 31, 2021 | | Dec. 31, 2020 |
| Gas storage facilities | | $ | 201 | | | $ | 201 | |
| Gas pipeline | | 21 | | | 21 | |
| Gross finance lease ROU assets | | 222 | | | 222 | |
| Accumulated amortization | | (97) | | | (90) | |
| Net finance lease ROU assets | | $ | 125 | | | $ | 132 | |
Components of lease expense:
| | | | | | | | | | | | | | | | | | | | |
| (Millions of Dollars) | | 2021 | | 2020 | | 2019 |
| Operating leases | | | | | | |
| PPA capacity payments | | $ | 251 | | | $ | 238 | | | $ | 221 | |
Other operating leases (a) | | 36 | | | 26 | | | 34 | |
Total operating lease expense (b) | | $ | 287 | | | $ | 264 | | | $ | 255 | |
| Finance leases | | | | | | |
| Amortization of ROU assets | | $ | 7 | | | $ | 7 | | | $ | 6 | |
| Interest expense on lease liability | | 17 | | | 18 | | | 19 | |
| Total finance lease expense | | $ | 24 | | | $ | 25 | | | $ | 25 | |
(a)Includes short-term lease expense of $5 million for 2021, 2020 and 2019.
(b)PPA capacity payments are included in electric fuel and purchased power on the consolidated statements of income. Expense for other operating leases is included in O&M expense and electric fuel and purchased power.
Commitments under operating and finance leases as of Dec. 31, 2021:
| | | | | | | | | | | | | | | | | | | | | | | | | | |
| (Millions of Dollars) | | PPA (a) (b) Operating Leases | | Other Operating Leases | | Total
Operating Leases | | Finance Leases (c) |
| 2022 | | $ | 229 | | | $ | 27 | | | $ | 256 | | | $ | 12 | |
| 2023 | | 221 | | | 26 | | | 247 | | | 12 | |
| 2024 | | 209 | | | 22 | | | 231 | | | 12 | |
| 2025 | | 189 | | | 16 | | | 205 | | | 10 | |
| 2026 | | 146 | | | 12 | | | 158 | | | 9 | |
| Thereafter | | 416 | | | 81 | | | 497 | | | 187 | |
| Total minimum obligation | | 1,410 | | | 184 | | | 1,594 | | | 242 | |
| Interest component of obligation | | (209) | | | (34) | | | (243) | | | (170) | |
| Present value of minimum obligation | | $ | 1,201 | | | 150 | | | 1,351 | | | 72 | |
| Less current portion | | | | | | (205) | | | (3) | |
| Noncurrent operating and finance lease liabilities | | | | | | $ | 1,146 | | | $ | 69 | |
| | | | | | | | |
| Weighted-average remaining lease term in years | | | | | | 8.9 | | 36.1 |
(a)Amounts do not include PPAs accounted for as executory contracts and/or contingent payments, such as energy payments on renewable PPAs.
(b)PPA operating leases contractually expire at various dates through 2039.
(c)Excludes certain amounts related to Xcel Energy’s 50% ownership interest in WYCO.
PPAs and Fuel Contracts
Non-Lease PPAs— NSP-Minnesota, PSCo and SPS have entered into PPAs with other utilities and energy suppliers for purchased power to meet system load and energy requirements, operating reserve obligations and as part of wholesale and commodity trading activities. In general, these agreements provide for energy payments, based on actual energy delivered and capacity payments. Certain PPAs, accounted for as executory contracts with various expiration dates through 2033, contain minimum energy purchase commitments. Total energy payments on those contracts were $149 million, $112 million and $102 million in 2021, 2020 and 2019, respectively.
Included in electric fuel and purchased power expenses for PPAs accounted for as executory contracts were payments for capacity of $69 million, $75 million and $86 million in 2021, 2020 and 2019, respectively.
Capacity and energy payments are contingent on the IPPs meeting contract obligations, including plant availability requirements. Certain contractual payments are adjusted based on market indices. The effects of price adjustments on financial results are mitigated through purchased energy cost recovery mechanisms.
At Dec. 31, 2021, the estimated future payments for capacity and energy that the utility subsidiaries of Xcel Energy are obligated to purchase pursuant to these executory contracts, subject to availability, were as follows:
| | | | | | | | | | | | | | |
| (Millions of Dollars) | | Capacity | | Energy (a) |
| 2022 | | $ | 75 | | | $ | 165 | |
| 2023 | | 77 | | | 169 | |
| 2024 | | 72 | | | 174 | |
| 2025 | | 29 | | | 53 | |
| 2026 | | 12 | | | 10 | |
| Thereafter | | 12 | | | 38 | |
| Total | | $ | 277 | | | $ | 609 | |
(a)Excludes contingent energy payments for renewable energy PPAs.
Fuel Contracts — Xcel Energy has entered into various long-term commitments for the purchase and delivery of a significant portion of its coal, nuclear fuel and natural gas requirements. These contracts expire between 2022 and 2060. Xcel Energy is required to pay additional amounts depending on actual quantities shipped under these agreements.
Estimated minimum purchases under these contracts as of Dec. 31, 2021:
| | | | | | | | | | | | | | | | | | | | | | | | | | |
| (Millions of Dollars) | | Coal | | Nuclear fuel | | Natural gas supply | | Natural gas supply and transportation |
| 2022 | | $ | 620 | | | $ | 89 | | | $ | 477 | | | $ | 292 | |
| 2023 | | 233 | | | 109 | | | 75 | | | 224 | |
| 2024 | | 147 | | | 82 | | | 4 | | | 172 | |
| 2025 | | 29 | | | 119 | | | — | | | 156 | |
| 2026 | | 31 | | | 29 | | | — | | | 149 | |
| Thereafter | | 34 | | | 309 | | | — | | | 571 | |
| Total | | $ | 1,094 | | | $ | 737 | | | $ | 556 | | | $ | 1,564 | |
VIEs
PPAs—Under certain PPAs, NSP-Minnesota, PSCo and SPS purchase power from IPPs for which the utility subsidiaries are required to reimburse fuel costs, or to participate in tolling arrangements under which the utility subsidiaries procure the natural gas required to produce the energy that they purchase. Xcel Energy has determined that certain IPPs are VIEs. Xcel Energy is not subject to risk of loss from the operations of these entities, and no significant financial support is required other than contractual payments for energy and capacity.
In addition, certain solar PPAs provide an option to purchase emission allowances or sharing provisions related to production credits generated by the solar facility under contract. These specific PPAs create a variable interest in the IPP.
Xcel Energy evaluated each of these VIEs for possible consolidation, including review of qualitative factors such as the length and terms of the contract, control over O&M, control over dispatch of electricity, historical and estimated future fuel and electricity prices, and financing activities. Xcel Energy concluded that these entities are not required to be consolidated in its consolidated financial statements because it does not have the power to direct the activities that most significantly impact the entities’ economic performance.
The utility subsidiaries had approximately 4,062 MW of capacity under long-term PPAs at both Dec. 31, 2021 and 2020 with entities that have been determined to be VIEs. These agreements have expiration dates through 2041.
Fuel Contracts — SPS purchases all of its coal requirements for its Harrington and Tolk plants from TUCO Inc. under contracts that will expire in accordanceDecember 2022. TUCO arranges for the purchase, receiving, transporting, unloading, handling, crushing, weighing and delivery of coal to meet SPS’ requirements. TUCO is responsible for negotiating and administering contracts with coal suppliers, transporters and handlers.
SPS has not provided any significant financial support to TUCO, other than contractual payments for delivered coal. However, the fuel contracts create a variable interest in TUCO due to SPS’ reimbursement of fuel procurement costs.
SPS has determined that TUCO is a VIE, however it has concluded that SPS is not the primary beneficiary of TUCO because it does not have the power to direct the activities that most significantly impact TUCO’s economic performance.
Low-Income Housing Limited Partnerships — Eloigne and NSP-Wisconsin have entered into limited partnerships for the construction and operation of affordable rental housing developments which qualify for low-income housing tax credits. Xcel Energy Inc. has determined Eloigne and NSP-Wisconsin’s low-income housing partnerships to be VIEs primarily due to contractual arrangements within each limited partnership that establish sharing of ongoing voting control and profits and losses that does not align with the applicable accounting guidance, as discussedpartners’ proportional equity ownership.
Eloigne and NSP-Wisconsin have the power to direct the activities that most significantly impact these entities’ economic performance. Therefore, Xcel Energy Inc. consolidates these limited partnerships in Note 1. Under this guidance, regulatory assetsits consolidated financial statements. Xcel Energy’s risk of loss for these partnerships is limited to its capital contributions, adjusted for any distributions and liabilities are created for amounts that regulators may allowits share of undistributed profits and losses; no significant additional financial support has been, or is required to be, collected,provided to the limited partnerships by Eloigne or may require to be paid back to customersNSP-Wisconsin.
Amounts reflected in future electric and natural gas rates. Any portion of Xcel Energy’s business that is not regulated cannot establish regulatory assets and liabilities. If changes in the utility industry or the business of Xcel Energy no longer allow for the application of regulatory accounting guidance under GAAP, Xcel Energy would be required to recognize the write-off of regulatory assets and liabilities in net income or OCI.
The components of regulatory assets shown on the consolidated balance sheets for the Eloigne and NSP-Wisconsin low-income housing limited partnerships:
| | | | | | | | | | | | | | |
| (Millions of Dollars) | | Dec. 31, 2021 | | Dec. 31, 2020 |
| Current assets | | $ | 7 | | | $ | 7 | |
| Property, plant and equipment, net | | 37 | | | 38 | |
| Other noncurrent assets | | 1 | | | 1 | |
| Total assets | | $ | 45 | | | $ | 46 | |
| | | | |
| Current liabilities | | $ | 7 | | | $ | 8 | |
| Mortgages and other long-term debt payable | | 27 | | | 25 | |
| Other noncurrent liabilities | | 1 | | | 1 | |
| Total liabilities | | $ | 35 | | | $ | 34 | |
Other
Technology Agreements — Xcel Energy has several contracts for information technology services that extend through 2022. The contracts are cancelable, although there are financial penalties for early termination. Xcel Energy capitalized or expensed $103 million, $110 million and $101 million associated with these contracts in 2021, 2020 and 2019, respectively.
Committed minimum payments under these obligations are $15 million in 2022.
Guarantees and Bond Indemnifications —Xcel Energy Inc. and its subsidiaries provide guarantees and bond indemnities, which guarantee payment or performance. Xcel Energy Inc.’s exposure is based upon the net liability under the specified agreements or transactions. Most of the guarantees and bond indemnities issued by Xcel Energy Inc. and its subsidiaries have a stated maximum amount.
As of Dec. 31, 2021 and 2020, Xcel Energy Inc. and its subsidiaries had no assets held as collateral related to their guarantees, bond indemnities and indemnification agreements. Guarantees and bond indemnities issued and outstanding for Xcel Energy were $60 million and $62 million at Dec. 31, 20172021 and 2016 are:2020 respectively.
Other Indemnification Agreements — Xcel Energy Inc. and its subsidiaries provide indemnifications through various contracts. These are primarily indemnifications against adverse litigation outcomes in connection with underwriting agreements, as well as breaches of representations and warranties, including corporate existence, transaction authorization and income tax matters with respect to assets sold. Xcel Energy Inc.’s and its subsidiaries’ obligations under these agreements may be limited in terms of duration and amount. Maximum future payments under these indemnifications cannot be reasonably estimated as the dollar amounts are often not explicitly stated.
|
| | | | | | | | | | | | | | | | | | | | | |
| (Millions of Dollars) | | See Note(s) | | Remaining
Amortization Period | | Dec. 31, 2017 | | Dec. 31, 2016 |
| Regulatory Assets | | | | | | Current | | Noncurrent | | Current | | Noncurrent |
Pension and retiree medical obligations (a) | | 9 |
| | Various | | $ | 91 |
| | $ | 1,499 |
| | $ | 89 |
| | $ | 1,549 |
|
Net AROs (b) | | 1, 13, 14 |
| | Plant lives | | — |
| | 301 |
| | — |
| | 379 |
|
| Excess deferred taxes - TCJA | | 6 |
| | Various | | — |
| | 254 |
| | — |
| | — |
|
Recoverable deferred taxes on AFUDC recorded in plant (c) | | 1 |
| | Plant lives | | — |
| | 244 |
| | — |
| | 424 |
|
| Environmental remediation costs | | 1, 13 |
| | Various | | 16 |
| | 165 |
| | 11 |
| | 165 |
|
Contract valuation adjustments (d) | | 1, 11 |
| | Term of related contract | | 21 |
| | 93 |
| | 18 |
| | 111 |
|
| Depreciation differences | | 1 |
| | One to fourteen years | | 20 |
| | 69 |
| | 15 |
| | 90 |
|
| Purchased power contract costs | | 13 |
| | Term of related contract | | 3 |
| | 67 |
| | 2 |
| | 70 |
|
| PI EPU | | 12 |
| | Seventeen years | | 3 |
| | 58 |
| | 3 |
| | 62 |
|
| Losses on reacquired debt | | 4 |
| | Term of related debt | | 5 |
| | 48 |
| | 4 |
| | 23 |
|
Conservation programs (e) | | 1 |
| | One to two years | | 50 |
| | 32 |
| | 48 |
| | 48 |
|
| State commission adjustments | | 1 |
| | Plant lives | | 1 |
| | 29 |
| | 1 |
| | 27 |
|
| Property tax | | | | Various | | 8 |
| | 24 |
| | 9 |
| | 2 |
|
| Nuclear refueling outage costs | | 1 |
| | One to two years | | 49 |
| | 20 |
| | 49 |
| | 16 |
|
| Deferred purchased natural gas and electric energy costs | | 1 |
| | Various | | 21 |
| | 13 |
| | 18 |
| | 16 |
|
| Sales true up and revenue decoupling | | | | One to two years | | 37 |
| | 12 |
| | — |
| | — |
|
| Gas pipeline inspection and remediation costs | | 12 |
| | One to two years | | 24 |
| | 12 |
| | 7 |
| | 14 |
|
| Renewable resources and environmental initiatives | | 13 |
| | One to three years | | 48 |
| | 10 |
| | 34 |
| | 23 |
|
| Other | | | | Various | | 27 |
| | 55 |
| | 56 |
| | 62 |
|
| Total regulatory assets | | | | | | $ | 424 |
| | $ | 3,005 |
| | $ | 364 |
| | $ | 3,081 |
|
| | |
(a)
| Includes $179 million and $241 million for the regulatory recognition of the NSP-Minnesota pension expense, of which $9 million and $15 million is included in the current asset at Dec. 31, 2017 and 2016, respectively. Also included are $8 million and $11 million of regulatory assets related to the nonqualified pension plan, of which $1 million and $3 million is included in the current asset at Dec. 31, 2017 and 2016, respectively. |
| |
(b)
| Includes amounts recorded for future recovery of AROs, less amounts recovered through nuclear decommissioning accruals and gains from decommissioning investments. |
| |
(c)
| Includes a write-down of $202 million as a result of the revaluation of deferred tax gross up at the new federal tax rate at Dec. 31, 2017. |
| |
(d)
| Includes the fair value of certain long-term PPAs used to meet energy capacity requirements and valuation adjustments on natural gas commodity purchases. |
| |
(e)
| Includes costs for conservation programs, as well as incentives allowed in certain jurisdictions. |
The components of regulatory liabilities shown on the consolidated balance sheets at Dec. 31, 2017 and 2016 are:
|
| | | | | | | | | | | | | | | | | | | | |
| (Millions of Dollars) | | See Note(s) | | Remaining
Amortization Period | | Dec. 31, 2017 | | Dec. 31, 2016 |
| Regulatory Liabilities | | | | | | Current | | Noncurrent | | Current | | Noncurrent |
Excess deferred taxes - TCJA (a) | | 6 | | Various | | $ | — |
| | $ | 3,733 |
| | $ | — |
| | $ | — |
|
| Plant removal costs | | 1, 13 | | Plant lives | | — |
| | 1,131 |
| | — |
| | 1,135 |
|
| Renewable resources and environmental initiatives | | 12, 13 | | Various | | 19 |
| | 56 |
| | 5 |
| | 71 |
|
| ITC deferrals | | 1, 6 | | Various | | — |
| | 42 |
| | — |
| | 45 |
|
| Deferred income tax adjustment | | 1, 6 | | Various | | — |
| | 38 |
| | — |
| | 48 |
|
| Deferred electric, natural gas and steam production costs | | 1 | | Less than one year | | 104 |
| | — |
| | 98 |
| | — |
|
Contract valuation adjustments (b) | | 1, 11 | | Term of related contract | | 30 |
| | — |
| | 22 |
| | 2 |
|
Conservation programs (c) | | 1, 12 | | Less than one year | | 23 |
| | — |
| | 25 |
| | — |
|
| DOE settlement | |
| | Less than one year | | 18 |
| | — |
| | 20 |
| | — |
|
| Other | | | | Various | | 45 |
| | 83 |
| | 51 |
| | 82 |
|
Total regulatory liabilities (d) | | | | | | $ | 239 |
| | $ | 5,083 |
| | $ | 221 |
| | $ | 1,383 |
|
| |
(a)
| Primarily relates to the revaluation of recoverable/regulated plant ADIT and $174 million revaluation impact of non-plant ADIT at Dec. 31, 2017. |
| |
(b)
| Includes the fair value of certain long-term PPAs used to meet energy capacity requirements and valuation adjustments on natural gas commodity purchases. |
| |
(c)
| Includes costs for conservation programs, as well as incentives allowed in certain jurisdictions. |
| |
(d)
| Revenue subject to refund of $15 million and $46 million for 2017 and 2016, respectively, is included in other current liabilities. |
At Dec. 31, 2017 and 2016, approximately $250 million and $166 million of Xcel Energy’s regulatory assets represented past expenditures not currently earning a return, respectively. This amount primarily includes recoverable purchased natural gas and electric energy costs and certain expenditures associated with pension and renewable resources and environmental initiatives.
| |
16. | 13. Other Comprehensive Income |
Changes in accumulated other comprehensive (loss),loss, net of tax, for the years ended Dec. 31, 201731:
| | | | | | | | | | | | | | | | | | | | |
| | 2021 |
| (Millions of Dollars) | | Gains and Losses on Cash Flow Hedges | | Defined Benefit Pension and Postretirement Items | | Total |
| Accumulated other comprehensive loss at Jan. 1 | | $ | (85) | | | $ | (56) | | | $ | (141) | |
| Other comprehensive loss before reclassifications (net of taxes of $1 and $—, respectively) | | 4 | | | — | | | 4 | |
| Losses reclassified from net accumulated other comprehensive loss: | | | | | | |
| Interest rate derivatives (net of taxes of $2 and $—, respectively) | | 6 | | (a) | — | | | 6 | |
| Amortization of net actuarial loss (net of taxes of $— and $3, respectively) | | — | | | 8 | | (b) | 8 | |
| Net current period other comprehensive income | | 10 | | | 8 | | | 18 | |
| Accumulated other comprehensive loss at Dec. 31 | | $ | (75) | | | $ | (48) | | | $ | (123) | |
(a)Included in interest charges.
(b)Included in the computation of net periodic pension and 2016 were as follows:postretirement benefit costs. See Note 11 for further information.
|
| | | | | | | | | | | | |
| | | Year Ended Dec. 31, 2017 |
| (Millions of Dollars) | | Gains and Losses on Cash Flow Hedges | | Defined Benefit Pension and Postretirement Items | | Total |
| Accumulated other comprehensive loss at Jan. 1 | | $ | (51 | ) | | $ | (59 | ) | | $ | (110 | ) |
| Other comprehensive loss before reclassifications | | — |
| | (3 | ) | | (3 | ) |
| Losses reclassified from net accumulated other comprehensive loss | | 3 |
| | 7 |
| | 10 |
|
| Net current period other comprehensive income | | 3 |
| | 4 |
| | 7 |
|
| | | | | | | |
Adoption of ASU No. 2018-02 (a) | | (10 | ) | | (12 | ) | | (22 | ) |
| Accumulated other comprehensive loss at Dec. 31 | | $ | (58 | ) | | $ | (67 | ) | | $ | (125 | ) |
| | | | | | | | | | | | | | | | | | | | |
| | 2020 |
| (Millions of Dollars) | | Gains and Losses on Cash Flow Hedges | | Defined Benefit Pension and Postretirement Items | | Total |
| Accumulated other comprehensive loss at Jan. 1 | | $ | (80) | | | $ | (61) | | | $ | (141) | |
| Other comprehensive loss before reclassifications (net of taxes of $(3) and $(2), respectively) | | (10) | | | (5) | | | (15) | |
| Losses reclassified from net accumulated other comprehensive loss: | | | | | | |
| Interest rate derivatives (net of taxes of $2 and $—, respectively) | | 5 | | (a) | — | | | 5 | |
| Amortization of net actuarial loss (net of taxes of $— and $3, respectively) | | — | | | 10 | | (b) | 10 | |
| Net current period other comprehensive (loss) income | | (5) | | | 5 | | | — | |
| Accumulated other comprehensive loss at Dec. 31 | | $ | (85) | | | $ | (56) | | | $ | (141) | |
(a)Included in interest charges.
(b)Included in the computation of net periodic pension and postretirement benefit costs. See Note 11 for further information.
| | |
(a)
| In 2017, Xcel Energy implemented ASU No. 2018-02 related to the TCJA, which resulted in reclassification of certain credit balances within net accumulated other comprehensive loss to retained earnings. For further information, see Note 2.14. Segment Information |
|
| | | | | | | | | | | | |
| | | Year Ended Dec. 31, 2016 |
| (Millions of Dollars) | | Gains and
Losses on Cash Flow Hedges | | Defined Benefit
Pension and
Postretirement
Items | | Total |
| Accumulated other comprehensive loss at Jan. 1 | | $ | (55 | ) | | $ | (55 | ) | | $ | (110 | ) |
| Other comprehensive loss before reclassifications | | — |
| | (8 | ) | | (8 | ) |
| Losses reclassified from net accumulated other comprehensive loss | | 4 |
| | 4 |
| | 8 |
|
| Net current period other comprehensive income (loss) | | 4 |
| | (4 | ) | | — |
|
| Accumulated other comprehensive loss at Dec. 31 | | $ | (51 | ) | | $ | (59 | ) | | $ | (110 | ) |
ReclassificationsXcel Energy evaluates performance by each utility subsidiary based on profit or loss generated from accumulated other comprehensive loss for the years ended Dec. 31, 2017 and 2016 were as follows:
|
| | | | | | | | | |
| | | Amounts Reclassified from Accumulated Other Comprehensive Loss | |
| (Millions of Dollars) | | Year Ended Dec. 31, 2017 | | Year Ended Dec. 31, 2016 | |
| Losses (gains) on cash flow hedges: | | | | | |
| Interest rate derivatives | | $ | 5 |
| (a) | $ | 6 |
| (a) |
| Total, pre-tax | | 5 |
| | 6 |
| |
| Tax benefit | | (2 | ) | | (2 | ) | |
| Total, net of tax | | 3 |
| | 4 |
| |
| Defined benefit pension and postretirement losses (gains): | | | | | |
| Amortization of net losses | | 12 |
| (b) | 6 |
| (b) |
| Total, pre-tax | | 12 |
| | 6 |
| |
| Tax benefit | | (5 | ) | | (2 | ) | |
| Total, net of tax | | 7 |
| | 4 |
| |
| Total amounts reclassified, net of tax | | $ | 10 |
| | $ | 8 |
| |
| |
(a)
| Included in interest charges. |
| |
(b)
| Included inproduct or service provided, including the computation of net periodic pension and postretirement benefit costs. See Note 9 for detail regarding these benefit plans. |
17. Segments and Related Information
The regulated electric utility operating results of NSP-Minnesota, NSP-Wisconsin, PSCo and SPS, as well as the regulated natural gas utility operating results of NSP-Minnesota, NSP-Wisconsin and PSCo are each separately and regularly reviewed by Xcel Energy’s chief operating decision maker. Xcel Energy evaluates performance by each utility subsidiary based on profit or loss generated from the product or service provided.PSCo. These segments are managed separately because the revenue streams are dependent upon regulated rate recovery, which is separately determined for each segment.
Xcel Energy has the following reportable segments: regulated electric utility, regulated natural gas utility and all other.
Xcel Energy’s•Regulated Electric — The regulated electric utility segment generates, transmits and distributes electricity in Minnesota, Wisconsin, Michigan, North Dakota, South Dakota, Colorado, Texas and New Mexico. In addition, this segment includes sales for resale and provides wholesale transmission service to various entities in the United States. RegulatedThe regulated electric utility segment also includes wholesale commodity and trading operations.
Xcel Energy’s•Regulated Natural Gas — The regulated natural gas utility segment transports, stores and distributes natural gas primarily in portions of Minnesota, Wisconsin, North Dakota, Michigan and Colorado.
Revenues fromXcel Energy also presents All Other, which includes operating segments not included above arewith revenues below the necessary quantitative thresholds and are therefore included in the all other category.thresholds. Those operating segments primarily include steam revenue, appliance repair services, nonutilitynon-utility real estate activities, revenues associated with processing solid waste into refuse-derived fuel, and investments in rental housing projects that qualify for low-income housing tax credits.
credits and the operations of MEC until July 2020.
Xcel Energy had equity method investments in unconsolidated subsidiaries of $140$208 million and $133$165 million as of Dec. 31, 20172021 and 2016,2020, respectively, included in the natural gas utility and all other segments.
Asset and capital expenditure information is not provided for Xcel Energy’s reportable segments because assegments. As an integrated electric and natural gas utility, Xcel Energy operates significant assets that are not dedicated to a specific business segment, and reportingsegment. Reporting assets and capital expenditures by business segment would require arbitrary and potentially misleading allocations, which may not necessarily reflect the assets that would be required for the operation of the business segments on a stand-alone basis.
To report income from operations for regulated electric and regulated natural gas utility segments, the majority of costs are directly assigned to each segment. However, some
Certain costs, such as common depreciation, common O&M expenses and interest expense are allocated based on cost causation allocators. Aallocators across each segment. In addition, a general allocator is used for certain general and administrative expenses, including office supplies, rent, property insurance and general advertising.
Xcel Energy’s segment information:
The accounting policies of the segments are the same as those described in Note 1. | | | | | | | | | | | | | | | | | | | | |
| (Millions of Dollars) | | 2021 | | 2020 | | 2019 |
| Regulated Electric | | | | | | |
| Operating revenues — external | | $ | 11,205 | | | $ | 9,802 | | | $ | 9,575 | |
| Intersegment revenue | | 2 | | | 2 | | | 1 | |
| Total revenues | | $ | 11,207 | | | $ | 9,804 | | | $ | 9,576 | |
| Depreciation and amortization | | 1,855 | | | 1,673 | | | 1,535 | |
| Interest charges and financing costs | | 568 | | | 534 | | | 500 | |
| Income tax (benefit) expense | | (96) | | | 1 | | | 125 | |
| Net income | | 1,478 | | | 1,407 | | | 1,288 | |
| Regulated Natural Gas | | | | | | |
| Operating revenues — external | | $ | 2,132 | | | $ | 1,636 | | | $ | 1,868 | |
| Intersegment revenue | | 2 | | | 1 | | | 2 | |
| Total revenues | | $ | 2,134 | | | $ | 1,637 | | | $ | 1,870 | |
| Depreciation and amortization | | 254 | | | 252 | | | 219 | |
| Interest charges and financing costs | | 75 | | | 71 | | | 69 | |
| Income tax expense | | 54 | | | 17 | | | 48 | |
| Net income | | 231 | | | 190 | | | 195 | |
| All Other | | | | | | |
| Total revenues | | $ | 94 | | | $ | 88 | | | $ | 86 | |
| Depreciation and amortization | | 12 | | | 23 | | | 11 | |
| Interest charges and financing costs | | 173 | | | 193 | | | 167 | |
| Income tax benefit | | (28) | | | (24) | | | (45) | |
| Net loss | | (112) | | | (124) | | | (111) | |
| | | | | | |
| Consolidated Total | | | | | | |
| Total revenues | | $ | 13,435 | | | $ | 11,529 | | | $ | 11,532 | |
| Reconciling eliminations | | (4) | | | (3) | | | (3) | |
| Total operating revenues | | $ | 13,431 | | | $ | 11,526 | | | $ | 11,529 | |
| Depreciation and amortization | | 2,121 | | | 1,948 | | | 1,765 | |
| Interest charges and financing costs | | 816 | | | 798 | | | 736 | |
| Income tax (benefit) expense | | (70) | | | (6) | | | 128 | |
| Net income | | 1,597 | | | 1,473 | | | 1,372 | |
|
| | | | | | | | | | | | | | | | | | | | |
| (Millions of Dollars) | | Regulated Electric | | Regulated Natural Gas | | All Other | | Reconciling Eliminations | | Consolidated Total |
| 2017 | | | | | | | | | | |
| Operating revenues from external customers | | $ | 9,676 |
| | $ | 1,650 |
| | $ | 78 |
| | $ | — |
| | $ | 11,404 |
|
| Intersegment revenues | | 2 |
| | 1 |
| | — |
| | (3 | ) | | — |
|
| Total revenues | | $ | 9,678 |
| | $ | 1,651 |
| | $ | 78 |
| | $ | (3 | ) | | $ | 11,404 |
|
| | | | | | | | | | | |
| Depreciation and amortization | | $ | 1,298 |
| | $ | 174 |
| | $ | 7 |
| | $ | — |
| | $ | 1,479 |
|
| Interest charges and financing costs | | 449 |
| | 57 |
| | 122 |
| | — |
| | 628 |
|
| Income tax expense (benefit) | | 528 |
| | 23 |
| | (9 | ) | | — |
| | 542 |
|
| Net income (loss) | | 1,066 |
| | 182 |
| | (100 | ) | | — |
| | 1,148 |
|
|
| | | | | | | | | | | | | | | | | | | | |
| (Millions of Dollars) | | Regulated Electric | | Regulated Natural Gas | | All Other | | Reconciling Eliminations | | Consolidated Total |
| 2016 | | | | | | | | | | |
| Operating revenues from external customers | | $ | 9,500 |
| | $ | 1,531 |
| | $ | 76 |
| | $ | — |
| | $ | 11,107 |
|
| Intersegment revenues | | 1 |
| | 1 |
| | — |
| | (2 | ) | | — |
|
| Total revenues | | $ | 9,501 |
| | $ | 1,532 |
| | $ | 76 |
| | $ | (2 | ) | | $ | 11,107 |
|
| | | | | | | | | | | |
| Depreciation and amortization | | $ | 1,136 |
| | $ | 160 |
| | $ | 7 |
| | $ | — |
| | $ | 1,303 |
|
| Interest charges and financing costs | | 450 |
| | 54 |
| | 116 |
| | — |
| | 620 |
|
| Income tax expense (benefit) | | 567 |
| | 76 |
| | (62 | ) | | — |
| | 581 |
|
| Net income (loss) | | 1,067 |
| | 124 |
| | (68 | ) | | — |
| | 1,123 |
|
|
| | | | | | | | | | | | | | | | | | | | |
| (Millions of Dollars) | | Regulated Electric | | Regulated Natural Gas | | All Other | | Reconciling Eliminations | | Consolidated Total |
| 2015 | | | | | | | | | | |
| Operating revenues from external customers | | $ | 9,276 |
| | $ | 1,672 |
| | $ | 76 |
| | $ | — |
| | $ | 11,024 |
|
| Intersegment revenues | | 2 |
| | 1 |
| | — |
| | (3 | ) | | — |
|
| Total revenues | | $ | 9,278 |
| | $ | 1,673 |
| | $ | 76 |
| | $ | (3 | ) | | $ | 11,024 |
|
| | | | | | | | | | | |
| Depreciation and amortization | | $ | 963 |
| | $ | 155 |
| | $ | 6 |
| | $ | — |
| | $ | 1,124 |
|
| Interest charges and financing costs | | 426 |
| | 50 |
| | 93 |
| | — |
| | 569 |
|
| Income tax expense (benefit) | | 509 |
| | 60 |
| | (26 | ) | | — |
| | 543 |
|
| Net income (loss) | | 921 |
| | 106 |
| | (43 | ) | | — |
| | 984 |
|
| | |
18. | Summarized Quarterly Financial Data (Unaudited)ITEM 9 — CHANGES IN AND DISAGREEMENTS WITH ACCOUNTANTS ON ACCOUNTING AND FINANCIAL DISCLOSURE |
|
| | | | | | | | | | | | | | | | |
| | | Quarter Ended |
| (Amounts in millions, except per share data) | | March 31, 2017 | | June 30, 2017 | | Sept. 30, 2017 | | Dec. 31, 2017 |
| Operating revenues | | $ | 2,946 |
| | $ | 2,645 |
| | $ | 3,017 |
| | $ | 2,796 |
|
| Operating income | | 486 |
| | 460 |
| | 818 |
| | 426 |
|
| Net income | | 239 |
| | 227 |
| | 492 |
| | 189 |
|
| EPS total — basic | | $ | 0.47 |
| | $ | 0.45 |
| | $ | 0.97 |
| | $ | 0.37 |
|
| EPS total — diluted | | 0.47 |
| | 0.45 |
| | 0.97 |
| | 0.37 |
|
| Cash dividends declared per common share | | 0.36 |
| | 0.36 |
| | 0.36 |
| | 0.36 |
|
|
| | | | | | | | | | | | | | | | |
| | | Quarter Ended |
| (Amounts in millions, except per share data) | | March 31, 2016 | | June 30, 2016 | | Sept. 30, 2016 | | Dec. 31, 2016 |
| Operating revenues | | $ | 2,772 |
| | $ | 2,500 |
| | $ | 3,040 |
| | $ | 2,795 |
|
| Operating income | | 490 |
| | 432 |
| | 827 |
| | 465 |
|
| Net income | | 241 |
| | 197 |
| | 458 |
| | 227 |
|
| EPS total — basic | | $ | 0.47 |
| | $ | 0.39 |
| | $ | 0.90 |
| | $ | 0.45 |
|
| EPS total — diluted | | 0.47 |
| | 0.39 |
| | 0.90 |
| | 0.45 |
|
| Cash dividends declared per common share | | 0.34 |
| | 0.34 |
| | 0.34 |
| | 0.34 |
|
Item 9 — Changes in and Disagreements with Accountants on Accounting and Financial Disclosure
None.
| | |
ITEM 9A— CONTROLS AND PROCEDURES |
Item 9A — Controls and Procedures
Disclosure Controls and Procedures
Xcel Energy maintains a set of disclosure controls and procedures designed to ensure that information required to be disclosed in reports that it files or submits under the Securities Exchange Act of 1934 is recorded, processed, summarized, and reported within the time periods specified in SEC rules and forms. In addition, the disclosure controls and procedures ensure that information required to be disclosed is accumulated and communicated to management, including the chief executive officer (CEO)CEO and chief financial officer (CFO),CFO, allowing timely decisions regarding required disclosure.
As of Dec. 31, 2017,2021, based on an evaluation carried out under the supervision and with the participation of Xcel Energy’s management, including the CEO and CFO, of the effectiveness of its disclosure controls and the procedures, the CEO and CFO have concluded that Xcel Energy’s disclosure controls and procedures were effective.
Internal Control Over Financial Reporting
No changechanges in Xcel Energy’s internal control over financial reporting has occurred during the most recent fiscal quarter ended Dec. 31, 2021 that has materially affected, or isare reasonably likely to materially affect, Xcel Energy’s internal control over financial reporting. Xcel Energy maintains internal control over financial reporting to provide reasonable assurance regarding the reliability of the financial reporting.
Xcel Energy has evaluated and documented its controls in process activities, general computer activities, and on an entity-wide level.
During the year and in preparation for issuing its report for the year ended Dec. 31, 20172021 on internal controls under section 404 of the Sarbanes-Oxley Act of 2002, Xcel Energy conducted testing and monitoring of its internal control over financial reporting. Based on the control evaluation, testing and remediation performed, Xcel Energy did not identify any material control weaknesses, as defined under the standards and rules issued by the Public Company Accounting Oversight Board, and as approved by the SEC and as indicated in Xcel Energy’s Management Report on Internal Controls over Financial Reporting, which is contained in Item 8 herein.
In 2016, Xcel Energy implemented the general ledger modules, as well as initiated deployment of work management systems modules, of a new enterprise resource planning system to improve certain financial and related transaction processes. Xcel Energy implemented additional work management systems modules in 2017. Xcel Energy updated its internal control over financial reporting, as necessary, to accommodate modifications to its business processes and accounting systems. Xcel Energy does not believe that this implementation had an adverse effect on its internal control over financial reporting.
Item 9B — Other Information
| | |
| ITEM 9B — OTHER INFORMATION |
None.
| | |
| ITEM 9C — DISCLOSURE REGARDING FOREIGN JURISDICTIONS THAT PREVENT INSPECTIONS |
Not applicable.
PART III
| | |
| ITEM 10 — DIRECTORS, EXECUTIVE OFFICERS AND CORPORATE GOVERNANCE |
Item 10 — Directors, Executive Officers and Corporate Governance
Information required under this Item with respect to Directors and Corporate Governance is set forth in Xcel Energy Inc.’s Proxy Statement for its 20182022 Annual Meeting of Shareholders, which is expected to occur on April 5, 2022, incorporated by reference. Information with respect to Executive Officers is included in Item 1 to this report.
Item 11 — Executive Compensation
| | |
| ITEM 11 — EXECUTIVE COMPENSATION |
Information required under this Item is set forth in Xcel Energy Inc.’s Proxy Statement for its 20182022 Annual Meeting of Shareholders, which is incorporated by reference.
Item 12 — Security Ownership of Certain Beneficial Owners and Management and Related Stockholder Matters
| | |
| ITEM 12 — SECURITY OWNERSHIP OF CERTAIN BENEFICIAL OWNERS AND MANAGEMENT AND RELATED STOCKHOLDER MATTERS |
Information required under this Item is contained in Xcel Energy Inc.’s Proxy Statement for its 20182022 Annual Meeting of Shareholders, which is incorporated by reference.
Item 13 — Certain Relationships and Related Transactions, and Director Independence
| | |
| ITEM 13 — CERTAIN RELATIONSHIPS AND RELATED TRANSACTIONS, AND DIRECTOR INDEPENDENCE |
Information required under this Item is contained in Xcel Energy Inc.’s Proxy Statement for its 20182022 Annual Meeting of Shareholders, which is incorporated by reference.
Item 14 — Principal Accountant Fees and Services
| | |
| ITEM 14 — PRINCIPAL ACCOUNTANT FEES AND SERVICES |
Information required under this Item (aggregate fees billed to us by our principal accountant, Deloitte & Touche LLP (PCAOB ID No. 34)) is contained in Xcel Energy Inc.’s Proxy Statement for its 20182022 Annual Meeting of Shareholders, which is incorporated by reference.
PART IV
Item 15 — Exhibits, Financial Statement Schedules
| | |
| ITEM 15 — EXHIBIT AND FINANCIAL STATEMENT SCHEDULES |
| | | | | | | | | | | |
1.1 | Consolidated Financial Statements:Statements |
| Management Report on Internal Controls Over Financial Reporting — For the year ended Dec. 31, 2017.2021. |
| Report of Independent Registered Public Accounting Firm — Financial Statements |
| Report of Independent Registered Public Accounting Firm — and Internal Controls Over Financial Reporting |
| Consolidated Statements of Income — For each of the three years ended Dec. 31, 2017, 2016,2021, 2020, and 2015.2019. |
| Consolidated Statements of Comprehensive Income — For each of the three years ended Dec. 31, 2017, 2016,2021, 2020, and 2015.2019. |
| Consolidated Statements of Cash Flows — For each of the three years ended Dec. 31, 2017, 2016,2021, 2020, and 2015.2019. |
| Consolidated Balance Sheets — As of Dec. 31, 20172021 and 2016.2020. |
| Consolidated Statements of Common Stockholders’ Equity — For each of the three years ended Dec. 31, 2017, 2016,2021, 2020, and 2015.2019. |
| Consolidated Statements of Capitalization — As of Dec. 31, 2017 and 2016. |
| 2 | |
2. | Schedule I — Condensed Financial Information of Registrant. |
| Schedule II — Valuation and Qualifying Accounts and Reserves for the years ended Dec. 31, 2017, 20162021, 2020, and 2015.2019. |
| |
3.3 | Exhibits |
| * | Indicates incorporation by reference |
| + | Executive Compensation Arrangements and Benefit Plans Covering Executive Officers and Directors |
| | | | | | | | | | | |
| Xcel Energy Inc. |
| Exhibit Number | Description | Report or Registration Statement | Exhibit Reference |
| | Xcel Energy Inc. Form 8-K dated May 16, 2012 (file no. 001-03034)). | 3.01 |
| | Xcel Energy Inc. Form 8-K dated Feb. 18, 2016 (file no. 001-03034)).April 3, 2020 | 3.01 |
| | | | | | | | | | | |
| Xcel Energy Inc. Form 10-K for the year ended Dec. 31, 2019 | 4.01 |
|
| | | | | | | | | | | |
| | Xcel Energy Inc. Form 8-K (file no. 001-03034) dated Dec. 14, 2000).2000 | 4.01 |
| | Xcel Energy Inc. Form 8-K (file no. 001-03034) dated June 6, 2006).2006 | 4.01 |
| | Xcel Energy Inc. Form 8-K (file no. 001-03034) dated Jan. 16, 2008).2008 | 4.01 |
| | Xcel Energy Inc. Form 8-K (file no. 001-03034) dated Jan. 16, 2008).2008 | 4.03 |
| |
| | Xcel Energy Inc. Form 8-K dated Sept. 12, 2011 (file no. 001-03034)). | 4.01 |
| | Xcel Energy Inc. Form 8-K dated June 1, 2015 (file no. 001-03034)). | 4.01 |
| |
| | Xcel Energy Inc. Form 8-K dated Dec. 1, 2016 | 4.01 |
| | Xcel Energy Inc. Form 8-K dated June 25, 2018 | 4.01 |
| | Xcel Energy Inc. Form 8-K dated Nov. 7, 2019 | 4.01 |
| | Xcel Energy Inc. Form 8-K dated April 1, 2020 | 4.01 |
| | Xcel Energy Inc. Form 8-K dated Sept. 25, 2020 | 4.01 |
| Supplemental Indenture No. 15, dated as of Nov. 3, 2021 between Xcel Energy Inc. and Computershare Trust Company, N.A. (as successor to Wells Fargo Bank, National Association), as Trustee, creating $500 million principal amount of 1.75% Senior Notes, Series due March 15, 2022 and $500.0 million aggregate principal amount of 3.35 percent Senior Notes, Series due Dec. 1, 2026 (Exhibit 4.01 to Form 8-K dated Dec. 1, 2016 (file no. 001-03034)). |
| | | | | | | | | | | |
NSP-Minnesota |
| |
| |
| |
| |
| |
| |
| |
| |
| |
| |
| |
|
| | | | | | | | | | | |
| |
| |
| |
| Supplemental Indenture dated as of Aug. 1, 2015 between NSP-Minnesota and The Bank of New York Mellon Trust Company, N.A., as successor Trustee, creating $300 million principal amount of 2.20 percent First Mortgage Bonds, Series due Aug. 15, 20202027 and $300 million principal amount of 4.00 percent First Mortgage Bonds, Series2.35% Senior Notes, Series due Aug.Nov. 15, 2045 (Exhibit 4.01 to Form 8-K of NSP-Minnesota dated Aug. 11, 2015 (file no. 001-31387)).2031 |
| |
|
|
| | | | | | | | | | | |
NSP-Wisconsin |
| |
| |
| |
| |
| |
| |
| |
| | | | | | | | | | | |
PSCo |
| |
| |
| |
| |
| |
|
| | | | | | | | | | | |
| |
| |
| Nov. 3, 2021 | 4.01 |
| |
| |
| |
| |
| |
| | | | | | | | | | | |
SPS | | | | | | | | | | | |
| |
| |
| |
| |
| |
| |
| |
| |
| |
| | | | | | | | | | | |
Xcel Energy Inc. |
| | Xcel Energy Inc. Form 10-K of Xcel Energy (file no. 001-03034) for the year ended Dec. 31, 2008). |
|
| 2008 | | | | | | | | | | | 10.02 |
| | Xcel Energy Inc. Form 10-K of Xcel Energy (file no. 001-03034) for the year ended Dec. 31, 2008).2008 | 10.05 |
| | Xcel Energy Inc. Non-Employee Directors Deferred Compensation Plan as amended and restated Jan. 1, 2009 (Exhibit 10.08 to Form 10-K of Xcel Energy (file no. 001-03034) for the year ended Dec. 31, 2008).2011 | 10.18 |
| | Xcel Energy Services Inc. and utility companies (Exhibit H-1 to Form U5B (file no. 001-03034) dated Nov. 16, 2000).10-Q for the quarter ended June 30, 2016 | 10.01 |
| | Xcel Energy Inc. Form 10-Q for the quarter ended June 30, 2018 | 10.01 |
| | Xcel Energy Inc. Form 10-Q for the quarter ended March 31, 2020 | 10.02 |
| | Xcel Energy Inc. Form 10-Q for the quarter ended June 30, 2020 | 10.01 |
| | Xcel Energy Inc. Form 10-K of Xcel Energy (file no. 001-03034) for the year ended Dec. 31, 2008).2008 | 10.17 |
| | Xcel Energy (file no. 001-03034)Inc. Definitive Proxy Statement dated April 6, 2010 | Appendix A |
| | Xcel Energy Inc. Form 10-Q for the quarter ended Sept. 30, 2009).March 31, 2013 | 10.01 |
| | Xcel Energy Inc. Form 10-Q of Xcel Energy (file no. 001-03034) for the quarter ended Sept. 30, 2009).2009 | 10.08 |
| | Xcel Energy Inc. (file no. 001-03034) dated April 6, 2010).Form 10-K for the year ended Dec. 31, 2008 | 10.07 |
| | Xcel Energy Inc. Form 10-K for the year ended Dec. 31, 2011 | 10.17 |
| | Xcel Energy Inc. Form 10-K for the year ended Dec. 31, 2013 | 10.22 |
| | Xcel Energy Inc. Form 10-Q for the quarter ended Sept. 30, 2016 | 10.01 |
| | Xcel Energy Inc. Form 10-Q for the quarter ended Sept. 30, 2017 | 10.1 |
| | Xcel Energy Inc. (file no. 001-03034) dated April 6, 2010).Form 10-K for the year ended Dec. 31, 2018 | 10.34 |
| | Xcel Energy Inc. Form 10-K for the year ended Dec. 31, 2018 | 10.35 |
| | Xcel Energy Inc. Form 10-K for the year ended Dec. 31, 2019 | 10.32 |
| | Xcel Energy Inc. Definitive Proxy Statement (file no. 001-03034) fileddated April 5, 2011).2011 | Appendix A |
| |
| |
| |
| |
| |
| |
| |
| |
| |
| | Xcel Energy Inc. Form 8-K of Xcel Energy, dated May 26,20, 2015 (file no. 001-03034). | 10.02 |
| | Xcel Energy Inc. Form 10-Q for the quarter ended September 30, 2021 | 10.01 |
| | Xcel Energy Inc. 2015 Omnibus Incentive Plan. (Exhibit 10.03 to Form 8-K of Xcel Energy, dated May 26, 2015 (file no. 001-03034). |
| 2018 | 10.36 |
| | Xcel Energy Inc. Executive Annual Incentive Award Sub-plan pursuant to the Xcel Energy Inc. 2015 Omnibus Incentive Plan (Exhibit 10.29 to Form 10-K of Xcel Energy (file no. 001-03034) for the year ended Dec. 31, 2015). |
| U5B dated Nov. 16, 2000 | H-1 |
|
| | | | | | | | | | | |
| SecondThird Amended and Restated Credit Agreement, dated as of June 20, 20167, 2019 among Xcel Energy Inc., as Borrower, the several lenders from time to time parties thereto, JPMorgan Chase Bank, N.A., as Administrative Agent, Bank of America, N.A. and Barclays Bank Plc, as Syndication Agents, and Wells Fargo Bank, National Association, MUFG Bank, Ltd., and The Bank of Tokyo-Mitsubishi UFJ, Ltd.Citibank, N.A., as Documentation Agents. (Exhibit 99.01 to Form 8-K of Xcel Energy dated June 20, 2016 (file no. 001-03034)).Agents |
| 8-K dated June 7, 2019
| 99.01 |
| |
| |
| | Xcel Energy Inc. Form 8-K dated February 18, 2021 | 10.01 |
| | Xcel Energy Inc. Form 8-K dated December 10, 2021 | 10.01 |
| | | |
| NSP-Minnesota |
| | Xcel Energy Inc. Form S-3 dated April 18, 2018 | 4(b)(3) |
| | Xcel Energy Inc. Form 10-K for the year ended Dec. 31, 2017 | 4.11 |
| | Xcel Energy Inc. Form 10-K for the year ended Dec. 31, 2017 | 4.12 |
| | NSP-Minnesota Form 10-12G dated Oct. 5, 2000 | 4.51 |
| | Xcel Energy Inc. Form S-3 dated April 18, 2018 | 4(b)(7) |
| | NSP-Minnesota Form 10-12G dated Oct. 5, 2000 | 4.63 |
| | NSP-Minnesota Form 8-K dated July 14, 2005 | 4.01 |
| | NSP-Minnesota Form 8-K dated May 18, 2006 | 4.01 |
| | NSP-Minnesota Form 8-K dated June 19, 2007 | 4.01 |
| | NSP-Minnesota Form 8-K dated Nov. 16, 2009 | 4.01 |
| | NSP-Minnesota Form 8-K dated Aug. 4, 2010 | 4.01 |
| | NSP-Minnesota Form 8-K dated Aug. 13, 2012 | 4.01 |
| | NSP-Minnesota Form 8-K dated May 20, 2013 | 4.01 |
| | NSP-Minnesota Form 8-K dated May 13, 2014 | 4.01 |
| | NSP-Minnesota Form 8-K dated Aug. 11, 2015 | 4.01 |
| | NSP-Minnesota Form 8-K dated May 31, 2016 | 4.01 |
| | NSP-Minnesota Form 8-K of Xcel Energy dated Dec. 5,Sept. 13, 2017 (file no. 001-03034)). | 4.01 |
| |
| NSP-Minnesota Form 8-K dated Sept. 10, 2019 | | | | | | | | | | | |
NSP-Minnesota4.01 |
| | NSP-Minnesota 8-K dated June 15, 2020 | 4.01 |
| | NSP-Minnesota 8-K dated March 30, 2021 | 4.01 |
| | NSP-Wisconsin Form S-4 (file no. 333-112033) dated Jan. 21, 2004).2004 | 10.01 |
| SecondThird Amended and Restated Credit Agreement, dated as of June 20, 20167, 2019 among NSP-Minnesota, as Borrower, the several lenders from time to time parties thereto, JPMorgan Chase Bank, N.A., as Administrative Agent, Bank of America, N.A. and Barclays Bank Plc, as Syndication Agents, and Wells Fargo Bank, National Association, MUFG Bank, Ltd., and The Bank of Tokyo-Mitsubishi UFJ, Ltd.Citibank, N.A., as Documentation Agents. (Exhibit 99.02 toAgents | Xcel Energy Inc. Form 8-K of Xcel Energy dated June 20, 2016 (file no. 001-03034)).7, 2019 | 99.02 |
| | | |
| NSP-Wisconsin |
| | Xcel Energy Inc. Form S-3 dated April 18, 2018 | 4(c)(3) |
| | NSP-Wisconsin Form 8-K dated Sept. 25, 2000 | 4.01 |
| | | | | | | | | | | |
| | NSP-Wisconsin Form 8-K dated Sept. 3, 2008 | 4.01 |
| | NSP-Wisconsin Form 8-K dated Oct. 10, 2012 | 4.01 |
| | NSP-Wisconsin Form 8-K dated June 23, 2014 | 4.01 |
| | NSP-Wisconsin Form 8-K dated Dec. 4, 2017 | 4.01 |
| | NSP-Wisconsin Form 8-K dated Sept. 12, 2018 | 4.01 |
| | NSP-Wisconsin Form 8-K dated May 26, 2020 | 4.01 |
| | NSP-Wisconsin Form 8-K dated July 20, 2021 | 4.01 |
| | NSP-Wisconsin Form S-4 (file no. 333-112033) dated Jan. 21, 2004).2004 | 10.01 |
| SecondThird Amended and Restated Credit Agreement, dated as of June 20, 20167, 2019 among NSP-Wisconsin, as Borrower, the several lenders from time to time parties thereto, JPMorgan Chase Bank, N.A., as Administrative Agent, Bank of America, N.A. and Barclays Bank Plc, as Syndication Agents, and Wells Fargo Bank, National Association, MUFG Bank, Ltd., and The Bank of Tokyo-Mitsubishi UFJ, Ltd.Citibank, N.A., as Documentation Agents. (Exhibit 99.05 toAgents | Xcel Energy Inc. Form 8-K of Xcel Energy dated June 20, 2016 (file no. 001-03034)). |
| 7, 2019 | |
PSCo | 99.05 |
| | NSP-Wisconsin Form 8-K dated July 20, 2021 | 1.01 |
| | | |
| PSCo |
| | Xcel Energy Inc. Form S-3 dated April 18, 2018 | 4(d)(3) |
| | PSCo Form 8-K dated Aug. 8, 2007 | 4.01 |
| | PSCo Form 8-K dated Aug. 6, 2008 | 4.01 |
| | PSCo Form 8-K dated Aug. 9, 2011 | 4.01 |
| | PSCo Form 8-K dated Sept. 11, 2012 | 4.01 |
| | PSCo Form 8-K dated March 26, 2013 | 4.01 |
| | PSCo Form 8-K dated March 10, 2014 | 4.01 |
| | PSCo Form 8-K dated May 12, 2015 | 4.01 |
| | PSCo Form 8-K dated June 13, 2016 | 4.01 |
| | PSCo Form 8-K dated June 19, 2017 | 4.01 |
| | PSCo Form 8-K dated June 21, 2018 | 4.01 |
| | PSCo Form 8-K dated March 13, 2019 | 4.01 |
| | PSCo Form 8-K dated August 13, 2019 | 4.01 |
| | PSCo Form 8-K dated May 15, 2020 | 4.01 |
| | PSCo Form 8-K dated March 1, 2021 | 4.01 |
| | Xcel Energy Inc. Form 8-K of Xcel Energy (file no. 001-03034) dated Dec. 3, 2004).2004 | 99.02 |
| SecondThird Amended and Restated Credit Agreement, dated as of June 20, 20167, 2019 among PSCo, as Borrower, the several lenders from time to time parties thereto, JPMorgan Chase Bank, N.A., as Administrative Agent, Bank of America, N.A. and Barclays Bank Plc, as Syndication Agents, and Wells Fargo Bank, National Association, MUFG Bank, Ltd., and The Bank of Tokyo-Mitsubishi UFJ, Ltd.Citibank, N.A., as Documentation Agents. (Exhibit 99.03 toAgents | Xcel Energy Inc. Form 8-K of Xcel Energy dated June 20, 2016 (file no. 001-03034)).7, 2019 | 99.03 |
| | | |
| SPS | |
| | SPS Form 8-K dated Feb. 25, 1999 | 99.2 |
| | Xcel Energy Inc. Form 10-Q for the quarter ended Sept. 30, 2003 | 4.04 |
| | SPS Form 8-K dated Oct. 3, 2006 | 4.01 |
| | SPS Form 8-K dated Aug. 10, 2011 | 4.01 |
| | | | | | | | | | | |
| | SPS Form 8-K dated Aug. 10, 2011 | 4.02 |
| | SPS Form 8-K dated June 9, 2014 | 4.02 |
| | SPS Form 8-K dated Aug. 12, 2016 | 4.02 |
| | SPS Form 8-K dated Aug 9. 2017 | 4.02 |
| | SPS Form 8-K dated Nov. 5, 2018 | 4.02 |
| | SPS Form 8-K dated June 18, 2019 | 4.02 |
| | SPS Form 8-K dated May 18, 2020 | 4.02 |
| Third Amended and Restated Credit Agreement, dated as of June 20, 20167, 2019 among SPS, as Borrower, the several lenders from time to time parties thereto, JPMorgan Chase Bank, N.A., as Administrative Agent, Bank of America, N.A. and Barclays Bank Plc, as Syndication Agents, and Wells Fargo Bank, National Association, MUFG Bank, Ltd., and The Bank of Tokyo-Mitsubishi UFJ, Ltd.Citibank, N.A., as Documentation Agents. (Exhibit 99.04 toAgents | Xcel Energy Inc. Form 8-K of Xcel Energy dated June 20, 2016 (file no. 001-03034)).7, 2019 | 99.04 |
| | | |
| Xcel Energy Inc. |
| |
| |
| |
| |
|
| | | | | | | | | | | |
| |
| |
| |
| 101.INS | Inline XBRL Instance Document - the instance document does not appear in the Interactive Data File because its XBRL tags are embedded within the Inline XBRL document |
101101.SCH | The following materials from Xcel Energy Inc.’s Annual Report on Form 10-K for the year ended Dec. 31, 2017 are formattedInline XBRL Schema |
| 101.CAL | Inline XBRL Calculation |
| 101.DEF | Inline XBRL Definition |
| 101.LAB | Inline XBRL Label |
| 101.PRE | Inline XBRL Presentation |
| 104 | Cover Page Interactive Data File (formatted as Inline XBRL and contained in XBRL (eXtensible Business Reporting Language): (i) the Consolidated Statements of Income, (ii) the Consolidated Statements of Comprehensive Income, (iii) the Consolidated Statements of Cash Flows, (iv) the Consolidated Balance Sheets, (v) the Consolidated Statements of Common Stockholders’ Equity, (vi) Consolidated Statements of Capitalization, (vii) Notes to Consolidated Financial Statements, (viii) document and entity information, (ix) Schedule I, and (x) Schedule II.Exhibit 101) |
SCHEDULE I
CONDENSED STATEMENTS OF INCOME AND COMPREHENSIVE INCOME
(amounts in millions, except per share data)
| | | | | | | | | | | | | | | | | |
| Year Ended Dec. 31 |
| 2021 | | 2020 | | 2019 |
| Income | | | | | |
| Equity earnings of subsidiaries | $ | 1,744 | | | $ | 1,646 | | | $ | 1,505 | |
| Total income | 1,744 | | | 1,646 | | | 1,505 | |
| Expenses and other deductions | | | | | |
| Operating expenses | 21 | | | 43 | | | 23 | |
| Other income | 3 | | | (4) | | | (9) | |
| Interest charges and financing costs | 173 | | | 198 | | | 173 | |
| Total expenses and other deductions | 197 | | | 237 | | | 187 | |
| Income before income taxes | 1,547 | | | 1,409 | | | 1,318 | |
| Income tax benefit | (50) | | | (64) | | | (54) | |
| Net income | $ | 1,597 | | | $ | 1,473 | | | $ | 1,372 | |
| | | | | |
| Other Comprehensive Income | | | | | |
| Pension and retiree medical benefits, net of tax of $ 1, $1 and $1, respectively | $ | 8 | | | $ | 5 | | | $ | 3 | |
| Derivative instruments, net of tax of $3, $(1) and $(7), respectively | 10 | | | (5) | | | (20) | |
| Other comprehensive income (loss) | 18 | | | — | | | (17) | |
| Comprehensive income | $ | 1,615 | | | $ | 1,473 | | | $ | 1,355 | |
| | | | | |
| Weighted average common shares outstanding: | | | | | |
| Basic | 539 | | | 527 | | | 519 | |
| Diluted | 540 | | | 528 | | | 520 | |
| Earnings per average common share: | | | | | |
| Basic | $ | 2.96 | | | $ | 2.79 | | | $ | 2.64 | |
| Diluted | 2.96 | | | 2.79 | | | 2.64 | |
| See Notes to Condensed Financial Statements |
XCEL ENERGY INC.
CONDENSED STATEMENTS OF CASH FLOWS
(amounts in millions)
| | | | | | | | | | | | | | | | | |
| Year Ended Dec. 31 |
| 2021 | | 2020 | | 2019 |
| Operating activities | | | | | |
| Net cash provided by operating activities | $ | 1,147 | | | $ | 2,377 | | | $ | 1,389 | |
| Investing activities | | | | | |
| Capital contributions to subsidiaries | (1,661) | | | (2,553) | | | (1,594) | |
| Net return (investments) in the utility money pool | 57 | | | (18) | | | 39 | |
| Other, net | — | | | (1) | | | — | |
| Net cash used in investing activities | (1,604) | | | (2,572) | | | (1,555) | |
| Financing activities | | | | | |
| Proceeds (repayment of) from short-term borrowings, net | 638 | | | (500) | | | 12 | |
| Proceeds from issuance of long-term debt | 791 | | | 1,089 | | | 1,120 | |
| Repayment of long-term debt | (400) | | | (300) | | | (550) | |
| Proceeds from issuance of common stock | 366 | | | 727 | | | 458 | |
| Repurchase of common stock | — | | | (4) | | | — | |
| Dividends paid | (935) | | | (856) | | | (791) | |
| Other | (16) | | | (17) | | | (14) | |
| Net cash provided by financing activities | 444 | | | 139 | | | 235 | |
| Net change in cash, cash equivalents, and restricted cash | (13) | | | (56) | | | 69 | |
| Cash, cash equivalents and restricted cash at beginning of period | 14 | | | 70 | | | 1 | |
| Cash, cash equivalents and restricted cash at end of period | $ | 1 | | | $ | 14 | | | $ | 70 | |
| See Notes to Condensed Financial Statements |
XCEL ENERGY INC.
XCEL ENERGY INC. CONDENSED STATEMENTS OF INCOME AND COMPREHENSIVE INCOME (amounts in millions, except per share data)
|
| | | | | | | | | | | |
| | Year Ended Dec. 31 |
| | 2017 | | 2016 | | 2015 |
| Income | | | | | |
| Equity earnings of subsidiaries | $ | 1,263 |
| | $ | 1,199 |
| | $ | 1,046 |
|
| Total income | 1,263 |
| | 1,199 |
| | 1,046 |
|
| Expenses and other deductions | | | | | |
| Operating expenses | 30 |
| | 22 |
| | 20 |
|
| Other income | (6 | ) | | (3 | ) | | (1 | ) |
| Interest charges and financing costs | 128 |
| | 116 |
| | 91 |
|
| Total expenses and other deductions | 152 |
| | 135 |
| | 110 |
|
| Income before income taxes | 1,111 |
| | 1,064 |
| | 936 |
|
| Income tax benefit | (37 | ) | | (59 | ) | | (48 | ) |
| Net income | $ | 1,148 |
| | $ | 1,123 |
| | $ | 984 |
|
| | | | | | |
| Other Comprehensive Income | | | | | |
| Pension and retiree medical benefits, net of tax of $3, $(3), and $(3) respectively | $ | 4 |
| | $ | (4 | ) | | $ | (5 | ) |
| Derivative instruments, net of tax of $2, $2, and $2, respectively | 3 |
| | 4 |
| | 3 |
|
| Other comprehensive income (loss) | 7 |
| | — |
| | (2 | ) |
| Comprehensive income | $ | 1,155 |
| | $ | 1,123 |
| | $ | 982 |
|
| | | | | | |
| Weighted average common shares outstanding: | | | | | |
| Basic | 509 |
| | 509 |
| | 508 |
|
| Diluted | 509 |
| | 509 |
| | 508 |
|
| Earnings per average common share: | | | | | |
| Basic | $ | 2.26 |
| | $ | 2.21 |
| | $ | 1.94 |
|
| Diluted | 2.25 |
| | 2.21 |
| | 1.94 |
|
| | | | | | |
| Cash dividends declared per common share | 1.44 |
| | 1.36 |
| | 1.28 |
|
| | | | | | |
| See Notes to Condensed Financial Statements |
(amounts in millions)
| | | | | | | | | | | |
| Dec. 31 |
| 2021 | | 2020 |
| Assets | | | |
| Cash and cash equivalents | $ | 1 | | | $ | 14 | |
| Accounts receivable from subsidiaries | 430 | | | 424 | |
| Other current assets | 6 | | | 6 | |
| Total current assets | 437 | | | 444 | |
| Investment in subsidiaries | 21,167 | | | 19,102 | |
| Other assets | 71 | | | 40 | |
| Total other assets | 21,238 | | | 19,142 | |
| Total assets | $ | 21,675 | | | $ | 19,586 | |
| Liabilities and Equity | | | |
| Current portion of long-term debt | — | | | 400 | |
| Dividends payable | 249 | | | 231 | |
| Short-term debt | 638 | | | — | |
| Other current liabilities | 29 | | | 21 | |
| Total current liabilities | 916 | | | 652 | |
| Other liabilities | 10 | | | 17 | |
| Total other liabilities | 10 | | | 17 | |
| Commitments and contingencies | | | |
| Capitalization | | | |
| Long-term debt | 5,137 | | | 4,342 | |
| Common stockholders' equity | 15,612 | | | 14,575 | |
| Total capitalization | 20,749 | | | 18,917 | |
| Total liabilities and equity | $ | 21,675 | | | $ | 19,586 | |
| See Notes to Condensed Financial Statements |
XCEL ENERGY INC. CONDENSED STATEMENTS OF CASH FLOWS (amounts in millions)
|
| | | | | | | | | | | |
| | Year Ended Dec. 31 |
| | 2017 | | 2016 | | 2015 |
| Operating activities | | | | | |
| Net cash provided by operating activities | $ | 1,208 |
| | $ | 817 |
| | $ | 705 |
|
| Investing activities | | | | | |
| Capital contributions to subsidiaries | (849 | ) | | (414 | ) | | (820 | ) |
| Investments in the utility money pool | (1,258 | ) | | (1,880 | ) | | (971 | ) |
| Return of investments in the utility money pool | 1,173 |
| | 1,880 |
| | 987 |
|
| Net cash used in investing activities | (934 | ) | | (414 | ) | | (804 | ) |
| Financing activities | | | | | |
| Proceeds from (repayment of) short-term borrowings, net | 715 |
| | (516 | ) | | 204 |
|
| Proceeds from issuance of long-term debt | — |
| | 1,539 |
| | 495 |
|
| Repayment of long-term debt | (250 | ) | | (704 | ) | | — |
|
| Proceeds from issuance of common stock | — |
| | — |
| | 7 |
|
| Repurchase of common stock | (3 | ) | | (32 | ) | | — |
|
| Dividends paid | (721 | ) | | (681 | ) | | (607 | ) |
| Other | (14 | ) | | (9 | ) | | (1 | ) |
| Net cash (used in) provided by financing activities | (273 | ) | | (403 | ) | | 98 |
|
| Net change in cash and cash equivalents | 1 |
| | — |
| | (1 | ) |
| Cash and cash equivalents at beginning of period | — |
| | — |
| | 1 |
|
| Cash and cash equivalents at end of period | $ | 1 |
| | $ | — |
| | $ | — |
|
| | | | | | |
| See Notes to Condensed Financial Statements |
XCEL ENERGY INC. CONDENSED BALANCE SHEETS (amounts in millions)
|
| | | | | | | |
| | Dec. 31 |
| | 2017 | | 2016 |
| Assets | | | |
| Cash and cash equivalents | $ | 1 |
| | $ | — |
|
| Accounts receivable from subsidiaries | 302 |
| | 364 |
|
| Other current assets | 1 |
| | 10 |
|
| Total current assets | 304 |
| | 374 |
|
| Investment in subsidiaries | 14,932 |
| | 13,904 |
|
| Other assets | 103 |
| | 163 |
|
| Total other assets | 15,035 |
| | 14,067 |
|
| Total assets | $ | 15,339 |
| | $ | 14,441 |
|
| Liabilities and Equity | | | |
| Current portion of long-term debt | $ | — |
| | $ | 250 |
|
| Dividends payable | 183 |
| | 172 |
|
| Short-term debt | 783 |
| | 68 |
|
| Other current liabilities | 11 |
| | 18 |
|
| Total current liabilities | 977 |
| | 508 |
|
| Other liabilities | 29 |
| | 37 |
|
| Total other liabilities | 29 |
| | 37 |
|
| Commitments and contingencies |
|
| |
|
|
| Capitalization | | | |
| Long-term debt | 2,878 |
| | 2,875 |
|
| Common stockholders’ equity | 11,455 |
| | 11,021 |
|
| Total capitalization | 14,333 |
| | 13,896 |
|
| Total liabilities and equity | $ | 15,339 |
| | $ | 14,441 |
|
| | | | |
| See Notes to Condensed Financial Statements |
NOTES TO CONDENSED FINANCIAL STATEMENTS
Notes to Condensed Financial Statements
Incorporated by reference are Xcel Energy’s consolidated statements of common stockholders’ equity and OCIother comprehensive income in Part II, Item 8.
Basis of Presentation — The condensed financial information of Xcel Energy Inc. is presented to comply with Rule 12-04 of Regulation S-X. Xcel Energy Inc.’s investments in subsidiaries are presented under the equity method of accounting. Under this method, the assets and liabilities of subsidiaries are not consolidated. The investments in net assets of the subsidiaries are recorded in the balance sheets. The income from operations of the subsidiaries is reported on a net basis as equity in income of subsidiaries.
As a holding company with no business operations, Xcel Energy Inc.’s assets consist primarily of investments in its utility subsidiaries. Xcel Energy Inc.’s material cash inflows are only from dividends and other payments received from its utility subsidiaries and the proceeds raised from the sale of debt and equity securities. The ability of its utility subsidiaries to make dividend and other payments is subject to the availability of funds after taking into account their respective funding requirements, the terms of their respective indebtedness, the regulations of the FERC under the Federal Power Act, and applicable state laws. Management does not expect maintaining these requirements to have an impact on Xcel Energy Inc.’s ability to pay dividends at the current level in the foreseeable future. Each of its utility subsidiaries, however, is legally distinct and has no obligation, contingent or otherwise, to make funds available to Xcel Energy Inc.
Guarantees and Indemnifications
Xcel Energy Inc. provides guarantees and bond indemnities under specified agreements or transactions, which guarantee payment or performance. Xcel Energy Inc.’s exposure is based upon the net liability of the relevant subsidiary under the specified agreements or transactions. Most of the guarantees and bond indemnities issued by Xcel Energy Inc. limit the exposure to a maximum stated amount. As of Dec. 31, 2021 and 2020, Xcel Energy Inc. had no assets held as collateral related to guarantees, bond indemnities and indemnification agreements.
Guarantees and bond indemnities issued and outstanding as of Dec. 31, 2021: | | | | | | | | | | | | | | | | | | | | | | | | | | |
| (Millions of Dollars) | | Guarantor | | Guarantee
Amount | | Current
Exposure | | Triggering
Event |
Guarantee of loan for Hiawatha Collegiate High School(a) | | Xcel Energy Inc. | | $ | 1 | | | — | | | (c) |
Guarantee performance and payment of surety bonds for Xcel Energy Inc.’s utility subsidiaries(b) | | Xcel Energy Inc. | | 59 | | | (e) | | (d) |
(a)The term of this guarantee expires the earlier of 2024 or full repayment of the loan.
(b)The surety bonds primarily relate to workers compensation benefits and utility projects. The workers compensation bonds are renewed annually and the project based bonds expire in conjunction with the completion of the related projects.
(c)Nonperformance and/or nonpayment.
(d)Per the indemnity agreement between Xcel Energy Inc. and the various surety companies, surety companies have the discretion to demand that collateral be posted.
(e)Due to the magnitude of projects associated with the surety bonds, the total current exposure of this indemnification cannot be determined. Xcel Energy Inc. believes the exposure to be significantly less than the total amount of the outstanding bonds.
Indemnification Agreements
Xcel Energy Inc. provides indemnifications through contracts entered into in the normal course of business. Indemnifications are primarily against adverse litigation outcomes in connection with underwriting agreements, breaches of representations and warranties, including corporate existence, transaction authorization and certain income tax matters. Obligations under these agreements may be limited in terms of duration or amount. Maximum future payments under these indemnifications cannot be reasonably estimated as the dollar amounts are often not explicitly stated.
Related Party Transactions — Xcel Energy Inc. presents its related party receivables net of payables. Accounts receivable and payablenet of payables with affiliates at Dec. 31 were:31:
| | | | | | | | | | | | | | |
| (Millions of Dollars) | | 2021 | | 2020 |
| NSP-Minnesota | | $ | 104 | | | $ | 81 | |
| NSP-Wisconsin | | 25 | | | 9 | |
| PSCo | | 91 | | | 98 | |
| SPS | | 58 | | | 55 | |
| Xcel Energy Services Inc. | | 125 | | | 159 | |
| | | | |
| Other subsidiaries of Xcel Energy Inc. | | 27 | | | 22 | |
| | $ | 430 | | | $ | 424 | |
|
| | | | | | | | | | | | | | | | |
| | | 2017 | | 2016 |
| (Millions of Dollars) | | Accounts Receivable | | Accounts Payable | | Accounts Receivable | | Accounts Payable |
| NSP-Minnesota | | $ | 68 |
| | $ | — |
| | $ | 59 |
| | $ | — |
|
| NSP-Wisconsin | | 13 |
| | — |
| | 14 |
| | — |
|
| PSCo | | 69 |
| | — |
| | 132 |
| | — |
|
| SPS | | 26 |
| | — |
| | 31 |
| | — |
|
| Xcel Energy Services Inc. | | 95 |
| | — |
| | 93 |
| | — |
|
| Xcel Energy Ventures Inc. | | 14 |
| | — |
| | 17 |
| | — |
|
| Other subsidiaries of Xcel Energy Inc. | | 17 |
| | — |
| | 18 |
| | — |
|
| | | $ | 302 |
| | $ | — |
| | $ | 364 |
| | $ | — |
|
Dividends — Cash dividends paid to Xcel Energy Inc. by its subsidiaries were $1,063$1,344 million, $923$2,527 million and $784$2,987 million for the years ended Dec. 31, 2017, 20162021, 2020 and 2015,2019, respectively. These cash receipts are included in operating cash flows of the condensed statements of cash flows.
Money Pool— Xcel Energy received FERC approval was received to establish a utility money pool arrangement with the utility subsidiaries, subject to receipt of required state regulatory approvals. The utility money pool allows for short-term investments in and borrowings between the utility subsidiaries. Xcel Energy Inc. may make investments in the utility subsidiaries at market-based interest rates; however, the money pool arrangement does not allow the utility subsidiaries to make investments in Xcel Energy Inc. The following tables present money
Money pool lending for Xcel Energy Inc.:
| | | | | | | | |
| (Amounts in Millions, Except Interest Rates) | | Three Months Ended Dec. 31, 2021 |
| Loan outstanding at period end | | $ | — | |
| Average loan outstanding | | — | |
| Maximum loan outstanding | | — | |
| Weighted average interest rate, computed on a daily basis | | N/A |
| Weighted average interest rate at end of period | | N/A |
| Money pool interest income | | $ | — | |
|
| | | | |
| (Amounts in Millions, Except Interest Rates) | | Three Months Ended Dec. 31, 2017 |
| Loan outstanding at period end | | 85 |
|
| Average loan outstanding | | 36 |
|
| Maximum loan outstanding | | 85 |
|
| Weighted average interest rate, computed on a daily basis | | 1.15 | % |
| Weighted average interest rate at end of period | | 1.18 | % |
| Money pool interest income | | $ | 0.1 |
|
| | | (Amounts in Millions, Except Interest Rates) | | Year Ended Dec. 31, 2017 | | Year Ended Dec. 31, 2016 | | Year Ended Dec. 31, 2015 | (Amounts in Millions, Except Interest Rates) | | Year Ended Dec. 31, 2021 | | Year Ended Dec. 31, 2020 | | Year Ended Dec. 31, 2019 |
| Loan outstanding at period end | | 85 |
| | — |
| | — |
| Loan outstanding at period end | | $ | — | | | $ | 57 | | | $ | 39 | |
| Average loan outstanding | | 38 |
| | 66 |
| | 27 |
| Average loan outstanding | | 16 | | | 104 | | | 47 | |
| Maximum loan outstanding | | 226 |
| | 211 |
| | 141 |
| Maximum loan outstanding | | 439 | | | 350 | | | 250 | |
| Weighted average interest rate, computed on a daily basis | | 1.13 | % | | 0.69 | % | | 0.42 | % | Weighted average interest rate, computed on a daily basis | | 0.08 | % | | 0.60 | % | | 2.15 | % |
| Weighted average interest rate at end of period | | 1.18 | % | | N/A |
| | N/A |
| Weighted average interest rate at end of period | | N/A | | 0.07 | % | | 1.63 | |
| Money pool interest income | | $ | 0.4 |
| | $ | 0.5 |
| | $ | 0.1 |
| Money pool interest income | | $ | — | | | $ | 1 | | | $ | 1 | |
See Xcel Energy’s notes to the consolidated financial statements in Part II, Item 8 for other disclosures.8.
SCHEDULE II
Xcel Energy Inc. and Subsidiaries Valuation and Qualifying Accounts Years Ended Dec. 31 | | | | | | | | | | | | | | | | | | | | | | | | | | | | | | | | | | | | | | | | | |
| | Allowance for bad debts | | NOL and tax credit valuation allowances |
| (Millions of Dollars) | | 2021 | | 2020 | | 2019 | | 2021 | | 2020 | | 2019 | |
| Balance at Jan. 1 | | $ | 79 | | | $ | 55 | | | $ | 55 | | | $ | 64 | | | $ | 67 | | | $ | 79 | | |
| Additions charged to costs and expenses | | 60 | | | 60 | | | 42 | | | 5 | | | 6 | | | 9 | | |
| Additions charged to other accounts | | 14 | | (a) | 12 | | (a) | 16 | | (a) | — | | | — | | | — | | |
| Deductions from reserves | | (47) | | (b) | (48) | | (b) | (58) | | (b) | (5) | | (d) | (9) | | (c) | (21) | | (d) |
| Balance at Dec. 31 | | $ | 106 | | | $ | 79 | | | $ | 55 | | | $ | 64 | | | $ | 64 | | | $ | 67 | | |
(a)Recovery of amounts previously written-off.
(b)Deductions related primarily to bad debt write-offs.
(c)Primarily the reduction of valuation allowances for North Dakota ITC, net of federal income tax benefit, that is offset to a regulatory liability forecasted to be used prior to expiration along with valuation allowances that expired.
(d)Primarily reductions to valuation allowances due to additional NOLs and tax credits forecasted to be used prior to expiration.
XCEL ENERGY INC. AND SUBSIDIARIES VALUATION AND QUALIFYING ACCOUNTS YEARS ENDED DEC. 31, 2017, 2016 AND 2015 (amounts in millions)
|
| | | | | | | | | | | | | | | | | | | |
| | | | Additions | | | | |
| | Balance at Jan. 1 | | Charged to Costs and Expenses | | Charged to Other Accounts(a) | | Deductions from Reserves(b) | | Balance at Dec. 31 |
| Allowance for bad debts: | | | | | | | | | |
| 2017 | $ | 51 |
| | $ | 39 |
| | $ | 10 |
| | $ | 48 |
| | $ | 52 |
|
| 2016 | 52 |
| | 39 |
| | 11 |
| | 51 |
| | 51 |
|
| 2015 | 58 |
| | 36 |
| | 12 |
| | 54 |
| | 52 |
|
| NOL and tax credit valuation allowances: | | | | | | | | | |
| 2017 | $ | 58 |
| | $ | 9 |
| | $ | 22 |
| | $ | 12 |
| | $ | 77 |
|
| 2016 | 28 |
| | 3 |
| | 35 |
| | 8 |
| | 58 |
|
| 2015 | 3 |
| | 2 |
| | 25 |
| | 2 |
| | 28 |
|
| | |
(a)
| Accrual of valuation allowance for North Dakota ITC, offset to regulatory liability.ITEM 16 — FORM 10-K SUMMARY |
| |
(b)
| Reductions to valuation allowances for North Dakota ITC carryforwards primarily due to a consolidated adjustment to the regulatory liability accrual referenced above. Reductions to valuation allowances for NOL carryforwards primarily due to changes in forecasted taxable income. |
Item 16 — Form 10-K Summary
None.
SIGNATURES
Signatures
Pursuant to the requirements of Section 13 or 15(d) of the Securities Exchange Act of 1934, the registrant has duly caused this annual report to be signed on its behalf by the undersigned thereunto duly authorized.
| | | | | | | | |
| | XCEL ENERGY INC. |
| | |
| Feb. 23, 2022 | By: | XCEL ENERGY INC./s/ BRIAN J. VAN ABEL |
| | Brian J. Van Abel |
Feb. 23, 2018 | By: | /s/ ROBERT C. FRENZEL |
| | Robert C. Frenzel |
| | Executive Vice President, Chief Financial Officer |
| | (Principal Financial Officer) |
Pursuant to the requirements of the Securities Exchange Act of 1934, this report has been signed below by the following persons on behalf of the registrant and in the capacities on the date indicated above.
| | | | | | | | | | | |
| /s/ ROBERT C. FRENZEL | | Chairman, President, Chief Executive Officer and Director |
| Robert C. Frenzel | | (Principal Executive Officer) |
| | | |
| /s/ BRIAN J. VAN ABEL | | Executive Vice President, Chief Financial Officer |
| Brian J. Van Abel | | (Principal Financial Officer) |
| | | |
| /s/ JEFFREY S. SAVAGE | | Senior Vice President, Controller |
| Jeffrey S. Savage | | (Principal Accounting Officer) |
| | | |
| * | | | Director |
| Lynn Casey | | |
| | | |
| * | /s/ BEN FOWKE | | Chairman, President, Chief Executive Officer and Director |
| Ben FowkeNetha N. Johnson | | (Principal Executive Officer) |
| | | |
| * | /s/ ROBERT C. FRENZEL | | Executive Vice President, Chief Financial OfficerDirector |
| Robert C. FrenzelPatricia L. Kampling | | (Principal Financial Officer) |
| | | |
| * | /s/ JEFFREY S. SAVAGE | | Senior Vice President, ControllerDirector |
| Jeffrey S. SavageGeorge J. Kehl | | (Principal Accounting Officer) |
| | | |
| * | | | Director |
* | | | Director |
| Richard K. Davis | | |
| | | |
* | | | Director |
| Richard T. O’Brien | | |
| | | |
| * | | | Director |
| David K. OwensCharles Pardee | | |
| | | |
| * | | | Director |
| Christopher J. Policinski | | |
| | | |
| * | | | Director |
| James Prokopanko | | |
| | | |
| * | | | Director |
| A. Patricia Sampson | | |
| | | |
* | | | Director |
| James J. Sheppard | | |
| | | |
* | | | Director |
| David A. Westerlund | | |
| | | |
| * | | | Director |
| Kim Williams | | |
| | | |
| * | | | Director |
| Timothy V. Wolf | | |
| | | |
| * | | | Director |
| Daniel Yohannes | | |
| | | |
| *By: | /s/ ROBERT C. FRENZELBRIAN J. VAN ABEL | | Attorney-in-Fact |
| Robert C. FrenzelBrian J. Van Abel | | |