Table of Contents

UNITED STATES

SECURITIES AND EXCHANGE COMMISSION

Washington, D.C. 20549

FORM 10-K

ANNUAL REPORT PURSUANT TO SECTION 13 OR 15(d) OF THE SECURITIES EXCHANGE ACT OF 1934

For the fiscal year ended January 30, 2021February 3, 2024

or

TRANSITION REPORT PURSUANT TO SECTION 13 OR 15(d) OF THE SECURITIES EXCHANGE ACT OF 1934

For the transition period from                                    to

Commission File Number: 1-4365

OXFORD INDUSTRIES, INC.

(Exact name of registrant as specified in its charter)

Georgia


58-0831862

(State or other jurisdiction of incorporation or organization)

(I.R.S. Employer Identification No.)

999 Peachtree Street, N.E., Suite 688, Atlanta, Georgia 30309

(Address of principal executive offices)                              (Zip Code)

Registrant’s telephone number, including area code:

(404) 659-2424

Securities registered pursuant to Section 12(b) of the Act:

Title of each class

Trading Symbol

Name of each exchange on which registered

Common Stock, $1 par value

OXM

New York Stock Exchange

Securities registered pursuant to Section 12(g) of the Act:

NONE

Indicate by check mark if the registrant is a well-known seasoned issuer as defined in Rule 405 of the Securities Act. Yes     No ��

Indicate by check mark if the registrant is not required to file reports pursuant to Section 13 or Section 15(d) of the Act. Yes     No 

Indicate by check mark whether the registrant (1) has filed all reports required to be filed by Section 13 or 15(d) of the Securities Exchange Act of 1934 during the preceding 12 months (or for such shorter period that the registrant was required to file such reports), and (2) has been subject to such filing requirements for the past 90 days. Yes     No 

Indicate by check mark whether the registrant has submitted electronically every Interactive Data File required to be submitted pursuant to Rule 405 of Regulation S-T during the preceding 12 months (or for such shorter period that the registrant was required to submit such files). Yes     No 

Indicate by check mark whether the registrant is a large accelerated filer, an accelerated filer, a non-accelerated filer, a smaller reporting company, or an emerging growth company. See the definitions of "large accelerated filer," "accelerated filer," "smaller reporting company" and "emerging growth company" in Rule 12b-2 of the Exchange Act.

Large accelerated filer

Accelerated filer 

Non-accelerated filer 

Smaller reporting company 

Emerging growth company 

If an emerging growth company, indicate by check mark if the registrant has elected not to use the extended transition period for complying with any new or revised financial accounting standards provided pursuant to Section 13(a) of the Exchange Act.

Indicate by check mark whether the registrant has filed a report on and attestation to its management’s assessment of the effectiveness of its internal control over financial reporting under Section 404(b) of the Sarbanes-Oxley Act (15 U.S.C. 7262(b)) by the registered public accounting firm that prepared or issued its audit report.

If securities are registered pursuant to Section 12(b) of the Act, indicate by check mark whether the financial statements of the registrant included in the filing reflect the correction of an error to previously issued financial statements.

Indicate by check mark whether any of those error corrections are restatements that required a recovery analysis of incentive-based compensation received by any of the registrant’s executive officers during the relevant recovery period pursuant to §240.10D-1(b).

Indicate by check mark whether the registrant is a shell company (as defined in Rule 12b-2 of the Act). Yes     No 

As of July 31, 2020,28, 2023, which is the last business day of the registrant’s most recently completed second fiscal quarter, the aggregate market value of the voting stock held by non-affiliates of the registrant (based upon the closing price for the common stock on the New York Stock Exchange on that date) was $510,615,213.$1,132,153,021. For purposes of this calculation only, shares of voting stock directly and indirectly attributable to executive officers, directors and holders of 10% or more of the registrant’s voting stock (based on Schedule 13G filings made as of or prior to July 31, 2020)28, 2023) are excluded. This determination of affiliate status and the calculation of the shares held by any such person are not necessarily conclusive determinations for other purposes.

Indicate the number of shares outstanding of each of the registrant’s classes of common stock, as of the latest practicable date.

Title of Each Class


Number of Shares Outstanding
as of March 19, 202129, 2024

Common Stock, $1 par value

16,930,73515,629,222

Documents Incorporated by Reference

Portions of our proxy statement for our Annual Meeting of Shareholders to be held on June 15, 202125, 2024 are incorporated by reference into Part III of this Form 10-K.

Table of Contents

Table of Contents

Page

PART I

Item 1.

Business

7

Item 1A.

Risk Factors

25

Item 1B.

Unresolved Staff Comments

39

Item 1C.

Cybersecurity

39

Item 2.

Properties

3940

Item 3.

Legal Proceedings

4041

Item 4.

Mine Safety Disclosures

4041

PART II

Item 5.

Market for Registrant’s Common Equity, Related Stockholder Matters and Issuer Purchases of Equity Securities

41

Item 6.

Selected Financial DataReserved

4243

Item 7.

Management’s Discussion and Analysis of Financial Condition and Results of Operations

4344

Item 7A.

Quantitative and Qualitative Disclosures About Market Risk

6867

Item 8.

Financial Statements and Supplementary Data

7069

Item 9.

Changes in and Disagreements With Accountants on Accounting and Financial Disclosure

108110

Item 9A.

Controls and Procedures

108110

Item 9B.

Other Information

110113

Item 9C.

Disclosure Regarding Foreign Jurisdictions that Prevent Inspections

113

PART III

Item 10.

Directors, Executive Officers and Corporate Governance

110113

Item 11.

Executive Compensation

110113

Item 12.

Security Ownership of Certain Beneficial Owners and Management and Related Stockholder Matters

110113

Item 13.

Certain Relationships and Related Transactions, and Director Independence

110113

Item 14.

Principal AccountingAccountant Fees and Services

110113

PART IV

Item 15.

Exhibits and Financial Statement Schedules

111114

Item 16.

Form 10-K Summary

112115

Signatures

113116

2

Table of Contents

CAUTIONARY STATEMENTS REGARDING FORWARD-LOOKING STATEMENTS

Our SEC filings and public announcements may include forward-looking statements about future events. Generally, the words "believe," "expect," "intend," "estimate," "anticipate," "project," "will" and similar expressions identify forward-looking statements, which generally are not historical in nature. We intend for all forward-looking statements contained herein, in our press releases or on our website, and all subsequent written and oral forward-looking statements attributable to us or persons acting on our behalf, to be covered by the safe harbor provisions for forward-looking statements within the meaning of the Private Securities Litigation Reform Act of 1995 and the provisions of Section 27A of the Securities Act of 1933 and Section 21E of the Securities Exchange Act of 1934 (which Sections were adopted as part of the Private Securities Litigation Reform Act of 1995). Such statements are subject to a number of risks, uncertainties and assumptions including, without limitation, the impact of the ongoing coronavirus (COVID-19) pandemic, including uncertainties about its scope and duration (including resurgence of COVID-19 cases), future store closures or other restrictions (including reduced hours and capacity) due to government mandates, and the effectiveness of store re-openings and reduction initiatives (including our ability to effectively renegotiate rent obligations), any or all of which may also affect many of the following risks; demand for our products, which may be impacted by competitive conditions and/or evolving consumer shopping patterns; macroeconomic factors that may impact consumer discretionary spending and pricing levels for apparel and related products;products, many of which may be impacted by inflationary pressures, elevated interest rates, concerns about the stability of the banking industry or general economic uncertainty, and the effectiveness of measures to mitigate the impact of any restructuring initiatives we may undertake in one these factors; competitive conditions and/or moreevolving consumer shopping patterns; acquisition activities (such as the acquisition of Johnny Was), including our ability to integrate key functions, recognize anticipated synergies and minimize related disruptions or distractions to our business lines,as a result of these activities; supply chain disruptions; costs and availability of labor and freight deliveries, including the process, timing, costs, uncertaintiesour ability to appropriately staff our retail stores and effects of our announced exit of the Lanier Apparel business;food and beverage locations; costs of products as well as the raw materials used in those products; expected pricing levels; costsproducts, as well as our ability to pass along price increases to consumers; energy costs; our ability to respond to rapidly changing consumer expectations; unseasonal or extreme weather conditions or natural disasters, including the ultimate impact of labor; the timingrecent wildfires on the island of shipments requestedMaui; the ability of business partners, including suppliers, vendors, wholesale customers, licensees, logistics providers and landlords, to meet their obligations to us and/or continue our business relationship to the same degree as they have historically; retention of and disciplined execution by key management and other critical personnel; cybersecurity breaches and ransomware attacks, as well as our wholesale customers; expected outcomesand our third party vendors’ ability to properly collect, use, manage and secure business, consumer and employee data and maintain continuity of pending orour information technology systems; the effectiveness of our advertising initiatives in defining, launching and communicating brand-relevant customer experiences; the level of our indebtedness, including the risks associated with heightened interest rates on the debt and the potential litigationimpact on our ability to operate and regulatory actions;expand our business; changes in international, federal or state tax, trade and other laws and regulations, including the potential imposition of additional duties; the abilitytiming of business partners, including suppliers, vendors, licensees and landlords, to meet their obligations to us and/or continueshipments requested by our business relationship to the same degree in light of current or future financial stress, staffing shortages, liquidity challenges and/or bankruptcy filings; weather;wholesale customers; fluctuations and volatility in global financial and/or real estate markets; retention of and disciplined execution by key management; the timing and cost of retail store and restaurantfood and beverage location openings and remodels, technology implementations and other capital expenditures; acquisitionthe timing, cost and disposition activities, includingsuccessful implementation of changes to our distribution network; pandemics or other public health crises; expected outcomes of pending or potential litigation and regulatory actions; the increased consumer, employee and regulatory focus on corporate responsibility issues; the regulation or prohibition of goods sourced, or containing raw materials or components, from certain regions and our ability to timely recognize expected synergies from acquisitions;evidence compliance; access to capital and/or credit markets; the impact of tax and other legislative changes; changes in accounting standards and related guidance; and factors that could affect our consolidated effective tax rate,rate; the risk of impairment to goodwill and other intangible assets; risks related to a shutdown of the US government; and geopolitical risks, including estimated Fiscal 2020 taxable losses eligible for carry back underongoing challenges between the CARES Act.United States and China and those related to the ongoing war in Ukraine, the Israel-Hamas war and the conflict in the Red Sea region. Forward-looking statements reflect our expectations at the time such forward lookingforward-looking statements are made, based on information available at such time, and are not guarantees of performance. Although we believe that the expectations reflected in such forward-looking statements are reasonable, these expectations could prove inaccurate as such statements involve risks and uncertainties, many of which are beyond our ability to control or predict. Should one or more of these risks or uncertainties, or other risks or uncertainties not currently known to us or that we currently deem to be immaterial, materialize, or should underlying assumptions prove incorrect, actual results may vary materially from those anticipated, estimated or projected. Important factors relating to these risks and uncertainties include, but are not limited to, those described in Part I, Item 1A. Risk Factors and elsewhere in this report and those described from time to time in our future reports filed with the SEC. We caution that one should not place undue reliance on forward-looking statements, which speak only as of the date on which they are made. We disclaim any intention, obligation or duty to update or revise any forward-looking statements, whether as a result of new information, future events or otherwise, except as required by law.

3

Table of Contents

SUMMARY OF RISKS AFFECTING OUR BUSINESS

Our business is subject to numerous risks. The following summary highlights some of the risks you should consider with respect to our business and prospects. This summary is not complete and the risks summarized below are not the only risks we face. You should review and carefully consider the risks and uncertainties described in more detail in Part I, Item 1A. Risk Factors, which includes a more complete discussion of the risks summarized below:

Risks Related to our Industry and Macroeconomic Conditions

The COVID-19 pandemic has had, and will continue to have, a material adverse effect on our business, revenues, financial condition and results of operations.

Our business and financial condition are heavily influenced by general economic and market conditions which are outside of our control.

We operate in a highly competitive industry with significant pricing pressures and may face competition from companies with significantly greater resources than us.heightened customer expectations.

Failure to anticipate and adapt to changing fashion trends and consumer preferences could harm our reputation and financial performance.

Our operations and those of our suppliers, vendors and wholesale customers may be affected by changes in weather patterns, natural or man-made disasters, civil unrest, public health crises, war, terrorism or other catastrophes.

Risks Related to our Business Strategy and Operations

Failure to maintain the reputation or value of our brands could harm our business operations and financial condition.

Our inability to execute our direct to consumer and portfolio-level strategies in response to shifts in consumer shopping behavior could adversely affect our financial results and operations.

Failure to maintain the reputation or value of our brands could harm our business operations and financial condition.

We may be unable to grow our business through organic growth, which could have a material adverse effect on our business, financial condition, liquidity and results of operations.

Failure to successfully execute our strategic initiative to improve Tommy Bahama’s operating performance may have an adverse impact on our growth and profitability.

The acquisition of new businesses is inherently risky, and we cannot be certain that we will realize the anticipated benefits of any acquisition.

The divestiture or discontinuation of businesses and product lines such as our exit of the Lanier Apparel business, could result in unexpected liabilities and adversely affect our financial condition, cash flows and results of operations.

Our business could be harmed if we fail to maintain proper inventory levels.

We are subject to risks associated with leasing real estate for our retail stores and restaurants.

We make use of debt to finance our operations, which could expose us to risks that adversely affect our business, financial position and operating results.

The loss of one or more of our key wholesale customers, or a significant adverse change in a customer’s financial position, could negatively impact our net sales and profitability.

Our business could be harmed if we fail to maintain proper inventory levels.

We are subject to risks associated with leasing real estate for our retail stores and restaurants.

We make use of debt to finance our operations, which exposes us to risks that could adversely affect our business, financial position and operating results.

Risks Related to Cybersecurity and Information Technology

Cybersecurity attacks and/or breaches of information security or privacy could disrupt our operations, cause us to incur additional expenses, expose us to litigation and/or cause us financial harm.

Our operations are reliant on information technology, and any interruption or other failure could have an adverse effect on our business or results of operations.

4

Table of Contents

Reliance on outdated technology or failure to upgrade our information technology systems and capabilities could impair the efficient operation of our business and our ability to compete.

Remote work arrangements could inhibit our ability to effectively operate our business and result in enhanced cybersecurity risks.

Risks Related to our Sourcing and Distribution Strategies

Our reliance on third party producers in foreign countries to meet our production demands exposes us to risks that could disrupt our supply chain, increase our costs and negatively impact our operations.

4

Table of Contents

Our operations are dependent on the global supply chain, and the impact of supply chain constraints may adversely impact our business and operating results.

Any disruption or failure in our primary distribution facilities may materially adversely affect our business or operations.

Fluctuations and volatility in the cost and availability of raw materials, labor and freight may materially increase our costs.

Labor-related matters, including labor disputes, may adversely affect our operations.

Our geographic concentration exposes us to certain regional risks.

Our international operations, including foreign sourcing, result in an exposure to fluctuations in foreign currency exchange rates.

Our geographic concentration of retail stores, restaurants and wholesale customers exposes us to certain regional risks.

Risks Related to Regulatory, Tax and Financial Reporting Matters

Our business is subject to various federal, foreign, state and local laws and regulations, and the costs of compliance with, or the violation of, such laws and regulations could have an adverse effect on our costs or operations.

Changes in international trade regulation could increase our costs andand/or disrupt our supply chain.

Any violation or perceived violation of our codesSupplier Code of conductConduct or environmental and social compliance programs, including by our manufacturers or vendors, could have a material adverse effect on our brands.

As a globalmulti-national apparel company, we may experience fluctuations in our tax liabilities and effective tax rate.

Impairment charges for goodwill or intangible assets or goodwill could have a material adverse impact on our financial results.

Any failure to maintain liquor licenses or comply with applicable regulations could adversely affect the profitability of our restaurant operations.

General Risks

Our business depends on our senior management and other key personnel, and failure to successfully attract, retain and implement succession of our senior management and key personnel or to attract, develop and retain personnel to fulfill other critical functions may have an adverse effect on our operations and ability to execute our strategies.

We may be unable to protect our trademarks and other intellectual property.

We are subject to periodic litigation, which may cause us to incur substantial expenses or unexpected liabilities.

Our common stock price may be highly volatile, and we may be unable to meet investor and analyst expectations.

Other factors may have an adverse effect on our business, results of operations and financial condition.

DEFINITIONS

As used in this report, unless the context requires otherwise, "our," "us" or "we" means Oxford Industries, Inc. and its consolidated subsidiaries; "SG&A" means selling, general and administrative expenses; "SEC" means the United

5

Table of Contents

States Securities and Exchange Commission; "FASB" means the Financial Accounting Standards Board; "ASC" means the FASB Accounting Standards Codification; "GAAP" means generally accepted accounting principles in the United

5

Table of Contents

States; and "TBBC" means The Beaufort Bonnet Company; "U.S. Tax Reform" means the United States Tax Cuts and Jobs Act and “CARES Act” means the Coronavirus Aid, Relief and Economic Security Act.Company. Additionally, the terms listed below reflect the respective period noted:

Fiscal 20212025

52 weeks ending January 29,31, 2026

Fiscal 2024

52 weeks ending February 1, 2025

Fiscal 2023

53 weeks ended February 3, 2024

Fiscal 2022

52 weeks ended January 28, 2023

Fiscal 2021

52 weeks ended January 29, 2022

Fiscal 2020

52 weeks ended January 30, 2021

Fourth quarter Fiscal 20192023

5214 weeks ended February 1, 20203, 2024

Third quarter Fiscal 20182023

5213 weeks ended February 2, 2019October 28, 2023

Second quarter Fiscal 20172023

5313 weeks ended February 3, 2018July 29, 2023

First quarter Fiscal 20162023

5213 weeks ended January 28, 2017

Fiscal 2015

52 weeks ended January 30, 2016April 29, 2023

Fourth quarter Fiscal 20202022

13 weeks ended January 30, 202128, 2023

Third quarter Fiscal 20202022

13 weeks ended October 202029, 2022

Second quarter Fiscal 20202022

13 weeks ended August 1, 2020July 30, 2022

First quarter Fiscal 20202022

13 weeks ended May 2, 2020

Fourth quarter Fiscal 2019

14 weeks ended February 1, 2020

Third quarter Fiscal 2019

13 weeks ended November 2, 2019

Second quarter Fiscal 2019

13 weeks ended August 3, 2019

First quarter Fiscal 2019

13 weeks ended May 4, 2019April 30, 2022

6

Table of Contents

PART I

Item 1.   Business

BUSINESS AND PRODUCTS

Overview

We are a leading branded apparel company that designs, sources, markets and distributes products bearing the trademarks of our portfolio of lifestyle brands: Tommy Bahama, Lilly Pulitzer, andJohnny Was, Southern Tide, lifestyle brandsTBBC, Duck Head and other brands. Tommy Bahama and Lilly Pulitzer, in the aggregate, represent more than 85% of our net sales and 97% of our sales were in the United States.Jack Rogers.

Our business strategy is to develop and market compelling lifestyle brands and products that evoke a strong emotional response from our target consumers. We consider lifestyle brands to be those brands that have a clearly defined and targeted point of view inspired by an appealing lifestyle or attitude. Furthermore, we believe lifestyle brands that create an emotional connection like Tommy Bahama, Lilly Pulitzer and Southern Tide, can command greater loyalty and higher price points at retail and create licensing opportunities. We believe the attraction of a lifestyle brand depends on creating compelling product, effectively communicating the respective lifestyle brand message and distributing products to consumers where and when they want them.

We believe the principal competitive factors in the apparel industry are the reputation, value, and image of brand names; design of differentiated, innovative or otherwise compelling product; consumer preference; price; quality; marketing;marketing (including through rapidly shifting digital and social media vehicles); product fulfillment capabilities; and customer service. Our ability to compete successfully in the apparel industry is directly related todependent on our proficiency in foreseeing changes and trends in fashion and consumer preference and presenting appealing products for consumers. Our design-led, commercially informed lifestyle brand operations strive to provide exciting, differentiated fashion products each season.season as well as certain core products that consumers expect from us.

To further strengthen each lifestyle brand’s connections with consumers, we directly communicate with consumers through digital and print media on a regular basis.basis with our loyal consumers, including the approximately 2.7 million who have transacted with us in the last year. We believe our ability to effectively communicate the images, lifestyle and products of our brands and create an emotional connection with consumers is critical to the success of our brands. Advertising forbrands, as evidenced by our brands often attempts to conveyadvertising which engages our consumers by conveying the lifestyle of the brand as well asbrand.

We believe the attraction of each of our lifestyle brands is a specific product.direct result of years of maintaining appropriate quality and design, and appropriately restricting the distribution of our products. We believe this approach to quality, design, distribution and communication has been critical in allowing us to achieve the current retail price points, high gross margins and success for our brands.

During Fiscal 2020, 77%2023, 80% of our consolidated net sales were through our direct to consumer channels of distribution, which consistsconsist of our 187 brand-specificbrand specific full-price retail stores, our e-commerce websites and outlets, as well as our 20 Tommy Bahama food and beverage locations and our 35 Tommy Bahama outlet stores.operations. During Fiscal 2020, our e-commerce, retail (including outlet) and restaurant operations represented 43%, 27%, and 7%, respectively,2023, the breakdown of our consolidated net sales comparedby direct to 23%, 39%,consumer channel was as follows: e-commerce of $538 million, or 34%; full-price retail of $533 million, or 34%; food and 8%, respectively, in Fiscal 2019.beverage of $116 million, or 7%; and outlet operations of $73 million, or 5%. Our direct to consumer operations provide us with the opportunity to interact directly with our customers, present to them a broad assortment of our current season products and immerse them in the theme of the lifestyle brand. We believe that presenting our products in a digital or physical setting specifically designed to showcase the lifestyle on which the brands are based enhances the image of our brands.

Our brand-specific e-commerce business continues to grow. Our e-commerce business is very profitable as we have a high gross margin on e-commerce sales that allow us to absorb any incremental picking, packing and freight expense associated with operating an e-commerce business and still maintain a high profit margin on e-commerce sales.

Our 278 full-price retail stores allow us the opportunity to carry a full line of current season merchandise, including apparel, accessories and other products, all presented in an aspirational brand-specific atmosphere. We believe that our full-price retail stores provide high visibility for our brands and products and allow us to stay close to the

7

Table of Contents

preferences of our consumers. Further, we believe that our presentation of products and our strategy to operate the full-price retail stores with limited in-store promotional activities are good forenhance the value and reputation of our lifestyle brands and, in turn, enhancestrengthen our business and relationships with ourkey wholesale customers. While aboutApproximately one-half of our full-price retail locationsstores are located in warm weather resort or travel totravel-to destinations and states, westates. We believe there are alsostill opportunities for new stores in both warmer and colder climates as we believe the more important consideration is whether the location attracts the affluent consumer that we are targeting.

Our e-commerce business continues to grow, with e-commerce sales in Fiscal 2020 totaling $324 million and representing 43% ofAdditionally, our net sales. Our growing e-commerce business is very profitable for our lifestyle brands as eachTommy Bahama brand has average e-commerce order values in excess of $100 and a high full-price gross margin in the 70% range. This

7

Table of Contents

provides a significant amount of profit that is available to pay for the incremental picking, packing and freight expense associated with an e-commerce sale.

We also operate 20 Tommy Bahamaoperates 22 food and beverage locations, including 14 restaurants and six Marlin Bars and full-service restaurants, generally adjacent to a Tommy Bahama full-price retail store location, which we believe further enhancestore. These food and beverage locations provide us with the brand’s image with consumersopportunity to immerse customers in the ultimate Tommy Bahama experience as well as attract new customers to the Tommy Bahama brand. Both Tommy Bahama and 35 Tommy BahamaJohnny Was operate brand-specific outlet stores, which play an important role in overallare typically utilized for end of season inventory and brand management. Our e-commerce websites provide the opportunity to increase revenues by reaching a larger population of consumers and at the same time allow our brands to provide a broader range of products.clearance.

The remaining 23%20% of our net sales in Fiscal 2020 waswere generated fromthrough our wholesale distribution channels. Our wholesale operations include sales of our lifestyle brands,channels, which complement our direct to consumer operations, and provide access to a larger groupbase of consumers and also includesgenerate high operating margins given the netlower fixed costs associated with these operations. Our wholesale operations consist of sales of products bearing the Lanier Apparel operating group, which we are exiting in the second half of Fiscal 2021. Our wholesale operationstrademarks of our lifestyle brands include sales to various specialty stores, Signature Stores, better department stores, multi-branded e-commerce retailers and other retailers. As

At the same time, as we seek to maintain the integrity and continued success of our lifestyle brands by limiting promotional activity in our full-price retail stores and e-commerce websites, we intend to maintain controlled distribution with careful selection of the retailers through which we sell our products and generally target wholesale customers that follow this samea limited promotions approach.

Each We continue to value our long-standing relationships with our wholesale customers and are committed to working with them to enhance the success of our Tommy Bahama, Lilly Pulitzer, Southern Tide and Lanier Apparel operating groups operateslifestyle brands within their stores.

Competitive Environment

We operate in a highly competitive apparel markets. No single apparel firm or small groupmarket that continues to evolve rapidly with the expanding application of apparel firms dominates the apparel industry, and our direct competitors vary by operating group and distribution channel. The apparel industry is cyclical and very dependent upon the overall level and focus of discretionary consumer spending, which changes as consumer preferences and regional, domestic and international economic conditions change. Increasingly, consumers are choosingtechnology to spend less of their discretionary spending on certain product categories, including apparel, while spending more on services and other product categories. Further, negative economic conditions often have a longer and more severe impact on the apparel industry than on other industries.

The retail apparel market is evolving very rapidly and in ways that are having a disruptive impact on traditional fashion retailing. Many of the changes in the industry were accelerated or exacerbated by the COVID-19 pandemic.retail. The application of technology, including the internet and mobile devices, to fashion retail provides consumers increasing access to multiple, responsive distribution platforms and an unprecedented ability to communicate directly with brands and retailers.retailers and capabilities by some competitors to offer same-day or next-day delivery of products to online consumers. As a result, consumers have more information and greater control over information they receive as well as broader, faster and cheaper access to goods than ever before. This is revolutionizing the way that consumers shop for fashion and other goods, which continues to be evidenced by weakness and store closures for certain department stores and mall-based retailers, decreaseduncertain consumer retail traffic patterns, a more promotional retail environment, expansion of off-price and discount retailers, and a shift from bricks and mortar to internet purchasing.  These changes may require

This competitive and evolving environment requires that brands and retailers approach their operations, including marketing and advertising, very differently than historical practicesthey have historically and may result in increased operating costs and capital investments to generate growth or even maintain currentexisting sales levels.

Investments and Opportunities

While the competition and evolution in the fashion retail industry (including as a result of the COVID-19 pandemic) presentspresent significant risks, especially for traditional retailers and others who fail or are unable to adapt, we believe it also presents a tremendous opportunity for brands and retailers to capitalize on the changing consumer environment. 

No single apparel firm or small group of apparel firms dominates the apparel industry, and our competitors vary by operating group and distribution channel. The apparel industry is cyclical and very dependent on the overall level and focus of discretionary consumer spending, which changes as consumer preferences and regional, domestic and international economic conditions change. Also, in recent years consumers have chosen to spend less of their discretionary spending on certain product categories, including apparel, while spending more on services and other product categories.

Further, negative economic conditions often have a longer and more severe impact on the apparel industry than on other industries due, in part, to apparel purchases often being more of a discretionary purchase. The current macroenvironment, with heightened concerns about continued inflation, a global economic recession, geopolitical issues, the availability and cost of credit and elevated interest rates for prolonged periods, is creating a complex and challenging retail environment, which may impact our businesses and exacerbate some of the inherent challenges to our operations.

8

Table of Contents

There remains significant uncertainty in the macroeconomic environment, and the impact of these and other factors could have a major effect on our businesses.

Investments and Opportunities

The evolution in the fashion retail industry presents significant risks, especially for traditional retailers and others who fail or are unable to adapt, but we believe it also presents a tremendous opportunity for brands and retailers to capitalize on the changing consumer environment. We believe our lifestyle brands have true competitive advantages in this new retailing paradigm, and we are leveragingcontinue to invest in and leverage technology to serve our consumers when and where they want to be served. We continue to believe that our lifestyle brands, with their strong emotional connections with consumers, are well suited to succeed and thrive in the long term while managing the various challenges facing our industry, including the near-term challenges resulting from COVID-19.industry. Further, each of our brands aimaims to further enhance theirits customer-focused, dynamic, thriving, digitally-driven, mobile-centered, cross-channel personalized and seamless shopping experience that recognizes and serves customers in their brand discovery and purchasing habits of the future.

Meanwhile, we must be very diligent in our effortWe believe there are ample opportunities to avoid compromisingexpand the integrityreach of each of our lifestyle brands by maintaining or growing sales with wholesale customers that may not be aligned with our long-term strategy. This is

8

Table of Contents

particularly important with the challenges in the department store channel, which represented 9%future, including the opening of our consolidated net sales in Fiscal 2020.

Even before the COVID-19 pandemic, an important initiative for us has beennew direct to increase the profitability of our Tommy Bahama operating group, which is our largest operating group. Prior to the COVID-19 pandemic, we made progress in recent years on this initiative, which remains a focus area for the long-term prospects of the businessconsumer locations, e-commerce growth and continues to focus on increasing gross margin and operating margin through: product cost reductions; selective price increases; reducing inventory purchases; redefining our approach to inventory clearance; effectively managing controllable and discretionary operating expenses; and taking a more conservative approach to retail store openings and lease renewals.

wholesale operations expansion. In order to expand the reach and maximize the success of each of our brands, we believe we must continue to invest in ourthe lifestyle brands to take advantage of their long-term growth opportunities. Future investments includeWe expect Fiscal 2024 will be a particularly heavy year for investment in capital expenditures and expect such investments to primarily relatedbe associated with a multi-year project to build a new distribution center in the Southeastern United States to ensure best-in-class direct-to-consumer throughput capabilities for our brands, direct to consumer operations, such as technology enhancements, e-commerce initiatives and retail store and food and beverage build-outlocation build-outs for new, relocated or remodeled locations, as well as distribution centertechnology and related enhancements to support our direct to consumer operations and administrative office expansion initiatives.expenditures. In addition to our capital investments, we will continue to invest in our SG&A expense infrastructure, including people, technology, advertising and other resources. While we believe that our investments will generate long-term benefits, the investments are likely to have a short-term negative impact on our operating margin as it will take some time for the anticipated sales growth to absorb the incremental costs of these expenditures.

While we believe we have significant opportunities to appropriately deploy our capital and resources in our existing lifestyle brands, we will continue to evaluate opportunities to add additional lifestyle brands, both large and small, to our portfolio if we identify appropriate targets that meet our investment criteria.

In Fiscal 2020, we made the decisioncriteria and/or take strategic measures to exitreturn capital to our Lanier Apparel business, which is expected to be completed during the second half of Fiscal 2021. In Fiscal 2020shareholders as and Fiscal 2019, Lanier Apparel, which has primarily sold tailored clothing products, represented 5% and 8%, respectively, of our consolidated net sales. This decision is in line with our stated business strategy of developing and marketing compelling lifestyle brands and takes into consideration the increased challenges faced by the Lanier Apparel business, many of which were magnified by the COVID-19 pandemic.when circumstances merit.

Important factors relating to certain risks, many of which are beyond our ability to control or predict, which could impact our business are described in Part I, Item 1A. Risk Factors of this report.

COVID-19 Pandemic

The COVID-19 pandemic has had a significant effect on overall economic conditions and our operations and is the primary reason for a 33% reduction in net sales and a significant net loss in Fiscal 2020, after years of profitable operating results. While our mission remains the enhancement of long-term shareholder value, our focus during this crisis has been (1) the health and well-being of our employees, customers and communities, (2) protecting the reputation, value and image of our brands and (3) preserving liquidity.

Due to the COVID-19 pandemic, we saw reduced consumer traffic starting in early March 2020 and temporarily closed all our retail and restaurant locations. We began reopening our stores and restaurants in early May 2020 with additional stores and restaurants reopening throughout the Second Quarter of Fiscal 2020. We have reopened substantially all of our direct to consumer locations using a phased approach in accordance with local government guidelines and with additional safety protocols. Substantially all locations are experiencing reduced traffic, limited operating hours and capacity, seating and other limitations, with such factors impacting individual locations differently. Certain retail stores and restaurants, including several in Hawaii and California, were required to close again for certain periods in the Third and Fourth Quarters of Fiscal 2020 after local jurisdictions reinstated some closure requirements. There can be no assurance that additional closures will not occur as a result of any resurgence of COVID-19 cases and/or additional government mandates or recommendations. Generally, locations with attached restaurants or Marlin Bars, in outdoor centers and in drivable resort vacation destinations performed better than locations in indoor malls in Fiscal 2020. At the same time, the shift from in-store shopping to online shopping has accelerated during the COVID-19 pandemic resulting in a 24% growth in our e-commerce businesses during Fiscal 2020.

There is significant uncertainty as to the duration and severity of the pandemic as well as the associated business disruption, impact on discretionary spending and restrictions on our ongoing operations. Thus, the ultimate

9

Table of Contents

impact of the pandemic cannot be reasonably estimated at this time. However, the COVID-19 pandemic is expected to continue to have a material adverse impact on our business, results of operations, cash flows and financial condition in the near-term due to the anticipated lower net sales from our bricks and mortar locations; reduced demand from our wholesale customers, several of which filed for bankruptcy in 2020 or are undergoing restructurings or closures; the uncertainty as to the continued strength of our brands’ e-commerce businesses during the pendency of the pandemic and thereafter; overall changes in consumer spending habits and consumer confidence; any potential disruptions to our supply chain; and a slowdown in the U.S. and global economies.

We took several actions in Fiscal 2020 to mitigate the impact of the COVID-19 pandemic on our business, operations and liquidity, which included:

we furloughed and laid off a significant number of our retail, restaurant and office employees;
certain salaried employees, including our Chief Executive Officer, Chief Financial Officer and other executives, took temporary reductions in base salary during Fiscal 2020;
our Board of Directors elected to reduce its cash retainers for Fiscal 2020;
we worked with our suppliers to cancel, delay or suspend future product deliveries;
we worked with our wholesale customers to identify suitable changes to our business arrangements;
we negotiated equitable rental arrangements with substantially all of our direct to consumer location landlords, believing that the payment of rents for both the closure and subsequent periods is inappropriate due to the impact of the COVID-19 pandemic, and are continuing those discussions with some landlords;
under the CARES Act, and other regulations in other countries, we obtained employee retention credits for certain compensation paid to employees even while they were not working during the COVID-19 pandemic and have deferred the payment of the employer portion of FICA;
we suspended, cancelled or deferred certain capital expenditure projects, reducing our capital expenditures for Fiscal 2020;
during much of Fiscal 2020, we had drawn down certain amounts on our U.S. Revolving Credit Agreement to increase our cash position and preserve financial flexibility; and
our Board of Directors reduced the rate of our dividend payable for Fiscal 2020.

Also, we established management committees, reporting to our Chief Executive Officer, to continue to monitor the COVID-19 pandemic and its impact and are taking the necessary measures to protect the health and safety of our employees and customers.

We anticipate that net sales in each of our Tommy Bahama, Lilly Pulitzer and Southern Tide operating groups will continue to be negatively impacted by the COVID-19 pandemic in Fiscal 2021, with the impact being more pronounced in the first half of the year and then beginning to rebound a little more in the second half of the year once more consumers are vaccinated, begin to travel again or otherwise begin to return to a more normal way of life.

Given our net cash position as of January 30, 2021, substantial availability under our U.S. Revolving Credit Agreement and expectation of positive cash flows from operations in Fiscal 2021, among other factors, we believe we have adequate liquidity and the financial discipline to address the near-term challenges related to the COVID-19 pandemic and to position ourselves well to thrive in the post-pandemic retail environment.

10

Table of Contents

Operating Groups

We identify our operating groups based on the way our management organizes the components of our business for purposes of allocating resources and assessing performance. Our operating group structure reflects a brand-focused management approach, emphasizing operational coordination and resource allocation across each brand’s direct to consumer, wholesale and licensing operations, as applicable. OurSubsequent to our acquisition of Johnny Was, our business has historically been operated primarily throughis organized as our Tommy Bahama, Lilly Pulitzer, Southern TideJohnny Was and Emerging Brands operating groups. Operating results for periods prior to Fiscal 2022 also include the Lanier Apparel operating groups. In Fiscal 2020,group, which we made the decision to exit our Lanier Apparel business, which is expected to be completed during the second half ofexited in Fiscal 2021. For additional information about each of our reportable operating groups as well as Corporate and Other, see Part II, Item 7. Management’s Discussion and Analysis of Financial Condition and Results of Operations, and Note 2 toof our consolidated financial statements, each included in this report. The table below presents certain financial information about each of our operating groups, as well as Corporate and Other (in thousands).


Fiscal 2020


Fiscal 2019


Fiscal 2018

Net Sales


Tommy Bahama

$

419,817

$

676,652

$

675,358

Lilly Pulitzer


231,078


284,700


272,299

Southern Tide


34,664


46,409


45,248

Lanier Apparel


38,796


95,200


99,904

Corporate and Other


24,478


19,829


14,657

Consolidated net sales

$

748,833

$

1,122,790


1,107,466

Operating Income (Loss)


Tommy Bahama

$

(53,310)

$

53,207

$

53,139

Lilly Pulitzer


27,702


51,795


47,239

Southern Tide (1)


(64,801)


5,554


5,663

Lanier Apparel


(26,654)


1,953


6,000

Corporate and Other (2)


(6,786)


(18,834)


(21,449)

Consolidated Operating Income

$

(123,849)

$

93,675


90,592

9

Table of Contents


Fiscal 2023


Fiscal 2022


Fiscal 2021

Net Sales


Tommy Bahama

$

898,807

$

880,233

$

724,305

Lilly Pulitzer


343,499


339,266


298,995

Johnny Was (1)

202,859

72,591


Emerging Brands


126,825


116,484


90,053

Lanier Apparel (2)


24,858

Corporate and Other


(515)


2,954


3,868

Consolidated net sales

$

1,571,475

$

1,411,528


1,142,079

Operating Income (Loss)


Tommy Bahama

$

160,543

$

172,761

$

111,733

Lilly Pulitzer


56,110


67,098


63,601

Johnny Was (1)

(104,776)

(1,544)

Emerging Brands (3)


6,714


15,602


16,649

Lanier Apparel (2)


4,888

Corporate and Other (4)


(37,609)


(35,143)


(31,368)

Consolidated Operating Income

$

80,982

$

218,774


165,503

(1)Southern Tide includedThe Johnny Was business was acquired on September 19, 2022. Activities for Fiscal 2022 consist of 19 weeks of activity from the acquisition date through January 28, 2023. The operating loss for Johnny Was in Fiscal 2023 resulted from a $60$111 million impairment charge for goodwill and intangible assets in Fiscal 2020, with no such charges in Fiscal 2019 and Fiscal 2018.assets.
(2)In Fiscal 2021, we exited our Lanier Apparel business, which had been focused on moderately priced tailored clothing and related products. The Lanier Apparel exit is discussed in more detail in Note 12 of our consolidated financial statements included in this report.
(3)The operating income for Emerging Brands in Fiscal 2023 included a $2 million impairment charge related to an unconsolidated entity.
(4)The operating loss for Corporate and Other includedincludes a last-in, first-out (LIFO)(“LIFO”) accounting credit of $9 million, charge of $1$10 million, $3 million and charge of $1$16 million in Fiscal 2020,2023, Fiscal 20192022 and Fiscal 2018,2021, respectively. The operating loss for Corporate and Other in Fiscal 2022 also included $3 million of transaction expenses and integration costs associated with the Johnny Was acquisition. Fiscal 2021 also included a gain on sale of an unconsolidated entity of $12 million.

Tommy Bahama

Tommy Bahama designs, sources, markets and distributes men’s and women’s sportswear and related products. Tommy Bahama’s typical consumer is older than 45 years old, has a household annual income in excess of $100,000, lives in or travels to warm weather and resort locations and embraces a relaxed and casual approach to daily living. Tommy Bahama products can be found in our Tommy Bahama stores and on our Tommy Bahama e-commerce website, tommybahama.com, as well as at better department stores, independent specialty stores and multi-branded e-commerce retailers. We also operate Tommy Bahama restaurantsfood and beverage locations and license the Tommy Bahama name for various product categories. During Fiscal 2020, 95%2023, 96% of Tommy Bahama’s sales were to customers withinin the United States, with the remaining sales in CanadaAustralia and Australia.Canada.

We believe thatIn Fiscal 2023, we increased Tommy Bahama’s sales by 2% to $899 million from $880 million in Fiscal 2022. Operating income decreased by 7% to $161 million, or 17.9% of sales, compared to $173 million, or 19.6% of sales, in Fiscal 2022, resulting primarily from our SG&A investments during Fiscal 2023. The operating income achieved in Fiscal 2023 and Fiscal 2022 is considerably higher than the attraction7.9% operating margin on $677 million of net sales generated in the last pre-pandemic year of Fiscal 2019. The significant improvement in operating margin reflects the results of important initiatives for us in recent years to our consumersincrease the profitability of the Tommy Bahama brand, which was founded in 1992, isoperating group. Maintaining the significantly higher post-pandemic operating margin levels continues to be a reflection of our efforts over many years to maintain appropriate quality and design of our Tommy Bahama apparel, accessories and licensed products, limit the distribution of Tommy Bahama products to a select tier of retailers, and effectively communicate the relaxed and casual Tommy Bahama lifestyle. We expect to continue to follow this approachfocus area for the brand in the future.

We believe there are ample opportunities to expand the direct to consumer reachlong-term prospects of the Tommy Bahama brand in the future, while maintaining its historically select distribution. In order to take advantage of opportunities for long-business.

1110

Table of Contents

term growth, we must continue to invest in the Tommy Bahama brand. These investments include capital expenditures and ongoing expenses to enhance e-commerce and other technology capabilities; open new stores and restaurants; remodel and/or relocate existing stores and restaurants; maintain and upgrade our distribution and other facilities; and enhance our marketing efforts to communicate the lifestyle to existing and prospective consumers.

Even before the COVID-19 pandemic, an important initiative for us has been to increase the profitability of the Tommy Bahama operating group. Prior to the COVID-19 pandemic, we made progress in recent years on this initiative, which remains a focus area for the long-term prospects of the business and continues to focus on increasing gross margin and operating margin through: product cost reductions; selective price increases; reducing inventory purchases; redefining our approach to inventory clearance; effectively managing controllable and discretionary operating expenses; and taking a more conservative approach to retail store openings and lease renewals.

Direct to Consumer Operations

A key component of our Tommy Bahama strategy is to operate our ownretail stores, restaurantse-commerce websites and e-commerce websites,food and beverage concepts, which we believe permits us to develop and build brand awareness by presenting our products in a setting specifically designed to showcase the aspirational lifestyle on which the products are based. Our Tommy Bahama direct to consumer channels, which consist of full-price retail store, e-commerce, food and restaurantbeverage and outlet store operations, in the aggregate, represented 84% and 80%83% of Tommy Bahama’s net sales in Fiscal 2020 and Fiscal 2019, respectively. Retail2023. Full-price retail store, e-commerce, food and restaurantbeverage and outlet store net sales accounted for 37%, 36%25%, 13% and 11%8%, respectively, of Tommy Bahama’s net sales in Fiscal 20202023.

Our Tommy Bahama e-commerce business, which generated $224 million of net sales in Fiscal 2023, has grown significantly over the last few years, including a 5% increase in net sales compared to 48%, 20%Fiscal 2022. Our Tommy Bahama websites, including the tommybahama.com website, allow consumers to buy Tommy Bahama products directly from us via the internet. These websites also enable us to increase our database of consumer contacts, which allows us to communicate directly and 12%, respectively,frequently with consenting consumers. As we reach more customers in Fiscal 2019.the future, we anticipate that our e-commerce distribution channel for Tommy Bahama will continue to grow at a faster pace than our retail store or wholesale operations.

Our direct to consumer strategy for the Tommy Bahama brand also includes locating and operating full-price retail stores in upscale malls, lifestyle shopping centers, resort destinations, and brand-appropriate street locations.locations and upscale malls. Generally, we seek to locate our full-price retail stores in shopping areas and malls that have high-profile or upscale consumer brand adjacencies. As of January 30, 2021,February 3, 2024, the majority of our Tommy Bahama full-price retail stores were in street-front locations or lifestyle centers with the remainder primarily in regional indoor malls, with a number of those regional indoor locations in resort travel destinations. We believe that we have opportunities for continued direct to consumer sales growth for our Tommy Bahama, particularly in our women’s business, which represented 29%36% and 34% of sales in our full-price direct to consumer operations in Fiscal 2020.2023 and Fiscal 2022, respectively, with women’s swim representing about one-third of the women’s business. For Tommy Bahama’s domestic full-price retail stores and retail-food and beverage locations operating for the full Fiscal 2023 year, sales per gross square foot, excluding food and beverage sales and food and beverage space, were approximately $815, compared to approximately $790 in Fiscal 2022.

DisposalAs of discontinuedFebruary 3, 2024, we operated 22 Tommy Bahama food and beverage locations including 13 restaurants and nine Marlin Bar locations, generally adjacent to a Tommy Bahama full-price retail store location. These retail-food and beverage locations, which generated over 25% of Tommy Bahama’s net sales in Fiscal 2023, provide us with the opportunity to immerse customers in the ultimate Tommy Bahama experience. We do not anticipate that the majority of our full-price retail locations will have an adjacent food and beverage location; however, we have determined that an adjacent food and beverage location can further enhance the image or exposure of the brand in select, high-profile, brand appropriate locations. The net sales per square foot in our domestic full-price retail stores that are adjacent to a food and beverage location have historically been approximately twice the sales per square foot of our other domestic full-price retail stores. We believe that the customer immersing themselves into the Tommy Bahama lifestyle by having a meal or a drink at the Tommy Bahama food and beverage location and visiting the adjacent full-price retail store may entice the customer to purchase additional Tommy Bahama merchandise and potentially provide a memorable consumer experience that further enhances the relationship between Tommy Bahama and the consumer. The Marlin Bar concept, like our traditional restaurant locations, is adjacent to one of our full-price retail store locations and serves food and beverages, but in a smaller space and with food options more focused on fast, yet upscale, casual dining, with small plate offerings rather than entrees. We believe that the smaller footprint, reduced labor requirements and lower required capital expenditure of the Marlin Bar concept provides us with the long-term potential for opening additional retail-food and beverage locations that are more in line with evolving customer trends toward fast casual dining, particularly with younger consumers.

Typically, at the end of the summer and holiday season, Tommy Bahama will conduct sales both in-store and online to move end of season inventory is an ongoing partproduct. Utilizing Tommy Bahama’s Enterprise Order Management (EOM) system, many online orders will be fulfilled from retail stores, greatly reducing the amount of any apparel business andgoods that ultimately get transferred from full-price retail stores to outlet stores. Tommy Bahama usesutilizes its outlet stores, which generated 8% of total Tommy Bahama sales in Fiscal 2023, and sales to off-price retailers and selected initial markdowns in our full-price retail stores and on our e-commerce websites to sell itsthe remaining end of season or excess inventory. Our Tommy Bahama outlet stores which generated 7% and 9% of our total Tommy Bahama net sales in Fiscal 2020 and Fiscal 2019, respectively, are generally located in outlet shopping centers that include other upscale retailers and serve

11

Table of Contents

an important role in overall inventory management by often allowing us to sell discontinued and out-of-season products at better prices than are otherwise available from outside parties. We believe that this approach has helped us protect the integrity of the Tommy Bahama brand by allowing our full-price retail stores to limit promotional activity while controlling the distribution of discontinued and out-of-season product. To supplement the clearance items sold in Tommy Bahama outlets and offer a more comprehensive selection of products and sizes, we merchandise our Tommy Bahama outlets with somecertain made-for products. We anticipate thatCurrently, we would generally expect to operate one outlet store for approximately every threefour full-price retail stores.

As of January 30, 2021, we operated 20 Tommy Bahama food and beverage locations including 14 restaurants and six Marlin Bar locations, generally adjacent to a Tommy Bahama full-price retail store location. These retail-food and beverage locations, which generated approximately 25% of Tommy Bahama’s net sales in Fiscal 2019, provide us with the opportunity to immerse customers in the ultimate Tommy Bahama experience. We do not anticipate that the majority of our retail locations will have an adjacent food and beverage location; however, we have determined that an adjacent food and beverage location can further enhance the image or exposure of the brand in select, high-profile, brand appropriate locations. The net sales per square foot in our domestic full-price retail stores that are adjacent to a food and beverage location have historically been twice the sales per square foot of our other domestic full-price retail stores. We believe that the customer immersing themselves into the Tommy Bahama lifestyle by having a meal or a drink at the Tommy Bahama food and beverage location and visiting the adjacent retail store may entice the customer to purchase additional Tommy Bahama merchandise and potentially provide a memorable consumer experience that further

12

Table of Contents

enhances the relationship between Tommy Bahama and the consumer. The Marlin Bar concept, like our traditional restaurant locations, is adjacent to one of our retail locations and serves food and beverages, but in a smaller space and with food options more focused on small plate offerings rather than entrees. We believe that with the smaller footprint, reduced labor requirements and lower required capital expenditure for build-out, the Marlin Bar concept provides us with the long-term potential for opening retail-food and beverage locations in sites that otherwise may not have been suitable or brand appropriate for one of our traditional retail-restaurant locations.

The table below provides certain information regarding Tommy Bahama retail stores and restaurants operated by usdirect to consumer locations as of January 30, 2021.February 3, 2024.


FullPrice Retail


RetailFood & Beverage


Stores

Outlet Stores

Locations (1)

Total

Florida


18


6


8


32

California


15


4


3


22

Texas


6


4


2


12

Hawaii


5


1


4


10

Nevada


4


1


1


6

New York


2


2


1


5

Other states


38


13


1


52

Total domestic


88


31


20


139

Canada


7


2


9

Total North America


95


33


20


148

Australia


10


2


12

Total


105


35


20


160

Average square feet per store (2)


3,400


4,700


4,300


Total square feet at year end (2)


360,000


165,000


85,000


Full-Price


RetailFood & Beverage


Retail Stores

Locations (1)

Outlet Stores

Total

Florida


16


10


5


31

California


15


4


4


23

Texas


6


2


4


12

Hawaii


5


3


1


9

Other states


41


3


14


58

Total domestic


83


22


28


133

Canada


6


2


8

Total North America


89


22


30


141

Australia


13


4


17

Total


102


22


34


158

Average square feet per store (2)


3,300


4,300


4,400


Total square feet at year end (2)


340,000


94,000


149,000


(1)Consists of 1413 traditional format retail-restaurant locations and sixnine Marlin Bar locations.
(2)Square feet for retail-restaurantretail-food and beverage locations consists of retail square footage and excludes square feet used in the associated restaurantfood and beverage operations.

During Fiscal 20202023, Florida, California, Hawaii and Texas represented 34%, 16%, 12% and Hawaii represented 35%, 17%, 10% and 7%8%, respectively, of our Tommy Bahama direct to consumer retail and restaurantretail-food and beverage location sales. Including e-commerce sales, while induring Fiscal 2019,2023, Florida, California, Hawaii and Texas and Hawaii represented 27%28%, 17%15%, 9% and 12%8%, respectively, of ourtotal Tommy Bahama retail and restaurantdirect to consumer sales.

The table below reflects the changes in store count for Tommy Bahama locations during Fiscal 2020.2023.


FullPrice Retail


RetailFood & Beverage


Full-Price


RetailFood & Beverage


Stores

Outlet Stores

Locations

Total

Retail Stores

Locations

Outlet Stores

Total

Open as of beginning of fiscal year


111


35


16


162


103


21


33


157

Opened


1


1


2


4


7


2


3


12

Marlin Bar conversion

(2)

2

Closed


(5)


(1)


(6)


(8)


(1)


(2)


(11)

Open as of end of fiscal year


105


35


20


160


102


22


34


158

In future periods, we anticipate that many of our new Tommy Bahama store openings will be Marlin Bar locations that are either new locations or replaceconversions of existing full-price retail store or traditional restaurant locations.stores. Currently, we have twofive Marlin Bar openings scheduled for Fiscal 20212024, including the Marlin Bar at Fashion Valley in San Diego, which opened in February 2021, and the conversion of the Tommy Bahama retail-restaurant locationfull-price retail locations in Las Vegas to aSan Antonio, Texas, Charlotte, North Carolina and King of Prussia, Pennsylvania as well as new locations in Sarasota, Florida and Oklahoma City, Oklahoma. We also have other locations in the pipeline for openings in Fiscal 2025 and beyond and anticipate opening at least three Marlin Bar which is scheduledlocations in Fiscal 2025, subject to open in the second half of the year.lease negotiation, construction timing and other factors. We continue to look for other appropriate locations for full-price retail stores and Marlin Bars.  In addition to the planned Marlin Bars in Fiscal 2024, we are also targeting three new full-price locations and three full-price retail store relocations. We believe that in Fiscal 2021,2024, we may close a limited number of locations, including certain outlets and full-price retail locations.

1312

Table of Contents

The operationconstruction and/or relocation of full-price retail stores outlet stores, Marlin Bars and retail-restaurant locations requires a greater amount of initial capital investment than wholesale operations, as well as greater ongoing operating costs. The cost of a traditional Tommy Bahama retail-restaurant location and a Marlin Bar is significantly more than the cost of a full-price retailIn addition to new store and can vary significantly depending on a variety of factors. Historically, the cost of our retail-restaurant locations has been approximately $5 million and the cost of our Marlin Bar locations has been approximately $3 million; however, the cost of a restaurant and Marlin Bar can vary significantly for certain locations. For most of our retail stores and our retail-food and beverage locations, the landlord provides certain incentives to fund a portion of our capital expenditures.

Additionally,openings, we also incur capital expenditure costs related to periodic remodels or expansions of existing stores, particularly when we renew or extend a lease beyond the original lease term, or otherwise determine that a remodel of a store is appropriate. We also incur capital expenditures when a lease expires, and we determine it is appropriate to relocate to a new location in the same vicinity as the previous store. Alternatively, when a lease expires we may decide to close the store rather than relocating the store to another location or renewing the lease. The capital cost of store relocationsa Tommy Bahama Marlin Bar is generally comparable tosignificantly more than the costscost of opening a new full-price retail store and can vary significantly depending on a variety of factors. The cost to build out a Marlin Bar location averages $4 million and future locations may be more or outlet store.

In addition toless expensive than that amount. For most of our full-price retail stores and outlet stores, our directMarlin Bar locations, the landlord often provides certain incentives to consumer approach includes various e-commerce websites, including the tommybahama.com website. During Fiscal 2020 and Fiscal 2019, e-commerce sales represented 36% and 20%, respectively,fund a portion of Tommy Bahama’s net sales. Our Tommy Bahama website allows consumers to buy Tommy Bahama products directly from us via the internet. These websites also enable us to increase our database of consumer contacts, which allows us to communicate directly and frequently with consenting consumers. As we reach more customers in the future, we anticipate that our e-commerce distribution channel for Tommy Bahama will continue to grow at a faster pace than our domestic full-price retail store operations or wholesale operations.capital expenditures.

Wholesale Operations

To complement our direct to consumer operations and have access to a larger group of consumers, we continue to maintain oura wholesale operationsbusiness for Tommy Bahama. Tommy Bahama’s wholesale customers include better department stores, specialty stores and multi-brand e-commerce retailers that generally follow a retail model approach with limited discounting. We value our long-standing relationships with our wholesale customers and are committed to working with them to enhance the success of the Tommy Bahama brand within their stores.

Wholesale sales for Tommy Bahama accounted for 16% and 20% of Tommy Bahama’s net sales in Fiscal 2020 and Fiscal 2019, respectively. Approximately 9% of Tommy Bahama’s net sales reflects sales to major department stores with our remaining wholesale sales primarily sales to specialty stores. During Fiscal 2020, 12% of Tommy Bahama’s net sales were to Tommy Bahama’s 10 largest wholesale customers, withWith its largest customer representing less than 5% of Tommy Bahama’s net sales.

Wewide distribution currently, we believe that the integrity and continued success of the Tommy Bahama brand, including its direct to consumer operations, is dependent, in part, upon controlled wholesale distribution, with careful selection of the retailers through which Tommy Bahama products are sold. As a result of our approach to limiting our wholesale distribution, we believe thatdomestic sales growth in our men’s apparel wholesale business may be somewhat limited in the long-term.long term. However, we believe that we may have opportunities for wholesale sales increases for our Tommy Bahama women’s business in the future, with its appeal evidenced by its performance in our full-price retail stores and e-commerce websites. Wholesale sales for Tommy Bahama accounted for 17% of Tommy Bahama’s net sales in Fiscal 2023. Approximately 10% of Tommy Bahama’s net sales reflects sales to major department stores with our remaining wholesale sales primarily to specialty stores. During Fiscal 2023, 12% of Tommy Bahama’s net sales were to Tommy Bahama’s 10 largest wholesale customers, with its largest customer representing less than 5% of Tommy Bahama’s net sales.

Tommy Bahama Resort

In Fiscal 2022, Tommy Bahama entered into a licensing arrangement for the first Tommy Bahama resort. Pursuant to the licensing agreement, the Miramonte Resort & Spa in Indian Wells, California was converted into the Tommy Bahama Miramonte Resort & Spa with a successful relaunch in the Third Quarter of Fiscal 2023. Tommy Bahama will earn royalty income calculated as a percentage of revenues associated with the resort. The property is managed and operated by a national commercial and hospitality real estate company with considerable experience in premier resort development and operations.

Lilly Pulitzer

Lilly Pulitzer designs, sources, markets and distributes upscale collections of women’s and girl’s dresses, sportswear and related products. The Lilly Pulitzer brand was originally created in the late 1950s by Lilly Pulitzer and is an affluent brand with a heritage and aesthetic based on the Palm Beach resort lifestyle. The brand is somewhat unique among women’s brands in that it has demonstrated multi-generational appeal, including among young women in college or recently graduated from college; young mothers with their daughters; and women who are not tied to the academic calendar. The brand’s 65th anniversary in Fiscal 2024 sets the stage for continued investment in brand enhancement that is the culmination of a multi-year initiative of modernizing the brand. Enhancements in Fiscal 2024 will include a visual refresh of the brand across retail store locations, marketing, packaging, and merchandising.

Lilly Pulitzer products can be found on our Lilly Pulitzer website, lillypulitzer.com, in our owned Lilly Pulitzer stores, and in Lilly Pulitzer Signature Stores, which are described below, and on our Lilly Pulitzer website, lillypulitzer.com, as well as in independent specialty stores and better department and

14

Table of Contents

independent specialty stores. During Fiscal 2020, 50%2023, 38%, 35% and 33%14% of Lilly Pulitzer’s net sales were for women’s dresses, sportswear, and dresses,Luxletic athleisure products, respectively, with the remaining sales consisting of Lilly Pulitzer accessories, including scarves, bags, jewelry and belts, children’s apparel, swim, footwear and licensed products.

13

We believe that there are opportunities to expand the reachTable of the Lilly Pulitzer brand in the future, while at the same time maintaining its historically select distribution. We believe that in order to take advantage of opportunities for long-term growth, we must continue to invest in the Lilly Pulitzer brand. These investments include enhancing e-commerce and other technology capabilities; opening and operating full-price retail stores; remodeling and/or relocating existing stores; and increasing headcount, advertising and other functions to support the business. While we believe that these investments will generate long-term benefits, the investments may have a short-term negative impact on Lilly Pulitzer’s operating margin, particularly if there is insufficient sales growth to absorb the incremental costs in a particular year.Contents

We believe the attraction of the Lilly Pulitzer brand to our consumers is a reflection of years of maintaining appropriate quality and design, restricting the distribution of Lilly Pulitzer products to a select tier of retailers and effectively communicating the message of Lilly Pulitzer’s optimistic Palm Beach resort chic lifestyle. We believe this approach to quality, design, distribution and communication has been critical in allowing us to achieve the current retail price points for Lilly Pulitzer products.

Direct to Consumer Operations

Lilly Pulitzer’s direct to consumer distribution channel, which consists of e-commerce operations and full-price retail store and e-commerce operations,stores, represented 84% and 79% of Lilly Pulitzer’s net sales in Fiscal 2020 and Fiscal 2019, respectively.2023. A key element of our Lilly Pulitzer strategy is the lillypulitzer.com website, which represented 64% and 38%generated $175 million, or 51%, of Lilly Pulitzer’s net sales in Fiscal 2020 and Fiscal 2019, respectively.2023. Another key component of our Lilly Pulitzer direct to consumer strategy is to operate our own Lilly Pulitzer stores, which represented 20% and 41%33% of Lilly Pulitzer’s net sales in Fiscal 2020 and Fiscal 2019, respectively.2023.

The Lilly Pulitzer e-commerce business has experienced significantdouble-digit percentage growth in recentfor many years, and we anticipate that the net sales growth of the e-commerce business will remain strong in the future. We also useutilize the Lilly Pulitzer website as an effective means of liquidating discontinued or out-of-season inventory in a brand appropriate manner and at gross margins in excess of 40% via e-commerce flash clearance sales. These sales are brand appropriate events that create a significant amount of excitement with loyal Lilly Pulitzer consumers, who are looking for an opportunity to purchase Lilly Pulitzer products at a discounted price.price and are also important in attracting new consumers to the Lilly Pulitzer brand. These e-commerce flash clearance sales typically run for two to three days during the summerend of season clearance period in September and for two days during the post-holiday clearance period in January,periods allowing the Lilly Pulitzer website to generally remain full-pricefull price for the remaining 360 daysremainder of the year. During Fiscal 2020, approximately one-third2023, 35% of Lilly Pulitzer’s e-commerce sales, or 18% of Lilly Pulitzer’s net sales, were e-commerce flash clearance sales. In addition to the e-commerce flash clearance events, in Fiscal 2020, we did have a few select promotional events to sell inventory that had previously been purchased for sale in our retail stores during the year.

Our Lilly Pulitzer retail stores permit us to develop and build brand awareness by presenting Lilly Pulitzer products in a setting specifically designed to showcase the aspirational lifestyle on which they are based. Ourfull-price retail store strategy for the Lilly Pulitzer brand includes operating full-price retail stores in higher-end lifestyle shopping centers and malls, resort destinations and brand-appropriate street locations. As of January 30, 2021,February 3, 2024, about 40% of our Lilly Pulitzer full-price stores were located in outdoor regional lifestyle centers and approximately one-thirdone-quarter of our Lilly Pulitzer stores were located in indoor regional malls, with the remaining locations in resort or street locations. In certain seasonal locations such as Nantucket, Massachusetts and Watch Hill, Rhode Island, our stores are only open during the resort season. Additionally, we may open temporary pop-up stores in certain locations.

15

Table of Contents

Lilly Pulitzer’s full-price retail store sales per gross square foot for Fiscal 2023 were approximately $737 for the full-price retail stores which were open the full Fiscal 2023 year, as compared to $765 in Fiscal 2022. The table below provides certain information regarding Lilly Pulitzer full-price retail storesdirect to consumer locations as of January 30, 2021.

February 3, 2024.


Number of

Full-Price

FullPrice Retail

Stores

Florida


1821

Massachusetts


76

Virginia


5

North Carolina

4

Ohio

3

Texas

35

Other


1923

Total


5960

Average square feet per store


2,500

Total square feet at year-end


150,000152,000

14

Table of Contents

During Fiscal 2020 and Fiscal 2019,2023, 51% and 43%, respectively, of Lilly Pulitzer’s full-price retail store sales were in stores located in Florida with no other state generating more than 10% of full-price retail store sales. Including e-commerce sales, during Fiscal 2023, Florida represented 34% of total Lilly Pulitzer direct to consumer sales.

The table below reflects the changes in storedirect to consumer location count for Lilly Pulitzer stores during Fiscal 2020.

2023.


FullPrice RetailFull-Price

Retail Stores

Open as of beginning of fiscal year


6159

Opened

4

Closed


(2)(3)

Open as of end of fiscal year


5960

Currently, we expect to open at least five new full-price retail stores in Fiscal 2024, with the anticipated new stores in Florida, Rhode Island, Massachusetts, Georgia and Arizona. We are in the process of identifying sites or negotiating leases for certain retail store locations and willadditional locations. We continue to look for other appropriate locations. We believe thatlocations and anticipate returning to a pace of opening as many as five to six locations per year in Fiscal 2021,the future. At the same time, we may relocate or close a limited number of locations.locations at lease expiration, or sooner based on store performance. The operationconstruction or relocation of full-price retail stores requires a greater amount of initial capital investment than wholesale operations, as well as greater ongoing operating costs. We anticipate that most future full-price retail store openings will generally be 2,500 square feet or less on average; however, the determination of actual size of the store will depend on a variety of criteria.

In addition to new store openings, we also incur capital expenditure costs related to remodels or expansions of existing stores, particularly when we renew or extend a lease beyond the original lease term, or otherwise determine that a remodel of a store is appropriate. We may also incur capital expenditures if we determine it is appropriate to relocate a store to a new location. The capital cost of store relocations, if any, will generally be comparable to the cost of opening a new store.

Wholesale Operations

To complement our direct to consumer operations and have access to a larger group of consumers, we continue to maintain our wholesale operations for Lilly Pulitzer. These wholesale operations, which represented 16% of Lilly Pulitzer’s net sales in Fiscal 2023, are primarily with Signature Stores, independent specialty stores, better department stores and multi-branded e-commerce retailers that generally follow a retail model approach with limited discounting. During Fiscal 2020 and Fiscal 2019,2023, approximately 16% and 21%, respectively, of Lilly Pulitzer’s net sales were sales to wholesale customers. During Fiscal 2020, about one-thirdone-quarter of Lilly Pulitzer’s wholesale sales were to Lilly Pulitzer’s Signature Stores, one-fourthapproximately one-fifth of Lilly Pulitzer’s wholesale sales were to specialty stores and aboutless than one-fifth of Lilly Pulitzer’s wholesale sales, or less than 5% of Lilly Pulitzer’s net sales, were to department stores. The remaining wholesale sales were primarily to off-price retailers and national accounts, including on-line retailers, and off-price retailers. Lilly Pulitzer’s net sales to its 10 largest wholesale customers represented 9% of Lilly Pulitzer’s net sales in Fiscal 20202023 with its largest customer representing less than 5% of Lilly Pulitzer’s net sales.

16

Table of Contents

An important part of Lilly Pulitzer’s wholesale distribution is sales to Signature Stores. For these stores, we enter into agreements whereby we grant the other party the right to independently operate one or more stores as a Lilly Pulitzer Signature Store, subject to certain conditions, including designating substantially all floor space specifically for Lilly Pulitzer products and adhering to certain trademark usage requirements. We sell products to these Lilly Pulitzer Signature Stores on a wholesale basis and do not receive royalty income associated with these sales. As of January 30, 2021,February 3, 2024, there were 4446 Lilly Pulitzer Signature Stores.

Johnny Was

In the Third Quarter of Fiscal 2022, we acquired the Johnny Was California lifestyle brand and related operations, which includes the design, sourcing, marketing and distribution of collections of affordable luxury, artisan-inspired bohemian apparel, accessories and home goods. The Johnny Was brand was founded in 1987 and continues to transcend fashion trends with its beautifully crafted, globally inspired products and demonstrates a unique ability to combine and mix elevated fabrics, patterns, bespoke prints and artisanal embroidery that distinguishes its product in the marketplace. Johnny Was products can be found on the Johnny Was website, johnnywas.com, and in our full-price retail stores as well as select department stores and specialty stores. During Fiscal 2023, approximately 90% of the net sales of Johnny Was were for women’s apparel, with the remaining sales consisting of Johnny Was accessories, including home products, shoes, scarves, handbags, and jewelry.

15

Table of Contents

Direct to Consumer Operations

The Johnny Was direct to consumer distribution channel, which consists of e-commerce operations and the Johnny Was retail stores, represented 79% of the Johnny Was net sales in Fiscal 2023. A key element of the Johnny Was strategy is the johnnywas.com website, which generated $84 million of net sales, or 41% of the net sales of Johnny Was, in Fiscal 2023. Another key component of our Johnny Was direct to consumer strategy is to operate our own Johnny Was stores, which represented 38% of the net sales of Johnny Was in Fiscal 2023.

Our full-price retail store strategy for the Johnny Was brand includes operating full-price retail stores in higher-end lifestyle shopping centers and malls, resort destinations and brand-appropriate street locations. As of February 3, 2024, about 75% of the Johnny Was full-price stores were located in lifestyle centers, open air shopping environments or street front locations with the remaining 25% of locations in indoor regional malls. Full-price retail store sales per gross square foot for Johnny Was for Fiscal 2023 were approximately $664. Full-price retail store sales per gross square foot for Johnny Was were approximately $740 for the full-price retail stores which were open the full 12 months ended January 28, 2023.

Our Johnny Was outlet stores are generally located in outlet shopping centers that include other upscale retailers and serve an important role in overall inventory management by often allowing us to sell discontinued and out-of-season products at better prices than are otherwise available from outside parties.

The table below provides certain information regarding Johnny Was direct to consumer locations as of February 3, 2024.


Full-Price


Retail Stores

Outlet Stores

Total

California


17


2


19

Florida


8


1


9

Texas


8


8

New York


4


4

Other states


35


35

Total


72


3


75

Average square feet per store


1,600


1,400


Total square feet at year end


117,000


4,200


During Fiscal 2023, 28%, 14% and 13% of the retail store sales of Johnny Was were in stores located in California, Texas and Florida, respectively. During Fiscal 2023, including e-commerce sales, California, Texas, and Florida represented 23%, 14% and 11%, respectively, of our total Johnny Was direct to consumer sales.

The table below reflects the changes in store count for Johnny Was during Fiscal 2023.


Full-Price


Retail Stores

Outlet Stores

Total

Open as of beginning of fiscal year


65


2


67

Opened

10

1

11

Closed


(3)


(3)

Open as of end of fiscal year


72


3


75

Currently, we expect to open approximately 10 new full-price retail stores in Fiscal 2024. During Fiscal 2024, we anticipate opening full-price retail stores across the country including stores in California, Florida, Idaho, Missouri, Massachusetts and New York. We believe that in Fiscal 2024, we may relocate or close a limited number of locations at lease expiration, or sooner based on store performance. The construction or relocation of retail stores requires a greater amount of initial capital investment than wholesale operations, as well as greater ongoing operating costs. The cost to build out a Johnny Was retail store is typically less than $0.5 million. In addition to new store openings, we also incur capital expenditure costs related to remodels or expansions of existing stores, particularly when we renew or extend a lease beyond the integrity and continued successoriginal lease term, or otherwise determine that a remodel of the Lilly Pulitzer brand, including itsa store is appropriate.

16

Table of Contents

Wholesale Operations

To complement our direct to consumer operations is dependent, in part, upon controlledand have access to a larger group of consumers, we maintain wholesale distributionoperations for Johnny Was. These wholesale operations are primarily with careful selectionbetter independent specialty and department stores and multi-branded e-commerce retailers that generally follow a retail model approach with limited discounting. During Fiscal 2023, 21% of the retailers through which Lilly Pulitzer products are sold. We continuenet sales of Johnny Was were sales to value our long-standing relationships with our wholesale customers and are committed to working with them to enhance the successapproximately 40% and 35% of the Lilly Pulitzer brand within their stores.wholesale sales of Johnny Was were to specialty stores and department stores, respectively. The remaining wholesale sales were primarily to off-price retailers and retailers in countries outside of the United States. Net sales to the 10 largest wholesale customers of Johnny Was represented 10% of the net sales of Johnny Was during Fiscal 2023 with its largest customer representing less than 5% of Johnny Was’ net sales.

Southern TideEmerging Brands

We acquiredEmerging Brands, which was organized in Fiscal 2022, consists of the operations of our smaller, earlier stage Southern Tide, TBBC, Duck Head and Jack Rogers brands. Investments in smaller lifestyle apparel brandbrands that are unconsolidated entities are included within Emerging Brands. Each of the brands included in Fiscal 2016. Southern TideEmerging Brands designs, sources, markets and distributes high-quality apparel and related products bearing its respective trademarks and is supported by Oxford’s emerging brands team that provides certain support functions to the distinctive Skipjack logo.smaller brands, including marketing and advertising execution, analysis and other functions. The shared resources provide for operating efficiencies and enhanced knowledge sharing across the brands. We acquired Southern Tide offers an extensive selection of men’s shirts, pants, shorts, outerwear, ties, swimwear,in 2016, Duck Head in 2016, TBBC in 2017 and Jack Rogers, a footwear brand, in 2023.

The table below reflects the net sales (in thousands) for Fiscal 2023 by brand for each brand included in Emerging Brands.

Fiscal 2023

Southern Tide

$

69,017

TBBC


43,524

Duck Head

12,780

Jack Rogers (1)

1,504

Total Emerging Brands net sales

$

126,825

(1)The Jack Rogers business was acquired during the Fourth Quarter of Fiscal 2023 and reflects activity from the acquisition date through February 3, 2024.

The brands distribute their products on their brand-specific e-commerce websites, southerntide.com, thebeaufortbonnetcompany.com, duckhead.com and accessories,jackrogersusa.com, as well as women’s and youth collections. Launched in 2006, Southern Tide combines the modern design elementswholesale channels of today’s youthful trends with lovedistribution for the Southern culture and lifestyle. Theeach brand has an appeal to all ages who have an appreciation for classic design, vibrant colors and a great fit and an affection for the coast. Southern Tide products can be found atthat may include independent specialty retailers, better department stores and brand specific Signature Stores. During Fiscal 2023, the majority of the net sales of both Southern Tide Signature Stores which are described below,and Duck Head were wholesale sales, while the majority of TBBC and Jack Rogers sales were direct to consumer sales.

Also, a key component of our Southern Tide website, southerntide.com, and our three Southern Tide retail stores. During Fiscal 2020, 64% of Southern Tide’s sales were wholesale sales, 32% of Southern Tide’s sales were e-commerce sales and 4% of Southern Tide’s sales were retail store sales.

We believe that thereTBBC growth strategy is significant opportunity to expand the reach of the Southern Tide brand by further increasing the wholesale presence of the brand and growing theour direct to consumer business including e-commerce and retail sales. We believe that wholesale growth and expansion will be at a prudent pace as we believe thatstore operations after both brands opened their first retail store locations in recent years. The table below provides certain information regarding the integrity and success of the Southern Tide brand is dependent, in part, upon controlled wholesale distribution with careful selection of the retailers through which Southern Tide products are sold. We anticipate that theEmerging Brands direct to consumer operations will grow at a faster pace than wholesale operations fueled by the additionlocations as of more owned Southern Tide retail stores in future years, as well as continued growth in our Southern Tide e-commerce operations. We opened the first owned Southern Tide retail store in the Fourth Quarter of Fiscal 2019, and had two additional store openings in Fiscal 2020.

We believe that in order to take advantage of opportunities for long-term growth, we must continue to invest in the Southern Tide brand. While we believe that these investments will generate long-term benefits, the investments may have a short-term negative impact on Southern Tide’s operating margin given the current size of the Southern Tide business.

Wholesale Operations

At this time, Southern Tide’s business is predominantly a wholesale business with sales to independent specialty stores, department stores and Southern Tide Signature Stores. Southern Tide’s wholesale operations provide an opportunity to grow our business and have access to a large group of consumers. During Fiscal 2020, approximately 16% and 7% of Southern Tide’s sales were to department stores and Southern Tide Signature Stores, respectively. Southern Tide’s net sales to its 10 largest wholesale customers represented 30% of Southern Tide’s net sales in Fiscal 2020, with its largest customer representing 12% of Southern Tide’s net sales.

A component of Southern Tide’s wholesale distribution is sales to Signature Stores. For Signature Stores, we enter into license agreements whereby we grant the other party the right to independently operate one or more stores as a Southern Tide Signature Store, subject to certain conditions, including designating substantially all floor space specifically for Southern Tide products and adhering to certain trademark usage requirements. We sell products to these Southern Tide Signature Stores on a wholesale basis and do not receive royalty income associated with these sales. As ofFebruary 3, 2024.

17

Table of Contents

Southern Tide

TBBC

Total Emerging Brands

Florida


9


2


11

South Carolina


3


1


4

Massachusetts

3

North Carolina


2


2

Other states


2


2

Total


19


3


22

Average square feet per store


1,600


1,400


Total square feet at year end


30,000


4,200


January 30, 2021, there were 18 Signature Stores including stores in Florida, Massachusetts, South Carolina and North Carolina. We anticipate some additional Signature Stores opening in

The table below reflects the future. In addition, we believe there is opportunity for wholesale growth for Southern Tidechanges in women’s apparel, which represented 18% of Southern Tide’s net sales in Fiscal 2020.

Direct to Consumer Operations

A key component of our Southern Tide growth strategy is to expand our direct to consumer operations, which consistslocation count for Emerging Brands during Fiscal 2023.


Southern Tide

TBBC

Total Emerging Brands

Open as of beginning of fiscal year


6


3


9

Opened / Acquired


13


13

Closed


Open as of end of fiscal year


19


3


22

We opened a total of the13 new Southern Tide website and retail store operations. Thestores during Fiscal 2023, including the acquisition of three former Southern Tide website markets a full linesignature stores located in Massachusetts during the First Quarter of merchandise, including apparelFiscal 2023 and accessories, all presentedthree additional former signature stores in a manner intended to enhance the Southern Tide image, brand awareness and acceptance. We believe our Southern Tide website enables us to stay close to the needs and preferences of consumers. In addition to off-price retailers, we also use the Southern Tide website as a means of liquidating discontinued or out-of-season inventory in a brand appropriate manner. During the year, we have a number of e-commerce clearance sales events, which are typically in industry end of season promotional periods.

In the Fourth Quarter of Fiscal 2019,2023, two of which are in South Carolina and one in Georgia. We also opened a total of seven stores in Florida, South Carolina, North Carolina and Texas. During Fiscal 2024, we opened our first ownedexpect to open approximately 10 additional Southern Tide retail store in Jacksonville, Florida. In Fiscal 2020, we opened retailstores, with stores in Fort LauderdaleFlorida, Texas, Alabama, Virginia and Destin, Florida. InNew York. Additionally, for TBBC, we anticipate opening at least one new store during Fiscal 2021, we plan to open a retail store in Islamadora, Florida and we2024. We continue to look at additional opportunities for new full-price store locations that may open later in the year. In the last couple of years, we prepared for these store openings and roll-out by supplementing theboth Southern Tide leadership team with retail management experience.

and TBBC. The operation of full-price retail stores requires a greater amount of initial capital investment than wholesale operations, as well as greater ongoing operating costs. We anticipate that most future full-price retail store openings for Southern Tide and TBBC will generally be approximately 1,500 to 2,000 square feet on average;feet; however, the determination of actual size of the store will depend on a variety of criteria. We anticipatecriteria, including the potential opportunities that for most of our full-price retail stores, the landlord will provide certain incentives to fund a portion of our capital expenditures.become available.

Lanier Apparel

In Fiscal 2020,2021, we made the decision to exitexited our Lanier Apparel business, which is expected to be completed during the second half of Fiscal 2021.had been focused on moderately priced tailored clothing and related products. This decision is in linealigns with our stated business strategy of developing and marketing compelling lifestyle brands and takesbrands. It also took into consideration the increased macroeconomic challenges faced by the Lanier Apparel business, many of which were magnified by the COVID-19 pandemic.

The operating results of the Lanier Apparel designs, sourcesbusiness in Fiscal 2021 largely consisted of activities associated with the wind down of operations following our Fiscal 2020 decision to exit the business. Refer to Note 12 and distributes branded and private label men’s apparel, primarily consisting of tailored clothing and casual pants, across a wide range of price points, but primarily at moderate price points. The moderate price point tailored clothing market has been an extremely competitive sector for years, with significant retail competition as well as increasing gross margin pressures due to retail sales price pressures and production cost increases.

The majorityNote 2 of our consolidated financial statements included in this report for additional information about the Lanier Apparel products were historically sold under certain trademarks licensed to us by third parties including Kenneth Cole®, Dockers®, Cole Haan®exit and Nick Graham®. Additionally, we designed and marketed products for our owned Billy London®, Oxford®, and Strong Suit® brands. In addition to these branded businesses, Lanier Apparel designed and sourced private label apparel products for certain customers. Lanier Apparel products are sold through large retailers including department stores, discount and off-price retailers, warehouse clubs, national chains, specialty retailers, multi-branded e-commerce retailers and others.

In Lanier Apparel, we historically had long-standing relationships with some of the United States’ largest retailers, including department stores which represented approximately 30% of Lanier Apparel’s sales in Fiscal 2020. Lanier Apparel’s three largest customers represented 20%, 15% and 10%, respectively, of Lanier Apparel’s net sales in Fiscal 2020, while sales to Lanier Apparel’s 10 largest customers represented more than 77% of Lanier Apparel’s net sales during Fiscal 2020. Approximately 70% of Lanier Apparel’s product purchases were from manufacturers located in Vietnam, with a significant concentration of purchases from just a few manufacturers.2021 operating results.

18

Table of Contents

Corporate and Other

Corporate and Other is a reconciling category for reporting purposes and includes our corporate offices, substantially all financing activities, the elimination of inter-segment sales, and any other items that are not allocated to the operating groups, including LIFO inventory accounting adjustments. Becauseadjustments as our LIFO inventory pool does not correspond to our operating group definitions, LIFO inventory accounting adjustments are not allocated to the operating groups. Corporate and Other also includes the operations of other businesses which are not included in our four operating groups. The operations of TBBC, Duck Head® and our Lyons, Georgia distribution center, are includedour Oxford America business, which generated net sales of $1 million and was exited in CorporateFiscal 2022, and Other. TBBC designs, sources, marketsour initial $8 million minority ownership interest in a property in Indian Wells, California that was converted and distributes premium childrenswear including bonnets, hats, apparel, swimwear and accessories throughrebranded in Fiscal 2023 as the TBBC e-commerce website, thebeaufortbonnetcompany.com, as well as wholesale specialty retailers. Duck Head designs, sources, markets and distributes premium men’s apparel including pants, shorts and tops through the Duck Head e-commerce website, duckhead.com, as well as wholesale specialty retailers.Tommy Bahama Miramonte Resort & Spa.

18

Table of Contents

TRADEMARKS

We own trademarks, many of which are very important and valuable to our business, including Tommy Bahama,Bahama®, Lilly PulitzerPulitzer®, Johnny Was®, Southern Tide®, The Beaufort Bonnet Company®, Duck Head® and Southern Tide.Jack Rogers®. Generally, our trademarks are subject to registrations and pending applications throughout the world for use on apparel and, in some cases, apparel-related products, accessories and home furnishings, and beauty products, as well as in connection with retail services. We continue to evaluate our worldwide usage and registration of our trademarks. In general, trademarks remain valid and enforceable as long as the trademarks are used in connection with our products and services in the relevant jurisdiction and the required registration renewals are filed. Important factors relating to risks associated with our trademarks include, but are not limited to, those described in Part I, Item 1A. Risk Factors.

ADVERTISING AND MARKETING

During Fiscal 2020 and Fiscal 2019,2023, we incurred $50$105 million, and $56 million, respectivelyor 7% of net sales, of advertising expense. Advertising and marketing are an integral part of the long-term strategy for our lifestyle brands, and we therefore devote significant resources to these efforts. Thus, we believe that it is very important that our brands communicate regularly with consumers about product offerings or other brand events in order to maintain and strengthen connections with consumers. Our advertising emphasizes the respective brand’s image and lifestyle and attempts to engage individuals within the target consumer demographic and guide them on a regular basis to our e-commerce websites, retail storesdirect to consumer locations or wholesale customers’ stores and websites in search of our products.

We increasingly utilize digital marketing, social media and email, as well asand continue to use traditional direct mail communications, to interact with our consumers. Our marketing may also include sponsorships, collaborations, and co-branding initiatives, which may be for a particular cause or non-profit organization that is expected to resonate with target consumers, and traditional media such as catalogs, print and other correspondence with consumers.

We vary our engagement tactics to elevate the consumer experience as we attract new consumers, drive conversion, build loyalty, activate consumer advocacy and address the transformation of consumer shopping behaviors. Our creative marketing teams design and produce imagery and content, social media strategies and email and print campaigns designed to inspire the consumer and drive traffic to our direct to consumer locations and websites as well as to increase influencer amplification.the brand. We attempt to increase our brand awareness through a strategic emphasis on technology and continuing to elevatethe elevation of our digital presence which encompasses e-commerce, mobile e-commerce, digital media, social media and influencer marketing. WeIn this environment where many people are also investingdigital-first consumers, we continue to enhance our approach to digital marketing and invest in analytical capabilities to promote a more personalized experience across our distribution channels. WeAt the same time, we continue to innovate to better meet consumer online shopping preferences (e.g. loyalty, ratings and reviews and mobile phone applications) and build brand equity. The COVID-19 pandemic has had a significant impact on consumer behaviors and has accelerated theongoing trend fortowards a digital first consumer. Thisconsumer provided a catalyst for accelerating the implementation of new direct to consumer business models and consumer engagement programs, such as selling through social media.

19

Table of Contents

Marketing initiatives in our direct to consumer operations may include special event promotions, including loyalty award card, Flip Side, Friends & Family and gift with purchase events and a variety of public relations activities designed to create awareness of our brands and products, drive traffic to our websites and stores, convert new consumers and increase demand and loyalty. Our various initiatives are effective in increasing online and in-store traffic resulting in the proportion of our sales that occur during our promotional marketing initiatives, such as Tommy Bahama’s Friends & Family events, increasing in recent years, which puts some downward pressure on our direct to consumer gross margins.

We believeOur marketing may also include sponsorships, collaborations, and co-branding initiatives, which may be for a particular cause or non-profit organization that highly visible full-price retail store locationsis expected to resonate with creative design, broad merchandise selection and brand appropriate visual presentation are key enticements for customers to visit and buy merchandise. We believe that full-price retail stores attract new consumers and enhance the shopping experience of our existing customers, which will increase consumer brand loyalty, our net sales and sales of our products for our wholesale customers.

target consumers. For certain of our wholesale customers, we may also provide point-of-sale materials and signage to enhance the presentation of our products at their retail locations and/or participate in cooperative advertising programs.

PRODUCT DESIGN

We believe that one of the principalkey competitive factors in the apparel industry areis the reputation, value, and image of brand names; design of differentiated, innovative or otherwise compelling product; consumer preference; price; quality; marketing; product fulfillment capabilities; and customer service.that resonates with our target consumers. Our ability to compete successfully in the apparel industry is directly related todependent on our proficiency in foreseeing changes and trends in fashion and consumer preference and presenting appealing products for consumers. Our design-led, commercially informed lifestyle brand operations strive to provide exciting, differentiated products each season.

19

Table of Contents

Each of our lifestyle brands’ products are designed and developed by dedicated brand-specific teams who focus on the target consumer for the respective brand. The design process includes feedback from buyers, consumers and sales agents, along with market trend research. Our apparel products generally incorporate fabrics made of cotton, silk, linen, nylon,polyester, cellulosic fibers, leather tencel and other natural and man-made fibers, or blends of two or more of these materials.

PRODUCT SOURCING AND CORPORATE SOCIAL RESPONSIBILITY

We intend to maintain flexible, diversified, cost-effective sourcing operations that provide high-quality apparel and related products. Our operating groups, either internally, using in-house employees located in the United States and/or Hong Kong, or through the use of third partythird-party vendors or buying agents, manage the production and sourcing of substantially all of our apparel and related products from non-exclusive, third party producers located in foreign countries.

Although we place a high value on long-term relationships with our suppliers of apparel and related products and have used many of our suppliers for a number of years, generally we do not have long-term contracts with our suppliers. Instead, we conduct business on an order-by-order basis. Thus, we compete with other companies for the production capacity of independent manufacturers. We believe that this approach provides us with the greatest flexibility in identifying the appropriate manufacturers while considering quality, cost, timing of product delivery and other criteria. We generally acquire products sold in our restaurant operations from various third party domestic suppliers. During Fiscal 2020,2023, we purchased our products from approximately 260 suppliers, with a significant concentration of suppliers in Asia. Our 10 largest suppliers provided approximately one-third of our product purchases. During Fiscal 2023, no individual third party manufacturer, licensee or other supplier provided more than 10% of our product purchases in total or fortotal. We generally acquire products sold in our Tommy Bahamafood and Lilly Pulitzer operating groups, while the purchases for our smaller operating groups and businesses each had certain vendors that provided more than 10% of product purchases. beverage operations from various third party domestic suppliers.

During Fiscal 2020, we purchased our products from2023, approximately 300 suppliers with the 10 largest suppliers providing approximately 25% of our product purchases.

The production41% and 23% of our apparel and related products has a significant concentration in Asia. During Fiscal 2020 approximately 35% and 22%, compared to 49% and 18% for Fiscal 2019, of our apparel and related products, excluding restaurant products, acquired directly by us or via vendors or buying agents, were from producers located in China and Vietnam, respectively, with no other country representing more than 10% of such purchases. For Fiscal 2020,Johnny Was, which was acquired in 2022, sources approximately 90% of its products from China. While we have and will continue to work on diversifying our supplier base and reducing the percentageconcentration of products sourcedmanufacturing from China forin the future, the majority of fibers included in our Tommy Bahamaapparel and Lilly Pulitzer operating groups were 47% and 28%,

20

Table of Contents

respectively, with the percentage concentration from China for both operating groups decreasing from the prior year. We expect that the percentage of ourother products sourced from producers locatedcurrently originate in China will decrease further.even if the products are manufactured elsewhere.

We purchase substantially all of our apparel and related products from third partythird-party producers, substantially all as package purchases of finished goods, whichgoods. These products are manufactured to our design and fabric specifications with oversight by us or our third partythird-party vendors or buying agents and to our design and fabric specifications.agents. The use of contract manufacturersthird-party producers reduces the amount of capital investment required by us, as operating manufacturing facilities can requirerequires a significant amount of capital investment.investment, labor and oversight. We depend on third partythird-party producers to secure a sufficient supply of specified raw materials, adequately finance the production of goods ordered and maintain sufficient manufacturing and shipping capacity. We believe that purchasing substantially all of our products as package purchases allows us to reduce our working capital requirements as we are not required to purchase, or finance the purchase of, the raw materials or other production costs related to our apparel and related product purchases until we take ownership of the finished goods, which typically occurs when the goods are shipped by the third partythird-party producers. In addition to purchasing products from third parties, our Lanier Apparel operating group operated an owned manufacturing facility located in Merida, Mexico, which ceased operations in Fiscal 2020.

As the design, manufacture and transportation of apparel and related products for our brands may take as many as six months for each season, we typically make commitments months in advance of when products will arrive in our full-price retail stores or our wholesale customers’ stores. We continue to seek ways to reduce the time required from design and ordering to bringing products to our customers. As our merchandising departments must estimate our requirements for finished goods purchases for our own full-price retail stores and e-commerce sites based on historical product demand data and other factors, and as purchases for our wholesale accounts must be committed to prior to the receipt of all wholesale customer orders, we carry the risk that we have purchased more inventory than will ultimately be desired or that we will not have purchased sufficient inventory to satisfy demand, resulting in lost sales opportunities.

CORPORATE RESPONSIBILITY

We recognize that our business operations throughout the value chain impact people and the environment and believe that, as a leading apparel company, we have a responsibility to reduce those impacts. Our Board is ultimately charged with overseeing the risks to our business on behalf of our shareholders, and we believe that our Board’s active involvement in oversight of environmental, social and governance (“ESG”) initiatives affords us tremendous benefits. We

20

Table of Contents

report routinely to our Board and/or various Board committees about ESG risks and strategies and communicate insights provided by our directors to our brands to assist in formulating ESG goals and initiatives.

Reducing our Impact

We are committed to identifying and executing commercially viable corporate responsibility initiatives in furtherance of a safer, more sustainable world. To support this objective, we organized a new Corporate Responsibility team at the end of Fiscal 2022 to efficiently manage environmental sustainability, social responsibility and traceability across the enterprise. Drawing on existing expertise from our Tommy Bahama initiatives, the new function ensures a consistent approach to corporate responsibility across our brands. The team reports to our General Counsel, with input from our Executive Leadership Team, and will focus in the immediate future on assessing corporate responsibility risks and opportunities, establishing baseline metrics and objectives and collaborating with our brands on potential brand-specific initiatives.

As part of our commitment to source our products in a lawful, ethical and socially responsible manner, each of our operating groups haswe have implemented a code of conductsupplier corporate responsibility program applicable to vendors and producers from whom we purchase apparel and related products, whichproducts. The program includes provisions related to abiding bya comprehensive Supplier Code of Conduct that requires compliance with applicable laws as well as compliance with other international business orand ethical standards, including related human rights, health, safety, working conditions, environmental and other requirements. We also require that each of our vendors and licensees comply with the applicable code of conduct or substantially similar compliance standards. All of ourall vendors from whom we purchase goods are also required by us to adhere to the United States Customs and Border Protection’s Customs-TradeCustoms Trade Partnership Against Terrorism program, including standards relating to facility, procedural, personnel and cargo security. On an ongoing basis we assess vendors’

We monitor compliance with the applicable codeour Supplier Code of conductConduct and applicable laws and regulations through auditssocial assessments performed by eithercredible third parties and require our employeessuppliers to partner with us to remediate issues identified. Social assessments of our tier 1 and strategic tier 2 producers are required annually or our designated agents. The assessment of compliance by vendors is directed by our corporate leadership team.more frequently. In the event we determine that a vendor issupplier cannot or will not abiding by our required standards, we work with the vendor to remediate the violation. If the violation is not satisfactorily remediated,issues, we will discontinue use of the vendor. Forsupplier.

We also continue to participate in various trade associations and organizations to drive industry-wide collective action and ensure we remain informed about emerging laws, risks, opportunities and best practices. We are an active member of the American Apparel & Footwear Association (AAFA) and in 2023, we transitioned Tommy Bahama’s membership in Cascale (formerly the Sustainable Apparel Coalition) to an enterprise-wide membership to support each of our brands in their journeys toward more informationresponsible production. Additionally, various combinations of our brands are members of the Textile Exchange, Better Cotton, and the Good Cashmere Standard by the Aid by Trade Foundation to further our adoption of preferred materials.

ENRICHING OUR COMMUNITIES

Since our founding in 1942, we have prided ourselves on being model citizens for the communities in which we operate.  We focus our community initiatives on programs that can impact a broad set of constituents where we operate. Our community partners include the United Way of Greater Atlanta, the Woodruff Arts Center and Grady Hospital, and each of our operating groups partners with respectorganizations improving quality of life in the communities where our customers and employees live and work.

In 2020, we announced the launch of the Oxford Educational Access Initiative to corporate social responsibility, please visitfurther our website at oxfordinc.com.goal of reducing economic and racial inequality through access to education. We believe that every child, regardless of race or economic circumstance, deserves the chance to learn and be successful. Over the course of four years beginning in 2021, we have committed to fund an aggregate of $1 million to community organizations with innovative program models that address a broad spectrum of educational challenges that children in underserved communities face. Each of our brands has selected recipient organizations that are working to address disparities in educational access and barriers to success for children in our local communities.

21

Table of Contents

IMPORT RESTRICTIONS AND OTHER GOVERNMENT REGULATIONS

We are exposed to certain risks as a result of our international operations as substantially all of our merchandise, as well as the products purchased by our licensing partners, is manufactured by foreign suppliers. During Fiscal 2020, approximately 35% and 22% of our apparel and related products, excluding restaurant products, acquired directly by us or via buying agents, were from producers located in China and Vietnam, respectively, with no other country representing more than 10% of such purchases. Products imported by us, or imported by others and ultimately sold to us, are subject to customs, trade and other laws and regulations governing their entry into the United States and other countries where we sell our products, including various federal, state, local and localforeign laws and regulations that govern any of our activities that may have adverse environmental, health and safety effects. Noncompliance with these laws and regulations may result in significant monetary penalties.

Substantially all of the merchandise we acquire is subject to certain duties which are assessed on the value of the imported product. These amounts represent a component of the inventories we sell and are included in cost of goods sold in our consolidated statements of operations. We paid total duties of more than $30$58 million and $45 million on

21

Table of Contents

products imported into the United States directly by us in Fiscal 2020 and Fiscal 2019, respectively,2023, with the average duty rate on those products of approximately 17%19% of the value of the imported product in Fiscal 2020.2023. Duty rates vary depending on the type of garment, fiber content and country of origin and are subject to change in future periods. In addition, while the World Trade Organization’s member nations have eliminated quotas on apparel and textiles, the United States and other countries into which we import our products are still allowed in certain circumstances to unilaterally impose "anti-dumping" or "countervailing" duties in response to threats to their comparable domestic industries.

Although we have not been materially inhibited from sourcing products from desired markets in the past, we cannot assure that significant impediments will not arise in the future as we expand product offerings and brands and enter into new markets. In recent years the United States government has implemented additional duties on certain product categories across various industries. It is possible that additional duty increases could occur in future years, which could have a significant unfavorable impact on the apparel retail industry and our cost of goods sold, operations, net sales, net earnings and cash flows. Our management regularly monitors proposed regulatory changes and the existing regulatory environment, including any impact on our operations or on our ability to import products. As a result of these changes and increased costs of production in certain countries that unfavorably impact our cost of goods sold, we continue to make changes in our supply chain, including exiting certain factories and sourcing those products from a factory in a different foreign country.

In addition, apparel and other related products sold by us are subject to stringent and complex product performance and security and safety standards, laws and other regulations. These regulations relate principally to product labeling, product content, certification of product safety and importer security procedures. We believe that we are in material compliance with those regulations. Our licensed products and licensing partners are also generally subject to such regulation. Our agreements require our licensing partners to operate in compliance with all laws and regulations.

Important factors relating to risks associated with government regulations, including forced labor laws, include those described in Part I, Item 1A. Risk Factors.

DISTRIBUTION CENTERS

We operate foura number of distribution centers, with each operating group generally serviced by one distribution center.centers. Our Auburn, Washington, King of Prussia, Pennsylvania and Toccoa, GeorgiaLos Angeles, California distribution centers serve our Tommy Bahama, Lilly Pulitzer and Lanier ApparelJohnny Was operating groups, respectively. Additionally, a third-party distribution center in Los Angeles, California provides distribution services for the Johnny Was e-commerce operations. Our Lyons, Georgia distribution center provides primary distribution services for our smaller Southern Tide, TBBC and Duck Head businesses, as well as certain distribution services for our Lilly Pulitzer business and certain third party customers.Tommy Bahama businesses.

In Fiscal 2023, we began a multi-year Southeastern United States distribution center enhancement project in Lyons, Georgia to build a new facility to ensure best-in-class direct-to-consumer throughput capabilities for our brands. The new facility will provide direct to consumer support for all of our brands, including the East Coast operations of Tommy Bahama. We anticipate total capital expenditures in excess of $130 million over the life of the project, with the majority of the spend occurring in Fiscal 2024, and expect completion of the new facility in the Second Half of Fiscal 2025.

22

Table of Contents

Activities at the distribution centers include receiving finished goods from suppliers, inspecting the products and shipping the products to our retail store, e-commerce and wholesale customers, each as applicable. We seek to maintain sufficient levels of inventory at the distribution centers to support our direct to consumer operations, as well as pre-booked, at-once and some in-stock replenishment orders for our wholesale customers. We use a local third party distribution center for our Tommy Bahama Australia operations.

More than 75%In Fiscal 2023, 80% of our net sales in Fiscal 2020 were direct to consumer sales, which are filled on a current basis; accordingly, an order backlog is not material to our business.

INFORMATION TECHNOLOGIES

We believe that sophisticated information systems and functionality are important components of maintaining our competitive position and supporting continued growth of our businesses, particularly in the ever-changing consumer shopping environment. Our information systems are designed to provide effective retail store, e-commerce, restaurantfood and beverage and wholesale operations while emphasizing efficient point-of-sale, distribution center, design, sourcing, order processing, marketing, customer relationship management, accounting and other functions. We regularlyperiodically evaluate the adequacy of our information technologies and upgrade or enhance our systems to gain operating efficiencies, to provide additional consumer access and to support our anticipated growth as well as other changes in our business. We believe

22

Table of Contents

that, where possible, continuous upgrading and enhancements to our information systems with newer technology that offers greater efficiency, functionality and reporting capabilities is critical to our operations and financial condition.

LICENSING AGREEMENTSAND OTHER DISTRIBUTION ARRANGEMENTS

We license certain of our trademarks, including the Tommy Bahama and Lilly Pulitzer and Southern Tide trademarksnames, to licensees in categories beyond our brands’ core product categories. We believe licensing is an attractive business opportunity for our larger lifestyle brands. Once a brand is more fully established, licensing typically requires modest additional investment but can yield high-margin income. It also affords the opportunity to enhance overall brand awareness and exposure. In evaluating a licensee for our brands, we typically consider the candidate’s experience, financial stability, sourcing expertise and marketing ability. We also evaluate the marketability and compatibility of the proposed licensed products with the brand image and our own products.

Our agreements with our licensees are brand specific, relate to specific geographic areas and have expirations at various dates in the future, with contingent renewal options in limited cases. Generally, the agreements require minimum royalty payments as well as royalty payments based on specified percentages of the licensee’s net sales of the licensed products as well as certain obligations for advertising and marketing. Our license agreements generally provide us the right to approve all products, advertising and proposed channels of distribution.

We license the Tommy Bahama brand for a broad range of product categories including indoor furniture, outdoor furniture, beach chairs, bedding and bath linens, fabrics, leather goods and gifts, headwear, hosiery, sleepwear, shampoo, toiletries, fragrances, cigar accessories, distilled spirits, resort operations and other products. Third party license arrangements for Lilly Pulitzer products include stationery and gift products; home furnishing products; and eyewear. We currently license the Southern Tide trademark to licensees for certain bed and bath product categories.

In addition to our license arrangements for the specific product categories listed above, we may enter into certain international distributor agreements which allow thosethird parties to distribute apparel and other products on a wholesale and/or retail basis within certain countries or regions. As of January 30, 2021,February 3, 2024, we have agreements for the distribution of Tommy Bahama products in the Middle East and parts of Latin America. The products sold by the distributors generally are identical to the products sold in our own Tommy Bahama stores. In addition to selling Tommy Bahama goods to wholesale accounts, the distributors may, in some cases, operate a limited number of their own retail stores. As of January 30, 2021,Additionally, we have licensed Tommy Bahama stores locatedarrangements for distribution of Johnny Was products in the Middle East and Central America.certain countries. None of theseour international distributor agreements are expected to generate growth that would materially impact our operating results in the near term.

23

Table of Contents

SEASONAL ASPECTS OF BUSINESS

Each of our operating groups is impacted by seasonality as the demand by specific product or style, as well as by distribution channel, may vary significantly depending on the time of year. Typically, the demand for products for our larger brands and principal markets is higher in the spring, summer and holiday seasons and lower in the fall season (generally, the third quarter of our fiscal year). As a result, our quarterly operating results and working capital requirements fluctuate significantly from quarter to quarter. Typically, the demand for products for our larger brands is higher in the spring, summer and holiday seasons and lower in the fall season (the third quarter with theof our fiscal year). Thus, our third quarter historically havinghas had the lowest net sales and net earnings compared to our other quarters and incurring an operating loss.quarters. Further, the impact of the timing of certain unusual or non-recurring items, economic conditions, our e-commerce flash clearance sales, wholesale product shipments, weather, acquisitions or other factors affecting our operations may vary from one year to the next. Therefore, due to the potential impact of these items, we do not believe that net sales or operating income for any particularby quarter or the distribution of net sales and operating income forin Fiscal 2019 or Fiscal 20202023 are necessarily indicative of the expected distribution inproportion of amounts by quarter for future years, particularly in light of the COVID-19 pandemic’s significant impact on our Fiscal 2020 operating results.periods.

HUMAN CAPITAL MANAGEMENT

Our key strategy is to own brands that make people happy, and we recognize that successful execution of our strategy starts with people.  We believe treating people fairly and with respect is key to long-term success and, more importantly, is simply the right thing to do.

23

Table of Contents

As of January 30, 2021,February 3, 2024, we employed approximately 3,900over 6,000 individuals globally, more than 95%96% of whom were in the United States.  Approximately 2,700 and 800 of these employees were dedicated to our Tommy Bahama and Lilly Pulitzer businesses, respectively, while approximately 70%77% of our employees were retail store and restaurantfood and beverage employees.  Our employee base fluctuates during the year, as we typically hire seasonal employees to support our retail store and restaurantfood and beverage operations, primarily during the holiday selling season. None of our employees as of January 30, 2021 wasFebruary 3, 2024 were represented by unions.

Fiscal 2020 was a challenging year for our company, with the COVID-19 pandemic causing temporary, extended closures of all of our retail stores and restaurants in the First Half of Fiscal 2020 and significantly disrupting the retail apparel industry. Even after reopening certain of our bricks and mortar operations, due to government and health requirements and guidelines, we elected to offer only limited curbside pickup at some locations and restrict operating hours, where necessary. We also made some difficult decisions to strategically reduce our workforce to right-size our operations to preserve liquidity in the short-term but, more importantly, position ourselves to thrive in a post-pandemic retail environment. As a result, our total employee headcount declined more than 30% from the end of Fiscal 2019 to the end of Fiscal 2020.union.

Commitment to our Core Values

Our actions are guided by our company’s core values:

Integrity – Build trust through honest relationships. Do the right thing.
Respect – Have respect for oneself and for one another. Lead by example. Exercise humility.
Inclusion – Root our relationships with one another in understanding, awareness and mutual respect. Value and embrace diversity. Welcome the respectful, open expression of differing ideas and perspectives.
Accountability – Own our words, decisions and actions. Earn our reputation.
Teamwork – Show up for each other. Solve problems through good and transparent communication. Know we are strongest when we work as a team.
Curiosity – Improve and innovate. Simplify and streamline. Embrace change. Challenge ourselves.

We believe that our adherence to these core values in everything we do as a company furthers our good relations with employees, suppliers and customers.

Commitment to Human Rights and our Code of Conduct

We are committed to respecting human rights in our business operations, including throughout our supply chain and product life cycle. As part of our supplier audit processes, we conduct human rights due diligence to identify risks and work to mitigate them, and our Supplier Code of Conduct sets forth minimum social responsibility requirements to ensure that the human rights of all people in our value chain are respected. We do not tolerate harassment, discrimination, violence or retaliation of any kind.

Our Code of Conduct applies to all employees, officers and directors in our organization and addresses, among other topics, compliance with laws, avoiding conflicts of interest, gifts and entertainment, bribery and kickbacks, anti-discrimination and anti-harassment and reporting misconduct. Our General Counsel takes responsibility for reviewing and refreshing our Code of Conduct; educating our team members about our expectations; and, as applicable, enforcing the Code of Conduct. All employees at the time of hire are required to read and certify compliance with the Code of Conduct and are given an opportunity to ask questions.

24

Table of Contents

Talent and Development

We are always looking for great people to join our team.  We recognize that in order to remain competitive, we must attract, develop and retain top caliber employees in our design, marketing, merchandising, information technology and other functions, as well as in our retail stores, restaurantsdirect to consumer locations and distribution centers.  Competition for talented employees is intense.

In furtherance of attracting and retaining employees committed to our core values and business strategy, we maintain competitive compensation programs that include a variety of components, including competitive pay consistent with skill level, experience and knowledge, as well as comprehensive benefit plans consisting of health and welfare plans, retirement benefits and paid leave for our employee base in the United States.

In 2018, we launched an ongoing initiativeWe continue to assess how well we’rewe are doing in managing performance, developing our people and putting our talent to its highest and best use across our company.  Our aim is greater employee engagement and ultimately a more effective organization. As part of our commitment to our people, throughout our brands and businesses, we provide employees with training, growth and development opportunities, including on-the-job training, learning and development programs, and other educational programs.

Health and Safety

We are committed to maintaining a clean, safe and healthy work environment for all of our employees. In the interest Outside of the healthUnited States, we work with outside partners familiar with the local markets and safety oflaws to ensure our employees, we made the preemptive decision prior to government mandate to close all of our retail storerewards are competitive within that jurisdiction and restaurant operations in North America starting on March 17, 2020. For our distribution

24

Table of Contents

centers that continued to operate to service our e-commerce operations, as well as our retail stores, restaurants and corporate office operations that reopened at various points during Fiscal 2020, we have been carefully monitoring guidelines published by the Center for Disease Control and Prevention and have established a number of safety protocols, including face covering and physical distance policies, enhanced cleaning, daily self-health checks and temperature screenings. We continue to review, monitor and revise our protocols, as appropriate.support employee well-being.

Diversity & Inclusion

Our ongoing commitment to having the best people includes a commitment to equal opportunity. We believe in a diverse and inclusive workplace that respects and invites differing ideas and perspective.perspectives. We have a number of initiatives to ensure that our hiring, retention and advancement practices promote fair and equal opportunities across our workforce and ensure that we will have the best people in the industry to support our businesses going forward.

Our diversity and inclusion strategies begin at the recruiting stage, where we seek to attract and hire the most qualified candidates possible, without regard to race, ethnicity, national origin, gender, age, sexual orientation, genetics or other protected characteristics. We reinforce our values and goals through our Code of Conduct and other workplace policies, with an anonymous, confidential ethics hotline that allows our employees to voice concerns. We also seek to ensure that our pay and rewards programs and advancement opportunities are consistent with our culture of equality.

As of January 30, 2021,February 3, 2024, our globaldomestic workforce, which comprised over 96% of our employee population, was self-disclosed as 38%34% male, 62%66% female and less than 1% undisclosed or choosing not to identify.  Among our management employees, who comprise approximately 20%19% of our workforce, the self-disclosed figures were 33%29% male, 67%71% female and less than 1% undisclosed or choosing not to identify. As of January 30, 2021, in the United States, which is the only jurisdiction in which our employees self-disclose ethnicity,February 3, 2024, the self-disclosed ethnicity of our domestic workforce was 62%59% white (not Hispanic or Latino) and 38%41% non-white, whereas for management employees, in the United States, the self-disclosed ethnicity figures were 78%71% white (not Hispanic or Latino) and 22%29% non-white.

We make a concerted effort to encourage the exchange of ideas and to actively listen to employee dialogue, provide appropriate training and ensure that the interests of all our employees are supported and advanced. We hope to maintain an environment where there is a sense of belonging and all voices are heard and valued.

Additional Information

For more information on our human capital management efforts, visit the Corporate Responsibility section of our website at https://www.oxfordinc.com/corporate-responsibility.

INFORMATION

Oxford Industries, Inc. is a Georgia corporation originally founded in 1942. Our corporate headquarters are located at 999 Peachtree Street, N.E., Ste. 688, Atlanta, Georgia 30309. Our internet address is oxfordinc.com. Copies of our annual report on Form 10-K, proxy statement, quarterly reports on Form 10-Q and current reports on Form 8-K, and amendments to those reports filed or furnished pursuant to Section 13(a) or 15(d) of the Securities Exchange Act of 1934, as amended, are available free of charge on our website the same day that they are electronically filed with the SEC. We also use our website as a means of disclosing additional information, including for complying with our disclosure obligations under the SEC’s Regulation FD (Fair Disclosure). The information on our website is not and should not be considered part of this Annual Report on Form 10-K and is not incorporated by reference in this document.

Item 1A.   Risk Factors

The risks described below highlight some of the factors that could materially affect our operations. If any of these risks actually occurs, our business, financial condition, prospects and/or operating results may be adversely

25

Table of Contents

affected. These are not the only risks and uncertainties we face. Additional risks and uncertainties that we currently consider immaterial or are not presently known to us may also adversely affect our business.

Risks Related to our Industry and Macroeconomic Conditions

The COVID-19 pandemic has had, and will continue to have, a material adverse effect on our business, revenues, financial condition and results of operations.

The ongoing COVID-19 pandemic has severely restricted the level of economic activity around the world. In response to this pandemic, governments and public health officials of many countries, states, cities and other geographic regions have taken preventative or protective actions to mitigate the spread and severity of the coronavirus, such as imposing restrictions on travel and business operations and advising or requiring individuals to limit or forego their time

25

Table of Contents

outside of their homes. Due to the COVID-19 pandemic, we temporarily closed all our retail stores and restaurants in the First Half of Fiscal 2020.

Although almost all of our stores and restaurants are open at this time, the operations of our stores continue to be impacted by requirements imposed by state and local governments with respect to occupancy levels, indoor dining and health and safety measures. In addition, our business is particularly sensitive to reductions in discretionary consumer spending, and we cannot predict the duration or severity of the impact of the COVID-19 pandemic on our business. There continue to be numerous uncertainties associated with the COVID-19 pandemic, including the timing and efficacy of vaccine distribution in the regions where we operate, the willingness of the public to be vaccinated, the potential spread of new variants of COVID-19, and the actions of governments and third parties in response to any resurgence of COVID-19 cases or spread of new variants. Further, even after containment of the virus, any prolonged reduction in consumer traffic, consumer willingness to visit malls and shopping centers or levels of consumer discretionary spending would result in a further loss of revenues.

The COVID-19 pandemic has also impacted, and may continue to impact, our office locations, distribution centers and shipping vendors, which may negatively impact our ability to meet consumer demand and may increase our costs of production and distribution. Our fulfillment of customer orders depends on third party shipping vendors. Service delays or disruptions, restrictions on services available to us or price increases imposed by these vendors due to increased demand or operational challenges as a result of the COVID-19 pandemic could lead to higher expenses or an inability to deliver merchandise to our customers. Any failure to deliver customer orders on a timely and consistent basis could result in returns, requests for refunds, cancellation of orders or lost sales and could harm our reputation and relationships with our customers.

Any of the negative impacts of the COVID-19 pandemic, alone or in combination with others, could exacerbate many of the other risk factors discussed in this report. The full extent to which the COVID-19 pandemic will negatively affect our results of operations, financial condition and cash flows will depend on future developments that are highly uncertain and cannot be predicted.

Our business and financial condition are heavily influenced by general economic and market conditions which are outside of our control.

We are a consumer products company and are highly dependent on consumer discretionary spending and retail traffic patterns, particularly in the United States. The demand for apparel products changes as regional, domestic and international economic conditions change and may be significantly impacted by trends in consumer confidence and discretionary consumer spending patterns, whichpatterns. These trends may be influenced by employment levels; recessions; inflation;inflation and elevated interest rates; fuel and energy costs; interest rates; tax rates; personal debt levels; savings rates; stock market and housing market volatility; shifting social ideology; concerns about the political and economic climate; and general uncertainty about the future. The factors impacting consumer confidence and discretionary consumer spending patterns are outside of our control and difficult to predict, and, often, the apparel industry experiences longer periods of recession and greater declines than the general economy.

Recently, the U.S. economy has been impacted by elevated inflation rates, which has created a complex and challenging retail environment that has affected consumer spending and consumer preferences. In addition, asFiscal 2023 and continuing into Fiscal 2024, the growth inprevailing macroeconomic concerns have led to conservative purchase order decisions for future seasons by many of our direct to consumer operations continues to outpace our other operations, we have increased exposure to the risks associated with a volatile and unpredictable economic environment. Anywholesale customers. A decline in consumer confidence or change in discretionary consumer spending patterns could reduce our sales, increase our inventory levels, result in more promotional activities and/or lower our gross margins, any or all of which may adversely affect our business and financial condition.

The agenda of the new U.S. presidential administration includes a number of potential policy and legislation changes, including changes to U.S. tax legislation that could adversely affect our effective tax rate and to economic policies which could impact general economic conditions. Any such changes to U.S. policy or legislation could have a greater effect on us compared to our peers as a result of the concentration of our operations in the United States.

We operate in a highly competitive industry with significant pricing pressures and may face competition from companies with significantly greater resources than us.heightened customer expectations.

We operate in a highly competitive industry in which the principal competitive factors are the reputation, value and image of brand names; design of differentiated, innovative or otherwise compelling product; consumer preference;

26

Table of Contents

price; quality; marketing;marketing (including through rapidly shifting digital and social media vehicles); product fulfillment capabilities; and customer service. The highly competitive apparel industry is characterized by low barriers to entry, with new competition entering the marketplace regularly. There are numerous domestic and foreign apparel designers, manufacturers, distributors, importers, licensors and retailers, some of whom are also our customers.retailers. Some of these companies may be significantly larger or more diversified than us and/or have significantly greater financial resources than we do. Competitive

Competition in the apparel industry is particularly enhanced in the digital marketplace for our rapidly growing e-commerce businesses, where there are new entrants in the market, greater pricing pressure and heightened customer expectations and competitive pressure related to, among other things, customer engagement, delivery speed, shipping charges and return privileges. In addition, fast fashion, value fashion and off-price retailers, as well as the more recent declines in spending within the consumer and retail sector, have contributed to additional promotional pressure. These and other competitive factors within the apparel industry may result in reduced sales, increased costs, lower prices for our products and/or decreased margins.

Failure to anticipate and adapt to changing fashion trends and consumer preferences could harm our reputation and financial performance.

We believe that our ability to compete successfully is directly related to our proficiency in foreseeing changes and trends in fashion and consumer preference and presenting appealing products for consumers when and where they seek it.them. Although certain of our products carry over from season to season, the apparel industry is subject to rapidly changing fashion trends and shifting consumer expectations,expectations. The increasing shift to digital brand engagement and social media communication, as evidencedwell as the attempted replication of our products by the recent acceleration of casualization trends in thecompetitors, presents emerging challenges for our business. The apparel industry in the midst of the COVID-19 pandemic.is also impacted by changing consumer preferences regarding spending categories generally, including shifts away from traditional consumer product spending and towards “experiential” spending and sustainable products. There can be no assurance that we will be able to successfully evaluate and adapt our products to

26

Table of Contents

align with consumer preferences and changes in consumer demographics.evolving trends. Any failure on our part to develop and market appealing products could harm the reputation and desirability of our brands and products and/or result in weakened financial performance.

Our operations and those of our suppliers, vendors and wholesale customers may be affected by changes in weather patterns, natural or man-made disasters, civil unrest, public health crises, war, terrorism or other catastrophes.

Our sales volume and operations and the operations of third parties on whom we rely, including our suppliers, vendors, licensees and wholesale customers, may be adversely affected by unseasonable or severe weather conditions or other climate-related events, natural or man-made disasters, hurricanes, public health crises, pandemics, war, terrorist attacks, including heightened security measures and responsive military actions, or other catastrophes which may cause consumers to alter their purchasing habits or result in a disruption to our operations.operations, such as the damage to, and temporary closure of, our Tommy Bahama restaurant and retail store in Naples, Florida due to Hurricane Ian in September 2022 and the destruction of our Tommy Bahama Marlin Bar in Lahaina, Hawaii by wildfires in August 2023. Our business may also be adversely affected by instability, disruption or destruction, regardless of cause, including civil insurrection or unrest.cause. These events may result in closures of our retail stores, restaurants, offices or distribution centers and/or declines in consumer traffic, which could have a material adverse effect on our business, results of operations or financial condition. Because of the seasonality of our business, the concentration of a significant proportion of our retail stores and wholesale customers in certain geographic regions, including a resort and/or coastal focus for most of our lifestyle brands, and the concentration of our sourcing and distribution center operations, the occurrence of such events could disproportionately impact our business, financial condition and operating results.

The ongoing war between Russia and Ukraine and the ongoing war between Israel and Hamas have adversely affected the global economy and resulted in economic sanctions, geopolitical instability and market disruption. Although we do not have operations or generate revenues in the impacted regions, the geopolitical tensions related to the wars could result in broader impacts that expand into other markets, cyberattacks, supply chain and logistics disruptions, including shipping disruptions in the Red Sea region, and lower consumer demand, any of which could have a material adverse effect on our business and operations.

Risks Related to our Business Strategy and Operations

Our inability to execute our direct to consumer and portfolio-level strategies in response to shifts in consumer shopping behavior could adversely affect our financial results and operations.

One of our key long-term initiatives over the last several years has been to grow our branded businesses through distribution strategies that allow our consumers to access our brands whenever and wherever they choose to shop. Our ability to anticipate and transform our business in response to the manner in which retail consumers seek to transact business and access products requires us to introduce new retail, restaurant and other concepts in suitable locations; anticipate and implement innovations in sales and marketing technology to align with our consumers’ shopping preferences; invest in appropriate digital and other technologies; establish the infrastructure necessary to support growth; maintain brand specific websites and mobile applications that offer the functionality and security customers expect; and effectively enhance our advertising and marketing activities, including our social media presence, to maintain our current customers and attract and introduce new consumers to our brands and offerings.

Even prior to the emergence of the COVID-19 pandemic, the retail apparel market was evolving very rapidly in ways that are disruptive to traditional fashion retailers. These changes included sustained declines in bricks and mortar retail traffic; entry into the fashion retail space by large e-commerce retailers and others with significant financial resources and enhanced distribution capabilities; increased investment in technology and multi-channel distribution

27

Table of Contents

strategies by large, traditional bricks and mortar and big box retailers; ongoing emphasis on off-price and fast fashion channels of distribution, in particular those who offer brand label products at clearance; and increased appeal for consumers of products that incorporate sustainable materials and processes in the supply chain and/or otherwise reflect their social or personal values. In response, traditional fashion retailers and competing brands have increasingly offered greater transparency for consumers in product pricing and continue to engage in increased promotional activities, both online and in-store. These trends accelerated during the COVID-19 pandemic and are likely to continue to evolve in ways that may not yet be evident. Any inability on our part to effectively adapt to rapidly evolving consumer behavioral trends may result in lost sales, increase our costs and/or adversely impact our results of operations, financial condition, reputation and credibility.

Failure to maintain the reputation or value of our brands could harm our business operations and financial condition.

Our success depends on the reputation and value of our brand names. The value of our brands could be diminished by actions taken by us or by our licensees, wholesale customers or others who have an interest in our brands. Actions that could cause harm to our brands include failing to respond to emerging fashion trends or meet consumer quality expectations; selling products bearing our brands through distribution channels that are inconsistent with customer expectations; becoming overly promotional; or setting up consumer expectations for promotional activity for our products. It is possible that certain actions taken by us in response to the COVID-19 pandemic could impair the reputation or image of our brands despite our focus on protecting the long-term value of our brands. In addition, social media is a critical marketing and customer acquisition and customer retention strategy in today’s technology-driven retail environment, and the value of our brands could be adversely affected if we do not effectively and accurately communicate our brand message through social media vehicles, including with respect to our social responsibility and environmental sustainability initiatives. The significant concentration in our portfolio heightens the risks we face if one of our larger brands is adversely impacted by actions we or third parties take with respect to that brand.

The improper or detrimental actions of a licensee or wholesale customer, including a third party distributor in an international market, or for example, the operator of the Tommy Bahama Miramonte Resort & Spa, which opened in late-2023 and is an unproven concept with previously untested brand and operating standards, could also significantly impact the perception of our brands. While we enter into comprehensive license and similar collaborative agreements with third party licensees covering product design, product quality, brand standards, sourcing, social compliance, distribution, operations, manufacturing and/or marketing requirements and approvals, there can be no guarantee our brands will not be negatively impacted through our association with products or concepts outside of our core apparel products and by the market perception of the third parties with whom we associate. In addition, we cannot always control the marketing and promotion of our products by our wholesale customers, and actions by such parties that adversely affect the appeal of our products could diminish the value or reputation of one or more of our brands and have an adverse effect on our sales, gross margins and business operations.

27

Table of Contents

The appeal of our brands may also depend on the perceived relevance and success of our initiatives related to corporate responsibility and our commitments to operating our business in a socially responsible fashion. Risks related to corporate responsibility include increased stakeholder focus on social and environmental sustainability matters, including forced labor, chemical use, energy and water use, packaging and waste, animal welfare and land use. We may also electbe required to enter into retailincur substantial costs to comply with the amalgamation of differing or wholesale distribution arrangements,conflicting state, federal or joint ventures, with third parties for certain international markets, and such arrangements are subject to a numberlaws or regulations or the rules of government agencies requiring disclosure of risks and uncertainties,initiatives related to corporate responsibility and the collection, certification and disclosure of operational data, and any failure to comply with such requirements could result in fines, penalties or negative public perception of our brands or drive decisions on whether we can continue or expand our business in certain markets. We may also face increased pressure from stakeholders or the public to voluntarily expand our disclosures, make commitments, set targets or establish additional goals and take actions to meet them, which could expose us to market, operational and execution costs or risks. The metrics we disclose may not meet stakeholder expectations and may impact our reputation and the value of our brands, and a failure to achieve progress on our metrics on a timely basis, or at all, could adversely affect our business and financial performance.

Our inability to execute our direct to consumer and portfolio-level strategies in response to shifts in consumer shopping behavior could adversely affect our financial results and operations.

One of our key long-term initiatives over the last several years has been to grow our branded businesses through distribution strategies that allow our consumers to access our brands whenever and wherever they choose to shop. Our ability to anticipate and transform our business in response to the manner in which consumers seek to transact business and access products requires us to introduce new retail, restaurant and other concepts in suitable locations; anticipate and implement innovations in sales and marketing technology to align with our consumers’ shopping preferences; invest in appropriate digital and other technologies; establish the infrastructure necessary to support growth; maintain brand specific websites and mobile applications that offer the functionality and security customers expect; and effectively enhance our advertising and marketing activities, including our reliance on the operational skillsocial media presence, to maintain our current customers and expertise of a local operator, the ability of the operatorattract and introduce new consumers to appropriately represent our brands and offerings.

For the last several years, the retail apparel market has been evolving very rapidly in ways that are disruptive to traditional fashion retailers. These changes included declines in bricks and mortar retail traffic; entry into the fashion retail space by large e-commerce retailers and others with significant financial resources and enhanced distribution capabilities; increased costs to attract and retain consumers; increased investment in technology and multi-channel distribution strategies by large, traditional bricks and mortar and big box retailers; ongoing emphasis on off-price and fast fashion channels of distribution, in particular those marketswho offer brand label products at clearance; and increased appeal for consumers of products that incorporate sustainable materials and processes in the supply chain and/or otherwise reflect their social or personal values. In response, fashion retailers and competing brands have increasingly offered greater transparency for consumers in product pricing and engaged in increased promotional activities, both online and in-store. These trends accelerated in recent years and are likely to continue to evolve in ways that may not yet be evident.

In response to these evolving and rapidly changing trends in consumer shopping behavior, we have made and expect to continue to make significant investments in expanding our digital capabilities and technologies in three key areas: mobile technology; digital marketing; and the digital customer experience. Although we have experienced significant growth in our e-commerce businesses in recent years, there is no assurance that we will realize a return on these investments, be successful in continuing to grow our e-commerce businesses over the long term or that any protective rightsincrease we may see in net sales from our e-commerce business will not cannibalize, or be sufficient to which the third partyoffset any decreases in, net sales from bricks and mortar retail stores. Any inability on our part to effectively adapt to rapidly evolving consumer behavioral trends may be entitled.result in lost sales, increase our costs and/or adversely impact our results of operations, financial condition, reputation and credibility.

We may be unable to grow our business through organic growth, which could have a material adverse effect on our business, financial condition, liquidity and results of operations.

A key component of our business strategy is organic growth in our brands, the importance of which is heightened as we seek to return to full operating performance and gross margins following contractions in our business and the industry as a result of the COVID-19 pandemic.brands. Organic growth may be achieved by, among other things, increasing sales in our direct to consumer channels; selling our products in new markets; increasing our market share in existing markets; expanding the demographic appeal of our brands; expanding our margins through

28

Table of Contents

product cost reductions, price increases or otherwise; expanding the customer reach of our brands through new and enhanced advertising initiatives; and increasing the product offerings and concepts within our various operating groups, such as the opening of additional Marlin Bars at Tommy Bahama and owned retail stores at Southern Tide.groups. Successful growth of our business is also subject to our ability to implement plans for expanding and/or maintaining our existing businesses at satisfactory levels. We may not be successful in achieving suitable organic growth, and our inability to grow our business may have a material adverse effect on our business, financial condition, liquidity and results of operations.

28

Table of Contents

In addition, investments we make in technology, advertising and infrastructure, retail stores and restaurants, office and distribution center facilities, personnel and elsewhere may not yield the full benefits we anticipate, and sales growth may be outpaced by increases in operating costs, putting downward pressure on our operating margins and adversely affecting our results of operations. If we are unable to increase our revenues organically, we may be required to pursue other strategic initiatives, including reductions in costs and/or acquisitions, in order to grow our business. These initiativeswhich may not be available to us on desirable terms, inhibitinginhibit our ability to increase profitability.

Failure to successfully execute our strategic initiative to improve Tommy Bahama’s operating performance may have an adverse impact on our growth and profitability.

Tommy Bahama, which represented 56% of our net sales in Fiscal 2020 and maintains a larger bricks and mortar footprint and fixed cost structure, faced several years of lower operating margins. Entering Fiscal 2020, we were in the process of implementing and executing a multi-year initiative to improve Tommy Bahama’s operating performance and long-term growth prospects, which included an enhanced outlet and clearance strategy, improved gross margin through selective price increases and reduced product costs, selective right-sizing of our store footprint, controlling and reducing overhead and operating expenses, implementing marketing initiatives targeting new customer acquisition and improving the Tommy Bahama customer experience. A strategic initiative of this nature is inherently challenging and faces significant potential risks, with the COVID-19 pandemic magnifying the challenges facing Tommy Bahama and requiring adaptability to today’s more digital retail environment. Any failure in our execution of this strategy, including delays and/or cost overruns, may adversely affect our ability to achieve long-term sustainable sales and operating margin growth and at the same time may detract from our focus and execution of other strategic initiatives.

The acquisition of new businesses is inherently risky, and we cannot be certain that we will realize the anticipated benefits of any acquisition.

Growth of our business through acquisitions of lifestyle brands that fit within our business model is a key component of our long-term business strategy. The competitive climate for desirablestrategy, as evidenced by our acquisition candidates drives higher market multiples, and we may pay more to consummateof Johnny Was in Fiscal 2022.

Integrating an acquisition thanacquired business, regardless of the value we derive fromsize of the acquired business. Acquisitions may cause us to incur debt or make dilutive issuances of our equity securities. Additionally, as a result of acquisitions, we may become responsible for unexpected liabilities that we failed or were unable to discover in the course of performing due diligence.

In addition, the benefits of an acquisition may not materialize to the extent or within the time periods anticipated. Integrating acquired businessesoperations, is a complex, time-consuming and expensive process. The integration process for newly acquired businesses could create a number of challenges and adverse consequences for us associated with the integration of product lines, support functions, employees, sales teams and outsourced manufacturers; employee turnover, including key management and creative personnel of the acquired business and our existing businesses; disruption in product cycles for newly acquired product lines; maintenance of acceptable standards, controls, procedures and policies; operating a business in new geographic territories; diversion of the attention of our management from other areas of our business; and the impairment of relationships with customers of the acquired and existing businesses. Furthermore, certain acquisitionsAs a result of these challenges or other factors, the benefits of an acquisition may also be structured utilizing contingent consideration based onnot materialize to the extent or within the time periods anticipated.

In addition, the competitive climate for desirable acquisition candidates drives higher market multiples, and we may pay more to consummate an acquisition than the value we ultimately derive from the acquired business’ post-acquisition results, and the principals from whom we acquired such a business, many of whombusiness. Acquisitions may continuecause us to operate the business as our employees, may have differing interests than thoseincur debt or make dilutive issuances of our shareholders becauseequity securities, and may result in certain impairment or amortization charges in our statements of such arrangements.operations, as evidenced by the noncash impairment charges for goodwill and intangible assets of $111 million recognized in Johnny Was in the Fourth Quarter of Fiscal 2023, which was driven by the challenging macroeconomic environment and elevated interest rates during Fiscal 2023. Additionally, as a result of acquisitions, we may become responsible for unexpected liabilities that we failed or were unable to discover in the course of performing due diligence, or may incur material, unrecoverable costs to evaluate and pursue an acquisition that is ultimately not consummated.

As the fashion retail environment evolves, our investment criteria for acquisitions has grown to include smaller brands and non-controlling investments in burgeoning brands seeking debt or equity financing. The limited operating history, less experienced management teams and less sophisticated systems, infrastructure and relationships generally associated with such brands may heighten the risks associated with acquisitions generally. Minority investments present additional risks, including the potential disproportionate distraction to our management team relative to the potential financial benefit; the potential for a conflict of interest; the damage to our reputation of associating with a brand which may take actions inconsistent with our values; and the financial risks associated with making an investment in an unproven business model.model, including the potential for impairment charges such as the $2 million noncash impairment charges recognized in Fiscal 2023 from our equity method investment in a smaller lifestyle brand that resulted from that entity, which we do not control, forecasting continued, future losses.

29

Table of Contents

The divestiture or discontinuation of businesses and product lines such as our exit of the Lanier Apparel business, could result in unexpected liabilities and adversely affect our financial condition, cash flows and results of operations.

29

Table of Contents

From time to time, we may also divest or discontinue businesses, product lines and/or programs, including exitingwholesale relationships with certain wholesale customers, including department stores, that do not align with our strategy or provide the returns that we expect or desire. Such dispositions and/or discontinuations may result in underutilization of our retained resources if the exited operations are not replaced with new lines of business, either internally or through acquisition. In addition, we may become responsible for unexpected liabilities, some of which may be triggered or increased by a purchaser’s operation of the disposed business following the transaction. Those liabilities combined with any other liabilities we contractually retain, individually or in the aggregate, could adversely affect our financial condition and results of operations.

In December 2020, we announced that we are exiting the Lanier Apparel business, which is expected to be completed during the Second Half of Fiscal 2021. We took significant charges and established reserves during the Second Half of Fiscal 2020 and have also made estimates as to the future financial impact of an orderly exit. However, if we are unable to effectively, efficiently and timely execute the wind down of our Lanier Apparel business, we may incur additional costs and cash outflows. Given the significant uncertainties about the retail environment during the pendency of the COVID-19 pandemic, there can be no assurance that we will complete the Lanier Apparel exit in a timely fashion in accordance with our current plans. Our announcement and subsequent actions in furtherance of the wind down may subject us to substantial risks and uncertainties that may result in a material adverse effect on our financial condition, cash flows and results of operations, including our ability to retain Lanier Apparel employees through the wind down; the potential for other losses in excess of our current expectations, including those resulting from third party relationships impacted by our decision; and the diversion of senior management’s attention from our ongoing operations while executing the exit from the Lanier Apparel business.

The loss of one or more of our key wholesale customers, or a significant adverse change in a customer’s financial position, could negatively impact our net sales and profitability.

We generate a significant percentage of our wholesale sales, which was 23% of our net sales in Fiscal 2020, from a few key customers, with our three largest customers representing 13%, 10% and 8%, respectively of our consolidated wholesale sales in Fiscal 2020. Over the last several years, department stores and other large retailers have faced increased competition from online competitors, declining sales and profitability and tightened credit markets, resulting in store closures, bankruptcies and financial restructurings. These challenges have been exacerbated by the COVID-19 pandemic and resulting economic downturn. Restructuring of our customers’ operations, continued store closures or increased direct sourcing by customers could negatively impact our net sales and profitability.

We also extend credit to most of our key wholesale customers without requiring collateral, which results in a large amount of receivables from just a few customers. A significant adverse change in a customer’s financial position or ability to satisfy its obligations to us could cause us to limit or discontinue business with that customer, in some cases after we have already made product purchase commitments for inventory; require us to assume greater credit risk relating to that customer’s receivables; or limit our ability to collect amounts related to shipments to that customer. In addition, a decision by one or more of our key wholesale customers to terminate its relationship with us or to reduce its purchases from us or our licensees, whether motivated by competitive considerations, a change in desired product assortment, quality or style issues, financial difficulties, economic conditions or otherwise, could also adversely affect our business.

Our business could be harmed if we fail to maintain proper inventory levels.

Many factors, such as economic conditions, fashion trends, consumer preferences, the financial condition of our wholesale customers and weather, make it difficult to accurately forecast demand for our products. In order to meet the expected demand for our products in a cost-effective manner, we make commitments for production several months prior to our receipt of goods and typicallyalmost entirely without firm commitments from our customers. Depending on the demand for our products, we may be unable to sell the products we have ordered or that we have in our inventory, which may result

30

Table of Contents

in inventory markdowns costs incurred to cancel inventory purchases or the sale of excess inventory at discounted prices and through off-price channels. These events many of which were exacerbated by the COVID-19 pandemic, could significantly harm our operating results and impair the image of our brands. Conversely, if we underestimate the timing or extent of demand for our products or if we are unable to access our products when we need them, for example due to a third party manufacturer’s inability to source materials or produce goods in a timely fashion or as a result of delays in the delivery of products to us, we may experience inventory shortages, which might result in lost sales, unfilled orders, negatively impactimpacted customer relationships, diminishand diminished brand loyalty, and result in lost sales, any of which could harm our business. These risks relating to inventory may also escalate as our direct to consumer sales, for which we do not have any advance purchase commitments, continue to increase as a proportion of our consolidated net sales.

We are subject to risks associated with leasing real estate for our retail stores and restaurants.

We lease all of our retail store and restaurant locations. Successful operation of our retail stores and restaurants depends, in part, on our ability to identify desirable, brand appropriate locations; the overall ability of the location to attract a consumer base sufficient to make sales volume profitable; our ability to negotiate satisfactory lease terms and employ qualified personnel; and our ability to timely construct and complete any build-outbuild out and open the location in accordance with our plans. A decline in the volume of consumer traffic at our retail stores and restaurants, due to economic conditions, shifts in consumer shopping preferences or technology, a decline in the popularity of malls or lifestyle centers in general or at those in which we operate, the closing of anchor stores or other adjacent tenants or otherwise, all of which have been exacerbated by the COVID-19 pandemic, have had and could continue to have a negative impact on our sales, gross marginmargins and results of operations. Our growth may be limited if we are unable to identify new locations with consumer traffic sufficient to support a profitable sales level or the local market reception to a new retail store opening is inconsistent with our expectations.

Our retail store and restaurant leases generally represent long-term financial commitments, with substantial costs at lease inception for a location’s design, leasehold improvements, fixtures and systems installation and recurring fixed costs. On an ongoing basis, we review the financial performance of our retail and restaurant locations in order to determine whether continued operation is appropriate. Even if we determine that it is desirable to exit a particular location, we may be unable to close an underperforming location due to continuous use clauses and/or because negotiating an early termination would be cost prohibitive. In addition, due to the fixed-cost structure associated with these operations, negative cash flows or the closure of a retail store or restaurant could result in impairment of leasehold improvements, impairment of operating lease assets and/or other long-lived assets, severance costs, lease termination costs or the loss of working capital, which could adversely impact our business and financial results. Furthermore, as each of our leases expire and as competition and rental rates for prime retail and restaurant locations continues to accelerate, as we have experienced in recent years, we may be unable to negotiate renewals, either on commercially acceptable terms or at all, including as a result of shifts in how shopping center operators seek to merchandise the particular center’s lineup, which could force us to close retail stores and/or restaurants in desirable locations.

As

Furthermore, a result of temporary retail store and restaurant closures and ongoing depressed consumer traffic due todeterioration in the COVID-19 pandemic, we determined that the payment of rents that might have otherwise been due under our retail store and restaurant leases was inappropriate. Accordingly, with limited exceptions where alternative arrangements with our landlords had been finalized, we discontinued rent payments starting in April 2020. We have negotiated equitable rental arrangements with substantially all of the landlords for our retail and restaurant locations and are confident that we will be able to resolve these matters with the landlords for our remaining locations. However, there can be no assurances, and some of these outstanding landlords may choose to claim that our non-payment constitutes a default under our leases. Successful claims against us, if any, could materially affect our business, operations, financial condition of shopping center operators or developers could, for example, limit their ability to invest in improvements and future growth. Even where successful, litigation could be costly, distract our managementfinance tenant improvements for us and result in reputational harm.other retailers and lead consumers to view these locations as less desirable. In addition, if our e-commerce businesses continue to grow, they may do so in part by attracting existing customers, rather than new customers, who choose to purchase products from us online through our websites rather than from our physical stores, thereby reducing the financial performance of our bricks and mortar operations, which could have a resurgencematerial adverse effect on our results of COVID-19 casesoperations or the spreadfinancial condition.

30

Table of new variants require us to close our stores and restaurants or further restrict our operations, we may not be able to negotiate further equitable arrangements with our landlords in respect of such future closures or restrictions.Contents

We make use of debt to finance our operations, which exposescould expose us to risks that could adversely affect our business, financial position and operating results.

The continued growth of our business depends on our access to sufficient funds.

Our levels of debt vary as a result of the seasonality of our business, investments in our operations, acquisitions we undertake and working capital needs, andneeds. Our debt levels may increase or decrease from time to time under our existing facility or potentially under new facilities, or the terms or forms

31

Table of Contents

of our financing arrangements may change. Our indebtedness under the U.S. Revolving Credit Agreement includes certain obligations and limitations, including the periodic payment of principal, interest and unused line fees, maintenance of certain covenants and certain other limitations. The negative covenants in the U.S. Revolving Credit Agreement limits our ability to, among other things, incur debt, guaranty certain obligations, incur liens, pay dividends, repurchase common stock, make investments, sell assets or make acquisitions. These obligations and limitations may increase our vulnerability to adverse economic and industry conditions, place us at a competitive disadvantage compared to any competitors that may be less leveraged and limit our flexibility in carrying out our business plans and planning for, or reacting to, change.

In addition, we are subject to interest rate risk on the indebtedness under our variable rate U.S. Revolving Credit Agreement, particularly in the current macroeconomic environment. An increase in the interest rate environment would require us to pay a greater amount towards interest on our borrowings.

The continued growth of our business depends on our access to sufficient funds. If the need arises in the future to finance expenditures in excess of those supported by our existing credit facility,U.S. Revolving Credit Agreement, we may need to seek additional funding through debt or equity financing. Our ability to obtain that financing will depend on many factors, including prevailing market conditions, our financial condition and our ability to negotiate favorable terms and conditions. The terms of any such financing or our inability to secure such financing could adversely affect our ability to execute our strategies, and the negative covenants in our debt agreements, now or in the future, may increase our vulnerability to adverse economic and industry conditions and/or limit our flexibility in carrying out our business strategy and plans.

In addition,

The loss of one or more of our key wholesale customers, or a significant adverse change in a customer’s financial position, could negatively impact our net sales and profitability.

We generate a material percentage of our wholesale sales, which was 20% of our net sales in Fiscal 2023, from a few key customers. Although our largest customer only represented less than 4% of our consolidated net sales in Fiscal 2023, the failure to increase or maintain our sales with our key customers as much as we anticipate would have a negative impact on our growth prospects and any decrease or loss of these customers’ business could result in a decrease in our net sales and operating income if we are unable to capture these sales through our direct to consumer operations or other wholesale accounts. Over the last several years, department stores and other large retailers have faced increased competition from online competitors, declining sales and profitability and tightened credit markets, resulting in store closures, bankruptcies and financial restructurings. Restructuring of our customers’ operations, continued store closures or increased direct sourcing by customers could negatively impact our net sales and profitability.

We also extend credit to most of our key wholesale customers without requiring collateral, which results in a large amount of receivables from just a few customers. A significant adverse change in a customer’s financial position or ability to satisfy its obligations to us could cause us to limit or discontinue business with that customer, in some cases after we have interest rate risk on indebtedness under our variable rate U.S. Revolving Credit Agreement. Our exposure to variable rate indebtedness may increase in the future, based on our debt levels and/or the terms of future financing arrangements. Further, an increase in the interest rate environment wouldalready made product purchase commitments for inventory; require us to payassume greater credit risk relating to that customer’s receivables; or limit our ability to collect amounts related to shipments to that customer. In addition, a greater amount towards interest, even if the amount of borrowings outstanding remains the same.

A portiondecision by one or more of our indebtedness under the U.S. Revolving Credit Agreement at any time may use the London Interbank Offered Rate (LIBOR) as the benchmark for establishing the interest rate. Recent regulatory reform efforts may cause LIBORkey wholesale customers to ceaseterminate its relationship with us or to exist, new methods of calculating LIBOR to be establishedreduce its purchases, whether motivated by competitive considerations, a change in desired product assortment, quality or the use of an alternative reference rate(s). As the future of LIBOR at this time is uncertain, the potential effect of any future changes cannot yet be determined butstyle issues, financial difficulties, economic conditions or otherwise, could also adversely impactaffect our interest expense and, thus, our results of operations.business.

Risks Related to Cybersecurity and Information Technology

Cybersecurity attacks and/or breaches of information security or privacy could disrupt our operations, cause us to incur additional expenses, expose us to litigation and/or cause us financial harm.

31

Table of Contents

Cybersecurity attacks continue to become increasingly sophisticated, and experienced computer programmers and hackers may be able to penetrate our network security and misappropriate or compromise our assets including confidential information, or disrupt our systems. We collect, use, store and transmit sensitive and confidential business information and personal information of our customers, employees, suppliers and others as an ongoing part of our business operations, and we are regularly subject to attempts by attackers to gain unauthorized access to our networks, systems and data, or to obtain, change or destroy confidential information. In addition, customers may use devices or software that are beyond our control environment to purchase our products, which may provide additional avenues for attackers to gain access to confidential information.information, and our embracing and implementation of remote work arrangements for a substantial portion of our employees may increase our vulnerability to cybersecurity attacks. Additionally, the security systems of businesses that we acquire could pose additional risks to us, such as those related to the collection, use, maintenance and disclosure of data, or present other cybersecurity vulnerabilities.

Despite our implementation of security measures, if an actual or perceived data security breach occurs, whether as a result of cybersecurity attacks, computer viruses, vandalism, ransomware, human error or otherwise, or if there are perceived vulnerabilities in our systems, the image of our brands and our reputation and credibility could be damaged, and, in some cases, our continued operations may be impaired or restricted. Ongoing and increasing costs to enhance cybersecurity protection and prevent, eliminate or mitigate vulnerabilities and comply with required security or other measures under state, federal and international laws, which may include deploying additional personnel and protection technologies, training employees and engaging third party experts and consultants, are significant. Although we have business continuity plans and other safeguards in place, our operations may be adversely affected by an actual or perceived data security breach. Costs to resolve any litigation or to investigate and remediate any actual or perceived breach could result in significant financial losses and expenses, as well as lost sales. While we continue to evolve and modify our business continuity plans, there can be no assurance in an escalating threat environment that they will be effective in avoiding disruption and business impacts.

In addition, the regulatory environment governing our use of individually identifiable data is complex, and compliance with new and modified state, federal and international privacy and security laws may require us to modify our operations and/or incur costs to make necessary systems changes and implement new administrative processes, which may include deploying additional personnel and protection technologies, training employees and engaging third party experts and consultants. In addition, because we process and transmit payment card information, we are subject to the payment card industry data security standard and card brand operating rules, which provide for a comprehensive set of rules relating to the retention and/or transmission of payment card information. If we do not comply with the applicable standards, we may be subject to fines or restrictions on our ability to accept payment cards, which could have a material adverse effect on our operations.

As part of our routine operations, we also contract with third party service providers to store, process and transmit personal information of our customers and employees. Although we may contractually require that these providers implement reasonable security measures, we cannot control third parties and cannot guarantee that a security breach will not occur at their location or within their systems. Privacy breaches of confidential information stored or used by our third party service providers or disruptions in their systems may expose us to the same risks as a breach of our own systems, including negative publicity, potential out-of-pocket costs and adverse effects on our business and customer relationships.

32

Table of Contents

Our operations are reliant on information technology, and any interruption or other failure could have an adverse effect on our business or results of operations.

The efficient operation of our business depends on information technology. This requires us to devote significant financial and employee resources to information technology initiatives and operations. Information systems are used in all stages of our operations and as a method of communication, both internally and with our customers, service providers and suppliers. Many of our information technology solutions are operated and/or maintained by third parties, including our use of cloud-based solutions. Additionally, each of our operating groups uses e-commerce websites, point-of-sale systems, enterprise order management systems, warehouse management systems and wholesale ordering systems to acquire, manage, sell and distribute goods. Our management also relies on information systems to provide relevant and accurate information in order to allocate resources, manage operations and forecast, account for and report our operating results. Service interruptions may occur as a result of a number of factors, including power outages, consumer traffic levels, computer viruses, sabotage, hacking or other unlawful activities by third parties, human error, disasters or failures to properly install, upgrade, integrate, protect, repair or maintain our various systems, networks and e-commerce websites.

32

Table of Contents

All of these events could have a material adverse effect on our financial condition and results of operations. In light of the current geopolitical environment, there are heightened risks that our information technology systems, as well as those of third parties on whom we rely in order to conduct our operations, could be compromised by threat actors.

Reliance on outdated technology or failure to upgrade our information technology systems and capabilities could impair the efficient operation of our business and our ability to compete.

Any failure to timely upgrade our technology systems and capabilities may impair our ability to market, sell and deliver products to our customers, efficiently conduct our operations, facilitate customer engagement in today’s digital marketplace and/or meet the needs of our management. We regularly evaluate upgrades or enhancements to our information systems to more efficiently and competitively operate our businesses, including periodic upgrades to digital commerce and marketing, warehouse management, guest relations, omnichannel and/or enterprise order management systems in our businesses. Digital commerce and marketing hashave continued to increase in importance to our business, and if we failhave invested and will continue to develop and maintaininvest significant capital in the digital strategies, systems, expertise and capabilities necessary for us to compete effectively in this arena, our results of operations could be adversely impacted.arena. Upgrades to our systems may be expensive undertakings, may not be successful and/or could be abandoned, as we did in the Fourth Quarter of Fiscal 2020 with a Tommy Bahama information technology project.abandoned. We may also experience difficulties during the implementation, upgrade or subsequent operation of our systems, including the risk of introducing cybersecurity vulnerabilities into our systems or the loss of certain functionality, information from our legacy systems and/or efficient interfaces with third party and continuing systems. Temporary processes or solutions, including manual operations, which may be required to be instituted in the short term could also significantly increase the risk of loss or corruption of data and information.

Remote work arrangements Additionally, if such upgraded information technology systems fail to operate or are unable to support our growth, our store operations and websites could inhibit our ability to effectively operate our business and result in enhanced cybersecurity risks.

In March 2020, we temporarily closed our corporate offices and implemented remote work arrangements for our corporate and office employees as a result of the COVID-19 pandemic. The majority of our corporate and office employees continue to perform some or all of their duties on a remote basis,be severely disrupted, and we anticipate continuing to implement remote work arrangements for a substantial portion of our employees in the future. If remote work arrangements negatively impact the performance or management of our employees, whether as a result of technological challenges, unsuitable work environments or other limitations, our ability to carry out key functions and successfully manage our operations could be compromised. In addition, remote work arrangements could exacerbate our existing cybersecurity and privacy risks, including by introducing vulnerabilities in our systems duerequired to the use of laptops, mobile devices and remote work environments. Cybersecurity attacks or data security incidents resulting from a failuremake significant additional expenditures to manage these risks could negatively impact our business and results of operations.remedy any such failure.

Risks Related to our Sourcing and Distribution Strategies

33

Table of Contents

Our reliance on third party producers in foreign countries to meet our production demands exposes us to risks that could disrupt our supply chain, increase our costs and negatively impact our operations.

We source substantially all of our products from non-exclusive, third party producers located in foreign countries. Although we place a high value on long-term relationships with our suppliers, generally we do not have long-term supply contracts but instead conduct business on an order-by-order basis. Therefore, we compete with other companies for the production capacity of independent manufacturers. We also depend on the ability of these third party producers to secure a sufficient supply of raw materials, adequately finance the production of goods ordered and maintain sufficient manufacturing and shipping capacity, and in some cases, the products we purchase and the raw materials that are used in our products are available only from one source or a limited number of sources. Although we monitor production in third party manufacturing locations, we cannot be certain that we will not experience operational difficulties with our manufacturers, such as the reduction of available production capacity, errors in complying with product specifications, insufficient quality control, failures to meet production deadlines or increases in manufacturing costs. In addition, we may experience disruptions in our supply chain as we continue to diversify the jurisdictions from which we source products. Any such difficulties may impact our ability to deliver quality products to our customers on a timely basis, increase our costs, negatively impact our customer relationships and result in lower net sales and profits.

Our operations are dependent on the global supply chain, and the impact of supply chain constraints may adversely impact our business and operating results.

Our operations in recent years have been, and may continue to be, impacted by supply chain constraints, labor shortages and raw material shortages, resulting in increased costs for raw materials, longer lead times, port congestion and increased freight costs. As a result of these factors within the global supply chain, our gross margins may be adversely impacted. We also rely on logistics providers to transport our products to our distribution centers. Delays in shipping may cause us to have to use more expensive air freight or other more costly methods to ship our products. Failure to adequately produce and timely ship our products to customers could lead to increased costs and lost sales, negatively impact our relationships with customers, and adversely impact our brand reputation.

33

Table of Contents

Any disruption or failure in our primary distribution facilities may materially adversely affect our business or operations.

We rely on our primary distribution facilities in order to support our direct to consumer and wholesale operations, meet customer fulfillment expectations, manage inventory, complete sales and achieve operating efficiencies. We may have a greater risk than our peers due to the concentration of our distribution facilities, as substantially all of our products for each operating group are distributed through one or two principal distribution centers. The primary distribution facilities that we operate are as follows: a distribution center in Auburn, Washington dedicated to our Tommy Bahama products; a distribution center in King of Prussia, Pennsylvania dedicated to our Lilly Pulitzer products; a distribution center in Toccoa, Georgia dedicated to our Lanier Apparel products; and a distribution center in Lyons, Georgia primarily dedicated to our Lilly Pulitzer and Southern Tide products. Although we continue to enhance our enterprise order management capabilities to deliver products from other physical locations, our ability to effectively support our direct to consumer and wholesale operations, meet customer expectations, manage inventory and achieve objectives for operating efficiencies depends on the proper operation of these distribution facilities, each of which manages the receipt, storage, sorting, packing and distribution of finished goods. In addition, initiatives to build new distribution centers or enhance existing distribution centers, such as our multi-year project to build a new distribution center in the Southeastern United States that will provide significant or exclusive support for all of our brands, or to transition operations among distribution facilities or third party service providers, may be subject to delays, cost overruns, supply chain disruptions or inability to obtain labor or materials which could result in substantial expense to us, disrupt our operations and divert the attention of our management. In addition, we may face challenges integrating the distribution center with the systems supporting our brands and transitioning operations to the distribution center around peak selling seasons, and there can be no assurance that any such investments will achieve anticipated efficiencies.  

If any of our primary distribution facilities were to shut down or otherwise become inoperable or inaccessible for any reason, including as a result of natural or man-made disasters, pandemics or epidemics, (including, for example, the ongoing COVID-19 pandemic), human error, or cybersecurity attacks or computer viruses, or if we are unable to receive or ship the goods in a distribution center, as a result of a technology failure, labor shortages or otherwise, we could experience a substantial loss of inventory, a reduction in sales, higher costs, insufficient inventory at our retail stores to meet consumer expectations and longer lead times associated with the distribution of our products. In addition, for the distribution facilities that we operate, there are substantial fixed costs associated with these large, highly automated distribution centers, and we could experience reduced operating and cost efficiencies during periods of economic weakness. Any disruption to our distribution facilities or in their efficient operation could negatively affect our operating results and our customer relationships.

Fluctuations and volatility in the cost and availability of raw materials, labor and freight may materially increase our costs.

We and our third party suppliers rely on the availability of raw materials at reasonable prices. The principal fabrics used in our business are cotton, linens, wools, silk, linen, polyester, cellulosic fibers, leather, and other natural and man-made fibers, synthetics andor blends of two or more of these materials. The prices paid for these fabrics depend on the market price for raw materials used to produce them. The cost of the materials and components that are used in our manufacturing process, such as oil-related commodity prices and other raw materials, such as dyes and chemicals, and other costs, can fluctuate. We historically have not entered into any futures contracts to hedge commodity prices, and inprices. In recent years, we have seen significant variability in theexperienced increased costs of certain raw materials, including cotton, and oil.that impacted our production costs. These pricing fluctuationsprice increases could continue in future years.

34

TableEmployment costs represented more than 40% of Contents

Weour consolidated SG&A in Fiscal 2023, and we have also seen increases in the cost of labor in our retail, restaurant and distribution center operations as well as at many of our suppliers in recent years. Employment costs are affected by labor markets, as well as various federal, state and foreign laws governing matters such as minimum wage rates, overtime compensation and other requirements. In addition, in recent years, there has been significant political pressure and legislative action to increase the minimum wage rate in many of the jurisdictions in which we operate, and the new U.S. presidential administration may advocate for similar wage rate increases on a federal level.operate. We have also experienced increases in freight costs and distribution and logistics functions as a result of the COVID-19 pandemic and other factors and may continue to see such cost pressures, including as a result of the recent blockage of freight through the Suez Canal.and capacity pressures. Although we attempt to mitigate the effect of increases in our cost of goods sold, labor costs, occupancy costs, other operational costs and SG&A items through sourcing initiatives and by selectively increasing the prices of our products, we may be unable to fully pass on these costs to our customers, and material increases in our costs may reduce the profitability of our operations and/or adversely impact our results of operations.

Labor-related matters, including labor disputes, may adversely affect our operations.

34

Table of Contents

We may be adversely affected as a result of labor disputes in our own operations or in those of third parties with whom we work. Our business depends on our ability to source and distribute products in a timely manner, and our new retail store and restaurant growth is dependent on timely construction of our locations. While we are not subject to any organized labor agreements and have historically enjoyed good employee relations, there can be no assurance that we will not experience work stoppages or other labor problems in the future with our non-unionized employees. In addition, potential labor disputes at independent factories where our goods are produced, shipping ports or transportation carriers create risks for our business, particularly if a dispute results in work slowdowns, lockouts, strikes or other disruptions during our peak manufacturing, shipping and selling seasons. Further, we plan our inventory purchases and forecasts based on the anticipated timing of retail store and restaurant openings, which could be delayed as a result of a number of factors, including labor disputes among contractors engaged to construct our locations or within government licensing or permitting offices.offices or the unavailability of qualified contractors due to labor shortages. Any potential labor dispute, either in our own operations or in those of third parties on whom we rely, could materially affect our costs, decrease our sales, harm our reputation or otherwise negatively affect our operations.

Our geographic concentration exposes us to certain regional risks.

Our operations and retail and restaurant locations are heavily concentrated in the United States and certain geographic areas within the United States, including Florida, California, Texas and Hawaii for our Tommy Bahama operations; Florida for our Lilly Pulitzer operations; California for our Johnny Was operations; and Florida for our Emerging Brands operations. Additionally, the wholesale sales for our businesses are also geographically concentrated, including in geographic areas where we have concentrations of our own retail store and restaurant locations. Due to these concentrations, as well as our brands’ association with the resort lifestyle and destinations, we have heightened exposure to factors that impact these regions, including general economic conditions, weather patterns, climate-related conditions, natural disasters, public health crises, changing demographics and other factors.

Our international operations, including foreign sourcing, result in an exposure to fluctuations in foreign currency exchange rates.

We are exposed to certain currency exchange risks in conducting business outside of the United States. The substantial majoritySubstantially all of our product purchases are from foreign vendors and are denominated in U.S. dollars. If the value of the U.S. dollar decreases relative to certain foreign currencies in the future, then the prices that we negotiate for products could increase and we may be unable to pass this increase on to customers, which would negatively impact our margins. However, if the value of the U.S. dollar increases between the time a price is set and payment for a product, the price we pay may be higher than that paid for comparable goods by competitors that pay for goods in local currencies, and these competitors may be able to sell their products at more competitive prices. An increase in the value of the U.S. dollar compared to other currencies in which we have sales could also result in lower levels of sales and earnings reported in our consolidated statements of operations and lower gross margins. Additionally, currency fluctuations could also disrupt the business of our independent manufacturers by making their purchases of raw materials more expensive and difficult to finance.

Our geographic concentration of retail stores, restaurants and wholesale customers exposes us to certain regional risks.

Our operations and retail and restaurant locations are heavily concentrated in the United States and certain geographic areas within the United States, including Florida, California, Texas and Hawaii for our Tommy Bahama operations and Florida, Massachusetts and Virginia for our Lilly Pulitzer operations. Additionally, the wholesale sales for each of Tommy Bahama, Lilly Pulitzer and Southern Tide are also geographically concentrated, including in geographic areas where we have concentrations of our own retail store locations. Due to these concentrations, as well as our brands’ association with the resort lifestyle and destinations, we have heightened exposure to factors that impact these regions, including general economic conditions, weather patterns, natural disasters, public health crises, changing demographics and other factors.

35

Table of Contents

Risks Related to Regulatory, Tax and Financial Reporting Matters

Our business is subject to various federal, foreign, state and local laws and regulations, and the costs of compliance with, or the violation of, such laws and regulations could have an adverse effect on our costs or operations.

We are subject to an increasing number of evolving and stringent standards, laws and other regulations, including those relating to health, product performance and safety, labor, employment, privacy and data security, anti-bribery, consumer protection, marketing, health, product performance, content and safety, anti-bribery, taxation, customs, logistics and other operational matters. These laws and regulations, in the United States and abroad, are complex and often vary widely by jurisdiction, making it difficult for us to ensure that we are currently or will in the future be compliant with all applicable laws and regulations in all the states and countries in which we operate. In addition to the local laws of the foreign countries in which we operate, we are subject to certain anti-corruption laws, including the U.S. Foreign Corrupt Practices Act. If any of our international operations, or

35

Table of Contents

our employees or agents, violates such laws, we could become subject to sanctions or other penalties that could negatively affect our reputation, business and operating results.

We have seen many new laws and regulations going into effect or being proposed in recent years, including in areas such as consumer and data privacy, matters related to corporate responsibility marketing and trade. We may be required to make significant expenditures and devote significant time and management resources to comply with any existing or future laws or regulations, and a violation of applicable laws and regulations by us, or any of our suppliers or licensees, may restrict our ability to import products, require a recall of our products, lead to fines or otherwise increase our costs, negatively impact our ability to attract and retain employees or materially limit our ability to operate our business. In addition, regardless of whether any allegations of violations of the laws and regulations governing our business are valid or whether we ultimately become liable, we may be materially affected by negative publicity as a result of such allegations.

In particular, the regulatory environment governing our use of individually identifiable data is complex, and compliance with new and modified state, federal and international privacy and security laws, such as the General Data Protection Regulation in the E.U. and the California Consumer Privacy Act and similar laws being contemplated in other states, may require us to modify our operations and/or incur costs to make necessary systems changes and implement new administrative processes. In addition, because we process and transmit payment card information, we are subject to the payment card industry data security standard and card brand operating rules, which provide for a comprehensive set of rules relating to the retention and/or transmission of payment card information. If we do not comply with the applicable standards, we may be subject to fines or restrictions on our ability to accept payment cards, which could have a material adverse effect on our operations.

Changes in international trade regulation could increase our costs andand/or disrupt our supply chain.

Due to our international sourcing activities, we are exposed to risks associated with changes in the laws and regulations governing the importing and exporting of apparel products into and from the countries in which we operate. These risks include imposition of additional or new antidumping, countervailing or other duties, tariffs, taxes or quota restrictions; government-imposed restrictions as a result of public health issues, such as the ongoing COVID-19 outbreak;issues; changes in customs procedures for importing apparel products; restrictions on the transfer of funds to or from foreign countries; and the issuance of sanctions and trade orders. Any of these factors may disrupt our supply chain, and we may be unable to offset any associated cost increases by shifting production to suitable manufacturers in other jurisdictions in a timely manner or at acceptable prices, and future regulatory actions or changes in international trade regulation may provide our competitors with a material advantage over us or render our products less desirable in the marketplace.

There has been heightened trade tension between the United States and China, from which we sourced 41% of our products in Fiscal 2023 and from which Johnny Was has sourced more than 90% of its products in recent years, with multiple rounds of increased U.S. tariffs on China-imported goods implemented in 2018 and 2019. It is unclear what, if any, additional actions might be considered or implemented, particularly in the current geopolitical environment. Significant tariffs or other restrictions placed on Chinese imports and any related countermeasures that are taken by China could have an adverse effect on our financial condition or results of operations.

Any violation or perceived violation of our codesSupplier Code of conductConduct or environmental and social compliance programs, including by our manufacturers or vendors, could have a material adverse effect on our brands.

We have a robust legal, social and socialenvironmental compliance program, including codesa Supplier Code of conductConduct and vendor compliance standards. The reputation of our brands could be harmed if we or our third party manufacturersthird-party producers and vendors, substantially all of which are located outside the United States, fail to meet appropriate human rights, environmental, product safety and product quality and social compliance standards. Despite our efforts, we cannot ensure that our manufacturersproducers and vendors will at all times conduct their operations in accordance with ethical practices or that the products we purchase will always meet our

36

Table of Contents

safety and quality control standards, and any failure to do so could disrupt our supply chain and adversely affect our business operations.

In particular, the U.S. Government has issued withhold release orders in response to concerns regarding forced labor in the Xinjiang Uyghur Autonomous Region of China. While we have diversified the jurisdictions from which we source products, our manufacturing operations remain concentrated in China, and cotton is among the principal raw materials used in many of our goods.

The presence or perception of forced labor in our supply chain in spite of our efforts to ensure that our third party manufacturersthird-party producers and vendors meet human rights and labor standards could result in adverse impacts on our business, including the detention of goods at U.S. pointsports of entry, challenges in identifying replacement vendors and harm to our reputation. While we have diversified the jurisdictions from which we source products and product inputs, our manufacturing operations remain concentrated in Asia, cotton is among the principal raw materials used in many of our goods and even the cotton used in our products manufactured outside of China largely originates from Chinese fabric mills. Starting in Fiscal 2020, the U.S. Government issued withhold release orders in response to concerns regarding forced labor in the Xinjiang Uyghur Autonomous Region (the “XUAR”) of China. The XUAR is a globally significant source of cotton production, much of which is controlled by the Xinjiang Production and Construction Corporation (“XPCC”) and its affiliates. The Uyghur Forced Labor Prevention Act (“UFLPA”), which was enacted in 2021, created a rebuttable presumption that goods produced in whole or in part in the XUAR or connected with certain listed companies, including

36

Table of Contents

the XPCC and its affiliates, were produced using forced labor and are, therefore, barred from entry into the United States. Requirements for enhanced supply chain traceability, monitoring and risk screening, including pursuant to the UFLPA, have increased our compliance costs. Furthermore, while we do not knowingly source any products or product inputs from the XUAR, we have no known involvement with the XPCC, its affiliates or other entity list companies and we prohibit our suppliers from using forced labor, our supply chain is complex, and we may not have the ability to completely map and monitor it. We could be subject to penalties, fines or sanctions if any of the producers from which we purchase goods is found or suspected to have dealings, directly or indirectly, with the XUAR or entity list companies, and any actions taken by customs officials to block the import of products suspected of being manufactured with forced labor, whether or not founded, could adversely impact our operations and financial results.

Furthermore, consumers are increasingly attuned to the environmental and social impact of the products they purchase and companies with which they do business. A failure to effectively communicateconvey our core principles withto our customers and investors or to accurately communicate our social responsibility and environmental sustainability initiatives and respond to concerns raised with respect to our social responsibility and sustainability initiatives,about them, including through our websites and social media channels, could result in a negative public perception of our brands and products and negatively impact our business.

As a globalmulti-national apparel company, we may experience fluctuations in our tax liabilities and effective tax rate.

As a globalmulti-national apparel company, we are subject to income taxes in the United States and various foreign jurisdictions. We record our income tax liability based on an analysis and interpretation of local tax laws and regulations, which requires a significant amount of judgment and estimation. In addition, we may from time to time modify our operations in an effort to minimize our globalconsolidated income tax expense. Our effective income tax rate in any particular period or in future periods may be affected by a number of factors, including a shift in the mix of revenues, income and/or losses among domestic and international sources during a year or over a period of years; changes in tax laws, and regulations and/or international tax treaties; the outcome of income tax audits in various jurisdictions;audits; the difference between the income tax deduction and the previously recognized income tax benefit related to the vesting of equity-based compensation awards; and the resolution of uncertain tax positions, any of which could adversely affect our effective income tax rate and profitability.

Further, changes to U.S. and foreign tax laws and compliance with new tax laws could have a material adverse effect on our tax expense, cash flows and operations. The CARES Act, signed into law in March 2020, favorably impacted our U.S. tax rate for Fiscal 2020 by allowing the carryback of net operating losses to periods prior to U.S. Tax Reform and accelerating depreciation of certain leasehold improvement costs. The issuance of new regulatory guidance on the CARES Act or other changes in interpretations and assumptions regarding the CARES Act and its impact on U.S. tax laws could cause our actual U.S. tax rate to differ significantly from historical rates and estimates. In addition, the Organization for Economic Cooperation and Development has published action plans that, if adopted by countries where we do business, could materially impact our tax obligations in those countries.

Impairment charges for goodwill or long-livedintangible assets could have a material adverse impact on our financial results.

The carrying values of our goodwill and long-livedintangible assets, including those recorded in connection with our acquisition of a business, or our bricks and mortar operations, are subject to periodic impairment testing. Impairment testing of goodwill and long-livedintangible assets requires us to make estimates about future performance and cash flows that are inherently uncertain and can be affected by numerous factors, including changes in economic conditions, income tax rates, our results of operations and competitive conditions in the industry. For example, inIn Fiscal 2020,2023, we recognized $60$111 million of non-cashnoncash impairment charges for goodwill and intangible assets which reflected the impact of COVID-19 onin connection with the operations plansof Johnny Was, which was driven by the prevailing macroeconomic environment’s impact on near-term expectations for our business operations and strategy of the Southern Tide business.higher interest rates. Future impairment charges may have a material adverse effect on our consolidated financial statements or results of operations.

37

Table of Contents

Any failure to maintain liquor licenses or comply with applicable regulations could adversely affect the profitability of our restaurant operations.

The restaurant industry requires compliance with a variety of federal, state and local regulations. In particular, all of our Tommy Bahama restaurants and Marlin Bars serve alcohol and, therefore, maintain liquor licenses. Our ability to maintain our liquor licenses and other permits depends on our compliance with applicable laws and regulations. The loss of a liquor license or other critical permits would adversely affect the profitability of that restaurant. Additionally, as a participant in the restaurant industry, we face risks related to food quality, food-borne illness, injury, health inspection scores and labor relations. The negative impact of adverse publicity relating to allegations of actual or perceived violations at one of our restaurants may extend beyond the restaurant involved to affect some or all of our other restaurants, as well as the image of the Tommy Bahama brand as a whole.

General Risks

37

Table of Contents

Our business depends on our senior management and other key personnel, and failure to successfully attract, retain and implement succession of our senior management and key personnel or to attract, develop and retain personnel to fulfill other critical functions may have an adverse effect on our operations and ability to execute our strategies.

Our senior management has substantial experience in the apparel and related industries, with our Chairman and Chief Executive Officer Mr. Thomas C. Chubb III having worked with our company for more than 30 years, including in various executive management capacities. Our success depends on disciplined execution at all levels of our organization, including our senior management, and continued succession planning. Competition for qualified personnel is intense, and we compete to attract and retain these individuals with other companies that may have greater financial resources than us. While we believe that we have depth within our management team, the unexpected loss of any of our senior management, or the unsuccessful integration of new leadership, could harm our business and financial performance. In addition, we may be unable to retain or recruit qualified personnel in key areas such as product design, sales, marketing (including individuals with key insights into digital and social media marketing strategies), distribution, technology, sourcing and other support functions, which could result in missed sales opportunities and harm to key business relationships.

In recent years, we have experienced staffing shortages, higher turnover rates and challenges in recruiting and retaining qualified employees at all levels of our organization, which may continue in the future. Our inability or failure to recruit and retain skilled personnel, or the still undeterminable longer term impact of our embracing remote and hybrid work arrangements on professional development and progression, retention and company culture, could adversely impact our business, financial performance, reputation, ability to keep up with the needs of our customers and overall customer satisfaction.

We may be unable to protect our trademarks and other intellectual property.

We believe that our trademarks and other intellectual property rights have significant value and are important to our continued success and our competitive position due to their recognition by consumers and retailers. Substantially all of our consolidated net sales are attributable to branded products for which we own the trademark. Therefore, our success depends to a significant degree on our ability to protect and preserve our intellectual property. We rely on laws in the United States and other countries to protect our proprietary rights. However, we may not be able to sufficiently prevent third parties from using our intellectual property without our authorization, particularly in those countries where the laws do not protect our proprietary rights as fully as in the United States. We have also experienced challenges with enforcing our intellectual property rights on third party e-commerce websites, especially those based in foreign jurisdictions. The use of our intellectual property or similar intellectual property by others could reduce or eliminate any competitive advantage we have developed, causing us to lose sales or otherwise harm the reputation of our brands.

We devote significant resources to the registration and protection of our trademarks and to anti-counterfeiting efforts. Despite these efforts, we regularly discover products that infringe our proprietary rights or that otherwise seek to mimic or leverage our intellectual property. Counterfeiting and other infringing activities typically increase as brand recognition increases, and association of our brands with inferior counterfeit reproductions or third partythird-party labels could adversely affect the integrity and reputation of our brands.

Additionally, there can be no assurance that the actions that we have taken will be adequate to prevent others from seeking to block sales of our products as violations of proprietary rights. As we extend our brands into new product categories and new product lines and expand the geographic scope of the manufacture,sourcing, distribution and marketing of our brands’ products, we could become subject to litigation or challenge based on allegations of the infringement of intellectual property rights of third parties, including by various third parties who have acquired or claim ownership rights in some of our trademarks internationally. In the event a claim of infringement against us is successful or would

38

Table of Contents

otherwise affect our operations, we may be required to pay damages, royalties, license fees or other costs to continue to use intellectual property rights that we had been using, or we may be unable to obtain necessary licenses from third parties at a reasonable cost or within a reasonable time. Litigation and other legal action of this type, regardless of whether it is successful, could result in substantial costs to us and diversion of the attention of our management and other resources.

We are subject to periodic litigation, which may cause us to incur substantial expenses or unexpected liabilities.

38

Table of Contents

From time to time, we are involved in litigation matters, which may relate to consumer protection, employment practices, leasing arrangements,consumer protection, intellectual property infringement, product liability and contract disputes, and which may include a class action, and we are subject to various claims and pending or threatened lawsuits in the ordinary course of our business operations. Often, these cases raise complex factual and legal issues and, due to the inherent uncertainties of litigation, we cannot accurately predict the ultimate outcome of any such proceedings. Regardless of the outcome or whether the claims have merit, legal proceedings may be expensive and require significant management time.

Our common stock price may be highly volatile, and we may be unable to meet investor and analyst expectations.

Our common stock, which is currently listed on the New York Stock Exchange, may be subject to extreme and unpredictable fluctuations in price. The market price of our common stock may decline, or litigation may ensue, if the results of our operations or projected results do not meet the expectations of securities analysts or our shareholders, investors are unreceptive to an announcement of changes in our business or our strategic initiatives or securities analysts who follow our company change their ratings or estimates of our future performance. Our stock price may also change suddenly as a result of other factors beyond our control, including general economic conditions, new or modified legislation impacting our industry, announcements by our competitors, or sales of our stock by existing shareholders.

The stock market has also experienced periods of general volatility which result in fluctuations in stock prices unrelated or disproportionate to operating performance. We cannot provide assurances that there will continue to be an active trading market for our stock, and the price of our common stock may also be affected by illiquidity or perceived illiquidity of our shares. In addition, although we have paid dividends in each quarter since we became a public company in July 1960, we may discontinue or reduce dividend payments based upon several factors, including the terms of our credit facility and applicable law, the need for funding for our strategic initiatives or other capital expenditures and our future cash needs. Any modification or suspension of dividends could cause our stock price to decline. We also may be subject, from time to time, to legal and business challenges or disruptions in the operation of our company due to actions instituted by activist shareholders or others.

Other factors may have an adverse effect on our business, results of operations and financial condition.

Other risks, many of which are beyond our ability to control or predict, could negatively impact our business and financial performance, including changes in social, political, labor, health and economic conditions; changes in the operations or liquidity of any of the parties with which we conduct our business, or in the access to capital markets for any such parties; increasing costs of customer acquisition, activation and retention; consolidation in the retail industryindustry; and other factors. Any of these risks, and others of which we are not aware or that we currently consider to be immaterial, could, individually or in the aggregate, have a material adverse effect on our business, financial condition and results of operations.

Item 1B.   Unresolved Staff Comments

None.

39

Table of Contents

Item 1C.   Cybersecurity

We maintain a comprehensive process for identifying, assessing, and managing material risks from cybersecurity threats. We obtain input, as appropriate, for our cybersecurity risk management program from threat intelligence services, cybersecurity consultants, and multiple external sources. Our cybersecurity program is managed by our Head of Cyber Security, whose team is responsible for leading enterprise-wide cybersecurity strategy, risk assessment, and management policies, standards, architecture, and processes. The Head of Cyber Security has a master’s degree in cybersecurity, maintains industry certifications, and has over 20 years of prior work experience in various roles involving information technology, cybersecurity, and compliance. We augment our cybersecurity team with consultants, contract resources, and managed security service providers when needed. Our executive leadership team, along with input the Head of Cyber Security, are responsible for our overall enterprise risk management system and processes and regularly consider cybersecurity risks in the context of other material risks to the company.

Our Board has delegated to its Audit Committee oversight responsibility for cyber risks and incidents relating to cybersecurity threats, including compliance with disclosure requirements. The Head of Cyber Security provides quarterly reports to our Audit Committee regarding cyber risk trends, technology security risks, projects to continually enhance our information security systems, cybersecurity strategy, and the emerging threat landscape. The Audit Committee reports any findings and recommendations, as appropriate, to the full Board for consideration. Our cybersecurity program is periodically evaluated by internal and external resources to evaluate and enhance the effectiveness of our information security policies, controls, and procedures. The results of those reviews are reported to senior management and the Audit Committee. As part of our cyber risk management program, we track and log security incidents across our enterprise and perform third-party risk assessments to identify and attempt to mitigate risks from third parties such as vendors and suppliers.

Despite our efforts, we cannot eliminate all risks from cybersecurity threats or incidents or provide assurances that we have not experienced an undetected cybersecurity incident. In addition, while we have implemented a risk management process to mitigate cybersecurity risks that arise from utilizing third party service providers, suppliers, and vendors, our control over and ability to monitor the security posture of third parties with whom we do business remains limited and there can be no assurance that we can prevent, mitigate, or remediate the risk of any compromise or failure in the security infrastructure owned or controlled by such third parties.

For more information on our cybersecurity related risks, see Part I, Item 1A. Risk Factors of this Report.

Item 2.   Properties

We lease and own space for our direct to consumer locations, distribution centers, and sales/administration offices in various domestic and international locations. We believe that our existing properties are well maintained, are

39

Table of Contents

in good operating condition and will be adequate for our present level of operations. We also own certain properties that were previously used in our manufacturing and distribution operations.

In the ordinary course of business, we enter into lease agreements for our direct to consumer operations, including leases for full-price retail restaurantstore, food and Marlin Barbeverage and outlet store space. The leases have varying terms and expirations and may have provisions to extend, renew or terminate the lease agreement, among other terms and conditions. At times, we may determine that it is appropriate to close certain direct to consumer or other locations that no longer meet our investment criteria, by either not renewing the lease, exercising an early termination option, negotiating an early termination or otherwise. For existing leases in desirable locations,Despite prevailing market conditions becoming increasingly competitive and commanding significantly higher rents for the most desired properties, we anticipate that we will be able to extend our leases for existing leases in desirable locations, to the extent that they expire in the near future, on terms that are satisfactory to us, or if necessary, locate substitute properties on acceptable terms. The terms and conditions of lease renewals or relocations may not be as favorable as existing leases. Greater detail about the direct to consumer space used by each operating group is included in Part I, Item 1, Business included in this report.

40

Table of Contents

Details of the principal administrative, sales distribution and manufacturingdistribution facilities used in our operations, including approximate square footage, are as follows:


Square


Lease


Square


Lease

Location

Primary Use

Operating Group

Footage

Expiration

Primary Use

Operating Group

Footage

Expiration

Seattle, Washington


Sales/administration


Tommy Bahama


115,000


2026 


Sales/administration


Tommy Bahama


125,000


2026 

Auburn, Washington(1)


Distribution center


Tommy Bahama


325,000


2025 


Distribution center


Tommy Bahama


335,000


2025 

King of Prussia, Pennsylvania


Sales/administration and distribution center


Lilly Pulitzer


160,000


Owned 


Sales/administration and distribution center


Lilly Pulitzer


160,000


Owned 

Greenville, South Carolina


Sales/administration


Southern Tide


14,000


2024 

Los Angeles, California

Sales/administration

Johnny Was

30,000

2032

Los Angeles, California

Administration and distribution center

Johnny Was

70,000

2025

Atlanta, Georgia


Sales/administration


Corporate and Other and Lanier Apparel


30,000


2024


Sales/administration


Corporate/Other


30,000


2026

Lyons, Georgia


Distribution center


Various


420,000


Owned 


Distribution center


Various


420,000


Owned 

Toccoa, Georgia (ceasing operations in Fiscal 2021)


Distribution center


Lanier Apparel


310,000


Owned 

Merida, Mexico (ceased operations in Fiscal 2020)


Manufacturing plant


Lanier Apparel


80,000


Owned 

(1)The lease on the Auburn, Washington Distribution center was extended in Fiscal 2024 through Fiscal 2035.

Item 3.   Legal Proceedings

From time to time, we are a party to litigation and regulatory actions arising in the ordinary course of business. These actions may relate to trademark and other intellectual property, licensing arrangements,employee relations matters, real estate, employee relations matters,licensing arrangements, importing or exporting regulations, product safety requirements, taxation or other topics. We are not currently a party to any litigation or regulatory action or aware of any proceedings contemplated by governmental authorities that we believe could reasonably be expected to have a material impact on our financial position, results of operations or cash flows. However, our assessment of any litigation or other legal claims could potentially change in light of the discovery of additional factors not presently known or determinations by judges, juries, or others which are not consistent with our evaluation of the possible liability or outcome of such litigation or claims.

Item 4.   Mine Safety Disclosures

Not applicable.

40

Table of Contents

PART II

Item 5.   Market for Registrant’s Common Equity, Related Stockholder Matters and Issuer Purchases of Equity Securities

Market and Dividend Information

Our common stock is listed and traded on the New York Stock Exchange under the symbol "OXM." As of March 19, 2021,24, 2024, there were 292255 record holders of our common stock.

On March 23, 2021,25, 2024, our Board of Directors approved a cash dividend of $0.37$0.67 per share payable on April 30, 2021May 3, 2024 to shareholders of record as of the close of business on April 16, 2021.19, 2024. Although we have paid dividends in each quarter since we became a public company in July 1960, including $17 million in total or $1.00 per common share in Fiscal 2020 and $25 million in total or $1.48 per common share in Fiscal 2019, we may discontinue or modify dividend payments at any time if we determine that other uses of our capital, including payment of outstanding debt, funding of acquisitions, funding of capital expenditures or repurchases of outstanding shares, may be in our best interest; if our expectations of future cash flows and future cash needs outweigh the ability to pay a dividend; or if the terms of our credit facility, other debt instruments or applicable law limit our ability to pay dividends. We may borrow to fund dividends or repurchase shares in the short term subject to the terms and conditions of our credit facility, other debt instruments and applicable law. All cash flow from operations will not be paid out as dividends in all periods.or repurchases of our common stock. For details about limitations on our ability to pay dividends, see the discussion of our $325 million Fourth Amended and Restated Credit Agreement (as amended, the “U.S. Revolving Credit Agreement”) in Note 56 of our consolidated financial statements and Part II, Item 7. Management’s Discussion and Analysis of Financial Condition and Results of Operations, both contained in this report.

41

Table of Contents

Recent Sales of Unregistered Securities

We did not sell any unregistered equity securities during Fiscal 2020.2023.

Purchases of Equity Securities by the Issuer and Affiliated Purchasers

We have certain stock incentive plans as described in Note 8 to our consolidated financial statements included in this report, all of which are publicly announced plans. Under the plans, we can repurchase shares from employees to cover employee tax liabilities related to the vesting of shares of our stock. During the Fourth Quarter of Fiscal 2020,2023, no shares were repurchased pursuant to these plans.

As disclosed in our AnnualQuarterly Report on Form 10-K10-Q for the Third Quarter of Fiscal 20172021, and in subsequent annual and quarterly reports, in March 2017,filings, on December 7, 2021, our Board of Directors authorized us to spend up to $50$150 million to repurchase shares of our stock. This authorization superseded and replaced all previous authorizations to repurchase shares of our stock and has no automatic expiration. AsPursuant to the Board of February 1, 2020, no sharesDirectors’ authorization, in the First Quarter of our stock had been repurchased pursuant to this authorization. In February and March 2020,Fiscal 2023, we repurchased 332,000 shares of our common stock for $18entered into a $20 million under an open market stock repurchase program (Rule 10b5-1 plan) pursuant to acquire shares of our stock. During the BoardSecond Quarter of Directors’ authorization. Fiscal 2023 and the Third Quarter of Fiscal 2023, we repurchased 186,000 and 10,000 shares, respectively, of our common stock for $19 million and $1 million, respectively. Over the life of the $20 million open market repurchase program we repurchased 196,000 shares, or 1%, of our outstanding shares at the commencement of the program for an average price of $102 per share.

During the Fourth Quarter of Fiscal 2020,2023, we did not repurchase any shares of our stock pursuant to this authorization. AsAfter considering the repurchases during Fiscal 2023 as of January 30, 2021, $32February 3, 2024, there were no amounts remaining under the open market repurchase program and $30 million remaining under the Board of the authorization remains available for future repurchasesDirectors’ authorization.

42

Table of our common stock.Contents

Stock Price Performance Graph

The graph below reflects cumulative total shareholder return (assuming an initial investment of $100 and the reinvestment of dividends) on our common stock compared to the cumulative total return for a period of five years, beginning January 30, 2016February 2, 2019, and ending January 30, 2021, of:

The S&P SmallCap 600 Index; and
The S&P 500 Apparel, Accessories and Luxury Goods.

41

TableFebruary 3, 2024, of Contents(1) The S&P SmallCap 600 Index and (2) The S&P 500 Apparel, Accessories and Luxury Goods.

GraphicGraphic


INDEXED RETURNS

Base Period

Years Ended

Company / Index


1/30/16


1/28/17


2/3/18


2/2/19


2/1/20


1/30/21

Oxford Industries, Inc.


100


78.78


117.38


116.42


106.72


102.47

S&P SmallCap 600 Index


100


135.00


154.01


154.55


164.80


202.99

S&P 500 Apparel, Accessories & Luxury Goods


100


85.20


108.75


101.36


93.38


91.33


INDEXED RETURNS

Base Period

Years Ended

Company / Index


2/2/19


2/1/20


1/30/21


1/29/22


1/28/23


2/3/24

Oxford Industries, Inc.


100


91.67


88.01


111.12


164.80


138.81

S&P SmallCap 600 Index


100


106.63


131.34


142.26


141.93


147.56

S&P 500 Apparel, Accessories & Luxury Goods


100


92.13


90.11


88.75


64.72


52.88

Item 6.  Selected Financial Data

Intentionally omitted.Reserved

4243

Table of Contents

Item 7.   Management’s Discussion and Analysis of Financial Condition and Results of Operations

The following discussion and analysis of our results of operations, cash flows, liquidity and capital resources compares Fiscal 20202023 to Fiscal 20192022 and should be read in conjunction with our consolidated financial statements contained in this report.

The results of operations, cash flows, liquidity and capital resources for Fiscal 20192022 compared to Fiscal 20182021 are not included in this report on Form 10-K. For a discussion of our results of operations, cash flows, liquidity and capital resources for Fiscal 20192022 compared to Fiscal 20182021 and certain other financial information related to Fiscal 20192022 and Fiscal 2018,2021, refer to the “Management’s Discussion and Analysis of Financial Condition and Results of Operations” in Part II. Item 7 of our 20192022 Annual Report on Form 10-K, filed with the SEC on March 30, 2020,28, 2023, which is available on the SEC’s website at www.sec.gov and under the Investor Relations section of our website at www.oxfordinc.com.

OVERVIEW

Business Overview

We are a leading branded apparel company that designs, sources, markets and distributes products bearing the trademarks of our Tommy Bahama, Lilly Pulitzer, andJohnny Was, Southern Tide, TBBC, Duck Head and Jack Rogers lifestyle brands and other brands. Tommy Bahama and Lilly Pulitzer, in the aggregate, represent more than 85% of our net sales.

Our business strategy is to develop and market compellingdrive excellence across a portfolio of lifestyle brands and products that evoke a strong emotional response from our target consumers.create sustained, profitable growth. We consider lifestyle brands to be those brands that have a clearly defined and targeted point of view inspired by an appealing lifestyle or attitude. Furthermore, we believe lifestyle brands that create an emotional connection like Tommy Bahama, Lilly Pulitzer and Southern Tide, can command greater loyalty and higher price points at retail and create licensing opportunities. We believe the attraction of a lifestyle brand depends on creating compelling product, effectively communicating the respective lifestyle brand message and distributing products to consumers where and when they want them. We believe the principal competitive factors in the apparel industry are the reputation, value, and image of brand names; design of differentiated, innovative or otherwise compelling product; consumer preference; price; quality; marketing;marketing (including through rapidly shifting digital and social media vehicles); product fulfillment capabilities; and customer service. Our ability to compete successfully in the apparel industry is directly related todependent on our proficiency in foreseeing changes and trends in fashion and consumer preference and presenting appealing products for consumers. Our design-led, commercially informed lifestyle brand operations strive to provide exciting, differentiated fashion products each season.season as well as certain core products that consumers expect from us.

On September 19, 2022, we acquired Johnny Was. Johnny Was products are sold through the Johnny Was website and full-price retail stores and outlets as well as select department stores and specialty stores. We continue to execute acquisition and integration activities in connection with the Johnny Was acquisition, such as investing in distribution and technology infrastructure. The financial information included in the results of operations discussion below for Fiscal 2022, includes only the nineteen weeks from the September 19, 2022 acquisition through January 28, 2023. Therefore, the amounts included in the results of operations below for Fiscal 2022 are not indicative of results for a full year. Refer to Note 4 and Note 2 of our consolidated financial statements included in this report for additional information about the Johnny Was acquisition.

During Fiscal 2020, 77%2023, 80% of our consolidated net sales were through our direct to consumer channels of distribution, which consistsconsist of our brand-specificbrand specific full-price retail stores, our e-commerce websites and outlets, as well as our Tommy Bahama food and beverage operations and our Tommy Bahama outlets.operations. The remaining 23%20% of our net sales was generated fromthrough our wholesale distribution channels. Our wholesale operations consist of net sales of products bearing our lifestyle brands,channels, which complement our direct to consumer operations and provide access to a larger groupbase of consumers, and the netconsumers. Our wholesale operations consist of sales of products bearing the trademarks of our Lanier Apparel operating group.lifestyle brands to various specialty stores, better department stores, Signature Stores, multi-branded e-commerce retailers and other retailers.

For additional information about our business and each of our operating groups, see Part I, Item 1. Business included in this report. Important factors relating to certain risks which could impact our business including those resulting from the COVID-19 outbreak, are described in Part I, Item 1A. Risk Factors of this report.

44

Table of Contents

Industry Overview

Our operating groupsWe operate in a highly competitive apparel marketsmarket that continuecontinues to evolve rapidly with the expanding application of technology to fashion retail. No single apparel firm or small group of apparel firms dominates the apparel industry, and our direct competitors vary by operating group and distribution channel. The apparel industry is cyclical and very dependent uponon the overall level and focus of discretionary consumer spending, which changes as consumer preferences and regional, domestic and international economic conditions change. Increasingly,Also, in recent years consumers are choosinghave chosen to spend less of their discretionary spending on certain product categories, including apparel, while spending

43

Table of Contents

more on services and other product categories. Further, negative economic conditions often have a longer and more severe impact on the apparel industry than on other industries.industries due, in part, to apparel purchases often being more of a discretionary purchase.

TheThis competitive and evolving environment may requirerequires that brands and retailers approach their operations, including marketing and advertising, very differently than historical practicesthey have historically and may result in increased operating costs and capital investments to generate growth or even maintain currentexisting sales levels. Many ofWhile the changes in the industry were accelerated or exacerbated by the COVID-19 pandemic. While this competition and evolution presentspresent significant risks, especially for traditional retailers who fail or are unable to adapt, we believe it also presents a tremendous opportunity for brands and retailers to capitalize on the changing consumer environment.

WeThe current macroenvironment, with heightened concerns about continuing inflationary trends, a global economic recession, geopolitical issues, the availability and cost of credit and elevated interest rates for prolonged periods, combined with heightened promotional activity in our industry, is creating a complex and challenging retail environment, which has impacted our businesses and financial results during Fiscal 2023 and exacerbated some of the inherent challenges to our operations and may continue to do so in the future. There remains significant uncertainty in the macroeconomic environment, and the impact of these and other factors could have a major effect on our businesses.

However, we believe our lifestyle brands have true competitive advantages, in this new retailing paradigm, and we arecontinue to invest in our brands’ direct to consumer initiatives and distribution capabilities while further leveraging technology to serve our consumers when and where they want to be served. We continue to believe that our lifestyle brands, with their strong emotional connections with consumers, are well suited to succeed and thrive in the long term while managing the various challenges facing our industry.

COVID-19 Pandemic

The COVID-19 pandemic has had a significant effect on overall economic conditions and our operations and is the primary reason for a 33% reduction in net sales and a significant net loss in Fiscal 2020 after years of profitable operating results. While our mission remains the enhancement of long-term shareholder value, our focus during this crisis has been (1) the health and well-being of our employees, customers and communities, (2) protecting the reputation, value and image of our brands and (3) preserving liquidity.

Due to the COVID-19 pandemic, we saw reduced consumer traffic starting in early March 2020 and temporarily closed all our retail and restaurant locations. We began reopening our stores and restaurants in early May with additional stores and restaurants reopening throughout the Second Quarter of Fiscal 2020. We have reopened substantially all of our direct to consumer locations in a phased approach in accordance with local government guidelines and with additional safety protocols. Substantially all locations are experiencing reduced traffic, limited operating hours and capacity, and seating and other limitations, with such factors impacting individual locations differently. Certain retail stores and restaurants, including several in Hawaii and California, were required to close again for certain periodsindustry in the Third and Fourth Quarters of Fiscal 2020 after local jurisdictions reinstated some closure requirements. There can be no assurance that additional closures will not occur as a result of any resurgence of COVID-19 cases and/or additional government mandates or recommendations. Generally, locations with attached restaurants or Marlin Bars, in outdoor centers and in drivable resort vacation destinations performed better than locations in indoor malls in Fiscal 2020. At the same time, the shift from in-store shopping to online shopping has accelerated during the COVID-19 pandemic resulting in 24% growth in our e-commerce businesses during Fiscal 2020.

There is significant uncertainty as to the duration and severity of the pandemic as well as the associated business disruption, impact on discretionary spending and restrictions on our ongoing operations. Thus, the ultimate impact of the pandemic cannot be reasonably estimated at this time. However, the COVID-19 pandemic is expected to continue to have a material adverse impact on our business, results of operations, cash flows and financial condition for the foreseeable future due to the anticipated lower net sales from our bricks and mortar locations; reduced demand from our wholesale customers, several of which filed for bankruptcy in 2020 or are undergoing restructurings or closures; the uncertainty as to the continued strength of our brands’ e-commerce businesses during the pendency of the pandemic and thereafter; overall changes in consumer spending habits and consumer confidence; any potential disruptions to our supply chain; and a slowdown in the U.S. and global economies.

We took several actions in Fiscal 2020 to mitigate the impact of the COVID-19 pandemic on our business, operations and liquidity, which included:

we furloughed and laid off a significant number of our retail, restaurant and office employees;
certain salaried employees, including our Chief Executive Officer, Chief Financial Officer and other executives, took temporary reductions in base salary during Fiscal 2020;

44

Table of Contents

our Board of Directors elected to reduce its cash retainers for Fiscal 2020;
we worked with our suppliers to cancel, delay or suspend future product deliveries;
we worked with our wholesale customers to identify suitable changes to our business arrangements;
we negotiated equitable rental arrangements with substantially all of our direct to consumer location landlords, believing that the payment of rents for both the closure and subsequent periods is inappropriate due to the impact of the COVID-19 pandemic, and are continuing those discussions with some landlords;
under the CARES Act, and other regulations in other countries, we obtained employee retention credits for certain compensation paid to employees even while they were not working during the COVID-19 pandemic and have deferred the payment of the employer portion of FICA;
we suspended, cancelled or deferred certain capital expenditure projects, reducing our capital expenditures for Fiscal 2020;
during much of Fiscal 2020, we had drawn down certain amounts on our U.S. Revolving Credit Agreement to increase our cash position and preserve financial flexibility; and
our Board of Directors reduced the rate of our dividend payable for Fiscal 2020.

Also, we established management committees, reporting to our Chief Executive Officer, to continue to monitor the COVID-19 pandemic and its impact and are taking the necessary measures to protect the health and safety of our employees and customers.

We anticipate that net sales in each of our Tommy Bahama, Lilly Pulitzer and Southern Tide operating groups will continue to be negatively impacted by the COVID-19 pandemic in Fiscal 2021, with the impact being more pronounced in the first half of the year and then beginning to rebound a little more in the second half of the year once more consumers are vaccinated, begin to travel again or otherwise begin to return to a more normal way of life.

Given our net cash position as of January 30, 2021, substantial availability under our U.S. Revolving Credit Agreement and expectation of positive cash flows from operations in Fiscal 2021, among other factors, we believe we have adequate liquidity and the financial discipline to address the near-term challenges related to the COVID-19 pandemic and to position ourselves well to thrive in the post-pandemic retailcurrent environment.

Lanier Apparel Exit

In Fiscal 2020, we made the decision to exit our Lanier Apparel business, which is expected to be completed during the second half of Fiscal 2021. In Fiscal 2020 and Fiscal 2019, Lanier Apparel represented 5% and 8%, respectively, of our consolidated net sales. This decision is in line with our stated business strategy of developing and marketing compelling lifestyle brands and takes into consideration the increased challenges faced by the Lanier Apparel business, many of which were magnified by the COVID-19 pandemic. The Lanier Apparel business was primarily focused on moderately priced tailored clothes and related products.

In connection with the planned exit of the Lanier Apparel business, we recorded pre-tax charges of $13 million in the Lanier Apparel operating group during Fiscal 2020. These charges consist of (1) $6 million of inventory markdowns, the substantial majority of which were reversed in Corporate and Other as part of LIFO accounting as the inventory has not been sold as of January 30, 2021, (2) $3 million of employee charges, including severance and employee retention costs, (3) $3 million of operating lease asset impairment charges for leased office space of Lanier Apparel, (4) $1 million of non-cash fixed asset impairment charges, primarily related to leasehold improvements, and (5) $1 million of charges related to our Merida manufacturing facility, which ceased operations in Fiscal 2020. Refer to

45

Table of Contents

Note 11 in our consolidated financial statements included in this report for more information about the Lanier Apparel exit charges.

In addition to these charges incurred in Fiscal 2020, we currently expect to incur incremental Lanier Apparel exit charges totaling approximately $3 million in Fiscal 2021, which are expected to consist of additional employee charges for employees retained during the exit and the acceleration of certain post-exit contractual commitments.

Key Operating Results

The following table sets forth our consolidated operating results from continuing operations (in thousands, except per share amounts) for Fiscal 2020 compared to2023 and Fiscal 2019:2022:


Fiscal 2020


Fiscal 2019

Net sales

$

748,833

$

1,122,790

Operating (loss) income

$

(123,849)

$

93,675

Net (loss) earnings

$

(95,692)

$

68,493

Net (loss) earnings per diluted share

$

(5.77)

$

4.05

Weighted average shares outstanding -- diluted


16,576


16,914


Fiscal


Fiscal 2023

Fiscal 2022

Net sales

$

1,571,475

$

1,411,528

Operating income

$

80,982

$

218,774

Net earnings

$

60,703

$

165,735

Net earnings per diluted share

$

3.82

$

10.19

Weighted average shares outstanding - diluted


15,906


16,259

The net lossNet earnings per diluted share were $3.82 in Fiscal 20202023 compared to positive$10.19 in Fiscal 2022. The 63% decrease in net earnings per diluted share in Fiscal 2019 was primarily due to a 63% decrease in net earnings partially offset by a 2% reduction in weighted average shares outstanding due to open market share repurchases in Fiscal 2022 and Fiscal 2023. The decreased net earnings was primarily due to (1) lower operating income at Johnny Was primarily resulting from the impact of COVID-19 on the operating results of each of our operating groups resulting in lower sales and lower gross margins, (2) the $60noncash $111 million Southern Tide impairment charge recognized in the FirstFourth Quarter of Fiscal 2020, a significant portion of which was non-deductible, (3) the $15 million write off of an information technology project in2023, (2) lower operating income at Tommy Bahama, Lilly Pulitzer and Emerging Brands, (3) increased interest expense, (4) $13 million of charges incurred in Fiscal 2020 related to the Lanier Apparel exit, which is expected to be completed in the second half of Fiscal 2021.a higher operating loss at Corporate and Other and (5) lower royalty income. These itemsdecreases were partially offset by a smallerlower effective tax rate.

During Fiscal 2023 we generated $244 million of cash flows from operations, which exceeded our cash used for capital expenditures, dividends and share repurchases. With our long history of strong positive cash flows from operations

45

Table of Contents

exceeding cash requirements for capital expenditures and dividends and our strong balance sheet, we believe our anticipated future cash flows from operations will provide sufficient cash to satisfy our ongoing operating losscash requirements, ample funds to continue to invest in Corporate and Other, which was primarily dueour lifestyle brands, the project to the favorable impact of LIFO accounting primarily due to the reversal of inventory markdowns recognizedbuild a new distribution center in the operating groups.Southeastern United States, direct to consumer initiatives and information technology projects, additional cash flow to repay outstanding debt and sufficient cash for other strategic initiatives.

OPERATING GROUPS

We identify our operating groups based on the way our management organizes the components of our business for purposes of allocating resources and assessing performance. Our operating group structure reflects a brand-focused management approach, emphasizing operational coordination and resource allocation across each brand’s direct to consumer, wholesale and licensing operations, as applicable. OurSubsequent to our acquisition of Johnny Was in September 2022, our business has historically been operated primarily throughis organized as our Tommy Bahama, Lilly Pulitzer, Southern TideJohnny Was and Emerging Brands operating groups. Operating results for periods prior to Fiscal 2022 also include the Lanier Apparel operating groups. In Fiscal 2020,group, which we made the decision to exit our Lanier Apparel business, which is expected to be completed during the second half ofexited in Fiscal 2021. For additional information about eacha more extensive description of our reportable operating groups and Corporate and Other, see Part I, Item 1. Business and Note 2 toof our consolidated financial statements, both included in this report.

STORE COUNTCOMPARABLE SALES

We often disclose comparable sales in order to provide additional information regarding changes in our results of operations between periods. Our disclosures of comparable sales include net sales from our full-price retail stores and e-commerce sites, excluding sales associated with e-commerce flash clearance sales. We believe that the inclusion of both full-price retail stores and e-commerce sites in the comparable sales disclosures is a more meaningful way of reporting our comparable sales results, given similar inventory planning, allocation and return policies, as well as our cross-channel marketing and other initiatives for the direct to consumer channels. For our comparable sales disclosures, we exclude (1) outlet store sales and e-commerce flash clearance sales, as those clearance sales are used primarily to liquidate end of season inventory, which may vary significantly depending on the level of end of season inventory on hand and generally occur at lower gross margins than our non-clearance direct to consumer sales, and (2) food and beverage sales, as we do not currently believe that the inclusion of food and beverage sales in our comparable sales disclosures is meaningful in assessing our total company operations. Comparable sales information reflects net sales, including shipping and handling revenues, if any, associated with product sales.

For purposes of our disclosures, comparable sales consists of sales through e-commerce sites and any physical full-price retail store that was owned and open as of the beginning of the prior fiscal year and which did not have during the relevant periods, and is not within the current fiscal year scheduled to have, (1) a remodel or other event which would result in a closure for an extended period of time (which we define as a period of two weeks or longer), (2) a greater than 15% change in the size of the retail space due to expansion, reduction or relocation to a new retail space or (3) a relocation to a new space that is significantly different from the prior retail space. For those stores which are excluded based on the preceding sentence, the stores continue to be excluded from comparable sales until the criteria for a new store is met subsequent to the remodel, relocation, or other event. A full-price retail store that is remodeled will generally continue to be included in our comparable sales metrics as a store is not typically closed for longer than a two-week period during a remodel; however, a full-price retail store that is relocated generally will not be included in our comparable sales metrics until that store has been open in the relocated space for the entirety of the prior fiscal year because the size or other characteristics of the store typically change significantly from the prior location. Any stores that were closed during the prior fiscal year or current fiscal year, or which we expect to close or vacate in the current fiscal year, as well as any pop-up or temporary store locations, are excluded from our comparable sales metrics.

Definitions and calculations of comparable sales differ among retail companies, and therefore comparable sales metrics disclosed by us may not be comparable to the metrics disclosed by other companies.

DIRECT TO CONSUMER LOCATIONS

The table below provides store count information about the number of direct to consumer locations for Tommy Bahama, Lilly Pulitzer and Southern Tideour brands as of the dates specified. For acquired businesses, locations are only included subsequent to the date of acquisition. The table includesamounts

46

Table of Contents

below include our permanent storeslocations and excludesexclude any pop-up or temporary store locations which have an initial lease term less thanof 12 months or equal to 12 months. Due to the impact of the COVID-19 pandemic, all our stores and restaurants were closed beginning in March 2020. We began reopening our stores and restaurants starting on May 3, 2020 in a phased approach in accordance with local government guidelines and with additional safety protocols implemented with substantially all direct to consumer locations reopened as of January 30, 2021. Certain retail stores and restaurants in some jurisdictions, including Hawaii and California, were required to close again for certain periods in the second half of Fiscal 2020 after local jurisdictions reinstated some closure requirements. Substantially all locations are experiencing reduced traffic, limited operating hours and capacity, seating and other limitations, with such factors impacting individual locations differently.less.

46

Table of Contents

January 30,

February 1,

February 2,

February 3,

February 3,

January 28,

January 29,

January 30,


2021


2020


2019


2018


2024


2023


2022


2021

Tommy Bahama retail stores


105


111


113


110

Tommy Bahama retail-restaurant locations


20


16


17


18

Tommy Bahama full-price retail stores


102


103


102


105

Tommy Bahama retail-food & beverage locations


22


21


21


20

Tommy Bahama outlets


35


35


37


38


34


33


35


35

Total Tommy Bahama locations


160


162


167


166


158


157


158


160

Lilly Pulitzer retail stores


59


61


62


57

Southern Tide retail stores

3

1

Total Oxford locations


222


224


229


223

Lilly Pulitzer full-price retail stores


60


59


58


59

Johnny Was full-price retail stores

72

65

Johnny Was outlets

3

2

Total Johnny Was locations

75

67

Southern Tide full-price retail stores

19

6

4

3

TBBC full-price retail stores

3

3

1

Total Oxford direct to consumer locations


315


292


221


222

RESULTS OF OPERATIONS

The following table sets forth the specified line items in our consolidated statements of operations both in dollars (in thousands) and as a percentage of net sales. We have calculated all percentages based on actual data, but percentage columns may not add due to rounding. Individual line items of our consolidated statements of operations may not be directly comparable to those of our competitors, as classification of certain expenses may vary by company.


Fiscal 2020


Fiscal 2019


Fiscal 2018


Fiscal 2023


Fiscal 2022


Fiscal 2021


Net sales


$

748,833


100.0

%  

$

1,122,790


100.0

%  

$

1,107,466


100.0

%


$

1,571,475


100.0

%  

$

1,411,528


100.0

%  

$

1,142,079


100.0

%

Cost of goods sold


333,626


44.6

%  


477,823


42.6

%  


470,342


42.5

%


575,890


36.6

%  


522,673


37.0

%  


435,861


38.2

%

Gross profit


415,207


55.4

%  


644,967


57.4

%  


637,124


57.5

%


995,585


63.4

%  


888,855


63.0

%  


706,218


61.8

%

SG&A


492,628


65.8

%  


566,149


50.4

%  


560,508


50.6

%


820,705


52.2

%  


692,004


49.0

%  


573,636


50.2

%

Impairment of goodwill and intangible assets

60,452

8.1

%  

%  

%

113,611

7.2

%  

%  

%

Royalties and other operating income


14,024


1.9

%  


14,857


1.3

%  


13,976


1.3

%


19,713


1.3

%  


21,923


1.6

%  


32,921


2.9

%

Operating income


(123,849)


(16.5)

%  


93,675


8.3

%  


90,592


8.2

%


80,982


5.2

%  


218,774


15.5

%  


165,503


14.5

%

Interest expense, net


2,028


0.3

%  


1,245


0.1

%  


2,283


0.2

%


6,036


0.4

%  


3,049


0.2

%  


944


0.1

%

Earnings from continuing operations before income taxes


(125,877)


(16.8)

%  


92,430


8.2

%  


88,309


8.0

%

Earnings before income taxes


74,946


4.8

%  


215,725


15.3

%  


164,559


14.4

%

Income taxes


(30,185)


(4.0)

%  


23,937


2.1

%  


22,018


2.0

%


14,243


0.9

%  


49,990


3.5

%  


33,238


2.9

%

Net earnings

$

(95,692)


NM

$

68,493


NM

$

66,291


NM

$

60,703


3.9

%

$

165,735


11.7

%

$

131,321


11.5

%

Net earnings per share

$

3.82

$

10.19

$

7.78

Weighted average shares outstanding - diluted


16,576


16,914


16,842


15,906


16,259


16,869


47

Table of Contents

The following table presents the proportion of our consolidated net sales, including any net sales of Johnny Was and Lanier Apparel, by distribution channel for each period presented:presented. We have calculated all percentages below on actual data, and percentages may not add to 100 due to rounding.


Fiscal 2020


Fiscal 2019


Fiscal 2018


Retail


27

%  

39

%  

40

%

E-commerce


43

%  

23

%  

21

%

Restaurant


7

%  

8

%  

8

%

Wholesale


23

%  

30

%  

31

%

Total


100

%  

100

%  

100

%


Fiscal 2023


Fiscal 2022


Fiscal 2021


Retail


39

%  

39

%  

39

%

E-commerce


34

%  

33

%  

32

%

Food & beverage


7

%  

8

%  

8

%

Wholesale


20

%  

20

%  

20

%

Total


100

%  

100

%  

100

%

FISCAL 20202023 COMPARED TO FISCAL 20192022

The discussion and tables below compare certain line items included in our consolidated statements of operations for Fiscal 20202023, which includes 53 weeks, to Fiscal 2019. Each dollar and percentage change provided reflects the change between these fiscal periods unless2022, which includes 52 weeks, except where indicated otherwise. Each dollar and share amount included in the tables is in thousands except for per share amounts. We have calculated all percentages based on actual data, and percentage columns in tables may not

47

Table of Contents

add due to rounding. Individual line items of our consolidated statements of operations, including gross profit, may not be directly comparable to those of our competitors, as classification of certain expenses may vary by company.

Net Sales


Fiscal


Fiscal 2020

Fiscal 2019

$ Change

% Change

Fiscal 2023

Fiscal 2022

$ Change

% Change

Tommy Bahama

$

419,817

$

676,652

$

(256,835)


(38.0)

%

$

898,807

$

880,233

$

18,574


2.1

%

Lilly Pulitzer


231,078


284,700


(53,622)


(18.8)

%


343,499


339,266


4,233


1.2

%

Southern Tide


34,664


46,409


(11,745)


(25.3)

%

Lanier Apparel


38,796


95,200


(56,404)


(59.2)

%

Johnny Was

202,859


72,591


130,268


NM

%

Emerging Brands


126,825


116,484


10,341


8.9

%

Corporate and Other


24,478


19,829


4,649


23.4

%


(515)


2,954


(3,469)


(117.4)

%

Consolidated net sales

$

748,833

$

1,122,790

$

(373,957)


(33.3)

%

$

1,571,475

$

1,411,528

$

159,947


11.3

%

Consolidated net sales decreased $374 million, or 33%,were $1.6 billion in the 53 week Fiscal 2020 primarily due2023 compared to net sales of $1.4 billion in the impact of the COVID-19 pandemic, which has had a negative impact on our retail, wholesale and restaurant operations, impacted by, among other things, temporary closures and reduced traffic after locations reopen, while our e-commerce business has generated very strong growth.52 week Fiscal 2022. The decreases11% increase in net sales included decreases(1) a $130 million increase in (1) full-price retail sales for Johnny Was, which we owned for 19 out of $213the 52 weeks of Fiscal 2022 and (2) single-digit percentage increases in each of our Tommy Bahama, Lilly Pulitzer, and Emerging Brands operating groups. We estimate that the 53rd week in Fiscal 2023 provided an approximate $16 million or 56%, (2) wholesale sales of $161 million, or 48%, (3) restaurant sales of $35 million, or 42%, and (4) outlet sales of $26 million, or 45%. These decreases were partially offset by increased e-commerce sales of $62 million, or 24%, primarily duebenefit to more demand as consumers shifted to online shopping as well as increased online marketing and promotional events to further engage consumers. our consolidated net sales.

The changesincrease in net sales by operating group are discussed below.distribution channel consisted of the following:

an increase in full-price e-commerce sales of $66 million, or 16%, including (1) a $53 million increase in full-price e-commerce sales in Johnny Was and (2) an increase in full-price e-commerce sales in Tommy Bahama and Emerging Brands. These increases were partially offset by a decrease in full-price e-commerce sales in Lilly Pulitzer;
an increase in full-price retail store sales of $46 million, or 9%, including (1) a $47 million increase in full-price retail store sales in Johnny Was and (2) an increase in full-price retail store sales in Emerging Brands. These increases were partially offset by a decrease in full-price retail sales in Tommy Bahama. Lilly Pulitzer full-price retail sales were comparable in Fiscal 2023 to Fiscal 2022;
an increase in wholesale sales of $30 million, or 11%, including (1) a $26 million increase in wholesale sales for Johnny Was and (2) an increase in wholesale sales in Tommy Bahama. These increases were partially offset by a decrease in wholesale sales in Emerging Brands. Lilly Pulitzer wholesale sales were comparable in Fiscal 2023 to Fiscal 2022;

48

Table of Contents

an increase in e-commerce flash clearance sales of $7 million, or 13%;
an increase in food and beverage sales of $7 million, or 6%; and
an increase in outlet sales of $7 million, or 10%, including a $3 million increase in outlet sales in Johnny Was.

Tommy Bahama:

Tommy Bahama net sales decreased $257increased $19 million, or 38%2%, in Fiscal 2020 primarily due to the impact of the COVID-19 pandemic, which had a negative impact on our retail, wholesale and restaurant operations. The decrease in net sales in Tommy Bahama included decreases2023, with an increase in (1) full-price retaile-commerce sales of $145$10 million, or 54%5%, (2) wholesale sales of $67$8 million, or 50%5%, including a decrease in both full-price(3) food and off-price sales, (3) restaurantbeverage sales of $35$7 million, or 42%6%, and (4) outlet store sales of $27$3 million, or 46%5%. These decreasesincreases were partially offset by increased e-commercea decrease in full-price retail sales of $17$9 million, or 13%3%. The following table presents the proportion of net sales by distribution channel for Tommy Bahama for each period presented:


Fiscal 2020


Fiscal 2019


Fiscal 2023


Fiscal 2022


Retail


37

%  

48

%


45

%  

46

%

E-commerce


36

%  

20

%


25

%  

24

%

Restaurant


11

%  

12

%

Food & beverage


13

%  

13

%

Wholesale


16

%  

20

%


17

%  

17

%

Total


100

%  

100

%


100

%  

100

%

Lilly Pulitzer:

Lilly Pulitzer net sales decreased $54increased $4 million, or 19%1%, in Fiscal 2020 primarily due to the impact of the COVID-19 pandemic, which had a negative impact on our retail and wholesale operations. The decrease2023, with an increase in net sales in Lilly Pulitzer included decreases in (1) retaile-commerce flash clearance sales of $69$7 million, or 60%, and (2) wholesale sales of $24 million, or 40%, primarily due to lower full-price sales. These decreases were13%. This increase was partially offset by increased e-commerce sales of $39 million, or 36%, including a 63% increasedecrease in full-price e-commerce sales of $3 million, or 3%. Wholesale sales and a 2% increasefull-price retail sales were comparable in e-commerce flash salesFiscal 2023 to $49 million.Fiscal 2022. The following table presents the proportion of net sales by distribution channel for Lilly Pulitzer for each period presented:

48

Table of Contents


Fiscal 2020


Fiscal 2019


Fiscal 2023


Fiscal 2022


Retail


20

%  

41

%


33

%  

33

%

E-commerce


64

%  

38

%


51

%  

51

%

Wholesale


16

%  

21

%


16

%  

16

%

Total


100

%  

100

%


100

%  

100

%

Southern Tide:Johnny Was:

Southern TideJohnny Was net sales decreased $12were $203 million or 25%, in Fiscal 2020 due to a $15 million, or 39%, decrease in wholesale sales, which was primarily due to the impact2023. We owned Johnny Was for 19 out of the COVID-19 pandemic, partially offset by a $1 million, or 15%, increase in e-commerce sales and a $1 million increase in retail store sales resulting from the opening of three Southern Tide retail stores, with the first store opening in the Fourth Quarter52 weeks of Fiscal 2019.2022. The following table presents the proportion of net sales by distribution channel for Southern TideJohnny Was for each period presented:


Fiscal 2020


Fiscal 2019


Fiscal 2023


Fiscal 2022


Retail

4

%

%


38

%  

36

%

E-commerce


32

%  

21

%


41

%  

42

%

Wholesale


64

%  

79

%


21

%  

22

%

Total


100

%  

100

%


100

%  

100

%

Lanier Apparel:Emerging Brands:

Lanier ApparelEmerging Brands net sales decreased $56increased $10 million, or 59%9%, in Fiscal 2020 primarily due to2023, including $2 million of sales in Jack Rogers that was acquired during the Fourth Quarter of Fiscal 2023. Sales increases in Southern Tide and Duck Head were

49

Table of Contents

partially offset by a slight sales decrease in TBBC. By distribution channel, the $10 million increase included increases of (1) $7 million, or 126%, in retail sales as we opened new retail locations and (2) $6 million, or 12%, in e-commerce. These increases were partially offset by a $3 million, or 5%, decrease in wholesale sales that includes the impact of the COVID-19 pandemic. Lanier Apparel had decreases inacquisition and conversion of six former Southern Tide Signature Store operations to company owned retail stores. The following table presents the proportion of net sales in most replenishment, seasonal and other programsby distribution channel for both the branded and private label businesses, including a large pants programEmerging Brands for a warehouse club that did not repeat in Fiscal 2020. These decreases were partially offset by $4 million of sales of COVID-19 related personal protective equipment such as masks and gowns.each period presented:


Fiscal 2023


Fiscal 2022


Retail

11

%

6

%

E-commerce


43

%  

42

%

Wholesale


46

%  

52

%

Total


100

%  

100

%

Corporate and Other:

Corporate and Other net sales increased $5 million, or 23%,primarily consist of net sales to third parties for our Lyons, Georgia distribution center operations as well as net sales of our Oxford America business, which we exited in Fiscal 20202022. The decrease in net sales was primarily due to increased sales in TBBC as well as increased Duck Head sales.the exit of Oxford America.

Gross Profit

The tables below present gross profit by operating group and in total for Fiscal 20202023 and Fiscal 2019,2022, as well as the change between those two periods and gross margin by operating group and in total. Our gross profit and gross margin, which is calculated as gross profit divided by net sales, may not be directly comparable to those of our competitors, as the statement of operations classification of certain expenses may vary by company.


Fiscal 2020


Fiscal 2019


$ Change


% Change


Fiscal 2023


Fiscal 2022


$ Change


% Change


Tommy Bahama

$

244,197

$

413,200

$

(169,003)


(40.9)

%

$

579,118

$

567,557

$

11,561


2.0

%

Lilly Pulitzer


137,962


174,573


(36,611)


(21.0)

%


226,206


225,028


1,178


0.5

%

Southern Tide


11,810


22,786


(10,976)


(48.2)

%

Lanier Apparel


303


25,086


(24,783)


(98.8)

%

Johnny Was


137,567


44,765


92,802


NM

%

Emerging Brands


61,798


53,012


8,786


16.6

%

Corporate and Other


20,935


9,322


11,613


NM

%


(9,104)


(1,507)


(7,597)


NM

%

Consolidated gross profit

$

415,207

$

644,967

$

(229,760)


(35.6)

%

$

995,585

$

888,855

$

106,730


12.0

%

Notable items included in amounts above:

LIFO adjustments in Corporate and Other

$

(9,220)

$

1,454


$

9,605

$

2,667


Tommy Bahama Japan inventory markdown charges

$

$

159

Lanier Apparel exit charges in cost of goods sold

$

6,684

$

Inventory step-up charge included in Johnny Was

$

$

4,230


Fiscal 2023


Fiscal 2022


Tommy Bahama


64.4

%  

64.5

%

Lilly Pulitzer


65.9

%  

66.3

%

Johnny Was

67.8

%  

61.7

%  

Emerging Brands


48.7

%  

45.5

%

Corporate and Other


NM

%

NM

%

Consolidated gross margin


63.4

%  

63.0

%

The increased gross profit of 12% was primarily due to the 11% increase in net sales as well as increased consolidated gross margin. The higher gross margin included (1) the higher gross margin of Johnny Was for a full Fiscal 2023 relative to only 19 weeks in Fiscal 2022, with Fiscal 2022 gross margin for Johnny Was impacted by purchase accounting, (2) fewer inventory markdowns in the Emerging Brands operating group and (3) reduced freight costs resulting primarily from lower ocean freight rates. These increases were partially offset by (1) increased e-commerce flash clearance sales in Lilly Pulitzer, (2) increased sales during the loyalty award, Flip Side marketing, and end of season clearance events in Tommy Bahama and (3) $7 million in higher LIFO accounting charges in Fiscal 2023 compared to Fiscal 2022. We estimate that the 53rd week in Fiscal 2023 resulted in approximately $10 million of additional gross profit.

4950

Table of Contents


Fiscal 2020


Fiscal 2019


Tommy Bahama


58.2

%  

61.1

%

Lilly Pulitzer


59.7

%  

61.3

%

Southern Tide


34.1

%  

49.1

%

Lanier Apparel


0.8

%  

26.4

%

Corporate and Other


NM

%

NM

%

Consolidated gross margin


55.4

%  

57.4

%

The decrease in consolidated gross profit in Fiscal 2020 was due to the lower net sales and lower gross margin. The lower consolidated gross margin reflects lower gross margin in each operating group as discussed below. During Fiscal 2020, we recognized the negative impact of $15 million of inventory markdowns which were partially offset by a $9 million LIFO accounting credit. In Fiscal 2019, we recognized $4 million of inventory markdowns and a $1 million LIFO accounting charge.

Tommy Bahama:

The decrease incomparable gross margin for Tommy Bahama was primarily drivendue to increased sales during special event promotions, including loyalty award card, Flip Side, Friends & Family and gift with purchase events and end of season clearance events. This decrease was partially offset by (1) reduced freight costs resulting primarily from lower ocean freight rates, (2) improved gross margin in the full-price direct to consumer channelat food & beverage locations primarily due to a change in sales mix as a greater proportion of sales were related to promotion events, (2) lower gross margin in the wholesale channel resulting from a change in sales mix, with a greater proportion of off-price wholesale sales, as well as increased inventory markdowns,lower food costs and (3) lowerimproved gross margin in outlet sales as discounts were increased to move product and (4) certain fixed asset and operating lease asset impairment charges relatedstores due primarily to the restructuringavailability of our Tommy Bahama sourcing operations.newer product from full-price retail stores.

Lilly Pulitzer:

The decrease inlower gross margin for Lilly Pulitzer was primarily due to (1) lower gross margina change in sales mix with flash clearance sales representing a larger proportion of net sales, (2) higher loyalty reward discounts driven by the ecommerce flashnew loyalty program implemented in 2023 and (3) a change in sales resulting from increased discounting and increased freight expense, and (2) increased inventory markdowns.mix with off-price sales representing a larger proportion of wholesale sales. These unfavorable itemsdecreases were partially offset by higher(1) an increase in initial product margins and (2) reduced freight costs resulting primarily from lower ocean freight rates.

Johnny Was:

Gross margin for Fiscal 2023 was 67.8% compared to 61.7% in Fiscal 2020.2022 for the 19 weeks from September 19, 2022 through the end of Fiscal 2022. Gross margin in Fiscal 2022 was unfavorably impacted by $4 million of incremental cost of goods sold resulting from the charge related to the step up of inventory to fair value at acquisition.

Southern Tide:Emerging Brands:

The decrease inhigher gross margin for Southern TideEmerging Brands was primarily due to (1) increasedfewer inventory markdowns and lower profitability on off-price sales related to excess inventory and (2) more significant discounts and allowances in all channels of distribution. These items were partially offset by a change in sales mix with direct to consumer sales representing a largergreater proportion of net sales in Fiscal 2020.

Lanier Apparel:

The decrease in gross margin for Lanier Apparelsales. This increase was primarily due to (1) the $7 million of Lanier Apparel exit charges in cost of goods sold, including inventory markdowns and charges related to our Merida manufacturing facility, as discussed in Note 11 in the consolidated financial statements included in this report, (2) an increase in inventory markdowns in the First Half of Fiscal 2020, and (3)partially offset by lower gross margin on various programswholesale sales due to the challenging tailored clothing market. Eachoff-price wholesale sales of these items hadpreviously marked down inventory representing a more significant gross margin impact on the lower sales volumegreater proportion of Fiscal 2020.wholesale sales.

Corporate and Other:

The gross profit in Corporate and Other primarily reflectsincludes the gross profitimpact of TBBC, Duck Head andLIFO accounting adjustments, the sales of the Lyons, Georgia distribution center as well asoperations to third parties and the impactsales of the Oxford America business. The primary driver for the decreased gross profit was the $7 million higher LIFO accounting adjustments. The primary drivers for the higher gross profit were (1) the $11 million net favorable impact of LIFO accounting with a LIFO accounting credit in Fiscal 2020 and a LIFO accounting charge in Fiscal 2019 and (2) the gross profit resulting from higher net sales.charge. The LIFO accounting impact in Corporate and Other in each period primarily reflectsincludes the net impact of (1) a charge in Corporate and Other when inventory that had been marked down to the estimated net realizable value in an operating group in a prior period is

50

Table of Contents

was ultimately sold, or (2) a credit in Corporate and Other when inventory hashad been marked down to the estimated net realizable value in an operating group in the current period, but hashad not been sold as of period end.end and (3) the change in the LIFO reserve.

SG&A


Fiscal 2020


Fiscal 2019


$ Change


% Change


SG&A

$

492,628

$

566,149

$

(73,521)


(13.0)

%

SG&A (as a % of net sales)


65.8

%  


50.4

%  


Notable items included in amounts above:

Tommy Bahama Japan SG&A charges

$

$

2,795

Tommy Bahama information technology project write-off

$

15,473

$

Amortization of Lilly Pulitzer Signature Store intangible assets

$

270

$

320

Amortization of Southern Tide intangible assets

$

288

$

292

Lanier Apparel exit charges in SG&A

$

6,342

$

TBBC change in fair value of contingent consideration

$

593

$

431


Fiscal 2023


Fiscal 2022


$ Change


% Change


SG&A

$

820,705

$

692,004

$

128,701


18.6

%

SG&A (as a % of net sales)


52.2

%  


49.0

%  


Notable items included in amounts above:

Amortization of Johnny Was intangible assets

$

13,852

$

5,194

Transaction expenses and integration costs associated with the Johnny Was acquisition included in Corporate and Other

$

$

2,783

SG&A was $821 million in Fiscal 2023 compared to SG&A of $692 million in Fiscal 2022 with approximately $85 million, or 66%, of the increase due to the SG&A of Johnny Was. The lower19% increase in total SG&A in Fiscal 2020 was2023 included the following, each of which includes the SG&A of Johnny Was: (1) increased employment costs of $46 million, primarily due to:

decreased employment costs of $63 million primarily due to reductions in our employment cost in response to COVID-19,to increased head count, pay rate increases and other employment cost increases, including the temporary furlough of substantially all retail and restaurant employees while direct to consumer operations were temporarily closed, lay-offs, reduced hours or pay reductions for certain employees, reductions in incentive compensation amounts, suspension of the company match during Fiscal 2020 for our 401(k) plan and the receipt of certain employee retention credits, partially offset by certain severance amounts, including employee charges associated with the Lanier Apparel exit as discussed in Note 11 to the consolidated financial statements included in this report;
an $11 million reduction in certain variable expenses including credit card transaction fees, shipping costs, commissions, supplies and other variable expenses;
a $10 million reduction in occupancy expenses which includes reductions in percent rent, utilities, maintenance and other expenses due to COVID-19 impact on store operations, certain negotiated rent reductions, and fewer Tommy Bahama and Lilly Pulitzer bricks and mortar locations, partially offset by a $3 million operating lease asset impairment charge associated with the Lanier Apparel exit as discussed in Note 11 to the consolidated financial statements included in this report;
a $6 million decrease in travel expenses as the COVID-19 pandemic halted most business travel;
a $3 million reduction in advertising expenses;
a $3 million decrease in Tommy Bahama Japan charges, which related to charges associated with the restructure and exit of our Tommy Bahama Japan operations, with no such charges in Fiscal 2020; and
decreases in other expense items including communications, samples, and administrative and general expenses.

These decreases in SG&A were partially offset by:our direct to

a $15 million charge for the write off of costs associated with a Tommy Bahama information technology project that has been abandoned and will not be implemented;

51

Table of Contents

$6 million of increased estimated provisions for credit losses and other charges related to bankruptcies with respect to multiple customers; and
a $3 million increase in depreciation expense including impairment charges for certain leasehold improvements at certain retail locations and Lanier Apparel office space.

consumer and distribution center operations partially offset by lower incentive compensation amounts, (2) a $22 million increase in advertising expense, (3) a $15 million increase in occupancy expenses, (4) a $12 million increase in variable expenses related to higher sales, including credit card transaction fees, supplies, commissions, royalties and other expense, (5) a $9 million increase in amortization of intangible assets, (6) a $6 million increase in depreciation expense and (7) a $5 million increase in administrative expenses including professional fees, travel and other items. These increases were partially offset by the lack of $3 million in transaction expenses associated with the Johnny Was acquisition in Fiscal 2022. We estimate that the 53rd week in Fiscal 2023 resulted in approximately $11 million of incremental SG&A.

Impairment of goodwill, and intangible assets and equity method investments

InAs a result of the annual impairment assessments performed in the Fourth Quarter of Fiscal 2020,2023, noncash impairment charges for goodwill and intangible assets totaling $60$111 million were recognized in Southern Tide.the Johnny Was reporting unit. The impairment charges for Southern Tide primarilyJohnny Was reflect the impactcurrent challenging macroeconomic environment that has resulted in a more cautious consumer and elevated interest rates for prolonged periods. The more cautious consumer has both negatively impacted Johnny Was’ wholesale customers and direct to consumer operations resulting in Johnny Was not performing as originally projected for Fiscal 2023 and the moderation of COVID-19 onforecasted revenue and operating income in future years. Interest rates also increased significantly after the operations, plansacquisition of Johnny Was in September 2022 and strategy of the Southern Tide business. In addition, a smallhave remained at elevated levels, leading to an increase in discount rates used in our impairment charge was recognized in Lanier Apparel related to a trademark that was not deemed recoverable.analyses. Refer to Note 45 in the consolidated financial statements included in this report for additional discussiondisclosure regarding the Johnny Was impairment charges recognized in Fiscal 2020.2023. There were no impairment charges for goodwill or intangible assets in Fiscal 2019.2022.

In the Fourth Quarter of Fiscal 2023, we also recognized noncash impairment charges of $2 million related to an equity method investment in a smaller lifestyle brand that resulted from the entity’s forecast of future losses. Refer to “Equity Investments in Unconsolidated Entities” in Note 1 in the consolidated financial statements for additional disclosure regarding the impairment charge recognized in Fiscal 2023. There were no impairment charges for equity method investments in Fiscal 2022.

Royalties and other operating income


Fiscal 2020


Fiscal 2019


$ Change


% Change


Fiscal 2023


Fiscal 2022


$ Change


% Change


Royalties and other operating income

$

14,024

$

14,857

$

(833)


(5.6)

%

$

19,713

$

21,923

$

(2,210)


(10.1)

%

Notable items included in amounts above:

Gain on sale of Merida manufacturing facility

$

(1,756)

$

Royalties and other operating income primarily includestypically consist of royalty income received from third parties from the licensing of our brands. The decreased royalties and otherRoyalty income in Fiscal 2020 was primarily due to lower royalty income in both Tommy Bahama and Lilly Pulitzer.

Operating income (loss)


Fiscal 2020


Fiscal 2019


$ Change


% Change


Tommy Bahama

$

(53,310)

$

53,207

$

(106,517)


NM

%

Lilly Pulitzer


27,702


51,795


(24,093)


(46.5)

%

Southern Tide


(64,801)


5,554


(70,355)


NM

%

Lanier Apparel


(26,654)


1,953


(28,607)


NM

%

Corporate and Other


(6,786)


(18,834)


12,048


NM

%

Consolidated Operating (Loss) Income

$

(123,849)

$

93,675

$

(217,524)


NM

%

Notable items included in amounts above:

LIFO adjustments in Corporate and Other

$

(9,220)

$

1,454


Tommy Bahama Japan inventory markdown charges

$

$

159

Lanier Apparel exit charges in cost of goods sold

$

6,684

$

Tommy Bahama Japan SG&A charges

$

$

2,795

Tommy Bahama information technology project write-off

$

15,473

$

Amortization of Lilly Pulitzer Signature Store intangible assets

$

270

$

320

Amortization of Southern Tide intangible assets

$

288

$

292

Southern Tide goodwill and intangible asset impairment charge

$

60,245

$

Lanier Apparel intangible asset impairment charge

$

207

$

Lanier Apparel exit charges in SG&A

$

6,342

$

TBBC change in fair value of contingent consideration

$

593

$

431


The lower operating results in Fiscal 2020 were2023 decreased by $2 million primarily due to (1) the impact$2 million of COVID-19 on eachlower royalties and other operating group,income in Tommy Bahama resulting from lower sales of our licensing partners and (2) the $60a $2 million Southern Tide impairment chargeloss recognized in the First Quarter of Fiscal 2020, (3) the $15 million write off of an information technology project in Tommy Bahama Miramonte Resort & Spa reflected in Corporate and (4)Other. The Tommy Bahama Miramonte Resort & Spa was remodeled and rebranded during Fiscal 2023 which led to increased expenses during the $13remodel and relaunch periods. These decreases were partially offset by a $2 million gain on the sale of Lanier Apparel exitthe Merida manufacturing facility in Mexico in Fiscal 2023.

52

Table of Contents

charges incurredOperating income


Fiscal 2023


Fiscal 2022


$ Change


% Change


Tommy Bahama

$

160,543

$

172,761

$

(12,218)


(7.1)

%

Lilly Pulitzer


56,110


67,098


(10,988)


(16.4)

%

Johnny Was

(104,776)

(1,544)

(103,232)


NM

%

Emerging Brands


6,714


15,602


(8,888)


(57.0)

%

Corporate and Other


(37,609)


(35,143)


(2,466)


NM

%

Consolidated operating income

$

80,982

$

218,774

$

(137,792)


(63.0)

%

Notable items included in amounts above:

LIFO adjustments in Corporate and Other

$

9,605

$

2,667


Inventory step-up charge included in Johnny Was

$

$

4,230

Amortization of Johnny Was intangible assets

$

13,852

$

5,194

Transaction expenses and integration costs associated with the Johnny Was acquisition included in Corporate and Other

$

$

2,783

Johnny Was goodwill and intangible asset impairment charge

$

111,136

$

Impairment of investment in unconsolidated entity

$

2,475

$

Gain on sale of Merida manufacturing facility

$

(1,756)

$

Operating income was $81 million in Fiscal 2020. These items were partially offset by improved2023 compared to $219 million in Fiscal 2022. The decreased operating resultsincome included lower operating income in all operating groups including an increased operating loss in Corporate and Other, which was primarily due to the favorable impact of LIFO accounting due to the reversal of inventory markdowns recognized in the operating groups.Other. Changes in operating income (loss) by operating group are discussed below.

Tommy Bahama:


Fiscal 2020


Fiscal 2019


$ Change


% Change


Net sales

$

419,817

$

676,652

$

(256,835)


(38.0)

%

Gross profit

$

244,197

$

413,200

$

(169,003)

(40.9)

%

Gross margin


58.2

%  


61.1

%  


Operating (loss) income

$

(53,310)

$

53,207

$

(106,517)


NM

%

Operating (loss) income as % of net sales


(12.7)

%  


7.9

%  


Notable items included in amounts above:

Tommy Bahama Japan inventory markdown charges

$

$

159

Tommy Bahama Japan SG&A charges

$

$

2,795

Tommy Bahama information technology project write-off

$

15,473

$


Fiscal 2023


Fiscal 2022


$ Change


% Change


Net sales

$

898,807

$

880,233

$

18,574


2.1

%

Gross profit

$

579,118

$

567,557

$

11,561

2.0

%

Gross margin


64.4

%  


64.5

%  


Operating income

$

160,543

$

172,761

$

(12,218)


(7.1)

%

Operating income as % of net sales


17.9

%  


19.6

%  


The lowerdecreased operating resultsincome for Tommy Bahama in Fiscal 2020 werewas primarily due to (1) increased SG&A and (2) lower sales and lower gross marginroyalty income. These decreases were partially offset by lower SG&A.higher sales. The lowerincreased SG&A was primarily due to (1) $51$14 million of lowerincreased employment costs, (2) $9 million of lower variable costs such as credit card transaction fees, commissions, shipping fees and supplies, (3) $7 million of lower occupancy costs, (4) a $4 million decreaseincrease in advertising expense, (5)(3) $4 million of increased variable expenses and (4) a $1 million increase in occupancy expenses. These increases were partially offset by a $3 million decrease in administrative expenses including professional fees, travel expense, (6) a $3 million decrease in Tommy Bahama Japan charges, which relatedand other items.

Lilly Pulitzer:


Fiscal 2023


Fiscal 2022


$ Change


% Change


Net sales

$

343,499

$

339,266

$

4,233


1.2

%

Gross profit

$

226,206

$

225,028

$

1,178

0.5

%

Gross margin


65.9

%  


66.3

%  


Operating income

$

56,110

$

67,098

$

(10,988)


(16.4)

%

Operating income as % of net sales


16.3

%  


19.8

%  


The decreased operating income for Lilly Pulitzer was due to Fiscal 2019 charges associated with the restructure(1) increased SG&A and exit of our Tommy Bahama Japan operations, and (7) decreases in other general and administrative expenses.(2) lower gross margin. These decreases were partially offset by (1) a $15 million charge related to the write off of an information technology project in Tommy Bahama that was abandoned in the Fourth Quarter of Fiscal 2020, (2) a $2 million increase in depreciation expense including impairment charges for certain direct to consumer locations and (3) a $1 million increase in provisions for credit losses.

Lilly Pulitzer:


Fiscal 2020


Fiscal 2019


$ Change


% Change


Net sales

$

231,078

$

284,700

$

(53,622)


(18.8)

%

Gross profit

$

137,962

$

174,573

$

(36,611)

(21.0)

%

Gross margin


59.7

%  


61.3

%  


Operating income

$

27,702

$

51,795

$

(24,093)


(46.5)

%

Operating income as % of net sales


12.0

%  


18.2

%  


Notable items included in amounts above:

Amortization of Lilly Pulitzer Signature Store intangible assets

$

270

$

320

higher sales. The lower operating income for Lilly Pulitzer in Fiscal 2020 was primarily due to lower sales and lower gross margin partially offset by lower SG&A. The lowerincreased SG&A was primarily due to (1) $9$4 million of lowerincreased employment costs, (2) $3$4 million of lower occupancy costs,increased depreciation and (3) a $2 million decrease in travel expense, and (4) reductions in other general and administrativeof increased variable expenses. These decreases in SG&A were partially offset by (1) $3 million of higher marketing expense and (2) increases in other expenses including provisions for credit losses.

53

Table of Contents

Southern Tide:Johnny Was:


Fiscal 2020


Fiscal 2019


$ Change


% Change


Fiscal 2023


Fiscal 2022


$ Change


% Change


Net sales

$

34,664

$

46,409

$

(11,745)


(25.3)

%

$

202,859

$

72,591

$

130,268


NM

%

Gross profit

$

11,810

$

22,786

$

(10,976)

(48.2)

%

$

137,567

$

44,765

$

92,802

NM

%

Gross margin


34.1

%  


49.1

%  


67.8

%  


61.7

%  


Operating (loss) income

$

(64,801)

$

5,554

$

(70,355)


NM

%

Operating (loss) income as % of net sales


(186.9)

%  


12.0

%  


Operating loss

$

(104,776)

$

(1,544)

$

(103,232)


NM

%

Operating loss as % of net sales


(51.6)

%  


(2.1)

%  


Notable items included in amounts above:

Amortization of Southern Tide intangible assets

$

288

$

292


Southern Tide goodwill and intangible asset impairment charge

$

60,245

$

Johnny Was goodwill and intangible asset impairment charge

$

111,136

$

Inventory step-up charge included in Johnny Was

$

$

4,230

Amortization of Johnny Was intangible assets

$

13,852

$

5,194

The operating results for Johnny Was in Fiscal 2023 include a full year of operations. Fiscal 2022 only included the 19 weeks from September 19, 2022, through the end of the fiscal year. The lower operating results for Southern TideJohnny Was in Fiscal 20202023 were primarily due to (1) the $60$111 million impairment charge for goodwill and intangible assets in the FirstFourth Quarter of Fiscal 2020 as well as lower sales2023, (2) a $9 million increase in amortization of intangible assets and lower gross margin partially(3) $1 million of costs associated with the implementation of a new e-commerce platform. These decreases were offset by lower SG&A. Lowerthe absence of $4 million of inventory step-up charges recorded in Fiscal 2022.

Emerging Brands:


Fiscal 2023


Fiscal 2022


$ Change


% Change


Net sales

$

126,825

$

116,484

$

10,341


8.9

%

Gross profit

$

61,798

$

53,012

$

8,786

16.6

%

Gross margin


48.7

%  


45.5

%  


Operating income

$

6,714

$

15,602

$

(8,888)


(57.0)

%

Operating income as % of net sales


5.3

%  


13.4

%  


Notable items included in amounts above:

Impairment of investment in unconsolidated entity

$

2,475

$


The decreased operating income for Emerging Brands was due to (1) increased SG&A for employment costs, advertising, travel and other expenses(2) an impairment charge in an unconsolidated entity. These decreases were partially offset by the(1) higher sales and (2) higher gross margin. The increased SG&A included (1) higher SG&A associated with the Southern Tidenew retail store operations, including related employment costs, occupancy costs and increased provisions for credit losses.

Lanier Apparel:


Fiscal 2020


Fiscal 2019


$ Change


% Change


Net sales

$

38,796

$

95,200

$

(56,404)


(59.2)

%

Gross profit

$

303

$

25,086

$

(24,783)

(98.8)

%

Gross margin


0.8

%  


26.4

%  


Operating (loss) income

$

(26,654)

$

1,953

$

(28,607)


NM

%

Operating (loss) income as % of net sales


(68.7)

%  


2.1

%  


Notable items included in amounts above:

Lanier Apparel exit charges in cost of goods sold

$

6,684

$

Lanier Apparel intangible asset impairment charge

$

207

$

Lanier Apparel exit charges in SG&A

$

6,342

$

In Fiscal 2020, we made the decision to exit our Lanier Apparel business, which is expected to be completed during the second half of Fiscal 2021. The lower operating results for Lanier Apparel in Fiscal 2020 were due to lower sales, $13 million of charges related to the Lanier Apparel exit,administrative expenses, (2) higher advertising expense and lower gross margin. The Lanier Apparel exit charges primarily consist of inventory markdowns and charges related to our Merida manufacturing facility, which are included in cost of goods sold, and operating lease asset impairment charges, employee charges, and fixed asset impairment charges, which are included in SG&A. Absent the $6 million of Lanier Apparel exit charges included in SG&A, SG&A decreased due to reductions in(3) increased variable expenses employment costs and other operating costs partially offset by $4 million ofresulting from increased estimated provisions for credit losses and other charges related to bankruptcies with respect to multiple Lanier Apparel customers. The Lanier Apparel exit charges are discussed in Note 11 in the consolidated financial statements included in this report.sales.

54

Table of Contents

Corporate and Other:


Fiscal 2020


Fiscal 2019


$ Change


% Change


Fiscal 2023


Fiscal 2022


$ Change


% Change


Net sales

$

24,478

$

19,829

$

4,649


23.4

%

$

(515)

$

2,954

$

(3,469)


(117.4)

%

Gross profit

$

20,935

$

9,322

$

11,613

NM

%

$

(9,104)

$

(1,507)

$

(7,597)

NM

%

Operating loss

$

(6,786)

$

(18,834)

$

12,048


NM

%

$

(37,609)

$

(35,143)

$

(2,466)


NM

%

Notable items included in amounts above:

LIFO adjustments in Corporate and Other

$

(9,220)

$

1,454


$

9,605

$

2,667


TBBC change in fair value of contingent consideration

$

593

$

431

Transaction expenses and integration costs associated with the Johnny Was acquisition

$

$

2,783

Gain on sale of Merida manufacturing facility

$

(1,756)

$

The smallerincreased operating loss forin Corporate and Other was primarily due toa result of (1) the $11$7 million favorable net impact ofhigher LIFO accounting charge in Fiscal 2023 relative to Fiscal 2022 and higher sales.(2) a $2 million equity investment loss associated with the Tommy Bahama Miramonte Resort & Spa. This decrease was partially offset by (1) decreased SG&A, including decreased incentive compensation amounts, (2) a $2 million gain on the sale of the Merida manufacturing facility in Mexico and (3) the lack of $3 million of transaction expenses and integration costs associated with the Johnny Was acquisition incurred in Fiscal 2022.

Interest expense, net


Fiscal 2020


Fiscal 2019


$ Change


% Change


Fiscal 2023


Fiscal 2022


$ Change


% Change


Interest expense, net

$

2,028

$

1,245

$

783


62.9

%

$

6,036

$

3,049

$

2,987


98.0

%

The increasedhigher interest expense in Fiscal 20202023 was primarily due to a higher levels ofaverage outstanding debt outstanding partially offset bybalance and increased interest income earned on cash invested in money market accountsrates during Fiscal 2023 than Fiscal 2022. We expect average debt levels in Fiscal 2020. During most of2024 to be lower than Fiscal 2020, to ensure liquidity during the COVID-19 pandemic, we maintained certain cash on our balance sheet by drawing down on the U.S. Revolving Credit Agreement.2023.

Income taxes


Fiscal 2020


Fiscal 2019


$ Change


% Change


Fiscal 2023


Fiscal 2022


$ Change


% Change


Income tax (benefit) provision

$

(30,185)

$

23,937

$

(54,122)


NM

%

Income tax expense

$

14,243

$

49,990

$

(35,747)


(71.5)

%

Effective tax rate


24.0

%  


25.9

%  


19.0

%  


23.2

%  


Income taxes were a tax benefit inBoth Fiscal 2020 resulting2023 and Fiscal 2022 benefitted from an operating loss and the net favorable impact of certain discrete and other items noted below, as compared tothat resulted in a lower tax expense in Fiscal 2019 resulting from operating income.

The incomerate than the more typical annual effective tax benefit in Fiscal 2020 reflects the benefit of operating losses that will be realized at a federal rate of 35% pursuant to the CARES Act provision allowing carryback of the Fiscal 2020 loss amounts to pre-U.S. Tax Reform years, as well as a favorable provision to return adjustment for our Fiscal 2019 returns.  These favorable impacts were offset by (1) the non-deductibility of certain impairment charges which results in an estimated effective income tax benefit rate of approximately 17% on25%. Thus, the impairment charges, (2) estimated book toeffective tax timing differences which may reducerates for Fiscal 2023 and Fiscal 2022 are not indicative of the amount of Fiscal 2020 expenses currently deductible for incomeeffective tax return purposes, (3) an increase to the reserve for uncertain tax positions and (4) restricted stock which vestedrate expected in the period with a vesting date price lower than the grant date price.future periods. Refer to Note 9 in11 of our consolidated financial statements included in this report for additionalour income tax rate reconciliation and other information about our income tax expense for Fiscal 20202023 and Fiscal 2019.

Net earnings


Fiscal 2020


Fiscal 2019

Net sales

$

748,833

$

1,122,790

Operating (loss) income

$

(123,849)

$

93,675

Net (loss) earnings

$

(95,692)

$

68,493

Net (loss) earnings per diluted share

$

(5.77)

$

4.05

Weighted average shares outstanding -- diluted


16,576


16,914

2022.

The net loss per shareincome tax expense in Fiscal 2020 compared2023 included the benefit of the vesting of restricted stock awards at a price significantly higher than the grant date fair value, the favorable utilization of research and development tax credits, changes in the fair value of life insurance policies associated with our deferred compensation plans and certain adjustments to positive net earnings per sharethe U.S. taxation on foreign earnings.  These favorable items were partially offset by unfavorable items related to the non-deductible amounts associated with executive compensation.  

The income tax expense in Fiscal 2019 was primarily due2022 included the benefit of the reversal of $2 million of valuation allowances associated with net operating loss carry-forward amounts, the utilization of net operating loss carry-forward amounts to (1)offset current year income in certain jurisdictions, a favorable provision to return adjustment and the impact of COVID-19 on the operating resultsvesting of eachemployee stock awards. These favorable items were partially offset by various unfavorable items related to non-deductible amounts associated with executive compensation, changes in the fair value of life insurance policies associated with our operating groups resulting in lower salesdeferred compensation plans and other items.

55

Table of Contents

Net earnings


Fiscal 2023


Fiscal 2022

Net sales

$

1,571,475

$

1,411,528

Operating income

$

80,982

$

218,774

Net earnings

$

60,703

$

165,735

Net earnings per diluted share

$

3.82

$

10.19

Weighted average shares outstanding - diluted


15,906


16,259

Net earnings per diluted share were $3.82 in Fiscal 2023 compared to $10.19 in Fiscal 2022. The 63% decrease in net earnings per diluted share included a 63% decrease in net earnings as well as a 2% reduction in weighted average shares outstanding due to open market share repurchases in Fiscal 2022 and Fiscal 2023. The decreased net earnings were primarily due to (1) lower gross margins, (2)operating income at Johnny Was primarily due to the $60$111 million Southern TideJohnny Was impairment charge recognized in the FirstFourth Quarter of Fiscal 2020, a significant portion of which was non-deductible, (3) the $15 million write off of an information technology project in2023, (2) lower operating income at Tommy Bahama, Lilly Pulitzer, and Emerging Brands, (3) increased interest expense, (4) $13 million of charges related to the Lanier Apparel exit incurred in Fiscal 2020.a higher operating loss at Corporate and Other and (5) lower royalty income. These itemsdecreases were partially offset by the smaller operating loss in Corporate and Other, which was primarily due to the favorable impact of LIFO accounting primarily due to the reversal of inventory markdowns recognized in the operating groups.a lower effective tax rate.

FINANCIAL CONDITION, LIQUIDITY AND CAPITAL RESOURCES

Our primary source of revenue and cash flow is through our design, sourcing, marketing and distribution of branded apparel products bearing the trademarks of our Tommy Bahama, Lilly Pulitzer, andJohnny Was, Southern Tide, lifestyle brandsTBBC, Duck Head and other ownedJack Rogers lifestyle brands. We primarily distribute our products to our customers via direct to consumer andchannels of distribution, but we also distribute our products via wholesale channels of distribution.

Our primary uses of cash flow include the purchase of products in the operation of our businessbranded apparel products from third party contract manufacturerssuppliers located outside of the United States, as well as operating expenses, including employee compensation and benefits, operating lease commitments and other occupancy-related costs, marketing and advertising costs, information technology costs, variable expenses, distribution costs, other general and administrative expenses and the periodic payment of periodic interest and other payments related to our financing arrangements.interest. Additionally, we use our cash for the funding ofto fund capital expenditures and other investing activities, dividends, share repurchases and repayment of indebtedness.indebtedness, if any. In the ordinary course of business, we maintain certain levels of inventory, extend credit to our wholesale customers and pay our operating expenses. Thus, we require a certain amount of ongoing working capital to operate our business. Our need for working capital is typically seasonal with the greatest working capital requirements to support our larger spring, summer and holiday direct to consumer seasons. Our capital needs depend on many factors including the results of our operations and cash flows, future growth rates, the need to finance inventory levels and the success of our various products.

IfWe have a long history of generating sufficient cash flows from operations to satisfy our cash requirements for our ongoing capital expenditure needs as well as payment of dividends and repayment of our debt. Thus, we believe our anticipated future cash flows from operating activities will provide (1) sufficient cash over both the short and long term to satisfy our ongoing operating cash requirements, (2) ample funds to continue to invest in our lifestyle brands, direct to consumer initiatives and information technology projects, (3) additional cash flow to repay outstanding debt and (4) sufficient cash for other strategic initiatives. Also, if cash inflows are less than cash outflows, we have access to amounts under our U.S.$325 million Fourth Amended and Restated Credit Agreement (as amended, the “U.S. Revolving Credit Agreement,Agreement”), subject to its terms, which is described below. We may fund our future cash requirements through various methods, including cash flow from operations, borrowings under our current or additional credit facilities, sales of debt or equity securities, and cash on hand.

As of January 30, 2021 and February 1, 2020, we had $66 million and $52 million, respectively, of cash and cash equivalents on hand, with no borrowings outstanding under our U.S. Revolving Credit Agreement. The increase in cash and cash equivalents at January 30, 2021 was primarily due to $84 million of cash flow from operations, which includes significant decreases in working capital amounts, which was partially offset by cash payments of $35 million for investing activities, $20 million for share repurchases and $17 million for dividends.

As of January 30, 2021, under our U.S. Revolving Credit Agreement, we had $301 million of unused availability, which includes substantially all of our cash and cash equivalents as eligible assets. We believe our U.S. Revolving Credit Agreement and anticipated future positive cash flow from operating activities will provide sufficient cash flow to satisfy our ongoing cash requirements as well as ample opportunity to continue to invest in our brands, direct to consumer initiatives and other strategic initiatives in both the near term and long term.

Key Liquidity MeasuresWorking Capital


January 30,


February 1,


February 3,


January 28,


($ in thousands)

2021

2020

$ Change

% Change


2024

2023

$ Change

% Change


Total current assets

$

258,316

$

288,826

$

(30,510)


(10.6)

%

$

293,115

$

330,463

$

(37,348)


(11.3)

%

Total current liabilities

$

196,252

$

177,779


18,473


10.4

%

$

240,644

$

269,639


(28,995)


(10.8)

%

Working capital

$

62,064

$

111,047

$

(48,983)


(44.1)

%

$

52,471

$

60,824

$

(8,353)


(13.7)

%

Working capital ratio


1.32


1.62


1.22


1.23


Debt to total capital ratio


%  


%


56

Table of Contents

Our working capital ratio is calculated by dividing total current assets by total current liabilities. Current assets as of January 30, 2021February 3, 2024 decreased from February 1, 2020January 28, 2023 primarily due to lowerdecreased inventories receivables and prepaid expensesof $61 million. These decreases were partially offset by increased income taxan increase in (1) receivables of $19 million and cash(2) prepaid expenses and cash equivalents.other current assets of $5 million. Current liabilities as of February 3, 2024 decreased from January 30, 2021 increased from February 1, 202028, 2023 primarily due to higherdecreases in (1) accrued compensation of $11 million driven primarily by decreased accrued incentive compensation, (2) accounts payable of $9 million and (3) current operating lease liabilities accounts payable and other accrued expenses. Changes in current assets and current liabilities are discussed below.

56

Table of Contents

For the ratio of debt to total capital, debt is defined as short-term and long-term debt, and total capital is defined as debt plus shareholders’ equity. There was no debt outstanding as of January 30, 2021 or February 1, 2020, while shareholders’ equity was $406 million as of January 30, 2021 and $529 million as of February 1, 2020. Shareholders’ equity decreased from February 1, 2020, primarily due to net losses, dividends and shares repurchased during Fiscal 2020. Our debt levels and ratio of debt to total capital in future periods may not be comparable to historical amounts as we continue to assess, and possibly make changes to, our capital structure. Changes in our capital structure in the future, if any, will depend on prevailing market conditions, our liquidity requirements, contractual restrictions, the ultimate impact of the COVID-19 pandemic and other factors. The amounts involved may be material.$9 million.

Balance Sheet

The following tables set forth certain information included in our consolidated balance sheets (in thousands). Below each table are explanations for any significant changes in the balances fromas of February 1, 20203, 2024 as compared to January 30, 2021.28, 2023.

Current Assets:


January 30,


February 1,


February 3,


January 28,


2021

2020

$ Change

% Change


2024

2023

$ Change

% Change


Cash and cash equivalents

$

66,013

$

52,460

$

13,553


25.8

%

$

7,604

$

8,826

$

(1,222)


(13.8)

%

Receivables, net


30,418


57,862


(27,444)


(47.4)

%


63,362


43,986


19,376


44.1

%

Inventories, net


123,543


152,229


(28,686)


(18.8)

%


159,565


220,138


(60,573)


(27.5)

%

Income tax receivable

17,975

862

17,113

NM

%

19,549

19,440

109

0.6

%

Prepaid expenses and other current assets


20,367


25,413


(5,046)


(19.9)

%


43,035


38,073


4,962


13.0

%

Total current assets

$

258,316

$

288,826

$

(30,510)


(10.6)

%

$

293,115

$

330,463

$

(37,348)


(11.3)

%

Cash and cash equivalents were $66$8 million as of February 3, 2024, compared to $9 million as of January 30, 2021 compared to $52 million28, 2023. The cash and cash equivalents balance as of February 1, 2020.3, 2024 and January 28, 2023 represent typical cash amounts maintained on an ongoing basis in our operations, which generally ranges from $5 million to $10 million at any given time. Any excess cash that is notgenerally used to repay amounts outstanding under our U.S. Revolving Credit Agreement is generally invested in money market investment accounts.Agreement.

The decrease inincreased receivables, net as of January 30, 2021February 3, 2024, was primarily due to lower(1) higher wholesale trade receivables resulting primarily from lowerhigher wholesale sales lower credit cardin Tommy Bahama and Lilly Pulitzer in the Fourth Quarter of Fiscal 2023, (2) increased tenant improvement allowance receivables due from landlords resulting from our increased store openings during Fiscal 2023 and (3) an insurance claim filed as a higher provision for credit losses. result of the wildfire on the island of Maui that destroyed the Tommy Bahama Marlin Bar in Lahaina, Hawaii in the Third Quarter of Fiscal 2023.

Inventories, net, which is net ofincluded a $62$83 million LIFO reserve as of January 30, 2021 and $63$76 million LIFO reserve as of February 1, 2020,3, 2024, and January 28, 2023, respectively. Inventories decreased as of January 30, 2021. The lower inventories are a result of significantly lower inventories in eachour Tommy Bahama, Lilly Pulitzer and Emerging Brands operating groupgroups primarily due to acontinuing initiatives to focus on decreasing inventories in the COVID-19 environment including reduced inventory purchases, cancellations ofclosely managing inventory purchases and liquidation of excess prior seasonreducing on-hand inventory lowerlevels. We believe that inventory levels in transit amounts and marking down inventory amounts to amounts expected to be realized. The decreases in theall operating groups were partially offset by increased inventoryare appropriate to support anticipated sales plans.

The increase in Corporate and Other resulting from the impact of LIFO accounting which requires the reversal of certain inventory markdowns in the operating groups.

Income tax receivable increased as of January 30, 2021 due to the expected income tax receivable for the benefit of the Fiscal 2020 operating losses, which we expect to carry back to offset prior year taxable income. Prepaidprepaid expenses and other current assets decreased as of January 30, 2021February 3, 2024, was primarily due to loweran increase in prepaid advertising, royalties, samples and other prepaid operating expenses.software costs.

57

Table of Contents

Non-current Assets:


January 30,


February 1,


February 3,


January 28,


2021

2020

$ Change

% Change


2024

2023

$ Change

% Change


Property and equipment, net

$

159,732

$

191,517

$

(31,785)


(16.6)

%

$

195,137

$

177,584

$

17,553


9.9

%

Intangible assets, net


156,187


175,005


(18,818)


(10.8)

%


262,101


283,845


(21,744)


(7.7)

%

Goodwill


23,910


66,578


(42,668)


(64.1)

%


27,190


120,498


(93,308)


(77.4)

%

Operating lease assets

233,775

287,181

(53,406)

(18.6)

263,934

240,690

23,244

9.7

%

Other assets, net


33,714


24,262


9,452


39.0

%

32,188

32,209

(21)

(0.1)

%

Deferred income taxes


24,179


3,376


20,803


616.2

%

Total non-current assets

$

607,318

$

744,543

$

(137,225)


(18.4)

%

$

804,729

$

858,202

$

(53,473)


(6.2)

%

Property and equipment, net as of January 30, 2021 decreasedFebruary 3, 2024, increased primarily due to depreciation expense, the write off of costs associated with a Tommy Bahama information technology project and impairment of certain property and equipmentcapital expenditures exceeding depreciation during Fiscal 2020, which exceeded capital expenditures during Fiscal 2020. 2023.

The decrease in goodwill and intangible assets, net and goodwill as of January 30, 2021February 3, 2024, was primarily due to the $99 million and $12 million goodwill and intangible assets, net, impairment charges of $60 million in Southern Tide inJohnny Was during Fiscal 2020,2023, respectively, as discussed in Note 45 of our consolidated financial statements included in this report. Intangible assets, net as of February 3, 2024, further decreased due to the amortization of intangible assets acquired in the acquisition of Johnny Was. The decrease in goodwill resulting from the Johnny Was impairment charge was partially offset by (1) the acquisition of Jack Rogers, (2) the acquisition of six former Southern Tide signature stores and (3) measurement period adjustments related to the acquisition of Johnny Was.

Operating lease assets as of January 30, 2021 decreasedFebruary 3, 2024, increased primarily due to the addition of new leased locations, or the extension of existing leased locations, exceeding the recognition of amortization related to existing operating leases and the termination or reduced term of certain operating leases andleases.

Deferred income taxes increased as of February 3, 2024, due primarily to the impairment of certain operating leasethe Johnny Was goodwill and intangible asset amounts exceeding the increased operating lease assets associated with any new or extended operating lease agreements. The increasebalances that resulted in other assets,a change from a net as of January 30, 2021 was primarily duedeferred income tax liability position to a $6 million increase in investment in unconsolidated entities due to the acquisition of an ownership interest in two entities, an increase in non-currentnet deferred income tax assets and an increase in assets set aside for potential deferred compensation obligations.asset position.

Liabilities:


January 30,


February 1,


February 3,


January 28,


2021

2020

$ Change

% Change


2024

2023

$ Change

% Change


Total current liabilities

$

196,252

$

177,779

$

18,473


10.4

%

$

240,644

$

269,639

$

(28,995)


(10.8)

%

Long-term debt


%


29,304


119,011


(89,707)


%

Non-current portion of operating lease liabilities


239,963


291,886


(51,923)


(17.8)


243,703


220,709


22,994


10.4

%

Other non-current liabilities


23,691


18,566


5,125


27.6

%


23,279


20,055


3,224


16.1

%

Deferred income taxes

16,540

(16,540)

(100.0)

%

2,981

(2,981)

(100.0)

%

Total liabilities

$

459,906

$

504,771

$

(44,865)


(8.9)

%

$

536,930

$

632,395

$

(95,465)


(15.1)

%

Current liabilities increaseddecreased as of January 30, 2021February 3, 2024, primarily due to higher operating lease liabilities, as certain rent amounts were withheld during the pendency of discussions with real property landlords, and accrued expenses and other liabilities, including higher expected direct to consumer inventory returns, increased gift card liabilities, increases(1) decreases in other accrued expenses and increased accounts payable. Accrued compensationpayable, which was comparable as the increased payable for deferred FICA payments allowable pursuant to the CARES Act offset lower incentive compensation amounts.

Non-current portion of operating lease liabilities as of January 30, 2021 decreased primarily due to the payment ofdecreased payables associated with lower inventory in transit, (2) decreases in accrued incentive compensation and (3) lower current operating lease related liabilities classificationresulting from lease payments partially offset by the addition and extension of certain unpaid amounts while negotiating with landlords regardingseveral leased locations. During Fiscal 2023, several new leased locations were added, and several locations were extended, which led to the addition of primarily non-current operating lease liabilities and reductionsliabilities.

The reduction in liabilities relatedlong-term debt was the result of continuing initiatives to the termination or reduced term of certain operating leases exceeding operating lease liabilities associated with any new or extended operating lease agreements. Other non-current liabilities increased as of January 30, 2021 primarily due to an increase in uncertain tax positions as disclosed in Note 9 topay down our consolidated financial statements included in this report. long-term debt balance.

Deferred income taxes decreased as of January 30, 2021February 3, 2024, due primarily due to timing differences associated withthe impairment of the Johnny Was goodwill and amortization of intangible assets and goodwill, impact of operating lease payable amounts, timing differences associated with inventories, and changesasset balances that resulted in other currenta change from a net deferred income tax liability amounts.position to a net deferred income tax asset position.

58

Table of Contents

Statement of Cash Flows

The following table sets forth the net cash flows including continuing and discontinued operations, resulting in the change in our cash and cash equivalents (in thousands):

Fiscal 2020


Fiscal 2019


Fiscal 2018

Cash provided by operating activities

$

83,850

$

121,926

$

96,377

Cash used in investing activities


(34,651)


(37,421)


(37,397)

Cash used in financing activities


(35,848)


(41,298)


(56,765)

Net change in cash and cash equivalents

$

13,351

$

43,207

$

2,215

Fiscal 2023


Fiscal 2022


Fiscal 2021

Cash provided by operating activities

$

244,284

$

125,610

$

198,006

Cash used in investing activities


(83,981)


(151,747)


(181,572)

Cash used in financing activities


(161,172)


(11,527)


(38,175)

Net change in cash and cash equivalents

$

(869)

$

(37,664)

$

(21,741)

Cash and cash equivalents on hand were $66$8 million and $52as of February 3, 2024, compared to $9 million as of January 30, 2021 and February 1, 2020, respectively.28, 2023. Changes in cash flows in Fiscal 20202023 and Fiscal 20192022 related to operating activities, investing activities and financing activities are discussed below.

Operating Activities:

In Fiscal 20202023 and Fiscal 2019,2022, operating activities provided $84$244 million and $122$126 million of cash, respectively. The cash flow from operating activities for each period was primarily the resultconsisted of net earnings (loss) for the relevant period adjusted, as applicable, for non-cash activities including impairment charges, depreciation, amortization, impairmentequity-based compensation, gains on sale of assets and equity-based compensation,other non-cash items as well as the net impact of changes in deferred income taxes and operating assets and liabilities. In Fiscal 2020,2023, changes in operating assets and liabilities had a slightly unfavorable impact on cash flow from operations primarily driven by decreases in current liabilities and increases in prepaid expenses and receivables partially offset by significant decreases in inventory balances. In Fiscal 2022 the changes in operating assets and liabilities had a significant favorablenet unfavorable impact on cash flow from operations and in Fiscal 2019, changes in operating assets and liabilities had a modest favorable impact on cash flow from operations.

In Fiscal 2020, the more significant changes in operating assets and liabilities were decreases in inventories, and receivables anddriven primarily by increases in current liabilities, which increased cash flow from operations, partially offset by an increase in income tax receivablesinventory and a decrease in deferred tax liabilities, which decreased cash flow from operations. In Fiscal 2019, the more significant changes in working capital, after considering the non-cash impact of certain reclassifications that resulted from the adoption of the revised lease accounting guidance, were a decrease in receivables and inventories, which increased cash flow from operations, partially offset by decreases in current liabilities, which reduced cash flow from operations.prepaid expenses.

Investing Activities:

In Fiscal 20202023 and Fiscal 2019,2022, investing activities used $35$84 million and $37$152 million of cash, respectively. OurOn an ongoing basis, our cash flow primarily consists of our capital expenditures, which were $29totaled $74 million and $47 million in Fiscal 20202023 and $37 million in Fiscal 2019, primarily consist of costs associated with information technology initiatives, including e-commerce capabilities; opening, relocating and remodeling retail stores and restaurants; and facilities enhancements for distribution centers and offices. 2022, respectively.

In addition to our capital expenditures in Fiscal 2020,2023, we invested $6paid (1) $12 million during Fiscal 2023 associated with acquisitions, including Jack Rogers and six former Southern Tide Signature Stores, and a working capital settlement associated with the acquisition of Johnny Was. We also received $2 million from the sale of the Merida manufacturing facility in Mexico. During Fiscal 2022, we paid $264 million for the acquisition of Johnny Was and also converted $165 million of short-term investments into cash to fund a minority interest in two separate unconsolidated entities, which operate branded apparel businesses.portion of the acquisition.

On an ongoing basis,In Fiscal 2024, our cash flow used in investing activities is expected to primarily consist of our capital expenditure investments in our existing brands as well as any acquisitions of or minority interests(1) the multi-year project to build a new distribution center in new businesses.the Southeastern United States (2) direct to consumer operations, including opening, relocating and remodeling locations and (3) information technology initiatives, including e-commerce capabilities.

Financing Activities:

In Fiscal 20202023 and Fiscal 2019,2022, financing activities used $36$161 million and $41$12 million of cash, respectively. DuringIn Fiscal 2020,2023, we repurchased $18$30 million of shares, including repurchased shares of our common stock pursuant to an open market stock repurchase program which was suspended on March 17, 2020. During Fiscal 2020 and Fiscal 2019, weequity awards in respect of employee tax withholding liabilities; paid $17$42 million of dividends; and $25paid $2 million in dividends, respectively. Bothdeferred financing costs associated with the amendment of the U.S. Revolving Credit Agreement. In Fiscal 2020 and Fiscal 2019 included certain amounts related to (1) the issuance2022, we repurchased $95 million of equityshares, including repurchased shares of our stock pursuant to our employeean open market stock purchase plan, (2) the repurchase program and of equity awards forin respect of employee tax withholding liabilities; paid

59

Table of Contents

withholding liabilities resulting from the vesting$35 million of equity awards during the perioddividends; and (3) the paymentpaid $2 million of contingent consideration or other deferred acquisitionfor the final contingent consideration payment related to the TBBC acquisition.

If net cash requirements are less than our net cash flows, we may repay amounts whichoutstanding on our U.S. Revolving Credit Agreement, if any, consistent with our net repayment of $90 million of long-term debt in Fiscal 2023. Alternatively, to the extent we are included in other financing activities.

Wea net debt position and our net cash requirements exceed our net cash flows, we may borrow or pay down debt depending on whetheramounts from our U.S. Revolving Credit Agreement consistent with our borrowing of $119 million in Fiscal 2022 to fund our investing and financing activities that exceeded cash flow from operations.

Liquidity and Capital Resources

We have a long history of generating sufficient cash flows from operations to satisfy our cash requirements for our ongoing capital expenditure needs as well as payment of dividends and repayment of our debt. Thus, we believe our anticipated future cash flows from operating activities exceedswill provide (1) sufficient cash over both the short and long term to satisfy our ongoing operating cash requirements, (2) ample funds to continue to invest in our lifestyle brands, the project to build a new distribution center in the Southeastern United States, direct to consumer initiatives and information technology projects, (3) additional cash flow to repay outstanding debt and (4) sufficient cash for other strategic initiatives.

Our capital needs depend on many factors including the results of our operations and cash flows, future growth rates, the need to finance inventory and the success of our various products. To the extent cash flow needs in the future exceed cash flow provided by our operations, we will have access, subject to its terms, to our U.S. Revolving Credit Agreement to provide funding for operating activities, capital expenditures dividend payments,and acquisitions, if any, and any other investing or financing activities. Generally,

Our cash and debt, as well as availability, levels in future periods will not be comparable to historical amounts, particularly after the completion of the acquisition of Johnny Was in Fiscal 2022. Further, we anticipate that excess cash,continue to assess, and may possibly make changes to, our capital structure, which we may achieve by borrowing from additional credit facilities, selling debt or equity securities or repurchasing additional shares of our stock in the future. Changes in our capital structure, if any, will depend on prevailing market conditions, our liquidity requirements, contractual restrictions and other factors. The amounts involved may be used to repay any debt on ourmaterial.

$325 Million U.S. Revolving Credit Agreement.Agreement

Liquidity and Capital Resources

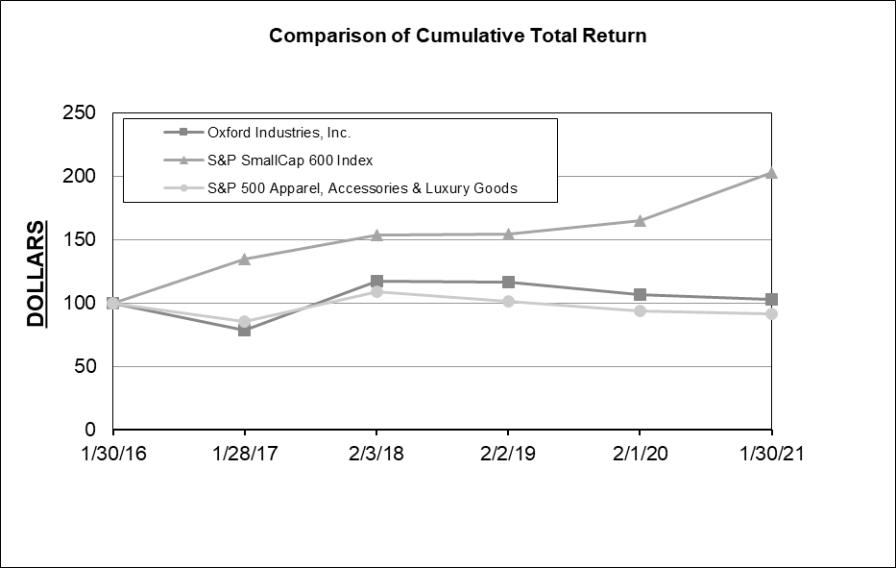
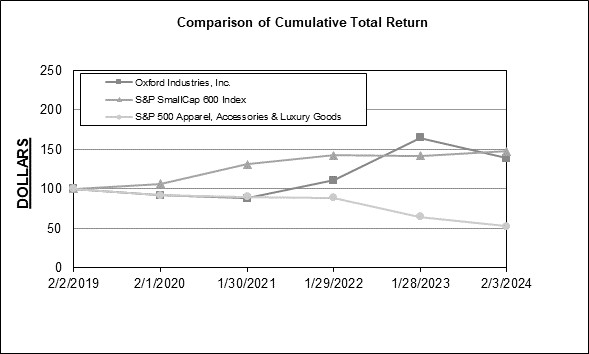
On March 6, 2023, we amended the U.S. Revolving Credit Agreement to, among other things, mature in March 2028. As of January 30, 2021,February 3, 2024, we had $66borrowings of $29 million, issued standby letters of cashcredit of $5 million, and cash equivalents on hand, with no borrowings outstandingavailability of $288 million under ourthe U.S. Revolving Credit Agreement. As of January 30, 2021, under ourThe U.S. Revolving Credit Agreement we had $301 million of unused availability, which includes substantially all ofamended and restated our cashFourth Amended and cash equivalents as eligible assets. We believe ourRestated Credit Agreement (the “Prior Credit Agreement”).

Pursuant to the U.S. Revolving Credit Agreement, and anticipated future positive cash flow from operating activities will provide sufficient cash flowthe interest rate applicable to satisfy our ongoing cash requirements as well as ample opportunityborrowings under the U.S. Revolving Credit Agreement is based on either the Term Secured Overnight Financing Rate plus an applicable margin of 135 to continue185 basis points or prime plus an applicable margin of 25 to invest in our brands, direct to consumer initiatives and other strategic initiatives in both the near term and long term.75 basis points.

The U.S. Revolving Credit Agreement generally (1) is limited to a borrowing base consisting of specified percentages of eligible categories of assets, (2) accrues variable-rate interest (weighted average interest rate of 7% as of February 3, 2024), unused line fees and letter of credit fees based upon average utilization or unused availability, or utilization,as applicable, (3) requires periodic interest payments with principal due at maturity (July 2024) and (4) is secured by a first priority security interest in substantially all of the assets of Oxford Industries, Inc. and its domestic subsidiaries, including accounts receivable, books and records, chattel paper, deposit accounts, equipment, certain general intangibles, inventory, investment property (including the equity interests of certain subsidiaries), negotiable collateral, life insurance policies, supporting obligations, commercial tort claims, cash and cash equivalents, eligible trademarks, proceeds and other personal property.

To the extent cash flow needs exceed cash flow provided by our operations we will have access, subject to its terms, to our U.S. Revolving Credit Agreement to provide funding for operating activities, capital expenditures and acquisitions, if any. Our U.S. Revolving Credit Agreement is also used to establish collateral for certain insurance programs and leases and to finance trade letters of credit for product purchases, which reduce the amounts available under our line of credit when issued. As of January 30, 2021, $3 million of letters of credit were outstanding under our U.S. Revolving Credit Agreement.

Covenants, Other Restrictions and Prepayment Penalties

The U.S. Revolving Credit Agreement is subject to a number ofseveral affirmative covenants regarding the delivery of financial information, compliance with law, maintenance of property, insurance requirements and conduct of business.

60

Table of Contents

Also, the U.S. Revolving Credit Agreement is subject to certain negative covenants or other restrictions including, among other things, limitations on our ability to (1) incur debt, (2) guaranty certain obligations, (3) incur liens, (4) pay dividends to shareholders, (5) repurchase shares of our common stock, (6) make investments, (7) sell assets or stock of subsidiaries, (8) acquire assets or businesses, (9) merge or consolidate with other companies or (10) prepay, retire, repurchase or redeem debt.

Additionally, the U.S. Revolving Credit Agreement contains a financial covenant that applies only if excess availability under the agreement for three consecutive business days is less than the greater of (i)(1) $23.5 million or (ii)(2) 10% of availability. In such a case, our fixed charge coverage ratio as defined in the U.S. Revolving Credit Agreement must not be less than 1.0 to 1.0 for the immediately preceding 12 fiscal months for which financial statements have been delivered. This financial covenant continues to apply until we have maintained excess availability under the U.S. Revolving Credit Agreement of more than the greater of (i)(1) $23.5 million or (ii)(2) 10% of availability for 30 consecutive days.

We believe that the affirmative covenants, negative covenants, financial covenants and other restrictions under the U.S. Revolving Credit Agreement are customary for those included in similar facilities entered into at the time we amended the U.S. Revolving Credit Agreement. During Fiscal 20202023 and as of January 30, 2021,February 3, 2024, no financial covenant

60

Table of Contents

testing was required pursuant to our U.S. Revolving Credit Agreement or the Prior Credit Agreement, as applicable, as the minimum availability threshold was met at all times. As of January 30, 2021,February 3, 2024, we were compliant with all applicable covenants related to the U.S. Revolving Credit Agreement.

Other Liquidity Items:Operating Lease Commitments:

In the ordinary course of business, we enter into long-term real estate lease agreements for our direct to consumer locations, which include both retail store and food and beverage locations, and office and warehouse/distribution space, as well as leases for certain equipment. Our real estate leases have varying terms and expirations and may have provisions to extend, renew or terminate the lease agreement at our discretion, among other provisions. Our real estate lease terms are typically for a period of 10 years or less and typically require monthly rent payments with specified rent escalations during the lease term. Our real estate leases usually provide for payments of our pro rata share of real estate taxes, insurance and other operating expenses applicable to the property, and certain of our leases require payment of sales taxes on rental payments. Also, our direct to consumer location leases often provide for contingent rent payments based on sales if certain sales thresholds are achieved. Base rent amounts specified in the leases are included in determining the operating lease liabilities included in our consolidated balance sheet, while amounts for real estate taxes, sales tax, insurance, other operating expenses and contingent rent applicable to the properties pursuant to the respective leases are not included in determining the operating lease liabilities included in our consolidated balance sheets.

These leases require us to make a substantial amount of cash payments on an annual basis.  Base rent amounts required to be paid in the future over the remaining lease terms under our existing leases as of February 3, 2024, totaled $368 million, including $79 million, $64 million, $58 million, $45 million and $39 million of required payments in each of the next five years. Additionally, amounts for real estate taxes, sales tax, insurance, other operating expenses and contingent rent applicable to the properties pursuant to the respective operating leases are required to be paid in the future, but the amounts payable in future periods are, in most cases, not quantified in the lease agreement or are dependent on factors which may not be known at this time. Such amounts incurred in Fiscal 2023 totaled $48 million.

Refer to Note 1 and Note 7 of our consolidated financial statements for additional disclosures about our operating lease agreements and related commitments.

Capital Expenditures:

We anticipate that we will be able to satisfy our ongoing cash requirements, which generally consist of working capital and other operating activity needs, capital expenditures interest payments onfor Fiscal 2024 to increase compared to the $74 million in Fiscal 2023. The planned increase is primarily due the commencement of a significant multi-year project at our debtnew Lyons, Georgia distribution center to modernize the operations into a more efficient e-commerce distribution center for our brands, increased investment in our various technology systems initiatives, increased Marlin Bar openings and dividends, if any, primarily from borrowings under our U.S. Revolving Credit Agreementincreases in store openings in Tommy Bahama, Lilly Pulitzer, Johnny Was, Southern Tide and positive cash flows from operations in the long term. Our need for working capital is typically seasonal with the greatest requirements generally in the fall and spring of each year.TBBC. Our capital needsexpenditure amounts in

61

Table of Contents

future years will dependfluctuate from the amounts incurred in prior years depending on many factors including the resultsinvestments we believe appropriate for that year to support future expansion of our operations and cash flows in the COVID-19 environment and beyond, future growth rates, the need to finance inventory levels and the success of our various products. We anticipate that at the maturity of the U.S. Revolving Credit Agreement or as otherwise deemed appropriate, we will be able to refinance the facility or obtain other financing on terms available in the market at that time. The terms of any future financing arrangements may not be as favorable as the terms of the current agreement or current market terms.businesses.

Dividends:

On March 23, 2021,25, 2024, our Board of Directors approved a cash dividend of $0.37$0.67 per share payable on April 30, 2021May 3, 2024 to shareholders of record as of the close of business on April 16, 2021. 19, 2024.

Although we have paid dividends in each quarter since we became a public company in July 1960, including $42 million in total, or $2.60 per common share, in Fiscal 2023, we may discontinue or modify dividend payments at any time if we determine that other uses of our capital, including payment of outstanding debt, funding of acquisitions, funding of capital expenditures or repurchases of outstanding shares, may be in our best interest; if our expectations of future cash flows and future cash needs outweigh the ability to pay a dividend; or if the terms of our credit facility, other debt instruments or applicable law limit our ability to pay dividends. We may borrow to fund dividends or repurchase shares in the short term subject to the terms and conditions of our credit facility, other debt instruments and applicable law. All cash flow from operations will not be paid out as dividends in all periods.dividends. For details about limitations on our ability to pay dividends, see the discussion of theour U.S. Revolving Credit Agreement above.above and in Note 6 of our consolidated financial statements contained in this report.

Contractual ObligationsShare Repurchases:

The following table summarizesAs disclosed in our contractual cash obligations,Quarterly Report on Form 10-Q for the Third Quarter of Fiscal 2021, and in subsequent filings, on December 7, 2021, our Board of Directors authorized us to spend up to $150 million to repurchase shares of our stock. This authorization superseded and replaced all previous authorizations to repurchase shares of our stock and has no automatic expiration. Pursuant to the Board of Directors’ authorization, we entered into a $20 million open market stock repurchase program (Rule 10b5-1 plan) in the First Quarter of Fiscal 2023 to acquire shares of our stock, under which we repurchased shares of our stock totaling: (1) $19 million in Second Quarter of Fiscal 2023 and (2) $1 million in the Third Quarter of Fiscal 2023, which completed the purchases pursuant to the open market stock repurchase program. Over the life of the $20 million open market repurchase program we repurchased 196,000 shares, or 1% of our outstanding shares at the commencement of the program for an average price of $102 per share.

After considering the repurchases during Fiscal 2023, as of January 30, 2021, by future period (in thousands):


Payments Due by Period


Less Than


More Than


1 year

13 Years

35 Years

5 Years

Total

Contractual Obligations:


U.S. Revolving Credit Agreement (1)

$

$

$

$

$

Operating leases (2)


70,338


122,208


78,545


68,247


339,338

Minimum royalty obligations pursuant to license agreements


4,162


4,162

Letters of credit


3,067


3,067

Other (3)(4)(5)


750


750

Total

$

78,317

$

122,208

$

78,545

$

68,247

$

347,317

(1)Principal, interest, unused line fees and letter of credit fees and amounts payable in future periods on our U.S. Revolving Credit Agreement have been excluded from the table above, as the principal amount that will be outstanding and interest rate during any fiscal year will be dependent upon future events which are not known at this time. During Fiscal 2020, we paid $2 million of interest, unused line fees and letter of credit fees.
(2)Amounts included reflect the rent amounts included in determining the operating lease liabilities. Amounts to be paid in future periods for real estate taxes, sales tax, insurance, other operating expenses and contingent rent applicable to the properties pursuant to the respective operating leases have been excluded from the table above, as the amounts payable in future periods are, in most cases, not quantified in the lease agreements or are dependent on factors which may not be known at this time. Such amounts incurred in Fiscal 2020 totaled $30 million. Refer to Note 6 in our consolidated financial statements for disclosures about our operating lease agreements.

61

TableFebruary 3, 2024, there were no amounts remaining under the open market repurchase program and $30 million remaining under the Board of ContentsDirectors’ authorization.

(3)Amounts totaling $16 million of deferred compensation obligations, which are included in other non-current liabilities in our consolidated balance sheet as of January 30, 2021, have been excluded from the table above, due to the uncertainty of the timing of the payment of these obligations, which are generally at the discretion of the individual employees or upon the death of the individual.
(4)Non-current deferred tax liability amounts included in our consolidated balance sheet as of January 30, 2021 and discussed in Note 9 to our consolidated financial statements included in this report have been excluded from the above table. Deferred income tax liabilities are calculated based on temporary differences between the tax basis and book basis of assets and liabilities, which will result in taxable amounts in future years when the amounts are settled at their reported financial statement amounts. As the results of these calculations do not have a direct connection with the amount of cash taxes to be paid in any future periods, scheduling deferred income tax amounts by period could be misleading.
(5)Includes an estimated amount for the Fiscal 2020 contingent consideration payment to be paid in Fiscal 2021 associated with the TBBC contingent consideration arrangement. Additional amounts totaling $1 million of contingent consideration amounts, which are included in other non-current liabilities in our consolidated balance sheet as of January 30, 2021, have been excluded from the table above, due to the uncertainty of the amount or timing of these potential obligations, which are dependent upon earnings of TBBC in Fiscal 2021.

Our anticipated capital expenditures for Fiscal 2021, which are excluded from the table above as we are generally not contractually obligated to pay these amounts as of January 30, 2021, are expected to be approximately $35 million in Fiscal 2021. Amounts actually spent in Fiscal 2021 will be impacted by a variety of factors including the impact of the COVID-19 pandemic. Our capital expenditure amounts in future years will fluctuate from the amounts incurred in prior years depending on the information technology initiatives, direct to consumer location openings, relocations and remodels and other infrastructure requirements deemed appropriate for that year to support future expansion of our businesses.

Off Balance Sheet ArrangementsOther Liquidity Items:

We have not entered into agreements which meet the SEC’s definition of an off balance sheet financing arrangement, other than operating leases, and have made no financial commitments to or guarantees with respect to any unconsolidated subsidiaries or special purpose entities.

CRITICAL ACCOUNTING POLICIES AND ESTIMATES

The discussion and analysis of our financial condition and results of operations are based upon our consolidated financial statements, which have been prepared in accordance with GAAP in a consistent manner. The preparation of these financial statements requires the selection and application of accounting policies. Further, the application of GAAP requires us to make estimates and judgments about future events that affect the reported amounts of assets, liabilities, revenues and expenses and related disclosures. On an ongoing basis, we evaluate our estimates, including those discussed below. We base our estimates on historical experience, current trends and various other assumptions and, in Fiscal 2020, the uncertain impact of COVID-19 and the Lanier Apparel exit, that we believe are reasonable under the circumstances, the results of which form the basis for making judgments about the carrying values of assets and liabilities that are not readily apparent from other sources.

Actual results may differ from these estimates under different assumptions or conditions. We believe it is possible that other professionals, applying reasonable judgment to the same set of facts and circumstances, could develop and support a range of alternative estimated amounts. We believe that we have appropriately applied our critical accounting

62

Table of Contents

policies. However, in the event that inappropriate assumptions or methods were used relating to the critical accounting policies, below, our consolidated statements of operations could be materially misstated.

A detailed summary of significant accounting policies is included in Note 1 toof our consolidated financial statements contained in this report. The following is a brief discussion of the more significant estimates, assumptions and judgments we use or the amounts most sensitive to change from outside factors.

62

Table of Contents

Revenue Recognition and Accounts Receivable

Our revenue consists of direct to consumer sales, including our retail store, e-commerce and restaurantfood and beverage operations, and wholesale sales, as well as royalty income, which is included in royalties and other income in our consolidated statements of operations. We recognize revenue when performance obligations under the terms of the contracts with our customers are satisfied. Our performance obligationssatisfied, which generally consist of deliveringoccurs when we deliver our products to our direct to consumer and wholesale customers. Control of the product is generally transferred upon providing the product to consumers in our bricks and mortar retail stores and restaurants, upon physical delivery of the products to consumers in our e-commerce operations and upon shipment from the distribution center to customers in our wholesale operations. Once control is transferred to the customer, we have completed our performance obligations related to the contract and have an unconditional right to consideration for the products sold, as outlined in the contract. Our receivables resulting from contracts with customers in our direct to consumer operations are generally collected within a few days, upon settlement of the credit card transaction. Our receivables resulting from contracts with our customers in our wholesale operations are generally due within one quarter, in accordance with established credit terms.

In the ordinary course of our wholesale operations, we offer discounts, allowances and cooperative advertising support to some of our wholesale customers for certain products. Wholesale sales are recorded net of such discounts, allowances, cooperative advertising support, operational chargebacks and provisions for estimated wholesale returns. As certain allowances, other deductions and returns are not finalized until the end of a season, program or other event which may not have occurred yet, we estimate such discounts, allowances and returns on an ongoing basis to estimate the consideration from the customer that we expect to ultimately receive. We only recognize revenue to the extent that it is probable that we will not have a significant reversal of revenue in a future period. Significant considerations in determining our estimates for discounts, allowances, operational chargebacks and returns for wholesale customers may include historical and current trends, agreements with customers, projected seasonal or program results, an evaluation of current economic conditions, specific program or product expectations and retailer performance. Actual discounts and allowances to our wholesale customers have not differed materially from our estimates in prior years. As of January 30, 2021, our total reserves for discounts, returns and allowances for our wholesale businesses were $6 million and, therefore, if the allowances changed by 10% it would have had a pre-tax impact of $1 million on earnings in Fiscal 2020. The substantial majority of these reserves as of January 30, 2021 relate to our Lanier Apparel business.

We extend credit to certain wholesale customers based on an evaluation of the customer’s financial capacity and condition, usually without requiring collateral. We recognize estimated provisions for credit losses based on our historical collection experience, the financial condition of our customers, an evaluation of current economic conditions and anticipated trends, each of which is subjective and requires certain assumptions. Actual charges for credit losses have not differed materially from our estimates in prior years. The amounts deemed uncollectible have not generally been significant in recent years prior to Fiscal 2020; in Fiscal 2020, we incurred a charge for provisions for credit losses of $4 million. If, in the future, amounts due from significant customer(s) were deemed to be uncollectible as a result of events that occur subsequent to January 30, 2021, this could result in a material charge to our consolidated statements of operations in future periods. As of January 30, 2021, our provision for credit losses was $3 million, and therefore, if the allowance for bad debts changed by 10% it would have had a pre-tax impact of less than $1 million on earnings in Fiscal 2020.

In our direct to consumer operations, which represented 80% of our consolidated net sales in Fiscal 2023, consumers have certain rights to return product within a specified period and are eligible for certain point of sale discounts, thus retail store, e-commerce and restaurant revenues are recorded net of estimated returns and discounts, as applicable.discounts. We make estimates of reserves for products which were sold prior to the balance sheet date but that we anticipate may be returned by the consumer subsequent to that date. The determination of direct to consumer return reserve amounts requires judgment and consideration of historical and current trends, evaluation of current economic trends and other factors. Our historical estimates of direct to consumer return reserves have not differed materially from actual results. As of January 30, 2021,February 3, 2024, our direct to consumer return reserve liability was $7 million.$13 million compared to $12 million as of January 28, 2023. A 10% change in the direct to consumer sales return reserve as of January 30, 2021February 3, 2024 would have had aan impact of less than $1 million impact on gross profit and pre-taxnet earnings in Fiscal 2020.2023.

63

TableIn the ordinary course of Contentsour wholesale operations, we offer discounts, allowances and cooperative advertising support to some of our wholesale accounts for certain products. As certain allowances, other deductions and returns are not finalized until the end of a season, program or other event which may not have occurred yet, we estimate such discounts, allowances and returns on an ongoing basis to estimate the consideration from the customer that we expect to ultimately receive. Significant considerations in determining our estimates for these amounts for wholesale customers may include historical and current trends, agreements with customers, projected seasonal or program results, an evaluation of current economic conditions, specific program or product expectations and retailer performance. As of February 3, 2024, our total reserves for discounts, returns and allowances for our wholesale businesses were $3 million compared to $4 million as of January 28, 2023. If these allowances changed by 10% it would have had an impact of less than $1 million on net earnings in Fiscal 2023.

We extend credit to certain wholesale customers based on an evaluation of the customer’s financial capacity and condition, usually without requiring collateral. We recognize estimated provisions for credit losses based on our historical collection experience, the financial condition of our customers, an evaluation of current economic conditions, anticipated trends, and the risk characteristics of the receivables, each of which is subjective and requires certain assumptions. As of both February 3, 2024 and January 28, 2023, our provision for credit losses for our wholesale receivables was $1 million. If the provision for credit losses changed by 10% it would have had an impact of less than $1 million on net earnings in Fiscal 2023.

Inventories, net

For operating group reporting, our inventory is carried at the lower of the first-in, first-out (FIFO)(“FIFO”) cost or market. We evaluate the composition of our inventories substantially all of which is finished goods inventory, for identification of distressed inventory at least quarterly. In performing this evaluation, we consider slow-turning products, an indication of lack of consumer acceptance of particular products, prior seasons’ fashion products, broken assortments, discontinued products and current levels of replenishment program products as compared to expected sales. We estimate the amount of goods that we will not be able to sell in the normal course of business and write down the value of these goods as necessary. As the amount to be ultimately realized for the goods is not necessarily known at period end, we must use certain assumptions considering historical experience, inventory quantity, quality, age and mix, historical sales trends, future sales projections, consumer and retailer preferences, market trends, general economic conditions and our anticipated plans to sell the inventory. Also, we provide an allowance for shrinkage, as appropriate, for the period between the last physical inventory count and each balance sheet date. Historically, our estimates

63

Table of inventory markdowns and inventory shrinkage have not varied significantly from actual results.Contents

For consolidated financial reporting, $116$146 million, or 94%92%, of our inventories were valued at the lower of the last-in, first-out (LIFO)(“LIFO”) cost or market after deducting the $62$83 million LIFO reserve as of January 30, 2021.February 3, 2024. The remaining $8$13 million of our inventories arewere valued at the lower of FIFO cost or market as of January 30, 2021.February 3, 2024. LIFO reserves are based on the Producer Price Index (PPI)(“PPI”) as published by the United States Department of Labor. We write down inventories valued at the lower of LIFO cost or market when LIFO cost exceeds market value. We deem LIFO accounting adjustments to not only include changes in the LIFO reserve, but also changes in markdown reserves which are considered in LIFO accounting. As our LIFO inventory pool does not correspond to our operating group definitions, LIFO inventory accounting adjustments are not allocated to the respective operating groups. Thus, the impact of accounting for inventories on the LIFO method is reflected in Corporate and Other for operating group reporting purposes.

As of January 30, 2021,February 3, 2024, we had recorded a reserve of $6$4 million related to inventory on the lower of FIFO cost or market method and for inventory on the lower of LIFO cost or market method with markdowns in excess of our LIFO reserve. A 10% change in the amount of such markdowns would have a pre-taxhad an impact of less than $1 million on net earnings in Fiscal 2020.2023. A change in the markdowns of our inventory valued at the lower of LIFO cost or market method that is not marked down in excess of our LIFO reserve typically would not be expected to have a material impact on our consolidated financial statements. A change in inventory levels, the mix of inventory by category or the mix by inventory category,PPI at the end of future fiscal years compared to inventory balancesamounts as of January 30, 2021February 3, 2024 could result in a material impact on our consolidated financial statements as such a change may erode portions of our earlier base year layers for purposes of making our annual LIFO computation. Additionally, a change in the PPI as published by the United States Department of Labor as compared to the indexes as of January 30, 2021 could result in a material impact on our consolidated financial statements as inflation or deflation would change the amount of our LIFO reserve.future.

Given the significant amount of uncertainty surrounding the year-end LIFO calculation, including the estimate of year-end inventory balances, the proportion of inventory in each inventory category and the year-end PPI, we have not typically do not adjustadjusted our LIFO reserve in the first three quarters of a fiscal year. ThisHowever, due to changes in the levels of inflation throughout Fiscal 2023, in addition to our Fourth Quarter adjustment at the end of Fiscal 2023, we also recognized an adjustment to the LIFO reserve in the Third Quarter of Fiscal 2023. Our policy of typically not adjusting the LIFO reserve at interim periods may result in significant LIFO accounting adjustments in the fourth quarterFourth Quarter of the fiscal year resulting from the year over year changes in inventory levels, the PPI and markdown reserves.year. We do recognize changes in markdown reserves during each of the first three quartersquarter of the fiscal year as those amounts can be estimated on an interim basis.

AccountingBusiness Combinations

From time-to-time, we make strategic acquisitions that may have a material effect on our consolidated results of operations and financial position. The measurement principle for the assets acquired and the liabilities assumed in a business combinations requires that assets and liabilities, including inventories, are recordedcombination is at estimated fair value atas of the acquisition date. In accordancedate, with GAAP, the definition of fair value of inventories acquired generally will equal the expected sales price less certain costs associated with selling the inventory, which may exceed the actual cost of producing the acquired inventories. Based on the inventory turn of the acquired inventories, amounts are recognized as additional cost of goods sold in the periods subsequentexceptions.

At acquisition, we use estimates that can be complex and require significant judgments to the acquisition as the acquired inventory is sold in the ordinary course of business. In determiningrecord the fair value of the acquired inventory, as well as the appropriate period to recognize the charge in our consolidated statements of operations as the acquired inventory is sold, we must make certain assumptions regarding costs incurred prior to acquisition for the acquired inventory, an appropriate profit allowance, estimates of the costs to sell the inventory and the timing of the sale of the acquired inventory. Such estimates

64

Table of Contents

involve significant uncertainty, and the use of different assumptions could have a material impact on our consolidated financial statements.

Goodwill and Intangible Assets, net

The cost of each acquired business is allocated to the individual tangible andpurchased intangible assets, acquired and liabilities assumed or incurred as a result of an acquisition based on their estimated fair values. The assessment of the estimated fair values of assets and liabilities acquired requires us to make certain assumptions regarding the use of the acquired assets, anticipated cash flows, probabilities of cash flows, discount rates and other factors. As a result of our prior acquisitions and any subsequent impairment charges, we had $156 million of intangible assets and $24 million of goodwill in our consolidated balance sheet as of January 30, 2021.

Our intangibles assetswhich primarily consist of trademarks, as well as customer relationships and reacquired rights and customer relationships. Goodwill is recognized as the amount by which the cost to acquire a company or group of assets exceeds the fair value of assets acquired less any liabilities assumed at acquisition. See Note 4 in our consolidated financial statements included in this report for further details about our various intangible assets and goodwill amounts.

rights. The fair values and useful lives of these acquired intangible assets and goodwill are estimated based on our assessment as well as independent third party appraisals in some cases. Such valuations, which are dependent upon a number of uncertain factors, may include a discounted cash flow analysis of anticipated revenues and expenses or cost savings resulting fromAdditionally, at acquisition we must determine whether the acquired intangible asset usinghas an estimate of a risk-adjusted, market-based cost of capitalindefinite or finite life and account for it accordingly. Refer to Note 5 for additional details about intangible assets.

Goodwill is recognized as the discount rate. The valuationamount by which the cost to acquire a business exceeds the fair value of identified tangible and intangible assets acquired, net of assumed liabilities. Thus, the amount of goodwill recognized in connection with a business combination depends on the fair values assigned to the individual assets acquired and liabilities assumed in a business combination. Goodwill is allocated to the respective reporting unit at the time of acquisition. Refer to “Note 5—Intangible Assets and Goodwill Intangible Assets and Goodwill” for additional information about our goodwill amounts.

At acquisition, assumptions and estimates about various items with significant uncertainty are required to determine the fair value of intangible assets and goodwill requiresgoodwill. When determining the fair value of intangible assets, including trademarks, customer relationships and other items, significant judgment due to the variety of uncertain factors, includingassumptions may include our planned use of the intangible assetsasset as well as estimates of net sales, royalty income, operating income, growth rates, royalty rates for the trademarks, a risk-adjusted, market basedmarket-based cost of capital asfor the discount rate andrates, income tax rates, anticipated cash flows and probabilities of cash flows, among other factors. Our fair value assessment may also consider any comparable market transactions. The use of different assumptions related to these uncertain factors at acquisition or a later date could result in a material change to the amounts of intangible assets and goodwill initially recorded at acquisition, which could result in a material impact on our consolidated financial statements.

Amortization64

Table of intangible assets with finite lives, which primarily consist of trademarks, reacquired rights and customer relationships, is recognized over their estimated useful lives using the straight lineContents

The acquisition method of amortization or another method of amortization that reflects the pattern inrequires us to record provisional amounts for any items for which the economic benefitsaccounting is not complete at the end of a reporting period. We must complete the intangible assets are consumed or otherwise realized. We amortizeaccounting during the measurement period, which cannot exceed one year. Adjustments made during the measurement period could have a material impact on our intangible assets with finite lives for periodsfinancial condition and results of up to 20 years. The determination of an appropriate useful life for amortization is based on the remaining contractual period, as applicable, andoperations. If our operating results, plans for the acquired business and/or macroeconomic conditions, anticipated results or other assumptions change after an acquisition, it could result in the impairment of the acquired intangible asset, as well as factors outsideassets or goodwill. Also, a change in macroeconomic conditions may not only impact the estimated operating cash flows used in our cash flow models but may also impact other assumptions used in our analysis, including but not limited to, the risk-adjusted market-based cost of our control.capital and/or discount rates.

Goodwill and Intangible assets with finite lives are reviewedAssets, net

We test goodwill for impairment periodically if events or changes in circumstances indicate thatat the carrying amount may not be recoverable. If expected future discounted cash flows from operations are less than their carrying amounts, an asset is determined to be impaired and a loss is recorded for the amount by which the carrying value of the asset exceeds its fair value. Amortization related to intangible assets with finite lives totaled $1 million during Fiscal 2020 and is anticipated to be $1 million in Fiscal 2021.

Trademarks with indefinite lives and goodwill are not amortized but instead evaluated, either qualitatively or quantitatively, for impairmentreporting unit level annually as ofon the first day of the fourth quarter and more often if an event occurs or circumstances change that indicate the fair value of a reporting unit is below its carrying amount. We have the option to first assess qualitative factors to determine whether it is more likely than not that goodwill is impaired to determine whether it is necessary to perform the quantitative impairment test. We also have the option to bypass the qualitative assessment entirely for any reporting unit in any period and proceed directly to performing the quantitative impairment test. For each impairment test of goodwill in Fiscal 2023, Fiscal 2022 and Fiscal 2021, we bypassed the qualitative test option and instead performed a quantitative test.

When applying the quantitative assessment, we determine the fair value of our fiscal yearreporting units based on an income approach, or in some cases a combination of an income approach and market approach. The income approach calculates a value based upon the present value of estimated future cash flows, while the market approach uses earnings multiples of similarly situated guideline public companies. Determining the fair value of a reporting unit involves judgment and the use of significant estimates and assumptions, which include assumptions regarding the revenue growth rates and operating margins used to calculate estimated future cash flows, risk-adjusted discount rates and future economic and market conditions. If an annual or interim analysis indicates an impairment of goodwill, the amount of the impairment is recognized in our consolidated financial statements based on the amount that the carrying value exceeds the estimated fair value of the reporting unit.

Intangible assets with indefinite lives, which primarily consist of trademarks, are not amortized but instead evaluated for impairment annually or more frequently if events or circumstances indicate that the intangible asset or goodwill might be impaired. The quantitative test includes valuations of each applicable underlying trademark or business using fair value techniques and market comparables, which may include a discounted cash flowThis analysis or an independent appraisal. The evaluation of the recoverability of trademarks with indefinite lives and goodwill includes valuations based on a discounted cash flow analysis which is typically similar to the analysis performed at acquisition and compares that amount to the carrying value. This valuation approach is dependent upon a number of uncertain factors including those useddescribed below and is typically performed in conjunction with the initial valuationgoodwill impairment analysis discussed above and is similar to the analysis performed at acquisition.

The fair value of our trademarks is principally determined by the “relief from royalty” approach that assumes the trademarks have value to the extent that their owner is relieved of the intangible assetsobligation to pay royalties for the benefits received from them. This method includes assumptions regarding revenue growth rates, royalty rates, risk-adjusted discount rates and goodwill listed above. Such estimates involve significant uncertainty, particularly in light of COVID-19,future economic and if our plansmarket conditions. If an annual or anticipated results change, the impact on our financial statements could be significant. If thisinterim analysis indicates an impairment of a trademarkan intangible asset with an indefinite useful life, or goodwill, the amount of the impairment is recognized in theour consolidated financial statements based on the amount that the carrying value of the intangible asset or goodwill exceeds the estimated fair value of the asset. If our plansasset for an intangible asset with an indefinite life or anticipated results change in the future, the impact on our financial statements could be significant.reporting unit for goodwill.

65

Table of Contents

IntangibleIndefinite-lived intangible assets and goodwill that have been recently acquired or impaired are typically much more sensitive to changes in recent transactions are naturally more susceptible to impairment, primarily since they areassumptions than other intangible asset and goodwill amounts as those amounts have recently been recorded at or adjusted to fair value based on operating plans and macroeconomic conditions present at the time of acquisition.value. Consequently, if operating results, plans for the acquired business and/or macroeconomic conditions change after an acquisition, it could result in the impairment of the acquired intangible assets or goodwill. A change in macroeconomic conditions may not only impact the estimated operating cash flows used in our cash flow models but may also impact other assumptions used in our analysis, including but not limited to, the risk-adjusted market-based cost of capital and/or discount rates. Additionally, we are required to ensure that assumptions used to determine fair value in our analyses are consistent with the assumptions a hypothetical market participant would use. Therefore, the cost of capital discount rates used in our analyses may increase or decrease based on market conditions and trends regardless of whether our actual cost of capital changed.

During Fiscal 2020, we recognized impairment charges for goodwill and intangible assets65

Table of Southern Tide of $60 million, resulting in the impairment of all goodwill for Southern Tide and the majority of the indefinite-lived intangible assets for Southern Tide. As noted above, theContents

The use of different assumptions related to the estimated fair value of the Southern Tide amounts could have resultedresult in the determination of a different fair value and a different impairment charge or charges in different periods. In Fiscal 2019For further discussion of the methods used and Fiscal 2018, nofactors considered in our estimates as part of the impairment testing for goodwill and intangible assets with indefinite lives see “Note 1—Business and Summary of Significant Accounting Policies.” See “Note 5—Intangible Assets and Goodwill Intangible Assets and Goodwill” for discussion of the impairment charges relatedrecognized in Fiscal 2023. The indefinite-lived trademarks and goodwill associated with Johnny Was that were impaired and adjusted to intangible assets or goodwill were recognized.

More recent acquisitions of goodwill and indefinite-lived intangible asset amounts that have been impaired recently, as they have been recorded at fair value typically are more sensitive to changes in assumptions than our other intangible asset and goodwill amounts. Thus, the $9 million of indefinite-lived intangible assets of Southern Tideduring Fiscal 2023 have the least excess of fair value over book value as of January 30, 2021, TheFebruary 3, 2024, since they are the most recently acquired and impaired. Thus, if the Johnny Was business does not achieve the anticipated growth and operating income in future years or if interest rates or tax rates increase, additional impairments of the Johnny Was intangible assets could be necessary in the future. No impairment charges related to intangible assets or goodwill were recognized in Fiscal 2022 and Fiscal 2021.

Intangible assets with finite lives primarily consist of customer relationships, certain trademarks and reacquired rights. These assets are amortized over their estimated fairuseful lives and reviewed for impairment periodically if events or changes in circumstances indicate that the carrying amount may not be recoverable. If the assets are determined to not be recoverable on an undiscounted cash flow basis and the expected future discounted cash flows of the asset group are less than the carrying amount, an asset group is impaired and a loss is recorded for the amount by which the carrying value of the indefinite-lived intangible assets of Tommy Bahama, Lilly Pulitzer and TBBC and the goodwill of Lilly Pulitzer and TBBC are each substantially higher than the net book value of the respective assets.asset group exceeds its fair value.

Other Fair Value Measurements

For many assets and liabilities, the determination of fair value may not require the use of many assumptions or other estimates. However, in some cases the assumptions or inputs associated with the determination of fair value as of a measurement date may require the use of many assumptions andwhich may be internally derived or otherwise unobservable. These assumptions may include the planned use of the assets, anticipated cash flows, probabilities of cash flows, discount rates and other factors. We use certain market-based and internally derived information and make assumptions about the information in (1) determining the fair values of assets and liabilities acquired as part of a business combination, (2) adjusting recognized assets and liabilities to fair value and (3) assessing recognized assets for impairment, including intangible assets, goodwill and property and equipment.

As noted above, the cost of each acquired business is allocated to the individual tangible and intangible assets acquired and liabilities assumed or incurred as a result of the acquisition based on its estimated fair value. The assessment of the estimated fair values of assets and liabilities acquired requires us to make certain assumptions regarding the use of the acquired assets, anticipated cash flows, probabilities of cash flows, discount rates and other factors. To the extent information to revise the allocation becomes available during the allocation period the allocation of the purchase price will be adjusted. Should information become available after the allocation period indicating that adjustments to the allocation are appropriate, those adjustments will be included in operating results.

For the determination of fair value for assets and liabilities acquired as part of a business combination, adjusting recognized assets and liabilities to fair value and assessing, and possibly adjusting, recognized assets for impairment, the assumptions, or the timing of changes in these assumptions, that we make regarding the valuation of these assets could differ significantly from the assumptions made by other parties. The use of different assumptions could result in materially different valuations for the respective assets and liabilities, which would impact our consolidated financial statements.

In connection with certain acquisitions, we have entered into contingent consideration arrangements to compensate the sellers if certain targets are achieved. For a contingent consideration arrangement as of the date of acquisition we must determine the fair value of the contingent consideration which would estimate the discounted fair value of any expected payments. Such valuation requires assumptions regarding anticipated cash flows, probabilities of

66

Table of Contents

cash flows, discount rates and other factors, each requiring a significant amount of judgment. Subsequent to the date of acquisition, we are required to periodically adjust the liability for the contingent consideration to reflect the fair value of the contingent consideration by reassessing any valuation assumptions as of the balance sheet date.non-current assets.

From time to time, we may recognize asset impairment or other charges related to certain leased spacelease assets, property and equipment or other amounts associated with us exiting retail ordirect to consumer locations, office space or otherwise. In these cases, we must determine the net lossimpairment charge related to the spaceasset group if the anticipatedassets are determined to not be recoverable on an undiscounted cash outflows forflow basis and the space exceedexpected future discounted cash flows of the estimated cash inflows related toasset group are less than the space.carrying amount. While estimated cash outflows are generally known sincecan be determined, in certain cases, if there is an underlying lease, the timing and amount of estimated cash inflows for any sublease rental income if any, and other costs are often very subjectiveuncertain, particularly if there is not a sub-lease agreement in place at that time since those amounts are dependent upon many factors including, but not limited to, whether a sub-tenant will be obtained and the time required to obtain the sub-tenant as well as the rent payments and any tenant allowances agreed with the sub-tenant as part of the future lease negotiations.place. Also, it is possible that we could subsequently negotiate a lease termination in the futureagreement that would differ from the amount of the required payments pursuant to the lease agreement.estimated amount. Thus, our estimate of aan impairment charge related to an operating lease asset or other lease obligationgroup could change significantly as we obtain better information in the future or if our current assumptions do not materialize. The assumptions made by another party related to such leases could be different than the assumptions made by us.periods.

Income Taxes

Income taxes included in our consolidated financial statements are determined using the asset and liability method. Under this method, in which income taxes are recognized based on amounts of income taxestax payable or refundable in the current year as well as the impact of any items that are recognized in different periods for consolidated financial statement reporting purposes and tax return reporting purposes. As certain amounts are recognizedSignificant judgment is required in different periods for consolidated financial statement and tax return reporting purposes, financial statement and tax bases of assets and liabilities differ, resulting in the recognition of deferred tax assets and liabilities. The deferred tax assets and liabilities reflect the estimated future tax effects attributable to these differences, as well as the impact of net operating loss, capital loss and federal and state credit carry-forwards, each as determined under enacted tax laws and rates expected to apply in the period in which such amounts are expected to be realized or settled.

We recognize deferred tax assets to the extent we believe it is more likely than not that these assets will be realized. In making such a determination, we consider all available positive and negative evidence, including future reversals of existing taxable temporary differences, projected future taxable income, taxable income in carryback years, tax-planning strategies, and results of recent operations. Valuation allowances are established when we determine that it is more-likely-than-not that some portion or all of a deferred tax asset will not be realized.

Valuation allowances, which total $6 million as of January 30, 2021, are analyzed periodically and adjusted as events occur or circumstances change that would indicate adjustments to the valuation allowances are appropriate. Valuation allowance amounts could have a material impact ondetermining our consolidated statements of operations in the future if assumptions related to realizability of the deferred tax assets changed significantly. Additionally, the timing of recognition of a valuation allowance or any reversal of a valuation allowance requires a significant amount of judgment to assess all the positive and negative evidence, particularly when operating results in the respective jurisdiction have changed or are expected to change from losses to income or from income to losses. As realization of deferred tax assets and liabilities is dependent upon future taxable income in specific jurisdictions, changes in tax laws and rates and shifts in the amount of taxable income among state and foreign jurisdictions may have a significant impact on the amount of benefit ultimately realized for deferred tax assets and liabilities.

As a global company, we are subject to income taxes in a number of domestic and foreign jurisdictions. Our income tax provision involvesas there are many uncertainties due to not onlytransactions and calculations where the timing differences of income for financial statement reportingultimate tax outcome is uncertain and tax return reporting, but also the application of complex tax laws and regulations which are often complex and subject to interpretation and judgment. These uncertainties relate to the recognition or changes to the realizability of deferred tax assets, loss carry-forwards, valuation allowances, uncertain tax positions and other matters. Our assessment of these income tax matters requires our consideration of taxable income and other items for historical periods, projected future taxable income, projected future reversals of existing timing differences, tax planning strategies and other information.

66

Table of Contents

The use of different assumptions or a change in our assumptions related to book tothe income tax timing differences, our determination of whether foreign investments or earnings are permanently reinvested, the ability to realize uncertain tax positions, the appropriateness of valuation allowances, transfer pricing practices, the impact of our tax planning strategies ormatters above, as well as a shift in earnings among jurisdictions, changes in tax laws, enacted rates or interpretations, court case decisions, statute of limitation expirations or audit settlements, each could have a significant impact on our income tax rate. Additionally, factors impacting

We are subject to income taxes including changes in the U.S. and certain other foreign jurisdictions and are periodically under audit by tax laws or interpretations, court

67

Tableauthorities.  The final determination of Contents

case decisions, statute of limitation expirations or audit settlements,tax audits could have a significantbe materially different from historical outcomes and may adversely impact on our income tax rate. A decreaseexpense and cash flows.  An increase in our consolidated income tax benefitexpense rate from 24.0%19.0% to 23.0%20.0% during Fiscal 20202023 would have reduced net earnings by $1 million.

Income tax expense recorded during interim periods is generally based on the expected tax rate for the year, considering projections of earnings and book to tax differences as of the balance sheet date. The tax rate ultimately realized for the year may increase or decrease due to actual operating results or book to tax differences varying from the amounts on which our interim calculations were based. Any changes in assumptions related to the need for a valuation allowance, the ability to realize an uncertain tax position, changes in enacted tax rates, the expected operating results in total or by jurisdiction for the year, or other assumptions are accounted for in the period in which the change occurs. As certain of our foreign operations are in a loss position and realization of a future benefit for the losses is uncertain, a variance in losses in such jurisdictions from our expectations can have an impact on our expected annual tax rate.

See Note 1 and Note 9 in11 of our consolidated financial statements included in this report for further discussion of income taxes.

RECENT ACCOUNTING PRONOUNCEMENTS

Refer to Note 1 inof our consolidated financial statements included in this report for a discussion of recent accounting pronouncements issued by the FASB that we have not yet adopted that may have a material effect on our financial position, results of operations or cash flows.flows in the future.

SEASONALITY

Each of our operating groups is impacted by seasonality as the demand by specific product or style, as well as by distribution channel, may vary significantly depending on the time of year. For information regarding the impact of seasonality on our business operations, see Part I, Item 1, Business, included in this report.

Item 7A.   Quantitative and Qualitative Disclosures About Market Risk

We are exposed to market risk in the ordinary course of business from changes in interest rates, commodity prices and foreign currency exchange rates. In recent years, we have not used financial instruments to mitigate our exposure to these risks, and we do not use financial instruments for trading or other speculative purposes. However, we could use financial instruments to mitigate our exposure to these risks in the future.

Interest Rate Risk

As of January 30, 2021, we had no borrowings outstanding underWe are exposed to market risk from changes in interest rates on our U.S. Revolving Credit Agreement and had $66 million of cash and cash equivalents, including $59 million of money market investments. However,when we did have any borrowings outstanding, at times during Fiscal 2020which could impact our financial condition and we may have borrowings outstanding from time to timeresults of operations in Fiscal 2021 due to our seasonal working capital needs or otherwise.

future periods. Our U.S. Revolving Credit Agreement providesaccrues interest based on variable interest rates while providing the necessary borrowing flexibility we require due to the seasonality of our business and our need to fund certain product purchases with trade letters of credit and accrues interest based on variable rate interest rates.credit. Additionally, for the amounts of unused credit under the U.S. Revolving Credit Agreement we pay unused line fees, which are based on a specified percentage of the unused line amounts. When

As of February 3, 2024, we have variable-ratehad $29 million of borrowings outstanding under our U.S. Revolving Credit Agreement, after borrowing amounts to fund the Johnny Was acquisition in Fiscal 2022. We do not consider that amount to necessarily be indicative of the average borrowings outstanding expected for Fiscal 2024 due to our expectation that we have exposurewill reduce debt levels during Fiscal 2024, particularly in the first quarter. Our expected cash flows from operations is expected to changesbe sufficient to fund our planned capital expenditures and dividends as well as allow for the repayment of a portion of our outstanding debt in Fiscal 2024. As of February 3, 2024, the weighted average interest rates as an increase in interest rates could increase our interest expense. Alternatively, when we have cash and cash equivalents on hand, we are exposed to market risk from changes in interest ratesrate on our cash and cash equivalents, including those invested in money market investments, as reduction in interest rates could reduce interest income.

During Fiscal 2020, our interest expenseborrowings was $2 million. Based7%, which includes borrowings pursuant to arrangements based on the average amountTerm Secured Overnight Financing Rate or the lender’s prime rate plus an applicable margin. Using the $29 million of variable-rate debt outstanding in Fiscal 2020,as of February 3, 2024 as an example, a 100 basis point increase in interest rates would not have materially increased ourincrease interest expense net. If our borrowings increase in the future, our interest expense andby less than $1 million.

Foreign Currency Risk

We have exposure to interestforeign currency exchange rate risk would also increase. Our interest rate riskchanges including the impact of the re-measurement of transaction amounts into the respective functional currency and certain mitigation efforts we may take are discussed in Interest Rate Risk in Note 1 to the consolidatedtranslation of our foreign subsidiary financial statements included in this report. We do not enter into debt agreements or interest rate hedging transactions onU.S. dollars. Also, although we purchase substantially all of our product purchases pursuant to a speculative basis.U.S. dollar

6867

Table of Contents

Foreign Currency Risk

As discussed in Foreign Currency in Note 1 to the consolidated financial statements in this report, we have certain exposure to foreign currency exchange rate changes. During Fiscal 2020, 97%denominated arrangement, future product costs could increase as a result of our net sales were sales in the United States, with the remaining net sales primarily relating to transactions in our Tommy Bahama Canada and Tommy Bahama Australia operations, where the underlying products were purchased in U.S. dollars. Additionally, future purchase prices for our products may be impacted by fluctuations in the exchange rate between the U.S. dollar and the local currencies of the contract manufacturers, which may have the effectour suppliers.

With 97% of increasing our cost of goods soldconsolidated net sales in the future even though our inventory is purchased on a U.S. dollar denominated arrangement.

As of January 30, 2021 and during Fiscal 2020, we were not a party to any foreign currency forward exchange contracts to mitigate our risk to changes in foreign currency fluctuations. However, we may enter into short-term forward foreign currency exchange contracts in the ordinary course of business from time to time in the future in order to mitigate a portion of the risk associated with foreign currency exchange rate fluctuations related to purchases of inventory or selling goods in currencies other than the functional currencies by certain of our foreign operations. At this time,United States, we do not anticipate that the impact of foreign currency changes on our internationalforeign operations would have a material impact on our consolidated net sales, operating income or our net earnings in the near term given the proportionterm. Our foreign currency exchange rate risk is discussed in Foreign Currency in Note 1 of our operations in international markets.

In addition to foreign currency risks related to specific transactions listed above, we also have foreign currency exposure risk associated with translating theconsolidated financial statements of our foreign operations with a functional currency other than the U.S. dollar into U.S. dollars for financial reporting purposes. We view our foreign investments as long term and we generally do not hedge such foreign investments. As of January 30, 2021, accumulated other comprehensive lossincluded in our consolidated balance sheets related to our Canada and Australia investments and operations were $3 million and $1 million, respectively.this report.

Commodity and Inflation Risk

We are affected by inflation and changing prices through the purchase of full-package finished goods from contract manufacturers,suppliers, who manufacture products consisting of various raw material components.components, including fabrics made of cotton, silk, linen, polyester, cellulosic fibers,  leather and other natural and man-made fibers, or blends of two or more of these materials. Inflation/deflation risks are managed by each operating group, when possible, through negotiating product prices in advance, selective price increases and cost containment initiatives. We have not historically entered into significant long-term sales or purchase contracts or engaged in hedging activities with respect to our commodity risks.

6968

Table of Contents

Item 8.   Financial Statements and Supplementary Data

OXFORD INDUSTRIES, INC.

CONSOLIDATED BALANCE SHEETS

($ in thousands, except par amounts)


January 30,


February 1,


February 3,


January 28,

2021

2020

2024

2023

ASSETS

Current Assets

Cash and cash equivalents

$

66,013

$

52,460

$

7,604

$

8,826

Receivables, net


30,418


57,862


63,362


43,986

Inventories, net


123,543


152,229


159,565


220,138

Income tax receivable

17,975

862

19,549

19,440

Prepaid expenses and other current assets


20,367


25,413


43,035


38,073

Total Current Assets

$

258,316

$

288,826

$

293,115

$

330,463

Property and equipment, net


159,732


191,517


195,137


177,584

Intangible assets, net


156,187


175,005


262,101


283,845

Goodwill


23,910


66,578


27,190


120,498

Operating lease assets

233,775

287,181

263,934

240,690

Other assets, net


33,714


24,262


32,188


32,209

Deferred income taxes

24,179

3,376

Total Assets

$

865,634

$

1,033,369

$

1,097,844

$

1,188,665

LIABILITIES AND SHAREHOLDERS’ EQUITY


Current Liabilities


Accounts payable

$

71,148

$

65,491

$

85,545

$

94,611

Accrued compensation


18,897


19,363


23,660


35,022

Current portion of operating lease liabilities


60,886


50,198


64,576


73,865

Accrued expenses and other liabilities


45,321


42,727


66,863


66,141

Total Current Liabilities

$

196,252

$

177,779

$

240,644

$

269,639

Long-term debt


29,304


119,011

Non-current portion of operating lease liabilities


239,963


291,886


243,703


220,709

Other non-current liabilities


23,691


18,566


23,279


20,055

Deferred income taxes


16,540


2,981

Shareholders’ Equity


Common stock, $1.00 par value per share


16,889


17,040


15,629


15,774

Additional paid-in capital


156,508


149,426


178,567


172,175

Retained earnings


235,995


366,793


369,453


370,145

Accumulated other comprehensive loss


(3,664)


(4,661)


(2,735)


(1,824)

Total Shareholders’ Equity

$

405,728

$

528,598

$

560,914

$

556,270

Total Liabilities and Shareholders’ Equity

$

865,634

$

1,033,369

$

1,097,844

$

1,188,665

See accompanying notes.

7069

Table of Contents

OXFORD INDUSTRIES, INC.

CONSOLIDATED STATEMENTS OF OPERATIONS

($ and shares in thousands, except per share amounts)

Fiscal


Fiscal


Fiscal

Fiscal


Fiscal


Fiscal

2020

2019

2018

2023

2022

2021

Net sales

$

748,833

$

1,122,790

$

1,107,466

$

1,571,475

$

1,411,528

$

1,142,079

Cost of goods sold


333,626


477,823


470,342


575,890


522,673


435,861

Gross profit

$

415,207

$

644,967

$

637,124

$

995,585

$

888,855

$

706,218

SG&A


492,628


566,149


560,508


820,705


692,004


573,636

Impairment of goodwill and intangible assets

60,452

Impairment of goodwill, intangible assets and equity method investments

113,611

Royalties and other operating income


14,024


14,857


13,976


19,713


21,923


32,921

Operating (loss) income

$

(123,849)

$

93,675

$

90,592

Operating income

$

80,982

$

218,774

$

165,503

Interest expense, net


2,028


1,245


2,283


6,036


3,049


944

(Loss) earnings before income taxes

$

(125,877)

$

92,430

$

88,309

Income tax (benefit) provision


(30,185)


23,937


22,018

Net (loss) earnings

$

(95,692)

$

68,493

$

66,291

Earnings before income taxes

$

74,946

$

215,725

$

164,559

Income tax expense


14,243


49,990


33,238

Net earnings

$

60,703

$

165,735

$

131,321

Net (loss) earnings per share:


Net earnings per share:


Basic

$

(5.77)

$

4.09

$

3.97

$

3.89

$

10.42

$

7.90

Diluted

$

(5.77)

$

4.05

$

3.94

$

3.82

$

10.19

$

7.78

Weighted average shares outstanding:


Basic


16,576


16,756


16,678


15,590


15,902


16,631

Diluted


16,576


16,914


16,842


15,906


16,259


16,869

Dividends declared per share

$

1.00

$

1.48

$

1.36

$

2.60

$

2.20

$

1.63

See accompanying notes.

7170

Table of Contents

OXFORD INDUSTRIES, INC.

CONSOLIDATED STATEMENTS OF COMPREHENSIVE INCOME

($ in thousands)

Fiscal


Fiscal


Fiscal

Fiscal


Fiscal


Fiscal

2020

2019

2018

2023

2022

2021

Net (loss) earnings

$

(95,692)

$

68,493

$

66,291

Net earnings

$

60,703

$

165,735

$

131,321

Other comprehensive income (loss), net of taxes:


Net foreign currency translation adjustment


997


434


(1,021)


(911)


1,648


192

Comprehensive (loss) income

$

(94,695)

$

68,927

$

65,270

Comprehensive income

$

59,792

$

167,383

$

131,513

See accompanying notes.

7271

Table of Contents

OXFORD INDUSTRIES, INC.

CONSOLIDATED STATEMENTS OF SHAREHOLDERS’ EQUITY

($ in thousands)


Accumulated


Accumulated


Additional

Other

Additional

Other

Common

Paid-In

Retained

Comprehensive

Common

Paid-In

Retained

Comprehensive

Stock

Capital

Earnings

(Loss) Income

Total

Stock

Capital

Earnings

(Loss) Income

Total

February 3, 2018

$

16,839

$

136,664

$

280,395

$

(4,074)

$

429,824

January 30, 2021

$

16,889

$

156,508

$

235,995

$

(3,664)

$

405,728

Net earnings and other comprehensive income


66,291


(1,021)


65,270


131,321


192


131,513

Shares issued under equity plans


150


1,306


1,456


41


1,411


1,452

Compensation expense for equity awards


7,327


7,327


8,186


8,186

Repurchase of shares


(30)


(2,321)


(2,351)


(125)


(2,949)


(8,268)


(11,342)

Cash dividends declared and paid

(23,054)

(23,054)


(27,873)


(27,873)

Cumulative effect of change in accounting standard


(117)


(117)

February 2, 2019

$

16,959

$

142,976

$

323,515

$

(5,095)

$

478,355

Net earnings and other comprehensive income


68,493


434


68,927

Shares issued under equity plans


116


1,523


1,639

Compensation expense for equity awards


7,620


7,620

Repurchase of shares


(35)


(2,693)


(2,728)

Cash dividends declared and paid


(25,215)


(25,215)

Cumulative effect of change in accounting standard


February 1, 2020

$

17,040

$

149,426

$

366,793

$

(4,661)

$

528,598

January 29, 2022

$

16,805

$

163,156

$

331,175

$

(3,472)

$

507,664

Net earnings and other comprehensive income (loss)


(95,692)


997


(94,695)


165,735


1,648


167,383

Shares issued under equity plans


227


1,151


1,378


26


1,573


1,599

Compensation expense for equity awards


7,755


7,755


10,577


10,577

Repurchase of shares


(378)


(1,824)


(17,721)


(19,923)


(1,057)


(3,131)


(90,651)


(94,839)

Cash dividends declared and paid


(16,886)


(16,886)


(36,114)


(36,114)

Cumulative effect of change in accounting standard


(499)


(499)

January 30, 2021

$

16,889

$

156,508

$

235,995

$

(3,664)

$

405,728

January 28, 2023

$

15,774

$

172,175

$

370,145

$

(1,824)

$

556,270

Net earnings and other comprehensive income (loss)


60,703


(911)


59,792

Shares issued under equity plans


144


1,767


1,911

Compensation expense for equity awards


14,473


14,473

Repurchase of shares


(289)


(9,848)


(19,856)


(29,993)

Cash dividends declared and paid


(41,539)


(41,539)

February 3, 2024

$

15,629

$

178,567

$

369,453

$

(2,735)

$

560,914

See accompanying notes.

7372

Table of Contents

OXFORD INDUSTRIES, INC.

CONSOLIDATED STATEMENTS OF CASH FLOWS

($ in thousands)

Fiscal


Fiscal


Fiscal

2020


2019


2018

Cash Flows From Operating Activities:


Net (loss) earnings

$

(95,692)

$

68,493

$

66,291

Adjustments to reconcile net earnings (loss) to cash flows from operating activities:


Depreciation


38,975


38,026


38,560

Amortization of intangible assets


1,111


1,171


2,610

Impairment of goodwill and intangible assets

60,452

Impairment of property and equipment

19,828

1,090

1,320

Equity compensation expense


7,755


7,620


7,327

Amortization of deferred financing costs


344


384


424

Change in fair value of contingent consideration


593


431


970

Deferred income taxes (benefit) expense


(18,332)


(1,973)


2,927

Changes in operating assets and liabilities, net of acquisitions and dispositions:


Receivables, net


28,429


10,252


(6,018)

Inventories, net


29,355


8,187


(36,518)

Income tax receivable

(17,113)

19

4,458

Prepaid expenses and other current assets


5,064


606


5,848

Current liabilities


17,611


(14,282)


5,081

Other non-current assets, net

53,819

(283,335)

2,286

Other non-current liabilities

(48,349)

285,237

811

Cash provided by operating activities

$

83,850

$

121,926

$

96,377

Cash Flows From Investing Activities:


Purchases of property and equipment


(28,924)


(37,421)


(37,043)

Other investing activities


(5,727)


(354)

Cash used in investing activities

$

(34,651)

$

(37,421)

$

(37,397)

Cash Flows From Financing Activities:


Repayment of revolving credit arrangements


(280,963)


(122,241)


(290,526)

Proceeds from revolving credit arrangements


280,963


109,248


257,710

Deferred financing costs paid

(952)

Repurchase of common stock

(18,053)

Proceeds from issuance of common stock


1,378


1,639


1,456

Repurchase of equity awards for employee tax withholding liabilities


(1,870)


(2,728)


(2,351)

Cash dividends declared and paid


(16,844)


(25,215)


(23,054)

Other financing activities


(459)


(1,049)


Cash used in financing activities

$

(35,848)

$

(41,298)

$

(56,765)

Net change in cash and cash equivalents

$

13,351

$

43,207

$

2,215

Effect of foreign currency translation on cash and cash equivalents


202


926


(231)

Cash and cash equivalents at the beginning of year


52,460


8,327


6,343

Cash and cash equivalents at the end of year

$

66,013

$

52,460

$

8,327

Fiscal


Fiscal


Fiscal

2023


2022


2021

Cash Flows From Operating Activities:


Net earnings

$

60,703

$

165,735

$

131,321

Adjustments to reconcile net earnings to cash flows from operating activities:


Depreciation


49,323


41,503


39,062

Amortization of intangible assets


14,743


6,102


880

Impairment of goodwill, intangible assets and equity method investments

113,611

Impairment of property and equipment

584

1,430

1,656

Equity compensation expense


14,473


10,577


8,186

Gain on sale of investment in unconsolidated entity

(11,586)

Gain on sale of property and equipment

(1,756)

(600)

(2,669)

Amortization and write-off of deferred financing costs


569


344


344

Change in fair value of contingent consideration


1,188

Deferred income taxes


(23,890)


(1,867)


4,054

Changes in operating assets and liabilities, net of acquisitions and dispositions:


Receivables, net


(14,994)


(1,966)


(15)

Inventories, net


62,507


(78,966)


5,378

Income tax receivable

(109)

288

(1,753)

Prepaid expenses and other current assets


(4,931)


(12,793)


(889)

Current liabilities


(28,069)


8,635


27,585

Other non-current assets, net

(25,220)

14,233

37,534

Other non-current liabilities

26,740

(27,045)

(42,270)

Cash provided by operating activities

$

244,284

$

125,610

$

198,006

Cash Flows From Investing Activities:


Acquisitions, net of cash acquired


(11,975)


(263,648)


Purchases of property and equipment


(74,098)


(46,668)


(31,894)

Purchases of short-term investments

(70,000)

(165,000)

Proceeds from short-term investments

234,852

Proceeds from the sale of property, plant and equipment

2,125

14,586

Other investing activities


(33)


(6,283)


736

Cash used in investing activities

$

(83,981)

$

(151,747)

$

(181,572)

Cash Flows From Financing Activities:


Repayment of revolving credit arrangements


(477,350)


(145,894)


Proceeds from revolving credit arrangements


387,643


264,905


Deferred financing costs paid

(1,661)

Repurchase of common stock

(20,045)

(91,674)

(8,359)

Proceeds from issuance of common stock


1,911


1,599


1,452

Repurchase of equity awards for employee tax withholding liabilities


(9,941)


(3,166)


(2,983)

Cash dividends paid


(41,729)


(35,287)


(27,536)

Other financing activities


(2,010)


(749)

Cash used in financing activities

$

(161,172)

$

(11,527)

$

(38,175)

Net change in cash and cash equivalents

$

(869)

$

(37,664)

$

(21,741)

Effect of foreign currency translation on cash and cash equivalents


(353)


1,631


587

Cash and cash equivalents at the beginning of year


8,826


44,859


66,013

Cash and cash equivalents at the end of period

$

7,604

$

8,826

$

44,859

See accompanying notes.

7473

Table of Contents

OXFORD INDUSTRIES, INC.

NOTES TO CONSOLIDATED FINANCIAL STATEMENTS

January 30, 2021February 3, 2024

Note 1. Business and Summary of Significant Accounting Policies

Description of Business

We are a leading branded apparel company that designs, sources, markets and distributes products bearing the trademarks of our Tommy Bahama®, Lilly Pulitzer®, Johnny Was®, Southern Tide®, The Beaufort Bonnet Company®, Duck Head® and Southern Tide®Jack Rogers® lifestyle brands and other owned and licensed brands. We distribute our lifestyle branded products through our direct to consumer channel,channels, consisting of our brand specific full-price retail stores, e-commerce websites and e-commerce sites,outlet stores, and our wholesale distribution channel, which includes sales to various specialty stores, Signature Stores, better department stores, specialty stores, multi-branded e-commerce retailers, off-price retailerswebsites and other retailers. Additionally, we operate Tommy Bahama food and beverage locations, including Marlin Bars and full-service restaurants, generally adjacent to a Tommy Bahama full-price retail store location.store.

InOn September 19, 2022, we acquired the Johnny Was lifestyle apparel brand and its related assets and operations, which is discussed in further detail in Note 4. Also, in Fiscal 2020,2021, we made the decision to exitexited our Lanier Apparel business, which is expectedas discussed in Note 12. Additionally, refer to be completed duringNote 2 for certain financial information about the second half of Fiscal 2021. This decision is in line with our stated business strategy of developingJohnny Was and marketing compelling lifestyle brands and takes into consideration the increased challenges faced by the Lanier Apparel business, which has primarily sold tailored clothing products, many of which were magnified by the COVID-19 pandemic.operating groups.

COVID-19 PandemicRecent Macroeconomic Conditions

The COVID-19 pandemic had a significant effect on overall economic conditions consumer traffic, tourism, consumer spending on discretionary items and our operations resulting in disruptionrecent years and a significant negative impact on our financial statementsaccelerated or exacerbated many of the challenges in Fiscal 2020. While our mission remains the enhancement of long-term shareholder value, our focus during this crisis has been (1)industry. Exceptionally strong consumer demand, along with the health and well-being of our employees, customers and communities, (2) protecting the reputation, value and imagestrength of our brands, resulted in record earnings for us during both Fiscal 2021 and (3) preserving liquidity,Fiscal 2022. The strong earnings in recent periods are despite certain challenges in the retail apparel market, including numerous initiativeslabor shortages, supply chain disruptions and product and operating cost increases in Fiscal 2021 and Fiscal 2022. We, as well as others in our industry, have increased prices to manage and reduce our inventory purchases, ongoing operating expenses, capital expenditures and other cash requirements.attempt to offset inflationary pressures.

Due to the COVID-19 pandemic, we temporarily closed all our North America retail and restaurant locations in March 2020 and began reopening our stores and restaurants in a phased approach in May 2020. Certain stores and restaurants were required to close again for certain periods after reopening, or operate pursuant to other mandated limitations, after local jurisdictions reinstated some closure requirements. There can be no assurance that additional closures will not occur as a result of any resurgence of COVID-19 cases and/or additional government mandates or recommendations. The COVID-19 pandemic is expected to continue toFurther, negative economic conditions often have a material adverselonger and more severe impact on our business, financial condition, resultsthe apparel industry than on other industries due, in part, to apparel purchases often being more of operationsa discretionary purchase. The current macroenvironment, with heightened concerns about inflation, a global economic recession, geopolitical issues, the stability of the U.S. banking system, the availability and cash flows in the near-term due to decreased consumer traffic in storescost of credit and restaurants; uncertainty as to the continued strength ofelevated interest rates for prolonged periods, is creating a complex and challenging retail environment, which impacted our brands’ e-commerce businesses during the pendency of the pandemic; overall changes in consumer confidenceFiscal 2023 and consumer spending habits; reduced demand fromcontinues to affect our wholesale customers, several of which filed for bankruptcy or are undergoing restructurings and closures; any potential disruptions to our supply chain; and a slowdown in the U.S. and global economies.

During Fiscal 2020, we incurred certain charges related to adjustments to the carrying value of goodwill, intangible assets, long-lived assets, inventories and receivables, each as discussed in these notes. We could experience other potential adverse impacts in the future asoperations. As a result of the COVID-19 pandemic, including additional charges relatedmacroeconomic environment, we saw reduced conversion rates in our direct to these assets or other items ifconsumer operations and a year-over-year decline in net earnings and operating income. There remains significant uncertainty in the duration or severity ofmacroeconomic environment, and the COVID-19 pandemic is worse than our current expectations.

For many reasons, including those identified above, the full magnitude of the COVID-19 pandemic continues to be difficult to predict at this time, and its ultimate duration and severity will depend on future developments. Additionally, consumer shopping and spending preferences and behavior likely have been changed permanently as a result of COVID-19; however, the ultimate impact of those changes is uncertain.these and other factors could have a major effect on our businesses.

75

Table of Contents

OXFORD INDUSTRIES, INC.

NOTES TO CONSOLIDATED FINANCIAL STATEMENTS (Continued)

Fiscal Year

We operate and report on a 52/53-week fiscal year. Our fiscal year ends on the Saturday closest to January 31 and is designated by the calendar year in which the fiscal year commences. As used in our consolidated financial statements, the terms Fiscal 2018,2021, Fiscal 2019,2022, Fiscal 20202023 and Fiscal 20212024 reflect the 52 weeks ended February 2, 2019; 52 weeks ended February 1, 2020;January 29, 2022; 52 weeks ended January 30, 202128, 2023; 53 weeks ended February 3, 2024; and 52 weeks ending January 29, 2022,February 1, 2025, respectively.

Principles of Consolidation

Our consolidated financial statements include the accounts of Oxford Industries, Inc. and any other entities in which we have a controlling financial interest, including our wholly-owned domestic and foreign subsidiaries, or variable interest entities for which we are the primary beneficiary, if any. Generally, we consolidate businesses in which we have a controlling financial interest which may be evidenced through ownership of a majority voting interest or other rights which might indicate that we are the primary beneficiary of the entity. The primary beneficiary has both the power to direct the activities of the entity that most significantly impact the entity’s economic performance and the obligation to absorb

74

Table of Contents

OXFORD INDUSTRIES, INC.

NOTES TO CONSOLIDATED FINANCIAL STATEMENTS (Continued)

losses or the right to receive benefits from the entity that could potentially be significant to the entity. All significant intercompany accounts and transactions are eliminated in consolidation.

Business Combinations

From time-to-time, we make strategic acquisitions that may have a material effect on our consolidated results of operations and financial position. The measurement principle for the assets acquired and the liabilities assumed in a business combination is at estimated fair value as of the acquisition date, with certain exceptions.

At acquisition, we use estimates that can be complex and require significant judgments to record the fair value of purchased intangible assets, which primarily consist of trademarks, as well as customer relationships and reacquired rights. The fair values and useful lives of these intangible assets are estimated based on our assessment as well as independent third party appraisals in some cases. The cost of each acquired business is allocated to the individual tangible and intangible assets acquired and liabilities assumed or incurred as a result of an acquisition based on their estimated fair values. The assessmentvalues pursuant to the acquisition method of accounting. Additionally, at acquisition we must determine whether the estimatedintangible asset has an indefinite or finite life and account for it accordingly.

Goodwill is recognized as the amount by which the cost to acquire a business exceeds the fair value of identified tangible and intangible assets acquired, net of assumed liabilities. Thus, the amount of goodwill recognized in connection with a business combination depends on the fair values assigned to the individual assets acquired and liabilities assumed in a business combination. Goodwill is allocated to the respective reporting unit at the time of acquisition. As of February 3, 2024, substantially all goodwill included in our consolidated balance sheet is deductible for income tax purposes.

At acquisition, as well as any subsequent impairment tests, assumptions and estimates about various items with significant uncertainty are required to determine the fair value of intangible assets and liabilities acquired requires us to make certaingoodwill. When determining the fair value of intangible assets, including trademarks, customer relationships and other items, significant assumptions regarding themay include our planned use of the acquired assets,asset as well as estimates of net sales, royalty income, operating income, growth rates, royalty rates for the trademarks, a risk-adjusted, market-based cost of capital for the discount rates, income tax rates, anticipated cash flows and probabilities of cash flows, discount ratesamong other factors. Our fair value assessment may also consider any comparable market transactions. The use of different assumptions related to these uncertain factors at acquisition could result in a material change to the amounts of intangible assets and other factors.goodwill initially recorded at acquisition, which could result in a material impact on our consolidated financial statements. Additionally, the definition of fair value of inventories acquired as part of a business combination generally will equal the expected sales price less certain costs associated with selling the inventory, which may exceed the actual cost of the acquired inventories, resulting in an inventory step-up to fair value at acquisition, which would be recognized in our consolidated statements of operations as the acquired inventory is sold. The

Our estimates of the purchase price allocation of a business combination may be revised during an allocationa measurement period as necessary when, and if, information becomes available to revise the fair values of the assets acquired and the liabilities assumed. Actual fair values ultimately assigned to the acquired assets and liabilities when final information is available may materially differ from our preliminary estimates during the measurement period. The allocation period willmay not exceed one year from the date of the acquisition. Should information become available after the allocation period indicating that an adjustment to the purchase price allocation is appropriate, that adjustment will be included in our consolidated statements of operations. The results of operations of acquired businesses are included in our consolidated statements of operations from the respective dates of the acquisitions. Transaction costs related to business combinations are included in SG&A in our consolidated statements of operations as incurred.

Refer to Note 4 for information related to the Fiscal 2022 acquisition of Johnny Was and the Fiscal 2023 acquisitions, including disclosures about the allocation of the preliminary purchase price to the estimated fair values of the acquired assets and liabilities.

75

Table of Contents

OXFORD INDUSTRIES, INC.

NOTES TO CONSOLIDATED FINANCIAL STATEMENTS (Continued)

Revenue Recognition and Receivables

Our revenue consists of direct to consumer sales, including our retail store, e-commerce and food and beverage operations, and wholesale sales, as well as royalty income, which is included in royalties and other income in our consolidated statements of operations. Revenue is recognized at an amount that reflects the consideration expected to be received for those goods and services pursuant to a five-step approach: (1) identify the contracts with the customer; (2) identify the separate performance obligations in the contracts; (3) determine the transaction price; (4) allocate the transaction price to separate performance obligations; and (5) recognize revenue when, or as, each performance obligation is satisfied.

Our revenue consists of direct to consumer sales, including our retail store, e-commerce and restaurant operations, and wholesale sales, as well as royalty income, which is included in royalties and other income in our

76

Table of Contents

OXFORD INDUSTRIES, INC.

NOTES TO CONSOLIDATED FINANCIAL STATEMENTS (Continued)

consolidated statements of operations. The table below quantifies the amount of net sales by distribution channel (in thousands) for each period presented.


Fiscal


Fiscal


Fiscal


Fiscal


Fiscal


Fiscal

2020


2019


2018

2023


2022


2021

Retail

$

202,071

$

440,803

$

439,556

$

605,486

$

552,696

$

443,015

E-commerce


323,900


262,283


239,034


538,224


465,446


369,300

Restaurant


48,428


83,836


84,530

Food & Beverage


115,766


109,225


96,244

Wholesale


173,209


333,986


341,615


311,910


281,938


231,536

Other


1,225


1,882


2,731


89


2,223


1,984

Net sales

$

748,833

$

1,122,790

$

1,107,466

$

1,571,475

$

1,411,528

$

1,142,079

We recognize revenue when performance obligations under the terms of the contracts with our customers are satisfied. Our performance obligationssatisfied, which generally consist of deliveringoccurs when we deliver our products to our direct to consumer and wholesale customers. Control of the product is generally transferred upon providing the product to consumers in our bricks and mortar retail stores and restaurants,food and beverage locations, upon physical delivery of the products to consumers in our e-commerce operations and upon shipment from our distribution center to customers in our wholesale operations. Once control is transferred to the customer, we have completed our performance obligations related to the contract and have an unconditional right to consideration for the products sold as outlined in the contract. Our receivables resulting from contracts with customers in our direct to consumer operations are generally collected within a few days, upon settlement of the credit card transaction, while our receivables resulting from contracts with our customers in our wholesale operations are generally due within one quarter, in accordance with established credit terms. All of our performance obligations under the terms of our contracts with customers in our direct to consumer and wholesale operations have an expected original duration of one year or less. We only recognize revenue to the extent that it is probable that we will not have a significant reversal of revenue in a future period. Our revenue, including any freight income, is recognized net of applicable taxes in our consolidated statements of operations.

In our direct to consumer operations, consumers have certain rights to return product within a specified period and are eligible for certain point of sale discounts; thus retail store, e-commerce and restaurantfood and beverage revenues are recorded net of estimated returns and discounts, as applicable. The sales return allowance is based on historical direct to consumer return rates and current trends and is recognized on a gross basis as a return liability for the amount of sales estimated to be returned and a return asset for the right to recover the product estimated to be returned by the customer. The value of inventory associated with a right to recover the goods returned in our direct to consumer operations areis included in prepaid expenses and other current assets in our consolidated balance sheets. The changes in the return liability are recognized in net sales and the changes in the return asset are recognized in cost of goods sold in our consolidated statements of operations. An estimated sales return liability of $13 million and $12 million for expected direct to consumer returns is classified in accrued expenses and other liabilities in our consolidated balance sheet as of February 3, 2024 and January 28, 2023, respectively.

In the ordinary course of our wholesale operations, we offer discounts, allowances and cooperative advertising support to some of our wholesale customers for certain products. Some of these arrangements are written agreements, while others may be implied by customary practices or expectations in the industry. As certain allowances, other deductions and returns are not finalized until the end of a season, program or other event which may not have occurred

76

Table of Contents

OXFORD INDUSTRIES, INC.

NOTES TO CONSOLIDATED FINANCIAL STATEMENTS (Continued)

yet, we estimate such discounts, allowances and returns on an ongoing basis to estimate the consideration from the customer that we expect to ultimately receive. We only recognize revenue to the extent that it is probable that we will not have a significant reversal of revenue in a future period. Significant considerations in determining our estimates for discounts, allowances, operational chargebacks and returns for wholesale customers may include historical and current trends, agreements with customers, projected seasonal or program results, an evaluation of current economic conditions, specific program or product expectations and retailer performance. We record the discounts, returns, allowances and operational chargebacks as a reduction to net sales in our consolidated statements of operations and as a reduction to receivables, net in our consolidated balance sheets, with the estimated value of inventory expected to be returned in prepaid expenses and other current assets in our consolidated balance sheets. As of February 3, 2024 and January 30, 2021 and February 1, 2020,28, 2023, reserve balances recorded as a reduction to wholesale receivables related to these items were $6$3 million and $9$4 million, respectively.

77

Table of Contents

OXFORD INDUSTRIES, INC.

NOTES TO CONSOLIDATED FINANCIAL STATEMENTS (Continued)

We extend credit to certain wholesale customers based on an evaluation of the customer’s financial capacity and condition, usually without requiring collateral. In circumstances where we become aware of a specific wholesale customer’s inability to meet its financial obligations, a specific provision for credit losses is taken as a reduction to accounts receivable to reduce the net recognized receivable to the amount reasonably expected to be collected. Such amounts are ultimately written off at the time that the amounts are not considered collectible. For all otherour wholesale customer receivable amounts not specifically provided for, we recognize estimated provisions for credit losses, using the current expected loss model based on our historical collection experience, the financial condition of our customers, an evaluation of current economic conditions, anticipated trends and the risk characteristics of the receivables, each of which is subjective and requires certain assumptions. During Fiscal 2020, we estimated these losses using the current expected loss approach including consideration of the expected impact of the ongoing COVID-19 pandemic on our receivables, whereas in Fiscal 2019, we estimated these losses using the incurred loss model under the previous guidance. We include such charges for credit losses and write-offs in SG&A in our consolidated statements of operations and as a reduction to receivables, net in our consolidated balance sheets.receivables. Provisions for credit loss expense, which is included in SG&A in our consolidated statements of operations, for Fiscal 2020,2023, Fiscal 20192022 and Fiscal 20182021 were $4a credit of less than $1 million, $0a credit of less than $1 million and $0a credit of $1 million, respectively, while write-offs of credit losses for Fiscal 2020,2023, Fiscal 20192022 and Fiscal 20182021 were $2less than $1 million, $0less than $1 million and less than $1 million. The increase in write-offs was due to bankruptcies of various wholesale customers during Fiscal 2020.million, respectively. As of both February 3, 2024 and January 30, 2021 and February 1, 2020,28, 2023, receivables, net in our consolidated balance sheet included a provision for credit losses related to trade receivables was $3 million andof $1 million, respectively.million.

In addition to trade receivables, tenant allowances due from landlord of $2$6 million and $1$2 million are included in receivables, net in our consolidated balance sheet, as of February 3, 2024 and January 30, 2021 and February 1, 2020,28, 2023, respectively. Substantially all other amounts recognized in receivables, net represent trade receivables related to contracts with customers, including receivables from wholesale customers, credit card receivables related to our direct to consumer operations, and receivables from licensing partners. As of both February 3, 2024 and January 30, 2021 and February 1, 2020,28, 2023, prepaid expenses and other current assets included $4 million and $3 million, respectively, representing the estimated value of inventory for expected wholesale and direct to consumer and wholesale sales returns in the aggregate. An estimated sales return liability of $7 million and $3 million for expected direct to consumer returns is classified in accrued expenses and other liabilities in our consolidated balance sheet as of January 30, 2021 and February 1, 2020, respectively. We did not have any significant contract assets related to contracts with customers, other than trade receivables and the value of inventory associated with expected sales returns, as of February 3, 2024 and January 30, 2021 and February 1, 2020.28, 2023.

In addition to our estimated expected return amounts, contract liabilities related to contracts with our customers include gift cards and merchandise credits issued by us.us as well as unredeemed loyalty program award points. Gift cards and merchandise credits issued by us are redeemable on demand by the holder, and do not have an expiration date orand do not incur administrative fees. Historically, substantially all gift cards and merchandise credits are redeemed within one year of issuance. Gift cards and merchandise credits are recorded as a liability until our performance obligation is satisfied, which occurs when redeemed by the consumer, at which point revenue is recognized. However, we recognize estimated breakage income for certain gift cards and merchandise credits using the redemption recognition method, subject to applicable laws in certain states. Contract liabilities for gift cards purchased by consumers and merchandise credits received by customers but not yet redeemed, less any breakage income recognized to date, is included in accrued expenses and other liabilities in our consolidated balance sheets and totaled $13$20 million and $12$19 million as of February 3, 2024 and January 30, 2021 and February 1, 2020,28, 2023, respectively. Gift card breakage income, which is included in net sales in our consolidated statements of operations, was $1 million $2in each of Fiscal 2023, Fiscal 2022 and Fiscal 2021.

In Fiscal 2021, each of our brands in our Emerging Brands operating group initiated brand specific loyalty award programs. These programs allow consumers to earn loyalty points associated with the brand. Lilly Pulitzer initiated also initiated a program in Fiscal 2023. These programs are primarily spend-based loyalty programs, with varying terms and conditions for each respective brand’s program. The consumer earns points which, depending on the program, allows the

77

Table of Contents

OXFORD INDUSTRIES, INC.

NOTES TO CONSOLIDATED FINANCIAL STATEMENTS (Continued)

consumer to (1) achieve a specified status with the brand, which provides the consumer with benefits, such as early access to events, free shipping or other benefits, for a specified period, and/or (2) earn a monetary reward by accumulating loyalty points that can be redeemed in association with future purchases from the brand. As loyalty points are earned, we defer revenue, based on the estimated fair value of the loyalty points, with a corresponding liability in accrued expenses and other liabilities in our consolidated balance sheets. The loyalty points liability is generally recognized as revenue when the loyalty points are redeemed or expire. Deferred revenue associated with the loyalty programs totaled $3 million and $0$1 million in Fiscal 2020, Fiscal 2019as of February 3, 2024 and Fiscal 2018,January 28, 2023, respectively.

Royalties from the license of our owned brands are recognized over the time that licensees are provided access to utilize our trademarks (i.e. symbolic intellectual property) and benefit from such access through their sales of licensed products. Payments are generally due quarterly, and depending on time of receipt, may be recorded as a liability until recognized as revenue. Royalty income is based upon the contractually guaranteed minimum royalty obligations and adjusted as sales data, or estimates thereof, is received from licensees whenreflects that the related royalties based on a percentage of the licensee’s sales exceed the contractually determined minimum royalty amount. Royalty income, which is included in royalties and other operating income in our consolidated statements of operations, were $14$19 million, $15$22 million and $14$18 million during Fiscal 2020,2023, Fiscal 20192022 and Fiscal 2018,2021, respectively.

78

Table of Contents

OXFORD INDUSTRIES, INC.

NOTES TO CONSOLIDATED FINANCIAL STATEMENTS (Continued)

Cost of Goods Sold

We include in cost of goods sold all(1) the cost paid to the suppliers for the acquired product, (2) sourcing, procurement and other costs incurred prior to or in association with the receipt of finished goods at our distribution facilities, as well asand (3) freight from our warehousedistribution facilities to our own retail stores, e-commerce consumers and wholesale customers and e-commerce consumers.customers. The costs prior to receipt at our distribution facilities include product cost, inbound freight charges, duties and other import costs, purchasing costs, internal transfer costs, direct labor, manufacturing overhead, insurance, duties, brokers’ fees, consolidators’ fees, insurance, direct labor, and depreciation expense associated with our manufacturing, sourcing and procurement operations. We generally classify amounts billed to customers for freight in net sales and classify freight costs for shipments to customers in cost of goods sold in our consolidated statements of operations.

Our gross profit and gross margin may not be directly comparable to those of our competitors, as statement of operations classifications of certain expenses may vary by company.

SG&A

We include in SG&A costs incurred subsequent to the receipt of finished goods at our distribution facilities, such as the cost of inspection, stocking, warehousing, picking and packing, and costs associated with the operations of our e-commerce sites, retail stores, e-commerce sites, restaurantsfood and beverage locations and concessions, such as labor, lease commitments and other occupancy costs, store and restaurantdirect to consumer location pre-opening costs (including rent, marketing, store set-up costs and training expenses), depreciation and other fees.amounts. SG&A also includes product design costs, selling costs, royalty expense, provision for credit losses, advertising, promotion and marketing expenses, professional fees, supplies, travel, other general and administrative expenses, our corporate overhead costs and amortization of intangible assets.

Distribution network costs, including costs associated with preparing goods to ship to customers and our costs to operate our distribution facilities, are included as a component of SG&A. We consider distribution network costs to be the costs associated with operating our distribution centers, as well as the costs paid to third parties who perform those services for us. In Fiscal 2020,2023, Fiscal 20192022 and Fiscal 2018,2021, distribution network costs included in SG&A totaled $26$40 million, million, $30$36 million and $28 million, respectively.

All costs associated with advertising, promotion and marketing of our products are expensed in SG&A during the period when the advertisement is first shown. Costs associated with cooperative advertising programs under which we agree to make general contributions to our wholesale customers’ advertising and promotional funds are generally recorded as a reduction to net sales as recognized.sales. Advertising, promotion and marketing expenses, excluding employment costs for our advertising and marketing employees, for Fiscal 2020,2023, Fiscal 20192022 and Fiscal 20182021 were $50$105 million, $56$82 million and $60

78

Table of Contents

OXFORD INDUSTRIES, INC.

NOTES TO CONSOLIDATED FINANCIAL STATEMENTS (Continued)

$60 million, respectively. Prepaid advertising, promotion and marketing expenses included in prepaid expenses and other current assets in our consolidated balance sheets as of February 3, 2024 and January 30, 2021 and February 1, 2020 and28, 2023 were $2$5 million and $5$6 million, respectively.

Royalty expense related to our license of third party brands, which are generally based on the greater of a percentage of our actual net sales for the brandlicensed product or a contractually determined minimum royalty amount, are recorded based upon theany guaranteed minimum levels and adjusted based on our net sales of the licensed products, as appropriate. Royalty expenses recognized as SG&A in Fiscal 2020,2023, Fiscal 20192022 and Fiscal 20182021 were $6 million, $7$4 million and $6 million, respectively. Substantially allAs of theseFebruary 3, 2024, we do not have any royalty expenseagreements with material guaranteed minimum royalty amounts for future periods as future royalty amounts are included in Lanier Apparel for each period presented.generally dependent on our future sales of the specified licensed products.

Cash and Cash Equivalents

We consider cash equivalents to be short-term investments with original maturities of three months or less for purposes of our consolidated statements of cash flows. As of February 3, 2024 and January 30, 2021 and February 1, 2020, our28, 2023, we did not have any cash and cash equivalents included $59 million and $45 million, respectively, of amounts invested in money market funds.fund investments.

79

Table of Contents

OXFORD INDUSTRIES, INC.

NOTES TO CONSOLIDATED FINANCIAL STATEMENTS (Continued)

Supplemental Cash Flow Information

During Fiscal 2020,2023, Fiscal 20192022 and Fiscal 2018,2021, cash paid for income taxes was $6$39 million, $17$56 million and $14$34 million, respectively. During Fiscal 2020,2023, Fiscal 20192022 and Fiscal 2018,2021, cash paid for interest, net of interest income was $2$6 million, $1$3 million and $2$1 million, respectively. Non-cash investing activities included capital expenditures incurred but not yet paid at period end, which were included in accounts payable in our consolidated balances sheets, of $1$2 million, $3 million and $2$3 million as of Fiscal 2020,2023, Fiscal 20192022 and Fiscal 2018,2021, respectively. Additionally, during Fiscal 20202023, Fiscal 2022 and Fiscal 2019,2021, we recorded a non-cash net increase in operating lease assets and corresponding operating lease liability amounts of $2$83 million, $47 million and $40$18 million, respectively, related to the net impact of new, modified and terminated operating lease amounts.amounts, excluding any operating lease amounts recognized in the opening balance sheet of an acquired business.

Inventories, net

Substantially all of our inventories are finished goods inventories of apparel, accessories and other related products. Inventories are valued at the lower of cost or market.

For operating group reporting, inventory is carried at the lower of FIFO cost or market. We evaluate the composition of our inventories for identification of distressed inventory at least quarterly.  In performing this evaluation, we consider slow-turning products, an indication of lack of consumer acceptance of particular products, prior-seasons’ fashion products, broken assortments, discontinued products and current levels of replenishment program products as compared to expected sales. We estimate the amount of goods that we will not be able to sell in the normal course of business and write down the value of these goods as necessary. Asnecessary based on various assumptions about the amountamounts we ultimately expect to be ultimately realizedrealize for the goods is not necessarily known at period end, we must use certain assumptions considering historical experience, inventory quantity, quality, age and mix, historical sales trends, future sales projections, consumer and retailer preferences, market trends, general economic conditions, the levels of end of season product in market and the prices being offered by off-price retailers and our anticipated plans and costs to sell the inventory.inventories. Also, we provide an allowance for shrinkage, as appropriate, for the period between the last physical inventory count and each balance sheet date.

For consolidated financial reporting, as of February 3, 2024 and January 30, 2021 and February 1, 2020, $11628, 2023, $146 million, or 94%92%, and $145$204 million, or 95%93%, respectively, of our inventories were valued at the lower of LIFO cost or market after deducting our LIFO accounting reserve. The remaining $8$13 million and $7$16 million of our inventories were valued at the lower of FIFO cost or market as of February 3, 2024 and January 30, 2021 and February 1, 2020,28, 2023, respectively. Generally, for consolidated financial reporting, inventories of our domestic operations are valued at the lower of LIFO cost or market, and our inventories of our international operations are valued at the lower of FIFO cost or market. Our LIFO reserves are based on the estimated Producer Price Index as published by the United States Department of Labor. We write down inventories valued at the

79

Table of Contents

OXFORD INDUSTRIES, INC.

NOTES TO CONSOLIDATED FINANCIAL STATEMENTS (Continued)

lower of LIFO cost or market when LIFO cost exceeds market value. We deem LIFO accounting adjustments to not only include changes in the LIFO reserve, but also includes changes in markdown reserves which are considered in LIFO accounting.reserves. As our LIFO inventory pool does not correspond to our operating group definitions, LIFO inventory accounting adjustments are not allocated to our operating groups. Thus, the impact of accounting for inventories on the LIFO method is reflected in Corporate and Other for operating group reporting purposes included in Note 2.

There was a $2 million LIFO inventory layer liquidation in Fiscal 2023. There were no material LIFO inventory layer liquidations that had a material impact on our net earnings in Fiscal 2020, Fiscal 20192022 or Fiscal 2018.2021. As of February 3, 2024 and January 30, 2021 and February 1, 2020,28, 2023, the LIFO reserve included in our consolidated balance sheets were $62sheet was $83 million and $63$76 million, respectively.

Property and Equipment, net

Property and equipment, including leasehold improvements that are reimbursed by landlords as a tenant improvement allowance and assets under capital leases, if any, is carried at cost less accumulated depreciation. Additions are capitalized while repair and maintenance costs are charged to our consolidated statements of operations as incurred.

80

Table of Contents

OXFORD INDUSTRIES, INC.

NOTES TO CONSOLIDATED FINANCIAL STATEMENTS (Continued)

Depreciation is calculated using both straight-line and accelerated methods generally over the estimated useful lives of the assets as follows:

Leasehold improvements


Lesser of remaining life of the asset or lease term

Furniture, fixtures, equipment and technology


2 – 15 years

Buildings and improvements


7 – 40 years

Property and equipment is reviewed periodically for impairment if events or changes in circumstances indicate that the carrying amount of the asset group may not be recoverable, as discussed in Impairment of Long-Lived Assets, other than Goodwill and Intangible Assets with Indefinite Lives below.

Substantially all of our depreciation expense is included in SG&A in our consolidated statements of operations. Cost of goods sold includes the depreciation associated with our manufacturing, sourcing operations.

Goodwill and procurement processes. Depreciation expense as disclosed in Note 2 includes the property and equipment impairment charges.

Intangible Assets

At acquisition, we estimateWe test goodwill for impairment at the reporting unit level annually on the first day of the fourth quarter and recordmore often if an event occurs or circumstances change that indicate the fair value of purchased intangible assets, which primarily consista reporting unit is below its carrying amount. We have the option to first assess qualitative factors to determine whether it is more likely than not that goodwill is impaired to determine whether it is necessary to perform the quantitative impairment test. We also have the option to bypass the qualitative assessment entirely for any reporting unit in any period and proceed directly to performing the quantitative impairment test. For each impairment test of trademarks, reacquired rightsgoodwill in Fiscal 2023, Fiscal 2022 and customer relationships. The fair valuesFiscal 2021, we bypassed the qualitative test option and useful lives of these intangible assets are estimated based on ourinstead performed a quantitative test.

When applying the quantitative assessment, as well as independent third party appraisals in some cases. Such valuations, which are dependent upon a number of uncertain factors, may include a discounted cash flow analysis of anticipated revenues and expenses or cost savings resulting from the acquired intangible asset using an estimate of a risk-adjusted market-based cost of capital as the discount rate. Significant assumptions and estimates included in determiningwe determine the fair value of intangible assets mayour reporting units based on an income approach, or in some cases a combination of an income approach and market approach. The income approach calculates a value based upon the present value of estimated future cash flows, while the market approach uses earnings multiples of similarly situated guideline public companies. Determining the fair value of a reporting unit involves judgment and the use of significant estimates and assumptions, which include estimates of net sales, royalty income, operating income,assumptions regarding the revenue growth rates royalty rates,and operating margins used to calculate estimated future cash flows, risk-adjusted discount rates and income tax rates, amongfuture economic and market conditions. If an annual or interim analysis indicates an impairment of goodwill, the amount of the impairment is recognized in our consolidated financial statements based on the amount that the carrying value exceeds the estimated fair value of the reporting unit.

80

Table of Contents

OXFORD INDUSTRIES, INC.

NOTES TO CONSOLIDATED FINANCIAL STATEMENTS (Continued)

As of October 29, 2023, our reporting units consisted of the following: Tommy Bahama; Lilly Pulitzer; Johnny Was; Southern Tide; TBBC; Duck Head; and Oxford of Lyons. As of October 29, 2023, we performed a quantitative assessment of impairment for the Lilly Pulitzer, Johnny Was, Southern Tide and TBBC reporting units. Our other factors. Additionally, at acquisitionreporting units do not have goodwill. We determined on the basis of the quantitative assessments of our Lilly Pulitzer, Southern Tide and TBBC reporting units that the fair value of each reporting unit was greater than its respective carrying amount, indicating no impairment. Based on the quantitative assessment of our Johnny Was reporting unit, we must determine whetherrecognized an impairment charge of $99 million in the Fourth Quarter of Fiscal 2023 which was recorded within impairment of goodwill, intangible asset has an indefinite or finite lifeassets and accountequity method investments in our Consolidated Statements of Operations. See “Note 5—Intangible Assets and Goodwill” for it accordingly.further discussion.

Intangible assets with indefinite lives, which are detailed by operating group in Note 4,primarily consist of trademarks, are not amortized but instead evaluated for impairment annually or more frequently if events or circumstances indicate that the intangible asset might be impaired. The evaluation of the recoverability of trademarks with indefinite lives includes valuations based on a discounted cash flowThis analysis utilizing the relief from royalty method, among other considerations. Like the initial valuation, the evaluation of recoverability is dependent upon a number of uncertain factors which requiredescribed below and is typically performed in conjunction with the goodwill impairment analysis discussed above and is similar to the analysis performed at acquisition.

The fair value of our trademarks is principally determined by the “relief from royalty” approach that assumes the trademarks have value to the extent that their owner is relieved of the obligation to pay royalties for the benefits received from them. This method includes assumptions to be made by us, including estimates of net sales, royalty income, operating income,regarding revenue growth rates, royalty rates, risk-adjusted discount rates and income tax rates, among other factors.

We have the option to first assess qualitative factors to determine whether it is more likely than not that an indefinite-lived intangible asset is impaired as a basis for determining whether it is necessary to perform the quantitative impairment test. We also have the option to bypass the qualitative assessment for any indefinite-lived intangible asset in any periodfuture economic and proceed directly to performing the quantitative impairment test. Bypassing the qualitative assessment in any period does not prohibit us from performing the qualitative assessment in any subsequent period. We test, either quantitatively or qualitatively, intangible assets with indefinite lives for impairment as of the first day of the fourth quarter of our fiscal year, or at an interim date if indicators of impairment exist at that date.market conditions. If an annual or interim analysis indicates an impairment of a trademarkan intangible asset with an indefinite useful life, the amount of the impairment is recognized in our consolidated financial statements based on the amount that the carrying value exceeds the estimated fair value of the asset.asset for an intangible asset with an indefinite life or the reporting unit for goodwill.

As discussed in Note 4, an impairment charge

Based on the quantitative assessment of our Johnny Was related to our Southern Tide intangible assets with an indefinite life, totaling $18we recognized noncash impairment charges of $12 million was recognized in the FirstFourth Quarter of Fiscal 2020,2023 which was recorded within impairment of goodwill, intangible assets and equity method investments in our Consolidated Statements of Operations. See “Note 5—Intangible Assets and Goodwill” for further discussion. For all other intangible assets with 0 additionalan indefinite life, we determined on the basis of the quantitative assessments that the fair value of each intangible asset with an indefinite life was greater than its respective carrying amount, indicating no impairment.

The estimated fair values used in the impairment charges related toassessments of goodwill and intangible assets with an indefinite lives inlife were considered nonrecurring Level 3 measurements of the other quarters of Fiscal 2020. NaN impairment of intangible assets with indefinite lives was recognized during Fiscal 2019 or Fiscal 2018.

81

Table of Contentsvaluation hierarchy.

OXFORD INDUSTRIES, INC.

NOTES TO CONSOLIDATED FINANCIAL STATEMENTS (Continued)

Intangible assets with finite lives which primarily consist of ownedcustomer relationships, certain trademarks of TBBC and Duck Head, reacquired rights and customer relationships,rights. These assets are amortized over the estimated useful life of the asset using the straight line method or a method of amortization that reflects the pattern in which the economic benefits of the intangible asset are consumed or otherwise realized.realized or the straight line method. Certain of our intangible assets with finite lives may be amortized over periods of up to 20 years. The determination of an appropriate useful life for amortization considers our plans for the intangible assets, the remaining contractual period of the reacquired right, and factors that may be outside of our control, including expected customer attrition. Amortization of intangible assets is included in SG&A in our consolidated statements of operations. Intangible assets with finite lives are reviewed periodically for impairment if events or changes in circumstances indicate that the carrying amount of the asset group may not be recoverable, as discussed inbelow under Impairment of Long-Lived Assets, other than Goodwill and Intangible Assets with Indefinite Lives below.

Lives. Any costs associated with extending or renewing recognized intangible assets are generally expensed as incurred.

Goodwill, net

Goodwill is recognized as the amount by which the cost to acquire a business exceeds the fair value of identified tangible and intangible assets acquired, net of assumed liabilities. Thus, the amount of goodwill recognized in connection with a business combination depends on the fair values assigned to the individual assets acquired and liabilities assumed in a business combination. Goodwill is allocated to the respective reporting unit at the time of acquisition. Goodwill, which as of the end of Fiscal 2020 primarily consists of goodwill related to our Lilly Pulitzer and TBBC acquisitions, is not amortized but instead is evaluated for impairment annually or more frequently if events or circumstances indicate that the goodwill might be impaired. As of January 30, 2021, all of our goodwill is deductible for income tax purposes.

We test, either qualitatively or quantitatively, goodwill for impairment as of the first day of the fourth quarter of our fiscal year or when impairment indicators exist. The qualitative factors that we use to determine the likelihood of goodwill impairment, as well as to determine if an interim test is appropriate, include: (a) macroeconomic conditions, (b) industry and market considerations, (c) cost factors, (d) overall financial performance, (e) other relevant entity-specific events, (f) events affecting a reporting unit, (g) a sustained decrease in share price, or (h) other factors, as appropriate. In the event we determine that we will bypass the qualitative impairment option or if we determine that a quantitative test is appropriate, the quantitative test includes valuations of each applicable underlying reporting unit using fair value techniques, which may include a discounted cash flow analysis or an independent appraisal, as well as consideration of any market comparable transactions. Significant estimates, some of which may be very subjective, considered in a discounted cash flow analysis are future cash flow projections of the business, an estimate of the risk-adjusted market-based cost of capital as the discount rate, income tax rates and other assumptions. The estimates and assumptions included in the evaluation of the recoverability of goodwill involve significant uncertainty, and if our plans or anticipated results change, the impact on our financial statements could be significant.

If an annual or interim analysis indicates an impairment of goodwill balances, the impairment is recognized in our consolidated financial statements. As discussed in Note 4, a $43 million goodwill impairment charge related to Southern Tide was recognized in the First Quarter of Fiscal 2020, with 0 additional impairment charges related to goodwill in the other quarters of Fiscal 2020. NaN impairment of goodwill was recognized during Fiscal 2019 or Fiscal 2018.

Prepaid Expenses and Other Non-Current Assets, net

Amounts included in prepaid expenses and other current assets primarily consist of prepaid operating expenses, including advertising, taxes,subscriptions, maintenance and other services contracts, royalties,advertising, insurance, samples and retaildirect to consumer supplies as well as the estimated value of inventory for anticipated wholesale and direct to consumer and wholesale sales returns. Other non-current assets primarily consist of assets set aside for potential liabilities related to our deferred compensation plan,

8281

Table of Contents

OXFORD INDUSTRIES, INC.

NOTES TO CONSOLIDATED FINANCIAL STATEMENTS (Continued)

equity investments in unconsolidated entities, assets related to certain investments in officers’ life insurance policies, deposits and amounts placed into escrow accounts, deferred financing costs related to our revolving credit agreement and non-current deferred tax assets.

Officers’ life insurance policies that are owned by us, substantially all of which are included in other non-current assets, net, are recorded at their cash surrender value, less any outstanding loans associated with the life insurance policies that are payable to the life insurance company with which the policy is outstanding. As of both February 3, 2024 and January 30, 2021 and February 1, 2020,28, 2023, officers’ life insurance policies, net, recorded in our consolidated balance sheets totaled $4 million.

Deferred financing costs for our revolving credit agreementsagreement are included in other non-current assets, net in our consolidated financial statements. Deferred financing costs are amortized on a straight-line basis, which approximates the effective interest method over the term of the related debt. Amortization of deferred financing costs is included in interest expense in our consolidated statements of operations. In March of 2023, we capitalized debt issuance costs of $2 million in connection with commitments upon entering into the U.S. Revolving Credit Agreement. Unamortized deferred financing costs included in other non-current assets, net totaled $1 million and $2 million as of February 3, 2024 and $1 million as of January 30, 2021 and February 1, 2020, respectively.28, 2023.

Deferred Compensation

We have a non-qualified deferred compensation plan offered to a select group of highly compensated employees and our non-employee directors. The plan provides participants with the opportunity to defer a portion of their cash compensation in a given plan year, of which a percentage may be matched by us in accordance with the terms of the plan. We make contributions to rabbi trusts or other investments to provide a source of funds for satisfying these deferred compensation liabilities. Investments held for our deferred compensation plan consist of insurance contracts and are recorded based on valuations which generally incorporate unobservable factors. A changeRealized and unrealized gains and losses on the deferred compensation plan investments are recorded in the value of the underlying assets would substantially be offset by a changeSG&A in the liability to the participant resulting in an immaterial net impact on our consolidated financial statements.statements of operations and substantially offset the changes in deferred compensation liabilities to participants resulting from changes in market values. These securities approximate the participant-directed investment selections underlying the deferred compensation liabilities.

The total value of the assets set aside for potential deferred compensation liabilities substantiallyas of February 3, 2024 and January 28, 2023 was $17 million and $16 million, respectively. Substantially all of whichthese amounts are held in a rabbi trust and included in other non-current assets, net as of January 30, 2021 and February 1, 2020 was $16 million and $15 million, respectively, substantially all of which are held in a rabbi trust.our consolidated balance sheet. Substantially all the assets set aside for potential deferred compensation liabilities are life insurance policies recorded at their cash surrender value, less any outstanding loans associated with the life insurance policies that are payable to the life insurance company with which the policy is outstanding. The liabilities associated with the non-qualified deferred compensation plan are included in other non-current liabilities in our consolidated balance sheets and totaled $16$18 million and $15 million at February 3, 2024 and January 30, 2021 and February 1, 2020,28, 2023, respectively.

Equity Investments in Unconsolidated Entities

We account for equity investments in which we exercise significant influence, but do not control via voting rights and were determined to not be the primary beneficiary of,directly or indirectly hold a controlling interest using the equity method of accounting. Generally, we determine that we exercise significant influence over a corporation or a limited liability company when we own 20% or more or 3% or more, respectively, of the voting interests, unless the facts and circumstances of that investment indicate that we do not have the ability to exhibit significant influence. Under the equity method of accounting, original investments are recorded at cost, and are subsequently adjusted for our contributions to, distributions from and share of income or losses of the entity. We account for equity investments in which we do not control or exercise significant influence using the fair value method of accounting unless there is not a readily determinable fair value for the equity investment. If there is no readily determinable fair value for such equity investment, we account for the equity investment using the alternative measurement method of cost adjusted for impairment and any identified observable price changes of the investment.

8382

Table of Contents

OXFORD INDUSTRIES, INC.

NOTES TO CONSOLIDATED FINANCIAL STATEMENTS (Continued)

Equity investments accounted for using the equity method of accounting, fair value method of accounting, or alternative measurement method are included in other non-current assets in our consolidated balance sheets, while the income or loss related to such investments areis included in royalties and other operating income in our consolidated statements of operations. During Fiscal 2020, we paid $6 million,Income or loss related to investments in the aggregate, for equitysmaller lifestyle brands are included within Emerging Brands, while income or loss related to investments in entities that are not lifestyle brands are included within Corporate and Other, including the income or loss from the Tommy Bahama Miramonte Resort & Spa. We made no equity investments during Fiscal 2023. During Fiscal 2022, we paid $8 million for an investment in the Tommy Bahama Miramonte Resort & Spa accounted for using either the equity method of accounting or the alternative measurement method, which areaccounting. The investment made in Fiscal 2022 is included in other investing activities in our consolidated statements of cash flows. Each of these investments is in smaller apparel lifestyle brands in which we have an ownership interest of approximately 10% as of January 30, 2021.

As of February 3, 2024 and January 30, 2021 and February 1, 2020,28, 2023, our consolidated balance sheet included equity investments accounted for using the equity method of accounting, fair value and alternative measurement method totaling, in the aggregate, $6$7 million and $0$11 million, respectively. The primary drivers of the decrease were (1) a $2 million noncash impairment of an equity method investment in a smaller lifestyle apparel brand in Fiscal 2023 and (2) a $2 million loss recognized related to the Tommy Bahama Miramonte Resort & Spa. The impairment in the equity method investment resulted from the investee’s forecast of future losses and was recorded within impairment of goodwill, intangible assets and equity method investments in our Consolidated Statements of Operations. The equity investments in unconsolidated entities included in our consolidated balance sheet represents substantially all our exposure or loss related to these investments, as there are no meaningful obligations to fund additional amounts or losses related to these investments. Our primary equity method investment is our minority ownership interest in a property in Indian Wells, California that operates as the Tommy Bahama Miramonte Resort & Spa that opened during Fiscal 2023. During Fiscal 2020,2023, Fiscal 20192022 and Fiscal 20182021 we recognized amounts related to theseequity method investments in our consolidated statementsroyalties and other income of operationsa loss of $0$2 million, $0 million and a loss of $1 million and income of $12 million, respectively. The income in Fiscal 2021 was related to our minority ownership interests in an unconsolidated entity that was redeemed upon that entity consummating a change in control transaction, resulting in proceeds to us of $15 million and a gain on sale of $12 million.

Impairment of Long-Lived Assets, other than Goodwill and Intangible Assets with Indefinite Lives

We assess our long-lived assets other than goodwill and intangible assets with indefinite lives for impairment whenever events indicate that the carrying amount of the asset or asset group may not be fully recoverable. This recoverability and impairment assessment is performed for a specific asset or asset group and includes any property and equipment, operating lease assets, intangible assets with definitefinite lives and other non-current assets included in the asset group. Events that would typically result in such an assessment would include a change in the estimated useful life of the assets, including a change in our plans of the anticipated period of operating a leased retail store or restaurantdirect to consumer location, the decision to vacate a leased space before lease termination,expiration, the abandonment of an asset or other factors. These events may also result in a change in the determination of the assets included in an asset group for impairment testing. To analyze recoverability, we consider undiscounted net future cash flows over the remaining life of the asset or asset group. If the amounts are determined to not be recoverable an impairment is recognized resulting in the write-down of the asset or asset group and a corresponding charge to our consolidated statements of operations. Impairment losses are measured based on the difference between the carrying amount and the estimated fair value of the assets. For any assets impaired during Fiscal 2020,2023, Fiscal 20192022 and Fiscal 2018,2021, there was no significant fair value at the date of impairment testing.

During Fiscal 2020,2023, Fiscal 20192022 and Fiscal 2018,2021, we recognized $20$1 million, $1 million and $1$2 million, respectively, of property and equipment impairment charges, which were primarily included in SG&A. During Fiscal 2020, these charges primarily related to a $15 million write-off of previously capitalized costs associated with a Tommy Bahama information technology project that was abandoned in the Fourth Quarter of Fiscal 2020, $2 million of charges related to retail store assets due to retail store closures in Tommy Bahama and Lilly Pulitzer, $1 million of charges related to office leasehold improvements resulting from the Lanier Apparel exit and $1 million of charges related to office leasehold improvements associated with the 2020 restructuring of Tommy Bahama’s international sourcing operations. The impairment charges in Fiscal 2019 and Fiscal 2018 were primarily related to retail store assets and information technology assets.

During Fiscal 2020, Fiscal 20192023 and Fiscal 2018,2022, we did not recognize any operating lease asset impairment charges. During Fiscal 2021, we recognized $4$5 million $0 million and $0 million, respectively, of operating lease asset impairment charges, which were primarily included in SG&A. During Fiscal 2020,2021, these charges primarily related to $3 million of charges related to certainour Tommy Bahama New York office leases resulting from the Lanier Apparel exit and $1 million of charges related to an officeshowroom lease, associated with the 2020 restructuring of Tommy Bahama’s international sourcing operations.

As discussed in Note 4, we recognized an impairment charge of less than $1 million of an intangible asset with a finite life in Lanier Apparelwhich was vacated in Fiscal 2020. NaN impairment of intangible assets with finite lives was recognized during Fiscal 2019 or Fiscal 2018.2021 and provides the landlord the ongoing right to terminate the lease.

8483

Table of Contents

OXFORD INDUSTRIES, INC.

NOTES TO CONSOLIDATED FINANCIAL STATEMENTS (Continued)

No impairment of intangible assets with finite lives was recognized during Fiscal 2023, Fiscal 2022, or Fiscal 2021.

Accounts Payable, Accrued Compensation and Accrued Expenses and Other Liabilities

Liabilities for accounts payable, accrued compensation and accrued expenses and other liabilities are carried at cost, which reflectsapproximates the fair value of the consideration expected to be paid in the future for goods and services received, whether or not billed to us as of the balance sheet date. Accruals for medical insurance and workers’ compensation, which are included in accrued expenses and other liabilities in our consolidated balance sheets, include estimated settlements for known claims, as well as accruals for estimates of incurred but not reported claims based on our claims experience and statistical trends.

Legal and Other Contingencies

We are subject to certain litigation, claims and assessments in the ordinary course of business. The claims and assessments may relate, among other things, to disputes about trademarks and other intellectual property, licensing arrangements,employee relations matters, real estate, and contracts, employee relations matters,licensing arrangements, importing or exporting regulations, environmental matters,product safety requirements, taxation or other topics. For those matters where it is probable that we have incurred a loss and the loss, or range of loss, can be reasonably estimated, we have recorded reserves in accrued expenses and other liabilities or other non-current liabilities in our consolidated financial statements for the estimated loss and related expenses, such as legal fees. In other instances, because of the uncertainties related to both the probable outcome or amount or range of loss, we are unable to make a reasonable estimate of a liability, if any, and therefore have not recorded a reserve. As additional information becomes available or as circumstances change, we adjust our assessment and estimates of such liabilities accordingly. Additionally, for any potential gain contingencies, we do not recognize the gain until the period that all contingencies have been resolved and the amounts are realizable. We believe the outcome of outstanding or pending matters, individually and in the aggregate, will not have a material impact on our consolidated financial statements, based on information currently available.

In connection with acquisitions, we may enter into contingent consideration arrangements, which provide for the payment of additional purchase price consideration to the sellers if certain performance criteria are achieved during a specified period. We recognize the fair value of the contingent consideration based on its estimated fair value at the date of acquisition. Such valuation requires assumptions regarding anticipated cash flows, probabilities of cash flows, discount rates and other factors. Each of these assumptions may involve a significant amount of uncertainty. Subsequent to the date of acquisition, we periodically adjust the liability for the contingent consideration to reflect the fair value of the contingent consideration by reassessing our valuation assumptions as of that date. A change in assumptions related to contingent consideration amounts could have a material impact on our consolidated financial statements. Any change in the fair value of the contingent consideration is recognized in SG&A in our consolidated statements of operations.

A change in the fair value of contingent consideration of $1 million less than $1 million and $1 million associated with the 2017 acquisition of TBBC was recognized in our consolidated statements of operations in Fiscal 2020, Fiscal 2019 and Fiscal 2018, respectively.2021. As of February 3, 2024, and January 30, 2021 and February 1, 2020, $2 million and $1 million, respectively, of28, 2023, no contingent consideration related to the TBBC acquisition was recognized as a liability in our consolidated balance sheet. In the aggregate, $4 million was earned by the sellers pursuant to the four year contingent consideration arrangement, which ended on January 29, 2022, with the final payment of $2 million paid in Fiscal 2022. One of the sellers of TBBC is an employee and continues to manage the operations of TBBC.

Other Non-current Liabilities

Amounts included in other non-current liabilities primarily consist of deferred compensation amounts and amounts related to uncertain tax positions and fair valuepositions.

84

Table of contingent consideration.Contents

OXFORD INDUSTRIES, INC.

NOTES TO CONSOLIDATED FINANCIAL STATEMENTS (Continued)

Leases

In the ordinary course of business, we enter into real estate lease agreements for our direct to consumer locations, which include both retail and food and beverage locations, office and warehouse/distribution space, as well as leases for certain equipment. Our real estate leases have varying terms and expirations and may have optionsprovisions to extend,

85

Table of Contents

OXFORD INDUSTRIES, INC.

NOTES TO CONSOLIDATED FINANCIAL STATEMENTS (Continued)

renew or terminate the lease agreement at our discretion, among other provisions. Our real estate lease terms are typically for a period of ten years or less and typically require monthly rent payments with specified rent escalations during the lease term. Our real estate leases usually provide for payments of our pro rata share of real estate taxes, insurance and other operating expenses applicable to the property, and certain of our leases require payment of sales taxes on rental payments. Also, our direct to consumer location leases often provide for contingent rent payments based on sales if certain sales thresholds are achieved. For many of our real estate lease agreements, we obtain lease incentives at lease inception from the landlord for tenant improvement or other allowances. Our lease agreements do not include any material residual value guarantees or material restrictive financial covenants. Substantially all of our leases are classified as long-term operating leases.

For our leases, we are required to recognize operating lease liabilities equal to our obligation to make lease payments arising from the leases on a discounted basis and operating lease assets which represent our right to use, or control the use of, a specified asset for a lease term. Operating lease liabilities, which are included in current portion of operating lease liabilities and non-current portion of operating lease liabilities in our consolidated balance sheets, are recognized at the lease commencement date based on the present value of lease payments over the lease term. The significant judgments in calculating the present value of lease obligations include determining the lease term and lease payment amounts, which are dependent upon our assessment of the likelihood of exercising any renewal or termination options that are at our discretion, as well as the discount rate applied to the future lease payments. The operating lease assets, which are included in operating lease assets in our consolidated balance sheets, at commencement represent the amount of the operating lease liability reduced for any lease incentives, including tenant improvement allowances. Typically, we do not include any renewal or termination options at our discretion in the underlying lease term at the time of lease commencement as the probability of exercise generally is not reasonably certain. Variable rental payments for real estate taxes, sales taxes,tax, insurance, other operating expenses and contingent rent based on a percentage of net sales or adjusted periodically for inflation are not included in lease expense used to calculate the present value of lease obligations recognized in our consolidated balance sheet, but instead are recognized as incurred.

Lease expense for operating leases is generally recognized on a straight-line basis over the lease term, even if there are fixed escalation clauses, lease incentives for rent holidays, or other similar items from the date that we take possession of the space. Substantially all of our lease expense is recognized in SG&A in our consolidated statements of operations.

We account for the underlying operating lease at the individual lease level. The lease guidance requires us to discount future lease payments using the interest rate implicit in the lease or, if that rate cannot be readily determined, our estimated incremental borrowing rate. As our leases do not provide an implicit rate, we use an estimated incremental borrowing rate based on information available at the applicable commencement date. Our estimated incremental borrowing rate for a lease is the rate of interest we estimate we would have to pay on a collateralized basis over the lease term to borrow an amount equal to the lease payments.

During the First Quarter of Fiscal 2020, the FASB provided for an optional practical expedient that simplifies how a lessee accounts for rent concessions that are a direct consequence of the COVID-19 pandemic. The practical expedient only applies if a lease is modified to allow for a rental concession and (1) the revised consideration is substantially the same as, or less than, the original consideration in the lease agreement, (2) the reduction in lease payments relates to payments due on or before June 30, 2021, and (3) no other substantive changes have been made to the terms of the leases. The practical expedient provides that, if the above conditions are met for the lease agreement, the lessee is not required to assess whether the eligible rent concessions are lease modifications. We have elected to apply the practical expedient for all eligible lease modifications resulting in the rent concession being recorded as an adjustment to variable lease payments and recognized in our consolidated statement of operations in that period. The amounts of concessions recognized in our consolidated statement of operations pursuant to this practical expedient in Fiscal 2020 was $4 million. For lease modifications that do not meet the criteria for the practical expedient, we account for the amendment and concession as a lease modification requiring lease remeasurement with the concession recognized as a reduction to the operating lease asset and recognized in our consolidated statements of operations over

86

Table of Contents

OXFORD INDUSTRIES, INC.

NOTES TO CONSOLIDATED FINANCIAL STATEMENTS (Continued)

the remaining term of the respective lease agreement. The amount of concessions agreed to in Fiscal 2020 that were recognized as reductions of the operating lease asset and will be recognized in future periods over the remaining lease term as a reduction to rent expense was $4 million.

In February 2016, the FASB issued revised lease accounting guidance. We adopted the guidance on the first day of Fiscal 2019 using a modified retrospective approach. The modified retrospective approach allowed us to apply the new lease accounting guidance to the financial statements for the period of adoption and apply the previous lease accounting guidance in the prior year comparative periods. The adoption of the new lease accounting guidance had a material impact on our consolidated balance sheet as a result of the recognition of operating lease assets and operating lease liabilities on our consolidated balance sheet, but did not have a material impact on our consolidated statements of operations, as the recognition of operating lease expense was generally consistent under the previous and new lease accounting guidance, or on our consolidated statements of cash flows, as the lease accounting guidance did not impact the timing of lease payments.

Foreign Currency

We are exposed to foreign currency exchange risk when we generate net sales or incur expenses in currencies other than the functional currency of the respective operations. The resulting assets and liabilities denominated in amounts other than the respective functional currency are re-measured into the respective functional currency at the rate of exchange in effect on the balance sheet date, and income and expenses are re-measured at the average rates of exchange prevailing during the relevant period. The impact of any such re-measurement is recognized in our consolidated statements of operations in that period. Net losses (gains) included in our consolidated statements of operations related to foreign

85

Table of Contents

OXFORD INDUSTRIES, INC.

NOTES TO CONSOLIDATED FINANCIAL STATEMENTS (Continued)

currency transactions recognized in Fiscal 2020,2023, Fiscal 20192022 and Fiscal 20182021 were $0 million,less than $1 million, $2 million and $0$1 million, respectively.

Additionally, the financial statements of our operations for which the functional currency is a currency other than the U.S. dollar are translated into U.S. dollars at the rate of exchange in effect on the balance sheet date for the balance sheet and at the average rates of exchange prevailing during the relevant period for the statements of operations. The impact of such translation is recognized in accumulated other comprehensive income (loss) in our consolidated balance sheets and included in other comprehensive income (loss) in our consolidated statements of comprehensive income resulting in no impact on net earnings for the relevant period. We view our foreign investments as long term, and we generally do not hedge such foreign investments.

As of January 30, 2021,February 3, 2024, our foreign currency exchange risk exposure primarily results from our businesses operating outside of the United States, which are primarily related to (1) our Tommy Bahama operations in Canada and Australia purchasing goods in U.S. dollars or other currencies which are not the functional currency of the business and (2) certain other transactions, including intercompany transactions. During Fiscal 2020,2023, Fiscal 20192022 and Fiscal 2018,2021, we did not enter into and were not a party to any foreign currency exchange contracts for hedging, trading or speculative purposes.contracts.

Interest Rate Risk

WeAs all of our indebtedness is variable-rate debt, we are exposed to market risk from changes in interest rates on any variable-rate indebtedness under our U.S. Revolving Credit Agreement.rates. If we have significant borrowings,determine that our exposure to interest rate changes is higher than we believe is appropriate, we may attempt to limit the impact of interest rate changes on earnings and cash flow primarily through a mix of variable-rate and fixed-rate debt although at times all of our debt may be either variable-rate or fixed-rate debt. At times we may enterby entering into interest rate swap arrangements related to certainarrangements. Our assessment of our variable-rate debt in order to fix the interest rate if we determine that ourappropriate levels of exposure to changes in interest rate changes is higher than optimal. Our assessmentrates also considers our need for flexibility in our borrowing arrangements resulting from the significant seasonality of our business and cash flows, anticipated future cash flows and our expectations about the risk of future interest rate changes, among other factors. During Fiscal 2020,2023, Fiscal 20192022 and Fiscal 2018,2021, we did not enter into and were not a party to any interest rate swap agreements for hedging, trading or speculative purposes.agreements.

87

Table of Contents

OXFORD INDUSTRIES, INC.

NOTES TO CONSOLIDATED FINANCIAL STATEMENTS (Continued)

Fair Value Measurements

Fair value in accordance with GAAP, is defined as the exchange price that would be received forto sell an asset or paid to transfer a liability (an exit price) in the principal or most advantageous market for the asset or liability in an orderly transaction between market participants at the measurement date. As such,GAAP establishes a fair value is a market-based measurementhierarchy that should be determined based on assumptions that market participants would use in pricing an asset or liability. Valuation techniques includecategorizes the market approach (comparable market prices), the income approach (present value of future income or cash flow), and the cost approach (costinputs to replace the service capacity of an asset or replacement cost). These valuation techniques may be based upon observable and unobservable inputs.

Theinto three levels ofbroad levels. Level 1 inputs used to measure fair value pursuant to the guidance are as follows: (1) Level 1—Quotedutilize quoted prices in active markets for identical assets or liabilities; (2)liabilities. Level 2—Observable2 inputs are based on other than quoted prices included in Level 1,observable market data, such as quoted prices for similar assets and liabilities, in active markets;and inputs other than quoted prices for identical or similar assets and liabilities in markets that are not active; or other inputs that are observable or can be corroborated by observable market data;such as interest rates and (3)yield curves. Level 3—Unobservable3 inputs that are supported bydeveloped from unobservable data reflecting our assumptions and include situations where there is little or no market activity and that are significant tofor the fair valueasset or liability.

As of the assets or liabilities, which include certain pricing models, discounted cash flow methodologies and similar techniques that use significant unobservable inputs.

OurFebruary 3, 2024, our financial instruments consist primarily of our cash and cash equivalents, accounts receivable, accounts payable, accrued expenses, other current liabilities and debt, if any.debt. Given their short-term nature, the carrying amounts of cash and cash equivalents, receivables, accounts payable, accrued expenses and other current liabilities generally approximate their fair values. The fair valuevalues of any cash and cash equivalents invested on an overnight basis in money market funds, isas well as short-term investments, are based upon the quoted prices in active markets provided by the holding financial institutions, which are considered Level 1 inputs in the fair value hierarchy. Additionally, we believe the carrying amounts of our variable-rate borrowings, if any, approximate fair value.

We have determined that our operating lease assets, property and equipment, intangible assets, goodwill operating lease assets and certain other non-current assets included in our consolidated balance sheets are non-financial assets measured at fair value on a non-recurring basis. We have determined that our approaches for determining fair values of each of these non-current assets generally are based on Level 3 inputs. Additionally, for contingent consideration fair value amounts, we have determined that our approaches for determining fair value are generally based on Level 3 inputs.inputs as discussed in “Goodwill and Intangibles” above.

86

Table of Contents

In determining the $9 million fair value, and resulting carrying value, of the Southern Tide trade name in our interim impairment test performed in the First Quarter of Fiscal 2020, which utilized the relief from royalty valuation method, we used certain Level 3 inputs. The significant unobservable inputs used in determining the fair value of the Southern Tide trade name as of the First Quarter of Fiscal 2020 included: (a) a double-digit percentage decrease in sales for the remainder of Fiscal 2020 as compared to the comparable prior year sales amounts, reflecting the anticipated impact of the COVID-19 pandemic during the remainder of Fiscal 2020; a double-digit percentage increase for sales in Fiscal 2021, reflecting an anticipated partial recovery from the COVID-19 pandemic; and high single-digit percentage growth rates for sales subsequent to Fiscal 2021, with the growth rate in future periods ultimately decreasing to a low single-digit percentage in the long term, and (b) a required rate of return for the intangible asset of 13%.OXFORD INDUSTRIES, INC.

NOTES TO CONSOLIDATED FINANCIAL STATEMENTS (Continued)

Equity Compensation

We have certain equity compensation plans as described in Note 8,9, which provide for the ability to grant restricted shares, restricted share units, options and other equity awards to our employees and non-employee directors. We recognize compensation expense related to equity awards to employees and non-employee directors in SG&A in our consolidated statements of operations based on the fair value of the awards on the grant date. The fair value of restricted sharesshare awards that are service and performance-based are determined based on the fair value of our common stock on the grant date. The fair value of restricted share unitsawards that are market-based (e.g. relative total shareholder return (“TSR”)) are determined based on a Monte Carlo simulation model, which models multiple TSR paths for our common stock as well as the comparator group, as applicable, to evaluate and determine the estimated fair value of the restricted share unit.award.

88

Table of Contents

OXFORD INDUSTRIES, INC.

NOTES TO CONSOLIDATED FINANCIAL STATEMENTS (Continued)

For awards with specified service requirements, the fair value of the equity awards granted to employees is recognized over the respectiverequisite service period. For performance-based awards (e.g. awards based on our earnings per share), during the performance period we assess expected performance versus the predetermined performance goals and adjust the cumulative equity compensation expense to reflect the relative expected performance achievement. The fair value of the performance-based awards, if earned, is recognized on a straight-line basis over the aggregate performance period and any additional required service period. For market-based awards (e.g. TSR-based awards) with specified service requirements that are equal to or longer than the market-based specification period, the fair value of the awards granted to employees is recognized over the requisite service period, regardless of whether, and to the extent to which, the market condition is ultimately satisfied. The impact of stock award forfeitures on compensation expense is recognized at the time of forfeitforfeiture as no estimate of future stock award forfeitures is considered in our calculation of compensation expense for our service-based, performance-based or market-based awards.

Comprehensive Income and Accumulated Other Comprehensive Loss

Comprehensive income consists of net earnings and specified components of other comprehensive income (loss). Other comprehensive income (loss) includes changes in assets and liabilities that are not included in net earnings pursuant to GAAP, such as foreign currency translation adjustments between the functional and reporting currencies and certain unrealized gains (losses), if any. For us, other comprehensive income for each period presented includesprimarily consists of the impact of the foreign currency translation impact of our Tommy Bahama operations in Canada, Australia and Japan.international operations. These other comprehensive income (loss) amounts are deferred in accumulated other comprehensive loss, which is included in shareholders’ equity in our consolidated balance sheets. As of January 30, 2021,February 3, 2024, the amounts included in accumulated other comprehensive loss in our consolidated balance sheet primarily reflectconsist of the net foreign currency translation adjustment related to our Tommy Bahama operations in Canada and Australia.

During Fiscal 2019, we recognized a $1 million charge in our consolidated statement of operations that was previously recognized in accumulated other comprehensive loss in our consolidated balance sheet. This charge related to foreign currency amounts associated with our investment and operations in Japan, which in Fiscal 2019 we decided to exit entirely after exiting a significant portion of the business in Fiscal 2018. No material amounts of accumulated other comprehensive loss were reclassified from accumulated other comprehensive loss into our consolidated statements of operations during Fiscal 20202023, Fiscal 2022 or Fiscal 2018.2021.

Dividends

Dividends are accrued at the time declared by our Board of Directors and typically paid within the same fiscal quarter. Certain restricted share units, as described in Note 8,9, earn dividend equivalents which are accrued at the time of dividend declaration by the Board of Directors in accrued expenses and other liabilities, but only paid if the restricted share units are ultimately earned. Dividends accrued related to these restricted share units, which are included in accrued expenses and other current liabilities in our consolidated balance sheet, were $1 million and $1 million, as of February 3, 2024 and January 28, 2023, respectively.

Share Repurchases

From time to time, we may repurchase shares of our stock under an open market repurchase program or otherwise. We account for share repurchases for open market transactions by charging the excess of repurchase price over the par value entirely to retained earnings based on the trade settlement date.

87

Table of Contents

OXFORD INDUSTRIES, INC.

NOTES TO CONSOLIDATED FINANCIAL STATEMENTS (Continued)

Concentration of Credit Risk and Significant Customers

We are exposed to concentrations of credit risk as a result of our receivables balances, for which the total exposure is limited to the amount recognized in our consolidated balance sheets. We sell our merchandise to wholesale customers operating in a number of distribution channels in the United States and other countries. We extend credit to certain wholesale customers based on an evaluation of the customer’s credit history and financial condition, usually without requiring collateral. Credit risk is impacted by conditions or occurrences within the economy and the retail industry and is principally dependent on each customer’s financial condition. As of January 30, 2021,February 3, customers2024, one customer represented 14% and eachanother customer represented more than 10% individually, and totaled 54% in the aggregate,12% of our receivables, net included in our consolidated balance sheet.

While noNo individual customer represented greater than 10% of our consolidated net sales in Fiscal 2020,2023, Fiscal 20192022 or Fiscal 2018,2021. However, a decision by the controlling owner of a group of stores or any significant customer to decrease the

89

Table of Contents

OXFORD INDUSTRIES, INC.

NOTES TO CONSOLIDATED FINANCIAL STATEMENTS (Continued)

amount of merchandise purchased from us or to cease carrying our products could have an adverse effect on our results of operations in future periods.

Additionally, as of January 30, 2021, we had $66 million of cash and cash equivalents, including $59 million invested in money market funds. Substantially all of these amounts are with major financial institutions in the United States. Further, we maintain cash deposits with major financial institutions that exceed the insurance coverage limits provided by the Federal Deposit Insurance Corporation.

Income Taxes

Income taxes included in our consolidated financial statements are determined using the asset and liability method. Under this method, income taxes are recognized based on amounts of income taxes payable or refundable in the current year as well as the impact of any items that are recognized in different periods for consolidated financial statement reporting and tax return reporting purposes. Prepaid income taxes and income taxes payable are recognized in prepaid expenses and other accrued expenses and liabilities, respectively, in our consolidated balance sheets.

As certain amounts are recognized in different periods for consolidated financial statement and tax return reporting purposes, financial statement and tax bases of assets and liabilities differ, resulting in the recognition of deferred tax assets and liabilities. The deferred tax assets and liabilities reflect the estimated future tax effects attributable to these differences, as well as the impact of net operating loss, capital loss and federal and state credit carrybackscarry-backs and carryforwards,carry-forwards, each as determined under enacted tax laws at rates expected to apply in the period in which such amounts are expected to be realized or settled. We account for the effect of changes in tax laws or rates in the period of enactment.

We recognize deferred tax assets to the extent we believe it is more likely than not that these assets will be realized. In making such a determination, we consider all available positive and negative evidence, including future reversals of existing taxable temporary differences, projected future taxable income, taxable income in any carrybackcarry-back years, tax-planning strategies, and recent results of operations.

Valuation allowances are established when we determine that it is more likely than not that some portion or all of a deferred tax asset will not be realized.

Valuation allowances are analyzed periodically and adjusted as events occur or circumstances change that would indicate adjustments to the valuation allowances are appropriate. If we determine that we are more likely than not to realize our deferred tax assets in the future in excess of their net recorded amount, we will reduce the deferred tax asset valuation allowance, which will reduce income tax expense. As realization of deferred tax assets and liabilities is dependent upon future taxable income in specific jurisdictions, changes in tax laws and rates and shifts in the amount of taxable income among jurisdictions may have a significant impact on the amount of benefit ultimately realized for deferred tax assets and liabilities.

WeAlso, we use a two-step approach for evaluating uncertain tax positions. Under the two-step method, recognition occurs when we conclude that a tax position, based solely on technical merits, is more likely than not to be sustained upon examination. The second step, measurement, is only addressed if step one has been satisfied. The tax benefit recorded is measured as the largest amount of benefit determined on a cumulative probability basis that is more likely than not to be realized upon ultimate settlement. Those tax positions failing to qualify for initial recognition are recognized in the first subsequent interim period they meet the more likely than not threshold or are resolved through settlement or litigation with the relevant taxing authority, upon expiration of the statute of limitations or otherwise. Alternatively, de-recognition of a tax position that was previously recognized occurs when we subsequently determine that a tax position no longer meets the more likely than not threshold of being sustained.

88

Table of Contents

OXFORD INDUSTRIES, INC.

NOTES TO CONSOLIDATED FINANCIAL STATEMENTS (Continued)

In the case of foreign subsidiaries, there are certain exceptions to the requirement that deferred tax liabilities be recognized for the difference in the financial statement and tax bases of assets. WhenIf we consider the investment to be essentially permanent in duration and the financial statement basis of the investment in a foreign subsidiary, excluding undistributed earnings, exceeds the tax basis in such investment, the deferred tax liability is not recognized if management considers the investment to be essentially permanent in duration.recognized. Further, deferred tax liabilities are not required to be recognized for undistributed earnings of foreign subsidiaries when

90

Table of Contents

OXFORD INDUSTRIES, INC.

NOTES TO CONSOLIDATED FINANCIAL STATEMENTS (Continued)

management considers we consider those earnings to be permanently reinvested outside the United States. The Tax Cuts and Jobs Act ("U.S. Tax Reform") as enacted on December 22, 2017 changed the way federal tax is applied to distributions of earnings of foreign subsidiaries. While distributions of foreign subsidiary earnings are generally not subject to federal tax, there are other possible tax impacts, including state taxes and foreign withholding tax, that must be considered if the earnings are not considered to be permanently reinvested. Further, U.S. Tax Reform did not exempt from federal tax thea gain realized upon the sale of a foreign subsidiary, if any, is not exempt from federal tax and consideration must therefore be given to the impact of differences in the book and tax basis of foreign subsidiaries not arising from earnings when determining whether a liability must be recorded if the investment is not considered permanently reinvested.

U.S. Tax Reform made significant changes in the taxation of our domestic and foreign earnings,Additionally, United States tax regulations currently include certain tax provisions including a reduction in the domestic corporate tax rate from 35% to 21%, the move to a territorial taxation system under which the earnings of foreign subsidiaries will generally not be subject to U.S. federal income tax upon distribution, the increase in bonus depreciation available for certain assets acquired, limitations on the deduction for certain expenses, including executive compensation and interest incurred, a tax on global intangible low-taxed income (“GILTI”), disallowance of deductions for certain payments (the base erosion anti-abuse tax, or “BEAT”) and certain deductions enacted for certain foreign-derived intangible income (“FDII”). While the calculations for GILTI, BEAT and FDII are complex calculations, the newthese provisions did not have a material impact on our effective tax rate in Fiscal 2020,2023, Fiscal 20192022 and Fiscal 2018.2021. We recognize the impact of GILTI as a period cost.

On March 27, 2020, the Coronavirus Aid, Relief and Economic Security Act (“CARES ActAct”) was signed into law, with applicable provisions reflected in our financial statements upon enactment. This law included several taxpayer favorable provisions which impactimpacted us, including allowing the carrybackcarry-back of our Fiscal 2020 net operating losses to periodsyears prior to the enactment of the United States Tax Cuts and Jobs Act in 2017 (“U.S. Tax ReformReform”), resulting in an increased benefit for those losses, accelerated depreciation of certain leasehold improvement costs, relaxed interest expense limitations and certain non-income tax benefits including deferral of employer FICA payments and an employee retention credit.

In Fiscal 2018 we adopted certain guidance that requires an entity to recognize Substantially all of the income tax consequences of an intra-entity transfer of an asset (other than inventory) when the transfer occurs. The impact of the adoption of this guidance resultedreceivable in a $0.1 million reduction to retained earningsour consolidated balance sheets as of February 4, 2018.3, 2024 and January 28, 2023 relates to the carry-back of our Fiscal 2020 net operating losses to prior years.

We file income tax returns in the United States and various state, local and foreign jurisdictions. Our federal, state, local and foreign income tax returns filed for years prior to Fiscal 2017,2020, with limited exceptions, are no longer subject to examination by tax authorities. We are currently under federal audit. The audit may conclude in the next 12 months and the unrecognized tax benefits recognized in relation to the audits may differ from actual settlement amounts. It is not possible to estimate the effect, if any, of the amount of such change during the next 12 months to previously recognized uncertain tax positions in connection with the audits; however, we do not anticipate that total unrecognized tax benefits will significantly change in the next 12 months.

Earnings (Loss) Per Share

Basic net earnings per share amounts are calculated by dividing the net earnings amount by the weighted average shares outstanding during the period. Shares repurchased, if any, are removed from the weighted average number of shares outstanding upon repurchase and delivery.based on the trade settlement date.

Diluted net earnings per share amounts are calculated similarly to the amounts above, except that the weighted average shares outstanding in the diluted net earnings per share calculation also include the potential dilution using the treasury stock method that could occur if dilutive securities, including restricted share awards or other dilutive awards, were converted to shares. The treasury stock method assumes that shares are issued for any restricted share awards, options or other dilutive awards that are "in the money," and that we use the proceeds received to repurchase shares at the average market value of our shares for the respective period. For purposes of the treasury stock method, proceeds consist of cash to be paid and future compensation expense to be recognized.recognized and any cash to be paid. Performance-based and market-based restricted share units are included in the computation of diluted shares only to the extent that the underlying performance or market conditions (i)(1) have been satisfied as of the end of the reporting period or (ii)(2) if the measurement criteria has been satisfied and the result would be dilutive, even if the contingency period has not ended as of the end of the reporting period.

9189

Table of Contents

OXFORD INDUSTRIES, INC.

NOTES TO CONSOLIDATED FINANCIAL STATEMENTS (Continued)

In periods that we incur a loss, we exclude restricted shares or restricted share unit awards as including the awards would be anti-dilutive. During Fiscal 2020, there were 0.4 million restricted shares and restricted share units outstanding that were excluded from the diluted earnings (loss) per share calculation. NaNNo restricted shares or restricted share units were excluded from the diluted earnings per share calculation for Fiscal 20192023 or Fiscal 2018.2022.

Reclassifications

Certain prior period amounts have been reclassified to conform to the current period presentation.

Use of Estimates

The preparation of our consolidated financial statements in conformity with GAAP requires us to make certain estimates and assumptions that affect the amounts reported as assets, liabilities, revenues and expenses in the consolidated financial statements and accompanying notes,notes. Actual results could differ from those estimates. Changes to our estimates particularly given the uncertainties associated with the ultimate impact of the COVID-19 pandemic, the Lanier Apparel exit or other factors. Such changesand assumptions could have a material impact on our consolidated financial statements in future periods.statements.

Accounting Standards Adopted in Fiscal 20202023

In June 2016, the FASB issued guidance, as amended, related to the measurement of credit losses on financial instruments, which requires that companies use a forward-looking current expected loss approach to estimate credit losses on certain financial instruments, including trade and other receivables, as well as other financial assets and instruments. We estimate current expected credit losses based on our historical collection experience, the financial condition of our customers, an evaluation of current economic conditions and anticipated trends. We adopted the guidance on the first day of Fiscal 2020 resulting in a charge of less than $1 million to retained earnings, which is included in the shareholders’ equity statement for Fiscal 2020, and a reduction to various asset amounts included in our consolidated balance sheet.

In December 2019, the FASB amended its guidance related to accounting for income taxes, which simplified the accounting for income taxes by removing certain exceptions in existing guidance to reduce complexity in certain areas. On the first day of Fiscal 2020, we adopted the provisions related to classification of franchise taxes partially based on income and changes in ownership of foreign equity method investments or foreign subsidiaries on a modified retrospective basis while we adopted the other provisions on a prospective basis. The adoption of the new guidance did not have an impact on our consolidated financial statements as of the first day of Fiscal 2020 or during Fiscal 2020.

OtherNo recently issued guidance that was adopted in Fiscal 2020 did not have2023 had a material impact on our consolidated financial statements upon adoption.adoption or is expected to have a material impact in future periods.

Recently Issued Accounting Standards Applicable to Future Years

Recent accounting pronouncements pendingIn November 2023, the Financial Standards Accounting Board (FASB) issued Accounting Standards Update (ASU) 2023-07 "Segment Reporting (Topic 280): Improvements to Reportable Segment Disclosures" which expands annual and interim disclosure requirements for reportable segments, primarily through enhanced disclosures about significant segment expenses. ASU 2023-07 is effective for our annual periods beginning January 1, 2024, and for interim periods beginning January 1, 2025, with early adoption permitted. We are either not applicable or not expected tocurrently evaluating the potential effect that the updated standard will have a material impact on our consolidated financial statements.statement disclosures.

In December 2023, the FASB issued ASU 2023-09 "Income Taxes (Topics 740): Improvements to Income Tax Disclosures" to expand the disclosure requirements for income taxes, specifically related to the rate reconciliation and income taxes paid. ASU 2023-09 is effective for our annual periods beginning January 1, 2025, with early adoption permitted. We are currently evaluating the potential effect that the updated standard will have on our financial statement disclosures.

Note 2. Operating Groups

We identify our operating groups based on the way our management organizes the components of our business for purposes of allocating resources and assessing performance. Our operating group structure reflects a brand-focused management approach, emphasizing operational coordination and resource allocation across each brand’s direct to consumer, wholesale and licensing operations, as applicable. OurWith our acquisition of Johnny Was on September 19, 2022, our business has historically been operated throughis organized as our Tommy Bahama, Lilly Pulitzer, Southern TideJohnny Was and Emerging Brands operating groups. Results for periods prior to Fiscal 2022 also include the Lanier Apparel operating groups.group, which we exited in Fiscal 2021.

Tommy Bahama, Lilly Pulitzer and Southern TideJohnny Was each design, source, market and distribute apparel and related products bearing their respective trademarks and may license their trademarks for other product categories, while Lanier Apparel designs, sources and distributes branded and private label men’s tailored clothing, sportswear and other

92

Table of Contents

OXFORD INDUSTRIES, INC.

NOTES TO CONSOLIDATED FINANCIAL STATEMENTS (Continued)

products. In Fiscal 2020, we made the decision to exit our Lanier Apparel business, which is expected to be completed during the second half of Fiscal 2021. Corporate and Other is a reconciling category for reporting purposes and includes our corporate offices, substantially all financing activities, the elimination of any inter-segment sales and any other items that are not allocated to the operating groups including LIFO inventory accounting adjustments. Because our LIFO inventory pool does not correspond to ourcategories. The Emerging Brands operating group, definitions, LIFO inventory accounting adjustments are not allocated to operating groups. Corporate and Other also includeswhich was organized in Fiscal 2022, consists of the operations of other businesses which are not included in our operating groups, including the operations ofsmaller, earlier stage Southern Tide, TBBC, Duck Head and our Lyons, Georgia distribution center. AsJack Rogers, which is a result of certain organizationalfootwear brand acquired during Fiscal 2023. Prior to Fiscal 2022, Southern Tide was reported as a separate operating group, while both TBBC and management reporting changes in Fiscal 2020, our Duck Head operations, which were previously included in Lanier Apparel, are considered part of and included in Corporate and Other. All prior periodyear amounts for Lanier Apparel and Corporate and Other have been restated to conform to the presentation in the current period.year presentation.

The tables below present certain financial information (in thousands) about our operating groups, as well as Corporate and Other.

Fiscal


Fiscal


Fiscal

2020


2019


2018

Net sales


Tommy Bahama

$

419,817

$

676,652

$

675,358

Lilly Pulitzer


231,078


284,700


272,299

Southern Tide


34,664


46,409


45,248

Lanier Apparel


38,796


95,200


99,904

Corporate and Other


24,478


19,829


14,657

Consolidated net sales

$

748,833

$

1,122,790

$

1,107,466

Depreciation and amortization


Tommy Bahama

$

46,698

$

27,852

$

29,549

Lilly Pulitzer


9,965


10,106


10,605

Southern Tide


676


549


528

Lanier Apparel


1,239


422


415

Corporate and Other


1,336


1,358


1,393

Consolidated depreciation and amortization

$

59,914

$

40,287

$

42,490

Operating income (loss)


Tommy Bahama

$

(53,310)

$

53,207

$

53,139

Lilly Pulitzer


27,702


51,795


47,239

Southern Tide (1)


(64,801)


5,554


5,663

Lanier Apparel


(26,654)


1,953


6,000

Corporate and Other (2)


(6,786)


(18,834)


(21,449)

Consolidated operating (loss) income


(123,849)


93,675


90,592

Interest expense, net


2,028


1,245


2,283

(Loss) earnings before income taxes

$

(125,877)

$

92,430

$

88,309

(1)Southern Tide included a $60 million impairment charge for goodwill and intangible assets in Fiscal 2020, with 0 such charges in Fiscal 2019 or Fiscal 2018.
(2)Corporate and Other included a LIFO accounting credit of $9 million, charge of $1 million and charge of $1 million in Fiscal 2020, Fiscal 2019 and Fiscal 2018, respectively.

9390

Table of Contents

OXFORD INDUSTRIES, INC.

NOTES TO CONSOLIDATED FINANCIAL STATEMENTS (Continued)

Each of the brands included in Emerging Brands designs, sources, markets and distributes apparel and related products bearing its respective trademarks and is supported by Oxford’s emerging brands team that provides certain support functions to the smaller brands, including marketing and advertising execution, analysis and other functions. The shared resources provide for operating efficiencies and enhanced knowledge sharing across the brands.

Corporate and Other is a reconciling category for reporting purposes and includes our corporate offices, substantially all financing activities, the elimination of inter-segment sales, any other items that are not allocated to the operating groups, including LIFO inventory accounting adjustments as our LIFO pool does not correspond to our operating group definitions, and the operations of our Lyons, Georgia distribution center and our Oxford America business, which we exited in Fiscal 2022.

The tables below present certain financial information (in thousands) about our reportable operating groups, as well as Corporate and Other.


Fiscal 2020


Fiscal 2019


Fiscal 2018

Fiscal


Fiscal


Fiscal

Purchases of Property and Equipment


2023


2022


2021

Net sales


Tommy Bahama

$

19,666

$

31,272

$

25,111

$

898,807

$

880,233

$

724,305

Lilly Pulitzer


7,059


4,273


10,777


343,499


339,266


298,995

Southern Tide


1,423


289


149

Lanier Apparel


21


571


99

Johnny Was (1)

202,859

72,591

Emerging Brands


126,825


116,484


90,053

Lanier Apparel (2)


24,858

Corporate and Other


755


1,016


907


(515)


2,954


3,868

Purchases of Property and Equipment

$

28,924

$

37,421

$

37,043

Consolidated net sales

$

1,571,475

$

1,411,528

$

1,142,079

Depreciation and amortization


Tommy Bahama

$

26,133

$

26,807

$

27,830

Lilly Pulitzer


16,603


12,784


11,678

Johnny Was (1)

18,794

7,199

Emerging Brands


2,003


1,582


1,298

Lanier Apparel (2)


107

Corporate and Other


533


663


685

Consolidated depreciation and amortization

$

64,066

$

49,035

$

41,598

Operating income (loss)


Tommy Bahama

$

160,543

$

172,761

$

111,733

Lilly Pulitzer


56,110


67,098


63,601

Johnny Was (1)

(104,776)

(1,544)

Emerging Brands (3)


6,714


15,602


16,649

Lanier Apparel (2)


4,888

Corporate and Other (4)


(37,609)


(35,143)


(31,368)

Consolidated operating income


80,982


218,774


165,503

Interest expense, net


6,036


3,049


944

Earnings before income taxes

$

74,946

$

215,725

$

164,559


January 30,


February 1,

2021

2020

Total Assets


Tommy Bahama (1)

$

569,854

$

668,197

Lilly Pulitzer (2)


176,467


199,913

Southern Tide (3)


31,641


99,667

Lanier Apparel (4)


10,967


39,207

Corporate and Other (5)


76,705


26,385

Total Assets

$

865,634

$

1,033,369

(1)DecreaseIn Fiscal 2023, the operating loss for Johnny Was resulted from a $111 million impairment charge for goodwill and intangible assets with no such charges in Fiscal 2022. Financial information for Fiscal 2022 consists of 19 weeks from the September 19, 2022, acquisition date through January 28, 2023, only.
(2)In Fiscal 2021, we exited our Lanier Apparel business, which is discussed in more detail in Note 12.

91

Table of Contents

OXFORD INDUSTRIES, INC.

NOTES TO CONSOLIDATED FINANCIAL STATEMENTS (Continued)

(3)The operating income for Emerging Brands in Fiscal 2023 included a $2 million impairment charge related to an unconsolidated entity.
(4)The operating loss for Corporate and Other included a LIFO accounting charge of $10 million, $3 million and $16 million in Fiscal 2023, Fiscal 2022 and Fiscal 2021, respectively. The operating loss for Corporate and Other in Fiscal 2022 also included $3 million of transaction expenses and integration costs associated with the Johnny Was acquisition. Fiscal 2021 also included a gain on sale of an unconsolidated entity of $12 million, respectively.


Fiscal 2023


Fiscal 2022


Fiscal 2021

Purchases of Property and Equipment


Tommy Bahama

$

39,060

$

17,019

$

12,887

Lilly Pulitzer


24,100


23,990


17,305

Johnny Was (1)

6,105

1,655

Emerging Brands


3,768


3,176


1,405

Lanier Apparel (2)


5

Corporate and Other


1,065


828


292

Purchases of Property and Equipment

$

74,098

$

46,668

$

31,894


February 3,


January 28,

2024

2023

Total Assets


Tommy Bahama (3)

$

556,431

$

569,833

Lilly Pulitzer (4)


194,871


211,119

Johnny Was (1)

251,429


334,603

Emerging Brands (5)


98,816


91,306

Corporate and Other (6)


(3,703)


(18,196)

Total Assets

$

1,097,844

$

1,188,665

(1)The financial information for Johnny Was for Fiscal 2022 consists of 19 weeks from the September 19, 2022, acquisition date through January 28, 2023, only. The decrease in Johnny Was total assets during Fiscal 2023 relates primarily to the $111 million impairment charge for goodwill and intangible assets.
(2)Lanier Apparel was exited during Fiscal 2021.
(3)Increase in Tommy Bahama total assets includes reductionsincreases in receivables, operating lease assets and property plant and equipment inventories and receivables.partially offset by reductions in inventories.
(2)(4)Decrease in Lilly Pulitzer total assets includes reductions in operating lease assets, receivables, inventories and property and equipment.
(3)Decreasepartially offset by increases in Southern Tide total assets was primarily due to the $60 million impairment charge for goodwill and intangible assets in the First Quarter of Fiscal 2020, as well as reductions in inventories and receivables.
(4)Decrease in Lanier Apparel total assets includes reductions in inventories, receivables, operating lease assets, prepaid expenses and property and equipment.
(5)Increase in Emerging Brands total assets includes increases in operating lease assets and property plant and equipment from the opening of new retail store locations. Goodwill and intangible assets also increased related to the current year acquisition of Jack Rogers and six former Southern Tide Signature Stores. These increase were partially offset by reductions in inventories.
(6)Decrease in Corporate and Other total assets includes increased income tax receivable, cash,reductions in inventories, primarily due to the reversal of inventory markdowns as partimpact of LIFO accounting and investments in unconsolidated entities.accounting.

Net book value of our property and equipment and net sales by geographic area are presented in the tables below (in thousands). The other foreign amounts primarily relate to our Tommy Bahama operations in Canada and Australia.


January 30,


February 1,

2021

2020

Net Book Value of Property and Equipment

United States

$

155,902

$

187,032

Other foreign


3,830


4,485

$

159,732

$

191,517


Fiscal 2020


Fiscal 2019


Fiscal 2018

Net Sales

United States

$

728,308

$

1,086,170

$

1,067,235

Other foreign


20,525


36,620


40,231

$

748,833

$

1,122,790

$

1,107,466

9492

Table of Contents

OXFORD INDUSTRIES, INC.

NOTES TO CONSOLIDATED FINANCIAL STATEMENTS (Continued)

Net book value of our property and equipment and net sales by geographic area are presented in the tables below (in thousands). The other foreign amounts primarily relate to our Tommy Bahama operations in Canada and Australia.


February 3,


January 28,

2024

2023

Net Book Value of Property and Equipment

United States

$

192,329

$

174,044

Other foreign


2,808


3,540

$

195,137

$

177,584


Fiscal 2023


Fiscal 2022


Fiscal 2021

Net Sales

United States

$

1,532,100

$

1,372,278

$

1,112,384

Other foreign


39,375


39,250


29,695

$

1,571,475

$

1,411,528

$

1,142,079

The tables below quantify net sales, for each operating group and in total (in thousands), and the percentage of net sales by distribution channel for each operating group and in total, for each period presented.presented, except that the amounts included for Johnny Was in Fiscal 2022 represent the post-acquisition period only. We have calculated all percentages below based on actual data, and percentages may not add to 100 due to rounding.

Fiscal 2020


Fiscal 2023


Net Sales


Retail


Ecommerce


Restaurant


Wholesale


Other


Net Sales


Retail


Ecommerce


Food & Beverage


Wholesale


Other


Tommy Bahama

$

419,817


37

%  

36

%  

11

%  

16

%  

%

$

898,807


45

%  

25

%  

13

%  

17

%  

%

Lilly Pulitzer


231,078


20

%  

64

%  

%  

16

%  

%


343,499


33

%  

51

%  

%  

16

%  

%

Southern Tide


34,664


4

%  

32

%  

%  

64

%  

%

Lanier Apparel


38,796


%  

%  

%  

100

%  

%

Johnny Was

202,859

38

%  

41

%  

%  

21

%  

%  

Emerging Brands


126,825


11

%  

43

%  

%  

46

%  

%

Corporate and Other


24,478


%  

63

%  

%  

33

%  

4

%


(515)


%  

%  

%  

%  

NM

%

Consolidated net sales

$

748,833


27

%  

43

%  

7

%  

23

%  

%

$

1,571,475


39

%  

34

%  

7

%  

20

%  

%


Fiscal 2019


Fiscal 2022


Net Sales


Retail


Ecommerce


Restaurant


Wholesale


Other


Net Sales


Retail


Ecommerce


Food & Beverage


Wholesale


Other


Tommy Bahama

$

676,652


48

%  

20

%  

12

%  

20

%  

%

$

880,233


46

%  

24

%  

13

%  

17

%  

%

Lilly Pulitzer


284,700


41

%  

38

%  

%  

21

%  

%


339,266


33

%  

51

%  

%  

16

%  

%

Southern Tide


46,409


%  

21

%  

%  

79

%  

%

Lanier Apparel


95,200


%  

%  

%  

100

%  

%

Johnny Was (1)

72,591

36

%  

42

%  

%  

22

%  

%  

Emerging Brands


116,484


6

%  

42

%  

%  

52

%  

%

Corporate and Other


19,829


%  

59

%  

%  

34

%  

7

%


2,954


%  

%  

%  

%  

NM

%

Consolidated net sales

$

1,122,790


39

%  

23

%  

8

%  

30

%  

%

$

1,411,528


39

%  

33

%  

8

%  

20

%  

%

Fiscal 2018


Fiscal 2021


Net Sales


Retail


Ecommerce


Restaurant


Wholesale


Other


Net Sales


Retail


Ecommerce


Food & Beverage


Wholesale


Other


Tommy Bahama

$

675,358


48

%  

18

%  

13

%  

21

%  

%

$

724,305


47

%  

25

%  

13

%  

15

%  

%

Lilly Pulitzer


272,299


42

%  

36

%  

%  

22

%  

%


298,995


34

%  

50

%  

%  

16

%  

%

Southern Tide


45,248


%  

18

%  

%  

82

%  

%

Johnny Was

%  

%  

%  

%  

%  

Emerging Brands


90,053


5

%  

39

%  

%  

56

%  

%

Lanier Apparel


99,904


%  

%  

%  

100

%  

%


24,858


%  

%  

%  

100

%  

%

Corporate and Other


14,657


%  

54

%  

%  

30

%  

16

%


3,868


%  

%  

%  

61

%  

39

%

Consolidated net sales

$

1,107,466


40

%  

21

%  

8

%  

31

%  

%

$

1,142,079


39

%  

32

%  

8

%  

20

%  

%

93

Table of Contents

OXFORD INDUSTRIES, INC.

NOTES TO CONSOLIDATED FINANCIAL STATEMENTS (Continued)

Note 3. Property and Equipment, Net

Property and equipment, carried at cost,net, is summarized as follows (in thousands):


January 30,


February 1,


February 3,


January 28,

2021

2020

2024

2023

Land

$

3,166

$

3,166

$

2,887

$

3,090

Buildings and improvements


39,559


39,563


32,651


32,495

Furniture, fixtures, equipment and technology


231,493


240,527


315,810


278,589

Leasehold improvements


237,360


231,089


270,861


255,955


511,578


514,345


622,209


570,129

Less accumulated depreciation and amortization


(351,846)


(322,828)


(427,072)


(392,545)

Property and equipment, net

$

159,732

$

191,517

$

195,137

$

177,584

Note 4. Business Combinations

During Fiscal 2023, we completed business combinations that were insignificant, individually and in the aggregate, to the consolidated financial statements for an aggregate purchase price of $11 million. The business combinations included the acquisition of certain assets from Jack Rogers LLC and Jack Rogers Holding Company LLC and their subsidiaries (collectively “Jack Rogers”) and the acquisition of six former Southern Tide signature stores. The assets acquired and liabilities assumed were recorded based on the provisional estimated fair values, including intangible assets of $5 million, inventory of $3 million and goodwill of $3 million. See "Note 5—Intangible Assets and Goodwill" for the allocation of goodwill to the respective segments. The operating results of each acquisition have been included in the consolidated financial statements since the respective acquisition dates.

Johnny Was

On September 19, 2022, we acquired 100% of the ownership interests in JW Holdings, LLC and its subsidiaries (collectively “Johnny Was”). Johnny Was owns the Johnny Was California lifestyle brand and its related operations including the design, sourcing, marketing and distribution of collections of affordable luxury, artisan-inspired bohemian apparel, accessories and home goods.  

This acquisition was accounted for under the acquisition method of accounting for business combinations. The preliminary purchase price for the acquisition of Johnny Was totaled $270 million in cash. After giving effect to the initial working capital adjustment,the purchase price paid at closing was $271 million, including acquired cash of $7 million. We used cash and short-term investments on hand and borrowings under our U.S. Revolving Credit Agreement to fund the transaction. During Fiscal 2023, additional consideration of $2 million was transferred related to measurement period adjustments. There were no contingent consideration arrangements associated with this transaction.

94

Table of Contents

OXFORD INDUSTRIES, INC.

NOTES TO CONSOLIDATED FINANCIAL STATEMENTS (Continued)

The final estimated acquisition-date fair values of major classes of assets acquired and liabilities assumed, including a reconciliation to the total purchase consideration, were as follows (in thousands):


Provisional Amounts at
January 28, 2023

Measurement Period Adjustments

Final Amounts at
February 3, 2024

Cash and cash equivalents

$

7,296

$

$

7,296

Receivables


8,777


8,777

Inventories


23,434


(28)


23,406

Prepaid expenses and other assets


6,353


6,353

Property and equipment


21,108


(947)


20,161

Intangible assets


134,640


134,640

Goodwill


96,637


2,599


99,236

Operating lease assets

54,859

54,859

Accounts payable, accrued expenses and other liabilities


(34,777)


699


(34,078)

Non-current portion of operating lease liabilities

(47,009)

(47,009)

Purchase price

$

271,318

$

2,323

$

273,641

Goodwill represents the amount by which the cost to acquire Johnny Was exceeds the fair value of individual acquired assets less liabilities of the business at acquisition. We made measurement-period adjustments, as shown in the table above, that increased the amount of provisional goodwill by $3 million. Substantially all the goodwill is deductible for income tax purposes.

We acquired tradenames and trademarks as well as customer relationships as part of the acquisition. We used the relief from royalty method to estimate the fair value of trademarks and tradenames and the multi-period excess earnings method under the income approach to estimate the fair value of customer relationships. Intangible assets allocated in connection with our preliminary purchase price allocation consisted of the following (in thousands):


Johnny Was

Useful life

acquisition

Finite lived intangible assets acquired, primarily consisting of customer relationships


8 - 13 years

$

56,740

Trade names and trademarks


Indefinite


77,900

$

134,640

The consolidated pro forma information presented below (in thousands, except per share data) gives effect to the September 19, 2022 acquisition of Johnny Was as if the acquisition had occurred as of the beginning of Fiscal 2021. The information presented below is for illustrative purposes only, is not indicative of results that would have been achieved if the acquisition had occurred as of the beginning of Fiscal 2021 and is not intended to be a projection of future results of operations. The consolidated pro forma information has been prepared from historical financial statements for Johnny Was and us for the periods presented, including without limitation, purchase accounting adjustments, but excluding any seller specific management/advisory or similar expenses and any synergies or operating cost reductions that may be achieved from the combined operations in the future.


Fiscal 2022


Fiscal 2021

Net sales


$

1,546,371


$

1,327,875

Earnings before income taxes

$

237,919

$

169,832

Net earnings

$

182,380

$

135,276

Earnings per share:

Basic

$

11.47

$

8.02

Diluted

$

11.22

$

8.13

95

Table of Contents

OXFORD INDUSTRIES, INC.

NOTES TO CONSOLIDATED FINANCIAL STATEMENTS (Continued)

The Fiscal 2022 pro forma information above includes amortization of acquired intangible assets, but excludes the transaction expenses and integration costs associated with the transaction and the $4 million of incremental cost of goods sold associated with the step-up of inventory at acquisition that was recognized by us in our Fiscal 2022 consolidated statement of operations. The Fiscal 2021 pro forma information above includes amortization of acquired intangible assets, transaction expenses and integration costs associated with the transaction and the $4 million of incremental cost of goods sold associated with the step-up of inventory at acquisition. Additionally, the pro forma adjustments for each period prior to the September 2022 acquisition reflect an estimate of incremental interest expense associated with additional borrowings and income tax expense that would have been incurred subsequent to the acquisition.

Note 4.5. Intangible Assets and Goodwill

Intangible assets by category are summarized below (in thousands):


February 3,


January 28,

2024


2023

Intangible assets with finite lives

$

113,413

$

108,513

Accumulated amortization and impairment


(64,812)


(50,068)

Total intangible assets with finite lives, net


48,601


58,445

Intangible assets with indefinite lives:


Tommy Bahama Trademark

$

110,700

$

110,700

Lilly Pulitzer Trademark


27,500


27,500

Johnny Was Trademark

66,000

77,900

Southern Tide Trademark


9,300


9,300

Total intangible assets with indefinite lives

$

213,500

$

225,400

Total intangible assets, net

$

262,101

$

283,845

As discussed

Intangible assets, by operating group and in Note 1,total, for Fiscal 2021, Fiscal 2022 and Fiscal 2023 are as follows (in thousands):


Tommy


Lilly


Johnny


Emerging


Lanier


Corporate 


Bahama

Pulitzer

Was

Brands

Apparel

and Other

Total

Balance, January 30, 2021

$

110,700

$

28,317

$

$

17,170

$

$

$

156,187

Acquisition

Impairment


Amortization


(220)


(660)


(880)

Balance, January 29, 2022

$

110,700

$

28,097

$

$

16,510

$

$

$

155,307

Acquisition

134,640

134,640

Impairment


Amortization


(238)


(5,194)


(670)


(6,102)

Balance, January 28, 2023

$

110,700

$

27,859

$

129,446

$

15,840

$

$

$

283,845

Acquisition

4,899

4,899

Impairment


(11,900)


(11,900)

Amortization


(227)


(13,852)


(664)


(14,743)

Balance, February 3, 2024

$

110,700

$

27,632

$

103,694

$

20,075

$

$

$

262,101

Based on the COVID-19 pandemic has had a significant negative impact oncurrent estimated useful lives assigned to our intangible assets, amortization expense for each of our operating groups. Thus, certain goodwillthe next five years is expected to be$12 million, $9 million, $6 million, $5 million and indefinite-lived intangible asset impairment testing was required in the First Quarter of Fiscal 2020, which resulted in significant impairment charges in Southern Tide as shown in the tables below. Impairment of goodwill and intangible assets are included in impairment of goodwill and intangible assets in our consolidated statements of operations. No additional tests were required in the Second Quarter of Fiscal 2020 or the$4 million.

9596

Table of Contents

OXFORD INDUSTRIES, INC.

NOTES TO CONSOLIDATED FINANCIAL STATEMENTS (Continued)

Third Quarter of Fiscal 2020. Further, no impairment was required based on our annual tests for impairment of goodwill and intangible assets with indefinite lives performed as of the first day of the Fourth Quarter of Fiscal 2020.

Intangible assets by category are summarized below (in thousands):


January 30,


February 1,

2021


2020

Intangible assets with finite lives

$

51,929

$

51,929

Accumulated amortization and impairment


(43,242)


(41,924)

Total intangible assets with finite lives, net


8,687


10,005

Intangible assets with indefinite lives:


Tommy Bahama Trademarks

$

110,700

$

110,700

Lilly Pulitzer Trademarks


27,500


27,500

Southern Tide Trademarks


9,300


26,800

Total intangible assets, net

$

156,187

$

175,005

Intangible assets,Goodwill, by operating group and in total, for Fiscal 2018,2021, Fiscal 20192022 and Fiscal 2020 are2023 is as follows (in thousands):


Tommy


Lilly


Southern


Lanier


Corporate 


Tommy


Lilly


Johnny


Emerging


Corporate


Bahama

Pulitzer

Tide

Apparel

and Other

Total

Bahama

Pulitzer

Was

Brands

and Other

Total

Balance, February 3, 2018

$

112,157


29,749


29,689


277


6,986

$

178,858

Balance, January 30, 2021

$

788

$

19,522

$

$

3,600

$

$

23,910

Other, including foreign currency


(41)


(41)

Balance January 29, 2022

$

747

$

19,522

$

$

3,600

$

$

23,869

Acquisition

96,637

96,637

Other, including foreign currency


(8)


(8)

Balance, January 28, 2023

$

739

$

19,522

$

96,637

$

3,600

$

$

120,498

Acquisition

3,371

3,371

Measurement-period adjustments


2,599


2,599

Impairment


(99,236)


(99,236)

Amortization


(1,385)


(533)


(288)


(31)


(373)


(2,610)

Other, including foreign currency


(72)


(72)


(42)


(42)

Balance February 2, 2019

$

110,700

$

29,216

$

29,401

$

246

$

6,613

$

176,176

Impairment


Amortization


(475)


(291)


(31)


(374)


(1,171)

Other, including foreign currency


Balance, February 1, 2020


110,700


28,741


29,110


215


6,239


175,005

Impairment


(17,500)


(207)


(17,707)

Amortization


(424)


(288)


(8)


(391)


(1,111)

Other, including foreign currency


Balance, January 30, 2021

$

110,700

$

28,317

$

11,322

$

$

5,848

$

156,187

Balance, February 3, 2024

$

697

$

19,522

$

$

6,971

$

$

27,190

Goodwill and Other Intangible Assets Impairment Testing

We assess the recoverability of goodwill and other indefinite-lived intangible assets annually, at the beginning of the fourth quarter of each fiscal year, and between annual tests if an event occurs or circumstances change that would indicate that it is more likely than not that the carrying amount may be impaired. Intangible assets with finite lives are amortized over their estimated useful life and are tested for impairment, along with other long-lived assets, when events and circumstances indicate that the assets might be impaired. Please see Note 1, “Summary of Significant Accounting Policies,” for discussion of the Company’s goodwill and intangible assets impairment testing process.  

Based on our annual quantitative assessment as of October 29, 2023, and in conjunction with our fourth quarter annual forecasting process for 2024 which impacts key assumptions used in our impairment assessments, it was determined that the Johnny Was reporting unit and intangible assets with an indefinite life were impaired. The impairment charges for Johnny Was reflect the current estimated useful lives assignedchallenging macroeconomic environment that has resulted in a more cautious consumer and an increase in interest rates. The more cautious consumer has both negatively impacted Johnny Was’ wholesale customers and direct to consumer operations resulting in Johnny Was not performing as originally projected in Fiscal 2023 and the moderation of forecasted revenue and operating income in future years. Interest rates also increased significantly after the acquisition of Johnny Was in September 2022 leading to an increase in discount rates used in our impairment analyses. We recorded $111 million of noncash impairment charges during the fourth quarter of Fiscal 2023, including a goodwill impairment of $99 million and an intangible asset impairment of $12 million, which were included in Impairment of goodwill, intangible assets and equity method investments in our Consolidated Statements of Operations.

amortization

expense

Note 6. Debt

On March 6, 2023, we entered into a Second Amendment to the Fourth Amended and Restated Credit Agreement (the “U.S. Revolving Credit Agreement”). The U.S. Revolving Credit Agreement provides for eacha revolving credit facility of up to $325 million, which may be used to fund working capital, to fund future acquisitions and for general corporate purposes. The U.S. Revolving Credit Agreement amended and restated our Fourth Amended and Restated Credit Agreement (the “Prior Credit Agreement”). The U.S. Revolving Credit Agreement (1) extended the maturity of the next fiveyears is expectedfacility from July 2024 to be $1March 2028 and (2) modified certain provisions of the agreement. In other non-current assets, we capitalized debt issuance costs of $2 million per year.in connection with commitments upon entering into the U.S. Revolving Credit Agreement.

9697

Table of Contents

OXFORD INDUSTRIES, INC.

NOTES TO CONSOLIDATED FINANCIAL STATEMENTS (Continued)

Goodwill, by operating group and in total, for Fiscal 2018, Fiscal 2019 and Fiscal 2020 is as follows (in thousands):


Tommy


Lilly


Southern


Corporate


Bahama

Pulitzer

Tide

and Other

Total

Balance, February 3, 2018

$

821


19,522


42,745


3,615

$

66,703

Impairment


Other, including foreign currency


(67)


(15)


(82)

Balance February 2, 2019

$

754

$

19,522

$

42,745

$

3,600

$

66,621

Impairment


Other, including foreign currency


(43)


(43)

Balance, February 1, 2020


711


19,522


42,745


3,600


66,578

Impairment


(42,745)


(42,745)

Other, including foreign currency


77


77

Balance, January 30, 2021

$

788

$

19,522

$

$

3,600

$

23,910

Note 5. Debt

As of January 30, 2021 and February 1, 2020, we had 0 amounts outstanding under our $325 million Fourth Amended and Restated Credit Agreement (as amended, the “U.S. Revolving Credit Agreement”). In July 2019, we amendedPursuant to the U.S. Revolving Credit Agreement, by entering into the First Amendmentinterest rate applicable to our borrowings under the Fourth Amended and RestatedU.S.  Revolving Credit Agreement is based on either the Term Secured Overnight Financing Rate plus an applicable margin of 135 to (1) extend the maturity185 basis points or prime plus an applicable margin of the facility25 to July 2024 and (2) modify certain provisions including a reduction of interest rates on certain borrowings and a reduction in unused line fees. 75 basis points.

The U.S. Revolving Credit Agreement generally (1) is limited to a borrowing base consisting of specified percentages of eligible categories of assets, (2) accrues variable-rate interest (weighted average interest rate of 7% as of February 3, 2024), unused line fees and letter of credit fees based upon average utilization or unused availability, or utilization,as applicable, (3) requires periodic interest payments with principal due at maturity (July 2024) and (4) is secured by a first priority security interest in substantially all of the assets of Oxford Industries, Inc. and its domestic subsidiaries, including accounts receivable, books and records, chattel paper, deposit accounts, equipment, certain general intangibles, inventory, investment property (including the equity interests of certain subsidiaries), negotiable collateral, life insurance policies, supporting obligations, commercial tort claims, cash and cash equivalents, eligible trademarks, proceeds and other personal property.

ToWe have issued standby letters of credit of $5 million in the extent cash flow needs exceed cash flow provided by our operations we will have access, subject to its terms, to ouraggregate under the U.S. Revolving Credit Agreement to provide funding for operating activities, capital expenditures and acquisitions, if any. Ouras of February 3, 2024. Outstanding letters of credit under the U.S. Revolving Credit Agreement is also used to establish collateral for certain insurance programs and leases and to finance trade letters of credit for product purchases, which reduce the amounts available under our line of credit when issued. As of January 30, 2021, $3 million of letters of credit were outstanding against our U.S. Revolving Credit Agreement. After considering these limitations and the amount of eligible assets in our borrowing base, as applicable, asborrowings available to us.

As of January 30, 2021,February 3, 2024, we had $301$29 million of borrowings outstanding and $288 million in unused availability under the U.S. Revolving Credit Agreement. Under the Prior Credit Agreement subject to certain limitations on borrowings.as of January 28, 2023 we had $119 million of borrowings outstanding and $199 million of unused availability.

Compliance with Covenants Other Restrictions and Prepayment Penalties

The U.S. Revolving Credit Agreement is subject to a number of affirmative covenants regarding the delivery of financial information, compliance with law, maintenance of property, insurance requirements and conduct of business. Also, the U.S. Revolving Credit Agreement is subject to certain negative covenants or other restrictions including, among other things, limitations on our ability to (1) incur debt, (2) guaranty certain obligations, (3) incur liens, (4) pay dividends to shareholders, (5) repurchase shares of our common stock, (6) make investments, (7) sell assets or stock of subsidiaries, (8) acquire assets or businesses, (9) merge or consolidate with other companies or (10) prepay, retire, repurchase or redeem debt.

97

Table of Contents

OXFORD INDUSTRIES, INC.

NOTES TO CONSOLIDATED FINANCIAL STATEMENTS (Continued)

Additionally, the U.S. Revolving Credit Agreement contains a financial covenant that applies only if excess availability under the agreement for three consecutive business days is less than the greater of (1) $23.5 million or (2) 10% of availability. In such case, our fixed charge coverage ratio as defined in the U.S. Revolving Credit Agreement must not be less than 1.0 to 1.0 for the immediately preceding 12 fiscal months for which financial statements have been delivered. This financial covenant continues to apply until we have maintained excess availability under the U.S. Revolving Credit Agreement of more than the greater of (1) $23.5 million or (2) 10% of availability for 30 consecutive days.

We believe that the affirmative covenants, negative covenants, financial covenants and other restrictions under the U.S. Revolving Credit Agreement are customary for those included in similar facilities entered into at the time we amended the U.S. Revolving Credit Agreement. During Fiscal 20202023 and as of January 30, 2021,February 3, 2024, no financial covenant testing was required pursuant to our U.S. Revolving Credit Agreement, or the Prior Credit Agreement, as applicable, as the minimum availability threshold was met at all times. As of January 30, 2021,February 3, 2024, we were compliant with all applicable covenants related to the U.S. Revolving Credit Agreement.

Note 6.7. Leases and Other Commitments

For Fiscal 2020,2023, operating lease expense, which includes amounts used in determining the operating lease liability and operating lease asset was $64$71 million and variable lease expense was $30$48 million, resulting in total lease expense of $93

98

Table of Contents

OXFORD INDUSTRIES, INC.

NOTES TO CONSOLIDATED FINANCIAL STATEMENTS (Continued)

$119 million. For Fiscal 2019,2022, operating lease expense, which includes amounts used in determining the operating lease liability and operating lease asset was $66$61 million and variable lease expense was $34$43 million, resulting in total lease expense of $99$104 million.  For Fiscal 2021, operating lease expense was $58 million and variable lease expense was $35 million, resulting in total lease expense of $93 million. As of both February 3, 2024 and January 30, 2021 and February 1, 2020,28, 2023, the weighted-average remaining operating lease term was six years and seven years, respectively, and theyears. The weighted-average discount rate for operating leases was 4.1%5.7% and 4.0%,4.7% as of February 3, 2024 and January 28, 2023, respectively. Cash paid for lease amounts included in the measurement of operating lease liabilities in Fiscal 20202023, Fiscal 2022 and Fiscal 20192021 was $63$89 million, $75 million and $70 million, respectively.

As of January 30, 2021,February 3, 2024, the required lease liability payments, which include base rent amounts but excludes payments for real estate taxes, sales taxes, insurance, other operating expenses and contingent rents incurred under operating lease agreements, for the fiscal years specified below were as follows (in thousands):


Operating lease


Operating lease

2021

70,338

2022

64,553

2023


57,655

2024


45,826

78,886

2025

32,719

64,045

After 2025


68,247

2026


58,746

2027


45,053

2028

39,334

After 2028


82,348

Total lease payments

$

339,338

$

368,412

Less: Difference between discounted and undiscounted lease payments


38,489


60,133

Present value of lease liabilities

$

300,849

$

308,279

Disclosures related to periods prior to adoption of revised accounting guidance

Total rent expense in Fiscal 2018 was $96 million, which includes base rent amounts, real estate taxes, sales taxes, insurance, other operating expenses and contingent rents incurred under all leases. Payments for real estate taxes, sales taxes, insurance, other operating expenses and contingent percentage rent are included in rent expense, but are generally not included in the aggregate minimum rental commitments, as, in most cases, the amounts payable in future periods are not quantified in the lease agreement or may be dependent on future events. The total amount of such charges included in total rent expense above were $28 million in Fiscal 2018.

98

Table of Contents

OXFORD INDUSTRIES, INC.

NOTES TO CONSOLIDATED FINANCIAL STATEMENTS (Continued)

Note 7. Commitments and Contingencies

As of January 30, 2021, we are a party to certain apparel license and design agreements, primarily within our Lanier Apparel operating group, which contemplate minimum royalty and advertising payments of $4 million in respect of Fiscal 2021.

In connection with our Fiscal 2017 acquisition of TBBC, we entered into a contingent consideration agreement which requires us to make cash payments to the sellers of up to $4 million in the aggregate subject to TBBC’s achievement of certain earnings targets over a four year period subsequent to the acquisition. Pursuant to this contingent consideration agreement, as of January 30, 2021, $1 million, in the aggregate, was earned related to Fiscal 2018 and Fiscal 2019 and has been paid to the sellers, and $1 million was earned related to Fiscal 2020 and is payable in Fiscal 2021. NaN of the sellers of TBBC is an employee and continues to manage the operations of TBBC.

During the 1990s, we discovered the presence of hazardous waste on 1 of our properties. We believe that remedial or other activities may be required, including continued investigation and monitoring of groundwater and soil, although the timing and extent of such activities is uncertain. As of both January 30, 2021 and February 1, 2020, the reserve for the remediation of this site was less than $1 million, which is included in other non-current liabilities in our consolidated balance sheets. The amount recorded represents our estimate of the costs, on an undiscounted basis, to clean up and monitor the site as well as any associated legal and consulting fees, based on currently available information. This estimate may change in future periods as more information on the activities required and timing of those activities become known.

Note 8. Shareholders’ Equity and Equity Compensation

Common Stock

We had 60 million shares of $1.00 par value per share common stock authorized for issuance as of February 3, 2024 and January 30, 202128, 2023. As of February 3, 2024 and February 1, 2020. WeJanuary 28, 2023, we had 1716 million shares and 16 million shares, respectively, of common stock issued and outstanding.

Dividends

During Fiscal 2023, Fiscal 2022 and Fiscal 2021, we paid $42 million, $35 million and $28 million, respectively, of dividends to our shareholders. Although we have paid dividends in each quarter since we became a public company in July 1960, we may discontinue or modify dividend payments at any time if we determine that other uses of our capital, including payment of outstanding asdebt, funding of January 30,acquisitions, funding of capital expenditures or repurchases of outstanding shares, may be in our best interest; if our expectations of future cash flows and future cash needs outweigh the ability to pay a dividend; or if the terms of our credit facility, other debt instruments or applicable law limit our ability to pay dividends.

Share Repurchases

During Fiscal 2023, Fiscal 2022 and Fiscal 2021, and February 1, 2020. During the First Quarter of Fiscal 2020, we repurchased 0.3$20 million, $92 million and $8 million, respectively in open market transactions. Additionally, during Fiscal 2023, Fiscal 2022 and Fiscal 2021, we purchased $10 million, $3 million and $3 million, respectively, of shares from our employees to cover employee tax liabilities related to the vesting of shares of our stock.

99

Table of Contents

OXFORD INDUSTRIES, INC.

NOTES TO CONSOLIDATED FINANCIAL STATEMENTS (Continued)

On December 7, 2021, our Board of Directors authorized us to spend up to $150 million to repurchase shares of our stock in open market transactions. This authorization superseded and replaced all previous authorizations to repurchase shares of our stock and has no automatic expiration. Pursuant to the Board of Directors’ December 7, 2021, authorization, we repurchased 196,000 shares of our common stock underfor $20 million, an average price of $102 per share, in open market transactions during Fiscal 2023.  As of February 3, 2024, $30 million of the authorization remained available for future repurchases of our common stock.

Preferred Stock

We had 30 million shares of $1.00 par value preferred stock repurchase program (Rule 10b5-1 plan).authorized for issuance as of February 3, 2024 and January 28, 2023. No preferred shares were issued or outstanding as of February 3, 2024 or January 28, 2023.

Note 9. Equity Compensation

Long-Term Stock Incentive Plan and Equity Compensation Expense

As of January 30, 2021, less than 1 millionFebruary 3, 2024, shares were available for issuance under our Long-Term Stock Incentive Plan (the "Long-Term“Long- Term Stock Incentive Plan"Plan”). were less than 1 million shares, which includes the additional shares approved for grant under the Long-Term Stock Incentive Plan by shareholders in June 2022. The Long-Term Stock Incentive Plan allows us to grant equity-based awards to employees and non-employee directors in the form of, among other things, stock options, stock appreciation rights, restricted shares and/or restricted share units. NaNNo additional shares are available under any predecessor plans.

RestrictedThe specific provisions of restricted share awards are evidenced by agreements with the employee as determined by the compensation committee of our Board of Directors. Restricted shares and restricted share units granted to officers and other key employees in recent years generally vest three or four years from the date of grant if (1) the performance or market threshold, if any, was met and (2) the employee is still employed by us on the vesting date. The employee generally is restricted from transferring or selling any restricted shares or restricted share units and forfeits the awards upon the termination of employment prior to the end of the vesting period. The restricted share unit awards granted during Fiscal 2022 and Fiscal 2023 include certain clauses related to accelerated vesting upon the occurrence of qualifying retirement, death or disability of the employee prior to the vesting date, while the restricted share awards granted in prior years did not include such clauses.

In recent years, we have granted a combination of service-based restricted share awards and awards based on total shareholder return (“TSR”) to certain of our employees. As of February 3, 2024, there was $20 million of unrecognized compensation expense related to the unvested service-based and TSR-based restricted share awards included in the tables below, which have been granted to employees but have not yet vested. As of February 3, 2024, the weighted average remaining life of the outstanding service-based and TSR-based awards was one year and two years, respectively.

Service-Based and Performance-Based Restricted Share Awards

During Fiscal 2023 and Fiscal 2022, we granted service-based restricted share and restricted share unit awards, while in Fiscal 2021 and years prior we granted service-based restricted shares. At the time that service-based restricted sharesshare unit awards are granted, the employee is generally, subject to the terms of the respective agreement, entitled to dividend equivalents, payable at the time of payment of any dividends paid on our common stock as long as the awards are outstanding, but do not have any voting rights. Whereas, at the time that service-based restricted share awards were issued, the shareholder is generally, subject to the terms of the respective agreement, entitled to the same dividend and voting rights as other holders of our common stock as long as the restricted shares are outstanding. The employee generally is restricted from transferring or selling any restricted shares or restricted share units and generally forfeits the awards upon the termination of employment prior to the end of the vesting period. The specific provisions of the awards, including exercisability and term of the award, are evidenced by agreements with the employee as determined by the compensation committee of our Board of Directors. Restricted share units pursuant to performance-based awards and market-based awards are not issued until approved by our compensation committee following completion of the specified performance period.

99100

Table of Contents

OXFORD INDUSTRIES, INC.

NOTES TO CONSOLIDATED FINANCIAL STATEMENTS (Continued)

Service-based Restricted Share Units

The table below summarizes the service-based restricted share awards, including both restricted shares and restricted share units, and performance-based award activity for officers and other key employees (in shares) during Fiscal 2020,2023, Fiscal 2019,2022, and Fiscal 2018:2021 (which do not include the TSR-based Restricted Share Unit activity described below):


Fiscal 2020


Fiscal 2019


Fiscal 2018


Fiscal 2023


Fiscal 2022


Fiscal 2021


Weighted- 


Weighted-


Weighted-


Weighted- 


Weighted-


Weighted-

average

average

average

Number of

average

Number of

average

Number of

average

Number of

grant date

Number of

grant date

Number of

grant date

Shares or

grant date

Shares

grant date

Shares

grant date

Shares

fair value

Shares

fair value

Shares

fair value

Units

fair value

or Units

fair value

or Units

fair value

Restricted shares outstanding at beginning of fiscal year

251,924

$

68

257,890

$

66

211,045

$

63

Service-based restricted shares granted/issued

131,425

$

40

42,573

$

76

49,726

$

79

Performance-based restricted shares issued related to prior year performance awards

42,438

$

76

43,152

$

79

72,427

$

57

Restricted shares vested, including restricted shares repurchased from employees for employees’ tax liability

(114,003)

$

56

(87,252)

$

71

(73,408)

$

58

Restricted shares forfeited

(3,415)


62

(4,439)


69

(1,900)


62

Restricted shares outstanding at end of fiscal year

308,369

$

61

251,924

$

68

257,890

$

66

Awards outstanding at beginning of year

212,945

$

64

238,889

$

61

308,369

$

61

Awards granted

60,505

$

115

67,965

$

89

42,855

$

89

Awards vested, including awards repurchased from employees for employees’ tax liability

(111,095)

$

41

(83,324)

$

77

(81,283)

$

77

Awards forfeited

(3,561)

$

83

(10,585)

$

62

(31,052)

$

62

Awards outstanding on February 3, 2024

158,794

$

99

212,945

$

64

238,889

$

61

The following table summarizes information about unvested service-based restricted share awards, including both restricted shares and restricted share units, as of February 3, 2024.


Number of


Average

Unvested

Fair Value

Share

on

Description

Awards

Date of Grant

Service-based restricted shares with May 2024 vesting date


34,455

$

89

Service-based restricted share units with May 2025 vesting date


64,134

$

89

Service-based restricted share units with May 2026 vesting date


60,205

$

115

Total service-based awards outstanding at end of year

158,794

$

99

Additionally, during the SecondFirst Quarter of Fiscal 2020,2024, we granted 0.1 million of service-based restricted share units, subject to the recipient remaining an employee through the May 2027 vesting date.

101

Table of Contents

OXFORD INDUSTRIES, INC.

NOTES TO CONSOLIDATED FINANCIAL STATEMENTS (Continued)

TSR-based Restricted Share Units

The table below summarizes the TSR-based restricted share unit activity for officers and other key employees (in units) during Fiscal 2023, Fiscal 2022, and Fiscal 2021:


Fiscal 2023


Fiscal 2022


Fiscal 2021


Weighted- 


Weighted-


Weighted-

average

average

average

Number of

grant date

Number of

grant date

Number of

grant date

Share Units

fair value

Share Units

fair value

Share Units

fair value

TSR-based awards outstanding at beginning of year

196,040

$

89

130,440

$

78

83,345

$

50

TSR-based awards granted

74,605

$

153

66,525

$

111

56,750

$

117

TSR-based restricted shares earned and vested, including restricted share units repurchased from employees for employees’ tax liability

(76,340)

$

50

$

$

TSR-based awards forfeited

(2,142)

$

115

(925)

$

115

(9,655)

$

68

TSR-based awards outstanding on February 3, 2024

192,163

$

129

196,040

$

89

130,440

$

78

The restricted share units granted in the table above are at targettarget. The TSR-based restricted share units are subject to (1) our achievement of a specified total shareholder return (“TSR”)TSR-based ranking by Oxfordus relative to a comparator group forduring a period of approximately three years from the three year period ending in July 2023date of grant and (2) generally the recipient remaining an employee through July 2023.the vesting date which is approximately three years from the date of grant. The ultimate number of shares ultimately earned, which will be settled in shares of our common stock on the vesting date, will be between 0% and 200% of the restricted share units at target. These TSR-based restricted share units are entitled to dividend equivalents for dividends declared on our common stock duringprior to the performance period,vesting date, which are payable after vesting of the restricted shares, solely for the number of shares ultimately earned. These TSR-based restricted share units do not have any voting rights duringprior to the performance period. These TSR-based restricted performance units are not included in the table above.vesting date.

The following table summarizes information about unvested restricted share awards as of January 30, 2021. The unvested restricted share awards will be settled in shares of our common stock on the vesting date, subject to the employee still being an employee at that time. All awards are subject to the employee remaining employed with us through the vesting date, and the TSR-based restricted share units are subject to us meeting the specified TSR relative to the comparator groupas of February 3, 2024.


Number of


Average

Unvested

Fair Value

Share/Unit

on

Description

Awards

Date of Grant

Service-based & Performance-based Restricted Shares Vesting in April 2021


82,513

$

77

Service-based & Performance-based Restricted Shares Vesting in April 2022


95,861

$

77

Service-based Restricted Shares Vesting in July 2023


129,995

$

40

Total Restricted Shares Outstanding

308,369

61

TSR-based Restricted Share Units (at target), with a July 2023 vesting date

83,345

50

Total


391,714

$

59


Unvested

Fair Value

TSR-Based

on

Description

Share/Unit

Date of Grant

TSR-based restricted share units (at target) with May 2024 vesting date


52,200

$

117

TSR-based restricted share units (at target) with May 2025 vesting date


65,358

$

111

TSR-based restricted share units (at target) with May 2026 vesting date

74,605

$

153

Total TSR-based restricted share units outstanding at end of year


192,163

$

129

AsAdditionally, during the First Quarter of January 30, 2021, there was $11Fiscal 2024, we granted 0.1 million of unrecognized compensation expense related to the unvested restricted shares andTSR-based restricted share units included inat target, subject to (1) our achievement of a specified TSR-based ranking by Oxford relative to a comparator group during a period of approximately three years from the table above, which have beendate of grant and (2) the recipient remaining an employee through the May 2027 vesting date. The number of shares ultimately earned will be between 0% and 200% of the restricted share units at target.

Director Share Awards

In addition to shares granted to employees, but have not yet vested. As of January 30, 2021, the weighted average remaining life of the outstanding awards was two years.

100

Table of Contents

OXFORD INDUSTRIES, INC.

NOTES TO CONSOLIDATED FINANCIAL STATEMENTS (Continued)

In addition, we grant restricted sharesshare awards to our non-employee directors for a portion of each non-employee director’s annual compensation. The non-employee directors must complete certain service requirements; otherwise, the restricted shares are subject to forfeiture. On the date of issuance, the non-employee directors

102

Table of Contents

OXFORD INDUSTRIES, INC.

NOTES TO CONSOLIDATED FINANCIAL STATEMENTS (Continued)

are entitled to the same dividend and voting rights as other holders of our common stock. The non-employee directors are restricted from transferring or selling the restricted shares prior to the end of the vesting period.

Employee Stock Purchase Plan

There were less than 1 million shares of our common stock authorized for issuance under our Employee Stock Purchase Plan ("ESPP") as of January 30, 2021.February 3, 2024. The ESPP allows qualified employees to purchase shares of our common stock on a quarterly basis, based on certain limitations, through payroll deductions. The shares purchased pursuant to the ESPP are not subject to any vesting or other restrictions. On the last day of each calendar quarter, the accumulated payroll deductions are applied toward the purchase of our common stock at a price equal to 85% of the closing market price on that date. Equity compensation expense related to the employee stock purchase plan recognized was less than $1 million in each of Fiscal 2020,2023, Fiscal 20192022 and Fiscal 2018.2021.

Preferred Stock

We had 30 million shares of $1.00 par value preferred stock authorized for issuance as of January 30, 2021 and February 1, 2020. NaN preferred shares were issued or outstanding as of January 30, 2021 or February 1, 2020.

Note 9. Income Taxes

The following table summarizes our distribution between domestic and foreign earnings (loss) before income taxes and the provision (benefit) for income taxes (in thousands):


Fiscal


Fiscal


Fiscal

2020

2019

2018

Earnings from continuing operations before income taxes:


Domestic

$

(129,129)

$

86,528

$

85,050

Foreign


3,252


5,902


3,259

Earnings from continuing operations before income taxes

$

(125,877)

$

92,430

$

88,309

Income taxes:


Current:


Federal

$

(11,498)

$

18,565

$

12,543

State


(1,060)


5,459


4,474

Foreign


735


1,650


1,979


(11,823)


25,674


18,996

Deferred—Domestic


(17,780)


(1,870)


3,141

Deferred—Foreign


(582)


133


(119)

Income taxes

$

(30,185)

$

23,937

$

22,018

101

Table of Contents

OXFORD INDUSTRIES, INC.

NOTES TO CONSOLIDATED FINANCIAL STATEMENTS (Continued)

Reconciliations of the United States federal statutory income tax rates and our effective tax rates are summarized as follows:


Fiscal


Fiscal


Fiscal


2020

2019

2018


Statutory federal income tax rate


21.0

%  

21.0

%  

21.0

%

State income taxes—net of federal income tax benefit


3.6

%  

4.4

%  

4.6

%

Impact of foreign operations rate differential


(0.2)

%  

0.2

%  

0.7

%

Impairment of non-deductible Southern Tide goodwill

(3.7)

%

%

%

Change in reserve for uncertain tax positions

(2.5)

%

%

%

Rate benefit from NOL carryback to pre-U.S. Tax Reform periods due to the CARES Act


5.5

%  

%  

%

Other, net


0.3

%  

0.3

%  

(1.4)

%

Effective tax rate for continuing operations


24.0

%  

25.9

%  

24.9

%

Deferred tax assets and liabilities included in our consolidated balance sheets are comprised of the following (in thousands):


January 30,


February 1,

2021

2020

Deferred Tax Assets:


Inventories

$

16,338

$

13,067

Accrued compensation and benefits


8,759


8,977

Receivable allowances and reserves


2,109


993

Operating lease liabilities


73,917


85,969

Operating loss and other carry-forwards


4,617


3,171

Other, net


3,686


1,546

Deferred tax assets


109,426


113,723

Deferred Tax Liabilities:


Operating lease assets

(66,341)

(82,186)

Depreciation and amortization


(9,682)


(8,076)

Acquired intangible assets


(25,047)


(34,019)

Deferred tax liabilities


(101,070)


(124,281)

Valuation allowance


(5,668)


(5,213)

Net deferred tax asset (liability)

$

2,688

$

(15,771)

As of January 30, 2021 and February 1, 2020, our operating loss and other carry-forwards primarily relate to our operations in Canada and Hong Kong, as well as certain states. The majority of these operating loss carry-forwards allow for carry-forward of at least 20 years and in some cases, indefinitely. The substantial majority of our valuation allowance of $6 million and $5 million as of January 30, 2021 and February 1, 2020, respectively, relates to these foreign and state operating loss carry-forwards and the deferred tax assets in those jurisdictions. The recent history of operating losses in certain jurisdictions is considered significant negative evidence against the future realizability of these tax benefits. The amount of the valuation allowance could change in the future if our operating results or estimates of future taxable operating results changes.

U.S. Tax Reform made significant changes to how foreign earnings are taxed. Certain amounts of foreign earnings are subject to U.S. federal tax currently pursuant to the GILTI rules regardless of whether those earnings are distributed, and actual distributions of foreign earnings are generally no longer subject to U.S. federal tax. We continue to assert that our investments in foreign subsidiaries and substantially all of the related earnings are permanently reinvested outside the United States. We believe that any other taxes such as foreign withholding or U.S. state tax payable would be immaterial if we were to repatriate the foreign earnings. Therefore, we have not recorded any deferred

102

Table of Contents

OXFORD INDUSTRIES, INC.

NOTES TO CONSOLIDATED FINANCIAL STATEMENTS (Continued)

tax liabilities related to investments and earnings in our consolidated balance sheets as of January 30, 2021 and February 1, 2020.

Accounting for income taxes requires that we offset deferred tax liabilities and assets within each tax jurisdiction and present the net deferred tax amount for each jurisdiction as a net deferred tax amount in our consolidated balance sheets. The amounts of deferred income taxes included in our consolidated balance sheets are as follows (in thousands):


January 30,


February 1,

2021

2020

Assets:


Deferred tax assets

$

2,688

$

769

Liabilities:


Deferred tax liabilities


(16,540)

Net deferred tax asset (liability)

$

2,688

$

(15,771)

A reconciliation of the changes in the gross amount of unrecognized tax benefits, which are included in other non-current liabilities, is as follows (in thousands):


Fiscal 2020

Fiscal 2019

Fiscal 2018

Balance of unrecognized tax benefits at beginning of year


$

1,212

$

975

$

335

Increase related to prior period tax positions


303


206

Decrease related to prior period tax positions

(1)

(27)

Increase related to current period tax positions

3,960

287

440

Decrease related to settlements with taxing authorities

Decrease related to lapse of statute of limitations


(213)


(23)


(6)

Balance of unrecognized tax benefits at end of year

$

5,261

$

1,212

$

975

Substantially all of our uncertain tax positions as of January 30, 2021, if recognized, would reduce the future effective tax rate in the period settled. The total amount of unrecognized tax benefits relating to our tax positions is subject to change based on future events including, but not limited to, settlements of ongoing audits and assessments and the expiration of applicable statutes of limitation. We expect that the balance of gross unrecognized tax benefits will decrease by approximately $3 million during Fiscal 2021. However, changes in the expected occurrence, outcomes, and timing of such events could cause our current estimate to change materially in the future. Interest and penalties associated with unrecognized tax positions are recorded within income tax expense in our consolidated statements of operations. During each of Fiscal 2020, Fiscal 2019 and Fiscal 2018, we recognized less than $1 million of interest and penalties associated with unrecognized tax positions in our consolidated statements of operations.

Note 10. Defined Contribution Plans

We have a tax-qualified voluntary defined contribution retirement savings plan covering substantially all United States employees. If aan eligible participant elects to contribute, a portion of the contribution may be matched by us. Additionally, we incur certain charges related to our non-qualified deferred compensation plan as discussed in Note 1. Realized and unrealized gains and losses on the deferred compensation plan investments are recorded in SG&A in our consolidated statements of operations and substantially offset the changes in deferred compensation liabilities to participants resulting from changes in market values. Our aggregate expense under these defined contribution and non-qualified deferred compensation plans in Fiscal 2020,2023, Fiscal 20192022 and Fiscal 20182021 was $1$7 million, $5 million and $5$4 million, respectively. The decreaseincrease in Fiscal 20202023 was primarily due to the suspension ofan increase in the company match percentage for our defined contribution plan during Fiscal 2020 to reduceplan.

Note 11. Income Taxes

The following table summarizes our expenses duringdistribution between domestic and foreign earnings (loss) before income taxes and the COVID-19 pandemic. A company match has been reinstatedprovision (benefit) for Fiscal 2021.income taxes (in thousands):


Fiscal


Fiscal


Fiscal

2023

2022

2021

Earnings (loss) before income taxes:


Domestic

$

62,772

$

206,944

$

161,233

Foreign


12,174


8,781


3,326

Earnings (loss) before income taxes

$

74,946

$

215,725

$

164,559

Income taxes:


Current:


Federal

$

28,183

$

41,776

$

24,998

State


7,530


8,835


3,780

Foreign


2,419


1,191


409


38,132


51,802


29,187

Deferred—Domestic


(24,083)


71


4,155

Deferred—Foreign


194


(1,883)


(104)

Income taxes

$

14,243

$

49,990

$

33,238

103

Table of Contents

OXFORD INDUSTRIES, INC.

NOTES TO CONSOLIDATED FINANCIAL STATEMENTS (Continued)

Reconciliations of the United States federal statutory income tax rates and our effective tax rates are summarized as follows:


Fiscal


Fiscal


Fiscal


2023

2022

2021


Statutory federal income tax rate


21.0

%  

21.0

%  

21.0

%

State income taxes—net of federal income tax benefit


1.6

%  

3.6

%  

3.7

%

Change in reserve for uncertain tax positions & method change

1.5

%

0.2

%

(1.0)

%

Impact of foreign operations rate differential


0.3

%  

0.1

%  

0.1

%

U.S. federal tax credits

(3.0)

%  

(0.7)

%  

(0.6)

%

Impact of prior year true-ups

(1.9)

%  

(0.3)

%  

(0.7)

%

Excess Tax Benefit, Restricted Stock Vesting

(1.6)

%  

(0.1)

%  

(0.3)

%

Impact of valuation allowances related to operating losses

(0.9)

%

(1.6)

%

(0.8)

%

Impact of valuation allowances related to capital losses

%

%

1.2

%

Impact of capital losses

%

%

(2.9)

%

Other, net


2.0

%  

1.0

%  

0.5

%

Effective tax rate for continuing operations


19.0

%  

23.2

%  

20.2

%

Deferred tax assets and liabilities included in our consolidated balance sheets are comprised of the following (in thousands):


February 3,


January 28,

2024

2023

Deferred Tax Assets:


Inventories

$

21,254

$

20,561

Accrued compensation and benefits


10,982


9,637

Receivable allowances and reserves


2,433


2,580

Operating lease liabilities


77,150


71,871

Operating loss and other carry-forwards


709


757

Other, net


5,902


4,901

Deferred tax assets


118,430


110,307

Deferred Tax Liabilities:


Operating lease assets

(74,004)

(66,145)

Depreciation and amortization


(16,907)


(15,289)

Acquired intangible assets


(1,051)


(26,030)

Deferred tax liabilities


(91,962)


(107,464)

Valuation allowance


(2,289)


(2,448)

Net deferred tax asset (liability)

$

24,179

$

395

The majority of our valuation allowance of $2 million as of February 3, 2024 and January 28, 2023 relates to our capital loss carry-forwards. The amount of the valuation allowance could change in the future if our operating results or estimates of future taxable operating results changes.

Certain amounts of foreign earnings are subject to U.S. federal tax currently pursuant to the GILTI rules regardless of whether those earnings are distributed, and actual distributions of foreign earnings are generally no longer subject to U.S. federal tax. We continue to assert that our investments in substantially all of our foreign subsidiaries and substantially all of the related earnings are permanently reinvested outside the United States. We believe that any other taxes such as foreign withholding or U.S. state tax payable would be immaterial if we were to repatriate the foreign earnings. Therefore, we have not recorded any deferred tax liabilities related to these foreign investments and earnings in our consolidated balance sheets as of February 3, 2024 and January 28, 2023.

104

Table of Contents

OXFORD INDUSTRIES, INC.

NOTES TO CONSOLIDATED FINANCIAL STATEMENTS (Continued)

Accounting for income taxes requires that we offset deferred tax liabilities and assets within each tax jurisdiction and present the net deferred tax amount for each jurisdiction as a net deferred tax amount in our consolidated balance sheets.  The amounts of deferred income taxes included in our consolidated balance sheets are as follows (in thousands):


February 3,


January 28,

2024

2023

Assets:


Deferred tax assets

$

24,179

$

3,376

Liabilities:


Deferred tax liabilities


(2,981)

Net deferred tax asset (liability)

$

24,179

$

395

A reconciliation of the changes in the gross amount of unrecognized tax benefits, which are included in other non-current liabilities, is as follows (in thousands):


Fiscal 2023

Fiscal 2022

Fiscal 2021

Balance of unrecognized tax benefits at beginning of year


$

3,664

$

3,390

$

5,261

Increase related to prior period tax positions


233


110


10

Decrease related to prior period tax positions

(2,027)

Increase related to current period tax positions

1,940

646

527

Decrease related to settlements with taxing authorities

(2,305)

Decrease related to lapse of statute of limitations


(100)


(482)


(103)

Balance of unrecognized tax benefits at end of year

$

3,710

$

3,664

$

3,390

Approximately $2 million of our uncertain tax positions as of February 3, 2024, if recognized, would reduce the future effective tax rate in the period settled.  The total amount of unrecognized tax benefits relating to our tax positions is subject to change based on future events including, but not limited to, settlements of ongoing audits and assessments and the expiration of applicable statutes of limitation. The ultimate occurrence, outcomes, and timing of such events could differ from our current expectations. Interest and penalties associated with unrecognized tax positions are recorded within income tax expense in our consolidated statements of operations. During each of Fiscal 2023, Fiscal 2022 and Fiscal 2021, we recognized less than $1 million of interest and penalties associated with unrecognized tax positions in our consolidated statements of operations.

Inflation Reduction Act of 2022

On August 16, 2022, the U.S. government enacted the Inflation Reduction Act (“IRA”) into law. The IRA implemented a corporate alternative minimum tax, subject to certain thresholds being met, and a 1% excise tax on share repurchases effective beginning January 1, 2023. We do not currently expect that the tax-related provisions of the IRA will have a material effect on our reported results, cash flows or financial position. For Fiscal 2023, excise taxes included as part of the price of common stock repurchased during the period did not have a material effect on our reported results.

Pillar Two Directive

In December 2022, the EU Member States formally adopted the Pillar Two Directive, which generally provides for a minimum effective tax rate of 15%, as established by the Organization for Economic Co-operation and Development Pillar Two Framework. The EU effective dates are January 1, 2024, and January 1, 2025, for different aspects of the directive. A significant number of other countries are expected to also implement similar legislation with varying effective dates in the future. We are continuing to evaluate the potential effect on future periods of the Pillar Two Framework, pending legislative adoption by additional individual countries.

105

Table of Contents

OXFORD INDUSTRIES, INC.

NOTES TO CONSOLIDATED FINANCIAL STATEMENTS (Continued)

Note 11.12. Lanier Apparel Exit

In Fiscal 2020,2021, we made the decision to exitexited our Lanier Apparel business, which is expected to be completed during the second half of Fiscal 2021. This decision is in linehad been focused on moderately priced tailored clothing and related products. The Lanier Apparel exit aligns with our stated business strategy of developing and marketing compelling lifestyle brands and takesbrands. It also took into consideration the increased macroeconomic challenges faced by the Lanier Apparel business, many of which were magnified by the COVID-19 pandemic. The Lanier Apparel business was primarily focused on moderately priced tailored clothes and related products.

In connection with the planned exit of the Lanier Apparel business,During Fiscal 2021, we recorded pre-tax charges of $13 millionrecognized in the Lanier Apparel operating group during Fiscal 2020. These charges consista benefit of $2 million related to the Lanier Apparel exit primarily consisting of (1) $6$4 million of reductions in inventory markdowns previously recognized, of which the substantial majority of which werethis amount was reversed in Corporate and Other as part of LIFO accounting as the inventory has not been sold as of January 30, 2021,and (2) a $3 million gain on the sale of employee charges, includingLanier Apparel’s Toccoa, Georgia distribution center. These items were partially offset by (1) $2 million of severance and employee retention costs, (3) $3(2) $2 million of operating lease asset impairmenttermination charges for leased office space, (4)related to certain license agreements and (3) $1 million of non-cash fixed asset impairment charges, primarily related to leasehold improvements, and (5) $1 million ofadditional charges related to ourthe Merida manufacturing facility, which ceased operations infacility.

For Fiscal 2020. The2021 the estimated inventory markdownsmarkdown charges and manufacturing facility charges which total $7 million in the aggregate, are included in cost of goods sold in Lanier Apparel, while the charges for operating lease asset impairments, employee charges, and fixed asset impairments which total $6 million in the aggregate, are included in SG&A in Lanier Apparel. As of January 30, 2021, $1 millionThe gain on sale of the Toccoa, Georgia distribution center in Fiscal 2021 is included in royalties and other income in Lanier Apparel. The $2 million gain on sale of the Merida manufacturing facility in Mexico that was sold in the First Quarter of Fiscal 2023 is also included in royalties and other income.

We do not expect to incur any additional Lanier Apparel exit charges. Substantially all of the cumulative accrued charges have been paid for the employee charges, termination charges related to contractual commitments and the charges related to the Merida manufacturing facility. As of January 30, 2021, the remainingfacility have been paid. During Fiscal 2023, lease amounts totaling $2 million of accrued employee charges are recorded in accrued compensation in our consolidated balance sheet and are expected to be paid during Fiscal 2021, and there are no significant remaining liabilities related to the Merida manufacturing facility.

In addition to these charges incurred in Fiscal 2020, we currently expect to incur incremental Lanier Apparel exit charges totaling approximately $3 million in Fiscal 2021, which are expectedoffice leases that were previously impaired and vacated were paid, with no other anticipated significant future cash requirements related to consist of additional employee charges for employees retained during the exit and the acceleration of certain post-exit contractual commitments.Lanier Apparel business.

Note 12. Tommy Bahama Japan Charges

During Fiscal 2019 and Fiscal 2018, we incurred certain charges related to the restructure of our Tommy Bahama Japan operations, which we exited entirely in the first half of Fiscal 2020. In Fiscal 2018, we incurred charges related to the lease termination and closure of the Tommy Bahama Ginza flagship retail-restaurant location, for which the lease was previously scheduled to expire in 2022, as well as other charges associated with downsizing the business. In Fiscal 2019, we incurred charges associated with the shutdown of our remaining retail and concession operations in Japan which was completed in the first half of Fiscal 2020. The substantial majority of the charges in Fiscal 2019 and Fiscal 2018, which are included in Tommy Bahama, were recognized in SG&A.

The charges in Fiscal 2018 totaled $4 million, including $2 million of lease termination and premises reinstatement charges, $1 million of non-cash asset impairment charges and $1 million of inventory markdown, severance and other charges related to the downsizing of the business. The charges in Fiscal 2019 totaled $3 million, including a $1 million non-cash foreign currency charge associated with our investment in Japan which was previously included in accumulated other comprehensive income in our consolidated balance sheet, $1 million of lease termination, premises reinstatement and operating lease asset impairment charges, and charges related to the revision to the estimated Ginza reinstatement charge recognized in the prior year, as well as other items including severance and inventory markdowns related to the shutdown of Tommy Bahama’s operations in Japan. No charges related to the exit of Tommy Bahama’s operations in Japan were recognized in Fiscal 2020. As of both January 30, 2021 and February 1, 2020, there were no significant liabilities related to these charges still outstanding.

104106

Table of Contents

SCHEDULE II

Oxford Industries, Inc.

Valuation and Qualifying Accounts

Column A

Column B

Column C

Column D

Column E

Column B

Column C

Column D

Column E

Additions

Charged

Additions

Charged

Balance at

Charged to

to Other

Deductions

Balance at

Balance at

Charged to

to Other

Deductions

Balance at

Beginning

Costs and

Accounts–

End of

Beginning

Costs and

Accounts–

End of

Description


of Period


Expenses


Describe


Describe


Period


of Period


Expenses


Describe


Describe


Period

(In thousands)

Fiscal 2020


(In thousands)

Fiscal 2023


Deducted from asset accounts:


Accounts receivable reserves (1)

$

8,766

$

5,629


$

(7,977)

(3)  

$

6,418

$

4,032

$

1,201

$

$

(2,592)

(4)  

$

2,641

Provision for credit losses (2)

$

555

$

4,052


$

(2,027)

(4)  

$

2,580

$

1,230

$

(382)

$

$

(348)

(5)  

$

500

Fiscal 2019


Fiscal 2022


Deducted from asset accounts:


Accounts receivable reserves (1)

$

6,646

$

15,802


$

(13,682)

(3)  

$

8,766

$

3,412

$

2,868

$

541

(3)  

$

(2,789)

(4)  

$

4,032

Provision for credit losses (2)

$

661

$

88


$

(194)

(4)  

$

555

$

1,311

$

(262)

$

200

(3)  

$

(19)

(5)  

$

1,230

Fiscal 2018


Fiscal 2021


Deducted from asset accounts:


Accounts receivable reserves (1)

$

6,485

$

9,599


$

(9,438)

(3)  

$

6,646

$

6,418

$

(1,140)

$

$

(1,866)

(4)  

$

3,412

Provision for credit losses (2)

$

1,659

$

225


$

(1,223)

(4)  

$

661

$

2,580

$

(1,190)

$

$

(79)

(5)  

$

1,311

(1)Accounts receivable reserves includes estimated reserves for allowances, returns and discounts related to our wholesale operations as discussed in our significant accounting policy disclosure for "Revenue Recognition and Receivables" in Note 1 of our consolidated financial statements.
(2)Provision for credit losses consists of amounts reserved for our estimate of a wholesale customer’s inability to meet its financial obligations as discussed in our significant accounting policy disclosure for "Revenue Recognition and Receivables" in Note 1 of our consolidated financial statements.
(3)Addition due to the acquisition of Johnny Was in September 2022.
(4)Principally consists of amounts written off related to customer allowances, returns and discounts.
(4)(5)Principally consists of accounts written off as uncollectible.

105107

Table of Contents

Report of Independent Registered Public Accounting Firm

To the Shareholders and the Board of Directors of Oxford Industries, Inc.

Opinion on the Consolidated Financial Statements

We have audited the accompanying consolidated balance sheets of Oxford Industries, Inc. (the Company) as of February 3, 2024 and January 30, 2021 and February 1, 2020,28, 2023, the related consolidated statements of operations, comprehensive income, shareholders’ equity and cash flows for each of the three years in the period ended January 30, 2021,February 3, 2024, and the related notes and financial statement schedule listed in the Index at Item 15(a) (collectively referred to as the “consolidated financial statements”). In our opinion, the consolidated financial statements present fairly, in all material respects, the financial position of the Company at February 3, 2024 and January 30, 2021 and February 1, 2020,28, 2023, and the results of its operations and its cash flows for each of the three years in the period ended January 30, 2021,February 3, 2024, in conformity with U.S. generally accepted accounting principles.

We also have audited, in accordance with the standards of the Public Company Accounting Oversight Board (United States) (PCAOB), the Company's internal control over financial reporting as of January 30, 2021,February 3, 2024, based on criteria established in Internal Control-Integrated Framework issued by the Committee of Sponsoring Organizations of the Treadway Commission (2013 framework) and our report dated March 29, 2021April 1, 2024 expressed an unqualified opinion thereon.

Adoption of New Accounting Standards

As discussed in Note 1 to the consolidated financial statements, the Company has changed its method of accounting for leases in fiscal year 2019 due to the adoption of the new leasing standard. The Company adopted the new leasing standard using the modified retrospective approach.

Basis for Opinion

These consolidated financial statements are the responsibility of the Company's management. Our responsibility is to express an opinion on the Company’s consolidated financial statements based on our audits. We are a public accounting firm registered with the PCAOB and are required to be independent with respect to the Company in accordance with the U.S. federal securities laws and the applicable rules and regulations of the Securities and Exchange Commission and the PCAOB.

We conducted our audits in accordance with the standards of the PCAOB. Those standards require that we plan and perform the audit to obtain reasonable assurance about whether the consolidated financial statements are free of material misstatement, whether due to error or fraud. Our audits included performing procedures to assess the risks of material misstatement of the consolidated financial statements, whether due to error or fraud, and performing procedures that respond to those risks. Such procedures included examining, on a test basis, evidence regarding the amounts and disclosures in the consolidated financial statements. Our audits also included evaluating the accounting principles used and significant estimates made by management, as well as evaluating the overall presentation of the consolidated financial statements. We believe that our audits provide a reasonable basis for our opinion.

Critical Audit Matter

The critical audit matter communicated below is a matter arising from the current period audit of the financial statements that was communicated or required to be communicated to the audit committee and that: (1) relates to accounts or disclosures that are material to the financial statements and (2) involved our especially challenging, subjective or complex judgments. The communication of the critical audit matter does not alter in any way our opinion on the consolidated financial statements, taken as a whole, and we are not, by communicating the critical audit matter below, providing a separate opinion on the critical audit matter or on the accounts or disclosures to which it relates.

106108

Table of Contents

Valuation of Goodwill and Trademark Indefinite-lived Intangible Asset of the Johnny Was Reporting Unit

Interim Impairment of Goodwill and Indefinite-Lived Intangible Asset of the Southern Tide Reporting Unit

Description of the Matter

As disclosed in Note 45 to the consolidated financial statements, at February 1, 2020,in connection with the Company’sannual impairment test, the Company recorded impairment charges of $99 million related to goodwill and $12 million related to the trademark indefinite-lived intangible asset balances for the Southern Tide reporting unit were approximately $43 million and $27 million, respectively.asset. As disclosed in Note 1 to the consolidated financial statements, goodwill and indefinite-lived intangible assets are tested for impairment at least annually on the first day of the fourth quarter or whenever changes in circumstances may indicate the carrying amounts may not be recoverable. Additionally, as disclosed in Note 4 to the consolidated financial statements, as a result of the significant negative impact from the COVID-19 pandemic, the Company performed an impairment test on Southern Tide goodwill and indefinite-lived intangible assets during the First Quarter of Fiscal 2020, which resulted in impairment charges recorded for goodwill in the amount of $43 million and the trademark indefinite-lived intangible asset in the amount of $18 million.  Subsequent to the impairment charges recorded, the Company’s goodwill and trademark indefinite-lived intangible asset balances for the Southern TideJohnny Was reporting unit were approximately $0 and $9$66 million, respectively, at January 30, 2021.February 3, 2024.

Auditing management’s interim goodwill and indefinite-lived intangible asset impairment chargetests for the Southern TideJohnny Was reporting unit was complex and highly judgmental due to the significant estimation required to determine the fair values of the Southern TideJohnny Was reporting unit and trademark indefinite-lived intangible asset. In particular, the fair value estimate of the Southern TideJohnny Was reporting unit for purposes of assessing the amount of impairment was sensitive to significant assumptions such as projected net sales, projectedrevenue growth rates, operating income,margin, and the discount rate. In addition, the fair value estimate of the Southern TideJohnny Was indefinite-lived intangible asset was sensitive to significant assumptions such as projected net sales, royalty raterates for the trademark, revenue growth rates, and the discount rate. These significant assumptions are affected by expectations about future market and economic conditions.

How We Addressed the Matter in Our Audit

We obtained an understanding, evaluated the design and tested the operating effectiveness of the Company’s controls over the Southern TideJohnny Was goodwill and indefinite-lived intangible asset impairment process.processes. For example, we tested controls over management’s review of the significant assumptions described above.

To test the estimated fair value of the Southern TideJohnny Was reporting unit and trademark indefinite-lived intangible asset, we performed audit procedures that included, among others, assessing methodologies used by the Company, testing the significant assumptions discussed above, and evaluating the completeness and accuracy of the underlying data used by the Company in its analyses. For example, we compared the significant assumptions described above to current market and economic trends; the assumptions used to value similar assets in acquisitions; historical results of the business; and other guidelines used by companies in the same industry. We involved our valuation specialists to assist in our evaluation of the Company's valuation methodology and certain significant assumptions, including the discount rates and trademark royalty rate.assumptions. In addition, we assessed the historical accuracy of management’s prospective financial information and performed sensitivity analyses on significant assumptions to evaluate the potential changes in the fair value of the Southern TideJohnny Was reporting unit and trademark indefinite-lived intangible asset that would result from changes in the assumptions.assumptions. We also recalculated the resulting impairment charges recorded by the Company.

/s/ Ernst & Young LLP

We have served as the Company's auditor since 2002.

Atlanta, GA

March 29, 2021

/s/ Ernst & Young, LLP

Atlanta, GA

April 1, 2024

107109

Table of Contents

Item 9.     Changes in and Disagreements With Accountants on Accounting and Financial Disclosure

None.

Item 9A.   Controls and Procedures

Evaluation of Disclosure Controls and Procedures

Our company, under the supervision and with the participation of our management, including our principal executive officer and principal financial officer, have evaluated the effectiveness of our disclosure controls and procedures as of the end of the period covered by this report. Based upon that evaluation, our principal executive officer and principal financial officer concluded that, as of the end of the period covered by this report, our disclosure controls and procedures were effective.

Changes in and Evaluation of Internal Control over Financial Reporting

There have not been any changes in our internal control over financial reporting during the fourth quarter of Fiscal 20202023 that have materially affected, or are reasonably likely to materially affect, our internal control over financial reporting.

Report of Management on Internal Control over Financial Reporting

Our management is responsible for establishing and maintaining adequate internal control over financial reporting (as such term is defined in Rules 13a-15(f) and 15d-15(f) under the Securities Exchange Act of 1934). Our internal control over financial reporting is a process designed to provide reasonable assurance regarding the reliability of financial reporting and the preparation of our consolidated financial statements for external purposes in accordance with accounting principles generally accepted in the United States. Our internal control over financial reporting is supported by a program of appropriate reviews by management, written policies and guidelines, careful selection and training of qualified personnel, and a written code of conduct.

We assessed the effectiveness of our internal control over financial reporting as of January 30, 2021.February 3, 2024. In making this assessment, management used the updated framework issued by the Committee of Sponsoring Organizations of the Treadway Commission ("COSO") in Internal Control—Integrated Framework (2013). Based on this assessment, we believe that our internal control over financial reporting was effective as of January 30, 2021.February 3, 2024.

Ernst & Young LLP, our independent registered public accounting firm, has audited our internal control over financial reporting as of January 30, 2021,February 3, 2024, and its report thereon is included herein.

and

/s/ THOMAS C. CHUBB III


/s/ K. SCOTT GRASSMYER

Thomas C. Chubb III

Chairman, Chief Executive Officer and

President

(Principal Executive Officer)

K. Scott Grassmyer

Executive Vice President, Chief Financial Officer and Chief FinancialOperating Officer

(Principal Financial Officer)

March 29, 2021April 1, 2024

March 29, 2021April 1, 2024

Limitations on the Effectiveness of Controls

Because of their inherent limitations, our disclosure controls and procedures and our internal controls over financial reporting may not prevent or detect misstatements. Projections of any evaluation of effectiveness for future periods are subject to the risks that controls may become inadequate because of changes in conditions, or that the degree of compliance with the policies or procedures may deteriorate. A control system, no matter how well designed and operated, can provide only reasonable, not absolute, assurance that a control system’s objectives will be met.

108110

Table of Contents

Report of Independent Registered Public Accounting Firm

To the Shareholders and the Board of Directors of Oxford Industries, Inc.

Opinion on Internal Control over Financial Reporting

We have audited Oxford Industries, Inc.’s internal control over financial reporting as of January 30, 2021,February 3, 2024, based on criteria established in Internal Control—Integrated Framework issued by the Committee of Sponsoring Organizations of the Treadway Commission (2013 framework) (the COSO criteria). In our opinion, Oxford Industries, Inc. (the Company) maintained, in all material respects, effective internal control over financial reporting as of January 30, 2021,February 3, 2024, based on the COSO criteria.

We also have audited, in accordance with the standards of the Public Company Accounting Oversight Board (United States) (PCAOB), the consolidated balance sheets of the CompanyOxford Industries, Inc. as of February 3, 2024 and January 30, 2021 and February 1, 2020,28, 2023, the related consolidated statements of operations, comprehensive income, shareholders’ equity and cash flows for each of the three years in the period ended January 30, 2021,February 3, 2024, and the related notes and financial statement schedule listed in the Index at Item 15(a) (collectively referred to as the “consolidated financial statements”) and our report dated March 29, 2021April 1, 2024 expressed an unqualified opinion thereon.

Basis for Opinion

The Company’s management is responsible for maintaining effective internal control over financial reporting and for its assessment of the effectiveness of internal control over financial reporting included in the accompanying Report of Management on Internal Control over Financial Reporting. Our responsibility is to express an opinion on the Company’s internal control over financial reporting based on our audit. We are a public accounting firm registered with the PCAOB and are required to be independent with respect to the Company in accordance with the U.S. federal securities laws and the applicable rules and regulations of the Securities and Exchange Commission and the PCAOB.

We conducted our audit in accordance with the standards of the PCAOB. Those standards require that we plan and perform the audit to obtain reasonable assurance about whether effective internal control over financial reporting was maintained in all material respects.

Our audit included obtaining an understanding of internal control over financial reporting, assessing the risk that a material weakness exists, testing and evaluating the design and operating effectiveness of internal control based on the assessed risk, and performing such other procedures as we considered necessary in the circumstances. We believe that our audit provides a reasonable basis for our opinion.

111

Table of Contents

Definition and Limitations of Internal Control Over Financial Reporting

A company’s internal control over financial reporting is a process designed to provide reasonable assurance regarding the reliability of financial reporting and the preparation of financial statements for external purposes in accordance with generally accepted accounting principles. A company’s internal control over financial reporting includes those policies and procedures that (1) pertain to the maintenance of records that, in reasonable detail, accurately and fairly reflect the transactions and dispositions of the assets of the company; (2) provide reasonable assurance that transactions are recorded as necessary to permit preparation of financial statements in accordance with generally accepted accounting principles, and that receipts and expenditures of the company are being made only in accordance with authorizations of management and directors of the company; and (3) provide reasonable assurance regarding prevention or timely detection of unauthorized acquisition, use, or disposition of the company’s assets that could have a material effect on the financial statements.

109

Table of Contents

Because of its inherent limitations, internal control over financial reporting may not prevent or detect misstatements. Also, projections of any evaluation of effectiveness to future periods are subject to the risk that controls may become inadequate because of changes in conditions, or that the degree of compliance with the policies or procedures may deteriorate.

/s/ Ernst & Young LLP

Atlanta, Georgia

March 29, 2021April 1, 2024

112

Table of Contents

Item 9B.   Other Information

None.

During the Fourth Quarter of Fiscal 2024, none of our directors or officers adopted or terminated a “Rule 10b5-1 trading arrangement” or a “non-Rule 10b5-1 trading arrangement,” as each term is defined in Item 408 of Regulation S-K.

Item 9C.   Disclosure Regarding Foreign Jurisdictions that Prevent Inspections

Not applicable.

PART III

Item 10.   Directors, Executive Officers and Corporate Governance

The information required by this Item 10 of Part III will appear in our definitive proxy statement under the headings "Corporate Governance and Board Matters—Directors," "Executive Officers," "Common Stock Ownership by Management and Certain Beneficial Owners—Section 16(a) Beneficial Ownership Reporting Compliance," "Corporate Governance and Board Matters—Website Information," "Additional Information—Submission of Director Candidates by Shareholders," and "Corporate Governance and Board Matters—Board Meetings and Committees of our Board of Directors," and is incorporated herein by reference.

Item 11.   Executive Compensation

The information required by this Item 11 of Part III will appear in our definitive proxy statement under the headings "Corporate Governance and Board Matters—Director Compensation," "Executive Compensation," "Nominating, Compensation & Governance Committee Report" and "Compensation Committee Interlocks and Insider Participation" and is incorporated herein by reference.

Item 12.   Security Ownership of Certain Beneficial Owners and Management and Related Stockholder Matters

The information required by this Item 12 of Part III will appear in our definitive proxy statement under the headings "Equity Compensation Plan Information" and "Common Stock Ownership by Management and Certain Beneficial Owners" and is incorporated herein by reference.

Item 13.   Certain Relationships and Related Transactions, and Director Independence

The information required by this Item 13 of Part III will appear in our definitive proxy statement under the headings "Certain Relationships and Related Transactions" and "Corporate Governance and Board Matters—Director Independence" and is incorporated herein by reference.

Item 14.   Principal Accounting Fees and Services

Our independent registered public accounting firm is Ernst & Young LLP, Atlanta, Georgia, Auditor Firm ID 42.

The information required by this Item 14 of Part III will appear in our definitive proxy statement under the heading "Audit-Related Matters—Fees Paid to Independent Registered Public Accounting Firm" and "Audit-Related Matters—Audit Committee Pre-Approval of Audit and Permissible Non-Audit Services of Independent Auditors" and is incorporated herein by reference.

110113

Table of Contents

PART IV

Item 15.   Exhibits, Financial Statement Schedules

(a)1. Financial Statements

The following consolidated financial statements are included in Part II, Item 8 of this report:

Consolidated Balance Sheets as of February 3, 2024 and January 30, 2021 and February 1, 2020.28, 2023.
Consolidated Statements of Operations for Fiscal 2020,2023, Fiscal 20192022 and Fiscal 2018.2021.
Consolidated Statements of Comprehensive Income for Fiscal 2020,2023, Fiscal 20192022 and Fiscal 2018.2021.
Consolidated Statements of Shareholders’ Equity for Fiscal 2020,2023, Fiscal 20192022 and Fiscal 2018.2021.
Consolidated Statements of Cash Flows for Fiscal 2020,2023, Fiscal 20192022 and Fiscal 2018.2021.
Notes to Consolidated Financial Statements for Fiscal 2020,2023, Fiscal 20192022 and Fiscal 2018.2021.

2.    Financial Statement Schedules

Schedule II—Valuation and Qualifying Accounts

All other schedules for which provisions are made in the applicable accounting regulation of the SEC are not required under the related instructions or are inapplicable and, therefore, have been omitted.

(b)   Exhibits

2.1

Unit Purchase Agreement, dated September 19, 2022 by and among JW Holdings, LLC, the sellers named therein, Oxford Industries, Inc. and Endeavour Capital Fund VI, L.P. as sellers’ representative (filed as Exhibit 2.2 to the Company’s Form 8-K filed on September 19, 2022)

3.1

Restated Articles of Incorporation of Oxford Industries, Inc. (filed as Exhibit 3.1 to the Company’s Form 10-Q for the fiscal quarter ended July 29, 2017)

3.2

Bylaws of Oxford Industries, Inc., as amended (filed as Exhibit 3.2 to the Company’s Form 8-K filed on August 18, 2020)

4.1

Description of Securities Registered under Section 12 of the Securities Exchange Act of 1934 (filed as Exhibit 4.1 to the Company’s Form 10-K for the fiscal year ended February 1, 2020)

10.1

Oxford Industries, Inc. Deferred Compensation Plan (as amended and restedrestated effective June 13, 2012) (filed as Exhibit 10.1 to the Company’s Form 10-Q for the fiscal quarter ended October 27, 2012)†

10.2

First Amendment to Oxford Industries, Inc. Deferred Compensation Plan dated July 1, 2016 (filed as Exhibit 10.3 to the Company’s Form 10-Q/A for the fiscal quarter ended on July 30, 2016)†

10.3

Fourth Amended and Restated Credit Agreement, dated as of May 24, 2016, by and amongSecond Amendment to Oxford Industries, Inc.; Tommy Bahama Group, Inc.; the Persons party thereto from time to time as Guarantors, the financial institutions party thereto as lenders, the financial institutions party thereto Deferred Compensation Plan dated December 22, 2022†

(filed as Exhibit 2.1: Issuing Banks; and SunTrust Robinson Humphrey, Inc. as a Joint Lead Arranger and a Joint Bookrunner; JPMorgan Chase Bank, N.A. as a Joint Lead Arranger, a Joint Bookrunner, and the Syndication Agent; and Bank of America, N.A. and KeyBank National Association, as the Co-Documentation Agents (filed as Exhibit 10.110.9 to the Company’s Form 8-K10-K filed on May 24, 2016)March 28, 2023)

10.4

Fourth Amended and Restated Pledge and Security Agreement, dated as of May 24, 2016, among Oxford Industries, Inc.; Tommy Bahama Group, Inc.; the additional entities grantor thereto, as Grantors, and Truist Bank f/k/a SunTrust Bank, as administrative agent (filed as Exhibit 10.2 to the Company’s Form 8-K filed on May 24, 2016)

111

Table of Contents

10.5

FirstForm of Oxford Industries, Inc. Restricted Share Unit Award Agreement*

10.6

Second Amendment to Fourth Amended and Restated Credit Agreement, dated as of July 31, 2019,March 6, 2023, by and among Oxford Industries, Inc., Tommy Bahama Group, Inc., the Persons party thereto from time to time as

114

Table of Contents

guarantors, the financial institutions party thereto from time to time as lenders, and SunTrustTruist Bank, as administrative agent (filed as Exhibit 10.199.1 to the Company’s Form 8-K filed on August 1, 2019)March 7, 2023)

10.610.7

Form of Oxford Industries, Inc. Restricted Stock Award Agreement (filed as Exhibit 10.1 to the Company’s Form 8-K filed on June 29, 2020)†

10.710.8

Form of Oxford Industries, Inc. Performance-Based Restricted Share Unit Award Agreement (filed as Exhibit 10.2 to the Company’s Form 8-K filed on June 29, 2020)†

10.810.9

Oxford Industries, Inc. Amended and Restated Long-Term Stock Incentive Plan (filed as Exhibit 10.310.9 to the Company’s Form 8-K10-K filed on June 29, 2020)†March 28, 2023)

21

Subsidiaries of Oxford Industries, Inc.*

23

Consent of Independent Registered Public Accounting Firm*

24

Power of Attorney*

31.1

Certification by Chief Executive Officer pursuant to Section 302 of the Sarbanes-Oxley Act of 2002*

31.2

Certification by Chief Financial Officer pursuant to Section 302 of the Sarbanes-Oxley Act of 2002*

32

Certification by Chief Executive Officer and Chief Financial Officer pursuant to Section 906 of the Sarbanes-Oxley Act of 2002*

97

Clawback Policy*

101INS

XBRL Instance Document – the instance document does not appear in the Interactive Data File because its XBRL tags are embedded within the Inline XBRL Document

101SCH

XBRL Taxonomy Extension Schema Document

101CAL

XBRL Taxonomy Extension Calculation Linkbase Document

101DEF

XBRL Taxonomy Extension Definition Linkbase Document

101LAB

XBRL Taxonomy Extension Label Linkbase Document

101PRE

XBRL Taxonomy Extension Presentation Linkbase Document

104

Cover Page Interactive Data File – the cover page interactive data file does not appear in the Interactive Data File because its XBRL tags are embedded within the Inline XBRL Document

*     Filed herewith

†     Management contract or compensation plan or arrangement required to be filed as an exhibit to this form pursuant to Item 15(b) of this report.

We agree to file upon request of the SEC a copy of all agreements evidencing long-term debt omitted from this report pursuant to Item 601(b)(4)(iii) of Regulation S-K.

Item 16.   Form 10-K Summary

None.

112115

Table of Contents

SIGNATURES

Pursuant to the requirements of Section 13 or 15(d) of the Securities Exchange Act of 1934, the registrant has duly caused this report to be signed on its behalf by the undersigned, hereunto duly authorized.

Oxford Industries, Inc.

By:

/s/ THOMAS C. CHUBB III

Thomas C. Chubb III
Chairman, Chief Executive Officer and President

Date: March 29, 2021April 1, 2024

Pursuant to the requirements of the Securities Exchange Act of 1934, this report has been signed below by the following persons on behalf of the registrant and in the capacities and on the dates indicated.

Signature


Capacity


Date

/s/ THOMAS C. CHUBB III

Thomas C. Chubb III

Chairman of the Board of Directors,

Chief Executive Officer and President (Principal

(Principal Executive Officer)

March 29, 2021April 1, 2024

/s/ K. SCOTT GRASSMYER

K. Scott Grassmyer

Executive Vice President, and Chief Financial Officer (Principal

and Chief Operating Officer

(Principal Financial Officer and Principal Accounting Officer)

March 29, 2021April 1, 2024

*

Helen Ballard

Director

March 29, 2021

*

Thomas C. Gallagher

Director

March 29, 2021

*

Virginia A. Hepner

Director

March 29, 2021April 1, 2024

*

John R. Holder

Director

March 29, 2021April 1, 2024

*

Stephen S. Lanier

Director

March 29, 2021April 1, 2024

*

Dennis M. Love

Director

March 29, 2021April 1, 2024

*

Milford W. McGuirt

Director

March 29, 2021April 1, 2024

*

Clarence H. Smith

Director

March 29, 2021April 1, 2024

*

Clyde C. Tuggle

Director

April 1, 2024

*

E. Jenner Wood III

Director

March 29, 2021April 1, 2024

*

Carol B. Yancey

Director

April 1, 2024

*By

/s/ SURAJ A. PALAKSHAPPA

Suraj A. Palakshappa

as Attorney-in-Fact

113116