UNITED STATES
SECURITIES AND EXCHANGE COMMISSION
Washington, D.C. 20549

 FORM 10-K

(Mark One)
ANNUAL REPORT PURSUANT TO SECTION 13 OR 15(d) OF THE SECURITIES EXCHANGE
ACT OF 1934
 For the fiscal year ended December 31, 20192022
or
TRANSITION REPORT PURSUANT TO SECTION 13 OR 15(d) OF THE SECURITIES
EXCHANGE ACT OF 1934
 For the transition period from ____ to ____
Commission file number: 1-13283
 _________________________________________________________ pva-20221231_g1.jpg
pvac2019logoa07.jpg
PENN VIRGINIA CORPORATIONRANGER OIL CORPORATION
(Exact name of registrant as specified in its charter)
Virginia23-1184320
(State or other jurisdiction of
incorporation or organization)
(I.R.S. Employer
Identification Number)
16285 Park Ten Place, Suite 500
Houston,, TX77084
(Address of principal executive offices) (Zip Code)
(713) 722-6500
(Registrant’s telephone number, including area code: (713722-6500code)
Securities registered pursuant to Section 12(b) of the Act:
Title of each classTrading Symbol(s)Name of exchange on which registered
Class A Common Stock, $0.01 Par ValuePVACROCCThe Nasdaq Global SelectStock Market LLC
Securities registered pursuant to Section 12(g) of the Act: None
Indicate by check mark if the registrant is a well-known seasoned issuer, as defined in Rule 405 of the Securities Act.      Yes      No  
Indicate by check mark if the registrant is not required to file reports pursuant to Section 13 or Section 15(d) of the Act.    Yes      No  
Indicate by check mark whether the registrant (1) has filed all reports required to be filed by Section 13 or 15(d) of the Securities Exchange Act of 1934 during the preceding 12 months (or for such shorter period that the registrant was required to file such reports), and (2) has been subject to such filing requirements for the past 90 days.    Yes      No  
Indicate by check mark whether the registrant has submitted electronically every Interactive Data File required to be submitted pursuant to Rule 405 of Regulation S-T (§ 232.405 of this chapter) during the preceding 12 months (or for such shorter period that the registrant was required to submit such files).    Yes    No  
Indicate by check mark whether the registrant is a large accelerated filer, an accelerated filer, a non-accelerated filer, a smaller reporting company, or an emerging growth company. See the definitions of “large accelerated filer,” “accelerated filer,” “smaller reporting company,” and “emerging growth company” in Rule 12b-2 of the Exchange Act. (Check One)
Large accelerated filerAccelerated filer

Non-accelerated filerSmaller reporting company
Emerging growth company
If an emerging growth company, indicate by check mark if the registrant has elected not to use the extended transition period for complying with any new or revised financial accounting standards provided pursuant to Section 13(a) of the Exchange Act. 
Indicate by check mark whether the registrant has filed a report on and attestation to its management’s assessment of the effectiveness of its internal control over financial reporting under Section 404(b) of the Sarbanes-Oxley Act (15 U.S.C. 7262(b)) by the registered public accounting firm that prepared or issued its audit report.
If securities are registered pursuant to Section 12(b) of the Act, indicate by check mark whether the financial statements of the registrant included in the filing reflect the correction of an error to previously issued financial statements.
Indicate by check mark whether any of those error corrections are restatements that required a recovery analysis of incentive-based compensation received by any of the registrant’s executive officers during the relevant recovery period pursuant to §240.10D-1(b).
Indicate by check mark whether the registrant is a shell company (as defined in Rule 12b-2 of the Act).    Yes      No  
The aggregate market value of voting and non-voting common equity held by non-affiliates of the registrant was $412,236,913$669,492,116 as of June 28, 201930, 2022 (the last business day of its most recently completed second fiscal quarter), based on the last sale price of such stock as quoted on the NASDAQNasdaq Global Select Market.
Indicate by check mark whether the registrant has filed all documents and reports required to be filed by Section 12, 13 or 15(d) of the Securities Exchange Act of 1934 subsequent to the distribution of securities under a plan confirmed by a court.   Yes       No   
As of February 21, 2020, 15,157,919March 3, 2023, there were 41,507,928 shares of common stock outstanding, including 18,958,930 shares of the registrant were outstanding.Class A Common Stock and 22,548,998 shares of Class B Common Stock.
DOCUMENTS INCORPORATED BY REFERENCE
Portions of the Proxy Statement relating to the registrant’s Annual Meeting of Shareholders, to be held on May 4, 2020, are incorporated by reference in Part III of this Form 10-K.
None.


PENN VIRGINIARANGER OIL CORPORATION
ANNUAL REPORT ON FORM 10-K
 For the Fiscal Year Ended December 31, 20192022
 Table of Contents
Page
Item 1A.Risk Factors


 Page
Forward-Looking Statements
Glossary of Certain Industry Terminology
Part I
Item  
1.Business
1A.Risk Factors
1B.Unresolved Staff Comments
2.Properties
3.Legal Proceedings
4.Mine Safety Disclosures
Part II
   
5.Market for Registrant’s Common Equity, Related Stockholder Matters and Issuer Purchases of Equity Securities
6.Selected Financial Data
7.Management’s Discussion and Analysis of Financial Condition and Results of Operations: 
 Overview and Executive Summary
 Key Developments
 Financial Condition
 Results of Operations
 Off-Balance Sheet Arrangements
 Contractual Obligations
 Critical Accounting Estimates
7A.Quantitative and Qualitative Disclosures About Market Risk 
8.Financial Statements and Supplementary Data
9.Changes in and Disagreements with Accountants on Accounting and Financial Disclosure
9A.Controls and Procedures
9B.Other Information
Part III
   
10.Directors, Executive Officers and Corporate Governance
11.Executive Compensation
12.Security Ownership of Certain Beneficial Owners and Management and Related Stockholder Matters
13.Certain Relationships and Related Transactions, and Director Independence
14.Principal Accountant Fees and Services
Part IV
   
15.Exhibits, Financial Statement Schedules
16.Form 10-K Summary
  
Signatures


Forward-Looking Statements
Certain statements contained herein that are not descriptions of historical facts are “forward-looking” statements within the meaning of Section 27A of the Securities Act of 1933, as amended, and Section 21E of the Securities Exchange Act of 1934, as amended, or the Exchange Act. We use words such as “anticipate,” “guidance,” “assumptions,” “projects,” “estimates,” “expects,” “continues,” “intends,” “plans,” “believes,” “forecasts,” “future,” “potential,” “may,” “possible,” “could” and variations of such words or similar expressions to identify forward-looking statements. Because such statements include risks, uncertainties and contingencies, actual results may differ materially from those expressed or implied by such forward-looking statements. These risks, uncertainties and contingencies include, but are not limited to, the following: 
all of the risks and uncertainty related to our announced merger with Baytex Energy Corp. (“Baytex”), including the risk that the conditions to the closing of the transaction are not satisfied and the additional risks discussed in Part I, Item 1A of this report;
risks related to completed acquisitions, including our abilitythe risk that the benefits of the acquisitions may not be fully realized or may take longer to realize theirthan expected, benefits;and that management attention will be diverted to integration-related issues;
the sustained market uncertainty of, and volatility of commodity prices for crude oil, natural gas liquids, or NGLs, and natural gas;
general economic conditions, including as a result of governmental actions to address elevated inflation levels caused by labor shortages, supply shortages and increased demand, and other inflationary pressures;
the impact of world health events, including the COVID-19 pandemic, economic slowdown, governmental actions, stay-at-home orders and interruptions to our operations or our customers operations;
risks related to and the impact of actual or anticipated other world health events;
our ability to satisfy our short-term and long-term liquidity needs, including our ability to generate sufficient cash
flows from operations or to obtain adequate financing on favorable terms, including access to the capital markets, to fund our capital expenditures and meet working capital needs;
needs;our ability to access capital, including through lending arrangements and the capital markets, as and when desired;
•    negative events or publicity adversely affecting our ability to maintain our relationships with our suppliers, service
providers, customers, employees, and other third parties;
•     plans, objectives, expectations and intentions contained in this report that are not historical;
•     our ability to execute our business plan in volatile and depressed commodity price environments;
the decline in, sustained market uncertainty of, and volatility of commodity prices for oil, natural gas liquids, or NGLs, and natural gas;
•     our ability to develop, explore for, acquire and replace oil and gas reserves and sustain production;
•     changes to our drilling and development program;
our ability to generate profits or achieve targeted reserves in our development and exploratory drilling and welloperations;
operations;
•     our ability to meet guidance, market expectations and internal projections, including type curvescurves;
•     any impairments, write-downs or write-offs of our reserves or assets;
•     the projected demand for and supply of oil, NGLs and natural gas;
•     our ability to contract for drilling rigs, frac crews, materials, supplies and services at reasonable costs;
our ability to declare dividends;
•     our ability to renew or replace expiring contracts on acceptable terms;
1


•     our ability to obtain adequate pipeline transportation capacity or other transportation for our oil and gas production at reasonable cost and to sell our production at, or at reasonable discounts to, market prices;
the uncertainties inherent in projecting future rates of production for our wells and the extent to which actual
production differs from that estimated in our proved oil and gas reserves;
•     use of new techniques in our development, including choke management and longer laterals;
drilling, completion and operating risks, including adverse impacts associated with well spacing and a high concentration of activity;
•     our ability to compete effectively against other oil and gas companies;
•     leasehold terms expiring before production can be established and our ability to replace expired leases;
•     environmental obligations, costs and liabilities that are not covered by an effective indemnity or insurance;
•     the timing of receipt of necessary regulatory permits;
•    the effect of commodity and financial derivative arrangements with other parties and counterparty risk related to the ability of these parties to meet their future obligations;
•     the occurrence of unusual weather or operating conditions, including force majeure events;
•     our ability to retain or attract senior management and key employees;
our reliance on a limited number of customers and a particular region for substantially all of our revenues and production;
compliance with and changes in governmental regulations or enforcement practices, especially with respect to
environmental, health and safety matters;
•     physical, electronic and cybersecurity breaches;
•    uncertainties and economic events relating to general domestic and international economic and political conditions;conditions, including political tensions or war;
the impact and uncertainty of world health events;
•     the impact and costs associated with litigation or other legal matters;
•     sustainability initiatives; and
•     other factors set forth in our periodic filings with the Securities and Exchange Commission, or SEC, including the risks set forth in Part I, Item 1A of this Annual Report on Form 10-K for the year ended December 31, 2019.2022.
Additional information concerning these and other factors can be found in our press releases and public filings with the SEC. Many of the factors that will determine our future results are beyond the ability of management to control or predict. Readers should not place undue reliance on forward-looking statements, which reflect management’s views only as of the date hereof. All subsequent written and oral forward-looking statements attributable to us or persons acting on our behalf are expressly qualified in their entirety by these cautionary statements. We undertake no obligation to revise or update any forward-looking statements, or to make any other forward-looking statements, whether as a result of new information, future events or otherwise, except as may be required by applicable law.

2
1


Glossary of Certain Industry Terminology
Terms
The following abbreviations, terms and definitions are commonly used in the oil and gas industry and are used within this Annual Report on Form 10-K.
Bblbbl. A standard barrel of 42 U.S. gallons liquid volume of oil or other liquid hydrocarbons.
Bcf. One billion cubic feet of natural gas.
BOEboe. One barrel of oil equivalent with six thousand6,000 cubic feet of natural gas converted to one barrel of crude oil based on the estimated relative energy content.
BOEPDboe/d. Barrels of oil equivalent per day.
Borrowing base. The value assigned to a collection of borrower’s assets used by lenders to determine an initial and/or continuing amount for loans. In the case of oil and gas exploration and development companies, the borrowing base is generally based on proved developed reserves.
Completion. A process of treating a drilled well, including hydraulic fracturing among other stimulation processes, followed by the installation of permanent equipment for the production of oil or gas.
Condensate. A mixture of hydrocarbons that exists in the gaseous phase at original reservoir temperature and pressure, but that, when produced, is in the liquid phase at surface temperature and pressure.
Development well. A well drilled within the proved area of an oil or gas reservoir to the depth of a stratigraphic horizon known to be productive.
Dry hole. A well found to be incapable of producing either oil or gas in sufficient commercial quantities to justify completion of the well.
EBITDAX. A measure of profitability utilized in the oil and gas industry representing earnings before interest, income taxes, depreciation, depletion, amortization and exploration expenses. EBITDAX is not a defined term or measure in generally accepted accounting principles, or GAAP (see below).
Exploratory well. A well drilled to find a new field or to find a new reservoir in a field previously found to be productive of oil or gas in another reservoir. Generally, an exploratory well is any well that is not a development well, a service well or a stratigraphic test well.
EUR. Estimated ultimate reserves, the sum of reserves remaining as of a given date and cumulative production as of that date.
GAAP. Accounting principles generally accepted in the Unites States of America.
Gas lift. A method of artificial lift that uses an external source of high-pressure gas for supplementing formation gas for lifting the well fluids.
Gross acre or well. An acre or well in which a working interest is owned.
HBP. Held by production is a provision in an oil and gas or mineral lease that perpetuates the leaseholder’s right to operate the property as long as the property produces a minimum paying quantity of oil or gas.
Henry HubHH. TheHenry Hub, the Erath, Louisiana settlement point price for natural gas.
HSC. Houston Ship Channel settlement point price for natural gas.
Juniper. Juniper Capital Advisors, L.P., JSTX Holdings, LLC and Rocky Creek Resources, LLC
Juniper Transactions. Consummation of the transactions contemplated by: (i) the Contribution Agreement, dated November 2, 2020, by and among Ranger Oil Corporation, the Partnership, and Juniper; and (ii) the Contribution Agreement, dated November 2, 2020 , by and among Rocky Creek, Ranger Oil Corporation and the Partnership pursuant to which Juniper contributed $150 million in cash and certain oil and gas assets in South Texas in exchange for equity.

3


LIBOR. London Interbank Offered Rate.
LLS. Light Louisiana Sweet, a crude oil pricing index reference.
MBblMbbl. One thousand barrels of oil or other liquid hydrocarbons.
MBOEMboe. One thousand barrels of oil equivalent.
Mcf. One thousand cubic feet of natural gas.
MEH. Magellan East Houston, a crude oil pricing index reference.
MMBblMMbbl. One million barrels of oil or other liquid hydrocarbons.
MMBOEMMboe. One million barrels of oil equivalent.
MMBtu. One million British thermal units, a measure of energy content.
MMcf. One million cubic feet of natural gas.
Nasdaq.Mt. Belvieu. The Nasdaq Global Select Market.Mont Belvieu, a natural gas liquid pricing index reference.
Net acre or well. The number of gross acres or wells multiplied by the owned working interest in such gross acres or wells.
NGL. Natural gas liquid.liquid (includes ethane, propane, butane, isobutane, pentane and pentanes plus).
NYMEX. New York Mercantile Exchange.


Oil. Includes crude oil and condensate.
Operator. The entity responsible for the exploration and/or production of a lease or well.
OPIS.Oil Price Information Service.
Partnership. ROCC Energy Holdings, L.P. (formerly PV Energy Holdings, L.P.)
Play. A geological formation with potential oil and gas reserves.
Productive wells. Wells that are not dry holes.
Proved reserves. Those quantities of oil and gas which, by analysis of geoscience and engineering data, can be estimated with reasonable certainty to be economically producible from a given date forward, from known reservoirs, and under existing economic conditions, operating methods and government regulations before the time at which contracts providing the right to operate expire, unless evidence indicates that renewal is reasonably certain, regardless of whether deterministic or probabilistic methods are used for the estimation.
Proved developed reserves. Proved reserves that can be expected to be recovered: (a) through existing wells with existing equipment and operating methods or in which the cost of the required equipment is relatively minor compared with the cost of a new well or (b) through installed extraction equipment and infrastructure operational at the time of the reserves estimate if the extraction is by means not involving a well.
Proved undeveloped reserves. Proved reserves that are expected to be recovered from new wells on undrilled acreage, or from existing wells where a relatively major expenditure is required for recompletion. Reserves on undrilled acreage are limited to those directly offsetting development spacing areas that are reasonably certain of production when drilled.
PV10
4


PV-10. A non-GAAP measure representing the present value of estimated future oil and gas revenues, net of estimated direct costs, discounted at an annual discount rate of 10%. PV10PV-10 is not a measure of financial or operating performance under GAAP, nor should it be considered in isolation or as a substitute for any GAAP measure. PV10PV-10 does not purport to represent the fair value of oil and gas properties.
Reservoir. A porous and permeable underground formation containing a natural accumulation of hydrocarbons that is confined by impermeable rock or water barriers and is separate from other reservoirs.
Revenue interest. An economic interest in production of hydrocarbons from a specified property.
Royalty interest. An interest in the production of a well entitling the owner to a share of production generally free of the costs of exploration, development and production.
SEC. United States Securities and Exchange Commission.
Service well. A well drilled or completed for the purpose of supporting production in an existing field.
Standardized measure. The present value, discounted at 10% per year, of estimated future cash inflows from the production of proved reserves, computed by applying prices used in estimating proved oil and gas reserves to the year-end quantities of those reserves (except for consideration of future price changes to the extent provided by contractual arrangements in existence at year-end), reduced by estimated future development and production costs, computed by estimating the expenditures to be incurred in developing and producing the proved oil and gas reserves at the end of the year (including the settlement of asset retirement obligations), based on year-end costs and assuming continuation of existing economic conditions, further reduced by estimated future income tax expenses, computed by applying the appropriate year-end statutory tax rates, with consideration of future tax rates already legislated, to the future pretax net cash flows relating to the proved oil and gas reserves, less the tax basis of the properties involved and giving effect to the tax deductions and tax credits and allowances relating to the proved oil and gas reserves.
Stratigraphic test well. A drilling effort, geologically directed, to obtain information pertaining to a specific geologic condition. Such wells customarily are drilled without the intention of being completed for hydrocarbon production.
Unconventional. Generally refers to hydrocarbon reservoirs that lack discrete boundaries that typically define conventional reservoirs. Examples include shales, tight sands or coal beds.
Undeveloped acreage. Lease acreage on which wells have not been drilled or completed to a point that would permit the production of economic quantities of oil or gas, regardless of whether such acreage contains proved reserves. Under appropriate circumstances, undeveloped acreage may not be subject to expiration if properly held by production, as that term is defined above.
WTI. West Texas Intermediate, a crude oil pricing index reference.
Working interest. A cost-bearing interest under an oil and gas lease that gives the holder the right to develop and produce the minerals under the lease.

35


RISK FACTOR SUMMARY
The following summarizes the principal factors that make an investment in Ranger Oil speculative or risky, all of which are more fully described in Part I, Item 1A. “Risk Factors” below. This summary should be read in connection with the Risk Factors section and should not be relied upon as an exhaustive summary of the material risks facing our business.
The following factors could materially adversely affect our business, results of operations, financial condition, cash flows, liquidity and the trading price of our common stock.
Risks Related to the Baytex Merger
The uncertainty of the precise value of the merger consideration because the exchange ratio is fixed and dependent on the market price of Baytex common shares, which may fluctuate
Risk that the Baytex Merger (as defined below) may not be completed or may be terminated
Adverse impacts associated with reduced ownership and voting interest in Baytex after the Baytex Merger
Provisions in the Baytex Merger Agreement that may limit our ability to pursue alternatives to the Baytex Merger and may discourage a potential acquiror of us from making a favorable alternative transaction proposal
Risks associated with the failure to complete the Baytex Merger
Business uncertainties while the Baytex Merger is pending
Different rights associated with the Baytex common shares from our Class A common stock
Change in control or other provisions in certain agreements that may be triggered by the Baytex Merger
The incurrence of significant transaction and merger-related costs
Risks associated with possible securities class action or derivative lawsuits
Risks Associated with our General Business
Prices for crude oil, NGLs and natural gas, which are dependent on many factors that are beyond our control
Risks associated with drilling and operations activities, which are high-risk activities with many uncertainties and may not result in commercially productive reserves
Risks associated with multi-well pad drilling and project development, which may result in volatility in our operating results
Adverse impacts associated with a high concentration of activity and tighter drilling spacing
Our ability to adhere to our proposed drilling schedule
Our dependence on gathering, processing, refining and transportation facilities owned by others
The unavailability, high cost or shortage of drilling rigs, frac crews, equipment, raw materials, supplies, oilfield services or personnel, which may restrict our operations
Our ability to find or acquire additional oil and gas reserves that are economically recoverable
Our ability to attract and retain key members of management, qualified Board members and other key personnel
The continued direct and indirect effects of the COVID-19 pandemic on our business, financial position, results of operations and/or cash flows, which will depend on future developments that are highly uncertain and cannot be predicted
Our ability to establish production on the acreage of certain of our undeveloped leasehold assets that are subject to leases that will expire over the next several years unless production is developed
Actions we or other operators may take when drilling, completing, or operating wells that they own that may adversely affect certain of our wells
Our exposure to the credit risk of our customers
Our participation in oil and gas leases with third parties, who may not be able to fulfill their commitments to our projects
The accuracy of our estimates of oil and gas reserves and future net cash flows, which are not precise, and undeveloped reserves, which may not ultimately be converted into proved producing reserves
6


The incurrence of impairments on our oil and gas properties
Our ability to obtain sufficient capital
Risks associated with property and business acquisitions
Losses resulting from title deficiencies
Difficulties associated with being a small company competing in a larger market
Our lack of diversification and risks associated with operating primarily in one major contiguous area
Operating risks, including risks associated with hydraulic fracturing
Financial and Related Risks
Our substantial indebtedness
A reduction in our borrowing base
Restrictive covenants under the Credit Facility and the indenture governing our 9.25% Senior Notes due 2026 (the “Indenture”), which could limit our financial flexibility
Derivative transactions, which may limit our potential gains and involve other risks
Investor sentiment towards the oil and gas industry, which could adversely affect our ability to raise equity and debt capital
Legal and Regulatory Risks
Various laws and regulations that could adversely affect the cost, manner or feasibility of doing business, including climate change legislation, laws and regulations restricting emissions of greenhouse gases or prohibiting, restricting, or delaying oil and gas development on public lands, and federal state and local legislation and regulatory initiatives relating to hydraulic fracturing
Our ability to access water to drill and conduct hydraulic fracturing and difficulties associated with disposing of produced water gathered from drilling and production activities
Our commitments and disclosures related to environmental and social matters expose us to numerous risks
Risks associated with legal proceedings
Tax-Related Risks
Our ability to use net operating loss carryforwards to offset future taxable income, which may be subject to certain limitations
The continued availability of certain federal income tax deductions with respect to oil and gas exploration and development
Technology-Related Risks
Our ability to keep pace with technological developments in our industry
Risks relating to cybersecurity incidents
Risks Related to Ownership of Our Class A Common Stock
Risks associated with Juniper’s control of the Company, including potential conflicts between Juniper’s interests and the interests of the Company and its stockholders
Certain provisions of our certificate of incorporation and our bylaws that may make it difficult for stockholders to change the composition of our Board and may discourage, delay or prevent a merger or acquisition that some stockholders may consider beneficial
The volatility of the market price of our Class A common stock
The actions of so-called “activist” shareholders, which could impact the trading value of our securities
Future sales or other dilution of our equity, which may adversely affect the market price of our Class A common stock
Our ability to pay dividends on shares of our Class A common stock is uncertain and could be limited

7


Part I
Item 1Business
Item 1. Business
Unless the context requires otherwise, references to the “Company,” “Penn Virginia,“Ranger Oil,” “we,” “us” or “our” in this Annual Report on Form 10-K refer to Penn VirginiaRanger Oil Corporation and its subsidiaries.
Description of Business
We are an independent oil and gas company engaged in the onshore exploration, development and production of crude oil, NGLs and natural gas. Our current operations consist of drilling unconventional horizontal development wells and operating our producing wells in the Eagle Ford Shale or the Eagle Ford, in Gonzales, Lavaca, Fayette and DeWitt Counties(the “Eagle Ford”) in South Texas.
We were incorporatedJuniper Capital Advisors, L.P. (“Juniper Capital”), through its affiliates, JSTX Holdings, LLC (“JSTX”) and Rocky Creek Resources, LLC (“Rocky Creek” and together with JSTX and Juniper Capital, “Juniper”) beneficially owned as of March 3, 2023 an approximate 54% equity interest in the CommonwealthCompany through its ownership of Virginia in 1882. Our22,548,998 shares of our Class B common stock, par value of $0.01 per share (“Class B Common Stock”) and 22,548,998 common units in our Up-C partnership subsidiary (the “Common Units”). See Note 2 and Note 4 to the consolidated financial statements included in Part II, Item 8, “Financial Statements and Supplementary Data” of this Annual Report on 10-K for further information.
On February 27, 2023, we entered into an Agreement and Plan of Merger (the “Merger Agreement”) with Baytex pursuant to which, among other things, the Company will merge with and into a wholly owned subsidiary of Baytex with the Company surviving the merger as a wholly owned subsidiary of Baytex (the “Baytex Merger”). Subject to the terms and conditions of the Merger Agreement, each share of our Class A common stock, par value $0.01 per share (“Class A Common Stock”) issued and outstanding immediately prior to the effective time of the Baytex Merger (including shares of our Class A Common Stock to be issued in connection with the exchange of the Class B Common Stock and Common Units for Class A Common Stock), will be converted automatically into the right to receive: (i) 7.49 Baytex common shares and (ii) $13.31 in cash. The transaction was unanimously approved by the board of directors of each company and JSTX and Rocky Creek delivered a support agreement to vote their outstanding shares in favor of the Baytex Merger. The Baytex Merger is publicly traded onexpected to close late in the Nasdaq undersecond quarter of 2023, subject to the symbol “PVAC.” Our headquarterssatisfaction of customary closing conditions, including the requisite shareholder and corporate office is located in Houston, Texas. We also have a field operations office near our Eagle Ford assets in South Texas.
We operate in and report our financial results and disclosures as one segment, which is the exploration, development and production of crude oil, NGLs and natural gas.regulatory approvals.
Current Operations
We lease a highly contiguous position of approximately 87,400 net187,700 gross (163,800 net) acres (asas of December 31, 2019)March 3, 2023 in the core liquids-rich area or “volatile oil window” of the Eagle Ford in Gonzales, Lavaca, Fayette and Dewitt Counties inSouth Texas, which we believe contains a substantial number of drilling locations that will support a multi-year drilling inventory.
In 2019,2022, our total productionsales volume was comprised of 74 percent72% crude oil, 15 percent15% NGLs and 11 percent13% natural gas. Crude oil accounted for 93 percent88% of our product revenues. We generally sell our crude oil, NGL and natural gas products using short-term floating price physical and spot market contracts.
As of December 31, 2019,2022, our total proved reserves were approximately 133 MMBOE,254.5 MMboe, of which 42 percent42% were proved developed reserves and 74 percent67% were crude oil. As of December 31, 2019,2022, we had 510976 gross (430.1(857.2 net) productive wells, approximately 98 percent97% of which we operate, and leased approximately 100,200188,900 gross (87,400(162,100 net) acres of leasehold and royalty interests, approximately 9 percent34% of which were undeveloped. Approximately 91 percent96% of our total acreage iswas HBP as of December 31, 2022 and includesincluded a substantial number of undrilled locations. During 2019,2022, we drilledcompleted and completed 48turned to sales 59 gross (43.3(49.9 net) wells, all in the Eagle Ford.wells. For a more detailed discussion ofadditional information regarding our production, reserves, drilling activities, wells and acreage, see Part I, Item 2, “Properties.
In 2018 and 2017 we completed the acquisition of certain oil and gas assets from Hunt Oil Company, or Hunt, and Devon Energy Corporation, or Devon, including oil and gas leases covering approximately 9,700 and 19,600 net acres located primarily in Gonzales and Lavaca Counties, Texas, respectively, or the Hunt and Devon Acquisitions. These acquisitions substantially expanded our Eagle Ford operations to their present scale. For a more detailed discussion of these transactions, see Note 4 to our Consolidated Financial Statements included in Part II, Item 8, “Financial Statements and Supplementary Data.
Key Contractual Arrangements
In the ordinary course of operating our business, we enter into a number of key contracts for services that are critical with respect to our ability to develop, produce, store and bring our production to market. The following is a summary of our most significant contractual arrangements.
Oil gathering and transportation service contracts. We have long-term agreements that provide us with field gathering and intermediate pipeline transportation services for a substantial portion of our crude oil and condensate production through February 2041 and February 2026, respectively, as well as volume capacity support for certain downstream interstate pipeline transportation.
Natural gas service contracts. We have an agreement that provides us with field gathering, compression and short-haul transportation services for a substantial portion of our natural gas production and gas lift for all of our hydrocarbon production until 2039.
Natural gas processing contracts. We have two agreements that provide us with services to process our wet gas production into NGL products and dry, or residue, gas. The more significant of these agreements extends through June 2029 while the other agreement, which represents a minor portion of our total processing requirements, is evergreen in term with either party having the right to terminate with 30-days’notice to the counterparty.
Drilling and Completion. From time to time we enter into drilling, completion and materials contracts in the ordinary course of business to ensure availability of rigs, frac crews and materials to satisfy our development program. As of December 31, 2019, there were no2022, we had contracts for three drilling completionrigs with remaining terms of less than two years.

8


Crude oil gathering and transportation service contracts. We have long-term agreements that provide us with field gathering and intermediate pipeline transportation services for a majority of our crude oil and condensate production in Lavaca and Gonzales Counties, Texas. We also have volume capacity support for certain downstream intrastate pipeline transportation. The following table provides details on these contractual arrangements as of December 31, 2022:

Description of contractual arrangementExpiration
of Contractual Arrangement
Minimum Gross
Volume Delivery
(bbl/d)
Expiration of Minimum Volume Commitment
Field gathering agreementFebruary 20418,000February 2031
Intermediate pipeline transportation servicesFebruary 20268,000February 2026
Volume capacity supportApril 20268,000April 2026
Each of these arrangements also contain an obligation to deliver the first 20,000 gross barrels of oil per day produced from Gonzales, Lavaca and Fayette Counties, Texas. For certain of our crude oil volumes gathered under the field gathering agreement, our rate includes an adjustment based on NYMEX WTI prices. As crude oil prices increase, up to a cap of $90 per bbl, the gathering rate escalates pursuant to the field gathering agreement.
Crude oil storage. As of December 31, 2022, we had access to up to approximately 180,000 barrels of crude oil storage as a component of the crude oil gathering agreement referenced above. In addition, we have access for an additional 70,000 barrels at the service provider’s central delivery point facility, or materialsCDP, in Lavaca County, Texas, on a month-to-month basis, which can be terminated by either party with 45 days’ notice to the counterparty. For additional information relating to crude oil storage see Note 14 to our consolidated financial statements included in Part II, Item 8, “Financial Statements and Supplementary Data.”
Crude terminal dedication. We have a long-term dedication of certain specific leases to a crude purchase and throughput terminal agreement through 2032. Under the agreement, we may transfer dedicated oil for delivery to a Gulf coast terminal in Point Comfort, Texas or to alternate locations to third parties and in any case, we pay a terminal fee.
Natural gas service contracts. We have agreements that provide us with field gathering, compression and short-haul transportation services for our natural gas production and gas lift for our hydrocarbon production under various terms that extended beyond one year.through 2039.


Natural gas processing contracts. We also have agreements that provide us with services to process our wet gas production into NGL products and dry, or residue, gas. Several agreements covering the majority of our wet gas production extend beyond three years, including one agreement that extends into 2029.
Major Customers
We sell a significant portion of our oil and gas production to a relatively small number of customers. For the year ended December 31, 2019,2022, approximately 76 percent43% of our consolidated product revenues were attributable to four customers: BP Products North America Inc.; Phillips 66 Company; Shell Trading (US) Companytwo customers, each of whom accounted for at least 10%. For the years ended December 31, 2021 and Trafigura Trading LLC.2020, approximately 48% and 56%, respectively, of our consolidated product revenues were attributable to three customers, each of whom accounted for at least 10%. There were no other customers that individually accounted for more than 10% of our consolidated product revenues for the years ended December 31, 2022, 2021 and 2020.
Seasonality
Our sales volumes of crude oil and natural gas are dependent upon the number of producing wells and, therefore, are not seasonal by nature. We do not believe that the pricing of our crude oil and NGL production is subject to any meaningful seasonal effects. Historically, the pricing of natural gas is seasonal, typically with higher pricing in the winter months.

9


Competition
The oil and gas industry is very competitive, and we compete with a substantial number of other companies, many of which are large, well-established and have greater financial and operational resources than we do. Some of our competitors not only engage in the acquisition, exploration, development and production of oil and gas reserves, but also carry on refining operations, electricity generation and the marketing of refined products. In addition, the oil and gas industry in general competes with other industries supplying energy and fuel to industrial, commercial and individual consumers. Competition is particularly intense in the acquisition of prospective oil and gas properties. We may incur higher costs or be unable to acquire and develop desirable properties at costs we consider reasonable because of this competition. We also compete with other oil and gas companies to secure drilling rigs, frac fleets, sand and other equipment and materials necessary for the drilling and completion of wells and in the recruiting and retaining of qualified personnel. Such materials, equipment and labor may be in short supply from time to time. Shortages of equipment, labor or materials may result in increased costs or the inability to obtain such resources as needed. Many of our larger competitors may have a competitive advantage when responding to commodity price volatility and overall industry cycles.
Government Regulation and Environmental Matters
Our operations are subject to extensive federal, state and local laws and regulations that govern oil and gas operations, regulate the discharge of materials into the environment or otherwise relate to the protection of the environment. These laws, rules and regulations may, among other things:
require the acquisition of various permits before drilling commences;
require notice to stakeholders of proposed and ongoing operations;
require the installation of expensive pollution control equipment;
restrict the types, quantities and concentration of various substances that can be released into the environment in connection with oil and gas drilling and production and saltwater disposal activities;
limit or prohibit drilling activities on certain lands lying within wilderness, wetlands and other protected areas, or otherwise restrict or prohibit activities that could impact the environment, including water resources; and
require remedial measures to mitigate pollution from former and ongoing operations, such as requirements to close pits and plug abandoned wells.
Numerous governmental departments issue rules and regulations to implement and enforce such laws that are often difficult and costly to comply with and which carry substantial administrative, civil and even criminal penalties, as well as the issuance of injunctions limiting or prohibiting our activities for failure to comply. Violations and liabilities with respect to these laws and regulations could also result in remedial clean-ups, natural resource damages, permit modifications or revocations, operational interruptions or shutdowns and other liabilities. The costs of remedying such conditions may be significant, and remediation obligations could adversely affect our financial condition, results of operations and cash flows. In certain instances, citizens or citizen groups also have the ability to bring legal proceedings against us if we are not in compliance with environmental laws or to challenge our ability to receive environmental permits that we need to operate. Some laws, rules and regulations relating to protection of the environment may, in certain circumstances, impose “strict liability” for environmental contamination, rendering a person liable for environmental and natural resource damages and cleanup costs without regard to negligence or fault on the part of such person. Other laws, rules and regulations may restrict the rate of oil and gas production below the rate that would otherwise exist or even prohibit exploration or production activities in sensitive areas. In addition, state laws often require some form of remedial action to prevent pollution from former operations, such as plugging of abandoned wells. As of December 31, 2019, we have recorded asset retirement obligations of $4.9 million attributable to these activities. The regulatory burden on the oil and gas industry increases its cost of doing business and consequently affects its profitability. These laws, rules and regulations affect our operations, as well as the oil and gas exploration and production industry in general. As of December 31, 2022, we had $8.8 million of asset retirement obligations.


In addition, the United States Environmental Protection Agency, or the EPA, has designated energy extraction as one of six national enforcement initiatives, and has indicated that the agency will direct resources towards addressing incidences of noncompliance from natural gas extraction and production activities. We believe that we are in substantial compliance with current applicable environmental laws, rules and regulations and that continued compliance with existing requirements will not have a material impact on our financial condition, results of operations or cash flows. Nevertheless, changes in existing environmental laws or regulations or the adoption of new environmental laws or regulations, including any significant limitation on the use of hydraulic fracturing or the ability to conduct oil and gas development could have the potential to adversely affect our financial condition, results of operations and cash flows. Federal, state or local administrative decisions, developments in the federal or state court systems or other governmental or judicial actions may influence the interpretation or enforcement of environmental laws and regulations and may thereby increase compliance costs. Environmental regulations have historically become more stringent over time, and thus, there can be no assurance as to the amount or timing of future expenditures for environmental compliance or remediation.

10


The following is a summary of the significant environmental laws to which our business operations are subject.subject:
CERCLA. The Comprehensive Environmental Response, Compensation, and Liability Act, or CERCLA, is also known as the “Superfund” law. CERCLA and comparable state laws impose liability, without regard to fault or the legality of the original conduct, on parties that are considered to have contributed to the release of a “hazardous substance” into the environment. These persons include the current or former owner or operator of the site where the release occurred and anyone who disposed or arranged for the disposal of a hazardous substance released at the site. Such “responsible parties” may be subject to joint and several liability under CERCLA for the costs of cleaning up the hazardous substances that have been released into the environment and for damages to natural resources. It is not uncommon for neighboring landowners and other third parties to file claims for personal injury and property damage allegedly caused by the hazardous substances released into the environment. We currently own or lease properties that have been used for the exploration and production of oil and gas for a number of years. Many of these properties have been operated by third parties whose treatment or release of hydrocarbons or other wastes was not under our control. These properties, and any wastes that may have been released on them, may be subject to CERCLA, and we could potentially be required to investigate and remediate such properties, including soil or groundwater contamination by prior owners or operators, or to perform remedial plugging or pit closure operations to prevent future contamination. States also have environmental cleanup laws analogous to CERCLA, including Texas.
RCRA. The Resource Conservation and Recovery Act, or RCRA, and comparable state statutes regulate the generation, transportation, treatment, storage, disposal and cleanup of hazardous and non-hazardous wastes. Under the auspices of the EPA, the individual states administer some or all of the provisions of RCRA. While there is currently an exclusion from RCRA for drilling fluids, produced waters and most of the other wastes associated with the exploration and production of oil or gas, it is possible that some of these wastes could be classified as hazardous waste in the future and therefore be subject to more stringent regulation under RCRA. For example, in December 2016, the EPA and certain environmental organizations entered into a consent decree to address the EPA’s alleged failure to timely assess its RCRA Subtitle D criteria regulations exempting certain exploration and production-related oil and gas wastes from regulation as hazardous wastes under RCRA. The consent decree required the EPA to propose a rulemaking no later than March 15, 2019 for revision of certain Subtitle D criteria regulations pertaining to oil and gas wastes or to sign a determination that revision of the regulations is not necessary; the EPA ultimately determined that a revision was not necessary. Also, in the course of our operations, we generate some amounts of ordinary industrial wastes that may be regulated as hazardous wastes if such wastes have hazardous characteristics.
Oil Pollution Act. The Oil Pollution Act of 1990, or the OPA, contains numerous restrictions relating to the prevention of and response to oil spills into waters of the United States.States (“U.S.”). The term “waters of the United States” has been interpreted broadly to include inland water bodies, including wetlands and intermittent streams. The OPA imposes certain duties and liabilities on certain “responsible parties” related to the prevention of oil spills and damages resulting from such spills in or threatening waters of the United StatesU.S. or adjoining shorelines. For example, operators of certain oil and gas facilities must develop, implement and maintain facility response plans, conduct annual spill training for certain employees and provide varying degrees of financial assurance. Owners or operators of a facility, vessel or pipeline that is a source of an oil discharge or that poses the substantial threat of discharge is one type of “responsible party” who is liable. The OPA subjects owners of facilities to strict, joint and several liability for all containment and cleanup costs, and certain other damages arising from a spill. As such, a violation of the OPA has the potential to adversely affect our business, financial condition, results of operations and cash flows.
Clean Water Act. The Federal Water Pollution Control Act, or the Clean Water Act, and comparable state laws impose restrictions and strict controls with respect to the discharge of pollutants, including spills and leaks of oil and other substances, into regulated waters, such as waters of the United States.U.S. The discharge of pollutants, including dredge or fill materials in regulated wetlands, into regulated waters or wetlands without a permit issued by the EPA, the U.S. Army Corps of Engineers, or the Corps, or the state is prohibited. The Clean Water Act has been interpreted by these agencies to apply broadly. The EPA and the Corps released a rule to revise the definition of “waters of the United States,” or WOTUS, for all Clean Water Act programs, which went into effect in August 2015. In January 2017,However, the United States Supreme Court accepted reviewEPA rescinded this rule in 2019 and promulgated the Navigable Waters Protection Rule in 2020. The Navigable Waters Protection Rule defined what waters qualify as navigable waters of the U.S. and are under Clean Water Act jurisdiction. This new rule to determine whether jurisdiction to hear challengeshas generally been viewed as narrowing the scope of waters of the U.S. as compared to the 2015 rule, rests with thebut litigation in multiple federal district or appellate courts. In January


2018,courts is currently challenging the Supreme Court ruled that district courts have jurisdiction over challenges torescission of the rule.2015 rule and the promulgation of the Navigable Waters Protection Rule. In June 2017,2021, the EPA andBiden Administration announced plans to develop its own definition for jurisdictional waters. On December 7, 2021, the CorpsBiden Administration announced a proposed a rule that would initiate the first step in a two-step process intended to review and revise the definition of WOTUS. Under“waters of the proposal,United States.” On January 24, 2022, the first step would beSupreme Court agreed to rescindconsider the 2015 final rule and put back into effect the narrower language defining WOTUS underscope of the Clean Water Act that existed prior to the rule. The second step would beagain in a notice-and-comment rule-making in which the agencies will conduct a substantive reevaluation of the definition of WOTUS. In September 2019, the EPA finalized the first step in this process. In January 2020, the EPA finalized the second step in this process, finalizing a rule that narrowed the regulatory definition of WOTUS. Litigation challenging the repeal of the August 2015 rule is pending.new appeal, Sackett v. EPA.
The Clean Water Act also requires the preparation and implementation of Spill Prevention, Control and Countermeasure Plans in connection with on-site storage of significant quantities of oil. In 2016, the EPA finalized new wastewater pretreatment standards that would prohibit onshore unconventional oil and gas extraction facilities from sending wastewater to publicly-owned treatment works. This restriction of disposal options for hydraulic fracturing waste may result in increased costs. In addition, the Clean Water Act and analogous state laws require individual permits or coverage under general permits for discharges of storm water runoff from certain types of facilities. Federal and state regulatory agencies can impose administrative, civil and criminal penalties for non-compliance with discharge permits or other requirements of the Clean Water Act and analogous state laws and regulations.

11


Safe Drinking Water Act. The Safe Drinking Water Act, or the SDWA, and the Underground Injection Control Program promulgated under the SDWA, establish the requirements for salt water disposal well activities and prohibit the migration of fluid-containing contaminants into underground sources of drinking water. The Underground Injection WellControl Program requires that we obtain permits from the EPA or delegated state agencies for our disposal wells, establishes minimum standards for injection well operations, restricts the types and quantities of fluids that may be injected and prohibits the migration of fluid containing any contaminants into underground sources of drinking water. Any leakage from the subsurface portions of the injection wells may cause degradation of freshwater, potentially resulting in cancellation of operations of a well, imposition of fines and penalties from governmental agencies, incurrence of expenditures for remediation of affected resources, and imposition of liability by landowners or other parties claiming damages for alternative water supplies, property damages, and personal injuries. In addition, in some instances, the operation of underground injection wells has been alleged to cause earthquakes (induced seismicity) as a result of flawed well design or operation. This has resulted in stricter regulatory requirements in some jurisdictions relating to the location and operation of underground injection wells, and regulators in some states are seeking to impose additional requirements, including requirements regarding the permitting of produced water disposal wells or otherwise, to assess the relationship between seismicity and the use of such wells. For example, in October 2014, the Texas Railroad Commission, or TRC, adopted disposal well rule amendments designed, among other things, to require applicants for new disposal wells that will receive non-hazardous produced water or other oil and gas waste to conduct seismic activity searches utilizing the U.S. Geological Survey. The searches are intended to determine the potential for earthquakes within a circular area of 100 square miles around a proposed new disposal well. If the permittee or an applicant of a disposal well permit fails to demonstrate that the produced water or other fluids are confined to the disposal zone or if scientific data indicates such a disposal well is likely to be, or determined to be, contributing to seismic activity, then TRC may deny, modify, suspend or terminate the permit application or existing operating permit for that disposal well. TRC has used this authority to deny permits for waste disposal wells. The TRC has created Seismic Response Areas (“SRAs”) with action plans to address seismic activity, including the Gardendale SRA in September 2021, the North Culberson-Reeves SRA in October 2021 and the Stanton SRA in January 2022. The potential adoption of federal, state and local legislation and regulations intended to address induced seismic activity in the areas in which we operate could restrict our drilling and production activities, as well as our ability to dispose of produced water gathered from such activities, which could result in increased costs and additional operating restrictions or delays.
We engage third parties to provide hydraulic fracturing or other well stimulation services to us in connection with the wells in which we act as operator. Hydraulic fracturing is an important and commonly used process in the completion of oil and gas wells, particularly in unconventional plays like the Eagle Ford formation, and is generally exempted from federal regulation as underground injection (unless diesel is a component of the fracturing fluid) under the SDWA. In addition, separate and apart from the referenced potential connection between injection wells and seismicity, concerns have been raised that hydraulic fracturing activities may be correlated to induced seismicity. The EPA also released the results of its comprehensive research study to investigate the potential adverse impacts of hydraulic fracturing on drinking water and ground water in December 2016, finding that hydraulic fracturing activities can impact drinking water resources under some circumstances, including large volume spills and inadequate mechanical integrity of wells. These developments could establish an additional level of regulation, including a removal of the exemption for hydraulic fracturing from the SDWA, and permitting of hydraulic fracturing operations at the federal level, which could lead to operational delays, increased operating and compliance costs and additional regulatory burdens that could make it more difficult or commercially impracticable for us to perform hydraulic fracturing. Such costs and burdens could delay the development of unconventional gas resources from shale formations, which are not commercially feasible without the use of hydraulic fracturing.


Chemical Disclosures Related to Hydraulic Fracturing.Fracturing. Texas has implemented chemical disclosure requirements for hydraulic fracturing operations. We currently disclose all hydraulic fracturing additives we use on www.FracFocus.org, a website created by the Ground Water Protection Council and Interstate Oil and Gas Compact Commission.
Prohibitions and Other Regulatory Limitations on Hydraulic Fracturing. Fracturing. There have been a variety of regulatory initiatives at the state level to restrict oil and gas drilling operations in certain locations.
In addition to chemical disclosure rules, some states have implemented permitting, well construction or water withdrawal regulations that may increase the costs of hydraulic fracturing operations. For example, Texas has water withdrawal restrictions allowing suspension of withdrawal rights in times of shortages while other states require reporting on the amount of water used and its source.

12


On the federal level, in 2016, the U.S. Bureau of Land Management, or BLM, under the Obama Administration published a final rule imposing more stringent standards on hydraulic fracturing activities on federal lands, including requirements for chemical disclosure, well bore integrity, and handling of flowback water. However, in late 2018, the BLM under the Trump Administration published a final rule rescinding the 2016 final rule. While the 2016 rule has been rescinded, new or more stringent regulations may be promulgated by the Biden Administration. In January 2021, President Biden announced a moratorium on new oil and gas leasing on federal lands and offshore waters pending completion of a comprehensive review and reconsideration of Federal oil and gas permitting and leasing practices. In August 2022, a federal district judge in Louisiana permanently enjoined the moratorium in the 13 states that filed a lawsuit against the action.
Increased regulation of and attention given by environmental interest groups, as well as state and federal regulatory authorities, to the hydraulic fracturing process could lead to greater opposition to oil and gas production activities using hydraulic fracturing techniques. Additional legislation or regulation could also lead to operational delays or increased operating costs in the production of oil and gas, including from the developing shale plays, or could make it more difficult to perform hydraulic fracturing. These developments could also lead to litigation challenging proposed or existing wells. The adoption of federal, state or local laws or the implementation of regulations regarding hydraulic fracturing that are more stringent could cause a decrease in the completion of new oil and gas wells, as well as increased compliance costs and time, which could adversely affect our financial position, results of operations and cash flows. We use hydraulic fracturing extensively and any increased federal, state, or local regulation of hydraulic fracturing could reduce the volumes of oil and gas that we can economically recover.
Clean Air Act. Our operations are subject to the Clean Air Act, or the CAA, and comparable state and local requirements. In 1990, the U.S. Congress adopted amendments to the CAA containing provisions that have resulted in the gradual imposition of certain pollution control requirements with respect to air emissions from our operations. The EPA and states have developed, and continue to develop, regulations to implement these requirements. We may be required to incur certain capital expenditures in the next several years for air pollution control equipment in connection with maintaining or obtaining operating permits and approvals addressing other air emission-related issues. Further, stricter requirements could negatively impact our production and operations. Federal and state regulatory agencies can impose administrative, civil and criminal penalties for non-compliance with air permits or other requirements of the CAA and associated state laws and regulations. In addition, the EPA has developed, and continues to develop, stringent regulations governing emissions of toxic air pollutants at specified sources.
On April 17, 2012, for example, the EPA issued final rules to subject oil and gas operations to regulation under the New Source Performance Standards, or NSPS, and National Emission Standards for Hazardous Air Pollutants, or NESHAPS, programs under the CAA, and to impose new and amended requirements under both programs. The EPA rules include NSPS standards for completions of hydraulically fractured natural gas wells, compressors, controllers, dehydrators, storage tanks, natural gas processing plants and certain other equipment. Further, in May 2016, the EPA issued final NSPS governing methane emissions from the oil and gas industry as well as source determination standards for determining when oil and gas sources should be aggregated for CAA permitting and compliance purposes. However, in August 2020 the EPA rescinded methane and volatile organic compound emissions standards for new and modified oil and gas transmission and storage infrastructure, as well as methane limits for new and modified oil and gas production and processing equipment. The NSPSEPA also relaxed requirements for methane extends the 2012 NSPSoil and gas operators to completions of hydraulically fractured oil wells, equipment leaks, pneumatic pumps and natural gas compressors.monitor emissions leaks. In June 2017,2021, President Biden signed into law a joint resolution of Congress repealing the 2020 Rule and reinstated the 2016 Rule. In November 2021, the EPA proposed a two year stay of the fugitive emissions monitoring requirements, pneumatic pump standardsnew NSPS updates and closed vent system certification requirements in the 2016 NSPS rule foremission guidelines to reduce methane and other pollutants from the oil and gas industry, while it reconsiders these aspects ofand, in December 2022 the rule. TheEPS issued a supplemental proposal is still under consideration. More recently, in September 2018,to expand the EPA proposed targeted improvements to the rule, including amendments to the rule’s fugitive emissions monitoring requirements,standards and is in the process of finalizing the amendments, which it originally expected to do in late 2019. Separately, on August 28, 2019, the EPA proposed amendments to the 2012further reduce methane and 2016 NSPS for the Oil and Natural Gas Industry that would remove all sources in the transmission and storage segment of the oil and natural gas industry from regulation under the NSPS, both for ozone-forming VOCs, and for “greenhouse gases,” or GHGs. The existing NSPS regulates GHGs through limitations on emissions of methane. The amendments also would rescind the methane requirements in the 2016 NSPS that apply to sources in the production and processing segments of the industry. As an alternative, the EPA also is proposing to rescind the methane requirements that apply to all sources in the oil and natural gas industry, without removing any sources from the current source category. The U.S. Bureau of Land Management, or other pollutants.
BLM finalized its own rules in November 2016 that limit methane emissions from new and existing oil and gas operations on federal lands through limitations on the venting and flaring of gas, as well as enhanced leak detection and repair requirements. The BLM adopted final rules in January 2017; operators generally had one year from the January 2017 effective date of the rule to come into compliance with the rule’s requirements. However, in September 2018, the BLMsubsequently announced a revised rule which would scale back the waste-prevention requirements of the 2016 rule. Environmental groups sued inrule, but this revised rule was vacated by a California federal district court in 2020, a day laterdecision which BLM has appealed to challenge the legalityNinth Circuit Court of aspectsAppeals. However, separately, the federal district court of Wyoming vacated the original 2016 rule in October 2020, a decision which BLM has appealed to the Tenth Circuit Court of Appeals. In November 2022, the BLM proposed a new iteration of the revisedregulations. The public comment period on the proposed rule and the outcome of this litigation is currently uncertain.ended on January 30, 2023. These rules have required changes to our operations, including the installation of new equipment to control emissions. The EPA had announced in 2016 an intent to impose methane emission standards for existing sources, but the agency was sued by multiple states for failing to implement these standards following the agency’s withdrawal


of information collection requests for oil and gas facilities. These rules wouldmay result in an increase to our operating costs and change to our operations. As a result of this continued regulatory focus, future federal and state regulations of the oil and gas industry remain a possibility and could result in increased compliance costs on our operations.

13


In November 2015, the EPA revised the existing National Ambient Air Quality Standards for ground level ozone to make the standard more stringent. The EPA finished promulgating final area designations under the new standard in 2018, which, to the extent areas in which we operate have been classified as non-attainment, may result in an increase in costs for emission controls and requirements for additional monitoring and testing, as well as a more cumbersome permitting process. Generally, it will take the states several years to develop compliance plans for their non-attainment areas. While we are not able to determine the extent to which this new standard will impact our business at this time, it has the potential to have a material impact on our operations and cost structure.
In June 2016, the EPA finalized a rule “aggregating” individual wells and other facilities and their collective emissions for purposes of determining whether major source permitting requirements apply under the CAA. These changes may introduce uncertainty into the permitting process and could require more lengthy and costly permitting processes and more expensive emission controls.
Collectively, these rules and proposed rules, as well as any future laws and their implementing regulations, may require a number of modifications to our operations. We may, for example, be required to install new equipment to control emissions from our well sites or compressors at initial startup or by the applicable compliance deadline. We may also be required to obtain pre-approval for the expansion or modification of existing facilities or the construction of new facilities. Compliance with such rules could result in significant costs, including increased capital expenditures and operating costs, and could adversely impact our business.
Greenhouse Gas Emissions. In response to findings that emissions of carbon dioxide, methane and other GHGs,greenhouse gases (“GHGs”), present an endangerment to public health and the environment, the EPA has issued regulations to restrict emissions of GHGs under existing provisions of the CAA. These regulations include limits on tailpipe emissions from motor vehicles and preconstruction and operating permit requirements for certain large stationary sources.
Both in the United StatesU.S. and worldwide, there is increasing attention being paid to the issue of climate change and the contributing effect of GHG emissions. Most recently in April 2016, the United StatesU.S. signed the Paris Agreement, which requires countries to review and “represent a progression” in their intended nationally determined contributions, which set GHG emission reduction goals, every five years beginning in 2020. However, in November 2019,In 2020, the Trump administration formally moved to exitAdministration withdrew the U.S. from the Paris Agreement, initiatingbut under the treaty-mandated one-year process atdirection of President Biden, the end of which the United States can officially exit the agreement. The United States’ adherence to the exit process and/or the terms on which the United States may reenterU.S. rejoined the Paris Agreement orin February 2021. Under the Paris Agreement, the Biden Administration has committed the U.S. to reducing its GHG emissions by 50% to 52% from 2005 levels by 2030. In November 2021, the U.S. and other countries entered into the Glasgow Climate Pact, which includes a separately negotiated agreement are unclear at this time.range of measures designed to address climate change, including but not limited to the phase-out of fossil fuel subsidies, reducing methane emissions 30% by 2030, and cooperating toward the advancement of the development of clean energy.
Domestically, in August 2022, President Biden signed into law the Inflation Reduction Act, which contains tax inducements and other provisions that incentivize investment, development, and deployment of alternative energy sources and technologies, which could increase operating costs within the oil and gas industry and accelerate the transition away from fossil fuels.
In August 2015, the EPA issued new regulations limiting carbon dioxide emissions from existing power generation facilities. Under this rule, nationwide carbon dioxide emissions would be reduced by approximately 30 percent30% from 2005 levels by 2030 with a flexible interim goal. Several industry groups and states challenged the rule. On February 9, 2016, the U.S. Supreme Court stayed the implementation of this rule pending judicial review. In August 2019, the EPA finalized the repeal of the 2015 regulations and replaced them with the Affordable Clean Energy rule, or ACE, that designates heat rate improvement, or efficiency improvement, as the best system of emissions reduction for carbon dioxide from existing coal-fired electric utility generating units. BothIn 2021, the appropriatenessU.S. Court of Appeals for the repealDistrict of Columbia struck down the 2015 regulations andACE rule, but did not reinstate the adequacy of ACE are currently subjectformer Clean Power Plan, or CPP, regulation. In June 2022, the Supreme Court struck down the CPP, holding that Congress did not grant EPA the authority to litigation.devise emissions caps based on the generation-shifting approach the EPA took in the CPP.
The EPA has issued the “Final Mandatory Reporting of Greenhouse Gases” Rule and a series of revisions to it, which requires operators of oil and gas production, natural gas processing, transmission, distribution and storage facilities and other stationary sources emitting more than established annual thresholds of carbon dioxide-equivalent GHGs to inventory and report their GHG emissions occurring in the prior calendar year on a facility-by-facility basis. These rules do not require control of GHGs. However, the EPA has indicated that it will use data collected through the reporting rules to decide whether to promulgate future GHG limits.
In certain circumstances, large sources of GHG emissions are subject to preconstruction permitting under the EPA’s Prevention of Significant Deterioration program. This program historically has had minimal applicability to the oil and gas production industry. However, there can be no assurance that our operations will avoid applicability of these or similar permitting requirements, which impose costs relating to emissions control systems and the efforts needed to obtain the permit.
14


Additional GHG regulations potentially affecting our industry include those described above under the subheading “Clean Air Act” which relate to methane.


Future federal GHG regulations of the oil and gas industry remain a possibility. Also, many states and regions have adopted GHG initiatives and certain governmental bodies have or are considering the imposition of fees or taxes based on the emission of GHGs by certain facilities. Many states have established GHG cap and trade programs. Most of these cap and trade programs work by requiring major sources of emissions, such as electric power plants, or major producers of fuels, such as refineries and natural gas processing plants, to acquire and surrender emission allowances. While it is not possible to predict how any regulations to restrict GHG emissions may come into force, these and other legislative and regulatory proposals for restricting GHG emissions or otherwise addressing climate change could require us to incur additional operating costs or curtail oil and gas operations in certain areas and could also adversely affect demand for the oil and gas we sell.
Finally,President Biden and the Democrat Party have identified climate change as a priority, and it shouldis likely that new executive orders, regulatory action, and/or legislation targeting GHG emissions, or prohibiting, delaying or restricting oil and gas development activities in certain areas, will be notedproposed and/or promulgated during the Biden Administration. For example, the acting Secretary of the Department of the Interior recently issued an order preventing staff from producing any new fossil fuel leases or permits without sign-off from a top political appointee, and President Biden recently announced a moratorium on new oil and gas leasing on federal lands and offshore waters pending completion of a comprehensive review and reconsideration of federal oil and gas permitting and leasing practices. President Biden’s order also established climate change as a primary foreign policy and national security consideration, affirms that achieving net-zero GHG emissions by or before mid-century is a critical priority, affirms President Biden’s desire to establish the U.S. as a leader in addressing climate change, generally further integrates climate change and environmental justice considerations into government agencies’ decision making, and eliminates fossil fuel subsidies, among other measures.
Finally, some scientists have concluded that increasing concentrations of GHGs in the Earth’s atmosphere may produce climate changes that have significant physical effects, such as increased frequency and severity of storms, floods and other climatic events; if any such effects were to occur, they could have an adverse effect on our operations.
OSHA. We are subject to the requirements of the Occupational Safety and Health Act, or OSHA, and comparable state laws that regulate the protection of the health and safety of workers. In addition, the OSHA hazard communication standard requires maintenance of information about hazardous materials used or produced in operations, and the provision of such information to employees, state and local government authorities and citizens. Other OSHA standards regulate specific worker safety aspects of our operations.
Endangered Species Act. The Endangered Species Act restricts activities that may affect endangered species or their habitats. While some of our facilities are in areas that may be designated as a habitat for endangered species, we believe that we are in substantial compliance with the Endangered Species Act. The presence of any protected species or the final designation of previously unprotected species as threatened or endangered in areas where we operate could result in increased costs from species protection measures or could result in limitations, delays, or prohibitions on our exploration and production activities that could have an adverse effect on our ability to develop and produce our reserves. Similar protections are given to bald and golden eagles under the Bald and Golden Eagle Protection Act and to migratory birds under the Migratory Bird Treaty Act, and similar protections may be available to certain species protected under state laws.
National Environmental Policy Act. Oil and gas exploration and production activities on federal lands are subject to the National Environmental Policy Act, or NEPA. NEPA requires federal agencies, including the U.S. Department of Interior, to evaluate major agency actions having the potential to significantly impact the environment. In the course of such evaluations, an agency will prepare an environmental assessment of the potential direct, indirect and cumulative impacts of a proposed project and, if necessary, will prepare a more detailed environmental impact statement that may be made available for public review and comment. This process has the potential to delay or even halt development of some of our oil and gas projects. For example, on January 27, 2022, the U.S. District Court for the District of Columbia found that the Bureau of Ocean Management’s failure to calculate the potential emissions from foreign oil consumption violated the agency’s approval of oil and gas leases in the Gulf of Mexico under the NEPA. This decision may disrupt or delay drilling operations if the agency is forced to reassess the environmental impacts of the Gulf of Mexico drilling program.
EmployeesNatural Gas Pipeline Safety Act. On November 15, 2021, the Pipeline and Labor RelationsHazardous Materials Safety Administration promulgated a rule expanding the scope of the Federal Pipeline Safety Regulations to include all onshore gas gathering pipelines. For the first time, gas lines transporting natural gas from production facilities to interstate gas transmission lines will be subject to federal pipeline regulations and operators will be required to report safety information for all gas gathering lines. The rules became effective in May 2022. Compliance with such rules could result in significant costs, including increased capital expenditures and operating costs, and could adversely impact our business.
We
15


Human Capital
At Ranger Oil, our employees are integral to the Company’s success. Ranger Oil’s key human capital management objectives are to attract, retain and develop talent to deliver on our strategy. As of December 31, 2022, we had a total of 94136 employees, asincluding 75 office-based employees and 61 field employees. All of December 31, 2019. We hire independent contractors on an as needed basis. We consider our current employee relations to be favorable. We andthese employees were full-time employees. None of our employees are not subject to anyrepresented by labor unions or covered by collective bargaining agreements. We focus on the following areas in supporting our human capital:
Diversity and Inclusion. We recognize that a diverse workforce provides the best opportunity to obtain unique perspectives, experiences and ideas to help our business succeed, and we are committed to providing a diverse and inclusive workplace to attract and retain talented employees. We seek to promote a work culture that treats all employees fairly and with respect, promotes inclusivity, and provides equal opportunities for the professional growth and advancement based on merit. Our Code of Business Conduct and Ethics prohibits discrimination on the basis of race, color, religion, national origin, sex, age (as defined by the law) or disability.
Health and Safety. Safety is a top priority at Ranger Oil. We promote safety with a robust health and safety program, which includes employee orientation and training, regular safety meetings, contractor management, risk assessments, hazard identification and mitigation, incident reporting and investigation, and corrective and preventative action development. Additionally, we have a Health, Safety and Environment Manual which includes specific field safety procedures, including responsibility to stop work on any activity deemed unsafe without the threat or fear of job reprisal. We subscribe to Safety Skills to convey relevant, applicable and timely safety training to our field operations staff.
Training and Development. We invest in developing our employees to help us realize opportunities for growth and contribute to advancing progress on our strategic priorities. Our ongoing efforts and initiatives are aimed at attracting, engaging, and developing employees in a thoughtful and meaningful way to support a diverse and inclusive culture. We encourage our employees to advance their knowledge and skills and to network with other professionals in order to pursue career advancement and enhance their skills.
Compensation and Benefits. We seek to provide fair, competitive compensation and comprehensive benefits to our employees that are designed to attract, retain and motivate employees. To align our short- and long-term objectives, our compensation programs consist of base pay, short-term incentives and long-term incentives, including restricted stock unit grants. Our wide array of benefits includes medical, dental, and vision insurance plans for employees and their families, life insurance and long-term disability plans, paid time off for holidays, vacation, sick leave, and other personal leave, and health and dependent care savings accounts. We also provide our employees with a 401(k) plan that includes a competitive company match, and employees have access to several other programs, such as a matching charitable gift program that matches employee donations to non-profit groups they support.
Philanthropy and Community Engagement. We also employ a local focus for our charitable giving campaigns, supporting non-profits and other organizations serving communities in and around Houston and our operating areas in Texas in addition to the company matching charitable gift program discussed above. The Company and its employees donate their time and resources to a wide range of charities, organizations, and activities. Additionally, we regularly partner with counties in which we operate to repair roads, often donating the necessary materials, as well as use local vendors to support our operations wherever possible.
Available Information
Our internet address is http://www.pennvirginia.com.www.rangeroil.com. We make available free of charge, on or through our website, our Corporate Governance Principles, Code of Business Conduct and Ethics, Audit Committee Charter, Compensation and Benefits Committee Charter, Nominating, Environmental, Social and Governance Committee Charter and Reserves Committee Charter, and we will provide copies of such documents to any shareholder who so requests.upon request. We also make available free of charge, on or through our website, our Annual Reports on Form 10-K, Quarterly Reports on Form 10-Q, Current Reports on Form 8-K and any amendments to those reports filed or furnished pursuant to Section 13(a) or 15(d) of the Exchange Act, as soon as reasonably practicable after we electronically file such material with, or furnish it to, the SEC. Investors can obtain currentCurrent and important information about the company fromis accessible through our website on a regular basis.website. The information contained on, or connected to, our website is not incorporated by reference intoin this Form 10-K and should not be considered part of this or any other report that we furnish or file with the SEC. We intend for our website to serve as a means of public dissemination of information for purposes of Regulation FD.

10
16


Item 1A1A. Risk Factors
Our business and operations are subject to a number of risks and uncertainties as described below; however, the risks and uncertainties described below are not the only ones we face. Additional risks and uncertainties that we are unaware of, or that we may currently deem immaterial, may become important factors that harm our business, financial condition, results of operations and cash flows in the future. If any of the following risks actually occur, our business, financial condition, results of operations and cash flows could suffer and the trading price of our common stockClass A Common Stock could decline.
Risk FactorsRisks in this section are grouped by the following categories: (i) Risks Related to the Baytex Merger; (ii) Risks Associated with our General Business; (iii) Financial and Related Risks; (iv) Legal and Regulatory Risks; (v) Tax-Related Risks; (vi) Technology-Related Risks; and (vii) Risks Related to the Ownership of Our Class A Common Stock. Many risks affect more than one category, and the risks are not in order of significance or probability of occurrence because they have been grouped by categories.
Risks Related to the Baytex Merger
Because the exchange ratio is fixed and because the market price of Baytex common shares may fluctuate, our stockholders cannot be certain of the precise value of any merger consideration they may receive in the Baytex Merger.
At the time the Baytex Merger is completed, each issued and outstanding eligible share of our Class A Common Stock will be converted into the right to receive the merger consideration of 7.49 Baytex common shares plus $13.31 in cash. The exchange ratio for the merger consideration is fixed, and there will be no adjustment to the merger consideration for changes in the market price of Baytex common shares or our Class A Common Stock prior to the completion of the Baytex Merger. If the Baytex Merger is completed, there will be a time lapse between the date of signing the Baytex Merger Agreement and the date on which our stockholders who are entitled to receive the merger consideration actually receive the merger consideration. The market value of the Baytex common shares may fluctuate during this period as a result of a variety of factors, including general market and economic conditions, changes in Baytex’s businesses, operations and prospects and regulatory considerations. Such factors are difficult to predict and, in many cases, may be beyond the control of Baytex and us. The actual value of any merger consideration received by our stockholders upon the completion of the Baytex Merger will depend on the market value of the Baytex common shares at that time. This market value may differ, possibly materially, from the market value of Baytex common shares at the time the Baytex Merger Agreement was entered into or at any other time. Our stockholders should obtain current quotations for Baytex common shares and for shares of our Class A Common Stock.
The Baytex Merger may not be completed and the Baytex Merger Agreement may be terminated in accordance with its terms.
The Baytex Merger is subject to a number of conditions that must be satisfied or waived prior to the completion of the Baytex Merger, including (i) the receipt of the required approvals from the Company’s stockholders and Baytex’s shareholders, (ii) the expiration or termination of the waiting period under the Hart-Scott-Rodino Act, (iii) the absence of any governmental order or law that prohibits or makes illegal the consummation of the Baytex Merger, (iv) Baytex common shares issuable in connection with the Baytex Merger having been authorized for listing on the New York Stock Exchange, subject to official notice of issuance and (v) Baytex’s registration statement on Form F-4 having been declared effective by the SEC under the Securities Act. The obligation of each party to consummate the Baytex Merger is also conditioned upon the other party’s representations and warranties being true and correct (subject to certain materiality exceptions) and the other party having performed in all material respects its obligations under the Baytex Merger Agreement.
Moreover, if the Baytex Merger is not completed by October 15, 2023, either Baytex or the Company may choose not to proceed with the Baytex Merger, and the parties can mutually decide to terminate the Baytex Merger Agreement at any time, before or after stockholder approval. In addition, Baytex and the Company may elect to terminate the Baytex Merger Agreement in certain other circumstances as further detailed in the Baytex Merger Agreement.

17


Current stockholders of the Company will have a reduced ownership and voting interest in Baytex after the Baytex Merger compared to their current ownership in the Company on a standalone basis and will exercise less influence over management.
Currently, our stockholders have the right to vote in the election of the Company’s board of directors and on other matters requiring stockholder approval under Virginia law and the Company’s articles of incorporation and bylaws. As a result of the Baytex Merger, our current stockholders will own a smaller percentage of Baytex than they currently own of the Company, and as a result will have less influence on the management and policies of Baytex after the Baytex Merger than they now have on the management and policies of the Company.
The Baytex Merger Agreement contains provisions that limit our ability to pursue alternatives to the Baytex Merger, could discourage a potential competing acquiror of us from making a favorable alternative transaction proposal and, in specified circumstances, could require us to pay Baytex a termination fee of $60 million.
The Baytex Merger Agreement contains a general prohibition on us and Baytex from soliciting or, subject to certain exceptions relating to the exercise of fiduciary duties by our boards of directors, entering into discussions with any third party regarding any competing proposal or offer for a competing transaction. Further, even if our Board withholds, withdraws, qualifies or modifies its recommendation with respect to the Baytex Merger Agreement proposal, unless the Baytex Merger Agreement has been terminated in accordance with its terms, we will still be required to submit the Baytex Merger Agreement proposal to a vote at our special meeting. In addition, each party generally has an opportunity to offer to modify the terms of Merger in response to any third-party alternative transaction proposal before a party’s board of directors may withhold, withdraw, qualify or modify its recommendation with respect to the Baytex Merger Agreement proposal or the share issuance proposal, as applicable. In some circumstances, upon termination of the Baytex Merger Agreement, we will be required to pay a termination fee of $60 million to Baytex.
These provisions could discourage a potential third-party acquiror or merger partner that might have an interest in acquiring all or a significant portion of us or pursuing an alternative transaction with us either from considering or proposing such a transaction, even if a third-party acquiror were prepared to pay consideration with a higher per share price than the per share price proposed to be received in the merger or might result in a potential third-party acquiror or merger partner proposing to pay a lower price to our stockholders than it might otherwise have proposed to pay because of the added expense of the $60 million termination fee that may become payable in certain circumstances.
Failure to complete the Baytex Merger could negatively impact the price of shares of our Class A Common Stock, as well as our future businesses and financial results.
The Baytex Merger Agreement contains a number of conditions that must be satisfied or waived prior to the completion of the Baytex Merger. There can be no assurance that all of the conditions to the completion of the Baytex Merger will be so satisfied or waived. If these conditions are not satisfied or waived, we will be unable to complete the Baytex Merger.
If the Baytex Merger is not completed for any reason, including the failure to receive the required approval of our stockholders and Baytex’s shareholders, our businesses and financial results may be adversely affected, including as follows:
we may experience negative reactions from the financial markets, including negative impacts on the market price of our Class A Common Stock;
the manner in which customers, vendors, business partners and other third parties perceive the Company may be negatively impacted, which in turn could affect our marketing operations or our ability to compete for new business or obtain renewals in the marketplace more broadly;
we will still be required to pay certain significant costs relating to the Baytex Merger, such as legal, accounting, financial advisor and printing fees;
we may experience negative reactions from employees; and
we will have expended time and resources that could otherwise have been spent on our existing businesses and the pursuit of other opportunities that could have been beneficial to the Company, and our ongoing business and financial results may be adversely affected.
In addition to the above risks, if the Baytex Merger Agreement is terminated and our board seeks an alternative transaction, our stockholders cannot be certain that we will be able to find a party willing to engage in a transaction on more attractive terms than the Baytex Merger. If the Baytex Merger Agreement is terminated under specified circumstances, we may be required to pay Baytex a termination fee or reimburse Baytex for certain of its expenses.

18


We will be subject to business uncertainties while the Baytex Merger is pending, which could adversely us.
Uncertainty about the effect of the Baytex Merger on employees and customers may have an adverse effect on the Company. These uncertainties may impair our ability to attract, retain and motivate key personnel until the Baytex Merger is completed and for a period of time thereafter and could cause customers and others that deal with us to seek to change their existing business relationships with us. Employee retention at the Company may be particularly challenging during the pendency of the Baytex Merger, as employees may experience uncertainty about their roles with Baytex following the Baytex Merger. In addition, the Baytex Merger Agreement restricts us from entering into certain corporate transactions and taking other specified actions without the consent of Baytex, and generally requires us to continue our operations in the ordinary course, until completion of the Baytex Merger. These restrictions may prevent us from pursuing attractive business opportunities that may arise prior to the completion of the Baytex Merger.
The Baytex common shares to be received by our stockholders upon completion of the Baytex Merger will have different rights from shares of our Class A Common Stock.
Upon completion of the Baytex Merger, our stockholders will no longer be stockholders of the Company. Instead, former stockholders of the Company will become Baytex shareholders, accordingly their rights will be subject to and governed by the terms of the Baytex articles of incorporation and the Baytex bylaws. The laws of the province of Alberta and terms of the Baytex articles of incorporation and the Baytex bylaws are in some respects different than the laws of the state of Virginia and the terms of our articles of incorporation and our bylaws, which currently govern the rights of our stockholders.
Completion of the Baytex Merger may trigger change in control or other provisions in certain agreements to which we are a party.
The completion of the Baytex Merger may trigger change in control or other provisions in certain agreements to which we are a party. If we are unable to negotiate waivers of those provisions, the counterparties may exercise their rights and remedies under the agreements, potentially terminating the agreements, or seeking monetary damages. Even if we are able to negotiate waivers, the counterparties may require a fee for such waivers or seek to renegotiate the agreements on terms less favorable to us.
We will incur significant transaction and merger-related costs in connection with the Baytex Merger, which may be in excess of those anticipated by us.
We have incurred and expect to continue to incur a number of non-recurring costs associated with negotiating and completing the Baytex Merger, combining the operations of the two companies and achieving desired synergies. These fees and costs have been, and will continue to be, substantial. The substantial majority of non-recurring expenses will consist of transaction costs related to the Baytex Merger and include, among others, employee retention costs, fees paid to financial, legal and accounting advisors, severance and benefit costs and filing fees. Certain of these costs will be borne by us even if the Baytex Merger is not completed.
We may be a target of securities class action and derivative lawsuits which could result in substantial costs and may delay or prevent the Baytex Merger from being completed.
Securities class action lawsuits and derivative lawsuits are often brought against public companies that have entered into merger agreements. Even if the lawsuits are without merit, defending against these claims can result in substantial costs and divert management time and resources. An adverse judgment could result in monetary damages, which could have a negative impact on our liquidity and financial condition. Additionally, if a plaintiff is successful in obtaining an injunction prohibiting completion of the Baytex Merger, then that injunction may delay or prevent the Baytex Merger from being completed, which may adversely affect our business, financial position and results of operation. Currently, we are unaware of any securities class action lawsuits or derivative lawsuits having been filed in connection with the Baytex Merger.

19


Risks Associated with our General Business
Prices for crude oil, NGLs and natural gas are dependent on many factors that are beyond our control and strongly affect our financial condition, results of operations and cash flows.
Prices for crude oil, NGLs and natural gas are dependent on many factors that are beyond our control, including:
domestic and foreign supplies of crude oil, NGLs and natural gas;
domestic and foreign consumer demand for crude oil, NGLs and natural gas;
political and economic conditions in oil or gas producing regions;
the extent to whichfurther actions by the members of the Organization of Petroleum Exporting Countries and other allied oil exporting nations agree upon and maintain(“OPEC+”) with respect to production constraintslevels and oil price controls;
overall domestic and foreign economic conditions, including adverse conditions driven by political, healthinflationary pressures, changes in interest rates or weather events;any general economic slowdowns or recessions;
prices and availability of, and demand for, alternative fuels;
the effect of energy conservation efforts, alternative fuel requirements and climate change-related initiatives;
shareholder activism or activities by non-governmental organizations to restrict the exploration, development and production of oil, natural gas and NGLs so as to minimize emissions of carbon dioxide and methane GHGs;
volatility and trading patterns in the commodity-futures markets;
technological advances or social attitudes and policies affecting energy consumption and energy supply;
or social attitudes and policies affecting energy consumption and energy supply;
political and economic events that directly or indirectly impact the relative strength or weakness of the United StatesU.S. dollar, on which crude oil prices are benchmarked globally, against foreign currencies;
changes in trade relations and policies, including the imposition of tariffs by the United StatesU.S. or China;China or sanctions or other trade consequences related to the Russia-Ukraine war;
risks related to the concentration of our operations in the Eagle Ford Shale field in South Texas;
speculation by investors in oil and gas;
the availability, cost, proximity and capacity of gathering, processing, refining and transportation facilities;
the cost and availability of products and personnel needed for us to produce oil and gas;
weather conditions;
the impact and uncertainty of world health events;events, including the COVID-19 pandemic; and
domestic and foreign governmental relations, regulation and taxation, including limits on the United States’U.S.’ ability to export crude oil.
For example, commodity prices continued to be volatile during 2022, as COVID-19 pandemic-related restrictions continued to loosen and global economic activity grew, OPEC+ production levels shifted and the Russia-Ukraine war and related sanctions started in the first quarter.
The NYMEX oil prices in 2022 ranged from a high of $123.70 to a low of $71.02 per bbl, while the spot market prices for natural gas in 2022 ranged from a high of $9.85 to a low of $3.45 per MMBtu. Oil prices continue to be influenced by the factors discussed above.
The long-term effects of these and other conditions on the prices of oil and natural gas are uncertain, and there can be no assurance that the demand or pricing for our products will follow historic patterns or recover meaningfully in the near term. For example, oil and natural gas prices continued to be volatile in 2019, andthat the recent oil and gas industry downturn has (and current market conditions have) resulted in reduced demand for our products, which have had, and may in the future have, a material adverse impact on its financial condition, results of operations and cash flows. For example, the NYMEX oil prices in 2019 ranged from a high of $66.30 to a low of $46.54 per Bbl and the NYMEX natural gas prices in 2019 ranged from a high of $4.12 to a low of $1.82 per MMBtu. Further, the NYMEX oil prices and NYMEX natural gas prices ranged from highs to lows of $63.27 to $49.59 per Bbl and $2.17 to $1.85 per MMBtu, respectively, during the period from January 1, 2020 to February 14, 2020. It is impossible to predict future commodity price movements with certainty; however, many of our projections and estimates are based on assumptions as to the future prices of crude oil, NGLs and natural gas. These price assumptions are used for planning purposes. We expect our assumptionspricing trend will change over time and that actual prices in the future will likely differ from our estimates.continue. Any substantial or extended decline, or sustained market uncertainty, in the actual prices of crude oil, NGLs or natural gas would have a material adverse effect on our business, financial position, results of operations, cash flows and borrowing capacity, stock price, the quantities of oil and gas reserves that we can economically produce, the quantity of estimated proved reserves that may be attributed to our properties and our ability to fund our capital program.

It is impossible to predict future commodity price movements with certainty; however, many of our projections and estimates are based on assumptions as to the future prices of crude oil, NGLs and natural gas. These price assumptions are used for planning purposes. We expect our assumptions will change over time and that actual prices in the future will likely differ from our estimates.
20


ExplorationDrilling and development drillingoperations activities are high-risk activities with many uncertainties and may not result in commercially productive reserves.
Our future financial condition and results of operations depend on the success of our exploration and production activities. Oil and gas exploration and production activities are subject to numerous risks beyond our control, including the risk that drilling will not result in commercially viable oil and gas production. The costs of drilling, completing and operating wells are often substantial and uncertain, and have increased substantially in 2022 due to inflationary pressures. Furthermore, drilling and completion operations may be curtailed, delayed or canceled as a result of a variety of factors, many of which are beyond our control, including:
unexpected drilling conditions;
the use of multi-well pad drilling that requires the drilling of all of the wells on a pad until any one of the pad’s wells can be brought into production;
risks associated with drilling horizontal wells and extended lateral lengths, such as deviating from the desired drilling zone or not running casing or tools consistently through the wellbore, particularly as lateral lengths get longer;
risks associated with downspacing and multi-well pad drilling;
fracture stimulation accidents or failures;
reductions in oil, natural gas and NGL prices;
elevated pressure or irregularities in geologic formations;
loss of title or other title related issues;
equipment failures or accidents;
costs, shortages or delays in the availability of drilling rigs, frac fleets, crews, equipment and materials;
shortages in experienced labor;
crude oil, NGLs or natural gas gathering, transportation, processing, storage and export facility availability,
restrictions or limitations;
surface access restrictions;
delays imposed by or resulting from compliance with regulatory requirements, including any hydraulic fracturing regulations and other applicable regulations, and the failure to secure or delays in securing necessary regulatory, contractual and third-party approvals and permits;
political events, public protests, civil disturbances, terrorist acts or cyber attacks;
environmental hazards, such as natural gas leaks, oil and produced water spills, pipeline and tank ruptures, encountering naturally occurring radioactive materials, and unauthorized discharges of brine, well stimulation and completion fluids, toxic gases or other pollutants into the surface and subsurface environment;
limited availability of financing at acceptable terms;
limitations in the market for crude oil, natural gas and NGLs;
fires, explosions, blow-outs and surface cratering;
adverse weather conditions; and
actions by third-party operators of our properties.
The wells we drill may not be productive and we may not recover all or any portion of our investment in such wells. Our decisions to purchase, explore, develop or otherwise exploit prospects or properties depend in part on the evaluation of data obtained through geophysical and geological analyses, production data and engineering studies, the results of which are often inconclusive or subject to varying interpretations. The seismic data and other technologies we use do not allow us to know conclusively prior to drilling a well that oil or gas is present or may be produced economically. The type curves we use in our development plans from time to time are only estimates of performance of the acreage we might develop and actual production can differ materially. Furthermore, the cost of drilling, completing, equipping and operating a well is often uncertain, and cost factors can adversely affect the economics of a project. Overruns in budgeted expenditures are common risks that can make a particular project uneconomical or less economical than forecasted. In addition, limitations on the use of hydraulic fracturing could have an adverse effect on our ability to develop and produce oil and gas from new wells, which would reduce our rate of return on these wells and our cash flows. Drilling activities can result in dry holes or wells that are productive but do not produce sufficient net revenues after operating and other costs to cover initial drilling costs.
21


Our future drilling activities may not be successful, and we cannot be sure that our overall drilling success rate or our drilling success rate within a particular area will not decline. Unsuccessful drilling activities could have a material adverse effect on our business, financial condition, results of operations and cash flows. Also, we may not be able to obtain any options or lease rights in potential drilling locations that we identify. Although we have identified numerous potential drilling locations, we may not be able to economically produce oil or gas from all of them.

Our business involves many operating risks, including hydraulic fracturing, that may result in substantial losses for which insurance may be unavailable or inadequate.
Our operations are subject to all of the risks and hazards typically associated with the exploitation, development and exploration for and the production and transportation of oil and gas, including well stimulation and completion activities such as hydraulic fracturing. These operating risks include:
fires, explosions, blowouts, cratering and casing collapses;
formations with abnormal pressures or structures;
pipeline ruptures or spills;
mechanical difficulties, such as stuck oilfield drilling and service tools;
uncontrollable flows of oil, natural gas or well fluids;
migration of fracturing fluids into surrounding groundwater;
spills or releases of fracturing fluids including from trucks sometimes used to deliver these materials;
spills or releases of brine or other produced water that may go off-site;
subsurface conditions that prevent us from (i) stimulating the planned number of stages, (ii) accessing the entirety of the wellbore with our tools during completion or (iii) removing all fracturing-related materials from the wellbore to allow production to begin;
environmental hazards such as natural gas leaks, oil or produced water spills and discharges of toxic gases; and
natural disasters and other adverse weather conditions (including events that may be caused or exacerbated by climate change), such as named winter storms in 2021 and 2022 that caused us to temporarily shut-in production;
terrorism, vandalism and physical, electronic and cybersecurity breaches.
Any of these risks could result in substantial losses resulting from injury or loss of life, damage to or destruction of property, natural resources and equipment, pollution and other environmental damages, clean up responsibilities, regulatory investigations and penalties, loss of well location, acreage, expected production and related reserves and suspension of operations. Moreover, a potential result of climate change is more frequent or more severe weather events or natural disasters. To the extent such weather events or natural disasters become more frequent or more severe, disruptions to our business and costs to repair damaged facilities could increase. In addition, under certain circumstances, we may be liable for environmental damage caused by previous owners or operators of properties that we own, lease or operate. As a result, we may incur substantial liabilities to third parties or governmental entities, which could reduce or eliminate funds available for exploration, development or acquisitions or cause us to incur losses.
If we experience any problems with well stimulation and completion activities, such as hydraulic fracturing, our ability to explore for and produce oil or natural gas may be adversely affected. We could incur substantial losses or otherwise fail to realize reserves in particular formations as a result of:
delays imposed by or resulting from compliance with environmental and other governmental or regulatory requirements, which may include limitations on hydraulic fracturing or the discharge of GHGs;
the need to shut down, abandon and relocate drilling operations;
the need to sample, test and monitor drinking water in particular areas and to provide filtration or other drinking water supplies to users of water supplies that may have been impacted or threatened by potential contamination from fracturing fluids;
the need to modify drill sites to ensure there are no spills or releases off-site and to investigate and/or remediate any spills or releases that might have occurred; or
suspension of our operations.

22


In accordance with industry practice, we maintain insurance at a level that balances the cost of insurance with our assessment of the risk and our ability to achieve a reasonable rate of return on our investments. We cannot assure you that our insurance will be adequate to cover losses or liabilities or that we will purchase insurance against all possible losses or liabilities. Also, we cannot predict the continued availability of insurance at premium levels that justify its purchase. The occurrence of a significant event, not fully insured or indemnified against, could have a material adverse effect on our business, financial condition, results of operations and cash flows.
Multi-well pad drilling and project development may result in volatility in our operating results.
We utilize multi-well pad drilling and project development where practical. Project development may involve more than one multi-well pad being drilled and completed at one time in a relatively confined area. Wells drilled on a pad or in a project may not be brought into production until all wells on the pad or project are drilled and completed. Problems affecting one pad or a single well could adversely affect production from all of the wells on the pad or in the entire project. As a result, multi-well pad drilling and project development can cause delays in the scheduled commencement of production, or interruptions in ongoing production. These delays or interruptions may cause declines or volatility in our operating results due to timing as well as declines in oil and natural gas prices. Further, any delay, reduction or curtailment of our development and producing operations, due to operational delays caused by multi-well pad drilling or project development, or otherwise, could result in the loss of acreage through lease expirations.
Additionally, infrastructure expansion, including more complex facilities and takeaway capacity, could become challenging in project development areas. Managing capital expenditures for infrastructure expansion could cause economic constraints when considering design capacity.
We could experience adverse impacts associated with a high concentration of activity and tighter drilling spacing.
We are subject to drilling, completion and operating risks, including our ability to efficiently execute large-scale project development, as we could experience delays, curtailments and other adverse impacts associated with a high concentration of activity and tighter drilling spacing. A higher concentration of activity and tighter drilling spacing may increase the riskfrequency of operational shut-ins and unintentional communication with other adjacent wells and reduce the potential to reduce total recoverable reserves from the reservoir. If these risks materialize, andthey could negatively impact our results of operations relative to guidance or market expectations, the research analysts who cover us may downgrade our common stock or change their recommendations or earnings or performance estimates, which may result in a decline in the market price of our common stock.Class A Common Stock.
We may not adhere to our proposed drilling schedule.
Our final determination of whether to drill any wells will be dependent on a number of factors, including:
the results of our exploration efforts and the acquisition, review and analysis of the seismic data;
the availability of sufficient capital resources to us and the other participants for the drilling of the prospects;
the approval of the prospects by the other participants after additional data has been compiled;
economic and industry conditions at the time of drilling, including prevailing and anticipated prices for oil and gas and the availability and prices of drilling rigs and crews, frac crews, and related equipment and material; and
the availability of leases and permits on reasonable terms for the prospects.
Although we have identified numerous drilling prospects, we may not be able to lease or drill those prospects within our expected time frame or at all. There can be no assurance that these projects can be successfully developed or that any identified drill sites will, if drilled, encounter reservoirs of commercially productive oil or gas or that we will be able to complete such wells on a timely basis, or at all. We may seek to sell or reduce all or a portion of our interest in a project area or with respect to prospects wells within such project area.
Our business depends on gathering, processing, refining and transportation facilities owned by others.
We deliver substantially all of our oil and gas production through pipelines and trucks that we do not own. The marketability of our production depends upon the availability, proximity and capacity of these pipelines and trucks, as well as gathering systems, gas processing facilities and downstream refineries. The unavailability of or lack of available capacity on these systems and facilities could result in the shut-in of producing wells, the reduction in wellhead pricing or the delay or discontinuance of development plans for properties. Federal, state and local regulation of oil and gas production and transportation, tax and energy policies, changes in supply and demand, pipeline pressures, damage to or destruction of pipelines and general economic conditions could adversely affect our ability to produce, gather, process, refine and market our oil and gas.

23


We have entered into firm transportation contracts that require us to pay fixed sums of money regardless of quantities actually shipped. If we are unable to deliver the minimum quantities of production, such requirements could adversely affect our results of operations, financial position, and liquidity.
We have entered into firm transportation contracts that require us to pay fixed sums of money regardless of quantities actually shipped. If we are unable to deliver the minimum quantities of production, such requirements could adversely affect our results of operations, financial position, and liquidity. We have entered into firm transportation agreements for a portion of our production in certain areas in order to improve our ability, and that of our purchasers, to successfully market our production. We may also enter into firm transportation arrangements for additional production in the future. These firm transportation agreements may be more costly than interruptible or short-term transportation agreements. Additionally, these agreements obligate us to pay fees on minimum volumes regardless of actual throughput. If we have insufficient production to meet the minimum volumes, the requirements to pay for quantities not delivered could have an impact on our results of operations, financial position, and liquidity.
The unavailability, high cost or shortage of drilling rigs, frac crews, equipment, raw materials, supplies, oilfield services or personnel may restrict our operations.
Where we are the operator of a property, we rely on third-party service providers to perform necessary drilling and completion operations. The ability and availability of third-party service providers to perform such drilling and completion operations will depend on those service providers’ ability to compete for and retain qualified personnel, financial condition, economic performance, and access to capital, which in turn will depend upon the supply and demand for oil, NGLs and natural gas, prevailing economic conditions and financial, business and other factors. The failure of a third-party service provider to adequately perform operations on a timely basis could delay drilling or completion operations, reduce production from the property or cause other damage to operations, each of which could adversely affect our business, financial condition, results of operations and cash flows.


Moreover, the oil and gas industry is cyclical, which can result in shortages of drilling rigs, frac crews, equipment, raw materials (particularly sand and other proppants), supplies and personnel, including geologists, geophysicists, engineers and other professionals. When shortages occur, the costs and delivery times of drilling rigs, equipment and supplies increase and demand for, and wage rates of, qualified drilling rig and frac crews also rise with increases in demand. The prevailing prices of crude oil, NGLs and natural gas also affect the cost of and the demand for drilling rigs, frac crews, materials (including sand) and other equipment and related services. TheAs a result of inflationary pressures and other factors, our costs for these items substantially increased in 2022. Furthermore, the availability of drilling rigs, frac crews, materials (including sand) and equipment can vary significantly from region to region at any particular time. Although land drilling rigs and frac crews can be moved from one region to another in response to changes in levels of demand, an undersupply in any region may result in drilling and/or completion delays and higher well costs in that region.
We cannot predict whether these conditions will exist in the future and, if so, what their timing and duration will be. In accordance with customary industry practice, we rely on independent third-party service providers to provide most of the services necessary to drill new wells. If we are unable to secure a sufficient number of drilling rigs and frac crews at reasonable costs, our financial condition and results of operations could suffer, and we may not be able to drill all of our acreage before our leases expire. Shortages of drilling rigs, frac crews, equipment, raw materials (particularly sand and other proppants), supplies, personnel, trucking services, tubulars, fracking and completion services and production equipment could delay or restrict our exploration and development operations, which in turn could impair our financial condition and results of operations. As a result of the COVID-19 pandemic and associated industry downturn, many experienced service providers have left the industry and remaining personnel are more limited and in some cases, less experienced, which could impact success of our operations and have a safety impact.
The COVID-19 pandemic and the Russia-Ukraine war have also significantly disrupted global supply chains including with respect to certain materials necessary to our operations, particularly tubulars and steel. If we are unable to timely source such materials in the future or if the prices of such materials increase, we may have to curtail or delay our operations and our results of operations and cash flows may be adversely impacted. Further, limited availability of materials may limit our ability to optimize our drilling and completions designs which could negatively impact our operations.

24


Our future performance depends on our ability to find or acquire additional oil and gas reserves that are economically recoverable.
Producing oil and gas reservoirs generally are characterized by declining production rates that vary depending upon reservoir characteristics and other factors. Unless we successfully replace the reserves that we produce, our reserves will decline, eventually resulting in a decrease in oil and gas production and lower revenues and cash flows from operating activities. We must make substantial capital expenditures to find, acquire, develop and produce new oil and gas reserves. We may not be able to make the necessary capital investments to maintain or expand our oil and gas reserves with our cash flows from operating activities. Furthermore, external sources of capital may be limited.
The ability to attract and retain key members of management, qualified Board members and other key personnel is critical to the success of our business and may be challenging.
Our success will dependdepends to a large extent upon the efforts and abilities of our management team and having experienced individuals serving on our Board who are also knowledgeable about our operations and our industry. We experienced turnover on our executive team and Board in both 2018 and 2019. If we experience similar turnover in the future, we may be unable to timely replace the talents and skills of our management team or directors if one or more did not continue serving. The success of our business also depends on other key personnel. The ability to attract and retain these key personnel may be difficult in light of the volatility of our business. We may need to enter into retention or other arrangements that could be costly to maintain. We do not maintain key-man life insurance with respect to any of our employees. Acquiring and keeping personnel could prove more difficult or cost substantially more than estimated. These factors could cause us to incur greater costs or prevent us from pursuing our development and exploitation strategy as quickly as we would otherwise wish to do. If executives, managersdirectors or other key personnel resign, retire or are terminated, or their service is otherwise interrupted, we may not be able to replace them adequately or in a timely manner and we could experience significant declines in productivity.
The COVID-19 pandemic has adversely affected our business, and the ultimate effect on our business, financial position, results of operations and/or cash flows will depend on future developments, which are uncertain and cannot be predicted.
The COVID-19 pandemic has negatively impacted the global economy, disrupted global supply chains, and created significant volatility and disruption of financial and commodity markets, and may continue to do so in the future. During the initial phase of the pandemic, there were significant reductions in demand for and prices of oil, NGLs and natural gas, which at times adversely impacted, and may in the future adversely impact, our business, financial position, results of operations and cash flows. The COVID-19 pandemic has also had, and may in the future have, an adverse impact on the availability of personnel, equipment and services critical to our ability to operate our properties. The degree to which the COVID-19 pandemic continues to adversely impact our results will depend on future developments, which cannot be predicted with precision.
Certain of our undeveloped leasehold assets are subject to leases that will expire over the next several years unless production is established on the acreage.
Leases on oil and gas properties typically have a term after which they expire unless, prior to expiration, a well is drilled and production of hydrocarbons in paying quantities is established. If our leases expire and we are unable to renew the leases, we will lose our right to develop the related properties. While we seek to actively manage our leasehold inventory through drilling wells to hold the leasehold acreage that we believe is material to our operations, our drilling plans for these areas are subject to change and subject to the availability of capital.
Certain of our wells may be adversely affected by actions we or other operators may take when drilling, completing, or operating wells that they own.
The drilling and production of potential locations by us or other operators could cause a depletion of our proved reserves and may inhibit our ability to further develop our proved reserves. In addition, completion operations and other activities conducted on adjacent or nearby wells by us or other operators could cause production from our wells to be shut in for indefinite periods of time, could result in increased lease operating expenses and could adversely affect the production and reserves from our wells after they re-commence production. We have no control over the operations or activities of offsetting operators.


We are exposed to the credit risk of our customers, and nonpayment or nonperformance by these parties would reduce our cash flows.
We are subject to risk from loss resulting from our customers’ nonperformance or nonpayment. We depend on a limited number of customers for a significant portion of our revenues. The concentration of credit risk may be affected by changes in economic or other conditions within our industry and may accordingly affect our overall credit risk. Recently, manyIn 2022, approximately 43% of our customers’ equity values have substantially declined. The combination of reduction of cash flow resulting from declines in commodity prices and the lack of availability of debt or equity financing may result in a significant reduction in our customers’ liquidity and ability to make payments or perform on their obligations to us. In 2019, approximately 76 percent of our total consolidated product revenues resulted from fourtwo of our customers. Any nonpayment or nonperformance by our customers would reduce our cash flows.

25


We participate in oil and gas leases with third parties, and these third parties may not be able to fulfill their commitments to our projects.
We frequently own less than 100 percent100% of the working interest in the oil and gas leases on which we conduct operations, and other parties own the remaining portion of the working interest under joint venture arrangements. Financial risks are inherent in any operation where the cost of drilling, equipping, completing and operating wells is shared by more than one party. We could be held liable for joint venture obligations of other working interest owners, such as nonpayment of costs and liabilities arising from the actions of the other working interest owners. In addition, the volatility in commodity prices increases the likelihood that some of these working interest owners may not be able to fulfill their joint venture obligations. Some of our project partners have experienced liquidity and cash flow problems.problems in the past. These problems have led and may lead our partners to continue to attempt to delay the pace of project development in order to preserve cash. A partner may be unable or unwilling to pay its share of project costs. In some cases, a partner may declare bankruptcy. In the event any of our project partners do not pay their share of such costs, we would likely have to pay those costs, and we may be unsuccessful in any efforts to recover these costs from our partners, which could materially adversely affect our financial condition, results of operations and cash flows.
Estimates of oil and gas reserves and future net cash flows are not precise, and undeveloped reserves may not ultimately be converted into proved producing reserves.
This Annual Report on Form 10-K contains estimates of our proved oil and gas reserves and the estimated future net cash flows from such reserves. These estimates are based upon various factors and assumptions, including assumptions relating to crude oil, NGL and natural gas prices, drilling and operating expenses, capital expenditures, development costs and workover and remedial costs, the quantity, quality and interpretation of relevant data, taxes and availability of funds. The process of estimating oil and gas reserves is complex. This process requires significant decisions and assumptions in the evaluation of available geological, geophysical, engineering and economic data for each reservoir. These estimates are dependent on many variables and inherently uncertain, therefore, changes often occur as these variables evolve and commodity prices fluctuate. Furthermore, different reserve engineers may make different estimates of reserves and cash flows based on the same data,, and and improvements or other changes in geological, geophysical and engineering evaluation methods may cause reserve estimates to change over time. Any material inaccuracies in these reserve estimates, cash flow estimates or underlying assumptions could materially affect the estimated quantities and present value of our reserves.
Actual future production, crude oil, NGL and natural gas prices, revenues, taxes, development expenditures, operating expenses and quantities of recoverable oil and gas reserves will most likely vary from those estimated. Any significant variance could materially affect the estimated quantities and present value of reserves disclosed by us. In addition, we may adjust estimates of proved reserves to reflect production history, results of exploration and development, prevailing crude oil, NGL and natural gas prices and other factors, many of which are beyond our control.
At December 31, 2019,2022 and December 31, 2021, approximately 58 percent58% and 62%, respectively, of our estimated proved reserves were proved undeveloped, compared to 62 percent at December 31, 2018.undeveloped. Estimation of proved undeveloped reserves and proved developed non-producing reserves is based on volumetric calculations and adjacent reserve performance data. Recovery of proved undeveloped reserves requires significant capital expenditures and successful drilling operations. Our reserve data assumes that we can and will make these significant expenditures to develop our reserves and conduct these drilling operations successfully. These assumptions, however, may not prove correct, and our estimated costs may not be accurate, development may not occur as scheduled and actual results may not occur as estimated.


The reserve estimation standards under SEC rules provide that, subject to limited exceptions, proved undeveloped reserves may only be booked if they relate to wells scheduled to be drilled within five years of the date of booking. These standards may limit our potential to book additional proved undeveloped reserves as we pursue our drilling program. Moreover, we may be required to write down our proved undeveloped reserves if we do not develop those reserves within the required five-year time frame or cannot demonstrate that we could do so. Accordingly, our reserve report at December 31, 2019,2022, includes estimates of total future development costs over the next five years associated with our proved undeveloped reserves of approximately $1,136 million.$2.8 billion. If we choose not to spend the capital to develop these reserves, or if we are not otherwise able to successfully develop these reserves, we will be required to write-off these reserves. During the year ended December 31, 2019,2022, we wrote-off 32.1 MMBOE34.3 MMboe of proved undeveloped reserves because they are no longer expected to be developed within five years of their initial recording. Any such write-offs of our reserves could reduce our ability to borrow money and could reduce the value of our securities.

26


You should not assume that the present value of estimated future net cash flows (standardized measure) referred to herein is the current fair value of our estimated oil and gas reserves. In accordance with SEC requirements, we base the estimated discounted future net cash flows from our proved reserves on prices and costs on the date of the estimate. Actual current and future prices and costs may be materially higher or lower than the prices and costs as of the date of the estimate. As a result, net present value estimates using actual prices and costs may be significantly less than the SEC estimate that is provided herein. Actual future net cash flows may also be affected by the amount and timing of actual production, availability of financing for capital expenditures necessary to develop our undeveloped reserves, supply and demand for oil and gas, increases or decreases in consumption of oil and gas and changes in governmental regulations or taxation. In addition, the 10% discount factor, which is required by the SEC to be used in calculating discounted future net cash flows for reporting purposes, is not necessarily the most accurate discount factor based on interest rates in effect from time to time and risks associated with us or the naturaloil and gas and oil industry in general. With all other factors held constant, if commodity prices used in the reserve report were to decrease by 10%, our standardized measure and PV-10 would have decreased to approximately $1,213.9 million$4.1 billion and $1,304.6 million,$4.7 billion, respectively. Any adjustments to the estimates of proved reserves or decreases in the price of our commodities may decrease the value of our securities.
We may record impairments on our oil and gas properties.
Quantities of proved reserves are estimated based on economic conditions in existence in the period of assessment. Lower crude oil, NGL and natural gas prices may have the impact of shortening the economic lives of certain fields because it becomes uneconomic to produce all reserves within such fields, thus reducing proved property reserve estimates. If such revisions in the estimated quantities of proved reserves occur, it will have the effect of increasing the rates of depreciation, depletion and amortization, or DD&A, on the affected properties, which would decrease earnings or result in losses through higher DD&A expense. The revisions may also be significant enough to result in a write-down that would further decrease reported earnings.
The full cost method of accounting for oil and gas properties under GAAP requires that at the end of each quarterly reporting period, the unamortized cost of our oil and gas properties, net of deferred income taxes, is limited to the sum of the estimated after tax discounted future net revenues from proved properties adjusted for costs excluded from amortization and related income taxes, or a Ceiling Test.(the “Ceiling Test”). The estimated after tax discounted future net revenues are determined using the prior 12-month’s average price based on closing prices on the first day of each month, adjusted for differentials, discounted at 10%. The calculation of the Ceiling Test and provision for DD&A are based on estimates of proved reserves. There are significant uncertainties inherent in estimating quantities of proved reserves and projecting future rates of production, timing and plan of development. In addition to revisions to reserves and the impact of lower commodity prices, Ceiling Test write-downs may occur due to increases in estimated operating and development costs and other factors. During the past several years, we have been required to write down the value of certain of our oil and gas properties and related assets. We could experience additional write-downs in the future.
If we cannot obtain sufficient capital when needed, we will not be able to continue with our business strategy.
The oil and gas industry is capital intensive. We incur and expect to continue to incur substantial capital expenditures for the acquisition, exploration and development of oil and gas reserves. We incurred approximately $370$533.8 million in acquisition, exploration and development costs, including capitalized interest and capitalized labor during the year ended December 31, 2019.2022. We intend to finance our future capital expenditures, other than significant acquisitions, through cash flow from operations and, if necessary, through borrowings under our credit agreement (as defined below). However, our cash flow from operations and access to capital are subject to a number of variables, including: (i) the volume of oil and gas we are able to produce from existing wells, (ii) our ability to transport our oil and gas to market, (iii) the prices at which our commodities are sold, (iv) the costs of producing oil and gas, (v) global credit and securities markets, (vi) the ability and willingness of lenders and investors to provide capital and the cost of the capital, (vii) our ability to acquire, locate and produce new reserves, (viii) the impact of potential changes in our credit ratings and (ix) our proved reserves. Additionally, a negative shift in investor sentiment towards the oil and gas industry could adversely affect our ability to raise equity and debt capital.


27


We may not generate expected cash flows and may have limited ability to obtain the capital necessary to sustain our operations at current or anticipated levels. A decline in cash flow from operations or our financing needs may require us to revise our capital program or alter or increase our capitalization substantially through the issuance of debt or equity securities. The issuance of additional equity securities could have a dilutive effect on the value of our common stock.Class A Common Stock. Additional borrowings under our credit agreement or the issuance of additional debt securities will require that a greater portion of our cash flow from operations be used for the payment of interest and principal on our debt, thereby reducing our ability to use cash flow to fund working capital, capital expenditures and acquisitions. In addition, our credit agreements and the Indenture impose certain limitations on our ability to incur additional indebtedness. If we desire to issue additional debt securities other than as expressly permitted under our creditsuch debt agreements, we will be required to seek the consent of the lendersconsents in accordance with the requirements of our creditsuch debt agreements, which consent may be withheld by the lenders at their discretion. In the future, we may not be able to obtain financing in sufficient amounts or on acceptable terms when needed, which could adversely affect our operating results and prospects. If we cannot raise the capital required to implement our business strategy, we may be required to curtail operations, which could adversely affect our financial condition, results of operations and cash flows.
Our property acquisitions carry significant risks.
Acquisition of oil and gas properties is a key element of maintaining and growing reserves and production. Competition for these assets has been and will continue to be intense. We may not be able to identify attractive acquisition opportunities. Even if we do identify attractive candidates, we may not be able to complete the acquisition or do so on commercially acceptable terms. In the event we do complete an acquisition, its success will depend on a number of factors, many of which are beyond our control. These factors include the purchase price, future crude oil, NGL and natural gas prices, the ability to reasonably estimate or assess the recoverable volumes of reserves, rates of future production and future net revenues attainable from reserves, future operating and capital costs, results of future exploration, exploitation and development activities on the acquired properties and future abandonment, possible future environmental or other liabilities and the effect on our liquidity or financial leverage of using available cash or debt to finance acquisitions. There are numerous uncertainties inherent in estimating quantities of proved oil and gas reserves, actual future production rates and associated costs and the assumption of potential liabilities with respect to prospective acquisition targets. Actual results may vary substantially from those assumed in the estimates. A customary review of subject properties will not necessarily reveal all existing or potential problems.
Additionally, significant acquisitions can change the nature of our operations and business depending upon the character of theif acquired properties if they have substantially different operating and geological characteristics or are in different geographic locations than our existing properties. To the extent that acquired properties are substantially different than our existing properties, our ability to efficiently realize the expected economic benefits of such transactions may be limited.
Integrating acquired businesses and properties is costly and involves a number of special risks. These risks include the possibility that management may be distracted from regular business concerns by the need to integrate operations and systems and that unforeseen difficulties can arise in integrating operations and systems and in retaining and assimilating employees. Any of these or other similar risks could lead to potential adverse short-term or long-term effects on our operating results and may cause us to not be able to realize any or all of the anticipated benefits of the acquisitions. Further, we may not realize expected synergies. If we are unable to realize expected synergies, or the cost to achieve these synergies is greater than expected, then the anticipated benefits may not be realized fully or at all or may take longer to realize than expected. In addition, it is possible that the integration of an acquired business could result in the loss of key employees, customers, providers, vendors or business partners, the disruption of our ongoing businesses, inconsistencies in standards, controls, procedures and policies, potential unknown liabilities and unforeseen expenses, delays, or regulatory conditions associated with higher than expected integration costs and an overall post-completion integration process that takes longer than originally anticipated.
Properties we acquire may not produce as projected, and we may be unable to determine reserve potential, identify liabilities associated with the properties or obtain protection from sellers against them.
Our initial technical reviews of properties we acquire are necessarily limited because an in-depth review of every individual property involved in each acquisition generally is not feasible. Even a detailed review of records and properties may not necessarily reveal existing or potential problems, nor will it permit a buyer to become sufficiently familiar with the properties to assess fully their deficiencies and potential. Inspections may not always be performed on every well and environmental problems, such as soil or ground water contamination, are not necessarily observable even when an inspection is undertaken. Even when problems are identified, we may assume certain environmental and other risks and liabilities in connection with acquired properties, or discover unknown liabilities after the acquisition, and such risks and liabilities could have a material adverse effect on its results of operations and financial condition.


28


We may incur losses as a result of title deficiencies.
We purchase working and revenue interests in the oil and gas leasehold interests upon which we will perform our exploration activities from third parties or directly from the mineral fee owners. The existence of a material title deficiency can render a lease worthless and can adversely affect our results of operations, financial condition and cash flows. Title insurance covering mineral leaseholds is not generally available and, in all instances, we forgo the expense of retaining lawyers to examine the title to the mineral interest to be placed under lease or already placed under lease until the drilling block is assembled and ready to be drilled. Even then, the cost of performing detailed title work can be expensive. We may choose to forgo detailed title examination by title lawyers on a portion of the mineral leases that we place in a drilling unit or conduct less title work than we have traditionally performed. As is customary in our industry, we generally rely upon the judgment of oil and gas lease brokers or independent landmen who perform the field work in examining records in the appropriate governmental offices and abstract facilities before attempting to acquire or place under lease a specific mineral interest and before drilling a well on a leased tract. We, in some cases, perform curative work to correct deficiencies in the marketability or adequacy of the title to us. The work might include obtaining affidavits of heirship or causing an estate to be administered. In cases involving more serious title problems, the amount paid for affected oil and gas leases can be generally lost and the target area can become undrillable. The failure of title may not be discovered until after a well is drilled, in which case we may lose the lease and the right to produce all or a portion of the minerals under the property.
As a small company, we face unique difficulties competing in the larger market.
We operate in a highly competitive environment for acquiring properties, marketing oil and gas and securing trained personnel, and we may face difficulties in competing with larger companies. The costs of doing business in the exploration and production industry, including such costs as those required to explore new oil and gas plays, to acquire new acreage, and to develop attractive oil and gas projects, are significant. We face intense competition in all areas of our business from companies with greater and more productive assets, greater access to capital, substantially larger staffs and greater financial and operating resources than we have. Those companies may be able to pay more for productive oil and gas properties and exploratory prospects and to evaluate, bid for and purchase a greater number of properties and prospects than our financial or personnel resources permit. Also, there is substantial competition for capital available for investment in the oil and gas industry. Our limited size has placed us at a disadvantage with respect to funding our capital and operating costs, and means that we are more vulnerable to commodity price volatility and overall industry cycles (such as the volatility and general economic challenges attributable to COVID-19, the Russia-Ukraine war, and other factors), are less able to absorb the burden of changes in laws and regulations, and that poor results in any single exploration, development or production play can have a disproportionately negative impact on us. We also compete for people, including experienced geologists, geophysicists, engineers and other professionals. Our limited size has placed us at a disadvantage with respect to attracting and retaining management and other professionals with the technical abilities necessary to successfully operate our business.
Our lack of diversification increases the risk of an investment in us and we are vulnerable to risks associated with operating primarily in one major contiguous area.
All of our operations are in the Eagle Ford Shale in South Texas, making us vulnerable to risks associated with operating in one geographic area. Due to the concentrated nature of our business activities, a number of our properties could experience any of the same conditions at the same time, resulting in a relatively greater impact on our results of operations than they might have on other companies that are more diversified. In particular, we may be disproportionately exposed to the impact of regional supply and demand factors, delays or interruptions of production from wells in which we have an interest that are caused by transportation capacity constraints, curtailment of production, availability of equipment, facilities, personnel or services, significant governmental regulation, natural disasters, adverse weather conditions, water shortages or other drought related conditions, plant closures for scheduled maintenance or interruption of transportation of crude oil or natural gas produced from wells in the Eagle Ford. Such delays or interruptions could have a material adverse effect on our financial condition, results of operations and cash flows.
Our oil, natural gas and NGLs are primarily sold in geographic markets in Texas which have a fixed amount of storage and processing capacity. As a result, if such markets become oversupplied with oil, natural gas and/or NGLs, it could have a material negative effect on the prices we receive for our products and therefore an adverse effect on our financial condition and results of operations. There is a risk that refining capacity in the U.S. Gulf Coast may be insufficient to refine all of the light sweet crude oil being produced in the U.S. If light sweet crude oil production remains at current levels or continues to increase, demand for our light crude oil production could result in widening price discounts to the world crude prices and potential shut-in of production due to a lack of sufficient markets despite the lift on prior restrictions on the exporting of oil and natural gas.
29


Financial and Related Risks
We have substantial indebtedness and may incur substantially more debt. Higher levels of indebtedness make us more vulnerable to economic downturns and adverse developments in our business.
We had $562.4 million of outstanding debt at December 31, 2019, including $362.4 million under the Company’s revolving credit agreement as amended, or the Credit Facility, and $200 million, excluding unamortized discount and issuance costs, under the $200 million Second Lien Credit Agreement, or the Second Lien Facility.


Our indebtedness and any increase in our level of indebtedness could have adverse effects on our financial condition, results of operations and cash flows, including (i) imposing additional cash requirements on us in order to support interest payments, which reduces the amount we have available to fund our operations and other business activities, (ii) increasing the risk that we may default on our debt obligations, (iii) increasing our vulnerability to adverse changes in general economic and industry conditions, economic downturns and adverse developments in our business, (iv) increasing our exposure to a continued rise in interest rates, which will generate greater interest expense, (v) limiting our ability to engage in strategic transactions or obtain additional financing for working capital, capital expenditures, general corporate and other purposes and (vi) limiting our flexibility in planning for or reacting to changes in our business and industry in which we operate. Our ability to meet our debt obligations and to reduce our level of indebtedness depends on our future performance, which is affected by general economic conditions and financial, business and other factors, many of which are out of our control.
Additionally, we may incur substantially more debt in the future. Our Credit Facility and the Second Lien FacilityIndenture contain restrictions that limit our ability to incur indebtedness. These restrictions, however, are subject to a number of qualifications and exceptions, and under certain circumstances, we could incur substantial additional indebtedness in compliance with these restrictions. If we were to incur additional indebtedness without retiring existing debt, the risks described above could be magnified.
The borrowing base under our credit facilityCredit Facility may be reduced in the future if commodity prices decline.
TheAs of December 31, 2022, the borrowing base under the Credit Facility was $950 million with aggregate elected commitments of $500 million as of December 31, 2019.million. Our borrowing base is generally redetermined at least twice each year and is scheduled to next be redetermined in April 2020.2023. During a borrowing baseredetermination, the lenders can unilaterally adjust the borrowing base and the borrowings permitted to be outstanding under our Credit Facility.In the event of a decline in crude oil, NGL or natural gas prices or for other reasons deemed relevant by our lenders, the borrowing base under the Credit Facility may be reduced. Additionally, the lenders typically may, at their discretion, initiate a redetermination at any time during the six-month period between scheduled redeterminations. As a result, we may be unable to obtain funding under the Credit Facility. If funding is not available when or in the amounts needed, or is available only on unfavorable terms, it might adversely affect our development plan and our ability to make new acquisitions. Furthermore, a determination to lower the borrowing base in the future to a level less than our outstanding indebtedness thereunder would require us to repay any indebtedness in excess of the redetermined borrowing base. Any such repayment or reduced access to funds could have a material adverse effect on our production, financial condition, results of operations and cash flows.
The Credit Facility and the Second Lien FacilityIndenture have restrictive covenants that could limit our financial flexibility.
The Credit Facility and Second Lien Facilitythe Indenture contain financial and other restrictive covenants that limit our ability to engage in activities that may be in our long-term best interests. Our ability to borrow under the Credit Facility is subject to compliance with certain financial covenants, including leverage, interest coverage and current ratios.
The Credit Facility and the Second Lien FacilityIndenture include other restrictions that, among other things, limit our ability to incur indebtedness; grant liens; engage in mergers, consolidations and liquidations; make asset dispositions, restricted payments and investments; enter into transactions with affiliates; and amend, modify or prepay certain indebtedness.
Our business plan and our compliance with these covenants are based on a number of assumptions, the most important of which is relatively stable oil and gas prices at economically sustainable levels. If the price that we receive for our oil and gas production deteriorates significantly from current levels it could lead to lower revenues, cash flows and earnings, which in turn could lead to a default under certain financial covenants contained in our Credit Facility. Because the calculations of the financial ratios are made as of certain dates, the financial ratios can fluctuate significantly from period to period as the amounts outstanding under our Credit Facility are dependent on the timing of cash flows related to operations, capital expenditures, sales of oil and gas properties and securities offerings. Our failure to comply with these covenants could result in an event of default that, if not cured or waived, could result in the acceleration of all of our debts. We may not have sufficient working capital to satisfy our debt obligations in the event of an acceleration of all or a significant portion of our outstanding indebtedness.


30


WeAdverse changes in our credit rating may affect our borrowing capacity and borrowing terms.
Our outstanding debt is periodically rated by nationally recognized credit rating agencies. The credit ratings are subjectbased on our operating performance, liquidity and leverage ratios, overall financial position, and other factors viewed by the credit rating agencies as relevant to complex lawsour industry and regulations that can adverselythe economic outlook. Our credit rating may affect the cost, manner or feasibilityamount of doing business.
Exploration, development, production and salecapital we can access, as well as the terms of oil and gas are subjectany financing we may obtain. Because we rely in part on debt financing to extensive federal, state and local laws and regulations, including complex environmental laws. Future laws or regulations, anyfund growth, adverse changes in the interpretation of existing laws and regulations, inability to obtain necessary regulatory approvals or a failure to comply with existing legal requirementsour credit rating may harm our business, results of operations, financial condition or cash flows. We may be required to make large expenditures to comply with environmental and other governmental regulations. Failure to comply with these laws and regulations may result in the suspension or termination of operations and subject us to administrative, civil and criminal penalties. Matters subject to regulation include discharge permits for drilling operations, drilling bonds, spacing of wells, unitization and pooling of properties, environmental protection and taxation. Our operations create the risk of environmental liabilities to the government or third parties for any unlawful discharge of oil, gas or other pollutants into the air, soil or water. In the event of environmental violations or other environmental, health or safety impacts, we may be charged with remedial costs and land owners may file claims for alternative water supplies, property damage or bodily injury. Laws and regulations protecting the environment have become more stringent in recent years, and may, in some circumstances, result in liability for environmental damage regardless of negligence or fault. New laws, regulations or enforcement policies could be more stringent and impose unforeseen liabilities or significantly increase compliance costs. No assurance can be given that continued compliance with existing or future environmental laws and regulations will not result in a curtailment of production or processing activities or result in a material increase in the costs of production, development, exploration or processing operations. In addition, pollution and similar environmental risks generally are not fully insurable. These liabilities and costs could have a material adversenegative effect on our business, financial condition, results of operations and cash flows. See Part I, Item 1, “Business - Government Regulation and Environmental Matters.”
Our business involves many operating risks, including hydraulic fracturing, that may result in substantial losses for which insurance may be unavailable or inadequate.
Our operations are subject to all of the risks and hazards typically associated with the exploitation, development and exploration for and the production and transportation of oil and gas, including well stimulation and completion activities such as hydraulic fracturing. These operating risks include:
fires, explosions, blowouts, cratering and casing collapses;
formations with abnormal pressures or structures;
pipeline ruptures or spills;
mechanical difficulties, such as stuck oilfield drilling and service tools;
uncontrollable flows of oil, natural gas or well fluids;
migration of fracturing fluids into surrounding groundwater;
spills or releases of fracturing fluids including from trucks sometimes used to deliver these materials;
spills or releases of brine or other produced water that may go off-site;
subsurface conditions that prevent us from (i) stimulating the planned number of stages, (ii) accessing the entirety of the wellbore with our tools during completion or (iii) removing all fracturing-related materials from the wellbore to allow production to begin;
environmental hazards such as natural gas leaks, oil or produced water spills and discharges of toxic gases; and
natural disasters and other adverse weather conditions, terrorism, vandalism and physical, electronic and cyber security breaches.
Any of these risks could result in substantial losses resulting from injury or loss of life, damage to or destruction of property, natural resources and equipment, pollution and other environmental damages, clean up responsibilities, regulatory investigations and penalties, loss of well location, acreage, expected production and related reserves and suspension of operations. In addition, under certain circumstances, we may be liable for environmental damage caused by previous owners or operators of properties that we own, lease or operate. As a result, we may incur substantial liabilities to third parties or governmental entities, which could reduce or eliminate funds available for exploration, development or acquisitions or cause us to incur losses.


If we experience any problems with well stimulation and completion activities, such as hydraulic fracturing, our ability to explore for and produce oil or natural gas may be adversely affected. We could incur substantial losses or otherwise fail to realize reserves in particular formations as a result of:
delays imposed by or resulting from compliance with environmental and other governmental or regulatory requirements, which may include limitations on hydraulic fracturing or the discharge of GHGs;
the need to shut down, abandon and relocate drilling operations;
the need to sample, test and monitor drinking water in particular areas and to provide filtration or other drinking water supplies to users of water supplies that may have been impacted or threatened by potential contamination from fracturing fluids;
the need to modify drill sites to ensure there are no spills or releases off-site and to investigate and/or remediate any spills or releases that might have occurred; or
suspension of our operations.
In accordance with industry practice, we maintain insurance at a level that balances the cost of insurance with our assessment of the risk and our ability to achieve a reasonable rate of return on our investments. We cannot assure you that our insurance will be adequate to cover losses or liabilities or that we will purchase insurance against all possible losses or liabilities. Also, we cannot predict the continued availability of insurance at premium levels that justify its purchase. The occurrence of a significant event, not fully insured or indemnified against, could have a material adverse effect on our business, financial condition, results of operations and cash flows.
Access to water to drill and conduct hydraulic fracturing may not be available if water sources become scarce, and we may face difficulty disposing of produced water gathered from drilling and production activities.
The availability of water is crucial to conduct hydraulic fracturing. A significant amount of water is necessary for drilling and completing each well with hydraulic fracturing. In the past, Texas has experienced severe droughts that have limited the water supplies that are necessary to conduct hydraulic fracturing. Although we have taken measures to secure our water supply, we can make no assurances that sufficient water resources will be available in the short or long term to carry out our current activities. If we are unable to obtain water to use in our operations from local sources, we may be unable to economically produce oil and gas, which could have an adverse effect on our financial condition, results of operations and cash flows.
In addition, we must dispose of the fluids produced from oil and natural gas production operations, including produced water. The legal requirements related to the disposal of produced water into a non-producing geologic formation by means of underground injection wells are subject to change based on concerns of the public or governmental authorities regarding such disposal activities. One such concern arises from recent seismic events near underground disposal wells that are used for the disposal by injection of produced water resulting from oil and natural gas activities. In March 2016, the United States Geological Survey identified Texas and Colorado as being among the states with areas of increased rates of induced seismicity that could be attributed to fluid injection or oil and natural gas extraction. In response to concerns regarding induced seismicity, regulators in some states have imposed, or are considering imposing, additional requirements in the permitting of produced water disposal wells to assess any relationship between seismicity and the use of such wells. For example, in Texas, the RRC adopted new rules governing the permitting or re-permitting of wells used to dispose of produced water and other fluids resulting from the production of oil and natural gas in order to address these seismic activity concerns within the state. Among other things, these rules require companies seeking permits for disposal wells to provide seismic activity data in permit applications, provide for more frequent monitoring and reporting for certain wells and allow the state to modify, suspend or terminate permits on grounds that a disposal well is likely to be, or determined to be, causing seismic activity. States may issue orders to temporarily shut down or to curtail the injection depth of existing wells in the vicinity of seismic events. Increased regulation and attention given to induced seismicity could also lead to greater opposition, including litigation to limit or prohibit oil and natural gas activities utilizing injection wells for produced water disposal.
Climate change legislation, laws and regulations restricting emissions of greenhouse gases or legal or other action taken by public or private entities related to climate change could force us to incur increased capital and operating costs and could have a material adverse effect on our financial condition, results of operations and cash flows,as well as our reputation.
In December 2009, the EPA determined that emissions of carbon dioxide, methane and other GHGs endanger public health and the environment because emissions of such gases are, according to the EPA, contributing to warming of the Earth’s atmosphere and other climatic changes. Based on these findings, the EPA began adopting and implementing regulations to restrict emissions of GHGs under existing provisions of the CAA. For example, the EPA issued rules restricting methane emissions from hydraulically fractured and refractured gas wells, compressors, pneumatic controls, storage vessels, and natural gas processing plants. For more information on GHG regulation, see Part I, Item 1, “Business - Government Regulation and Environmental Matters.”


While Congress has from time to time considered legislation to reduce emissions of GHGs, there has not been significant activity in the form of adopted legislation to reduce emissions of GHGs in recent years. In the absence of Congressional action, many states have established rules aimed at reducing GHG emissions, including GHG cap and trade programs. Most of these cap and trade programs work by requiring major sources of emissions, such as electric power plants, or major producers of fuels, such as refineries and natural gas processing plants, to acquire and surrender emission allowances. The number of allowances available for purchase is reduced each year in an effort to achieve the overall GHG emission reduction goal. In the future the United States may also choose to adhere to international agreements targeting GHG reductions. The adoption of legislation or regulatory programs to reduce emissions of GHGs could require us to incur increased operating costs, such as costs to purchase and operate emissions control systems, to acquire emissions allowances or to comply with new regulatory or reporting requirements. Any such legislation or regulatory programs could also increase the cost of consuming, and thereby reduce demand for, the oil and gas we produce. Consequently, legislation and regulatory programs to reduce emissions of GHGs could have an adverse effect on our business, financial condition, results of operations and cash flows. Reduced demand for the oil and gas that we produce could also have the effect of lowering the value of our reserves.
In addition, some scientists have concluded that increasing concentrations of GHGs in the Earth’s atmosphere may produce climate changes that have significant physical effects, such as increased frequency and severity of storms, droughts, floods and other climatic events. If such climactic events were to occur more frequently or with greater intensity, our exploration and development activities and ability to transport our production to market could be adversely affected, as these events could cause a loss of production from temporary cessation of activity or damaged facilities and equipment. If any such events were to occur, they could have an adverse effect on our financial condition, results of operations and cash flows. For a more complete discussion of environmental laws and regulations intended to address climate change and their impact on our business and operations, see Part I, Item 1, “Business - Government Regulation and Environmental Matters.”
There have also been efforts in recent years to influence the investment community, including investment advisors and certain sovereign wealth, pension and endowment funds, as well as other stakeholders, promoting divestment of fossil fuel equities and pressuring lenders to limit funding to companies engaged in the extraction of fossil fuel reserves. Such environmental activism and initiatives aimed at limiting climate change and reducing air pollution could interfere with our business activities, operations and ability to access capital and adversely impact our reputation. Finally, increasing attention to the risks of climate change has resulted in an increased possibility of lawsuits or investigations brought by public and private entities against oil and gas companies in connection with their GHG emissions. Should we be targeted by any such litigation or investigation, we may incur liability, which, to the extent that societal pressures or political or other factors are involved, could be imposed without regard to our causation of or contribution to the asserted damage, or to other mitigating factors.
Federal state and local legislation and regulatory initiatives relating to hydraulic fracturing, as well as governmental reviews of such activities, could result in increased costs and additional operating restrictions or delays and adversely affect our production.
Hydraulic fracturing involves the injection of water, sand or other propping agents and chemicals under pressure into rock formations to stimulate oil and gas production. We routinely use hydraulic fracturing to complete wells. The EPA released the final results of its comprehensive research study on the potential adverse impacts that hydraulic fracturing may have on drinking water resources in December 2016. The EPA concluded that hydraulic fracturing activities can impact drinking water resources under some circumstances, including large volume spills and inadequate mechanical integrity of wells. The results of the EPA’s study could spur action towards federal legislation and regulation of hydraulic fracturing or similar production operations. In past sessions, Congress has considered, but did not pass, legislation to amend the SDWA to remove the SDWA’s exemption granted to most hydraulic fracturing operations (other than operations using fluids containing diesel) and to require reporting and disclosure of chemicals used by oil and gas companies in the hydraulic fracturing process. The EPA has issued SDWA permitting guidance for hydraulic fracturing operations involving the use of diesel fuel in fracturing fluids in those states where the EPA is the permitting authority. The EPA has also issued final regulations under the CAA establishing performance standards, including standards for the capture of VOCs and methane released during hydraulic fracturing; an advanced notice of proposed rulemaking under the Toxic Substances Control Act to require companies to disclose information regarding the chemicals used in hydraulic fracturing; and final rules in June 2016 to prohibit the discharge of wastewater from hydraulic fracturing operations to publicly owned wastewater treatment plants. In addition, a number of states and local regulatory authorities are considering or have implemented more stringent regulatory requirements applicable to hydraulic fracturing, including bans/moratoria on drilling that effectively prohibit further production of oil and gas through the use of hydraulic fracturing or similar operations. Texas has adopted regulations that require the disclosure of information regarding the substances used in the hydraulic fracturing process, and the RRC has also adopted rules governing well casing, cementing and other standards for ensuring that hydraulic fracturing operations do not contaminate nearby water resources. Moreover, the legal requirements related to the disposal of produced water into a non-producing geologic formation by means of underground injection wells are subject to change based on concerns of the public or governmental authorities regarding such disposal activities. In light of concerns about seismic activity being triggered by the injection of produced waters into underground wells, Texas regulators have asserted regulatory authority to limit injection activities in certain wells in an effort to reduce seismic activity. A 2015 U.S. Geological Survey report identified areas of increased rates of induced seismicity that could be


attributed to fluid injection or oil and gas extraction. Another consequence of seismic events may be lawsuits alleging that disposal well operations have caused damage to neighboring properties or otherwise violated state and federal rules regulating waste disposal. These developments could result in additional regulation and restrictions on the use of injection wells by us. Increased regulation and attention given to induced seismicity could also lead to greater opposition, including litigation to limit or prohibit oil, natural gas and natural gas liquids activities utilizing injection wells for produced water disposal.
The adoption of new laws or regulations imposing reporting or operational obligations on, or otherwise limiting or prohibiting, the hydraulic fracturing process could make it more difficult to complete oil and gas wells in unconventional plays. In addition, if hydraulic fracturing becomes regulated at the federal level as a result of federal legislation or regulatory initiatives by the EPA, hydraulic fracturing activities could become subject to additional permitting requirements, and also to attendant permitting delays and potential increases in cost, which could adversely affect our business and results of operations.
Restrictions on drilling activities intended to protect certain species of wildlife or their habitat may adversely affect our ability to conduct drilling activities in some of the areas where we operate.
Various federal and state statutes prohibit certain actions that harm endangered or threatened species and their habitats, migratory birds, wetlands and natural resources. These statutes include the Endangered Species Act, the Migratory Bird Treaty Act, the Clean Water Act, CERCLA and the OPA. The U.S. Fish and Wildlife Service may designate critical habitat and suitable habitat areas that it believes are necessary for survival of threatened or endangered species. A critical habitat or suitable habitat designation could result in further material restrictions to federal land use and private land use and could delay or prohibit land access or oil and gas development. If harm to species or damages to wetlands, habitat or natural resources occur or may occur, government entities or, at times, private parties may act to prevent oil and gas exploration or development activities or seek damages for harm to species, habitat or natural resources resulting from drilling, construction or releases of oil, wastes, hazardous substances or other regulated materials, and in some cases, may seek criminal penalties.growth.
Derivative transactions may limit our potential gains and involve other risks.
In order to achieve more predictable cash flows and manage our exposure to commodity price risks in the sale of our crude oil, NGLs and natural gas, we periodically enter into commodity price hedging arrangements with respect to a portion of our expected production. Our hedges are limited in duration, usually for periods of three years or less. While intended to reduce the effects of volatile crude oil, NGL and natural gas prices, such transactions may limit our potential gains if crude oil, NGL or natural gas prices were to rise over the price established by the hedging arrangements. In trying to maintain an appropriate balance, we may end up hedging too much or too little, depending upon how commodity prices fluctuate in the future, which could have the effect of reducing our net income.
In addition, derivative transactions may expose us to the risk of financial loss in certain circumstances, including instances in which:
our production is less than expected;
there is a widening of price basis differentials between delivery points for our production and the delivery point assumed in the hedge arrangement;
the counterparty to a derivatives instrument fails to perform under the contract; or
a sudden, unexpected event materially impacts commodity prices.
In addition, we may enter into derivative instruments that involve basis risk. Basis risk in a derivative contract occurs when the index upon which the contract is based is more or less variable than the index upon which the hedged asset is based, thereby making the hedge less effective. For example, a NYMEX index used for hedging certain volumes of production may have more or less variability than the regional price index used for the sale of that production.
The adoption of derivatives legislation and implementing rules could have an adverse effect on our ability to use derivative instruments to reduce the effect of commodity price risks associated with our business.
The Dodd-Frank Wall Street Reform and Consumer Protection Act, or the Dodd Frank Act, enacted on July 21, 2010, established federal oversight and regulation of the over-the-counter derivatives market and entities, such as us, that participate in that market. The Dodd-Frank Act requires the Commodity Futures Trading Commission, or CFTC, and the SEC, to promulgate rules and regulations implementing the Dodd-Frank Act. While some of these rules have been finalized, some have not been finalized or implemented, and it is not possible at this time to predict when this will be accomplished. In October 2011, the CFTC issued regulations to set position limits for certain futures and option contracts in the major energy markets and for swaps that are their economic equivalents; however, this initial position limits rule was vacated by the United StatesU.S. District Court for the District of Columbia in September 2012. The CFTC has subsequently issued proposals for new rules that would place position limits on certain core futures contracts and equivalent swap contracts for or linked to certain physical commodities, subject to certain exceptions for bona fide hedging transactions, though these rules have not been finalized and the impact of those provisions on us is uncertain at this time.


31


While the CFTC has designated certain interest rate swaps and credit default swaps subject to mandatory clearing, and the associated rules also will require us, in connection with covered derivative activities, to comply with clearing and trade-execution requirements or take steps to qualify for an exemption to such requirements. The CFTC has not yet proposed rules subjecting any other classes of swaps, including physical commodity swaps, to mandatory clearing. Although we believe we qualify for the end-user exception from the mandatory clearing requirements for swaps entered to hedge our commercial risks, the application of the mandatory clearing and trade execution requirements to other market participants, such as swap dealers, may change the cost and availability of the swaps that we use for hedging. If our swaps do not qualify for the end-user exception from mandatory clearing, or if the cost of entering into uncleared swaps becomes prohibitive, we may be required to clear such transactions or our ability to hedge may be impacted. The ultimate effect of the rules and any additional regulations on our business is uncertain at this time.
In addition, certain banking regulators and the CFTC have adopted final rules establishing minimum margin requirements for uncleared swaps. Although we expect to be exempt from such requirements for the mandatory exchange of margin for uncleared swaps, the application of such requirements to other market participants, such as swap dealers, may change the cost and availability of the swaps that we use for hedging. Further, if we did not qualify for an exemption and were required to post collateral for our swaps, it could reduce our liquidity and cash available for capital expenditures and our ability to manage commodity price volatility and the volatility in cash flows.
The full impact of the Dodd-Frank Act and related regulatory requirements upon our business will not be known until the regulations are implemented and the market for derivatives contracts has adjusted. When fully implemented, the Dodd-Frank Act and any new regulations could increase the operational and transactional cost of derivatives contracts, reduce the availability of derivatives to protect against risks that we encounter, reduce our ability to monetize and restructure our existing derivatives contracts and affect the number and/or creditworthiness of available counterparties. If we reduce our use of derivatives as a result of the Dodd-Frank Act and regulations, our results of operations may become more volatile and our cash flows may be less predictable, which could adversely affect our ability to plan for and fund capital expenditures.
In addition, we may transact with counterparties based in the European Union, Canada or other jurisdictions which, like the U.S., are in the process of implementing regulations to regulate derivatives transactions, some of which are currently in effect and impose operational and transactional costs on our derivatives activities.
A negative shift in investor sentiment towards the oil and gas industry could adversely affect our ability to raise equity and debt capital.
Certain segments of the investor community have recently developed negative sentiments towards investing in our industry. The negative sentiment toward our sector versus other industry sectors has led to lower oil and gas representation in certain key equity market indices. Some investors, including certain pension funds, university endowments and family foundations, have stated policies to reduce or eliminate their investments in the oil and gas sector based on social and environment considerations. Such developments could result in a reduction of available capital funding for potential development projects or diminution of capital to fund our business which could impact our future financial results. Additionally, such developments have resulted and could continue to result in downward pressure on the stock prices of oil and gas companies, including ours.
In addition, organizations that provide information to investors on corporate governance and related matters have developed ratings processes for evaluating companies on their approach to environmental, social, and governance (“ESG”) matters. Currently, there are no universal standards for such scores or ratings, but the importance of sustainability evaluations is becoming more broadly accepted by investors and shareholders. Such ratings are used by some investors to inform their investment and voting decisions. Additionally, certain investors use these scores to benchmark companies against their peers and if a company is perceived as lagging, these investors may engage with companies to require improved ESG disclosure or performance. Moreover, certain members of the broader investment community may consider a company’s sustainability score as a reputational or other factor in making an investment decision. Consequently, a low sustainability score could result in exclusion of our stock from consideration by certain investment funds, engagement by investors seeking to improve such scores and a negative perception of our operations by certain investors.

32


Legal and Regulatory Risks
We are subject to complex laws and regulations that can adversely affect the cost, manner or feasibility of doing business.
Exploration, development, production and sale of oil and gas are subject to extensive federal, state and local laws and regulations, including complex environmental laws. Future laws or regulations, any adverse changes in the interpretation of existing laws and regulations, inability to obtain necessary regulatory approvals or a failure to comply with existing legal requirements may harm our business, results of operations, financial condition or cash flows. We may be required to make large expenditures to comply with environmental and other governmental regulations. Failure to comply with these laws and regulations may result in the suspension or termination of operations and subject us to administrative, civil and criminal penalties. Matters subject to regulation include discharge permits for drilling operations, drilling bonds, spacing of wells, unitization and pooling of properties, environmental protection and taxation. Our operations create the risk of environmental liabilities to the government or third parties for any unlawful discharge of oil, gas or other pollutants into the air, soil or water. In the event of environmental violations or other environmental, health or safety impacts, we may be charged with remedial costs and land owners may file claims for alternative water supplies, property damage or bodily injury. Laws and regulations protecting the environment have become more stringent in recent years, and may, in some circumstances, result in liability for environmental damage regardless of negligence or fault. New laws, regulations or enforcement policies could be more stringent and impose unforeseen liabilities or significantly increase compliance costs. Moreover, these risks are likely to be enhanced with the Biden Administration. For example, see Part I, Item 1, “Business – Government Regulation and Environmental Matters – Greenhouse Gas Emissions” for information about certain actions the Biden Administration has taken targeting GHG emissions. No assurance can be given that continued compliance with existing or future environmental laws and regulations will not result in a curtailment of production or processing activities or result in a material increase in the costs of production, development, exploration or processing operations. In addition, pollution and similar environmental risks generally are not fully insurable. These liabilities and costs could have a material adverse effect on our business, financial condition, results of operations and cash flows. See Part I, Item 1, “Business – Government Regulation and Environmental Matters.”
Access to water to drill and conduct hydraulic fracturing may not be available if water sources become scarce, and we may face difficulty disposing of produced water gathered from drilling and production activities.
The availability of water is crucial to conduct hydraulic fracturing. A significant amount of water is necessary for drilling and completing each well with hydraulic fracturing. In the past, Texas has experienced severe droughts that have limited the water supplies that are necessary to conduct hydraulic fracturing. Although we have taken measures to secure our water supply, we can make no assurances that sufficient water resources will be available in the short or long term to carry out our current activities. If we are unable to obtain water to use in our operations from local sources, we may be unable to economically produce oil and gas, which could have an adverse effect on our financial condition, results of operations and cash flows.
In addition, we must dispose of the fluids produced from oil and natural gas production operations, including produced water. The legal requirements related to the disposal of produced water into a non-producing geologic formation by means of underground injection wells are subject to change based on concerns of the public or governmental authorities regarding such disposal activities. One such concern arises from recent seismic events near underground disposal wells that are used for the disposal by injection of produced water resulting from oil and natural gas activities. In March 2016, the U.S. Geological Survey identified Texas and Colorado as being among the states with areas of increased rates of induced seismicity that could be attributed to fluid injection or oil and natural gas extraction. In response to concerns regarding induced seismicity, regulators in some states have imposed, or are considering imposing, additional requirements in the permitting of produced water disposal wells to assess any relationship between seismicity and the use of such wells. For example, in Texas, the RRC adopted new rules governing the permitting or re-permitting of wells used to dispose of produced water and other fluids resulting from the production of oil and natural gas in order to address these seismic activity concerns within the state. Among other things, these rules require companies seeking permits for disposal wells to provide seismic activity data in permit applications, provide for more frequent monitoring and reporting for certain wells and allow the state to modify, suspend or terminate permits on grounds that a disposal well is likely to be, or determined to be, causing seismic activity. States may issue orders to temporarily shut down or to curtail the injection depth of existing wells in the vicinity of seismic events. Increased regulation and attention given to induced seismicity could also lead to greater opposition, including litigation to limit or prohibit oil and natural gas activities utilizing injection wells for produced water disposal.

33


Climate change legislation, laws and regulations restricting emissions of GHGs or prohibiting, restricting, or delaying oil and gas development on public lands, or legal or other action taken by public or private entities related to climate change could force us to incur increased capital and operating costs and could have a material adverse effect on our financial condition, results of operations and cash flows, as well as our reputation.
In December 2009, the EPA determined that emissions of carbon dioxide, methane and other GHGs endanger public health and the environment because emissions of such gases are, according to the EPA, contributing to warming of the Earth’s atmosphere and other climatic changes. Based on these findings, the EPA began adopting and implementing regulations to restrict emissions of GHGs under existing provisions of the CAA. For example, the EPA issued rules restricting methane emissions from hydraulically fractured and refractured gas wells, compressors, pneumatic controls, storage vessels, and natural gas processing plants. For more information on GHG regulation, see Part I, Item 1, “Business – Government Regulation and Environmental Matters.”
While Congress has from time to time considered legislation to reduce emissions of GHGs, there has not been significant activity in the form of adopted legislation to reduce emissions of GHGs in recent years. In the absence of Congressional action, many states have established rules aimed at reducing GHG emissions, including GHG cap and trade programs. Most of these cap and trade programs work by requiring major sources of emissions, such as electric power plants, or major producers of fuels, such as refineries and natural gas processing plants, to acquire and surrender emission allowances. The number of allowances available for purchase is reduced each year in an effort to achieve the overall GHG emission reduction goal. In the future, the U.S. may also choose to adhere to international agreements targeting GHG reductions. The adoption of legislation or regulatory programs or other government action to reduce emissions of GHGs or restrict, delay or prohibit oil and gas development on public lands could require us to incur increased operating costs, such as costs to purchase and operate emissions control systems, to acquire emissions allowances or to comply with new regulatory or reporting requirements, or prevent us from conducting operations in certain areas. Any such legislation or regulatory programs could also increase the cost of consuming, and thereby reduce demand for, the oil and gas we produce. These risks are likely to be enhanced with the Biden Administration. See Part I, Item 1, “Business – Government Regulation and Environmental Matters - Greenhouse Gas Emissions.” Consequently, legislation and regulatory programs to reduce emissions of GHGs could have an adverse effect on our business, financial condition, results of operations and cash flows. Reduced demand for the oil and gas that we produce could also have the effect of lowering the value of our reserves.
In addition, some scientists have concluded that increasing concentrations of GHGs in the Earth’s atmosphere may produce climate changes that have significant physical effects, such as increased frequency and severity of storms, droughts, floods and other climatic events. If such climactic events were to occur more frequently or with greater intensity, our exploration and development activities and ability to transport our production to market could be adversely affected, as these events could cause a loss of production from temporary cessation of activity or damaged facilities and equipment. If any such events were to occur, they could have an adverse effect on our financial condition, results of operations and cash flows. For a more complete discussion of environmental laws and regulations intended to address climate change and their impact on our business and operations, see Part I, Item 1, “Business – Government Regulation and Environmental Matters.”
There have also been efforts in recent years to influence the investment community, including investment advisors and certain sovereign wealth, pension and endowment funds, as well as other stakeholders, promoting divestment of fossil fuel equities and pressuring lenders to limit funding to companies engaged in the extraction of fossil fuel reserves. Such environmental activism and initiatives aimed at limiting climate change and reducing air pollution could interfere with our business activities, operations and ability to access capital and adversely impact our reputation. Finally, increasing attention to the risks of climate change has resulted in an increased possibility of lawsuits or investigations brought by public and private entities against oil and gas companies in connection with their GHG emissions. Should we be targeted by any such litigation or investigation, we may incur liability, which, to the extent that societal pressures or political or other factors are involved, could be imposed without regard to our causation of or contribution to the asserted damage, or to other mitigating factors.

34


Federal state and local legislation and regulatory initiatives relating to hydraulic fracturing, as well as governmental reviews of such activities, could result in increased costs and additional operating restrictions or delays and adversely affect our production.
Hydraulic fracturing involves the injection of water, sand or other propping agents and chemicals under pressure into rock formations to stimulate oil and gas production. We routinely use hydraulic fracturing to complete wells. The EPA released the final results of its comprehensive research study on the potential adverse impacts that hydraulic fracturing may have on drinking water resources in December 2016. The EPA concluded that hydraulic fracturing activities can impact drinking water resources under some circumstances, including large volume spills and inadequate mechanical integrity of wells. The results of the EPA’s study could spur action towards federal legislation and regulation of hydraulic fracturing or similar production operations. In past sessions, Congress has considered, but did not pass, legislation to amend the SDWA to remove the SDWA’s exemption granted to most hydraulic fracturing operations (other than operations using fluids containing diesel) and to require reporting and disclosure of chemicals used by oil and gas companies in the hydraulic fracturing process. The EPA has issued SDWA permitting guidance for hydraulic fracturing operations involving the use of diesel fuel in fracturing fluids in those states where the EPA is the permitting authority. The EPA has also issued proposed and final regulations under the CAA establishing performance standards, including standards for the capture of volatile organic compounds and methane released during hydraulic fracturing; an advanced notice of proposed rulemaking under the Toxic Substances Control Act to require companies to disclose information regarding the chemicals used in hydraulic fracturing; and final rules in June 2016 to prohibit the discharge of wastewater from hydraulic fracturing operations to publicly owned wastewater treatment plants. In addition, a number of states and local regulatory authorities and federal politicians are considering or have implemented more stringent regulatory requirements applicable to hydraulic fracturing, including bans/moratoria on drilling that effectively prohibit further production of oil and gas through the use of hydraulic fracturing or similar operations. Texas has adopted regulations that require the disclosure of information regarding the substances used in the hydraulic fracturing process, and the RRC has also adopted rules governing well casing, cementing and other standards for ensuring that hydraulic fracturing operations do not contaminate nearby water resources. Moreover, the legal requirements related to the disposal of produced water into a non-producing geologic formation by means of underground injection wells are subject to change based on concerns of the public or governmental authorities regarding such disposal activities, and the RRC has recently limited certain disposal well activity resulting from an increase in seismic events in certain areas of Texas. In light of concerns about seismic activity being triggered by the injection of produced waters into underground wells, Texas regulators have asserted regulatory authority to limit injection activities in certain wells in an effort to reduce seismic activity. Another consequence of seismic events may be lawsuits alleging that disposal well operations have caused damage to neighboring properties or otherwise violated state and federal rules regulating waste disposal. These developments could result in additional regulation and restrictions on the use of injection wells by us. Increased regulation and attention given to induced seismicity could also lead to greater opposition, including litigation to limit or prohibit oil, natural gas and natural gas liquids activities utilizing injection wells for produced water disposal.
The adoption of new laws or regulations imposing reporting or operational obligations on, or otherwise limiting or prohibiting, the hydraulic fracturing process could make it more difficult to complete oil and gas wells in unconventional plays. In addition, if hydraulic fracturing becomes regulated at the federal level as a result of federal legislation or regulatory initiatives by the EPA, hydraulic fracturing activities could become subject to additional permitting requirements, and also to attendant permitting delays and potential increases in cost, which could adversely affect our business and results of operations. These risks are likely to be enhanced with the Biden Administration.
Restrictions on drilling activities intended to protect certain species of wildlife or their habitat may adversely affect our ability to conduct drilling activities in some of the areas where we operate.
Various federal and state statutes prohibit certain actions that harm endangered or threatened species and their habitats, migratory birds, wetlands and natural resources. These statutes include the Endangered Species Act, the Migratory Bird Treaty Act, the Bald and Golden Eagle Protection Act, the Clean Water Act, CERCLA and the OPA. The U.S. Fish and Wildlife Service may designate critical habitat and suitable habitat areas that it believes are necessary for survival of threatened or endangered species. A critical habitat or suitable habitat designation could result in further material restrictions to federal land use and private land use and could delay or prohibit land access or oil and gas development. If harm to species or damages to wetlands, habitat or natural resources occur or may occur, government entities or, at times, private parties may act to prevent oil and gas exploration or development activities or seek damages for harm to species, habitat or natural resources resulting from drilling, construction or releases of oil, wastes, hazardous substances or other regulated materials, and in some cases, may seek criminal penalties.
35


Our commitments and disclosures related to environmental and social matters expose us to numerous risks.
We have made, and will continue to make, commitments and disclosures related to environmental and social matters. Statements related to sustainability, diversity and other environmental and social goals, objectives and priorities reflect our current plans and do not constitute a guarantee that they will be achieved or fulfilled. Our efforts to research, establish, accomplish and accurately report on these goals, objectives and priorities expose us to numerous operational, reputational, financial, legal and other risks. In particular, our ability to achieve any stated goal, objective or priority, is subject to numerous factors and conditions, some of which are outside of our control. Examples of such factors include: (i) our access to capital, technology and third party cooperation in order to accomplish our plans and targets; (ii) the viability of new techniques in our development; and (iii) evolving regulatory requirements affecting sustainability standards or disclosures. Standards for tracking and reporting on sustainability matters, including climate-related matters, have not been harmonized and continue to evolve. Our processes and controls for reporting sustainability matters may not always comply with evolving and disparate standards for identifying, measuring and reporting such metrics, including sustainability-related disclosures that may be required of public companies by the SEC, and such standards may change over time, which could result in significant revisions to our current goals, reported progress in achieving such goals or ability to achieve such goals in the future. Our business may also face increased scrutiny from investors and other stakeholders related to our environmental and social activities, including the goals, objectives and priorities that we announce, and our methodologies and timelines for pursuing them. If our sustainability, diversity and other practices do not meet investor or other stakeholder expectations and standards, which continue to evolve, our reputation, our ability to attract or retain employees and our attractiveness as an investment or business partner could be negatively affected. Similarly, our failure or perceived failure to pursue or fulfill our environmental and social goals, objectives and priorities, to comply with ethical, environmental or other standards, regulations or expectations, or to satisfy various reporting standards with respect to these matters, within the timelines we announce, or at all, could expose us to government enforcement actions and private litigation, as well as adversely affect our business or reputation.
New climate disclosure rules proposed by the SEC may increase our costs of compliance and adversely impact our business.
On March 21, 2022, the SEC proposed new rules relating to the disclosure of a range of climate-related risks. We are currently assessing the proposed rule, but at this time cannot predict the costs of implementation or any potential adverse impacts resulting from the rule. According to the SEC’s Fall 2022 regulatory agenda, the proposed climate disclosure rule is scheduled to be finalized in April 2023. To the extent this rule is finalized as proposed, we could incur increased costs relating to the assessment and disclosure of climate-related risks, including increased legal, accounting and financial compliance costs, as well as making some activities more difficult, time-consuming and costly, and placing strain on our personnel, systems and resources. We may also face increased litigation risks related to disclosures made pursuant to the rule if finalized as proposed. In addition, enhanced climate disclosure requirements could accelerate the trend of certain stakeholders and lenders restricting or seeking more stringent conditions with respect to their investments in certain carbon-intensive sectors.
We may be involved in legal proceedings that could result in substantial liabilities.
Like many oil and gas companies, from time to time, we expect to be involved in various legal and other proceedings, such as title, royalty or contractual disputes, regulatory compliance matters and personal injury or property damage matters, in the ordinary course of business. Such legal proceedings are inherently uncertain and their results cannot be predicted. Regardless of the outcome, such proceedings could have an adverse impact on us because of legal costs, diversion of management and other personnel and other factors. In addition, it is possible that a resolution of one or more such proceedings could result in liability, penalties or sanctions, as well as judgments, consent decrees or orders requiring a change in our business practices, which could materially and adversely affect our business, operating results and financial condition. Accruals for such liability, penalties or sanctions may be insufficient, and judgments and estimates to determine accruals or range of losses related to legal and other proceedings could change from one period to the next, and such changes could be material.

36


Tax-Related Risks
Our ability to use net operating loss carryforwards to offset future taxable income may be subject to certain limitations.
Our ability to utilize U.S. net operating loss, or NOL, carryforwards to reduce future taxable income is subject to various limitations under the Internal Revenue Code of 1986, as amended, or the Code. As disclosed in Note 10 to our Consolidated Financial Statementsconsolidated financial statements included in Part II, Item 8, “Financial Statements and Supplementary Data,” we have substantial NOL carryforwards. The utilization of such carryforwards may be limited upon the occurrence of certain ownership changes, including the purchase or sale of our stock by 5 percent5% shareholders and our offering of stock during any three-year period resulting in an aggregate change of more than 50 percent50% in our beneficial ownership. In the event of an ownership change, Section 382 of the Code imposes an annual limitation on the amount of our taxable income that can be offset by these carryforwards. As of December 31, 2019,2022, we do not believe that an ownership change has occurred; however, to the extent an ownership change has occurred or were to occur in the future, it is possible that the limitations imposed on our ability to use pre-ownership change losses could cause a significant net increase in our U.S. federal income tax liability and could cause U.S. federal income taxes to be paid earlier than they otherwise would be paid if such limitations were not in effect. In addition, U.S. NOLs generated on or after January 1, 2018, can be limited to 80 percent80% of taxable income. To the extent we are not able to offset our future income with our NOLs, this could adversely affect our operating results and cash flows once we attain profitability.
Certain federal income tax deductions currently available with respect to oil and gas exploration and development may be eliminated. Additional state taxes on oil and gas extraction may be imposed, as a result of future legislation.
In recent years, lawmakers and the U.S. Treasury have proposed certain significant changes to U.S. tax laws applicable to oil and gas companies. These changes include, but are not limited to: (i) the repeal of the percentage depletion allowance for oil and gas properties; (ii) the elimination of current deductions for intangible drilling and development costs; and (iii) an extension of the amortization period for certain geological and geophysical expenditures. It is unclear whether any such changes will be enacted or if enacted, when such changes could be effective. If such proposed changes are ever made, as well as any similar changes in in U.S. federal tax law or state law, it could eliminate or postpone certain tax deductions that are currently available to us with respect to oil and gas exploration and development, and any such change could negatively affect our financial condition, results of operations and cash flows.
Additionally, future legislation could be enacted that increases the taxes or fees imposed on oil and gas extraction. Any such legislation could result in increased operating costs and/or reduced consumer demand for petroleum products, which in turn could affect the prices we receive for our crude oil, NGLs and natural gas.


Technology-Related Risks
We may not be able to keep pace with technological developments in our industry.
The oil and gas industry is characterized by rapid and significant technological advancements and introductions of new products and services using new technologies. As others use or develop new technologies, we may be placed at a competitive disadvantage, and competitive pressures may force us to implement those new technologies at substantial cost. In addition, other oil and gas companies may have greater financial, technical and personnel resources that allow them to enjoy technological advantages and may allow them to implement new technologies before we can. We may not be able to respond to these competitive pressures and implement new technologies on a timely basis or at an acceptable cost. If one or more of the technologies we use now or in the future were to become obsolete or if we are unable to use the most advanced commercially available technology, our business, financial condition, results of operations and cash flows could be adversely affected.
A cybersecurity incident could result in theft of confidential information, data corruption or operational disruption.
The oil and gas industry is increasingly dependent on digital technologies to conduct certain exploration, development and production activities. Software programs are used for, among other things, reserve estimates, seismic interpretation, modeling and compliance reporting. In addition, the use of mobile communication is widespread. Increasingly, we must protect our business against potential cyber incidents including attacks as we have experienced and will continue to experience varying degrees of cyber incidents in the normal conduct of our business.
If our systems for protecting against cyber incidents prove insufficient, we could be adversely affected by unauthorized access to our digital systems which could result in theft of confidential information, data corruption or operational disruption. These cybersecurity threat actors are becoming more sophisticated and coordinated in their attempts to access a company’s information technology systems and data, including the information technology systems of cloud providers and third parties with which a company conducts business. As cyber threats continue to evolve, we may be required to expend additional resources to continue to modify and enhance our protective systems or to investigate and remediate any vulnerabilities.

37


Information technology solution failures, network disruptions and breaches of data security could disrupt our operations by causing delays or cancellation of customer orders, impeding processing of transactions and reporting financial results, resulting in the unintentional disclosure of customer, employee or our information, or damage to our reputation. A cyber attack involving our information systems and related infrastructure, or that of our business associates, could negatively impact our operations in a variety of ways, including but not limited to, the following:
Unauthorized access to seismic data, reserves information, strategic information, or other sensitive or proprietary information could have a negative impact on our ability to compete for oil and gas resources;
Data corruption, communication interruption, or other operational disruption during drilling activities could result in failure to reach the intended target or a drilling incident;
Data corruption or operational disruptions of production-related infrastructure could result in a loss of production, or accidental discharge;
A cyber attack on a vendor or service provider could result in supply chain disruptions which could delay or halt our major development projects;
A cyber attack on third-party gathering, pipeline, or other transportation systems could delay or prevent us from transporting and marketing our production, resulting in a loss of revenues;
A cyber attack involving commodities exchanges or financial institutions could slow or halt commodities trading, thus preventing us from marketing our production or engaging in hedging activities, resulting in a loss of revenues;
A cyber attack which halts activities at a power generation facility or refinery using natural gas as feed stock could have a significant impact on the natural gas market;
A cyber attack on a communications network or power grid could cause operational disruption resulting in loss of revenues;
A cyber attack on our automated and surveillance systems could cause a loss in production and potential environmental hazards;
A deliberate corruption of our financial or operating data could result in events of non-compliance which could then lead to regulatory fines or penalties; and
A cyber attack resulting in the loss or disclosure of, or damage to, our or any of our customer’s or supplier’s data or confidential information could harm our business by damaging our reputation, subjecting us to potential financial or legal liability, and requiring us to incur significant costs, including costs to repair or restore our systems and data or to take other remedial steps.
Additionally, certain cyber incidents may remain undetected for an extended period. There can be no assurance that a system failure or data security breach will not have a material adverse effect on our financial condition, results of operations or cash flows. Furthermore, the growth of cyber attacks has resulted in evolving legal and compliance matters which impose significant costs that are likely to increase over time.

Risks Related to the Ownership of Our Class A Common Stock

Juniper controls the Company, and their interests may conflict with the Company’s and its other shareholders’ interests in the future.
A negative shiftAs of March 3, 2023, Juniper beneficially owned approximately 54% of our Common Stock. As a result, Juniper is able to control the election and removal of our directors and thereby control our policies and operations and its interests may not in investor sentiment towards the oilall cases be aligned with other shareholders’ interests. In addition, Juniper may have an interest in pursuing acquisitions, divestitures and gas industryother transactions that, in its judgment, could adversely affectenhance its investment, even though such transactions might involve risks to other shareholders. For example, Juniper could cause us to make acquisitions that increase our abilityindebtedness or cause us to raise equitysell revenue-generating assets. Additionally, Juniper and debt capital.
Certain segmentsits designated directors are not obligated to present any business opportunities (other than those presented to such directors in their roles as directors of the investor community have recently developed negative sentiment towards investing in our industry. The negative sentiment toward our sector versus other industry sectors has ledCompany) to lower oilus.

38


In addition, Juniper is able to determine the outcome of many matters requiring shareholder approval and gas representation in certain key equity market indices. Some investors, including certain pension funds, university endowments and family foundations, have stated policiesis able to reducecause or eliminate their investments in the oil and gas sector based on social and environment considerations. Such development could result inprevent a reductionchange of available capital funding for potential development projects or diminution of capital to fund our business which could impact our future financial results.
We may be involved in legal proceedings that could result in substantial liabilities.
Like many oil and gas companies, from time to time, we expect to be involved in various legal and other proceedings, such as title, royalty or contractual disputes, regulatory compliance matters and personal injury or property damage matters, in the ordinary course of business. Such legal proceedings are inherently uncertain and their results cannot be predicted. Regardlesscontrol of the outcome, such proceedings could have an adverse impact on us because of legal costs, diversion of management and other personnel and other factors. In addition, it is possible that a resolution of oneCompany or more such proceedings could result in liability, penalties or sanctions, as well as judgments, consent decrees or orders requiring a change in the composition of our business practices, which Board of Directors and could materiallypreclude any acquisition of the Company. This concentration of voting control could deprive shareholders of an opportunity to receive a premium for their shares of Class A Common Stock as part of a sale of the Company and adverselyultimately might affect the market price of our business, Class A Common Stock.
Moreover, Juniper has certain director designation rights entitling them to designate up to five members of the Board out of a total of nine directors, with such designation rights being subject to certain step-downs.
We are a “controlled company” within the meaning of the Nasdaq rules and, as a result, qualify for exemptions from certain corporate governance requirements.
Juniper controls a majority of the voting power of our Common Stock. As a result, we are a “controlled company” within the meaning of the corporate governance standards of Nasdaq and we are not required to comply with certain corporate governance requirements, including the requirement to have a majority of the board of directors be independent directors and the requirement to have compensation and nominating committees that are composed entirely of independent directors. While we have not elected to utilize these exemptions, in the future we could elect to do so. If we were to utilize any such exemptions, our shareholders would not have the same protections afforded to shareholders of companies that are subject to all of the corporate governance rules for Nasdaq-listed companies.
Ranger Oil is a holding company. Ranger Oil’s only material asset is its equity interest in the Partnership, and Ranger Oil is accordingly dependent upon distributions from the Partnership to pay taxes and cover its operating resultsexpenses and other obligations.
Ranger Oil is a holding company and has no material assets other than its equity interest in the Partnership. Ranger Oil has no independent means of generating revenue. To the extent the Partnership has available cash, Ranger Oil intends to cause the Partnership to make (i) pro rata distributions to its limited partners, including Ranger Oil, in an amount sufficient to allow Ranger Oil to pay its taxes and (ii) payments to Ranger Oil to cover its operating expenses and other obligations. To the extent that Ranger Oil needs funds and the Partnership or its subsidiaries are restricted from making such distributions or payments under applicable law or regulation or under the terms of any future financing arrangements, or are otherwise unable to provide such funds, Ranger Oil’s liquidity and financial condition. Accrualscondition could be materially adversely affected.
Moreover, because Ranger Oil has no independent means of generating revenue, Ranger Oil’s ability to pay dividends will be dependent on the ability of the Partnership to make cash distributions. This ability, in turn, may depend on the ability of the Partnership’s subsidiaries to make distributions to it. The ability of the Partnership, its subsidiaries and other entities in which it directly or indirectly holds an equity interest to make such distributions will be subject to, among other things, (i) applicable laws or regulations that may limit the amount of funds available for such liability, penaltiesdistribution and (ii) restrictions in relevant debt instruments issued by the Partnership or sanctionsits subsidiaries and other entities in which it directly or indirectly holds an equity interest.
In certain circumstances, the Partnership will be required to make tax distributions to its unitholders, including us, and the tax distributions that the Partnership will be required to make may be insufficient, and judgments and estimates to determine accruals or range of losses related to legal and other proceedings could change from one periodsubstantial.
Pursuant to the next,amended and such changesrestated limited partnership agreement of the Partnership (the “Partnership Agreement”), the Partnership will make generally pro rata cash distributions, or tax distributions, to its unitholders, including us, in an amount generally intended to allow the unitholders to satisfy their respective income tax liabilities with respect to their allocable share of the income of the Partnership, based on certain assumptions and conventions, provided that the distribution will be sufficient to allow us to satisfy our actual tax liabilities. Because tax distributions will be made pro rata based on ownership and based on an assumed tax rate, the Partnership could be material.required to make tax distributions that, in the aggregate, exceed the amount of taxes that the Partnership would have paid if it were taxed on its net income at its effective tax rate.
We emerged from bankruptcyFunds used by the Partnership to satisfy its tax distribution obligations will not be available for reinvestment in September 2016, which could adversely affect our business and relationships.
It is possible that our having filed for bankruptcy and our emergence could adversely affect our business and relationships with customers, employees and suppliers. Duethe business. Moreover, the tax distributions the Partnership will be required to uncertainties, many risks exist, including the following:
key suppliers could terminate their relationship or require financial assurances or enhanced performance;
our ability to renew existing contracts and compete for new businessmake may be adversely affected;substantial and may exceed the unitholder’s tax liabilities if the unitholder has an overall effective tax rate that is lower than the assumed rate.
our ability to attract, motivate and/or retain key executives and employees may be adversely affected;
employees may be distracted from performance of their duties or more easily attracted to other employment opportunities;
39

our ability to obtain credit and raise capital on terms acceptable to us or at all; and

our ability to attract and retain customers may be negatively impacted.
The occurrence of one or more of these events could have a material and adverse effect on our operations, financial condition and reputation. We cannot assure you that having been subject to bankruptcy protection will not adversely affect our operations in the future.
Certain provisions of our certificate of incorporation and our bylaws may make it difficult for stockholders to change the composition of our Board and may discourage, delay or prevent a merger or acquisition that some stockholders may consider beneficial.
Certain provisions of our CertificateArticles of Incorporation and our Bylaws may have the effect of delaying or preventing changes in control if our Board determines that such changes in control are not in the best interests of the Company and our stockholders. The provisions in our Certificate of Incorporation and Bylaws include, among other things, those that:
authorize our Board to issue preferred stock and to determine the price and other terms, including preferences and voting rights, of those shares without stockholder approval;
establish advance notice procedures for nominating directors or presenting matters at stockholder meetings; and
limit the persons who may call special meetings of stockholders.
While these provisions have the effect of encouraging persons seeking to acquire control of the Company to negotiate with our Board, they could enable the Board to hinder or frustrate a transaction that some, or a majority, of the stockholders may believe to be in their best interests and, in that case, may prevent or discourage attempts to remove and replace incumbent directors. These provisions may frustrate or prevent any attempts by our stockholders to replace or remove our current management by making it more difficult for stockholders to replace members of our Board, which is responsible for appointing the members of our management.

Our Articles of Incorporation designate the U.S. Direct Court for the Eastern District of Virginia or the federal district courts for the United States of America as the sole and exclusive forum for certain types of actions and proceedings that may be initiated by our shareholders, which could limit our shareholders’ ability to obtain a favorable judicial forum for disputes with us or our directors, officers, or other employees.

Our Articles of Incorporation provide that, to the fullest extent required by law, the U.S. District Court for the Eastern District of Virginia, (or, if U.S. District Court for the Eastern District of Virginia lacks subject matter jurisdiction, another state or federal court located within the Commonwealth of Virginia) is the sole and exclusive forum for (i) any derivative action or proceeding brought on behalf of the Company, (ii) any action asserting a claim of breach of a fiduciary duty owed by any director, officer or other employee of the Company to the Company or the Company’s shareholders, (iii) any action asserting a claim arising pursuant to any provision of the Virginia Stock Corporation Act or (iv) any action asserting a claim governed by the internal affairs doctrine. Furthermore, under our Articles of Incorporation, the federal district courts for the United States of America are the sole and exclusive forum for causes of action arising under the Securities Act.
Any person or entity purchasing or otherwise acquiring any interest in shares of our capital stock is deemed to have received notice of and consented to the foregoing forum selection provision. This provision may limit our shareholders’ ability to bring a claim in a judicial forum that they find favorable for disputes with us or our directors, officers, or other employees, which may discourage such lawsuits. Alternatively, if a court were to find this choice of forum provision inapplicable to, or unenforceable in respect of, one or more of the specified types of actions or proceedings, we may incur additional costs associated with resolving such matters in other jurisdictions, which could adversely affect our business, financial condition, prospects, or results of operations.
The market price of our common stockClass A Common Stock is subject to volatility.
The market price of our common stockClass A Common Stock could be subject to wide fluctuations in response to, and the level of trading of our common stockClass A Common Stock may be affected by, numerous factors, many of which are beyond our control. These factors include, among other things, our limited trading volume, the concentration of holdings of our common stock,Class A Common Stock, actual or anticipated variations in our operating results and cash flow, the nature and content of our earnings releases, announcements or events that impact our products, customers, competitors or markets, business conditions in our markets and the general state of the securities markets and the market for energy-related stocks, as well as general economic and market conditions and other factors that may affect our future results, including those described in this report. Significant sales of our common stock,Class A Common Stock, or the expectation of these sales, by significant shareholders, officers or directors could materially and adversely affect the market price of our common stock.Class A Common Stock.

40


Our business and the trading prices of our securities could be negatively affected as a result of actions of so-called “activist” shareholders, and such activism could impact the trading value of our securities.
Shareholders may from time to time attempt to effect changes, engage in proxy solicitations or advance shareholder proposals. Activist shareholders may make strategic proposals, suggestions or requested changes concerning our operations, strategy, management, assets or other matters. If we become the subject of activity by activist shareholders, responding to such actions could be costly and time-consuming, diverting the attention of our management and employees. Furthermore, activist campaigns can create perceived uncertainties as to our future direction, strategy, or leadership and may result in the loss of potential business opportunities and cause our stock price to experience periods of volatility.
There may be future sales or other dilution of our equity, which may adversely affect the market price of our common stock.
We are not restricted from issuing additional common stock, including securities that are convertible into or exchangeable for, or that represent a right to receive, common stock. Any issuance of additional shares of our common stock or convertible securities will dilute the ownership interest of our common stockholders. Sales of a substantial number of shares of our common stock or other equity-related securities in the public market, or the perception that these sales could occur, could depress the market price of our common stock and impair our ability to raise capital through the sale of additional equity securities. We cannot predict the effect that future sales of our common stock or other equity-related securities would have on the market price of our common stock.
As of March 3, 2023, Juniper beneficially owned 22,548,998 shares of our Class B Common Stock and 22,548,998 common units in our Up-C partnership subsidiary, which are redeemable or exchangeable for 22,548,998 shares of our Class A Common Stock at the election of the holder for no additional consideration or, at our option, for cash. Juniper may decide to reduce its investment in the Company at any time. Pursuant to the Investor and Registration Rights Agreement with Juniper, at their election, we are required to assist them in a secondary offering of the sale of their securities. Any such sales of Class A Common Stock by Juniper, or expectations thereof, could have the effect of depressing the market price for our Class A Common Stock.
Item 1B
Unresolved Staff Comments
We cannot assure you that we will pay dividends on our Class A Common Stock, and our indebtedness could limit our ability to pay future dividends on our Class A Common Stock.
We declared cash dividends on our Class A Common Stock in the third and fourth quarters of 2022. Any determination to pay dividends to holders of our Class A Common Stock in the future will be subject to applicable law and at the discretion of our Board of Directors and will depend upon many factors, including our financial condition, results of operations, projections, liquidity, earnings, legal requirements, covenant compliance, restrictions in our existing and any future debt agreements and other factors that our board of directors deems relevant. Our financing arrangements, including the Credit Facility, place certain direct and indirect restrictions on our ability to pay cash dividends. Therefore, there can be no assurance that we will pay any dividends to holders of our Class A Common Stock or as to the amount of any such dividends, and we may cease such payments at any time in the future. In addition, our historical results of operations, including cash flows, are not indicative of future financial performance, and our actual results of operations could differ significantly from our historical results of operations. We have not adopted, and do not currently expect to adopt, a separate written dividend policy.
Item 1B. Unresolved Staff Comments
None.

27Item 2. Properties


Item 2
Properties
As of December 31, 2019,2022, our oil and gas assets were located in Gonzales, Lavaca, Fayette and Dewitt Counties in South Texas.
Facilities
Our corporate headquarters andis located in Houston, Texas. We also lease field office facilities are leasednear our oil and we believe that they are adequate for our current needs.gas assets in South Texas.
Title to Oil and Gas Properties
Prior to completing an acquisition of producing oil and gas assets, we review title opinions on all material leases. As is customary in the oil and gas industry,industry; however, we make a cursory review of title when we acquire farmout acreage or undeveloped oil and gas leases. Prior to the commencement of drilling operations, a thorough title examination is conducted. To the extent the title examination reflects defects, we cure such title defects. If we are unable to cure any title defect of a nature such that it would not be prudent to commence drilling operations on a property, we could suffer a loss of our investment in the property. Our oil and gas properties are subject to customary royalty interests, liens for debt obligations, current taxes and other burdens that we believe do not materially interfere with the use or materially affect the value of such properties. We believe that we have satisfactory title to all of our properties and the associated oil and gas in accordance with standards generally accepted in the oil and gas industry.
41


Summary of Oil and Gas Reserves
Proved Reserves
The following tables summarize certain information regarding our estimated proved reserves as of December 31 for each of the years presented:
Crude OilNGLsNatural
Gas
Oil
Equivalents
Standardized
Measure
PV-10 1
Crude Oil NGLs 
Natural
Gas
 
Oil
Equivalents
 
Standardized
Measure
 
PV10 1
(MMbbl)(MMbbl)(Bcf)(MMboe)$ in millions$ in millions
(MMBbl) (MMBbl) (Bcf) (MMBOE) $ in millions $ in millions
2019 


20222022     
Developed      
    Developed
Producing40.1
 8.7
 41.0
 55.6
    Producing68.0 18.3 102.1 103.4 
Non-producing0.5
 0.2
 0.8
 0.8
    Non-producing1.9 0.8 4.5 3.4 
40.6
 8.9
 41.8
 56.4
    69.9 19.1 106.6 106.8 
Undeveloped58.3
 10.3
 48.6
 76.7
    Undeveloped99.3 25.3 138.5 147.7 
98.9
 19.2
 90.4
 133.1
 $1,488.9
 $1,600.1
169.2 44.4 245.1 254.5 $4,848.3 $5,554.6 
           
Price measurement used$55.67/Bbl
 $13.36/Bbl
 $2.58/MMBtu
      Price measurement used$93.67/bbl$35.42/bbl$6.36/MMBtu
           
2018


20212021
Developed           Developed
Producing35.2
 6.3
 31.8
 46.8
    Producing59.9 16.4 94.0 92.0 
Non-producing


    Non-producing0.1 — — 0.1 
35.2
 6.3
 31.8
 46.8
    60.0 16.4 94.0 92.1 
Undeveloped54.5
 11.7
 59.7
 76.2
    Undeveloped103.1 23.6 131.2 148.6 
89.7
 18.0
 91.5
 123.0
 $1,623.9
 $1,769.4
163.1 40.0 225.2 240.7 $3,057.2 $3,418.7 
           
Price measurement used$65.56/Bbl
 $23.60/Bbl
 $3.10/MMBtu
      Price measurement used$66.57/bbl$22.99/bbl$3.60/MMBtu
           
2017           
20202020
Developed           Developed
Producing22.4
 4.9
 27.2
 31.8
    Producing36.4 8.0 37.6 50.6 
Non-producing


    Non-producing— — — — 
22.4
 4.9
 27.2
 31.8
    36.4 8.0 37.6 50.6 
Undeveloped33.4
 4.0
 20.1
 40.8
    Undeveloped62.1 7.6 36.1 75.8 
55.8
 8.9
 47.3
 72.6
 $590.5
 $609.0
98.5 15.6 73.7 126.4 $650.3 $657.5 
           
Price measurement used$51.34/Bbl
 $18.48/Bbl
 $2.98/MMBtu
      Price measurement used$39.54/bbl$7.51/bbl$1.99/MMBtu

1 PV10PV-10 represents a non-GAAP measure that is most directly comparable to the Standardized Measure as defined in GAAP. The Standardized Measure represents the discounted future net cash flows from our proved reserves after future income taxes discounted at 10% in accordance with SEC criteria. PV10PV-10 represents the Standardized Measure without regard to income taxes.taxes of $706.3 million, $361.5 million and $7.2 million for 2022, 2021 and 2020, respectively. We believe that PV10PV-10 is a meaningful supplemental disclosure to the Standardized Measure as the PV10PV-10 concept is widely used within the industry and by the financial and investment community to evaluate the proved reserves on a comparable basis across companies without regard to the individual owner’s unique income tax position. We utilize PV10PV-10 to evaluate the potential return on investment in our oil and gas properties as well as evaluating properties for potential purchases and sales.


A discussion and analysis of the changes in our total proved reserves and price measurements used is provided in Supplemental“Supplemental Information on Oil and Gas Producing Activities (Unaudited)” included in Part II, Item 8, “Financial Statements and Supplementary Data.”

42


Proved Undeveloped Reserves
The proved undeveloped reserves included in our reserve estimates relate to wells that are forecasted to be drilled within the next five years. The following table sets forth the changes in our proved undeveloped reserves during the year ended December 31, 2019:2022:
Crude OilNGLsNatural GasOil Equivalents
(MMbbl)(MMbbl)(Bcf)(MMboe)
Proved undeveloped reserves at beginning of year103.1 23.6 131.2 148.6 
Revisions of previous estimates(33.6)(6.9)(39.8)(47.1)
Extensions and discoveries43.6 12.1 66.4 66.7 
Purchase of reserves2.0 0.4 1.8 2.7 
Conversion to proved developed reserves(15.8)(3.9)(21.1)(23.2)
Proved undeveloped reserves at end of year99.3 25.3 138.5 147.7 
 Crude Oil NGLs Natural Gas Oil Equivalents
 (MMBbl) (MMBbl) (Bcf) (MMBOE)
Proved undeveloped reserves at beginning of year54.5
 11.8
 59.7
 76.2
Revisions of previous estimates(22.7) (4.6) (26.5) (31.8)
Extensions and discoveries37.4
 6.3
 29.7
 48.7
Purchase of reserves0.6
 
 0.2
 0.7
Conversion to proved developed reserves(11.5) (3.2) (14.5) (17.1)
Proved undeveloped reserves at end of year58.3
 10.3
 48.6
 76.7
The marginal increase inIn 2022, our proved undeveloped reserves overdecreased less than 1% primarily due to the quantities atconversion to proved developed reserves from the end2022 drilling program and negative revisions which was offset by inventory optimization on existing acreage and acquisitions. The optimization on existing acreage resulted in an increase to extensions and discoveries of 2018 is66.7 MMboe and the acquisitions increased reserves by 2.7 MMboe that was slightly offset by 34.3 MMboe of negative revisions due primarily to substantial changes in our development plans from the southeast portion of our acreage position in the Eagle Ford to the central region. The overall shift to this region will allow us to develop wells with a lower gas content than what we experienced in the southeast region through the first half of 2019. After achieving more favorable results with certain wells in the central region, we proceeded to drill a total of 11 gross wells, or approximately 23 percent ofthat are now beyond our total wells drilled and completed in 2019, in the central region that were not considered proved undeveloped locations at the end of 2018. Accordingly, we have prioritized our drilling schedule to exploit these more favorable opportunities. While we still believe that the southeastern sites have economic merit, despite a higher gas content, we have deferred drilling them beyond the five-year window which results in revisions due to timing. Accordingly, our current five-year drilling plan is substantially weighted to the lower gas content central region.
The aforementioned shift in regional focus is reflected in the changes as follows: we experienced net negativewindow schedule. In addition, our revision of previous estimates reflect: (i) unfavorable revisions of 31.8 MMBOE including: (i) 32.1 MMBOE due to the loss of certain locations resulting from changes in the drilling locations and timing3.7 MMboe attributable to our development plans as discussed above,performance and pricing, (ii) reductionsunfavorable revisions of 9.1 MMboe attributable to changes in lateral lengths and net revenue interests of 1.7 MMBOEtype curves, and (iii) declines in pricing23.2 MMboe transferred out of 1.0 MMBOE partially offset by (iv) 3.0 MMBOE due to improved performance from treatable lateral lengths in certain locations. Extensions and discoveries of 48.7 MMBOE are substantially attributable to a regional shift in our development plan, the creation of additional extended reach lateral locations and our recent leasing activities. We acquired 0.7 MMBOE in connection with the acquisition of certain non-operating partners’ working interests in locations in which we are the operator. In addition, we converted 17.1 MMBOE from proved undeveloped to proved developed reserves indue to the Eagle Ford. 2022 drilling program.
During 2019,2022, we incurred capital expenditures of approximately $254$398.3 million attributable to 38drilling and completing 51 gross (33.9(42.8 net) wells in connection with the conversion of proved undeveloped reserves to proved developed reserves. Our conversion rates for quantities of proved undeveloped reserves were 22 percent, 33 percent16%, 16% and 21 percent12% in 2019, 20182022, 2021 and 2017,2020, respectively. The conversion rate decline experienced in 20192020 was adversely impacted by the aforementioned shifttemporary suspension of our drilling and completion program from April through September of 2020 in response to the focus ofeconomic downturn associated with the development plan during 2019.global COVID-19 pandemic.
Preparation of Reserves Estimates and Internal Controls
The proved reserve estimates were prepared by DeGolyer and MacNaughton, Inc., our independent third party petroleum engineers. For additional information regarding estimates of proved reserves and other information about our oil and gas reserves, see Supplemental“Supplemental Information on Oil and Gas Producing Activities (Unaudited)” in our Notesnotes to the Consolidated Financial Statementsconsolidated financial statements included in Part II, Item 8, “Financial Statements and Supplementary Data” and the report of DeGolyer and MacNaughton, Inc., dated February 19, 2020,2, 2023, which is included as an Exhibit to this Annual Report on Form 10-K. We did not file any reports during the year ended December 31, 2019 with any federal authority or agency with respect to our estimate of oil and gas reserves.
Our policies and practices regarding the recording of reserves are structured to objectively and accurately estimate our oil and gas reserve quantities and present values in compliance with the SEC’s regulations and GAAP. Our Senior Vice President, EngineeringChief Operating Officer is primarily responsible for overseeing the preparation of the reserve estimate by DeGolyer and MacNaughton, Inc. Our Senior Vice President, EngineeringChief Operating Officer has over 3026 years of industry experience in the estimation and evaluation of reserve information, holds a B.S. degree in Petroleum Engineering from Texas A&M Universitythe Colorado School of Mines and is licensedregistered by the StateStates of TexasColorado and Wyoming as a ProfessionalPetroleum Engineer. Our internal controls over reserve estimates include reconciliation and review controls, including an independent internal review of assumptions used in the estimation. In addition to conducting these internal reviews and external reserves audits, we also have a Reserves Committee that consists of four independent members of our Board of Directors. This committee provides additional oversight of our reserves estimation and certification process.


There are numerous uncertainties inherent in estimating quantities of reserves and in projecting future rates of production and timing of development expenditures, including many factors beyond our control. For additional information about the risks inherent in our estimates of proved reserves, see Part I, Item 1A, “Risk Factors.”
Qualifications of Third Party Petroleum Engineers
The technical person primarily responsible for review of our reserve estimates at DeGolyer and MacNaughton, Inc. meets the requirements regarding qualifications, independence, objectivity and confidentiality set forth in the Standards Pertaining to the Estimating and Auditing of Oil and Gas Reserves Information promulgated by the Society of Petroleum Engineers. DeGolyer and MacNaughton, Inc. is an independent firm of petroleum engineers, geologists, geophysicists and petrophysicists; they do not own an interest in our properties and are not employed on a contingent fee basis.
43


Oil and Gas Production, Production Prices and Production Costs
In the tables that follow, we have presented our former operations in the Mid-Continent, which were sold in 2018, as “Divested properties.” The sale of those operations represented a complete divestiture and we have retained no interests therein.
Oil and Gas Production by Region
The following tables set forth by region our total production and average daily production for the periods presented:
  Year Ended December 31,
Region 2019 2018 2017
  (MBOE) 
South Texas 10,121
 7,780
 3,487
Mid-Continent 1
 
 165
 292
  10,121
 7,944
 3,779
       
  Average Daily Production
  Year Ended December 31,
Region 2019 2018 2017
  (BOEPD) 
South Texas 27,730
 21,314
 9,553
Mid-Continent 1
 
 451
 800
  27,730
 21,765
 10,353

1 Mid-Continent operations were sold on July 31, 2018.

Production Prices and Production Costs
The following table sets forth the average sales prices per unit of volume and our average production costs, not including ad valorem and production/severance taxes, per unit of productionsales volume for the periods presented:
  Year Ended December 31,
  2019 2018 2017
Average prices:      
Crude oil ($ per Bbl) $58.33
 $66.23
 $50.96
NGLs ($ per Bbl) $11.13
 $20.99
 $19.25
Natural gas ($ per Mcf) $2.51
 $3.08
 $2.89
Aggregate ($ per BOE) $46.34
 $55.33
 $42.20
Average production and lifting cost ($ per BOE):      
Lease operating $4.26
 $4.52
 $5.76
Gathering processing and transportation 2.29
 2.34
 2.84
  $6.55
 $6.86
 $8.60


Significant Fields
Our properties in the Eagle Ford in South Texas, which contain primarily crude oil reserves, represented all of our total equivalent proved reserves as of December 31, 2019.
The following table sets forth certain information with respect to this field for the periods presented:
 Year Ended December 31,
 2019 2018 2017
Production:   
  
Crude oil (MBbl)7,453
 6,050
 2,716
NGLs (MBbl)1,491
 944
 418
Natural gas (MMcf)7,067
 4,713
 2,120
Total (MBOE)10,121
 7,780
 3,487
Percent of total company production100% 98% 92%
Average prices:     
Crude oil ($ per Bbl)$58.33
 $66.24
 $51.08
NGLs ($ per Bbl)$11.13
 $21.10
 $18.13
Natural gas ($ per Mcf)$2.51
 $3.16
 $2.95
Aggregate ($ per BOE)$46.34
 $55.99
 $43.74
Average production and lifting cost ($ per BOE):     
Lease operating$4.26
 $4.47
 $5.79
Gathering processing and transportation2.29
 2.27
 2.49
 $6.55
 $6.74
 $8.28

 Year Ended December 31,
202220212020
Sales volume:  
Crude oil (Mbbl)10,668 7,711 6,829 
NGLs (Mbbl)2,205 1,326 1,165 
Natural gas (MMcf)12,100 6,712 5,360 
Total (Mboe)14,890 10,155 8,887 
Average prices:
Crude oil ($/bbl)$94.04 $67.09 $36.86 
NGLs ($/bbl)$30.59 $25.23 $7.68 
Natural gas ($/Mcf)$5.86 $3.89 $1.88 
Aggregate ($/boe)$76.67 $56.80 $30.47 
Average production and lifting cost ($/boe):
Lease operating$5.76 $4.47 $4.22 
Gathering processing and transportation2.46 2.33 2.48 
$8.22 $6.80 $6.70 
Drilling and Other Exploratory and Development Activities
The following table sets forth the gross and net development wells that we drilled,completed and turned in line (regardless of when drilling was initiated), all of which were in the Eagle Ford in South Texas, during the years ended December 31, 2019, 2018 and 2017, respectively,indicated and wells that were in progress at the end of each year. There were no exploratory wells drilled in any of the years presented. The number of wells drilled refers to the number of wells completed at any time during the year, regardless of when drilling was initiated. 
2019 2018 2017 202220212020
Gross Net Gross Net Gross Net GrossNetGrossNetGrossNet
Development 


Development      
Productive48
 43.3
 53
 45.5
 29
 16.9
Productive59 49.9 46 40.4 23 20.6 
Dry well 1


 1
 0.7
Dry holeDry hole— — — — — — 
Total48
 43.3
 53
 45.5
 30
 17.6
Total59 49.9 46 40.4 23 20.6 
           
Wells in progress at end of year 2
8
 7.3
 11
 10.2
 11
 8.2
Wells in progress at end of year 1
15 13.6 12 10.4 6.3 

1 Represents the Zebra Hunter 05H well in the northern portion of our Eagle Ford acreage.
2 Includes three6 gross (2.6(5.4 net) wells completing, two4 gross (1.9(3.9 net) wells waiting on completion and three5 gross (2.8(4.3 net) wells being drilled as of December 31, 2019.2022.

44


Present Activities
As of December 31, 2019, we had eightMarch 3, 2023, 5 gross (7.3 net) wells in progress. As of February 21, 2020, two gross (1.9(4.3 net) wells were completing and seven11 gross (5.5(10.0 net) wells were in progress.
Delivery Commitments
We generally sell our crude oil, NGL and natural gas products using short-term floating price physical and spot market contracts. We have commitments to provide minimum deliveries of crude oil of 8,000 BOPD (gross) in our South Texas regiongross barrels of oil per day through February 2031 under a gathering agreement and through February 2026 under a transportation agreementsagreement with Nuevo Dos Gathering and Transportation,Ironwood Shiner Pipeline, LLC, and Nuevo Dosthrough April 2026 under a marketing agreement with Ironwood Shiner Marketing, LLC. Our production and reserves are currently sufficient to fulfill the current 8,000 BOPDbarrels of oil per day delivery commitment under these agreements.


See Note 14 to our consolidated financial statements included in Part II, Item 8, “Financial Statements and Supplementary Data” for additional information related to these commitments.
Productive Wells
The following table sets forth our productive wells in which we had a working interest as of December 31, 2019:2022:
  Primarily Oil Primarily Natural Gas Total
  Gross Net Gross Net Gross Net
Total productive wells 509
 429.1
 1
 1.0
 510
 430.1
 Oil WellsNatural Gas WellsTotal
GrossNetGrossNetGrossNet
Total productive wells910 795.8 66 61.4 976 857.2 
Of the total wells presented in the table above, we are the operator of 498942 gross (497(877 oil and one65 natural gas) and 428.2848.8 net (427.2(787.8 oil and 1.061.0 natural gas) wells. In addition to the above working interest wells, we own overriding royalty interests in 1835 gross wells.
Acreage
The following table sets forth our developed and undeveloped acreage as of December 31, 20192022 (in thousands):
  Developed  Undeveloped  Total 
  Gross  Net  Gross  Net  Gross  Net 
Total acreage 91.4
 79.7
 8.8
 7.7
 100.2
 87.4
Developed Undeveloped Total 
Gross Net Gross Net Gross Net 
Total acreage124.5106.964.455.2188.9162.1
The primary terms of our leases generally range from three to five years, and we do not have any concessions. As of December 31, 2019,2022, our net undeveloped acreage is scheduled to expire as shown in the table below, unless the primary lease terms are, where appropriate, extended, HBP or otherwise changed (in thousands):
  2020 2021 2022 Thereafter
Expirations by year 4.8 0.9 2.0 0.0
202320242025Thereafter
Expirations by year2.92.42.0
We anticipate paying options to extend a substantial portion of the acreage scheduled to expire in 2020.2023. We do not believe that the remaining scheduled expirations of our undeveloped acreage will substantially affect our ability or plans to conduct our exploration and development activities.
Item 3Legal Proceedings
Item 3. Legal Proceedings
See Note 14 to our Consolidated Financial Statementsconsolidated financial statements included in Part II, Item 8, “Financial Statements and Supplementary Data.” We are not aware of any material legal or governmental proceedings against us, or threatened to be brought against us, under the various environmental protection statutes to which we are subject.
Item 4Mine Safety Disclosures
Item 4. Mine Safety Disclosures
Not applicable.

45
32


Part II
 Item 5Market for Registrant’s Common Equity, Related Stockholder Matters and Issuer Purchases of Equity Securities
Item 5. Market for Registrant’s Common Equity, Related Stockholder Matters and Issuer Purchases of Equity Securities
Market Information
SinceFrom December 28, 2016 through October 18, 2021, our common stock has beenwas listed and traded on the Nasdaq under the symbol “PVAC.” In October 2021, we changed our name from Penn Virginia Corporation to Ranger Oil Corporation and our Class A Common Stock began trading under the symbol “ROCC” on October 18, 2021.
Equity Holders
As of February 13, 2020,March 3, 2023, there were 111239 record holders of our common stock.Class A Common Stock and two record holders of our Class B Common Stock. There is no public market for our Class B Common Stock.
Dividends
In the third and fourth quarter of 2022, cash dividends of $0.075 per outstanding share were paid to the holders of our Class A Common Stock and a corresponding distribution was made to holders of Partnership Common Units. We have not paid nor do we currently have plansfunded all such dividends and corresponding distributions with available working capital and cash provided by operating activities. On March 3, 2023, the Company’s Board of Directors declared a cash dividend of $0.075 per share of Class A Common Stock, payable on March 30, 2023 to pay any cashholders of record of Class A Common Stock as of the close of business on March 17, 2023. We intend to continue paying dividends on our common stock inClass A Common Stock; however, the foreseeable future. Furthermore, wedeclaration of any future cash dividends and, if declared, the amount of any such dividends, will be subject to our financial condition, earnings, capital requirements, financial covenants, applicable law and other factors our board of directors deems relevant. Further, there are limited inrestrictions on our ability to pay dividends set forth under the Credit Facility and the Second Lien Facility.Indenture.
Securities Authorized for Issuance Under Equity Compensation Plans
See Part III, Item 12, “Security Ownership of Certain Beneficial Owners and Management and Related Stockholder Matters” and Note 16 to our Consolidated Financial Statementsconsolidated financial statements included in Part II, Item 8, “Financial Statements and Supplementary Data” for information regarding shares of common stock authorized for issuance under our stock compensation plans.
Issuer Purchases of Equity Securities
We did notThe following table summarizes our repurchase any shares of our common stock inequity securities during the fourth quarter of 2019.2022:

PeriodTotal Number of Shares RepurchasedAverage Price Paid Per UnitTotal Number of Shares Purchased as Part of Publicly Announced Plans or Programs
Approximate Dollar Value of Shares That May Yet be Purchased Under the Publicly Announced Plans or Programs 1
October 1, 2022 - October 31, 2022316,917 $37.54 316,917$68,069,313 
November 1, 2022 - November 30, 202274,733$41.64 74,733$64,957,122 
December 1, 2022 - December 31, 20223,000$38.48 3,000$64,841,686 
Total394,650$38.32 394,650$64,841,686 
_______________________
1    On April 13, 2022, our Board of Directors approved a share repurchase program, under which the Company was authorized to repurchase up to $100 million of its outstanding Class A Common Stock through March 31, 2023. On July 7, 2022, the Board of Directors authorized an increase in the share repurchase program from $100 million to $140 million and extended the term of the program through June 30, 2023. The shares may be repurchased from time to time in open market transactions, through privately negotiated transactions, or by other means in accordance with federal securities laws. The timing, as well as the number and value of shares repurchased under the program, will be determined by the Company at its discretion and will depend on a variety of factors, including among other things, our earnings, liquidity, capital requirements, financial condition, management’s assessment of the intrinsic value of the Class A Common Stock, the market price of the Company's Class A Common Stock, general market and economic conditions, available liquidity, compliance with the Company’s debt and other agreements, applicable legal requirements and other factors deemed relevant and may be discontinued at any time. We do not intend to repurchase additional shares pending closing of the Baytex Merger.
46


Performance Graph
The following graph compares our cumulative total shareholder return with the cumulative total return of the Standard & Poor’s 600 Oil & Gas Exploration and Production Index and the Standard & Poor’s SmallCap 600 Index for the period from November 15, 2016 (the date that our common shares became publicly tradeable)December 31, 2017 through December 31, 2019. As of December 31, 2019, there were seventeen exploration and production companies in the Standard & Poor’s 600 Oil & Gas Exploration and Production Index: Bonanza Creek Energy Inc., Callon Petroleum Company, Denbury Resources Inc., Gulfport Energy Corporation, Highpoint Resources Corporation, Jagged Peak Energy, Laredo Petroleum Inc., Oasis Petroleum Inc., PDC Energy Inc., QEP Resources Inc., Range Resources Corporation, Ring Energy Inc., SM Energy Co., Southwestern Energy Company, SRC Energy Inc., Talos Energy Inc. and Whiting Petroleum Corp.2022. The graph assumes that the value of the investment in our common stock, in each index, and in the peer group (including reinvestment of dividends) was $100 ison December 31, 2017 and tracks it through December 31, 2022.

pva-20221231_g2.jpg
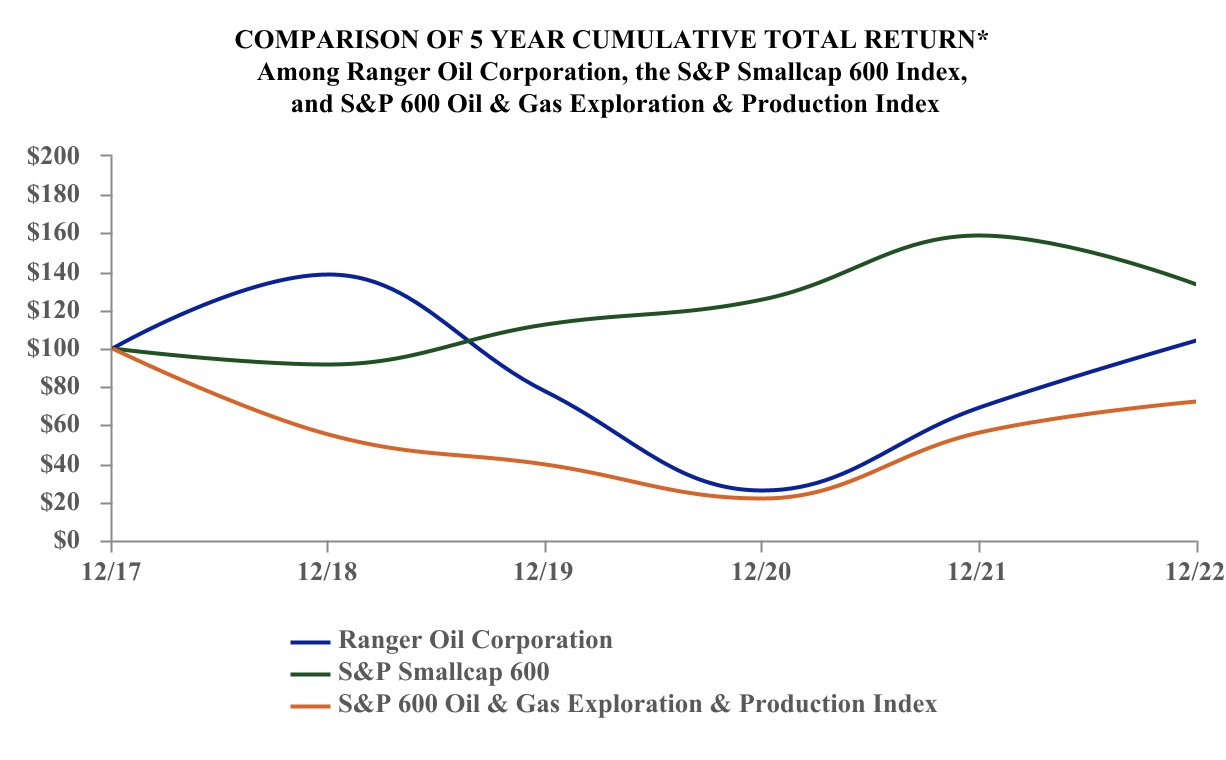
*$100 invested on November 15, 201612/31/17 in us and eachstock or index, at November 15, 2016 closing prices.including reinvestment of dividends.
stockperformancea02.jpgFiscal year ending December 31.
The following table represents the actual data points for the dates indicated on the graph above:
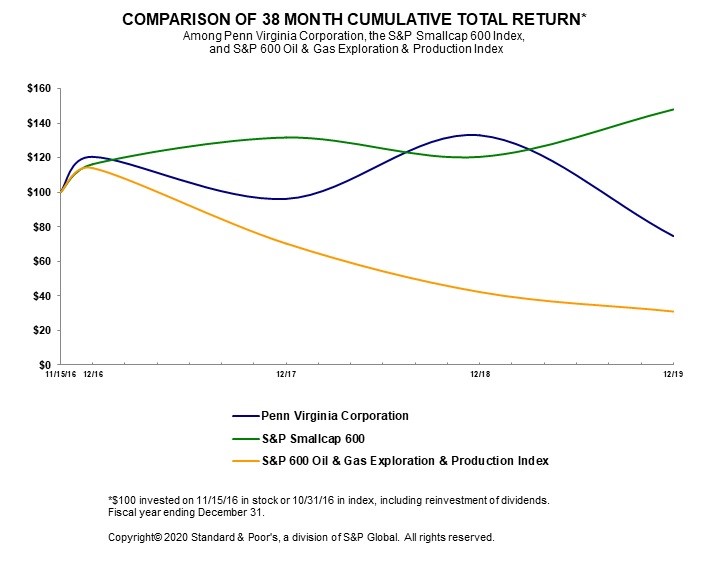
Copyright© 2023 Standard & Poor's, a division of S&P Global. All rights reserved.

Item 6. [Reserved]

47
 November 15, December 31,
 2016 2016 2017 2018 2019
Penn Virginia Corporation$100.00
 $120.62
 $96.27
 $133.07
 $74.71
S&P SmallCap 600 Index$100.00
 $116.34
 $131.74
 $120.56
 $148.03
S&P 600 Oil & Gas Exploration & Production Index$100.00
 $114.11
 $70.37
 $42.30
 $31.04


34


Item 6Selected Financial Data
The following selected historical financial and operating information was derived from our Consolidated Financial Statements. The selected financial data should be read in conjunction with Part II, Item 7, “Management’s Discussion and Analysis of Financial Condition and Results of Operations,” and our Consolidated Financial Statements and the accompanying Notes and Supplementary Data in Part II, Item 8, “Financial Statements and Supplementary Data.”
 (in thousands, except per share amounts, production and reserves)
 
Successor 1
  
Predecessor 1
       September 13  January 1  
 Year Ended Through  Through Year Ended
 December 31, December 31,  September 12, December 31,
 2019 2018 2017 2016  2016 2015
Statements of Operations and Other Data:       
   
  
Revenues 2
$471,216
 $440,832
 $160,054
 $39,003
  $94,310
 $305,298
Operating income (loss) 3
$176,821
 $208,755
 $51,872
 $11,413
  $(20,867) $(1,564,976)
Net income (loss) 4
$70,589
 $224,785
 $32,662
 $(5,296)  $1,054,602
 $(1,582,961)
Preferred stock dividends$
 $
 $
 $
  $5,972
 $22,789
Income (loss) attributable to common shareholders$70,589
 $224,785
 $32,662
 $(5,296)  $1,048,630
 $(1,605,750)
Income (loss) per common share, basic$4.67
 $14.93
 $2.18
 $(0.35)  $11.91
 $(21.81)
Income (loss) per common share, diluted$4.67
 $14.70
 $2.17
 $(0.35)  $8.50
 $(21.81)
Weighted-average shares outstanding:          
  
Basic15,110
 15,059
 14,996
 14,992
  88,013
 73,639
Diluted15,126
 15,292
 15,063
 14,992
  124,087
 73,639
Dividends declared per share$
 $
 $
 $
  $
 $
             
Cash provided by operating activities$320,194
 $272,132
 $81,710
 $30,774
  $30,247
 $169,303
Cash paid for capital expenditures$362,743
 $430,592
 $115,687
 $4,812
  $15,359
 $364,844
             
Total production (MBOE)10,121
 7,944
 3,779
 1,039
  3,346
 7,923
             
 December 31,  September 12, December 31,
 2019 2018 2017 2016  2016 2015
Balance Sheet and Other Data:            
Property and equipment, net$1,120,425
 $927,994
 $529,059
 $247,473
  $253,510
 $344,395
Total assets$1,218,238
 $1,068,954
 $629,597
 $291,686
  $333,974
 $517,725
Total debt$555,028
 $511,375
 $265,267
 $25,000
  $75,350
 $1,224,383
Shareholders’ equity (deficit)$520,745
 $447,355
 $221,639
 $185,548
  $190,895
 $(915,121)
             
Actual shares outstanding at period-end15,136
 15,081
 15,019
 14,992
  14,992
 81,253
Proved reserves as of December 31, (MMBOE)133
 123
 73
 49
  N/A
 44

1
Upon our emergence from bankruptcy, we adopted and applied fresh start accounting. Accordingly, our financial statements for periods after September 12, 2016 are not comparable to those prior to that date. Financial information for the periods up to and including September 12, 2016 are referred to herein as those of the “Predecessor” while those beginning on September 13, 2016 and all periods thereafter are referenced as those of the “Successor.”
2
Revenues for the years ended after December 31, 2017 reflect the application of Accounting Standards Codification, or ASC, Topic 606, Revenues from Contracts with Customers, or ASC Topic 606. The adoption of ASC Topic 606 impacts the presentation and comparability of NGL product revenues between the years beginning after December 31, 2017 with those years ending on that date and all prior periods. See “Presentation of Financial Information and Changes in Accounting Principles” included in Part II, Item 7, “Management’s Discussion and Analysis of Financial Condition and Results of Operations” and Note 2 to our Consolidated Financial Statements included in Part II, Item 8, “Financial Statements and Supplementary Data.”
3
Operating income (loss) for the year ended December 31, 2019 reflects the application of ASC Topic 842, Leases, or ASC Topic 842. The adoption of ASC Topic 842 impacts the presentation and comparability of lease expense between the year ended December 31, 2019 with all prior periods. See “Presentation of Financial Information and Changes in Accounting Principles” included in Part II, Item 7, “Management’s Discussion and Analysis of Financial Condition and Results of Operations” and Note 2 to our Consolidated Financial Statements included in Part II, Item 8, “Financial Statements and Supplementary Data.”
3
Net income (loss) and Income (loss) attributable to common shareholders for the year ended December 31, 2018 and the period of January 1 through September 12, 2016 includes reorganization items resulting in income attributable to our bankruptcy proceedings of $3.3 million and $1.1 billion, respectively.


35


Item 7Management’s Discussion and Analysis of Financial Condition and Results of Operations
Item 7. Management’s Discussion and Analysis of Financial Condition and Results of Operations
The following discussion and analysis of our financial condition and results of operations should be read in conjunction with our Consolidated Financial Statementsconsolidated financial statements and Notesnotes thereto included in Part II, Item 8, “Financial Statements and Supplementary Data.” All dollar amounts presented in the tables that follow are in thousands unless otherwise indicated. Also, due to the combination of different units of volumetric measure, and the number of decimal places presented and rounding, certain results may not calculate explicitly from the values presented in the tables.
This section of the Form 10-K discusses the results of operations for the year ended December 31, 2022 compared to the year ended December 31, 2021. On October 5, 2021, the Company acquired Lonestar Resources US Inc., a Delaware corporation (“Lonestar”), as a result of which Lonestar and its subsidiaries became wholly-owned subsidiaries of the Company (the “Lonestar Acquisition”). Results for the periods prior to October 5, 2021 reflect the financial and operating results of Ranger Oil and do not include the financial and operating results of Lonestar. As such, our historical results of operations are not comparable from period to period. The results of operations for the year ended December 31, 2021 compared to the year ended December 31, 2020 that are not included in this Form 10-K are included in “Management’s Discussion and Analysis of Financial Condition and Results of Operations” in Part II, Item 7 of our Annual Report on Form 10-K for the fiscal year ended December 31, 2021.
Overview and Executive Summary
We are an independent oil and gas company engaged infocused on the onshore exploration, development and production of crude oil, NGLs, and natural gas. Our current operations consist of drilling unconventional horizontal development wells and operating our producing wells in the Eagle Ford in Gonzales, Lavaca, Fayette and DeWitt CountiesShale in South Texas.
Key Developments
Proposed Merger with Baytex
On February 27, 2023, we entered into the Merger Agreement for the Baytex Merger. Subject to the terms and conditions of the Merger Agreement, each share of our Class A Common Stock issued and outstanding immediately prior to the effective time of the Baytex Merger (including shares of our Class A Common Stock to be issued in connection with the exchange of the Class B Common Stock and Common Units for Class A Common Stock), will be converted automatically into the right to receive: (i) 7.49 Baytex common shares and (ii) $13.31 in cash. The transaction was unanimously approved by the board of directors of each company and JSTX and Rocky Creek delivered a support agreement to vote their outstanding shares in favor of the Baytex Merger. The Baytex Merger is expected to close late in the second quarter of 2023, subject to the satisfaction of customary closing conditions, including the requisite shareholder and regulatory approvals.
Share Repurchase Program
On April 13, 2022, our Board of Directors approved a share repurchase program, under which the Company was authorized to repurchase up to $100 million of its outstanding Class A Common Stock through March 31, 2023. On July 7, 2022, the Board of Directors authorized an increase in the share repurchase program from $100 million to $140 million and extended the term of the program through June 30, 2023. We do not intend to repurchase additional shares pending closing of the Baytex Merger.
During the year ended December 31, 2022, we repurchased 2,150,486 shares of our Class A Common Stock at a total cost of $75.2 million at an average purchase price of $34.95. Subsequent to December 31, 2022 through March 3, 2023, we repurchased an additional 121,857 shares of our Class A Common Stock at an average price of $39.52 for a total cost of $4.8 million.
See Note 15 to the consolidated financial statements included in Part II, Item 8, “Financial Statements and Supplementary Data” for additional information.
Dividends
On July 7, 2022 and November 2, 2022, the Company’s Board of Directors declared cash dividends of $0.075 per share of Class A Common Stock. The dividends were paid on August 4, 2022 and November 28, 2022 to holders of record of Class A Common Stock as of the close of business on July 25, 2022 and November 16, 2022, respectively. Additionally, on March 3, 2023, the Company’s Board of Directors declared a cash dividend of $0.075 per share of Class A Common Stock payable on March 30, 2023 to holders of record of Class A Common Stock as of the close of business on March 17, 2023.

48


Recent Acquisitions
During 2022, we closed on several acquisitions of oil and gas producing properties in the Eagle Ford Shale, comprised of additional working interests in Ranger-operated wells and adjacent producing assets and undeveloped acreage for aggregate cash consideration totaling $137.5 million, including customary post-closing adjustments.
See Note 4 to the consolidated financial statements included in Part II, Item 8, “Financial Statements and Supplementary Data” for additional information on our acquisitions.
Increased Borrowing Base of Credit Facility
During 2022, the aggregate elected commitment amounts under the Credit Facility increased from $400 million to $500 million and our borrowing base increased to $950 million.
See Note 9 to the consolidated financial statements included in Part II, Item 8, “Financial Statements and Supplementary Data” for additional information on our debt.
Industry Environment and Recent Operating and Financial Highlights
Commodity Price and Other Economic Conditions
CrudeAs an oil and gas development and production company, we are exposed to a number of risks and uncertainties that are inherent to our industry.
There continues to be a high level of uncertainty around the volatility of energy supply and demand. OPEC+ has recently changed its strategy from one which has seen gradually increasing production throughout 2021 and most of 2022 to one of drastically cutting production. In October 2022, OPEC+ announced its intent to decrease output targets by 2 Mbbls per day in November 2022, after increasing output target by 100,000 bbls per day in September 2022 and following the raising of output by 648,000 bbls per day in July and August 2022. Additionally, certain OPEC+ members are pumping below their targeted volumes under the current agreement. At the February 2023 meeting, OPEC+ reaffirmed the output targets agreed to in October 2022 and noted that would remain the policy moving forward in 2023. These shifts in OPEC+ production levels as well as the Russia-Ukraine war and related sanctions, which began in the first quarter of 2022, and continuing impact of the COVID-19 global public health crisis continue to contribute to volatility in commodity prices. During 2022, NYMEX West Texas Intermediate (“NYMEX WTI”) crude oil and NYMEX Henry Hub (“NYMEX HH”) natural gas prices exhibited significant volatility throughout 2019 with a range between high and low pricesranged from highs of approximately $20$123 per barrel. Thisbbl and over $9 per Mcf, respectively, to lows of approximately $71 per bbl and under $4 per Mcf, respectively, due to oil supply shortage concerns and factors discussed above. Higher commodity prices, along with the global supply chain issues and other factors, have increased inflation, which has led or may lead to increased costs of services and certain materials necessary for our operations. Governmental actions to combat inflation, including the Inflation Reduction Act passed into law in August 2022 as well as interest rate hikes by the Federal Reserve and increased recession fears also continue to create pricing and economic volatility in the markets. The ultimate effect of these measures on inflation and overall energy supply and demand is uncertain at this time.
Our crude oil production is sold at a premium or deduct differential to the prevailing NYMEX WTI price. The differential reflects adjustments for location, quality and transportation and gathering costs, as applicable. All of our crude oil volumes are sold under Magellan East Houston (“MEH”) pricing, which historically has continued into Februarybeen at a premium to NYMEX WTI.
Similar to crude prices, natural gas prices remain volatile as a result of 2020the Russia-Ukraine war and other factors discussed above, with NYMEX HH closing as low as $3.45 per Mcf and as high as $9.85 per Mcf during 2022. Subsequently, natural gas prices declined even further during 2023 with NYMEX HH closing as low as $2.08 per Mcf. Natural gas prices vary by region and locality, depending upon the distance to markets, availability of pipeline capacity, and supply and demand relationships in that region or locality. Similar to crude oil, our natural gas sold has included significant swingsa premium or deduct differential to the prevailing NYMEX HH price primarily due to adjustments for location and energy content of the natural gas. Location differentials result from variances in natural gas transportation costs based on a daily basis. the proximity of the natural gas to its major consuming markets that correspond with the ultimate delivery point as well as individual interaction of supply and demand.
A summary of these pricing differentials is provided in the discussion of “Results of Operations – Realized Differentials” that follows.
In addition to the traditional domestic (i.e., significant production from the Permian Basin and mature shale plays including the Eagle Ford, etc.) and global (i.e., Middle East capacity, etc.) supply and demand factors, the impactvolatility of certain geopoliticalcommodity prices, we are subject to inflationary and other dynamicsfactors that have had a significant daily impact on crude oilresulted in higher costs for products, materials and services that we utilize in both our capital projects and with respect to our operating expenses. We continue to work with vendors and other commodity prices as well. For example, Middle East tensions have approached levels with military involvement not experiencedservice providers to secure competitive pricing and fixed pricing terms whenever favorable in many years. In addition,an effort to resist inflationary pressures. However, supply chain constraints may continue and exacerbate inflationary demands in the global economic impact of the coronavirus is continuing to evolve and its uncertainty has been reflected in daily commodity price volatility. While impacting us to a lesser extent, NGL and natural gas pricing has steadily declined from year-end 2018 levels due primarily to excess domestic supply and milder winter weather through January of 2020. Collectively, these trends have had a substantial impact on the rate of growth in our product revenues. These factors are anticipated to maintain downward pressure on commodity prices for the near term.future.
Since February 2019, we have contracted for our drilling rigs on a pad-to-pad basis and the day rates charged for these services as well as casing costs have declined throughout 2019. In addition, costs associated with our dedicated frac services agreement including certain component stimulation product and service costs have also declined in 2019. We anticipate that many of these costs will continue a declining trend into 2020. Costs incurred for most oilfield products and services associated with operating our properties remained relatively stable during 2019 and are anticipated to behave similarly into 2020 with moderate declines in certain costs consistent with recent industry experience.
49


Capital Expenditures, and Development Progress and Production
During 2019,As of December 31, 2022, we operated three drilling rigs and during the year ended December 31, 2022, we incurred capital expenditures of approximately $356$524.6 million, with 97 percentof which $513.9 million was directed to drilling and completion projects. We drilled and completedDuring the fourth quarter 2022, a total of 4816 gross (43.3(14.6 net) wells. In a serieswells were completed and turned to sales. As of transactions,March 3, 2023, we acquired certainturned an additional 12 gross (11.1 net) wells to sales and 5 gross (4.3 net) wells were completing and 11 gross (10.0 net) wells were in progress.
As of our joint venture partners’ working interests in selected properties for whichMarch 3, 2023, we are the operator forhad approximately $6.5 million. Through our drilling program and these acquisitions, we operated a total of 510187,700 gross (430.1(163,800 net) wellsacres in the Eagle Ford asShale, net of December 31, 2019. Through selected acquisitions, certain property exchanges and other transactions, we added or renewedexpirations, of which approximately 3,500 net acres to our Eagle Ford lease portfolio during 2019.95% is held by production.
Sequential Quarterly Analysis
The following summarizes certain key operating and financial highlightsTotal sales volume for the three months ended December 31, 2019 with comparison to the three months ended September 30, 2019 as presented in the table that follows. The year-over-year highlights for 2019 and 2018 are addressed in further detail in the discussions for Financial Condition and Results of Operations that follow.
Daily production increased one percent to 29,314 BOEPD, from 29,003 BOEPD due primarily to the number of wells turned to sales in the second half of 2019. During the fourth quarter 2022 was 4,069 Mboe, or 44,227 boe/d, with approximately 72%, or 2,916 Mbbls, of 2019,sales volume from crude oil, 15% from NGLs and 13% from natural gas.
Commodity Hedging Program
As of March 3, 2023, we turned to sales 11 gross (9.9 net) wells compared to 20 gross (18.3 net) wells turned to sales inhave hedged a portion of our estimated future crude oil, NGL and natural gas production through the thirdsecond quarter of 2019. Of2024. The following table, inclusive of January and February 2023 production months, summarizes our net hedge position for the wells turned to sales in the third quarterperiods presented:
1Q20232Q20233Q20234Q20231Q20242Q2024
NYMEX WTI Crude Swaps
Average Volume Per Day (bbl)2,500 2,400 2,807 2,657 462 462 
Weighted Average Swap Price ($/bbl)$54.40 $54.26 $54.92 $54.93 $58.75 $58.75 
NYMEX WTI Crude Collars
Average Volume Per Day (bbl)24,306 19,918 16,304 8,967 
Weighted Average Purchased Put Price ($/bbl)$68.74 $67.45 $72.50 $72.27 
Weighted Average Sold Call Price ($/bbl)$83.87 $78.70 $88.35 $87.57 
MEH WTI CMA Crude Differential Swaps
Average Volume Per Day (bbl)7,77813,187
Weighted Average Swap Price ($/bbl)$2.03 $2.03 
NYMEX HH Swaps
Average Volume Per Day (MMBtu)10,000 7,500 
Weighted Average Swap Price ($/MMBtu)$3.620 $3.690 
NYMEX HH Collars
Average Volume Per Day (MMBtu)14,617 11,538 11,413 11,413 11,538 11,538 
Weighted Average Purchased Put Price ($/MMBtu)$6.561 $2.500 $2.500 $2.500 $2.500 $2.328 
Weighted Average Sold Call Price ($/MMBtu)$12.334 $2.682 $2.682 $2.682 $3.650 $3.000 
HSC Basis Swaps
Average Volume Per Day (MMBtu)24,617 19,038 11,413 11,413 
HSC Basis Average Fixed Price ($/MMBtu)$(0.153)$(0.153)$(0.153)$(0.153)
OPIS Mt. Belvieu Ethane Swaps
Average Volume per Day (gal)98,901 34,239 34,239 34,615 
Weighted Average Fixed Price ($/gal)$0.2288 $0.2275 $0.2275 $0.2275 

50


Results of 2019, ten gross (9.0 net) wells were turned to sales in late August and September of 2019. Total production increased one percent to 2,697 MBOE from 2,668 MBOE.
Product revenues increased approximately four percent to $123.2 million from $118.4 million due primarily to six percent higher crude oil volume partially offset by one percent lower crude oil prices. NGL revenues were 13 percent higher due to 26 percent higher prices partially offset by 10 percent lower volume. Natural gas revenues declined six percent due to an 11 percent decrease in volume partially offset by a five percent increase in prices.
Production and lifting costs (consisting of LOE and GPT) declined on an absolute and per unit basis to $16.1 million and $5.98 per BOE from $18.5 million and $6.92 per BOE due primarily to lower utility charges, maintenance costs and chemical costs.


Production and ad valorem taxes were relatively consistent on an absolute basis at $7.4 million for each period and declined marginally on per unit basis to $2.74 per BOE from $2.77 per BOE, respectively, due to three percent lower overall product pricing and one percent higher production volume partially offset by the effect of higher estimated valuations for ad valorem tax assessments that were recorded in prior quarters of 2019.
G&A expenses decreased on an absolute and per unit basis to $5.3 million and $1.97 per BOE from $6.9 million and $2.57 per BOE, respectively, due primarily to lower benefits charges as well as lower occupancy and consulting costs.
Our DD&A, decreased on an absolute basis and per unit basis to $44.9 million and $16.64 per BOE from $46.5 million and $17.43 per BOE due primarily to higher reserve quantity estimates.
Our operating income increased to $50.2 million from $40.0 million due to the combined impact of the matters noted in the bullets above.Operations
The following table sets forth certain historical summary operating and financial statistics for the periods presented: 
 (in thousands except per unit measurements, production, wells and reserves)
 Three Months Ended      
 December 31, September 30, Year Ended December 31,
 2019 2019 2019 2018 2017
Total production (MBOE)2,697
 2,668
 10,121
 7,944
 3,779
Average daily production (BOEPD)29,314
 29,003
 27,730
 21,765
 10,353
Crude oil production (MBbl)2,043
 1,937
 7,453
 6,077
 2,764
Crude oil production as a percent of total76% 73% 74% 76% 73%
Product revenues$123,196
 $118,379
 $469,035
 $439,530
 $159,469
Crude oil revenues$115,252
 $110,618
 $434,713
 $402,485
 $140,886
Crude oil revenues as a percent of total94% 93% 93% 92% 88%
Realized prices:         
Crude oil ($ per Bbl)$56.40
 $57.12
 $58.33
 $66.23
 $50.96
NGL ($ per Bbl) 1
$10.74
 $8.54
 $11.13
 $20.99
 $19.25
Natural gas ($ per Mcf)$2.34
 $2.22
 $2.51
 $3.08
 $2.89
Aggregate ($ per BOE)$45.68
 $44.37
 $46.34
 $55.33
 $42.20
Prices, adjusted for derivatives::         
Crude oil ($ per Bbl)$56.50
 $56.90
 $57.78
 $58.28
 $49.69
Aggregate ($ per BOE)$45.75
 $44.21
 $45.93
 $49.25
 $41.27
Production and lifting costs ($ per BOE):         
Lease operating$3.65
 $4.45
 $4.26
 $4.52
 $5.76
Gathering, processing and transportation 1
$2.32
 $2.47
 $2.29
 $2.34
 $2.84
Production and ad valorem taxes ($ per BOE)$2.74
 $2.77
 $2.77
 $2.96
 $2.33
General and administrative ($ per BOE) 2
$1.97
 $2.58
 $2.52
 $3.28
 $4.82
Depreciation, depletion and amortization ($ per BOE)$16.64
 $17.43
 $17.25
 $16.11
 $12.87
Capital expenditure program costs 3
$64,623
 $99,068
 $355,851
 $418,951
 $129,827
Cash provided by operating activities 4
$75,981
 $89,851
 $320,194
 $272,132
 $81,710
Cash paid for capital expenditures 5
$71,010
 $115,792
 $362,743
 $430,592
 $115,687
Cash and cash equivalents at end of period$7,798
 $11,387
 $7,798
 $17,864
 $11,017
Debt outstanding, net of discount and issue costs, at end of period$555,028
 $562,445
 $555,028
 $511,375
 $265,267
Credit available under credit facility at end of period$137,200
 $129,200
 $137,200
 $128,600
 $159,745
Net development wells drilled and completed9.9
 18.3
 43.3
 45.5
 16.9
Proved reserves at the end of the period (MMBOE)133
 N/A
 133
 123
 73
 Three Months EndedYear Ended December 31,
 December 31, 2022September 30, 2022December 31, 202120222021
Total sales volume (Mboe) 1
4,069 3,921 3,702 14,890 10,155 
Average daily sales volume (boe/d) 1
44,227 42,624 40,236 40,793 27,822 
Crude oil sales volume (Mbbl) 1
2,916 2,822 2,532 10,668 7,711 
Crude oil sold as a percent of total 1
72 %72 %68 %72 %76 %
Product revenues$268,455 $304,105 $224,594 $1,141,603 $576,824 
Crude oil revenues$240,397 $262,537 $191,079 $1,003,255 $517,301 
Crude oil revenues as a percent of total90 %86 %85 %88 %90 %
Realized prices:
Crude oil ($/bbl)$82.46 $93.03 $75.48 $94.04 $67.09 
NGLs ($/bbl)$21.75 $31.97 $29.91 $30.59 $25.23 
Natural gas ($/Mcf)$4.53 $7.41 $4.54 $5.86 $3.89 
Aggregate ($/boe)$65.98 $77.55 $60.67 $76.67 $56.80 
Realized prices, including effects of derivatives, net 2
Crude oil ($/bbl)$76.43 $83.14 $64.50 $79.53 $56.15 
NGLs ($/bbl)$21.17 $30.67 $29.91 $29.70 $24.86 
Natural gas ($/Mcf)$2.76 $4.26 $2.99 $3.74 $3.01 
Aggregate ($/boe)$60.15 $67.76 $51.77 $64.42 $47.87 
Production and lifting costs:
Lease operating ($/boe)$6.06 $6.15 $4.38 $5.76 $4.47 
Gathering, processing and transportation ($/boe)$2.27 $2.50 $2.19 $2.46 $2.33 
Production and ad valorem taxes ($/boe)$3.63 $4.26 $3.05 $4.12 $3.06 
General and administrative ($/boe) 3
$2.64 $2.51 $9.57 $2.75 $6.55 
Depreciation, depletion and amortization ($/boe)$17.96 $16.88 $12.97 $16.42 $12.96 

1
The effects of the adoption of ASC Topic 606, if applied to the year ended December 31, 2017, would have resulted in realized prices for NGLs of $16.40 per BOE and GPT of $2.45 per BOE, respectively.
2
Includes combined amounts of $0.36 and $0.39 per BOE
1    All volumetric statistics presented above represent volumes of commodity production that were sold during the periods presented. Volumes of crude oil physically produced in excess of volumes sold are placed in temporary storage to be sold in subsequent periods.
2    Realized prices, including effects of derivatives, net is a non-GAAP measure (see discussion and reconciliation to GAAP measure below in “Results of Operations Effects of Derivativesthat follows).
3    Includes combined amounts of $0.07, $0.48, and $7.57 per boe for the three months ended December 31, 2019 and September 30, 2019, respectively, and $0.48, $1.11 and 1.36 per BOE for the years ended December 31, 2019, 2018 and 2017, respectively, attributable to equity-classified share-based compensation and significant special charges, including acquisition, divestiture and strategic transaction costs, among others costs, as described in the discussion of “Results of Operations - General and Administrative” that follows.
3
Includes amounts accrued and excludes capitalized interest and capitalized labor.
4
Includes net cash received for derivative settlements of $0.2 million and net cash paid for derivative settlements of $0.4 million for the three months ended December 31, 2019 and September 30, 2019, respectively, and net cash paid for derivative settlements of $4.1 million, $48.3 million and $3.5 million for the years ended December 31, 2019, 2018 and 2017, respectively. Reflects changes in operating assets and liabilities of $(12.7) million and $10.9 million for the three months ended December 31, 2019 and September 30, 2019, respectively, and $0.2 million, $(2.8) million and $(15.0) million for the years ended December 31, 2019, 2018 and 2017, respectively.
5
Represents actual cash paid for capital expenditures including capitalized interest and capitalized labor.


37


Key Developments
The following general business developments and corporate actions had or may have a significant impact on our results of operations, financial position and cash flows:
Production and Development Progress
Total production for the quarter and year ended December 31, 20192022, September 30, 2022, and December 31, 2021, respectively, and $0.49 and $3.92 per boe for the years ended December 31, 2022 and 2021, respectively, attributable to share-based compensation and certain special charges, comprised of organizational restructuring, including severance and acquisition, integration and strategic transaction costs, including costs attributable to the Lonestar Acquisition during those periods, the Juniper Transactions during the year ended 2021 as well as costs attributable to our 2022 acquisitions in the 2022 periods as described in the discussion of “Results of Operations General and Administrative” that follows.

51


Sequential Quarterly Analysis
The following summarizes our key operating and financial highlights for the three months ended December 31, 2022 with comparison to the three months ended September 30, 2022. The year-over-year highlights for 2022 and 2021 are addressed in the discussions that follow below in Year over Year Analysis of Operating and Financial Results.
Daily sales volume and total sales volume increased approximately 4% to 44,227 boe/d and 4,069 Mboe, respectively, for the three months ended December 31, 2022 compared to 42,624 boe/d and 3,921 Mboe for the three months ended September 30, 2022. The increase was 2,697 MBOE and 10,121, or 29,314 and 27,730 BOEPD, with approximately 76 percent and 74 percent, or 2,043 MBbls and 7,453 MBbls, of production from crude oil, 14 and 15 percent from NGLs and 10 percent and 11 percent from natural gas, respectively.
We drilled andprimarily due to 14.6 net wells turned 11 and 48 gross (9.9 and 43.3 net) wells to sales during the fourth quarter and year ended December 31, 2019, respectively. Subsequentof 2022.
Product revenues decreased 12% to December 31, 2019, we turned an additional six gross (5.4 net) wells to sales through February 21, 2020. As of February 21, 2020, we were in the process of drilling seven gross (5.5 net) wells and two gross (1.9 net) wells were completing.
As of February 21, 2020, we had approximately 100,200 gross (87,400 net) acres in the Eagle Ford, net of expirations. Approximately 91 percent of our acreage is held by production and substantially all is operated by us.
Commodity and Interest Rate Hedging Program
As of January 31, 2020 and including hedges we entered into after December 31, 2019, we have hedged a portion of our estimated future crude oil and natural gas production from February 1, 2020 through the end of 2021 with a mix of WTI- , MEH-, and Henry Hub indexed swaps, enhanced swaps and collars. We are currently unhedged with respect to NGL production. The following table summarizes our hedge positions for the periods presented:
 WTI - Oil Volumes WTI Average Price MEH - Oil Volumes MEH Average Price
Swaps(Barrels per day) ($ per barrel) (Barrels per day) ($ per barrel)
1Q - 202015,648
 $55.34
 2,000
 $61.03
2Q - 202010,648
 $55.35
 2,000
 $61.03
3Q - 20208,630
 $55.20
 2,000
 $61.03
4Q - 20208,630
 $55.20
 2,000
 $61.03
1Q - 20213,333
 $55.89
 
 $
2Q - 20213,297
 $55.89
 
 $
3Q - 20211,630
 $55.50
 
 $
4Q - 20211,630
 $55.50
 
 $
 WTI - Oil Volumes WTI Floor Price WTI Ceiling Price
Collars(Barrels per day) ($ per barrel) ($ per barrel)
2Q - 20205,297
 $52.36
��$57.60
3Q - 20206,891
 $52.97
 $58.03
4Q - 20202,000
 $48.00
 $57.10
1Q - 20211,667
 $55.00
 $58.00
2Q - 20211,648
 $55.00
 $58.00
 WTI - Oil Volumes WTI Put Price
Sold Puts(Barrels per day) ($ per barrel)
1Q - 20215,000
 $44.00
2Q - 20214,945
 $44.00
3Q - 20211,630
 $44.00
4Q - 20211,630
 $44.00
As of January 31, 2020, we have hedged over 40% of our estimated 2020 natural gas production.
 Henry Hub - Gas Volumes Henry Hub Floor Price Henry Hub Ceiling Price
Collars(MMBtu/d) ($/MMBtu) ($/MMBtu)
1Q - 20205,934
 $2.00
 $2.18
2Q - 20208,901
 $2.00
 $2.18
3Q - 20208,804
 $2.00
 $2.18
4Q - 20208,804
 $2.00
 $2.18
In February 2020, we began hedging our exposure to variable interest rates as we entered into a series of interest rate swaps contracts through May 2022 for a notional amount of $300 million, paying a weighted-average fixed rate of 1.36%.


Amendment to Credit Facility and Affirmation of Borrowing Base
In May 2019, we entered into the Borrowing Base Increase Agreement and Amendment No. 6 to the Credit Facility, or the Sixth Amendment, to our credit agreement, or Credit Facility, increasing the lender commitment to $1.0 billion from $450 million and the borrowing base to $500$268.5 million from $450$304.1 million and extending the maturity to May 2024 from September 2020 (subject to certain conditions as described in Note 9 to our Consolidated Financial Statements included in Part II, Item 8, “Financial Statements and Supplementary Data,”) among other things. In addition, the applicable margin ranges associated with borrowings under the Credit Facility were each reduced by 150 basis points. We incurred and capitalized approximately $2.6 million of issue and other costs associated with the Sixth Amendment.
In November 2019, we completed our fall borrowing base redetermination and our lenders affirmed the $500 million borrowing base. Our next redetermination is currently scheduled for April 2020.
Executive Transition
On November 4, 2019, the Company announced that Russell T Kelley, Jr. had been appointed as the Company’s Senior Vice President, Chief Financial Officer and Treasurer, or SVP and CFO, effective November 13, 2019. In connection with the transition, Steven A. Hartman, the former SVP and CFO resigned in accordance with a separation and transition agreement with the Company.


39


Financial Condition
Liquidity
Our primary sources of liquidity include our cash on hand, cash provided by operating activities and borrowings under the Credit Facility. The Credit Facility provides us with up to $1.0 billion in borrowing commitments. The current borrowing base under the Credit Facility is also $500 million. As of February 27, 2020, we had $133.2 million of availability under the Credit Facility.
Our cash flows from operating activities are subject to significant volatility due to changes in commodity prices for crude oil, NGL and natural gas products, as well as variations in our production. The prices for these commodities are driven by a number of factors beyond our control, including global and regional product supply and demand, weather, product distribution, refining and processing capacity and other supply chain dynamics, among other factors. In order to mitigate this volatility, we entered into derivative contracts with a number of financial institutions, all of which are participants in the Credit Facility, hedging a portion of our estimated future crude oil production through the end of 2021. The level of our hedging activity and duration of the financial instruments employed depend on our desired cash flow protection, available hedge prices, the magnitude of our capital program and our operating strategy.
Capital Resources
Under our capital program for 2020, we anticipate capital expenditures, excluding acquisitions, of up to $310 million with approximately 95 percent of capital being directed to drilling and completions on our Eagle Ford acreage. We plan to fund our 2020 capital spending primarily with cash from operating activities and, to the extent necessary, supplemental borrowings under the Credit Facility. Based upon current price and production expectations for 2020, we believe that our cash from operating activities and borrowings under our Credit Facility, as necessary, will be sufficient to fund our operations through year-end 2020; however, future cash flows are subject to a number of variables and significant additional capital expenditures may be required to more fully develop our properties. For a detailed analysis of our historical capital expenditures, see the “Cash Flows” discussion that follows.
Cash on Hand and Cash From Operating Activities. As of February 27, 2020, we had over $15 million of cash on hand. For additional information and an analysis of our historical cash flows from operating activities, see the “Cash Flows” discussion that follows.
Credit Facility Borrowings. During 2019, we borrowed $41.4 million, net of repayments, under the Credit Facility. For additional information regarding the terms and covenants under the Credit Facility, see the “Capitalization” discussion that follows.
The following table summarizes our borrowing activity under the Credit Facility for the periods presented:
 Borrowings Outstanding  
 End of Period 
Weighted-
Average
 Maximum 
Weighted-
Average Rate
Three months ended December 31, 2019$362,400
 $381,465
 $384,400
 4.06%
Year ended December 31, 2019$362,400
 $349,713
 $384,400
 4.79%
Proceeds from Sales of Assets. We continually evaluate potential sales of assets, including certain non-strategic oil and gas properties and undeveloped acreage, among others. For additional information and an analysis of our historical proceeds from sales of assets, see the “Cash Flows” discussion that follows.
Capital Markets Transactions. From time-to-time and under market conditions that we believe are favorable to us, we may consider capital market transactions, including the offering of debt and equity securities.


Cash Flows
The following table summarizes our cash flows for the periods presented:
 Year Ended
 December 31,
 2019 2018
Cash flows from operating activities   
Operating cash flows, net of working capital changes$356,321
 $346,780
Crude oil derivative settlements paid, net(4,136) (48,291)
Interest payments, net of amounts capitalized(32,398) (22,599)
Income tax refunds2,471
 
Acquisition, divestiture and strategic transaction costs paid(1,985) (2,968)
Reorganization-related administration fees and costs paid, net(79) (540)
Consulting costs paid to former Executive Chairman
 (250)
Net cash provided by operating activities320,194
 272,132
Cash flows from investing activities 
  
Acquisitions, net(6,516) (85,387)
Capital expenditures(362,743) (430,592)
Proceeds from sales of assets, net215
 7,683
Net cash used in investing activities(369,044) (508,296)
Cash flows from financing activities 
  
Proceeds from credit facility borrowings, net41,400
 244,000
Debt issuance costs paid(2,616) (989)
Net cash provided by financing activities38,784
 243,011
Net increase (decrease) in cash and cash equivalents$(10,066) $6,847
Cash Flows from Operating Activities. The increase of $48.1 million in net cash from operating activities for 2019 compared to 2018 was primarily attributable to: (i) approximately 27 percent higher production volume in 2019 despite approximately 16 percent lower overall product pricing, (ii) substantially lower net payments of derivative settlements during 2019 resulting primarily from the narrowing of the margin between hedged and actual settlement prices, (iii) the receipt in 2019 of a refund of alternative minimum tax, or AMT, credits in connection with the filing of our 2018 federal income tax return, (iv) lower payments in 2019 for acquisition, divestiture and strategic transaction costs as a merger agreement was terminated in early 2019, (v)result of 15% lower bankruptcy-related administration costs as the case was closed in November 2018 and (vi) less executive retirement costs in 2019 compared to 2018. These items wereaggregate realized prices, partially offset by 4% higher interest payments due to greater outstanding borrowings in 2019.
Cash Flows from Investing Activities. In 2019, we paid $6.5 million for the acquisition of working interests in certain properties for which we are the operator from our joint working interest partners. In 2018, we paid a combined total of $86.5 million for the Hunt Acquisition and the purchase of other working interests in producing properties in the Eagle Ford and received a total of $1.1 million in connection with the final settlement of the Devon Acquisition. As illustrated in the tables below, our cash payments for capital expendituressales volumes. Crude oil revenues were significantly8% lower during 2019 as compared to 2018, due primarily to the employment of two drilling rigs through most of 2019 compared11% lower crude oil prices, or $30.8 million, partially offset by 3% higher volume, or $8.7 million. NGL revenues decreased 29% due to three drilling rigs utilized during most of 2018. The cash payments for capital expenditures for 2019 and 2018 also reflect refunds of $3.832% lower prices, or $6.2 million, and $0.6partially offset by 4% higher volume, or $0.8 million. Natural gas revenues decreased 35% due to 39% lower prices, or $9.4 million, respectively, received for sales and use taxes that were applicablepartially offset by 6% higher volume, or $1.3 million.
Lease operating expenses (“LOE”) increased slightly on an absolute basis to capital expenditures in prior years. In addition, we received $0.2$24.7 million in proceeds from the sale of scrap tubular and well materials in 2019 while we received proceeds of $7.7$24.1 million in 2018 attributable to the sales of: (i) all of our Mid-Continent properties, (ii) undeveloped acreage holdings in the Tuscaloosa Marine Shale in Louisiana, (iii) certain undeveloped deep leasehold rights in Oklahoma, (iv) certain pipeline assets in our former Marcellus Shale operating region and (iv) scrap tubular and well materials.


The following table sets forth costs related to our capital expenditure program for the periods presented:
 Year Ended
 December 31,
 2019 2018
Drilling and completion$344,542
 $405,677
Lease acquisitions and other land-related costs3,433
 5,180
Geological, geophysical (seismic) and delay rental costs363
 377
Pipeline, gathering facilities and other equipment, net7,513
 7,717
 $355,851
 $418,951
The following table reconciles the total costs of our capital expenditure program with the net cash paid for capital expenditures as reported in our Consolidated Statements of Cash Flows for the periods presented:
 Year Ended
 December 31,
 2019 2018
Total capital expenditures program costs (from above)$355,851
 $418,951
Decrease (increase) in accrued capitalized costs3,602
 (44)
Less:   
Transfers from tubular inventory and well materials(10,971) (10,056)
Sales & use tax refunds received and applied to property accounts(3,816) (643)
Other, net(115) 
Add:   
Tubular inventory and well materials purchased in advance of drilling9,967
 9,578
Capitalized internal labor4,089
 3,688
Capitalized interest4,136
 9,118
Total cash paid for capital expenditures$362,743
 $430,592
Cash Flows from Financing Activities. During 2019, we borrowed $76.4 million and made repayments of $35.0 million under the Credit Facility which were used to fund a portion of our capital program as well as the aforementioned acquisition of working interests. During 2018, we borrowed $244 million under the Credit Facility to fund the three-rig capital program and the Hunt Acquisition. We also paid $2.6 million and $1.0primarily driven by $1.3 million of debt issueincreased water disposal costs, in 2019 and 2018, respectively, in connectionpartially offset by $0.8 million associated with amendmentsless workover activity. LOE decreased on a per unit basis to the Credit Facility.
Capitalization
The following table summarizes our total capitalization as of the dates presented:
 December 31,
 2019 2018
Credit Facility borrowings$362,400
 $321,000
Second Lien Facility term loans, net of original issue discount and issuance costs192,628
 190,375
Total debt555,028
 511,375
Shareholders’ equity520,745
 447,355
Total capitalization$1,075,773
 $958,730
Debt as a % of total capitalization52% 53%
Credit Facility. The Credit Facility provides for a $1.0 billion revolving commitment and $500 million borrowing base, including a $25.0 million sublimit for the issuance of letters of credit. The availability under the Credit Facility may not exceed the lesser of the aggregate commitments or the borrowing base. The borrowing base under the Credit Facility is redetermined semi-annually, generally in April and October of each year. Additionally, the Credit Facility lenders may, at their discretion, initiate a redetermination at any time during the six-month period between scheduled redeterminations. The Credit Facility is available to us for general corporate purposes including working capital. We had $0.4 million in letters of credit outstanding as of December 31, 2019 and 2018, respectively.


The Credit Facility is scheduled to mature in May 2024; provided that on June 30, 2022, unless we have either extended the maturity date of our $200 million Second Lien Credit Agreement dated as of September 29, 2017, or the Second Lien Facility, to a date that is at least 91 days after May 7, 2024 or have repaid our Second Lien Facility in full, the maturity date of the Credit Facility will mean June 30, 2022.
The outstanding borrowings under the Credit Facility bear interest at a rate equal to, at our option, either (a) a customary reference rate plus an applicable margin ranging$6.06 from 0.50% to 1.50%, determined based on the average availability under the Credit Facility or (b) a customary London interbank offered rate, or LIBOR, plus an applicable margin ranging from 1.50% to 2.50%, determined based on the average availability under the Credit Facility. Interest on reference rate borrowings is payable quarterly in arrears and is computed on the basis of a year of 365/366 days, and interest on LIBOR borrowings is payable every one, three or six months, at our election, and is computed on the basis of a year of 360 days. As of December 31, 2019, the actual weighted-average interest rate on the outstanding borrowings under the Credit Facility was 3.75%. Unused commitment fees are charged at a rate of 0.375% to 0.50%, depending upon utilization.
The Credit Facility is guaranteed by us and all of our subsidiaries, or the Guarantor Subsidiaries. The guarantees under the Credit Facility are full and unconditional and joint and several. Substantially all of our consolidated assets are held by the Guarantor Subsidiaries. There are no significant restrictions on our ability or any of the Guarantor Subsidiaries to obtain funds through dividends, advances or loans. The obligations under the Credit Facility are secured by a first priority lien on substantially all of our assets.
Second Lien Facility. On September 29, 2017, we entered into the $200 million Second Lien Facility. The maturity date under the Second Lien Facility is September 29, 2022.
The outstanding borrowings under the Second Lien Facility bear interest at a rate equal to, at our option, either (a) a customary reference rate based on the prime rate plus an applicable margin of 6.00% or (b) a customary LIBOR rate plus an applicable margin of 7.00%. As of December 31, 2019, the actual interest rate on outstanding borrowings under the Second Lien Facility was 8.81%. Amounts under the Second Lien Facility were borrowed at a price of 98% with an initial interest rate of 8.34% resulting in an effective interest rate of 9.89%. Interest on reference rate borrowings is payable quarterly in arrears and is computed on the basis of a year of 365/366 days, and interest on eurocurrency borrowings is payable every one or three months (including in three month intervals if we select a six-month interest period), at our election and is computed on the basis of a year of 360 days. We have the right, to the extent permitted under the Credit Facility and an intercreditor agreement between the lenders under the Credit Facility and the lenders under the Second Lien Facility, to prepay loans under the Second Lien Facility at any time, subject to the following remaining prepayment premiums (in addition to customary “breakage” costs with respect to eurocurrency loans): during the period ending September 29, 2020, 101% of the amount being prepaid; and thereafter, no premium. The Second Lien Facility also provides for the following remaining prepayment premiums in the event of a change in control that results in an offer of prepayment that is accepted by the lenders under the Second Lien Facility: during the period ended September 29, 2020, 101% of the amount being prepaid; and thereafter, no premium.
The Second Lien Facility is collateralized by substantially all of the Company’s and its subsidiaries’ assets with lien priority subordinated to the liens securing the Credit Facility. The obligations under the Second Lien Facility are guaranteed by us and the Guarantor Subsidiaries.
Covenant Compliance. The Credit Facility requires us to maintain (1) a minimum current ratio (as defined in the Credit Facility, which considers the the unused portion of the total commitment as a current asset) of 1.00 to 1.00, and (2) a maximum leverage ratio (consolidated indebtedness to EBITDAX, each as defined in the Credit Facility), in each case measured as of the last day of each fiscal quarter of 4.00 to 1.00. The Second Lien Facility has no financial covenants.
The Credit Facility and Second Lien Facility also contain customary affirmative and negative covenants, including as to compliance with laws (including environmental laws, ERISA and anti-corruption laws), maintenance of required insurance, delivery of quarterly and annual financial statements, oil and gas engineering reports and budgets, maintenance and operation of property (including oil and gas properties), limitations on the incurrence of liens and indebtedness, merger, consolidation or sale of assets, payment of dividends, and transactions with affiliates and other customary covenants.
The Credit Facility and Second Lien Facility contain customary events of default and remedies. If we do not comply with the financial and other covenants in the Credit Facility and Second Lien Facility, as applicable, the lenders thereto may, subject to customary cure rights, require immediate payment of all amounts outstanding under the Credit Facility and Second Lien Facility.
As of December 31, 2019, we were in compliance with all of the covenants under the Credit Facility and the Second Lien Facility.
Reference Rate Reform. In July 2017, the U.K.s Financial Conduct Authority, which regulates LIBOR, announced that it intends to phase out LIBOR by the end of 2021. At the present time, the Credit Facility and Second Lien Facility are, at our option, contractually subject to LIBOR rates and both have terms that extend beyond 2021. We have not yet pursued any technical amendment or other contractual alternative to address this matter. We are currently evaluating the potential impact of the eventual replacement of the LIBOR interest rate.

43


Results of Operations
Presentation of Financial Information and Changes in Accounting Principles
Adoption of New Accounting Standards
As discussed in further detail in Notes 2, 5 and 11 to the Consolidated Financial Statements included in Part II, Item 8, “Financial Statements and Supplementary Data,” we have adopted two accounting standards that impact the comparability of our financial statements: Accounting Standards Codification, or ASC, Topic 842, Leases, or ASC Topic 842, effective January 1, 2019 and ASC Topic 606, Revenues from Contracts with Customers, or ASC Topic 606, effective January 1, 2018. The adoption of ASC Topic 842 impacts the presentation and comparability of (i) Lease operating, or LOE, expense and (ii) General and administrative, or G&A, expenses. We adopted ASC Topic 842 utilizing the cumulative effect transition method effective January 1, 2019. Accordingly, our LOE and G&A expenses for the year ended December 31, 2019 are not comparable to the 2018 and 2017 presentation of these items. The adoption of ASC Topic 606 impacts the presentation and comparability of (i) NGL product revenues and (ii) Gathering, processing and transportation, or GPT, expense. We adopted ASC Topic 606 utilizing the cumulative effect transition method effective January 1, 2018. Accordingly, our NGL revenues and GPT expense for the year ended December 31, 2017 are not comparable to the 2019 and 2018 presentation of these items. Our discussion and analysis of these items in the Results of Operations that follow address the effects of changes directly attributable to the adoption of ASC Topic 842 and ASC Topic 606.
Impact of Acquisitions and Divestitures
A portion of the components of our year-over-year variances for 2018 to 2017 are also$6.15 due to the effects of the Hunt Acquisition in March 20184% higher sales volume discussed above.
Gathering, processing and the Devon Acquisition in September 2017. Partially offsetting the impact of these transactions are the effectstransportation expenses (“GPT”) decreased on an absolute and per unit basis to $9.2 million and $2.27 per boe, respectively, from $9.8 million and $2.50 per boe, respectively, due to lower GPT costs from lower prices for crude oil and natural gas. For certain of our divestiturecrude oil volumes gathered, our rate includes an adjustment based on NYMEX WTI prices. As crude oil prices increase, up to a cap of our former assets in$90 per bbl, the Mid-Continent region thatgathering rate escalates. As such, with the lower prices during the three months ended December 31, 2022 compared to the three months ended September 30, 2022, we sold in July 2018.
Productionincurred lower gathering costs associated with these volumes which caused a corresponding decrease on a per unit basis.
Production and ad valorem taxes decreased on an absolute basis to $14.8 million from $16.7 million and decreased on a per unit basis to $3.63 per boe from $4.26 per boe, respectively, due primarily to lower product revenues driven by lower aggregated realized prices, despite higher volumes.
General and administrative expenses (“G&A”) increased on an absolute and per unit basis to $10.7 million and $2.64 per boe from $9.8 million and $2.51 per boe, respectively, due primarily to $1.2 million increase in compensation costs and $0.3 million increase in information technology costs, partially offset by $0.4 million in lower insurance costs and $0.2 million lower consulting and professional fees.
Depreciation, depletion and amortization (“DD&A”) increased on an absolute and per unit basis to $73.1 million and $17.96 per boe during the fourth quarter 2022 from $66.2 million and $16.88 per boe due during the third quarter 2022 primarily due to increased future development costs associated with proved reserve additions that were at a higher relative cost per boe as compared to third quarter 2022.

52


Year over Year Analysis of Operating and Financial Results
Sales Volume
The following tables set forth a summary of our total and average daily productionsales volumes by product and geographic region for the periods presented:
 Total Production
 Year Ended December 31,
 2019 2018 2017
Crude oil (MBbl)7,453
 6,077
 2,764
NGLs (MBbl)1,491
 1,004
 523
Natural gas (MMcf)7,067
 5,181
 2,949
Total (MBOE)10,121
 7,944
 3,779
2019 vs 2018 Variance (MBOE)  2,177
 
% Change  27% 
2018 vs. 2017 Variance (MBOE)    4,165
% Change    110%
 Average Daily Production
 Year Ended December 31,
 2019 2018 2017
Crude oil (Bbl per day)20,418
 16,650
 7,573
NGLs (Bbl per day)4,085
 2,750
 1,432
Natural gas (MMcf per day)19
 14
 8
Total (BOEPD)27,730
 21,765
 10,353
2019 vs 2018 Variance (BOEPD)  5,965
 
% Change  27% 
2018 vs. 2017 Variance (BOEPD)    11,412
% Change    110%


 Total Production by Region
 Year Ended December 31,
 2019 2018 2017
South Texas10,121
 7,780
 3,487
Mid-Continent 1

 165
 292
Total (MBOE)10,121
 7,944
 3,779
2019 vs 2018 Variance (MBOE)  2,177
  
% Change  27%  
2018 vs. 2017 Variance (MBOE)    4,165
% Change    110%
 Average Daily Production by Region
 Year Ended December 31,
 2019 2018 2017
South Texas27,730
 21,314
 9,553
Mid-Continent 1

 451
 800
Total (BOEPD)27,730
 21,765
 10,353
2019 vs 2018 Variance (BOEPD)  5,965
  
% Change  27%  
2018 vs. 2017 Variance (BOEPD)    11,412
% Change    110%
Year Ended December 31,
Total Sales Volume 1
20222021Change% Change
Crude oil (Mbbl)10,668 7,711 2,957 38 %
NGLs (Mbbl)2,205 1,326 879 66 %
Natural gas (MMcf)12,100 6,712 5,388 80 %
Total (Mboe)14,890 10,155 4,735 47 %
Year Ended December 31,
Average Daily Sales Volume 1
20222021Change% Change
Crude oil (bbl/d)29,227 21,125 8,102 38 %
NGLs (bbl/d)6,041 3,632 2,409 66 %
Natural gas (MMcf/d)33 18 15 83 %
Total (boe/d)40,793 27,822 12,971 47 %

1    Mid-Continent operationsAll volumetric statistics represent volumes of commodity production that were actually sold on July 31, 2018.during the periods presented. Volumes of crude oil physically produced in excess of volumes sold are placed in temporary storage to be sold in subsequent periods.
20192022 vs. 2018. 2021. Total productionsales volume increased 27 percent47% during 20192022 compared to 2018 due2021 primarily to a greater number of higher working interest wells turned to salesdriven by the Lonestar Acquisition that closed in the fourth quarter of 2018 through December 31, 2019 when compared to the corresponding periods from the fourth quarter of 2017 through December 31, 2018October 2021 as well as the effect of a full year of production from the Hunt Acquisition. These increases were partially offset by the effect of the divestitureother asset acquisitions that closed in July 2018 of our former Mid-Continent operations, as well as natural production declines from our more mature Eagle Ford wells.2022 and increased drilling activity.
We operated two drilling rigs during the majority of 2019 compared to three during the majority of 2018. During 2019, we turned 48 gross (43.3 net) wells to2022, total crude oil sales compared to 53 gross (45.5 net) wells during 2018. When considering the wells turned to sales in the fourth quarters of the prior years for which we would receive a full year of subsequent production, we had 58 gross (52.2 net) wells for the year ended December 31, 2019 as compared to 62 gross (50.8 net) wells for the year ended December 31, 2018.
Approximately 74 percentvolume was approximately 72% of total production during 2019 was attributable to crude oil whensales volume compared to approximately 76 percent76% during 2018.2021. The declinedecrease in the crude oil composition of total production wassales volume during 2022 is due primarily to a higher gas content experienced with some of our recently drilledthe wells primarilyacquired in the southeastern portion of our acreage holdings.Lonestar Acquisition in 2021.
2018 vs. 2017. Total production increased 110 percent during 2018 compared to 2017 due primarily to a greater number of wells turned to sales in 2018 under an expanded drilling program as well as incremental production from the Hunt and Devon Acquisitions. We operated three drilling rigs during 2018 compared to two during 2017, the second of which was not contracted until mid-March 2017. These increases were partially offset by the effect of the divestiture in July 2018 of our former Mid-Continent operations, as well as natural production declines from our more mature Eagle Ford wells.
Approximately 76 percent of total production during 2018 was attributable to crude oil when compared to approximately 73 percent during 2017. Our Eagle Ford production represented 98 percent of our total production during 2018 compared to approximately 92 percent from this region during 2017. Subsequent to the sale of our Mid-Continent properties on July 31, 2018, the entirety of our production was derived from the Eagle Ford. During 2018, we turned 53 gross (45.5 net) Eagle Ford wells to sales compared to 29 gross (16.9 net) wells during 2017.


Product Revenues and Prices
The following tables set forth a summary of our revenues and prices per unit of volume by product and geographic region for the periods presented:
 Total Product Revenues
 Year Ended December 31,
 2019 2018 2017
Crude oil$434,713
 $402,485
 $140,886
NGLs16,589
 21,073
 10,066
Natural gas17,733
 15,972
 8,517
Total$469,035
 $439,530
 $159,469
2019 vs. 2018 Variance  $29,505
 
% Change  7 % 
2018 vs. 2017 Variance    $280,061
% Change    176%
 Product Revenues per Unit of Volume
 Year Ended December 31,
 2019 2018 2017
Crude oil ($ per barrel)$58.33
 $66.23
 $50.96
NGLs ($ per barrel)$11.13
 $20.99
 $19.25
Natural gas ($ per Mcf)$2.51
 $3.08
 $2.89
Total ($ per BOE)$46.34
 $55.33
 $42.20
2019 vs. 2018 Variance ($ per BOE)  $(8.99) 
% Change  (16)% 
2018 vs. 2017 Variance ($ per BOE)    $13.13
% Change    31%
Year Ended December 31,
Total Product Revenues20222021Change% Change
Crude oil$1,003,255 $517,301 $485,954 94 %
NGLs67,453 33,443 34,010 102 %
Natural gas70,895 26,080 44,815 172 %
Total$1,141,603 $576,824 $564,779 98 %
Year Ended December 31,
Realized Prices ($ per unit of volume)
20222021Change% Change
Crude oil$94.04 $67.09 $26.95 40 %
NGLs$30.59 $25.23 $5.36 21 %
Natural gas$5.86 $3.89 $1.97 51 %
Total$76.67 $56.80 $19.87 35 %
53

 Product Revenues by Region
 Year Ended December 31,
 2019 2018 2017
South Texas$469,035
 $435,599
 $152,521
Divested properties 1

 3,931
 6,948
Total$469,035
 $439,530
 $159,469
2019 vs. 2018 Variance  $29,505
  
% Change  7 %  
2018 vs. 2017 Variance    $280,061
% Change    176%
 Product Revenues per BOE by Region
 Year Ended December 31,
 2019 2018 2017
South Texas$46.34
 $55.99
 $43.74
Divested properties 1
$
 $23.87
 $23.79
Total ($ per BOE)$46.34
 $55.33
 $42.20
2019 vs. 2018 Variance ($ per BOE)  $(8.99)  
% Change  (16)%  
2018 vs. 2017 Variance ($ per BOE)    $13.13
% Change    31%

1
Mid-Continent operations were sold on July 31, 2018.
The following table provides an analysis of the changes in our revenues for the periods presented:
 Year Ended December 31, 2019 vs. Year Ended December 31, 2018 vs.
 Year Ended December 31, 2018 Year Ended December 31, 2017
 Revenue Variance Due to Revenue Variance Due to
 Volume Price Total Volume Price Total
Crude oil$91,108
 $(58,880) $32,228
 $168,812
 $92,787
 $261,599
NGLs10,227
 (14,711) (4,484) 9,259
 1,748
 11,007
Natural gas5,815
 (4,054) 1,761
 6,448
 1,007
 7,455
 $107,150
 $(77,645) $29,505
 $184,519
 $95,542
 $280,061


Year Ended December 31, 2022 vs.
Year Ended December 31, 2021
Revenue Variance Due to
VolumePriceTotal
Crude oil$198,394 $287,560 $485,954 
NGLs22,188 11,822 34,010 
Natural gas20,935 23,880 44,815 
$241,517 $323,262 $564,779 
20192022 vs. 20182021. Our product revenues increased seven percent during 2019 over 20182022 compared to 2021 due primarily to approximately 23 percentsignificantly higher crude oilprices stemming from macroeconomic factors and volatility in the global commodity markets as a result of continued economic recovery, as well as supply concerns resulting from the Russia-Ukraine war. These factors resulted in an increase to the NYMEX WTI benchmark price of 38% for 2022 as compared to 2021. Also contributing to the higher product revenues was an increase in volumes partially offset by 12 percent loweracross commodities as discussed above, with overall increase in Mboe of 47% for 2022. Total crude oil pricing resulting in higher overall product revenues. NGL revenues declined approximately 21 percent in 2019 due to substantially lower pricing (47 percent) partially offset by approximately 49 percent higher volumes. Natural gas revenues increased approximately 11 percent due primarily to approximately 36 percent higher volumes substantially offset by approximately 19 percent lower pricing. Crude oil revenues were approximately 93 percent88% and 90% of our total product revenues during 2019 as compared to approximately 92 percent during 2018.
2018 vs. 2017. Our product revenues increased 176 percent during 2018 over 2017 due primarily to approximately 120 percent higher crude oil volumes, 92 percent higher NGL volumes2022 and 76 higher natural gas volumes as well as the effect of 30 percent higher crude oil prices and approximately seven percent higher natural gas prices. Excluding the $2.4 million effect of the adoption of ASC Topic 606, NGL pricing increased by 21 percent during 2018 as compared to 2017. Crude oil revenues were approximately 92 percent of our total revenues during 2018 compared to 88 percent during 2017. Total Eagle Ford revenues were approximately 99 percent of total revenues in 2018 and 96 percent during 2017. Effective August 2018, all of our revenues were derived from the Eagle Ford.2021, respectively.
Realized Differentials
The following table reconciles our realized price differentials from weighted-averageaverage NYMEX-quoted prices for WTI crude oil and HH natural gas for the periods presented:
Year Ended December 31,
20222021Change% Change
Average WTI prices ($/bbl)$94.33 $68.11 $26.22 38 %
Realized differential to WTI(0.29)(1.02)0.73 72 %
Realized crude oil prices ($/bbl)$94.04 $67.09 $26.95 40 %
Average HH prices ($/MMBtu)$6.38 $3.82 $2.56 67 %
Realized differential to HH(0.52)0.07 (0.59)(843)%
Realized natural gas prices ($/Mcf)$5.86 $3.89 $1.97 51 %
 Year Ended December 31,
 2019 2018 2017
Realized crude oil prices per barrel$58.33
 $66.23
 $50.96
Weighted-average WTI prices57.04
 65.56
 51.34
Realized differential to WTI per barrel$1.29
 $0.67
 $(0.38)
We have realized premiumsOur differential to theNYMEX WTI index price for crude oil over the past two years as the majority of our production during those periods was sold based on LLS or MEH index pricing2022 improved by 72% compared to 2021 due to more favorable NYMEX Calendar Month Average contractual pricing and more favorable pricing negotiated with certain crude purchasers effective early in first quarter 2022. Our differential to NYMEX HH was negatively impacted for 2022 as compared to 2021 due to more unfavorable location basis differentials. See also the proximitydiscussion of our operating region toCommodity Price and Other Economic Conditions in the Gulf Coast markets.Overview above.
54


Effects of Derivatives
We present realized prices for crude oil, NGLs and natural gas, as adjusted for the effects of derivatives, net as we believe these measures are useful to management and stakeholders in determining the effectiveness of our price-risk management program that is designed to reduce the volatility associated with our operations. Realized prices for crude oil, NGLs and natural gas, as adjusted for the effects of derivatives, net, are supplemental financial measures that are not prepared in accordance with GAAP.
The following table reconcilespresents the calculation of our non-GAAP realized prices for crude oil, revenuesNGLs and natural gas, as adjusted for the effect of derivatives, net and reconciles to realized prices for crude oil, NGLs and natural gas determined in accordance with GAAP:
Year Ended December 31,
20222021Change% Change
Realized crude oil prices ($/bbl)$94.04 $67.09 $26.95 40 %
Effects of derivatives, net ($/bbl)(14.51)(10.94)(3.57)(33)%
Crude oil realized prices, including effects of derivatives, net ($/bbl)$79.53 $56.15 $23.38 42 %
Realized NGL prices ($/bbl)$30.59 $25.23 $5.36 21 %
Effects of derivatives, net ($/bbl)(0.89)(0.37)(0.52)(141)%
NGL realized prices, including effects of derivatives, net ($/bbl)$29.70 $24.86 $4.84 19 %
Realized natural gas prices ($/Mcf)$5.86 $3.89 $1.97 51 %
Effects of derivatives, net ($/Mcf)(2.12)(0.88)(1.24)(141)%
Natural gas realized prices, including effects of derivatives, net ($/Mcf)$3.74 $3.01 $0.73 24 %
Effects of derivatives, net include, as adjusted forapplicable to the period presented: (i) current period commodity derivative activities, forsettlements; (ii) the impact of option premiums paid or received in prior periods presented: 
 Year Ended December 31,
 2019 2018 2017
Crude oil revenues as reported$434,713
 $402,485
 $140,886
Derivative settlements, net(4,136) (48,291) (3,511)
 $430,577
 $354,194

$137,375
      
Crude oil prices per Bbl, as reported$58.33
 $66.23
 $50.96
Derivative settlements per Bbl(0.55) (7.95) (1.27)
 $57.78
 $58.28

$49.69
Gain (Loss) on Salesrelated to current period production; (iii) the impact of Assets
We recognize gainsprior period cash settlements of early-terminated derivatives originally designated to settle against current period production; (iv) the exclusion of option premiums paid or received in current period related to future period production; and losses on(v) the sale or disposition of assets other than our oil and gas properties upon the completionexclusion of the underlying transactions. The following table sets forth the total gains and losses recognizedimpact of current period cash settlements for the periods presented:
 Year Ended December 31,
 2019 2018 2017
Gain (loss) on sales of assets, net$5
 $(177) $(36)
2019, 2018 and 2017. In 2019, 2018 and 2017, we recognized insignificant net gains and losses attributableearly-terminated derivatives originally designated to sale or trade of certain support equipment and surplus and scrap tubular inventory and well materials.


Other Revenues, Netsettle against future period production.
Other revenues,Operating Income, Net
Other operating income, net, includes fees for marketing and water disposal services that we charge to third parties, net of related expenses, as well as other miscellaneous revenues and credits attributable to our current operations.operations and gains and losses on the sale or disposition of assets other than our oil and gas properties. In addition, charges attributable to credit losses associated with our trade and joint venture partner receivables are netted within this caption.
The following table sets forth the total other revenues,Other operating income, net recognized for the periods presented:
 Year Ended December 31,
 2019 2018 2017
Other revenues, net$2,176
 $1,479
 $621
Year Ended December 31,
20222021Change% Change
Other operating income, net$3,586 $2,667 $919 34 %
20192022 vs. 2018. 2021Other revenues, net. Our marketing fee income increased during 2019 from 2018in 2022 as compared to 2021 due primarily to higher commodity-based pricing, higher water disposal revenues attributablefees in 2022 due to higher productionsales volumes, gains on sales of field materials and fixed assets in 2022, partially offset by certain unscheduled repairshigher credit losses in 2022 and maintenance costs incurred during the second quarter of 2019 at our water disposal facilitiesmiscellaneous income recognized in 2021.
2018 vs. 2017.
55

Other revenues, net increased during 2018 from 2017 due primarily to higher marketing fees charged to third parties resulting from substantially higher production.
Lease Operating Expenses
LOE include costs that we incur to operate our producing wells and field operations. The most significant costs include compression and gas-lift,for gas lift, chemicals, water disposal, repairs and maintenance, including down-hole repairs, field labor, pumping and well-tending, equipment rentals, utilities and supplies, among others.
The following table sets forth our LOE for the periods presented:
Year Ended December 31,Year Ended December 31,
2019 2018 201720222021Change% Change
Lease operating$43,088
 $35,879
 $21,784
Lease operating$85,792 $45,402 $40,390 89 %
Per unit of production ($/BOE)$4.26
 $4.52
 $5.76
Per unit ($/boe)Per unit ($/boe)$5.76 $4.47 $1.29 29 %
20192022 vs. 2018. 2021. LOE increased on an absolute basis but declined on aand per unit basis during 20192022 when compared to 20182021 due primarily to the overall effect of 27 percentLonestar Acquisition and the other asset acquisitions that closed in 2022, increased workover activity and higher productionfuel, service and equipment costs driven by higher sales volume during 2019. The volume-based absolute increases were primarily attributable to compression and gas lift, water disposal, utilities and environmental costs for a combined effect of $5.6 million. Higher maintenance costs of $1.3 million were incurred in 2019. In addition, the 2019 period includes the effects of two additional months of production attributable to the Hunt Acquisition.
2018 vs. 2017. LOE increased on an absolute basis, but declined on a per unit basis during 2018 when compared to 2017. The absolute increases were due primarily to higher production volume including the incremental effects of the Devon and Hunt Acquisitions. The higher production volume also had the effect of decreasing the overall per unit cost, particularly those costs that have a higher fixed cost component. Furthermore, comprehensive maintenance costs in the second half of 2017 improved production and cost efficiency progressingcoupled with inflationary pressures throughout 2018.2022.
Gathering, Processing and Transportation
GPT expense includes costs that we incur to gather and aggregate our crude oil NGL and natural gas production from our wells and deliver them via pipeline or truck to a central delivery point, downstream pipelines or processing plants, and blend or process, as necessary, depending upon the type of production and the specific contractual arrangements that we have with the applicable midstream operators. In addition, GPT expense includes short-term rental charges for crude oil storage tanks.
The following table sets forth our GPT expense for the periods presented:
 Year Ended December 31,
 2019 2018 2017
Gathering, processing and transportation$23,197
 $18,626
 $10,734
Per unit of production ($/BOE)$2.29
 $2.34
 $2.84
Year Ended December 31,
20222021Change% Change
GPT$36,698 $23,647 $13,051 55 %
Per unit ($/boe)$2.46 $2.33 $0.13 %
20192022 vs. 2018. 2021. GPT expense increased on an absolute basis during 2019 when2022 as compared to 20182021 due primarily to substantiallythe Lonestar Acquisition and the other asset acquisitions that closed in 2022, which contributed to 80% higher productionnatural gas sales volumes and 38% higher crude oil sales volumes for 2022. Additionally, for certain of our crude oil volumes gathered, our rate includes an adjustment based on NYMEX WTI prices. As crude oil prices increase, up to a cap of $90 per bbl, the gathering rate escalates. As such, with the higher prices during 2022 as discussed above. Per unit costs declined marginally in 2019 compared to 2018 due primarily to2021, we incurred higher gathering costs associated with these volumes which caused a shiftcorresponding increase on a per unit basis. These unfavorable variances were partially offset by the effects of an increase in the mix of crude oil productionvolume sold at the wellhead, with no corresponding GPT expense subsequent toincluding the achievementmajority of required minimum crude oil volumes transported by pipeline partially offset by a scheduled rate increase effective August 1, 2019, for crude oil gathering services provided by Nuevo Dos Gathering & Transportation, LLC, or Nuevo G&T, successor to Republic Midstream, LLC.


2018 vs. 2017. GPT expense increased on an absolute basis during 2018 when compared to 2017 due primarily to substantially higher production volumes partially offset byfrom the effect of the adoption of ASC Topic 606, or $2.4 million. Per unitacquired Lonestar wells, which reduces transportation costs declined $0.30and cost per BOE in 2018 due primarily to the effect of the adoption of ASC Topic 606, as well as a result of increased production sold at the wellhead with no corresponding GPT expense.unit.
Production and Ad Valorem Taxes
Production or severance taxes represent taxes imposed by the states in which we operate for the removal of resources including crude oil, NGLs and natural gas. Ad valorem taxes represent taxes imposed by certain jurisdictions, primarily counties, in which we operate, based on the assessed value of our operating properties. The assessments for ad valorem taxes are generally based on contemporary commoditypublished index prices.
The following table sets forth our production and ad valorem taxes for the periods presented:
Year Ended December 31,
Year Ended December 31,20222021Change% Change
2019 2018 2017
Production and ad valorem taxes     
Production/severance taxes$21,774
 $20,619
 $7,533
Production/severance taxes$52,737 $27,246 $25,491 94 %
Ad valorem taxes6,283
 2,928
 1,281
Ad valorem taxes8,640 3,795 4,845 128 %
$28,057
 $23,547
 $8,814
Per unit of production ($/BOE)$2.77
 $2.96
 $2.33
Production/severance and ad valorem taxesProduction/severance and ad valorem taxes$61,377 $31,041 $30,336 98 %
Per unit ($/boe)Per unit ($/boe)$4.12 $3.06 $1.06 35 %
Production/severance tax rate as a percent of product revenues4.6% 4.7% 4.7%Production/severance tax rate as a percent of product revenues4.6 %4.7 %(0.1)%(2)%
20192022 vs. 2018. 2021. Production and ad valorem taxes increased on an absolute basis but declined on aand per unit basis during 20192022 when compared to 20182021 due primarily to increasedthe impact of higher volumes from the Lonestar Acquisition and other asset acquisitions that closed in 2022. Additionally, production volume despite lower overall commodity sales prices. Accruals for ad valorem taxes also increased substantially for the 2019 periods due to a higher commodity-price based valuation assumption and the effects of growing our assessable property base and increased working interests from acquisition activity.
2018 vs. 2017. Production taxes increased on both an absolute and per unit basis due to higher aggregate commodity sales prices during 2018 when compared to 2017 due primarily to increased production volume and higher commodity prices. Accruals2022. Our accruals for ad valorem taxes have alsoare based on our most recent estimates for assessments which increased for 2018 as we have grown our assessablefrom the lower property base and we anticipate higher assessments as a result of higher commodity prices and increased working interests.values in 2021.
56


General and Administrative
Our G&A expenses include employee compensation, benefits and other related costs for our corporate management and governance functions, rent and occupancy costs for our corporate facilities, insurance, and professional fees and consulting costs supporting various corporate-level functions, among others. In order to facilitate a meaningful discussion and analysis of our results of operations with respect to G&A expenses, we have disaggregated certain costs into three components as presented in the table below. Primary G&A encompasses all G&A costs except share-based compensation and certain significant special charges that are generally attributable to material stand-alone transactions or corporate actions that are not otherwise in the normal course.
The following table sets forth the components of G&A expenses for the periods presented:
Year Ended December 31,
20222021Change% Change
Primary G&A expenses$33,661 $26,753 $6,908 26 %
Share-based compensation 1
5,554 15,589 (10,035)(64)%
Special charges:
Organizational restructuring, including severance 2
(1,152)367 (1,519)(414)%
Acquisition/integration and strategic transaction costs2,909 23,820 (20,911)(88)%
Total G&A expenses$40,972 $66,529 $(25,557)(38)%
Per unit ($/boe)$2.75 $6.55 $(3.80)(58)%
Per unit ($/boe) excluding share-based compensation and other special charges identified above$2.26 $2.63 $(0.37)(14)%

 Year Ended December 31,
 2019 2018 2017
Primary G&A$20,602
 $17,236
 $13,072
Share-based compensation - equity-classified4,082
 4,618
 3,809
Significant special charges     
Acquisition, divestiture and strategic transaction costs800
 3,960
 1,340
Executive retirement costs
 250
 
Restructuring expense adjustment
 
 (20)
Total general and administrative expenses$25,484
 $26,064
 $18,201
Per unit of production ($/BOE)$2.52
 $3.28
 $4.82
Per unit of production excluding all share-based compensation and other significant special charges identified above ($/BOE)$2.04
 $2.17
 $3.46


1    Share-based compensation for the year ended December 31, 2021 included $10.4 million related to the Lonestar Acquisition. See Note 4 and Note 16 to the consolidated financial statements included in Part II, Item 8, “Financial Statements and Supplementary Data” for further details.
20192    Organizational restructuring, including severance for the year ended December 31, 2022, resulted in a benefit for the period as it relates to an accrual acquired in connection with the Lonestar Acquisition.
2022 vs. 2018. 2021. Our primary G&A expenses increased on an absolute basis during 2022 compared to 2021. The increase for 2022 compared to 2021 is due primarily to increased headcount following the Lonestar Acquisition and the impact of bonuses and salary increases in 2022. Primary G&A expenses decreased on a per unit basis due to higher overall sales volumes in 2022.
Our total G&A expenses were lower on an absolute and per unit basis during 20192022 compared to 2018. The absolute increases are2021 due primarily to the effects of higher payroll, benefitslower acquisition and support costs attributable to a higher overall employee headcount. In addition, we incurred higher occupancy costs and higher consulting andintegration related costs including those associated with the SVP/CFO transition inJuniper Transactions and the second half of 2019. Higher production volume hadLonestar Acquisition and lower share-based compensation costs as discussed below, partially offset by the effect of reducing G&A per unit of production during 2019.aforementioned increased headcount and salaries.
Equity-classified share-basedShare-based compensation charges during the periods presented are attributable to the amortization of compensation cost, net of forfeitures, associated with the grants of time-vested restricted stock units or RSUs,(“RSUs”), and performanceperformance-based restricted stock units or PRSUs.(“PRSUs”). The grants of RSUs and PRSUs are described in greater detail in Note 16 to the Consolidated Financial Statementsconsolidated financial statements included in Part II, Item 8, “Financial Statements and Supplementary Data.” A substantial portionData”. As a result of the share-based compensation expense is attributable toJuniper Transactions, substantially all of the RSURSUs granted before 2019 vested and PRSU grants made inan incremental charge of approximately $1.9 million was recorded during the normal course in January 2017 and RSU grants in September and December of 2016 in connection with our reorganization. The remainder is attributable to grants of RSUs and PRSUs to certain employees upon their hiring orfirst quarter 2021. Additionally, as a result of promotion subsequent to the first quarter of 2017. The year 2018 also includes a charge of $0.6 million attributable to the accelerated vesting ofLonestar Acquisition, certain RSUs of Lonestar employees and PRSUsdirectors vested at closing and $10.4 million was recorded as share-based compensation related to these vestings in connection with the retirement of our Executive Chairman in February 2018.fourth quarter 2021 (see table above). All of our equity-classified share-based compensation represents non-cash expenses.
We incurred consulting and other costs in the second half of 2018 which continued into the first quarter of 2019 associated with the previously terminated merger transaction. In addition to these costs, we incurred transaction costs in 2018 associated with the Mid-Continent divestiture and the Hunt Acquisition, including legal, due diligence and other professional fees. We also paid certain costs attributable to the retirement of our former Executive Chairman in February 2018.
2018 vs. 2017. Our primary G&A expenses increased on an absolute and decreased on a per unit basis during 2018 compared to 2017. The absolute increase is due primarily to the effects of higher payroll, benefits and support costs attributable to a higher overall employee headcount as well as costs associated with the relocation of our corporate headquarters to a new office within Houston, Texas. Higher production volume had the effect of reducing G&A per unit of production for 2018.
During 2017, we incurred transaction costs associated with the Devon Acquisition and certain costs in advance of the Hunt Acquisitions, including advisory, legal, due diligence and other professional fees. In 2017, we recorded adjustments to severance-related restructuring accruals that were originally established prior to 2017.
Depreciation, Depletion and Amortization (DD&A)
DD&A expense includes charges for the allocation of property costs based on the volume of production, depreciation of fixed assets other than oil and gas assets as well as the accretion of our ARO liabilities.
The following table sets forth total and per unit costs for DD&A expense for the periods presented:
Year Ended December 31,Year Ended December 31,
2019 2018 201720222021Change% Change
DD&A expense$174,569
 $127,961
 $48,649
DD&A expense$244,455 $131,657 $112,798 86 %
DD&A rate ($/BOE)$17.25
 $16.11
 $12.87
DD&A rate ($/boe)DD&A rate ($/boe)$16.42 $12.96 $3.46 27 %
20192022 vs. 2018. 2021. DD&A expense increased on an absolute and a per unit basis during 20192022 when compared to 2018.2021. Higher production volume provided for an increase of approximately $35.1$61.4 million while $11.5 million was attributable to the higher DD&A rates in 2019. The higher DD&A rates in 2019 are attributable to higher costs added to the full cost pool in 2019.
2018 vs. 2017. DD&A increased on an absolute and per unit basis during 2018 when compared to 2017. Higher production volume2022 provided for an increase of approximately $53.6 million while $25.7 million was attributable to the higher DD&A rates in 2018.$51.5 million. The higher DD&A ratesrate in 2022 was primarily due to the 2018 periods were attributableLonestar Acquisition and other asset acquisitions that closed in 2022, which contributed to an increase in our total proved reserves at a higher relative cost per boe coupled with increased future development costs addedassociated with proved reserve additions as compared to 2021.
57


Impairment of Oil and Gas Properties
We assess our oil and gas properties on a quarterly basis based on the results of a Ceiling Test in accordance with the full cost pool, including those frommethod of accounting for oil and gas properties.
Year Ended December 31,
20222021Change% Change
Impairments of oil and gas properties$— $1,811 $(1,811)(100)%
2022 vs. 2021. We did not record an impairment of our oil and gas properties during 2022 compared to an impairment of $1.8 million recorded in the Devon and Hunt Acquisitions, during a periodfirst quarter 2021. The impairment in 2021 was the result of risingthe decline in the twelve-month average prices of crude oil, prices,NGLs and natural gas as well asindicated by the salerespective quarterly Ceiling Test under the full cost method of our Mid-Continent propertiesaccounting for oil and gas properties. See Note 7 to the consolidated financial statements included in July 2018, while the DD&A ratePart II, Item 8, “Financial Statements and Supplementary Data” for 2017 period is based primarily on the fair value of our properties at September 2016.
Interest Expensemore discussion.
Interest Expense
Interest expense for 2022 includes charges for outstanding borrowings under the Credit Facility and the Second Lien Facility derived from internationally-recognizedinternationally recognized interest rates with a premium based on our credit profile and the level of credit outstanding. outstanding and the contractual rate associated with the 9.25% Senior Notes due 2026. Also included are the amortization of issuance costs capitalized attributable to the Credit Facility and the 9.25% Senior Notes due 2026 and accretion of original issue discount (“OID”) on the 9.25% Senior Notes due 2026.
Interest expense for the periods in 2021 includes charges for outstanding borrowings under the Credit Facility and the Second Lien Credit Agreement, dated September 29, 2017 (the “Second Lien Term Loan”) which was repaid in full in October 2021, as well as amortization of their respective issuance costs capitalized. Also included is the accretion of OID on the Second Lien Term Loan.
In addition, we are assessed certain fees for the overall credit commitments provided to us as well as fees for credit utilization and letters of credit. Also included is the accretion of original issue discount on the Second Lien Facility and the amortization of costs capitalized attributable to the Credit Facility and the Second Lien Facility. These costs are partially offset by interest costsamounts that we capitalize on unproved property costs while we are engaged in the evaluation of projects for the underlying acreage.


The following table summarizes the components of our interest expense for the periods presented:
 Year Ended December 31,
 2019 2018 2017
Interest on borrowings and related fees$36,593
 32,164
 $6,995
Accretion of original issue discount743
 680
 161
Amortization of debt issuance costs2,611
 2,736
 1,961
Capitalized interest(4,136) (9,118) (2,725)
 $35,811
 $26,462

$6,392
Year Ended December 31,
20222021Change% Change
Interest on borrowings and related fees$49,729 34,029 $15,700 46 %
Amortization of debt issuance costs2,861 2,248 613 27 %
Accretion of original issue discount665 487 178 37 %
Capitalized interest(4,324)(3,603)(721)20 %
Total interest expense, net of capitalized interest$48,931 $33,161 $15,770 48 %
20192022 vs. 2018.2021 Interest. The increase in interest expense during 2022 is primarily attributable to interest incurred in the amount of $36.6 million for the 9.25% Senior Notes due 2026 and $11.8 million for the Credit Facility compared to interest incurred in 2021 of $15.0 million for the 9.25% Senior Notes due 2026, $10.6 million for the Second Lien Term Loan and $7.7 million for the Credit Facility as well as increased amortization of OID and debt issuance costs in 2022 compared to the corresponding period in 2021. These increases are partially offset by increased capitalized interest during 20192022, driven by higher overall weighted-average interest rates in 2022 as compared to 2018 due primarily to higher outstanding balances under the Credit Facility partially offset by the effect of lower interest rates. Weighted-average balances under the Credit Facility were higher in 2019 compared to 2018 by approximately $119 million while the weighted-average interest rates were lower during the same period by 97 basis points. The accretion of original issue discount is entirely attributable to the Second Lien Facility and the amortization of debt issuance costs includes amounts attributable to both the Credit Facility and Second Lien Facility. We capitalized a smaller portion of interest during 2019 as we maintained a substantially smaller portion of unproved property as compared to 2018.2021.
2018 vs. 2017.
58

Interest expense increased during 2018 as compared to 2017 due primarily to higher outstanding balances under the Credit Facility, including amounts borrowed to fund our larger capital expenditure program in 2018 and the Hunt Acquisition, as well as interest attributable to the Second Lien Facility that was entered into in September 2017. Furthermore, the Credit Facility and the Second Lien Facility are variable-rate instruments and both were subject to periodic increases in LIBOR rates on a consistent basis since 2017. We capitalized a larger portion of interest during 2018 as we maintained a substantially larger balance of unproved property as compared to 2017 due primarily to the Devon Acquisition.
Derivatives
The gains and losses for our derivatives portfolio reflect changes in the fair value attributable to changes in market values relative to our hedged commodity prices.prices and interest rates.
The following table summarizes the gains and (losses) attributable to our crude oilcommodity derivatives portfolio and interest rate swaps for the periods presented:
 Year Ended December 31,
 2019 2018 2017
Crude oil derivative gains (losses)$(68,131) $37,427
 $(17,819)
Year Ended December 31,
20222021Change% Change
Commodity derivative losses$(162,736)$(136,997)$(25,739)19 %
Interest rate swap gains (losses)64 (2)66 (3300)%
Total$(162,672)$(136,999)$(25,673)19 %
20192022 vs. 2018. 2021. In 2019, the forward curve for2022, commodity prices increased relativewere significantly higher on an average aggregate basis than those during 2021. Accordingly, the derivative losses in 2022 and 2021 reflect the decline in the mark-to-market values consistent with the increase in prices attributable to our weighted-average hedged prices resulting inopen positions. Realized settlement payments, net losses for our derivative portfolio. We paid net cash settlements of $4.1crude oil, NGL and natural gas derivatives were $182.0 million and $48.3 million in 2019 and 2018, respectively.
2018 vs. 2017. The forward curve for commodity prices declined relative to our weighted-average hedged prices during 2018 resulting in a net gain for the year ended December 31, 2018 while the forward curve for such prices increased relative to our weighted-average hedged prices during 2017. We paid cash settlements of $48.3 million in 20182022 as compared to cash settlements paidrealized settlement payments, net of $3.5$77.1 million in 2017.
Other, Net
Other, net includesduring 2021. Through May 2022, we hedged a portion of our exposure to variable interest income, non-service costsrates associated with our retiree benefit plansCredit Facility and, miscellaneous itemsduring 2021, our Second Lien Term Loan. As of December 31, 2022, we did not have any interest rate derivatives. During 2022 and 2021, we paid $1.4 million and $3.8 million of net settlements from our interest rate swaps, respectively.
Income Taxes
Income taxes represent our income and expense that are not directly associatedtax provision as determined in accordance with our current operations, including certain recoveries and write-offs attributable to prior years and properties that have been divested.
The following table sets forth the other income (expense), net recognized for the periods presented:
 Year Ended December 31,
 2019 2018 2017
Other, net$(153) $2,266
 $58
2019. Other, net income (expense) decreased during 2019 as compared to 2018 due primarily to the write-off in 2019 of $0.2 million attributable to acquisition transactions in prior years that were no longer deemed recoverable. This charge was partially offset in 2019 by recoveries of sales and usegenerally accepted accounting principles. It considers taxes attributable to previously divested properties.


2018. In 2018, we received a recovery of $1.5 million from partners attributable to a prior-year acquisition and received recoveries of $0.3 million of joint interest receivable balances previously written-off in connection withour obligations for federal taxes under the bankruptcy of a former partner. We also received severance tax refunds attributable to previously-divested properties in excess of recorded amounts, interest income earned on the escrow account attributable to the Devon Acquisition prior to the escrow account’s liquidation in March 2018Internal Revenue Code as well as recording the reversal of a litigation reserve attributable to previously-divested properties. The combined benefit to income from these items was approximately $0.7 million. These amounts were partially offset by interest charges applicable to a settlement with a royalty owner and charges associated with our retiree benefit plans.
2017. In 2017, we recorded interest income attributable to the escrow account attributable to the Devon Acquisition that was partially offset by charges associated with our retiree benefit plans and certain costs attributable to assets that were soldvarious states in prior years.
Reorganization Items, Net
The following table summarizes the components included in “Reorganization items, net” for the periods presented:
 Year Ended December 31,
 2019 2018 2017
Legal and professional fees and expenses$
 $200
 $
Other reorganization items
 3,122
 
 $
 $3,322

$
2018. Whilewhich we emerged from bankruptcy in September 2016, certain administrative and claims resolution activities continued until November 2018 when the Bankruptcy Court issued a final decree which effectively closed the case. Upon the closure, we reversed the remaining $0.2 million unused portion of an accrual that was established upon emergence from bankruptcy for legal and professional fees and administrative costs. In addition, we reversed the $2.7 million unallocated portion of a reserve that was established upon emergence for the potential settlement of certain claims in cash. Finally, we also reversed $0.4 million of accounts payable that were held open since the date of emergence as secured claims, but were ultimately expunged. As these items of income are directly attributable to the final administration of our bankruptcy case and not a part of ouroperate, primarily Texas, or otherwise have continuing operations, they are classified on our Consolidated Statement of Operations as components of “Reorganization items, net.”
Income Taxesinvolvement.
The following table summarizes our income tax provision for the periods presented:
Year Ended December 31,
Year Ended December 31,20222021Change% Change
2019 2018 2017
Income tax (expense) benefit$(2,137) $(523) $4,943
Income tax expenseIncome tax expense$(4,186)$(1,560)$(2,626)168 %
Effective tax rate3.0% 0.2% 17.8%Effective tax rate(0.9)%(1.6)%0.7 %(44)%
2019. 2022. The income tax provision for the year ended December 31, 20192022 includes current federal benefitsa deferred state tax expense of $1.2$3.4 million attributable to property and equipment and $0.8 million of current state expense attributable to the anticipated refund of alternative minimumTexas margin tax or AMT, credits for the 2019 tax year. The amount for 2019 has been recognized on our Consolidated Balance Sheet as of December 31, 2019 as a current asset. These benefits have been offset by corresponding decreases in the deferred tax asset associated with AMT credit carryforwards giving rise to deferred federal expense for the year ended December 31, 2019. In addition, we have recognized a2022. The federal portion was fully offset by an adjustment to the valuation allowance against our net deferred state tax expense of $2.1 million attributable to property and equipment forassets resulting in an overall effective tax rate of 3.0%.0.9%, which is fully attributable to the State of Texas. Our net deferred income tax liability balance of $6.2 million as of December 31, 2022 is also fully attributable to the State of Texas and primarily related to property.
2018. 2021. The income tax provision for the year ended December 31, 20182021 includes a current federal benefit of $2.5 million attributable to the anticipated refund of AMT credits for the 2018 tax year. The $2.5 million attributable to 2018 was refunded to us in 2019. This benefit is offset by a corresponding decrease in the deferred tax asset associated with the refundable AMT credit giving rise to a deferred federal expense. In addition, we have recognized a deferred state tax expense of $0.5$1.2 million for an overall effectiveattributable to property and equipment and $0.3 million of current state expense attributable to the Texas margin tax rate of 0.2%.
2017. In connection with our analysis of the impact of the TCJA we recorded an income tax charge of $86.6 million for the year ended December 31, 2017, which consists of a reduction of2021. The federal portion was fully offset by an adjustment to the valuation allowance against our net deferred tax assets previously valued at 35%. We recorded a corresponding decreaseresulting in our deferredan effective tax asset valuation allowance representing an income tax benefit for the same amount. In addition to the aforementioned offsetting items with respect to the reduction in income tax rates, our income tax provision included federal income taxes of $9.7 million applied at the statutory rate of 35% for 2017 and an adjustment of $10.8 million attributable to reductions in certain tax attributes of property and other adjustments of $0.3 million applied in connection with the filing of our 2016 income tax returns. These expenses were effectively offset by benefits1.6%, which was fully attributable to the reduction inState of Texas.
59


Liquidity and Capital Resources
Our primary sources of liquidity include our deferred tax asset valuation allowance of $24.3 millioncash on hand, cash provided by operating activities and state income tax benefits of $1.4 million resulting in a net tax deferred benefit of $4.9 million, all of which is attributable to refundable AMT credit carryforwards.

52


Off-Balance Sheet Arrangements
We may enter into off-balance sheet arrangements and transactions that can give rise to material off-balance sheet obligations.borrowings under the Credit Facility. As of December 31, 2019,2022, we had liquidity of $291.6 million, comprised of cash and cash equivalents of $7.6 million and availability under our Credit Facility of $284.0 million (factoring in letters of credit). The Credit Facility provides us up to $1.0 billion in borrowing commitments. The current borrowing base under the material off-balance sheet arrangementsCredit Facility is $950 million with aggregate elected commitments of $500 million.
Our cash flows from operating activities are subject to significant volatility due to changes in commodity prices for crude oil, NGLs and transactionsnatural gas, as well as variations in our production. The prices for these commodities are driven by a number of factors beyond our control, including global and regional product supply and demand, weather, product distribution, refining and processing capacity and other supply chain dynamics, among other factors. All of these factors have been impacted by the volatility and uncertainty in the global economic markets stemming from the COVID-19 pandemic and subsequent recovery, the Russia-Ukraine war, OPEC+ production decisions and related instability in the global energy markets, as well as inflationary pressures and recession fears that impact demand. In order to mitigate this volatility, we utilize derivative contracts with a number of financial institutions, all of which are participants in our Credit Facility, hedging a portion of our estimated future crude oil, NGLs and natural gas production through the first half of 2024. The level of our hedging activity and duration of the financial instruments employed depends on our desired cash flow protection, available hedge prices, the magnitude of our capital program and our operating strategy.
From time to time and under market conditions that we believe are favorable to us, we may consider capital market transactions, including the offering of debt and equity securities. We maintain an effective shelf registration statement to allow for optionality.
Capital Resources
Based upon current price and production expectations, we believe that our cash on hand, cash from operating activities and borrowings under our Credit Facility, as necessary, will be sufficient to fund our capital spending and operations for at least the next twelve months; however, future cash flows are subject to a number of variables including the length and magnitude of the current global economic uncertainties associated with continued volatility and related instability in the global energy markets. We plan to fund our 2023 capital expenditures and our operations primarily with cash on hand, cash from operating activities and, to the extent necessary, supplemental borrowings under the Credit Facility.
Additionally, we have entered into included information technology licensing,other obligations primarily consisting of our outstanding debt principal and interest obligations, derivative instruments, service agreements, operating leases, and letters of credit,asset retirement and environmental obligations, all of which are customary in our business. See Contractual Obligations“Commitments and Contingencies” summarized below, as well as Note 9 and Note 14 to the Consolidated Financial Statementsconsolidated financial statements included in Part II, Item 8, “Financial Statements and Supplementary Data” for more details related to these obligations. The Partnership is also required in certain circumstances to make certain tax distributions to its partners, which may impact cash flow from operations for the valueCompany, as discussed below under “Tax Distributions.”
Dividends
On July 7, 2022, the Company’s Board of Directors declared an inaugural cash dividend of $0.075 per share of Class A Common Stock and on November 2, 2022, a second cash dividend was declared of $0.075 per share of Class A Common Stock. The related dividends were paid on August 4, 2022 and November 28, 2022 to holders of record of Class A Common Stock as of the close of business on July 25, 2022 and November 16, 2022, respectively. In connection with any dividend, Ranger’s operating subsidiary will also make a corresponding distribution to its common unitholders. During 2022, the dividends to the holders of our off-balance sheet arrangements.Class A Common Stock and distribution to common unitholders totaled $6.3 million in the aggregate. Additionally, on March 3, 2023, the Company’s Board of Directors declared a cash dividend of $0.075 per share of Class A Common Stock payable on March 30, 2023 to holders of record of Class A Common Stock as of the close of business on March 17, 2023. We didexpect to fund dividends and distributions from available working capital and cash provided by operating activities.

60


Share Repurchase Program
In April 2022, we announced that the Board of Directors approved a share repurchase program under which we were authorized to repurchase up to $100 million of outstanding Class A Common Stock through March 31, 2023. Subsequently on July 7, 2022, the Board of Directors authorized an increase in the share repurchase program from $100 million to $140 million and extended the term of the program through June 30, 2023. We do not haveintend to repurchase additional shares pending closing of the Baytex Merger.
Subsequent to December 31, 2022 through March 3, 2023, we repurchased an additional 121,857 shares of our Class A Common Stock at an average price of $39.52 for a total cost of $4.8 million.
On August 16, 2022, the Inflation Reduction Act was signed into law and imposes a 1% excise tax on the repurchase of stock by publicly traded U.S. corporations. The excise tax is effective for stock repurchases after December 31, 2022. We are currently evaluating the impacts, if any, relationships with unconsolidated entities or financial partnerships,of this provision to our results of operations and cash flows.
Tax Distributions
Under its Partnership Agreement, the Partnership is required to make distributions to all of its limited partners pro rata on a quarterly basis and in such amounts as structured finance or special purpose entities, which would have been establishednecessary to enable the Company to timely satisfy all of its U.S. federal, state and local and non-U.S. tax liabilities. Additionally, the Partnership is required to make advances to its non-corporate partners in an amount sufficient to enable such partner to timely satisfy its U.S. federal, state and local and non-U.S. tax liabilities (a “Tax Advance”). Any such Tax Advance will be treated as an advance against and, therefore, reduce any future distributions that such partner is otherwise entitled to receive. The Company’s cash flow from operations and ability to pay cash dividends to our stockholders could be adversely impacted as a result of such cash distributions. Whether and how much Tax Advances are required to be paid is dependent upon the amount and timing of taxable income generated in the future that is allocable to partners and the federal tax rates then applicable. The Partnership was not required to make Tax Advances for the purpose of facilitating off-balance sheet arrangementsyear ended December 31, 2022. At this time we are unable to assess whether the Partnership will be required to make Tax Advances for the year ending December 31, 2023 or other contractually narrow or limited purposes. We are, therefore, not materially exposed to any financing, liquidity, market or credit risk that could arise had we engaged in such relationships.future years.
Contractual ObligationsCash Flows
The following table summarizes our contractual obligationscash flows for the periods presented:
 Year Ended December 31,
 20222021
Net cash provided by operating activities675,430 289,025 
Net cash used in investing activities(606,598)(245,174)
Net cash used in financing activities(84,921)(33,190)
Net increase (decrease) in cash and cash equivalents$(16,089)$10,661 
Cash Flows from Operating Activities. The increase of $386.4 million in net cash from operating activities for 2022 compared to 2021 was primarily attributable to the effect of 2022 cash receipts that were derived from higher average prices and higher total sales volume, partially offset by higher net payments for commodity derivatives settlements and premiums. Additionally, during 2021, there were higher acquisition, integration and strategic transaction costs and executive restructuring costs, including severance payments.
Cash Flows from Investing Activities. Our cash payments for capital expenditures were higher during 2022 compared to 2021 due primarily to significantly increased development program in 2022 along with higher drilling and completion costs associated with inflation. Additionally, our cash flow from investing activities was impacted by cash paid for oil and gas property acquisitions which closed in 2022.
The following table sets forth costs related to our capital expenditure program for the periods presented:
Year Ended December 31,
 20222021
Drilling and completion$513,943 $263,936 
Lease acquisitions, land-related costs, and geological and geophysical (seismic) costs7,188 3,773 
Pipeline, gathering facilities and other equipment, net 1
3,440 (1,252)
Total capital expenditures incurred$524,571 $266,457 

1    Includes certain capital charges to our working interest partners for completion services.
61


The following table reconciles the total costs of our capital expenditure program with the net cash paid for capital expenditures as reported in our consolidated statements of cash flows for the periods presented:
Year Ended December 31,
 20222021
Total capital expenditures program costs (from above)$524,571 $266,457 
Increase in accounts payable for capital items and accrued capitalized costs(46,616)(16,726)
Net purchases of tubular inventory and well materials 1
3,043 3,388 
Prepayments for drilling and completion services, net of (transfers)(9,125)(4,018)
Capitalized internal labor, capitalized interest and other9,613 7,242 
Total cash paid for capital expenditures$481,486 $256,343 

1    Includes purchases made in advance of drilling.
Cash Flows from Financing Activities. During 2022, we had borrowings of $610.0 million and repayments of $603.0 million under the Credit Facility and $75.2 million of share repurchases. During 2021, we received net proceeds of $396.1 million from the offering of the 9.25% Senior Notes due 2026 and $151.2 million from the issuance of equity in connection with the Juniper Transactions (See Note 4 to our consolidated financial statements included in Part II, Item 8, “Financial Statements and Supplementary Data” for additional information). The proceeds from these transactions were primarily used to: (i) repay and discharge $249.6 million of Lonestar’s outstanding long-term debt in connection with the Lonestar Acquisition, (ii) repay the $200 million Second Lien Term Loan, (iii) repay $80.5 million under the Credit Facility, and (iv) pay $9.3 million of transaction and issue costs related to the Juniper Transactions. Additionally, during 2021, we had borrowings of $70.0 million and additional repayments of $95.9 million under the Credit Facility and paid $14.4 million in debt issuance costs.
Capitalization
The following table summarizes our total capitalization as of the dates presented:
December 31,
20222021
Credit Facility borrowings$215,000 $208,000 
9.25% Senior Notes due 2026, net388,839 386,427 
Mortgage debt 1
— 8,438 
Other 2
238 2,516 
Total debt, net604,077 605,381 
Total equity1,057,022 669,508 
Total capitalization$1,661,099 $1,274,889 
Debt as a % of total capitalization36 %47 %

1    The mortgage debt at December 31, 2021 related to the corporate office building and related other assets acquired in connection with the Lonestar Acquisition for which assets were held as collateral for such debt. As of December 31, 2019:
 Payments Due by Period
 Total 
Less than
1 Year
 1-3 Years 3-5 Years 
More Than
5 Years
Credit Facility 1
$362,400
 $
 $
 $362,400
 $
Second Lien Facility 2
200,000
 
 
 200,000
 
Interest payments on long-term debt 3
107,405
 31,209
 57,879
 18,317
 
Operating leases 4
3,483
 847
 1,664
 972
 
Crude oil gathering and transportation commitments 5
102,598
 12,962
 25,924
 25,924
 37,788
Asset retirement obligations 6
113,050


 113,050
Derivatives20,488
 19,853
 635
 
 
Other commitments 7
499
 289
 210
 
 
Total contractual obligations$909,923
 $65,160
 $86,312
 $607,613
 $150,838

1 Assumes that the amount outstanding of $362 million as of December 31, 2019 will remain outstanding until its maturity in 2024. The Credit Facility has been2021, these assets were classified as a long term liabilityAssets held for sale on the consolidated balance sheets in our Consolidated Balance Sheet as described in “Financial Condition – Liquidity” and in Note 9 to the Consolidated Financial Statementsconsolidated financial statements included in Part II, Item 8, “Financial Statements and Supplementary Data.” In July 2022, the mortgage debt was fully repaid in connection with the sale of the corporate office building. See Note 4 to our consolidated financial statements included in Part II, Item 8, “Financial Statements and Supplementary Data” for additional information on the sale.
2
Assumes that the amount outstanding of $200 million as of December 31, 2019 will remain outstanding until its maturity in 2022. The Second Lien Facility has been classified as a long term liability on our Consolidated Balance Sheet as described in “Financial Condition – Liquidity” and in Note 9 to the Consolidated Financial Statements included in Part II, Item 8, “Financial Statements and Supplementary Data.”
3 2Represents estimated interest payments that will be due    Other debt of $2.2 million at December 31, 2021 was extinguished during 2022 and recorded as a gain on extinguishment of debt on the consolidated statements of operations in our consolidated financial statements included in Part II, Item 8, “Financial Statements and Supplementary Data.”.
Credit Facility. As of December 31, 2022, the Credit Facility had a $1.0 billion revolving commitment and a $950 million borrowing base, with aggregate elected commitments of $500 million and a $25 million sublimit for the issuance of letters of credit. The borrowing base under the Credit Facility is redetermined semi-annually, generally in the Spring and Second Lien Facility, assuming that the underlying LIBOR-based interest rates in effect at December 31, 2019 remain in effectFall of each year. Additionally, we and the amounts outstanding of $362.4Credit Facility lenders may, upon request, initiate a redetermination at any time during the six-month period between scheduled redeterminations. The Credit Facility is available to us for general corporate purposes including working capital. We had $1.0 million and $200$0.9 million in letters of credit outstanding as of December 31, 2019, respectively, will remain outstanding until their maturities in 20242022 and 2022,2021, respectively. The maturity date under the Credit Facility is October 6, 2025.
4

Relates primarily to office facilities and equipment leases as described in Note 11 to the Consolidated Financial Statements included in Part II, Item 8, “Financial Statements and Supplementary Data.”
5
Represents minimum payments for gathering and intermediate pipeline transportation services for our crude oil and condensate production in South Texas. The gathering portion of these commitments is recognized as GPT while the intermediate transportation and pipeline support components are recognized as a reduction to the index-based price that we receive from crude oil sold to Republic Midstream.
6
Represents the undiscounted balance payable, primarily for the plugging of inactive wells, in periods more than five years in the future for which $4.9 million, on a discounted basis, has been recognized on our Consolidated Balance Sheet as of December 31, 2019 and illustrated in Note 8 to the Consolidated Financial Statements included in Part II, Item 8, “Financial Statements and Supplementary Data.” While we may make payments to settle certain AROs, including those subject to regulatory requirements during each of the next five years, no material amounts are currently required by contract or regulatory authority to be made during this time frame.
7
Represents all other significant obligations including information technology licensing and service agreements, among others as described in Note 14 to the Consolidated Financial Statements included in Part II, Item 8, “Financial Statements and Supplementary Data.”

53
62


The outstanding borrowings under the Credit Facility bear interest at a rate equal to, at our option, either (a) a customary reference rate plus an applicable margin ranging from 1.50% to 2.50%, determined based on the utilization level under the Credit Facility or (b) effective June 1, 2022, a term Secured Overnight Financing Rate (“SOFR”) reference rate (a Eurodollar rate, including LIBOR prior to June 1, 2022), plus an applicable margin ranging from 2.50% to 3.50%, determined based on the utilization level under the Credit Facility. Interest on reference rate borrowings is payable quarterly in arrears and is computed on the basis of a year of 365/366 days, and interest on SOFR borrowings is payable every one, three or six months, at our election, and is computed on the basis of a year of 360 days. At December 31, 2022, the actual weighted-average interest rate on the outstanding borrowings under the Credit Facility was 7.25%. Unused commitment fees are charged at a rate of 0.50%.
The following table summarizes our borrowing activity under the Credit Facility for the periods presented:
 Borrowings Outstanding
End of PeriodWeighted-
Average
MaximumWeighted-
Average Rate
Three months ended December 31, 2022$215,000 $260,978 $292,000 6.91 %
Year ended December 31, 2022$215,000 $219,345 $301,000 5.25 %
The Credit Facility is guaranteed by all of the subsidiaries of the borrower (the “Guarantor Subsidiaries”), except for Boland Building, LLC. The guarantees under the Credit Facility are full and unconditional and joint and several. Substantially all of our consolidated assets are held by the Guarantor Subsidiaries. There are no significant restrictions on the ability of the borrower or any of the Guarantor Subsidiaries to obtain funds through dividends, advances or loans. The obligations under the Credit Facility are secured by a first priority lien on substantially all of our subsidiaries’ assets.
9.25% Senior Notes due 2026. On August 10, 2021, our indirect, wholly-owned subsidiary completed an offering of $400 million aggregate principal amount of senior unsecured notes due 2026 (the “9.25% Senior Notes due 2026”) that bear interest at 9.25% and were sold at 99.018% of par. Obligations under the 9.25% Senior Notes due 2026 were assumed by ROCC Holdings, LLC (formerly, Penn Virginia Holdings, LLC, hereinafter referred to as “Holdings”), as borrower, and are guaranteed by the subsidiaries of Holdings that guarantee the Credit Facility.
Covenant Compliance. The Credit Facility requires us to maintain (1) a minimum current ratio (as defined in the Credit Facility, which considers the unused portion of the total commitment as a current asset) of 1.00 to 1.00 and (2) a maximum leverage ratio (consolidated indebtedness to EBITDAX, each as defined in the Credit Facility), in each case measured as of the last day of each fiscal quarter of 3.50 to 1.00.
The Credit Facility and the Indenture contain customary affirmative and negative covenants as well as events of default and remedies. If we do not comply with the financial and other covenants in the Credit Facility, the lenders may, subject to customary cure rights, require immediate payment of all amounts outstanding under the Credit Facility.
As of December 31, 2022, the Company was in compliance with all debt covenants.
See Note 9 to the consolidated financial statements included in Part II, Item 8, “Financial Statements and Supplementary Data” for additional information on our debt.

63


Commitments and Contingencies
Long-Term Debt
We have long-term debt obligations that have various maturities and interest rates. For information on our debt obligations, see Note 9 to the consolidated financial statements included in Part II, Item 8, “Financial Statements and Supplementary Data” for more details.
Leases
We have various non-cancelable operating leases in connection with the leases of our office facilities and equipment. See Note 11 to the consolidated financial statements included in Part II, Item 8, “Financial Statements and Supplementary Data” for further information.
Gathering and Intermediate Transportation Commitments
We have agreements for gathering and intermediate pipeline transportation services for our crude oil and condensate production. For further details on these agreements, see Note 14 to the consolidated financial statements included in Part II, Item 8, “Financial Statements and Supplementary Data.”
Asset Retirement Obligations
We have asset retirement obligations (“AROs”) that primarily relate to the plugging and abandonment of oil and gas wells. For information on our AROs, see Note 8 and Note 14 to the consolidated financial statements included in Part II, Item 8, “Financial Statements and Supplementary Data.”
Critical Accounting Estimates
The process of preparing financial statements in accordance with GAAP requires our management to make estimates and judgments regarding certain items and transactions. It is possible that materially different amounts could be recorded if these estimates and judgments change or if the actual results differ from these estimates and judgments. We consider the following to be the most critical accounting estimates requiring judgment of our management.
Oil and Gas Reserves
Estimates of our oil and gas reserves are the most critical estimate included in our Consolidated Financial Statements.consolidated financial statements. Reserve estimates become the basis for determining depletive write-off rates and the recoverability of historical cost investments. There are many uncertainties inherent in estimating crude oil, NGL and natural gas reserve quantities, including projecting the total quantities in place, future production rates and the amount and timing of future development expenditures. In addition, reserve estimates of new discoveries are less precise than those of producing properties due to the lack of a production history. Accordingly, these estimates are subject to change as additional information becomes available.
There are several factors which could change the estimates of our oil and gas reserves. Significant rises or declines in commodity product prices as well as changes in our drilling plans could lead to changes in the amount of reserves as production activities become more or less economical. An additional factor that could result in a change of recorded reserves is the reservoir decline rates differing from those assumed when the reserves were initially recorded. Estimation of future production and development costs is also subject to change partially due to factors beyond our control, such as energy costs and inflation or deflation of oil field service costs.
Oil and Gas Properties
We apply the full cost method to account for our oil and gas properties. Under this method, all productive and nonproductive costs incurred in the exploration, development and acquisition of oil and gas reserves are capitalized. Such costs may be incurred both prior to and after the acquisition of a property and include lease acquisitions, geological and geophysical, or seismic, drilling, completion and equipment costs. Internal costs incurred that are directly attributable to exploration, development and acquisition activities undertaken by us for our own account, and which are not attributable to production, general corporate overhead or similar activities are also capitalized. Future development costs are estimated on a property-by-property basis based on current economic conditions and are amortized as a component of DD&A.

64


Unproved properties not being amortized include unevaluated leasehold costs and associated capitalized interest. These costs are reviewed quarterly to determine whether or not and to what extent proved reserves have been assigned to a property or if an impairment has occurred due to lease expirations, general economic conditions and other factors, in which case, the related costs along with associated capitalized interest are reclassified to the proved oil and gas properties subject to DD&A. Factors we consider in our assessment include drilling results, the terms of oil and gas leases not held by production and drilling and completion capital expenditures consistent with our plans.
At the end of each quarterly reporting period, the unamortized cost of our oil and gas properties, net of deferred income taxes, is limited to the sum of the estimated after-tax discounted future net revenues from proved properties adjusted for costs excluded from amortization and related income taxes, or a Ceiling Test. The estimated after-tax discounted future net revenues are determined using the prior 12-month’s average price based on closing prices on the first day of each month, adjusted for differentials, discounted at 10%. The calculation of the Ceiling Test and provision for DD&A are based on estimates of proved reserves. There are significant uncertainties inherent in estimating quantities of proved reserves and projecting future rates of production, timing and plan of development. AsWe had no impairments of December 31, 2019,our proved oil and gas properties during 2022. During the first quarter of 2021, the carrying value of our proved oil and gas properties was belowexceeded the limit determined by the Ceiling Test, by approximately $480 million.
Depreciation, Depletion and Amortization
DD&A of our oil and gas properties is computed usingresulting in a $1.8 million impairment. There were no other such impairments during 2021. During 2020, the units-of-production method. We apply this method by multiplying the unamortized costcarrying value of our proved oil and gas properties net of estimated salvage plus future development costs, by a rateexceeded the limit determined by dividing the physical units of oil and gas produced during the period by the total estimated units of proved oil and gas reserves at the beginning of the period.
Leases
ImplicitCeiling Test in the recognitionsecond, third and measurementfourth quarters of our lease obligations and2020, resulting in a total of $391.8 million of impairment charges recorded for the related right-of-use, or ROU, assets are certain assumptions regarding discount rates, renewal options, cost escalations and other factors. Depending upon the length of term, including extensions if applicable, the magnitude of certain contractual costs and the applicable discount rate, certain of these critical assumptions could have a material impact on the underlying measurement.


year ended December 31, 2020.
Derivative Activities
From time to time, we enter intoWe utilize derivative instruments, to mitigate our exposure to commodity price volatility. The derivative financial instruments that we employ,typically swaps, put options and call options which are placed with financial institutions that we believe are of acceptable credit risk, generally take the formrisks, to mitigate our financial exposure to commodity price volatility associated with anticipated sales of collarsour future production and, swaps, among others.at times, volatility in interest rates attributable to our variable rate debt instruments. All derivative instruments are recognized in our Consolidated Financial Statementsconsolidated financial statements at fair value with the changes recorded currently in earnings. TheWe determine the fair values of our commodity derivative instruments are determined based on discounted cash flows derived from quoted forward prices.using industry-standard models that consider various assumptions including current market and contractual prices for the underlying instruments, implied volatilities, time value and non-performance risk. All derivative transactions are subject to our risk management policy, which has been reviewed and approved by our board of directors.
Deferred Tax Asset Valuation Allowance
We record a valuation allowance to reduce our deferred tax assets to an amount that is more likely than not to be realized after consideration of expected future taxable income and reasonable tax planning strategies. In the event that we were to determine that we would not be able to realize all or a part of our deferred tax assets for which a valuation allowance had not been established, an adjustment to the deferred tax asset will be reflected in income in the period such determination is made. The most significant matter applicable to the realization of our deferred tax assets is attributable to net operating losses at the federal level as well as certain states in which we operate. Estimates of future taxable income inherently reflect a significant degree of uncertainty. As of December 31, 2019,2022, we had a full valuation allowance for all of our deferred tax assets, with the exception of our remaining refundable AMT credit carryforwards, due primarily to our inability to projectbelieve it is more likely than not that we will not have sufficient future taxable income to realize the benefit of our gross deferred tax assets and, accordingly, have maintained a full valuation allowance.
Determination of Fair Value in bothBusiness Combinations
Accounting for the federal and various state jurisdictions.
Disclosureacquisition of a business requires allocation of the Impactpurchase price to the various assets acquired and liabilities assumed at their respective fair values. The determination of Recently Issued Accounting Standardsfair value requires the use of significant estimates and assumptions, and in making these determinations management uses all available information. If necessary, we have up to one year after the acquisition closing date to finalize these fair value determinations. For assets acquired in a business combination, the determination of fair value utilizes several valuation methodologies including discounted cash flows, which has assumptions with respect to the timing and amount of future revenue and expenses associated with an asset, and in the case of oil and gas companies, these as they relate to the reserves associated with its oil and gas properties. The assumptions made in performing these valuations include, but are not limited to, discount rate, future revenues and operating costs, projections of capital costs, and other assumptions believed to be Adoptedconsistent with those used by principal market participants. Due to the specialized nature of these calculations, we engage third-party specialists to assist management in evaluating our assumptions as well as appropriately measuring the Futurefair value of assets acquired and liabilities assumed.
In June 2016, the FASB issued ASU 2016–13,
65

Measurement of Credit Losses on Financial Instruments
, or ASU 2016–13, which changes the recognition model for the impairment of financial instruments, including accounts receivable, loans
Item 7A. Quantitative and held-to-maturity debt securities, among others. ASU 2016–13 is required to be adopted using the modified retrospective method by January 1, 2020. In contrast to current guidance, which considers current information and events and utilizes a probable threshold, (an “incurred loss” model), ASU 2016–13 mandates an “expected loss” model. The expected loss model: (i) estimates the risk of loss even when risk is remote, (ii) estimates losses over the contractual life, (iii) considers past events, current conditions and reasonably supported forecasts and (iv) has no recognition threshold. ASU 2016–13 will have applicability to our accounts receivable portfolio, particularly those receivables attributable to our joint interest partners which have a higher credit risk than those associated with our traditional customer receivables. We will adopt ASU 2016–13 effective January 1, 2020. While we do not anticipate that the adoption of ASU 2016–13 will have a significant impact on our Consolidated Financial Statements and related disclosures, we will be applying new procedures and controls to our customer and partner billing processes in order to apply the expected loss model on a monthly basis.Qualitative Disclosures About Market Risk


55


Item 7A
Quantitative and Qualitative Disclosures About Market Risk
Market risk is the risk of loss arising from adverse changes in market rates and prices. The principal market risks to which we are exposed are interest rate risk and commodity price risk.
Interest Rate Risk
Our interest rate risk is attributable to our borrowings under the Credit Facility, and the Second Lien Facility, which areis subject to variable interest rates. As of December 31, 2019,2022, we had borrowings of $362.4$215.0 million under the Credit Facility at an interest rate of 3.75%. As of December 31, 2019, we had borrowings of $192.6 million under the Second Lien Facility, net of OID and issuance costs, at an interest rate of 8.81%7.25%. Assuming a constant borrowing level under the Credit and Second Lien Facilities,Facility, an increase (decrease) in the interest rate of one percent1% would result in an increase (decrease) in aggregate interest expense of approximately $5.6$2.2 million on an annual basis.
Commodity Price Risk
We produce and sell crude oil, NGLs and natural gas. As a result, our financial results are affected when prices for these commodities fluctuate. Our price risk management programs permit the utilization of derivative financial instruments (such as collars and swaps) to seek to mitigate the price risks associated with fluctuations in commodity prices as they relate to a portion of our anticipated production. The derivative instruments are placed with major financial institutions that we believe are of acceptable credit risk. The fair values of our derivative instruments are significantly affected by fluctuations in the prices of crude oil, NGLs and natural gas. As of December 31, 2019, we were not utilizing any derivative instruments with respect to NGLs and natural gas, although we may do so in the future. 
As of December 31, 2019, we reported net2022, our commodity derivative liabilitiesportfolio was in a net liability position in the amount of $20.0$41.3 million. The contracts associated with this position are with nineseven counterparties, all of which are investment grade financial institutions. This concentration may impact our overall credit risk, either positively or negatively, in that these counterparties may be similarly affected by changes in economic or other conditions. We have neither paid to, nor received from, our counterparties any cash collateral in connection with our derivative positions. Furthermore, our derivative contracts are not subject to margin calls or similar accelerations. No significant uncertainties exist related to the collectability of amounts that may be owed to us by these counterparties.
During the year ended December 31, 2019,2022, we reported a net commodity derivative lossesloss of $68.1$162.7 million. We have experienced and could continue to experience significant changes in the estimate of derivative gains or losses recognized due to fluctuations in the value of our derivative instruments. Our results of operations are affected by the volatility of unrealized gains and losses and changes in fair value, which fluctuate with changes in crude oil, NGL and natural gas prices. These fluctuations could be significant in a volatile pricing environment. See Note 6 to our Consolidated Financial Statements included in Part II, Item 8,consolidated financial statements included in Part II, Item 8, “Financial Statements and Supplementary Data” for a further description of our commodity price risk management activities.


The following table sets forth our commodity derivative positions as of December 31, 2019:
  1Q2020 2Q2020 3Q2020 4Q2020 1Q2021 2Q2021 3Q2021 4Q2021
NYMEX WTI Crude Swaps 


Average Volume Per Day (barrels) 15,648
 12,648
 10,630
 10,630
 3,333
 3,297
 1,630
 1,630
Weighted Average Swap Price ($/barrel) $55.34
 $54.96
 $54.77
 $54.77
 $55.89
 $55.89
 $55.50
 $55.50


NYMEX WTI Purchased Puts/Sold Calls 


Average Volume Per Day (barrels) 

 3,297
 4,891
 

 1,667
 1,648


Weighted Average Purchased Put Price ($/barrel) 

 $55.00
 $55.00
 

 $55.00
 $55.00


Weighted Average Sold Call ($/barrel) 

 $57.69
 $58.42
 

 $58.00
 $58.00


NYMEX WTI Sold Puts 


Average Volume Per Day (barrels) 


 5,000
 4,945
 1,630
 1,630
Weighted Average Sold Put Price ($/barrel) 


 $44.00
 $44.00
 $44.00
 $44.00


MEH Crude Swaps 


Average Volume Per Day (barrels) 2,000
 2,000
 2,000
 2,000


Weighted Average Swap Price ($/barrel) $61.03
 $61.03
 $61.03
 $61.03


The following table illustrates the estimated impact on the fair values of our derivative financial instruments and operating income attributable to hypothetical changes in the underlying commoditycrude oil prices. This illustration assumes that crude oil production volumes, NGL prices and production volumes, and natural gas prices and production volumes remain constant at anticipated levels. The estimated changes in operating income exclude potential cash receipts or payments in settling outstandingthese derivative positions.
Change of $10.00 per Barrel of Crude Oil
($ in millions)
Change of 10% per bbl of 
Crude Oil
($ in millions)
Increase
 Decrease
IncreaseDecrease
Effect on the fair value of crude oil derivatives 1
$(69.8) $66.6
Effect on the fair value of crude oil derivatives 1
$(36.8)$36.3 
Effect on 2020 operating income, excluding crude oil derivatives 2
$29.0
 $(27.0)
Effect on 2023 operating income, excluding derivatives 2
$67.3 $(50.4)

1 Based on derivatives outstanding as of December 31, 2019.2022.
2 Based on our 20202023 Business Plan consistent with the assumptions used to determine our proved reserves as disclosed in Item 2, “Properties – Summary of Oil and Gas Reserves.” These sensitivities are subject to significant changechange.

66

57


Item 8      
Item 8. Financial Statements and Supplementary Data

PENN VIRGINIA
RANGER OIL CORPORATION 
INDEX TO CONSOLIDATED FINANCIAL STATEMENTS
 
Page
1. Nature of Operations
2.
3.
4. Acquisitions and Divestitures
5. Accounts Receivable and Major Customers
6.
7.
8.
9.
10.
11.
12. Additional
13.
14.
15.
16.
17. Interest Expense
18. Earnings per Share
Supplemental Quarterly Financial Information (unaudited)
Supplemental Information on Oil and Gas Producing Activities (unaudited)


58
67


Report of Independent Registered Public Accounting Firm


Board of Directors and Shareholders
Penn VirginiaRanger Oil Corporation
Opinion on the financial statements
We have audited the accompanying consolidated balance sheets of Penn VirginiaRanger Oil Corporation (a Virginia corporation) and subsidiaries (the “Company”) as of December 31, 20192022 and 2018,2021, the related consolidated statements of operations, comprehensive income shareholders’(loss), equity, and cash flows for each of the three years in the period ended December 31, 2019,2022, and the related notes (collectively referred to as the “financial statements”). In our opinion, thefinancial statements present fairly, in all material respects, the financial position of the Companyas of December 31, 20192022 and 2018,2021, and the results of itsoperations and itscash flows for each of the three years in the period ended December 31, 2019,2022, in conformity with accounting principles generally accepted in the United States of America.
We also have audited, in accordance with the standards of the Public Company Accounting Oversight Board (United States) (“PCAOB”), the Company’s internal control over financial reporting as of December 31, 2019,2022, based on criteria established in the 2013Internal Control-IntegratedControl—Integrated Framework issued by the Committee of Sponsoring Organizations of the Treadway Commission (“COSO”), and our report dated February 28, 2020March 9, 2023 expressed an unqualified opinion.
Basis for opinion
These financial statements are the responsibility of the Company’s management. Our responsibility is to express an opinion on the Company’s financial statements based on our audits. We are a public accounting firm registered with the PCAOB and are required to be independent with respect to the Company in accordance with the U.S. federal securities laws and the applicable rules and regulations of the Securities and Exchange Commission and the PCAOB.
We conducted our audits in accordance with the standards of the PCAOB. Those standards require that we plan and perform the audit to obtain reasonable assurance about whether the financial statements are free of material misstatement, whether due to error or fraud. Our audits included performing procedures to assess the risks of material misstatement of the financial statements, whether due to error or fraud, and performing procedures that respond to those risks. Such procedures included examining, on a test basis, evidence supportingregarding the amounts and disclosures in the financial statements. Our audits also included evaluating the accounting principles used and significant estimates made by management, as well as evaluating the overall presentation of the financial statements. We believe that our audits provide a reasonable basis for our opinion.
Critical audit matter
The critical audit matter communicated below is a matter arising from the current period audit of the financial statements that was communicated or required to be communicated to the audit committee and that: (1) relates to accounts or disclosures that are material to the financial statements and (2) involved our especially challenging, subjective, or complex judgments. The communication of critical audit matters does not alter in any way our opinion on the financial statements, taken as a whole, and we are not, by communicating the critical audit matter below, providing a separate opinion on the critical audit matter or on the accounts or disclosures to which it relates.
The development of estimated proved reserves used in the calculation of depletion, depreciation, and amortization expense under the full cost method of accounting.
As described further in note 3 to the financial statements, the Company accounts for its oil and gas properties using the full cost method of accounting which requires management to make estimates of proved reserve volumes and future net revenues to record depletion, depreciation, and amortization expense. To estimate the volume of proved reserves and future net revenue, management makes significant estimates and assumptions including forecasting the production decline rate of producing properties and forecasting the timing and volume of production associated with the Company’s development plan for proved undeveloped properties. In addition, the estimation of proved reserves is also impacted by management’s judgments and estimates regarding the financial performance of wells associated with proved reserves to determine if wells are expected with reasonable certainty to be economical under the appropriate pricing assumptions required in the estimation of depletion, depreciation and amortization expense. We identified the estimation of proved reserves of oil and gas properties as a critical audit matter.

68


The principal consideration for our determination that the estimation of proved reserves is a critical audit matter is that changes in certain inputs and assumptions necessary to estimate the volumes and future net revenues of the Company’s proved reserves require a high degree of subjectivity and could have a significant impact on the measurement of depletion, depreciation, and amortization expense. In turn, auditing those inputs and assumptions required subjective and complex auditor judgment.
Our audit procedures related to the estimation of proved reserves included the following, among others.
We tested the design and operating effectiveness of controls relating to management’s estimation of proved reserves for the purpose of measuring depletion, depreciation, and amortization expense.
We evaluated the independence, objectivity, and professional qualifications of the Company’s reserve engineers, made inquiries of those specialists regarding the process followed and judgments made to estimate the Company’s proved reserve volumes, and read the reserve report prepared by the Company’s specialists.
To the extent key inputs and assumptions used to determine proved reserve volumes and other cash flow inputs and assumptions are derived from the Company’s accounting records, including, but not limited to historical pricing differentials, operating costs, estimated capital costs, and ownership interests, we tested management’s process for determining the assumptions, including examining the underlying support on a sample basis. Specifically, our audit procedures involved testing management’s assumptions by performing the following:
We compared the estimated pricing differentials used in the reserve report to realized prices related to revenue transactions recorded in the current year and examined contractual support for the pricing differentials.
We tested models used to estimate the future operating costs in the reserve report and compared amounts to historical operating costs.
We evaluated the method used to determine the future capital costs and compared estimated future capital expenditures used in the reserve report to amounts expended for recently drilled and completed wells to ascertain its reasonableness.
We tested the working and net revenue interests used in the reserve report by inspecting land and division order records.
We evaluated the Company’s evidence supporting the amount of proved undeveloped properties reflected in the reserve report by examining historical conversion rates and support for the Company’s ability and intent to develop the proved undeveloped properties.
We applied analytical procedures to the forecasted reserve report production by comparing to historical actual results and to the prior year reserve report.

/s/ GRANT THORNTON LLP
We have served as the Company’s auditor since 2016.
Houston, Texas
February 28, 2020March 9, 2023

69


Report of Independent Registered Public Accounting Firm


Board of Directors and Shareholders
Penn VirginiaRanger Oil Corporation
Opinion on internal control over financial reporting
We have audited the internal control over financial reporting of Penn VirginiaRanger Oil Corporation (a Virginia corporation) and subsidiaries (the “Company”) as of December 31, 2019,2022, based on criteria established in the 2013 Internal Control-IntegratedControl—Integrated Framework issued by the Committee of Sponsoring Organizations of the Treadway Commission (“COSO”). In our opinion, the Company maintained, in all material respects, effective internal control over financial reporting as of December 31, 2019,2022, based on criteria established in the 2013 Internal Control-IntegratedControl—Integrated Framework issued by COSO.
We also have audited, in accordance with the standards of the Public Company Accounting Oversight Board (United States) (“PCAOB”), the consolidated financial statements of the Company as of and for the year ended December 31, 2019,2022, and our report dated February 28, 2020March 9, 2023 expressed an unqualified opinion on those financial statements.
Basis for opinion
The Company’s management is responsible for maintaining effective internal control over financial reporting and for its assessment of the effectiveness of internal control over financial reporting, included in the accompanying Management’s Annual Report on Internal Control Over Financial Reporting. Our responsibility is to express an opinion on the Company’s internal control over financial reporting based on our audit. We are a public accounting firm registered with the PCAOB and are required to be independent with respect to the Company in accordance with the U.S. federal securities laws and the applicable rules and regulations of the Securities and Exchange Commission and the PCAOB.
We conducted our audit in accordance with the standards of the PCAOB. Those standards require that we plan and perform the audit to obtain reasonable assurance about whether effective internal control over financial reporting was maintained in all material respects. Our audit included obtaining an understanding of internal control over financial reporting, assessing the risk that a material weakness exists, testing and evaluating the design and operating effectiveness of internal control based on the assessed risk, and performing such other procedures as we considered necessary in the circumstances. We believe that our audit provides a reasonable basis for our opinion.
Definition and limitations of internal control over financial reporting
A company’s internal control over financial reporting is a process designed to provide reasonable assurance regarding the reliability of financial reporting and the preparation of financial statements for external purposes in accordance with generally accepted accounting principles. A company’s internal control over financial reporting includes those policies and procedures that (1) pertain to the maintenance of records that, in reasonable detail, accurately and fairly reflect the transactions and dispositions of the assets of the company; (2) provide reasonable assurance that transactions are recorded as necessary to permit preparation of financial statements in accordance with generally accepted accounting principles, and that receipts and expenditures of the company are being made only in accordance with authorizations of management and directors of the company; and (3) provide reasonable assurance regarding prevention or timely detection of unauthorized acquisition, use, or disposition of the company’s assets that could have a material effect on the financial statements.
Because of its inherent limitations, internal control over financial reporting may not prevent or detect misstatements. Also, projections of any evaluation of effectiveness to future periods are subject to the risk that controls may become inadequate because of changes in conditions, or that the degree of compliance with the policies or procedures may deteriorate.

/s/ GRANT THORNTON LLP
Houston, Texas
February 28, 2020


March 9, 2023
60
70


PENN VIRGINIARANGER OIL CORPORATION
CONSOLIDATED STATEMENTS OF OPERATIONS
(in thousands, except per share data)
Year Ended December 31,
 202220212020
Revenues and other 
Crude oil$1,003,255 $517,301 $251,741 
Natural gas liquids67,453 33,443 8,948 
Natural gas70,895 26,080 10,103 
Other operating income, net3,586 2,667 2,476 
Total revenues and other1,145,189 579,491 273,268 
Operating expenses 
Lease operating85,792 45,402 37,463 
Gathering, processing and transportation36,698 23,647 22,050 
Production and ad valorem taxes61,377 31,041 16,619 
General and administrative40,972 66,529 33,789 
Depreciation, depletion and amortization244,455 131,657 140,673 
Impairments of oil and gas properties— 1,811 391,849 
Total operating expenses469,294 300,087 642,443 
Operating income (loss)675,895 279,404 (369,175)
Other income (expense) 
Interest expense, net of amounts capitalized(48,931)(33,161)(31,257)
Gain (loss) on extinguishment of debt2,157 (8,860)— 
Derivatives gains (losses)(162,672)(136,999)88,422 
Other, net2,255 94 (850)
Income (loss) before income taxes468,704 100,478 (312,860)
Income tax (expense) benefit(4,186)(1,560)2,303 
Net income (loss)464,518 98,918 (310,557)
Net income attributable to Noncontrolling interest(246,825)(58,689)— 
Net income (loss) attributable to Class A common shareholders$217,693 $40,229 $(310,557)
Net income (loss) per share attributable to Class A common shareholders: 
Basic$10.77 $2.41 $(20.46)
Diluted$10.53 $2.34 $(20.46)
Weighted average shares outstanding – basic20,205 16,695 15,176 
Weighted average shares outstanding – diluted20,826 17,165 15,176 
 Year Ended December 31,
 2019 2018 2017
Revenues     
Crude oil$434,713
 $402,485
 $140,886
Natural gas liquids16,589
 21,073
 10,066
Natural gas17,733
 15,972
 8,517
Gain (loss) on sales of assets, net5
 (177) (36)
Other revenues, net2,176
 1,479
 621
Total revenues471,216
 440,832
 160,054
Operating expenses     
Lease operating43,088
 35,879
 21,784
Gathering, processing and transportation23,197
 18,626
 10,734
Production and ad valorem taxes28,057
 23,547
 8,814
General and administrative25,484
 26,064
 18,201
Depreciation, depletion and amortization174,569
 127,961
 48,649
Total operating expenses294,395
 232,077
 108,182
Operating income176,821
 208,755
 51,872
Other income (expense)     
Interest expense, net of amounts capitalized(35,811) (26,462) (6,392)
Derivatives(68,131) 37,427
 (17,819)
Other, net(153) 2,266
 58
Reorganization items, net
 3,322
 
Income before income taxes72,726
 225,308
 27,719
Income tax (expense) benefit(2,137) (523) 4,943
Net income$70,589
 $224,785
 $32,662
      
Net income per share:     
Basic$4.67
 $14.93
 $2.18
Diluted$4.67
 $14.70
 $2.17
      
Weighted average shares outstanding – basic15,110
 15,059
 14,996
Weighted average shares outstanding – diluted15,126
 15,292
 15,063

See accompanying notes to consolidated financial statements.

71
61


PENN VIRGINIARANGER OIL CORPORATION 
CONSOLIDATED STATEMENTS OF COMPREHENSIVE INCOME (LOSS)
(in thousands)
 Year Ended December 31,
 202220212020
Net income (loss)$464,518 $98,918 $(310,557)
Other comprehensive income (loss):
Change in pension and postretirement obligations, net of tax 1
— 20 (72)
Comprehensive income (loss)464,518 98,938 (310,629)
Net income attributable to Noncontrolling interest(246,825)(58,689)— 
Other comprehensive income attributable to Noncontrolling interest 1
— (23)— 
Comprehensive income (loss) attributable to Class A common shareholders$217,693 $40,226 $(310,629)
 Year Ended December 31,
 2019 2018 2017
Net income$70,589
 $224,785
 $32,662
Other comprehensive income (loss):     
Change in pension and postretirement obligations, net of tax(141) 82
 (73)
 (141) 82
 (73)
Comprehensive income$70,448
 $224,867
 $32,589
___________________________________________
1 The amounts for the 2022 periods are minimal and round down to zero.
 
See accompanying notes to consolidated financial statements.

72
62


PENN VIRGINIARANGER OIL CORPORATION
CONSOLIDATED BALANCE SHEETS
(in thousands, except share data)
 December 31,
20222021
Assets  
Current assets  
Cash and cash equivalents$7,592 $23,681 
Accounts receivable, net of allowance for credit losses139,715 118,594 
Derivative assets29,714 11,478 
Prepaid and other current assets22,264 20,998 
Assets held for sale1,186 11,400 
Total current assets200,471 186,151 
Property and equipment, net1,809,000 1,383,348 
Derivative assets316 2,092 
Other assets4,420 5,017 
Total assets$2,014,207 $1,576,608 
Liabilities and Shareholders’ Equity  
Current liabilities  
Accounts payable and accrued liabilities$265,609 $214,381 
Derivative liabilities67,933 50,372 
Current portion of long-term debt— 4,129 
Total current liabilities333,542 268,882 
Deferred income taxes6,216 2,793 
Derivative liabilities3,416 23,815 
Other non-current liabilities9,934 10,358 
Long-term debt, net604,077 601,252 
Commitments and contingencies (Note 14)
Equity  
Preferred stock of $0.01 par value – 5,000,000 shares authorized; none issued as of December 31, 2022 and 2021— — 
Class A common stock of $0.01 par value – 110,000,000 shares authorized; 19,074,864 and 21,090,259 shares issued and outstanding as of December 31, 2022 and 2021, respectively190 729 
Class B common stock of $0.01 par value – 30,000,000 shares authorized; 22,548,998 shares issued and outstanding as of December 31, 2022 and 2021
Paid-in capital220,062 273,329 
Retained earnings264,256 49,583 
Accumulated other comprehensive loss(111)(111)
Ranger Oil shareholders’ equity484,399 323,532 
Noncontrolling interest572,623 345,976 
Total equity1,057,022 669,508 
Total liabilities and equity$2,014,207 $1,576,608 
 December 31,
 2019 2018
Assets 
  
Current assets 
  
Cash and cash equivalents$7,798
 $17,864
Accounts receivable, net of allowance for doubtful accounts70,716
 66,038
Derivative assets4,131
 34,932
Income taxes receivable1,236
 2,471
Other current assets4,458
 5,125
Total current assets88,339
 126,430
Property and equipment, net (full cost method)1,120,425
 927,994
Derivative assets2,750
 10,100
Deferred income taxes
 1,949
Other assets6,724
 2,481
Total assets$1,218,238
 $1,068,954
    
Liabilities and Shareholders’ Equity 
  
Current liabilities 
  
Accounts payable and accrued liabilities$105,824
 $103,700
Derivative liabilities23,450
 991
Total current liabilities129,274
 104,691
Other liabilities8,382
 5,533
Deferred income taxes1,424
 
Derivative liabilities3,385
 
Long-term debt, net555,028
 511,375
    
Commitments and contingencies (Note 14)


Shareholders’ equity: 
  
Preferred stock of $0.01 par value – 5,000,000 shares authorized; none issued
 
Common stock of $0.01 par value – 45,000,000 shares authorized; 15,135,598 and 15,080,594 shares issued as of December 31, 2019 and December 31, 2018, respectively151
 151
Paid-in capital200,666
 197,630
Retained earnings319,987
 249,492
Accumulated other comprehensive income (loss)(59) 82
Total shareholders’ equity520,745
 447,355
Total liabilities and shareholders’ equity$1,218,238
 $1,068,954

See accompanying notes to consolidated financial statements.

73
63


PENN VIRGINIARANGER OIL CORPORATION
CONSOLIDATED STATEMENTS OF CASH FLOWS
(in thousands)
 Year Ended December 31,
 202220212020
Cash flows from operating activities
Net income (loss)$464,518 $98,918 $(310,557)
Adjustments to reconcile net income (loss) to net cash provided by operating activities:
(Gain) loss on extinguishment of debt(2,157)8,860 — 
Depreciation, depletion and amortization244,455 131,657 140,673 
Impairments of oil and gas properties— 1,811 391,849 
Derivative contracts:
Net losses (gains)162,672 136,999 (88,422)
Cash settlements and premiums (paid) received, net(183,378)(130,475)78,087 
Deferred income tax expense (benefit)3,422 1,249 (1,424)
Non-cash interest expense3,404 2,735 4,150 
Share-based compensation5,554 15,589 3,284 
Other, net(361)19 13 
Changes in operating assets and liabilities:
Accounts receivable, net(21,721)(38,676)28,078 
Accounts payable and accrued expenses6,528 60,338 (24,244)
Other assets and liabilities(7,506)778 
Net cash provided by operating activities675,430 289,025 222,265 
Cash flows from investing activities
Capital expenditures(481,486)(256,343)(168,565)
Acquisitions of oil and gas properties(137,532)— — 
Cash acquired in Lonestar Acquisition— 11,009 — 
Proceeds from sales of assets, net12,420 160 87 
Net cash used in investing activities(606,598)(245,174)(168,478)
Cash flows from financing activities
Proceeds from credit facility borrowings610,000 70,000 51,000 
Repayments of credit facility borrowings(603,000)(176,400)(99,000)
Repayments of second lien term loan— (200,000)— 
Proceeds from 9.25% Senior Notes due 2026, net of discount— 396,072 — 
Repayments of acquired debt(8,559)(249,700)— 
Payments for share repurchases(75,203)— — 
Distributions to Noncontrolling interest(3,382)— — 
Dividends paid(2,921)— — 
Proceeds from redeemable common units— 151,160 — 
Proceeds from redeemable preferred stock— — 
Transaction costs paid on behalf of Noncontrolling interest— (5,543)— 
Issuance costs paid for Noncontrolling interest securities— (3,758)— 
Withholding taxes for share-based compensation(954)(656)(487)
Debt issuance costs paid(902)(14,367)(78)
Net cash used in financing activities(84,921)(33,190)(48,565)
Net increase (decrease) in cash and cash equivalents(16,089)10,661 5,222 
Cash and cash equivalents – beginning of period23,681 13,020 7,798 
Cash and cash equivalents – end of period$7,592 $23,681 $13,020 
Supplemental disclosures:
Cash paid for:
Interest, net of amounts capitalized$46,071 $15,609 $27,333 
Income tax refunds, net of payments$— $288 $(2,471)
Non-cash investing and financing activities:
Changes in property and equipment related to capital contributions$— $(38,561)$— 
Changes in accrued liabilities related to capital expenditures$46,616 $16,726 $(18,671)
Change in property and equipment related to acquisitions$— $(480,563)$— 
Equity and replacement awards issued as consideration in the Lonestar Acquisition$— $173,576 $— 
 Year Ended December 31,
 2019 2018 2017
Cash flows from operating activities     
Net income$70,589
 $224,785
 $32,662
Adjustments to reconcile net income to net cash provided by operating activities:     
Non-cash reorganization items
 (3,322) 
Depreciation, depletion and amortization174,569
 127,961
 48,649
Derivative contracts:     
Net (gains) losses68,131
 (37,427) 17,819
Cash settlements, net(4,136) (48,291) (3,511)
Deferred income tax expense (benefit)3,373
 2,994
 (4,943)
Loss (gain) on sales of assets, net(5) 177
 36
Non-cash interest expense3,354
 3,416
 2,122
Share-based compensation (equity-classified)4,082
 4,618
 3,809
Other, net52
 44
 61
Changes in operating assets and liabilities:     
Accounts receivable, net(5,079) (23,674) (43,318)
Accounts payable and accrued expenses4,690
 21,109
 28,542
Other assets and liabilities574
 (258) (218)
Net cash provided by operating activities320,194
 272,132
 81,710
Cash flows from investing activities     
Acquisitions, net(6,516) (85,387) (200,849)
Capital expenditures(362,743) (430,592) (115,687)
Proceeds from sales of assets, net215
 7,683
 869
Net cash used in investing activities(369,044) (508,296) (315,667)
Cash flows from financing activities     
Proceeds from credit facility borrowings76,400
 244,000
 59,000
Repayment of credit facility borrowings(35,000) 
 (7,000)
Proceeds from second lien note
 
 196,000
Debt issuance costs paid(2,616) (989) (9,787)
Proceeds received from rights offering, net
 
 55
Other, net
 
 (55)
Net cash provided by financing activities38,784
 243,011
 238,213
Net increase (decrease) in cash and cash equivalents(10,066) 6,847
 4,256
Cash and cash equivalents - beginning of period17,864
 11,017
 6,761
Cash and cash equivalents - end of period$7,798
 $17,864
 $11,017
Supplemental disclosures:     
Cash paid for:     
Interest, net of amounts capitalized$32,398
 $22,599
 $4,102
Income taxes, net of (refunds)$(2,471) $
 $
Reorganization items, net$79
 $540
 $954
Non-cash investing and financing activities:     
Changes in accounts receivable, net related to acquisitions$(152) $(27,107) $(2,583)
Changes in other assets related to acquisitions$
 $(743) $3,201
Changes in accrued liabilities related to acquisitions$(540) $(11,182) $(2,507)
Changes in accrued liabilities related to capital expenditures$(3,602) $44
 $19,910
Changes in other liabilities for asset retirement obligations related to acquisitions$83
 $385
 $494
 
See accompanying notes to consolidated financial statements.

64
74


PENN VIRGINIARANGER OIL CORPORATION
CONSOLIDATED STATEMENTS OF SHAREHOLDERS’ EQUITY
(in thousands)
Shares 1
Preferred Shares OutstandingClass A Common Shares / Common Shares OutstandingClass B Common Shares OutstandingPreferred StockClass A Common Stock / Common StockClass B Common StockPaid-in CapitalRetained EarningsAccumulated Other Comprehensive LossNoncontrolling InterestTotal Equity
Balance as of December 31, 2019 15,136  $ $151 $ $200,666 $319,987 $(59)$ $520,745 
Net loss— — — — — — — (310,557)— — (310,557)
Restricted stock unit vesting— 64 — — — (487)— — — (486)
Cumulative effect of change in accounting principle— — — — — — — (76)— — (76)
Common stock issued related to share-based compensation and other, net— — — — — — 3,284 — (72)— 3,212 
Balance as of December 31, 2020 15,200   152  203,463 9,354 (131) 212,838 
Net income— — — — — — — 40,229 — 58,689 98,918 
Issuance of preferred stock225 — — — — — — — — 
Issuance of Noncontrolling interest— — — — — — (50,068)— — 229,620 179,552 
Conversion of preferred stock into common stock 1
(225)— 22,549 (2)— — — — — — 
Issuance of common stock related to the Lonestar Acquisition 2
— 5,750 — — 575 — 162,607 — — — 163,182 
Change in ownership related to the Lonestar Acquisition— — — — — — (57,604)— — 57,644 40 
Common stock issued related to share-based compensation and other, net— 140 — — — 14,931 — 20 23 14,976 
Balance as of December 31, 2021 21,090 22,549  729 2 273,329 49,583 (111)345,976 669,508 
Net income— — — — — — — 217,693 — 246,825 464,518 
Repurchase of Class A Common Stock— (2,150)— — (22)— (75,181)— — — (75,203)
Change in ownership, net— — — — — — 16,796 — — (16,796)— 
Distributions to Noncontrolling interest— — — — — — — — — (3,382)(3,382)
Dividends declared ($0.075 per share of Class A common stock)— — — — — — — (3,020)— — (3,020)
Common stock issued related to share-based compensation and other, net— 135 — — (517)— 5,118 — — — 4,601 
Balance as of December 31, 2022 19,075 22,549 $ $190 $2 $220,062 $264,256 $(111)$572,623 $1,057,022 
 
Common
Shares
Outstanding
 
Preferred
Stock
 
Common
Stock
 
Paid-in
Capital
 Retained Earnings (Accumulated Deficit) 
Accumulated
Other
Comprehensive
Income (Loss)
 Total Shareholders’ Equity
December 31, 201614,992
 $
 $150
 $190,621
 $(5,296) $73
 $185,548
Net Income


 32,662
 
 32,662
Share-based compensation
 
 
 3,809
 
 
 3,809
Restricted stock unit vesting27
 
 
 (351) 
 
 (351)
All other changes
 
 
 44
 
 (73) (29)
December 31, 201715,019
 
 150
 194,123
 27,366
 
 221,639
Net Income


 224,785
 
 224,785
Share-based compensation
 
 
 4,618
 
 
 4,618
Restricted stock unit vesting61
 
 1
 (1,111) 
 
 (1,110)
Cumulative effect of change in accounting principle (see Note 5)


 (2,659) 
 (2,659)
All other changes


 82
 82
December 31, 201815,080
 
 151
 197,630
 249,492
 $82
 447,355
Net Income


 70,589
 
 70,589
Share-based compensation
 
 
 4,082
 
 
 4,082
Restricted stock unit vesting56
 
 
 (1,046) 
 
 (1,046)
Cumulative effect of change in accounting principle (see Note 11)


 (94) 
 (94)
All other changes


 (141) (141)
December 31, 201915,136
 $
 $151
 $200,666
 $319,987
 $(59) $520,745
__________________________________________________________________________________
1 In October 2021, the Company effected a recapitalization, pursuant to which, among other things, the Company’s common stock was renamed and reclassified as Class A common stock, par value $0.01 per share (“Class A Common Stock”), a new class of capital stock of the Company, Class B Common Stock, par value $0.01 per share (“Class B Common Stock”) was authorized, and the designation of the Series A Preferred Stock was cancelled. See Note 15 in the notes to the consolidated financial statements for further details.
2Includes $4.5 million attributed to pre-combination services for replacement awards issued in connection with the Lonestar Acquisition. See Note 4 and Note 16 for further details.
 
 See accompanying notes to consolidated financial statements.

75
65


PENN VIRGINIARANGER OIL CORPORATION
NOTES TO CONSOLIDATED FINANCIAL STATEMENTS
(in thousands, except per share amounts or where otherwise indicated)


1. 
Nature of Operations
Penn VirginiaNote 1 – Organization and Description of Business 
Ranger Oil Corporation (together with its consolidated subsidiaries, unless the context otherwise requires, “Penn Virginia,“Ranger Oil,” the “Company,” “we,” “us” or “our”) is an independent oil and gas company engaged infocused on the onshore exploration, development and production of oil, natural gas liquids (“NGLs”) and natural gas. Our current operations consist of drilling unconventional horizontal development wells and operating our producing wells in the Eagle Ford Shale (the “Eagle Ford”) in Gonzales, Lavaca, FayetteSouth Texas. We operate in and DeWitt Countiesreport our financial results and disclosures as one segment, which is the development and production of crude oil, NGLs and natural gas.
On January 15, 2021 (the “Juniper Closing Date”), the Company consummated the transactions (collectively, the “Juniper Transactions”) contemplated by: (i) the Contribution Agreement, dated November 2, 2020, by and among the Company, ROCC Energy Holdings, L.P. (formerly PV Energy Holdings, L.P., the “Partnership”) and JSTX Holdings, LLC (“JSTX”), an affiliate of Juniper Capital Advisors, L.P. (“Juniper Capital” and, together with JSTX and Rocky Creek Resources, LLC, “Juniper”); and (ii) the Contribution Agreement, dated November 2, 2020 (the “Contribution Agreement”), by and among Rocky Creek Resources, LLC, an affiliate of Juniper Capital (“Rocky Creek”), the Company and the Partnership pursuant to which Juniper contributed $150 million in cash and certain oil and gas assets in South Texas.Texas in exchange for equity. See Note 3 and Note 4 for further discussion.
2. 
Note 2 – Basis of Presentation
Adoption of Recently Issued Accounting PronouncementsPresentation
Our consolidated financial statements include the accounts of Ranger Oil and Comparability to Prior Periods
Effective January 1, 2019, we adopted and began applyingall of our subsidiaries as of the relevant guidancedates. Intercompany balances and transactions have been eliminated. A substantial noncontrolling interest in our subsidiaries is provided for in our consolidated statements of operations and comprehensive income (loss) and our consolidated balance sheets as of and for the Financial Accounting Standards Board’s (“FASB”) Accounting Standards Update (“ASU”) 2016–02, Leases (“ASU 2016–02”)periods ended December 31, 2022 and related amendments to2021. Our consolidated financial statements have been prepared in conformity with accounting principles generally accepted in the United States of America (“GAAP”) and the rules and regulations of the Securities and Exchange Commission (the “SEC”). Preparation of these statements involves the use of estimates and judgments where appropriate. In the opinion of management, all adjustments considered necessary for a fair presentation of our consolidated financial statements have been included. Certain reclassifications have been made to prior period amounts to conform to the current period presentation. Such reclassifications did not have a material impact on prior period financial statements.
Note 3 – Summary of Significant Accounting Policies
Principles of Consolidation
In January 2021, Ranger Oil completed a reorganization into an Up-C structure with JSTX and Rocky Creek. Under the Up-C structure, Juniper owns all of the shares of the Company’s Class B Common Stock which togetherare non-economic voting only shares of the Company. Juniper’s economic interest in the Company is held through its ownership of limited partner interests (the “Common Units”) in the Partnership. Pursuant to the amended and restated limited partnership agreement of the Partnership (the “Partnership Agreement”), the Company’s ownership of Common Units in the Partnership at all times equals the number of shares of the Company’s Class A Common Stock then outstanding, and Juniper’s ownership of Common Units in the Partnership at all times equals the number of shares of Class B Common Stock then outstanding. The Partnership was formed for the purpose of executing the Company’s reorganization with ASU 2016–02, representJuniper into an Up-C structure. The Partnership, through its subsidiaries, owns, operates, and manages oil and gas properties in Texas and manages the Company’s outstanding debt and derivative instruments. The Company’s wholly-owned subsidiary, ROCC Energy Holdings GP LLC (formerly, PV Energy Holdings GP, LLC, the “GP”), is the general partner of the Partnership. Subsidiaries of the Partnership own and operate all our oil and gas assets. Ranger Oil and the Partnership are holding companies with no other operations, material cash flows, or material assets or liabilities other than the equity interests in their subsidiaries.
The Common Units are redeemable (concurrently with the cancellation of an equivalent number of shares of Class B Common Stock) by Juniper at any time on a one-for-one basis in exchange for shares of Class A Common Stock or, if the Partnership elects, cash based on the 5-day average volume-weighted closing price for the Class A Common Stock immediately prior to the redemption. In determining whether to make a cash election, the Company would consider the interests of the holders of the Class A Common Stock, the Company’s financial condition, results of operations, earnings, projections, liquidity and capital requirements, management’s assessment of the intrinsic value of the Class A Common Stock, the trading price of the Class A Common Stock, legal requirements, covenant compliance, restrictions in the Company’s debt agreements and other factors it deems relevant.
76


The Partnership is considered a variable interest entity for which the Company is the primary beneficiary. The Company has benefits in the Partnership through the Common Units, and it has power over the activities most significant to the Partnership’s economic performance through its 100% controlling interest in the GP (which, accordingly, is acting as an agent on behalf of the Company). This conclusion was based on a qualitative analysis that considered the Partnership’s governance structure and the GP’s control over operations of the Partnership. The GP manages the business and affairs of the Partnership, including key Partnership decision-making, and the limited partners do not possess any substantive participating or kick-out rights that would allow Juniper to block or participate in certain operational and financial decisions that most significantly impact the Partnership’s economic performance or that would remove the GP. As such, because the Company has both power and benefits in the Partnership, the Company determined it is the primary beneficiary of the Partnership and consolidates the Partnership in the Company’s consolidated financial statements. The Company reflects the noncontrolling interest in the consolidated financial statements based on the proportion of Common Units owned by Juniper relative to the total number of Common Units outstanding. The noncontrolling interest is presented as a component of equity in the accompanying consolidated financial statements and represents the ownership interest held by Juniper in the Partnership (the “Noncontrolling interest”).
Noncontrolling interest
The Noncontrolling interest percentage may be affected by the issuance of shares of Class A Common Stock, repurchases or cancellation of Class A Common Stock, the exchange of Class B Common Stock and the redemption of Common Units (and concurrent cancellation of Class B Common Stock), among other things. The percentage is based on the proportionate number of Common Units held by Juniper relative to the total Common Units outstanding. As of December 31, 2022, the Company owned 19,074,864 Common Units, representing a 45.8% limited partner interest in the Partnership, and Juniper owned 22,548,998 Common Units, representing the remaining 54.2% limited partner interest. As of December 31, 2021, the Company owned 21,090,259 Common Units, representing a 48.3% limited partner interest in the Partnership, and Juniper owned 22,548,998 Common Units, representing the remaining 51.7% limited partner interest. During the year ended December 31, 2022, changes in the ownership interests were the result of share repurchases and issuances of Class A Common Stock in connection with the vesting of employees’ share-based compensation. See Note 15 for information regarding share repurchases and Note 16 for vesting of share-based compensation.
When the Company’s relative ownership interest in the Partnership changes, adjustments to Noncontrolling interest and Paid-in capital, tax effected, will occur. Because these changes in the ownership interest in the Partnership do not result in a change of control, the transactions are accounted for as equity transactions under Accounting Standards Codification (“ASC”) Topic 842,810, LeasesConsolidation (“ASC Topic 842”). We adopted ASC Topic 842 using, which requires that any differences between the optional transition approach with a chargecarrying value of the Company’s basis in the Partnership and the fair value of the consideration received are recognized directly in equity and attributed to the beginning balance of retained earnings as of January 1, 2019 (see Note 11 forcontrolling interest. Additionally, based on the impactPartnership Agreement, there are no substantive profit sharing arrangements that would cause distributions to be other than pro rata. Therefore, profits and disclosures associated withlosses are attributed to the adoption of ASC Topic 842).
Effective January 1, 2018, we adopted and began applying the relevant guidance provided in ASU 2014–09, Revenues from Contracts with Customers (“ASU 2014–09”) and related amendments to GAAP which, together with ASU 2014–09, represent ASC Topic 606, Revenues from Contracts with Customers (“ASC Topic 606”). We adopted ASC Topic 606 using the cumulative effect transition method (see Note 5 for the impact and disclosures associated with the adoption of ASC Topic 606).
Comparative periods and related disclosures have not been restated for the application of ASC Topic 842 and ASC Topic 606. Accordingly, certain components of our Consolidated Financial Statements are not comparable between periodsClass A common shareholders and the Consolidated Statement of Operations for the year ended December 31, 2017 is presentedNoncontrolling interest pro rata based on prior GAAP for both revenue recognition and leases in their entirety.
Recently Issued Accounting Pronouncements Pending Adoption
In June 2016, the FASB issued ASU 2016–13, Measurement of Credit Losses on Financial Instruments (“ASU 2016–13”), which changes the recognition model for the impairment of financial instruments, including accounts receivable, loans and held-to-maturity debt securities, among others. ASU 2016–13 is required to be adopted using the modified retrospective method by January 1, 2020, with early adoption permitted for fiscal periods beginning after December 15, 2018. In contrast to current guidance, which considers current information and events and utilizes a probable threshold, (an “incurred loss” model), ASU 2016–13 mandates an “expected loss” model. The expected loss model: (i) estimates the risk of loss even when risk is remote, (ii) estimates losses over the contractual life, (iii) considers past events, current conditions and reasonable supported forecasts and (iv) has no recognition threshold. ASU 2016–13 will have applicability to our accounts receivable portfolio, particularly those receivables attributable to our joint interest partners which have a higher credit risk than those associated with our traditional customer receivables. We will adopt ASU 2016–13 effective January 1, 2020. While we do not anticipate that the adoption of ASU 2016–13 will have a significant impact on our Consolidated Financial Statements and related disclosures, we will be applying new procedures and controls to our customer and partner billing processes in order to apply the expected loss model on a monthly basis.
Going Concern Presumption
Our Consolidated Financial Statements have been prepared on a going concern basis, which contemplates the realization of assets and the satisfaction of liabilities and other commitmentsownership interests in the normal course of business.
Subsequent Events
Management has evaluated all of our activities through the issuance date of our Consolidated Financial Statements and has concluded that, other than the entry into additional commodity derivative contracts including crude oil and natural gas hedges and certain interest rate swap agreements (see Note 6), all in the ordinary course of business, no subsequent events have occurred that would require recognition in our Consolidated Financial Statements or disclosure in the Notes thereto.

66


3.Summary of Significant Accounting Policies
Principles of ConsolidationPartnership.
Our Consolidated Financial Statements include the accounts of Penn Virginia and all of its subsidiaries. Intercompany balances and transactions have been eliminated.
Use of Estimates
Preparation of our Consolidated Financial Statementsconsolidated financial statements in conformity with GAAP requires management to make estimates and assumptions that affect the reported amounts of assets and liabilities in our Consolidated Financial Statementsconsolidated financial statements and the reported amounts of revenues and expenses during the reporting period. Such estimates include certain asset and liability valuations as further described in these Notes.notes. Actual results could differ from those estimates.
Cash and Cash Equivalents
We consider all highly liquid investments purchased with an original maturity of three months or less to be cash equivalents.
Derivative Instruments
From timeSome of our account balances exceed the FDIC coverage limits. We believe our cash and cash equivalents are not subject to time, we utilize derivative instruments to mitigate our financial exposure to commodity price andany material interest rate volatility. Therisk, equity price risk, credit risk or other market risk.
Derivative Instruments
We utilize derivative instruments, which are placed with financial institutions that we believe are of acceptable credit risk, generally take the form of collarsto mitigate our financial exposure to commodity price and swaps.interest rate volatility. All derivative transactions are subject to our risk management policy, which has been reviewed and approved by our board of directors.
All derivative instruments are recognized in our Consolidated Financial Statementsconsolidated financial statements at fair value. The fair valuesWe have elected to report all of our derivative instruments are determined basedasset and liability positions on discounted cash flows derived from quoted forward prices.a gross basis on our consolidated balance sheets and not net the positions, even when a legal right-of-setoff exists. Our derivative instruments are not formally designated as hedges.hedges in the context of GAAP. In accordance with our internal policies, we do not utilize derivative instruments for speculative purposes. We recognize changes in fair value in earnings currently as a component of theincome within Derivatives captiongains (losses) in our Consolidated Statementsconsolidated statements of Operations. We have experiencedoperations. See Note 6 for further information on our derivatives.

77


Inventory
Inventory is stated at the lower of cost and could continue to experience significant changes innet realizable value using the amountaverage cost method. Our inventory consists of derivative gains or losses recognized due to fluctuations in the valuetubular goods and equipment that are primarily comprised of the underlying derivative contracts, which fluctuate with changes in commodity pricesoil and interest rates. natural gas drilling and repair items such as tubing, casing and pumping units.
Property and Equipment
Oil and Gas Properties
We apply the full cost method of accounting for our oil and gas properties. Under this method, all productive and nonproductive costs incurred in the exploration, development and acquisition of oil and gas reserves are capitalized. Such costs may be incurred both prior to and after the acquisition of a property and include lease acquisitions, geological and geophysical, or seismic, drilling, completion and equipment costs. Internal costs incurred that are directly attributable to exploration, development and acquisition activities undertaken by us for our own account, and which are not attributable to production, general corporate overhead or similar activities are also capitalized. Future development costs are estimated on a property-by-property basis based on current economic conditions and are amortized as a component of depreciation, depletion and amortization (“DD&A”).
Unproved properties not being amortized include unevaluated leasehold costs and associated capitalized interest. These costs are reviewed quarterly to determine whether or not and to what extent proved reserves have been assigned to a property or if an impairment has occurred due to lease expirations, general economic conditions and other factors, in which case the related costs along with associated capitalized interest are reclassified to the proved oil and gas properties subject to DD&A.
At the end of each quarterly reporting period, the unamortized cost of our oil and gas properties, net of deferred income taxes, is limited to the sum of the estimated after-tax discounted future net revenues from proved properties adjusted for costs excluded from amortization and related income taxes (a(the “Ceiling Test”). The estimated after-tax discounted future net revenues are determined using the prior 12-month’s average pricecommodity prices based on closing prices on the first day of each month, adjusted for differentials, discounted at 10%. The calculation of the Ceiling Test and provision for DD&A are based on estimates of proved reserves. There are significant uncertainties inherent in estimating quantities of proved reserves and projecting future rates of production, timing and plan of development.
Depreciation, Depletion and Amortization
DD&A of our oil and gas properties is computed using the units-of-production method. We apply this method by multiplying the unamortized cost of our proved oil and gas properties, net of estimated salvage plus future development costs, by a rate determined by dividing the physical units of oil and gas produced during the period by the total estimated units of proved oil and gas reserves at the beginning of the period.
Other Property and Equipment
Other property and equipment consists primarily of gathering systems and related support equipment. Propertyequipment, vehicles, leasehold improvements, information technology hardware and capitalized software costs. Other property and equipment are carried at cost and include expenditures for additions and improvements which increase the productive lives of existing assets. Maintenance and repair costs are charged to expense as incurred. Renewals and betterments, which extend the useful life of the properties, are also capitalized.


Maintenance and repair costs are charged to expense as incurred. We compute depreciation and amortization of property and equipment using the straight-line balance method over the estimated useful life of each asset as follows: Gathering systems – fifteen15 to twenty20 years and Other property and equipment – three to twenty20 years.
Leases
We determine if ana contractual arrangement is a lease at the inception of the underlying contractual arrangement. In addition, we determineand whether the leaseit is classified as operating or financing. Asfinancing based on whether that contract conveys the right to control the use of the datean identified asset in exchange for consideration for a period of adoption of ASC Topic 842 and through December 31, 2019, we do not have any financing leases.time. Leases are included in the captions “OtherOther assets,” “Accounts Accounts payable and accrued liabilities”liabilities and “Other liabilities”Other liabilities on our Consolidated Balance Sheetsconsolidated balance sheets and are identified as Right-of-use (“ROU”) assets, Current lease obligations and Noncurrent lease obligations, respectively, in NotesNote 11 and Note 12.
ROU assets represent our right to use an underlying asset for the lease term and lease obligations represent our obligation to make lease payments arising from the underlying contractual arrangement. Operating lease ROU assets and obligations are recognized at the commencement date based on the present value of lease payments over the lease term. The operating lease ROU assets include any lease payments made in advance and excludes lease incentives. Our lease terms may include options to extend or terminate the lease when it is reasonably certain that we will exercise such options. Lease expense for operating lease payments is recognized on a straight-line basis over the lease term.

78


Most of our leasing arrangements do not identify or otherwise provide for an implicit interest rate. Accordingly, we utilize a secured incremental borrowing rate based on information available at the commencement date in the determination of the present value of the lease payments. As most of our lease arrangements have terms ranging from two to 5five years, our secured incremental borrowing rate is primarily based on the rates applicable to our credit agreement (the “Credit Facility”).Credit Facility.
We have lease arrangements that include lease and certain non-lease components, including amounts for related taxes, insurance, common area maintenance and similar terms. We have elected to apply a practical expedient provided in ASCAccounting Standards Codification (“ASC”) Topic 842,Leases, to not separate the lease and non-lease components. Accordingly, the ROU assets and lease obligations for such leases will include the present value of the estimated payments for the non-lease components over the lease term.
Certain of our lease arrangements with contractual terms of 12 months or less are classified as short-term leases.leases and are recognized on a straight-line basis over the lease term. Accordingly, we have elected todo not include the underlying ROU assets and lease obligations on our Consolidated Balance Sheets.consolidated balance sheets. The associated costs are aggregated with all of our other lease arrangements and are disclosed in the tables in Note 11.
Certain of our lease arrangements result in variable lease payments which, in accordance with ASC Topic 842, do not give rise to lease obligations. Rather, the basis and terms and conditions upon which such variable lease payments are determined are disclosed in Note 11.
Asset Retirement Obligations
We recognize the fair value of a liability for an asset retirement obligation (“ARO”) in the period in which it is incurred. Associated asset retirement costs are capitalized as part of the carrying cost of the asset. Our AROs relate to the plugging and abandonment of oil and gas wells and the associated asset is recorded as a component of oil and gas properties. After recording these amounts, the ARO is accreted to its future estimated value, and the additional capitalized costs are depreciated over the productive life of the assets. Both the accretion of the ARO and the depreciation of the related long-lived assets are included in the DD&A expense caption in our Consolidated Statementsconsolidated statements of Operations.operations.
Income Taxes
We recognize deferred tax assets and liabilities for the expected future tax consequences of events that have been recognized in the Company’s financial statements or tax returns. Using this method, deferred tax assets and liabilities are determined based on the difference between the financial statement carrying amounts and tax bases of assets and liabilities using enacted tax rates. In assessing our deferred tax assets, we consider whether a valuation allowance should be recorded for some or all of the deferred tax assets which may not be realized. The ultimate realization of deferred tax assets is assessed at each reporting period and is dependent upon the generation of future taxable income and our ability to utilize tax credits and operating loss carryforwards during the periods in which the temporary differences become deductible. We also consider the scheduled reversal of deferred tax liabilities and available tax planning strategies. We recognize interest attributable to income taxes, to the extent they arise,it may be incurred, as a component of interest expense and penalties as a component of income tax expense.
We are subject to ongoing tax examinations in numerous domestic jurisdictions. Accordingly, we may record incremental tax expense based upon the more-likely-than-not outcomes of uncertain tax positions. In addition, when applicable, we adjust the previously recorded tax expense to reflect examination results when the position is effectively settled. Our ongoing assessments of the more-likely-than-not outcomes of the examinations and related tax positions require judgment and can increase or decrease our effective tax rate, as well as impact our operating results. The specific timing of when the resolution of each tax position will be reached is uncertain.


Revenue Recognitionand Associated Costs
Crude oilThe Company recognizes revenue in accordance with ASC Topic 606, . We sell our crude oil production to our customers at either the wellhead or a contractually agreed-upon delivery point, including certain regional central delivery point terminals or pipeline inter-connections. We recognize revenue when control transfers to the customer considering factors associated with custody, title, risk of loss and other contractual provisions as appropriate. Pricing is based on a market index with adjustments for product quality, location differentials and, if applicable, deductions for intermediate transportation. Costs incurred by us for gathering and transporting the products to an agreed-upon delivery point are recognized as a component of GPT expense.
NGLs. We have natural gas processing contracts in place with certain midstream processing vendors. We deliver “wet” natural gas to our midstream processing vendors at the inlet of their processing facilities through gathering lines, certain of which we own and others which are owned by gathering service providers. Subsequent to processing, NGLs are delivered or otherwise transported to a third-party customer. Depending upon the nature of the contractual arrangements with the midstream processing vendors, particularly those attributable to the marketing of the NGL products, we recognize revenue for NGL products on either a gross or net basis. For those contracts where we have determined that we are the principal, and the ultimate third party is our customer, we recognize revenue on a gross basis, with associated processing costs presented as GPT expenses. For those contracts where we have determined that we are the agent and the midstream processing vendor is our customer, we recognize NGL product revenues based on a net basis with processing costs presented as a reduction of revenue. Based on an analysis of all of our existing natural gas processing contracts, we have determined that, as of January 1, 2018, and through December 31, 2019, we were the agent and our midstream processing vendors were our customers with respect to all of our NGL product sales.
Natural gas. Subsequent to the aforementioned processing of “wet” natural gas and the separation of NGL products, the “dry” or residue gas is delivered to us at the tailgate of the midstream processing vendors’ facilities and we market the product to our customers, most of whom are interstate pipelines. We recognize revenue when control transfers to the customer considering factors associated with custody, title, risk of loss and other contractual provisions as appropriate. Pricing is based on a market index with adjustments for product quality and location differentials, as applicable. Costs incurred by us for gathering and transportation from the wellhead through the processing facilities are recognized as a component of GPT expenses.
Marketing services. We provide marketing services to certain of our joint venture partners and other third parties with respect to oil and gas production for which we are the operator. Pricing for such services represents a negotiated fixed rate fee based on the sales price of the underlying oil and gas products. Production attributable to joint venture partners from wells that we operate that are not subject to marketing agreements are delivered in kind. Marketing revenue is recognized simultaneously with the sale of our commodity production to our customers. Direct costs associated with our marketing efforts are included in G&A expenses.
Share-Based Compensation
Our stock compensation plans permit the grant of incentive and nonqualified stock options, common stock, deferred common stock units, restricted stock and restricted stock units to our employees and directors. We measure the cost of employee services received in exchange for an award of equity-classified instruments based on the grant-date fair value of the award. Compensation cost associated with equity-classified awards are generally amortized on a straight-line basis over the applicable vesting period except for those that are based on performance which are amortized on a graded basis over the term of the applicable performance periods. Compensation cost associated with liability-classified awards is measured at the end of each reporting period and recognized based on the period of time that has elapsed during the applicable performance period. We recognize share-based compensation expense related to our share-based compensation plans as a component of “General and administrative” expense in our Consolidated Statements of Operations.
Reorganization Items
We emerged from bankruptcy in September 2016 and a final decree was issued in November 2018, at which time we recognized all final adjustments associated with the discharge action. These adjustments included certain gains and losses and are included in this caption on our Consolidated Statement of Operations as these items of income are directly attributable to the final administration of our bankruptcy case and not a part of our continuing operations.

69


4.    Acquisitions and Divestitures
Acquisitions
Eagle Ford Working Interests
In 2019, we acquired working interests in certain properties for which we are the operator from our joint venture partners in a series of transactions for cash consideration of $6.5 million. Funding for these acquisition was provided by borrowings under the Credit Facility.
Hunt Acquisition
In December 2017, we entered into a purchase and sale agreement with Hunt Oil Company (“Hunt”) to acquire certain oil and gas assets in the Eagle Ford Shale, covering approximately 9,700 net acres primarily in Gonzales County, Texas for $86.0 million in cash (the “Hunt Acquisition”). The Hunt Acquisition had an effective date of October 1, 2017 and closed in 2018. We paid total cash consideration of $83.0 million, net of suspended revenues received, for the Hunt Acquisition in 2018. We also acquired working interests in certain wells that we previously drilled as operator in which Hunt had rights to participate prior to the transaction closing. Accumulated costs, net of suspended revenues for these wells was $13.8 million, along with $0.2 million of certain working capital adjustments which we have reflected as components of the total net assets acquired. We funded the Hunt Acquisition with borrowings under the Credit Facility.
We incurred a total of $0.5 million of transaction costs for legal, due diligence and other professional fees associated with the Hunt Acquisition, including $0.1 million in 2017 and $0.4 million in 2018. These costs have been recognized as a component of our G&A expenses.
We accounted for the Hunt Acquisition by applying the acquisition method of accounting as of March 1, 2018. The following table represents the final fair values assigned to the net assets acquired and the total acquisition cost incurred, including consideration transferred to Hunt:
Assets  
Oil and gas properties - proved $82,443
Oil and gas properties - unproved 16,339
Liabilities  
Revenue suspense 1,448
Asset retirement obligations 356
Net assets acquired $96,978
   
Cash consideration paid to Hunt, net $82,955
Application of working capital adjustments 245
Accumulated costs, net of suspended revenues, for wells in which Hunt had rights to participate 13,778
Total acquisition costs incurred $96,978

Devon Acquisition
In July 2017, we entered into a purchase and sale agreement (the “Purchase Agreement”), with Devon Energy Corporation (“Devon”) to acquire all of Devon’s right, title and interest in and to certain oil and gas assets (the “Devon Properties”), including oil and gas leases covering approximately 19,600 net acres located primarily in Lavaca County, Texas for aggregate consideration of $205 million in cash (the “Devon Acquisition”). We also acquired working interests in the Devon Properties from parties that had tag-along rights to sell their interests under the Purchase Agreement. The Devon Acquisition had an effective date of March 1, 2017 andclosed in September 2017. We paid total cash consideration of $199.8 million for the Devon Acquisition including $200.9 million paid in 2017 net of $1.1 million of suspended revenues and other adjustments paid to us in 2018 in connection with a final settlement. The Devon Acquisition was financed with the net proceeds received from borrowings under the $200 million Second Lien Credit Agreement dated as of September 29, 2017 (the “Second Lien Facility”) (see Note 9 for terms of the Second Lien Facility) and incremental borrowings under the Credit Facility.
We incurred a total of $1.3 million of transaction costs associated with the Devon Acquisitions during 2017, including advisory, legal, due diligence and other professional fees. These costs have been recognized as a component of our G&A expenses.


We accounted for the Devon Acquisition by applying the acquisition method of accounting as of September 29, 2017. The following table represents the final fair values assigned to the net assets acquired and the total consideration transferred:
Assets  
Oil and gas properties - proved $42,866
Oil and gas properties - unproved 146,686
Other property and equipment 8,642
Liabilities  
Revenue suspense 355
Asset retirement obligations 494
Net assets acquired $197,345
   
Cash consideration paid to Devon and tag-along parties, net $199,796
Application of working capital adjustments, net (2,451)
Total consideration $197,345

Valuation of Acquisitions
The fair values of the oil and gas properties acquired in the Hunt and Devon Acquisitions were measured using valuation techniques that convert future cash flows to a single discounted amount. Significant inputs to the valuation include estimates of: (i) reserves, (ii) future operating and development costs, (iii) future commodity prices, (iv) future cash flows (v) the timing of or development plans and (vi) a market-based weighted-average cost of capital. The fair value of the other property and equipment acquired was measured primarily with reference to replacement costs for similar assets adjusted for the age and normal use of the underlying assets. Because many of these inputs are not observable, we have classified the initial fair value estimates as Level 3 inputs as that term is defined in GAAP.
Impact of Acquisitions on Actual and Pro Forma Results of Operations
The results of operations attributable to the Hunt and Devon Acquisitions have been included in our Consolidated Financial Statements for the periods after March 1, 2018 and September 30, 2017, respectively. The Devon Acquisition provided revenues and estimated earnings, excluding allocations of interest expense and income taxes, of approximately $9 million and $4 million, respectively, for the period from October 1, 2017 through December 31, 2017. The Hunt Acquisition provided revenues and estimated earnings, excluding allocations of interest expense and income taxes, of approximately $0.4 million and $0.2 million, respectively, for the period from March 1, 2018 through March 31, 2018. As the properties and working interests acquired in connection with the Hunt and Devon Acquisitions are included within our existing Eagle Ford acreage, it is not practical or meaningful to disclose revenues and earnings unique to those assets for periods beyond those during which they were acquired, as they were fully integrated into our regional operations soon after their acquisition.
The following table presents unaudited summary pro forma financial information for the years ended December, 31, 2018 and 2017 assuming the Hunt and Devon Acquisitions and the related entry into the Second Lien Facility occurred as of January 1, 2017. The pro forma financial information does not purport to represent what our actual results of operations would have been if the Hunt and Devon Acquisitions and the entry into the Second Lien Facility had occurred as of this date, or the results of operations for any future periods.
 Year Ended December 31,
 2018 2017
Total revenues$446,077
 $209,015
Net income$227,930
 $30,861
Net income per share - basic$15.14
 $2.06
Net income per share - diluted$14.91
 $2.05

Divestitures
Mid-Continent Divestiture
In June 2018, we entered into a purchase and sale agreement with a third party to fully divest our Mid-Continent operations and sell all of our remaining oil and gas properties, located primarily in Oklahoma in the Granite Wash, for $6.0 million in cash, subject to customary adjustments. The sale had an effective date of March 1, 2018 and closed on July 31, 2018, and we received proceeds of $6.2 million. The sale proceeds and de-recognition of certain assets and liabilities were recorded as a reduction of our net oil and gas properties. In November 2018, we paid $0.5 million, including $0.2 million of suspended revenues, to the buyer in connection with the final settlement.


The Mid-Continent properties had AROs of $0.3 million as well as a net working capital deficit attributable to the oil and gas properties of $1.3 million as of July 31, 2018. The net pre-tax operating income attributable to the Mid-Continent assets was $1.6 million and $2.2 million for the years ended December 31, 2018 and December 31, 2017, respectively.
Sales of Undeveloped Acreage, Rights and Other Assets
In February 2018, we sold all of our undeveloped acreage holdings in the Tuscaloosa Marine Shale in Louisiana that were scheduled to expire in 2019. In March 2018, we sold certain undeveloped deep leasehold rights in our former Mid-Continent operating region in Oklahoma, and in May 2018, we sold certain pipeline assets in our former Marcellus Shale operating region. We received a combined total of $1.7 million for these leasehold and other assets which were applied as a reduction of our net oil and gas properties.
5.
Accounts Receivable and Major Customers
The following table summarizes our accounts receivable by type as of the dates presented:
 December 31,
 2019 2018
Customers$63,165
 $59,030
Joint interest partners6,929
 6,404
Other674
 640
 70,768
 66,074
Less: Allowance for doubtful accounts(52) (36)
 $70,716
 $66,038

For the year ended December 31, 2019, 4 customers accounted for $354.6 million, or approximately 76% of our consolidated product revenues. The revenues generated from these customers during 2019 were $172.3 million, $84.6 million, $50.7 million and $47.0 million or 37%, 18%, 11% and 10% of the consolidated total, respectively. As of December 31, 2019, $44.5 million, or approximately 70% of our consolidated accounts receivable from customers was related to these customers. For the year ended December 31, 2018, 3 customers accounted for $304.3 million, or approximately 69% of our consolidated product revenues. The revenues generated from these customers during 2018 were $173.0 million, $71.5 million and $59.8 million, or approximately 39%, 16% and 14% of the consolidated total, respectively. As of December 31, 2018, $28.6 million, or approximately 48% of our consolidated accounts receivable from customers was related to these customers. No significant uncertainties exist related to the collectability of amounts owed to us by any of these customers. The allowance for doubtful accounts is entirely attributable to certain receivables from joint interest partners.
Revenue from Contracts with Customers,
Adoption of ASC Topic 606
Effective January 1, 2018, we adopted ASC Topic 606 and have applied the guidance therein to our contracts with customers for the sale of commodity products (crude oil, NGLs and natural gas) as well as marketing services that we provide to our joint venture partners and other third parties. ASC Topic 606 provides forwhich includes a five-step revenue recognition process model to determinedepict the transfer of goods or services to consumerscustomers in an amount that reflects the consideration to which we expectthe Company expects to be entitled in exchange for suchthose goods andor services.
Upon the adoption of ASC Topic 606, we: (i) changed the presentation of our NGL product revenues from a gross basis to a net basis and changed the classification of certain natural gas processing costs associated with NGLs from a component of “Gathering, processing and transportation” (“GPT”) expense to a reduction of NGL product revenues as described in further detail below, (ii) wrote off $2.7 million of accounts receivable arising from natural gas imbalances accounted for under the entitlements method as a direct reduction to our beginning balance of retained earnings as of January 1, 2018, and (iii) adopted the sales method with respect to production imbalance transactions beginning after December 31, 2017.
Transaction Prices, Contract Balances and Performance Obligations
Substantially all of our commodity product sales are short-term in nature with contract terms of one year or less. Accordingly, we have applied the practical expedient included in ASC Topic 606, which provides for an exemption from disclosure of the transaction price allocated to remaining performance obligations if the performance obligation is part of a contract that has an original expected duration of one year or less.
Under our commodity product sales contracts, we bill our customers and recognize revenue when our performance obligations have been satisfied as described above. At that time, we have determined that payment is unconditional. Accordingly, our commodity sales contracts do not create contract assets or liabilities as those terms are defined in ASC Topic 606.


We record revenue in the month that our oil and gas production is delivered to our customers. As a result of the numerous requirements necessary to gather information from purchasers or various measurement locations, calculate volumes produced, perform field and wellhead allocations and distribute and disburse funds to various working interest partners and royalty owners, the collection of revenues from oil and gas production may take up to 60 days following the month of production. Therefore, we make accruals for revenues and accounts receivable based on estimates of our share of production. We record any differences, which historically have not been significant, between the actual amounts ultimately received and the original estimates in the period they become finalized. See Note 5 for further discussion.

79


Substantially all of our commodity product sales are short-term in nature with contract terms of one year or less. We apply a practical expedient which provides for an exemption from disclosure of the transaction price allocated to remaining performance obligations if the performance obligation is part of a contract that has an original expected duration of one year or less. Under our commodity product sales contracts, we bill our customers and recognize revenue when our performance obligations have been satisfied. At that time, we have determined that payment is unconditional. Accordingly, our commodity sales contracts do not create material contract assets or liabilities.
Crude oil. We sell our crude oil production to our customers at either the wellhead or a contractually agreed-upon delivery point, including certain regional central delivery point terminals or pipeline inter-connections. We recognize revenue when control transfers to the customer considering factors associated with custody, title, risk of loss and other contractual provisions as appropriate. Pricing is based on a market index with adjustments for product quality, location differentials and, if applicable, deductions for intermediate transportation. Costs incurred by us for gathering and transporting the products to an agreed-upon delivery point are recognized as a component of gathering, processing and transportation expense (“GPT”) in our consolidated financial statements.
NGLs. We have natural gas processing contracts in place with certain midstream processing vendors. We deliver “wet” natural gas to our midstream processing vendors at the inlet of their processing facilities through gathering lines, certain of which we own and others which are owned by gathering service providers. Subsequent to processing, NGLs are delivered or transported to a third-party customer. Depending upon the nature of the contractual arrangements with the midstream processing vendors regarding the marketing of the NGL products, we recognize revenue for NGL products on either a gross or net basis. For those contracts where we have determined that we are the principal, and the ultimate third party is our customer, we recognize revenue on a gross basis, with associated processing costs presented as GPT expenses. For those contracts where we have determined that we are the agent and the midstream processing vendor is our customer, we recognize NGL product revenues on a net basis with processing costs presented as a reduction of revenue.
Natural gas. Subsequent to the processing of “wet” natural gas and the separation of NGL products, the “dry” or residue gas is purchased by the processor or delivered to us at the tailgate of the midstream processing vendors’ facilities and sold to a third-party customer. We recognize revenue when control transfers to the customer considering factors associated with custody, title, risk of loss and other contractual provisions as appropriate. Pricing is based on a market index with adjustments for product quality and location differentials, as applicable. Costs incurred by us for gathering and transportation from the wellhead through the processing facilities are recognized as a component of GPT expenses in our consolidated financial statements.
Marketing and water disposal services. We provide marketing and water disposal services to certain of our joint venture partners and other third parties with respect to oil and gas production for which we are the operator. Pricing for such services represents a fixed rate fee based, in the case of marketing services, on the sales price of the underlying oil and gas products and, in the case of water services, on the quantity of water volume processed. Marketing revenue is recognized simultaneously with the sale of our commodity production to our customers while water service revenue is recognized in the month that the service is rendered. Direct costs associated with our marketing efforts are included in General and administrative expenses (“G&A”) and direct costs associated with our water service efforts are netted against the underlying revenue.
Credit Losses
We monitor and assess our portfolio of accounts receivable, including those from our customers, our joint interest partners and others, when applicable, for credit losses on a monthly basis as we originate the underlying financial assets. Our review process and related internal controls take into appropriate consideration (i) past events and historical experience with the identified portfolio segments, (ii) current economic and related conditions within the broad energy industry as well as those factors with broader applicability and (iii) reasonable supportable forecasts consistent with other estimates that are inherent in our financial statements. In order to facilitate our processes for the review and assessment of credit losses, we have identified the following portfolio segments: (i) customers for our commodity production and (ii) joint interest partners which are further stratified into the following sub-segments: (a) mutual operators which includes joint interest partners with whom we are a non-operating joint interest partner in properties for which they are the operator, (b) large partners consisting of those legal entities that maintain a working interest of at least 10% in properties for which we are the operator and (c) all others which includes legal entities that maintain working interests of less than 10% in properties for which we are the operator as well as legal entities with whom we no longer have an active joint interest relationship, but continue to have transactions, including joint venture audit settlements, that from time-to-time give rise to the origination of new accounts receivable.

80


Share-Based Compensation
Our stock compensation plans permit the grant of incentive and nonqualified stock options, common stock, deferred common stock units, restricted stock and restricted stock units to our employees and directors. We measure the cost of employee services received in exchange for an award of equity-classified instruments based on the grant-date fair value of the award. Compensation cost associated with equity-classified awards are generally amortized on a straight-line basis over the applicable vesting period. Awards that are based on performance are amortized either on a graded basis over the term of the applicable performance periods for awards that represent in-substance multiple awards or ratably over the requisite service period for awards that cliff vest. Compensation cost associated with liability-classified awards is measured at the end of each reporting period and recognized based on the period of time that has elapsed during the applicable performance period. We recognize forfeitures as they occur. We recognize share-based compensation expense related to our share-based compensation plans as a component of G&A expenses in our consolidated statements of operations.
Recent Accounting Pronouncements
We consider the applicability and impact of all Accounting Standard Updates (“ASUs”). ASUs not listed below were assessed and determined to be not applicable.
Recently Issued Accounting Pronouncements Not Yet Adopted
In October 2021, the Financial Accounting Standards Board issued ASU 2021-08, Business Combinations (Topic 805): (“ASU 2021-08”): Accounting for Contract Assets and Contract Liabilities from Contracts with Customers. ASU 2021-08 amends Topic 805 to require the acquirer in a business combination to record contract assets and contract liabilities in accordance with Revenue from Contracts with Customers (Topic 606) at acquisition as if it had originated the contract, rather than at fair value. This update is effective for public companies beginning after December 15, 2022, with early adoption permitted. Adoption should be applied prospectively to business combinations occurring on or after the effective date of the amendments unless early adoption occurs during an interim period in which other application rules apply. We do not expect the adoption of this update to have a material impact to our financial statements.
Note 4 – Transactions
2022
Asset Acquisitions
In 2022, we completed acquisitions of additional working interests in Ranger-operated wells along with certain contiguous oil and gas producing assets and undeveloped acreage in the Eagle Ford shale. The aggregate cash consideration for these acquisitions was $137.5 million, including customary post-closing adjustments. These transactions were accounted for as asset acquisitions.
Asset Disposition
On July 22, 2022, we closed on the sale of the corporate office building and related assets acquired in connection with the Lonestar Acquisition (defined below) that were classified as Assets held for sale on the consolidated balance sheet as of December 31, 2021. Gross proceeds were $11.0 million and total net proceeds were $1.8 million after netting costs to sell of approximately $0.8 million and payoff of the related mortgage debt and accrued interest of $8.4 million.
2021
Acquisition of Lonestar Resources
On October 5, 2021 (the “Closing Date”), the Company acquired Lonestar Resources US Inc., a Delaware corporation (“Lonestar”), as a result of which Lonestar and its subsidiaries became wholly-owned subsidiaries of the Company (the “Lonestar Acquisition”). The Lonestar Acquisition was effected pursuant to the Agreement and Plan of Merger (the “Merger Agreement”), dated July 10, 2021, by and between the Company and Lonestar. In accordance with the terms of the Merger Agreement, Lonestar shareholders received 0.51 shares of the Company’s common stock for each share of Lonestar common stock held immediately prior to the effective time of the Lonestar Acquisition. Based on the closing price of the Company’s common stock on October 5, 2021 of $30.19, the total value of the Company’s common stock issued to holders of Lonestar common stock, warrants and restricted stock units as applicable, was approximately $173.6 million.
The Lonestar Acquisition constituted a business combination and was accounted for using the acquisition method of accounting, with Ranger Oil being treated as the accounting acquirer. Under the acquisition method of accounting, the assets and liabilities of Lonestar and its subsidiaries were recorded at their respective fair values as of the date of completion of the Lonestar Acquisition. The Company completed the purchase price allocation during the third quarter of 2022.
81


The following table sets forth the Company’s final allocation of the purchase price to the assets acquired and liabilities assumed as of the acquisition date.
 Final Purchase Price Allocation
Consideration:
Fair value of the Company’s common stock issued 1
$173,576 
Less: Replacement awards attributable to post-combination compensation cost 2
(10,394)
Total consideration transferred$163,182 
6.Assets:
Other current assets$50,044 
Proved oil and gas properties476,743 
ARO asset1,239 
Corporate office building and related assets 3
11,400 
Other property and equipment2,582 
Other non-current assets37 
Total assets acquired$542,045 
Liabilities:
Current portion of long-term debt$24,187 
Other current liabilities66,150 
Derivative Instrumentsliabilities 4
49,554 
Asset retirement obligations2,494 
Long-term debt236,478 
Total liabilities assumed$378,863 
Net Assets Acquired$163,182 
__________________________________________________________________________________
1    Includes the fair value of the replacement equity awards to the extent services were provided by employees of Lonestar prior to closing of $4.5 million. See Note 16 for additional information about the replacement equity awards.
2    Represents the fair value of the replacement equity awards considered post-combination services. See Note 16 for further details.
3    As of December 31, 2021, these assets met the held for sale criteria and were classified as Assets held for sale on the respective consolidated balance sheet.
4    Immediately following the Lonestar Acquisition, we paid approximately $50 million to restructure certain of Lonestar’s derivatives which were novated or terminated. We reset the majority of the swaps to reflect then current market pricing.
For the period from the closing date of the Lonestar Acquisition on October 5, 2021 through December 31, 2021, approximately $62.5 million of revenues and $34.0 million of direct operating expenses were included in the Company’s consolidated statement of operations for the year ended December 31, 2021.
Lonestar Acquisition-Related Expenses
The following table summarizes expenses related to the Lonestar Acquisition incurred for the year ended December 31, 2021:
Year Ended
December 31, 2021
Bank, legal and consulting fees$9,856 
Employee severance and related costs7,563 
Replacement awards stock-based compensation costs10,394 
Integration and rebranding costs1,746 
Total acquisition-related expenses$29,559 
Employee severance and related costs primarily related to one-time severance and change-in-control compensation costs. Replacement awards stock-based compensation costs related to the accelerated vesting of certain Lonestar share-based awards for former Lonestar employees and directors based on the terms of the Merger Agreement and change-in-control provisions within the former Lonestar employment agreements.
82


Pro Forma Operating Results (Unaudited)
The following unaudited pro forma condensed financial data for the years ended December 31, 2021 and 2020 was derived from the historical financial statements of the Company giving effect to the Lonestar Acquisition, as if it had occurred on January 1, 2020. The below information reflects pro forma adjustments for the issuance of the Company’s common stock in exchange for Lonestar’s outstanding shares of common stock, as well as pro forma adjustments based on available information and certain assumptions that the Company believes are reasonable, including (i) the Company’s common stock issued to convert Lonestar’s outstanding shares of common stock and equity awards as of the closing date of the Lonestar Acquisition, (ii) the depletion of Lonestar’s fair-valued proved oil and natural gas properties under the full cost accounting method as well as other impacts of converting Lonestar from successful efforts to the full cost accounting method and (iii) the estimated tax impacts of the pro forma adjustments. The pro forma results of operations do not include any cost savings or other synergies that may result from the Lonestar Acquisition or any estimated costs that have been or will be incurred by the Company to integrate the Lonestar assets.
The pro forma consolidated statements of operations data has been included for comparative purposes only and is not necessarily indicative of the results that might have occurred had the Lonestar Acquisition taken place on January 1, 2020 and is not intended to be a projection of future results.
December 31,
20212020
Total revenues$729,026 $389,495 
Net income (loss) attributable to Class A common shareholders$74,355 $(321,951)
Juniper Transactions
On the Juniper Closing Date, (i) pursuant to the terms of the Contribution Agreement, JSTX contributed to the Partnership, as a capital contribution, $150 million in cash in exchange for 17,142,857 newly issued Common Units and the Company issued to JSTX 171,428.57 shares of Series A Preferred Stock, par value $0.01 per share, of the Company (“Series A Preferred Stock”) (now Class B Common Stock as discussed below) at a price equal to the par value of the shares acquired, and (ii) pursuant to the terms of the Asset Agreement, including certain closing adjustments based on a September 1, 2020 effective date (the “Effective Date”), Rocky Creek contributed to our operating subsidiary certain oil and gas assets in exchange for 5,405,252 newly issued Common Units and the Company issued to Rocky Creek 54,052.52 shares of Series A Preferred Stock (5,406,141 Common Units and 54,061.41 shares of Series A Preferred Stock after post-closing adjustments) at a price equal to the par value of the shares acquired, including 495,900 Common Units and 4,959 shares of Series A Preferred Stock placed in a restricted account to support post-closing indemnification claims, 50% of such amount of which was disbursed 180 days after the Juniper Closing Date and the remainder was disbursed one year after the Juniper Closing Date. In connection with the contribution of the oil and gas assets under the Asset Agreement, we received $1.2 million of revenues attributable to production from the Rocky Creek assets for the period from December 1, 2020 through the Juniper Closing Date.
We incurred a total of $19.0 million of professional fees, including advisory, legal, consulting fees and other costs in connection with the Juniper Transactions. A total of $5.0 million were attributable to services and costs incurred and recognized in 2020 as G&A. The remaining $14.0 million of costs were incurred in January 2021 or otherwise incurred contingent upon the closing of the Juniper Transactions, including $5.5 million of transaction costs incurred by Juniper that were required to be paid by the Company under the Juniper Transaction Agreements as well as $3.8 million of costs incurred by us related to the issuance of the Series A Preferred Stock and Common Units. Collectively, these amounts were classified as a reduction to the capital contribution on our consolidated balance sheets. The remainder of $4.7 million, representing professional fees and other costs, was recognized as a component of G&A in the quarter ended March 31, 2021.
On October 6, 2021, the Company, JSTX and Rocky Creek entered into a Contribution and Exchange Agreement, whereby all outstanding shares of the Series A Preferred Stock were exchanged for newly issued shares of Class B Common Stock (“Class B Common Stock”), at a ratio of one share of Class B Common Stock for each 1/100th of a share of Series A Preferred Stock and the designation of the Series A Preferred Stock was cancelled. See Note 15 for additional information.


83


The following table reconciles the initial investment by Juniper and the carrying value of their Noncontrolling interest as of the Juniper Closing Date (after post-closing adjustments):
Cash contribution$150,000 
Issue costs paid for Noncontrolling interest securities(3,758)
Transaction costs paid on behalf of Noncontrolling interest(5,543)
Fair value of Rocky Creek oil and gas properties contributed38,561 
Revenues received attributable to contributed properties1,160 
Suspense revenues attributable to the contributed properties(146)
Asset retirement obligations of the contributed properties(14)
Fair value of capital contributions180,260 
Income tax adjustment attributable to the Juniper Transactions(708)
Total shareholders’ equity prior to the Juniper Closing Date205,558 
$385,110 
Juniper voting power through Series A Preferred Stock59.6 %
Noncontrolling interest as of the Juniper Closing Date$229,620 
Due to the Lonestar Acquisition in October 2021, a change in ownership of the Noncontrolling interest occurred. Refer to Note 15 for additional information.
Note 5 – Revenue Recognition
The Company’s revenues are derived from contracts for crude oil, natural gas and NGL sales and other services, as described in Note 3.
Our accounts receivable consists mainly of trade receivables from commodity sales and joint interest billings due from partners on properties we operate. Our allowance for credit losses is entirely attributable to receivables from joint interest partners. We generally have the right to withhold future revenue distributions to recover past due receivables from joint interest owners. Generally, our oil, natural gas, and NGL receivables are collected within 30 to 90 days. The following table summarizes our accounts receivable by type as of the dates presented:
 December 31,
 20222021
Customers$109,149 $96,195 
Joint interest partners30,730 21,755 
Derivative settlements from counterparties 1
437 1,037 
Other114 18 
Total140,430 119,005 
Less: Allowance for credit losses(715)(411)
Accounts receivable, net of allowance for credit losses$139,715 $118,594 
_______________________
1     See Note 6 for information regarding our derivative instruments.
Major Customers
For the year ended December 31, 2022, two customers accounted for 43% of our consolidated product revenues, of which 27%, and 16% of the consolidated revenues were generated from these customers, respectively. For the year ended December 31, 2021, three customers accounted for 48% of our consolidated product revenues, of which 22%, 14%, and 12% of the consolidated revenues were generated from these customers, respectively. For the year ended December 31, 2020, three customers accounted for 56% of our consolidated product revenues of which 27%, 19%, and 10% of the consolidated revenues were generated from these customers, respectively.
84


Note 6 – Derivative Instruments
We utilize derivative instruments, typically swaps, two-put options and three-way collars and enhanced swapscall options which are placed with financial institutions that we believe are acceptable credit risks, to mitigate our financial exposure to commodity price volatility associated with anticipated sales of our future production and volatility in interest rates attributable to our variable rate debt instruments. Our derivative instruments are not formally designated as hedges in the context of GAAP.for accounting purposes. While the use of derivative instruments limits the risk of adverse commodity price and interest rate movements, such use may also limit the beneficial impact of future product revenues and interest expense from favorable commodity price and interest rate movements. From time to time, we may enter into incremental derivative contracts in order to increase the notional volume of production we are hedging, restructure existing derivative contracts or enter into other derivative contracts resulting in modification to the terms of existing contracts. In addition,accordance with our internal policies, we do not utilize derivative instruments for speculative purposes. As
For our commodity derivatives, we typically combine swaps, purchased put options, purchased call options, sold put options and sold call options in order to achieve various hedging objectives. Certain of December 31, 2019, we were unhedgedthese objectives result in combinations that operate as collars which include purchased put options and sold call options, three-way collars, which include purchased put options, sold put options and sold call options, and enhanced swaps, which include either sold put options or sold call options with respect to NGL and natural gas production and we had no interest rate hedges outstanding. the associated premiums rolled into an enhanced fixed price swap, among others.
Commodity Derivatives
The following is a general description of the commodity derivative instruments we have employed:employ:
Swaps. A swap contract is an agreement between two parties pursuant to which the parties exchange payments at specified dates on the basis of a specified notional amount, or the swap price, with the payments calculated by reference to specified commodities or indexes. The purchasing counterparty to a swap contract is required to make a payment to usselling counterparty based on the amount of the swap price in excess of the settlement price multiplied by the notional volume if the settlement price for any settlement period is below the swap price for such contract. We are required to make a payment to the counterparty based on the amount of the settlement price in excess of the swap price multiplied by the notional volume if the settlement price for any settlement period is above the swap price for such contract.
Two-Way CollarsPut Options. A put option has a defined strike, or floor price. We have entered into put option contracts in the roles of buyer and seller depending upon our particular hedging objective. The counterpartybuyer of the put option pays the seller a premium to a two-way collar contract is required to make a payment to us ifenter into the contract. When the settlement price for any settlement period is below the floor price, for such contract. We are requiredthe seller pays the buyer an amount equal to makethe difference between the settlement price and the strike price multiplied by the notional volume. When the settlement price is above the floor price, the put option expires worthless. Certain of our purchased put options have deferred premiums. For the deferred premium puts, we agree to pay a paymentpremium to the counterparty ifat the time of settlement.
Call Options. A call option has a defined strike, or ceiling price. We have entered into call option contracts in the roles of buyer and seller depending upon our particular hedging objective. The buyer of the call option pays the seller a premium to enter into the call option. When the settlement price for any settlement period is above the ceiling price, for such contract. Neither party is required to make a paymentthe seller pays the buyer an amount equal to the other party ifdifference between the settlement price for anyand the strike price multiplied by the notional volume. When the settlement periodprice is equal to or greater than the floor price and equal to or less thanbelow the ceiling price, for such collar contract.the call option expires worthless.
Three-WayTwo-Way Collars. A three-waytwo-way collar consists of (i) a purchased put option which establishes a floor price for the collar, (ii)is an arrangement that contains a sold call option, which establishes a ceilingmaximum price of(ceiling price) we will receive for the collarcontract volumes, and (iii) a soldpurchased put, option which establishes a sub-floor price. Three-way collars are settledminimum price (floor price) we will receive based on differences betweenan index price. We have entered into two-way collars periodically to achieve particular hedging objectives. When the floor orindex price is higher than the ceiling prices andprice, we pay the settlement price of a referenced index orcounterparty the difference between the floorindex price and sub-floorceiling price. If the settlementindex price of the referenced index is below the sub-floor price, the counterparty is required to make a payment to us for the difference between the floor price and sub-floor price. If the settlement price of the referenced index is between the floor and ceiling prices, no payments are due from either party. When the index price and sub-flooris below the floor price, the counterparty is required to make a payment to us forwe will receive the difference between the floor price and the settlement price of the referenced index. If the settlement price of the referenced index is between the floor price and ceiling price, no payments are due to or from either party. If the settlement price of the referenced index is above the ceiling price, we are required to make a payment to the counterparty for the difference.
Enhanced Swaps. An enhanced swap consists of a sold put option with the associated premiums rolled into an enhanced fixed price swap. The counterparty to an enhanced swap contract is required to make a payment to us if the settlement price for any settlement period is below the swap price for such contract. We are required to make a payment to the counterparty if the settlement price for any settlement period is above the swap price for such contract. Additionally, we are required to make a payment to the counterparty if the settlement price for any settlement period is below the sold-put strike price. Effectively, when the settlement price for any settlement period is below the sold-put strike price, we receive the swap price minus the sold put strike price.
We determine the fair values of
85


The following table sets forth our commodity derivative instruments basedcontracts as of December 31, 2022:
Commodity Derivatives1Q20232Q20233Q20234Q20231Q20242Q2024
NYMEX WTI Crude Swaps
Average Volume Per Day (bbl)2,500 2,400 2,807 2,657 462 462 
Weighted Average Swap Price ($/bbl)$54.4 $54.26 $54.92 $54.93 $58.75 $58.75 
NYMEX WTI Crude Collars
Average Volume Per Day (bbl)20,972 12,775 13,043 8,967 
Weighted Average Purchased Put Price ($/bbl)$67.75 $63.23 $73.13 $72.27 
Weighted Average Sold Call Price ($/bbl)$83.64 $75.69 $89.07 $87.57 
NYMEX HH Swaps
Average Volume Per Day (MMBtu)10,0007,500
Weighted Average Swap Price ($/MMBtu)$3.620 $3.690 
NYMEX HH Collars
Average Volume Per Day (MMBtu)14,617 11,538 11,413 11,413 11,538 11,538 
Weighted Average Purchased Put Price ($/MMBtu)$6.561 $2.500 $2.500 $2.500 $2.500 $2.328 
Weighted Average Sold Call Price ($/MMBtu)$12.334 $2.682 $2.682 $2.682 $3.650 $3.000 
HSC Basis Swaps
Average Volume Per Day (MMBtu)24,617 19,038 11,413 11,413 
HSC Basis Average Fixed Price ($/MMBtu)$(0.153)$(0.153)$(0.153)$(0.153)
OPIS Mt. Belvieu Ethane Swaps
Average Volume per Day (gal)98,901 34,239 34,239 34,615 
Weighted Average Fixed Price ($/gal)$0.2288 $0.2275 $0.2275 $0.2275 
Interest Rate Derivatives
Through May 2022, we had a series of interest rate swap contracts (the “Interest Rate Swaps”) establishing fixed interest rates on discounteda portion of our variable interest rate indebtedness. The notional amount of the Interest Rate Swaps totaled $300 million, with us paying a weighted average fixed rate of 1.36% on the notional amount, and the counterparties paying a variable rate equal to LIBOR. As of December 31, 2022, we did not have any interest rate derivatives.
Financial Statement Impact of Derivatives
The impact of our derivatives activities on income is included within Derivatives gains (losses) on our consolidated statements of operations. Derivative contracts that have expired at the end of a period, but for which cash flows derived from third-party quoted forward prices for West Texas Intermediate (“WTI”), Louisiana Light Sweet (“LLS”) and Magellan East Houston (“MEH”) crude oil closing priceshad not been received or paid as of the endbalance sheet date, have been recognized as components of Accounts receivable (see Note 5) and Accounts payable and accrued liabilities (see Note 12) on the consolidated balance sheets. Adjustments to reconcile net income to net cash provided by operating activities include derivative losses and cash settlements that are reported under Net losses (gains) and Cash settlements and premiums (paid) received, net, on our consolidated statements of cash flows, respectively.

86


The following table summarizes the effects of our derivative activities for the periods presented:
 Year Ended December 31,
 202220212020
Interest Rate Swap gains (losses) recognized in the consolidated statements of operations$64 $(2)$(7,510)
Commodity gains (losses) recognized in the consolidated statements of operations(162,736)(136,997)95,932 
$(162,672)$(136,999)$88,422 
Interest rate cash settlements recognized in the consolidated statements of cash flows$(1,415)$(3,822)$(2,210)
Commodity cash settlements and premiums received (paid) recognized in the consolidated statements of cash flows(181,963)(77,099)80,297 
Commodity cash settlements paid for acquired derivatives recognized in the consolidated statements of cash flows— (49,554)— 
$(183,378)$(130,475)$78,087 
The following table summarizes the fair value of our derivative instruments, which we elect to present on a gross basis, as well as the locations of these instruments on our consolidated balance sheets as of the reporting period.dates presented:
  Fair Values
  December 31, 2022December 31, 2021
TypeBalance Sheet LocationDerivative AssetsDerivative LiabilitiesDerivative AssetsDerivative Liabilities
Interest rate contractsDerivative assets/liabilities – current$— $— $— $1,480 
Commodity contractsDerivative assets/liabilities – current29,714 67,933 11,478 48,892 
Commodity contractsDerivative assets/liabilities – non-current316 3,416 2,092 23,815 
  $30,030 $71,349 $13,570 $74,187 
As of December 31, 2022, we reported net commodity derivative liabilities of $41.3 million. The discounted cash flows utilizecontracts associated with these positions are with seven counterparties for commodity derivatives, all of which are investment grade financial institutions and are participants in the Credit Facility. This concentration may impact our overall credit risk in that these counterparties may be similarly affected by changes in economic or other conditions. Non-performance risk is incorporated by utilizing discount rates adjusted for the credit risk of our counterparties if the derivative is in an asset position, and our own credit risk if the derivative is in a liability position.
Subsequent Events
In January of 2020, we entered into additional commodity hedge contracts as well as certain interest rate swap transactions. We replaced a portion of two crude oil swaps with a costless collar for 2,000 BOPD for April through December 2020 with floor and ceiling prices of $48.00 and $57.10 per barrel. We entered into a costless collar for Henry Hub natural gas for 270,000 MMBTU per month with a term from February through December of 2020 with floor and ceiling prices of $2.00 and $2.18 per MMBTU, respectively. In January and February 2020, we entered into interest rate swaps contracts through May 2022 for a notional amount of $300 million, paying a weighted-average fixed rate of 1.36%.


The following table sets forth our commodity derivative contracts as of December 31, 2019:
  1Q2020 2Q2020 3Q2020 4Q2020 1Q2021 2Q2021 3Q2021 4Q2021
NYMEX WTI Crude Swaps 


Average Volume Per Day (barrels) 15,648
 12,648
 10,630
 10,630
 3,333
 3,297
 1,630
 1,630
Weighted Average Swap Price ($/barrel) $55.34
 $54.96
 $54.77
 $54.77
 $55.89
 $55.89
 $55.50
 $55.50


NYMEX WTI Purchased Puts/Sold Calls 


Average Volume Per Day (barrels) 

 3,297
 4,891
 

 1,667
 1,648


Weighted Average Purchased Put Price ($/barrel) 

 $55.00
 $55.00
 

 $55.00
 $55.00


Weighted Average Sold Call ($/barrel) 

 $57.69
 $58.42
 

 $58.00
 $58.00


NYMEX WTI Sold Puts 


Average Volume Per Day (barrels) 


 5,000
 4,945
 1,630
 1,630
Weighted Average Sold Put Price ($/barrel) 


 $44.00
 $44.00
 $44.00
 $44.00


MEH Crude Swaps 


Average Volume Per Day (barrels) 2,000
 2,000
 2,000
 2,000


Weighted Average Swap Price ($/barrel) $61.03
 $61.03
 $61.03
 $61.03


Financial Statement Impact of Derivatives
The impact of our derivatives activities on income is included in the “Derivatives” caption on our Consolidated Statements of Operations. The effects of derivative gains and (losses) and cash settlements are reported as adjustments to reconcile net income (loss) to net cash provided by operating activities. These items are recorded in the “Derivative contracts” section of our Consolidated Statements of Cash Flows under the “Net (gains) losses” and “Cash settlements, net.”
The following table summarizes the effects of our derivative activities for the periods presented:
 Year Ended December 31,
 2019 2018 2017
Derivative gains (losses) recognized in the Consolidated Statements of Operations$(68,131) $37,427
 $(17,819)
Cash settlements recognized in the Consolidated Statements of Cash Flows$(4,136) $(48,291) $(3,511)

The following table summarizes the fair value ofagreements underlying our derivative instruments as well asinclude provisions for the locationsnetting of these instruments, on our Consolidated Balance Sheets assettlements with the counterparties for contracts of the dates presented:
    Fair Values
    December 31, 2019 December 31, 2018
    Derivative Derivative Derivative Derivative
Type Balance Sheet Location Assets Liabilities Assets Liabilities
Commodity contracts Derivative assets/liabilities – current $4,131
 $23,450
 $34,932
 $991
Commodity contracts Derivative assets/liabilities – noncurrent 2,750
 3,385
 10,100
 
    $6,881
 $26,835
 $45,032
 $991

As of December 31, 2019, we reported net commodity derivative liabilities of $20.0 million. The contracts associated with this position are with 9 counterparties, all of which are investment grade financial institutions and are participants in the Credit Facility. This concentration may impact our overall credit risk, either positively or negatively, in that these counterparties may be similarly affected by changes in economic or other conditions.similar type. We have neither paid to, nor received from, our counterparties any cash collateral in connection with our derivative positions. Furthermore, our derivative contracts are not subject to margin calls or similar accelerations. No significant uncertainties exist related to the collectability of amounts that may be owed to us by these counterparties.

See Note 13 for information regarding the fair value of our derivative instruments.
74
87


Note 7 – Property and Equipment, Net
7.Property and Equipment
The following table summarizes our property and equipment as of the dates presented:
 December 31,
 20222021
Oil and gas properties (full cost accounting method):  
Proved$3,013,854 $2,327,686 
Unproved41,882 57,900 
Total oil and gas properties3,055,736 2,385,586 
Other property and equipment 1
30,969 31,055 
Total properties and equipment3,086,705 2,416,641 
Accumulated depreciation, depletion, amortization and impairments(1,277,705)(1,033,293)
Total property and equipment, net$1,809,000 $1,383,348 
 December 31,
 2019 2018
Oil and gas properties: 
  
Proved$1,409,219
 $1,037,993
Unproved53,200
 63,484
Total oil and gas properties1,462,419
 1,101,477
Other property and equipment25,915
 20,383
Total property and equipment1,488,334
 1,121,860
Accumulated depreciation, depletion and amortization(367,909) (193,866)
 $1,120,425
 $927,994
_______________________

1
    Excludes the corporate office building and related other assets acquired in connection with the Lonestar Acquisition that were classified as Assets held for sale on the consolidated balance sheets as of December 31, 2021. We closed on the sale of the corporate office building in July 2022. See Note 4 for additional information. As of December 31, 2022, we had $1.2 million remaining other assets classified as Assets held for sale excluded from above.
Unproved property costs of $53.2$41.9 million and $63.5$57.9 million have been excluded from amortization as of December 31, 20192022 and December 31, 2018,2021, respectively. An additional $0.3 million of costs, associated with wells in-progress for which we had not previously recognized any proved undeveloped reserves, were excluded from amortization as of December 31, 2018. The total costs not subject to amortization as of December 31, 20192022 were incurred in the following periods: $0.9 million in 2022, $1.3 million in 2019, $6.12021, $0.7 million in 2018, $43.12020 and $33.2 million in 2017 and the remaining $2.7prior to 2019 as well as $5.8 million in 2016.of capitalized interest applied thereto. We transferred $16.8$25.2 million and $82.8$17.8 million of undevelopedunproved leasehold costs, including capitalized interest, associated with proved undeveloped reserves, and acreage unlikely to be drilled or expiring acreage, from unproved properties to the full cost pool during the years ended December 31, 20192022 and 2018,2021, respectively. We capitalized internal costs of $5.3 million, $4.1 million $3.7 million and $2.4$2.1 million and interest of $4.1$4.3 million, $9.1$3.6 million and $2.7 million during the yearyears ended December 31, 2019, 20182022, 2021 and 20172020, respectively, in accordance with our accounting policies. Average DD&A per barrel of oil equivalentboe of proved oil and gas properties was $17.25, $16.11$16.42, $12.96 and $12.87$15.83 for the years ended December 31, 2019, 20182022, 2021 and 2017,2020, respectively.
Ceiling Test
8.Asset Retirement Obligations
Beginning in early 2020, certain events such as the COVID-19 pandemic coupled with decisions by the Organization of the Petroleum Exporting Countries (“OPEC”) and Russia (together with OPEC, collectively “OPEC+”) negatively impacted the oil and gas industry with significant declines in crude oil prices and oversupply of crude oil. Then in early 2021 with the deployment of vaccines and resulting increased mobility and global economic activity and other factors, demand for oil increased and commodity prices began to recover. Prior to the announced significant production cut to take effect in November 2022, OPEC+ had previously employed a strategy to gradually increase production. These shifts in OPEC+ production levels as well as the Russia-Ukraine war and related sanctions, which began in the first quarter of 2022, continue to contribute to a high level of uncertainty surrounding energy supply and demand resulting in volatile commodity prices. WTI crude oil and natural gas prices surged with prices over $120 per bbl and over $9 per Mcf, respectively, during the first half of 2022 due to oil supply shortage concerns. During the second half of 2022, WTI crude oil and natural gas prices dropped to lows under $72 per bbl and $4 per Mcf, respectively.
As discussed in Note 3, the Ceiling Test utilizes commodity prices based on a trailing 12-month average based on the closing prices on the first day of each month. With the higher commodity prices in 2022, we did not record any impairments of our oil and gas properties during the year ended December 31, 2022. However, the years ended December 31, 2021 and 2020 were impacted by the decline in commodity prices as a result of the various factors discussed above, resulting in impairments of our oil and gas properties of $1.8 million and $391.8 million, respectively.
88


Note 8 – Asset Retirement Obligations
The following table reconciles our AROs as of the dates presented, which are included in the “Other liabilities” captionwithin Other liabilities on our Consolidated Balance Sheets: consolidated balance sheets:
 Year Ended December 31,
 2019 2018
Balance at beginning of period$4,314
 $3,286
Changes in estimates(2) 354
Liabilities incurred290
 335
Liabilities settled(67) (8)
Acquisitions of properties83
 385
Sale of properties
 (310)
Accretion expense316
 272
Balance at end of period$4,934
 $4,314
Year Ended December 31,
 20222021
Balance at beginning of period$8,413 $5,461 
Changes in estimates182 — 
Liabilities incurred64 226 
Liabilities settled(589)(228)
Acquisitions of properties166 2,508 
Accretion expense613 446 
Balance at end of period$8,849 $8,413 


Note 9 – Long-Term Debt
75


9.Long-Term Debt
The following table summarizes our long-term debt as of the dates presented:
 December 31, 2022December 31, 2021
Credit Facility$215,000 $208,000 
9.25% Senior Notes due 2026400,000 400,000 
Mortgage debt 1
— 8,438 
Other 2
238 2,516 
Total615,238 618,954 
Less: Unamortized discount 3
(3,055)(3,720)
Less: Unamortized deferred issuance costs 3, 4
(8,106)(9,853)
Total, net$604,077 $605,381 
Less: Current portion— (4,129)
Long-term debt$604,077 $601,252 
 December 31, 2019 December 31, 2018
 Principal 
Unamortized Discount and Issuance Costs 1
 Principal 
Unamortized Discount and Issuance Costs 1
Credit facility 2
$362,400
   $321,000
  
Second lien term loan200,000
 $7,372
 200,000
 $9,625
Totals562,400
 7,372
 521,000
 9,625
Less: Unamortized discount(2,415)   (3,159)  
Less: Unamortized deferred issuance costs(4,957)   (6,466)  
Long-term debt, net$555,028
   $511,375
  
_______________________

1    DiscountThe mortgage debt related to the corporate office building and related other assets acquired in connection with the Lonestar Acquisition for which assets were held as collateral for such debt. In July 2022, the mortgage debt was fully repaid in connection with the sale of the corporate office building. See Note 4 for additional information on the sale.
2    Other debt of $2.2 million at December 31, 2022 was extinguished during 2022 and recorded as a gain on extinguishment on the consolidated statements of operations.
3     The discount and issuance costs of the Second Lien9.25% Senior Notes due 2026 are being amortized over its respective term using the effective-interest method.
4     Excludes issuance costs associated with the Credit Facility, which represent costs attributable to the access to credit over its contractual term, that have been presented as a component of Other assets (see Note 12) and are being amortized over the term of the underlying loanCredit Facility using the effective-intereststraight-line method.
2
Issuance costs of the Credit Facility, which represent costs attributable to the access to credit over its contractual term, have been presented as a component of Other assets (see Note 12) and are being amortized over the term of the Credit Facility using the straight-line method.
Credit Facility
TheAs of December 31, 2022, the Credit Facility provides forhad a $1.0 billion revolving commitment and $500a $950 million borrowing base, includingwith aggregate elected commitments of $500 million, and a $25 million sublimit for the issuance of letters of credit. In December 2019, we completed our fall borrowing base redetermination and our lenders affirmed the $500 million borrowing base. In the years ended December 31, 2019 and December 31, 2018, we paid and capitalized issue costs of $2.6 million and $0.9 million, respectively in connection with amendments to the Credit Facility. Availability under the Credit Facility may not exceed the lesser of the aggregate elected commitments or the borrowing base.base less outstanding advances and letters of credit. The borrowing base under the Credit Facility is redetermined semi-annually, generally in Aprilthe Spring and OctoberFall of each year. Additionally, we and the Credit Facility lenders may, at their discretion,upon request, initiate a redetermination at any time during the six-month period between scheduled redeterminations. The Credit Facility is available to us for general corporate purposes, including working capital. We had $0.4 million in letters of credit outstanding as of December 31, 2019 and December 31, 2018.
In May 2019, maturity ofJune 2022, we entered into the Agreement and Amendment No. 12 to Credit Agreement (the “Twelfth Amendment”). The Twelfth Amendment, in addition to other changes described therein, amended the Credit Facility was extended to, May 2024 from September 2020; provided thateffective on June 30,1, 2022, unless(1) increase the borrowing base from $725 million to $875 million, with aggregate elected commitments remaining at $400 million and (2) replaced LIBOR with the Secured Overnight Financing Rate (“SOFR”), an index supported by short-term Treasury repurchase agreements.

89


In September 2022, we have either extendedentered into the maturity date of the Second Lien FacilityAgreement and Amendment No. 13 to Credit Agreement (the “Thirteenth Amendment”). The Thirteenth Amendment, in addition to other changes described below to a date that is at least 91 days after the May 7, 2024 or have repaid our Second Lien Facility in full, the maturity date oftherein, amended the Credit Facility will mean June 30, 2022.to (1) increase the borrowing base from $875 million to $950 million and (2) increase the aggregate elected commitment amounts under the Credit Facility from $400 million to $500 million.
The outstanding borrowings under the Credit Facility bear interest at a rate equal to, at our option, either (a) a customary reference rate plus an applicable margin ranging from 0.50% to 1.50%, determined based on the average availability under the Credit Facility or (b) a customary London interbank offered rate (“LIBOR”) plus an applicable margin ranging from 1.50% to 2.50%, determined based on the average availabilityutilization level under the Credit Facility or (b) effective June 1, 2022, a term SOFR reference rate (a Eurodollar rate, including LIBOR prior to June 1, 2022), plus an applicable margin ranging from 2.50% to 3.50%, determined based on the utilization level under the Credit Facility. Interest on reference rate borrowings is payable quarterly in arrears and is computed on the basis of a year of 365/366 days, and interest on LIBOREurodollar borrowings is payable every one, three or six months, at the election of the borrower, and is computed on the basis of a year of 360 days. As ofAt December 31, 2019,2022, the actual weighted-average interest rate on the outstanding borrowings under the Credit Facility was 3.75%7.25%. Unused commitment fees are charged at a rate of 0.375% to 0.50%, depending upon utilization.
The Credit Facility is guaranteed by us and all of our subsidiaries (the “Guarantor Subsidiaries”). The guarantees under the Credit Facility are full and unconditional and joint and several. Substantially all of our consolidated assets are held by the Guarantor Subsidiaries. There are no significant restrictions on our ability or any of the Guarantor Subsidiaries to obtain funds through dividends, advances or loans. The obligations under the Credit Facility are secured by a first priority lien on substantially all of our assets.
The Credit Facility requires us to maintain (1) a minimum current ratio (as defined in the Credit Facility, which considers the unused portion of the total commitment as a current asset), measured as of the last day of each fiscal quarter of 1.00 to 1.00 and (2) a maximum leverage ratio (consolidated indebtedness to adjusted earnings before interest, taxes, depreciation, depletion, amortization and exploration expenses, both as defined in the Credit Facility), measured as of the last day of each fiscal quarter of 4.003.50 to 1.00.
The Credit Facility also contains other customary affirmative and negative covenants including as to compliance with laws (including environmental laws, ERISA and anti-corruption laws), maintenance of required insurance, delivery of quarterly and annual financial statements, oil and gas engineering reports and budgets, maintenance and operation of property (including oil and gas properties), limitations on the incurrence of liens and indebtedness, merger, consolidation or sale of assets, payment of dividends, and transactions with affiliates and other customary covenants.


The Credit Facility contains customarywell as events of default and remedies for credit facilities of this nature.remedies. If we do not comply with the financial and other covenants in the Credit Facility, the lenders may, subject to customary cure rights, require immediate payment of all amounts outstanding under the Credit Facility.
As of December 31, 2019, and through the date upon which the Consolidated Financial Statements were issued,2022, we were in compliance with all of thedebt covenants under the Credit Facility.
Second Lien Facility
On September 29, 2017, we entered into the Second Lien Facility. We received net proceeds of $187.8had $215.0 million from the Second Lien Facility net of an original issue discount (“OID”) of $4.0 million and issue costs of $8.2 million. The proceeds from the Second Lien Facility were used to fund the Devon Acquisition and related fees and expenses. The maturity date under the Second Lien Facility is September 29, 2022.
Thein outstanding borrowings under the Second Lien Facility bear interest at a rate equal to, at our option, either (a) a customary reference rate based on the prime rate plus an applicable marginand $1.0 million in outstanding letters of 6.00% or (b) a customary LIBOR rate plus an applicable margin of 7.00%. As of December 31, 2019, the actual interest rate of outstanding borrowings under the Second Lien Facility was 8.81%. Amounts under the Second Lien Facility were borrowed at a price of 98% with an initial interest rate of 8.34% resulting in an effective interest rate of 9.89%. Interest on reference rate borrowings is payable quarterly in arrears and is computed on the basis of a year of 365/366 days, and interest on eurocurrency borrowings is payable every one or three months (including in three month intervals if we select a six-month interest period), at our election and is computed on the basis of a 360-day year. We have the right, to the extent permittedcredit under the Credit Facility and an intercreditor agreement betweenas of December 31, 2022. Factoring in the lendersoutstanding letters of credit, we had $284.0 million of availability under the Credit Facility as of December 31, 2022. During the years ended December 31, 2022 and the lenders under the Second Lien Facility,2021, we incurred and capitalized issue costs of $0.9 million and $2.6 million, respectively, in connection with amendments to prepay loans under the Second Lien Facility at any time, subject to the following prepayment premiums (in addition to customary “breakage” costs with respect to eurocurrency loans): from October 2019 through September 2020, 101% of the amount being prepaid; and thereafter, no premium. The Second Lien Facility also provides for the following prepayment premiums in the event of a change in control that results in an offer of prepayment that is accepted by the lenders under the Second Lien Facility: from October 2019 through September 2020, 101% of the amount being prepaid; and thereafter, no premium.
The Second Lien Facility is collateralized by substantially all of the Company’s and its subsidiaries’ assets with lien priority subordinated to the liens securing the Credit Facility. TheAdditionally, during 2022 and 2021, we wrote off $0.1 million and $0.8 million of previously deferred debt issue costs associated with amendments to the Credit Facility, respectively.
9.25% Senior Notes due 2026
On August 10, 2021, our indirect, wholly-owned subsidiary completed an offering of $400 million aggregate principal amount of senior unsecured notes due 2026 (the “9.25% Senior Notes due 2026”) that bear interest at 9.25% and were sold at 99.018% of par. Obligations under the 9.25% Senior Notes due 2026 were assumed by ROCC Holdings, LLC (formerly, Penn Virginia Holdings, LLC, hereinafter referred to as “Holdings”), as borrower, and are guaranteed by the subsidiaries of Holdings that guarantee the Credit Facility.
In connection with the consummation of the Lonestar Acquisition, the net proceeds from the 9.25% Senior Notes due 2026 were used to repay and discharge $249.8 million of Lonestar’s long-term debt including accrued interest and related expenses, and the remainder, along with cash on hand, of $146.2 million was used to repay outstanding obligations under the Second Lien Facility are guaranteed by usTerm Loan including a prepayment premium and accrued interest and related expenses. Thereafter, the Subsidiary Guarantors.Second Lien Term Loan was terminated and $6.9 million was recorded as a loss on extinguishment of debt for costs incurred related to a prepayment premium and write off of unamortized discount and issue costs. During 2021, we incurred and capitalized $10.4 million of issue costs in connection with the 9.25% Senior Notes due 2026. See Note 4 for additional information.
The Second Lien Facility has no financial covenants, butindenture governing the 9.25% Senior Notes due 2026 also contains other customary affirmative and negative covenants including as to compliance with laws (including environmental laws, ERISAwell as events of default and anti-corruption laws), maintenance of required insurance, delivery of quarterly and annual financial statements, oil and gas engineering reports and budgets, maintenance and operation of property (including oil and gas properties), limitations on the incurrence of liens and indebtedness, merger, consolidation or sale of assets, payment of dividends and transactions with affiliates and other customary covenants.
As illustrated in the table above, the OID and issue costs of the Second Lien Facility are presented as reductions to the outstanding term loan. These costs are subject to amortization using the interest method over the five-year term of the Second Lien Facility.remedies.
As of December 31, 2019, and through2022, the date upon which the Consolidated Financial Statements were issued, we wereCompany was in compliance with all of thedebt covenants under the Second Lien Facility.

indenture.
77
90


Note 10 – Income Taxes
10.Income Taxes
The following table summarizes our provision for income taxes for the periods presented:
 Year Ended December 31,
 2019 2018 2017
Current income taxes (benefit)     
Federal$(1,236) $(2,471) $
 (1,236) (2,471) 
Deferred income taxes (benefit)     
Federal1,236
 2,471
 (4,943)
State2,137
 523
 
 3,373
 2,994
 (4,943)
 $2,137
 $523
 $(4,943)

 Year Ended December 31,
 202220212020
Current income tax expense (benefit) 
Federal$— $— $(1,236)
State764 311 357 
Total current income tax expense (benefit)764 311 (879)
Deferred income tax expense (benefit) 
Federal— — 1,236 
State3,422 1,249 (2,660)
Total deferred income tax expense (benefit)3,422 1,249 (1,424)
Income tax expense (benefit)$4,186 $1,560 $(2,303)
The following table reconciles the difference between the income tax expense (benefit) computed by applying the statutory tax rate to our income (loss) before income taxes and our reported income tax benefitexpense (benefit) for the periods presented:
 Year Ended December 31,
 2019 2018 2017
Computed at federal statutory rate$15,272
 21.0 % $47,315
 21.0 % $9,701
 35.0 %
State income taxes, net of federal income tax benefit1,494
 2.1 % 1,743
 0.8 % (1,383) (5.0)%
Change in valuation allowance(14,240) (19.6)% (48,820) (21.7)% (24,353) (87.8)%
Effect of rate change on the valuation allowance
  % 
  % (86,612) (312.5)%
Effect of rate change
  % 
  % 86,612
 312.5 %
Reorganization adjustments
  % 
  % 10,760
 38.8 %
Other, net(389) (0.5)% 285
 0.1 % 332
 1.2 %
 $2,137
 3.0 % $523
 0.2 % $(4,943) (17.8)%

 Year Ended December 31,
 202220212020
Tax computed at federal statutory rate$98,428 21.0 %$21,100 21.0 %$(65,701)21.0 %
State income taxes, net of federal income tax benefit4,186 0.9 %1,560 1.6 %(1,856)0.6 %
Change in valuation allowance(44,070)(9.4)%(9,348)(9.3)%64,062 (20.5)%
Noncontrolling interest(52,299)(11.2)%(12,501)(12.4)%— — %
Other, net(2,059)(0.4)%749 0.7 %1,192 (0.4)%
Income tax expense (benefit)$4,186 0.9 %$1,560 1.6 %$(2,303)0.7 %
The following table summarizes the principal components of our deferred income tax assets and liabilities as of the dates presented:
 December 31,
 20222021
Deferred tax assets:  
Net operating loss (“NOL”) carryforwards$194,819 $203,243 
Asset retirement obligations66 63 
Property and equipment27,530 24,585 
Fair value of derivative instruments310 493 
Interest expense limitation13,443 13,747 
Other— 18 
Total deferred tax assets236,168 242,149 
Less: Valuation allowance(158,017)(205,617)
Total net deferred tax assets$78,151 $36,532 
Deferred tax liabilities:
Property and equipment$6,592 $3,357 
Investment in the Partnership77,713 35,968 
Other62 — 
Total deferred tax liabilities$84,367 $39,325 
Net deferred tax liabilities$(6,216)$(2,793)
 December 31,
 2019 2018
Deferred tax assets: 
  
Net operating loss (“NOL”) carryforwards$175,221
 $163,437
Alternative minimum tax (“AMT”) credit carryforwards1,236
 2,471
Asset retirement obligations1,073
 647
Pension and postretirement benefits340
 441
Share-based compensation880
 546
Fair value of derivative instruments4,191
 
Interest expense limitation11,463
 3,128
Other2,441
 2,590
 196,845
 173,260
Less:  Valuation allowance(114,939) (128,650)
Total net deferred tax assets81,906
 44,610
Deferred tax liabilities:   
Property and equipment83,330
 33,413
Fair value of derivative instruments
 9,248
Total deferred tax liabilities83,330
 42,661
Net deferred tax assets (liabilities)$(1,424) $1,949

91


Continuing Impact of 2017 Tax Reform
In 2017, the U.S. Congress enacted the budget reconciliation act commonly referred to as the Tax Cuts and Jobs Act (the “TCJA”). The TCJA provided for broad and complex changes to the U.S. tax code (the “Code”). In addition to the reduction in the U.S. federal corporate income tax rate from 35% to 21%, the most significant aspects of the TCJA that continue to have a material impact on us are those attributable to: (i) the repeal of the corporate AMT, (ii) limitations on deductible interest expense and (iii) the utilization and limitations on NOLs. The specific impact of these TCJA-related items are described in further detail below in our discussion of the income tax provision and our deferred tax assets and liabilities.
As a result of the repeal of the AMT, our existing AMT credit carryovers became refundable beginning with the 2018 tax year. The AMT credit carryforwards are used to offset current year regular tax liabilities with 50 percent of any excess remaining credit per year being refundable as part of the annual income tax filing.
Income Tax Provision
For the year ended December 31, 2022 and 2021, we did not have any current federal tax benefits. The provision for the yearsyear ended December 31, 2019 and 20182020 includes current federal benefits of $1.2 million and $2.5 million attributable to the anticipated refundrefunds of AMT credits for the 2020 tax year. The amounts attributable to 2020 combined the amounts attributable to 2019, and 2018 tax years, respectively. The amount for 2019 haswhich had been recognized on our Consolidated Balance Sheetconsolidated balance sheets as of December 31, 2019 as a current asset. The $2.5asset, were received in 2020 as an acceleration of all AMT credits in connection with certain provisions of the CARES Act. In addition, we have recognized deferred state tax expense (benefits) of $3.4 million, $1.2 million and $(2.7) million primarily attributable to 2018 was refundedproperty and equipment as well as $0.8 million, $0.3 million and $0.4 million current state expense attributable to us in 2019. These benefits have been offset by corresponding decreases in the deferredTexas margin tax asset associated with AMT credit carryforwards giving rise to deferred federal expenses for the years ended December 31, 20192022, 2021 and 2018,2020, respectively. In addition, we have a recognized deferred state tax expenses of $2.1 million and $0.5 million attributable to property and equipment forOur overall effective tax rates of 3.0%were 0.9%, 1.6% and 0.2%0.7% for the years ended December 31, 20192022, 2021 and 2018,2020, respectively. The remaining AMT credit carryforwards of approximately $1.2 million will be reclassified from deferred tax assets, where they are classified as of December 31, 2019, to income taxes receivable upon the filing of federal returns in future years.
In connection with the TCJA, we recorded an income tax charge of $86.6 million for the year ended December 31, 2017, which consisted of a reduction of deferred tax assets previously valued at 35%. We recorded a corresponding decrease in our deferred tax asset valuation allowance representing an income tax benefit for the same amount. In addition, our provision for the year ended December 31, 2017 included federal income taxes of $9.7 million applied at the statutory rate of 35% and an adjustment of $10.8 million attributable to reductions in certain tax attributes of property and other adjustments of $0.3 million applied in connection with the filing of our 2016 income tax returns. These expenses were effectively offset by benefits attributable to the reduction in our deferred tax asset valuation allowance of $24.4 million and state income tax benefits of $1.4 million resulting in a net tax deferred benefit of $4.9 million.
Deferred Tax Assets and Liabilities
As of December 31, 2019,2022, we had federal NOL carryforwards of approximately $613.4$706.7 million, a substantial portion of which, if not utilized, expire between 2032 and 2037. NOLs incurred after January 1, 2018 can be carried forward indefinitely. State NOL carryforwards of approximately $437.9 million expire between 2024 and 2037. Because of the change in ownership provisions of the Code, use of a portion of our federal and state NOLs may be limited in future periods. As of December 31, 2019,2022, we carried a valuation allowance against our federal and state deferred tax assets of $114.9$158.0 million. We considered both the positive and negative evidence in determining whether it was more likely than not that some portion or all of our deferred tax assets will be realized. The amount of deferred tax assets considered realizable could, however, be adjusted if estimates of future taxable income during the carryforward period are reduced or increased or if objective negative evidence is no longer present and additional weight is given to subjective positive evidence, including projections for growth.
The valuation allowance along with $84.4 million of deferred tax liabilities fully offset our deferred tax assets. The net deferred tax liability recognized on the Consolidated Balance Sheetour consolidated balance sheets as of December 31, 20192022 is attributable to certain state deferred tax liabilities associated with property and equipment in excess of federal deferred tax assets associated with refundable AMT credit carryforwards for tax years ending after 2019. The net deferred tax asset recognized on the Consolidated Balance Sheet as of December 31, 2018 is attributable to federal deferred tax assets associated with AMT credit carryforwards in excess of certain state deferred tax liabilities attributable to property and equipment.unrealized hedges. The valuation allowance related to all other net deferred tax assets remains in full as of December 31, 20192022 and 2018.2021.
Following the Juniper Transactions, Ranger Oil is a holding company and all of its operating assets are held within the Partnership. Certain of the federal deferred tax assets and liabilities were reclassified to investment in partnership deferred tax liability in 2021.
Other Income Tax Matters
We had no liability for unrecognized tax benefits as of December 31, 20192022 and 2018.2021. There were no interest and penalty charges recognized during the years ended December 31, 2019, 20182022, 2021 and 2017.2020. Tax years from 2015 forward remain open for examination by the Internal Revenue Service and various state jurisdictions.

79


11.Note 11 – Leases
Adoption of ASC Topic 842
Effective January 1, 2019, we adopted ASC Topic 842 and have applied the guidance therein to all of our contracts and agreements explicitly identified as leases as well as other contractual arrangements that we have determined to include or otherwise have the characteristics of a lease as defined in ASC Topic 842. As illustrated in the disclosures below, the adoption of ASC Topic 842 resulted in the recognition of certain assets and liabilities on our Consolidated Balance Sheet and changes in the amounts and timing of lease cost recognition in our Consolidated Statements of Operations as compared to prior GAAP. We have adopted ASC Topic 842 using the optional transition approach with an adjustment to the beginning balance of retained earnings as of January 1, 2019. Accordingly, our 2019 financial statements are not comparable with respect to leases in effect during all periods prior to January 1, 2019. On January 1, 2019, we recognized operating lease right-of-use (“ROU”) assets of $2.5 million and operating lease obligations of $2.8 million on our Consolidated Balance Sheet for operating leases in effect on that date. We recorded an immaterial adjustment to the beginning balance of retained earnings as of January 1, 2019 representing the difference between the operating lease ROU assets and operating lease obligations recognized upon adoption net of amounts already included in our liabilities as of December 31, 2018 that were attributable to straight-line lease expense in excess of amounts paid for certain operating leases. We did not identify any finance leases, as defined in ASC Topic 842, upon the date of initial adoption.
Lease Arrangements and Supplemental Disclosures
We generally have lease arrangements for office facilities and certain office equipment, certain field equipment including compressors, drilling rigs, crude oil storage tank capacity, land easements and similar arrangements for rights-of-way, and certain gas gathering and gas lift assets. Our short-term leases included in the disclosures below are primarily comprised of our contractual arrangements with certain vendors for operated drilling rigs, crude oil storage tank capacity and our field compressors. Our primary variable lease includeswas represented by our field gas gathering and gas lift agreement with a midstream service provider and the lease payments are charged on a volumetric basis at a contractual fixed rate.
The following table summarizes the components of our total lease cost as determined in accordance with ASC Topic 842, for the twelve months ended December 31, 2019:periods presented:
Year Ended December 31,
202220212020
Operating lease cost $773
Operating lease cost$889 $891 $979 
Short-term lease cost 36,202
Short-term lease cost49,418 24,655 23,721 
Variable lease cost 23,762
Variable lease cost32,370 24,807 21,932 
Less: Amounts charged as drilling costs 1
 (33,354)
Less: Amounts charged as drilling costs 1
(43,867)(21,213)(20,708)
Total lease cost recognized in the Condensed Consolidated Statement of Operations 2
 $27,383
Total lease cost recognized in the consolidated statement of operations 2
$38,810 $29,140 $25,924 
___________________
1
Represents the combined gross amounts paid and (i) capitalized as drilling costs for our working interest share and (ii) billed to joint interest partners for their working interest share for short-term leases of operated drilling rigs.
2
Includes $12.1 million recognized in Gathering, processing and transportation, $14.5
1    Represents the combined gross amounts paid and (i) capitalized as drilling costs for our working interest share and (ii) billed to joint interest partners for their working interest share for short-term leases of operated drilling rigs.
2    Includes $14.9 million, $10.8 million and $11.2 million recognized in GPT, $23.1 million, $17.4 million and $13.8 million recognized in Lease operating expense (“LOE”) and $0.8 million, $0.9 million and $1.0 million recognized in G&A for the twelve months ended December 31, 2019.
Operating lease rental expense, as determined in accordance with prior GAAP was $2.7 million and $1.0 million, for the years ended December 31, 20182022, 2021, and 2017, related primarily to field equipment, office equipment and office leases. The substantial difference between operating lease rental expense disclosed in accordance with prior GAAP and that provided in the table above for 2019 in accordance with ASC Topic 842 is attributable to the aforementioned field gas gathering and gas lift agreement which has been determined to be a variable lease under ASC Topic 842.2020, respectively.
92


The following table summarizes supplemental cash flow information as determined in accordance with ASC Topic 842, related to leases for the twelve months ended December 31, 2019:periods presented:
Cash paid for amounts included in the measurement of lease liabilities:  
Operating cash flows from operating leases $659
ROU assets obtained in exchange for lease obligations:  
Operating leases 1
 $3,325
___________________
1    Includes $2.5 million recognized upon adoption of ASC Topic 842 and $0.8 million obtained during the twelve months ended December 31, 2019.


Year Ended December 31,
202220212020
Cash paid for amounts included in the measurement of lease liabilities:
Operating cash flows from operating leases$952 $981 $943 
ROU assets obtained in exchange for operating lease obligations$118 $— $388 
The following table summarizes supplemental balance sheet information related to leases as of the dates presented:
December 31,
LeasesBalance Sheet Location20222021
Assets
ROU assets – operating leasesOther assets$989 $1,671 
Liabilities
Current operating lease obligationsAccounts payable and accrued liabilities$907 $914 
Non-current operating lease obligationsOther non-current liabilities200 975 
Total operating lease obligations$1,107 $1,889 
The following table presents other information as it relates to operating leases as of the dates presented:
December 31,
20222021
Weighted-average remaining lease term – operating leases1.5 years2.1 years
Weighted-average discount rate – operating leases3.33 %3.13 %
As of December 31, 2019:2022, maturities of our operating lease liabilities consisted of the following:
December 31, 2022
2023$907 
2024175 
202529 
202626 
2027
Total undiscounted lease payments1,138 
Less: imputed interest(31)
Total operating lease obligations$1,107 
ROU assets - operating leases $2,740
Current operating lease obligations $847
Noncurrent operating lease obligations 2,232
Total operating lease obligations $3,079
Weighted-average remaining lease term  
Operating leases 4.1 Years
Weighted-average discount rate  
Operating leases 5.97%
Maturities of operating lease obligations for the years ending December 31,  
2020 $847
2021 830
2022 834
2023 833
2024 139
Total undiscounted lease payments 3,483
Less: imputed interest (404)
Total operating lease obligations $3,079
93


Note 12 – Supplemental Balance Sheet Detail
12.
Additional Balance Sheet Detail
The following table summarizes components of selected balance sheet accounts as of the dates presented:
 December 31,
 20222021
Prepaid and other current assets:  
Inventories 1
$19,341 $10,305 
Prepaid expenses 2
2,923 10,693 
 $22,264 $20,998 
Other assets:  
Deferred issuance costs of the Credit Facility, net of amortization$3,218 $3,308 
Right-of-use assets – operating leases989 1,671 
Other213 38 
 $4,420 $5,017 
Accounts payable and accrued liabilities:  
Trade accounts payable$58,592 $32,452 
Drilling and other lease operating costs62,842 35,045 
Revenue and royalties payable104,512 95,521 
Production, ad valorem and other taxes10,547 7,905 
Derivative settlements to counterparties4,109 6,117 
Compensation and benefits6,927 13,942 
Interest14,655 15,321 
Environmental remediation liability 3
207 2,287 
Current operating lease obligations907 914 
Other2,311 4,877 
 $265,609 $214,381 
Other non-current liabilities:  
Asset retirement obligations$8,849 $8,413 
Non-current operating lease obligations200 975 
Postretirement benefit plan obligations885 970 
 $9,934 $10,358 
 December 31,
 2019 2018
Other current assets: 
  
Tubular inventory and well materials$2,989
 $4,061
Prepaid expenses1,469
 1,064
 $4,458
 $5,125
Other assets: 
  
Deferred issuance costs of the Credit Facility, net of amortization$3,952
 $2,437
Right-of-use assets - operating leases2,740
 
Other32
 44
 $6,724
 $2,481
Accounts payable and accrued liabilities: 
  
Trade accounts payable$30,098
 $16,507
Drilling costs18,832
 22,434
Royalties44,537
 51,212
Production, ad valorem and other taxes3,244
 2,418
Compensation and benefits5,272
 4,489
Interest730
 670
Current operating lease obligations847
 
Other2,264
 5,970
 $105,824
 $103,700
Other liabilities: 
  
Asset retirement obligations$4,934
 $4,314
Noncurrent operating lease obligations2,232
 
Defined benefit pension obligations873
 857
Postretirement health care benefit obligations343
 362
 $8,382
 $5,533
_______________________
1    Includes tubular inventory and well materials of $18.7 million and $9.5 million and crude oil volumes in storage of $0.6 million and $0.8 million as of December 31, 2022 and 2021, respectively.
2    The balance as of December 31, 2022 and 2021 includes $0.5 million and $9.6 million, respectively, for the prepayment of drilling and completion services and materials.
3    The balance as of December 31, 2022 and 2021 represents estimated costs associated with remediation activities for certain wells and tanks acquired as part of the Lonestar Acquisition; the remediation was completed in the fourth quarter of 2022.
94


81Note 13 – Fair Value Measurements


13.Fair Value Measurements
We apply the authoritative accounting provisions included in GAAP for measuring fair value of both our financial and nonfinancial assets and liabilities. Fair value is an exit price representing the expected amount we would receive upon the sale of an asset or that we would expect to pay to transfer a liability in an orderly transaction with market participants at the measurement date.
We use a hierarchy that prioritizes the inputs we use to measure fair value into three distinct categories based upon whether such inputs are observable in active markets or unobservable. We classify assets and liabilities in their entirety based on the lowest level of input that is significant to the fair value measurement. Our methodology for categorizing assets and liabilities that are measured at fair value pursuant to this hierarchy gives the highest priority to unadjusted quoted prices in active markets and the lowest level to unobservable inputs as outlined below.
Fair value measurements are classified and disclosed in one of the following three categories:
Level 1: Unadjusted quoted prices in active markets that are accessible at the measurement date for identical, unrestricted assets or liabilities. Level 1 inputs generally provide the most reliable evidence of fair value.
Level 2: Quoted prices in markets that are not active or inputs, which are observable, either directly or indirectly, for substantially the full term of the asset or liability.
Level 3: Prices or valuation techniques that require inputs that are both significant to the fair value measurement and unobservable (i.e., supported by little or no market activity).
Our financial instruments, that are subject to fair value disclosure consist of cash and cash equivalents, accounts receivable, accounts payable, derivatives and our Credit Facility and Second Lien Facility borrowings. Due to the short-term nature of their maturities, the carrying value of ourincluding cash and cash equivalents, accounts receivable, and accounts payable approximate fair value due to their short-term maturities. As of December 31, 2022 and 2021, the carrying values of the borrowings outstanding under our Credit Facility approximate fair value. Our derivatives are marked-to-marketvalue as the borrowings bear interest at variables rates tied to current market rates and presented at their values.the applicable margins represent market rates. The carryingfair value of our long-termfixed rate 9.25% Senior Notes due 2026 is estimated based on the published market prices for issuances of similar risk and tenor and is categorized as Level 2 within the fair value hierarchy. As of December 31, 2022, the carrying amount and estimated fair value of total debt which includes(before amortization of issuance costs) was $615.2 million and $616.4 million, respectively. As of December 31, 2021, the Credit Facilitycarrying amount and the Second Lien Facility, approximated theirestimated fair values as they represent variable-ratevalue of total debt (before amortization of issuance costs) was $619.0 million and their interest rates are reflective of market rates.$634.6 million, respectively.
Recurring Fair Value Measurements
Certain financial assets and liabilitiesThe fair values of our derivative instruments are measured at fair value on a recurring basis on our Consolidated Balance Sheets.consolidated balance sheets. The following tables summarize the valuation of those financial assets and (liabilities)liabilities as of the dates presented:
 As of December 31, 2022
Level 1Level 2Level 3Total
Financial assets:    
Commodity derivative assets – current$— $29,714 $— $29,714 
Commodity derivative assets – non-current— 316 — 316 
Total financial assets$— $30,030 $— $30,030 
Financial liabilities:    
Commodity derivative liabilities – current— 67,933 — 67,933 
Commodity derivative liabilities – non-current— 3,416 — 3,416 
Total financial liabilities$— $71,349 $— $71,349 
  As of December 31, 2019
  Fair Value Fair Value Measurement Classification
Description Measurement Level 1 Level 2 Level 3
Assets:  


Commodity derivative assets – current $4,131
 $
 $4,131
 $
Commodity derivative assets – noncurrent 2,750
 
 2,750
 
Liabilities:  


Commodity derivative liabilities – current $(23,450) $
 $(23,450) $
Commodity derivative liabilities – noncurrent (3,385) 
 (3,385) 
 As of December 31, 2021
Level 1Level 2Level 3Total
Financial assets:    
Commodity derivative assets – current$— $11,478 $— $11,478 
Commodity derivative assets – non-current— 2,092 — 2,092 
Total financial assets$— $13,570 $— $13,570 
Financial liabilities:    
Interest rate swap liabilities – current$— $1,480 $— $1,480 
Commodity derivative liabilities – current— 48,892 — 48,892 
Commodity derivative liabilities – non-current— 23,815 — 23,815 
Total financial liabilities$— $74,187 $— $74,187 
  As of December 31, 2018
  Fair Value Fair Value Measurement Classification
Description Measurement Level 1 Level 2 Level 3
Assets:  


Commodity derivative assets – current $34,932
 $
 $34,932
 $
Commodity derivative assets – noncurrent 10,100
 
 10,100
 
Liabilities:  


Commodity derivative liabilities – current $(991) $
 $(991) $
Commodity derivative liabilities – noncurrent 


95


Changes in economic conditions or model-based valuation techniques may require the transfer of financial instruments from one level of the fair value hierarchy to another level. In such instances, the transfer is deemed to have occurred at the beginning of the quarterly period in which the event or change in circumstances that caused the transfer occurred. There were no transfers during any period in the years ended December 31, 2019, 2018 and 2017.


We used the following methods and assumptions to estimate fair values for the financial assets and liabilities described below:
Commodity derivatives: We determine the fair values of our commodity derivative instruments based on discounted cash flows derived from third-party quoted forward
Commodity derivatives: We determine the fair values of our commodity derivative instruments using industry-standard models that consider various assumptions including current market and contractual prices for the underlying instruments, implied volatilities, time value and non-performance risk. For the current market prices, we use third-party quoted forward prices, as applicable, for NYMEX WTI, LLS and MEH crude oil and NYMEX HH natural gas and OPIS Mt. Belvieu Ethane natural gas liquids closing prices as of the end of the reporting periods. We generally use the income approach, using valuation techniques that convert future cash flows to a single discounted value. Each of these is a level 2 input.
Interest rate swaps: We determined the fair values of our interest rate swaps using an income approach valuation technique which discounts future cash flows back to a single present value. We estimated the fair value of the swaps based on published interest rate yield curves as of the date of the estimate. Each of these was a Level 2 input. All interest rate swaps matured in May 2022, and as of December 31, 2022, we had not entered into any new interest rate derivative instruments.
Non-performance risk is incorporated by utilizing discount rates adjusted for the credit risk of our counterparties if the derivative is in an asset position, and our own credit risk if the derivative is in a liability position. See Note 6 for additional details on our derivative instruments.
Non-Recurring Fair Value Measurements
In addition to the fair value measurements applied with respect to assets contributed in the HuntJuniper Transactions and Devon Acquisitions,acquired with the Lonestar Acquisition, as described in Note 4, the most significant non-recurring fair value measurements utilized in the preparation of our Consolidated Financial Statementsconsolidated financial statements are those attributable to the initial determination of AROs associated with the ongoing development of new oil and gas properties. The determination of the fair value of AROs is based upon regional market and facility specific information. The amount of an ARO and the costs capitalized represent the estimated future cost to satisfy the abandonment obligation using current prices that are escalated by an assumed inflation factor after discounting the future cost back to the date that the abandonment obligation was incurred using a rate commensurate with the risk, which approximates our cost of funds. Because these significant fair value inputs are typically not observable, we have categorized the initial estimates as level 3 inputs.
14.Commitments and Contingencies
Note 14 – Commitments and Contingencies
The following table sets forth our significant commitments as of December 31, 2019,2022, by category, for the next 5five years and thereafter:
Year Gathering and Intermediate Transportation Other Commitments
2020 $12,962
 $289
2021 12,962
 140
2022 12,962
 70
2023 12,962
 
2024 12,962
 
Thereafter 37,789
 
Total $102,599
 $499

YearGathering and Intermediate Transportation CommitmentsOther Commitments
2023$13,937 $296 
202413,976 211 
202513,937 136 
20267,794 — 
20273,796 — 
Thereafter12,012 — 
Total$65,452 $643 
Drilling and Completion Commitments
As of December 31, 2019,2022, we had contractual commitments on a pad-to-pad basiscontracts for 2three drilling rigs. Additionally, we have a one-year agreement, effective January 1, 2020, which can be terminatedrigs with 30 days' notice by either party, to utilize certain frac services and related materials, with 0 minimum commitment.remaining terms of less than two years.

96


Gathering and Intermediate Transportation Commitments
We have long-term agreements that provide us with Nuevo Dos Gathering and Transportation, LLC (“Nuevo G&T”) and Nuevo Dos Marketing, LLC (“Nuevo Marketing” and together with Nuevo G&T, collectively “Nuevo”), successor to Republic Midstream, LLC and affiliates, to providefield gathering and intermediate pipeline transportation services for a substantial portionmajority of our crude oil and condensate production in South Texas as well asLavaca and Gonzales Counties, Texas. We also have volume capacity support for certain downstream interstateintrastate pipeline transportation. The following table provides details on these contractual arrangements as of December 31, 2022:
Nuevo is obligated
Description of contractual arrangementExpiration
of Contractual Arrangement
Minimum Gross Volume Commitment (MVC)
(bbl/d)
Expiration of Minimum Volume Commitment (MVC)
Field gathering agreementFebruary 20418,000February 2031
Intermediate pipeline transportation servicesFebruary 20268,000February 2026
Volume capacity supportApril 20268,000April 2026
Each of these arrangements also contain an obligation to gather and transport our crude oil and condensate from within a dedicated area indeliver the Eagle Ford via a gathering system and intermediate takeaway pipeline connecting to a downstream interstate pipeline operated by a third party through 2041. We have a minimum volume commitment of 8,000first 20,000 gross barrels of oil per day to Nuevo through 2031produced from Gonzales, Lavaca and Fayette Counties, Texas. For certain of our crude oil volumes gathered under the field gathering agreement, our rate includes an adjustment based on NYMEX WTI prices. As crude oil prices increase, up to a cap of $90 per bbl, the gathering rate escalates pursuant to the field gathering agreement.
Under the field gathering and volume capacity support arrangements, credits for deliveries of volumes in excess of the volume commitment may be applied to any deficiency arising in the succeeding 12-month period.
During the years ended December 31, 2022, 2021 and 2020, we recorded expense of $42.5 million, $36.0 million and $34.5 million, respectively, for these contractual obligations in connection with these arrangements.
Crude Oil Storage
As of December 31, 2022, we had access to up to approximately 180,000 barrels of dedicated tank capacity for no additional charge at the service provider’s central delivery point facility (“CDP”), in Lavaca County, Texas through February 2041. In addition, we had access for an additional 70,000 barrels of tank capacity at the CDP on a marketingmonth-to-month basis, which can be terminated by either party with 45-days’ notice to the counterparty. Costs associated with this monthly agreement are in the form of a monthly fixed rate short-term lease and are charged as incurred on a monthly basis to GPT in our consolidated statements of operations.
Other Agreements
We have a long-term dedication of certain specific leases under a crude purchase and throughput terminal agreement through 2032. Under the agreement, we have rights to transfer dedicated oil for delivery to a commitmentGulf coast terminal in Point Comfort, Texas or oil may be transferred at alternate locations to sell 8,000 barrels per day of crude oil (gross) to Nuevo, or to any third party, utilizing Nuevo Marketing's capacity inparties with a downstream interstate pipeline through 2026.
Other Commitmentsterminal fee.
We have enteredagreements that provide us with field gathering, compression and short-haul transportation services for our natural gas production and gas lift for our hydrocarbon production under various terms through 2039.
We also have agreements that provide us with services to process our wet gas production into certain contractual arrangements for otherNGL products and services. We have purchase commitments for certain materials as well as minimum commitments under information technology licensing and servicedry, or residue, gas. Several agreements among others.


covering the majority of our wet gas production extend beyond three years, including one agreement that extends into 2029.
Legal
We are involved, from time to time, in various legal proceedings arising in the ordinary course of business. While the ultimate results of these proceedings cannot be predicted with certainty, our management believes that these claims will not have a material effect on our financial position, results of operations or cash flows. As of December 31, 2019,2022 and 2021, we had aan estimated reserve in the amount of $0.3approximately $0.1 million for certain claims made against us regarding previously divested operations included in Accounts payable and accrued liabilities for the estimated settlement of disputes with a joint venture partner regarding certain transactions that occurred in prior years.on our consolidated balance sheets.

97


Environmental Compliance
Extensive federal, state and local laws govern oil and gas operations, regulate the discharge of materials into the environment or otherwise relate to the protection of the environment. Numerous governmental departments issue rules and regulations to implement and enforce such laws that are often difficult and costly to comply with and which carry substantial administrative, civil and even criminal penalties for failure to comply. Some laws, rules and regulations relating to protection of the environment may, in certain circumstances, impose “strict liability” for environmental contamination, rendering a person liable for environmental and natural resource damages and cleanup costs without regard to negligence or fault on the part of such person. Other laws, rules and regulations may restrict the rate of oil and gas production below the rate that would otherwise exist or even prohibit exploration or production activities in sensitive areas. In addition, state laws often require some form of remedial action to prevent pollution from former operations, such as plugging of abandoned wells. As of December 31, 2019,2022, and 2021, we have recordedhad AROs of $4.9$8.8 million attributable to these activities. and $8.4 million, respectively. Additionally, we had environmental remediation liabilities recorded as part of the Lonestar Acquisition of $0.2 million and $2.3 million as of December 31, 2022, and 2021, respectively. The environmental remediation activities were completed in the fourth quarter of 2022.
The regulatory burden on the oil and gas industry increases its cost of doing business and consequently affects its profitability. These laws, rules and regulations affect our operations, as well as the oil and gas exploration and production industry in general. We believe that we are in substantial compliance with current applicable environmental laws, rules and regulations and that continued compliance with existing requirements will not have a material impact on our financial condition or results of operations. Nevertheless, changes in existing environmental laws or the adoption of new environmental laws, including any significant limitation on the use of hydraulic fracturing, have the potential to adversely affect our operations.
Other Commitments
15.
Shareholders’ Equity
We have entered into certain contractual arrangements for other products and services and have commitments under information technology licensing and service agreements, among others.
Note 15 – Shareholders’ Equity
Capital Stock
Prior to the Lonestar Acquisition, the Company’s authorized capital stock consisted of 115,000,000 shares including (i) 110,000,000 shares of common stock, par value $0.01 per share and (ii) 5,000,000 shares of Series A Preferred Stock, par value $0.01 per share.
On October 6, 2021, in connection with the consummation of the Lonestar Acquisition, the Company effected a recapitalization, pursuant to which (i) the Company’s common stock was renamed and reclassified as Class A Common Stock, (ii) the authorized number of shares of capital stock of the Company was increased to 145,000,000 shares, (iii) 30,000,000 shares of Class B Common Stock was authorized, (iv) all 225,489.98 outstanding shares of the Series A Preferred Stock were exchanged for 22,548,998 newly issued shares of Class B Common Stock, and (v) the designation of the Series A Preferred Stock was cancelled.
As of December 31, 20192022, the Company had two classes of common stock: Class A Common Stock and December 31, 2018, there were 5,000,000Class B Common Stock. The holders of record of Class A Common Stock and Class B Common Stock vote together as a single class on all matters on which holders of Class A Common Stock and Class B Common Stock are entitled to vote; except that certain directors are elected by holders of a majority of the shares of preferred stock authorized with NaN issued or outstanding.
Class B Common Stock voting as a separate class.
The holders of Class A Common Stock have no preemptive rights to purchase shares of Class A Common Stock. Shares of Class A Common Stock are not subject to any redemption or sinking fund provisions and are not convertible into any of the Company’s other securities. In the event of the Company’s voluntary or involuntary liquidation, dissolution or winding up, holders of Class A Common Stock will share equally in the assets remaining after it pays its creditors and preferred shareholders. Holders of Class A Common Stock are entitled to receive dividends when and if declared by the Board of Directors.
Shares of Class B Common Stock are non-economic interests in the Company, and no dividends can be declared or paid on the Class B Common Stock. The holders of Class B Common Stock have no preemptive rights to purchase shares of any Class B Common Stock. Shares of Class B Common stock are not subject to any redemption or sinking fund provisions. In the event of the Company’s voluntary or involuntary liquidation, dissolution or winding up, after payment or provision for payment of its debts and other liabilities, the holders of Class B Common Stock will be entitled to receive, out of its assets or proceeds thereof available for distribution to our shareholders, before any distribution of such assets or proceeds is made to or set aside for the holders of Class A Common Stock and any other of the Company’s stock ranking junior to the Class B Common Stock as to such distribution, payment in full in an amount equal to $0.01 per share of Class B Common Stock. With the exception of the aforementioned distribution, the holders of shares of Class B Common Stock will not be entitled to receive any of the Company’s assets in the event of its voluntary or involuntary liquidation, dissolution or winding up.
98


The Company’s Class B Common Stock is not convertible into any of the Company’s other securities. However, if a holder exchanges one common unit of the Partnership, for one share of the Company’s Class A Common Stock, it must also surrender to the Company a share of its Class B Common Stock for each common unit exchanged.
As of December 31, 2019 and December 31, 2018, there were 15,135,598 and 15,080,5942022, the Company had (i) 110,000,000 authorized shares of Class A Common Stock and 19,074,864 shares of Class A Common Stock issued and outstanding, respectively, with a(ii) 30,000,000 authorized shares of Class B Common Stock and 22,548,998 shares of Class B Common Stock issued and outstanding, and (iii) 5,000,000 authorized shares of preferred stock, par value of $0.01 per share. We have a totalshare, and no shares of 45,000,000 shares authorized. We have not paid any cash dividends on our common stock. In addition, our Credit Facility and Second Lien Facility have restrictive covenants that limit our ability to pay dividends.preferred stock were issued or outstanding.
Paid-in Capital
RepresentsPaid-in capital represents the value of consideration we received in excess of par value for the original issuance of our common stock net of costs directly attributable to the issuance transactions. In addition, paid-in capital includes amounts attributable to the amortized cost of share-based awards that have been granted to our employees and directors, net of any adjustments with the ultimate vesting of such awards.
Accumulated Other Comprehensive Income (Loss)
Accumulated other comprehensive income and losses are entirely attributable to our pension and postretirement health care benefit obligations. For further details on our pension and postretirement health care plans, see Note 16.
Dividends
On July 7, 2022, the Company’s Board of Directors declared an inaugural cash dividend of $0.075 per share of Class A Common Stock and on November 2, 2022, a second cash dividend was declared of $0.075 per share of Class A Common Stock. The accumulatedrelated dividends were paid on August 4, 2022 and November 28, 2022 to holders of record of Class A Common Stock as of the close of business on July 25, 2022 and November 16, 2022, respectively. In connection with any dividend, Ranger’s operating subsidiary will also make a corresponding distribution to its common unitholders. During 2022, the dividends paid to the holders of our Class A Common Stock and distribution to common unitholders totaled $6.3 million in the aggregate. The Company’s Credit Facility and the indenture have restrictive covenants that limit its ability to pay dividends.
Share Repurchase Program
On April 13, 2022, our Board of Directors approved a share repurchase program that authorized the Company to repurchase up to $100 million of its outstanding Class A Common Stock. The share repurchase authorization was effective immediately and was valid through March 31, 2023. On July 7, 2022, the Board of Directors authorized an increase in the share repurchase program from $100 million to $140 million and extended the term of the program through June 30, 2023. We do not intend to repurchase additional shares pending closing of the Baytex Merger.
During the year ended December 31, 2022, we repurchased 2,150,486 shares of our Class A Common Stock at a total cost of $75.2 million at an average purchase price of $34.95. The share repurchases were recorded to Class A common stock and Paid-in capital on our consolidated balance sheets. As of December 31, 2022, the remaining authorized repurchase amount under the share repurchase program was $64.8 million.
Change in Ownership of Consolidated Subsidiaries
The following table summarizes changes in the ownership interest in consolidated subsidiaries during the periods presented:
Year Ended December 31,
202220212020
Net income (loss) attributable to Class A common shareholders$217,693 $40,229 $(310,557)
Transfers (to) from the noncontrolling interest, net 1
16,796 $(57,604)N/A
Change from net income (loss) attributable to Class A common shareholders and net transfers to Noncontrolling interest$234,489 $(17,375)$(310,557)

1     The year ended December 31, 2022 includes a net transfer of $16.8 million from Noncontrolling interest for share repurchases and common stock issuances related to employees’ share-based compensation with a corresponding adjustment to Paid-in capital. The year ended December 31, 2021 includes a net transfer to Noncontrolling interest of $57.6 million related to (i) the Class A common stock issuances and (2) the relative proportionate share of net assets acquired in the Lonestar Acquisition with a corresponding adjustment to Paid-in capital. These equity adjustments had no impact on earnings other comprehensivethan a resulting increase (decrease) to the noncontrolling interest proportionate share of net income (loss) and a corresponding increase (decrease) to the proportionate share of net income (loss) attributable to common shareholders.

99


During the year ended December 31, 2022, as discussed above and in Note 16, we repurchased shares of tax, was less than $0.1our Class A Common Stock and issued shares of our Class A Common Stock related to the vesting of employees’ share-based compensation resulting in a change in the proportionate share of Common Units held by the Company relative to Juniper. As such, we recognized an adjustment to the carrying amount of noncontrolling interest and a corresponding adjustment to Class A common shareholders’ equity of $16.8 million during the year ended December 31, 2022 to reflect the revised ownership percentage of total equity. See Note 3 for all periods presented.further discussion.
As discussed in Note 4, on October 5, 2021, the Company completed its acquisition of Lonestar in an all-stock transaction. In accordance with the terms of the Merger Agreement, Lonestar shareholders received 0.51 shares of Penn Virginia common stock for each share of Lonestar common stock held immediately prior to the effective time of the Lonestar Acquisition.
16.
In connection with the Lonestar Acquisition, 5,749,508 shares of Class A Common Stock of the Company were issued and, in accordance with the Partnership Agreement, an equivalent number of Common Units were issued to the Company resulting in a change in the proportionate share of Common Units held by the Company relative to Juniper as no additional Common Units in the Partnership were issued to Juniper. As such and effective upon the close of the Lonestar Acquisition, we recognized an adjustment to the carrying amount of noncontrolling interest and a corresponding adjustment to Class A common shareholders’ equity of $57.6 million to reflect the revised ownership percentage of total equity, inclusive of Juniper’s revised proportionate share of the fair value of net assets acquired in connection with the Lonestar Acquisition effective October 5, 2021.
Note 16 – Share-Based Compensation and Other Benefit Plans
Share-Based Compensation and Other Benefit Plans
We reserved 1,424,6004,424,600 shares of Class A Common Stock for issuance under the Penn Virginia CorporationRanger Oil Management Incentive Plan (the “Incentive Plan”) for future share-based compensation awards. A total of 360,615811,573 time-vested restricted stock units (“RSUs”) and 113,592 performance664,414 performance-based restricted stock units (“PRSUs”) have been granted as ofto employees and directors through December 31, 2019.2022.
We recognized $4.1 million, $4.6 million and $3.8 million of share-based compensation expense for the years ended December 31, 2019, 2018 and 2017, respectively. All of our share-based compensation awards are classified as equity instruments because they result in the issuance of common stock on the date of grant, upon exercise or are otherwise payable in common stock upon vesting, as applicable. The compensation cost attributable to these awards has been measured at the grant date and recognized over the applicable vesting periods as a non-cash itemexpense.
We recognized $5.6 million, $15.6 million (including $10.4 million and $1.9 million as a result of expense.


the change-in-control events associated with the Lonestar Acquisition discussed below and the Juniper Transactions, respectively) and $3.3 million of share-based compensation expense for the years ended December 31, 2022, 2021 and 2020, respectively, and nil, $0.5 million and $0.1 million of related income tax benefits for the years ended December 31, 2022, 2021 and 2020, respectively.
The Merger Agreement provided the terms in which Lonestar share-based awards held by Lonestar employees were replaced with share-based awards of the Company (“replacement awards”) on the acquisition date. For accounting purposes, the fair value of the replacement awards must be allocated between each employee’s pre-combination and post-combination services. Amounts allocated to pre-combination services have been included as consideration transferred as part of the Lonestar Acquisition. See Note 4 for a summary of consideration transferred. Compensation costs of $10.4 million allocated to post-combination services were recorded during the year ended December 31, 2021as stock-based compensation expense from the immediate vesting of these awards pursuant to the terms of the Merger Agreement.
Time-Vested Restricted Stock Units
A restricted stock unit entitlesThe RSUs entitle the grantee to receive a share of common stock upon the vestingachievement of the restricted stock unit.applicable service period vesting requirement. The grant date fair value of our time-vested restricted stock unitRSU awards are recognized on a straight-line basis over the applicable vesting period, which is generally over a three-year period.

100


The following table summarizes activity for our most recent fiscal year with respect to awarded RSUs:
 
Restricted Stock
Units
 
Weighted-Average
Grant Date
Fair Value
Balance at beginning of year208,040
 $47.35
Granted13,175
 $30.35
Vested(74,888) $39.40
Forfeited(9,451) $51.71
Balance at end of year136,876
 $49.76

Time-Vested Restricted Stock
Units
Weighted-Average
Grant Date
Fair Value
Balance at January 1, 2022230,517 $9.20 
Granted49,314 $35.07 
Vested(112,509)$10.03 
Forfeited(17,451)$12.77 
Balance at December 31, 2022149,871 $17.51 
As of December 31, 2019,2022, we had $5.0$1.6 million of unrecognized compensation cost attributable to RSUs. We expect that cost to be recognized over a weighted-average period of 1.11.74 years. The total grant-dategrant date fair values of RSUs that vested in 2019, 20182022, 2021 and 2017 was $3.02020 were $1.1 million, $3.3$3.6 million and $0.8$2.8 million, respectively.
Performance Restricted Stock Units
InThe PRSUs entitle the years ended December 31, 2019grantee to receive a share of common stock upon the achievement of both service and December 31, 2017, we granted 15,066 and 98,526 PRSUs, respectivelymarket conditions.
The table below presents information pertaining to members of our management. There were no PRSUs granted in the following periods:
2022202120202019
PRSUs granted 1
180,217225,206145,39915,066
Monte Carlo grant date fair value 2
$60.60 to $74.92$17.74 to $33.31$2.40 $34.02 
Average grant date fair value 3
$34.68 $13.63 not applicablenot applicable
___________________
1    The 2020 PRSU grants include one executive officers’ inducement award originally granted in August 2020 that was amended in April 2021 to conform vesting conditions to other PRSU awards granted in 2021.
2    Represents the Monte Carlo grant date fair value of PRSU grants based on the Company’s TSR performance (as defined below).
3    Represents the average grant date fair value of 2022 and 2021 PRSU grants based on the Company’s ROCE performance (as defined below).
Compensation expense for PRSUs with a market condition is being amortized ratably over three years for the year ended December 31, 2018.2022 and 2021 grants. For the 2020 and 2019 grants, compensation expense for the PRSUs with a market condition were amortized on a graded-vesting basis. The PRSUs were issued collectively inapplicable period for the amortization of compensation expense ranges from less than one year to three separate tranchesyears. Compensation expense for PRSUs with individuala performance condition is recognized ratably over three years when it is considered probable that the performance condition will be achieved and such grants are expected to vest. PRSUs with a market condition do not allow for the reversal of previously recognized expense, even if the market condition is not achieved and no shares ultimately vest.
The 2022 and 2021 PRSU grants contain performance measures of which 50% are based on the Company’s return on average capital employed (“ROCE”) relative to a defined peer group and 50% are based on the Company’s absolute total shareholder return and total shareholder return (“TSR”) relative to a defined peer group over the three-year performance periods beginning in January 2017, 2018, 2019period. The 2022 and 2020, respectively. 2021 PRSUs cliff vest from 0% to 200% of the original grant at the end of a three-year performance period based on satisfaction of the respective underlying conditions.
Vesting of the PRSUs cangranted in 2020 and 2019 range from 00% to 200% of the original grant based on the performance of our common stockTSR relative to an industry index or for those granted in 2019, a defined peer group of companies. Due to theirover the three-year performance period. As TSR is deemed a market condition, the PRSUs are being charged to expense using graded vesting over a maximum of five years. Thegrant-date fair value for the 2019, 2020 and a portion of eachthe 2021 and 2022 PRSU award was estimated on their grant datesgrants is derived by using a Monte Carlo simulation with a range of $47.70 to $65.28 per PRSU for the 2017 grants and $34.02 for the 2019 grant.
model. The table below presents ranges for the assumptions used in the Monte Carlo model for the PRSUs granted during 2019 and 2017in the following periods:
2022
2021 1
2020 1
2019
Expected volatility134.98% to 138.75%131.74% to 134.74%101.32% to 117.71%49.90 %
Dividend yield0.0 %0.0 %0.0 %0.0 %
Risk-free interest rate2.59%0.22% to 0.29%0.18% to 0.51%1.66 %
Performance period2022-20242021-20232020-20222020-2022
___________________
1    One executive officer’s inducement award originally granted in August 2020 was amended in April 2021 to conform vesting conditions to other PRSU awards granted in 2021. The Monte Carlo assumptions for both years are presented as follows:included above.

 2019 2017
Expected volatility49.9% 59.63% to 62.18%
Dividend yield0.0%
 0.0%
Risk-free interest rate1.66% 1.44% to 1.51%
101


The following table summarizes activity for our most recent fiscal year with respect to awarded PRSUs:
Performance Restricted Stock UnitsWeighted-Average Grant Date Fair Value
Balance at January 1, 2022345,069 $16.20 
Granted180,217 $47.77 
Vested(68,190)$10.12 
Change in units based on performance 1
(4,494)$7.01 
Forfeited(12,502)$21.47 
Balance at December 31, 2022440,100 $29.87 
 
Performance Restricted Stock
Units
 
Weighted-Average Grant Date
Fair Value
Balance at beginning of year89,071
 $58.69
Granted15,066
 $34.02
Vested(3,917) $63.25
Forfeited(1,083) $63.25
Expired(19,223) $62.92
Balance at end of year79,914
 $52.73
___________________

1
    PRSUs granted in 2020 and 2019 are granted at a target of 100% but can vest from a range of 0% to 200% of the original grant based on performance as described above. Amount represents difference between original grant amount and amounts ultimately earned.
As of December 31, 2022, we had $6.6 million of unrecognized compensation cost attributable to PRSUs. We expect that cost to be recognized over a weighted-average period of 1.65 years.
Executive Transition and Retirement
EffectiveIn August 2020, we appointed Darrin Henke as our president and chief executive officer, or CEO, and director following the retirement of John Brooks. We incurred incremental G&A costs of approximately $1.2 million, in connection with Mr. Henke’s appointment and Mr. Brooks’ separation. In addition to those incremental costs, we recognized $0.7 million during the year ended December 2, 2019, Mr. Steven A. Hartman separated from the Company. In accordance with his separation and transition agreement (“Hartman Separation Agreement”), we recorded a charge of $0.5 million for severance and other cash benefits that were paid in the first quarter of 2020. The Hartman Separation Agreement also provided31, 2020 for the accelerated vesting of certain share-based compensation awards for which we recognized accelerated expense of $0.2 million during the year ended December 31, 2019. Effective February 28, 2018, Mr. Harry Quarls retired from his position as a director and Executive Chairman of the Company. InBrooks in connection with his retirement, we entered into a separation and consulting agreement (“Quarls Separation Agreement”) whereby Mr. Quarls agreed to provide transition and support services to us through


December 31, 2018. We paid Mr. Quarls $0.3 million under the Quarls Separation Agreement. The Quarls Separation Agreement included a general release of claims and provided for the accelerated vesting of certain share-based compensation awards for which we recognized accelerated expense of $0.6 million during the year ended December 31, 2018. The costs associated with the Hartman and Quarls Separation Agreements, including the share-based compensation charges, were included as a component of “G&A expenses” in our Consolidated Statements of Operations for the years ended December 31, 2019 and 2018, respectively.retirement.
Defined Contribution Plan
We maintain the Penn VirginiaRanger Oil Corporation and Affiliated Companies Employees 401(k) Plan (the “401(k) Plan”), a defined contribution plan, which covers substantially all of our employees. We provide matching contributions on our employees’ elective deferral contributions up to 6 percent6% of compensation up to the maximum statutory limits. The 401(k) Plan also provides for discretionary employer contributions. TheWe recognized expense recognized with respectattributable to the 401(k) Plan wasof $1.2 million, $1.0 million, $0.9 million, $0.6 million, $0.5 million for the years ended December 31, 2019, 20182022, 2021 and 2017, respectively, and is2020, respectively. The charges for the 401(k) Plan are included as a component of “General and administrative expenses”G&A expenses in our Statementsconsolidated statements of Operations.operations. Amounts representing accrued obligations to the 401(k) Plan of $0.3$0.4 million and $0.3 million are included in the “Accountsrecorded within Accounts payable and accrued expenses” captionexpenses on our Consolidated Balance Sheetsconsolidated balance sheets as of December 31, 20192022 and 2018,2021, respectively.
Defined Benefit Pension and Postretirement Health Care Plans
We maintain unqualified legacy defined benefit pension and defined benefit postretirement health care plans whichthat cover a limited populationnumber of former employees that retired prior to January 1, 2000. The combined expense recognized with respect to these plans was less than $0.1 million for each year ended December 31, 2019, 20182022, 2021 and 2017,2020, and is included as a component of “Other, net”Other, net in our Statementsconsolidated statements of Operations.operations. The combined unfunded benefit obligations under these plans were $1.4$1.1 million as of December 31, 2022 and 2021 and are included within the “AccountsAccounts payable and accrued expenses”liabilities (current portion) and “Other liabilities” (noncurrentOther liabilities (non-current portion) captions on our Consolidated Balance Sheetsconsolidated balance sheets.
102


Note 17 – Earnings Per Share
Basic net earnings (loss) per share is calculated by dividing the net income (loss) available to Class A common shareholders, excluding net income or loss attributable to Noncontrolling interest, by the weighted average common shares outstanding for the period.
In computing diluted earnings (loss) per share, basic net earnings (loss) per share is adjusted based on the assumption that dilutive RSUs and PRSUs have vested and outstanding Common Units (and Class B Common Stock as ofapplicable to the years ended December 31, 20192022 and 2018.
17.Interest Expense
The following table summarizes2021) held by the componentsNoncontrolling interest in the Partnership are exchanged for Class A Common Stock. Accordingly, our reported net income (loss) attributable to Class A common shareholders is adjusted due to the elimination of the Noncontrolling interest expense forassuming exchange of the periods presented:Common Units (and Class B Common Stock as applicable to the years ended December 31, 2022 and 2021) held by the Noncontrolling interest.
 Year Ended December 31,
 2019 2018 2017
Interest on borrowings and related fees$36,593
 $32,164
 $6,995
Accretion of original issue discount 1
743
 680
 161
Amortization of debt issuance costs 2
2,611
 2,736
 1,961
Capitalized interest(4,136) (9,118) (2,725)
 $35,811
 $26,462
 $6,392

1
Includes accretion of original issue discount attributable to the Second Lien Facility (see Note 9).
2
The year ended December 31, 2017 includes a total of $0.8 million of write-offs attributable to changes in the composition of financial institutions comprising the Credit Facility’s bank group in connection with amendments to the Credit Facility (see Note 9).
18.Earnings per Share
The following table provides a reconciliation of the components used in the calculation of basic and diluted earnings (loss) per share for the periods presented:
 Year Ended December 31,
Numerator:202220212020
Net income (loss)$464,518 $98,918 $(310,557)
Net income attributable to Noncontrolling interest(246,825)(58,689)— 
Net income (loss) attributable to Class A common shareholders for Basic EPS217,693 40,229 (310,557)
Adjustment for assumed conversions of RSUs and PRSUs1,628 — — 
Adjustment for assumed conversions and elimination of Noncontrolling interest net income— 58,689 — 
Net income (loss) attributable to Class A common shareholders for Diluted EPS$219,321 $98,918 $(310,557)
Denominator:
Weighted average shares outstanding used in Basic EPS20,205 16,695 15,176 
Effect of dilutive securities:
Common Units and Series A Preferred Stock or Class B Common Stock, as applicable, that are exchangeable for Class A Common Stock 1, 2
— — — 
RSUs and PRSUs 2
621 470 — 
Weighted average shares outstanding used in Diluted EPS 2
20,826 17,165 15,176 

 Year Ended December 31,
 2019 2018 2017
Net income – basic and diluted$70,589
 $224,785
 $32,662
      
Weighted-average shares – basic15,110
 15,059
 14,996
Effect of dilutive securities 1
16
 233
 67
Weighted-average shares – diluted15,126
 15,292
 15,063
1    In connection with the Juniper Transactions in January 2021, we issued shares of Series A Preferred Stock. In October 2021, the Company effected a recapitalization and the Series A Preferred Stock were exchanged with Class B Common Stock and the designation of the Series A Preferred Stock was cancelled.
2     For the years ended December 31, 2022 and 2021, approximately 22.5 million potentially dilutive Common Units (and the associated 22.5 million Class B Common Stock) had the effect of being anti-dilutive and were excluded from the calculation of diluted earnings per share. For the year ended December 31, 2020, approximately 0.1 million potentially dilutive securities, represented by RSUs and PRSUs, had the effect of being anti-dilutive and were excluded from the calculation of diluted earnings per share.
Note 18 – Subsequent Events
Proposed Merger with Baytex Energy Corp.
On February 27, 2023, we entered into an Agreement and Plan of Merger (the “Merger Agreement”) with Baytex pursuant to which, among other things, the Company will merge with and into a wholly owned subsidiary of Baytex with the Company surviving the merger as a wholly owned subsidiary of Baytex (the “Baytex Merger”). Subject to the terms and conditions of the Merger Agreement, each share of our Class A Common Stock issued and outstanding immediately prior to the effective time of the Baytex Merger (including shares of our Class A Common Stock to be issued in connection with the exchange of the Class B Common Stock and Common Units for Class A Common Stock), will be converted automatically into the right to receive: (i) 7.49 Baytex common shares and (ii) $13.31 in cash. The transaction was unanimously approved by the board of directors of each company and JSTX and Rocky Creek delivered a support agreement to vote their outstanding shares in favor of the Baytex Merger. The Baytex Merger is expected to close late in the second quarter of 2023, subject to the satisfaction of customary closing conditions, including the requisite shareholder and regulatory approvals.
Dividends
On March 3, 2023, the Company’s Board of Directors declared a cash dividend of $0.075 per share of Class A Common Stock, payable on March 30, 2023 to holders of record of Class A Common Stock as of the close of business on March 17, 2023.
103


1
Represents a combination of unvested RSUs and PRSUs that are dilutive with the exception of December 31, 2019 at which time all of our unvested PRSUs were determined to be at a zero percent vesting level due to the relative performance of our common stock.

86


Supplemental Quarterly Financial Information (Unaudited)
2019 
First
Quarter
 
Second
Quarter
 Third Quarter 
Fourth
Quarter
Revenues 1
 $105,228
 $122,767
 $119,304
 $123,917
Operating income $38,668
 $47,888
 $40,040
 $50,225
Income (loss) $(38,697) $51,625
 $54,362
 $3,299
Income (loss) per share – basic 2
 $(2.56) $3.42
 $3.60
 $0.22
Income (loss) per share – diluted 2
 $(2.56) $3.40
 $3.59
 $0.22
Weighted-average shares outstanding:        
Basic 15,098
 15,106
 15,110
 15,126
Diluted 15,098
 15,162
 15,160
 15,131

2018 
First
Quarter
 
Second
Quarter
 Third Quarter 
Fourth
Quarter
Revenues 3
 $77,211
 $111,580
 $127,185
 $124,856
Operating income $33,912
 $55,886
 $64,036
 $54,921
Income (loss) 4
 $10,295
 $(2,521) $16,276
 $200,735
Income (loss) per share – basic 2
 $0.68
 $(0.17) $1.08
 $13.32
Income (loss) per share – diluted 2
 $0.68
 $(0.17) $1.06
 $13.10
Weighted-average shares outstanding:        
Basic 15,042
 15,058
 15,062
 15,075
Diluted 15,081
 15,058
 15,344
 15,328

1
Includes gains (losses) on sales of assets of less than $0.1 million, less than $0.1 million, less than $0.1 million and $(0.1) million during the quarters ended March 31, 2019, June 30, 2019, September 30, 2019 and December 31, 2019, respectively.
2  The sum of the quarters may not equal the total of the respective year’s earnings per common share due to changes in weighted-average shares outstanding throughout the year. 
3   Includes gains (losses) on sales of assets of less than $0.1 million, less than $0.1 million, less than $0.1 million and $(0.3) million during the quarters ended March 31, 2018, June 30, 2018, September 30, 2018 and December 31, 2018, respectively.
4
The quarter ended December 31, 2018 includes a mark-to-market gain on derivatives of $149.2 million.


87


Supplemental Information on Oil and Gas Producing Activities (Unaudited)
Oil and Gas Reserves
All of our proved oil and gas reserves are located in the continental United States. The estimates of our proved oil and gas reserves were prepared by our independent third party engineers, DeGolyer and MacNaughton, Inc. utilizing data compiled by us. DeGolyer and MacNaughton, Inc. is an independent firm of petroleum engineers, geologists, geophysicists and petrophysicists. Our Senior Vice President, EngineeringChief Operating Officer is primarily responsible for overseeing the preparation of the reserve estimate by DeGolyer and MacNaughton, Inc.
Reserve engineering is a process of estimating underground accumulations of oil and gas that cannot be measured in an exact manner, and the accuracy of any reserve estimate is a function of the quality of available data and of engineering and geological interpretation and judgment. The quantities of crude oil, NGLs and natural gas that are ultimately recovered, production and operating costs, the amount and timing of future development expenditures and future prices for these commodities may all differ from those assumed. In addition, reserve estimates of new discoveries are more imprecise than those of properties with a production history. Accordingly, these estimates are subject to change as additional information becomes available.
The following table sets forth our estimate of net quantities of proved reserves, including changes therein and proved developed and proved undeveloped reserves for the periods presented:
 Oil NGLs 
Natural
Gas
 
Total
Equivalents
Proved Developed and Undeveloped Reserves(MBbl) (MBbl) (MMcf) (MBOE)
December 31, 201636,611
 6,765
 36,682
 49,490
Revisions of previous estimates(5,735) (2,071) (10,468) (9,550)
Extensions and discoveries23,850
 3,571
 16,840
 30,228
Production(2,764) (523) (2,949) (3,779)
Purchase of reserves3,867
 1,122
 7,162
 6,183
December 31, 201755,829
 8,864
 47,267
 72,572
Revisions of previous estimates(19,096) (1,789) (9,608) (22,487)
Extensions and discoveries48,119
 11,737
 59,447
 69,764
Production(6,077) (1,004) (5,181) (7,944)
Purchase of reserves11,278
 969
 5,827
 13,218
Sale of reserves in place(397) (733) (6,259) (2,173)
December 31, 201889,656
 18,044
 91,493
 122,950
Revisions of previous estimates(24,709) (4,055) (25,440) (33,006)
Extensions and discoveries40,190
 6,575
 31,045
 51,939
Production(7,453) (1,491) (7,067) (10,121)
Purchase of reserves1,212
 81
 418
 1,363
December 31, 201998,896
 19,154
 90,449
 133,125
Proved Developed Reserves: 
    
  
December 31, 201722,412
 4,882
 27,229
 31,832
December 31, 201835,190
 6,279
 31,833
 46,774
December 31, 201940,641
 8,846
 41,808
 56,455
Proved Undeveloped Reserves: 
    
  
December 31, 201733,417
 3,982
 20,038
 40,740
December 31, 201854,466
 11,765
 59,660
 76,176
December 31, 201958,255
 10,308
 48,641
 76,670


Proved Developed and Undeveloped ReservesOil
(Mbbl)
NGLs
(Mbbl)
Natural
Gas
(MMcf)
Total
Equivalents
(Mboe)
December 31, 201998,896 19,154 90,449 133,125 
Revisions of previous estimates(23,554)(5,599)(26,712)(33,606)
Extensions and discoveries29,966 3,208 15,357 35,734 
Production(6,829)(1,165)(5,360)(8,887)
December 31, 202098,479 15,598 73,734 126,366 
Revisions of previous estimates(5,633)(2,606)(11,154)(10,098)
Extensions and discoveries45,709 9,877 47,774 63,548 
Production(7,711)(1,326)(6,712)(10,155)
Purchase of reserves32,278 18,476 121,550 71,012 
December 31, 2021163,122 40,019 225,192 240,673 
Revisions of previous estimates(35,615)(7,381)(44,239)(50,369)
Extensions and discoveries46,176 12,644 70,700 70,603 
Production(10,668)(2,205)(12,100)(14,890)
Purchase of reserves6,217 1,331 5,516 8,468 
December 31, 2022169,232 44,408 245,069 254,485 
Proved Developed Reserves:   
December 31, 202036,360 7,979 37,597 50,605 
December 31, 202159,957 16,431 94,033 92,060 
December 31, 202269,881 19,136 106,566 106,778 
Proved Undeveloped Reserves:   
December 31, 202062,119 7,619 36,137 75,761 
December 31, 2021103,165 23,588 131,159 148,613 
December 31, 202299,351 25,272 138,503 147,707 
The following is a discussion and analysis of the significant changes in our proved reserve estimates for the periods presented:
Year Ended December 31, 20192022
In 2019,2022, our proved reserves increased by 10.2 MMBOE.13.8 MMboe due primarily to substantial changes in our development plans from the southeast portion of our acreage position in the Eagle Ford to the central region. The overall shift to this region will allow us to develop wells with a lower gas content than what we were experienced in the southeast region through the first half of 2019. After achieving more favorable results with certain wells in the central region, we proceededacquisitions and proved undeveloped reserves extensions. During 2022, Ranger Oil continued to drill a totaland complete wells and increased drilling efficiencies in lateral footage capabilities. We optimized and refreshed the existing drilling inventory to access stranded acreage and optimize for longer laterals, resulting in an increase in average treatable lateral per well. This process resulted in an increase to extensions and discoveries of 11 gross wells, or approximately 23 percent70.6 MMboe that was offset by 34.3 MMboe of our total wells drilled in 2019, in the central region that were not considered proved undeveloped locations at the end of 2018. Accordingly, we have prioritized our drilling schedule to exploit these more favorable opportunities. While we still believe that the southeastern sites have economic merit, despite a higher gas content, we have deferred drilling them beyond the five-year window which results innegative revisions due to timing. Accordingly,schedule adjustments that moved wells beyond our five-year drilling plan is heavily weighted to the lower gas content central region.
We had downwardwindow schedule. In addition, our revisions of 33.0 MMBOE including:previous estimates reflect: (i) 32.1 MMBOE due to a change in timing beyond five years9.3 MMboe of unfavorable revisions attributable to our development plans as discussed above, as well as a reduction of drilling rigs from three to two, combining certain wells into extended reach lateral locations and other reductions due to changes in the planlateral lengths and type curves, (ii) unfavorable revisions of development, (ii) 2.7 MMBOE10.0 MMboe due to 15 percent lower crude oil pricing from $65.56 per barrel to $55.67 per barrel andperformance, offset by (iii) 1.6 MMBOEfavorable revisions due to reductions in lateral length and net revenue interests partially offset by (iv) 3.4 MMBOE due to improved performancepricing of certain proved undeveloped wells and proved undeveloped wells transferred to proved developed net of lower performance associated with certain existing proved developed wells including those reclassified to proved non-producing. Extensions and discoveries of 51.9 MMBOE are substantially attributable to geographical shift in our development plan, greater utilization of extended reach laterals, increasing the length of such laterals, higher estimated ultimate reserves (“EUR”) per lateral foot as well the addition of certain non-operated royalty wells. We acquired 1.4 MMBOE in connection with the acquisition of certain non-operating partners working interests in locations in which we are the operator.3.3 MMboe.
104


Year Ended December 31, 20182021
In 2018,2021, our proved reserves increased by 50.4 MMBOE. The overall increase over our proved reserves at the end of 2017 is114.3 MMboe due primarily to a significant shiftthe Juniper transactions and the Lonestar Acquisition increasing our reserves. During the COVID-19 pandemic, Ranger Oil continued to drill and complete wells and increased drilling efficiencies in our development plans fromlateral footage capabilities. Additionally, we optimized and refreshed the northwest portionexisting drilling inventory to access stranded acreage and optimize for longer laterals, resulting in an increase in average treatable lateral per well, thus increasing the average reserves per well. This process resulted in an increase to extensions and discoveries of our acreage position in the Eagle Ford63.5 MMboe that was offset by 14.0 MMboe of negative revisions due to the southeast region. The performance of ourschedule adjustments that moved wells drilled in the southeast region in the first half of the year was the impetus to our redirecting of resources and replication, to the extent practical, of our drilling and completion design techniques for the second half of 2018. Of the 53 gross wells we drilled in 2018, 19 gross wells were not proved undeveloped locations at the end of 2017. Accordingly,beyond our five-year drilling plan is heavily weighted to the southeast region.
We had downwardwindow schedule. In addition, our revisions of 22.5 MMBOE including:previous estimates reflect: (i) 21.1 MMBOE5.8 MMboe of favorable revisions attributable to changes in lateral lengths and type curves and (ii) favorable revisions due to the losspricing of certain locations resulting from changes in the drilling locations and timing attributable to our development plans as discussed above and (ii) 4.4 MMBOE due to well performance partially3.6 MMboe, offset by (iii) 1.2 MMBOEunfavorable revisions of 5.5 MMboe due to improved treatable lateral lengths in certain locations due primarily to reconfiguration of the planned drilling units and (iv) 1.8 MMBOE of other changes, primarily price-related. Extensions and discoveries of 69.8 MMBOE are substantially attributable to geographical shift in our development plan, greater utilization of extended reach laterals, increasing the length of such laterals, higher EUR estimates per lateral foot and higher net revenue interests due to the Hunt Acquisition. We acquired 13.2 MMBOE in connection with the Hunt Acquisition and we sold 2.2 MMBOE in connection with our exit from the Mid-Continent region.performance.
Year Ended December 31, 20172020
We had downward revisions of 9.6 MMBOE as a result of the following: (i) downward revisions of 6.5 MMBOEIn 2020, our proved reserves declined by 6.8 MMboe due primarily to reduced treatable lateral lengthslower commodity pricing reducing our reserves in certain locationsexcess of the positive revisions to replace production. In light of the ongoing COVID-19 pandemic and its impact on our capital resources, we undertook a substantial review of our drilling plans and available site inventory that resulted in a substantial shift in the focus of our near-term drilling schedule to a greater focus on our core, oilier prospects. This process resulted in an increase to extensions and discoveries of 35.7 MMboe that was largely offset by 34.0 MMboe of negative revisions due primarily to reconfigurationcertain wells that moved beyond our five-year drilling window schedule. In addition, our revisions of the planned drilling units partiallyprevious estimates reflect: (i) 6.9 MMboe of favorable revisions attributable to changes in lateral lengths and type curves, substantially offset by improved performance, (ii) downwardunfavorable revisions of 4.7 MMBOE to our proved undeveloped reserves3.2 MMboe due to the lossperformance and (iii) declines in pricing of certain locations resulting from changes in the timing and drilling locations attributable to our development plans partially offset by (iii) 1.6 MMBOE due to improved well performance. Extensions and discoveries of 30.2 MMBOE are entirely attributable to our expanded development plan including adding a third rig to our drilling program and the corresponding increase in the number of drilling locations that we are planning to drill in the next five years. We acquired 6.2 MMBOE in connection with the Devon Acquisition. An additional 1.0 MMBOE attributable to the Devon Acquisition was determined in our year-end assessment consistent with our development plans and is included in the aforementioned extensions and discoveries.


3.2 MMboe.
Capitalized Costs Relating to Oil and Gas Producing Activities
The following table sets forth capitalized costs related to our oil and gas producing activities and accumulated DD&A for the periods presented:
 December 31,
 2019 2018 2016
Oil and gas properties:     
Proved$1,409,219
 $1,037,993
 $460,029
Unproved53,200
 63,484
 117,634
Total oil and gas properties1,462,419
 1,101,477
 577,663
Other property and equipment21,317
 16,462
 10,057
Total capitalized costs relating to oil and gas producing activities1,483,736
 1,117,939
 587,720
Accumulated depreciation and depletion(364,716) (191,802) (60,247)
Net capitalized costs relating to oil and gas producing activities 1
$1,119,020
 $926,137
 $527,473

 December 31,
 202220212020
Oil and gas properties:
Proved$3,013,854 $2,327,686 $1,545,910 
Unproved41,882 57,900 49,935 
Total oil and gas properties3,055,736 2,385,586 1,595,845 
Other property and equipment25,318 26,131 23,068 
Total capitalized costs relating to oil and gas producing activities3,081,054 2,411,717 1,618,913 
Accumulated depreciation and depletion(1,273,005)(1,028,970)(896,219)
Net capitalized costs relating to oil and gas producing activities 1
$1,808,049 $1,382,747 $722,694 
_____________________________________________ 
1Excludes property and equipment attributable to our corporate operations which is comprised of certain capitalized hardware, software, leasehold improvements and office furniture and fixtures.
105


Costs Incurred in Certain Oil and Gas Activities
The following table summarizes costs incurred in our oil and gas property acquisition, exploration and development activities for the periods presented:
 Year Ended December 31,
 2019 2018 2017
Development costs 1
$355,925
 $416,037
 $135,360
Proved property acquisition costs 2
6,051
 86,514
 43,151
Unproved property acquisition costs 3
7,570
 30,637
 153,905
Exploration costs 4
363
 377
 696
 $369,909
 $533,565
 $333,112

 Year Ended December 31,
 202220212020
Development costs$516,616 $262,439 $126,739 
Proved property acquisition costs 1
137,532 — — 
Unproved property acquisition costs6,882 3,687 3,448 
Exploration costs1,214 86 342 
$662,244 $266,212 $130,529 
_____________________________________________ 
1 Includes plugging and abandonment asset additionsExcludes the fair value of $0.3proved properties of $478.0 million $0.7 million and $0.3 million and capitalized internal costs of $3.6 million, $3.3 million and $2.1 millionrecorded in the purchase price allocation with respect to the Lonestar Acquisition for the years ended December 31, 2019, 2018 and 2017, respectively.
2 Includes plugging and abandonment assets acquired of $0.1 million in the year ended December 31, 2019 and $0.4 million and $0.5 million acquired in2021. The purchase was funded through the Hunt and Devon Acquisitions during the years ended December 31, 2018 and 2017, respectively. Also includes capitalized internal costsissuance of $0.5 million, $0.4 million and $0.3 million for the years ended December 31, 2019, 2018 and 2017, respectively.
3 Includes capitalized interest of $4.1 million, $9.1 million and $2.7 million for the years ended December 31, 2019, 2018 and 2017, respectively as well as unproved properties acquired in the Hunt and Devon Acquisitions during the years ended December 31, 2018 and 2017.
4 Includes geological costs, geophysical costs (seismic) and delay rentals for all periods presented.our common stock.
Standardized Measure of Discounted Future Net Cash Flows Relating to Proved Oil and Gas Reserves
Future cash inflows were computed by applying the average prices of oil and gas during the 12-month period prior to the period end, determined as an unweighted arithmetic average of the first-day-of-the-month price for each month within the period and estimated costs as of that fiscal year end, to the estimated future production of proved reserves. Future prices actually received may materially differ from current prices or the prices used in the standardized measure.
Future production and development costs represent the estimated future expenditures (based on current costs) to be incurred in developing and producing the proved reserves, assuming continuation of existing economic conditions. Future income tax expenses were computed by applying statutory income tax rates to the difference between pre-tax net cash flows relating to our proved reserves and the tax basis of proved oil and gas properties. In addition, the effects of statutory depletion in excess of tax basis, available NOL carryforwards and alternative minimum tax credits were used in computing future income tax expense. The resulting annual net cash inflows were then discounted using a 10% annual rate.
The standardized measure of discounted future net cash flows is not intended, and should not be interpreted, to represent the fair value of our oil and gas reserves. An estimate of the fair value would also consider, among other things, the recovery of reserves not presently classified as proved, anticipated future changes in prices and cost, and a discount factor more representative of economic conditions and risks inherent in reserve estimates. Accordingly, the changes in standardized measure reflected below do not necessarily represent the economic reality of such transactions.


Crude oil and natural gas prices were based on average (beginning of month basis) sales prices per Bblbbl and MMBtu with the representative price of natural gas adjusted for basis premium and energy content to arrive at the appropriate net price. NGL prices were estimated as a percentage of the base crude oil price.
The following table summarizes the price measurements utilized, by product, with respect to our estimates of proved reserves as well as in the determination of the standardized measure of the discounted future net cash flows for the periods presented:
Crude OilNGLsNatural Gas
$/bbl$/bbl$/MMBtu
December 31, 2020$39.54 $7.51 $1.99 
December 31, 2021$66.57 $22.99 $3.60 
December 31, 2022$93.67 $35.42 $6.36 
106

 Crude Oil NGLs Natural Gas
 $ per Bbl $ per Bbl $ per MMBtu
December 31, 2017$51.34
 $18.48
 $2.98
December 31, 2018$65.56
 $23.60
 $3.10
December 31, 2019$55.67
 $13.36
 $2.58


The following table sets forth the standardized measure of the discounted future net cash flows attributable to our proved reserves for the periods presented:
 December 31,
 202220212020
Future cash inflows$18,918,984 $12,157,254 $3,832,194 
Future production costs(4,204,946)(2,938,528)(1,356,505)
Future development costs(2,876,385)(1,809,394)(926,904)
Future net cash flows before income tax11,837,653 7,409,332 1,548,785 
Future income tax expense(1,720,781)(978,510)(60,598)
Future net cash flows10,116,872 6,430,822 1,488,187 
10% annual discount for estimated timing of cash flows(5,268,597)(3,373,661)(837,897)
Standardized measure of discounted future net cash flows$4,848,275 $3,057,161 $650,290 
 December 31,
 2019 2018 2017
Future cash inflows$6,260,292
 $6,719,145
 $3,091,366
Future production costs(1,792,891) (1,852,168) (1,069,910)
Future development costs(1,174,215) (1,208,815) (689,998)
Future net cash  flows before income tax3,293,186
 3,658,162
 1,331,458
Future income tax expense(334,451) (413,137) (84,350)
Future net cash flows2,958,735
 3,245,025
 1,247,108
10% annual discount for estimated timing of cash flows(1,469,853) (1,621,135) (656,624)
Standardized measure of discounted future net cash flows$1,488,882
 $1,623,890
 $590,484
Changes in Standardized Measure of Discounted Future Net Cash Flows Relating to Proved Oil and Gas Reserves
The following table summarizes the changes in the standardized measure of the discounted future net cash flows attributable to our proved reserves for the periods presented:
 Year Ended December 31,
 202220212020
Sales of oil and gas, net of production costs$(957,736)$(476,734)$(194,660)
Net changes in prices and production costs2,145,419 1,324,982 (950,201)
Changes in future development costs(81,629)(129,058)450,286 
Extensions and discoveries1,139,833 753,601 74,830 
Development costs incurred during the period380,463 131,743 102,459 
Revisions of previous quantity estimates(1,325,864)(188,804)(303,219)
Purchases of reserves-in-place348,926 926,169 — 
Changes in production rates and all other144,547 353,520 (282,055)
Accretion of discount341,872 65,755 160,010 
Net change in income taxes(344,717)(354,303)103,958 
Net increase (decrease)1,791,114 2,406,871 (838,592)
Beginning of year3,057,161 650,290 1,488,882 
End of year$4,848,275 $3,057,161 $650,290 
 Year Ended December 31,
 2019 2018 2017
Sales of oil and gas, net of production costs$(374,694) $(361,478) $(118,137)
Net changes in prices and production costs(402,616) 585,737
 170,488
Changes in future development costs415,193
 206,901
 30,692
Extensions and discoveries459,501
 809,880
 131,060
Development costs incurred during the period253,982
 204,160
 74,880
Revisions of previous quantity estimates(515,345) (483,091) (122,357)
Purchases of reserves-in-place12,241
 86,128
 80,878
Sale of reserves-in-place
 (8,912) 
Changes in production rates and all other(194,453) 60,160
 12,161
Accretion of discount176,935
 60,897
 31,755
Net change in income taxes34,248
 (126,976) (18,486)
Net increase (decrease)(135,008) 1,033,406
 272,934
Beginning of year1,623,890
 590,484
 317,550
End of year$1,488,882
 $1,623,890
 $590,484


91
107


Item 9. Changes in and Disagreements With Accountants on Accounting and Financial Disclosure 
Item 9
Changes in and Disagreements With Accountants on Accounting and Financial Disclosure
Not applicable.

Item 9AControls and Procedures
Item 9A. Controls and Procedures
(a) Disclosure Controls and Procedures
Our management, with the participation of our Chief Executive Officer and our Chief Financial Officer, evaluated the effectiveness of our disclosure controls and procedures (as defined in Rule 13a-15(e) of the Exchange Act) as of December 31, 2019.2022. Our disclosure controls and procedures are designed to ensure that information required to be disclosed by us in the reports we file or submit under the Exchange Act is recorded, processed, summarized and reported within the time periods specified in the Securities and Exchange Commission’s rules and forms, and that such information is accumulated and communicated to the issuer’s management, including our Chief Executive Officer and our Chief Financial Officer, as appropriate, to allow timely decisions regarding required disclosure. Based on that evaluation, our Chief Executive Officer and our Chief Financial Officer concluded that, as of December 31, 2019,2022, such disclosure controls and procedures were effective.
(b) Management’s Annual Report on Internal Control Over Financial Reporting
Our management is responsible for establishing and maintaining adequate internal control over our financial reporting. Our management assessed the effectiveness of our internal control over financial reporting as of December 31, 2019.2022. This evaluation was completed based on the framework established in Internal Control—Integrated Framework(2013) issued by the Committee of Sponsoring Organizations of the Treadway Commission. 
Based on that assessment, our management has concluded that, as of December 31, 2019,2022, our internal control over financial reporting was effective. 
(c) Attestation Report of the Registered Public Accounting Firm 
Grant Thornton LLP, the independent registered public accounting firm that audited and reported on the consolidated financial statements contained in this Form 10-K, has issued an attestation report on the internal control over financial reporting as of December 31, 2019,2022, which is included in Item 8 of this Annual Report on Form 10-K. 
(d) Changes in Internal Control Over Financial Reporting
No changes were made in our internal control over financial reporting that occurred during our last fiscal quarter that have materially affected, or are reasonably likely to materially affect, our internal control over financial reporting.

Item 9BOther Information
Item 9B. Other Information
None.
Item 9C. Disclosure Regarding Foreign Jurisdictions that Prevent Inspections
Not applicable.

92
108


Part III

Item 10. Directors, Executive Officers and Corporate Governance 
Item 10
Directors, Executive Officers and Corporate Governance
In accordance with General Instruction G(3), reference is hereby madethe information required will be filed as an amendment to the Company’s definitive proxy statement to be filedthis Form 10-K within 120 days after the end of the fiscal year covered by this Annual Report on Form 10-K.
We have adopted a Code of Business Conduct and Ethics that applies to all of our directors, officer and employees,
including our principal executive, principal financial and principal accounting officers, or persons performing similar
functions. Our Code of Business Conduct and Ethics is posted on our website located at https://ir.pennvirginia.com/ir.rangeroil.com/governance-docs. We intend to disclose future amendments to certain provisions of the Code of Business Conduct and Ethics, and any waivers of the Code of Business Conduct and Ethics granted to executive officers and directors, on the website within four business days following the date of the amendment or waiver.
Item 11Executive Compensation
Item 11. Executive Compensation
In accordance with General Instruction G(3), reference is hereby madethe information required will be filed as an amendment to the Company’s definitive proxy statement to be filedthis Form 10-K within 120 days after the end of the fiscal year covered by this Annual Report on Form 10-K.
Item 1212. Security Ownership of Certain Beneficial Owners and Management and Related Stockholder Matters
In accordance with General Instruction G(3), reference is hereby madethe information required will be filed as an amendment to the Company’s definitive proxy statement to be filedthis Form 10-K within 120 days after the end of the fiscal year covered by this Annual Report on Form 10-K.
Item 13Certain Relationships and Related Transactions, and Director Independence
Item 13. Certain Relationships and Related Transactions, and Director Independence
In accordance with General Instruction G(3), reference is hereby madethe information required will be filed as an amendment to the Company’s definitive proxy statement to be filedthis Form 10-K within 120 days after the end of the fiscal year covered by this Annual Report on Form 10-K.
Item 14
Item 14. Principal Accountant Fees and Services 
Principal Accountant Fees and Services
In accordance with General Instruction G(3), reference is hereby madethe information required will be filed as an amendment to the Company’s definitive proxy statement to be filedthis Form 10-K within 120 days after the end of the fiscal year covered by this Annual Report on Form 10-K.

109
93


Part IV
Item 1515. Exhibits and Financial Statement Schedules
(1)    Financial Statements
(1)Financial Statements
The financial statements filed herewith are listed in the Index to Consolidated Financial Statements on page 5867 of this Annual Report on Form 10-K.
(2)Exhibits
(2)    Exhibits
The following documents are included as exhibits to this Annual Report on Form 10-K. Those exhibits incorporated by reference are indicated as such in the parenthetical following the description. All other exhibits are included herewith. 
Exhibit
Number
Description
Second
(4.1)#
Description of Common Stock.
Master Agreement, Borrowing Base Increase Agreement, and Amendment No. 6 to Credit Agreement, dated as of May 7, 2019, among Penn Virginia Holding Corp., as borrower, Penn Virginia Corporation, as parent, the subsidiaries of the borrower party thereto, the lenders party thereto and Wells Fargo Bank, National Association, as administrative agent (incorporated by reference to Exhibit 10.13.3 to Registrant’s Current Report on Form 8-K filed on May 8, 2019)October 7, 2021).
Credit
Pledge and Security Agreement, dated as of September 29, 2017, by Penn Virginia Holding Corp., Penn Virginia Corporation and the other grantors party thereto in favor of Jefferies Finance LLC, as administrative agent and collateral agent for the ratable benefit of the secured parties thereunder (incorporated by reference to Exhibit 10.3 to Registrants Current Report on Form 8-K filed on October 5, 2017)7, 2021).
Intercreditor Agreement, dated as of September 29, 2017, by and among Penn Virginia Holding Corp., Penn Virginia Corporation, the subsidiaries of Penn Virginia Holding Corp. party thereto, Wells Fargo Bank, National Association and Jefferies Finance LLC (incorporated by reference to Exhibit 10.4 to Registrants Current Report on Form 8-K filed on October 5, 2017).
Second Amended and Restated Construction and Field Gathering Agreement by and between Republic Midstream, LLC and Penn Virginia Oil & Gas, L.P. dated August 1, 2016 (incorporated by reference to Exhibit 10.5 to Registrant’s Quarterly Report on Form 10-Q/A filed on November 28, 2016).
110


Form of Performance Restricted Stock Unit Award Agreement (incorporated by reference to Exhibit 10.2 to Registrants Current Report on Form 8-K filed on January 30, 2017).
Form of Director Restricted Stock Award Agreement (incorporated by reference to Exhibit 10.1 to Registrants Current Report on Form 8-K filed on December 21, 2016).
Penn Virginia Corporation 2019 Management Incentive Plan (incorporated by reference to Appendix A to Companys Definitive Proxy Statement for its 2019 Annual General Meeting of Shareholders filed on July 1, 2019).
Plan (incorporated by reference to Exhibit 10.11.2 to Registrant’s Annual Report on Form 10-K filed on February 28, 2020).
Plan (incorporated by reference to Exhibit 10.11.3 to Registrant’s Annual Report on Form 10-K filed on February 28, 2020).
Separation and Transition Agreement, entered into as of July 1, 2019, between Penn Virginia Corporation and Steven A. Hartman (incorporated by reference to Exhibit 10.1 to Registrant’s Current Report on Form 8-K filed on July 8, 2019).
Subsidiaries
Officer Indemnification Agreement (incorporated by reference to Exhibit 10.3 to Registrant’s Current Report on Form 8-K filed on August 21, 2020).
(32.1)(32.1)††
(32.2)(32.2)††
(101.INS)#
(101.INS)#Inline XBRL Instance Document – the instance document does not appear in the Interactive Data File because its XBRL tags are embedded within the Inline XBRL document.
(101.SCH)#
(101.SCH)#Inline XBRL Taxonomy Extension Schema Document
(101.CAL)#
(101.CAL)#Inline XBRL Taxonomy Extension Calculation Linkbase Document
(101.DEF)#
(101.DEF)#Inline XBRL Taxonomy Extension Definition Linkbase Document
(101.LAB)#
(101.LAB)#Inline XBRL Taxonomy Extension Label Linkbase Document
(101.PRE)#
(101.PRE)#Inline XBRL Taxonomy Extension Presentation Linkbase Document
(104)#
(104)#The cover page of Penn Virginia Corporation'sRanger Oil Corporation’s Annual Report on Form 10-K for the year ended December 31, 2019,2022, formatted in Inline XBRL (included within the Exhibit 101 attachments).
____________________
*
*    Management contract or compensatory plan or arrangement.
#Filed herewith.
Confidential treatment has been requested for this exhibit and confidential portions have been filed separately with the Securities and Exchange Commission.
††Furnished herewith.

#     Filed herewith.
†    Confidential treatment has been requested for this exhibit and confidential portions have been filed separately with the Securities and Exchange Commission.
††    Furnished herewith.
Item 16Form 10-K Summary
Item 16. Form 10-K Summary
None.

111
95


SIGNATURES
Pursuant to the requirements of Section 13 or 15(d) of the Securities Exchange Act of 1934, the Registrant has duly caused this report to be signed on its behalf by the undersigned, thereunto duly authorized.

RANGER OIL CORPORATION
March 9, 2023By:/s/ RUSSELL T KELLEY, JR.
Russell T Kelley, Jr.
Senior Vice President, Chief Financial Officer and Treasurer
(Principal Financial Officer)
March 9, 2023PENN VIRGINIA CORPORATIONBy: /s/ KAYLA D. BAIRD
Kayla D. Baird
By:/s/ RUSSELL T KELLEY, JR.Vice President, Chief Accounting Officer and Controller
Russell T Kelley, Jr.
Senior Vice President and Chief Financial Officer
(Principal Financial Officer)
February 28, 2020By: /s/ TAMMY L. HINKLE
Tammy L. Hinkle 
Vice President and Controller
(Principal Accounting Officer)

Pursuant to the requirements of the Securities Exchange Act of 1934, this report has been signed below by the following persons on behalf of the Registrant and in the capacities and on the dates indicated.
/s/ DARRIN J. HENKEPresident and Chief Executive Officer and DirectorMarch 9, 2023
Darrin J. Henke(Principal Executive Officer)
/s/ RUSSELL T KELLEY, JR.Senior Vice President, Chief Financial Officer and TreasurerMarch 9, 2023
Russell T Kelley, Jr.(Principal Financial Officer)
/s/ KAYLA D. BAIRDVice President, Chief Accounting Officer and ControllerMarch 9, 2023
Kayla D. Baird(Principal Accounting Officer)
/s/ RICHARD BURNETTDirectorMarch 9, 2023
Richard Burnett
/s/ JOHN A. BROOKSChief Executive Officer and DirectorFebruary 28, 2020
John A. Brooks(Principal Executive Officer)
/s/ RUSSELL T KELLEY, JR.Senior Vice President and Chief Financial OfficerFebruary 28, 2020
Russell T Kelley, Jr.(Principal Financial Officer)
/s/ TAMMY L. HINKLEVice President and ControllerFebruary 28, 2020
Tammy L. Hinkle(Principal Accounting Officer)
/s/ TIFFANY THOM CEPAKDirectorFebruary 28, 2020March 9, 2023
Tiffany Thom Cepak
/s/ DARIN G. HOLDERNESSGARRETT CHUNNDirectorMarch 9, 2023
Garrett Chunn
/s/ KEVIN CUMMINGDirectorMarch 9, 2023
Kevin Cumming
/s/ EDWARD GEISERChairman of the BoardFebruary 28, 2020March 9, 2023
Darin G. HoldernessEdward Geiser
/s/ V. FRANK POTTOWTIMOTHY W. GRAYDirectorFebruary 28, 2020March 9, 2023
V. Frank PottowTimothy W. Gray
/s/ JERRY R. SCHUYLER

JOSHUA SCHMIDT
DirectorFebruary 28, 2020March 9, 2023
Jerry R. Schuyler

Joshua Schmidt
/s/ BRIAN STECK

DirectorFebruary 28, 2020
Brian Steck

/s/ JEFFREY WOJAHN

DirectorFebruary 28, 2020March 9, 2023
Jeffrey Wojahn


96112