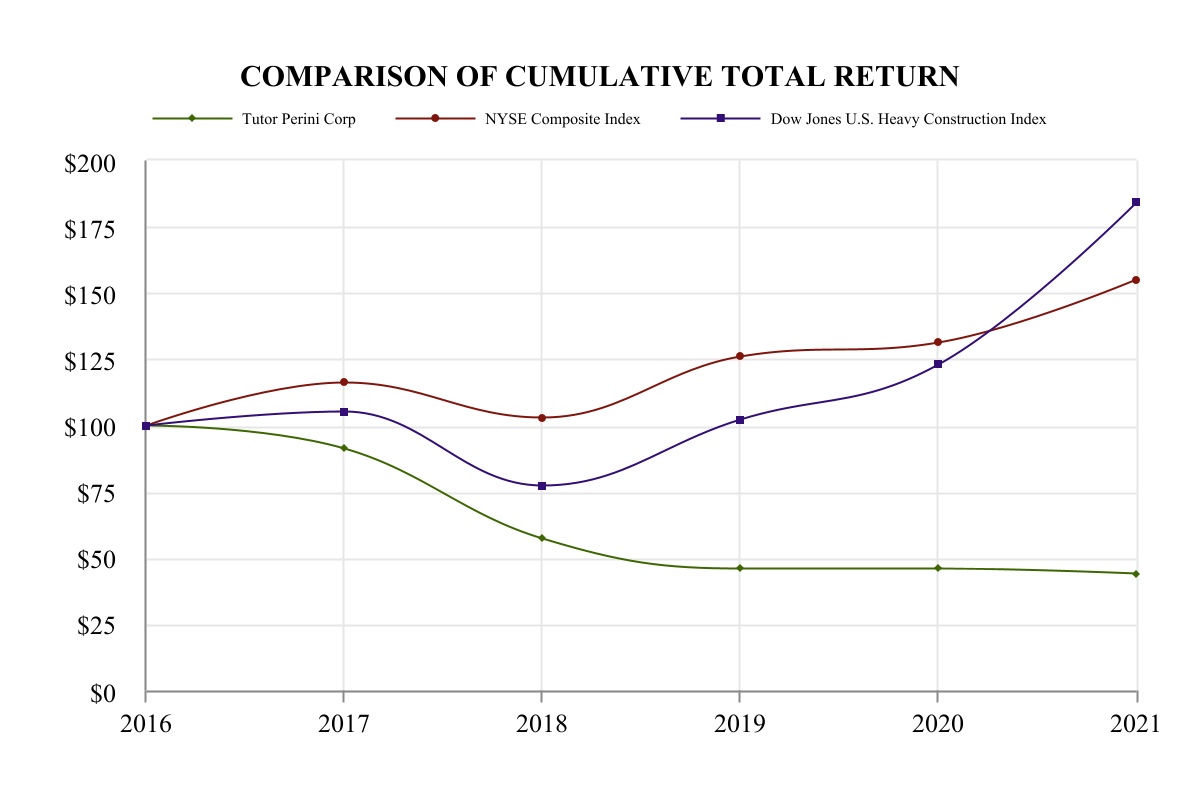
(Exact name of registrant as specified in its charter)
|
| |||||||||
Massachusetts | 04-1717070 | |||||||||
| (State or Other Jurisdiction of Incorporation or Organization) | ( | |||||||||
15901 Olden Street, Sylmar, California | 91342 | |||||||
(Address of principal executive offices) | (Zip Code) | |||||||
(818) 362-8391 | ||||||||
(Registrant’s telephone number, including area code) | ||||||||
Title of each class Trading Symbol(s) Name of each exchange on which registered Common Stock, $1.00 par value TPC The New York Stock Exchange ☐ ☒ ☐ ☐ Accelerated filer Smaller reporting company Emerging growth company 51,095,706. TUTOR PERINI CORPORATION CONTENTS Business Segment Overview control. Although price is a key competitive factor, we believe our strong reputation, long-standing customer relationships and significant level of repeat and referral business have enabled us to achieve a leading position in the marketplace. segments. Our Specialty Contractors business units have completed, or are currently working on, various portions of the East Side Access project in New York City, various projects at the World Trade Center and at Hudson Yards in New York City, and upgrades and rehabilitations at various New York City public housing As of December 31, (in thousands) 2019 2018 Backlog by business segment: Civil $ 6,037,195 54 % $ 5,141,863 55 % Building 2,790,289 25 % 2,333,127 25 % Specialty Contractors 2,393,626 21 % 1,821,701 20 % Total backlog $ 11,221,110 100 % $ 9,296,691 100 % As of December 31, (in thousands) 2019 2018 Civil segment backlog by end market: Mass transit $ 4,628,664 77 % $ 3,710,354 72 % Military defense facilities 369,647 6 % 189,004 4 % Bridges 364,992 6 % 513,839 10 % Highways 229,851 4 % 348,589 7 % Tunneling 83,551 1 % 168,113 3 % Other 360,490 6 % 211,964 4 % Total Civil segment backlog $ 6,037,195 100 % $ 5,141,863 100 % As of December 31, (in thousands) 2019 2018 Building segment backlog by end market: Hospitality and gaming $ 793,624 28 % $ 26,866 1 % Municipal and government 584,444 21 % 499,288 21 % Commercial and industrial facilities 578,852 21 % 518,880 22 % Mass transit 345,462 12 % 678,371 29 % Education facilities 233,551 8 % 177,402 8 % Health care facilities 92,913 3 % 280,354 12 % Other 161,443 7 % 151,966 7 % Total Building segment backlog $ 2,790,289 100 % $ 2,333,127 100 % As of December 31, (in thousands) 2019 2018 Specialty Contractors segment backlog by end market: Mass transit $ 1,406,047 59 % $ 1,132,158 62 % Multi-unit residential 307,009 13 % 278,602 15 % Water 278,788 12 % 69,373 4 % Commercial and industrial facilities 115,742 5 % 100,163 6 % Education facilities 48,741 2 % 95,360 5 % Other 237,299 9 % 146,045 8 % Total Specialty Contractors segment backlog $ 2,393,626 100 % $ 1,821,701 100 % As of December 31, 2019 2018 Backlog by customer type: State and local agencies 69 % 72 % Private owners 25 % 20 % Federal agencies 6 % 8 % Total backlog 100 % 100 % As of December 31, 2019 2018 Backlog by contract type: Fixed price 76 % 80 % Guaranteed maximum price 11 % 5 % Unit price 5 % 8 % Cost plus fee and other 8 % 7 % Total backlog 100 % 100 % obtaining firm fixed price quotes from major subcontractors and material suppliers, Accordingly, we believe that our environmental liabilities are not material. In addition, we continually evaluate our compliance with all applicable environmental laws and regulations, and believe that we are in substantial compliance with those laws and regulations. Our principal asset is our employees, many of whom have technical and professional backgrounds and undergraduate and/or advanced degrees. As of December 31, 2021, we had approximately 7,800 employees (including union employees), of which approximately 1,900 were salaried and 5,900 were hourly employees. The number of We are signatory to numerous local and regional collective bargaining agreements, both directly and through trade associations, as a union contractor. These agreements cover all necessary union crafts and are subject to various renewal dates. As of December 31, 2021, our workforce included a total of approximately 3,900 union employees. Estimated amounts for wage escalation related to the expiration of union contracts are included in our bids on various projects; accordingly, the expiration of any union contract in the next year is not expected to have any material impact on us. During the past several years, we have not experienced any significant work stoppages caused by our union employees. We place a strong emphasis on the safety of our employees, our customers and the public. Accordingly, we conduct extensive safety training programs that have allowed us to maintain a high safety level at our worksites. All newly hired employees that will be working at project job sites undergo an initial safety orientation, and for certain types of projects or processes we conduct specific hazard training programs. Our project supervisors regularly conduct on-site safety meetings and our safety managers make random site safety inspections and perform daily assessments. In addition, operational employees are required to complete an OSHA 30-hour training program and project-specific courses on various safety topics. Moreover, we promote a culture of safety by encouraging employees to recognize, immediately correct and report all unsafe conditions. To underscore the importance of safety, a portion of annual performance bonus compensation for certain executive management is ITEM 1A. operations. delay and damage to our reputation. financial results. Our international operations expose us to economic, political, regulatory and other risks, as well as uncertainty related to U.S. Government funding, which could adversely affect our revenue and earnings. Our Stock Ownership ITEM 2. PROPERTIES Offices Owned or Leased by Tutor Perini Business Segment(s) Los Angeles (Sylmar), CA Owned and Leased Corporate, Civil & Specialty Contractors Barrigada, Guam Owned Civil Black River Falls, WI Owned Civil Evansville, IN Owned Civil Fort Lauderdale, FL Leased Building & Specialty Contractors Framingham, MA Owned Building Gulfport, MS Owned Building Henderson, NV Owned Building & Specialty Contractors Houston, TX Owned Specialty Contractors Jessup, MD Owned Civil Mount Vernon, NY Leased Specialty Contractors New Rochelle, NY Owned Civil Ozone Park, NY Specialty Contractors Philadelphia, PA Leased Building San Carlos, CA Leased Building Equipment Yards Owned or Leased by Tutor Perini Business Segment(s) Black River Falls, WI Owned Civil Evansville, IN Owned Civil Fontana, CA Leased Civil Owned Civil Stockton, CA Owned Building Performance Graph CONSOLIDATED OPERATING RESULTS Year Ended December 31, (In thousands, except per common share data) 2019 2018 2017 2016 2015 Revenue: Civil $ 1,779,352 $ 1,586,093 $ 1,602,175 $ 1,668,963 $ 1,889,907 Building 1,742,040 1,861,699 1,941,325 2,069,841 1,802,535 Specialty Contractors 929,440 1,006,870 1,213,708 1,234,272 1,228,030 Total 4,450,832 4,454,662 4,757,208 4,973,076 4,920,472 Cost of operations (4,209,060) (4,000,209) (4,302,803) (4,515,886) (4,564,219) Gross profit(a) 241,772 454,453 454,405 457,190 356,253 General and administrative expenses(b) (226,916) (262,577) (274,928) (255,270) (250,840) Goodwill impairment(c) (379,863) — — — — Income (loss) from construction operations (365,007) 191,876 179,477 201,920 105,413 Other income, net(d) 6,667 4,256 43,882 6,977 13,569 Interest expense (67,494) (63,519) (69,384) (59,782) (45,143) Income (loss) before income taxes (425,834) 132,613 153,975 149,115 73,839 Income tax benefit (expense)(e) 65,609 (34,832) 569 (53,293) (28,547) Net income (loss) (360,225) 97,781 154,544 95,822 45,292 Less: Net income attributable to noncontrolling interests 27,465 14,345 6,162 — — Net income (loss) attributable to Tutor Perini Corporation $ (387,690) $ 83,436 $ 148,382 $ 95,822 $ 45,292 Earnings (loss) per common share:(a)(b)(c)(d)(e) Basic $ (7.72) $ 1.67 $ 2.99 $ 1.95 $ 0.92 Diluted $ (7.72) $ 1.66 $ 2.92 $ 1.92 $ 0.91 Weighted-average common shares outstanding: Basic 50,220 49,952 49,647 49,150 48,981 Diluted 50,220 50,301 50,759 49,864 49,666 As of and For the Year Ended December 31, (In thousands, except ratios and percentages) 2019 2018 2017 2016 2015 CONSOLIDATED FINANCIAL POSITION Current assets $ 3,510,986 $ 3,175,643 $ 3,074,392 $ 2,837,756 $ 2,608,939 Current liabilities 2,109,856 1,597,966 1,581,846 1,518,943 1,448,819 Working capital $ 1,401,130 $ 1,577,677 $ 1,492,546 $ 1,318,813 $ 1,160,120 Current ratio 1.66 1.99 1.94 1.87 1.80 Property and equipment, net of accumulated depreciation $ 509,685 $ 490,669 $ 467,499 $ 477,626 $ 523,525 Total assets 4,485,777 4,387,752 4,264,123 4,038,620 3,861,300 Capitalization: Total debt 834,476 761,504 736,276 759,519 817,684 Stockholders’ equity 1,440,142 1,809,177 1,713,275 1,553,023 1,420,227 Total capitalization $ 2,274,618 $ 2,570,681 $ 2,449,551 $ 2,312,542 $ 2,237,911 Total debt as a percentage of total capitalization 37 % 30 % 30 % 33 % 37 % Ratio of debt to equity 0.58 0.42 0.43 0.49 0.58 Stockholders' equity per common share $ 28.64 $ 36.16 $ 34.42 $ 31.56 $ 28.94 OTHER DATA Backlog at year end $ 11,221,110 $ 9,296,691 $ 7,283,434 $ 6,227,137 $ 7,465,129 New awards 6,375,262 6,467,918 5,813,505 3,735,084 4,553,877 Capital expenditures 84,196 77,069 30,280 15,743 35,912 Net cash provided by operating activities 136,530 21,402 163,550 113,336 14,072 Net cash used in investing activities (76,055) (70,208) (87,133) (13,844) (30,932) Net cash provided by (used in) financing activities 21,763 (28,979) (75,376) (24,190) (41,788) ITEM 7. Comparison of 2020 to 2019 Results factors discussed above that drove the decrease in income from construction operations, as well as the higher effective tax rate in 2021 compared to 2020. taxiway project in the Northern Mariana Islands; the $152 million Santa Rosa Courthouse project in California; and a $122 million military range project and a $98 million military housing project, both in Guam. Contractors, compared to 57% for Civil, 20% for Building and 23% for Specialty Contractors at the end of 2020. Importantly, Building segment backlog, which carries a substantially lower margin, increased $607 million year-over-year, whereas backlog for the higher-margin Civil and Specialty Contractors segments declined $230 million and $487 million, respectively, year-over-year. Backlog at Revenue Backlog at December 31, New Awards Recognized December 31, (in millions) 2018 in 2019 (a) in 2019 2019(b) Civil $ 5,141.9 $ 2,674.7 $ (1,779.4) $ 6,037.2 Building 2,333.1 2,199.2 (1,742.0) 2,790.3 Specialty Contractors 1,821.7 1,501.3 (929.4) 2,393.6 Total $ 9,296.7 $ 6,375.2 $ (4,450.8) $ 11,221.1 (a)New awards consist of the original contract price of projects added to our backlog plus or minus subsequent changes to the estimated total contract price of existing contracts. The outlook for the Company’s growth over the next several years remains favorable, and potentially increased, spending on infrastructure projects if borrowing rates remain at relatively low levels following anticipated interest rate increases by the Federal Reserve in 2022. Reconciliation of Non-GAAP Financial Measures Specialty Consolidated (in millions) Civil Building Contractors Corporate Total Year Ended December 31, 2019 Income (loss) from construction operations, as reported $ (150.9) $ 23.7 $ (172.6) $ (65.2) $ (365.0) Plus: Goodwill impairment charge 210.2 13.5 156.2 — 379.9 Adjusted income (loss) from construction operations $ 59.3 $ 37.2 $ (16.4) $ (65.2) $ 14.9 Year Ended December 31, (in millions, except per common share amounts and percentages) 2019 2018 Net income (loss) attributable to Tutor Perini Corporation, as reported $ (387.7) $ 83.4 Plus: Goodwill impairment charge 379.9 — Less: Tax benefit provided on goodwill impairment charge (49.4) — Adjusted net income (loss) attributable to Tutor Perini Corporation $ (57.2) $ 83.4 Diluted earnings (loss) per common share, as reported $ (7.72) $ 1.66 Plus: Goodwill impairment charge 7.56 — Less: Tax benefit provided on goodwill impairment charge (0.98) — Adjusted diluted earnings (loss) per common share $ (1.14) $ 1.66 Effective income tax rate, as reported 15.4 % 26.3 % Tax effect of goodwill impairment charge 19.9 % — % Adjusted effective income tax rate 35.3 % 26.3 % Results of Segment Operations Year Ended December 31, (in millions) 2019 2018 Revenue $ 1,779.4 $ 1,586.1 Income (loss) from construction operations, as reported (150.9) 168.3 Plus: Goodwill impairment charge 210.2 — Adjusted income from construction operations 59.3 168.3 Guam. The COVID-19 pandemic has resulted in significant revenue shortfalls for many state and local government agencies since 2020, and could continue to cause deferrals or cancellations of certain new projects, depending on the allocation and prioritization of state and local funding, as well as the availability, timing and magnitude of anticipated funding from the federal government, including funding from the recently enacted IIJA. Alabama. Building Segment Year Ended December 31, (in millions) 2019 2018 Revenue $ 1,742.0 $ 1,861.7 Income from construction operations, as reported 23.7 43.9 Plus: Goodwill impairment charge 13.5 — Adjusted income from construction operations 37.2 43.9 Revenue for aforementioned COVID-19 impacts. Northeast that included a charge and the temporary negative impact to earnings from growth in unapproved change orders. opportunities. several government facilities projects nationwide. in 2022. However, the COVID-19 pandemic has resulted in, and could continue to result in, reduced demand for our building construction services. Year Ended December 31, (in millions) 2019 2018 Revenue $ 929.4 $ 1,006.9 Income (loss) from construction operations, as reported (172.6) 43.4 Plus: Goodwill impairment charge 156.2 — Adjusted income (loss) from construction operations (16.4) 43.4 Operating margin was 2020. The increase in corporate general and administrative expenses in 2021 was predominantly due to higher travel-related expenses compared to 2020, when the COVID-19 pandemic caused significant travel reductions. Expense Year Ended December 31, (in millions) 2019 2018 Other income, net $ 6.7 $ 4.3 Interest expense (67.5) (63.5) Income tax benefit (expense) 65.6 (34.8) 2020 related to the unfavorable resolutions of certain disputes pertaining to past business acquisitions, which were not material. which resulted in a tax rate adjustment associated with an adverse 2019 jury verdict that rendered certain income recognized in 2016 to be uncollectible. Company. cash balances as of December 31, 2020. Restricted cash and restricted investments are primarily held to secure insurance-related contingent obligations. Restricted cash as of December 31, 2020 also included $69.9 million of cash held to repay the outstanding principal balance of the Convertible Notes, which were repaid at maturity on June 15, 2021 (see Note 7 of the Notes to Consolidated Financial Statements). Agreement Trailing Four Fiscal Quarters Ended Actual Required < or = 2021. Contractual Obligations 2021 include: Payments Due (in thousands) Total Less than 1 year 1-3 years 3-5 years More than 5 years Debt(a) $ 857,819 $ 124,054 $ 226,513 $ 7,252 $ 500,000 Interest on debt(a) 200,107 47,040 72,743 68,866 11,458 Operating leases 50,379 13,564 17,344 11,853 7,618 Pension benefit payments(b) 5,322 4,387 935 — — Other 8,064 1,353 1,043 17 5,651 Total $ 1,121,691 $ 190,398 $ 318,578 $ 87,988 $ 524,727 Estimates Construction Joint Ventures — Certain contracts are executed through joint ventures. The arrangements are often formed for the execution of single contracts or projects and allow the Company to share risks and secure specialty skills required for project execution. no triggering events occurred or circumstances changed since 2021. REPORT OF INDEPENDENT REGISTERED PUBLIC ACCOUNTING FIRM California 24, 2022 ITEM 9B. 2021. 2021. 2021. 2021. (b) Exhibits. Exhibit 3. Articles of Incorporation and By-laws 3.1 Exhibit 4. Instruments Defining the Rights of Security Holders, Including Indentures 4.1 4.2 4.3 4.4 4.5 Exhibit 10. Material Contracts 10.27* Exhibit 23 Exhibit 24 Exhibit 31.1 Exhibit 31.2 Exhibit 32.1 Exhibit 32.2 Exhibit 95 Exhibit 101.INS Inline XBRL Instance Document – The instance document does not appear in the Interactive Data File because its XBRL tags are embedded within the Inline XBRL document. Exhibit 101.SCH Inline XBRL Taxonomy Extension Schema Document. Exhibit 101.CAL Inline XBRL Taxonomy Extension Calculation Linkbase Document. Exhibit 101.LAB Inline XBRL Taxonomy Extension Label Linkbase Document. Exhibit 101.PRE Inline XBRL Taxonomy Extension Presentation Linkbase Document. Exhibit 101.DEF Inline XBRL Taxonomy Extension Definition Linkbase Document. Exhibit 104 Cover Page Interactive Data File - The cover page from the Company’s Annual Report on Form 10-K for the year ended December 31, SUMMARY SIGNATURES Tutor Perini Corporation (Registrant) /s/ Gary G. Smalley Gary G. Smalley Executive Vice President and Chief Financial Officer Signature Title Date /s/ Ronald N. Tutor Ronald N. Tutor Chairman and Chief Executive Officer February /s/ Gary G. Smalley Gary G. Smalley Executive Vice President and Chief Financial Officer February /s/ Ryan J. Soroka Ryan J. Soroka Vice President and Chief Accounting Officer February Peter Arkley ) Jigisha Desai ) Michael F. Horodniceanu ) /s/ Gary G. Smalley Michael R. Klein ) Gary G. Smalley Robert C. Lieber ) Attorney in Fact Dennis D. Oklak ) Raymond R. Oneglia ) Dale A. Reiss ) Dickran M. Tevrizian, Jr. ) Dated: February TUTOR PERINI CORPORATION AND SUBSIDIARIES REPORT OF INDEPENDENTREGISTERED PUBLIC ACCOUNTING FIRM Matter it relates. and subject to many variables, auditing the corresponding balances and related accounting estimates required extensive audit effort due to the complexity of these estimates, and a high degree of auditor judgment when performing audit procedures and evaluating the results of those procedures. /s/ Deloitte & Touche LLP California 24, 2022 TUTOR PERINI CORPORATION AND SUBSIDIARIES Year Ended December 31, (in thousands, except per common share amounts) 2019 2018 2017 REVENUE $ 4,450,832 $ 4,454,662 $ 4,757,208 COST OF OPERATIONS (4,209,060) (4,000,209) (4,302,803) GROSS PROFIT 241,772 454,453 454,405 General and administrative expenses (226,916) (262,577) (274,928) Goodwill impairment (379,863) — — INCOME (LOSS) FROM CONSTRUCTION OPERATIONS (365,007) 191,876 179,477 Other income, net 6,667 4,256 43,882 Interest expense (67,494) (63,519) (69,384) INCOME (LOSS) BEFORE INCOME TAXES (425,834) 132,613 153,975 Income tax benefit (expense) 65,609 (34,832) 569 NET INCOME (LOSS) (360,225) 97,781 154,544 LESS: NET INCOME ATTRIBUTABLE TO NONCONTROLLING INTERESTS 27,465 14,345 6,162 NET INCOME (LOSS) ATTRIBUTABLE TO TUTOR PERINI CORPORATION $ (387,690) $ 83,436 $ 148,382 BASIC EARNINGS (LOSS) PER COMMON SHARE $ (7.72) $ 1.67 $ 2.99 DILUTED EARNINGS (LOSS) PER COMMON SHARE $ (7.72) $ 1.66 $ 2.92 WEIGHTED-AVERAGE COMMON SHARES OUTSTANDING: BASIC 50,220 49,952 49,647 DILUTED 50,220 50,301 50,759 TUTOR PERINI CORPORATION AND SUBSIDIARIES Year Ended December 31, (in thousands) 2019 2018 2017 NET INCOME (LOSS) $ (360,225) $ 97,781 $ 154,544 OTHER COMPREHENSIVE INCOME (LOSS), NET OF TAX: Defined benefit pension plan adjustments 844 771 1,424 Foreign currency translation adjustments 1,337 (2,945) 1,273 Unrealized gain (loss) in fair value of investments 1,561 (778) (2) TOTAL OTHER COMPREHENSIVE INCOME (LOSS), NET OF TAX 3,742 (2,952) 2,695 COMPREHENSIVE INCOME (LOSS) (356,483) 94,829 157,239 LESS: COMPREHENSIVE INCOME ATTRIBUTABLE TO NONCONTROLLING INTERESTS 27,858 14,124 6,162 COMPREHENSIVE INCOME (LOSS) ATTRIBUTABLE TO TUTOR PERINI CORPORATION $ (384,341) $ 80,705 $ 151,077 TUTOR PERINI CORPORATION AND SUBSIDIARIES As of December 31, (in thousands, except share and per share amounts) 2019 2018 ASSETS CURRENT ASSETS: Cash and cash equivalents ($103,850 and $43,131 related to VIEs) $ 193,685 $ 116,075 Restricted cash 8,416 3,788 Restricted investments 70,974 58,142 Accounts receivable ($91,090 and $62,482 related to VIEs) 1,354,519 1,261,072 Retainage receivable ($89,132 and $36,724 related to VIEs) 562,375 478,744 Costs and estimated earnings in excess of billings ($22,764 and $0 related to VIEs) 1,123,544 1,142,295 Other current assets ($58,128 and $30,185 related to VIEs) 197,473 115,527 Total current assets 3,510,986 3,175,643 PROPERTY AND EQUIPMENT: Land 39,047 41,599 Building and improvements 115,041 125,193 Construction equipment 560,547 486,034 Other equipment 183,197 181,578 897,832 834,404 Less accumulated depreciation (388,147) (343,735) Total property and equipment, net ($49,919 and $51,508 related to VIEs) 509,685 490,669 GOODWILL 205,143 585,006 INTANGIBLE ASSETS, NET 155,270 85,911 OTHER ASSETS 104,693 50,523 TOTAL ASSETS $ 4,485,777 $ 4,387,752 LIABILITIES AND EQUITY CURRENT LIABILITIES: Current maturities of long-term debt $ 124,054 $ 16,767 Accounts payable ($93,848 and $18,070 related to VIEs) 682,699 621,728 Retainage payable ($13,967 and $0 related to VIEs) 252,181 211,956 Billings in excess of costs and estimated earnings ($422,847 and $263,764 related to VIEs) 844,389 573,190 Accrued expenses and other current liabilities ($25,402 and $34,828 related to VIEs) 206,533 174,325 Total current liabilities 2,109,856 1,597,966 LONG-TERM DEBT, less current maturities, net of unamortized discount and debt issuance costs totaling $23,343 and $34,998 710,422 744,737 DEFERRED TAX LIABILITIES 35,686 105,521 OTHER LONG-TERM LIABILITIES 199,288 151,639 TOTAL LIABILITIES 3,055,252 2,599,863 COMMITMENTS AND CONTINGENCIES (Note 8) EQUITY Stockholders' equity: Preferred stock – authorized 1,000,000 shares ($1 par value), NaN issued — — Common stock – authorized 75,000,000 shares ($1 par value), issued and outstanding 50,278,816 and 50,025,996 shares 50,279 50,026 Additional paid-in capital 1,117,972 1,102,919 Retained earnings 313,991 701,681 Accumulated other comprehensive loss (42,100) (45,449) Total stockholders' equity 1,440,142 1,809,177 Noncontrolling interests (9,617) (21,288) TOTAL EQUITY 1,430,525 1,787,889 TOTAL LIABILITIES AND EQUITY $ 4,485,777 $ 4,387,752 Year Ended December 31, (in thousands) 2019 2018 2017 Cash Flows from Operating Activities: Net income (loss) $ (360,225) $ 97,781 $ 154,544 Adjustments to reconcile net income (loss) to net cash provided by operating activities: Goodwill impairment 379,863 — — Depreciation 58,818 43,724 48,387 Amortization of intangible assets 6,226 3,543 3,543 Share-based compensation expense 19,143 22,782 21,174 Change in debt discount and deferred debt issuance costs 13,207 12,072 17,595 Deferred income taxes (71,609) (449) (23,096) Gain on remeasurement of investment in joint venture (37,792) — — (Gain) loss on sale of property and equipment (4,688) 402 1,131 Changes in other components of working capital, net of balances acquired 131,257 (156,844) (60,214) Other long-term liabilities 1,863 (2,007) 3,656 Other, net 467 398 (3,170) NET CASH PROVIDED BY OPERATING ACTIVITIES 136,530 21,402 163,550 Cash Flows from Investing Activities: Business acquisition, cash balance acquired net of cash paid 6,607 — — Acquisition of property and equipment (84,196) (77,069) (30,280) Proceeds from sale of property and equipment 12,581 6,387 2,744 Investments in securities (35,167) (20,848) (60,967) Proceeds from maturities and sales of investments in securities 24,120 21,322 1,370 NET CASH USED IN INVESTING ACTIVITIES (76,055) (70,208) (87,133) Cash Flows from Financing Activities: Proceeds from debt 931,594 1,753,160 2,161,384 Repayment of debt (870,277) (1,738,314) (2,195,068) Business acquisition related payment — (15,951) — Cash payments related to share-based compensation (2,363) (2,671) (11,769) Distributions paid to noncontrolling interests (46,500) (29,000) (17,499) Contributions from noncontrolling interests 9,813 3,797 2,842 Debt issuance and extinguishment costs (504) — (15,266) NET CASH PROVIDED BY (USED IN) FINANCING ACTIVITIES 21,763 (28,979) (75,376) Net increase (decrease) in cash, cash equivalents and restricted cash 82,238 (77,785) 1,041 Cash, cash equivalents and restricted cash at beginning of year 119,863 197,648 196,607 Cash, cash equivalents and restricted cash at end of year $ 202,101 $ 119,863 $ 197,648 Accumulated Additional Other Common Paid-in Retained Comprehensive Noncontrolling (in thousands) Stock Capital Earnings Loss Interests Total Balance - December 31, 2016 $ 49,211 $ 1,075,600 $ 473,625 $ (45,413) $ — $ 1,553,023 Net income — — 148,382 — 6,162 154,544 Other comprehensive income — — — 2,695 — 2,695 Share-based compensation — 20,877 — — — 20,877 Issuance of common stock, net 570 (12,272) — — — (11,702) Contributions from noncontrolling interests — — — — 2,842 2,842 Distributions to noncontrolling interests — — — — (17,499) (17,499) Balance - December 31, 2017 $ 49,781 $ 1,084,205 $ 622,007 $ (42,718) $ (8,495) $ 1,704,780 Cumulative effect of accounting change — — (3,762) — (1,714) (5,476) Net income — — 83,436 — 14,345 97,781 Other comprehensive loss — — — (2,731) (221) (2,952) Share-based compensation — 21,544 — — — 21,544 Issuance of common stock, net 245 (2,830) — — — (2,585) Contributions from noncontrolling interests — — — — 3,797 3,797 Distributions to noncontrolling interests — — — — (29,000) (29,000) Balance - December 31, 2018 $ 50,026 $ 1,102,919 $ 701,681 $ (45,449) $ (21,288) $ 1,787,889 Net income (loss) — — (387,690) — 27,465 (360,225) Other comprehensive income — — — 3,349 393 3,742 Share-based compensation — 17,571 — — — 17,571 Issuance of common stock, net 253 (2,518) — — — (2,265) Contributions from noncontrolling interests — — — — 9,813 9,813 Distributions to noncontrolling interests — — — — (46,500) (46,500) Recognized fair value of noncontrolling interest in joint venture upon consolidation — — — — 20,500 20,500 Balance - December 31, 2019 $ 50,279 $ 1,117,972 $ 313,991 $ (42,100) $ (9,617) $ 1,430,525 The accompanying notes are an integral part of these consolidated financial statements. Certain amounts in the notes to the consolidated financial statements of prior years have been reclassified to conform to the current year presentation. performance and all information (historical, current and forecasted) that is reasonably available to management. Back charges to suppliers or subcontractors are recognized as a reduction of cost when it is determined that recovery of such cost is probable and the amounts can be reliably estimated. Disputed back charges are recognized when the same requirements described above for variable consideration have been satisfied. necessary. (i) Income Taxes Year Ended December 31, (in thousands, except per common share data) 2019 2018 2017 Net income (loss) attributable to Tutor Perini Corporation $ (387,690) $ 83,436 $ 148,382 Weighted-average common shares outstanding, basic 50,220 49,952 49,647 Effect of dilutive restricted stock units and stock options — 349 1,112 Weighted-average common shares outstanding, diluted 50,220 50,301 50,759 Net income (loss) attributable to Tutor Perini Corporation per common share: Basic $ (7.72) $ 1.67 $ 2.99 Diluted $ (7.72) $ 1.66 $ 2.92 Anti-dilutive securities not included above 3,640 2,670 798 As of December 31, (in thousands) 2019 2018 Cash and cash equivalents available for general corporate purposes $ 43,760 $ 51,749 Joint venture cash and cash equivalents 149,925 64,326 Cash and cash equivalents 193,685 116,075 Restricted cash 8,416 3,788 Total cash, cash equivalents and restricted cash $ 202,101 $ 119,863 As of December 31, 2020, restricted cash also included $69.9 million held to repay the outstanding principal balance of Convertible Notes, which matured and were repaid on June 15, 2021. (l) Restricted Investments The fair value of unrestricted stock is based on the closing price of the Company’s common stock on the NYSE. Year Ended December 31, 2019 2018 2017 (in thousands) Before-Tax Amount Tax (Expense) Benefit Net-of-Tax Amount Before-Tax Amount Tax (Expense) Benefit Net-of-Tax Amount Before-Tax Amount Tax (Expense) Benefit Net-of-Tax Amount Other comprehensive income (loss): Defined benefit pension plan adjustments $ 1,180 $ (336) $ 844 $ 1,079 $ (308) $ 771 $ 2,416 $ (992) $ 1,424 Foreign currency translation adjustment 1,867 (530) 1,337 (4,067) 1,122 (2,945) 2,159 (886) 1,273 Unrealized gain (loss) in fair value of investments 1,982 (421) 1,561 (1,005) 227 (778) (4) 2 (2) Total other comprehensive income (loss) $ 5,029 $ (1,287) $ 3,742 $ (3,993) $ 1,041 $ (2,952) $ 4,571 $ (1,876) $ 2,695 Less: Other comprehensive income (loss) attributable to noncontrolling interests(a) 393 — 393 (221) — (221) — — — Total other comprehensive income (loss) attributable to Tutor Perini Corporation $ 4,636 $ (1,287) $ 3,349 $ (3,772) $ 1,041 $ (2,731) $ 4,571 $ (1,876) $ 2,695 (a)The only component of other comprehensive income (loss) attributable to noncontrolling interests is foreign currency translation. The changes in AOCI balances by component (after tax) attributable to Tutor Perini Corporation during the years ended December 31, (in thousands) Defined Benefit Pension Plan Foreign Currency Translation Unrealized Gain (Loss) in Fair Value of Investments Accumulated Other Comprehensive Income (Loss) Attributable to Tutor Perini Corporation: Balance as of December 31, 2016 $ (40,865) $ (4,864) $ 316 $ (45,413) Other comprehensive income (loss) before reclassifications 306 1,273 (2) 1,577 Amounts reclassified from AOCI 1,118 �� — 1,118 Balance as of December 31, 2017 $ (39,441) $ (3,591) $ 314 $ (42,718) Other comprehensive loss before reclassifications (695) (2,724) (835) (4,254) Amounts reclassified from AOCI 1,466 — 57 1,523 Balance as of December 31, 2018 $ (38,670) $ (6,315) $ (464) $ (45,449) Other comprehensive income (loss) before reclassifications (539) 944 1,621 2,026 Amounts reclassified from AOCI 1,383 — (60) 1,323 Balance as of December 31, 2019 $ (37,826) $ (5,371) $ 1,097 $ (42,100) The BALANCE SHEET Balance as of Adjustments due to Balance as of (in thousands) December 31, 2018(a) ASC 842 January 1, 2019 ASSETS Other assets(b) $ 50,523 $ 43,273 $ 93,796 LIABILITIES Accrued expenses and other current liabilities(b) $ 174,325 $ 11,569 $ 185,894 Other long-term liabilities(b) 151,639 31,704 183,343 As of December 31, 2019 Balance Without BALANCE SHEET Adoption of Effect of (in thousands) As Reported ASC 842 Change ASSETS Other assets(a) $ 104,693 $ 64,598 $ 40,095 LIABILITIES Accrued expenses and other current liabilities(a) $ 206,533 $ 195,341 $ 11,192 Other long-term liabilities(a) 199,288 170,373 28,915 follows: 2. Consolidated Statements of Cash Flows Year Ended December 31, (in thousands) 2019 2018 2017 (Increase) Decrease in: Accounts receivable $ (81,983) $ 3,899 $ (91,062) Retainage receivable (78,520) 56,754 33,453 Costs and estimated earnings in excess of billings 18,751 (209,537) (100,932) Other current assets (76,146) 15,398 (19,718) (Decrease) Increase in: Accounts payable 53,999 (78,243) (35,751) Retainage payable 35,013 (49,864) 3,526 Billings in excess of costs and estimated earnings 245,292 76,703 125,757 Accrued expenses and other current liabilities 14,851 28,046 24,513 Changes in other components of working capital $ 131,257 $ (156,844) $ (60,214) Cash paid during the year for: Interest $ 56,137 $ 51,063 $ 50,443 Income taxes $ 43,374 $ 13,652 $ 39,776 2019. Year Ended December 31, (in thousands) 2019 2018 Civil segment revenue by end market: Mass transit $ 992,755 $ 702,614 Bridges 334,117 431,202 Tunneling 128,229 103,980 Highways 86,747 202,423 Other 237,504 145,874 Total Civil segment revenue $ 1,779,352 $ 1,586,093 Year Ended December 31, (in thousands) 2019 2018 Building segment revenue by end market: Commercial and industrial facilities $ 459,806 $ 374,312 Hospitality and gaming 297,700 301,871 Municipal and government 254,736 261,496 Health care facilities 239,299 428,819 Mass transit 201,400 67,588 Education facilities 143,382 145,147 Mixed use 31,685 150,549 Other 114,032 131,917 Total Building segment revenue $ 1,742,040 $ 1,861,699 Year Ended December 31, (in thousands) 2019 2018 Specialty Contractors segment revenue by end market: Mass transit $ 419,402 $ 296,092 Commercial and industrial facilities 186,819 189,632 Multi-unit residential 83,903 81,023 Education facilities 70,229 99,214 Mixed use 64,302 163,308 Health care facilities 29,519 52,392 Transportation 7,756 83,551 Other 67,510 41,658 Total Specialty Contractors segment revenue $ 929,440 $ 1,006,870 Year Ended December 31, 2019 Year Ended December 31, 2018 Specialty Specialty (in thousands) Civil Building Contractors Total Civil Building Contractors Total Revenue by customer type: State and local agencies $ 1,401,001 $ 573,049 $ 496,195 $ 2,470,245 $ 1,294,630 $ 617,133 $ 406,782 $ 2,318,545 Federal agencies 116,869 153,467 11,326 281,662 95,567 201,745 53,335 350,647 Private owners 261,482 1,015,524 421,919 1,698,925 195,896 1,042,821 546,753 1,785,470 Total revenue $ 1,779,352 $ 1,742,040 $ 929,440 $ 4,450,832 $ 1,586,093 $ 1,861,699 $ 1,006,870 $ 4,454,662 State and local agencies. The Company’s state and local government customers include state transportation departments, metropolitan authorities, cities, municipal agencies, school districts and public universities. Services provided to state and local customers are primarily pursuant to contracts awarded through competitive bidding processes. Construction services for state and local government customers have included mass-transit systems, tunnels, bridges, highways, judicial and correctional facilities, schools and dormitories, health care facilities, convention centers, parking structures and other municipal buildings. The vast majority of the Company’s civil contracting and building construction services are provided in locations throughout the United States and its territories. Year Ended December 31, 2019 Year Ended December 31, 2018 Specialty Specialty (in thousands) Civil Building Contractors Total Civil Building Contractors Total Revenue by contract type: Fixed price $ 1,315,195 $ 561,831 $ 769,410 $ 2,646,436 $ 1,054,473 $ 377,538 $ 857,742 $ 2,289,753 Guaranteed maximum price 6,951 752,110 21,291 780,352 15,709 1,040,093 62,132 1,117,934 Unit price 436,015 12,063 91,803 539,881 469,305 32,468 32,562 534,335 Cost plus fee and other 21,191 416,036 46,936 484,163 46,606 411,600 54,434 512,640 Total revenue $ 1,779,352 $ 1,742,040 $ 929,440 $ 4,450,832 $ 1,586,093 $ 1,861,699 $ 1,006,870 $ 4,454,662 Guaranteed maximum price (“GMP”). GMP contracts provide for a cost plus fee arrangement up to a maximum agreed upon price. These contracts place risks on the Company for amounts in excess of the GMP, but may permit an opportunity for greater profits than under cost plus fee contracts through sharing agreements with the owner on any cost savings that may be realized. Services provided by our Building segment to various private customers are often performed under GMP contracts. Billings on GMP contracts typically occur on a monthly basis and are based on actual costs incurred plus a negotiated margin. 4. Contract Assets and Liabilities As of December 31, (in thousands) 2019 2018 Retainage receivable $ 562,375 $ 478,744 Costs and estimated earnings in excess of billings: Claims 705,993 698,274 Unapproved change orders 362,264 354,000 Other unbilled costs and profits 55,287 90,021 Total costs and estimated earnings in excess of billings 1,123,544 1,142,295 Capitalized contract costs 80,294 37,404 Total contract assets $ 1,766,213 $ 1,658,443 Contract liabilities include amounts owed under retainage provisions and billings in excess of costs and estimated earnings. The amount as reported on the Consolidated Balance Sheets consisted of the following: As of December 31, (in thousands) 2019 2018 Retainage payable $ 252,181 $ 211,956 Billings in excess of costs and estimated earnings 844,389 573,190 Total contract liabilities $ 1,096,570 $ 785,146 Year Ended December 31, (in thousands) 2019 2018 2017 United States operations $ (456,403) $ 106,222 $ 135,177 Foreign and U.S. territory operations 30,569 26,391 18,798 Total $ (425,834) $ 132,613 $ 153,975 Year Ended December 31, (in thousands) 2019 2018 2017 Current expense: Federal $ (2,884) $ 21,055 $ 12,329 State 3,585 8,676 6,763 Foreign and U.S. territories 5,299 5,550 3,435 Total current expense 6,000 35,281 22,527 Deferred (benefit) expense: Federal (43,579) (1,773) (30,021) State (27,566) 1,278 5,560 Foreign and U.S. territories (464) 46 1,365 Total deferred (benefit) expense (71,609) (449) (23,096) Total (benefit) expense $ (65,609) $ 34,832 $ (569) The income tax expense (benefit) is as follows: Year Ended December 31, 2019 2018 2017 (dollars in thousands) Amount Rate Amount Rate Amount Rate Federal income tax (benefit) expense at statutory tax rate $ (89,425) 21.0 % $ 27,849 21.0 % $ 53,892 35.0 % State income taxes, net of federal tax benefit (18,442) 4.3 9,011 6.8 7,753 5.0 Stock based compensation 1,706 (0.4) — — — — Impact of federal tax law change — — 211 0.2 (53,348) (34.6) Officers' compensation 2,938 (0.7) 3,078 2.3 2,622 1.7 Goodwill impairment 43,990 (10.3) — — — — Domestic production activities deduction — — — — (2,668) (1.7) Noncontrolling interests (6,064) 1.4 (3,232) (2.4) (2,137) (1.4) Federal R&D credits (3,998) 0.9 (2,658) (2.0) (470) (0.4) Reversal of reserve for uncertain tax positions and taxes payable due to statute expirations (773) 0.2 (1,958) (1.5) (4,337) (2.8) Foreign tax differences 4,940 (1.2) (19) — (389) (0.3) Other (481) 0.2 2,550 1.9 (1,487) (0.9) Income tax (benefit) expense $ (65,609) 15.4 % $ 34,832 26.3 % $ (569) (0.4) % The following is a summary of the significant components of the deferred tax assets and liabilities: As of December 31, (in thousands) 2019 2018 Deferred tax assets: Timing of expense recognition $ 44,761 $ 20,832 Net operating losses 23,711 8,611 Goodwill 26,658 — Other, net 17,098 18,828 Deferred tax assets 112,228 48,271 Valuation allowance (2,212) (1,150) Net deferred tax assets 110,016 47,121 Deferred tax liabilities: Intangible assets, due primarily to purchase accounting (15,309) (36,862) Fixed assets, due primarily to purchase accounting (75,461) (75,998) Construction contract accounting (13,464) (9,435) Joint ventures (24,331) (9,853) Other (16,567) (20,411) Deferred tax liabilities (145,132) (152,559) Net deferred tax liabilities $ (35,116) $ (105,438) As of December 31, (in thousands) 2019 2018 Deferred tax assets $ 570 $ 83 Deferred tax liabilities (35,686) (105,521) Net deferred tax liabilities $ (35,116) $ (105,438) 2021: As of December 31, (in thousands) 2019 2018 2017 Beginning balance $ 4,998 $ 6,495 $ 7,574 Change in tax positions of prior years 351 (302) (1,207) Change in tax positions of current year 1,106 763 128 Reduction in tax positions for statute expirations (773) (1,958) — Ending Balance $ 5,682 $ 4,998 $ 6,495 audit Specialty (in thousands) Civil Building Contractors Total Gross goodwill $ 492,074 $ 424,724 $ 156,193 $ 1,072,991 Accumulated impairment (76,716) (411,269) — (487,985) Balance as of December 31, 2018 415,358 13,455 156,193 585,006 Second quarter 2019 impairment (210,215) (13,455) (156,193) (379,863) Balance as of December 31, 2019(a) $ 205,143 $ — $ — $ 205,143 (a)As of December 31, Assessing impairment inherently involves management judgments as to the assumptions used to calculate fair value of the reporting units and the impact of market conditions on those assumptions. The key inputs that the Company uses in its assumptions to estimate the fair value of its reporting units under the income-based approach are as follows: Amortization expense related to amortizable intangible assets was As of December 31, (in thousands) 2019 2018 2017 Senior Notes $ 494,365 $ 493,521 2017 Credit Facility 114,000 41,000 Convertible Notes 182,292 171,481 Equipment financing and mortgages 39,159 50,904 Other indebtedness 4,660 4,598 Total debt 834,476 761,504 Less: Current maturities 124,054 16,767 Long-term debt, net $ 710,422 $ 744,737 2020: As of December 31, 2019 As of December 31, 2018 (in thousands) Outstanding Long-Term Debt Unamortized Discount and Issuance Costs Long-Term Debt, as reported Outstanding Long-Term Debt Unamortized Discount and Issuance Costs Long-Term Debt, 2017 Senior Notes $ 500,000 $ (5,635) $ 494,365 $ 500,000 $ (6,479) $ 493,521 Convertible Notes 200,000 (17,708) 182,292 200,000 (28,519) 171,481 On June 15, 2016, the Company issued $200 million of 2.875% Convertible Senior Notes due June 15, 2021 (the “Convertible Notes”) in a private placement offering. deferred debt costs associated with the Convertible Notes were fully amortized, the principal balance of the Convertible Notes was equal to their fair value and there was no gain or loss on extinguishment at maturity. None of the Convertible Notes remained outstanding as of December 31, 2021. (in thousands) December 31, 2019 December 31, 2018 Liability component: Principal $ 200,000 $ 200,000 Conversion feature (46,800) (46,800) Allocated debt issuance costs (5,051) (5,051) Amortization of discount and debt issuance costs (non-cash interest expense) 34,143 23,332 Net carrying amount $ 182,292 $ 171,481 Equity component: Conversion feature $ 46,800 $ 46,800 Allocated debt issuance costs (1,543) (1,543) Deferred taxes (18,815) (18,815) Net carrying amount $ 26,442 $ 26,442 dividends and share repurchases. Year (in thousands) 2020 $ 124,054 2021 218,967 2022 7,546 2023 7,164 2024 88 Thereafter 500,000 857,819 Less: Unamortized discount and issuance costs 23,343 Total $ 834,476 For the year ended December 31, (in thousands) 2019 2018 2017 Cash interest expense: Interest on 2017 Senior Notes $ 34,375 $ 34,375 $ 23,967 Interest on 2017 Credit Facility 11,990 8,575 5,517 Interest on Convertible Notes 5,750 5,750 5,750 Interest on 2010 Senior Notes — — 6,926 Interest on 2014 Credit Facility — — 4,455 Other interest 2,172 2,747 3,261 Cash portion of loss on extinguishment — — 1,913 Total cash interest expense 54,287 51,447 51,789 Non-cash interest expense(a): Amortization of discount and debt issuance costs on Convertible Notes 10,811 9,846 8,967 Amortization of debt issuance costs on 2017 Credit Facility 1,552 1,439 962 Amortization of debt issuance costs on 2017 Senior Notes 844 787 516 Amortization of debt issuance costs on 2014 Credit Facility — — 1,703 Amortization of discount and debt issuance costs on 2010 Senior Notes — — 308 Non-cash portion of loss on extinguishment — — 5,139 Total non-cash interest expense 13,207 12,072 17,595 Total interest expense $ 67,494 $ 63,519 $ 69,384 is remote. In April and September 2018, rulings received on pre-trial motions is awaiting a decision from the Court of Appeals of the State of Washington, which is expected in the second half of 2022. If STP is successful in its appeal, the case will be remanded to the trial court for a new trial. alleging tortious interference with TPBC’s right to recover under the lease agreement’s “cure” provision in the bankruptcy proceeding, which was removed to federal court. On June 1, 2020, the defendants filed motions to dismiss, which were granted in part and denied in part on December 29, 2020, resulting in the lender defendants being dismissed from the lawsuit and the lawsuit against the individual owners of the Developer continuing. The lawsuit was refiled in New York state court on July 26, 2021. 9. Leases 2021 and 2020: leases: The following table presents supplemental cash flow information and non-cash activity related to operating leases: Year (in thousands) Operating Leases 2020 $ 13,572 2021 9,372 2022 7,971 2023 6,761 2024 5,093 Thereafter 7,618 Total lease payments 50,387 Less: Imputed interest 7,095 Total $ 43,292 Year (in thousands) Operating Leases 2019 $ 14,039 2020 10,706 2021 7,464 2022 6,567 2023 5,587 Thereafter 11,662 56,025 Less: Sublease rental agreements 1,398 Total $ 54,627 2021: Restricted Stock Units Stock Options Weighted- Weighted- Average Average Grant Date Exercise/ Fair Value (Strike) Price Number Per Share Number Per Share Outstanding as of December 31, 2016 1,156,484 $ 22.64 2,174,500 $ 19.50 Granted 1,064,000 30.02 539,000 24.54 Expired or cancelled (20,985) 23.91 (19,466) 26.56 Vested/exercised (801,515) 19.38 (140,000) 21.41 Outstanding as of December 31, 2017 1,397,984 $ 30.11 2,554,034 $ 20.45 Granted 699,000 24.21 664,000 23.20 Expired or cancelled (240,289) 32.76 (274,990) 22.82 Vested/exercised (387,695) 28.67 — — Outstanding as of December 31, 2018 1,469,000 $ 27.27 2,943,044 $ 20.89 Granted 530,000 20.23 220,000 19.66 Expired or cancelled (104,029) 28.98 (884,029) 21.03 Vested/exercised (179,971) 25.39 — — Outstanding as of December 31, 2019 1,715,000 $ 25.19 2,279,015 $ 20.62 The Company recognized liabilities for CPSUs and restricted stock units with guaranteed minimum payouts totaling approximately $4.8 million and $2.4 million as of December 31, 2021 and 2020, respectively. The Company paid approximately $0.3 million in each of 2021 and 2020 to settle liability-classified awards, and there were no cash settlements in 2019. Unrestricted Stock Units Weighted-Average Grant Date Year Number Fair Value Per Share 2017 99,155 $ 26.26 2018 115,420 21.26 2019 98,591 15.72 vest. Year Ended December 31, 2019 2018 2017 Total stock options granted 220,000 664,000 539,000 Weighted-average grant date fair value $ 7.59 $ 11.09 $ 13.11 Weighted-average assumptions: Risk-free rate 2.1 % 2.6 % 1.8 % Expected life of options(a) 6.1 5.8 4.8 Expected volatility(b) 39.4 % 42.2 % 43.1 % Expected quarterly dividends $ — $ — $ — (a)Calculated using the simplified method due to the terms of the stock options and the limited pool of grantees. 2019: Year Ended December 31, (in thousands) 2019 2018 2017 Interest cost $ 3,801 $ 3,496 $ 3,919 Service cost 900 875 850 Expected return on plan assets (4,170) (4,302) (4,358) Recognized net actuarial losses 1,933 2,067 1,897 Net periodic benefit cost $ 2,464 $ 2,136 $ 2,308 Actuarial assumptions used to determine net cost: Discount rate 4.12 % 3.45 % 3.90 % Expected return on assets 5.75 % 6.00 % 6.00 % Rate of increase in compensation N/A N/A N/A Percentage of Plan Assets as of December 31, Target Allocation Actual Allocation Asset Category 2020 2019 2018 Cash 5 % 4 % 3 % Equity funds: Domestic 45 47 50 International 18 18 27 Fixed income funds 32 31 20 Total 100 % 100 % 100 % 2022. (in thousands) Year ended December 31, 2020 $ 6,822 2021 6,789 2022 6,724 2023 6,637 2024 6,611 2025-2029 31,183 Total $ 64,766 2020: Year Ended December 31, (in thousands) 2019 2018 Change in Fair Value of Plan Assets Balance at beginning of year $ 63,109 $ 71,541 Actual return on plan assets 12,123 (4,758) Company contribution 4,793 2,975 Benefit payments (6,668) (6,649) Balance at end of year $ 73,357 $ 63,109 Year Ended December 31, (in thousands) 2019 2018 Change in Benefit Obligations Balance at beginning of year $ 95,869 $ 106,218 Interest cost 3,801 3,496 Service cost 900 875 Assumption change loss (gain) 8,373 (7,056) Actuarial loss (gain) 332 (1,014) Benefit payments (6,668) (6,650) Balance at end of year $ 102,607 $ 95,869 As of December 31, (in thousands) 2019 2018 Funded status $ (29,250) $ (32,760) Net unfunded amounts recognized in Consolidated Balance Sheets consist of: Current liabilities $ (279) $ (262) Long-term liabilities (28,971) (32,498) Total net unfunded amount recognized in Consolidated Balance Sheets $ (29,250) $ (32,760) The discount rate used in determining the accumulated post-retirement benefit obligation was securities. As of December 31, 2019 As of December 31, 2018 Fair Value Hierarchy Fair Value Hierarchy (in thousands) Level 1 Level 2 Level 3 Total Level 1 Level 2 Level 3 Total Cash and cash equivalents $ 2,867 $ — $ — $ 2,867 $ 7,587 $ — $ — $ 7,587 Fixed income funds — 2,861 — 2,861 — 2,585 — 2,585 Mutual funds 54,085 — — 54,085 36,436 — — 36,436 $ 56,952 $ 2,861 $ — $ 59,813 $ 44,023 $ 2,585 $ — $ 46,608 Closely held funds(a) Equity partnerships 3,660 5,580 Hedge fund investments 9,884 10,921 Total closely held funds(a) 13,544 16,501 Total $ 56,952 $ 2,861 $ — $ 73,357 $ 44,023 $ 2,585 $ — $ 63,109 (a) As of December 31, 2019 As of December 31, 2018 Benefit Benefit Pension Equalization Pension Equalization (in thousands) Plan Plan Total Plan Plan Total Projected benefit obligation $ 99,515 $ 3,092 $ 102,607 $ 92,816 $ 3,053 $ 95,869 Accumulated benefit obligation $ 99,515 $ 3,092 $ 102,607 $ 92,816 $ 3,053 $ 95,869 Fair value of plans' assets 73,357 — 73,357 63,109 — 63,109 Projected benefit obligation greater than fair value of plans' assets $ 26,158 $ 3,092 $ 29,250 $ 29,707 $ 3,053 $ 32,760 Accumulated benefit obligation greater than fair value of plans' assets $ 26,158 $ 3,092 $ 29,250 $ 29,707 $ 3,053 $ 32,760 Expiration FIP/RP Date of Pension Protections Act Status Company Contributions Collective EIN/Pension Zone Status Pending Or (amounts in millions) Surcharge Bargaining Pension Fund Plan Number 2019 2018 Implemented 2019(b) 2018(b) 2017 Imposed Agreement The Pension, Hospitalization and Benefit Plan of the Electrical Industry - Pension Trust Fund 13-6123601/001 Green Green N/A $ 9.3 $ 12.2 $ 16.0 (a) No 4/13/2022 Carpenters Pension Trust Fund for Northern California 94-6050970 Red Red Implemented 4.0 4.9 8.2 No 6/30/2023 Excavators Union Local 731 Pension Fund 13-1809825/002 Green Green N/A 5.1 4.1 4.3 No 4/30/2022 Northern California Electrical Workers Pension Plan 94-6062674 Green Green N/A 3.0 4.1 5.2 No 5/31/2022 Laborers Pension Trust Fund for Northern California 94-6277608 Green Green N/A 3.4 3.8 6.6 No 6/30/2023 Steamfitters Industry Pension Fund 13-6149680/001 Green Green N/A 1.7 3.5 3.9 (a) No 6/30/2020 (a) The following fair value hierarchy table presents the Company’s assets that are measured at fair value on a recurring basis as of December 31, As of December 31, 2019 As of December 31, 2018 Fair Value Hierarchy Fair Value Hierarchy (in thousands) Level 1 Level 2 Level 3 Total Level 1 Level 2 Level 3 Total Cash and cash equivalents(a) $ 193,685 $ — $ — $ 193,685 $ 116,075 $ — $ — $ 116,075 Restricted cash(a) 8,416 — — 8,416 3,788 — — 3,788 Restricted investments(b) — 70,974 — 70,974 — 58,142 — 58,142 Investments in lieu of retainage(c) 89,572 1,219 — 90,791 62,858 1,190 — 64,048 Total $ 291,673 $ 72,193 $ — $ 363,866 $ 182,721 $ 59,332 $ — $ 242,053 (a)Includes money market funds and short-term investments with maturity dates of three months or less when acquired. activities without additional subordinated financial support, (b) characteristics of a controlling financial interest are missing (either the ability to make decisions through voting or other rights, the obligation to absorb the expected losses of the entity or the right to receive the expected residual returns of the entity), or (c) the voting rights of the equity holders are not proportional to their obligations to absorb the expected losses of the entity and/or their rights to receive the expected residual returns of the entity, and substantially all of the entity’s activities either involve or are conducted on behalf of an investor that has disproportionately few voting rights. Upon the occurrence of certain events outlined in ASC 810, the Company reassesses its initial determination of whether 2021. The Building segment has significant experience providing services for private and public works customers in a number of specialized building markets, including: Reportable Segments Specialty Segment Consolidated (in thousands) Civil Building Contractors Total Corporate Total Year ended December 31, 2019 Total revenue $ 2,054,097 $ 1,764,753 $ 929,738 $ 4,748,588 $ — $ 4,748,588 Elimination of intersegment revenue (274,745) (22,713) (298) (297,756) — (297,756) Revenue from external customers $ 1,779,352 $ 1,742,040 $ 929,440 $ 4,450,832 $ — $ 4,450,832 Income (loss) from construction operations(a) $ (150,837) $ 23,655 $ (172,637) $ (299,819) $ (65,188) (b) $ (365,007) Capital expenditures $ 82,156 $ 518 $ 688 $ 83,362 $ 834 $ 84,196 Depreciation and amortization(c) $ 47,905 $ 1,934 $ 4,136 $ 53,975 $ 11,069 $ 65,044 Year ended December 31, 2018 Total revenue $ 1,810,232 $ 1,866,902 $ 1,006,870 $ 4,684,004 $ — $ 4,684,004 Elimination of intersegment revenue (224,139) (5,203) — (229,342) — (229,342) Revenue from external customers $ 1,586,093 $ 1,861,699 $ 1,006,870 $ 4,454,662 $ — $ 4,454,662 Income (loss) from construction operations(d) $ 168,256 $ 43,939 $ 43,430 $ 255,625 $ (63,749) (b) $ 191,876 Capital expenditures $ 73,866 $ 1,655 $ 777 $ 76,298 771 77,069 Depreciation and amortization(c) $ 29,685 $ 1,956 $ 4,358 $ 35,999 $ 11,268 $ 47,267 Year ended December 31, 2017 Total revenue $ 1,856,164 $ 1,982,857 $ 1,213,708 $ 5,052,729 $ — $ 5,052,729 Elimination of intersegment revenue (253,989) (41,532) — (295,521) — (295,521) Revenue from external customers $ 1,602,175 $ 1,941,325 $ 1,213,708 $ 4,757,208 $ — $ 4,757,208 Income (loss) from construction operations $ 192,207 $ 34,199 $ 18,938 $ 245,344 $ (65,867) (b) $ 179,477 Capital expenditures $ 27,694 $ 267 $ 721 $ 28,682 $ 1,598 $ 30,280 Depreciation and amortization(c) $ 33,767 $ 2,021 $ 4,699 $ 40,487 $ 11,443 $ 51,930 (a)During the year ended December 31, 2021, the Company recognized favorable adjustments in income (loss) from construction operations in the Civil segment of $29.0 million (an after-tax impact of $20.9 million, or $0.41 per diluted share) and $16.3 million (an after-tax impact of $13.5 million, or $0.26 per diluted share) on two mass-transit projects, reflecting improved profitability as a result of the negotiation and settlement of certain change orders and the associated mitigation of certain risks in 2021 as the projects progressed towards completion. The Company’s income (loss) from construction operations was negatively impacted by $13.3 million (an after-tax impact of $10.3 million, or $0.20 per diluted share) due to changes in estimates on a Civil segment transportation project in the Northeast that reflected a charge and the negative impact to earnings from growth in unapproved change orders, which resulted in a reduction in the project’s percentage of completion (and, correspondingly, a reduction in the percentage of estimated profit recognized for the year ended December 31, 2021 for this project). The above were the only changes in estimates considered material to the Company’s results of operations during the periods presented herein. As of December 31, (in thousands) 2019 2018 Civil $ 2,791,402 $ 2,574,326 Building 995,298 913,746 Specialty Contractors 635,180 745,313 Corporate and other(a) 63,897 154,367 Total assets $ 4,485,777 $ 4,387,752 (a)Consists principally of cash, equipment, tax-related assets and insurance-related assets, offset by the elimination of assets related to intersegment revenue. Year Ended December 31, (in thousands) 2019 2018 2017 Revenue: United States $ 4,073,691 $ 4,180,206 $ 4,613,644 Foreign and U.S. territories 377,141 274,456 143,564 Total revenue $ 4,450,832 $ 4,454,662 $ 4,757,208 As of December 31, (in thousands) 2019 2018 Assets: United States $ 4,271,722 $ 4,225,143 Foreign and U.S. territories 214,055 162,609 Total assets $ 4,485,777 $ 4,387,752 Reconciliation of Segment Information to Consolidated Amounts Year Ended December 31, (in thousands) 2019 2018 2017 Income (loss) from construction operations $ (365,007) $ 191,876 $ 179,477 Other income, net 6,667 4,256 43,882 Interest expense (67,494) (63,519) (69,384) Income (loss) before income taxes $ (425,834) $ 132,613 $ 153,975 both 2020 and 2019. joint ventures on customary trade terms; there were no material (in thousands, except per common share amounts) First Second Third Fourth Year Ended December 31, 2019 Quarter Quarter Quarter Quarter Revenue $ 958,487 $ 1,125,275 $ 1,189,345 $ 1,177,725 Gross profit (loss) 88,470 100,943 115,063 (62,704) Income (loss) from construction operations 22,913 (341,717) 47,943 (94,146) Income (loss) before income taxes 6,910 (358,339) 32,312 (106,717) Net income (loss) 4,722 (315,439) 26,721 (76,229) Net income (loss) attributable to Tutor Perini Corporation (356) (320,530) 19,313 (86,117) Earnings (loss) per common share: Basic $ (0.01) $ (6.38) $ 0.38 $ (1.71) Diluted $ (0.01) $ (6.38) $ 0.38 $ (1.71) (in thousands, except per common share amounts) First Second Third Fourth Year Ended December 31, 2018 Quarter Quarter Quarter Quarter Revenue $ 1,028,156 $ 1,120,085 $ 1,123,137 $ 1,183,284 Gross profit 67,068 118,640 111,124 157,621 Income (loss) from construction operations (925) 54,815 47,306 90,680 Income (loss) before income taxes (15,210) 39,867 32,804 75,152 Net income (loss) (10,942) 27,896 25,436 55,391 Net income (loss) attributable to Tutor Perini Corporation (12,124) 24,883 21,272 49,405 Earnings (loss) per common share: Basic $ (0.24) $ 0.50 $ 0.43 $ 0.99 Diluted $ (0.24) $ 0.49 $ 0.42 $ 0.98Yes þYes☒ No oo☐ No þþ☒ No oþ☒ No oþoooActAct. oExchange Act). Yes o☐ No ☒þ$549,519,663$573,656,973 as of June 28, 2019,30, 2021, the last business day of the registrant’s most recently completed second fiscal quarter.21, 202017, 2022 was 50,298,607.2020,2022, which definitive proxy statement shall be filed with the Securities and Exchange Commission within 120 days after the end of the fiscal year to which this Annual Report on Form 10-K relates.2019CONTENTSPARTPART I.BUSBUSINESSINESSGeneralTutor Perini Corporation, formerly known as Perini Corporation (“Perini”), was incorporated in 1918 as a successor to businesses that had been engaged in providing construction services since 1894. Tutor Perini Corporation (together with its consolidated subsidiaries, “Tutor Perini,” the “Company,” “we,” “us,” and “our,” unless the context indicates otherwise) is a leading construction company, based on revenue as ranked by Engineering News-Record (“ENR”), offering diversified general contracting, construction management and design-build services to private customers and public agencies throughout the world. The Company was formed as a result of the 2008 merger between Tutor-Saliba Corporation and Perini Corporation (“Perini”) and our legacy dates back to 1894, when Perini's predecessor businesses began providing construction services. Our corporate headquarters are in Los Angeles (Sylmar), California, and we have various other principal offices throughout the United States and its territories (see Item 2. Propertiesfor a listing of our major facilities). Our common stock is listed on the New York Stock Exchange under the symbol “TPC.” We are incorporated in the Commonwealth of Massachusetts.electrical, mechanical, plumbing,electrical; mechanical; plumbing; heating, ventilation and air conditioning (HVAC),; and fire protection. During 2019,2021, we performed work on approximately 1,300more than 1,600 construction projects.2019,2021, ENR ranked Tutor Perini as the 12thseventh largest domestic contractor. We are recognized as one of the leading civil contractors in the United States, as evidenced by our performance on several of the country’s largest mass-transit and transportation projects, such as Newark Liberty International Airport Terminal One (“Newark Airport Terminal One”), the East Side Access project in New York City, the California High-Speed Rail System, the Alaskan Way Viaduct Replacement (SR 99)(the “SR 99”) project in Seattle, major portions of the Red Line and Purple Line segments of the Los Angeles Metro subway system, and the San Francisco Central Subway extension to Chinatown. We are also recognized as one of the leadingmajor building contractors in the United States, as evidenced by our performance on several of the country’s largest building development projects, including Hudson Yards in New York City and CityCenter and the Cosmopolitan Resort and Casino, both in Las Vegas,Vegas.Hudson Yardsexpertise in New York City.As a resultthe construction of the 2008 merger between our predecessor companies, Tutor-Saliba Corporation (“Tutor-Saliba”)civil and Perini, and the subsequent acquisitions that we made in 2010 and 2011, webuilding infrastructure projects have experienced growth supportedbeen augmented by our increased size, scale, bonding capacity, access to broadervertical integration capabilities, which we established more than 10 years ago through the acquisitions of various business entities specializing in electrical, mechanical, plumbing, HVAC and other services that enhanced our market capabilities and expanded our geographic regions, expanded management capabilities, complementary assets and particular expertise in large, complex projects. presence. Our acquisitions have enabled us to provide customers with a vertically integrated service offering. This vertical integration is a unique capability and competitive advantage that allows us to self-perform a greater amount of work than our competitors. Our vertical integrationIt also increases our competitiveness in bidding and our efficiency in managing and executing large, complex projects. It alsoprojects, and provides us with significant cross-selling opportunities across a broad geographic footprint.most of theseveral major geographic regions of the United States. Our civil contracting services include construction and rehabilitation of highways, bridges, tunnels, mass-transit systems, military defense facilities, and water management and wastewater treatment facilities.Company’s legacy heavy civil construction operations (civil operations of our predecessors, Tutor-Saliba Corporation, its subsidiary Black Construction, and Perini),Perini, as well as our acquired companies, Frontier-Kemper, Lunda Construction and Becho. The Company’s legacyOur heavy civil units operate primarily on the West and East Coasts of the United States and are engaged in a variety of large mass-transit, tunneling, bridge and highway projects. Black Construction is the largest contractor in Guam and provides a variety of heavy civil, building, mechanical and electrical construction services throughout the Western Pacific region and in other strategic military locations. Frontier-Kemper is a heavy civil contractor engaged in the construction of tunnels for highways, railroads, subways and rapid transit systems; the construction of shafts and other facilities for water supply, wastewater transport and hydroelectric projects; and the development and equipping of mines with innovative hoisting, elevator and vertical conveyance systems. Lunda Construction is a heavy civil contractor specializing in the construction, rehabilitation and maintenance of bridges, railroads and other civil structures throughout the United States. Becho is engaged in drilling, foundation and excavation support for shoring, bridges, piers, roads and highway projects, primarily in the southwestern United States. We believe thatCompany has benefitted from these acquisitions by an expanded geographic presence, enhanced civil construction capabilitiesnation’s largest contractor in the transportation market and the addition of experienced management with proven, successful track records.third largest domestic heavy contractor.request forbest value proposal, where contracts are awarded based on a combination of technical qualifications, proposed project team, schedule, past performance on similar projects and price.and outstanding record of performance on challenging civil works projects, and vertical integration capabilities often enable us to pre-qualify for projects in situations where smaller, less diversified contractors are unable to meet the qualification requirements. We believe this is a competitive advantage that allows us to self-perform a greater amount of work and makes us an attractive partner onideal lead contractor for the largest, most complex infrastructure projects and on prestigious design-build, design-build-operate-maintain and public-private partnership projects.In its 2019 rankings, ENR ranked us as the nation’s third largest contractor in the transportation market and fifth largest domestic heavy contractor.We believe the Civil segment provides us with significant opportunities for growth due to the age and condition of existing infrastructure coupled with large government funding sources dedicated to the replacement and reconstruction of aging U.S. infrastructure. In addition, infrastructure improvement programs frequently enjoy popular, bipartisan support from the public and elected officials. Funding for major civil infrastructure projects is typically provided through a combination of one or more of the following: local, regional, state and federal loans and grants; other direct allocations sourced through tax revenue; bonds; user fees; and, for certain projects, private capital.Alaskan Way Viaduct Replacement (SR 99)SR 99 project in Seattle; the platform over the eastern rail yard at Hudson Yards in New York City; the rehabilitation of the Verrazano-Narrows Bridge in New York; and multiple runway reconstruction projects includingat the John F. Kennedy International Airport in New York, Los Angeles International Airport and Fort Lauderdale-Hollywood International Airport.Airport, among others.high-tech.technology. We believe the success of the Building segment results from our proven ability to manage and perform large, complex projects with aggressive fast-track schedules, elaborate designs, and advanced mechanical, electrical and life safety systems, while providing accurate budgeting and strict quality20192021 rankings, ENR ranked us as the 17th largest domestic building contractor. We are a recognized leader in the hospitality and gaming market, specializing in the construction of high-end resorts and casinos. We work with hotel operators, Native American tribal councils, developers and architectural firms to provide diversified construction services to meet the challenges of new construction and renovation of hotel and resort properties. We believe that our reputation for completing projects on time is a significant competitive advantage in this market, as any delay in project completion could result in significant loss of revenue for the customer.CorporationCorp. focuses on large, complex building projects nationwide, including significant projects in the hospitality and gaming, commercial office, education, government facilities, and multi-unit residential markets. Rudolph and Sletten focuses on large, complex projects in California in the health care, commercial office, technology, industrial, education, and government facilities markets. Roy Anderson Corp. provides general contracting services, including major disaster response and reconstruction support, to public and private customers primarily throughout the southeastern United States. Perini Management Services provides diversified construction and design-build services internationally to U.S. government agencies, as well as to surety companies and multi-national corporations. recently completed, or are currently working on, various large private and public building projects across a wide array of building end markets, including commercial offices, multi-unit residential, health care, hospitality and gaming, transportation, education and entertainment.markets. Specific projects include Newark Airport Terminal One in Newark, New Jersey;One; three large corporate office buildings in northern California for distinct confidential technology customers; a commercial office tower at 10 Hudson Yards and a multi-unit residential tower, both at 15 Hudson Yards in New York City; the El Camino Hospital Integrated Medical Office Building in El Camino, California; Kaiser Hospital Buildingsbuildings in San Leandro, Redwood City and Roseville, California; the Choctaw Casino and Resort in Durant, Oklahoma; the Pechanga Resort and Casino expansion in Temecula, California; the O Street Government Office Building in Sacramento, California; and courthouses in San Bernardino and San Diego, California and Broward County, Florida. As a result of our reputation and track record, we were previously awarded and completed contracts for several marquee hospitality and gaming projects in Las Vegas, including CityCenter, the Cosmopolitan Resort and Casino and the Wynn Encore Hotel. These projects span a wide array of building end markets and illustrate our Building segment’s résumé of successfully completed large-scale public and private projects. and pneumatically placed concrete for a full range of civil and building construction projects in the industrial, commercial, hospitality and gaming, and mass-transit end markets. This segment provides unique strengths and vertically integrated service capabilities that position us as a full-service contractor with greater control over project bids and costs, scheduled work, project delivery and risk management. The majority of work performed by the Specialty Contractors segment is contracted directly with state and local municipal agencies, real estate developers, school districts and other commercial and industrial customers. A significantportion of itsthe segment's work has been, and is expected to continue to be, performed for our Civil and Building segments in future years.has established itself asCorp. (“Five Star”) is an industry leader and is one of the largest electrical contractors in New York City. Five Star Electric provides construction services, in the electrical sector, including power, lighting, fire alarm, security, telecommunications, lowtechnologythe design and the development of electrical and technology systems for major projects spanning a broad variety of project types, including commercial office buildings, sports arenas, hospitals, research laboratories, hotels and casinos, convention centers, manufacturing plants, refineries, and water and wastewater treatment facilities. WDF, Nagelbush and Desert Mechanical each provide mechanical, plumbing, HVAC and fire protection services to a range of customers in a wide variety of markets, including transportation, commercial/industrial, schools and universities and residential. WDF is one of the largest mechanical contractors servicingserving the New York City metropolitan region. Nagelbush operates primarily in Florida and Desert Mechanical operates primarily in the western United States. Superior Gunite specializes in pneumatically placed structural concrete utilized in infrastructure projects nationwide, such as bridges, dams, tunnels and retaining walls.In its 2019 rankings, ENR ranked us as the 13th largest electrical contractor1, 18th largest mechanical contractor1 and 18th largest specialty contractor1 in the United States. Through Five Star Electric and WDF, collectively, we are also the largest specialty contractor in the New York City metropolitan area.facilities, and electrical work for the new hospital at the University of Texas Southwestern Medical Center in Dallas.facilities. The Specialty Contractors segment has also supported, or is currently supporting, several large projects in our Civil and Building segments, including the Alaskan Way Viaduct Replacement (SR 99)SR 99 project in Seattle; the San Francisco Central Subway extension to Chinatown; the Purple Line Segments 2 and 3 expansion projects in Los Angeles; Newark Airport Terminal OneOne; the California High Speed Rail project in Newark, New Jersey;central California; McCarran International Airport Terminal 3 in Las Vegas; and several marquee hospitality and gaming projects in Las Vegas, including CityCenter, the Cosmopolitan Resort and Casino, and the Wynn Encore Hotel.$5$4 billion, or 44%46%, of our backlog as of December 31, 20192021 will be recognized as revenue in 2020.2022. Our backlog by segment, end market, customer type and customercontract type is presented in the following tables:As of December 31, (in thousands) 2021 2020 Backlog by business segment: Civil $ 4,553,539 55 % $ 4,783,564 57 % Building 2,308,930 28 % 1,702,305 20 % Specialty Contractors 1,373,167 17 % 1,859,848 23 % Total backlog $ 8,235,636 100 % $ 8,345,717 100 % 1This ranking represents the collective revenue of the Company’s specialty contracting subsidiaries as reported to ENR.As of December 31, (in thousands) 2021 2020 Civil segment backlog by end market: Mass transit (includes certain transportation and tunneling projects) $ 3,256,556 71 % $ 3,885,275 81 % Military defense facilities 627,407 14 % 318,389 7 % Bridges 448,416 10 % 244,385 5 % Water 119,707 3 % 130,274 3 % Other 101,453 2 % 205,241 4 % Total Civil segment backlog $ 4,553,539 100 % $ 4,783,564 100 % As of December 31, (in thousands) 2021 2020 Building segment backlog by end market: Municipal and government $ 824,173 36 % $ 556,726 33 % Health care facilities 575,006 25 % 49,655 3 % Mass transit (includes transportation projects) 476,454 21 % 144,019 8 % Commercial and industrial facilities 164,878 7 % 350,012 21 % Education facilities 140,822 6 % 165,766 10 % Hospitality and gaming 94,732 4 % 333,315 20 % Other 32,865 1 % 102,812 5 % Total Building segment backlog $ 2,308,930 100 % $ 1,702,305 100 % As of December 31, (in thousands) 2021 2020 Specialty Contractors segment backlog by end market: Mass transit (includes certain transportation and tunneling projects) Mass transit (includes certain transportation and tunneling projects) $ 730,480 53 % $ 1,058,479 57 % Water Water 164,653 12 % 214,717 12 % Municipal and government Municipal and government 158,614 12 % 92,749 5 % Multi-unit residential 137,824 10 % 219,139 12 % Commercial and industrial facilities 96,686 7 % 122,687 7 % Other 84,910 6 % 152,077 7 % Total Specialty Contractors segment backlog $ 1,373,167 100 % $ 1,859,848 100 % As of December 31, 2021 2020 Backlog by customer type: State and local agencies 71 % 72 % Private owners 16 % 20 % Federal agencies 13 % 8 % Total backlog 100 % 100 % As of December 31, 2021 2020 Backlog by contract type: Fixed price 77 % 76 % Guaranteed maximum price 12 % 11 % Unit price 4 % 4 % Cost plus fee and other 7 % 9 % Total backlog 100 % 100 % The composition of backlog by type of contract for 2019 and 2018 is as follows:For additional information on customer types and contract types, see Note 3of the Notes to Consolidated Financial Statements.CompetitioncivilCivil segment projects. In recent years, however, we have observed a diminished presence from some of these foreign competitorsEvolving changes in the bidding for severalconstruction industry, such as the trend toward an increased use of the larger U.S.progressive design-build project opportunities.delivery method that may reduce project risks for both owners and contractors, could result in increased competition and potentially lower margins on certain projects in the future. We believe price, experience, reputation, responsiveness, customer relationships, project completion track record, schedule control, risk management and quality of work are key factors customers consider when awarding contracts.Ifand by entering intosecuring purchase commitments for materials early in the project schedule.schedule and by including contingency for these risks in our bid price. Construction and other materials used in our construction activities are generally available locally from multiple sources andsources. Despite the widespread adverse supply chain impacts related to the effects of the COVID-19 pandemic, we have beennot yet experienced significant supply chain issues, but we cannot be certain that such issues may not arise in adequate supply during recent years.the future. Labor resources for our domestic projects are largely obtained through various labor unions. We have not experienced significant labor shortages in recent years, nor do we expect to in the near future, although afuture. However, longer-term, the anticipated significant rapid growthincrease in demand for large complex projects driven by the IIJA could lead to labor shortages.backlog may leadbusiness. Our revenue and operating income are typically higher in the second half of the year. Our first fiscal quarter of the year is typically our lowest revenue quarter, as the harsher winter weather conditions that often occur during this period can negatively impact our ability to situationsexecute work and our productivity in parts of North America. Our revenue typically increases during the high construction seasons of the summer and fall months in the United States. Within the United States, as well as in other parts of the world, our business generally benefits from milder weather conditions during our third fiscal quarter, which labor resources become constrained. We employ expatriateallows for more productivity from our on-site construction operations. For these reasons, it is not unusual for us to experience seasonal changes or fluctuations in our quarterly operating results.labor in selected overseas areas.Environmental MattersOur propertiesgovernment customers can terminate, renegotiate, or modify any of their contracts with us at their election, and operationsmany of our federal government contracts are subject to renewal or extension periodically. Revenue derived from federal, state and municipal lawslocal government customers was 66%, 63% and 62% of our total revenue for each of the years ended December 31, 2021, 2020 and 2019, respectively.relatingand requirements materially affect our business. We are firmly committed to providing a safe and healthy work environment for our employees and to working in a manner that ensures the safety of our subcontractors, customers and the general public, as well as the protection of the environment, including requirements for water discharges; air emissions; the use, management and disposal of solid or hazardous materials or wastes;facilities, equipment and the cleanup of contamination. In certain circumstances,environment. Compliance with Occupational Safety and Health Administration (“OSHA”) and other health and safety regulations, in particular, is essential to procure business and to attract and retain our workforce. Accordingly, we maymake considerable investments in our environmental, health and safety programs, and we factor costs associated with compliance into our project bids and proposals.be required to hire subcontractors to disposehandle small quantities of hazardous materials encountered on a project in accordanceoccasion. Significant fines, penalties and other sanctions may be imposed for non-compliance with a plan approved in advance by the owner. We continually evaluate our compliance with all applicable environmental and health and safety laws and regulations, and believe that we are in substantial compliance with thosesome laws provide for joint and regulations. However, future requirements or amendments to current laws or regulations imposing more stringent requirements could require us to incur additional costs to maintain or achieve compliance.In addition, some environmental laws, such as the U.S. federal “Superfund” law and similar state statutes, can impose liabilityseveral strict liabilities for the entire costremediation of cleanupreleases of contaminated sites upon any of the current or former owners or operators or upon parties who generated waste at, or sent waste to, these sites, regardless of who owned the site at the time of the release or the lawfulness of the original disposal activity. hazardous substances.We believe thatHowever, we do not own the job sites upon which we perform our liabilities for these sites are not material, either individually or in the aggregate.work. We have pollution liability insurance coverage for such matters, and if applicable, we seekautoautomobile liability, general liability and workers’ compensation insurance, allowing us to centralize our claims and risk management functions to reduce our insurance-related costs.Employeesour employees varies basedat any given time depends on the numbervolume and types of active projects the type and magnitude of those projects,in progress, as well as our position within the lifecycle of those projects. Our total numberWe believe that we have strong relationships with our employees and that the quality and level of service that our employees as of December 31, 2019 was approximately 9,100.deliver to our customers are among the highest in our industry.Financial Our business relies upon an adequate supply of management, supervisory and field personnel. Recruiting, training and retaining key personnel has been and will remain primary goals of our human capital initiative. Through the use of management information about geographic areassystems, on-the-job training and educational seminars, employees are trained to understand the importance of project execution. We place a strong emphasis on training employees in accurate and comprehensive project estimating, project management and project cost control. As is discussedcommon in Note 15our industry, we experience some recurring employee turnover each year, which we believe is comparable to the Consolidated Financial Statements underindustry average. Historically, we have successfully attracted and retained sufficient numbers of personnel, including union personnel, to support our operational needs. We strive to ensure a fully competent project management team that includes long-term successors to our current project leaders by investing significant resources to build strong and highly competent project managers. We regularly hire construction management and engineering staff, including interns and recent graduates, and provide them with engaging projects and development programs. On the heading “Geographic Information.”occasion when we have a need for senior project executives, the broad professional network of our leadership team often provides strong candidates to fill those needs. We also utilize internal and external recruiting specialists to help fill our open job positions. To support retention and motivation of our top talent, we provide very competitive compensation, which may include performance incentives.10-Q,10-Q, current reports on Form 8-K, and any amendments to these reports. These reports, and any amendments to them, are made available on our website as soon as reasonably practicable after we electronically file them with the Securities and Exchange Commission (“SEC”).RISKRISK FACTORSsignificantlysubstantially throughout the project lifecycle, which has previously resulted, and in the future could result, in a material impact to our consolidated financial statements. In addition, cost overruns, including unanticipated cost increases on fixed price contracts (including contracts performed under the design-build project delivery method, in which we assume the risks associated with the design of the project) and guaranteed maximum price contracts, have previously resulted, and in the future may result, in lower profits or losses. Economic factors, including inflation, could also subject us to higher costs, which we may not be able to fully recover in future projects that we are bidding, and may also decrease profit on our existing contracts, in particular with respect to our fixed price, unit price and guaranteed maximum price contracts. Changes in laws, policies or regulations, including tariffs and taxes, have previously impacted, and in the future could impact, the prices for materials or equipment. Further, our results of operations canhave historically fluctuated, and may continue to fluctuate, quarterly and annually depending on when new awards occur and the commencement and progress of work on projects already awarded.adverselyunfavorable to us, could adversely affect our financial results and/or cash flows, harm our reputation and/or preclude us from bidding on future projects. We also may invest significant working capital on projects while legal proceedings are being settled.resultadverse legal proceeding outcome or settlement that is materially different from our expectations and estimates could have a material adverse effect on our financial condition, results of operations and cash flows. This may include requiring us to record an expense or reduce revenue that we previously recorded based on our expectations or estimates, requiring us to pay damages or reducing cash collections that we had expected to receive. For example, on December 13, 2019, we received an adverse jury verdict in the case related to the construction of the Alaskan Way Viaduct Replacement Project (“SR 99”)99 project by a joint venture for which the Company holds a 45% share as a minority partner. As a result of the unexpected adverse jury verdict, we recorded in a pre-tax charge of $166.8 million in 2019. Refer to the Alaskan Way Viaduct Matter in Note 8 of the Notes to Consolidated Financial Statements for further discussion. In addition, any adverse judgments could harm our reputation and preclude us from bidding on future projects.results.results and could result in further legal proceedings.or change order, work beyond the initial project scope, which can result in disputes or claims and adversely affect our working capital, profits and cash flows.generallyoften require us to perform extra or change order, work beyond the initial project scope as directed by the customer even if the customer has not agreed in advance on the scope and/or price of the work to be performed. This process mayhas resulted and in the future could result in disputes or claims over whether the work performed is beyond the scope of work directed by the customer and/or exceeds the price the customer is willing to pay for the work performed. To the extent we do not recover our costs for this work or there are delays in the recovery of these costs, our working capital, profits and cash flows could continue to be adversely impacted.Our actual resultsdiffer from the assumptionsreduce our market share and estimates used to prepareprofits.financial statements.In preparing our financial statements,industry, we compete with many international, regional and local construction firms. If we are required under generally accepted accounting principlesunable to compete successfully in such markets, our relative market share and profits could be reduced.United States (“GAAP”)original contract price. Consequently, our ability to make estimatesresolve and assumptions asrecover on these types of claims has been and may continue to be delayed, which may adversely affect our liquidity and financial results.datefull impact that the COVID-19 pandemic may have on our business, including the impact of actions that may continue to be taken in response to the financial statements. These estimates and assumptions affect the reported values of assets, liabilities, revenue and expenses,pandemic and the disclosure of contingent assetsimpacts that the pandemic will have on our employees, our operating segments and liabilities. Areas requiring significant estimates bypractices, our management include, but are not limited to:• recognition of contract revenue, costs, profitscustomers, subcontractors and suppliers, and the regions that we serve, or losses in applying the principles of revenue accounting;• recognition of revenue related to project incentives or awards we expect to receive;• recognition of recoveries under contract change orders or claims;• estimated amounts for expected project losses, warranty costs, contract closeout or other costs;• collectability of billed and unbilled accounts receivable;• asset valuations;• income tax provisions and related valuation allowances;• determination of expense and potential liabilities under pension and other post-retirement benefit programs; and• accruals for other estimated liabilities, including litigation and insurance revenue/reserves.Our actual business and financial results could differ from our estimates of such results, which could have a material negative impact on our financial condition and reportedresults of operations as a whole. The full impact depends on many factors that remain uncertain and subject to ongoing volatility, or that are not yet identifiable, and in many cases are out of our control. These factors could include, among other things: (1) the duration of the COVID-19 pandemic and the types and magnitude of adverse impacts on the U.S. and global economies; (2) the health and welfare, and general availability, of our employees, and those of our customers, subcontractors and suppliers; (3) evolving business and government actions in response to the pandemic, including, but not limited to, social distancing measures, new or increased COVID-19 testing and/or vaccination requirements, and additional health and safety requirements that we may be required to observe in order to continue working on our projects; (4) the varying impact that the pandemic may have on industries we serve and on government spending for infrastructure projects, including reduced government spending on infrastructure as a result of lower revenues from taxes, tolls and fares; (5) the response of our customers or prospective customers to the pandemic, including potential future delays, stoppages or terminations of existing projects or potential new awards; (6) delays in the settlement of receivables if customers are unable to pay, fail to make timely payments, request financial concessions or if we continue to experience delays in resolving claims and disputes (e.g., further delays in court proceedings or settlement discussions); (7) limitations and higher costs associated with obtaining financing; (8) the impact of higher inflation that has resulted, at least in part, from market and government responses to the COVID-19 pandemic, and how long elevated inflation levels may persist, which may increase the cost of labor and materials; (9) supply chain and related logistical challenges that could further limit the availability or increase the cost of materials; (10) potential interruptions to our information systems and technology or breaches in our data security due to increasing use of remote communications and access; and (11) the extent to which COVID-19 vaccines and vaccine boosters are effective against the various current and future virus strains. Such factors may continue to result in fewer or delayed project bidding opportunities or additional or further delays on existing projects.We require substantial personnel, including construction The COVID-19 pandemic and project managers and specialty subcontractor resources to execute and perform our contracts in backlog. The successful execution of our business strategies is also dependent upon our ability to attract and retain our key officers,the volatile economic conditions stemming from the pandemic, as well as adequately plan for their succession.Our abilityreactions to executefuture pandemics or resurgences of COVID-19, could also aggravate or heighten the risks posed by other risk factors that we have identified in this Annual Report on Form 10-K, which in turn could materially and perform on our contracts in backlog depends in large part upon our ability to hire and retain highly skilled personnel, including project and construction management and trade labor resources, such as carpenters, masons and other skilled workers. In the event we are unable to attract, hire and retain the requisite personnel and subcontractors necessary to execute and perform our backlog, we may experience delays in completing projects in accordance with project schedules or an increase in expected costs, both of which could have a material adverse effect on our financial results, our reputation and our relationships. In addition, if we lack the personnel and specialty subcontractors necessary to perform on our current contract backlog, we may find it necessary to curtail our pursuit of new projects. A significant, rapid growth in our backlog may lead to situations in which labor resources become constrained.The execution of our business strategies also substantially depends on our ability to retain several key members of our management. Losing any of these individuals could adversely affect our business. The majoritybusiness, financial condition and results of these key individualsoperations.bound by employment agreements. Volatilitypresently known or lack of positive performance in our stock price may adversely affect our ability to retain key individuals to whomthat have not yet become apparent. As a result, we cannot assure you that if the COVID-19 pandemic continues, it would not have provided share-based compensation. Additionally, because a substantial portion of our key officers' compensation is placed "at risk" and linked to the performance offurther adverse impact on our business, when our operatingfinancial condition and results are negatively impacted, we are at greater risk of employee turnover. If we lose our key officers and do not have qualified successors in place, our operating results would likely be harmed.The construction services industry is highly schedule driven, and our failure to meet the schedule requirements of our contracts could adversely affect our reputation and/or expose us to financial liability.Many of our contracts are subject to specific completion schedule requirements. Any failure to meet contractual schedule requirements could subject us to liquidated damages, liability for our customer’s actual cost arising out of our delay and damage to our reputation.Wesubstantial amountmaterial adverse impact on our financial condition and reported results of indebtedness whichoperations.positionliability.preventin the future could subject us, from fulfillingto liquidated damages, liability for our obligations undercustomer’s actual cost arising out of our debt agreements.currently have, and expectmay not fully realize the revenue value reported in our backlog due to continue to have, a substantial amount of indebtedness. cancellations or reductions in scope.2019,2021, our total debtbacklog of uncompleted construction work was $834.5 million, with $124.1 million classifiedapproximately $8.2 billion. The revenue projected in our backlog may not be fully realized and, in some cases, if realized, may not result in profits or may be less profitable than expected. The cancellation or reduction in scope of significant projects included in our backlog could have a material adverse effect on our financial condition, results of operations and cash flows.current debt. Ifwell as adequately plan for their succession.meetattract, hire and retain the termsrequisite personnel and subcontractors necessary to execute and perform on our contracts in backlog, we may experience delays in completing projects in accordance with project schedules or an increase in expected costs, both of which could have a material adverse effect on our financial results, our reputation and our relationships. In addition, if we lack the personnel and specialty subcontractors necessary to perform on our current contract backlog, we may find it necessary to curtail our pursuit of new projects. A significant, rapid growth in our backlog has led, and could continue to lead, to situations in which labor resources become constrained.financial covenantsexisting infrastructure and buildings; the need for new or fail to complyexpanded infrastructure and buildings; and federal, state and local government spending levels. As a result, our future operating results could be negatively impacted by any decrease in demand for public projects or decrease or delay in government funding (even with anythe passage of the other restrictions containedIIJA), which could result from a variety of factors, including extended government shutdowns, delays in the agreements governing our indebtedness, an eventsale of default could occur, causingvoter-approved bonds, budget shortfalls, credit rating downgrades or long-term impairment in the debt relatedability of state and local governments to such agreements to become immediately due. If such acceleration occurs, we may not be able to repay such indebtedness as required. Since indebtedness under our credit agreement entered into on April 20, 2017 (the “2017 Credit Facility”) with SunTrust Bank, now known as Truist Bank, as Administrative Agent, Swing Line Lenderraise capital in the municipal bond market.L/C Issuerinformation technology interruption and a syndicate of other lenders is secured by substantially all of our assets, acceleration of this debt could resultbreaches in foreclosure of those assets and a negative impact on our operations. In addition, a failure to meet the terms of our 2017 Credit Facility could result in a reduction of future borrowing capacity under the 2017 Credit Facility, causing a loss of liquidity. A loss of liquiditydata security and/or privacy could adversely impact our ability to execute projectsoperate and negatively impact our operating results.backlog, obtain new projects,reputation or an unintentional disclosure of customer confidential or personally identifiable information, any of which could have a material adverse impact on us and our consolidated financial statements.subcontractors,significant resources to remediate the impact of, or further mitigate the risk of, such an attack. Any successful cyber-attack can result in the criminal, or otherwise illegitimate use of, confidential data, including our data or third-party data for which we have the responsibility for safekeeping. Additionally, such an attack could have a material adverse impact on our operations, reputation and attractfinancial results.retain key employees. Lastly, the 2017 Credit Facility includes a spring-forward provision whereby the facility will mature on December 17, 2020 if the 2.875% Convertible Senior Notes due June 15, 2021 (the “Convertible Notes”) remain outstanding at that time. While we do not have call rights that allowsecurity laws and regulations requiring us to unilaterally redeem the Convertible Notes, we intendprotect sensitive and confidential information from disclosure continue to repurchase or exchange the Convertible Notes and/or modify or replacethe 2017 Credit Facility during 2020. Various alternatives are under considerationevolve and pose increasingly complex compliance challenges. Compliance with evolving data privacy laws and regulations may cause us to determine the financing arrangement that is best suitedincur additional costs, and any violation could result in damage to our needsreputation and/or subject us to fines, payment of damages, lawsuits and provides the most favorable terms. We are currently in discussions with lenders regarding our options. As a result of the aforementioned spring-forward provision in the 2017 Credit Facility, all borrowings under the facility are included in current debtrestrictions on our balance sheet asuse of December 31, 2019. If we are unable to repurchase or exchange the Convertible Notes in 2020 and/or modify or replace the 2017 Credit Facility, all outstanding borrowings underdata, which could have a material adverse impact on our 2017 Credit Facility will mature and become immediately due and payable on December 17, 2020.Weather can significantly affect our revenue and profitability.Inclement weather conditions, such as significant storms and unusual temperatures, can impact our ability to perform work. Adverse weather conditions can cause delays and increases in project costs, resulting in variability in our revenue and profitability.the execution capabilitycapabilities and financial reward of project teams.increasing surety bonding capacity. Success on these joint projects depends in large part on whether our joint venture partners satisfy their contractual obligations. Generally, we and our joint venture partners are jointly and severally liable for all liabilities and obligations of our joint ventures. If a joint venture partner fails to perform or is financially unable to bear its portion of required capital contributions or other obligations, including liabilities stemming from lawsuits, we could be required to make additional investments, provide additional services or pay more than our proportionate share of a liability to make up for our partner’s shortfall. Further, if we are unable to adequately address our partner’s performance issues, the customer may terminate the project, which could result in legal liability to us, harm our reputation, reduce our profit on a project or, in some cases, result in a loss.We may not fully realize the revenue value reported in our backlog due to cancellations or reductions in scope.As of December 31, 2019, our backlog of uncompleted construction work was approximately $11.2 billion. The revenue projected in our backlog may not be fully realized and, in some cases, if realized, may not result in profits or may be less profitable than expected. The cancellation or reduction in scope of significant projects included in our backlog could have a material adverse effect on our financial condition, results of operations and cash flows.The level of federal, state and local government spending for infrastructure and other public projects could adversely affect the number of projects available to us in the future.The civil construction and public-works building markets are dependent on the amount of work funded by various government agencies, which depends on many factors, including the condition of the existing infrastructure and buildings; the need for new or expanded infrastructure and buildings; and federal, state and local government spending levels. As a result, our future operating results could be negatively impacted by any decrease in demand for public projects or decrease or delay in government funding, which could result from a variety of factors, including extended government shutdowns, delays in the sale of voter-approved bonds, budget shortfalls, credit rating downgrades or long-term impairment in the ability of state and local governments to raise capital in the municipal bond market.Competition for new project awards is intense, and our failure to compete effectively could reduce our market share and profits.New project awards are determined through either a competitive bid basis or on a negotiated basis. Projects may be awarded based solely upon price, but often take into account other factors, such as technical qualifications, proposed project team, schedule and past performance on similar projects. Within our industry, we compete with many international, regional and local construction firms. Some of these competitors have achieved greater market penetration than we have in the markets in which we compete, and some have greater resources than we do. If we are unable to compete successfully in such markets, our relative market share and profits could be reduced.In connection with mergers and acquisitions, we have recorded goodwill and other intangible assets that could become impaired and adversely affect our operating results. Assessing whether impairment has occurred requires us to make significant judgments and assumptions about the future, which are inherently subject to risks and uncertainties, and if actual events turn out to be materially less favorable than the judgments we make and the assumptions we use, we may be required to record impairment charges in the future.We had $255.5 million of goodwill and indefinite-lived intangible assets recorded on our Consolidated Balance Sheet as of December 31, 2019. We assess these assets for impairment annually, or more often if required. Our assessments involve a number of estimatesand assumptions that are inherently subjective, require significant judgment and involve highly uncertain matters that are subject to change. The use of different assumptions or estimates could materially affect the determination as to whether or not an impairment has occurred. In addition, if future events are less favorable than what we assumed or estimated in our impairment analysis, we may be required to record an impairment charge, which could have a material impact on our consolidated financial statements.Systems and information technology interruption and breaches in data security could adversely impact our ability to operate and negatively impact our operating results.We rely on computer, information and communication technology and other related systems, some of which are hosted by third party providers, for various business processes and activities, including project management, accounting, financial reporting and business development. These systems may be subject to interruptions or damage by a variety of factors including, but not limited to, cyber-attacks, natural disasters, power loss, telecommunications failures, acts of war, computer viruses, obsolescence and physical damage. Such interruptions could result in a loss of critical data, a delay in operations or an unintentional disclosure of client confidential or personally identifiable information, any of which could have a material impact to us and our consolidated financial statements.In addition, various privacy and security laws require us to protect sensitive and confidential information from disclosure. We dedicate considerable attention and resources to the safeguarding of our information technology systems. Our systems may, nevertheless, continue to be at risk for cyber-attacks. Consequently, we may need to engage significant resources in the future to remediate the impact of, or further mitigate the risk of, such an attack. Any successful cyber-attack could result in the criminal, or otherwise illegitimate use of, confidential data, including our data or third-party data for which we have the responsibility for safekeeping. Additionally, such an attack could adversely affect our operations, reputation and financial results.We are subject to risks related to government contracts and related procurement regulations.Our contracts with U.S. federal, as well as state, local and foreign, government entities are subject to various procurement regulations and other requirements relating to their formation, administration and performance. We are subject to audits and investigations relating to our government contracts, and any violations could result in various civil and criminal penalties and administrative sanctions, including termination of contract, refunding or suspending of payments, forfeiture of profits, payment of fines and suspension or debarment from future government business. In addition, some of these contracts provide for termination by the government at any time, without cause.We may need to include the potential dilutive impact of our Convertible Notes in our diluted earnings per share calculation.We currently intend to pay the principal amount of our Convertible Notes in cash; therefore, we have not included the potential dilutive effect of our Convertible Notes in our diluted earnings per share calculations. If, however, there is a change in future circumstances as a result of a decline in our projected cash flow, available cash/liquidity or other reasons, we may conclude at such time that it will be preferable to use shares to satisfy the Convertible Notes. Such a change in our intentions would result in the inclusion of the potential dilutive impact of the Convertible Notes in our diluted earnings per share calculation, which would result in a decrease in our diluted earnings per share. In addition, we could be adversely affected by violations of the U.S. Foreign Corrupt Practices Act and similar worldwide anti-bribery laws.2019,2021, we derived $377.1$374.1 million of revenue from our work on projects located outside of the United States. Our international operations expose us to risks inherent in doing business in certain hostile regions outside the United States, including political risks; risks of loss due to acts of war; unstable economic, financial and market conditions; potential incompatibility with foreign subcontractors and vendors; foreign currency controls and fluctuations; trade restrictions; logistical challenges; variations in taxes; and changes in labor conditions, labor strikes and difficulties in staffing and managing international operations. Failure to successfully manage risks associated with our international operations could result in higher operating costs than anticipated or could delay or limit our ability to generate revenue and income from construction operations in key international markets.Finally,We could be adversely affected by violations of the U.S. Foreign Corrupt Practices Act and similar worldwide anti-bribery laws.coronavirus.COVID-19. If a disease spreads sufficiently to cause an epidemic or a pandemic, our business or the businessesbusiness of our suppliers, subcontractors or customers could be adversely impacted.May 17, 2019.March 23, 2020. The credit ratings assigned to us and our debt are subject to ongoing evaluation by credit rating agencies and could change based upon, among other things, our results of operations and financial condition. Actual or anticipated changes or downgrades in our credit ratings, including any announcement that our ratings are under review for a downgrade, could have a material adverse effect on our costs and availability of capital, which could in turn have a material adverse effect on our financial condition, results of operations, cash flows and our ability to satisfy our debt service obligations. Negative changes in our credit ratings could also result in more stringent covenants and higher interest rates with regard to any new debt.The phase-out of the London Interbank Offered Rate (“LIBOR”), or the replacement of LIBOR with a different reference rate, may adversely affect interest rates paid on some of our loans and consequently, our earnings and cash flows.Borrowings under our revolving credit facility and the variable portion of our equipment financing and mortgages use interest rates in relationrefinanced debt.LIBOR. In 2017, the United Kingdom’s Financial Conduct Authority, which regulates LIBOR, announced that it intends to phase out LIBOR by the end of 2021. It is unclear if LIBOR will cease to exist at that time or if new methods of calculating LIBOR will be established such that it continues to exist after 2021. The expected phase out of LIBOR could cause market volatility or disruption and may adversely affect our access to the capital markets and cost of funding.Conversion of our outstanding Convertible Notes could dilute ownership interests of existing stockholders and could adversely affect the market price of our common stock.Based on the terms of the indenture for our Convertible Notes, we may redeem the Convertible Notes in cash, shares of our common stock or a combination thereof. Should we redeem the Convertible Notes for shares of our common stock, the ownership interests of existing stockholders may be diluted and any subsequent sales in the public market of our common stock issued upon such conversion could cause the price of our common stock to decline. In addition, the existence of the Convertible Notes may encourage short selling by market participants because a conversion of the Convertible Notes could depress the price of our common stock.2019,2021, our chairman and chief executive officer, Ronald N. Tutor, and three trusts controlled by Mr. Tutor (the “Tutor Group”) owned approximately 16%15% of the outstanding shares of our common stock. Additionally, one of our current directors was appointed by Mr. Tutor pursuant to his right to nominate one member to our Board of Directors, so long as the Tutor Group owns at least 11.25% of the outstanding shares of our common stock. Accordingly, Mr. Tutor could exert influence over the outcome of a range of corporate matters, including the election of directors and the approval or rejection of other extraordinary transactions, such as a takeover attempt or sale of the Company or its assets.UNRESOLVEDUNRESOLVED STAFF COMMENTSPROPERTIESLakeview Terrace, CALeasedSpecialty ContractorsLeasedOwnedJessup, MDHilbert, WILakeview Terrace, CARosemount, MNLeasedOwnedSpecialty ContractorsCivilWaukesha, WI Owned Civil LEGALLEGAL PROCEEDINGSProceedingsproceedings are set forthdiscussed in Note 8 of the Notes to Consolidated Financial Statements and are incorporated herein by reference.MINEMINE SAFETY DISCLOSURESPARTPART II.MARKETMARKET FOR REGISTRANT’S COMMON EQUITY, RELATED STOCKHOLDER MATTERS AND ISSUER PURCHASES OF EQUITY SECURITIES21, 2020,17, 2022, there were 363340 holders of record of our common stock, including holders of record on behalf of an indeterminate number of beneficial owners.2019.2021. We have not historically paid dividends on our common stock and have no immediate plans to do so.None.20142016 in each of our common stock, the NYSE Composite Index and the Dow Jones U.S. Heavy Construction Index, with investment weighted on the basis of market capitalization.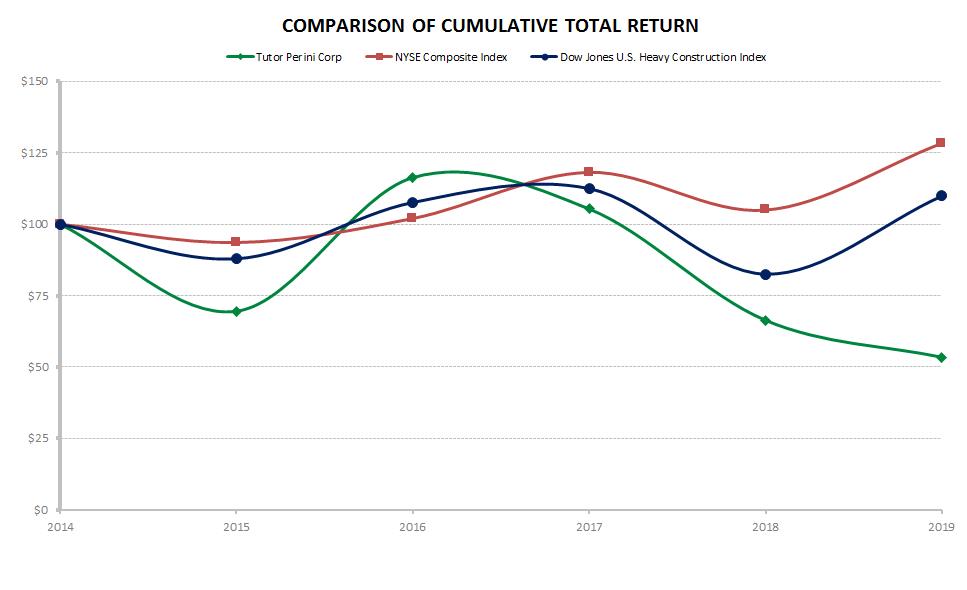
COMPARISON OF CUMULATIVE TOTAL RETURNTutor Perini Corp NYSE Composite Index Dow Jones U.S. Heavy Construction Index$225 $220 $175 $150 $125 $100 $75 $50 $25 $02012 2013 2014 2015 2016 2017SELE[RESERVED]CTED FINANCIAL DATASelected Consolidated Financial InformationThe following tables present selected financial data for the last five years. This selected financial data should be read in conjunction with Item 7. Management’s Discussion and Analysis of Financial Condition and Results of Operations, Item 15. Exhibits andFinancial Statement Schedules, and the other information included elsewhere inthis Annual Report._____________________________________________________________________________________________________________(a)During the year ended December 31, 2019, the Company recorded a charge of $166.8 million in gross profit ($2.38 per diluted share) as a result of the adverse jury verdict in the case related to the construction of SR 99 by a joint venture for which the Company holds a 45% share as a minority partner. Refer to the Alaskan Way Viaduct Matter discussion in Note 8 of the Notes to Consolidated Financial Statements for further discussion of this item.During the year ended December 31, 2018, the Company recorded a charge of $17.8 million in gross profit ($0.25 per diluted share), which was primarily non-cash, as a result of the unexpected adverse outcome of an arbitration decision related to a subcontract back charge dispute on a Civil segment project in New York that was completed in 2013.During the year ended December 31, 2015, the Company recorded unfavorable adjustments totaling $45.6 million to gross profit ($0.53 per diluted share) for various Five Star Electric projects in the Specialty Contractors segment. In addition, that same year there was a decrease of $24.3 million in gross profit ($0.28 per diluted share) due to unfavorable adjustments to the estimated cost to complete a Building segment project in New York. The Company’s 2015 results were also impacted by an unfavorable adjustment for an adverse legal decision related to a long-standing litigation matter in the Civil segment, which resulted in a decrease of $23.9 million in gross profit ($0.28 per diluted share). Furthermore, the Company recorded favorable adjustments for a Civil segment runway reconstruction project, which resulted in an increase of $13.7 million in gross profit ($0.16 per diluted share) in 2015.(b)During the year ended December 31, 2019, the Company recognized a one-time gain of $37.8 million ($0.54 per diluted share) related to the Company’s acquisition of an additional 25% interest in a Civil segment joint venture for which the Company gained a controlling financial interest. The gain resulted from the remeasurement to fair value of the Company’s existing investment in the joint venture. For further discussion on the acquisition and the related remeasurement, see Note 13 of the Notes to Consolidated Financial Statements.(c)During the year ended December 31, 2019, the Company recorded a non-cash goodwill impairment charge of $379.9 million in income (loss) from construction operations ($6.58 per diluted share) resulting from an interim impairment test the Companyperformed as of June 1, 2019. For further information and breakdown of the goodwill impairment charge by segment, see Note 6 of the Notes to Consolidated Financial Statements.(d)On June 6, 2017, the Company received $37.0 million ($0.43 per diluted share) in a cash settlement with Merrill Lynch, Pierce, Fenner & Smith Incorporated (“Merrill Lynch”), as successor in interest to Banc of America Securities LLC and Bank of America, N.A. (collectively “BofA”). The settlement pertained to litigation, which was filed by the Company in 2011, and related to the purchase by the Company of certain auction-rate securities from BofA. The Company recognized the settlement as a gain during the second quarter of 2017. For additional information, see Note 10 of the Notes to Consolidated Financial Statements.(e)As mentioned above in footnote (c), the Company recorded a $379.9 million goodwill impairment charge during 2019, of which approximately $209.5 million is not deductible for income tax purposes. The Company recognized a tax benefit totaling $49.4 million ($0.98 per diluted share) as a result of the impairment charge.In December 2017, the Tax Cuts and Jobs Act of 2017 (“TCJA”) was enacted reducing the U.S. corporate income tax rate from 35% to 21%, effective in 2018. As a result, tax expense in 2019 and 2018 was positively impacted and in 2017 the Company recognized a favorable tax adjustment of $53.3 million ($1.05 per diluted share) primarily due to a one-time revaluation of its deferred tax assets and liabilities in connection with the adoption of the TCJA. For a further discussion of the effect of the TCJA, see Note 5 of the Notes to Consolidated Financial Statements._____________________________________________________________________________________________________________MANAGEMENT’SMANAGEMENT’S DISCUSSION AND ANALYSIS OF FINANCIAL CONDITION AND RESULTS OF OPERATIONSFiscal Years 2018 and 2017fiscal 20182020 results to fiscal 2017,our 2019 results, refer to Item 7. Management’s Discussion and Analysis of Financial Condition and Results of Operations in our Form 10-K for the fiscal year ended December 31, 2018,2020, as filed with the Securities and Exchange Commission on February 27, 2019.24, 2021.Executive OverviewConsolidated revenue forOur 2019 was $4.5 billion, which is comparable to revenue in 2018. Revenue in 2019 was favorablyresults of operations were negatively impacted by higher volume on certain Civil segment projects, which was mostly offset by a $123.9 million reduction in revenue associated with the SR 99-related charge discussed in the following paragraph.For the year ended December 31, 2019, the Company reported a loss from construction operations of $365.0 million compared to income from construction operations of $191.9 million in 2018. The loss was primarily driven by the $379.9 million pre-tax, non-cash goodwill impairment charge recorded in 2019 (see Note 6 of the Notes to Consolidated Financial Statements). Adjusted income from construction operations for 2019, which is a non-GAAP financial measure and excludes the non-cash goodwill impairment charge, was $14.9 million. (For a discussion of non-GAAP financial measures, including a reconciliation of non-GAAP financial measures to the most nearly comparable GAAP financial measures, see the section below titled Non-GAAP Financial Measures.) The decrease in adjusted income from construction operations was primarily due to a $166.8 million pre-tax charge related to the adverse SR 99 jury verdict. The goodwill impairment charge reduced income from construction operations for the Civil, Building and Specialty Contractors segments by $210.2 million, $13.5 million and $156.2 million, respectively, for the year ended December 31, 2019. The SR 99-related99-related charge principally impactedreduced revenue and income from construction operations in the Civil segment. For additional information on the goodwill impairment charge, refer to the Second Quarter of 2019 Goodwill Impairment discussion in Note 6 of the Notes to Consolidated Financial Statements. For additional information on the SR 99-related charge, refer to the Alaskan Way Viaduct Matter discussion in Note 8 of the Notes to Consolidated Financial Statements.for 2019 was 15.4% comparedin 2020 primarily reflects one-time tax benefits related to 26.3% for 2018. During 2019, the Company recognized an income tax benefit of $65.6 million as a resultprovisions of the pre-tax loss primarily related to the goodwill impairmentCoronavirus Aid, Relief, and SR 99 charges mentioned above. The goodwill impairment charge was not fully deductibleEconomic Security Act (the “CARES Act”). See Corporate, Tax and Other Matters below for income taxes, which significantly reduced the tax benefit and effective tax rate for the year. For a further discussion of the effect ofchanges in the goodwill impairment charge, see Note 5 of the Notes to Consolidated Financial Statements.effective tax rate.lossearnings per share for 20192021 was $7.72$1.79 compared to diluted earnings per share of $1.66$2.12 for 2018.2020. The substantially reduced earningsdecrease in 2019 were primarily attributable2021 was principally due to the above-mentioned goodwill impairment ($6.58 per diluted share) and SR 99-related ($2.38 per diluted share) charges.20192021 were $6.4$4.5 billion compared to $6.5$2.4 billion in 2018.2020. The Civilincrease in new awards in 2021 was primarily due to the impacts of the COVID-19 pandemic in 2020, which delayed certain customers from moving forward with planned project bid solicitations and contract awards until 2021 and beyond, due to budgetary impacts, funding uncertainties and customer staffing challenges. The Building and Civil segments were the predominantprimary contributors ofto the new award activity in 2021. Significant new awards during 2019included the Cedars-Sinai Marina del Rey Hospital in California (contract value was not publicly announced); the $471 million LAX Airport Metro Connector project; $434 million for various Civil segment projects in the Midwest; more than $385 million of additional funding for certain mass-transit projects in California; the $269 million Yountville Veterans Home in California; the $220 million I-70 Missouri River Bridge project; the $162 million Tinian International Airport aircraft parking apron and 2018.20192021 was $11.2$8.2 billion, essentially level compared to $9.3$8.3 billion as of December 31, 2018. The Company experienced backlog growth2020. Backlog for both 2020 and 2021 was negatively impacted by the COVID-19 pandemic due to reduced bidding and proposal activity. In addition, the Company’s lack of 21%success in 2019, driven by variousits pursuit of certain large awardsprospective Civil segment projects in the Civil and Building segments.second half of 2021 also negatively impacted backlog. As of December 31, 2019,2021, the mix of backlog by segment was 54%55% for Civil, 25%28% for Building and 21%17% for Specialty Contractors.$5$4 billion, or 44%46%, of our backlog as of December 31, 20192021 will be recognized as revenue in 2020.2022. As a result of the changes in the backlog mix and the rate of conversion from backlog to revenue discussed above, we anticipate that in 2022 the Building segment will contribute proportionately higher revenue at a lower operating margin relative to contributions from the Civil and Specialty Contractors segments.2019:2021:(in millions) Backlog at December 31, 2020 Civil $ 4,783.6 $ 1,865.7 $ (2,095.8) $ 4,553.5 Building 1,702.3 2,034.7 (1,428.1) 2,308.9 Specialty Contractors 1,859.8 631.3 (1,117.9) 1,373.2 Total $ 8,345.7 $ 4,531.7 $ (4,641.8) $ 8,235.6 _____________________________________________________________________________________________________________ will proceed (e.g., adequate funding is in place).particularly inbut the Civilimpact of the COVID-19 pandemic could continue to adversely affect performance and Specialty Contractors segments, althoughoperations, and the paceamount and timing of new work awarded. In addition, the Company’s growth could continue to be impacted by future project delays or the timing of project commencements, ramp-up activities and completions. We anticipate that we will continue to win our share of significant new awards resulting from long-term capital spending plans by state, local and federal customers, as well as bipartisan support for infrastructure investments and limited competition for some of the largest project opportunities.recentelections over the past several years, voters in numerous states approved dozens of long-term transportation funding measures totaling approximately $200 billion in long-term funding. The largest of these werewas in Los Angeles County, where Measure M, a half-cent sales tax increase, was approved and is expected to generate $120 billion of funding over 40 years, and in Seattle, Washington, where Sound Transit 3 was passed and is expected to generate $54 billion of funding over 25 years. Recently, there has been renewed interest at the federal government level in passing budgetary measures that would provide significant long-term funding for infrastructure investments. In addition, several large, long-duration civil infrastructure programs withCalifornia's Senate Bill 1, which we are already involved are progressing, such as the Purple Line Extension projectswas signed into law in Los Angeles. Finally, interest2017, is providing an average of $5.4 billion annually through 2027 for various transportation, mass-transit and bridge projects. Interest rates remain relativelyhave remained near historically low andlevels, which may be conducive to continued, customer spending.Non-GAAP Financial MeasuresTo supplement our consolidated financial statements presented under generally accepted accounting principles in the United States (“GAAP”), we are presenting certain non-GAAP financial measures. We are providing these non-GAAP financial measures to disclose additional information to facilitate the comparison of past and present operations, and they are among the indicators management uses as a basis for evaluating the Company’s financial performance as well as for forecasting future periods. We believe that these non-GAAP financial measures, when considered together with our GAAP financial results, provide management and investors with an additional understanding of our business operating results, including underlying trends.These non-GAAP financial measures, which exclude the non-cash goodwill impairment charge (as well as the tax benefit associated with this charge), include adjusted income (loss) from construction operations, adjusted net income (loss) attributable to Tutor Perini Corporation, adjusted diluted earnings (loss) per common share and adjusted effective income tax rate. We also reference adjusted operating margin for each segment, which is a non-GAAP financial measure that we define as adjusted income (loss) from construction operations as a percentage of revenue. These non-GAAP financial measures are not intended to replace the presentation of our financial results in accordance with GAAP, and they may not be comparable to other similarly titled non-GAAP financial measures presented by other companies. Reconciliations of these non-GAAP financial measures to the most nearly comparable GAAP financial measures are presented below. For the year ended December 31, 2018, there are no non-GAAP financial measures presented or included in the reconciliation tables below because the non-GAAP financial measures, as defined by the Company, do not differ from GAAP results in those periods, as the only adjustment occurred in 2019.income (loss) from construction operations and adjusted income from construction operations for the Civil segment are summarized as follows:Year Ended December 31, (in millions) 2021 2020 Revenue $ 2,095.8 $ 2,199.9 Income from construction operations 266.2 245.8 2019 increased 12%2021 decreased 5% compared to 2018.2020. The growthdecrease was principally driven by increasedprimarily due to reduced project execution activities on certain mass-transitvarious completed or nearly completed projects in the Northeast, partially offset by increased activities on various projects in California and Minnesota that are earlyGuam. Revenue for both 2020 and 2021 was reduced by the aforementioned COVID-19 impacts.their project life cycles, as well as increased activities on the Newark Airport Terminal One project.2021. The growthincrease was partially offset by the revenue reduction associated with the adverse SR 99 jury verdict discusseda $13.3 million negative impact due to changes in estimates on a transportation project in the section entitled Executive Overview.Income (loss)Northeast that included a charge and the temporary negative impact to earnings from construction operations decreased significantlygrowth in 2019unapproved change orders.2018, mainly due to the goodwill impairment charge. Despite the strong revenue growth, adjusted income from construction operations11.2% in 2020. The increase in operating margin for 2019 decreased 65% compared to 2018,2021 was primarily due to the impact of the SR 99-related charge ($155.8 million of the $166.8 million impacted the Civil segment), partially offset by the $37.8 million reduction in general and administrative expenses associated with the remeasurement gain that resulted from the Company increasing its ownership interest in a joint venture (see Note 13 of the Notes to Consolidated Financial Statements) and income contributions related to the volume increase mentioned above.Operating margin was (8.5)% and adjusted operating margin was 3.3% for 2019 compared to 10.6% in 2018. The reduction in operating margin for 2019 was driven by the goodwill impairment and SR 99 charges mentioned above. The decrease in adjusted operating margin for 2019 was principally due to the factors mentioneddiscussed above that drove the changes to revenue and adjustedincrease in income from construction operations.$2.7$1.9 billion in 20192021 compared to $2.6 billion$946 million in 2018.2020. As discussed earlier, the larger volume of new awards in 2021 was primarily due to the impacts of the COVID-19 pandemic, which delayed the bidding and awards for various projects until 2021 and beyond. In spite of the improvement in new award activity in 2021, the level of new awards was negatively impacted by the Company’s lack of success in its pursuit of certain large Civil segment projects in the second half of 2021. New awards in 20192021 included $434 million for various Civil segment projects in the $1.4 billion Purple Line Section 3 Stations project and the $432Midwest; more than $385 million Division 20 Portal Widening and Turnback Facility project, bothof additional funding for certain mass-transit projects in California; the $253$220 million Culver Line Communications-Based Train ControlI-70 Missouri River Bridge project; the $162 million Tinian International Airport aircraft parking apron and taxiway project in New York; and a $178 million military facilities projectthe Northern Mariana Islands; and a $122 million wastewater treatmentmilitary range project and a $98 million military housing project, both in Guam.20182020 included more than $732 million of additional funding for various mass-transit projects, the $800Company’s $121 million Minneapolis Southwest Light Rail Transit project in Minnesota; the Civil segment’s 50% share of the $1.4 billion Newark Airport Terminal One project, net of subcontracts awarded to Five Star Electric and WDF in the Specialty Contractors segment (with the remaining 50% share of the project booked in the Building segment’s backlog); a $410 millionjoint-venture mass-transit project in California;Massachusetts, and a $121$64 million water tunnelmining project in California; a $93 million bridge project in New York; and an $82 million aircraft maintenance facility and hangar project in Guam.$6.0$4.6 billion as of December 31, 2019, an increase2021, a modest decrease of 17%5% compared to $5.1$4.8 billion as of December 31, 2018. The strong backlog growth was driven by the significant new award activity discussed above.2020. The segment continues to experience strong demand reflected in a large, multi-year pipeline of prospective projects, that are supported by substantial anticipated funding from various voter-approved transportation measures and the IIJA, and by public agencies’ long-term spending plans. The Civil segment is well-positioned to continue capturingcapture its share of these prospective projects.income from construction operations and adjusted income from construction operations for the Building segment are summarized as follows:Year Ended December 31, (in millions) 2021 2020 Revenue $ 1,428.1 $ 1,984.6 Income from construction operations 28.7 53.2 20192021 decreased 6%28% compared to 20182020, primarily due to a reduction inreduced project execution activities on health carecertain projects in California and hospitalityOklahoma that are completed or nearing completion. Revenue for both 2020 and gaming projects in various states. The decrease2021 was partially offsetreduced by increased activities on the Newark Airport Terminal One project and an industrial revitalization project in Mississippi.in 2019 compared to 2018, 2020, primarily due to the goodwill impairment charge recorded in 2019. Adjusted income from construction operations for 2019 decreased 15% compared to 2018 mainlyvolume reductions mentioned above, as well as a $13.3 million negative impact due to the absence of prior-yearchanges in estimates on a transportation project closeout adjustments, none of which were individually material, partially offset by increased project contributions from other projects, including Newark Airport Terminal One, in the current year.1.4% and adjusted2.0% in 2021 compared to 2.7% in 2020. The decrease in operating margin was 2.1% in 2019 compared to 2.4% in 2018. The reduction in operating margin for 2019 was driven by the aforementioned goodwill impairment charge recorded. The slight reduction in adjusted operating margin for 2019 was primarily driven by the factors mentioned above that drove the changes inlower revenue and adjusted income from construction operations.$2.2$2.0 billion in 20192021 compared to $2.5 billion$897 million in 2018.2020. The substantially increased level of new awards in 2021 was due to delays of certain new awards in 2020 that resulted from impacts of the COVID-19 pandemic. New awards in 20192021 included the Choctaw CasinoCedars-Sinai Marina del Rey Hospital in California (contract value was not publicly announced); the $471 million LAX Airport Metro Connector project; the $269 million Yountville Veterans Home in California; and Resortthe $152 million Santa Rosa Courthouse project in Oklahoma; a large hospitality and gamingCalifornia. The COVID-19 pandemic could continue to result in certain delayed project in California; a $263 million courthouse project in Florida; a technology campus tenant improvement project in California valued at more than $200 million; and the $200 million Southland Gaming Casino and Hotel project in Arkansas.20182020 included the Building segment’s 50% share of the $1.4 billion Newark Airport Terminal One project, net of subcontracts awarded to Five Star Electric and WDF in the Specialty Contractors segment; $311approximately $615 million of additional funding for a technology project in California; a government officevarious building projectprojects in California valued at $215 million; a $100and $271 million military facility project in Saudi Arabia; an $88 million airport parking garage project in South Carolina; and incremental funding of $90 million and $82 million, respectively, for another technology office project and a health care project, both in California.$2.8 billion as of December 31, 2019, an increase of 20% compared to $2.3 billion as of December 31, 2018.2021, an increase of 36% compared to $1.7 billion as of December 31, 2020. The strong backlog growthincrease was driven by the heightened new award activity discussedmentioned above. The Building segment continues to have a large volume of prospective projects across various end markets and geographic locations. StrongWe expect demand to grow as economic conditions remain conducive to increased customer spending on new building facilities and renovations to existing buildings, supported by what has been and is expected to continue due to ongoing customer spending supported byremain a favorable, economic environment andrelatively low interest rate environment despite the prospect of higher interest rates that have persisted.income (loss) from construction operations and adjusted income (loss) from construction operations for the Specialty Contractors segment are summarized as follows:Year Ended December 31, (in millions) 2021 2020 Revenue $ 1,118.0 $ 1,134.2 Income (loss) from construction operations (10.0) 17.2 2019 decreased 8%2021 declined slightly compared to 20182020. Revenue for 2020 and 2021 was reduced by the aforementioned COVID-19 impacts.reducednegative impacts of $19.0 million and $17.6 million on the mechanical and electrical components, respectively, of a transportation project execution activitiesin the Northeast and $16.2 million on certain completedan electrical and mechanical projectsmass-transit project also in California, Washington and New York.the Northeast, all of which were due to changes in estimates that included charges and/or the temporary negative impact to earnings from growth in unapproved change orders. The decrease was partially offset by increased activitya $20.1 million favorable adjustment related to a legal judgment on a completed electrical project in New York, as well as the absence of the following largely offsetting items that had a net negative impact on the Company’s results in 2020: a $25.7 million prior-year gain as a result of a favorable arbitration decision and subsequent settlement of the related employment dispute, a $15.2 million prior-year unfavorable legal ruling pertaining to a mechanical project in New YorkCalifornia and a $13.2 million prior-year impact from an adverse arbitration ruling related to another electrical project in California.Income (loss) from construction operations decreased substantially in 2019 compared to 2018, mainly due to the goodwill impairment charge mentioned above. Adjusted income (loss) from construction operations for 2019 also decreased substantially due primarily tonet unfavorable adjustments totaling $41.5 million on certain electrical and mechanical projects in New York, none of which were individually material. The Specialty Contractors segment was also impacted by $11.0 million of the $166.8 million SR 99 charge in 2019.(18.6)(0.9)% and adjustedin 2021 compared to 1.5% in 2020. The decrease in operating margin was (1.8)% in 2019 comparedmainly attributable to 4.3% in 2018. The reduction in operating margin for 2019 was driven by the aforementioned goodwill impairment charge. The reduction in adjusted operating margin for 2019 was primarily driven by the factors mentioned above that drove the changes in revenue and adjustedlower income (loss) from construction operations.$1.5 billion$631 million in 20192021 compared to $1.4 billion$600 million in 2018.2020. New awards in 2019 included, among others, 2021 were mostly comprised of $370 million for various electrical and mechanical subcontracts valued at $216projects in the Northeast, and $260 million for the Purple Line Section 3 Stations projectvarious electrical and an electrical subcontract valued at $140 million for the Division 20 Portal Widening and Turnback Facility project, both in California; and three mechanical projects collectively valued at $192 millionin Florida, Texas and an electrical subcontract valued at $140 million for a mass-transit project, allCalifornia. The COVID-19 pandemic has resulted in, New York.and could continue to result in, reduced demand from certain commercial and government customers that have been experiencing funding constraints.20182020 included $364$286 million offor various electrical projects in Texas, California and mechanical subcontracts for the Newark Airport Terminal One project; $294Florida, and $158 million for various electrical projects in New York; $248 million for various electrical projects in the southern United States and California; and $243 million for two large mechanical projects in New York.$2.4$1.4 billion as of December 31, 2019, an increase2021, a decrease of 31%26% compared to $1.8$1.9 billion as of December 31, 2018.2020. The robustdecrease corresponds with the reduction in Civil segment backlog, growth was driven by strongas certain large Civil segment projects that were not awarded to the Company would have included substantial amounts of subcontract work for the Specialty Contractors segment. The decrease is also due to lower demand from certain customers, particularly in New York, that have experienced adverse budgetary impacts as evidenced by publica result of the COVID-19 pandemic and private customer spending on numerous civil and building projects.that have consequently delayed and/or reduced certain spending. The Specialty Contractors segment continues to be increasingly focused on servicing the Company’s growing backlog of large Civil and Building segment projects, but it also remains well-positioned to capture its share of new projects for external customers, leveraging the size and scale of our business units that operate in New York, Texas, Florida and California and the strong reputation held by these business units for high-quality work on large, complex projects.$65.5$58.0 million in 20192021 compared to $63.8$53.9 million in 2018.Net,(Expense), Interest Expense and Income Tax Benefit (Expense)Year Ended December 31, (in millions) 2021 2020 Other income (expense) Other income (expense) $ 2.0 $ (11.9) Interest expense (69.0) (76.2) Income tax expense Income tax expense (25.6) (21.9) Othernet, increased $2.4for 2021 was $2.0 million in 2019 compared to 2018,net other expense of $11.9 million for 2020. The improvement in 2021 was primarily due to a net gain on the saleabsence of property and equipmentcharges incurred in 2019.increased $4.0decreased $7.2 million in 20192021 compared to 2018, principally2020. The decrease in 2021 was primarily due to the absence of extinguishment costs recognized in 2020 related to debt refinancing.higher average balance on our linefederal claim of right tax credit,.was 15.4% comparednet operating loss (“NOL”) carryback. Under the CARES Act, enacted on March 27, 2020, the NOL generated in 2019 may be carried back up to 26.3% for 2018. During 2019,five years, whereas under previous rules NOLs were only allowed to be carried forward. This allowed the Company recognized a taxto realize the benefit of $65.6 million onthe tax rate differential by carrying back the NOL to tax years when the federal statutory tax rate was 35% rather than the current rate of 21%. For a loss beforefurther discussion of income taxes, of $425.8 million. As a resultrefer to Note 5 of the $379.9 million goodwill impairment charge discussed above, the Company recognized a tax benefit totaling $49.4 million. Approximately $209.5 million of the charge is not deductible for income tax purposes, which significantly reduced the tax benefit andNotes to Consolidated Financial Statements.raterates for the year. The adjusted effective2021 and 2020 were unfavorably impacted by state income tax rate for 2019, which excludes the tax benefit from the goodwill impairment chargetaxes and which is a non-GAAP financial measure, was 35.3%. The adjusted effective income tax rate for 2019 was higher than the U.S. federal statutory rate primarily due tofavorably impacted by earnings attributable to noncontrolling interests, for which income taxes are not the responsibility of the Company, which increased the effective rate due to the pre-tax loss for the period, U.S. federal research and development tax credits, and state income taxes, partially offset by foreign tax impacts. The 2018 effective tax rate was higher than the U.S. federal rate primarily due to state income taxes.$350$175 million, with sublimits for the issuance of letters of credit and swing line loans up to the aggregate amounts of $75.0 million and $10.0 million, respectively, which may be used for revolving loans, letters of credit and/or general purposes. We believe that cash generated from operations, along with our unused credit capacity of $236$148 million and available2019,2021, will be sufficient to fund any working capital needs and debt maturities for the next 12 months.months and beyond, provided that we are not adversely impacted by unanticipated future events, including further impacts related to the COVID-19 pandemic as discussed above in COVID-19 Update. Liquidity has been, and could continue to be, adversely impacted by our inability to collect cash due to the follow-on impacts ofsection entitled Debt below,COVID-19 pandemic has delayed court and arbitration schedules and also hindered the Company’s ability to resolve unapproved work, which has largely contributed to an increase in CIE. We believe that the follow-on impacts of COVID-19 could be alleviated with the anticipated funding from the IIJA, as discussed above, and the relief of customers’ revenue and funding constraints as travel and commuting continue to resume, providing higher fare, toll and fuel tax revenue. Furthermore, the bottleneck of accumulated court and arbitration proceedings that grew during 2020 and 2021 due to the pandemic has recently begun to alleviate, although the timing of resolution and collection of amounts due to the Company intendsrelated to modify or replacesuch matters remains uncertain. We anticipate substantially improved operating cash generation in 2022 compared to 2021, as a result of projected cash collections, both from project execution activities and the 2017 Credit Facility and/or repurchase or exchange the Convertible Notes in 2020.resolution of various outstanding claims and change orders.$193.7$202.2 million as of December 31, 20192021 compared to $116.1$374.3 million as of December 31, 2018.2020. Cash immediately available for general corporate purposes was $43.8$60.2 million and $51.7$210.8 million as of December 31, 20192021 and 2018,2020, respectively, with the remainder being amounts held by our consolidated joint ventures and also our proportionate share of cash held by our unconsolidated joint ventures. Cash held by our joint ventures was available only for joint venture-related uses, including distributions to joint venture partners. In addition, our restricted cash and restricted investments held primarily to secure insurance-related contingent obligations, totaled $79.4$93.6 million as of December 31, 20192021 compared to $61.9$156.5 million as of December 31, 2018.2019,2021, net cash used in operating activities was $148.5 million due primarily to investments in project working capital, partially offset by cash generated from earnings sources. The increase in working capital in 2021 primarily reflects a decrease in accounts payable due to timing of payments to suppliers and subcontractors and an increase in CIE. The increase in CIE was primarily due to the follow-on impacts of the COVID-19 pandemic, which has caused delays in the negotiation and resolution of certain claims and unapproved change orders (due to the postponement or deferrals of certain legal and arbitration proceedings and settlement discussions, which have recently begun to resume), and constrained customers’ revenue and funding sources, thereby limiting their budgetary discretion to pay the Company for changes approved in scope but for which pricing is pending. As discussed above, we expect the follow-on impacts of COVID-19 to ease as a result of anticipated funding from the IIJA and improved customer revenue and funding sources. During the year ended December 31, 2020, net cash provided by operating activities was $136.5 million (with $248.0 million provided in the second half of 2019), due primarily to changes in net investment in working capital and cash generated from income sources. The change in working capital primarily reflects an increase in billings in excess of costs and estimated earnings (“BIE”), partially offset by increases in accounts receivable and retainage receivable. During the year ended December 31, 2018, net cash provided by operating activities was $21.4$172.8 million due primarily to cash generated from incomeearnings sources, mostlypartially offset by changes in net investment in working capital.change in working capital primarily reflected an increase in costs and estimated earnings in excess of billings (“CIE”), which was partially offset by an increase in BIE.The $115.1$321.3 million increasedecrease in cash provided by operating activities when comparing 20192021 with 2018 primarily2020 substantially reflects an increased investment in working capital principally as a current yearresult of a current-year decrease in CIEaccounts payable compared to an increase in the prior year due to timing of payments to vendors and subcontractors, partially offset by a larger increasecurrent-year decrease in BIE in the current year andretainage receivable compared to an increase in accounts payable compared to a decrease in the prior year. These current year improvements were partially offset by increases in retainage receivableaccounts receivable in 2019 compared to decreases in 2018.During 2019 and 2018,2020, we used $76.1$37.3 million and $70.2$46.4 million of cash from investing activities, respectively. The net cash used in investing activities in 2019for 2021 and 2020 was primarily due to $84.2 million of expenditures for the acquisition of property and equipment.equipment for projects, which totaled $38.6 million and $54.8 million, respectively. The majority of ourdecrease in capital expenditures in 2021 was forprimarily due to higher capital expenditures in 2020 related to project-specific equipment purchased by our joint ventures and funded directly by our customers. The cash used in investing activities in 2018 was primarily due to $77.1 million of expenditures for the acquisition of property and equipment.During 2019, we generated $21.8 million of cash from financing activities principally due to increased net borrowings of $61.3 million and contributions from noncontrolling interests of $9.8 million, partially offset by distributions to noncontrolling interests of $46.5 million. Net cash used in financing activities for 2018 was $29.0$54.7 million, which was primarily due todriven by net repayment of borrowings of $37.0 million and $22.7 million of cash distributions to noncontrolling interests, of $29.0 million and an earn-out payment related to a 2011 acquisition of $16.0 million, partially offset by $7.0 million of cash contributions from noncontrolling interests. During 2020, net cash provided by financing activities was $123.3 million, which was primarily driven by increased net borrowings of $14.8$181.4 million, partially offset by $48.5 million of cash distributions to noncontrolling interests and debt issuance costs of $11.2 million.2019,2021, we had working capital of $1.4$2.1 billion, a ratio of current assets to current liabilities of 1.662.17 and a ratio of debt to equity of 0.580.59 compared to working capital of $1.6$1.8 billion, a ratio of current assets to current liabilities of 1.991.80 and a ratio of debt to equity of 0.430.66 at December 31, 2018.2020.2019.2021. For additional information, refer to Note 7 of the Notes to Consolidated Financial Statements, as applicable.2017FacilityApril 20, 2017,August 18, 2020, the Company entered into the 2017a credit agreement (the “2020 Credit FacilityAgreement”) with SunTrustBMO Harris Bank now known as Truist Bank,N.A., as Administrative Agent, Swing Line Lender and L/C Issuer and a syndicate of other lenders. The 20172020 Credit FacilityAgreement provides for a $350$425.0 million term loan B facility (the “Term Loan B”) and a $175.0 million revolving credit facility (the “2017“2020 Revolver”) and a sublimit, with sublimits for the issuance of letters of credit and swinglineswing line loans up to the aggregate amountamounts of $150$75.0 million and $10$10.0 million, respectively, both maturingrespectively. The Term Loan B will mature on April 20, 2022August 18, 2027 and the 2020 Revolver will mature on August 18, 2025, in each case, unless any of the Convertible2017 Senior Notes are outstanding on December 17, 2020, in which case all such borrowings will mature on December 17, 2020, provided that (i) if the Convertible Notes are refinanced in full with the proceeds of permitted refinancing indebtedness in accordance with the terms of the 2017 Credit Facility, the maturity date for the 2017 Credit Facility will remain April 20, 2022 and (ii) if the Company issues “New Convertible Notes” (as defined in the 2017 Credit Facility), the maturity date for the 2017 Credit Facility will be the earlier of (x) April 20, 2022 or December 17, 2020 if Convertible Notes are outstanding on December 17, 2020 and (y) 90January 30, 2025 (which is 91 days prior to the maturity date for such New Convertible Notes. In addition, the 2017 Credit Facility permits additional borrowings in an aggregate amount of $150 million, which can be in the form of increased capacity on the 2017 Revolver or the establishment of one or more term loans. On May 7, 2019, certain provisions of the 2017 Credit Facility were amended, including settingSenior Notes), in which case, both the maximum leverage ratio at 3.50:1.00forTerm Loan B and the remainder of its term, thus eliminating the step down from 3.50:1.002020 Revolver will mature on January 30, 2025 (subject to 3.25:1.00.certain further exceptions). For additionalmore information regarding the terms of our 20172020 Credit Facility,Agreement, refer to Note 7 of the Notes to Consolidated Financial Statements.consolidated fixed charge coverage ratio and consolidatedfirst lien net leverage ratio under the 20172020 Credit FacilityAgreement for the period, which areis calculated on a rolling four-quarter basis:Twelve Months Ended December 31, 20192021Fixed charge coverageFirst lien net leverage ratio3.571.23 to 1.00> or = 1.25 : 1.00Leverage ratio2.60 to 1.003.502.75 : 1.002019,2021, we were in compliance and expect to continue to be in compliance with the covenants under the 20172020 Credit Facility.AsAgreement.resultprivate placement offering. On August 19, 2020, the Company used proceeds from the Term Loan B to repurchase $130.1 million aggregate principal amount of the aforementioned provision in the 2017 Credit Facility whereby the maturity date of the 2017 Credit Facility may be moved forward from April 20, 2022, the facility will mature on December 17, 2020 if the Convertible Notes remain outstanding at that time (the “spring-forward” provision)for an aggregate purchase price of $132.4 million (including accrued and unpaid interest to the repurchase date). WhileThe Company repaid the Company does not have call rights that allow it to unilaterally redeemremaining principal balance of the Convertible Notes it intends to repurchase or exchangeat maturity on June 15, 2021 using proceeds from the Term Loan B, which were held in a restricted cash account for this purpose. None of the Convertible Notes and/or modify or replace the 2017 Credit Facility during 2020. Various alternatives are under consideration to determine the financing arrangement that is best suited to the Company’s needs and provides the most favorable terms. The Company is currently in discussions with lenders regarding its options. Due to the spring-forward provision in the 2017 Credit Facility, all borrowings under the facility are included in “Current maturities of long-term debt” on the Consolidated Balance Sheetremained outstanding as of December 31, 2019.wethe Company issued $500 million in aggregate principal amount of 6.875% Senior Notes due May 1, 2025 (the “2017 Senior Notes”) in a private placement offering. Interest on the 2017 Senior Notes is payable in arrears semi-annually in May and November of each year, beginning in November 2017.Convertible NotesOn June 15, 2016, the Company issued $200 million of our Convertible Notes in a private placement offering. The Convertible Notes are unsecured obligations of the Company and do not contain any financial covenants or restrictions on the payments of dividends, the incurrence of indebtedness or the issuance or repurchase of securities by the Company. The Convertible Notes bear interest at a rate of 2.875% per year, payable in cash semi-annually in June and December. Upon conversion, and at the Company’s election, the Company may satisfy its conversion obligation with cash, shares of its common stock or a combination thereof. As of December 31, 2019, the conversion provisions of our Convertible Notes have not been triggered.$27.7$41.7 million and $38.6$36.9 million at December 31, 20192021 and 2018,2020, respectively, with interest rates ranging from 2.62%2.54% to 3.89% with equal monthly installment payments over periods up to ten years with additional balloon payments of $12.4 million in 2021 and $6.3 million in 2022 on the remaining loans outstanding at December 31, 2019.five years. The aggregate balance of mortgage loans was approximately $11.5$14.6 million and $12.3$10.7 million at December 31, 20192021 and 2018,2020, respectively, with interest rates ranging from a fixed 3.50%2.25% to LIBOR plus 3% and equal monthly installment payments over periods up to ten10 years, as well as one loan with additionala balloon paymentspayment of $2.9$6.8 million in 2021 and $7.0 milliondue in 2023. outstanding contractual obligations and commitments as of December 31, 2019 are summarized in the following table:_____________________________________________________________________________________________________________(a)•Debt obligations of $1.0 billion (of which $24.4 million are due in 2022) and interest on debt exclude unamortized debt discount and deferred debt issuance costs. Amounts for interest on debtpayments of $259.5 million (of which $62.1 million are due in 2022) based on interest rates in effect as of December 31, 2019.(b)The Company utilizes current actuarial assumptions in determining the expected minimum contributions to fund our defined benefit pension and other post-retirement plans. Estimated contributions for periods beyond the scope2021. See Note 7 of the actuarial assumptions have not been included because,Notes to Consolidated Financial Statements for further detail of our debt and the timing of expected future principal and interest payments.management’s judgment, such estimates may not be reliable.2022). See Note 9 of the Notes to Consolidated Financial Statements for further detail of our lease obligations and the timing of expected future payments.Off-Balance Sheet ArrangementsNone.PoliciesEffective January 1, 2018, the Company adopted Accounting Standards Codification (“ASC”) 606, Revenue from Contracts with Customers (“ASC 606”). See Note 1(d), Note 3 and Note 4 of the Notes to Consolidated Financial Statements for more information. Significant judgments and estimates used in the preparation of the Consolidated Financial Statements apply to the following critical accounting policies:606.606”). Assumptions as to the occurrence of future events and the likelihood and amount of variable consideration are made during the contract performance period. Estimates of variable consideration and determination of whether to include estimated amounts in the transaction price are based largely on an assessment of anticipated performance and all information (historical, current and forecasted) that is reasonably available to management. Estimated amounts are only included in the transaction price to the extent it is probable that a significant reversal of cumulative revenue recognized will not occur when the uncertainty associated with the variable consideration is resolved. Back charges to suppliers or subcontractors are recognized as a reduction of cost when it is determined that recovery of such cost is probable and the amounts can be reliably estimated. Disputed back charges are recognized when the same requirements described above for variable consideration have been satisfied.have beenare eliminated. See Note 1(b) and Note 1413 of the Notes to Consolidated Financial Statements for additional discussion regarding VIEs.capital (“WACC”).capital. Changes in these assumptions would impact the results of our impairment tests.2019,2021, we conducted our annual goodwill impairment test and determined that goodwill was not impaired since the estimated fair value of the Civil reporting unit exceeded its net book value but not by a significant amount. As such, there is a risk of goodwill impairment if future events are less favorable than what we assumed or estimated in our impairment analysis.The Company has continued to observe significant opportunities in a robust marketplace which have led to sizable new awards and significant growth in backlog for the Civil reporting unit. In considering the totality of qualitative factors known as of the reporting date, we determined thatthe date of our October 1, 2021 annual test that would more likely than not reduce the fair value of the Civil reporting unit below its carrying amount. We will continue to monitor events occurring or circumstances changing which may suggest that goodwill should be reevaluated. These events and circumstances include, but are not limited to, changes in the overall financial performance of the Civil reporting unit, impacts to our business as a sustained decline in our stock price and market capitalization,result of the COVID-19 pandemic, as well as other quantitative and qualitative factors specific to the Civil reporting unit which indicate potential triggering events that would more likely than not reduce the fair value of the Civil reporting unit below its carrying amount.11(p) of the Notes to Consolidated Financial Statements.QUANTITATIVEQUANTITATIVE AND QUALITATIVE DISCLOSURES ABOUT MARKET RISK20172020 Credit FacilityAgreement and certain other debt obligations have variable interest rates subject to interest rate risk. See Note 7 of the Notes to Consolidated Financial Statements for further20172020 Credit Facility.Agreement. We had approximately $121.9$453.9 million and $49.1$431.5 million of net borrowings with variable interest rates as of December 31, 20192021 and 2018.2020, respectively. If short-term floating interest rates on these borrowings were to change by 0.50% and our variable indebtedness were to remain unchanged, interest expense would increase or decrease by approximately $610,000$2.3 million for the next twelve months.FINANCIALFINANCIAL STATEMENTS AND SUPPLEMENTARY DATACHANGESCHANGES IN AND DISAGREEMENTS WITH ACCOUNTANTS ON ACCOUNTING AND FINANCIAL DISCLOSURENone.
CONTROLSCONTROLS AND PROCEDURES20192021 was made under the supervision and with the participation of our management, including our Chief Executive Officer and Chief Financial Officer. Based upon that evaluation, the Chief Executive Officer and Chief Financial Officer concluded that, as of December 31, 2019,2021, our disclosure controls and procedures were effective, in that they provide reasonable assurance that information required to be disclosed in our reports filed or submitted under the Exchange Act were recorded, processed, summarized and reported within the time periods specified in the SEC’s rules. Our disclosure controls and procedures are designed to ensure that information we are required to disclose in such reports is accumulated and communicated to management, including our Chief Executive Officer and Chief Financial Officer, as appropriate, to allow timely decisions regarding required disclosures.issued issued by the Committee of Sponsoring Organizations of the Treadway Commission.Based on this assessment, management concluded that, as of December 31, 2019,2021, our internal control over financial reporting was effective based on those criteria.2019.20192021 that have materially affected, or are reasonably likely to materially affect, our internal control over financial reporting.2019,2021, based on criteria established in Internal Control — Integrated Framework (2013) issued by the Committee of Sponsoring Organizations of the Treadway Commission (COSO). In our opinion, the Company maintained, in all material respects, effective internal control over financial reporting as of December 31, 2019,2021, based on criteria established in Internal Control — Integrated Framework (2013) issued by COSO.2019,2021, of the Company and our report dated February 26, 2020,24, 2022, expressed an unqualified opinion on those financial statements.CA26, 2020OTHEROTHER INFORMATIONPARTDIRECTORS,DIRECTORS, EXECUTIVE OFFICERS AND CORPORATE GOVERNANCE2019.corporate-governance/corporate-governance/overview/default.aspx. We intend to disclose future amendments to certain provisions of the Code of Business Conduct and Ethics, and waivers of the Code of Business Conduct and Ethics granted to executive officers and directors, on the website within four business days following the date of the amendment or waiver.EXECUTIVEEXECUTIVE COMPENSATION2019.SECURITYSECURITY OWNERSHIP OF CERTAIN BENEFICIAL OWNERS AND MANAGEMENT AND RELATED STOCKHOLDER MATTERSThe(a) (b) (c) Plan category Number of securities to be issued upon exercise of outstanding options, warrants and rights Weighted-average
exercise price
of outstanding
options, warrants and rightsNumber of securities remaining available for future issuance under equity compensation plans (excluding securities reflected in column (a)) Equity compensation plans approved by security holders 3,356,616 $ 20.11 1,243,070 Equity compensation plans not approved by security holders — — — Total 3,356,616 $ 20.11 1,243,070 2019.CERTAINCERTAIN RELATIONSHIPS AND RELATED TRANSACTIONS, AND DIRECTOR INDEPENDENCE2019.PRINCIPAL ACCOUNTINGPRINCIPAL ACCOUNTANT FEES AND SERVICES2019.2021.EXHIBITSEXHIBITS AND FINANCIAL STATEMENT SCHEDULESconsolidated financial statementsConsolidated Financial Statements as of December 31, 20192021 and 20182020 and for each of the three years in the period ended December 31, 20192021 and the Notes thereto, together with the reportReport of the independent registered public accounting firmIndependent Registered Public Accounting Firm (PCAOB ID No. 34) on those consolidated financial statementsConsolidated Financial Statements are hereby filed as part of this Annual Report on Form 10-K, beginning on page F-1.3.23.33.43.53.24.64.74.64.84.710.110.1**10.210.2**10.310.3**10.410.4**10.510.5**10.6* 10.7* 10.610.8**10.710.9*10.10 10.810.1110.12 10.9*10.13 10.14 10.15 10.16 10.17 10.18 10.19 10.20* 10.1010.21**10.1110.22*10.12*10.13*10.14*10.15*10.1610.23*10.17*10.1810.24*10.1910.25*10.2010.26*10.28 Exhibit 21 2019,2021, formatted in Inline XBRL (included as Exhibit 101)._________________________________________________________________________________________ required to be filed as an exhibit pursuant to Item 15(a)(3) of Form 10-KSUMMARYSIGNATURESCompanyregistrant has duly caused this report to be signed on its behalf by the undersigned, thereunto duly authorized.Dated:Date: February 26, 202024, 2022Companyregistrant and in the capacities and on the dates indicated.=Principal Executive Officer and Director26, 202024, 2022=Principal Financial Officer26, 202024, 2022=Principal Accounting Officer26, 202024, 2022= Other Directors) Sidney J. Feltenstein James A. Frost)26, 202024, 2022PagePage Consolidated Financial Statements of the Registrant F-2F-2F-5F-4F-6F-5F-7F-6F-8F-7F-9F-8F-10F-9"Company"“Company”) as of December 31, 20192021 and 2018,2020, the related consolidated statements of operations, comprehensive income (loss), changes in equity, and cash flows, for each of the three years in the period ended December 31, 2019,2021, and the related notes (collectively referred to as the "financial statements"“financial statements”). In our opinion, the financial statements present fairly, in all material respects, the financial position of the Company as of December 31, 20192021 and 2018,2020, and the results of its operations and its cash flows for each of the three years in the period ended December 31, 2019,2021, in conformity with accounting principles generally accepted in the United States of America.2019,2021, based on criteria established in Internal Control — Integrated Framework (2013) issued by the Committee of Sponsoring Organizations of the Treadway Commission and our report dated February 26, 2020,24, 2022, expressed an unqualified opinion on the Company's internal control over financial reporting.Mattersmattersmatter communicated below are mattersis a matter arising from the current-period audit of the financial statements that werewas communicated or required to be communicated to the audit committee and that (1) relaterelates to accounts or disclosures that are material to the financial statements and (2) involved our especially challenging, subjective, or complex judgments. The communication of critical audit matters does not alter in any way our opinion on the financial statements, taken as a whole, and we are not, by communicating the critical audit mattersmatter below, providing a separate opinionsopinion on the critical audit mattersmatter or on the accounts or disclosures to which they relate.Contracts–Contracts – Refer to Notes 1, 3, 4, and 8 to the consolidated financial statements•We tested the effectiveness of controls over revenues, including those over the determination of estimated costs at completion of the contract, total estimated revenue (including the estimated percentage of completion), variable consideration (including significant change orders and claims), and back charges.•We selected a sample of construction contracts and performed the following:o◦Compared the total estimated revenue (transaction price), including estimated variable consideration, to the consideration expected to be received based on current rights and obligations under the contracts and any modifications that were agreed upon with the customers.o◦We evaluated the reasonableness of the estimated variable consideration by 1) evaluating the information supporting management’s judgment as to the cause and contractual rights and 2) testing the accuracy of the identification of the underlying costs.o◦Tested the accuracy and completeness of costs incurred to date.o◦Evaluated the reasonableness of management’s estimates of total cost and profit at completion for selected contracts by:•Evaluating management’s ability to achieve the estimates of total cost and profit by performing corroborating inquiries with the Company’s project managers, and comparing the estimates to management’s work plans, engineering specifications, and supplier contracts.•Comparing management’s estimates to supporting documents for those estimates, when applicable.•Evaluating management’s ability to accurately estimate total costs and profits at completion by comparing actual costs and profits to management’s historical estimates for performance obligations that have been fulfilled.•Evaluating trends on changes in estimates and obtaining evidence on timing and amounts supporting these changes in estimates.o◦Tested the mathematical accuracy of management’s calculation of revenue recognized.•We evaluated selected quarter over quarter changes in contract profit estimates by obtaining explanations from the Company’s project managers regarding timing and amount and corroborating these inquiries by reading documents such as management work plans, customer communications, invoices and supplier communications.•Performed procedures on recorded back charges to evaluate the reasonableness of the estimated recovery by 1) evaluating the information supporting management’s judgment as to the cause and contractual rights and 2) testing the accuracy of the identification of the underlying costs.Goodwill – Refer to Notes 1 and 6 to the financial statementsCritical Audit Matter DescriptionThe Company’s evaluation of goodwill for impairment involves the comparison of the fair value of each reporting unit (which correspond to the Company’s operating segments) to its carrying value. The Company determines the fair value of its reporting units using the income approach and market approach valuation methodologies. The determination of fair value using the income-based approach requires management to make significant estimates and assumptions related to projected operating margins, cash flows generated from existing work and new awards, and projected investments in working capital (collectively, the “forecasted financial information”), as well as the discount rates and weighted-average cost of capital (“WACC”). The determination of fair value using the market-based approach requires management to make significant assumptions, including those related to the forecasted financial information referred to above and the industry-comparable multiples to be used for each of its reporting units. The Company determines the valuation of each reporting unit based upon a weighted-average value of the income approach and market approach valuation methods. As appropriate, the Company also assesses the reasonableness of the estimated fair value of the reporting units by comparing the sum of the reporting units’ fair values to the Company’s market capitalization and calculating an implied control premium (the excess of the aggregate fair values of the reporting units over the Company’s market capitalization). In evaluating the results there are various quantitative and qualitative factors that need to be considered and could involve subjective judgment. During the second quarter of 2019, the Company identified an interim impairment indicator in its goodwill balance. The Company performed an interim impairment test and determined that the fair value of each of the reporting units was below the carrying value, leading to a pre-tax impairment charge of $379.9 million and leaving a $205.1 million post-impairment goodwill balance solely attributable to the Civil reporting unit.We identified goodwill as a critical audit matter because small changes to valuation assumptions, specifically the forecasted financial information, discount rates, WACC, and industry-comparable multiples, could have a significant impact on the reporting unit concluded value for both the interim and annual impairment tests, and changes to the reporting unit concluded value impacts the implied control premium calculated from the reconciliation between the reporting unit’s fair values and the Company’s marketcapitalization, which was performed during the interim impairment test. Auditing these assumptions involved extensive audit effort, including the need to involve our fair value specialists, due to the complexity of these assumptions and a high degree of auditor judgment when performing audit procedures and evaluating the results of those procedures.How the Critical Audit Matter Was Addressed in the AuditOur audit procedures related to the forecasted financial information, discount rates, WACC, and industry-comparable multiples for the reporting units, for both the interim and the annual impairment tests, included the following, among others:We tested the effectiveness of controls within the goodwill impairment test process, including those over the forecasted financial information, the selection of the industry-comparable multiples, WACC, and discount rates, as well as the identification of interim impairment indicators.We evaluated management’s historical ability to accurately forecast by comparing actual results to management’s previous forecasted financial information for the same period.We evaluated the reasonableness of management’s forecasted financial information by comparing the forecasted financial information to (1) historical results, (2) internal communications to management and the Board of Directors, (3) reporting units’ backlog, and (4) forecasted financial information included in the Company’s press releases, as well as analyst and industry reports of the Company and companies in its peer group.We considered the impact of circumstances affecting the industry including, but not limited to, changes in the legal and business environment.With the assistance of our fair value specialists, we evaluated the WACC and discount rates, including testing the underlying source information and the mathematical accuracy of the calculations, and developing a range of independent estimates of the discount rates and comparing those to the WACC and discount rates selected by management.With the assistance of our fair value specialists, we evaluated the industry-comparable multiples, including testing the underlying source information and mathematical accuracy of the calculations, the acceptability of the selected companies within the Company’s peer group, and comparing the multiples selected by management to companies in the engineering and construction industry.With the assistance of our fair value specialists, we evaluated the reasonableness of the quantitative and qualitative factors considered in the reconciliation between the reporting units’ fair values and the Company’s market capitalization and implied control premium as of the interim impairment test date. We evaluated factors such as implied control premiums in other mergers and acquisition transactions in the industry, ownership of the Company’s common stock, market trends, and vertical-integration between reporting units.We evaluated the selected industry-comparable multiples by comparing to those used in the prior year, those used in the different reporting units and to current facts and circumstances affecting the reporting unit.CA26, 2020F-Year Ended December 31, (in thousands, except per common share amounts) 2021 2020 2019 REVENUE $ 4,641,830 $ 5,318,763 $ 4,450,832 COST OF OPERATIONS (4,175,439) (4,832,610) (4,209,060) GROSS PROFIT 466,391 486,153 241,772 General and administrative expenses (239,587) (223,809) (226,916) Goodwill impairment — — (379,863) INCOME (LOSS) FROM CONSTRUCTION OPERATIONS 226,804 262,344 (365,007) Other income (expense) Other income (expense) 2,004 (11,853) 6,667 Interest expense (69,026) (76,212) (67,494) INCOME (LOSS) BEFORE INCOME TAXES 159,782 174,279 (425,834) Income tax (expense) benefit Income tax (expense) benefit (25,632) (21,942) 65,609 NET INCOME (LOSS) 134,150 152,337 (360,225) LESS: NET INCOME ATTRIBUTABLE TO NONCONTROLLING INTERESTS 42,225 43,943 27,465 NET INCOME (LOSS) ATTRIBUTABLE TO TUTOR PERINI CORPORATION $ 91,925 $ 108,394 $ (387,690) BASIC EARNINGS (LOSS) PER COMMON SHARE $ 1.80 $ 2.14 $ (7.72) DILUTED EARNINGS (LOSS) PER COMMON SHARE $ 1.79 $ 2.12 $ (7.72) WEIGHTED-AVERAGE COMMON SHARES OUTSTANDING: BASIC 51,017 50,656 50,220 DILUTED 51,369 51,077 50,220 F-Year Ended December 31, (in thousands) 2021 2020 2019 NET INCOME (LOSS) $ 134,150 $ 152,337 $ (360,225) OTHER COMPREHENSIVE INCOME (LOSS), NET OF TAX: Defined benefit pension plan adjustments 6,221 (6,261) 844 Foreign currency translation adjustments (325) 279 1,337 Unrealized gain (loss) in fair value of investments (2,650) 1,571 1,561 TOTAL OTHER COMPREHENSIVE INCOME (LOSS), NET OF TAX 3,246 (4,411) 3,742 COMPREHENSIVE INCOME (LOSS) 137,396 147,926 (356,483) LESS: COMPREHENSIVE INCOME ATTRIBUTABLE TO NONCONTROLLING INTERESTS 42,365 44,173 27,858 COMPREHENSIVE INCOME (LOSS) ATTRIBUTABLE TO TUTOR PERINI CORPORATION $ 95,031 $ 103,753 $ (384,341) F-CONSOLIDATEDThe accompanying notes are an integral part of these consolidated financial statements. As of December 31, (in thousands, except share and per share amounts) 2021 2020 ASSETS CURRENT ASSETS: Cash and cash equivalents ($102,679 and $105,735 related to VIEs) $ 202,197 $ 374,289 Restricted cash 9,199 77,563 Restricted investments 84,355 78,912 Accounts receivable ($116,415 and $86,012 related to VIEs) 1,454,319 1,415,063 Retainage receivable ($162,259 and $122,335 related to VIEs) 568,881 648,441 Costs and estimated earnings in excess of billings ($143,105 and $39,846 related to VIEs) 1,356,768 1,236,734 Other current assets ($43,718 and $51,746 related to VIEs) 186,773 249,455 Total current assets 3,862,492 4,080,457 PROPERTY AND EQUIPMENT: Land 40,175 44,167 Building and improvements 116,146 116,422 Construction equipment 580,909 570,675 Other equipment 175,832 192,247 913,062 923,511 Less accumulated depreciation (483,417) (434,294) Total property and equipment, net ($2,203 and $12,840 related to VIEs) 429,645 489,217 GOODWILL 205,143 205,143 INTANGIBLE ASSETS, NET 85,068 123,115 OTHER ASSETS 142,550 147,685 TOTAL ASSETS $ 4,724,898 $ 5,045,617 LIABILITIES AND EQUITY CURRENT LIABILITIES: Current maturities of long-term debt, net of unamortized discount and debt issuance costs totaling $0 and $2,040 $ 24,406 $ 100,188 Accounts payable ($96,097 and $116,461 related to VIEs) 512,056 794,611 Retainage payable ($37,007 and $26,439 related to VIEs) 268,945 315,135 Billings in excess of costs and estimated earnings ($355,270 and $362,427 related to VIEs) 761,689 839,222 Accrued expenses and other current liabilities ($8,566 and $9,595 related to VIEs) 210,017 215,207 Total current liabilities 1,777,113 2,264,363 969,248 925,277 DEFERRED INCOME TAXES 70,989 82,966 OTHER LONG-TERM LIABILITIES 233,828 230,066 TOTAL LIABILITIES 3,051,178 3,502,672 COMMITMENTS AND CONTINGENCIES (Note 8) 0 0 EQUITY Stockholders' equity: Preferred stock – authorized 1,000,000 shares ($1 par value), none issued — — Common stock – authorized 112,500,000 shares ($1 par value), issued and outstanding 51,095,706 and 50,827,205 shares 51,096 50,827 Additional paid-in capital 1,133,150 1,127,385 Retained earnings 514,310 422,385 Accumulated other comprehensive loss (43,635) (46,741) Total stockholders' equity 1,654,921 1,553,856 Noncontrolling interests 18,799 (10,911) TOTAL EQUITY 1,673,720 1,542,945 TOTAL LIABILITIES AND EQUITY $ 4,724,898 $ 5,045,617 TUTOR PERINI CORPORATION AND SUBSIDIARIESCONSOLIDATED STATEMENTS OF CASH FLOWSThe accompanying notes are an integral part of these consolidated financial statements.TUTOR PERINI CORPORATION AND SUBSIDIARIESCONSOLIDATED STATEMENTS OF CHANGES IN EQUITYF-Year Ended December 31, (in thousands) 2021 2020 2019 Cash Flows from Operating Activities: Net income (loss) $ 134,150 $ 152,337 $ (360,225) Adjustments to reconcile net income (loss) to net cash provided by (used in) operating activities: Goodwill impairment — — 379,863 Depreciation 82,732 74,879 58,818 Amortization of intangible assets 35,497 32,155 6,226 Share-based compensation expense 11,642 11,833 19,143 Change in debt discounts and deferred debt issuance costs 5,756 20,153 13,207 Deferred income taxes (13,887) 48,253 (71,609) Gain on remeasurement of investment in joint venture — — (37,792) (Gain) loss on sale of property and equipment 2,639 (1,673) (4,688) Changes in other components of working capital, net of balances acquired (422,227) (169,976) 131,257 Other long-term liabilities 14,766 4,352 1,863 Other, net 478 459 467 NET CASH PROVIDED BY (USED IN) OPERATING ACTIVITIES (148,454) 172,772 136,530 Cash Flows from Investing Activities: Business acquisition, cash balance acquired net of cash paid — — 6,607 Acquisition of property and equipment (38,594) (54,781) (84,196) Proceeds from sale of property and equipment 7,245 14,550 12,581 Investments in securities (30,761) (31,331) (35,167) Proceeds from maturities and sales of investments in securities 24,771 25,204 24,120 NET CASH USED IN INVESTING ACTIVITIES (37,339) (46,358) (76,055) Cash Flows from Financing Activities: Proceeds from debt 740,743 1,301,282 931,594 Repayment of debt (777,762) (1,119,887) (870,277) Cash payments related to share-based compensation (1,989) (1,397) (2,363) Distributions paid to noncontrolling interests (22,655) (48,467) (46,500) Contributions from noncontrolling interests 7,000 3,000 9,813 Debt issuance, extinguishment and modification costs — (11,194) (504) NET CASH PROVIDED BY (USED IN) FINANCING ACTIVITIES (54,663) 123,337 21,763 Net increase (decrease) in cash, cash equivalents and restricted cash (240,456) 249,751 82,238 Cash, cash equivalents and restricted cash at beginning of year 451,852 202,101 119,863 Cash, cash equivalents and restricted cash at end of year $ 211,396 $ 451,852 $ 202,101 (in thousands) Common
StockAdditional
Paid-in
CapitalRetained
EarningsAccumulated
Other
Comprehensive
LossNoncontrolling
InterestsTotal Balance - December 31, 2018 $ 50,026 $ 1,102,919 $ 701,681 $ (45,449) $ (21,288) $ 1,787,889 Net income (loss) — — (387,690) — 27,465 (360,225) Other comprehensive income — — — 3,349 393 3,742 Share-based compensation — 17,571 — — — 17,571 Issuance of common stock, net 253 (2,518) — — — (2,265) Contributions from noncontrolling interests — — — — 9,813 9,813 Distributions to noncontrolling interests — — — — (46,500) (46,500) Recognized fair value of noncontrolling interest in joint venture upon consolidation — — — — 20,500 20,500 Balance - December 31, 2019 $ 50,279 $ 1,117,972 $ 313,991 $ (42,100) $ (9,617) $ 1,430,525 Net income — — 108,394 — 43,943 152,337 Other comprehensive income (loss) — — — (4,641) 230 (4,411) Share-based compensation — 11,928 — — — 11,928 Reacquisition of equity component from convertible note repurchase, net of taxes — (764) — — — (764) Issuance of common stock, net 548 (1,751) — — — (1,203) Contributions from noncontrolling interests — — — — 3,000 3,000 Distributions to noncontrolling interests — — — — (48,467) (48,467) Balance - December 31, 2020 $ 50,827 $ 1,127,385 $ 422,385 $ (46,741) $ (10,911) $ 1,542,945 Net income — — 91,925 — 42,225 134,150 Other comprehensive income — — — 3,106 140 3,246 Share-based compensation — 8,848 — — — 8,848 Issuance of common stock, net 269 (3,083) — — — (2,814) Contributions from noncontrolling interests — — — — 10,000 10,000 Distributions to noncontrolling interests — — — — (22,655) (22,655) Balance - December 31, 2021 $ 51,096 $ 1,133,150 $ 514,310 $ (43,635) $ 18,799 $ 1,673,720 14)13). If a joint venture is not a VIE, it may be consolidated under the voting interest method if the Company holds a controlling financial interest in the joint venture. The Company is considered to hold a controlling financial interest when it is able to exercise control over the joint venture’s operating and financial decisions. For construction joint ventures that do not need to be consolidated, the Company accounts for its interest in the joint ventures using the proportionate consolidation method, whereby the Company’s proportionate share of the joint ventures’ assets, liabilities, revenue and cost of operations are included in the appropriate classifications in the Company’s consolidated financial statements. Intercompany balances and transactions have been eliminated.TUTOR PERINI CORPORATION AND SUBSIDIARIESNOTES TO CONSOLIDATED FINANCIAL STATEMENTS (Continued)20192021 as a result of the $379.9 million impairment loss recognized in the second quarter of 2019. The Company performs its annual quantitative impairment assessment during the fourth quarter of each year using a weighted-averageweighted average of an income and a market approach. These approaches utilize various valuation assumptions, and small changes to the assumptions could have a significant impact on the concluded fair value. The income approach is based on estimated present value of future cash flows for each reporting unit carrying a goodwill balance. The market approach is based on assumptions about how market data relates to each reporting unit carrying a goodwill balance. The weighting of these two approaches is based on their individual correlation to the economics of each reporting unit carrying a goodwill balance. The annual quantitative assessment performed in the fourth quarter of 20192021 resulted in an estimated fair value that exceeded the net book value of the Civil reporting unit; therefore, no impairment charge was necessary. and may assess its non-amortizable trade names for impairment initially using a qualitativean income approach to determine whether conditions exist to indicate that it is more likely than not that the fair value of a trade name is less than its carrying value. If the Company concludes, based on assessment of relevant events, facts and circumstances, that it is more likely than not that the trade name’s fair value is greater than its carrying value, no further impairment testing through a quantitative assessment is required. (relief from royalty method). The qualitative assessment performed for the Company’s annual impairment assessment in the fourth quarter of 2019 concluded that it was more likely than not that the trade name’s2021 resulted in an estimated fair value for the non-amortizable trade names that exceeded their respective net book values; therefore, no impairment charge was greater than its carrying value, and therefore a quantitative analysis was not required.F- (EPS)EPSearnings per common share (“EPS”) and diluted EPS are calculated by dividing net income attributable to Tutor Perini Corporation by the following: for basic EPS, the weighted-average number of common shares outstanding during the period; and for diluted EPS, the sum of the weighted-average number of both outstanding common shares and potentially dilutive securities, which for the Company can include restricted stock units and unexercised stock options andoptions. Potentially dilutive securities also included the Convertible Notes as(as defined in Note 7. For the year ended December 31, 2019, all potentially dilutive securities were excluded from the calculation of diluted EPS as a result of the net loss for the period. In accordance with ASC 260, Earnings Per Share, the settlement of the principal amount of7) prior to their repayment on June 15, 2021; however, the Convertible Notes has had no impact on diluted EPS because the Company has had the intent and ability to settle the principal amount in cash.EPS. The Company calculates the effect of the potentially dilutive restricted stock units and stock options using the treasury stock method.Year Ended December 31, (in thousands, except per common share data) 2021 2020 2019 Net income (loss) attributable to Tutor Perini Corporation $ 91,925 $ 108,394 $ (387,690) Weighted-average common shares outstanding, basic 51,017 50,656 50,220 Effect of dilutive restricted stock units and stock options 352 421 — Weighted-average common shares outstanding, diluted 51,369 51,077 50,220 Net income (loss) attributable to Tutor Perini Corporation per common share: Basic $ 1.80 $ 2.14 $ (7.72) Diluted $ 1.79 $ 2.12 $ (7.72) Anti-dilutive securities not included above 1,892 1,862 3,640 As of December 31, (in thousands) 2021 2020 Cash and cash equivalents available for general corporate purposes $ 60,192 $ 210,841 Joint venture cash and cash equivalents 142,005 163,448 Cash and cash equivalents 202,197 374,289 Restricted cash 9,199 77,563 Total cash, cash equivalents and restricted cash $ 211,396 $ 451,852 Amounts included in restrictedare primarily includes amounts held as collateral to secure insurance-related contingent obligations, such as insurance claim deductibles, in lieu of letters of credit.F-corporate debt securities and U.S. government agency securities and corporate debt securities that are rated A3A3 or better.stock units and stock options. stock.andgive the holder the right to exchange their stock optionsunits for shares of the Company’s common stock on a one-for-one basis. These awards generally vest subject to service, and/performance or performance requirements,market conditions, with related compensation expense equal to the fair value of the award on the date of grant and recognized on a straight-line basis over the requisite period. The fair value of restricted stock units with service or performance-vesting conditions is generally based on the closing price of the Company’s common stock on the New York Stock Exchange (“NYSE”). Certain restricted stock units are classified as liabilities because they contain guaranteed minimum payouts.share-basedall awards that havewith only a service requirement,service-based vesting condition, the Company accounts for forfeitures upon occurrence, rather than estimating the probability of forfeiture at the date of grant. Accordingly, the Company recognizes the full grant-date fair value of these awards on a straight-line basis throughout the requisite service period, reversing any expense if, and only if, there is a forfeiture.share-basedall awards that have a performance-based vesting requirement,condition, the Company evaluates the probability of achieving the performance criteria quarterly throughout the performance period, and will adjust share-based compensation expense if it estimates that the achievement of the performance criteria is not probable. CertainIn addition, liability awards with a performance-based vesting condition are remeasured at fair value at each reporting period and the compensation expense is adjusted accordingly.containwith a market-based vesting condition, compensation expense is recognized regardless of whether the market condition components andis satisfied, provided that the requisite service period has been completed. Conversely, liability awards with market-based vesting requirements are valued on the date of grantremeasured at fair value at each reporting period using a Monte Carlo simulation model. The fair valuemodel and the compensation expense is adjusted accordingly.2019, 20182021, 2020 and 20172019 were as follows:Year Ended December 31, 2021 2020 2019 (in thousands) Before-Tax Amount Tax (Expense) Benefit Net-of-Tax Amount Before-Tax Amount Tax (Expense) Benefit Net-of-Tax Amount Before-Tax Amount Tax (Expense) Benefit Net-of-Tax Amount Other comprehensive income (loss): Defined benefit pension plan adjustments $ 8,665 $ (2,444) $ 6,221 $ (8,700) $ 2,439 $ (6,261) $ 1,180 $ (336) $ 844 Foreign currency translation adjustment (508) 183 (325) 178 101 279 1,867 (530) 1,337 Unrealized gain (loss) in fair value of investments (3,440) 790 (2,650) 2,015 (444) 1,571 1,982 (421) 1,561 Total other comprehensive income (loss) $ 4,717 $ (1,471) $ 3,246 $ (6,507) $ 2,096 $ (4,411) $ 5,029 $ (1,287) $ 3,742 140 — 140 230 — 230 393 — 393 Total other comprehensive income (loss) attributable to Tutor Perini Corporation $ 4,577 $ (1,471) $ 3,106 $ (6,737) $ 2,096 $ (4,641) $ 4,636 $ (1,287) $ 3,349 _____________________________________________________________________________________________________________TUTOR PERINI CORPORATION AND SUBSIDIARIESNOTES TO CONSOLIDATED FINANCIAL STATEMENTS (Continued)2019, 20182021, 2020 and 20172019 were as follows:(p) Recent Accounting PronouncementsIn February 2016, the FASB issued ASU 2016-02, Leases (Topic 842), as amended and supplemented by subsequent ASUs (collectively, “ASC 842”). ASC 842 amends the existing guidance in ASC 840, Leases. This ASU requires, among other things, the recognition of lease right-of-use (“ROU”) assets and lease liabilities by lessees for those leases currently classified as operating leases. ASC 842 allowed companies to adopt the new standard by applying either a modified retrospective method to the beginning of the earliest period presented in the financial statements or an optional transition method to initially apply the standard on January 1, 2019 and recognize a cumulative-effect adjustment to the opening balance of retained earnings in the period of adoption. The Company adopted the standard using the optional transition method. Under this method, financial results reported in periods prior to 2019 are unchanged. The Company elected the package of practical expedients which provides relief from having to reassess (1) whether any expired or existing contracts contain leases, (2) lease classification (as operating or financing) for any expired or existing leases, and (3) initial direct costs for any existing leases. The Company also elected to separate non-lease components from lease components. Based on the Company’s evaluation of ASC 842, the adoption on January 1, 2019 resulted in an increase of $43.3 million to its assets and liabilities on the Consolidated Balance Sheets with no impact to its results of operations or cash flows.(in thousands) Defined Benefit Pension Plan Foreign Currency Translation Unrealized Gain (Loss) in Fair
Value of InvestmentsAccumulated Other Comprehensive
Income (Loss)Attributable to Tutor Perini Corporation: Balance as of December 31, 2018 $ (38,670) $ (6,315) $ (464) $ (45,449) Other comprehensive income (loss) before reclassifications (539) 944 1,621 2,026 Amounts reclassified from AOCI 1,383 — (60) 1,323 Balance as of December 31, 2019 $ (37,826) $ (5,371) $ 1,097 $ (42,100) Other comprehensive income (loss) before reclassifications (7,993) 49 1,820 (6,124) Amounts reclassified from AOCI 1,732 — (249) 1,483 Balance as of December 31, 2020 $ (44,087) $ (5,322) $ 2,668 $ (46,741) Other comprehensive income (loss) before reclassifications 4,167 (465) (2,372) 1,330 Amounts reclassified from AOCI 2,054 — (278) 1,776 Balance as of December 31, 2021 $ (37,866) $ (5,787) $ 18 $ (43,635) F-effectssignificant items reclassified out of AOCI and the changes made to the Company’s January 1, 2019 consolidated balance sheet for the adoption of ASC 842 were as follows:_____________________________________________________________________________________________________________(a)Balance as previously reportedcorresponding location and impact on the Company’s Annual Report on Form 10-K forConsolidated Statements of Operations during the yearyears ended December 31, 2018.(b)Prior to the adoption of ASC 842, operating lease ROU assets2021, 2020 and current and long-term operating lease liabilities were not recorded on the Consolidated Balance Sheets.The following table presents the impacts of adoption of the new leases standard on the Consolidated Balance Sheet:_____________________________________________________________________________________________________________(a)Prior to the adoption of ASC 842, operating lease ROU assets and current and long-term operating lease liabilities were not recorded on the Consolidated Balance Sheets.In May 2014, the FASB issued ASU 2014-09, Revenue from Contracts with Customers (Topic 606),2019 are as amended by subsequent ASUs (collectively, “ASC 606”). The Company adopted this ASU effective January 1, 2018 using the modified retrospective transition method. As such, the 2017 comparative information has not been restated and continues to be reported under the accounting standards in effect for that period.New accounting pronouncements requiring implementation in future periods are discussed below.In June 2016, the FASB issued ASU 2016-13, Measurement of Credit Losses on Financial Instruments, and issued subsequent amendments to the initial guidance within ASU 2019-04 and ASU 2019-05 (collectively, “ASU 2016-13”). The amendments in ASU 2016-13 replace the incurred loss impairment methodology in current practice with a methodology that reflects expected credit losses and requires consideration of a broader range of reasonable and supportable information to estimate credit losses. ASU 2016-13 is effective for interim and annual reporting periods beginning after December 15, 2019. The Company does not expect the adoption of ASU 2016-13 to have a material impact on its financial position, results of operations or cash flows.Location in Consolidated Year Ended December 31, (in thousands) Statements of Operations 2021 2020 2019 Component of AOCI: Defined benefit pension plan adjustments Other income (expense) $ 2,861 $ 2,407 $ 1,933 Income tax benefit Income tax expense (benefit) (807) (675) (550) Net of tax $ 2,054 $ 1,732 $ 1,383 Unrealized gain in fair value of investment adjustments Other income (expense) $ (352) $ (315) $ (76) Income tax expense Income tax expense (benefit) 74 66 16 Net of tax $ (278) $ (249) $ (60) FASBFinancial Accounting Standards Board (“FASB”) issued ASUAccounting Standards Update (“ASU”) 2019-12, Simplifying the Accounting for Income Taxes (“ASU 2019-12”), modifying ASCAccounting Standards Codification (“ASC”) 740, Income Taxes (“ASC 740”). The amendments in ASU 2019-12, among other things, remove certain exceptions to the general principles in ASC 740 and seek more consistent application by clarifying and amending the existing guidance. The Company adopted this ASU effective January 1, 2021. The adoption of ASU 2019-12 is effective for interim and annual reporting periods beginning after December 15, 2020. The Company is currently evaluating the new standard, which isdid not expected to have a material impact on the Company’s financial position, results of operations or cash flows.TUTOR PERINI CORPORATION AND SUBSIDIARIESNOTES TO CONSOLIDATED FINANCIAL STATEMENTS (Continued)13)6), as shown in the Consolidated Statements of Cash Flows, andas well as the supplemental disclosuredisclosures of cash paid for interest, income taxes and income taxes:non-cash investing activities:Year Ended December 31, (in thousands) 2021 2020 2019 (Increase) Decrease in: Accounts receivable $ (31,972) $ (104,901) $ (81,983) Retainage receivable 78,618 (85,769) (78,520) Costs and estimated earnings in excess of billings (120,034) (113,190) 18,751 Other current assets 62,371 (49,468) (76,146) (Decrease) Increase in: Accounts payable (283,482) 111,912 53,999 Retainage payable (46,190) 62,954 35,013 Billings in excess of costs and estimated earnings (77,533) (5,168) 245,292 Accrued expenses and other current liabilities (4,005) 13,654 14,851 Changes in other components of working capital $ (422,227) $ (169,976) $ 131,257 Supplemental disclosures: Interest paid $ 63,762 $ 57,038 $ 56,137 Income taxes paid (refunded), net $ (8,299) $ 11,204 $ 43,374 Non-cash investing activities: Real property acquired in settlement of a receivable $ — $ 11,660 $ — Receivable recognized from sale of subsidiary $ 4,163 $ — $ — 20192021, 2020 and 2018.Year Ended December 31, (in thousands) 2021 2020 2019 Civil segment revenue by end market: Mass transit (includes certain transportation and tunneling projects) Mass transit (includes certain transportation and tunneling projects) $ 1,417,196 $ 1,367,412 $ 992,755 Bridges 238,345 306,161 334,117 Military defense facilities Military defense facilities 194,701 146,969 59,082 Water Water 98,739 101,705 33,370 Highways 55,666 122,254 86,747 Other 91,113 155,398 273,281 Total Civil segment revenue $ 2,095,760 $ 2,199,899 $ 1,779,352 Year Ended December 31, (in thousands) 2021 2020 2019 Building segment revenue by end market: Commercial and industrial facilities $ 352,265 $ 580,297 $ 459,806 Hospitality and gaming 338,998 474,329 297,700 Municipal and government 291,629 287,337 254,736 Education facilities Education facilities 159,929 173,472 143,382 Mass transit (includes transportation projects) Mass transit (includes transportation projects) 130,923 218,930 201,400 Health care facilities 64,042 117,968 239,299 Other 90,316 132,308 145,717 Total Building segment revenue $ 1,428,102 $ 1,984,641 $ 1,742,040 Year Ended December 31, (in thousands) 2021 2020 2019 Specialty Contractors segment revenue by end market: Mass transit (includes certain transportation and tunneling projects) $ 588,162 $ 592,430 $ 419,402 Commercial and industrial facilities 139,751 152,868 186,819 Multi-unit residential 133,085 139,924 83,903 Water 90,887 73,769 37,403 Education facilities 50,572 44,762 70,229 Mixed use 44,660 47,022 64,302 Other 70,851 83,448 67,382 Total Specialty Contractors segment revenue $ 1,117,968 $ 1,134,223 $ 929,440 Year Ended December 31, 2021 (in thousands) Civil Building Specialty
ContractorsTotal Revenue by customer type: State and local agencies $ 1,791,531 $ 363,686 $ 481,255 $ 2,636,472 Federal agencies 205,080 189,508 47,724 442,312 Private owners 99,149 874,908 588,989 1,563,046 Total revenue $ 2,095,760 $ 1,428,102 $ 1,117,968 $ 4,641,830 F-Year Ended December 31, 2020 (in thousands) Civil Building Specialty
ContractorsTotal Revenue by customer type: State and local agencies $ 1,875,653 $ 534,449 $ 533,768 $ 2,943,870 Federal agencies 175,933 143,327 75,067 394,327 Private owners 148,313 1,306,865 525,388 1,980,566 Total revenue $ 2,199,899 $ 1,984,641 $ 1,134,223 $ 5,318,763 Year Ended December 31, 2019 (in thousands) Civil Building Specialty
ContractorsTotal Revenue by customer type: State and local agencies $ 1,401,001 $ 573,049 $ 496,195 $ 2,470,245 Federal agencies 116,869 153,467 11,326 281,662 Private owners 261,482 1,015,524 421,919 1,698,925 Total revenue $ 1,779,352 $ 1,742,040 $ 929,440 $ 4,450,832 Year Ended December 31, 2021 (in thousands) Civil Building Specialty
ContractorsTotal Revenue by contract type: Fixed price $ 1,815,079 $ 336,128 $ 988,941 $ 3,140,148 Guaranteed maximum price 2,854 888,345 14,505 905,704 Unit price 268,377 (1,373) 96,782 363,786 Cost plus fee and other 9,450 205,002 17,740 232,192 Total revenue $ 2,095,760 $ 1,428,102 $ 1,117,968 $ 4,641,830 Year Ended December 31, 2020 (in thousands) Civil Building Specialty
ContractorsTotal Revenue by contract type: Fixed price $ 1,792,765 $ 508,655 $ 1,010,973 $ 3,312,393 Guaranteed maximum price 1,829 1,136,782 15,417 1,154,028 Unit price 392,548 867 83,257 476,672 Cost plus fee and other 12,757 338,337 24,576 375,670 Total revenue $ 2,199,899 $ 1,984,641 $ 1,134,223 $ 5,318,763 Year Ended December 31, 2019 (in thousands) Civil Building Specialty
ContractorsTotal Revenue by contract type: Fixed price $ 1,315,195 $ 561,831 $ 769,410 $ 2,646,436 Guaranteed maximum price 6,951 752,110 21,291 780,352 Unit price 436,015 12,063 91,803 539,881 Cost plus fee and other 21,191 416,036 46,936 484,163 Total revenue $ 1,779,352 $ 1,742,040 $ 929,440 $ 4,450,832 TUTOR PERINI CORPORATION AND SUBSIDIARIESNOTES TO CONSOLIDATED FINANCIAL STATEMENTS (Continued)none of which was individually material, except forincluding a $123.9 million revenue impact that resulted from the charge related to the Alaskan Way Viaduct matterMatter discussed in Note 8. Revenue recognized during the year ended December 31, 2018 related to performance obligations satisfied (or partially satisfied) in prior periods was $19.4 million for various projects, none2019, the aggregate amounts of the transaction prices allocated to the remaining performance obligations of the Company’s construction contracts were $5.2 billion, $2.2 billion and $2.2 billion for the Civil, Building and Specialty Contractors segments, respectively. As of December 31, 2018,2021, the aggregate amounts of the transaction prices allocated to the remaining performance obligations of the Company’s construction contracts were $4.6 billion, $2.3$2.2 billion and $1.7$1.3 billion for the Civil, Building and Specialty Contractors segments, respectively. As of December 31, 2020, the aggregate amounts of the transaction prices allocated to the remaining performance obligations of the Company’s construction contracts were $4.8 billion, $1.5 billion and $1.8 billion for the Civil, Building and Specialty Contractors segments, respectively. The Company typically recognizes revenue on Civil segment projects over a period of three to five years, whereas for projects in the Building and Specialty Contractors segments, the Company typically recognizes revenue over a period of one to three years.TUTOR PERINI CORPORATION AND SUBSIDIARIESNOTES TO CONSOLIDATED FINANCIAL STATEMENTS (Continued)As of December 31, (in thousands) 2021 2020 Retainage receivable $ 568,881 $ 648,441 Costs and estimated earnings in excess of billings: Claims 833,352 752,783 Unapproved change orders 418,054 415,489 Other unbilled costs and profits 105,362 68,462 Total costs and estimated earnings in excess of billings 1,356,768 1,236,734 Capitalized contract costs 69,027 74,452 Total contract assets $ 1,994,676 $ 1,959,627 towardstoward completion. As of December 31, 2019,2021, the amount of retainage receivable estimated by management to be collected beyond one year is approximately 39%31% of the balance.20192021 estimated by management to be collected beyond one year is approximately $572.1$795.2 million.contract, and are included in other current assets.contract. Capitalized contract costs are generally expensed to the associated contract over the period of anticipated use on the project. During the yearyears ended December 31, 2021, 2020 and 2019, and 2018, $33.8$47.3 million, $46.7 million and $16.3$33.8 million, respectively, of previously capitalized contract costs were amortized and recognized as expense on the related contracts.TUTOR PERINI CORPORATION AND SUBSIDIARIESNOTES TO CONSOLIDATED FINANCIAL STATEMENTS (Continued)As of December 31, (in thousands) 2021 2020 Retainage payable $ 268,945 $ 315,135 Billings in excess of costs and estimated earnings 761,689 839,222 Total contract liabilities $ 1,030,634 $ 1,154,357 2019,2021, the amount of retainage payable estimated by management to be remitted beyond one year is approximately 28%24% of the balance.yearyears ended December 31, 20192021, 2020 and 20182019 and included in the opening billings in excess of costs and estimated earnings balances for each period totaled $638.7 million, $690.7 million and $479.6 million, and $382.7 million, respectively.The income tax (benefit) expense is as follows:Year Ended December 31, (in thousands) 2021 2020 2019 United States operations $ 118,749 $ 138,426 $ (456,403) Foreign and U.S. territory operations 41,033 35,853 30,569 Total $ 159,782 $ 174,279 $ (425,834) F-Year Ended December 31, (in thousands) 2021 2020 2019 Current expense (benefit): Federal $ 20,052 $ (36,159) $ (2,884) State 7,899 (1,282) 3,585 Foreign and U.S. territories 11,568 11,130 5,299 Total current expense (benefit): 39,519 (26,311) 6,000 Deferred expense (benefit): Federal (13,667) 38,667 (43,579) State 36 10,608 (27,566) Foreign and U.S. territories (256) (1,022) (464) Total deferred expense (benefit): (13,887) 48,253 (71,609) Total expense (benefit): $ 25,632 $ 21,942 $ (65,609) ratesfederal tax rate to the income tax (benefit) expense at the Company’s effective tax rate:Year Ended December 31, 2021 2020 2019 (dollars in thousands) Amount Rate Amount Rate Amount Rate Federal income tax expense (benefit) at statutory tax rate Federal income tax expense (benefit) at statutory tax rate $ 33,554 21.0 % $ 36,599 21.0 % $ (89,425) 21.0 % State income taxes, net of federal tax benefit 8,301 5.2 8,518 4.9 (18,442) 4.3 Stock based compensation 87 0.1 3,185 1.8 1,706 (0.4) Impact of federal tax law changes Impact of federal tax law changes — — (14,476) (8.3) — — Officers' compensation 3,664 2.3 2,486 1.4 2,938 (0.7) Goodwill impairment — — — — 43,990 (10.3) Noncontrolling interests (8,872) (5.6) (9,799) (5.6) (6,064) 1.4 Federal R&D credits (1,105) (0.7) (3,007) (1.7) (3,998) 0.9 Foreign tax rate differences Foreign tax rate differences (625) (0.4) 1,491 0.9 4,940 (1.2) Federal claim of right credit Federal claim of right credit (8,191) (5.1) — — — — Other (1,181) (0.8) (3,055) (1.8) (1,254) 0.4 Income tax expense (benefit) Income tax expense (benefit) $ 25,632 16.0 % $ 21,942 12.6 % $ (65,609) 15.4 % iswas not tax deductible and yielded permanent differences betweenOn December 22, 2017, the U.S. government enacted the Tax Cuts and Jobs Act of 2017 (“TCJA”) which made broad and complex changes to the U.S. tax code that impact the Company’s financial statements, including, but not limited to, a permanent decrease in the corporate federal statutory income tax rate from 35% to 21%, effective January 1, 2018, and a one-time transition tax from the inclusion of foreign earnings. Future distributions from foreign subsidiaries, however, are no longer subject to federal income tax.As a result of the TCJA, the Company recognized an income tax benefit of $53.3 million in 2017, primarily due to the remeasurement of deferred tax assets and liabilities based on the reduced corporate federal statutory income tax rate of 21%.TUTOR PERINI CORPORATION AND SUBSIDIARIESNOTES TO CONSOLIDATED FINANCIAL STATEMENTS (Continued)As of December 31, (in thousands) 2021 2020 Deferred tax assets: Timing of expense recognition $ 28,710 $ 24,470 Net operating losses 15,824 19,968 Goodwill 11,698 19,315 Other, net 13,125 10,155 Deferred tax assets 69,357 73,908 Deferred tax liabilities: Intangible assets, due primarily to purchase accounting (16,453) (15,212) Fixed assets Fixed assets (70,128) (76,567) Construction contract accounting (9,196) (9,769) Joint ventures (26,764) (41,669) Other (15,672) (11,962) Deferred tax liabilities (138,213) (155,179) Net deferred tax liabilities $ (68,856) $ (81,271) 2019,2021, the Company had federal and various state net operating loss carryforwards for income tax purposes of $29.3in various states totaling $166.0 million and $184.8 million, respectively. Federal net operating loss carryforwards do not have expiration dates, whereas the state net operating loss carryforwards havewith expiration dates ranging from 2022 to 2038.2040. As of December 31, 2019,2020, the Company hashad net operating loss carryforwards in various states totaling $196.5 million. As of December 31, 2021, the Company had federal and state tax credit carryforwards for income tax purposes of approximately $6.0$0.1 million and $1.2$2.6 million, respectively.The netdeferred As of December 31, 2020, the Company had federal and state taxliabilities credit carryforwards of approximately $1.4 million and $2.0 million, respectively.intheConsolidatedBalancein the Consolidated Balance Sheets as follows:As of December 31, (in thousands) 2021 2020 Deferred tax assets $ 2,133 $ 1,695 Deferred tax liabilities (70,989) (82,966) Net deferred tax liabilities $ (68,856) $ (81,271) Since the enactment of the TCJA, the Company no longer intends to permanently reinvest in its foreign subsidiaries. Consequently, the Company now provides deferred income taxes and foreign withholding taxes related to its foreign subsidiaries.20192021 that, if recognized, would affectimpact the effective tax rate is $5.7$7.5 million. The Company does not expect any significant release of unrecognized tax benefits within the next twelve months.2019:As of December 31, (in thousands) 2021 2020 2019 Beginning balance $ 8,681 $ 5,682 $ 4,998 Change in tax positions of prior years (1,319) 2,286 351 Change in tax positions of current year 1,000 1,202 1,106 Reduction in tax positions for statute expirations (823) (489) (773) Ending balance Ending balance $ 7,539 $ 8,681 $ 5,682 Company is subject toCompany's open tax years for a U.S. federal income taxTUTOR PERINI CORPORATION AND SUBSIDIARIESNOTES TO CONSOLIDATED FINANCIAL STATEMENTS (Continued)for fiscal years 2016are 2018 and later, although therelater. The 2018 federal income tax return is currently nounder audit being conducted by the Internal Revenue Service. The Company has various years open to audit in a number of state and local jurisdictions and is currently under audit by certainvarious state and local taxing authorities.2019:2021:(in thousands) Civil Building Specialty
ContractorsTotal Gross goodwill as of December 31, 2019 $ 492,074 $ 424,724 $ 156,193 $ 1,072,991 Accumulated impairment as of December 31, 2019 (286,931) (424,724) (156,193) (867,848) Goodwill as of December 31, 2019 205,143 — — 205,143 2020 activity — — — — Goodwill as of December 31, 2020 205,143 — — 205,143 Current year activity — — — — $ 205,143 $ — $ — $ 205,143 _____________________________________________________________________________________________________________2019,2021, accumulated impairment was $867.8 million.net changeCompany performed its annual impairment test in the fourth quarter of 2021 and concluded goodwill was not impaired. In addition, the Company determined that no triggering events occurred and no circumstances changed since the date of our annual impairment test that would more likely than not reduce the fair value of the Civil reporting unit below its carrying amountamount.goodwillthe Civil reporting unit, impacts to our business as a result of the COVID-19 pandemic, as well as other quantitative and qualitative factors which could indicate potential triggering events for the year ended December 31,possible impairment.was primarily due to a goodwill impairment charge of $379.9 million recorded inGoodwill Impairment2019. In connection with the preparation of its quarterly financial statements during the second quarter of 2019,, the Company assessedrecognized a non-cash impairment loss totaling $379.9 million, of which $210.2 million, $13.5 million and $156.2 million was in the changes in circumstances that occurred during the quarter to determine whether it was more likely than not that the fair values of any of its reporting units were below their carrying amounts.Civil, Building and Specialty Contractors segments, respectively. While there was no single determinative event or factor, potential triggering events identified in the accounting guidance (ASC 350, Intangibles – Goodwill and Other) developed during the second quarter of 2019, which led to the Company to conclude that, when considering the events and factors in totality, it was more likely than not that the fair values of each of its reporting units were below their carrying amounts. The triggering factorsimpairment conclusion included:•The Company faced a declining stock price and observed a sustained decrease subsequent to the filing of the Company’s first quarter Form 10-Q on May 8, 2019, in both absolute terms and relative to its peers. Consistent with the average stock prices of companies in its peer group, the Company’s stock price had been trending lower overbelievesbelieved that delays experienced in resolving certain claims and unapproved change orders, which when combined with the increased working capital needs and significant negative operating cash flows in the first quarter of 2019, hashad contributed significantly to the sustained decrease in the Company’s stock price;•The Company experienced significant negative operating cash flows from each of its reporting units in the first quarter of 2019, and that trend continued at the beginning of the second quarter; and•The Company’s debt rating was downgraded by a major credit rating agency on May 17, 2019.AsCompany determined that it was more likely than not that the fair values of its reporting units were below their carrying amounts, the Company performed an interim goodwill impairment test as of June 1, 2019 (the “Interim Test”) and, as described below, recognized a non-cash impairment loss totaling $379.9 million.The decrease in the Company’s stock price reduced its total market capitalization and increased the implied control premium to a level beyond observable market-comparable data. As a result, when performing the Interim Test, the Company increased the discount rates and the projected investments in working capital compared to the assumptions used in the previous October 1, 2018 test, which extended the timing of certain expected future cash flows in the calculation of fair value under the income-based approach. The Company believes these changes were consistent with market participant inputs as reflected in the decrease in the Company’s market valuation at that time.Consistent with the previous October 1, 2018 test,, the Company utilized a weighted-averageweighted average of (1) an income approach and (2) a market approach to determine the fair value of the Company and each of its reporting units for the Interim Test. The income approach was based on estimated present value of future cash flows for each reporting unit. The market approach was based on assumptions about how market data relates to each reporting unit. The weighting of these two approaches was based on their individual correlation to the economics of each reporting unit as impacted by factors such as the availability of comparable market data for each reporting unit.TUTOR PERINI CORPORATION AND SUBSIDIARIESNOTES TO CONSOLIDATED FINANCIAL STATEMENTS (Continued)•Weighted-average cost of capital (“WACC”), the risk-adjusted rate used to discount the projected cash flows;•Cash flows generated from existing work and new awards; and•Projected operating margins.The Company believes that the discount rates, timingTable of cash flows and other inputs and assumptions used in the Interim Test were consistent with those that a market participant would use based on the events described above which occurred during the second quarter of 2019 and were reflectiveContentsmarket assessment of the fair value of its reporting units at that time. following:
___________________________________________________________________________________________________________As of December 31, 2021 Weighted-Average Amortization Period (in thousands) Cost Accumulated
AmortizationAccumulated Impairment Charge Carrying Value Trade names (non-amortizable) $ 117,600 $ — $ (67,190) $ 50,410 Indefinite 69,250 (23,650) (23,232) 22,368 20 years Contractor license 6,000 — (6,000) — N/A Customer relationships 39,800 (23,053) (16,645) 102 12 years Construction contract backlog 149,290 (137,102) — 12,188 3 years Total $ 381,940 $ (183,805) $ (113,067) $ 85,068 addition,2021, the Company believes that its estimates and assumptions about future revenues and margin projections in the Interim Test were reasonable and consistent with the estimates and assumptions used in the annual goodwill impairment test as of October 1, 2018. Assold an additional step to corroborate the Interim Test results, the Company compared its implied control premium with those of recent comparable market transactions and concluded that the implied control premium was within the range of control premiums observed in prior industry-specific M&A transactions.The assumption changes described above were relatively larger in the Specialty Contractors reporting unit than in the Civil or Building reporting units, as Specialty Contractorsimmaterial subsidiary, which had not met recent market expectations at the time of the Interim Test.Subsequent to the Interim Test, the Company performed its annual impairment test in the fourth quarter of 2019 using a weighted-average of an income and a market approach. These approaches utilize various valuation assumptions, and small changes to the assumptions could have a significant impact on the concluded fair value. Based on this assessment, the Company concluded goodwill was not impaired since the estimated fair value of the Civil reporting unit exceeded its carrying value; therefore, no further adjustment to goodwill was necessary. In addition, no events or circumstances have occurred since the annual test that would indicate any additional impairment of goodwill.Intangible AssetsAs of December 31, 2019 and 2018, the Company had the following: (1) non-amortizable trade names with a carrying value of $50.4 million; (2) amortizable trade names with a gross cost of $5.1 million and a carrying value of $51.1$2.6 million and accumulated amortization asat the time of December 31, 2019 and 2018 of $21.3 million and $18.8 million, respectively; (3) amortizable customer relationships with a gross carrying value of $23.2 million and accumulated amortization as of December 31, 2019 and 2018 of $21.0 million and $sale.20.0 million, respectively; and (4) amortizable construction contract backlog with a gross carrying value as of December 31, 2019 and 2018 of $149.3 million and $73.7 million, respectively, and accumulated amortization as of December 31, 2019 and 2018 of $76.4 million and $73.7, respectively. The increase in amortizable construction contract backlog of $75.6 million is due to the acquisition of an additional interest in a joint venture, as discussed in Note 13.TUTOR PERINI CORPORATION AND SUBSIDIARIESNOTES TO CONSOLIDATED FINANCIAL STATEMENTS (Continued)As of December 31, 2020 Weighted-Average Amortization Period (in thousands) Cost Accumulated
AmortizationAccumulated Impairment Charge Carrying Value Trade names (non-amortizable) $ 117,600 $ — $ (67,190) $ 50,410 Indefinite Trade names (amortizable) 74,350 (23,754) (23,232) 27,364 20 years Contractor license 6,000 — (6,000) — N/A Customer relationships 39,800 (22,103) (16,645) 1,052 12 years Construction contract backlog 149,290 (105,001) — 44,289 3 years Total $ 387,040 $ (150,858) $ (113,067) $ 123,115 $6.2$35.5 million, $32.2 million and $3.5$6.2 million for the years ended December 31, 2021, 2020 and 2019, respectively. The increase in amortization expense in 2021 and 2020, compared to 2019, was due to the acquisition of an additional 25% interest in a Civil segment joint venture during the fourth quarter of 2019, which increased the Company’s ownership interest from 50% to 75% and gave it a controlling financial interest in the joint venture, thereby requiring consolidation by the Company. The transaction was accounted for as a business combination achieved in stages, and under ASC 805, Business Combinations, the previously held equity interest in the joint venture was remeasured at the acquisition date fair value. The transaction resulted in a gain of $37.8 million recognized in earnings, which was included in general and administrative expenses in the Company’s Consolidated Statement of Operations in 2019, and 2018, respectively. in the recording of an intangible asset for construction contract backlog of $75.6 million, which is amortized as the related contract backlog is recognized as revenue.for the years 2020, 2021 and 2022 will be approximately $31.2$14.5 million $31.1for 2022, $2.2 million and $20.2 million, respectively, and $2.5 millionper year for the years 2023 through 2026, and 2024.The weighted-average amortization period for amortizable trade names, customer relationships and construction contract backlog is approximately 20 years, 12 years and 3 years, respectively.In conjunction with its Interim Test for goodwill during the second quarter of 2019, the Company also evaluated its non-amortizable trade names for potential impairment due to the second quarter triggering factors related to goodwill mentioned above. $11.4 million thereafter.interimannual impairment test by comparing the carrying value of its indefinite-lived intangible assets to their calculated fair value, which is determined by the income approach (relief from royalty method). This income-based valuation approach involves similar key assumptions to the goodwill impairment analysis discussed above. The interim impairment test performed in the second quarter of 2019 resulted in an estimated fair value for the non-amortizable trade names that substantially exceeded their respective net book values; therefore, no impairment charge was necessary for the second quarter. While the key assumptions used in the impairment test of the non-amortizable trade names are similar to those used in the evaluation of goodwill, historically, the headroom (the excess of calculated fair value over carrying value) has been relatively higher for non-amortizable trade names than for goodwill. Unlike goodwill, trade names possess inherent value based on market perception which is valued considering the cost savings available through ownership and the avoidance of paying royalties associated with revenue generation. The discounted value is not impacted by cash flow related assumptions such as working capital investment. Consequently, goodwill was impaired while the non-amortizable trade name intangible assets were not.The Company also performed an annual impairment assessment of its non-amortizable trade names induring the fourth quarter of 2019 using a qualitative approach to determine whether conditions existed to indicate that it is more likely than not that the fair value of trade names is less than their carrying values.2021. Based on this assessment, the Company concluded that it was more likely than not that the fair value of theits non-amortizable trade names was greaterwere not impaired. In addition, the Company determined that no triggering events occurred and no circumstances changed since the date of our annual impairment test that would indicate impairment of its non-amortizable trade names. Other amortizable intangible assets are reviewed for impairment whenever circumstances indicate that the future cash flows generated by the assets might be less than theirthe assets’ net carrying values, and therefore a quantitative analysis was not required.value. The Company had no impairment of intangible assets during the years ended December 31, 2021, 2020 or 2019.As of December 31, (in thousands) 2021 2020 2017 Senior Notes $ 496,244 $ 495,271 Term Loan B 406,335 408,458 2020 Revolver 27,000 — — 67,878 Equipment financing and mortgages 56,246 47,594 Other indebtedness 7,829 6,264 Total debt 993,654 1,025,465 Less: Current maturities 24,406 100,188 Long-term debt, net $ 969,248 $ 925,277 balancebalances to the reported debt balances as of December 31, 20192021 and 2018:As of December 31, 2021 As of December 31, 2020
as reported(in thousands) Outstanding Debt Unamortized Discounts and Issuance Costs
Debt,
as reportedOutstanding Debt Unamortized Discounts and Issuance Costs 2017 Senior Notes $ 500,000 $ (3,756) $ 496,244 $ 500,000 $ (4,729) $ 495,271 Term Loan B Term Loan B 419,688 (13,353) 406,335 423,938 (15,480) 408,458 Convertible Notes — — — 69,918 (2,040) 67,878 2017 Credit Facility2020 Revolver were $3.7$2.1 million and $4.8$2.6 million as of December 31, 20192021 and 2018,2020, respectively, and are included in other assets inon the Consolidated Balance Sheets.F-2017 Senior NotesOn April 20, 2017,2020 Credit Agreement) does not exceed 1.35:1.00, (B) in the case of junior lien secured indebtedness, the Total Net Leverage Ratio (as defined in the 2020 Credit Agreement) does not exceed 3.50:1.00 and (C) in the case of unsecured indebtedness, (x) the Total Net Leverage Ratio does not exceed 3.50:1.00 or (y) the Fixed Charge Coverage Ratio (as defined in the 2020 Credit Agreement) is no less than 2.00:1.00.issued $500 millionwill pay a commitment fee to the lenders under the 2020 Revolver in aggregate principal amount of 6.875% Senior Notes due 2025 (the “2017 Senior Notes”) in a private placement offering. Interest on the 2017 Senior Notes is payable in arrears semi-annually in May and November of each year, beginning in November 2017.Prior to May 1, 2020, the Company may redeem the 2017 Senior Notes at a redemption price equal to 100% of their principal amount plus a “make-whole” premium described in the indenture. In addition, prior to May 1, 2020, the Company may redeem up to 40%respect of the original aggregate principal amountunutilized commitments thereunder. The Company will pay customary letter of credit fees. If a payment or bankruptcy event of default occurs and is continuing, the notes at a redemption priceotherwise applicable margin on overdue amounts will be increased by 2% per annum. The agreement includes provisions for the replacement of 106.875% of their principal amountLIBOR with an alternative benchmark rate upon LIBOR being discontinued. The weighted-average annual interest rate on borrowings under the proceeds received by2020 Revolver was 6.5% during the Company from any offering of the Company’s equity. After May 1,year ended December 31, 2021.the Company may redeem the 2017 Senior Notes at specified redemption prices described in the indenture. Upon a change of control, holders of the 2017 Senior Notes may require the Company to repurchase all or part of the 2017 Senior Notes at 101% of the principal amount thereof, plus accrued and unpaid interestCredit Agreement requires, with respect to the redemption date.The 2017 Senior Notes are senior unsecured obligations of2020 Revolver only, the Company and are guaranteed byits restricted subsidiaries to maintain a maximum First Lien Net Leverage Ratio of 2.75:1:00, stepping down to 2.25:1.00 beginning the quarter ending March 31, 2022. The 2020 Credit Agreement also includes certain customary representations and warranties, affirmative covenants and events of default. Subject to certain exceptions, substantially all of the Company’s existing and future material wholly-owned subsidiaries that alsounconditionally guarantee the obligations of the Company under the Company’s2020 Credit Agreement; additionally, subject to certain exceptions, the obligations are secured by a lien on substantially all of the assets of the Company and its subsidiaries guaranteeing these obligations. as defined below. In addition, the indenture for the 2017 Senior Notes provides for customary covenants, including events of default and restrictions on the payment of dividends and share repurchases.2017 Credit FacilityApril 20, 2017,August 18, 2020, the Company entered into aused proceeds from the Term Loan B to repay outstanding amounts under its credit agreement (the “2017 Credit Facility”) with SunTrust Bank, now known as Truist Bank, as Administrative Agent, Swing Line Lender and L/C Issuer and a syndicate of other lenders. The 2017 Credit Facility provides for a $350 million revolving credit facility (the “2017 Revolver”) and a sublimit for the issuance of letters of credit and swingline loans up to the aggregate amount of $150 million and $10 million, respectively, both maturing on April 20, 2022 unless any of the Convertible Notes, as defined below, are outstanding on December 17, 2020, inlenders, at which case all such borrowings will mature on December 17, 2020, provided that (i) if the Convertible Notes are refinanced in full with the proceeds of permitted refinancing indebtedness in accordance with the terms oftime the 2017 Credit Facility the maturity date for the 2017 Credit Facility will remain April 20, 2022was terminated.(ii) if the Company issues “NewRepayment of Convertible Notes” (as defined in the 2017 Credit Facility), the maturity date for the 2017 Credit Facility will be the earlier of (x) April 20, 2022 or December 17, 2020 if Convertible Notes are outstanding on December 17, 2020 and (y) 90 days prior to the maturity date for such New Convertible Notes. The 2017 Credit Facility also permits additional borrowings in an aggregate amount of $150 million, which can be in the form of increased capacity on the 2017 Revolver or the establishment of one or more term loans.Borrowings under the 2017 Revolver bear interest, at the Company’s option, at a rate equal to (a) the London Interbank Offered Rate (“LIBOR”) plus a margin of between 1.50% and 3.00% or (b) a base rate (determined by reference to the highest of (i) the administrative agent’s prime lending rate, (ii) the federal funds effective rate plus 50 basis points, (iii) the LIBOR rate for a one-month interest period plus 100 basis points and (iv) 0%), plus a margin of between 0.50% and 2.00%, in each case based on the Consolidated Leverage Ratio (as defined in the 2017 Credit Facility). In addition to paying interest on outstanding principal under the 2017 Credit Facility, the Company will pay a commitment fee to the lenders under the 2017 Revolver in respect of the unutilized commitments thereunder. The Companywill pay customary letter of credit fees. If an event of default occurs and is continuing, the otherwise applicable margin and letter of credit fees will be increased 2% per annum. The weighted-average annual interest rate on borrowings under the 2017 Revolver was approximately 4.96% during the year ended December 31, 2019.The 2017 Credit Facility contains customary covenants for credit facilities of this type, including maximum consolidated leverage ratios ranging from 4.00:1.00 to 3.25:1.00 over the life of the facility and a minimum consolidated fixed charge coverage ratio of 1.25:1.00. On May 7, 2019, certain provisions of the 2017 Credit Facility were amended, including setting the maximum leverage ratio at 3.50:1.00 for the remainder of its term, thus eliminating the step down from 3.50:1:00 to 3.25:1.00. Substantially all of the Company’s subsidiaries unconditionally guarantee the obligations of the Company under the 2017 Credit Facility; additionally, the obligations are secured by a lien on all personal property of the Company and its subsidiaries guaranteeing these obligations.As of December 31, 2019, there was $236 million available under the 2017 Revolver, and the Company had not utilized the 2017 Credit Facility for letters of credit. The Company was in compliance with the financial covenants under the 2017 Credit Facility as of December 31, 2019.As a result of the aforementioned provision in the 2017 Credit Facility whereby the maturity date of the 2017 Credit Facility may be moved forward from April 20, 2022, the facility will mature on December 17, 2020 if the Convertible Notes remain outstanding at that time (the “spring-forward” provision). While the Company does not have call rights that allow it to unilaterally redeem theTUTOR PERINI CORPORATION AND SUBSIDIARIESNOTES TO CONSOLIDATED FINANCIAL STATEMENTS (Continued)Convertible Notes, it intends to repurchase or exchange the Convertible Notes and/or modify or replace the 2017 Credit Facility during 2020. Various alternatives are under consideration to determine the financing arrangement that is best suited to the Company’s needs and provides the most favorable terms. The Company is currently in discussions with lenders regarding its options. Due to the spring-forward provision in the 2017 Credit Facility, all borrowings under the facility are included in “Current maturities of long-term debt” on the Consolidated Balance Sheet as of December 31, 2019.Convertible NotesTheOn August 19, 2020, the Company used proceeds from the Term Loan B to repurchase $130.1 million aggregate principal amount of the Convertible Notes are unsecured obligationsfor an aggregate purchase price of $132.4 million (including accrued and unpaid interest to the repurchase date). As a result of the repurchase, the Company and do not contain any financial covenants or restrictionsrecognized a $7.1 million loss on extinguishment of debt in 2020, which is included in interest expense in the paymentsConsolidated Statements of dividends,Operations. The Company repaid the incurrenceremaining $69.9 million principal balance of indebtedness or the issuance or repurchase of securities by the Company. The Convertible Notes bear interest at maturity on June 15, 2021 using proceeds from the Term Loan B, which were held in a raterestricted cash account for this purpose. As of 2.875% per year, payable in cash semi-annually in June 15, 2021, the discount and December.(“ (“ASC 470-20”). ASC 470-20 requires issuers of certain convertible debt instruments that may be settled in cash upon conversion to separately account for the liability (debt) and equity (conversion option) components of the instrument in a manner that reflects the issuer’s nonconvertible debt borrowing rate. This is done by allocating the proceeds from issuance to the liability component based on the fair value of the debt instrument excluding the conversion feature, with the residual allocated to the equity component and classified in additional paid in capital. The $46.8 million difference between the initial principal amount of the Convertible Notes ($200.0 million) and the proceeds initially allocated to the liability component ($153.2 million) iswas treated as a discount on the Convertible Notes. This difference is beingwas amortized as non-cash interest expense The debt issuance costs attributable to the liability component of the Convertible Notes ($5.1 million) are also treated as a discount on the Convertible Notes and amortized as non-cash interest expense. The debt issuance costs attributable to the equity component ($1.5 million) were netted with the equity component and are not amortized.(in thousands) December 31, 2020 Liability component: Principal $ 69,918 Conversion feature (46,800) Allocated debt issuance costs (5,051) Amortization and extinguishment of discount and debt issuance costs (non-cash interest expense) 49,811 Net carrying amount $ 67,878 Equity component: Conversion feature $ 46,800 Reacquisition of conversion option from repurchase of notes, net of tax (764) Allocated debt issuance costs (1,543) Deferred taxes (18,815) Net carrying amount $ 25,678 Prior to January 15, 2021,Convertible Notes will be convertible only under the following circumstances: (1) during the five business day period after any 10 consecutive trading day periodCompany issued $500 million in which the trading price per $1,000aggregate principal amount of Convertible6.875% Senior Notes for such trading day was less than 98% of the product of the last reported sale price of the Company’s common stock and the conversion rate on each such trading day; (2) if the last reported sale price of the common stock for at least 20 trading days (whether or not consecutive) duringdue May 1, 2025 (the “2017 Senior Notes”) in a period of 30 consecutive trading days endingprivate placement offering. Interest on the last trading day2017 Senior Notes is payable in arrears semi-annually in May and November of each year, beginning in November 2017.immediately preceding calendar quarter is greater than or equal to 130% of the conversion rate of 33.0579 (or $39.32) on each applicable trading day; or (3) upon the occurrence of2017 Senior Notes at specified corporate events. On or after January 15, 2021 until the close of business on the second scheduled trading day immediately preceding the maturity date, holders may convert all or any portion of their notes, in multiples of $1,000 principal amount, at the option of the holder regardless of the foregoing circumstances.The Convertible Notes will be convertible at an initial conversion rate of 33.0579 shares of the Company’s common stock per $1,000 principal amount of the Convertible Notes, which is equivalent to an initial conversion price of approximately $30.25. The conversionTUTOR PERINI CORPORATION AND SUBSIDIARIESNOTES TO CONSOLIDATED FINANCIAL STATEMENTS (Continued)rate will be subject to adjustment for some events but will not be adjusted for any accrued and unpaid interest. In addition, following certain corporate events that occur prior to the maturity date, the Company is required to increase, in certain circumstances, the conversion rate for a holder who elects to convert their Convertible Notes in connection with such a corporate event including customary conversion rate adjustments in connection with a “make-whole fundamental change”redemption prices described in the indenture. Upon conversion,a change of control, holders of the 2017 Senior Notes may require the Company to repurchase all or part of the 2017 Senior Notes at 101% of the principal amount thereof, plus accrued and atunpaid interest to the redemption date.election,existing and future subsidiaries that also guarantee obligations under the Company may satisfy its conversion obligation with cash, sharesCompany’s 2020 Credit Agreement, as defined above. In addition, the indenture for the 2017 Senior Notes provides for customary covenants, including events of its common stock or a combination thereof. Asdefault and restrictions on the payment of December 31, 2019, the conversion provisions of the Convertible Notes have not been triggered.$27.7$41.7 million and $38.6$36.9 million at December 31, 20192021 and 2018,2020, respectively, with interest rates ranging from 2.62%2.54% to 3.89% with equal monthly installment payments over periods up to ten years with additional balloon payments of $12.4 million in 2021 and $6.3 million in 2022 on the remaining loans outstanding at December 31, 2019.5 years. The aggregate balance of mortgage loans was approximately $11.5$14.6 million and $12.3$10.7 million at December 31, 20192021 and 2018,2020, respectively, with interest rates ranging from a fixed 3.50%2.25% to LIBOR plus 3% and equal monthly installment payments over periods up to ten10 years, as well as one loan with additionala balloon paymentspayment of $2.9 $6.8 million in 2021 and $7.0 milliondue in 2023.2022 $ 24,406 2023 23,187 2024 16,137 2025 2025 539,888 2026 2026 8,578 Thereafter 398,567 1,010,763 Less: Unamortized discounts and issuance costs Less: Unamortized discounts and issuance costs 17,109 Total $ 993,654 For the year ended December 31, (in thousands) 2021 2020 2019 Cash interest expense: Interest on 2017 Senior Notes $ 34,375 $ 34,375 $ 34,375 Interest on Term Loan B 24,590 9,028 — Interest on 2020 Revolver 1,479 77 — Interest on 2017 Credit Facility — 5,341 11,990 Interest on Convertible Notes 921 4,373 5,750 Other interest 1,905 2,079 2,172 Cash portion of loss on extinguishment — 786 — Total cash interest expense 63,270 56,059 54,287 Amortization of discount and debt issuance costs on Convertible Notes 2,040 8,944 10,811 Amortization of discount and debt issuance costs on Term Loan B 2,175 784 — Amortization of debt issuance costs on 2020 Revolver 568 206 — Amortization of debt issuance costs on 2017 Credit Facility — 1,001 1,552 Amortization of debt issuance costs on 2017 Senior Notes 973 906 844 Non-cash portion of loss on extinguishment — 8,312 — Total non-cash interest expense 5,756 20,153 13,207 Total interest expense $ 69,026 $ 76,212 $ 67,494 _____________________________________________________________________________________________________________TUTOR PERINI CORPORATION AND SUBSIDIARIESNOTES TO CONSOLIDATED FINANCIAL STATEMENTS (Continued)(a) The combination of cash and non-cash interest expense produces effective interest rates that are higher than contractual rates. Accordingly, the effective interest rates for the 2017 Senior Notes, Term Loan B and the Convertible Notes were 7.13%, 6.48% and 9.39%, respectively, for the year ended December 31, 20192021..2019,2021, the Company cannot predict the ultimate outcome of the investigation and cannot reasonably estimatehas concluded that the potential loss or range of loss thatfor a material adverse financial impact on Five Star or the Company may incur or the impact of the resultsas a result of the investigation on Five Star or the Company.large diameterlarge-diameter bored tunnel in downtown Seattle, King County, Washington to replace the Alaskan Way Viaduct, also known as State Route 99. The Company has a 45% interest in STP.large diameterlarge-diameter bored tunnel required the use of a tunnel boring machine (“TBM”). In December 2013, the TBM struck a steel pipe, installed by WSDOT as a well casing for an exploratory well. The TBM was significantly damaged and was required to be repaired. STP has asserted that the steel pipe casing was a differing site condition that WSDOT failed to properly disclose. The Disputes Review Board mandated by the contract to hear disputes issued a decision finding the steel casing was a Type I (material) differing site condition. WSDOT hasdid not acceptedaccept that finding.has also joined the case as a plaintiff for costs incurred to repair the damages to the TBM.TUTOR PERINI CORPORATION AND SUBSIDIARIESNOTES TO CONSOLIDATED FINANCIAL STATEMENTS (Continued)effectively limited some of the potential recoveryrecoveries under the Policy for STP, WSDOT and Hitachi. However, on December 19, 2018,On August 2, 2021, the Court of Appeal granted the Company’s request for a discretionary appealAppeals reversed in part certain of those limitations but affirmed other parts of those rulings. The appeal is expected to be heard in mid to late 2020.On January 5, 2022, the Washington Supreme Court issued an order granting STP, submitted damages toWSDOT and Hitachi’s requests for discretionary review of the Insurers inportions of the King County lawsuit inCourt of Appeals’ decision that affirmed the amountApril and September 2018 decisions. STP also asserted $532 million of $532 million. STP is also seeking these damages from WSDOT related to the pipe-strike by the TBM in a related lawsuit in Thurston County (see following paragraph).foralleging breach of contract, alleging STP’s delays and failure to perform, seeking $57.2 million in delay-related damages and seeking declaratory relief concerning contract interpretation. STP filed its answer tocausedreleased and dismissed the release and dismissal of claims that STP and Hitachi had against each other. The jury trial between STP and WSDOT commenced on October 7, 2019 and concluded on December 13, 2019, with a jury verdict in favor of WSDOT awarding them $57.2 million in damages. Judgment was entered on January 10, 2020, and a notice ofSTP appealed the decision. The appeal was filed byargued on December 10, 2021 and STP on January 17, 2020.million. The charge includes a pre-tax accrual ofmillion, which included $25.7 million (which isfor the Company’s 45% proportionate share of the $57.2 million in damages awarded by the jury to WSDOT).WSDOT. Payment of damages will only be made if the adverse verdict is upheld on appeal, as the payment is secured by a bond for the course of the appeal. Other than the possible future cash payment in cash of $25.7 million infor damages, the charge iswas for non-cash write-downs primarily related to the costs and estimated earnings in excess of billings and receivables that the Company previously recorded to reflect its expected recovery in this case.CorporationCorp. (“TPBC”) entered into a contract with the George Washington Bridge Bus Station Development Venture, LLC (the “Developer”) to renovate the George Washington Bridge Bus Station, a mixed-use facility owned by the Port Authority of New York and New Jersey (the “Port Authority”) that serves as a transit facility and retail space. The $100 million project experienced significant design errors and associated delays, resulting in damages to TPBC and its subcontractors, including WDF and Five Star, wholly owned subsidiaries of the Company. The project reached substantial completion on May 16, 2017.panel, and were expected to continue over various weeks through March 2020. On April 15, 2019, the counsel for the Developer withdrew from the case, which resulted in further delays to the proceedings.panel. On June 4, 2019, the arbitration panel, as confirmed by the U.S. District Court in the Southern District of New York, issued a writ of attachment for $23 million of the $29 million discussed above. On October 7, 2019, the Developer filed for bankruptcy protection in the Southern District of New York under Chapter 11 of the Bankruptcy Code. The filing for bankruptcy stayed the pending arbitration proceedings. TPBC appeared in the bankruptcy proceedings on October 8, 2019 and filed a Proof of Claim in the amount of $113 million on December 13, 2019.of New York and New Jersey, as owner of the project, and STV Incorporated, as designer, seeking the same $113 million in damages.damages pursuant to the lease agreement between the Port Authority and the Developer. On January 13, 2020,August 20, 2018, the Court dismissed STV Incorporated fromPort Authority filed a motion to dismiss all causes of action, which was denied by the case. Thatcourt on July 1, 2019. The Portis proceedingin state court against the Port Authority of New York and New Jersey.the CompanyTPBC filed separate litigation in the United StatesU.S. District Court for the Southern District of New York in which the CompanyTPBC asserted related claims against individual owners of the Developer for their wrongful conversion of project funds and against certain lenders that received interest payments from project funds and other amounts earmarked to pay the contractors.2019,2021, the Company has concluded that the potential for a material adverse financial impact due to the Developer’s claims is remote. With respect to TPBC’s claims against the Developer, its owners, certain lenders and the Port Authority, of New York and New Jersey, management has made an estimate of the total anticipated recovery on this project, and such estimate is included in revenue recorded to date.TUTOR PERINI CORPORATION AND SUBSIDIARIESNOTES TO CONSOLIDATED FINANCIAL STATEMENTS (Continued)2019,2021, the Company’s operating leases have remaining lease terms ranging from less than one year to 1017 years, some of which include options to renew the leases. The exercise of lease renewal options is generally at the Company’s sole discretion. The Company’s leases do not contain any material residual value guarantees or material restrictive covenants.ROUright-of-use (“ROU”) assets are included in other assets, while current and long-term operating lease liabilities are included in accrued expenses and other current liabilities, and other long-term liabilities, respectively, on the Consolidated Balance Sheet as of December 31, 2019.Sheets. ROU assets represent the Company’s right to use an underlying asset for the lease term and lease liabilities represent the Company’s obligation to make lease payments arising from the lease. ROU assets and lease liabilities are recognized at the commencement date based on the present value of lease payments over the lease term. The present value of future lease payments are discounted using either the implicit rate in the lease, if known, or the Company’s incremental borrowing rate for the specific lease as of the lease commencement date. The ROU asset is also adjusted for any prepayments made or incentives received. The lease terms include options to extend or terminate the lease only to the extent it is reasonably certain any of those options will be exercised. Lease expense is recognized on a straight-line basis over the lease term. The Company accounts for lease components (e.g., fixed payments) separate from the non-lease components (e.g., common-area maintenance costs). The Company does not have any material financing leases.yearyears ended December 31, 2019:Year Ended(in thousands)December 31, 2019Operating lease expense$15,854Short-term lease expense(a)72,56288,416Less: Sublease income1,077Total lease expense$87,339For the year ended December 31, (in thousands) 2021 2020 Operating lease expense $ 14,733 $ 14,547 72,047 87,969 86,780 102,516 Less: Sublease income 697 1,026 Total lease expense $ 86,083 $ 101,490 year.year. Short-term leases include, among other things, construction equipment rented on an as-needed basis as well as temporary housing.leases as of December 31, 2019:As of December 31,(dollars in thousands)Balance Sheet Line Item2019AssetsROU assetsOther assets$40,156Total lease assets$40,156LiabilitiesCurrent lease liabilitiesAccrued expenses and other current liabilities$11,392Long-term lease liabilitiesOther long-term liabilities31,900Total lease liabilities$43,292Weighted-average remaining lease term (in years)5.0Weighted-average discount rate5.96%TUTOR PERINI CORPORATION AND SUBSIDIARIESNOTES TO CONSOLIDATED FINANCIAL STATEMENTS (Continued)As of December 31, (dollars in thousands) Balance Sheet Line Item 2021 2020 Assets ROU assets Other assets $ 53,462 $ 55,897 Total lease assets $ 53,462 $ 55,897 Liabilities Current lease liabilities Accrued expenses and other current liabilities $ 7,481 $ 7,661 Long-term lease liabilities Other long-term liabilities 50,057 51,336 Total lease liabilities $ 57,538 $ 58,997 Weighted-average remaining lease term 12.0 years 12.5 years Weighted-average discount rate 9.44 % 9.22 % leases for the year ended December 31, 2019:Year Ended(in thousands)December 31, 2019Operating cash flow information:Cash paid for amounts included in the measurement of lease liabilities$(15,658)Non-cash activity:ROU assets obtained in exchange for lease liabilities$9,784As of December 31, (in thousands) 2021 2020 Operating cash flow information: Cash paid for amounts included in the measurement of lease liabilities $ (13,799) $ (14,591) Non-cash activity: ROU assets obtained in exchange for lease liabilities $ 6,979 $ 29,244 2019:As of December 31, 2018, future minimum lease payments under long-term non-cancelable operating leases as classified under ASC 840 were as follows:10. Other Income, NetOn May 31, 2017, the Company entered into a settlement agreement with Merrill Lynch, Pierce, Fenner & Smith Incorporated (“Merrill Lynch”), as successor in interest to Banc of America Securities LLC and Bank of America, N.A. (collectively “BofA”), to resolve the pending litigation between the Company and Merrill Lynch. The litigation, which was filed by the Company in 2011, related to the Company’s purchase of certain auction-rate securities from BofA.On June 6, 2017, the Company received the $37.0 million cash settlement payment agreed to in the settlement agreement, and the pending litigation was dismissed with prejudice. Neither party made any admission of liability or wrongdoing, and the settlement agreement includes mutual releases of all claims and liabilities related to the subject matter of the pending litigation.The Company recognized the settlement as a gain and reported it as a component of other income, net in its Consolidated Statement of Operations for the year ended December 31, 2017.TUTOR PERINI CORPORATION AND SUBSIDIARIESNOTES TO CONSOLIDATED FINANCIAL STATEMENTS (Continued)Operating Leases 2022 $ 12,372 2023 9,622 2024 7,673 2025 6,803 2026 5,640 Thereafter 60,833 Total lease payments 102,943 Less: Imputed interest 45,405 Total $ 57,538 11.The Current Plan provides for various types of share-based grants, including restricted and unrestricted stock units and stock options. Restricted and unrestricted stock units give the holder the right to exchange their stock units for shares of the Company’s common stock on a one-for-one basis. Stock options give the holder the right to purchase shares of the Company’s common stock subsequent to the vesting date at a defined exercise price. A stock option exercise price must be equal to or greater than the fair value of the Company’s common stock on the date of the award. Restricted stock units and stock options are usually subject to certain service and performance conditions as well as other restrictions. The term for stock options is limited to 10 years from the award date. As of December 31, 2019,2021, there were 1,241,8791,243,070 shares of common stock available for grant under the Company’s Current Plan. As of December 31, 2019,2021, the Plans had an aggregate of 4,144,015 of3,356,616 restricted stock units and stock options from outstanding, historical awards that either have not vested or have vested but have not been exercised. Any awards that were granted under the 2014 Plan or the 2017 PlanPlans that are forfeited, cancelled or held back for net settlement will become available to be issued under the Current Plan. During the years ended December 31, 2019 and 2018, the Company did 0t settle any awards in cash. During the year ended December 31, 2017, the Company paid approximately $0.6 million to settle share-based awards. As a result, as of December 31, 2019, the Company had outstanding awards with 75,000 restricted stock units and 75,000 stock options that had not been granted yet. These units will be granted in 2020 when the performance targets for those respective years are established.and stock option and CPSU activity:Restricted Stock Units Stock Options CPSUs Number Weighted-
Average
Grant Date
Fair Value
Per ShareNumber Weighted-
Average
Exercise/
(Strike) Price
Per ShareNumber Weighted-
Average Grant Date
Fair Value
Per UnitOutstanding as of December 31, 2018 1,469,000 $ 27.27 2,943,044 $ 20.89 — $ — Granted 530,000 20.23 220,000 19.66 — — Expired or cancelled (104,029) 28.98 (884,029) 21.03 — — Vested/exercised (179,971) 25.39 — — — — Outstanding as of December 31, 2019 1,715,000 $ 25.19 2,279,015 $ 20.62 — $ — Granted 245,000 20.67 165,000 19.24 — — Expired or cancelled (403,750) 25.52 (168,750) 25.87 — — Vested/exercised (521,250) 29.44 — — — — Outstanding as of December 31, 2020 1,035,000 $ 21.85 2,275,265 $ 20.13 — $ — Granted 678,851 16.26 100,000 19.24 398,852 20.39 Expired or cancelled (155,000) 15.37 (202,500) 20.07 — — Vested/exercised (370,000) 23.53 (5,000) 13.32 — — Outstanding as of December 31, 2021 1,188,851 $ 18.98 2,167,765 $ 20.11 398,852 $ 20.39 F-TUTOR PERINI CORPORATION AND SUBSIDIARIESNOTES TO CONSOLIDATED FINANCIAL STATEMENTS (Continued)units,awards, which are generally issued to the non-employee members of the Company’s Board of Directors as part of their annual retainer fees:Unrestricted Stock Awards Year Number Weighted-Average
Grant Date
Fair Value Per Share2019 98,591 $ 15.72 2020 194,177 8.60 2021 101,894 15.47 Unrestricted stock units vest immediately upon grant and are converted to shares of the Company’s stock on a one-for-one basis. unitsawards issued during 2019, 20182021, 2020 and 20172019 was approximately $1.6 million, $1.7 million and $1.5 million, $2.5 million and $2.6 million, respectively.2019, 20182021, 2020 and 20172019 was approximately $5.3 million, $4.1 million and $3.1 million, $7.9 million and $25.3 million, respectively. There were 0 stock options exercised during 2019 or 2018. The aggregate intrinsic value, representing the difference between the market value on the date of exercise and the option price of the stock options exercised during 2017 was $1.3 million, with a corresponding tax benefit of $0.6 million. As of December 31, 2019,2021, the balance of unamortized restricted stock, and stock option and CPSU expense was $17.3$12.9 million, $2.0 million and $3.6$6.8 million, respectively, which is expected to be recognized over weighted-average periods of 2.01.9 years for restricted stock units, and 1.81.9 years for stock options.options and 2.0 years for CPSUs.2,279,0152,167,765 outstanding stock options as of December 31, 20192021 had an intrinsic value of $0.9$0.6 million and a weighted-average remaining contractual life of 5.53.8 years. Of those outstanding options: (1) 1,509,0151,842,765 were exercisable with an intrinsic value of $0.9$0.6 million, a weighted-average exercise price of $19.69$20.77 per share and a weighted-average remaining contractual life of 4.13.0 years; (2) 770,000 have been granted but325,000 have not vested withand have no intrinsic value, a weighted-average exercise price of $22.44$16.37 per share and a weighted-average remaining contractual life of 8.48.5 years. Of the granted butThe 325,000 unvested stock options 770,000,include 187,500 with time-based or market-based vesting conditions that are expected to vest.The fair value of restricted and unrestricted stock units is based on the closing price of the Company’s common stock on the New York Stock Exchange on the date of the grant and the fair value of stock options is based on the Black-Scholes model. Certain performance-based awards contain market condition components tiedvest, as well as 137,500 with market-based vesting conditions that are not expected to the Company’s total shareholder return in relation to its peer companies, as calculated over a multi-year performance period (“TSR awards”). The fair value of the TSR awards is determined using a Monte Carlo simulation model. Significant assumptions used in this simulation model include the Company’s expected volatility, a risk-free rate based on U.S. Treasury yield curve rates with maturities consistent with the performance period, and the volatilities for each of the Company’s peers. The ultimate payout on TSR awards is determined at the end of the performance period and will vary based on actual total shareholder return performance results. Compensation expense related to the TSR awards is recognized regardless of whether the market condition is satisfied, provided that the requisite service period has been completed.Year Ended December 31, 2021 2020 2019 Total stock options granted 100,000 165,000 220,000 Weighted-average grant date fair value $ 15.21 $ 7.67 $ 7.59 Weighted-average assumptions: Risk-free rate 1.4 % 1.2 % 2.1 % 6.5 years 6.3 years 6.1 years 73.7 % 60.7 % 39.4 % Expected quarterly dividends $ — $ — $ — _____________________________________________________________________________________________________________2019, 20182021, 2020 and 2017,2019, the Company recognized, as part of general and administrative expenses, costs for share-based payment arrangements for employees of $17.5$10.0 million, $21.1$10.2 million and $19.6$17.5 million. Additionally for the same periods, the Company recognized as part of general and administrative expenses, costs for share-based awards to non-employee directors of $1.6 million $1.7 million and $1.6 million, respectively.for each of the three years. The aggregate tax benefits for these awards were approximately $2.9$1.2 million, $3.8$1.3 million and $8.7$2.9 million, for the respective periods.TUTOR PERINI CORPORATION AND SUBSIDIARIESNOTES TO CONSOLIDATED FINANCIAL STATEMENTS (Continued)12.11. Employee Benefit Plans2019, 20182021, 2020 and 2017:Year Ended December 31, (in thousands) 2021 2020 2019 Interest cost $ 2,349 $ 3,032 $ 3,801 Service cost 935 925 900 Expected return on plan assets (3,976) (4,022) (4,170) Recognized net actuarial losses 2,860 2,407 1,933 Net periodic benefit cost $ 2,168 $ 2,342 $ 2,464 Actuarial assumptions used to determine net cost: Discount rate 2.24 % 3.07 % 4.12 % Expected return on assets 5.75 % 5.75 % 5.75 % Rate of increase in compensation N/A N/A N/A 20202022 and the actual asset allocation as of December 31, 20192021 and 20182020 by asset category are as follows:Percentage of Plan Assets as of December 31, Actual Allocation Asset Category 2021 2020 Cash 5 % 4 % 5 % Equity funds: Domestic 47 47 34 International 15 16 17 Fixed income funds 33 33 44 Total 100 % 100 % 100 % F-TableDue to the election of ContentsTUTOR PERINI CORPORATION AND SUBSIDIARIESNOTES TO CONSOLIDATED FINANCIAL STATEMENTS (Continued)Thecertain options provided under the American Rescue Plan Act of 2021, enacted on March 11, 2021, the Company expectsis not required to contribute approximately $4.1 millionadditional amounts to itsthe defined benefit pension plan in 2020.(in thousands) Year ended December 31, 2022 $ 6,881 2023 6,795 2024 6,747 2025 6,657 2026 6,580 2027-2031 30,545 Total $ 64,205 20192021 and 2018,2020, and a summary of the funded status as of December 31, 20192021 and 2018:Year Ended December 31, (in thousands) 2021 2020 Change in Fair Value of Plan Assets Balance at beginning of year $ 71,940 $ 73,357 Actual return on plan assets 6,844 899 Company contribution 1,235 4,408 Benefit payments (6,644) (6,724) Balance at end of year $ 73,375 $ 71,940 Year Ended December 31, (in thousands) 2021 2020 Change in Benefit Obligations Balance at beginning of year $ 107,824 $ 102,607 Interest cost 2,349 3,032 Service cost 935 925 Assumption change (gain) loss Assumption change (gain) loss (3,921) 7,902 Actuarial loss Actuarial loss 983 81 Benefit payments (6,644) (6,723) Balance at end of year $ 101,526 $ 107,824 As of December 31, (in thousands) 2021 2020 Funded status $ (28,151) $ (35,884) Net unfunded amounts recognized in Consolidated Balance Sheets consist of: Current liabilities $ (292) $ (293) Long-term liabilities (27,859) (35,591) Total net unfunded amount recognized in Consolidated Balance Sheets $ (28,151) $ (35,884) $57.6$65.2 million as of December 31, 20192021 and 2018,2020, respectively.In 2019, net other comprehensive income of $1.2 million consisted of reclassification adjustments for the amortization of previously existing actuarial losses and net actuarial losses arising during the period. In 2018, net other comprehensive income of $1.1 million consisted of reclassification adjustments for the amortization of previously existing actuarial losses and net actuarial gains arising during the period. In 2017, net other comprehensive income of $2.4 million consisted of reclassification adjustments for the amortization of previously existing actuarial losses and net actuarial gains arising during the period.The estimated amount of the net accumulated loss (consisting of net actuarial losses) that will be amortized from accumulated other comprehensive loss into net periodic benefit cost in 2020 is $2.4 million.TUTOR PERINI CORPORATION AND SUBSIDIARIESNOTES TO CONSOLIDATED FINANCIAL STATEMENTS (Continued)3.1%2.7% as of December 31, 20192021 and 4.1%2.2% as of December 31, 2018.2020. The discount rate used for the accumulated post-retirement obligation was derived using a blend of U.S. Treasury and high-quality corporate bond discount rates.2019both 2021 and 6.0% for 2018.2020. The expected long-term rate of return on assets assumption was developed considering forward looking capital market assumptions and historical return expectations for each asset class assuming the plans’ target asset allocation and full availability of invested assets.long-shortinvestments in both long and short equity and long equity, event-driven, multi-strategy and distressed credit.Registered investment companiesMutual funds are public investment vehicles valued using the Net Asset Value (“NAV”) of shares held by the pension plan at year-end. Equity partnerships and fixed income funds are valued based on quoted market prices in active markets. Closely held funds, held by the pension plan, which are only available through private offerings, do not have readily determinable fair values. Estimates of fair value of these funds were determined using the information provided by the fund managers and are generally based on the NAV per share or its equivalent.13:12:As of December 31, 2021 As of December 31, 2020 Fair Value Hierarchy Fair Value Hierarchy (in thousands) Level 1 Level 2 Level 3 Total Level 1 Level 2 Level 3 Total Cash and cash equivalents $ 2,533 $ — $ — $ 2,533 $ 1,582 $ — $ — $ 1,582 Fixed income funds — 3,057 — 3,057 2,000 3,086 — 5,086 Mutual funds 54,966 — — 54,966 54,671 — — 54,671 $ 57,499 $ 3,057 $ — $ 60,556 $ 58,253 $ 3,086 $ — $ 61,339 Equity partnerships 4,259 3,700 Hedge fund investments 8,560 6,901 12,819 10,601 Total $ 57,499 $ 3,057 $ — $ 73,375 $ 58,253 $ 3,086 $ — $ 71,940 _____________________________________________________________________________________________________________CloselyThe pension plan’s investments in closely held funds in private investment were comprised of a combination of Level 1, 2 and 3 investments, but wereare not categorized in the fair value hierarchy because they wereare measured at NAV using the practical expedient under ASC 820, Fair Value Measurement (“ASC 820”). The underlying holdings of closely held funds were comprised of a combination of Level 1, 2 and 3 investments, and in some cases, may also include investments not categorized in the fair value hierarchy because they are measured at NAV using the practical expedient, as described above.20192021 and 2018,2020, pension plan assets included approximately $13.5$12.8 million and $16.5$10.6 million, respectively, of investments in hedge funds and equity partnerships which do not have readily determinable fair values. The underlying holdings of the funds were comprised of a combination of assets for which the estimate of fair value is determined using information provided by fund managers.As of December 31, 2021 As of December 31, 2020 (in thousands) Pension
PlanBenefit
Equalization
PlanTotal Pension
PlanBenefit
Equalization
PlanTotal Projected benefit obligation $ 98,570 $ 2,956 $ 101,526 $ 104,657 $ 3,167 $ 107,824 Accumulated benefit obligation $ 98,570 $ 2,956 $ 101,526 $ 104,657 $ 3,167 $ 107,824 Fair value of plans' assets 73,375 — 73,375 71,940 — 71,940 Projected benefit obligation greater than fair value of plans' assets $ 25,195 $ 2,956 $ 28,151 $ 32,717 $ 3,167 $ 35,884 Accumulated benefit obligation greater than fair value of plans' assets $ 25,195 $ 2,956 $ 28,151 $ 32,717 $ 3,167 $ 35,884 2019TUTOR PERINI CORPORATION AND SUBSIDIARIESNOTES TO CONSOLIDATED FINANCIAL STATEMENTS (Continued)and $4.2 million in both 2018 and 2017.2019. The Company’s contribution is based on a non-discretionary match of employees’ contributions, as defined by the plan.2019:2021:Pension Protections Act
Zone StatusCompany Contributions
(amounts in millions)Expiration
Date of
Collective
Bargaining
AgreementPension Fund EIN/Pension
Plan Number2021 2020 2020 2019 Surcharge
ImposedThe Pension, Hospitalization and Benefit Plan of the Electrical Industry - Pension Trust Fund 13-6123601/001 Green Green N/A $ 9.5 $ 10.1 (c) $ 9.3 (c) No 4/13/2022 Joint Pension Fund, Local Union 164 IBEW 22-6031199 Green Yellow Implemented 6.8 2.5 0.8 No 6/2/2025 Excavators Union Local 731 Pension Fund 13-1809825/002 Green Green N/A 4.0 4.8 5.1 No 4/30/2026 Carpenters Pension Trust Fund for Northern California 94-6050970 Red Red Implemented 2.9 4.6 (d) 4.0 No 6/30/2023 Northern California Electrical Workers Pension Plan 94-6062674 Green Green N/A 2.8 3.5 (c) 3.0 No 5/31/2022 _____________________________________________________________________________________________________________These amounts exceeded 5% of the respective totalThe “FIP/RP Status Pending or Implemented” column indicates plans for which a funding improvement plan contributions.(“FIP”) or a rehabilitation plan (“RP”) is either pending or implemented.2019 and 20182021 plan yearsyear for any of the above pension funds, excluding Excavators Union Local 731funds.Fund, Northern California Electrical Workers Pension Plan and Steamfitters Industry PensionTrust Fund for the 2018 plan year.Northern California.$31.4$43.6 million in 2019, $29.32021, $44.3 million in 20182020 and $27.8$35.7 million in 20172019 to other multiemployer pension plans. Funding for these payments is principally provided for in the contracts with our customers.13.•Level 1 inputs are observable quoted prices in active markets for identical assets or liabilities•Level 2 inputs are observable, either directly or indirectly, but are not Level 1 inputs•Level 3 inputs are unobservableTUTOR PERINI CORPORATION AND SUBSIDIARIESNOTES TO CONSOLIDATED FINANCIAL STATEMENTS (Continued)20192021 and 2018:As of December 31, 2021 As of December 31, 2020 Fair Value Hierarchy Fair Value Hierarchy (in thousands) Level 1 Level 2 Level 3 Total Level 1 Level 2 Level 3 Total $ 202,197 $ — $ — $ 202,197 $ 374,289 $ — $ — $ 374,289 9,199 — — 9,199 77,563 — — 77,563 — 84,355 — 84,355 — 78,912 — 78,912 27,472 58,856 — 86,328 92,609 1,300 — 93,909 Total $ 238,868 $ 143,211 $ — $ 382,079 $ 544,461 $ 80,212 $ — $ 624,673 _____________________________________________________________________________________________________________2019,2021, consist of investments in corporate debt securities of $35.8$46.7 million, U.S. government agency securities of $33.8$37.1 million and corporate certificates of deposits of $1.4$0.6 million, all with maturities of up to five years, and are valued based on pricing models, which are determined from a compilation of primarily observable market information, broker quotes in non-active markets or similar assets and are therefore classified as Level 2 assets. As of December 31, 2018,2020, restricted investments consisted of investments in corporate debt securities of $30.4 million and U.S. government agency securities of $27.7$40.5 million, corporate debt securities of $37.5 million and corporate certificates of deposits of $0.9 million, all with maturities20192021 and 20182020 was not materially different from the fair value.20192021 are comprised of corporate debt securities of $57.5 million, money market funds of $89.6$27.5 million and municipal bonds of $1.2$1.3 million. The fair values of the money market funds are measured using quoted market prices; therefore, they are classified as Level 1 assets. The corporate and municipal bonds have maturity periods up to five years, and their fair values are determined from a compilation of municipal bonds are measured using readily available pricing sources for comparable instruments;primarily observable market information, third-party quoted market prices, broker quotes in non-active markets or similar assets; therefore, they are classified as Level 2 assets. As of December 31, 2018,2020, investments in lieu of retainage consisted of money market funds of $62.9$92.6 million and municipal bonds of $1.2$1.3 million. The amortized cost of these available-for-sale securities at December 31, 20192021 and 20182020 was not materially different from the fair value.The Company did not have material transfers between Levels 1 and 2 during the years ended December 31, 2019 and 2018.$485.0$504.9 million and $466.8$495.0 million as of December 31, 20192021 and 2018,2020, respectively. The fair value of the Convertible Notes was $193.4 million and $184.4$69.1 million as of December 31, 20192020 and 2018, respectively.the Company repaid the remaining principal balance of the notes at maturity on June 15, 2021. The fair values of the 2017 Senior Notes and Convertible Notes were determined using Level 1 inputs, specifically current observable market prices. The fair value of the Term Loan B was $419.7 million and $425.0 million as of December 31, 2021 and 2020, respectively, and was determined using Level 2 inputs, specifically third-party quoted market prices. The reported value of the Company’s remaining borrowings approximates fair value as of December 31, 20192021 and 2018.During the year ended December 31, 2019, the Company acquired an additional 25% interest in a Civil segment joint venture. The Company’s 50% ownership interest prior to the acquisition was accounted for under the proportionate consolidation method and had a carrying value of $3.2 million. Through this acquisition, the Company’s interest increased from 50% to 75%, and it obtained a controlling financial interest in the joint venture, thereby requiring consolidation by the Company. The transaction was accounted for as a business combination achieved in stages, and under ASC 805, Business Combinations, the previously held equity interest in the joint venture was remeasured at the acquisition date fair value with the resulting gain of $37.8 million recognized in earnings, which was included in general and administrative expenses in the Company’s Consolidated Statement of Operations. The fair value of the joint venture and the Company’s existing investment therein was determined based on the fair value of the underlying assets and liabilities acquired by applying an income approach that used discounted future estimated cash flows based on projected revenues, expenses and weighted-average cost of capital. The fair value of the assets and liabilities of the joint venture was recognized in the Company’s consolidated financial statements as of the acquisition date with the 25% interest not owned by the Company recorded as a noncontrolling interest. The acquisition resulted in the recording of an intangible asset for construction contract backlog of $75.6 million. The fair values of the other assets acquired and liabilities assumed were not material. Pro forma results of operations for this acquisition of additional interest in the joint venture have not been presented because they are not material to the Company’s results of operations.14.2020.TUTOR PERINI CORPORATION AND SUBSIDIARIESNOTES TO CONSOLIDATED FINANCIAL STATEMENTS (Continued)thea joint venture is a VIE.2019,2021, the Company had unconsolidated VIE-related current assets and liabilities of $1.5$0.7 million and $1.4$0.4 million, respectively, included in the Company’s Consolidated Balance Sheet. As of December 31, 2018,2020, the Company had unconsolidated VIE-related current assets and liabilities of $4.0$0.6 million and $3.8$0.5 million, respectively, included in the Company’s Consolidated Balance Sheet. The Company’s maximum exposure to loss as a result of its investments in unconsolidated VIEs is typically limited to the aggregate of the carrying value of the investment and future funding commitments. There were no future funding requirements for the unconsolidated VIEs as of December 31, 2019.2019,2021, the Company’s Consolidated Balance Sheet included current and noncurrent assets of $365.0$568.2 million and $52.0$3.0 million, respectively, as well as current liabilities of $556.1$496.9 million related to the operations of its consolidated VIEs. As of December 31, 2018,2020, the Company’s Consolidated Balance Sheet included current and noncurrent assets of $173.9$405.7 million and $51.5$14.2 million, respectively, as well as current liabilities of $319.9$514.9 million related to the operations of its consolidated VIEs.aan original combined value of approximately $2.8 billion. The$1.4 billion transportation infrastructure project in Newark, New Jersey.Jersey with an original value of approximately $1.4 billion. The Company has an 80% interest in the joint venture with the remaining 20% held by Parsons. The joint venture was initially financed with contributions from the partners and, per the terms of the joint venture agreement, the partners may be required to provide additional capital contributions in the future. The Company has determined that this joint venture is a VIE for which the Company is the primary beneficiary.15.TUTOR PERINI CORPORATION AND SUBSIDIARIESNOTES TO CONSOLIDATED FINANCIAL STATEMENTS (Continued)high-rise residential, hospitality and gaming, transportation, health care, commercial andoffices, government offices,facilities, sports and entertainment, education, correctional facilities, biotech, pharmaceutical, industrial and technology. and pneumatically placed concrete for a full range of civil and building construction projects in the industrial, commercial, hospitality and gaming, and mass-transit end markets. This segment provides the Company with unique strengths and capabilities that allow the Company to position itself as a full-service contractor with greater control over scheduled work, project delivery, and cost and risk management.2019, 20182021, 2020 and 2017:2019:Reportable Segments (in thousands) Civil Building Specialty
ContractorsTotal Corporate Consolidated
TotalYear ended December 31, 2021 Total revenue $ 2,443,828 $ 1,574,759 $ 1,120,115 $ 5,138,702 $ — $ 5,138,702 Elimination of intersegment revenue (348,068) (146,657) (2,147) (496,872) — (496,872) Revenue from external customers $ 2,095,760 $ 1,428,102 $ 1,117,968 $ 4,641,830 $ — $ 4,641,830 $ 266,214 $ 28,721 $ (9,961) $ 284,974 $ (58,170) (b) $ 226,804 Capital expenditures $ 37,067 $ 359 $ 476 $ 37,902 $ 692 $ 38,594 $ 102,723 $ 1,677 $ 3,316 $ 107,716 $ 10,513 $ 118,229 Year ended December 31, 2020 Total revenue $ 2,565,210 $ 2,114,459 $ 1,135,018 $ 5,814,687 $ — $ 5,814,687 Elimination of intersegment revenue (365,311) (129,818) (795) (495,924) — (495,924) Revenue from external customers $ 2,199,899 $ 1,984,641 $ 1,134,223 $ 5,318,763 $ — $ 5,318,763 $ 245,835 $ 53,158 $ 17,203 $ 316,196 $ (53,852) (b) $ 262,344 Capital expenditures $ 51,044 $ 878 $ 1,917 $ 53,839 $ 942 $ 54,781 $ 90,250 $ 1,703 $ 3,983 $ 95,936 $ 11,098 $ 107,034 Year ended December 31, 2019 Total revenue $ 2,054,097 $ 1,764,753 $ 929,738 $ 4,748,588 $ — $ 4,748,588 Elimination of intersegment revenue (274,745) (22,713) (298) (297,756) — (297,756) Revenue from external customers $ 1,779,352 $ 1,742,040 $ 929,440 $ 4,450,832 $ — $ 4,450,832 $ (150,837) $ 23,655 $ (172,637) $ (299,819) $ (65,188) (b) $ (365,007) Capital expenditures $ 82,156 $ 518 $ 688 $ 83,362 $ 834 $ 84,196 $ 47,905 $ 1,934 $ 4,136 $ 53,975 $ 11,069 $ 65,044 _____________________________________________________________________________________________________________13)6).(b)Consists primarily of corporate general and administrative expenses.(c)Depreciation and amortization is included in income (loss) from construction operations.(d)During the year ended December 31, 2018, the Company recorded a charge of $17.8 million in income (loss) from construction operations (an after-tax impact of $12.8 million, or $0.25 per diluted share), which was primarily non-cash, as a result of the unexpected adverse outcome of an arbitration decision related to a subcontract back charge dispute on a Civil segment project in New York that was completed in 2013.TUTOR PERINI CORPORATION AND SUBSIDIARIESNOTES TO CONSOLIDATED FINANCIAL STATEMENTS (Continued)As of December 31, (in thousands) 2021 2020 Civil $ 3,310,648 $ 3,141,991 Building 980,989 1,147,649 Specialty Contractors 631,710 673,891 (198,449) 82,086 Total assets $ 4,724,898 $ 5,045,617 _____________________________________________________________________________________________________________Year Ended December 31, (in thousands) 2021 2020 2019 Revenue: United States $ 4,267,734 $ 4,953,045 $ 4,073,691 Foreign and U.S. territories 374,096 365,718 377,141 Total revenue $ 4,641,830 $ 5,318,763 $ 4,450,832 As of December 31, (in thousands) 2021 2020 Assets: United States $ 4,479,873 $ 4,836,735 Foreign and U.S. territories 245,025 208,882 Total assets $ 4,724,898 $ 5,045,617 Year Ended December 31, (in thousands) 2021 2020 2019 Income (loss) from construction operations $ 226,804 $ 262,344 $ (365,007) Other income (expense) 2,004 (11,853) 6,667 Interest expense (69,026) (76,212) (67,494) Income (loss) before income taxes $ 159,782 $ 174,279 $ (425,834) 16.$3.0 million in 2018 and $2.8 million in 2017, and recognized expense of $4.6 million in 2021 and $3.2 million in each of the three years., 2019, 2021, the Company had active joint ventures with O&G including two2 infrastructure projects in the northeastern United States that were completed in 2017 and 2two mass-transit projects in Los Angeles, California to construct the Purple Line Extension Section 2 (Tunnels and Stations) and Section 3 (Stations), in which the Company’s and O&G’s joint venture interests are 75% and 25%, respectively. O&G may provide equipment and services to theseTUTOR PERINI CORPORATION AND SUBSIDIARIESNOTES TO CONSOLIDATED FINANCIAL STATEMENTS (Continued)paymentspayments made by these joint ventures to O&G for services and equipment during the years ended December 31, 2019, 20182021, 2020 and 2017.2019.2018 and 2017 were $18.4$16.4 million, $14.7$16.0 million and $17.6$18.4 million, respectively. The Company owed Alliant $2.7$1.5 million and $4.1$2.7 million as of December 31, 20192021 and 2018,2020, respectively, for services rendered.17. Unaudited Quarterly Financial DataThe following table presents selected unaudited quarterly financial data for each full quarterly period of 2019 and 2018:F-