UNITED STATES
SECURITIES AND EXCHANGE COMMISSION
Washington, D.C. 20549
FORM 10-K
T ANNUAL REPORT PURSUANT TO SECTION 13 OR 15(d) OF THE SECURITIES EXCHANGE ACT OF 1934
For the fiscal year ended December 31, 20112012
or
£ TRANSITION REPORT PURSUANT TO SECTION 13 OR 15(d) OF THE SECURITIES EXCHANGE ACT OF 1934
For the transition period from __________ to _________
Commission File Number 000-07246
PETROLEUM DEVELOPMENT CORPORATIONPDC ENERGY, INC.
(Exact name of registrant as specified in its charter)
(Doing Business as PDC Energy)
|
| |
| Nevada | 95-2636730 |
(State of Incorporation)incorporation) | (I.R.S. Employer Identification No.) |
1775 Sherman Street, Suite 3000
Denver, Colorado 80203
(Address of principal executive offices) (Zip Code)code)
Registrant's telephone number, including area code: (303) 860-5800
Securities registered pursuant to Section 12(b) of the Act:
|
| | |
| Title of each class | | Name of each exchange on which registered |
| Common Stock, par value $0.01 per share | | NASDAQ Global Select Market |
Securities registered pursuant to Section 12(g) of the Act: None
Indicate by check mark if the registrant is a well-known seasoned issuer, as defined in Rule 405 of the Securities Act. Yes T No £
Indicate by check mark if the registrant is not required to file reports pursuant to Section 13 or Section 15(d) of the Act. Yes £ No T
Indicate by check mark whether the registrant (1) has filed all reports required to be filed by Section 13 or 15(d) of the Securities Exchange Act of 1934 during the preceding 12 months (or for such shorter period that the registrant was required to file such reports), and (2) has been subject to such filing requirements for the past 90 days. Yes T No £
Indicate by check mark whether the registrant has submitted electronically and posted on its corporate Website, if any, every Interactive Data File required to be submitted and posted pursuant to Rule 405 of Regulation S-T (§232.405 of this chapter) during the preceding 12 months (or for such shorter period that the registrant was required to submit and post such files). Yes T No £
Indicate by check mark if disclosure of delinquent filers pursuant to Item 405 of Regulation S-K (§229.405 of this chapter) is not contained herein, and will not be contained, to the best of registrant's knowledge, in definitive proxy or information statements incorporated by reference in Part III of this Form 10-K or any amendment to this Form 10-K. £
Indicate by check mark whether the registrant is a large accelerated filer, an accelerated filer, a non-accelerated filer, or a smaller reporting company. See definitions of "large accelerated filer," "accelerated filer" and "smaller reporting company" in Rule 12b-2 of the Exchange Act.
|
| |
Large accelerated filer £x | Accelerated filer xo |
Non-accelerated filer £ (Do not check if a smaller reporting company) | Smaller reporting company o |
Indicate by check mark whether the registrant is a shell company (as defined in Rule 12b-2 of the Act). Yes £ No T
The aggregate market value of our common stock held by non-affiliates on June 30, 20112012, was $699,417,474735,547,944 (based on the then closing price of $29.9124.52) per share).
As of February 17, 20128, 2013, there were 23,634,45630,316,670 shares of our common stock outstanding.
DOCUMENTS INCORPORATED BY REFERENCE
We hereby incorporate by reference into this document the information required by Part III of this Form, which will appear in our definitive proxy statement to be filed pursuant to Regulation 14A for our 20122013 Annual Meeting of Stockholders.
PETROLEUM DEVELOPMENT CORPORATION
(dba PDC Energy)ENERGY, INC.
20112012 ANNUAL REPORT ON FORM 10-K
TABLE OF CONTENTS
|
| | | |
| | PART I | | Page |
| | | | |
| | | |
| | | |
| | | |
| | | |
| | | |
| | | | |
| | PART II | | |
| | | | |
| | | |
| | | |
| | | |
| | | |
| | | |
| | | |
| | | |
| | | |
| | | | |
| | PART III | | |
| | | | |
| | | |
| | | |
| | | |
| | | |
| | | |
| | | | |
| | PART IV | | |
| | | | |
| | | |
| | | | |
| | | | |
| | | | |
| | | | |
PART I
REFERENCES TO THE REGISTRANT
In July 2010,At our annual meeting of stockholders held on June 7, 2012, the stockholders approved a change of the Company's legal name from Petroleum Development Corporation established in 1969, began conducting business asto PDC Energy. The Company'sEnergy, Inc. Reflecting this change, on July 16, 2012, our common stock continues to tradebegan trading on the NASDAQ Global Select Market under the ticker symbol PETD. The Company's website, www.petd.com, reflects the PDC Energy name and brand identity. At the Company's annual stockholders' meeting to be held in June 2012, we plan to request shareholders to approve and amend the Company's articles of incorporation to formally change the corporate name to PDC Energy, Inc."PDCE." Information contained on or linked to our website, www.pdce.com, is not part of this report and is not hereby incorporated by reference and should not be considered part of this report.
Unless the context otherwise requires, references in this report to "PDC Energy," "PDC, Energy," "the Company," "we," "us," "our," "ours" or "ourselves" refer to the registrant, Petroleum Development Corporation,PDC Energy, Inc. and all subsidiaries consolidated for the purposes of its financial statements, including our proportionate share of the financial position, results of operations, cash flows and operating activities of our affiliated partnerships and PDC Mountaineer, LLC ("PDCM"), a joint venture currently owned 50% each by PDC and Lime Rock Partners, LP, formed for the purpose of exploring and developing the Marcellus Shale formation in the Appalachian Basin ("Marcellus JV").Basin. Unless the context otherwise requires, references in this report to "Appalachian Basin" includes PDC's proportionate share of our affiliated partnerships' and the Marcellus JV'sPDCM's assets, results of operations, cash flows and operating activities.
See Note 1, Nature of Operations and Basis of Presentation, to our consolidated financial statements included elsewhere in this report for a description of our consolidated subsidiaries.
GLOSSARY OF UNITS OF MEASUREMENTS AND INDUSTRY TERMS
Units of measurements and industry terms defined in the Glossary of Units of Measurements and Industry Terms, included at the end of this report, are set in boldface type the first time they appear.
WHERE YOU CAN FIND ADDITIONAL INFORMATION
We file annual, quarterly and current reports, proxy statements and other information with the United States Securities and Exchange Commission ("SEC"). Our SEC filings are available free of charge from the SEC’s website at www.sec.gov or from our website at www.petd.com. You may also read or copy any document we file at the SEC’s public reference room in Washington, D.C., located at 100 F Street, N.E., Room 1580, Washington, D.C. 20549. Please call the SEC at (800) SEC-0330 for further information on the public reference room. We also make available free of charge any of our SEC filings by mail. For a mailed copy of a report, please contact Petroleum Development Corporation, dba PDC Energy, Investor Relations, 1775 Sherman Street, Suite 3000, Denver, CO 80203, or call toll free (800) 624-3821.
We recommend that you view our website for additional information, as we routinely post information that we believe is important for investors. Our website can be used to access such information as our recent news releases, bylaws, committee charters, code of business conduct and ethics, shareholder communication policy, director nomination procedures and our whistle-blower hotline. While we recommend that you view our website, the information available on our website is not part of this report and is not hereby incorporated by reference.
SPECIAL NOTE REGARDING FORWARD-LOOKING STATEMENTS
This report contains forward-looking statements within the meaning of Section 27A of the Securities Act of 1933 ("Securities Act") and Section 21E of the Securities Exchange Act of 1934 ("Exchange Act") regarding our business, financial condition, results of operations and prospects. All statements other than statements of historical facts included in and incorporated by reference into this report are "forward-looking statements" within the meaning of the safe harbor provisions of the United States ("U.S.") Private Securities Litigation Reform Act of 1995. Words such as expects, anticipates, intends, plans, believes, seeks, estimates and similar expressions or variations of such words are intended to identify forward-looking statements herein. These statements include:relate to, among other things: estimated natural gas, natural gas liquids ("“NGLs"”) and crude oil production andreserves; expected operational, midstreamfuture production (including the components of such production), expenses, cash flows, margins and marketing synergies from PDCM's Seneca-Upshur acquisition;liquidity; anticipated capital projects, expenditures and opportunities, including our ability to fund our 2012 capital budget; increased focus ondrilling locations and downspacing potential; future exploration and development activities; availability of additional midstream facilities and services in the Wattenberg Field and liquid-rich areas;timing of that availability; availability of sufficient funding for our horizontal Niobrara drilling plans in 2012; planned refracturescapital program and recompletions in 2012; expected usesources of proceeds fromthat funding; potential for infrastructure projects to improve our Permian divestiture; the expected benefit of operational diversity in the Rocky Mountain region; our ability to mitigate risks by sharing costs of exploratory drilling in the Marcellus Shale with our joint venture partner; our intent to mitigate risks by maintaining a natural gas and liquids mix to counter a decline in the market price of one of our commodities; our expected term for inventory of projects for drilling activity; planned limited development in Piceance in 2012 due to the commodity pricing environment; drilling plans in the Utica Shale in 2012; that development drilling will remain the foundation of our drilling program; addition of 8 Bcfe of reserves at December 31, 2011 from the Seneca Upshur acquisition; our belief that pricing provisions in our natural gas contracts are customary; our belief that our exploration program has the potential to replenish our portfolio with new projects for significant production and reserves growth;NGL pricing; our compliance with our debt covenants and the indenture restrictions governingrenewal of a letter of credit under our senior notes and expected continued compliance; sufficient liquidity to meet our partnership repurchase obligations; our belief that the acquisition of partnerships will provide us with growth in production and proved reserves and operational benefits; therevolving credit facility; adequacy of our casualty insurance coverage as managing general partnerinsurance; the future effect of numerous partnershipscontracts, policies and as operator of our own wells; the impact of decreased commodity prices on future borrowing base redeterminations; thatprocedures we hold good and defensible titlebelieve to our natural gas and crude oil properties in accordance with industry standards; thebe customary; effectiveness of our derivative
policies program in achievingproviding a degree of price stability; our risk management objectives;future dividend policy; closing of, and expected proceeds from, our expected remaining liability for uncertain tax positions;pending asset disposition; and our ability to secure a joint venture partner for our Utica Shale acreage; the impact of outstanding legal issues; our ability to benefit from crude oil and natural gas price differential; and ourfuture strategies, plans and objectives.
The above statements are not the exclusive means of identifying forward-looking statements herein. Although forward-looking statements contained in this report reflect our good faith judgment, such statements can only be based on facts and factors currently known to us. Consequently, forward-looking statements are inherently subject to risks and uncertainties, including known and unknown risks and uncertainties incidental to the exploration for, and the acquisition, development, production and marketing of natural gas, NGLs and crude oil, and actual outcomes may differ materially from the results and outcomes discussed in the forward-looking statements.
Important factors that could cause actual results to differ materially from the forward-looking statements include, but are not limited to:
changes in production volumes and worldwide demand, including economic conditions that might impact demand;
volatility of commodity prices for natural gas, NGLs and crude oil;
the impact of governmental fiscal termspolicies and/or regulations, including changes in environmental and other laws, the regulationinterpretation and enforcement related to those laws and regulations, liabilities arising thereunder and the costs to comply with those laws as well as otherand regulations;
declinepotential declines in the values of our natural gas and crude oil properties resulting in impairments;
changes in estimates of proved reserves;reserves;
inaccuracy of reserve estimates and expected production rates;
the potential for production decline rates from our wells to be greater than expected;
the timing and extent of our success in discovering, acquiring, developing and producing reserves;
our ability to acquire leases, drilling rigs, supplies and services at reasonable prices;
the timing and receipt of necessary regulatory permits;
risks incidental to the drilling and operation of natural gas and crude oil wells;
our future cash flow,flows, liquidity and financial position;condition;
competition in the oil and gas industry;
availability and cost of capital to us;
reductions in the borrowing base under our revolving credit facility;
the availability of sufficient pipeline, gathering and other transportation facilities and related infrastructure to carryprocess and transport our production, particularly in the Wattenberg Field, and the impact of these facilities on price;the prices we receive for our production;
our success in marketing natural gas, NGLs and crude oil;
the effect of natural gas and crude oil derivatives activities;
the impact of environmental events, governmental and other third-party responses to thesuch events, and our ability to insure adequately against such events;
the cost of pending or future litigation;
effect that acquisitions we may pursue have on our capital expenditures;
potential obstacles to completing our pending asset disposition or other transactions, in a timely manner or at all, and purchase price or other adjustments relating to those transactions that may be unfavorable to us;
our ability to retain or attract senior management and key technical employees; and
the success of strategic plans, expectations and objectives for future operations of the Company.
Further, we urge you to carefully review and consider the cautionary statements and disclosures, specifically those under Item 1A, Risk Factors, made in this report and our other filings with the SECU.S. Securities and Exchange Commission ("SEC") for further information on risks and uncertainties that could affect our business, financial condition, results of operations and cash flows. We caution you not to place undue reliance on forward-looking statements, which speak only as of the date of this report. We undertake no obligation to update any forward-looking statements in order to reflect any event or circumstance occurring after the date of this report or currently unknown facts or conditions or the occurrence of unanticipated events. All forward-looking statements are qualified in their entirety by this cautionary statement.
ITEMS 11. AND 2. BUSINESS AND PROPERTIES
The Company
Effective July 15, 2010, Petroleum Development Corporation began conducting business as PDC Energy. A new logo and corporate identity accompanied this change. Our common stock continues to trade on the NASDAQ Global Select Market under the ticker symbol PETD. We continue to maintain our website address, www.petd.com, which reflects the new PDC Energy name and brand identity. This change reflects the transitioning in our business model, from a company that was predominately a sponsor of limited partnerships to an exploration and production company that explores for and acquires, develops, produces and markets natural gas and oil resources.
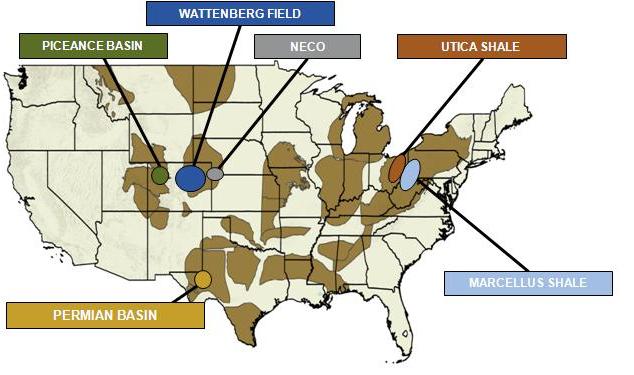
We are a domestic independent exploration and production company that acquires, develops, explores and produces natural gas, NGLs and crude oil.oil with operations in the Western and Eastern regions of the United States. Our Western Operating Region is primarily focused on development in the Wattenberg Field in Colorado, particularly in the liquid-rich horizontal Niobrara play and on the ongoing development of refractures and recompletions of our Wattenberg wells.Codell plays. In our Eastern Operating Region, we are currently focused on horizontal development in the Marcellus Shale in northern West Virginia, and recently initiated exploration and development activity in the liquid-rich portion of the Utica Shale play in Ohio. We are also pursuing horizontal development in the Marcellus Shale in northern West Virginia through our 50% joint venture interest in PDCM. We own an interest in approximately 6,5007,200 gross producing wells and maintained an average December 2011 production rate of approximately 146135.6 MMcfe per day for the year ended December 31, 2012, which was comprised of 62%65.3% natural gas, 27%10.2% NGLs and 24.5% crude oil and 11% NGLs.
Asoil. This represents production growth of 10.2% from continuing operations as compared to the year ended December 31, 2011 an independent petroleum engineering firm estimated our total. As of December 31, 2012, we had approximately 1.2 Tcfe of proved reserves to be approximately 1
Tcfe with a PV-10%present value of future net revenues (“PV-10”) value, which is not a financial measure under Accounting Principles Generally Accepted in the United States of America (“U.S. GAAP”), of $1.7 billion, a non-U.S. GAAP financial measure, of $1.3 billion. Approximately 46% of our total proved reserves have been classified as proved developed. Our total proved reserves consist of 66% natural gas and 34% crude oil and NGLs. Our internal estimaterepresenting growth of proved, probable141 Bcfe and possible ("3P") reserves has increased from 1.4 Tcfe$359 million, respectively, relative to the totals as of December 31, 2010, to 2.1 Tcfe as of December 31, 2011. The percentage of our proved reserves represented by NGLs and includes a significant multi-year inventorycrude oil rose to 48% as of horizontal and vertical drilling projectsDecember 31, 2012, up from 34% as well as multiple refracture and recompletion projects in existing wells.of
December 31, 2011. See Part I, Item 7. Management's Discussion and Analysis of Financial Condition and Results of Operations - Reconciliation of Non-U.S. GAAP Financial Measures,, for a definition of PV-10% and a reconciliation of our PV-10% value to our standardized measure.measure.
2011 Overview
In 2011, we focusedThe increase in our estimated proved reserves and production is primarily attributable to liquid-rich horizontal drilling activities in the liquid-rich Wattenberg Field and our June 2012 acquisition of certain Wattenberg Field properties and related assets from affiliates of Merit Energy (the "Merit Acquisition") for $304.6 million, after certain post-closing adjustments. The acquired assets comprise approximately 29,800 net acres, after post-closing adjustments, located almost entirely in northern Colorado where wethe core Wattenberg Field with significant overlay with our existing acreage position. We believe that the Merit Acquisition should provide us with an opportunity to continue our rapid growth in the Wattenberg Field and to substantially increase our oil and NGL production. We drilled 1737 horizontal Niobrara wells, 80 verticaland Codell wells, completed 190 160 refracture and/or and recompletion projects and participated in 4819 non-operated drilling projects. During the year, we reduced our drilling of vertical wells to refocus our efforts on our horizontal Niobrara drilling program. We have successfully de-risked much of the horizontal Niobrara potential throughout our core Wattenberg acreage position and generated over 350 gross horizontal well projects in inventory. PDCM drilled six horizontal Marcellus wells, completed five horizontal wells and initiated several midstream projects. the Wattenberg Field in 2012.
In October, we announced that we entered the Utica Shale play, whereour Eastern Operating Region, we have the rights to acquire up toacquired an estimated 40,000 45,000 net acres targeting the wet gas and crude oil windows of the Utica Shale in southeast Ohio,Ohio. Our year-end 2012 proved reserves do not include reserves associated with our Utica Shale properties. We drilled and throughcompleted two horizontal Utica Shale wells in 2012, both of which are currently shut-in awaiting pipeline connections. We also drilled one vertical Utica Shale well and completed two vertical Utica test wells in 2012 for the primary purpose of providing engineering and geological data in support of the horizontal play. In addition, PDCM drilled three and completed the Seneca-Upshur acquisitionsix horizontal Marcellus wells and constructed various midstream projects in 2012.
The following table presents our historical proved reserve estimates as of December 31, 2012 based on a reserve report prepared by Ryder Scott Company, L.P. (“Ryder Scott”), our independent petroleum engineering consulting firm:
|
| | | | | | | | | | | | | | |
| | Proved Reserves at December 31, 2012 | | | | | | |
| | Proved Reserves (Bcfe) | | % of Total Proved Reserves | | % Proved Developed | | % Liquids | | Proved Reserves to Production Ratio (in years) | | Production (MMcfe) |
| Western | | | | | | | | | | | |
| Wattenberg Field | 893.5 | | 77 | % | | 41 | % | | 62 | % | | 33.4 | | 26,748 |
| Other | 84.6 | | 8 | % | | 100 | % | | 1 | % | | 5.1 | | 16,672 |
| Total Western | 978.1 | | 85 | % | | 46 | % | | 56 | % | | 22.5 | | 43,420 |
| Eastern | | | | | | | | | | | |
| Appalachian Basin | 178.8 | | 15 | % | | 23 | % | | — | % | | 28.9 | | 6,192 |
| Total Eastern | 178.8 | | 15 | % | | 23 | % | | — | % | | 28.9 | | 6,192 |
| Total proved reserves | 1,156.9 | | 100 | % | | 42 | % | | 48 | % | | 23.3 | | 49,612 |
On February 4, 2013, we entered into a purchase and sale agreement with certain affiliates of Caerus Oil and Gas LLC (“Caerus”), pursuant to which added 90,000 gross acres to our Marcellus position. During the fourth quarter, we closed on the sale of our non-core Permian Basin assets to an unrelated third party for a sales price of $13.2 million. In December, we executed a definitive agreementhave agreed to sell to Caerus our core Permian WolfberryPiceance Basin, NECO and certain non-core Colorado oil and gas properties, leasehold mineral interests and related assets, to another unrelated third partyincluding derivatives, for a sales priceaggregate cash consideration of $173.9approximately $200 million, subject to customary post-closingcertain adjustments. On February 28,As of December 31, 2012, total estimated proved reserves related to these assets were 84.6 Bcfe. See Note 19, Subsequent Events, to our consolidated financial statements included elsewhere in this divestiture was completed with total proceeds received of $184.4 million after preliminaryreport for additional information regarding the planned divestiture. There can be no assurance we will be successful in closing adjustments.such divestiture.
In addition to our oil and gas exploration and production activities, we engage in natural gas marketing through our subsidiary Riley Natural Gas (“RNG”).
Our Strengths
Multi-year project inventory targeting highly economic oil and NGL production growth.We have a significant operational presence in three key U.S. onshore basins and have identified a substantial inventory of approximately 4,100 gross capital projects across our assets. This inventory includes approximately 3,300 gross projects in the liquid-rich Wattenberg Field, of which approximately 1,400 are horizontal Niobrara and Codell proved and probable locations that we expect to be capable of providing liquid-rich production growth for the next several years at attractive rates of return based on current strip prices. Potential downspacing of future drill sites would provide the opportunity for additional locations. In the core area of the Wattenberg Field, we have achieved an average of 335 MBoe gross reserves per horizontal well, with approximately 75% liquids contribution. In the Appalachian Basin, we have approximately 600 gross Marcellus Shale drilling locations in inventory, of which approximately 360 gross wells in our core focus area would be expected to generate reserves of 5 to 7 Bcfe per well. In addition, our leasehold position in the emerging Utica Shale play is expected to provide approximately 200 horizontal drilling opportunities in liquid rich areas. With the development of the horizontal Niobrara and Codell and exploration and delineation of acreage in the Utica Shale, we are focused on transitioning our portfolio to a higher mix of oil and NGLs that we believe is capable of delivering higher margins and improved capital efficiencies.
Track record of reserve and production growth.Our proved reserves have grown from 323 Bcfe at December 31, 2006 to approximately 1.2 Tcfe at December 31, 2012, representing a compound annual growth rate (“CAGR”) of 23.7%. During the same time period, our proved crude oil and NGL reserves grew at a CAGR of 52.7%. Our annual production grew from 16.9 Bcfe in 2006 to 49.6 Bcfe in 2012 from continuing operations, representing a CAGR of 19.7%.
Horizontal drilling and completion experience.We have a proven track record of applying technical expertise toward developing unconventional resources through horizontal drilling, having drilled 108 Niobrara, Codell, Marcellus and Utica horizontal wells as of December 31, 2012. We have begun multi-well pad drilling to further optimize costs and enhance horizontal drilling efficiencies. Pad drilling enables us to streamline the transition to increased well density in the horizontal Niobrara and Codell plays. We have approximately 2,000 gross horizontal proved and probable locations in inventory from our Wattenberg and Marcellus positions. Our current leasehold position in the emerging Utica Shale play is expected to provide approximately 200 horizontal drilling opportunities in liquid-rich areas.
Significant operational control in our core areas.As a result of successfully executing our strategy over time of acquiring largely concentrated acreage positions with a high working interest, we operate and manage approximately 89% of our oil and natural gas properties. Our high percentage of operated properties enables us to exercise a significant level of control with respect to drilling, production, operating and administrative costs, in addition to leveraging our base of technical expertise in our core operating areas.
Access to liquidity.As of December 31, 2012, we had $2.5 million of cash and cash equivalents and $396.1 million available for
borrowing under our revolving credit facility. We have no near-term debt maturities, although we periodically repay borrowings outstanding under our revolving credit facility. We actively hedge our future exposure to commodity price fluctuations by entering into oil and natural gas swaps and collars. We have hedged approximately 28.7 Bcf of our natural gas production for 2013 at an average minimum price of $4.15 per Mcf. We have hedged approximately 2,326 MBbls of our oil production in 2013 at an average minimum price of $88.75 per Bbl. As of December 31, 2012, the net fair value of all of our hedges was approximately $30.3 million.
Management experience and operational expertise.We have a management team with a proven track record of performance and a technical and operational staff with significant expertise in the basins in which we operate, particularly with horizontal well development activities.
Business Strategy
Our business strategy focuses on generating shareholder value through the organic growth of our reserves, production and productioncash flows in our high-value, liquid-rich and high impact horizontal plays. We allocate capital to high return projects in our portfolio capable of maximizing our cash flow and return on capital. We place a strong emphasis on organic growth through active horizontal drilling programs, emphasize low-risk development drilling, programs. We also engage in targeted exploratory drilling in of unconventional resources and maintain an active acquisition program. We pursue various midstream, marketing and cost reduction initiatives designed to increase our per unit operating margins and maintain a conservative and disciplined financial strategy focused on providing sufficient liquidity and balance sheet strength to execute our business strategy.
Drill and Develop
Our leasehold consists primarilyinterests consist of interests in developed and undeveloped natural gas, NGLs and crude oil resources located in our Western and Eastern Operating Regions. We seek to maximize the value of our existing wells through a successful program of well refractures, recompletions and workovers. Based on our prior acreage holdings and recent acquisitions, we have accumulatedidentified a multi-yearsubstantial inventory of approximately 4,100 gross capital projects for development primarily through horizontal and vertical developmental drilling projects,in high-return, liquid-rich plays, as well as refracture and recompletion and exploration projects.opportunities.
Western Operating Region. Our primary focus in the liquid-rich Wattenberg Field is the horizontal developmentNiobrara and Codell plays. We have begun multi-well pad drilling ofto further optimize costs and enhance horizontal drilling efficiencies in the Wattenberg Field. Pad drilling enables us to streamline the transition to increased well density in the horizontal Niobrara formation.and Codell plays. We also maintain a vertical drilling inventory in the Niobrara and Codell formationsformations. We currently estimate that we have 3,300 gross capital projects, which include over 1,400 gross proved and probable projects for the horizontal Niobrara and Codell. Depending upon commodity prices and the number of drilling rigs operating, we believe that this inventory of projects provides us with over 10 years of drilling activity.
Of our total capital budget of $324 million for 2013, approximately 75%, or $245 million, is expected to be spent on development activities, substantially all of which is expected to be invested in the Wattenberg Field for an expanded horizontal Niobrara and continueCodell drilling program and participation in various non-operated projects. We plan to execute on multiple refracturerun a two-rig program in the Wattenberg Field through the second quarter of the year and recompletion projects. add a third rig during the third quarter. Under this drilling program, we expect to drill approximately 63 horizontal Niobrara or Codell wells in 2013.
Additionally, we operate natural gas assets in the Piceance Basin in western Colorado and in northeast Colorado ("NECO"), where we currently focusfocused on production optimization and increasing operating margins.
Approximately 65%margins in 2012. On February 4, 2013, we entered into a purchase and sale agreement with certain affiliates of our 2012 capital budget, or $184 million, is expectedCaerus, pursuant to be spent on development activities, approximately 97% of which is expected to be invested in the Wattenberg Field for an expanded horizontal Niobrara drilling program, increased pace of refractures and recompletions and participation in various non-operated projects. We currently estimate that we have more than 1,750 gross drilling projects, which include over 350 gross projects for the horizontal Niobrara, and approximately 1,450 refracture and recompletion projects in existing wells in the Wattenberg Field. Depending on the number of drilling rigs operating and commodity prices, we believe that this inventory of projects provides us with approximately 10 years of drilling activity. In 2012, we planagreed to run a one-rig program in Wattenberg to drill between between 25 and 30 horizontal Niobrara wells, along with completing an estimated 250 to 265 refracture and recompletion projects on existing wells.
In 2011, we drilled a total of 17 development wells in the Piceance Basin. We currently estimate that we have more than 390 gross drilling projects, representing multiple years of inventory depending on the number of drilling rigs operating and commodity prices. We expect to maintain a disciplined approach to the development ofsell our Piceance Basin, NECO and certain non-core Colorado oil and gas acreage holdings in 2012, with plans to complete only those wells previously drilled in this area in 2011 as we focus our capital budget in areas expected to generate higher rates of return.
Drilling activity in the Permian Basin in 2011 included 23 development wells,properties, leasehold mineral interests and related assets, including two determined to bederivatives. See Note 19, dry holes. In October 2011, we announced our intent to divest our Permian Basin assets. The divestiture was completed on February 28, 2012. See Acquisitions and Divestitures below and Note 13, Assets Held for Sale, Divestitures and Discontinued Operations, and Note 18Subsequent Events, Subsequent Event, to our consolidated financial statements included elsewhere in this report for additional details related toinformation regarding the divestiture of our Permian assets.planned divestiture. There can be no assurance we will be successful in closing such divestiture.
Eastern Operating Region. We continue to delineate and develop our leasehold position in the Utica Shale. To date, we have drilled two vertical test wells to collect geologic data and two horizontal wells to test the productivity of the acreage. We currently estimate we have approximately 200 gross projects for horizontal drilling in the Utica Shale. In 2013, we expect to devote approximately $53 million of our 2013 capital program primarily toward drilling and completion activity in the Utica Shale, where we plan to drill approximately five horizontal wells targeting the wet gas and crude oil windows of the play.
Our primaryother focus in the Eastern Operating Region is on horizontal drilling in the Marcellus Shale natural gas play consists of horizontal drilling in West Virginia. In 2011,2012, PDCM drilledcompleted a total of 6six gross 3 net,(three net) horizontal wells and constructed various midstream assets to gather and compress its Marcellus gas. PDCM recently announced it has elected to temporarily suspendWe currently estimate we have approximately 600 gross projects for horizontal drilling in the Marcellus Shale play due to the current depressed natural gas price environment. Prior to suspending its drilling activities in 2012,Shale. PDCM expects to drill a total of 414 gross horizontal
Marcellus wells and complete 7 wells, including 3 wells that were in-process as of December 31, 2011.
With the addition of our Ohio leaseholds in late 2011, we have recently begun to focus on exploratory and delineation drilling targeting the wet gas and crude oil windows of the Utica Shale. We drilled one vertical well to total depth in mid-December, which was fracture treated early in 2012. In 2012, we expect to drill approximately two horizontal shale wells with an option to drill two additional vertical wells. Currently, we are pursuing an industry joint venture partner to participate in and share in funding the growth and development in this play. While we expect to identify a partner by mid-2012, we cannot assure we will be successful in securing a partner or developing this acreage.2013.
The following table presents information regarding the number of wells we drilled or participated in and the number of refractures and/or recompletions we performed.Strategically acquire
|
| | | | | | | | | | | | | | | | | | |
| | | Drilling Activity |
| | | Year Ended December 31, |
| | 2011 | | 2010 | | 2009 |
| Operating Region | | Gross | | Net | | Gross | | Net | | Gross | | Net |
| Western (1) | | 186 |
|
| 139.6 |
|
| 204 |
|
| 164.9 |
|
| 92 |
|
| 71.2 |
|
| Eastern | | 9 |
| | 5.2 |
| | 9 |
| | 5.2 |
| | 8 |
| | 8.0 |
|
| Total wells drilled | | 195 |
| | 144.8 |
| | 213 |
| | 170.1 |
| | 100 |
| | 79.2 |
|
| Refractures and Recompletions (2) | | 192 |
| | 177.6 |
| | 46 |
| | 33.7 |
| | 37 |
| | 35.4 |
|
| | | | | | | | | | | | | |
__________
| |
(1) | Includes drilling activity in the Permian Basin. As of December 31, 2011, our Permian assets were held for sale and, on February 28, 2012, the divestiture closed. See Note 13, Assets Held for Sale, Divestitures and Discontinued Operations, and Note 18, Subsequent Event, to our consolidated financial statements included in this report for additional details related to the divestiture of our Permian assets. |
| |
(2) | 190 of the refractures and recompletions occurred in the Wattenberg Field. |
The following tables set forth our developmental and exploratory well drilling activity. There is no correlation between the number of productive wells completed during any period and the aggregate reserves attributable to those wells. Productive wells consist of wells spudded, turned in line and producing during the period. In-process wells represent wells that are in the process of being drilled or have been drilled and are waiting to be fractured and/or for gas pipeline connection during the period.
|
| | | | | | | | | | | | | | | | | | | | | | | | | | | |
| | | Net Development Well Drilling Activity |
| | | Year Ended December 31, |
| | | 2011 | | 2010 | | 2009 |
| Operating Region/Area | | Productive | | In-Process | | Dry | | Productive | | In-Process | | Dry | | Productive | | In-Process | | Dry |
| Western | | | | | | | | | | | | | | | | | | |
| Wattenberg Field | | 86.5 |
| | 13.1 |
| | — |
| | 106.9 |
| | 26.5 |
| | — |
| | 58.3 |
| | 6.9 |
| | — |
|
| Piceance Basin | | 14.0 |
| | 3.0 |
| | — |
| | 18.0 |
| | 7.0 |
| | — |
| | 1.0 |
| | — |
| | — |
|
| Permian Basin (1) | | 14.5 |
| | 5.5 |
| | 2.0 |
| | — |
| | 5.0 |
| | — |
| | — |
| | — |
| | — |
|
| Other | | — |
| | — |
| | — |
| | 0.5 |
| | — |
| | — |
| | 2.0 |
| | — |
| | 1.0 |
|
| Total Western | | 115.0 |
| | 21.6 |
| | 2.0 |
| | 125.4 |
| | 38.5 |
| | — |
| | 61.3 |
| | 6.9 |
| | 1.0 |
|
| Eastern | | | | | | | | | | | | | | | | | | |
| Appalachian Basin | | 0.9 |
| | 2.0 |
| | — |
| | 0.6 |
| | 1.1 |
| | — |
| | 2.0 |
| | — |
| | — |
|
| Total Eastern | | 0.9 |
| | 2.0 |
| | — |
| | 0.6 |
| | 1.1 |
| | — |
| | 2.0 |
| | — |
| | — |
|
| Total net development wells | | 115.9 |
| | 23.6 |
| | 2.0 |
| | 126.0 |
| | 39.6 |
| | — |
| | 63.3 |
| | 6.9 |
| | 1.0 |
|
| | | | | | | | | | | | | | | | | | | |
__________
| |
(1) | As of December 31, 2011, our Permian assets were held for sale and, on February 28, 2012, the divestiture closed. See Note 13, Assets Held for Sale, Divestitures and Discontinued Operations, and Note 18, Subsequent Event, to our consolidated financial statements included in this report for additional details related to the divestiture of our Permian assets. |
|
| | | | | | | | | | | | | | | |
| | Net Exploratory Well Drilling Activity |
| | | Year Ended December 31, |
| | 2011 | | 2010 | | 2009 |
| Operating Region/Area | | In-Process | | Productive | | In-Process | | Productive | | In-Process |
| Western | | | | | | | | | | |
| Wattenberg Field | | — |
| | — |
| | 1.0 |
| | — |
| | — |
|
| Other | | 1.0 |
| | — |
| | — |
| | 1.0 |
| | 1.0 |
|
| Total Western | | 1.0 |
| | — |
| | 1.0 |
| | 1.0 |
| | 1.0 |
|
| Eastern | | | | | | | | | | |
| Appalachian Basin | | 2.3 |
| | 2.8 |
| | 0.7 |
| | 5.0 |
| | 1.0 |
|
| Total Eastern | | 2.3 |
| | 2.8 |
| | 0.7 |
| | 5.0 |
| | 1.0 |
|
| Total net exploratory wells | | 3.3 |
| | 2.8 |
| | 1.7 |
| | 6.0 |
| | 2.0 |
|
| | | | | | | | | | | |
Acquisitions and Divestitures
We typically pursue the acquisition of assets that have a balance of value in producing wells, behind-pipe reserves reserves and high qualityhigh-quality undeveloped drilling locations. In 2010, we began seeking liquid-rich properties with large undeveloped drilling upside where we believe we can utilize our operational abilities to add shareholder value. As weWe have an experienced team of management, engineering and geosciences professionals who identify and evaluate investment opportunities, we may also seek to divest non-core assets to optimize our property portfolio.acquisition opportunities.
Acquisitions
In 2010,June 2012, we initiated a plan to purchase our affiliated partnerships. The acquisition of these partnerships have provided us with immediate growth in both production and proved reserves from assets in which we currently own an operated working interest. We believe that these acquisitions will also allow us to realize operational benefits as well ascompleted the potential to accelerate the refracture/recompletion program of the wells acquired, thus allowing us to optimize revenue opportunities. As of December 31, 2011, we had acquired a total of 12 affiliated partnershipsMerit Acquisition for an aggregate purchase price of $107.7approximately $304.6 million eight, after certain post-closing adjustments. We financed the purchase with cash from the May 2012 offering of which occurredour common stock and a draw on our revolving credit
facility. The acquired assets comprise approximately 29,800 net acres, after post-closing adjustments, located almost entirely in 2011 for an aggregate purchase price of $73 million. We estimate that the 2011 acquisitions added approximately 40 Bcfe in total proved reserves as of December 31, 2011, which includes the non-affiliated investor partners' remaining working interests in a total of 299 gross, 204.2 net, wells located in ourcore Wattenberg Field and Piceance Basin.with significant overlay with our existing acreage position. Following the closing of the Merit Acquisition, our total position in the core Wattenberg Field is approximately 98,600 net acres.
During 2011 and 2012, we obtained the rights to acquireacquired approximately 45,000 net acres of Utica leasehold acres from unrelated third partiesleaseholds, targeting the wet natural gas and crude oil windows of the Utica Shale play throughout southeastern Ohio. Should we exercise our right to acquire all 40,000 acres, we estimate that theOhio, for a purchase price of such leaseholds will approximate $70approximately $92.3 million. A portionAs an early entrant into the development of the options related to these leaseholds will expireUtica Shale, we believe we have gained valuable experience and expertise in August 2012. Currently, we are pursuing an industry joint venture partner to participate inproactively addressing title and share in fundingother issues associated with the growth and development in thisof the play. While we expect to identify a partner by mid-2012, we cannot assure we will be successful in securing a partner or developing this acreage.
In October 2011, PDCM acquired from an unrelated third party 100% of the membership interests of Seneca-Upshur Petroleum, LLC ("Seneca-Upshur"Seneca-Upshur”), a West Virginia limited liability company, from an unrelated third-party for the purchase price of $162.9$139.2 million including a post-closing working capital adjustment of $10.4 million.. The acquisition included approximately 1,340 gross wells producing natural gas from the shallow Devonian Shale and Mississippian formations and all rights and depths to an estimated 100,000 net acres in West Virginia, of which 90,000 acres are prospective for the Marcellus Shale. Substantially all of the acreage acquired is held by production prospective for the Marcellus Shale and is in close proximity to PDCM's existing properties. Pursuant to our joint venture interest in PDCM, our portion of the purchase price was $81.5$69.6 million and we hold a 50% interest in both the wells and acreage acquired. We estimate that the acquisition added approximately 8 Bcfe
In 2010, we initiated a plan to purchase our total proved reserves asaffiliated partnerships. As of December 31, 2011.2012, we had acquired a total of 12 affiliated partnerships for an aggregate purchase price of $107.7 million. The acquisition of these partnerships have provided us with immediate growth in both production and proved reserves from assets in which we currently own an operated working interest.
Manage operational and financial risk
We focus on development drilling programs in resource plays that offer repeatable results capable of driving growth in reserves, production and cash flows. We regularly review acquisition opportunities in our core areas of operation as we believe we can extract additional value from such assets through production optimization, refractures and recompletions and development drilling. In addition, core acquisitions can potentially provide synergies that result in economies of scale from a combined position. While we believe development drilling will remain the foundation of our capital programs, we continue our disciplined approach to acquisitions and exploratory drilling, both of which have the potential to identify new development opportunities.
We believe we proactively employ strategies to help reduce the financial risks associated with the oil and gas industry. One such strategy is to maintain a balanced production mix of natural gas and liquids. Our Western Operating Region produces natural gas, NGLs and crude oil, with a production mix of approximately 60.5% natural gas to 39.5% liquids during 2012. We expect that the Merit Acquisition and our horizontal drilling program will allow us to substantially increase our crude oil and NGL production. While our legacy properties in the Eastern Operating Region primarily produce natural gas, our Ohio properties are prospective in the wet gas and crude oil windows of the Utica Shale. This strategy of a diversified commodity mix helps to mitigate the financial impact from a decline in the market price in any one of our commodities. In addition, we utilize commodity-based derivative instruments to manage a substantial portion of our exposure to price volatility with regard to our natural gas and crude oil sales and natural gas marketing. As of December 31, 2012, we had natural gas and crude oil derivative positions in place for 2013 covering approximately 28.7 Bcfe of our natural gas production and approximately 2,326 MBbls of our crude oil production. Currently, we do not hedge our NGL production. See Part II, Item 7A, Quantitative and Qualitative Disclosures about Market Risk, for a detailed summary of our open derivative positions.
Divestitures
Permian Basin. In October 2011, we announced our intent to divest our acreage located in the Wolfberry Trend in the Permian Basin in West Texas to focus our efforts inour horizontal drilling programs and to provide funding for our 2012 capital budget. During the fourth quarter of 2011, we completed the sale of our non-core Permian assets to unrelated third parties for a total of $13.2 million. On December 20, 2011, we executed a purchase and sale agreement with another unrelated third party for the sale of our core Permian assets for a total price of $173.9 million, subject to customary post-closing adjustments. The transaction closed on February 28, 2012 with total proceeds received of $184.4 million after preliminary closing adjustments. The proceeds from the sales were used to pay down our corporate credit facility, until needed to fund our 2012 capital budget. The Permian Basin assets were classified as held for sale as of December 31, 2011 and 2010, and the results of operations related to those assets were reported as discontinued operations in 2010, year of acquisition, and 2011 on our consolidated statements of operations included in this report.
North Dakota. In December 2010, we effected a letter of intent with an unrelated third party for the sale of our North Dakota assets. The North Dakota assets were classified as held for sale as of December 31, 2010, and the results of operations related to those assets were reported as discontinued operations in 2009, 2010 and 2011 on our consolidated statements of operations included in this report. In February
2011, we executed a purchase and sale agreement and subsequently closed with the same unrelated party. Proceeds from the sale were $9.5 million, net of non-affiliated investor partners' share of $3.8 million, resulting in a pretax gain on sale of $3.9 million.
ExplorationSelective exploration
We believe that our disciplined exploration program has the potential to consistently replenish our portfolio with new exploration projects capable of positioning us for significant production and reserve growth in future years. Due to the continued decline in natural gas prices, we have focused our efforts toward liquid-rich plays to take advantage of the current attractive economics associated with crude oil and NGL weighted projects. We strive to identify potential plays in their early stages in an attempt to accumulate significant leasehold positions prior to competitive forces driving up the cost of entry. We seek investment in leasehold positions that are in the proximity of existing or emerging pipeline infrastructures. We believe the leaseholdsleasehold we acquired targeting the Utica Shale meetmeets these criteria and we see these leaseholdsthe derisking and delineation of this leasehold as our primary exploration playfocus during for 2012.
Manage Operational and Financial Risk
We focus on lower risk development drilling programs in resource plays with repeatable drilling opportunities that will grow reserves and production while maintaining or growing cash flows. We regularly review acquisition opportunities in our core areas of operation as we believe we can enhance the value of such opportunities through economies of scale. We believe development drilling will remain the foundation of our drilling programs; however, we view a disciplined approach to exploratory drilling as having the potential to identify new development opportunities, as we have done in recent years with our horizontal Niobrara and Marcellus drilling programs.
We engage in limited exploratory drilling as such activities involve numerous risks, including the risk that we may not be successful in the discovery of commercially productive natural gas and crude oil reservoirs. Costs associated with exploratory activities can be quite high. In an effort to mitigate in part the financial risk associated with exploratory activities, we may seek opportunities to participate in joint venture arrangements to share in the potential high costs and risks of exploratory drilling while maximizing the potential returns. We believe our Marcellus JV has effectively served to mitigate the risks associated with exploring the Marcellus Shale. We are currently seeking an investment partner to participate with us in exploring our newly acquired Ohio properties, which are prospective for the wet gas and crude oil windows of the Utica Shale. We cannot assure we will be successful in securing a joint venture partner or developing this acreage.
We believe we proactively employ strategies to help reduce the financial risks associated with the oil and gas industry. One such strategy is to maintain a balanced production mix of natural gas and liquids. Our Western Operating Region produces natural gas, NGLs and crude oil, with a production mix of approximately 65% natural gas to 35% liquids. While our legacy properties in the Eastern Operating Region primarily produce natural gas, our Ohio properties are prospective for the wet gas and crude oil windows of the Utica Shale. This strategy of a diversified commodity mix helps to mitigate the financial impact from a decline in the market price in any one of our commodities. In addition, we utilize commodity-based derivative instruments to manage a portion of our exposure to price volatility with regard to our natural gas and crude oil sales and natural gas marketing. We utilize both financial and physical derivative instruments. The financial instruments consist of floors, collars, swaps and basis swaps and consist of NYMEX, CIG and PEPL-based contracts. We may utilize derivatives based on other indices or markets where appropriate. The contracts provide price stability for up to 80% of our committed and anticipated natural gas and crude oil sales and purchases forecasted to occur within the next five-year period. Our policies prohibit the use of commodity derivatives for speculative purposes and permit utilization of derivatives only if there is an underlying physical position. As of December 31, 2011, we had natural gas and crude oil derivative positions in place for 2012 covering 59.1% of our expected natural gas production and 60.8% of our expected crude oil production. Currently, we do not hedge our NGL production. See Item 7A, Quantitative and Qualitative Disclosures about Market Risk, for a detailed summary of our open derivative positions.
Riley Natural Gas ("RNG"), a wholly-owned subsidiary, uses financial derivatives in its gas marketing operations to augment its fixed purchases and sales. RNG also enters into back-to-back fixed-price physical purchases and sales contracts with counterparties. RNG does not always hedge the area basis risk for third party trades with back-to-back fixed price purchases and sales. We continue to evaluate the potential for reducing this risk by entering into derivative transactions. Further, we may choose to close out any portion of a derivative contract existing at any time, which may result in a realized gain or loss on that derivative transaction.2013.
Business Segments
We divide our operating activities into two segments: (1) Oil and Gas Exploration and Production and (2) Gas Marketing.
Oil and Gas Exploration and Production
Our Oil and Gas Exploration and Production segment primarily reflects revenues and expenses from the production and sale of natural gas, NGLs and crude oil.
Natural gas. We primarily sell our natural gas to midstream marketers, utilities, industrial end-users and other wholesale purchasers. We primarilygenerally sell the natural gas that we produce under contracts with indexed or NYMEX monthly pricing provisions, with the remaining production sold under contracts with daily pricing provisions. Virtually all of our contracts include provisions wherein prices change monthly with changes in the market, for which certain adjustments may be made based on whether a well delivers
to a gathering or transmission line and the quality of the natural gas and prevailing supply and demand conditions.gas. Therefore, the price of the natural gas fluctuates to remain competitive with other available natural gas supplies. As a result, our revenues from the sale of
natural gas, holding production volume constant, increase as market prices increase and decrease as market prices decline. We believe that the pricing provisions of our natural gas contracts are customary in the industry.
NGLs. The majority of our NGLs are sold to one NGL marketer in the Wattenberg Field. Our NGL production is sold under both short- and long-term purchase contracts with monthly pricing provisions based on an average daily price.
Crude oil. We do not refine any of our crude oil production. We sell our crude oil to oil marketers and refiners. Our crude oil production is sold to purchasers at or near our wells under both short and long-term purchase contracts with monthly pricing provisions based on an average daily price.
NGLs. The majority of our NGLs are sold to one NGL marketer in the Wattenberg Field. Our NGL production is sold under both shortshort- and long-term purchase contracts with monthly pricing provisions based on an average daily price.
We enter into financial derivatives in order to reduce the impact of possible price volatility regarding the physical sales market. See Part II, Item 7, Management’sManagement's Discussion and Analysis of Financial Condition and Results of Operations: Results of Operations –- Commodity Price Risk Management, Net, Natural Gas and Crude Oil Derivative Activities, Item 7A, Quantitative and Qualitative Disclosures about Market Risk, and Note 4, Derivative Financial Instruments, to our consolidated financial statements included elsewhere in this report.
Our Oil and Gas Exploration and Production segment also reflects revenues and expenses related to well operations and pipeline services. We are paid a monthly operating fee for the portion of each well we operate that is owned by others, including our affiliated partnerships. We believe the fee is competitive with rates charged by other operators in the area. As we acquire the working interest of our non-affiliated investor partners in our affiliated partnerships, revenues related to well operations and pipeline services will decrease.
We construct, own and operate gathering systems in some of our areas of operations. Pipelines and related facilities can represent a significant portion of the capital costs of developing wells, particularly in new areas located at a distance from existing pipelines. We consider these costs in the evaluation of our leasing, development and acquisition opportunities.
Our natural gas and NGLs areis transported through our own and third partythird-party gathering systems and pipelines, and we incur gathering, processing and transportation expenses to move our natural gas from the wellhead to a purchaser-specified delivery point. These expenses vary based onupon the volume and distance shipped, andas well as the fee charged by the third-party processor or transporter. Capacity on these gathering systems and pipelines is occasionally interrupted due to operational issues, repairs or improvements. A majorityportion of our natural gas is transported under interruptible contracts and thusthe remainder under firm transportation agreements, either directly with RNG or through third-party processors or marketers. Therefore, interruptions in natural gas sales could result if pipeline space is constrained, resultconstrained. As discussed in an interruption inPart II, Item 7, Management's Discussion and Analysis of Financial Condition and Results of Operations - Operational Overview, our 2012production was adversely affected by high line pressures experienced by our principal third-party provider of natural gas sales.gathering, processing and transportation facilities in the Wattenberg Field. The high line pressure was the result of a series of operational issues and capacity constraints, primarily in the second and third quarters. The operational issues included downtime on downstream third-party NGL transportation and fractionation facilities and abnormally warm weather, which limited third-party gathering system compression capacity. We are working closely with our primary midstream provider who is implementing a multi-year facility expansion capable of significantly increasing long-term gathering and processing capacity in the Wattenberg Field. However, we do not expect the impact of this increased capacity to substantially benefit us until late 2013. While our ability to market these volumes of natural gas has been only infrequently limited or delayed, if transportation space is restricted or is unavailable, our production and cash flowflows from the affected properties could be adversely affected.
In certain instances, we enter into firm transportation agreements to provide for pipeline capacity to flow and sell a portion of our natural gas volumes. In order to meet pipeline specifications, we are required, in some cases, to process our natural gas before we can transport it. We typically contract with third parties in the Piceance Basin and the NECO areasarea of our Western Operating Region and our Eastern Operating Region for firm transportation of our natural gas. We also may enter into firm sales agreements to ensure that we are selling to a purchaser who has contracted for pipeline capacity. These agreements are subject to the same limitations discussed above in this paragraph. See Note 11, Commitments and Contingencies - Firm Transportation Agreements, to our consolidated financial statements included elsewhere in this report for our long-term firm sales, processing and transportation agreements for pipeline capacity.
Our crude oil production is marketed directly to purchasers in the Wattenberg Field area under a combination of annual and short-term monthly agreements. The majority of our crude oil is delivered to local area refineries with other volumes being either trucked or shipped via pipeline out of the Wattenberg area.
See Part II, Item 7, Management's Discussion and Analysis of Financial Condition and Results of Operations - Results of Operations, Summary Operating Results, for production, sales, prices and lifting cost data for each of the years in the three-year period ended December 31, 2011.2012.
Gas Marketing
Our Gas Marketing segment is comprised solely of the operating activities of RNG. RNG specializes in the purchase, aggregation and sale of natural gas production in the Eastern Operating Region. RNG purchases for resale natural gas produced by third partythird-party producers, as well as natural gas produced by us, PDCM and our affiliated partnerships. The natural gas is marketed to third partythird-party marketers, natural gas utilities as well asand industrial and commercial customers, either directly through our gathering system or through transportation services provided by regulated interstate pipeline companies. Additionally, RNG markets our natural gas production in the NECO area.
For additional information regarding our business segments, see Note 17,18, Business Segments, to our consolidated financial statements included elsewhere in this report.
Areas of Operations
The following map presents the general locations of our development, production and exploration activities as of December 31, 2011.2012. With the divestiture of our Permian Basin assets on February 28, 2012, our development, production and exploration efforts are primarily focused in two geographic areas of the U.S.
(1) On February 4, 2013, we entered into a purchase and sale agreement with certain affiliates of Caerus, pursuant to which we have agreed to sell our Piceance Basin, NECO and certain non-core Colorado oil and gas properties, leasehold mineral interests and related assets, including derivatives. See Note 19, Subsequent Events, to our consolidated financial statements included elsewhere in this report for additional information regarding the planned divestiture. There can be no assurance we will be successful in closing such divestiture.
Western Operating Region
Our primary focus in the Western Operating Region for 20122013, and we expect for the near termnext several years, is on horizontal Niobrara and Codell development drilling. We divide our Western Operating Region into two majorthe following areas: the Wattenberg Field and Piceance Basin.
Wattenberg Field, DJ Basin, Colorado. WellsCurrently, wells drilled in this area have historically been vertical and range from approximately 7,000 to 8,000 feet in depth. Theseare horizontal wells targettargeting the liquid-rich reservoirs in the Codell and Niobrara formations that have historically contained about 50% crude oil and NGLs. In October 2010, we began aformations. These horizontal drilling program targeting the liquid-rich Niobrara formation. The horizontal Niobrara wells have a vertical depth range from approximately 7,000 to 8,000 feet, with an average lateral length of 4,000 feet. OperationsWe drill multi-well pads to further optimize costs and enhance horizontal drilling efficiencies in the Wattenberg Field. Pad drilling enables us to streamline the transition to increased well density in the horizontal Niobrara and Codell plays. We have approximately 3,300 gross projects, including over 1,400 proved and probable horizontal projects, in the liquid-rich Wattenberg Field.
In June 2012, we completed an acquisition of approximately 29,800 net acres in the core area, which positions us as the third largest producer and leaseholder in the core Wattenberg area. We estimate that the Wattenberg Field has approximately 400 horizontal drilling locations based on 4 gross wells per section for our proved undeveloped reserves ("PUDs"). Additional potential upside exists as we continue testing the Codell formation and plan to test downspacing to 10 gross wells per section in addition to developmental drilling, include athe play as part of our 2013 horizontal program, which is the basis for our estimate of refractures and recompletion projects on existingover 1,400 horizontal wells in the Codellour proved and Niobrara reservoirs.probable inventory.
Piceance Basin, Colorado. Wells in this area predominately target natural gas withfrom the area's volume ofWilliams Fork formation. For 2012, we removed all PUD reserves in the Piceance Basin due to low natural gas prices. Our 2012 Piceance natural gas reserves representingwere 66.5 Bcfe, or approximately 47%6% of our total proved natural gasequivalent reserves. Our Piceance reserves which equates to approximately 32% of our total proved reserves. Reserves in this area represent approximately 1%2% of our
present valuePV-10% as of future net revenues ("PV-10%"), a non-U.S. GAAP measure.December 31, 2012. See table in the Properties -Proved- Proved Reserves section below for information regarding our proved reserves and PV-10% as of December 31, 2011. While all inputs to the cash flow model must be evaluated at each date that the estimate of future cash flows for each producing basin is calculated, a significant decrease in long-term forward natural gas prices alone could result in a significant impairment for our properties that are sensitive to declines in natural gas prices.2012.
The majority of the wells drilled in this area are drilled directionally from multi-well drilling pads, generally range from two to ten wells per pad and range from 7,000 to 9,500 feet in depth. Reserves in this area originate from multiple sandstone reservoirs in the Mesaverde Williams Fork formation. Well spacing is approximately ten acres per well.
Northeastern Colorado ("NECO"). Wells drilled in this arearea range from 1,500 to 3,000 feet in depth and target natural gas reserves in the shallow Niobrara reservoir. We have not conducted drilling activity in this area since 2009.Well spacing is approximately 40 acres per well.
Permian Basin.As of December 31, 2011, our Permian assets were held for sale and,noted above, on February 28, 2012,4, 2013, we entered into a purchase and sale agreement with Caerus pursuant to which Caerus agreed to purchase our Piceance Basin, NECO and other non-core Colorado leasehold mineral interests and various other assets within these basins for an aggregate cash consideration of approximately $200 million, subject to post-closing adjustments. The cash consideration is subject to customary adjustments, including adjustments based upon title and environmental due diligence, and by certain firm transportation obligations and natural gas hedging positions that will be assumed by Caerus as part of the divestiture closed. See Note 13, Assets Held for Sale, Divestiturestransaction. The effective date of the transaction is January 1, 2013. We intend to use the proceeds from the sale to repay a portion of amounts outstanding under our revolving credit facility and Discontinued Operations, and Note 18, Subsequent Event, topartially fund our consolidated financial statements included2013 capital program. There can be no assurance we will be successful in this report for additional details related to the divestiture of our Permian assets.
closing such divestiture.
Eastern Operating Region
Our primary focus in the Eastern Operating Region is on horizontal drilling in the Utica Shale in southeastern Ohio and the Marcellus Shale play in northern West Virginia and, with the addition of leaseholds in Ohio during 2011, exploratory and delineation drilling in the emerging Virginia.
Utica Shale, play.
8Ohio. We have acquired approximately 45,000 net acres targeting the wet natural gas and crude oil windows of the Utica Shale play throughout southeastern Ohio. To date, we have drilled and completed two horizontal wells in Guernsey County that are currently waiting on first production, as well as two stratigraphic vertical test wells to collect engineering and geologic data to test the productivity of the acreage. The horizontal wells have a vertical depth range of approximately 7,000 feet, with an average lateral length of 4,000 feet.
Marcellus Shale, West Virginia. In October 2009, through our contribution of the majority of our Eastern Operating Region assets, consisting of acreage, producing properties and related reserves, gathering assets and equipment, and a cash contribution byThrough our joint venture, partner,PDCM, we formed the joint venture PDCM. The wells contributed were producing from the shallow Devonian and Mississippian aged tight sandstone reservoirs, ranging from 1,200 to 6,000 feet in depth. In October 2011, PDCM acquired all rights and depths to 100,000have over 236,000 net acres of which 90,000 netin the Appalachian Basin, with approximately 152,000 acres are prospective for the Marcellus Shale, and added an additional 1,340 gross wells producing from the Devonian and Mississippian formations.majority of which is in northern West Virginia. PDCM is primarily focused on horizontal drilling targeting theand has approximately 600 Marcellus Shale formation in northerngross drilling locations on the West Virginia.Virginia acreage. These wells have a vertical depth range from approximately 7,000 to 8,000 feet, with lateral lengths ranging from 4,000 to 6,000 feet.
In addition to our ownership interest in the wells held by PDCM, we own an interest in approximately 311236 gross 106.2 net,(77.9 net) natural gas and crude oil wells in West Virginia Pennsylvania and Tennessee.
Utica Shale, Ohio. Our newest prospect is the Utica Shale play in southeastern Ohio, with our initial leasehold acquisitions occurring in 2011. Exploratory drilling activity began in the fourth quarter, with one vertical well drilled to total depth, approximately 9,600 feet, and subsequently fracture treated in early 2012. We continue to pursue an industry joint venture partner to participate in and share in funding the growth and development in this play; however, we cannot assure we will be successful in securing a partner or developing the play.
Pennsylvania.
Properties
Productive Wells
The following table presents our productive wells.wells:
| | | | | Productive Wells | | Productive Wells |
| | | As of December 31, 2011 | | As of December 31, 2012 |
| | | Natural Gas | | Crude Oil | | Total | | Natural Gas | | Crude Oil | | Total |
| Operating Region/Area | | Gross | | Net | | Gross | | Net | | Gross | | Net | | Gross | | Net | | Gross | | Net | | Gross | | Net |
| Western | | | | | | | | | | | | | | | | | | | | | | | | |
| Wattenberg Field | | 1,762 |
| | 1,456.0 |
| | 24 |
| | 19.1 |
| | 1,786 |
| | 1,475.1 |
| | 2,523 |
| | 2,181.2 |
| | 91 |
| | 71.8 |
| | 2,614 |
| | 2,253.0 |
|
| Piceance Basin | | 348 |
| | 301.4 |
| | — |
| | — |
| | 348 |
| | 301.4 |
| |
| Permian Basin (1) | | — |
| | — |
| | 58 |
| | 54.5 |
| | 58 |
| | 54.5 |
| |
| NECO | | 618 |
| | 410.0 |
| | — |
| | — |
| | 618 |
| | 410.0 |
| |
| Other | | 97 |
| | 95.0 |
| | 3 |
| | 0.7 |
| | 100 |
| | 95.7 |
| | 1,057 |
| | 800.7 |
| | — |
| | — |
| | 1,057 |
| | 800.7 |
|
| Total Western | | 2,825 |
| | 2,262.4 |
| | 85 |
| | 74.3 |
| | 2,910 |
| | 2,336.7 |
| | 3,580 |
| | 2,981.9 |
| | 91 |
| | 71.8 |
| | 3,671 |
| | 3,053.7 |
|
| Eastern | | | | | | | | | | | | | | | | | | | | | | | | |
| Appalachian Basin | | 3,568 |
| | 1,652.4 |
| | 39 |
| | 15.5 |
| | 3,607 |
| | 1,667.9 |
| | 3,565 |
| | 1,654.5 |
| | 6 |
| | 3.7 |
| | 3,571 |
| | 1,658.2 |
|
| Total Eastern | | 3,568 |
| | 1,652.4 |
| | 39 |
| | 15.5 |
| | 3,607 |
| | 1,667.9 |
| | 3,565 |
| | 1,654.5 |
| | 6 |
| | 3.7 |
| | 3,571 |
| | 1,658.2 |
|
| Total productive wells | | 6,393 |
| | 3,914.8 |
| | 124 |
| | 89.8 |
| | 6,517 |
| | 4,004.6 |
| | 7,145 |
| | 4,636.4 |
| | 97 |
| | 75.5 |
| | 7,242 |
| | 4,711.9 |
|
| | | | | | | | | | | | | | | | | | | | | | | | | |
__________
| |
(1) | As of December 31, 2011, our Permian assets were held for sale and, on February 28, 2012, the divestiture closed. See Note 13, Assets Held for Sale, Divestitures and Discontinued Operations, and Note 18, Subsequent Event, to our consolidated financial statements included in this report for additional details related to the divestiture of our Permian assets. |
Proved Reserves
Our proved reserves are sensitive to future natural gas, NGLs and crude oil sales prices and theirthe related effect on the economic productive life of producing properties. Increases in commodity prices may result in a longer economic productive life of a property or result in more economically viable proved undeveloped reserves to be recognized. Decreases in commodity prices may result in negative impacts of this nature.
All of our proved reserves are located onshore in the U.S. Our reserve estimates are prepared with respect to reserve categorization, using the definitions for proved reserves set forth in SEC Regulation S-X, Rule 4-10(a) and subsequent SEC staff regulations, interpretations and guidance. AllAs of December 31, 2012, all of our proved reserves, as of December, 31, 2011, including the reserves of all subsidiaries consolidated for the purposes of our financial statements, have been estimated by independent petroleum engineers.
We have a comprehensive process that governs the determination and reporting of our proved reserves. As part of our internal control process, our reserves are reviewed annually by an internal team composed of reservoir engineers, geologists and accounting personnel for adherence to SEC guidelines through a detailed review of land records, available geological and reservoir data, as well as production performance data. The process includes a review includes, but is not limited to, confirmation that reserve estimates (1) include all properties owned, (2) are based on properof applicable working and net revenue interests and (3) reflect reasonable cost estimates and field performance.performance data. The internal team compiles the reviewed data and forwards the data to an independent engineering firm engaged to estimate our reserves.
Our reserve estimates as of December 31, 2011,2012 were based on a reserve report prepared by Ryder Scott Company, L.P. ("Ryder Scott").Scott. When preparing our reserve estimates, the independent petroleum engineerRyder Scott did not independently verify the accuracy and completeness of information and data furnished by us with respect to ownership interests, production volumes, well test data, historical costs of operations and development, product prices or any agreements relating to current and future operations of properties and sales of production.
The independent petroleum engineerRyder Scott prepares an estimate of our reserves in conjunction with an ongoing review by our engineers. A final comparison of data is performed to ensure that the reserve estimates are complete, determined by acceptable industry methods and to a level of detail we deem appropriate. TheRyder Scott's final independent petroleum engineer's estimated reserve report is reviewed and approved by our engineering staff and management.
The professional qualifications of the internal lead engineer primarily responsible for overseeing the preparation of our reserve estimates meet the standards of Reserves Estimator, as defined in the Standards Pertaining to the Estimating and Auditing of Oil and Gas Reserves Information as promulgated by the Society of Petroleum Engineers. This employee holds a Bachelor of Science degree in Petroleum and Chemical Refining Engineering with a minor in Petroleum Engineering, and has over 3035 years of experience in reservoir engineering. The individualengineering, is a member of the Society of Petroleum Engineers and the Society of Petroleum Evaluation Engineers and is a registered Professional Engineer in the State of Colorado.
The following tablesSEC's reserve rules expanded the technologies that a registrant may use to establish reserves. The SEC now allows use of techniques that have been proved effective by actual production from projects in the same reservoir or an analogous reservoir, or by other evidence using reliable technology that establishes reasonable certainty. Reliable technology is a grouping of one or more technologies (including computational methods) that has been field tested and has been demonstrated to provide information regardingreasonably certain results with consistency and repeatability in the formation being evaluated or in an analogous formation.
We used a combination of production and pressure performance, wireline wellbore measurements, offset analogies, seismic data and interpretation, wireline formation tests, geophysical logs and core data to calculate our estimated proved reserves. Reservesreserve estimates, including the material additions to the 2012 reserve estimates.
Reserve estimates involve judgments and, therefore, cannot be measured exactly, because reserve estimates involve judgments.exactly. The estimates must be reviewed periodically and adjusted to reflect additional information gained from reservoir performance, new geological and geophysical data and economic changes. Neither the estimated future net cash flows nor the standardized measure of discounted future net cash flows ("standardized measure") is intended to represent the current market value of our proved reserves. For additional information regarding both of these measures, as well as other information regarding our proved reserves, see the unaudited Supplemental Information - Natural Gas and Crude Oil Information provided with our consolidated financial statements included elsewhere in this report. The following tables provide information regarding our estimated proved reserves:
| | | | As of December 31, | As of December 31, |
| | 2011 (1) | | 2010 (1) | | 2009 | 2012 (5) | | 2011 (4)(5) | | 2010 (4)(5) |
| Proved reserves | | | | | | | | | | |
Natural gas (MMcf) (2) | 672,145 |
| | 657,306 |
| | 608,925 |
| 604,038 |
| | 672,145 |
| | 657,306 |
|
Crude oil and condensate (MBbls) | 37,636 |
| | 23,236 |
| | 18,070 |
| 59,310 |
| | 37,636 |
| | 23,236 |
|
NGLs (MBbls) (2)(1) | 19,588 |
| | 10,649 |
| | — |
| 32,827 |
| | 19,588 |
| | 10,649 |
|
Total proved reserves (MMcfe) | 1,015,489 |
| | 860,616 |
| | 717,345 |
| 1,156,860 |
| | 1,015,489 |
| | 860,616 |
|
Proved developed reserves (MMcfe) (3)(2) | 471,347 |
| | 301,141 |
| | 295,839 |
| 490,515 |
| | 471,347 |
| | 301,141 |
|
Estimated future net cash flows (in millions) | $ | 2,290 |
| | $ | 1,315 |
| | $ | 764 |
| $ | 2,756 |
| | $ | 2,290 |
| | $ | 1,315 |
|
PV-10% (in millions) (4)(3) | $ | 1,350 |
| | $ | 693 |
| | $ | 360 |
| $ | 1,709 |
| | $ | 1,350 |
| | $ | 693 |
|
Standardized measure (in millions) | $ | 941 |
| | $ | 488 |
| | $ | 348 |
| $ | 1,168 |
| | $ | 941 |
| | $ | 488 |
|
___________
| |
| (1) | Includes estimated reserve data related to our Permian assets, which were held for sale asApproximately 49% of the increase in crude oil and condensate and 38% of the increase in NGLs from December 31, 2011 and, on February 28,to December 31, 2012 the divestiture closed. See Note 13, Assets Held for Sale, Divestitures and Discontinued Operations, and Note 18, Subsequent Event, to our consolidated financial statements included in this report for additional details relatedis due to the divestitureaddition of our Permian assets. |
The following table sets forth information regarding estimated proved reserves for our Permian assets.
|
| | | | | | | |
| | As of December 31, |
| | 2011 | | 2010 |
| Proved reserves | | | |
Natural gas (MMcf) | 6,242 |
| | 4,979 |
|
Crude Oil and condensate (MBbls) | 7,825 |
| | 3,331 |
|
NGLs (MBbls) | 1,971 |
| | 1,190 |
|
Total proved reserves (MMcfe) | 65,018 |
| | 32,105 |
|
Proved developed reserves (MMcfe) | 15,940 |
| | 11,416 |
|
Estimated future net cash flows (in millions) | $ | 348 |
| | $ | 129 |
|
| |
(2) | Phorizontal Niobrara and Codell rior to 2010, NGLs were includedproved developed and undeveloped reserves in natural gas, which impacts comparability of 2011 and 2010 to 2009.the Wattenberg Field.
|
| |
(3)(2) | Approximately 73.4%73% of the increase in proved developed reserves from December 31, 2010 to December 31, 2011 was due to the reclassification of our estimated Wattenberg refracture reserves from proved undevelopedPUDs to proved developed as a result of the greater differencecost differential between the cost of a refracture andversus the cost of drilling a new well. |
| |
(4)(3) | PV-10% is a non-U.S. GAAP financial measure. This non-U.S. GAAP measures is not a measure of financial or operating performance under U.S. GAAP norand it is itnot intended to represent the current market value of our estimated reserves. PV-10% should not be considered in isolation or as a substitute for the standardized measure reported in accordance with U.S. GAAP, but rather should be considered in addition to the standardized measure. See Part I, Item 7. Management's Discussion and Analysis of Financial Condition and Results of Operations - Reconciliation of Non-U.S. GAAP Financial Measures, for a definition of PV-10% and a reconciliation of our PV-10% value to the standardized measure. |
GAAP Financial Measures, for a definition of PV-10% and a reconciliation of our PV-10% value to the standardized measure.
|
| | | | | | | | | | | | | | | |
| | | As of December 31, 2011 |
| Operating Region/Area | | Natural Gas
(MMcf) | | NGLs (MBbls) | | Crude Oil and Condensate (MBbls) | | Natural Gas
Equivalent
(MMcfe) | | Percent |
| Proved developed | | | | | | | | | | |
| Western | | | | | | | | | | |
| Wattenberg Field | | 113,911 |
| | 11,203 |
| | 14,788 |
| | 269,857 |
| | 58 | % |
| Piceance Basin | | 108,642 |
| | — |
| | 231 |
| | 110,028 |
| | 23 | % |
| Permian Basin (1) | | 1,750 |
| | 550 |
| | 1,815 |
| | 15,940 |
| | 3 | % |
| Other | | 31,940 |
| | — |
| | — |
| | 31,940 |
| | 7 | % |
| Total Western | | 256,243 |
| | 11,753 |
| | 16,834 |
| | 427,765 |
| | 91 | % |
| Eastern | | | | | | | | | | |
| Appalachian Basin | | 43,126 |
| | — |
| | 76 |
| | 43,582 |
| | 9 | % |
| Total Eastern | | 43,126 |
| | — |
| | 76 |
| | 43,582 |
| | 9 | % |
| Total proved developed | | 299,369 |
| | 11,753 |
| | 16,910 |
| | 471,347 |
| | 100 | % |
| Proved undeveloped | | | | | |
| | | | |
| Western | | | | | |
| | | | |
| Wattenberg Field | | 64,071 |
| | 6,414 |
| | 14,506 |
| | 189,591 |
| | 35 | % |
| Piceance Basin | | 210,467 |
| | — |
| | 210 |
| | 211,727 |
| | 39 | % |
| Permian Basin (1) | | 4,492 |
| | 1,421 |
| | 6,010 |
| | 49,078 |
| | 9 | % |
| Other | | 3,194 |
| | — |
| | — |
| | 3,194 |
| | * |
|
| Total Western | | 282,224 |
| | 7,835 |
| | 20,726 |
| | 453,590 |
| | 83 | % |
| Eastern | | | | | | | | | | |
| Appalachian Basin | | 90,552 |
| | — |
| | — |
| | 90,552 |
| | 17 | % |
| Total Eastern | | 90,552 |
| | — |
| | — |
| | 90,552 |
| | 17 | % |
| Total proved undeveloped | | 372,776 |
| | 7,835 |
| | 20,726 |
| | 544,142 |
| | 100 | % |
| Proved reserves | | | | | | | | | | |
| Western | | | | | | | | | | |
| Wattenberg Field | | 177,982 |
| | 17,617 |
| | 29,294 |
| | 459,448 |
| | 46 | % |
| Piceance Basin (2) | | 319,109 |
| | — |
| | 441 |
| | 321,755 |
| | 32 | % |
| Permian Basin (1) | | 6,242 |
| | 1,971 |
| | 7,825 |
| | 65,018 |
| | 6 | % |
| Other | | 35,134 |
| | — |
| | — |
| | 35,134 |
| | 3 | % |
| Total Western | | 538,467 |
| | 19,588 |
| | 37,560 |
| | 881,355 |
| | 87 | % |
| Eastern | | | | | | | | | | |
| Appalachian Basin | | 133,678 |
| | — |
| | 76 |
| | 134,134 |
| | 13 | % |
| Total Eastern | | 133,678 |
| | — |
| | 76 |
| | 134,134 |
| | 13 | % |
| Total proved reserves | | 672,145 |
| | 19,588 |
| | 37,636 |
| | 1,015,489 |
| | 100 | % |
| | | | | | | | | | | |
______________
* De Minimis
| |
(1)(4) | AsIncludes estimated reserve data related to our Permian assets, which were classified as held for sale as of December 31, 2011, our Permian assets were held for sale and, on2011. On February 28, 2012, the divestiture closed. See Note 13,14, Assets Held for Sale, Divestitures and Discontinued Operations, and Note 18, Subsequent Event, to our consolidated financial statements included elsewhere in this report for additional details related to the divestiture of our Permian assets.
|
The following table sets forth information regarding estimated proved reserves for our Permian assets:
|
| | | | | | | |
| | As of December 31, |
| | 2011 | | 2010 |
| Proved reserves | | | |
Natural gas (MMcf) | 6,242 |
| | 4,979 |
|
Crude oil and condensate (MBbls) | 7,825 |
| | 3,331 |
|
NGLs (MBbls) | 1,971 |
| | 1,190 |
|
Total proved reserves (MMcfe) | 65,018 |
| | 32,105 |
|
Proved developed reserves (MMcfe) | 15,940 |
| | 11,416 |
|
Estimated future net cash flows (in millions) | $ | 348 |
| | $ | 129 |
|
| |
(2)(5) | Two leases inIncludes estimated reserve data related to our Piceance Basin represent 32%and NECO assets, which are to be divested pursuant to a purchase and sale agreement entered into on February 4, 2013. See Note 19, Subsequent Events, to our consolidated financial statements included elsewhere in this report for additional details related to the planned divestiture of our total proved reserves.Piceance and NECO assets. |
The following table sets forth information regarding estimated proved reserves for our Piceance and NECO assets:
|
| | | | | | | | | | | |
| | As of December 31, |
| | 2012 | | 2011 | | 2010 |
| Proved reserves | | | | | |
Natural gas (MMcf) | 83,656 |
| | 354,080 |
| | 454,886 |
|
Crude oil and condensate (MBbls) | 148 |
| | 441 |
| | 548 |
|
NGLs (MBbls) | — |
| | — |
| | — |
|
Total proved reserves (MMcfe) | 84,544 |
| | 356,726 |
| | 458,174 |
|
Proved developed reserves (MMcfe) | 84,544 |
| | 141,802 |
| | 142,949 |
|
Estimated future net cash flows (in millions) | $ | 43 |
| | $ | 32 |
| | $ | 52 |
|
|
| | | | | | | | | | | | | | | |
| | | As of December 31, 2012 |
| Operating Region/Area | | Natural Gas
(MMcf) | | NGLs (MBbls) | | Crude Oil and Condensate (MBbls) | | Natural Gas
Equivalent
(MMcfe) | | Percent |
| Proved developed | | | | | | | | | | |
| Western | | | | | | | | | | |
| Wattenberg Field | | 158,192 |
| | 14,353 |
| | 20,226 |
| | 365,666 |
| | 74 | % |
| Piceance Basin | | 65,609 |
| | — |
| | 148 |
| | 66,497 |
| | 14 | % |
| Other | | 18,047 |
| | — |
| | — |
| | 18,047 |
| | 4 | % |
| Total Western | | 241,848 |
| | 14,353 |
| | 20,374 |
| | 450,210 |
| | 92 | % |
| Eastern | | | | | | | | | | |
| Appalachian Basin | | 40,077 |
| | — |
| | 38 |
| | 40,305 |
| | 8 | % |
| Total Eastern | | 40,077 |
| | — |
| | 38 |
| | 40,305 |
| | 8 | % |
| Total proved developed | | 281,925 |
| | 14,353 |
| | 20,412 |
| | 490,515 |
| | 100 | % |
| Proved undeveloped | | | | | |
| | | | |
| Western | | | | | |
| | | | |
| Wattenberg Field | | 183,618 |
| | 18,474 |
| | 38,898 |
| | 527,850 |
| | 79 | % |
| Total Western | | 183,618 |
| | 18,474 |
| | 38,898 |
| | 527,850 |
| | 79 | % |
| Eastern | | | | | | | | | | |
| Appalachian Basin | | 138,495 |
| | — |
| | — |
| | 138,495 |
| | 21 | % |
| Total Eastern | | 138,495 |
| | — |
| | — |
| | 138,495 |
| | 21 | % |
| Total proved undeveloped | | 322,113 |
| | 18,474 |
| | 38,898 |
| | 666,345 |
| | 100 | % |
| Proved reserves | | | | | | | | | | |
| Western | | | | | | | | | | |
| Wattenberg Field | | 341,810 |
| | 32,827 |
| | 59,124 |
| | 893,516 |
| | 77 | % |
| Piceance Basin | | 65,609 |
| | — |
| | 148 |
| | 66,497 |
| | 6 | % |
| Other | | 18,047 |
| | — |
| | — |
| | 18,047 |
| | 2 | % |
| Total Western | | 425,466 |
| | 32,827 |
| | 59,272 |
| | 978,060 |
| | 85 | % |
| Eastern | | | | | | | | | | |
| Appalachian Basin | | 178,572 |
| | — |
| | 38 |
| | 178,800 |
| | 15 | % |
| Total Eastern | | 178,572 |
| | — |
| | 38 |
| | 178,800 |
| | 15 | % |
| Total proved reserves | | 604,038 |
| | 32,827 |
| | 59,310 |
| | 1,156,860 |
| | 100 | % |
| | | | | | | | | | | |
Developed and Undeveloped Acreage
The following table presents our developed and undeveloped lease acreage.:
| | | | | As of December 31, 2011 | | As of December 31, 2012 |
| | | Developed | | Undeveloped (1) | | Total | | Developed | | Undeveloped (1) | | Total |
| Operating Region/Area | | Gross | | Net | | Gross | | Net | | Gross | | Net | | Gross | | Net | | Gross | | Net | | Gross | | Net |
| Western | | | | | | | | | | | | | | | | | | | | | | |
| Wattenberg Field | | 53,300 |
| | 51,200 |
| | 28,800 |
| | 20,200 |
| | 82,100 |
| | 71,400 |
| | 92,300 |
| | 81,700 |
| | 33,100 |
| | 23,300 |
| | 125,400 |
| | 105,000 |
|
| Piceance Basin | | 3,100 |
| | 3,100 |
| | 4,900 |
| | 4,900 |
| | 8,000 |
| | 8,000 |
| | 3,100 |
| | 3,100 |
| | 4,900 |
| | 4,900 |
| | 8,000 |
| | 8,000 |
|
| Permian Basin (2) | 3,800 |
| 3,800 |
| | 3,400 |
| | 6,800 |
| | 6,500 |
| | 10,600 |
| | 9,900 |
| |
| NECO | | 23,600 |
| | 19,600 |
| | 81,500 |
| | 71,700 |
| | 105,100 |
| | 91,300 |
| | 23,600 |
| | 19,600 |
| | 64,600 |
| | 54,600 |
| | 88,200 |
| | 74,200 |
|
| Other | | 400 |
| | 400 |
| | 22,100 |
| | 18,000 |
| | 22,500 |
| | 18,400 |
| | — |
| | — |
| | 21,800 |
| | 17,700 |
| | 21,800 |
| | 17,700 |
|
| Total Western | | 84,200 |
| | 77,700 |
| | 144,100 |
| | 121,300 |
| | 228,300 |
| | 199,000 |
| | 119,000 |
| | 104,400 |
| | 124,400 |
| | 100,500 |
| | 243,400 |
| | 204,900 |
|
| Eastern | | | | | | | | | | | | | | | | | | | | | | |
| Appalachian Basin | | 263,900 |
| | 107,300 |
| | 50,000 |
| | 33,150 |
| | 313,900 |
| | 140,450 |
| |
| Appalachian Basin, other | | — |
| 263,900 |
| | 107,300 |
| | 32,000 |
| | 17,950 |
| | 295,900 |
| | 125,250 |
|
| Utica Shale | | | 800 |
| | 400 |
| | 48,200 |
| | 45,300 |
| | 49,000 |
| | 45,700 |
|
| Total Eastern | | 263,900 |
| | 107,300 |
| | 50,000 |
| | 33,150 |
| | 313,900 |
| | 140,450 |
| | 264,700 |
| | 107,700 |
| | 80,200 |
| | 63,250 |
| | 344,900 |
| | 170,950 |
|
| Total acreage | | 348,100 |
| | 185,000 |
| | 194,100 |
| | 154,450 |
| | 542,200 |
| | 339,450 |
| | 383,700 |
| | 212,100 |
| | 204,600 |
| | 163,750 |
| | 588,300 |
| | 375,850 |
|
| | | | | | | | | | | | | | | | | | | | | | | |
__________
| |
| (1) | With the exception of our Eastern Operating Region properties prospective for the Utica Shale, substantially all of our undeveloped acreage is related to leaseholds that are held by production. Approximately 15%10% of our undeveloped leaseholds expire during 2012,2013, none of which is material to any one specific area. |
Drilling Activity
The following table presents information regarding the number of wells drilled or participated in and the number of wells for which refractures and/or recompletions were performed:
|
| | | | | | | | | | | | | | | | | | |
| | | Drilling Activity |
| | | Year Ended December 31, |
| | 2012 | | 2011 | | 2010 |
| Operating Region | | Gross | | Net | | Gross | | Net | | Gross | | Net |
| Western (1) | | 57 |
|
| 39.0 |
|
| 186 |
|
| 139.6 |
|
| 204 |
|
| 164.9 |
|
| Eastern | | 6 |
| | 4.0 |
| | 9 |
| | 5.2 |
| | 9 |
| | 5.2 |
|
| Total wells drilled | | 63 |
| | 43.0 |
| | 195 |
| | 144.8 |
| | 213 |
| | 170.1 |
|
| Refractures and Recompletions (2) | | 85 |
| | 79.9 |
| | 192 |
| | 177.6 |
| | 46 |
| | 33.7 |
|
| | | | | | | | | | | | | |
__________
| |
| (1) | Includes drilling activity in the Permian Basin. As of December 31, 2011, our Permian assets were held for sale and, on February 28, 2012, the divestiture closed. See Note 14, Assets Held for Sale, Divestitures and Discontinued Operations, to our consolidated financial statements included elsewhere in this report for additional details related to the divestiture of our Permian assets. |
| |
| (2) | 83 of the refractures and recompletions in 2012 occurred in the Wattenberg Field. |
The following tables set forth our developmental and exploratory well drilling activity. There is no correlation between the number of productive wells completed during any period and the aggregate reserves attributable to those wells. Productive wells consist of wells spudded, turned-in-line and producing during the period. In-process wells represent wells that are in the process of being drilled or have been drilled and are waiting to be fractured and/or for gas pipeline connection during the period.
|
| | | | | | | | | | | | | | | | | | | | | | | | | | | |
| | | Net Development Well Drilling Activity |
| | | Year Ended December 31, |
| | | 2012 | | 2011 | | 2010 |
| Operating Region/Area | | Productive | | In-Process | | Dry | | Productive | | In-Process | | Dry | | Productive | | In-Process | | Dry |
| Western | | | | | | | | | | | | | | | | | | |
| Wattenberg Field | | 31.3 |
| | 7.7 | (2) | | — |
| | 86.5 |
| | 13.1 |
| | — |
| | 106.9 |
| | 26.5 |
| | — |
|
| Piceance Basin | | — |
| | — |
| | — |
| | 14.0 |
| | 3.0 |
| | — |
| | 18.0 |
| | 7.0 |
| | — |
|
| Permian Basin (1) | | — |
| | — |
| | — |
| | 14.5 |
| | 5.5 |
| | 2.0 |
| | — |
| | 5.0 |
| | — |
|
| Other | | — |
| | — |
| | — |
| | — |
| | — |
| | — |
| | 0.5 |
| | — |
| | — |
|
| Total Western | | 31.3 |
| | 7.7 |
| | — |
| | 115.0 |
| | 21.6 |
| | 2.0 |
| | 125.4 |
| | 38.5 |
| | — |
|
| Eastern | | | | | | | | | | | | | | | | | | |
| Appalachian Basin | | 1.5 |
| | — |
| | — |
| | 0.9 |
| | 2.0 |
| | — |
| | 0.6 |
| | 1.1 |
| | — |
|
| Total Eastern | | 1.5 |
| | — |
| | — |
| | 0.9 |
| | 2.0 |
| | — |
| | 0.6 |
| | 1.1 |
| | — |
|
| Total net development wells | | 32.8 |
| | 7.7 |
| | — |
| | 115.9 |
| | 23.6 |
| | 2.0 |
| | 126.0 |
| | 39.6 |
| | — |
|
| | | | | | | | | | | | | | | | | | | |
__________
| |
| (1) | As of December 31, 2011, our Permian assets were held for sale and, on February 28, 2012, the divestiture closed. See Note 13,14, Assets Held for Sale, Divestitures and Discontinued Operations, and Note 18, Subsequent Event, to our consolidated financial statements included elsewhere in this report for additional details related to the divestiture of our Permian assets. |
| |
| (2) | On a gross basis, wells in-process as of December 31, 2012 consisted of 10 wells in the Wattenberg Field. |
|
| | | | | | | | | | | | | | | | | | | | | | | | | | | |
| | | Net Exploratory Well Drilling Activity |
| | | Year Ended December 31, |
| | | 2012 | | 2011 | | 2010 |
| Operating Region/Area | | Productive | | In-Process | | Dry | | Productive | | In-Process | | Dry | | Productive | | In-Process | | Dry |
| Western | | | | | | | | | | | | | | | | | | |
| Wattenberg Field | | — |
| | — |
| | — |
| | — |
| | — |
| | — |
| | — |
| | 1.0 |
| | — |
|
| Other | | — |
| | — |
| | — |
| | — |
| | 1.0 |
| | — |
| | — |
| | — |
| | — |
|
| Total Western | | — |
| | — |
| | — |
| | — |
| | 1.0 |
| | — |
| | — |
| | 1.0 |
| | — |
|
| Eastern | | | | | | | | | | | | | | | | | | |
| Appalachian Basin | | — |
| | 1.5 |
| | 1.0 |
| | — |
| | 2.3 |
| | — |
| | 2.8 |
| | 0.7 |
| | — |
|
| Total Eastern | | — |
| | 1.5 |
| | 1.0 |
| | — |
| | 2.3 |
| | — |
| | 2.8 |
| | 0.7 |
| | — |
|
| Total net exploratory wells | | — |
| | 1.5 |
| | 1.0 |
| | — |
| | 3.3 |
| | — |
| | 2.8 |
| | 1.7 |
| | — |
|
Title to Properties
We believe that we hold good and defensible leasehold title to our natural gas and crude oil properties, in accordance with standards generally accepted in the industry. As is customary in the industry, a preliminary title examination is typically conducted at the time the undeveloped properties are acquired. Prior to the commencement of drilling operations, a title examination is conducted and remedial work is performed with respect to discovered defects which we deem to be significant. Title examinations have been performed with respect to substantially all of our producing properties.
The properties we own are subject to royalty, overriding royaltroyaltyy and other outstanding interests customary toin the industry. The properties may also be subject to additional burdens, liens or encumbrances customary toin the industry, including items such as operating agreements, current taxes, development obligations under natural gas and crude oil leases, farm-out agreements and other restrictions. We do not believe that any of these burdens will materially interfere with our use of the properties.
Substantially all of our natural gas and crude oil properties, excluding properties held by PDCM and our share of the limited partnerships that we sponsor, have been mortgaged or pledged as security for our corporaterevolving credit facility. Substantially all of ourEastern Operating Region properties, excluding our Ohio acreage,properties, have been pledged as security for PDCM's credit facility. See Note 8, Long-Term Debt, to our consolidated financial statements included elsewhere in this report.
Facilities
We lease 39,72041,710 square feet of office space in Denver, Colorado, which serves as our corporate offices, through December 2015. We own a 32,000 square feet administrative office building located in Bridgeport, West Virginia, where we also lease approximately 18,600 square feet of office space in a second building through October 2014.
We own or lease field operating facilities in the following locations:
Colorado: Evans, Parachute and Wray
Pennsylvania: Indiana and Mahaffey
Texas: Midland
West Virginia: Bridgeport, Buckhannon and Glenville
Ohio: Marietta
Governmental Regulation
While the prices of natural gas and crude oil are market driven, other aspects of our business and the industry in general are heavily regulated. The availability of a ready market for natural gas and crude oil production depends on several factors that are beyond our control. These factors include, but are not limited to, regulation of production, federal and state regulations governing environmental quality and pollution control, the amount of
natural gas and crude oil available for sale, the availability of adequate pipeline and other transportation and processing facilities and the marketing of competitive fuels. In general, state and federal regulations are intended to protect consumers from unfair treatment and oppressive control, to reduce environmental and health risks from the development and transportation of natural gas and crude oil, to prevent misuse of natural gas and crude oil and to protect rights among owners in a common reservoir. Pipelines are subject to the jurisdiction of various federal, state and local agencies. In the western part of the U.S., governments own a large percentage of the land and control the right to develop natural gas and crude oil. Government leases may be subject to additional regulations and controls not common to private leases. We believe that we are in compliance with such statutes, rules, regulations and governmental orders, although there can be no assurance that this is or will remain the case. The following summary discussion on the regulation of the U.S. oil and gas industry is not intended to constitute a complete discussion of the various statutes, rules, regulations and environmental ordersdirectives to which our operations may be subject.
Regulation of Natural Gas and Crude Oil Exploration and Production. Production. Our exploration and production business is subject to various federal, state and local laws and regulations on the taxation of natural gas and crude oil, the development, production and marketing of natural gas and crude oil and environmental and safety matters. Many laws and regulations require drilling permits and govern the spacing of wells, rates of production, water discharge, prevention of waste and other matters. Prior to commencing drilling activities for a well, we must procure permits and/or approvals for the various stages of the drilling process from the applicable state and local agencies where the well being drilled is located. Additionally, other regulated matters include:
bond requirements in order to drill or operate wells;
well locations;
drilling and casing methods;
surface use and restoration of well properties;
well plugging and abandoning;
fluid disposal; and
fluid disposal.air emissions.
In addition, our drilling activities involve hydraulic fracturing, which may be subject to additional federal and state disclosure and regulatory requirements discussed in "Environmental Matters" below and in Item 1A, Environmental MattersRisk Factors.
Our operations are also subject to various conservation laws and regulations. These include the regulation of the size of drilling and spacing units or proration units, the density of wells which may be drilled and the unitization or pooling of properties. In this regard, some states allow the forced pooling or integration of tracts to facilitate exploration while other states rely primarily or exclusively on voluntary pooling of lands and leases. In areas where pooling is voluntary, it may be more difficult to form units, and therefore, more difficult to develop a project if the operator owns less than 100% of the leasehold. State laws may establish maximum rates of production from natural gas and crude oil wells, generally prohibiting the venting or flaring of natural gas and imposing certain requirements regarding the ratability of production. State or federal leases often include additional regulations and conditions. The effect of these regulations may limit the amount of natural gas and crude oil we can produce from our wells and may limit the number of wells or the locations at which we can drill. Such laws and regulations may increase the costs of planning, designing, drilling, installing, operating and abandoning our natural gas and crude oil wells and other facilities. These laws and regulations, and any others that are passed by the jurisdictions where we have production, can limit the total number of wells drilled or the allowable production from successful wells, which can limit our reserves. As a result, we are unable to predict the future cost or effect of complying with such regulations.
Although we currently hold very little acreage under federal leases, if we were to increase such holdings, then our costs and timing would increase due to the new Bureau of Land Management leasing policies announced in May 2010. These policies change, among other things, a required environmental review, including additional public input related to the proposed leases.
Regulation of Sales and Transportation of Natural Gas. GasHistorically, the price of natural gas was subject to limitation by federal legislation. As of January 1, 1993, The Natural Gas Wellhead Decontrol Act removed all remaining federal price controls from natural gas sold in "first sales" on or after that date. The Federal Energy Regulatory Commission's ("FERC") jurisdiction over natural gas transportation was unaffected by the Decontrol Act.
. We move natural gas through pipelines owned by other companies and sell natural gas to other companies that also utilize common carrier pipeline facilities. Natural gas pipeline interstate transmission and storage activities are subject to regulation by the FERCFederal Energy Regulatory Commission ("FERC") under the Natural Gas Act of 1938 ("NGA") and under the Natural Gas Policy Act of 1978, and, as such, rates and charges for the transportation of natural gas in interstate commerce, accounting, and the
extension, enlargement or abandonment of its jurisdictional facilities, among other things, are subject to regulation. Each natural gas pipeline company holds certificates of public convenience and necessity issued by the FERC authorizing ownership and operation of all pipelines, facilities and properties for which certificates are required under the NGA. Each natural gas pipeline company is also subject to the Natural Gas Pipeline Safety Act of 1968, as amended, which regulates safety requirements in the design, construction, operation and maintenance of interstate natural gas transmission facilities. FERC regulations govern how interstate pipelines communicate and do business with their affiliates. Interstate pipelines may not operate their pipeline systems to preferentially benefit their marketing affiliates.
Each interstate natural gas pipeline company establishes its rates primarily through the FERC’sFERC's rate-making process. Key determinants in the ratemaking process are:
costs of providing service, including depreciation expense;
allowed rate of return, including the equity component of the capital structure and related income taxes; and
volume throughput assumptions.
The availability, terms and cost of transportation affect our natural gas sales. In the past, FERC has undertaken various initiatives to increase competition within the industry. As a result of initiatives like FERC Order No. 636, issued in April 1992, the interstate natural gas transportation and marketing system was substantially restructured to remove various barriers and practices that historically limited non-pipeline natural gas sellers, including producers, from effectively competing with interstate pipelines for sales to local distribution companies and large industrial and commercial customers. The most significant provisions of Order No. 636 require that interstate pipelines provide transportation separate or "unbundled" from their sales service, and require that pipelines provide firm and interruptible transportation service on an open access basis that is equal for all natural gas suppliers. In many instances, the result of Order No. 636 and related initiatives has been to substantially reduce or eliminate the interstate pipelines' traditional role as wholesalers of natural gas in favor of providing only storage and transportation services. Another effect of regulatory restructuring is greater access to transportation on interstate pipelines. In some cases, producers and marketers have benefited from this availability. However, competitionCompetition among suppliers has greatly increased and traditional long-term producer-pipeline contracts are rare. Furthermore, gathering facilities of interstate pipelines are no longer regulated by FERC, thus allowing gatherers to charge higher gathering rates. Historically, producers were able to flow supplies into interstate pipelines on an interruptible basis; however, recently we have seen the increased need to acquire firm transportation on pipelines in order to avoid curtailments or shut-in gas, which could adversely affect cash flows from the affected area.
Additional proposals and proceedings that might affect the industry occur frequently in Congress, FERC, state commissions, state legislatures and the courts. The industry historically has been very heavily regulated; therefore, there is no assurance that the less stringent regulatory approach recently pursued by FERC and Congress will continue. We cannot determine to what extent our future operations and earnings will be affected by new legislation, new regulations, or changes in existing regulation, at federal, state or local levels.
Environmental Matters
Our operations are subject to numerous laws and regulations governing the discharge of materials into the environment or otherwise relating to environmental protection. Public interest in the protection of the environment has increased dramatically in recent years. The trend of more expansive and restrictive environmental legislation and regulations is expected to continue. To the extent laws are enacted or other governmental actions are taken restricting drilling or imposing environmental protection requirements resulting in increased costs, our business and prospects may be adversely affected.
We generate wastes that may be subject to the Federal Resource Conservation and Recovery Act ("RCRA") and comparable state statutes. The U.S. Environmental Protection Agency ("EPA") and various state agencies have adopted requirements that limit the approved disposal methods for certain hazardous and non-hazardous wastes. Furthermore, certain wastes generated by our operations that are currently exempt from treatment as "hazardous wastes" may in the future be designated as "hazardous wastes," and therefore may subject us to more rigorous and costly operating and disposal requirements.
Hydraulic fracturing is commonly used to stimulate production of natural gas and/or crude oil from dense subsurface rock formations such as shales that generally exist between 4,000 and 14,000 feet below ground.formations. We routinely apply fracturing in our drillingnatural gas and crude oil production programs. The process involves the injection of water, sand and additives under pressure into a targeted subsurface formation. The water and pressure create fractures in the rock formations, which are held open by the grains of sand, enabling the crude oil or natural gas to flow to the wellbore. The process is generally subject to regulation by state oil and gas commissions. However, the EPA recently asserted federal regulatory authority over certain fracturing activities involving diesel fuel under the federal Safe Drinking Water Act ("SDWA"), and has begun the process of drafting guidance documents related to this newly asserted regulatory authority. In addition, legislation has been introduced before Congress, called the Fracturing Responsibility and Awareness of Chemicals Act, to provide for federal regulation of hydraulic fracturing and to require disclosure of the chemicals used in the hydraulic-fracturinghydraulic fracturing process.
Certain states in which we operate, including Colorado, Pennsylvania and Ohio, have adopted, and other states are considering adopting, regulations that could impose more stringent permitting, transparency and well construction requirements on hydraulic fracturing operations or otherwise seek to ban fracturing activities altogether. In December 2011, Colorado adopted a fracturing chemical disclosure rule, wherein all chemicals used in the hydraulic fracturing of a well must be reported in a publicly searchable registry website developed and maintained by the Ground Water Protection Council and Interstate Oil and Gas Compact Commission. Also,Commission ("Frac Focus"). The new rules also require operators seeking new location approvals to provide certain disclosures regarding fracturing to surface owners and adjacent property owners within 500 feet of a new well. In December 2012 and February 2013, Colorado finalized a baseline groundwater sampling rule and a new rule governing setback distances of oil and gas wells located near population centers. See further discussion in Item 1A, Risk Factors.
In December 2011, West Virginia enacted the Natural Gas Horizontal Well Control Act and amendments to existing laws that together establish a comprehensive, detailed system for permitting and regulation of horizontal natural gas wells. The new law applies to most proposed new natural gas wells. The law imposes far more detailed permitting and regulatory requirements than prior law, and requires further study and authorizes potential rulemaking by the West Virginia Department of Environmental Protection (DEP)("DEP"). Among the new regulatory requirements are: detailed surface owner compensation requirements; performance standards applicable to disposal of drilling cuttings and associated drilling mud, protection of quantity and quality of surface and groundwater systems; advance designation of water withdrawal locations to the DEP and record keepingrecordkeeping and reporting for all flowback and produced water; and restrictions on well locations. In Ohio, in early 2012, officials of the Ohio Department
of Natural Resources imposed a moratorium on injection drilling of wastewater from fracturing operations within a five milefive-mile radius of a well that was suspected as contributing to the cause of earthquakes in the area. Regulation was also enacted requiring the disclosure of chemicals used in hydraulic fracturing and any chemicals used when drilling through a drinking water zone.
The White House Council on Environmental Quality is coordinating an administration-wide review of hydraulic fracturing practices and a committee of the U.S. House of Representatives has conducted an investigation of hydraulic fracturing practices. Furthermore, a number of federal agencies are analyzing, or have been requested to review, environmental issues associated with hydraulic fracturing. The EPA has commenced a study of the potential environmental effects of hydraulic fracturing on drinking water and groundwater,
with initialfinal results expected to be available by late 2012 and final results by 2014. In addition, the U.S. Department of Energy is conducting an investigation into practices the agency could recommend to better protect the environment from drilling using hydraulic-fracturinghydraulic fracturing completion methods. The U.S. Department of the Interior is consideringconducting a rule making, likely to result in new disclosure requirements orand other mandates for hydraulic fracturing on federal lands. These ongoing studies, depending on their degree of pursuit and any meaningful results obtained, could spur initiatives to further regulate hydraulic fracturing under the SDWA or other regulatory mechanism.mechanisms.
In Colorado, local governing bodies have begun to issue drilling moratoriums, or develop jurisdictional siting, permitting and operating requirements.requirements, and conduct air quality studies to identify potential public health impacts. For instance, the City of Fort Collins, Colorado, adopted on February 19, 2013 a ban on drilling and fracturing of new wells within city limits. If new laws or regulations that significantly restrict hydraulic fracturing or well locations are adopted at the state and local level, such laws could make it more difficult or costly for us to perform fracturing to stimulate production from dense subsurface rock formations and, in the event of local prohibitions against commercial production of natural gas, may preclude our ability to drill wells. If hydraulic fracturing becomes regulated at the federal level as a result of federal legislation or regulatory initiatives by the EPA or other federal agencies, our fracturing activities could become subject to additional permitting requirements and result in permitting delays, as well as potential increases in costs. Restrictions on hydraulic fracturing could also reduce the amount of crude oil and natural gas that we are ultimately able to produce from itsour reserves.
We currently own or lease numerous properties that for many years have been used for the exploration and production of natural gas and crude oil. Although we believe that we have utilized good operating and waste disposal practices, and when necessary, appropriate remediation techniques, prior owners and operators of these properties may have operated prior to the enactment of applicable laws now governing these areas, or may not have utilized similar practices and techniques and hydrocarbons or other wastes may have been disposed of or released on or under the properties that we own or lease or on or under locations where such wastes have been taken for disposal. These properties and the wastes disposed thereon may be subject to the Comprehensive Environmental Response, Compensation and Liability Act ("CERCLA"), RCRA and analogous state laws, as well as state laws governing the management of natural gas and crude oil wastes. Under such laws, we may be required to remove or remediate previously disposed wastes (including wastes disposed of or released by prior owners or operators) or remediate property contamination (including surface and groundwater contamination) or to perform remedial plugging operations to prevent future contamination.
CERCLA and similar state laws impose liability, without regard to fault or the legality of the original conduct, on certain classes of persons that are considered to have contributed to the release of a "hazardous substance" into the environment. These persons include the owner or operator of the disposal site or sites where the release occurred and companies that disposed of or arranged for the disposal of the hazardous substances found at the site. Persons who are or were responsible for release of hazardous substances under CERCLA may be subject to full liability for the costs of cleaning up the hazardous substances that have been released into the environment and for damages to natural resources, and it is not uncommon for neighboring landowners and other third parties to file claims for personal injury and property damage allegedly caused by the hazardous substances released into the environment. As an owner and operator of natural gas and crude oil wells, we may be liable pursuant to CERCLA and similar state laws.
Our operations are subject to the federal Clean Air Act ("CAA") and comparable state and local requirements. Amendments to the CAA were adopted in 1990 and contain provisions that may result in the gradual imposition of certain pollution control requirements with respect to air emissions from our operations. The EPA and states have been developing regulations to implement these requirements. We may be required to incur certain capital expenditures in the next several years for air pollution control equipment in connection with maintaining or obtaining operating permits and approvals addressing other air emission-related issues. Greenhouse gas record keeping and reporting requirements of the CAA became effective in 2011 and will continue into the future with increased costs for administration and implementation of controls. The New Source Performance Standards regarding oil and gas operations ("NSPS 0000") introduced by the EPA in 2011 will becomebecame effective in 2012, adding administrative and operational expense.costs. Colorado partially adopted the requirements of NSPS 0000 in 2012 and will consider full adoption in 2013.
The federal Clean Water Act ("CWA") and analogous state laws impose strict controls against the discharge of pollutants and fill material, including spills and leaks of crude oil and other substances. The CWA also requires approval and/or permits prior to construction, where construction will disturb wetlands or other waters of the U.S. The CWA also regulates storm water run-off from natural gas and crude oil facilities and requires storm water discharge permits for certain activities. Spill Prevention, Control, and Countermeasure ("SPCC") requirements of the CWA require appropriate secondary containment loadout controls, and piping controls, berms and other measures to help prevent the contamination of navigable waters in the event of a petroleum hydrocarbon spill, rupture or leak.
Crude oil production is subject to many of the same operating hazards and environmental concerns as natural gas production, but is also subject to the risk of crude oil spills. Federal regulations require certain owners or operators of facilities that store or otherwise handle crude oil, including us, to procure and implement additional SPCC plansmeasures relating to the possible discharge of crude oil into surface waters. The
Oil Pollution Act of 1990 or OPA,("OPA") subjects owners of facilities to strict joint and several liability for all containment and cleanup costs and certain other damages arising from crude oil spills. Noncompliance with OPA may result in varying civil and criminal penalties and liabilities. Historically, we have not experienced any significant crude oil discharge or crude oil spill problems. Our shift in production since mid-2010 to a greater percentage of crude oil enhances our risks related to soil and water contamination.
In late 2011, the State of Colorado's Oil and Gas Conservation Commission ("Commission") adopted rules that require service companies and vendors to disclose all known chemicals in hydraulic fracturing fluid to operators and require operators to disclose such chemicals to the public through a website or, with respect to an operator's trade secrets, directly to the Commission or health professionals. The new rules also require operators seeking new location approvals to provide certain disclosures regarding fracturing to surface owners and adjacent property owners within 500 feet of a new well. These regulations will continue to increase ourOur costs and may ultimately limit some drilling locations.
Our expenses relating to preservingprotecting the environment have risen over the past few years and are expected to continue to rise in 2012
2013 and beyond. Environmental regulations have increased our costs and planning time, but have had no materially adverse effect on our ability to operate to date. However, no assurance can be given that environmental regulations or interpretations of such regulations will not, in the future, result in a curtailment of production or otherwise have a materially adverse effect on our business, financial condition or results of operations. See Note 11, Commitments and Contingencies, to our consolidated financial statements included elsewhere in this report.
Operating Hazards and Insurance
Our exploration and production operations include a variety of operating risks, including, but not limited to, the risk of fire, explosions, blowouts, cratering, pipe failure, casing collapse, abnormally pressured formations and environmental hazards such as gas leaks, ruptures and discharges of natural gas and crude oil. The occurrence of any of these could result in substantial losses to us due to injury and loss of life, severe damage to and destruction of property, natural resources and equipment, pollution and other environmental damage, clean-up responsibilities, regulatory investigation and penalties and suspension of operations. Our pipeline, gathering and distribution operations are subject to the many hazards inherent in the industry. These hazards include damage to wells, pipelines and other related equipment, damage to property caused by hurricanes, floods, fires and other acts of God, inadvertent damage from construction equipment, leakage of natural gas and other hydrocarbons, fires and explosions and other hazards that could also result in personal injury and loss of life, pollution and suspension of operations.
Any significant problems related to our facilities could adversely affect our ability to conduct our operations. In accordance with customary industry practice, we maintain insurance against some, but not all, potential risks; however, there can be no assurance that such insurance will be adequate to cover any losses or exposure for liability. The occurrence of a significant event not fully insured against could materially adversely affect our operations and financial condition. We cannot predict whether insurance will continue to be available at premium levels that justify our purchase or whether insurance will be available at all. Furthermore, we are not insured against our economic losses resulting from damage or destruction to third partythird-party property, such as transportation pipelines, crude oil refineries or natural gas processing facilities; suchfacilities. Such an event could result in significantly lower regional prices or our inability to deliver gas.
Competition and Technological Changes
We believe that our exploration, drilling and production capabilities and the experience of our management and professional staff generally enable us to compete effectively. We encounter competition from numerous other natural gas and crude oil companies, drilling and income programs and partnerships in all areas of operations, including drilling and marketing natural gas and crude oil and obtaining desirable natural gas and crude oil leases on producing properties. Many of these competitors possess larger staffs and greater financial resources than we do, which may enable them to identify and acquire desirable producing properties and drilling prospects more economically. Our ability to explore for natural gas and crude oil prospects and to acquire additional properties in the future depends upon our ability to conduct our operations, to evaluate and select suitable properties and to consummate transactions in this highly competitive environment. We also face intense competition in the marketing of natural gas from competitors including other producers, as well as marketing companies. Also, international developments and the possible improved economics of domestic natural gas exploration may influence other companies to increase their domestic natural gas and crude oil exploration. Furthermore, competition among companies for favorable prospects can be expected to continue and it is anticipated that the cost of acquiring properties will increase in the future.
In 2011,Recently, certain regions experienced strong demand for drilling services and supplies, which resulted in increasing costs. Our Wattenberg Field and Eastern Operating Region specifically our properties in West Virginia, experienced intense competition for drilling and pumping services. Factors affecting competition in the industry include price, location of drilling, availability of drilling prospects and drilling rigs, fracturing services, pipeline capacity, quality of production and volumes produced. We believe that we can compete effectively in the industry in each of the areas where we have operations. Nevertheless, our business, financial condition and results of operations could be materially adversely affected by competition. We also compete with other natural gas and crude oil companies, as well as companies in other industries, for the capital we need to conduct our operations. Should economic conditions deteriorate and financing become more expensive and difficult to obtain, we may not have adequate capital to execute our business plan and we may be forced to curtail our drilling and acquisition activities.
The oil and gas industry is characterized by rapid and significant technological advancements and introductions of new products and services using new technologies. If one or more of the technologies we use now or in the future were to become obsolete or if we are unable to use the most advanced commercially available technology, our business, financial position,condition, results of operations and cash flows could be materially adversely affected.
Employees
As of December 31, 2011,2012, we had 404421 employees. Our employees are not covered by a collective bargaining agreement. We consider relations with our employees to be good.
Our engineers, supervisors and well tenders are responsible for the day-to-day operation of wells and some pipeline systems. Much of the work associated with drilling, completing and connecting wells, including fracturing, logging and pipeline construction, is performed under our direction by subcontractors specializing in these activities as is common in the industry.
WHERE YOU CAN FIND ADDITIONAL INFORMATION
We file annual, quarterly and current reports, proxy statements and other information with the SEC. Our SEC filings are available free of charge from the SEC’s website at www.sec.gov or from our website at www.pdce.com. You may also read or copy any document we file at the SEC’s public reference room in Washington, D.C., located at 100 F Street, N.E., Room 1580, Washington, D.C. 20549. Please call the SEC at (800) SEC-0330 for further information on the public reference room. We also make available free of charge any of our SEC filings by mail. For a mailed copy of a report, please contact PDC Energy Inc., Investor Relations, 1775 Sherman Street, Suite 3000, Denver, CO 80203, or call (800) 624-3821.
We recommend that you view our website for additional information, as we routinely post information that we believe is important for investors. Our website can be used to access such information as our recent news releases, committee charters, code of business conduct and ethics, shareholder communication policy, director nomination procedures and our whistle-blower hotline. While we recommend that you view our website, the information available on our website is not part of this report and is not hereby incorporated by reference.
ITEM 1A. RISK FACTORS
You should carefully consider the following risk factors in addition to the other information included in this report. Each of these risk factors could adversely affect our business, operating results and financial condition, as well as adversely affect the value of an investment in our common stock or other securities.
Risks Related to the Domestic and Global Economic Environment
The current slow economic growth both domestically and globally may not improve or there may be a reoccurrence of the disruptions during the recent recession in the global financial markets and the related economic environment may further decrease the demand for naturalNatural gas, and crude oil and the prices of natural gas and crude oil, negatively impacting our future drilling and production, and adversely affecting our financial condition and profitability.
The global financial market disruptions during the recent recession and the related economic environment initially resulted in a decrease, and more recently in 2011, limited growth in the demand for natural gas and crude oil and has maintained pressure on natural gas prices. For example, during 2011, the price for natural gas decreased another 8% from 2010 rates, which were over 60% below the 2008 peak. Crude oil prices rebounded in 2011, increasing 20% over 2010 rates, but were still 28% below the 2008 peak. While crude oil prices have remained relatively strong, the continued growth in production of natural gas has increased supply and resulted in record gas storage inventories. As a result natural gas prices continue to face downward pressure. There is no certainty how long this low price environment would continue. We operate in a highly competitive industry, and certain competitors may have lower operating costs in such an environment. In particular, consider the risks related to (1) the deterioration of demand for natural gas and crude oil products and the related negative impact on natural gas and crude oil pricing, and (2) the deterioration of the financial markets and the related challenges, constraints or inability to raise necessary capital or maintain sufficient liquidity to access and provide the capital necessary to fund our operations. Further reductions in natural gas and crude oil prices could result in some of our assets becoming uneconomic to exploit, which would reduce our economically viable reserve profile. Counterparty failure risk would increase for both the banks which provide us capital and are parties to our natural gas and crude oil derivative holdings and for purchasers of our natural gas and crude oil. A prolonged and material negative economic environment could lead to the curtailment of capital expenditures and therefore a reduction in our drilling program, which would result in reduced production, reserves, cash flow generation and financial results.
Credit and funding challenges of French banks which are participants in our revolving credit facility and counterpartiesto some of our natural gas and crude oil derivative holdings could have a material adverse effect on our operations and financial condition.
We have three French banks, Credit Agricole Corporate and Investment Bank ("CA"), BNP Paribas ("BNP") and Natixis (collectively "the French Banks") that participate in our revolving credit facility and are counterpartiesto some of our natural gas and crude oil derivative hedges. The recent global economic turmoil, particularly in Europe, has led to negative credit actions and created an increased cost for the French Banks to provide U.S. dollar funding under contractually committed U.S. credit facilities. Certain of the French Banks have provided public disclosures as to the challenges they are experiencing. BNP has announced that it plans to divest both its U.S. hedging holdings and activities and its U.S. dollar energy portfolio; CA has announced that it is divesting its U.S. hedging holdings and activities. We are unaware of any announced divestitures by Natixis. We have had numerous discussions with senior bank representatives from each of the French Banks, and their representatives have indicated they plan to hold their current position in our revolving credit facility and intend to fund borrowing requests as contractually required. Additionally, the French Banks have indicated that they intend to satisfy their contractual counterparty obligationson all natural gas and crude oil derivative holdings with us. Moreover, the French Banks have been performing to date under our revolving credit facility and as hedging counterparties. However, should the need arise, we believe we would be able to replace our current French Banks borrowing and hedging capacity through increased credit provision from our existing bank syndicate or through the addition of additional banks to our bank syndicate. In light of the preceding challenges confronting our French bank credit providers, and despite the numerous mitigants to offset the situation, we cannot assure that we can replace the borrowing capacity being provided to us by the French Banks should the need arise, or that the French Banks will continue to perform under our revolving credit facility or as hedging counterparties in the future. Should we be unable to replace such borrowing capacity, or should the French Banks fail to perform, those events could have a material adverse effect on our operations and financial condition.
While we believe that we will be able to find other banking institutions to be effective counterparties for our derivatives instruments in the future, it is possible that the loss of these banks from the class of available banking institutions that become counterparties for U.S. derivative instruments will significantly reduce the number of banking institutions that write such instruments and serve as counterparties. In this event, it is possible that we might not be able to find comparable counterparties to write derivatives instruments as readily as before these banks determined to leave the U.S. hedging market. Additionally, even if we are readily able to contract with such counterparties, the cost of these derivatives instruments might be greater than those that we have to date become a party to, thereby diminishing the economic effectiveness of those derivatives instruments that we in fact do write. Moreover, it is possible that with new counterparties to our derivatives instruments the risk of counterparty default on such derivatives instruments might increase.
Risks Related to Our Business and the Industry
Natural gas and crude oilNGL prices fluctuate and a decline in natural gas and crude oilthese prices can significantly affect the value of our assets and our financial results and impede our growth.
Our revenue, profitability and cash flowflows depend in large part upon the prices and demand for natural gas, NGLs and crude oil. The markets
for these commodities can be volatile, and significant drops in prices can negatively affect our financial results and impede our growth. For instance,example, in much of 2011,2012, natural gas prices were too low to economically justify drilling operations in several areas.areas, and the outlook for natural gas prices remains weak due largely to increased supply and large inventories in storage. Similarly, NGL prices have decreased in some recent periods due to increased development activities in a variety of basins across the U.S. Changes in natural gas and crude oilcommodity prices have a significant effect on our cash flowflows and on the value and quantity of our reserves, which can in turn reduce ourthe borrowing base under our seniorrevolving credit facility. Prices for natural gas, NGLs and crude oil may fluctuate in response to relatively minor changes in the supply of and demand, for natural gas and crude oil, market uncertainty and a variety of additional factors that are beyond our control, including national and international economic and political factors and federal and state legislation. For example, any substantial reduction in the growth rate of China could affect global oil prices significantly, and continued weakness in the overall economic environment could adversely affect all commodity prices. In addition to factors affecting the price of oil, NGLs and natural gas generally, the prices we receive for our oil and natural gas production are affected by factors specific to us and to the local markets where the production occurs. Pricing can be influenced by, among other things, local or regional supply and demand factors (such as refinery or pipeline capacity issues, trade restrictions and governmental regulations) and the terms of our sales contracts. In addition, any substantial reduction in the growth rate of China could affect global oil prices significantly.
Lower natural gas and crude oilcommodity prices may not only reduce our revenues, but also may reduce the amount of natural gas, NGLs and crude oil that we can produce economically. As a result, we may have to make substantial additional downward adjustments to our estimated proved reserves.reserves if prices decline or remain at depressed levels for extended periods. If this occurs or if our estimates of development costs increase, production data factors change or our exploration results deteriorate, accounting rules may require us to write-down operating assets to fair value, as a non-cash charge to earnings. We assess impairment of capitalized costs of proved natural gas and crude oil properties by comparing net capitalized costs to estimated undiscounted future net cash flows on a field-by-field basis using estimated production based upon prices at which management reasonably estimates such products may be sold. InFor example, in 2011, and 2010, we recorded an impairment charge related to our NECO proved natural gas and crude oil properties of $22.5 million and in 2012 we recorded an impairment charge of $161.2 millionrelated to our MichiganPiceance Basin proved oil and natural gas and crude oil properties an impairment of $4.7 million, respectively. These impairments were attributable to our decision to divest these assets.properties. We may incur additional impairment charges in the future, which could have a material adverse effect on theour results of operations.
The marketability of our production is dependent upon limited transportation and processing facilities over which we may have no control. Market conditions or operational impediments, including high line pressures, particularly in the Wattenberg Field, and other impediments affecting gathering and transportation systems, could hinder our access to natural gas, crude oil and NGL markets or delay production and thereby adversely affect our profitability.
Our ability to market our production depends in substantial part on the availability, proximity and capacity of gathering systems, pipelines and processing facilities owned and operated by third parties. If adequate gathering, processing and transportation facilities are not available to us on a timely basis and at acceptable costs, our production and results of operations will be adversely affected. For example, due to increased drilling activities by third parties and unusually hot temperatures in Colorado in the second half of 2012, the principal third-party provider we use in the Wattenberg area for these facilities and services experienced high line pressure, and the resulting capacity constraints impacted the productivity of some of our older wells and limited the incremental production impact of our newer horizontal wells. As a result, we have seen an impact on our production and a related decrease in revenue from the impacted wells. Thus, our profitability has been adversely affected, and will continue to be affected until available capacity increases or alternative arrangements are available. Additional pipelines and facilities are being planned for the area but are not expected to be completed until the latter part of 2013. Capacity constraints affecting natural gas production also impact our ability to produce the associated NGLs. We may face similar risks in other areas, including our Utica operating area, as gathering/processing infrastructure is currently in the development phase. We are also dependent on third party pipeline infrastructure to deliver our natural gas production to market in the Marcellus and Piceance Basin areas.
Federal, state and local legislative and regulatory initiatives and litigation relating to hydraulic fracturing could result in increased costs and additional drilling and operating restrictions or delays in the production of natural gas, NGLs and crude oil, including from the development of shale plays. A decline in the drilling of new wells and related servicing activities caused by these initiatives and litigation could adversely affect our financial condition, results of operations and cash flows.
Most of our drilling uses hydraulic fracturing. Hydraulic fracturing is an important and commonly used process in the completion of unconventional wells in shale, coalbed and tight sand formations. Proposals have been introduced in the U.S. Congress to regulate hydraulic fracturing operations and related injection of fracturing fluids and propping agents used by the oil and natural gas industry in fracturing fluids under the Safe Drinking Water Act (“SDWA”), and to require the disclosure of chemicals used in the hydraulic fracturing process under the SDWA, the Emergency Planning and Community Right-to-Know Act (“EPCRA”), or other laws. Sponsors of these bills, which have been subject to various proceedings in the legislative process, including in the House Energy and Commerce Committee and the Senate Environmental and Public Works Committee, have asserted that chemicals used in the fracturing process could adversely affect drinking water supplies and otherwise cause adverse environmental impacts. The Chairman of the House Energy and Commerce Committee has initiated an investigation
of the potential impacts of hydraulic fracturing, which has involved seeking information about fracturing activities and chemicals from certain companies in the oil and natural gas sector. The Environmental Protection Agency (the “EPA”) has recently focused on citizen concerns about the risk of water contamination and public health problems from drilling and hydraulic fracturing activities, and conducted public meetings around the country on this issue which have been well publicized and well attended. In March 2011, the EPA announced its intention to conduct a comprehensive research study on the potential adverse impacts that hydraulic fracturing may have on water quality and public health. The EPA issued an initial report about the study in December 2012. The initial report described the focus of the continuing study but did not include any data concerning EPA's efforts to date, nor did it draw any conclusions about the safety of hydraulic fracturing. Final results, including data and conclusions, are expected in 2014.
The EPA has also begun a Toxic Substances Control Act rulemaking which will collect expansive information on the chemicals used in hydraulic fracturing fluid, as well as other health-related data, from chemical manufacturers and processors. EPA also has finalized major new Clean Air Act (“CAA”) standards (New Source Performance Standards, or NSPS, and National Emission Standards for Hazardous Air Pollutants, or NESHAPs) applicable to hydraulically fractured natural gas wells. The standards will require, among other things, use of reduced emission completions, or green completions, to reduce volatile organic compound emissions from well completions as well as new controls applicable to a wide variety of storage tanks. While most key provisions in the new CAA standards are not effective until 2015, the rules associated with such standards are substantial and may increase future costs of our operations and will require us to make modifications to our operations and install new equipment. EPA has also issued and is in the process of finalizing permitting guidance for hydraulically fractured wells where diesel is used. It remains to be seen how broadly applicable the diesel guidance will be, but it has the potential to create duplicative requirements, further slow down the permitting process in certain areas, and increase the costs of operations. Certain other federal agencies are analyzing, or have been requested to review, environmental issues associated with hydraulic fracturing. The U.S. Department of the Interior, through the Bureau of Land Management, is currently conducting a rulemaking that will require, among other things, disclosure of chemicals and more stringent well integrity measures associated with hydraulic fracturing operations on public land.
In addition, certain state governments, including the states of Colorado, Pennsylvania, Ohio, and West Virginia, have adopted or are considering adopting laws and regulations that impose or could impose, among other requirements, stringent permitting, disclosure, wastewater disposal, baseline sampling, well construction and well location requirements on hydraulic fracturing operations or otherwise seek to ban underground injection of fracturing wastewater or fracturing activities altogether. Some municipalities and local governments, including most recently the city of Fort Collins in Colorado, have adopted or are considering similar actions. In addition, lawsuits have been filed against unrelated third parties in Pennsylvania, New York, Arkansas and several other states alleging contamination of drinking water by hydraulic fracturing. Increased regulation and attention given to the hydraulic fracturing process could lead to greater opposition, including litigation, to natural gas, crude oil and NGL production activities using hydraulic fracturing techniques. Additional legislation, regulation, or litigation could also lead to operational delays or lead us to incur increased operating costs in the production of natural gas, NGLs and crude oil, including from the development of shale plays, or could make it more difficult to perform hydraulic fracturing or other drilling activities. If these legislative, regulatory, and litigation initiatives cause a material decrease in the drilling of new wells and in related servicing activities, our profitability could be materially impacted.
Environmental and overall public scrutiny focused on the oil and gas industry is increasing. The current trend is to increase regulation of our operations and the industry. We are subject to complex federal, state, local and other laws and regulations that could adversely affect the cost, manner or feasibility of doing business.
Our exploration, development, production and marketing operations are regulated extensively at the federal, state, and local levels. Environmental and other governmental laws and regulations have increased our costs to plan, design, drill, install, operate and abandon natural gas and crude oil wells. Under these laws and regulations, we could also be liable for personal injuries, property damage and natural resource or other damages. Similar to our competitors, we incur substantial operating and capital costs to comply with such laws and regulations. These compliance costs may put us at a competitive disadvantage compared to larger companies in the industry which can spread such additional costs over a greater number of wells and larger operating staff. Failure to comply with these laws and regulations may result in the suspension or termination of our operations and subject us to administrative, civil and criminal penalties. Moreover, public interest in environmental protection has increased in recent years-particularly with respect to hydraulic fracturing-and environmental organizations have opposed, with some success, certain drilling projects.
In addition, our activities are subject to regulations governing conservation practices, protection of wildlife and habitat and protection of correlative rights by state governments. These regulations affect our operations, increase our costs of exploration and production and limit the quantity of natural gas, NGLs and crude oil that we can produce and market. A major risk inherent in our drilling plans is the possibility that we will be unable to obtain needed drilling permits from state and local authorities in a timely manner. Delays in obtaining regulatory approvals or drilling permits, the failure to obtain a drilling permit for a well or the receipt of a permit with unreasonable conditions or costs could have a material adverse effect on our ability to explore or develop our properties.
Additionally, the natural gas and crude oil regulatory environment could change in ways that might substantially increase our financial and managerial costs to comply with the requirements of these laws and regulations and, consequently, adversely affect our profitability. At the state level, for instance, the Colorado Oil and Gas Conservation Commission (“COGCC”) issued a new rule governing mandatory minimum spacing, or setbacks, between oil and gas wells and occupied buildings and other areas. Similarly, it is expected that the COGCC may undertake a rulemaking focused on wellbore integrity in 2013 that would increase requirements in this area. In addition to increasing costs of operation, these rules could prevent us from drilling wells on certain locations we plan to develop, thereby reducing our reserves as well as our future revenues. The COGCC has also recently concluded a rulemaking that will require baseline sampling of certain
ground and surface water in most areas of Colorado. These new sampling requirements could increase the costs of developing wells in certain locations.
Some local governmental bodies, for instance Longmont, Colorado, have adopted or are considering regulations regarding, among others things, land use, requiring the posting of bonds to secure restoration obligations and limiting hydraulic fracturing and other drilling activities, and these regulations may limit, delay or prohibit exploration and development activities or make those activities more expensive. Additionally, state and local governments are undertaking air quality studies to assess potential public health impacts from oil and gas operations. These studies may result in the imposition of additional regulatory requirements on oil and gas operations.
The BP crude oil spill in the Gulf of Mexico and generally heightened industry scrutiny has resulted and may result in new state and federal safety and environmental laws, regulations, guidelines and enforcement interpretations. The EPA has recently focused on citizen concerns about the risk of water contamination and public health problems from drilling and hydraulic fracturing activities, and conducted public meetings around the country on this issue which have been well publicized and well attended. This renewed focus could lead to additional federal, state and local laws and regulations affecting our drilling, fracturing and other operations.
Other potential laws and regulations affecting us include new or increased severance taxes proposed in several states, including Pennsylvania. This could adversely affect the existing operations in these states and the economic viability of future drilling. Additional laws, regulations or other changes could significantly reduce our future growth, increase our costs of operations and reduce our cash flows, in addition to undermining the demand for the natural gas, NGLs and crude oil we produce.
Our ability to produce natural gas and crude oil could be impaired if we are unable to acquire adequate supplies of water for our drilling and completion operations or are unable to dispose of the water we use at a reasonable cost and within applicable environmental rules.
Our operations could be adversely impacted if we are unable to locate sufficient amounts of water, or dispose of or recycle water used in our exploration and production operations. Currently, the quantity of water required in certain completion operations, such as hydraulic fracturing, and changing regulations ongoverning usage may lead to water constraints and supply concerns.concerns (particularly in some parts of the country). In addition, Colorado and other western states have recently experienced a drought. As a result, future availability of water from certain sources used in the past may be limited. Moreover, the imposition of new environmental initiatives and regulationsconditions could include restrictions on our ability to conduct certain operations such as hydraulic fracturing or disposal of waste, including, but not limited to, produced water, drilling fluids and other wastes associated with the exploration, development or production of oil and natural gas. The CWA imposesfederal Clean Water Act (“CWA”) and analogous state laws impose restrictions and strict controls regarding the discharge of pollutants, including produced waters and other oil and natural gas waste, into navigable waters or other regulated state waters. Permits or other approvals must be obtained to discharge pollutants to regulated waters and to conduct construction activities in such waters and wetlands. Uncertainty regarding regulatory jurisdiction over wetlands and other regulated waters has, and will continue to, complicate and increase the cost of obtaining such permits or other approvals. The CWA and similaranalogous state laws provide for civil, criminal and administrative penalties for any unauthorized discharges of pollutants and unauthorized discharges of reportable quantities of oil and other hazardous substances. Many state discharge regulations, and the Federal National Pollutant Discharge Elimination System general permits issued by the EPA, prohibit the discharge of produced water and sand, drilling fluids, drill cuttings and certain other substances related to the oil and natural gas industry into coastal waters. The EPA hasWhile generally exempt under federal programs, many state agencies have also adopted regulations requiring certain oil and natural gas exploration and production facilities to obtain permits for storm water discharges. Indeed, onIn October 20, 2011, the EPA announced its intention to develop federal pretreatment standards for wastewater discharges associated with hydraulic fracturing activities. If adopted, the new pretreatment rules will require coalbed methane and shale gas operations to pretreat wastewater before transferring it to treatment facilities. Proposed rules are expected in 2013 for coalbed methane production and in 2014 for shale gas. Wegas production. Some states, including Pennsylvania, have banned the treatment of fracturing wastewater at publicly owned treatment facilities. There has been recent nationwide concern, particularly in Ohio, over earthquakes associated with Class II underground injection control wells, a predominant storage method for crude oil and gas wastewater. It is likely that new rules and regulations will be developed to address these concerns, possibly eliminating access to Class II wells in certain locations, and increasing the cost of disposal in others. Finally, the EPA study noted above has focused and will continue to focus on various stages of water use in hydraulic fracturing operations. It is possible that, following the conclusion of EPA's study, the agency will move to more strictly regulate the use of water in hydraulic fracturing operations. While we cannot predict the impact that these standardschanges may have on our business at this time, but these standards could have athey may be material impact onto our business, financial condition, and results of operations. Compliance with environmental regulations and permit requirements governing the withdrawal, storage and use of surface water or groundwater necessary for hydraulic fracturing of wells or the disposal or recycling of water will increase our operating costs and may cause delays, interruptions or termination of our operations, the extent of which cannot be predicted. In addition, our inability to meet our water supply needs to conduct our completion operations may impact our business, and any such future laws and regulations could negatively affect our financial condition and results of operations.
FederalAcquisitions are subject to the uncertainties of evaluating recoverable reserves and state legislative and regulatory initiatives relating to hydraulic fracturing could result in increased costs and additional drilling and operating restrictions or delays in the production of natural gas and crude oil,potential liabilities, including from the development of shale plays. A decline in the drilling of new wells and related servicing activities caused by these initiatives could adversely affect our financial condition, results of operations and cash flows.environmental uncertainties.
MostAcquisitions of producing properties and undeveloped properties have been an important part of our drilling uses hydraulic fracturing. Proposals have been introduced in the U.S. Congresshistorical and recent growth. We expect acquisitions will also contribute to regulate hydraulic fracturing operations and related injectionour future growth. Successful acquisitions require an assessment of fracturing fluids and propping agents used by the oil and natural gas industry in fracturing fluids under the SDWA, and to require the disclosurea number of chemicals used in the hydraulic fracturing process under the SDWA, Emergency Planning and Community Right-to-Know Act ("EPCRA"), or other laws. Hydraulic fracturing is an important and commonly used process in the completionfactors, many of unconventional natural gas and crude oil wells in shale, coalbed and tight sand formations. Sponsors of these bills, which are currently being considered in the legislative process, including the House Energybeyond our control. These factors include recoverable reserves, development potential, future commodity prices, operating costs, title issues and Commerce Committeepotential environmental and the Senate Environmentalother liabilities. Such assessments are inexact and Public Works Committee, have asserted that chemicals used in the fracturing process could adversely affect drinking water suppliestheir accuracy is inherently uncertain. In connection with our assessments, we perform engineering, environmental, geological and otherwise cause adverse environmental impacts. The Chairmangeophysical reviews of the House Energyacquired properties, which we believe are generally consistent with industry practices. However, such reviews are not likely to permit us to become sufficiently familiar with the properties to fully assess their deficiencies and Commerce Committee has initiatedcapabilities. We do not inspect every well prior to an investigation of the potential impacts of hydraulic fracturing, which has involved seeking information about fracturing activitiesacquisition and chemicals from certain companies in the oil and natural gas sector. The EPA has recently focused on citizen concerns about the risk of water contamination and public health problems from drilling and hydraulic fracturing activities, including public meetings around the country on this issue which have been well publicized and well attended. In March 2010, the EPA announced its intention to conduct a comprehensive research study onour
ability to evaluate undeveloped acreage is inherently imprecise. Even when we inspect a well, we may not always discover structural, subsurface and environmental problems that may exist or arise. In some cases, our review prior to signing a definitive purchase agreement may be even more limited. In addition, we often acquire acreage without any warranty of title except as to claims made by, through or under the transferor.
When we acquire properties, we will generally have potential adverse impactsexposure to liabilities and costs for environmental and other problems existing on the acquired properties, and these liabilities may exceed our estimates. Often we are not entitled to contractual indemnification associated with acquired properties. We often acquire interests in properties on an “as is” basis with no or limited remedies for breaches of representations and warranties. Therefore, we could incur significant unknown liabilities, including environmental liabilities, or losses due to title defects, in connection with acquisitions for which we have limited or no contractual remedies or insurance coverage. In addition, the acquisition of undeveloped acreage is subject to many inherent risks and we may not be able to realize efficiently, or at all, the assumed or expected economic benefits of acreage that hydraulic fracturingwe acquire.
Additionally, significant acquisitions can change the nature of our operations depending upon the character of the acquired properties, which may have on water qualitysubstantially different operating and public health. The initial results are expectedgeological characteristics or may be in different geographic locations than our existing properties. These factors can increase the fall of 2012.risks associated with an acquisition.
Several states haveAcquisitions also proposedpresent risks associated with the additional disclosure concerning chemicals usedindebtedness that may be required to finance the purchase price, and any related increase in the process. New York has imposed a moratorium on hydraulic fracturing of horizontal wells pending additional environmental investigation by the state. Lawsuits have also been filed against unrelated third parties in Pennsylvania and New York alleging contamination of drinking water by hydraulic fracturing. Increased regulation and attention given to the hydraulic fracturing process could lead to greater opposition, including litigation, to natural gas and crude oil production activities using hydraulic fracturing techniques. Additional legislationinterest expense or regulation could also lead to operational delays or lead us to incur increased operating costs in the production of natural gas and crude oil, including from the development of shale plays, or could make it more difficult to perform hydraulic fracturing. If these legislative and regulatory initiatives cause a material decrease in the drilling of new wells and inother related servicing activities, our profitability could be materially impacted.charges.
A substantial part of our natural gas, NGLs and crude oil production is located in our Western Operating Region,the Wattenberg Field, making it vulnerable to risks associated with operating primarily in a single geographic area. In addition, we have a large amount of proved reserves attributable to a small number of producing formations.
Our operations have beenare focused inprimarily on the Wattenberg Field and Piceance Basin ofin our Western Operating Region, which means our current producing properties and new drilling opportunities are geographically concentrated in that area. Because our operations are not as diversified geographically as many of our competitors, the success of our operations and our profitability may be disproportionately exposed to the effect of any regional events, including fluctuations in prices of natural gas, NGLs and crude oil produced from the wells in the region,area, natural disasters, restrictive governmental regulations, transportation capacity constraints, curtailment of production or interruption of transportation, and any resulting delays or interruptions of production from existing or planned new wells. For example, the recent increase in activity in the Niobrara could leadWattenberg Field has contributed to bottlenecks in processing and transportation that have negatively affectaffected our results of operations, and these adverse effects may be disproportionately severe to us compared to our more geographically diverse competitors.
Prior to 2010, natural gas prices in the Rocky Mountain Region often fell disproportionately when compared to other markets, due in part to continuing constraints in transporting natural gas from producing properties in the region. Because of Similarly, the concentration of our operationsassets within a small number of producing formations, in our Western Operating Region,particular the Niobrara, Codell and Marcellus formations, exposes us to risks, such price decreases are more likelyas changes in field-wide rules that could adversely affect development activities or production relating to have a material adverse effect on our revenue, profitability and cash flow than those of our more geographically diverse competitors. During 2010 and 2011, natural gas prices in the Rocky Mountain Region were not steeply discounted to NYMEX and future prices are trading at the same discount; however, there can be no assurance as to such continuation. In view of the concentration of our operations in Colorado, a significant decline in natural gas prices in the Western Operating Regionformations. Such an event could have a material adverse effect on our operations, financial condition and results of operations.operations and financial condition.
Our estimated natural gas and crude oil reserves are based on many assumptions that may turn out to be inaccurate. Any material inaccuracies in these reserve estimates or underlying assumptions may materially affect the quantities and present value of our reserves.
Natural gas, and crude oil and NGL reserve engineering requires subjective estimates of underground accumulations of natural gas and crude oilhydrocarbons and assumptions concerning natural gas and crude oilcommodity prices, production levels, and operating and development costs over the economic life of the properties. As a result, estimated quantities of proved reserves and projections of future production rates and the timing of development expenditures may be inaccurate. Independent petroleum engineers prepare our estimates of natural gas, NGLs and crude oil reserves using pricing, production, cost, tax and other information that we provide. The reserve estimates are based on certain assumptions regarding natural gas and crude oilcommodity prices, production levels, and operating and development costs that may prove incorrect. Any significant variance from these assumptions to actual figuresresults could greatly affect:
the economically recoverable quantities of natural gas, NGLs and crude oil attributable to any particular group of properties;
future depreciation, depletion and amortization ("(“DD&A"&A”) rates and amounts;
impairments in the value of our assets;
the classifications of reserves based on risk of recovery;
estimates of the future net cash flows;
timing of our capital expenditures; and
the amount of funds available for us to utilize under our revolving credit facility.
Some of our reserve estimates must be made with limited production history,histories, which renders these reserve estimates less reliable than estimates based on a longer production history. Reservehistories. Horizontal drilling in the Wattenberg field is a relatively recent development, whereas vertical drilling has been used by producers in this field for over 40 years. As a result, the amount of production data from horizontal wells available to reserve engineers is relatively small, and future reserve estimates will be affected by additional production data as it becomes available. Further, reserve estimates are based on the volumes of natural gas, NGLs and crude oil that are anticipated to be economically recoverable from a given date forward based on economic conditions that exist at that date. The actual quantities of natural gas, NGLs and crude oil recovered willwould be different than the reserve estimates since they willwould not be produced under the same economic conditions as used for the reserve calculations. In addition, quantities ofprobable and possible reserves by definition are inherently more risky than proved reserves and are less likely to be recovered.
At December 31, 2012, approximately 57.6% of our estimated proved reserves (by volume) were undeveloped. These reserve estimates reflected our plans to make significant capital expenditures to convert our PUDs into proved developed reserves, including approximately $1.6 billion during the five years ending in 2017. You should be aware that the estimated development costs may not be accurate, development may not occur as scheduled and results may not be as estimated. If we choose not to develop PUDs, or if we are not otherwise able to successfully develop them, we will be required to remove the associated volumes from our reported proved reserves. In addition, under the SEC's reserve reporting rules, because PUDs generally may be booked only if they relate to wells scheduled to be drilled within five years of the date of booking, we may be required to downgrade any PUDs that are not developed within this five-year time frame to probable or possible.
The present value of our estimated future net cash flows from proved reserves is not necessarily the same as the current market value of our estimated natural gas and crude oil reserves. The estimated discounted future net cash flows from proved reserves were based on the prior 12-month average natural gas and crude oil index prices. However, factors such as actual prices we receive for natural gas and crude oil and hedging instruments, the amount and timing of actual production, amount and timing of future development costs, supply of and demand for natural gas, NGLs and crude oil, and changes in governmental regulations or taxation also affect our actual future net cash flows from our natural gas and crude oil properties.
The timing of both our production and incurrence of expenses in connection with the development and production of natural gas,
and crude oil and NGL properties will affect the timing of actual future net cash flows from proved reserves, and thus their actual present value. In addition, the 10% discount factor (the rate required by the SEC) we use when calculating discounted future net cash flows may not be the most appropriate discount factor based on interest rates currently in effect and risks associated with our natural gas and crude oil properties or the industry in general.
Unless natural gas and crude oil reserves are replaced as they are produced, our reserves and production will decline, which would adversely affect our future business, financial condition and results of operations.
Producing natural gas, and crude oil and NGL reservoirs are generally is characterized by declining production rates that vary depending upon reservoir characteristics and other factors. The rate of decline will change if production from existing wells declines in a different manner than we estimated and theestimated. The rate can change due to other circumstances. Thus, ourcircumstances as well. Our future natural gas and crude oil reserves and production and, therefore, our cash flowflows and income, are highly dependent on our ability to efficiently developingdevelop and exploitingexploit our current reserves and to economically findingfind or acquiringacquire additional recoverable reserves. We may not be able to develop, discover or acquire additional reserves to replace our current and future production at acceptable costs. As a result,Our failure to do so would adversely affect our future operations, financial condition and results of operations would be adversely affected.
Acquisitions are subject to the uncertainties of evaluating recoverable reserves and potential liabilities, including environmental uncertainties.
Acquisitions of producing properties and undeveloped properties have been an important part of our historical and recent growth. We expect acquisitions will also contribute to our future growth. Successful acquisitions require an assessment of a number of factors, many of which are beyond our control. These factors include recoverable reserves, development potential, future natural gas and crude oil prices, operating costs and potential environmental and other liabilities. Such assessments are inexact and their accuracy is inherently uncertain, including those regarding the validity of our assumptions about reserves, future production, future commodity prices, revenues, capital expenditures and operating costs, including synergies. In connection with our assessments, we perform engineering, geological and geophysical reviews of the acquired properties, which we believe are generally consistent with industry practices. However, such reviews are not likely to permit us to become sufficiently familiar with the properties to fully assess their deficiencies and capabilities. We do not inspect every well prior to an acquisition and our ability to evaluate undeveloped acreage is inherently imprecise. Even when we inspect a well, we may not always discover structural, subsurface and environmental problems that may exist or arise. In some cases, our review prior to signing a definitive purchase agreement may be even more limited.
The acquisitions of producing natural gas and crude oil properties may increase our potential exposure to liabilities and costs for environmental and other problems existing on acquired properties. Often we are not entitled to contractual indemnification associated with acquired properties. We often acquire interests in properties on an "as is" basis with no or limited remedies for breaches of representations and warranties. We could incur significant unknown liabilities, including environmental liabilities, natural disasters or experience losses due to title defects, in our acquisitions for which we have limited or no contractual remedies or insurance coverage. In addition, the acquisition of undeveloped acreage is subject to many inherent risks and we may not be able to efficiently realize the assumed or expected economic benefits of acreage that we acquire, if at all.
Additionally, significant acquisitions can change the nature of our operations depending upon the character of the acquired properties, which may have substantially different operating and geological characteristics or be in different geographic locations than our existing properties. We acquire interests in wells which we may need to operate together with other partners, and we acquire pipelines that we may need to operate and expect we may need to commit to drilling in the acquired areas to achieve the expected benefits. Consequently, we may not be able to efficiently realize the assumed or expected economic benefits of properties that we acquire, if at all.operations.
We may not be able to consummate additional prospective acquisitions of our drilling partnerships, which could adversely affect our business operations.
We have previously disclosed our intention to pursue, beginning in the fall of 2010 and extending through 2013, the acquisition of the limited partnership units held by non-affiliated investor partners in the drilling partnerships that we have sponsored. We have not budgeted for the acquisition of the largest remaining partnership in 2013. We also may be unable to make additional acquisitions of such affiliated drilling partnerships since consummation of any futuresuch acquisitions of our affiliated public drilling partnerships may be subject to the same procedural processes that were utilized in connection with our previously completed acquisitions of public drilling partnerships. Such procedural hurdles previously included, and may in the future include, among others:
negotiation and execution of a merger agreement with a special committee, comprised entirely of non-employee directors, of our board of directors;
clearance from the SEC upon completion by each of the partnerships of their SEC proxy disclosure review process before the partnerships can request approval of the merger transactions from their non-affiliated investors; and
approval by the holders of a majority of the limited partnership units held by the non-affiliated investors of each respective partnership.
In addition, twocertain former non-affiliated investor partners have initiated litigation concerning our acquisition of thetwelve limited partnership units we acquiredpartnerships in 2010 and 2011. Litigation challenges to further acquisitions are also possible. If we are unable to consummate all or a portion of these prospective acquisitions, we would not realize the expected benefits of the proposed acquisitions. In addition, we will have incurred, and will remain liable for, transaction costs, including legal, accounting, financial advisory and other costs relating to theany prospective acquisitions, including the costs of the financial and legal consultants to the special committee of our board of directors, whether
or not theythe acquisitions are consummated. We currently do not have any drilling partnership acquisitions pending or planned in 2012; however, future acquisitions are possible.2013. The occurrence of any of the risks associated with these eventspotential transactions individually or in combination could have an adverse effect on our business, financial condition andor results of operations.
Any acquisitions we complete, including prospective acquisitions, are subject to substantial risks including integration risks that could adversely affect our financial condition and results of operations.
Even if we complete the prospective acquisitions, integration of the prospective acquisitions may be difficult. Any acquisition involves potential risks, including, among other things:
the validity of our assumptions about reserves, future production, future commodity prices,
revenues, capital expenditures and operating costs, including synergies;
an inability to integrate the businesses we acquire successfully;
a decrease in our liquidity by using a portion of our available cash or borrowing capacity under
our revolving credit facility to finance acquisitions;
a significant increase in our interest expense or financial leverage if we incur additional debt to
finance acquisitions;
the assumption of unknown liabilities, losses or costs, including those that are environmental, for
which we are not indemnified or for which our indemnity is inadequate;
the diversion of management’s attention from other business concerns;
the incurrence of other significant charges, such as impairment of natural gas and crude oil properties,
goodwill or other intangible assets, asset devaluation or restructuring charges;
unforeseen difficulties encountered in operating in new geographic areas; and
customer or key employee losses at the acquired businesses.
If we fail to realize the benefits we anticipate from an acquisition, our results of operations may be adversely affected.
When drilling prospects, the wells we drill may not yield natural gas, NGLs or crude oil in commercially viable quantities.
A prospect is a property on which our geologists have identified what they believe, based on available information, to be indications of natural gas or crude oil bearinghydrocarbon-bearing rocks. However, our geologists cannot know conclusively prior to drilling and testing whether natural gas, NGLs or crude oil will be present at all or if present, whether natural gas or crude oil will be present in sufficient quantities to repay drilling or completion costs and generate a profit given the available data and technology. If a well is determined to be dry or uneconomic, which can occur even though it contains some natural gas, NGLs or crude oil, it is classified as a dry hole and must be plugged and abandoned in accordance with applicable regulations. This generally results in the loss of the entire cost of drilling and completion to that point, the cost of plugging, and lease costs associated with the prospect. Even wells
that are completed and placed into production may not produce sufficient natural gas, NGLs and crude oil to be profitable. If we drill a dry hole or unprofitable well on current and future prospects, the profitability of our operations will decline and the value of our valueproperties will likely be reduced. These risks are greater in developing areas such as the Utica Shale, where we are currently investing substantial capital. Exploratory drilling is typically subject to substantially greater risk than development drilling. In sum, the costaddition, initial results from a well are not necessarily indicative of drilling, completing and operating any well is often uncertain and new wells may not be productive.
We may not be able to identify and acquire enough attractive prospects onits performance over a timely basis to meet our development needs, which could limit our future development opportunities and adversely affect our profitability.
Our geologists have identified a number of potential drilling locations on our existing acreage. These drilling locations must be replaced as they are drilled for us to continue to grow our reserves and production. Our ability to identify and acquire new drilling locations depends on a number of uncertainties, including the availability of capital, regulatory approvals, natural gas and crude oil prices, competition, costs, availability of drilling rigs, drilling results and the ability of our geologists to successfully identify potentially successful new areas to develop. Because of these uncertainties, our profitability and growth opportunities may be limited by the timely availability of new drilling locations. As a result, our operations and profitability could be adversely affected.longer period.
Drilling for and producing natural gas, NGLs and crude oil are high risk activities with many uncertainties that could adversely affect our business, financial condition and results of operations. Our drilling risk exposure may be increased as we plan to devotehave allocated most of our 20122013 capital budget to drilling horizontal wells.
Drilling activities are subject to many risks, including the risk that we will not discover commercially productive reservoirs. Drilling for natural gas and crude oil can be unprofitable, not only due to dry holes, but also due to curtailments, delays or cancellations as a result of other factors, including:
unusual or unexpected geological formations;
pressures;
fires;
blowouts;loss of well control;
loss of drilling fluid circulation;
title problems;
facility or equipment malfunctions;
unexpected operational events;
shortages or delivery delays of equipment and services;
compliance with environmental and other governmental requirements; and
adverse weather conditions.
Any of these risks can cause substantial losses, including personal injury or loss of life, damage to or destruction of property, natural resources and equipment, pollution, environmental contamination or loss of wells and regulatory penalties. For example, a loss of containment of hydrocarbons during these activities could potentially subject us to civil and/or criminal liability and the possibility of substantial costs, including for environmental remediation, depending upon the circumstances of the loss of containment, the nature and scope of the loss and the applicable laws and regulations. We maintain insurance against various losses and liabilities arising from operations; however, insurance against certain operational risks may not be available or may be prohibitively expensive relative to the perceived risks presented. Thus, losses could occur for uninsurable or uninsured risks or for amounts in excess of existing insurance coverage. The occurrence of an event that is not fully covered by insurance and/or the governmental response to an event could have a material adverse effect on our business activities, financial condition and results of operations. We are currently involved in various remedial and investigatory activities at some of our wells and related sites. See Note 11, Commitments and Contingencies - Environmental, to our consolidated financial statements included elsewhere in this report.
Our business strategy focuses on production in our liquid-rich and high impact shale gas plays. In this regard, we plan to allocate our capital to an active horizontal drilling program. DuringHistorically, most of the wells we drilled were vertical wells. In 2012 and 2013, however, we intend to devote a substantial parthave devoted the majority of our capital budget to drilling horizontal wells in the Wattenberg Field in Colorado to exploit the Niobrara formation. While we drilled 195 total wells in 2011, we plan to drill approximately 35 wells during 2012. Substantially all of these wells will be horizontal wells. Drilling horizontal wells is technologically more difficult than drilling vertical wells, including as a result of risks relating to our ability to fracture stimulate the planned number of stages and to successfully run casing the length of the well bore, and thus the risk of failure is far greater than the risk involved in drilling vertical wells. Additionally, drilling horizontal wells is far costlier than drilling vertical wells. Consequently, because we plan to drillare drilling far fewer total wells during 2012,2013 as compared to many prior years, the risk of drilling a non-economic well will be relatively higher than if we were to drill a similar number of wells as we did in previousthose prior years. Furthermore, because of the relatively higher cost in drilling horizontal wells, a completed well to be successful economically will need to have production that will cover the higher drilling costs involved in drilling horizontal wells.costs. While we believe that the Companywe will be better served by our drilling horizontal wells, the risk component involved in such drilling will be increased, with the result that we might find it more difficult to achieve economic success in our horizontal drilling program.
Our hydrocarbon drilling, transportation and processing activities are subject to a range of applicable federal, state and local laws and regulations. A loss of containment of hydrocarbons during these activities could potentially subject us to civil and/or criminal liability and the possibility of substantial costs, including environmental remediation, depending upon the circumstances of the loss of containment, the nature and scope of the loss and the applicable laws and regulations. We are currently involved in various remedial and investigatory activities at some of our wells and related sites. See Note 11, Commitments and Contingencies - Environmental, to our consolidated financial statements included in this report.
Under the "successful efforts"“successful efforts” accounting method that we use, unsuccessful exploratory wells must be expensed in the period when they are determined to be non-productive, which reduces our net income in such periods and could have a negative effect on our profitability.
We have conductedconduct exploratory drilling and plan to continue exploratory drilling in 2012 in order to identify additional opportunities for future development. Under the "successful efforts"“successful efforts” method of accounting that we use, the cost of unsuccessful exploratory wells must be charged to expense in the period when theyin which the wells are determined to be unsuccessful. In addition, lease costs for acreage condemned by the unsuccessful well must also be expensed. In contrast, unsuccessful development wells are capitalized as a part of the investment in the field where they are located. Because exploratory wells generally are more likely to be unsuccessful than development wells, we anticipate that some or all of our exploratory wells may not be productive. The costs of such unsuccessful exploratory wells could result in a significant reduction in our profitability in periods when the costs are required to be expensed and could have a negative effect on our debt covenants.
Increasing finding and development costs may impair our profitability.
In order to continue to grow and maintain our profitability, we must annually add new reserves that exceed our yearly production over time at a finding and development cost that yields an acceptable operating margin and DD&A rate. Without cost effective exploration, development or acquisition activities, our production, reserves and profitability will decline over time. Given the relative maturity of most natural gas and crude oil basins in North America and the high level of activity in the industry, the cost of finding new reserves through exploration and development operations has been increasing.increasing in some basins. The acquisition market for natural gas and crude oil properties has become extremely competitive among producers for additional production and expanded drilling opportunities in North America. Acquisition values for crude
oil properties climbed in 2010 and 2011 and these values may continue to increase in the future. This increase in finding and development costs results in higher DD&A rates. If the upward trend in crude oil finding and development costs continues, we will be exposed to an increased likelihood of a write-down in the carrying value of our crude oil properties in response to any future fallingdecrease in commodity prices and/or reduction in the profitability of our operations.
Depressed natural gas prices could result in significant impairment charges and significant downward revisions of proved natural gas reserves.
The domestic natural gas market remains weak. Low natural gas prices could result in significant impairment charges in the future. The cash flow model we use to assess properties for impairment includes numerous assumptions, such as management's estimates of future oil and gas production and commodity prices, market outlook on forward commodity prices and reduced profitabilityoperating and development costs. All inputs to the cash flow model must be evaluated at each date that the estimate of future cash flows for each producing basin is calculated. However, a significant decrease in long-term forward natural gas prices alone could result in a significant impairment for our operations.properties that are sensitive to declines in natural gas prices. In December 2012, we recognized an impairment charge of $161.2 million associated with our Piceance Basin proved oil and natural gas properties and similar charges could occur in the future. In addition, low natural gas prices could result in significant downward revisions to our proved natural gas reserves.
Our development and exploration operations require substantial capital, and we may be unable to obtain needed capital or financing on satisfactory terms, which could lead to a loss of properties and a decline in our natural gasproduction and crude oil reserves, and ultimately our profitability.
Our industry is capital intensive. We expect to continue to make substantial capital expenditures in our business and operations for the exploration, development, production and acquisition of natural gas, and crude oil and NGL reserves. To date, we have financed capital expenditures primarily with bank borrowings under our revolving credit facility, cash generated by operations and from capital markets through the sale of equitytransactions and the issuance of debt securities and sale of properties. We intend to finance our future capital expenditures utilizing similar financing sources. Our cash flows from operations and access to capital are subject to a number of variables, including:
our proved reserves;
the amount of natural gas, NGLs and crude oil we are able to produce from existing wells;
the prices at which natural gas, NGLs and crude oil are sold;
the costs to produce natural gas, NGLs and crude oil; and
our ability to acquire, locate and produce new reserves.
If our revenues or the borrowing base under our revolving credit facility decreases as a result of lower natural gas and crude oilcommodity prices, operating difficulties declines in reserves or for any other reason, then we may have limited ability to obtain theour need for capital necessary to sustain our operations at current levels. We may, from time to time, need to seek additional financing.other sources would increase. If we raise funds by issuing additional equity securities, this would have a dilutive effect on existing shareholders. If we raise funds through the incurrence of debt, the risks we face with respect to our indebtedness would increase and we would incur additional interest expense. There can be no assurance as to the availability or terms of any additional financing. Our inability to obtain additional financing, or sufficient financing on favorable terms, would adversely affect our financial condition and profitability. We intend to fund a portion of our 2013 capital expenditures with proceeds from our sale of Piceance Basin and certain other properties to Caerus. There can be no assurance that this transaction will close as planned. In addition, purchase price adjustments may reduce our proceeds from the transaction.
IfWe have a substantial amount of debt and the cost of servicing, and risks related to refinancing, that debt could adversely affect our revenuesbusiness. Those risks could increase if we incur more debt.
We have a substantial amount of indebtedness. As a result, a significant portion of our cash flows will be required to pay interest and principal on our indebtedness, and we may not generate sufficient cash flows from operations, or thehave future borrowing basecapacity available, to enable us to repay our indebtedness or to fund other liquidity needs. As of December 31, 2012, we had $676.6 million in outstanding indebtedness and approximately $382.3 million available to be borrowed under our revolving credit facility, decreasessubject to limitation under our financial covenants.
Servicing our indebtedness and satisfying our other obligations will require a significant amount of cash. Our cash flows from operating activities and other sources may not be sufficient to fund our liquidity needs. Our ability to pay interest and principal on our indebtedness and to satisfy our other obligations will depend upon our future operating performance and financial condition and the availability of refinancing indebtedness, which will be affected by prevailing economic conditions and financial, business and other factors, many of which are beyond our control. We cannot assure you that our business will generate sufficient cash flows from operations, or that future borrowings will be available to us under our revolving credit facility or otherwise, in an amount sufficient to fund our liquidity needs.
A substantial decrease in our operating cash flows or an increase in our expenses could make it difficult for us to meet our debt service requirements and could require us to modify our operations, including by curtailing our exploration and drilling programs, selling assets, refinancing all or a portion of our existing debt or obtaining additional financing. These alternative measures may not be successful and may not permit us to meet our scheduled debt service obligations. Our ability to restructure or refinance our debt will depend on the condition of the capital markets and our financial condition at such time. Any refinancing of our debt could be at higher interest rates and may require us to comply with more onerous covenants, which could further restrict our business operations. In addition, the terms of future debt agreements may, and our existing debt agreements do, restrict us from implementing some of these alternatives. In the absence of adequate cash from operations and other available capital resources, we could face substantial liquidity problems and might be required to dispose of material assets or operations to meet our debt service and other obligations. We may not be able to consummate these dispositions for fair market value, in a timely manner or at all. Furthermore, any proceeds that we could realize from any dispositions may not be adequate to meet our debt service or other obligations then due.
Our substantial indebtedness could adversely impact our business, results of operations and financial condition.
In addition to making it more difficult for us to satisfy our debt and other obligations, our substantial indebtedness could limit our ability to respond to changes in the markets in which we operate and otherwise limit our activities. For example, our indebtedness, and the terms of agreements governing that indebtedness, could:
require us to dedicate a substantial portion of our cash flows from operations to service our existing debt obligations, thereby reducing the cash available to finance our operations and other business activities and could limit our flexibility in planning for or reacting to changes in our business and the industry in which we operate;
increase our vulnerability to economic downturns and impair our ability to withstand sustained declines in commodity prices;
subject us to covenants that limit our ability to fund future working capital, capital expenditures, exploration costs and other general corporate requirements;
prevent us from borrowing additional funds for operational or strategic purposes (including to fund future acquisitions), disposing of assets or paying cash dividends;
limit our flexibility in planning for, or reacting to, changes in our business and the industry in which we operate;
require us to devote a substantial portion of our cash flows from operations to payments on our indebtedness, thereby reducing the availability of our cash flows to fund exploration efforts, working capital, capital expenditures and other general corporate purposes; and
place us at a competitive disadvantage relative to our competitors that have less debt outstanding.
Covenants in our debt agreements currently impose, and future financing agreements may impose, significant operating and financial restrictions.
The indenture governing our senior notes and our revolving credit facility contain restrictions, and future financing agreements may contain additional restrictions, on our activities, including covenants that restrict our and certain of our subsidiaries' ability to:
incur additional debt;
pay dividends on, redeem or repurchase stock;
create liens;
make specified types of investments;
apply net proceeds from certain asset sales;
engage in transactions with our affiliates;
engage in sale and leaseback transactions;
merge or consolidate;
restrict dividends or other payments from restricted subsidiaries;
sell equity interests of restricted subsidiaries; and
sell, assign, transfer, lease, convey or dispose of assets.
Our revolving credit facility will mature on November 5, 2015, and is secured by all of our oil and gas properties as well as a pledge of all ownership interests in our operating subsidiaries. The restrictions contained in our debt agreements may prevent us from taking actions that we believe would be in the best interest of our business, and may make it difficult for us to successfully execute our business strategy or effectively compete with companies that are not similarly restricted. We may also incur future debt obligations that might subject us to additional restrictive covenants that could affect our financial and operational flexibility.
Our revolving credit facility has substantial restrictions and financial covenants and our ability to comply with those restrictions and covenants is uncertain. Our lenders can unilaterally reduce our borrowing availability based on anticipated commodity prices.
We depend in large part on our revolving credit facility for future capital needs. The terms of the credit agreement require us to comply with certain financial covenants and ratios. Our ability to comply with these restrictions and covenants in the future is uncertain and will be affected by the levels of cash flows from operations and events or circumstances beyond our control. Our failure to comply with any of the restrictions and covenants under the revolving credit facility or other debt agreements could result in a default under those agreements, which could cause all of lowerour existing indebtedness to be immediately due and payable.
The revolving credit facility limits the amounts we can borrow to a borrowing base amount, determined by the lenders in their sole discretion based upon projected revenues from the properties securing their loan. The lenders can unilaterally adjust the borrowing base and the borrowings permitted to be outstanding under the revolving credit facility. Outstanding borrowings in excess of the borrowing base must be repaid immediately, or we must pledge other natural gas, and crude oil prices, or we incur operating difficulties, declines in reserves or forand NGL properties as additional collateral. We do not currently have any other reason,substantial unpledged properties, and we may not have limited abilitythe financial resources in the future to obtainmake any mandatory principal prepayments required under the capital necessaryrevolving credit facility. Our inability to sustainborrow additional funds under our revolving credit facility could adversely affect our operations at planned levels, and our profitability may be adversely affected.financial results.
If additional capitalwe are unable to comply with the restrictions and covenants in the agreements governing our indebtedness, there would be a default under the terms of these agreements, which could result in an acceleration of payment of funds that we have borrowed and would impact our ability to make principal and interest payments on our indebtedness and satisfy our other obligations.
Any default under the agreements governing our indebtedness, including a default under our revolving credit facility that is needed,not waived by the required lenders, and the remedies sought by the holders of any such indebtedness, could make us unable to pay principal and interest on our indebtedness and satisfy our other obligations. If we are unable to generate sufficient cash flows and are otherwise unable to obtain funds necessary to meet required payments of principal and interest on our indebtedness, or if we otherwise fail to comply with the various covenants, including financial and operating covenants, in the instruments governing our indebtedness, we could be in default under the terms of the agreements governing such indebtedness. In the event of such default, the holders of such indebtedness could elect to declare all the funds borrowed thereunder to be due and payable, together with accrued and unpaid interest, the lenders under our revolving credit facility could elect to terminate their commitments, cease making further loans and institute foreclosure proceedings against our assets, and we could be forced into bankruptcy or liquidation. If our operating performance declines, we may in the future need to seek to obtain waivers from the required lenders under our revolving credit facility to avoid being in default. If we breach our covenants under our revolving credit facility and seek a waiver, we may not be able to obtain debt or equity financing on favorable terms, or at all.a waiver from the required lenders. If cash generated by our operations or availablethis occurs, we would be in default under our revolving credit facility, is not sufficientthe lenders could exercise their rights as described above, and we could be forced into bankruptcy or liquidation. We cannot assure you that we will be granted waivers or amendments to meet our capital requirements, failuredebt agreements if for any reason we are unable to obtaincomply with these agreements, or that we will be able to refinance our debt on terms acceptable to us, or at all.
Our variable rate indebtedness subjects us to interest rate risk, which could cause our debt service obligations to increase significantly.
Borrowings under our revolving credit facility bear interest at variable rates and expose us to interest rate risk. If interest rates increase, our debt service obligations on the variable rate indebtedness would increase although the amount borrowed remained the same, and our net income and cash available for servicing our indebtedness and for other purposes would decrease.
Notwithstanding our current indebtedness levels and restrictive covenants, we may still be able to incur substantial additional financingdebt, which could resultexacerbate the risks described above.
We may be able to incur additional debt in a curtailment of the exploration and development offuture. Although our prospects, which in turn could leaddebt agreements contain restrictions on our ability to incur indebtedness, those restrictions are subject to a possible lossnumber of properties, declineexceptions. In particular, we may borrow under the revolving credit facility. We may also consider investments in natural gasjoint ventures or acquisitions that may increase our indebtedness. Adding new debt to current debt levels could intensify the related risks that we and crude oil reserves and production and a decline in our profitability.subsidiaries now face.
Seasonal weather conditions and lease stipulations adversely affect our ability to conduct drilling activities in some of the areas where we operate.
Seasonal weather conditions and lease stipulations designed to protect various wildlife affect natural gas and crude oil operations in our Western Operating Region. In certain areas, including parts of the Piceance Basin in Colorado, drilling and other natural gas and crude oil activities are restricted or prohibited by lease stipulations, or prevented by weather conditions, for up to six months out of the year. This limits our operations in those areas and can intensify competition during thosethe active months for drilling rigs, oil field equipment, services, supplies and qualified personnel, which may lead to additional or increased costs or periodic shortages. These constraints and the resulting high costs or shortages could delay our operations and materially increase operating and capital costs and therefore adversely affect our profitability. Similarly, hot weather during parts of 2012 adversely impacted the operation of certain midstream facilities, and therefore our production. Similar events could occur in the future and could negatively impact our results of operations and cash flows.
We have limited control over activities on properties in which we own an interest but we do not operate, which could reduce our production and revenues.
We operate approximately 88%89% of the wells in which we own an interest. If we do not operate the properties in which we own an interest, we do not have control over normal operating procedures, expenditures or future development of the underlying properties. The failure by an operator to adequately perform operations, or an operator’s breach of the applicable agreements, could reduce production and revenues and adversely affect our profitability. The success and timing of drilling and development activities on properties operated by others therefore depends upon a number of factors outside of our control, including the operator’soperator's timing and amount of capital expenditures, expertise (including safety and environmental compliance) and financial resources, inclusion of other participants in drilling wells, and use of technology.
Market conditions The failure by an operator to adequately perform operations, or operational impediments, including transportation and gathering systems,an operator's breach of the applicable agreements, could hinder our access to natural gas and crude oil markets or delayreduce production and therebyrevenues and adversely affect our profitability.
Market conditions or the unavailability of satisfactory natural gas and crude oil transportation arrangements may hinder our access to natural gas and crude oil markets or delay our production. The availability of a ready market for natural gas and crude oil production depends on a number of factors, including the demand for and supply of natural gas and crude oil and the proximity of reserves to pipelines and terminal facilities. Our ability to market our production depends in substantial part on the availability and capacity of gathering systems, pipelines and processing facilities owned and operated by third parties. Failure to obtain such services on acceptable terms could materially harm our business. We may be required to shut in wells for the lack of a market or because of inadequacy, unavailability or the pricing associated with natural gas pipelines, gathering system capacity or processing facilities. If that were to occur, we would be unable to realize revenue from those wells until we made production arrangements to deliver the product to market. Thus, our profitability would be adversely affected.27
Our derivative activities could result in financial losses or reduced income from failure to perform by our counterparties or could limit our potential gains from increases in prices.
We use derivatives for a portion of our natural gas and crude oilthe production from our own wells, our partnerships and for natural gas purchases and sales by our marketing subsidiary to achieve a more predictable cash flow,flows, to reduce exposure to adverse fluctuations in thecommodity prices, of natural gas and crude oil, and to allow our natural gas marketing company to offer pricing options to natural gas sellers and purchasers. These arrangements expose us to the risk of financial loss in some circumstances, including when purchases or sales are different than expected, the counter-partycounterparty to the derivative contract defaults on its contract obligations, or when there is a change in the expected differential between the underlying price in the derivative agreement and actual prices that we receive.
In addition, derivative arrangements may limit the benefit we would otherwise receive from increases in the prices for natural gas and crude oil.the relevant commodity. They may also require the use of our resources to meet cash margin requirements. Since we do not designate our derivatives as hedges, we do not currently
qualify for use of hedge accounting; therefore, changes in the fair value of derivatives are recorded in our income statements, and our net income is subject to greater volatility than it would be if our derivative instruments qualified for hedge accounting. For instance, if natural gas and crude oilcommodity prices rise significantly, itthis could result in significant non-cash charges each quarter,during the relevant period, which could have a material negative effect on our net income.
The inability of one or more of our customers or other counterparties to meet their obligations may adversely affect our financial results.
Substantially all of our accounts receivable result from our natural gas, NGLNGLs and crude oil sales or joint interest billings to a small number of third parties in the energy industry. This concentration of customers and joint interest owners may affect our overall credit risk in that these entities may be similarly affected by changes in economic and other conditions. In addition, our natural gas and crude oil derivatives as well as the derivatives used by our marketing subsidiary expose us to credit risk in the event of nonperformance by counterparties. Nonperformance by our customers may adversely affect our financial condition and profitability. We face similar risks with respect to our other counterparties, including the lenders under our revolving credit facility and the providers of our insurance coverage.
Our business could be negatively impacted by security threats, including cybersecurity threats, and other disruptions.
As an oil and natural gas producer, we face various security threats, including cybersecurity threats to gain unauthorized access to sensitive information or to render data or systems unusable; threats to the safety of our employees; threats to the security of our infrastructure or third party facilities and infrastructure, such as processing plants and pipelines; and threats from terrorist acts. Although we utilize variousThere can be no assurance that the procedures and controls we use to monitor these threats and mitigate our exposure to such threats, there can be no assurance that these procedures and controlsthem will be sufficient in preventing security threatsthem from materializing. If any of these events were to materialize, they could lead to losses of sensitive information, critical infrastructure, personnel or capabilities essential to our operations and could have a material adverse effect on our reputation, financial position,condition, results of operations, or cash flows.
Our insurance coverage may not be sufficient to cover some liabilities or losses that we may incur.
The occurrence of a significant accident or other event not fully covered by insurance or in excess of our insurance coverage could have a material adverse effect on our operations and financial condition. Insurance does not protect us against all operational risks. We do not carry business interruption insurance at levels that would provide enough funds for us to continue operating without access to other funds. We also do not carry contingent business interruption insurance related to the processing plants owned bypurchasers of our natural gas purchasers or oil refineries owned by our crude oil purchasers. For some risks, such as drilling blow-out insurance, we may not obtain insurance if we believe the cost of available insurance is prohibitive relative to the perceived risks presented.production. In addition, pollution and environmental risks are generally not fully insurable.
We may not be able to keep pace with technological developments in our industry.
Our industry is characterized by rapid and significant technological advancements and introductions of new products and services using new technologies.advancements. As our competitors use or develop new technologies, we may be placed at a competitive disadvantage, and competitive pressures may force us to implement those or other new technologies at substantial cost. In addition, other natural gas and crude oil companiesour competitors may have greater financial, technical and personnel resources that allow them to enjoy technological advantages and may in the future allow them to implement new technologies before we can. We may not be able to respond to these competitive pressures and implement new technologies on a timely basis or at an acceptable cost. If one or more of the technologies we use now or in the future were to become obsolete or if we were unable to use the most advanced commercially available technology, our business, financial condition and results of operations could be materially adversely affected.
Competition in our industry is intense, which may adversely affect our ability to succeed.
Our industry is intensely competitive, and we compete with other companies that have greater resources. Many of these companies not only explore for and produce natural gas, NGLs and crude oil, but also carry on refining operations and market petroleum and other products on a regional, national or worldwide basis. These companies may be able to pay more for productive natural gas and crude oil properties and exploratory prospects or define, evaluate, bid for and purchase a greater number of properties and prospects than we can. In addition, these companies may have a greater ability to continue exploration activities during periods of low natural gas and crude oil market prices. Larger competitors may be able to absorb the burden of present and future federal, state, local and other laws and regulations more easily than we can, which can adversely affect our competitive position. Our ability to acquire additional properties and to discover reserves in the future will be dependent upon our ability to evaluate and select suitable properties and to consummate transactions in a highly competitive environment. In addition, because manylarger companies inmay have a greater ability to continue exploration activities during periods of low commodity prices. Larger competitors may also be able to absorb the burden of present and future federal, state, local
and other laws and regulations more easily than we can, which could adversely affect our industry have greater financial and human resources, we may be at a disadvantage in bidding for exploratory prospects and producing natural gas and crude oil properties.competitive position. These factors could adversely affect the success of our operations and our profitability.
Anti-oil and gas industry sentiment has increased. The current trend is to increase regulation of our operations and the industry. We are subject to complex federal, state, local and other laws and regulations that could adversely affect the cost, manner or feasibility of doing business.
Our exploration, development, production and marketing operations are regulated extensively at the federal, state and local levels. Environmental and other governmental laws and regulations have increased the costs to plan, design, drill, install, operate and abandon natural gas and crude oil wells. Under these laws and regulations, we could also be liable for personal injuries, property damage and other
damages. Failure to comply with these laws and regulations may result in the suspension or termination of operations and subject us to administrative, civil and criminal penalties. Moreover, public interest in environmental protection has increased in recent years, and environmental organizations have opposed, with some success, certain drilling projects.
In addition, our activities are subject to the regulation of conservation practices and protection of correlative rights by state governments. These regulations affect our operations, increase our costs of exploration and production and limit the quantity of natural gas and crude oil that we can produce and market. A major risk inherent in our drilling plans is the need to obtain drilling permits from state and local authorities. Delays in obtaining regulatory approvals, drilling permits, the failure to obtain a drilling permit for a well or the receipt of a permit with unreasonable conditions or costs could have a material adverse effect on our ability to explore on or develop our properties. Additionally, the natural gas and crude oil regulatory environment could change in ways that might substantially increase our financial and managerial costs to comply with the requirements of these laws and regulations and, consequently, adversely affect our profitability. Furthermore, these additional costs may put us at a competitive disadvantage compared to larger companies in the industry which can spread such additional costs over a greater number of wells and larger operating staff.
The BP crude oil spill in the Gulf of Mexico and anti-industry sentiment may result in new state and federal safety and environmental laws, regulations, guidelines and enforcement interpretations. Although we have no operations in the Gulf of Mexico, this incident could result in regulatory initiatives in other areas as well that could limit our ability to drill wells and increase our costs of exploration and production. The EPA has recently focused on citizen concerns about the risk of water contamination and public health problems from drilling and hydraulic fracturing activities, including public meetings around the country on this issue which have been well publicized and well attended. This renewed focus could lead to additional federal and state laws and regulations affecting our drilling, fracturing and operations. Additional laws, regulations or other changes could significantly reduce our future growth, increase our costs of operations, and reduce our cash flow, in addition to undermining the demand for the natural gas and crude oil we produce.
Other potential laws and regulations affecting us include new or increased severance taxes proposed in several states, including Pennsylvania. This could adversely affect the existing operations in these states and the economic viability of future drilling. Additional laws, regulations or other changes could significantly reduce our future growth, increase our costs of operations and reduce our cash flow, in addition to undermining the demand for the natural gas and crude oil we produce.
Certain federal income tax deductions currently available with respect to natural gas and crude oil and exploration and development may be eliminated as a result of future legislation.
In February 2012, U.S. President Barack Obama ("President Obama") and his administration (the "Obama administration"), released its budget proposals for the fiscal year 2013, which included numerous proposed tax changes. The proposed budget, if enacted, would eliminate certain key U.S. federal income tax preferences currently available with respect to natural gas and crude oil exploration and production. Similar changes have been in previous budget proposals from the Obama administration but were not adopted into law. The changes in the current budget proposal related to oil and gas drilling and production include, but are not limited to (i) the repeal of the percentage depletion allowance for natural gas and crude oil properties; (ii) the elimination of current deductions for intangible drilling and development costs; (iii) the elimination of the deduction for certain U.S. production activities; and (iv) an extension of the amortization period for certain geological and geophysical expenditures. It is not possible at this time to predict how legislation or new regulations that may be adopted to address these proposals would impact our business, but any such future laws and regulations could result in higher federal income taxes,
which could negatively affect our financial condition and results of operation.operations.
New derivatives legislation and regulation could adversely affect our ability to hedge natural gas and crude oil prices and increase our costs and adversely affect our profitability.
In July 2010, President Obama signed into law the Dodd-Frank Wall Street Reform and Consumer Protection Act (the “Dodd-Frank Act”). The Dodd-Frank Act regulates derivative transactions, including our natural gas and crude oilcommodity hedging swaps, (swaps are broadly defined to include mostand could have a number of our hedging instruments). The new law required the issuance of new regulations and administrative procedures related to derivatives within one year, but that implementation has been delayed until at least July 2012 and will initially consist of reporting and data gathering requirements, with substantive regulation to follow. The effect of such future regulationsadverse effects on our business is currently uncertain. In particular, noteus, including the following:
The Dodd-Frank Act may decrease our ability to enter into hedging transactions, whichand this would expose us to additional risks related to commodity price volatility; commodity price decreases would then have an immediate significant adverse affecteffect on our profitability and revenues. Reduced hedging may also impair our ability to have certainty with respect to a portion of our cash flow,flows, which could lead to decreases in capital spending and, therefore, decreases in future production and reserves.
If, as a result of the Dodd-Frank Act or its implementing regulations, we are required to post cash collateral in connection with our derivative positions, this would likely make it impracticable to implement our current hedging strategy.
We expect that the cost to hedge will increase as a result of fewer counterparties in the market and the pass-through of increased counterparty costs, thereby increasing the costs of derivative instruments. Our derivatives counterparties maywill be subject to significant new capital, margin and business conduct requirements imposed as a result of the Dodd-Frank Act.
The Dodd-Frank Act contemplates We expect that most swapsthese requirements will increase the cost to hedge because there will be requiredfewer counterparties in the market and increased counterparty costs will be passed on to be cleared through a registered clearing facility and traded on a designated exchange or swap execution facility. There are some exceptions to these
requirements for entities that use swaps to hedge or mitigate commercial risk. While we may ultimately be eligible for such exceptions, the scope of these exceptions currently is somewhat uncertain, pending further definition through rulemaking proceedings.us.
The above factors could also affect the pricing of derivatives and make it more difficult for us to enter into hedging transactions on favorable terms.
Climate change legislation or regulations restricting emissions of “greenhouse gases” could result in increased operating costs and reduced demand for the natural gas, NGLs and crude oil that we produce while physical effects of climate change could disrupt our production and cause us to incur significant costs in preparing for or responding to those effects.
In December 2009, the EPA published its findings that emissions of carbon dioxide, methane and other greenhouse gases present an endangerment to public health and the environment because emissions of such gases are, according to the EPA, contributing to warming of the earth’searth's atmosphere and other climatic changes. These findings allowprovide the basis for the EPA to adopt and implement regulations that would restrict emissions of greenhouse gases under existing provisions of the CAA.Clean Air Act (the “CAA”). In June 2010, the EPA published its final rule to address the permitting of greenhouse gas emissions from stationary sources under the CAA's Prevention of Significant Deterioration ("PSD"(“PSD”), and Title V permitting programs. This rule “tailors” these permitting programs to apply to certain stationary sources of greenhouse gas emissions in a multi-step process, with the largest sources first subject to permitting. It is widely expected that facilities required to obtain PSD permits for their greenhouse gas emissions will be required to also reduce those emissions according to “best available control technology,” or BACT,("BACT") standards. In its permitting guidance for greenhouse gases, issued on November 10, 2010, the EPA recommended options for BACT, which include improved energy efficiency, among others. EPA has recently issued a final rule retaining the current “tailored” permitting thresholds, opting not to extend greenhouse gas permitting requirements to smaller stationary sources at this time. The EPA, however, intends to revisit these thresholds again by 2016. In addition, on June 26, 2012, the United States Court of Appeals for the District of Columbia Circuit issued an opinion and order in Coalition for Responsible Regulation v. Environmental Protection Agency, No. 09-1322, upholding EPA's greenhouse gas-related rules, including the “Tailoring Rule,” against challenges from various state and industry group petitioners. Any regulatory or permitting obligation that limits emissions of greenhouse gases could require us to incur costs to reduce and monitor emissions of greenhouse gases associated with our operations and also adversely affect demand for the natural gas and crude oil that we produce.
In addition, in October 2009, the EPA published a final rule requiring the reporting of greenhouse gas emissions from specified large greenhouse gas sources in the U.S. on an annual basis, beginning in 2011 for emissions occurring after January 1,in 2010. On November 8, 2010, the EPA finalized rules to expand its greenhouse gas reporting rule to include onshore natural gas and crude oil production, processing, transmission, storage and distribution facilities. Reporting ofWe are required to report our greenhouse gas emissions from such facilities will be required on an annual basis, with reporting beginning in 2012 for emissions occurring in 2011.
In June 2009, the U.S. House of Representatives passed the American Clean Energy and Security Act of 2009 ("ACESA"(“ACESA”), which would establish an economy-wide cap on emissions of greenhouse gases in the U.S. and would require most sources of greenhouse gas
emissions to obtain and hold “allowances” corresponding to their annual emissions of greenhouse gases. By steadily reducing the number of available allowances over time, ACESA would require a 17 percent reduction in greenhouse gas emissions from 2005 levels by 2020, increasing up to an 83 percent reduction of such emissions by 2050. ManyThe ACESA was not passed by the U.S. Senate. However, many states and regions have already taken legal measures to reduce emissions of greenhouse gases, primarily through the planned development of greenhouse gas emission inventories and/or regional greenhouse gas cap and trade programs. Recently, increased focus has been directed to methane emissions, including a lawsuit by several Northeastern states that would require the EPA to more stringently regulate methane emissions from the oil and gas sector. The passage of legislation, or other initiatives, that limitslimit emissions of greenhouse gases from our equipment and operations could require us to incur costs to reduce the greenhouse gas emissions from our operations, and it could also adversely affect demand for the natural gas and crude oil that we produce.
Some have suggested that one consequence of climate change could be increased severity of extreme weather, such as increased hurricanes and floods. If such effects were to occur, our operations could be adversely affected in various ways, including damagesdamage to our facilities from powerful winds or increased costs for insurance.
Another possible consequence of climate change is increased volatility in seasonal temperatures. The market for natural gas is generally improved by periods of colder weather and impaired by periods of warmer weather, so any changes in climate could affect the market for the fuels that we produce. Despite the use of the term “global warming” as a shorthand for climate change, some studies indicate
that climate change could cause some areas to experience temperatures substantially colder than their historical averages. As a result, it is difficult to predict how the market for our fuels could be affected by increased temperature volatility, although if there is an overall trend of warmer temperatures, it would be expected to have an adverse effect on our business.
LitigationThe cost of defending any suits brought against us pertainingwith respect to our royalty payment practices, and payments is ongoing; our cost of defending these lawsuits, and any future similar lawsuits, could be significant and anyjudgments resulting judgments against usfrom such suits, could have a materialan adverse effect uponon our results of operations and financial condition.
In recent years, litigation has commenced against us and other companies in our industry regarding royalty practices and payments in jurisdictions where we conduct business. For more information on the suits that currently relate to us, see Note 11, Commitments and Contingencies, to our consolidated financial statements included in this report. We intend to defend ourselves vigorously in these cases. Even if the ultimate outcomeThe costs of this litigation resulteddefending these suits can be significant, even when we ultimately succeed in our dismissal, defense costs could be significant.having them dismissed. These costs would be reflected in terms of dollar outlay, as well as the amount of time, attention and other resources that our management would have to appropriate to the defense. Although we cannot predict an eventual outcome of this litigation, aA judgment in favor of a plaintiff in a suit of this type could have a material adverse effect on our financial condition and profitability.
Risks Associated with Our Indebtedness
Our credit facility has substantial restrictions and financial covenants and we may have difficulty obtaining additional credit, which could
adversely affect our operations. Our lenders can unilaterally reduce our borrowing availability based on anticipated sustained natural gas and crude oil prices.
We depend in large part on our revolving credit facility for future capital needs. The terms of the borrowing agreement require us to comply with certain financial covenants and ratios. Our ability to comply with these restrictions and covenants in the future is uncertain and will be affected by the levels of cash flows from operations and events or circumstances beyond our control. Our failure to comply with any of the restrictions and covenants under the revolving credit facility or other debt financing could result in a default under those facilities, which could cause all of our existing indebtedness to be immediately due and payable.
The revolving credit facility limits the amounts we can borrow to a borrowing base amount, determined by the lenders in their sole discretion based upon projected revenues from the natural gas and crude oil properties securing their loan. The lenders can unilaterally adjust the borrowing base and the borrowings permitted to be outstanding under the revolving credit facility. Outstanding borrowings in excess of the borrowing base must be repaid immediately, or we must pledge other natural gas and crude oil properties as additional collateral. We do not currently have any substantial unpledged properties, and we may not have the financial resources in the futurebe able to make any mandatory principal prepayments required under the revolving credit facility. Our inability to borrow additional funds under our credit facility could adversely affect our operationsidentify and our financial results.
The indentures governing our outstanding notes and our senior credit facility impose (and we anticipate that the indentures governing any other debt securities we may issue will also impose) restrictionsacquire enough attractive prospects on us that may limit the discretion of management in operating our business. That, in turn, could impair our abilitya timely basis to meet our obligations.
The indentures governing our outstanding notes and our senior credit facility contain (and we anticipate that the indentures governing any other debt securities we may issue will also contain) various restrictive covenants that limit management’s discretion in operating our business. In particular, these covenantsdevelopment needs, which could limit our ability to, among other things:
incur additional debt;
make certain investments or pay dividends or distributions on our capital stock, or purchase, redeem or retire capital stock;
sell assets, including capital stock of our restricted subsidiaries;
restrict dividends or other payments by restricted subsidiaries;
create liens;
enter into transactions with affiliates; and
merge or consolidate with another company.
These covenants could materiallyfuture development opportunities and adversely affect our ability to finance our future operations or capital needs. Furthermore, they may restrict our ability to expand, to pursue our business strategies and otherwise conduct our business. Our ability to comply with these covenants may be affected by circumstances and events beyond our control, such as prevailing economic conditions and changes in regulations, and we cannot assure you that we will be able to comply with them. A breach of any of these covenants could result in a default under the indentures governing our outstanding senior notes and any other debt securities we may issue in the future and/or our senior credit facility. If there were an event of default under our indentures and/or the senior credit facility, the affected creditors could cause all amounts borrowed under these instruments to be due and payable immediately. Additionally, if we fail to repay indebtedness under our senior credit facility when it becomes due, the lenders under the senior credit facility could proceed against the assets which we have pledged to them as security. Our assets and cash flow might not be sufficient to repay our outstanding debt in the event of a default. The occurrence of such an event would adversely affect our operations and profitability.
Our senior credit facility also requiresgeologists have identified a number of potential drilling locations on our existing acreage. These drilling locations must be replaced as they are drilled for us to maintain specified financial ratioscontinue to grow our reserves and satisfy certain financial tests.production. Our ability to maintain or meet such financial ratiosidentify and testsacquire new drilling locations depends on a number of factors, including the availability of capital, regulatory approvals, commodity prices, competition, costs, availability of drilling rigs, drilling results and the ability of our geologists to successfully identify potentially successful new areas to develop. All of these factors are subject to numerous uncertainties. Because of these uncertainties, our profitability and growth opportunities may be affectedlimited by events beyond our control, including changes in general economic and business conditions, and we cannot assure you that we will maintain or meet such ratios and tests, or that the lenders under the senior credit facility will waive any failure to meet such ratios or tests.
In addition, upontimely availability of new drilling locations. As a change in control, we are required to offer to buy each senior note for 101% of the principal amount, plus unpaid interest. A change in control is defined to include: (i) when a majority of the Board of Directors are not continuing directors; (ii) when one person (or group of related persons) holds direct or indirect ownership of over 50% of our voting stock; or (iii) upon sale, transfer or lease of substantially all of our assets.
We may incur additional indebtedness to facilitate our acquisition of additional properties, which would increase our leverage and could negatively affect our business or financial condition.
Our business strategy includes the acquisition of additional properties that we believe would have a positive effect on our current business and operations. We expect to continue to pursue acquisitions of such properties and may incur additional indebtedness to finance the acquisitions. Our incurrence of additional indebtedness would increase our leverage and our interest expense, which could have a negative effect on our business or financial condition.
If we fail to obtain additional financing, we may be unable to refinance our existing debt, expand our current operations or acquire new businesses. This could result, in our failure to grow in accordance with our plans, or could result in defaults in our obligations under our senior credit facility or the indentures relating to our outstanding senior notes.
In order to refinance indebtedness, expand existing operations and acquire additional businesses or properties, we will require substantial amounts of capital. There can be no assurance that financing, whether from equity or debt financings or other sources, will be available or, if available, will be on terms satisfactory to us. If we are unable to obtain such financing, we will be unable to acquire additional businesses or properties and may be unable to meet our obligations under our senior credit facility and the indentures relating to our outstanding senior notes or any other debt securities we may issue in the future. Such an event would adversely affect our operations and profitability.profitability could be adversely affected.
Risks Associated with Our Joint Venture
PDC Mountaineer, LLCPDCM is dependent upon our equity partner (the “Investor”) and poses exit-related risks for us.
The board of managers of the joint venture consists of three representatives appointed by us and three representatives appointed by the Investor,our equity partner Lime Rock Partners, LP, each with equal voting power. The joint venture agreement generally requires the affirmative vote of a majority of the members of the board to approve an action, and we and the InvestorLime Rock may not always agree on the best course of action for the joint venture. If such a disagreement were to occur, we would not be able to cause the joint venture to take action that we believed to be in the best interests of the joint venture. Consequently, our best interests may not be advanced and our investment in the joint venture could be adversely affected. If there is a disagreement about a development plan and budget for the joint venture, the InvestorLime Rock is entitled to unilaterally suspend substantially all of the operations of the joint venture, which could have a material adverse impact on the results of operations of the joint venture and our investment. Such a suspension could last for up to two years, at which point either party could elect to dissolve the joint venture or to sell theirits ownership interests to a third party. The InvestorLime Rock is entitled to a preference with respect to liquidating distributions and proceeds from significant sales of ownership interests up to the amount of its contributed capital, which would diminish our returns if the value of the joint venture had declined at the time of the liquidation or sale.
After a “restricted period” which generally lasts for the four year years following the closing of the joint venture, the InvestorLime Rock can seek to sell its interest in the joint venture to a third party, subject to rights of first offer and refusal in favor of us. If we do not exercise those rights in a sale involving all of the Investor’sLime Rock's ownership interests, the InvestorLime Rock can exercise “drag-along” rights and compel us to sell all of our interests in the proposed transaction. Accordingly, if we possessed insufficient funds and were unable to obtain financing necessary to purchase the Investor’sLime Rock's interest under the rights of first offer and refusal, the InvestorLime Rock might sell its interests in the joint venture to a third party with whom we might have a difficult time in dealing and in managing the joint venture or we may be required to sell our interest in the joint venture at a time when we may not wish to do so. Under these circumstances, our investment in the joint venture could be adversely affected.
Our undeveloped acreage must be drilled before lease expiration to hold the acreage by production. In highly competitive markets for acreage, failure to drill sufficient wells to hold acreage could result in a substantial lease renewal cost or, if renewal is not feasible, loss of our lease and prospective drilling opportunities.
Unless production is established within the spacing units covering the undeveloped acres on which some of the locations are identified, our leases for such acreage will expire. The cost to renew such leases may increase significantly, and we may not be able to renew such leases on commercially reasonable terms or at all. As such, our actual drilling activities may differ materially from our current expectations, which could adversely affect our business.
Our articles of incorporation, bylaws, stockholders rights plan and Nevada law contain provisions that may have an anti-takeover effect and may delay, defer or prevent a tender offer or takeover attempt, which may adversely affect the market price of our common stock.
Our articles of incorporation authorize our board of directors to issue preferred stock without stockholder approval. If our board of directors elects to issue preferred stock, it could be more difficult for a third party to acquire us. We previously adopted a stockholders rights plan that will dilute the stock ownership of certain acquirers of our common stock upon the occurrence of certain events. In addition, some provisions of our articles of incorporation, bylaws and Nevada law could make it more difficult for a third party to acquire control of us, including:
the organization of our board of directors as a classified board, which allows no more than one-third of our directors to be elected each year;
limitations on the ability of our shareholders to call special meetings; and
certain antitakeover provisions of the Nevada private corporations statute.
Because we have no plans to pay dividends on our common stock, stockholders must look solely to stock appreciation for a return on their investment in us.
We have never declared or paid cash dividends on our common stock. We currently intend to retain all future earnings and other cash resources, if any, for the operation and development of our business and do not anticipate paying cash dividends in the foreseeable future. Payment of any future dividends will be at the discretion of our board of directors after taking into account many factors, including our financial condition, operating results, current and anticipated cash needs and plans for expansion. In addition, our revolving credit facility and the indenture governing our senior notes limit our ability to pay cash dividends on our common stock. Any future dividends may also be restricted by any other debt agreements which we may enter into from time to time.
ITEM 1B. UNRESOLVED STAFF COMMENTS
None.
ITEM 3. LEGAL PROCEEDINGS
Information regarding our legal proceedings can be found in Note 11, Commitments and Contingencies – Litigation, to our consolidated financial statements included elsewhere in this report.
ITEM 4. MINE SAFETY DISCLOSURES
None.Not applicable.
PART II
ITEM 5. MARKET FOR THE REGISTRANT'S COMMON EQUITY, RELATED STOCKHOLDERS MATTERS AND ISSUER PURCHASES OF EQUITY SECURITIES
Our common stock, par value $0.01 per share, is traded on the NASDAQ Global Select Market under the symbol PETD.PDCE. The following table sets forth the range of high and low sales prices for our common stock for each of the periods presented.presented:
| | | | Price Range | Price Range |
| | High | | Low | High | | Low |
| | | | | | | |
| January 1 - March 31, 2010 | $ | 25.37 |
| | $ | 18.11 |
| |
| April 1 - June 30, 2010 | 27.73 |
| | 17.92 |
| |
| July 1 - September 30, 2010 | 30.39 |
| | 23.82 |
| |
| October 1 - December 31, 2010 | 43.01 |
| | 27.44 |
| |
| January 1 - March 31, 2011 | 49.60 |
| | 39.93 |
| $ | 49.60 |
| | $ | 39.93 |
|
| April 1 - June 30, 2011 | 48.51 |
| | 28.67 |
| 48.51 |
| | 28.67 |
|
| July 1 - September 30, 2011 | 39.50 |
| | 19.35 |
| 39.50 |
| | 19.35 |
|
| October 1 - December 31, 2011 | 37.77 |
| | 15.08 |
| 37.77 |
| | 15.08 |
|
| January 1 - March 31, 2012 | | 40.26 |
| | 28.61 |
|
| April 1 - June 30, 2012 | | 37.63 |
| | 19.33 |
|
| July 1 - September 30, 2012 | | 34.25 |
| | 23.27 |
|
| October 1 - December 31, 2012 | | 36.55 |
| | 25.76 |
|
As of February 17, 20128, 2013, we had approximately 790726 shareholders of record. Since inception, no cash dividends have been declared on our common stock. Cash dividends are restricted under the terms of our revolving credit facility and the indenture governing our 2022 Senior Notes and we presently intend to continue a policy of using retained earnings for expansion of our business. See Note 8, Long-term Debt, to our consolidated financial statements included elsewhere in this report.
The following table presents information about our purchases of our common stock during the three months ended December 31, 20122011.:
|
| | | | | | | | | | | | | |
| Period | | Total Number
of Shares
Purchased (1) | | Average Price
Paid per Share | | Total Number
of Shares
Purchased as
Part of Publicly
Announced Plans
or Programs | | Maximum Number
of Shares that May
Yet Be Purchased
Under the Plans
or Programs |
| | | | | | | | | |
| October 1 - 31, 2011 | | 175 |
| | $ | 26.11 |
| | — |
| | — |
|
| November 1 - 30, 2011 | | 3,755 |
| | 27.52 |
| | — |
| | — |
|
| December 1 - 31, 2011 | | 2,607 |
| | 35.11 |
| | — |
| | — |
|
| Total fourth quarter purchases | | 6,537 |
| | 30.51 |
| | | | |
|
| | | | | | | | | | | | | |
| Period | | Total Number
of Shares
Purchased (1) | | Average Price
Paid per Share | | Total Number
of Shares
Purchased as
Part of Publicly
Announced Plans
or Programs | | Maximum Number
of Shares that May
Yet Be Purchased
Under the Plans
or Programs |
| | | | | | | | | |
| October 1 - 31, 2012 | | 709 |
| | $ | 31.93 |
| | — |
| | — |
|
| November 1 - 30, 2012 | | 9,786 |
| | 31.53 |
| | — |
| | — |
|
| December 1 - 31, 2012 | | 254 |
| | 33.25 |
| | — |
| | — |
|
| Total fourth quarter purchases | | 10,749 |
| | 31.59 |
| | | | |
__________
| |
| (1) | Purchases primarily represent shares purchased pursuant to our stock-based compensation plansfrom employees for the payment of their tax liabilities related to the vesting of securities.securities issued pursuant to our stock-based compensation plans. |
SHAREHOLDER PERFORMANCE GRAPH
The performance graph below compares the cumulative total return of our common stock over the five-year period ended December 31, 20112012, with the cumulative total returns for the same period for the Standard and Poor's ("S&P") 500 Index and the Standard Industrial Code ("SIC") Index. The SIC Index is a weighted composite of 235254 crude petroleum and natural gas companies. The results shown in the graph below are not necessarily indicative of future performance. The cumulative total shareholder return assumes that $100 was invested, including reinvestment of dividends, if any, in our common stock on December 31, 2006,2007 and in the S&P 500 Index and the SIC Index on the same date. The results shown in the graph below are not necessarily indicative of future performance.
ITEM 6. SELECTED FINANCIAL DATA
|
| | | | | | | | | | | | | | | | | | | | |
| | Year Ended December 31, |
| | 2011 | | 2010 | | 2009 | | 2008 | | 2007 (3) |
| | (in millions, except per share data and as noted) |
| Statement of Operations | |
| |
| |
| |
| |
|
| Natural gas, NGL and crude oil sales | | $ | 276.6 |
| | $ | 205.0 |
| | $ | 171.2 |
| | $ | 304.9 |
| | $ | 175.2 |
|
| Commodity price risk management gain (loss), net (1) | | 46.1 |
| | 59.9 |
| | (10.1 | ) | | 127.8 |
| | 2.8 |
|
| Total revenues | | 396.0 |
| | 343.0 |
| | 230.9 |
| | 572.5 |
| | 291.7 |
|
| Income (loss) from continuing operations | | 3.1 |
| | 6.0 |
| | (80.1 | ) | | 105.8 |
| | 26.1 |
|
| | | |
| |
| |
| |
|
| Earnings (loss) per share attributable to shareholders: | | | |
|
| |
|
| |
|
| |
|
|
| Net income (loss) from continuing operations - basic | | $ | 0.13 |
| | $ | 0.33 |
| | $ | (4.76 | ) | | $ | 7.19 |
| | $ | 1.77 |
|
| Net income (loss) from continuing operations - diluted | | 0.13 |
| | 0.32 |
| | (4.76 | ) | | 7.13 |
| | 1.76 |
|
| | | |
|
| |
|
| |
|
| |
|
|
| Statement of Cash Flows | | | |
| |
| |
| |
|
| Net cash provided by operating activities | | $ | 166.8 |
| | $ | 151.8 |
| | $ | 143.9 |
| | $ | 139.1 |
| | $ | 60.3 |
|
| Capital expenditures | | 334.5 |
| | 162.7 |
| | 143.0 |
| | 323.2 |
| | 239.0 |
|
| Acquisitions | | 145.9 |
| | 158.1 |
| | — |
| | — |
| | 255.7 |
|
| | | |
| |
| |
| |
|
| Balance Sheet | | | |
| |
| |
| |
|
| Total assets | | $ | 1,698.0 |
| | $ | 1,389.0 |
| | $ | 1,250.3 |
| | $ | 1,402.7 |
| | $ | 1,050.5 |
|
| Working capital (deficit) | | (22.0 | ) | | 16.2 |
| | 32.9 |
| | 31.3 |
| | (50.2 | ) |
| Long-term debt | | 532.2 |
| | 295.7 |
| | 280.7 |
| | 394.9 |
| | 235.0 |
|
| Equity | | 664.1 |
| | 642.2 |
| | 538.6 |
| | 512.3 |
| | 396.3 |
|
| | | |
| |
| |
| |
|
| Pricing and Lifting Costs on Continuing Operations | | | |
| |
| |
| |
|
| Average sales price (excluding gains/losses on derivatives) (per Mcfe) | | $ | 6.15 |
| | $ | 5.63 |
| | $ | 4.19 |
| | $ | 8.37 |
| | $ | 6.26 |
|
| Average sales price (including realized gains/losses on derivatives) (per Mcfe) | | 6.53 |
| | 6.89 |
| | 6.77 |
| | 8.62 |
| | 6.52 |
|
| Average lifting cost (per Mcfe) (2) | | 0.95 |
| | 1.09 |
| | 0.81 |
| | 1.08 |
| | 0.90 |
|
| | | | | | | | | | | |
| Production (Bcfe) | | | | | | | | | | |
| Production from continuing operations | | 45.0 | | 37.0 |
| | 41.6 |
| | 36.9 |
| | 28.0 |
|
| Production from discontinued operations (3) | | 2.5 | | 1.6 |
| | 1.7 |
| | 1.8 |
| | — |
|
| Total production | | 47.5 |
| | 38.6 |
| | 43.3 |
| | 38.7 |
| | 28.0 |
|
| | | | | | | | | | | |
| Total proved reserves (Bcfe) (4) | | 1,015.5 | | 860.6 |
| | 717.3 |
| | 753.1 |
| | 685.6 |
|
|
| | | | | | | | | | | | | | | | | | | | |
| | Year Ended December 31, |
| | 2012 | | 2011 | | 2010 | | 2009 | | 2008 |
| | (in millions, except per share data and as noted) |
| Statement of Operations: | |
| |
| |
| |
| |
|
| Natural gas, NGLs and crude oil sales | | $ | 270.3 |
| | $ | 276.6 |
| | $ | 205.0 |
| | $ | 171.2 |
| | $ | 304.9 |
|
| Commodity price risk management gain (loss), net | | 32.3 |
| | 46.1 |
| | 59.9 |
| | (10.1 | ) | | 127.8 |
|
| Total revenues | | 356.1 |
| | 396.0 |
| | 343.0 |
| | 230.9 |
| | 572.5 |
|
| Income (loss) from continuing operations | | (144.8 | ) | | 3.1 |
| | 6.0 |
| | (80.1 | ) | | 105.8 |
|
| | | | | | | | | | |
| Earnings per share from continuing operations | | | | | | | | | | |
| Basic | | $ | (5.23 | ) | | $ | 0.13 |
| | $ | 0.33 |
| | $ | (4.76 | ) | | $ | 7.19 |
|
| Diluted | | (5.23 | ) | | 0.13 |
| | 0.32 |
| | (4.76 | ) | | 7.13 |
|
| | | | | | | | | | |
| Statement of Cash Flows: | | | | | | | | | | |
| Net cash from: | | | | | | | | | | |
| Operating activities | | $ | 174.7 |
| | $ | 166.8 |
| | $ | 151.8 |
| | $ | 143.9 |
| | $ | 139.1 |
|
| Investing activities | | (451.9 | ) | | (456.4 | ) | | (300.9 | ) | | (142.3 | ) | | (323.0 | ) |
| Financing activities | | 271.4 |
| | 243.4 |
| | 171.5 |
| | (20.6 | ) | | 150.1 |
|
| Capital expenditures | | 347.7 |
| | 334.5 |
| | 162.7 |
| | 143.0 |
| | 323.2 |
|
| Acquisitions of natural gas and crude oil properties | | 312.2 |
| | 145.9 |
| | 158.1 |
| | — |
| | — |
|
| | | | | | | | | | |
| Balance Sheet: | | | | | | | | | | |
| Total assets | | $ | 1,826.8 |
| | $ | 1,698.0 |
| | $ | 1,389.0 |
| | $ | 1,250.3 |
| | $ | 1,402.7 |
|
| Working capital (deficit) | | (31.4 | ) | | (22.0 | ) | | 16.2 |
| | 32.9 |
| | 31.3 |
|
| Long-term debt | | 676.6 |
| | 532.2 |
| | 295.7 |
| | 280.7 |
| | 394.9 |
|
| Total equity | | 703.2 |
| | 664.1 |
| | 642.2 |
| | 538.6 |
| | 512.3 |
|
| | | | | | | | | | |
| Pricing and Lifting Costs Relating to Continuing Operations (per Mcfe): | | | | | | | | |
| Average sales price (excluding gains/losses on derivatives) | | $ | 5.45 |
| | $ | 6.15 |
| | $ | 5.63 |
| | $ | 4.19 |
| | $ | 8.37 |
|
| Average sales price (including realized gains/losses on derivatives) | | 6.44 |
| | 6.53 |
| | 6.89 |
| | 6.77 |
| | 8.62 |
|
| Average lifting cost (1) | | 0.85 |
| | 0.92 |
| | 1.05 |
| | 0.78 |
| | 1.04 |
|
| | | | | | | | | | | |
| Production (Bcfe): | | | | | | | | | | |
| Production from continuing operations | | 49.6 |
| | 45.0 |
| | 37.0 |
| | 41.6 |
| | 36.9 |
|
| Production from discontinued operations | | 0.4 |
| | 2.5 |
| | 1.6 |
| | 1.7 |
| | 1.8 |
|
| Total production | | 50.0 |
| | 47.5 |
| | 38.6 |
| | 43.3 |
| | 38.7 |
|
| | | | | | | | | | | |
| Total proved reserves (Bcfe) (2) | | 1,156.9 |
| | 1,015.5 |
| | 860.6 |
| | 717.3 |
| | 753.1 |
|
______________
| |
| (1) | See Note 4, Derivative Financial Instruments, to our consolidated financial statements included in this report. |
| |
(2) | Lifting costs represent lease operating expenses, excluding production taxes, on a per unit basis. |
| |
(3) | 2007 does not present the effects of the divestitures of our Michigan and North Dakota assets as discontinued operations as the amounts related to these operations were immaterial. |
| |
(4)(2) | Includes total proved reserves related to our Permian Basin assets of 65.0 Bcfe and 32.1 Bcfe as of December 31, 2011 and 2010, respectively .respectively. As of December 31, 2011, our Permian assets were held for sale and, on February 28, 2012, the divestiture closed. See Note 13,14, Assets Held for Sale, Divestitures and Discontinued Operations, and Note 18, Subsequent Event, to our consolidated financial statements included elsewhere in this report for additional details related to the divestiture of our Permian assets. |
ITEM 7. MANAGEMENT'S DISCUSSION AND ANALYSIS OF FINANCIAL CONDITION AND RESULTS OF OPERATIONS
The following discussion and analysis, as well as other sections in this report, should be read in conjunction with our consolidated financial statements and related notes to consolidated financial statements included elsewhere in this report. Further, we encourage you to revisit the Special Note Regarding Forward-Looking Statements in Part I of this report.
EXECUTIVE SUMMARY
20112012 Financial Overview
In 2011, we recorded strong increases in revenues and cash flows from operations. Increased production, liquids to2012, our natural gas, ratioNGLs and crude oil prices wereproduction from continuing operations averaged 135.6 MMcfe per day, an increase of approximately 10% compared to the largest contributorsprior year. The increase in production is primarily attributable to these increases, despite lower averageour successful horizontal Niobrara and Codell drilling program in the Wattenberg Field and the Merit Acquisition. Crude oil production from continuing operations increased 18.5% in 2012, while NGL production from continuing operations increased 17.0%. As a result, our liquids percentage of total production from continuing operations was 34.7% in 2012 compared 32.4% in 2011. Natural gas production increased 6.5% in 2012 compared to 2011. As discussed under "Operational Overview-Production" below, production growth in 2012 was adversely affected by high line pressures experienced by our principal third-party provider of natural gas prices. Naturalgathering, processing and transportation facilities in the Wattenberg Field. The high line pressure, primarily experienced during the second and third quarters, was the result of two primary factors: a series of operational issues experienced by the third-party midstream service provider facilities and abnormally warm weather. While natural gas NGLproduction increased when compared to prior year, significant declines in the average price of natural gas during 2012 resulted in a decrease in natural gas sales, excluding hedges, of 28.9% year-over-year. The price of natural gas, however, rebounded significantly during the fourth quarter of 2012. During 2012, we recorded an impairment charge of $161.2 million related to our Piceance Basin proved oil and crude oil sales revenuenatural gas properties. While the significant decrease in natural gas prices from prior years has impacted our results of operations, we believe our derivative program was effective in providing a degree of price stability. Realized gains from derivative transactions increased considerably to 34.9%$49.4 million in 2012, compared to $17.2 million in 2011, compared to 2010, with increases in productionan addition of approximately 21.5%$0.99 and an overall increase in the average sales price per Mcfe sold during 2012.
Mcfe of 9.2%. Leading the increase in production were liquids, with crude oil production increasing 38.9% and NGL production increasing 26.3%, resulting in a liquids to natural gas ratio of 32/68 in 2011 compared to 29/71 in 2010. Our derivative transactions generated revenues of $48.9 million and liquidity of $17.6 million. Available liquidity as of December 31, 2011,2012 was$398.6 million, including $14.1 million through our joint venture PDCM, compared to $196.4 million, including $16.6 million related to PDCM, for the acquisition and development of Marcellus properties, compared to $379.3 million, which included $23.9 million related to PDCM, as of December 31, 2010. The decrease in available liquidity year-over-year was expected as we intended to use the excess proceeds from our November 2010 capital transactions on the acquisition of natural gas and crude oil properties, specifically our partnership acquisitions and the acceleration of organic growth projects.2011. Available liquidity is comprised of cash, cash equivalents and funds available under our revolving credit facility. In May 2012, we completed a public offering of 6.5 million shares of our common stock for net proceeds of approximately $164.5 million, after deducting underwriting discounts and offering expenses. These funds were used to complete the Merit Acquisition noted below. In October 2012, we issued $500 million aggregate principal amount of our 2022 Senior Notes in a private placement. The net proceeds from the issuance of the notes of approximately $489 million were used to fund the redemption of our 2018 Senior Notes for a total redemption price of approximately $222 million, repay a portion of the amount outstanding under our revolving credit facility after giving considerationand for general corporate purposes. The early redemption of the 2018 Senior Notes resulted in a pre-tax loss on debt extinguishment of approximately $23.3 million. On October 31, 2012, we completed the semi-annual redetermination of our revolving credit facility's borrowing base. Our available borrowing base was reduced from $525 million to $450 million as a result of issuance of our undrawn outstanding letters of credit.2022 Senior Notes.
Operational Overview
Operational OverviewAcquisitions. We continued to make strides in 2012 toward our strategic goal of growing production while increasing our mix of crude oil and Updatenatural gas liquids. In June, we completed the Merit Acquisition for cash consideration of approximately $304.6 million, after certain post-closing adjustments. The acquired assets comprise approximately 29,800 net acres, after post-closing adjustments, located almost entirely in the core Wattenberg Field and with significant overlay with our existing acreage position. Ryder Scott prepared a reserve report with respect to the Merit Acquisition properties and estimated net proved reserves of 29.2 MMBoe (175 Bcfe) based on our development plan, using year-end 2011 SEC pricing and an effective date of April 1, 2012. Following the closing of the Merit Acquisition, our total position in the core Wattenberg Field was approximately 98,600 net acres.
Drilling ActivitiesActivities.. In 2011, During 2012, we continued to focus our operations primarily in the oil- and liquid-rich Wattenberg Field in Colorado and the emerging Utica Shale play in Ohio. We currently have two drilling rigs operating in the Wattenberg Field. We drilled 97 developmental37 horizontal wells and participated in 48 non-operated wellsone vertical well in the Wattenberg Field in 2012, of which 12330 were completed and turnedturned-in-line as of December 31, 2012, and we participated in line.19 non-operated drilling projects. We also executed 190160 refracture and/or recompletion projects in this area. Of the 145 wells drilled, 17 were horizontal Niobrara with 16 of them producing as of December 31, 2011. We drilled 17 developmentalon 83 wells in the Wattenberg Field. The shift in the Wattenberg Field from drilling both vertical and horizontal wells to our current program of drilling horizontal wells has resulted in significantly fewer wells being drilled at a considerably higher cost per well and higher production and reserves per well. The remaining activity in our Western Operating Region in 2012 was the first quarter completion of our final three Piceance Basinwells drilled in 2011.
In our Eastern Operating Region, we drilled and completed two horizontal Utica wells during the year. At December 31, 2012, these wells are currently shut-in awaiting pipeline connections. We also drilled and completed one vertical Utica stratigraphic test well and completed one vertical Utica stratigraphic test well drilled in late 2011. In 2012, the costs related to the two vertical stratigraphic test wells were expensed at a cost of $12.2 million. We currently plan to continue to de-risk and develop our approximate 45,000 net acres without materially adding to our leasehold position. We estimate our total gross horizontal Utica Shale drilling inventory to be approximately 200 locations. In addition, PDCM drilled six horizontal Marcellus wells, two of which had been turned in line as of the end of the year, and completed three horizontal Marcellus wells that were in-process as of December 31, 2010. In the Permian Basin, we drilled a total of 23 developmental wells, 15in 2012, all of which were producing at year endcompleted and two of which were determined to be dry holes.
Acquisitions and Leasehold Agreements. In 2011, we entered into leasehold agreements with various unrelated third parties providing us with an option to acquire acreage targetingturned-in-line during the wet natural gas and crude oil windows of the Utica Shale play throughout southeastern Ohio. Pursuant to the agreements, we have the right to acquire an estimated 40,000 net acres. Should we exercise our right to acquire all 40,000 acres, we estimate that the purchase price of such leaseholds will approximate $70 million. A portion of the options related to these leaseholds will expire in August 2012. Currently, we are pursuing an industry joint venture partner to participate in and share in funding the growth and development in this play. While we expect to identify a partner by mid-2012, we cannot assure we will be successful in securing a partner or developing this acreage. These Utica Shale acreage expenditures demonstrate our heightened interest in dedicating a portion of our capital budget to exploration, which involves higher risks and the potential for higher rewards. In previous years we have dedicated very little of our expenditures to exploration.year.
In October 2011, PDCM acquired from an unrelated third party 100% of the membership interests of Seneca-Upshur Petroleum, LLC ("Seneca-Upshur"), a West Virginia limited liability company, for the purchase price of $162.9 million, including a post-closing working capital adjustment of $10.4 million. The acquisition included approximately 1,340 gross wells producing from the shallow Devonian Shale and Mississippian formations and all rights and depths to an estimated 100,000 net acres in West Virginia, of which 90,000 acres are prospective for the Marcellus Shale. Pursuant to our joint venture interest in PDCM, our portion of the purchase price was $81.5 million and we hold a 50% interest in both the wells and acres acquired. We estimate that the acquisition added approximately 8 Bcfe to our total proved reserves as of December 31, 2011. Substantially all of the acreage acquired is held by production and is in close proximity to PDCM's existing properties.
During 2011, we acquired eight affiliated partnerships for an aggregate purchase price of $73 million. These purchases included the non-affiliated investor partners' remaining working interests in a total of 299 gross, 204.2 net, wells located in our Wattenberg Field and Piceance Basin. The acquisition of these partnerships has provided us with immediate growth in both production and proved reserves, and will allow us to realize operational benefits, as well as the opportunity to optimize revenue opportunities by accelerating a refracture and recompletion program of the wells acquired.
Natural Gas and Crude Oil Properties Divestitures. In October 2011, we announced our intent to divest our assets located in the Wolfberry Trend in the Permian Basin in West Texasassets to focus our efforts inon our horizontal drilling programs and to provide partial funding for our 2012 capital budget.programs. During the fourth quarter of 2011, we sold ourcertain non-core Permian assets to unrelated
third parties for a total of $13.2 million. On December 20, 2011, we executed a purchase and salessale agreement with another unrelated third partythird-party for the sale of our core Permian assets for a total price of $173.9 million, subject to customary post-closing adjustments. The transaction closed onOn February 28, 2012, withthe divestiture of the core Permian assets closed. Upon final post-closing adjustments on June 29, 2012, total proceeds received for the core Permian assets was $189.2 million, resulting in a pre-tax gain on sale of $184.4 million after preliminary closing adjustments.$19.9 million. The proceeds from these sales were used to pay down amounts outstanding under our corporaterevolving credit facility and to provide partial funding for our 2012 capital budget, allowing us to accelerate the development of our liquid-rich inventory of projects in the Wattenberg Field and to fund the acquisition of Utica Shale acreage in Ohio while beginning exploratory activities on this acreage. Our Permian Basin assets were classified as held for sale as of December 31, 2010 and 2011, and thebudget. The results of operations related to thoseour Permian Basin assets wereare reported as discontinued operations in 2010, year of acquisition, and 2011,for all applicable periods presented in the
accompanying consolidated statements of operations included elsewhere in this report.
Potential for Future Asset Impairments.2013 Planned Divestiture. The domestic natural gas market remains weak. A further decrease in forward natural gas prices during 2012 could result in significant impairment charges. OurOn February 4, 2013, we entered into a purchase and sale agreement with certain affiliates of Caerus Oil and Gas LLC (“Caerus”), pursuant to which we have agreed to sell to Caerus our Piceance Basin, has significant natural gas reserves, representing 47% of our total proved natural gas reservesNECO and 32% of our total proved reserves, and is sensitive to declines in natural gas prices. These assets, which had a net book value of approximately $308 million at December 31, 2011, are at risk of impairment if future natural gas prices for production in this area experience further long-term decline. The cash flow model we use to assess properties for impairment includes numerous assumptions, such as management's estimates of futurecertain other non-core Colorado oil and gas productionproperties, leasehold mineral interests and commodity prices, market outlook on forward commodity pricesrelated assets, including derivatives, for aggregate cash consideration of approximately $200 million. The cash consideration is subject to customary adjustments, including adjustments based upon title and operatingenvironmental due diligence, and development costs. All inputsby certain firm transportation obligations and natural gas hedging positions that will be assumed by Caerus. We intend to use the proceeds from the sale to repay a portion of amounts outstanding under our revolving credit facility and partially fund our 2013 capital program. The assets being sold do not include any of our core Wattenberg Field acreage. As of December 31, 2012, total estimated proved reserves related to these assets were 83,656 MMcf of natural gas and 148 MBbls of crude oil, for an aggregate of 84,544 Mmcfe of natural gas equivalent. See Note 19, Subsequent Events, to our consolidated financial statements included elsewhere in this report for additional details related to the cash flow model mustplanned divestiture of our Piceance and NECO assets. There can be evaluatedno assurance that this transaction will close as planned. In addition, purchase price adjustments may reduce our proceeds from the transaction.
Production. Production from continuing operations increased significantly in 2012 as compared to 2011. In particular, primarily as a result of our Wattenberg Field drilling activities, oil production increased 18.5% and NGL production increased 17%. This production growth was achieved despite high line pressures experienced by our principal third-party provider of natural gas gathering, processing and transportation facilities in the Wattenberg Field. The high line pressure was the result of a series of operational issues experienced by third-party midstream service provider, primarily during the second and third quarter of 2012. The operational issues included downtime on third-party NGL transportation and fractionation facilities and abnormally warm weather, which limited the gathering system compression capacity. We are working closely with this primary midstream provider who is implementing a multi-year facility expansion capable of significantly increasing long-term gathering and processing capacity in the Wattenberg Field. However, we do not expect the impact of this increased capacity to substantially benefit us until late 2013.
Our NGL pricing has also decreased significantly relative to the same period in 2011. Our NGLs are priced at each date that the estimate of future cash flows for each producing basin is calculated. However,Conway, Kansas, where ethane and propane are valued at a significant decrease in long-term forward natural gas prices alone could result indiscount to Mt. Belvieu gulf coast NGL pricing. The planned 2013 infrastructure projects include a significant impairmentnew NGL pipeline that will provide direct access for our properties that are sensitiveNGLs to declines in natural gas prices.Mt. Belvieu where we anticipate improved pricing.
Non-U.S. GAAP Financial Measures
We use "adjusted cash flowflows from operations," "adjusted net income (loss) attributable to shareholders," "adjusted EBITDA" and "PV-10%," non-U.S. GAAP financial measures, for internal managerial purposes,management reporting, when evaluating period-to-period changes and providing public guidance on possible future results. These measures are not measures of financial performance under U.S. GAAP and should be considered in addition to, not as a substitute for, cash flows from operations, investing or financing activities, norand should not be viewed as a liquidity measure or indicator of cash flows reported in accordance with U.S. GAAP. The non-U.S. GAAP financial measures that we use may not be comparable to similarly titled measures reported by other companies. Also, in the future, we may disclose different non-U.S. GAAP financial measures in order to help our investors more meaningfully evaluate and compare our future results of operations to our previously reported results of operations. We strongly encourage investors to review our financial statements and publicly filed reports in their entirety and to not rely on any single financial measure. See Reconciliation of Non-U.S. GAAP Financial Measures for a detailed description of these measures, as well as a reconciliation of each to the nearestmost comparable U.S. GAAP measure.
Results of Operations
Summary Operating Results
The following table presents selected information regarding our operating results from continuing operations.operations:
| | | | Year Ended December 31, | Year Ended December 31, |
| | | | | | | | Change | | | | | | | Change |
| | 2011 | | 2010 | | 2009 | | 2011-2010 | | 2010-2009 | 2012 | | 2011 | | 2010 | | 2012-2011 | | 2011-2010 |
| | (dollars in millions, except per unit data) | | | | | (dollars in millions, except per unit data) | | | | |
| Production (1) | | | | | | | | | | | | | | | | | | |
Natural gas (MMcf) (2) | 30,429.7 |
| | 26,239.1 |
| | 34,089.6 |
| | 16.0 | % | | (23.0 | )% | 32,409.8 |
| | 30,429.7 |
| | 26,239.1 |
| | 6.5 | % | | 16.0 | % |
| NGLs (MBbls) | | 841.3 |
| | 719.2 |
| | 569.6 |
| | 17.0 | % | | 26.3 | % |
| Crude oil (MBbls) | 1,709.9 |
| | 1,231.4 |
| | 1,244.0 |
| | 38.9 | % | | (1.0 | )% | 2,025.9 |
| | 1,709.9 |
| | 1,231.4 |
| | 18.5 | % | | 38.9 | % |
| NGLs (MBbls) (2) | 719.2 |
| | 569.6 |
| | — |
| | 26.3 | % | | * |
| |
Natural gas equivalent (MMcfe) (3)(2) | 45,004.8 |
| | 37,044.9 |
| | 41,553.4 |
| | 21.5 | % | | (10.8 | )% | 49,612.4 |
| | 45,004.8 |
| | 37,044.9 |
| | 10.2 | % | | 21.5 | % |
| Average MMcfe per day | 123.3 |
| | 101.5 |
| | 113.8 |
| | 21.5 | % | | (10.8 | )% | 135.6 |
| | 123.3 |
| | 101.5 |
| | 10.0 | % | | 21.5 | % |
| Natural Gas, NGL and Crude Oil Sales | | | | | | | | | | |
| Natural Gas, NGLs and Crude Oil Sales | | | | | | | | | | |
Natural gas (2) | $ | 99.6 |
| | $ | 94.6 |
| | $ | 105.4 |
| | 5.3 | % | | (10.2 | )% | $ | 70.8 |
| | $ | 99.6 |
| | $ | 94.6 |
| | (28.9 | )% | | 5.3 | % |
| NGLs | | 23.0 |
| | 27.2 |
| | 22.6 |
| | (15.4 | )% | | 20.4 | % |
| Crude oil | 149.8 |
| | 91.1 |
| | 68.5 |
| | 64.4 | % | | 33.0 | % | 176.5 |
| | 149.8 |
| | 91.1 |
| | 17.8 | % | | 64.4 | % |
| NGLs (2) | 27.2 |
| | 22.6 |
| | — |
| | 20.4 | % | | * |
| |
| Provision for underpayment of natural gas sales | — |
| | (3.3 | ) | | (2.7 | ) | | (100.0 | )% | | 22.2 | % | — |
| | — |
| | (3.3 | ) | | — | % | | (100.0 | )% |
| Total natural gas, NGL and crude oil sales | $ | 276.6 |
| | $ | 205.0 |
| | $ | 171.2 |
| | 34.9 | % | | 19.7 | % | |
| Total natural gas, NGLs and crude oil sales | | $ | 270.3 |
| | $ | 276.6 |
| | $ | 205.0 |
| | (2.3 | )% | | 34.9 | % |
| | | | | | | | | | | | | | | | | | | |
| Realized Gain (Loss) on Derivatives, net (4) | | | | | | | | | | |
| Realized Gain (Losses) on Derivatives, net (3) | | | | | | | | | | |
| Natural gas | $ | 29.1 |
| | $ | 40.0 |
| | $ | 89.4 |
| | (27.3 | )% | | (55.3 | )% | $ | 49.9 |
| | $ | 29.1 |
| | $ | 40.0 |
| | 71.5 | % | | (27.3 | )% |
| Crude oil | (11.9 | ) | | 7.1 |
| | 17.9 |
| | (267.6 | )% | | (60.3 | )% | (0.5 | ) | | (11.9 | ) | | 7.1 |
| | (95.8 | )% | | (267.6 | )% |
| Total realized gain on derivatives, net | $ | 17.2 |
| | $ | 47.1 |
| | $ | 107.3 |
| | (63.5 | )% | | (56.1 | )% | $ | 49.4 |
| | $ | 17.2 |
| | $ | 47.1 |
| | 187.2 | % | | (63.5 | )% |
| | | | | | | | | | | | | | | | | | | |
| Average Sales Price (excluding gain/loss on derivatives) | | | | | | | | | | | | | | | | | | |
| Natural gas (per Mcf) (2) | $ | 3.27 |
| | $ | 3.61 |
| | $ | 3.09 |
| | (9.4 | )% | | 16.8 | % | |
| Natural gas (per Mcf) | | $ | 2.18 |
| | $ | 3.27 |
| | $ | 3.61 |
| | (33.3 | )% | | (9.4 | )% |
| NGLs (per Bbl) | | 27.36 |
| | 37.82 |
| | 39.66 |
| | (27.7 | )% | | (4.6 | )% |
| Crude oil (per Bbl) | 87.63 |
| | 73.96 |
| | 55.07 |
| | 18.5 | % | | 34.3 | % | 87.14 |
| | 87.63 |
| | 73.96 |
| | (0.6 | )% | | 18.5 | % |
| NGLs (per Bbl) (2) | 37.82 |
| | 39.66 |
| | — |
| | (4.6 | )% | | * |
| |
| Natural gas equivalent (per Mcfe) | 6.15 |
| | 5.63 |
| | 4.19 |
| | 9.2 | % | | 34.4 | % | 5.45 |
| | 6.15 |
| | 5.63 |
| | (11.4 | )% | | 9.2 | % |
| | | | | | | | | | | | | | | | | | | |
| Average Sales Price (including realized gain/loss on derivatives) | | | | | | | | | | | | | | | | | | |
| Natural gas (per Mcf) (2) | $ | 4.23 |
| | $ | 5.13 |
| | $ | 5.72 |
| | (17.5 | )% | | (10.3 | )% | |
| Natural gas (per Mcf) | | $ | 3.72 |
| | $ | 4.23 |
| | $ | 5.13 |
| | (12.1 | )% | | (17.5 | )% |
| NGLs (per Bbl) | | 27.36 |
| | 37.82 |
| | 39.66 |
| | (27.7 | )% | | (4.6 | )% |
| Crude oil (per Bbl) | 80.69 |
| | 79.70 |
| | 69.44 |
| | 1.2 | % | | 14.8 | % | 86.87 |
| | 80.69 |
| | 79.70 |
| | 7.7 | % | | 1.2 | % |
| NGLs (per Bbl) (2) | 37.82 |
| | 39.66 |
| | — |
| | (4.6 | )% | | * |
| |
| Natural gas equivalent (per Mcfe) | 6.53 |
| | 6.89 |
| | 6.77 |
| | (5.2 | )% | | 1.8 | % | 6.44 |
| | 6.53 |
| | 6.89 |
| | (1.4 | )% | | (5.2 | )% |
| | | | | | | | | | | | | | | | | | | |
Average Lifting Cost (per Mcfe) (5)(4) | $ | 0.95 |
| | $ | 1.09 |
| | $ | 0.81 |
| | (12.8 | )% | | 34.6 | % | | | | | | | | | |
| Western operating region | | $ | 0.77 |
| | $ | 0.87 |
| | $ | 1.01 |
| | (11.5 | )% | | (13.9 | )% |
| Eastern operating region | | 1.38 |
| | 1.33 |
| | 1.55 |
| | 3.8 | % | | (14.2 | )% |
| Weighted-average | | 0.85 |
| | 0.92 |
| | 1.05 |
| | (7.6 | )% | | (12.4 | )% |
| | | | | | | | | | | | | | | | | | | |
| Natural Gas Marketing Contribution Margin (6) | $ | 0.9 |
| | $ | 1.1 |
| | $ | 2.0 |
| | (18.2 | )% | | (45.0 | )% | |
| Natural Gas Marketing Contribution Margin (5) | | $ | 0.5 |
| | $ | 0.9 |
| | $ | 1.1 |
| | (44.4 | )% | | (18.2 | )% |
| | | | | | | | | | | | | | | | | | | |
| Other Costs and Expenses | | | | | | | | | | | | | | | | | | |
| Exploration expense | $ | 6.3 |
| | $ | 13.7 |
| | $ | 14.1 |
| | (54.0 | )% | | (2.8 | )% | $ | 22.6 |
| | $ | 6.3 |
| | $ | 13.7 |
| | 261.5 | % | | (54.3 | )% |
| Impairment of natural gas and crude oil properties | 25.2 |
| | 6.5 |
| | 5.0 |
| | 287.7 | % | | 30.0 | % | 168.1 |
| | 25.2 |
| | 6.5 |
| | * |
| | 288.2 | % |
| General and administrative expense | 61.5 |
| | 42.2 |
| | 54.0 |
| | 45.7 | % | | (21.9 | )% | 58.8 |
| | 61.5 |
| | 42.2 |
| | (4.3 | )% | | 45.7 | % |
| Depreciation, depletion, and amortization | 128.9 |
| | 108.1 |
| | 126.8 |
| | 19.2 | % | | (14.7 | )% | 146.9 |
| | 128.9 |
| | 108.1 |
| | 13.9 | % | | 19.3 | % |
| | | | | | | | | | | | | | | | | | | |
| Loss on extinguishment of debt | | $ | 23.3 |
| | $ | — |
| | $ | — |
| | 100.0 | % | | — | % |
| Interest Expense | $ | 37.0 |
| | $ | 33.2 |
| | $ | 37.2 |
| | 11.4 | % | | (10.8 | )% | $ | 48.3 |
| | $ | 37.0 |
| | $ | 33.3 |
| | 30.6 | % | | 11.2 | % |
| |
| * | Percentage change is not meaningful or equal to or greater than 300%. |
Amounts may not recalculate due to rounding.
______________
| |
| (1) | Production is net and determined by multiplying the gross production volume of properties in which we have an interest by the percentage interest we own.our ownership percentage. For total production volume, including discontinued operations, see Part I, Item 6, Selected Financial Data included in this report. |
| |
| (2) | Prior to 2010, NGLs were included in natural gas, which impacts the comparability of 2011 and 2010 to 2009. |
| |
(3) | Six Mcf of natural gas equals one Bbl of crude oil or NGL. |
| |
(4)(3) | Represents realized derivative gains and losses related to natural gas, NGLs and crude oil sales, which do not include realized derivative gains and losses related to natural gas marketing. |
related to natural gas marketing.
| |
(5)(4) | Represents lease operating expenses, exclusive of production taxes, on a per unit basis. |
| |
(6)(5) | Represents sales from natural gas marketing, net of costs of natural gas marketing, including realized and unrealized derivative gains and losses related to natural gas marketing activities. |
Natural Gas, NGLNGLs and Crude Oil Sales
The following tables present natural gas, NGLNGLs and crude oil production and averageweighted-average sales price for continuing operations.operations:
| | | | | Year Ended December 31, | | Year Ended December 31, |
| | | | | | | | | Change | | | | | | | | Change |
| Production by Operating Region | | 2011 | | 2010 | | 2009 | | 2011-2010 | | 2010-2009 | | 2012 | | 2011 | | 2010 | | 2012-2011 | | 2011-2010 |
Natural gas (MMcf) (2) | | | | | | | | | | | | | | | | | | | | |
| Western | | 26,004.0 |
| | 23,650.8 |
| | 29,957.4 |
| | 9.9 | % | | (21.1 | )% | | | | | | | | | | |
| Eastern (1) | | 4,389.9 |
| | 2,526.0 |
| | 4,010.5 |
| | 73.8 | % | | (37.0 | )% | |
| Other | | 35.8 |
| | 62.3 |
| | 121.7 |
| | (42.5 | )% | | (48.8 | )% | |
| Wattenberg Field | | | 9,845.2 |
| | 8,980.2 |
| | 7,229.7 |
| | 9.6 | % | | 24.2 | % |
| Piceance Basin (1) | | | 13,226.9 |
| | 13,350.0 |
| | 12,001.5 |
| | (0.9 | )% | | 11.2 | % |
| NECO, other (1) | | | 3,194.3 |
| | 3,709.6 |
| | 4,481.9 |
| | (13.9 | )% | | (17.2 | )% |
| Total Western | | | 26,266.4 |
| | 26,039.8 |
| | 23,713.1 |
| | 0.9 | % | | 9.8 | % |
| Eastern | | | 6,143.4 |
| | 4,389.9 |
| | 2,526.0 |
| | 39.9 | % | | 73.8 | % |
| Total | | 30,429.7 |
| | 26,239.1 |
| | 34,089.6 |
| | 16.0 | % | | (23.0 | )% | | 32,409.8 |
| | 30,429.7 |
| | 26,239.1 |
| | 6.5 | % | | 16.0 | % |
| Crude oil (MBbls) | | | | | | | | | | | | | | | | | | | | |
| Western | | 1,705.1 |
| | 1,224.9 |
| | 1,233.3 |
| | 39.2 | % | | (0.7 | )% | | | | | | | | | | |
| Eastern (1) | | 4.8 |
| | 5.9 |
| | 9.6 |
| | (18.6 | )% | | (38.5 | )% | |
| Other | | — |
| | 0.6 |
| | 1.1 |
| | (100.0 | )% | | (45.5 | )% | |
| Wattenberg Field | | | 1,979.7 |
| | 1,670.9 |
| | 1,190.3 |
| | 18.5 | % | | 40.4 | % |
| Piceance Basin (1) | | | 37.7 |
| | 33.2 |
| | 33.1 |
| | 13.6 | % | | 0.3 | % |
| NECO, other (1) | | | 0.4 |
| | 1.0 |
| | 2.1 |
| | (60.0 | )% | | (52.4 | )% |
| Total Western | | | 2,017.8 |
| | 1,705.1 |
| | 1,225.5 |
| | 18.3 | % | | 39.1 | % |
| Eastern | | | 8.1 |
| | 4.8 |
| | 5.9 |
| | 68.8 | % | | (18.6 | )% |
| Total | | 1,709.9 |
| | 1,231.4 |
| | 1,244.0 |
| | 38.9 | % | | (1.0 | )% | | 2,025.9 |
| | 1,709.9 |
| | 1,231.4 |
| | 18.5 | % | | 38.9 | % |
| NGLs (MBbls) (2) | | | | | | | | | | | |
| NGLs (MBbls) | | | | | | | | | | | |
| Western | | 712.1 |
| | 561.1 |
| | — |
| | 26.9 | % | | * |
| | | | | | | | | | |
| Other | | 7.1 |
| | 8.5 |
| | — |
| | (16.5 | )% | | * |
| |
| Wattenberg Field | | | 837.3 |
| | 712.1 |
| | 561.1 |
| | 17.6 | % | | 26.9 | % |
| NECO, other (1) | | | 4.0 |
| | 7.1 |
| | 8.5 |
| | (43.7 | )% | | (16.5 | )% |
| Total | | 719.2 |
| | 569.6 |
| | — |
| | 26.3 | % | | * |
| | 841.3 |
| | 719.2 |
| | 569.6 |
| | 17.0 | % | | 26.3 | % |
| Natural gas equivalent (MMcfe) | | | | | | | | | | | | | | | | | | | | |
| Western | | 40,505.3 |
| | 34,367.2 |
| | 37,357.0 |
| | 17.9 | % | | (8.0 | )% | | | | | | | | | | |
| Eastern (1) | | 4,418.9 |
| | 2,561.4 |
| | 4,068.1 |
| | 72.5 | % | | (37.0 | )% | |
| Other | | 80.6 |
| | 116.3 |
| | 128.3 |
| | (30.7 | )% | | (9.4 | )% | |
| Wattenberg Field | | | 26,747.0 |
| | 23,278.4 |
| | 17,738.4 |
| | 14.9 | % | | 31.2 | % |
| Piceance Basin (1) | | | 13,453.1 |
| | 13,549.3 |
| | 12,199.9 |
| | (0.7 | )% | | 11.1 | % |
| NECO, other (1) | | | 3,220.1 |
| | 3,758.2 |
| | 4,545.2 |
| | (14.3 | )% | | (17.3 | )% |
| Total Western | | | 43,420.2 |
| | 40,585.9 |
| | 34,483.5 |
| | 7.0 | % | | 17.7 | % |
| Eastern | | | 6,192.2 |
| | 4,418.9 |
| | 2,561.4 |
| | 40.1 | % | | 72.5 | % |
| Total | | 45,004.8 |
| | 37,044.9 |
| | 41,553.4 |
| | 21.5 | % | | (10.8 | )% | | 49,612.4 |
| | 45,004.8 |
| | 37,044.9 |
| | 10.2 | % | | 21.5 | % |
| | | | | | | | | | | | | | | | | | | | | |
| |
* | Percentage change is not meaningful or equal to or greater than 300%. |
Amounts may not recalculate due to rounding.
________________________
| |
| (1) | For 2010, the decrease in production was primarily the result ofOn February 4, 2013, we entered into a purchase and sale agreement pursuant to which we have agreed to sell our contribution of naturalPiceance Basin, NECO and certain non-core Colorado oil and gas and crude oil properties to PDCM. Effective January 1, 2010, PDCM was deconsolidated and accounted for in accordance with the proportionate consolidation method.properties. See Note 1, Nature of Operations and Basis of Presentation,19, Subsequent Events, to our consolidated financial statements included elsewhere in this report. |
| |
(2) | Prior to 2010, NGLs were includedreport for additional information regarding the planned divestiture. There can be no assurance we will be successful in natural gas, which impacts the comparability of 2011 and 2010 to 2009.closing such divestiture. |
| | | | | Year Ended December 31, | | Year Ended December 31, |
| Average Sales Price by Operating Region | | | | | | | | Change | | | | | | | | Change |
| (excluding gain/loss on derivatives) | | 2011 | | 2010 | | 2009 | | 2011-2010 | | 2010-2009 | | 2012 | | 2011 | | 2010 | | 2012-2011 | | 2011-2010 |
Natural gas (per Mcf) (1) | | | | | | | | | | | | | | | | | | | | |
| Western | | $ | 3.12 |
| | $ | 3.52 |
| | $ | 2.97 |
| | (11.4 | )% | | 18.5 | % | | | | | | | | | | |
| Wattenberg Field | | | $ | 2.61 |
| | $ | 3.52 |
| | $ | 3.70 |
| | (25.9 | )% | | (4.9 | )% |
| Piceance Basin (1) | | | 1.67 |
| | 2.82 |
| | 3.38 |
| | (40.8 | )% | | (16.6 | )% |
| NECO, other (1) | | | 2.08 |
| | 3.26 |
| | 3.60 |
| | (36.2 | )% | | (9.4 | )% |
| Western | | | 2.07 |
| | 3.12 |
| | 3.52 |
| | (33.7 | )% | | (11.4 | )% |
| Eastern | | 4.15 |
| | 4.44 |
| | 4.00 |
| | (6.5 | )% | | 11.0 | % | | 2.66 |
| | 4.15 |
| | 4.44 |
| | (35.9 | )% | | (6.5 | )% |
| Other | | 4.01 |
| | 2.49 |
| | 2.40 |
| | 61.0 | % | | 3.8 | % | |
| Weighted average price | | 3.27 |
| | 3.61 |
| | 3.09 |
| | (9.4 | )% | | 16.8 | % | |
| Weighted-average price | | | 2.18 |
| | 3.27 |
| | 3.61 |
| | (33.3 | )% | | (9.4 | )% |
| Crude oil (per Bbl) | | | | | | | | | | | | | | | | | | | | |
| Western | | 87.63 |
| | 73.95 |
| | 55.06 |
| | 18.5 | % | | 34.3 | % | | | | | | | | | | |
| Wattenberg Field | | | 87.27 |
| | 87.93 |
| | 74.46 |
| | (0.8 | )% | | 18.1 | % |
| Piceance Basin (1) | | | 80.20 |
| | 78.50 |
| | 56.60 |
| | 2.2 | % | | 38.7 | % |
| NECO, other (1) | | | 83.80 |
| | (95.33 | ) | | 40.23 |
| | (187.9 | )% | | (337.0 | )% |
| Western | | | 87.14 |
| | 87.63 |
| | 73.95 |
| | (0.6 | )% | | 18.5 | % |
| Eastern | | 87.09 |
| | 77.10 |
| | 57.24 |
| | 13.0 | % | | 34.7 | % | | 86.43 |
| | 87.09 |
| | 77.10 |
| | (0.8 | )% | | 13.0 | % |
| Other | | — |
| | 62.68 |
| | 40.62 |
| | * |
| | 54.3 | % | |
| Weighted average price | | 87.63 |
| | 73.96 |
| | 55.07 |
| | 18.5 | % | | 34.3 | % | |
| NGLs (per Bbl) (1) | | | | | | | | | | | |
| Weighted-average price | | | 87.14 |
| | 87.63 |
| | 73.96 |
| | (0.6 | )% | | 18.5 | % |
| NGLs (per Bbl) | | | | | | | | | | | |
| Western | | 37.69 |
| | 39.56 |
| | — |
| | (4.7 | )% | | * |
| | | | | | | | | | |
| Other | | 50.30 |
| | 46.29 |
| | — |
| | 8.7 | % | | * |
| |
| Weighted average price | | 37.82 |
| | 39.66 |
| | — |
| | (4.6 | )% | | * |
| |
| Wattenberg Field | | | 27.33 |
| | 37.62 |
| | 39.56 |
| | (27.4 | )% | | (4.9 | )% |
| NECO, other (1) | | | 32.80 |
| | 58.07 |
| | 46.29 |
| | (43.5 | )% | | 25.4 | % |
| Weighted-average price | | | 27.36 |
| | 37.82 |
| | 39.66 |
| | (27.7 | )% | | (4.6 | )% |
| Natural gas equivalent (per Mcfe) | | | | | | | | | | | | | | | | | | | | |
| Western | | 6.35 |
| | 5.71 |
| | 4.20 |
| | 11.2 | % | | 36.0 | % | | | | | | | | | | |
| Wattenberg Field | | | 8.27 |
| | 8.82 |
| | 7.81 |
| | (6.2 | )% | | 12.9 | % |
| Piceance Basin (1) | | | 1.87 |
| | 2.97 |
| | 3.40 |
| | (37.0 | )% | | (12.6 | )% |
| NECO, other (1) | | | 2.12 |
| | 3.30 |
| | 3.65 |
| | (35.8 | )% | | (9.6 | )% |
| Western | | | 5.83 |
| | 6.35 |
| | 5.71 |
| | (8.2 | )% | | 11.2 | % |
| Eastern | | 4.22 |
| | 4.55 |
| | 4.08 |
| | (7.3 | )% | | 11.5 | % | | 2.76 |
| | 4.22 |
| | 4.55 |
| | (34.6 | )% | | (7.3 | )% |
| Other | | 7.14 |
| | 4.99 |
| | 2.62 |
| | 43.1 | % | | 90.5 | % | |
| Weighted average price | | 6.15 |
| | 5.63 |
| | 4.19 |
| | 9.2 | % | | 34.4 | % | |
| Weighted-average price | | | 5.45 |
| | 6.15 |
| | 5.63 |
| | (11.4 | )% | | 9.2 | % |
| |
* | Percentage change is not meaningful or equal to or greater than 300%. |
Amounts may not recalculate due to rounding.
__________
| |
(1) | Prior to 2010, NGLs were included in natural gas, which impacts the comparability of 2011 and 2010 to 2009. |
The year-over-year change in natural gas, NGLNGLs and crude oil sales revenue were primarily due to the following:
|
| | | | | | | | | | | |
| | Year Ended December 31, |
| | 2011 | | 2010 | | 2009 |
| | (in millions) |
| Increase (decrease) in production | $ | 56.4 |
| | $ | (25.0 | ) | | $ | 37.1 |
|
| Increase (decrease) in average crude oil price | 23.4 |
| | 23.3 |
| | (43.0 | ) |
| Increase (decrease) in average NGL price (1) | (1.3 | ) | | 22.6 |
| | — |
|
| Increase (decrease) in average natural gas price | (10.2 | ) | | 13.5 |
| | (129.1 | ) |
| Decrease (increase) in provision for underpayment of natural gas sales | 3.3 |
| | (0.6 | ) | | 1.3 |
|
| Total increase (decrease) in natural gas, NGL and crude oil sales revenue | $ | 71.6 |
| | $ | 33.8 |
| | $ | (133.7 | ) |
|
| | | | | | | |
| | Year Ended December 31, |
| | 2012 | | 2011 |
| | (in millions) |
| Increase in production | $ | 38.8 |
| | $ | 56.4 |
|
| Decrease in average natural gas price | (35.3 | ) | | (10.2 | ) |
| Decrease in average NGL price | (8.8 | ) | | (1.3 | ) |
| Increase (decrease) in average crude oil price | (1.0 | ) | | 23.4 |
|
| Decrease in provision for underpayment of natural gas sales | — |
| | 3.3 |
|
| Total increase (decrease) in natural gas, NGLs and crude oil sales revenue | $ | (6.3 | ) | | $ | 71.6 |
|
__________
| |
(1) | Prior to 2010, NGLs were included in natural gas, which impacts the comparability of 2011 and 2010 to 2009. |
Natural gas, NGLNGLs and crude oil sales revenue in 2011 increased2012 decreased 34.9%2.3% compared to 2010.2011. The increasedecrease was primarily dueattributable to the 33.3% and 27.7% declines in the average price of natural gas and NGLs, respectively, during 2012. The decrease was offset in part by significantly higher volumes sold, in particular liquids, which shifted our liquids to natural gas ratiopercentage of total production to approximately 32/6834.7% in 20112012 compared to 29/7132.4% in 2010 and a higher average sales price of crude oil. The shift in production mix favoring liquids allowed us to benefit from the higher average sales price of crude oil compared to natural gas.
2011. Our average daily sales volumes increased to 135.6 MMcfe per day in 2012 compared to 123.3 MMcfe per day in 2011, primarily due to the success of the horizontal Niobrara and Codell drilling program in the Wattenberg Field and the Merit Acquisition. For December 2012, our average production exit rate from continuing operations was 143 MMcfe per day compared to 101.5139 MMcfe per day in December 2011.
The increase in 2011 production compared to 2010 primarily duewas directly attributable to an increase in production in our Western Operating Region of 16.8 MMcfe per day as a result of increased drilling in the Wattenberg field, as well as a 5.1 MMcfe per day increase in production in our Eastern Operating Region associated with our Marcellus wells. The 2011 increase in production was directly attributable to our decision to increase our capital expenditures for new wells drilled in 2010 and 2011 and switching a majority of our drilling program from vertical to horizontal wells in the Niobrara formation and Marcellus Shale. For December 2011, our average production exit rate was 146 MMcfe per day compared to 109 MMcfe per day in December 2010 and 98 MMcfe per day in December 2009.
The decrease in 2010 production compared to 2009 was directly attributable to our decision to reduce our capital expenditures for new wells drilled in 2009 due to the decline in commodity prices from the second half of 2008 to 2009 and the uncertainty in the financial and commodity markets. The decrease in production was offset in part by our decision to report NGLs separately from natural gas volumes as
these amounts are expected to become more significant as we concentrate our drilling and acquisition spending toward more liquid rich resources as well as to enhance comparability among our peers, which resulted in the recognition of approximately 1.8Bcfe of additional production.
Natural Gas, NGLs and Crude Oil Pricing. Our results of operations depend upon many factors, particularly the price of natural gas, NGLs and crude oil and our ability to market our production effectively. Natural gas, NGLs and crude oil prices are among the most volatile of all commodity prices. These price variations have a material impact on our financial results and capital expenditures.
Natural gas prices vary by region and locality, depending upon the distance to markets, the availability of pipeline capacity and the supply and demand relationships in that region or locality. The combination of increased drilling activity and the lack ofcurtailments due to limited capacity on local markets hasgathering and processing infrastructure resulted in local market oversupply situations from time to time.capacity constraints during the second and third quarters of 2012, primarily in our Wattenberg Field. Like most producers, we rely on major interstate pipeline companies to construct these pipelines to increase capacity, rendering the timing and availability of these facilities beyond our control. Crude oil pricingThe price we receive for our natural gas is predominately drivenimpacted by our transportation, gathering and processing agreements. We currently use the "net-back" method of accounting for these arrangements related to our natural gas sales. We sell natural gas at the wellhead and collect a price and recognize revenues based on the wellhead sales price since transportation costs downstream of the wellhead are incurred by the physical market, supplypurchaser and demand,reflected in the financial markets and national and international politics.wellhead price. The net-back method results in the recognition of a sales price that is below the indices for which the production is based.
The price we receive for our natural gas produced in our Western Operating Region is based on a market basket of prices, which generally includes natural gas sold at, near or below CIGColorado Interstate Gas ("CIG") prices, as well as other nearby regionregional prices. The CIG Index, and other indicesIn September 2012, we renegotiated our marketing agreement for production deliveredour natural gas in the Piceance Basin, which added approximately $0.40 per MMbtu to other western area pipelines, has historically been less thanour Piceance natural gas price realization, effective with November 1 production. We have experienced a decline in the price receivedof NGLs, mainly at Conway hub in Kansas where our Wattenberg production is marketed. This is primarily due to the increase in ethane and propane volumes flowing to Conway with a limited market for natural gas produced inthese products out of the eastern regions, whicharea. Crude oil pricing is NYMEX-based. This negativepredominately driven by the physical market, supply and demand, the financial markets and national and international politics. The majority of our crude oil is sold on a calendar-year basis at a fixed differential has narrowed over the last few years and is lower than historical variances. The negative differential betweento NYMEX and CIG averaged $0.25, $0.47 and $0.92 in 2011, 2010 and 2009, respectively.pricing.
Production Costs. Costs
Production costs include our lease operating expenses, production taxes the costand certain production and engineering staff-related overhead costs, as well as other costs to operate wells and pipelines and certain production and engineering staff related overhead costs.as follows:
| | | | Year Ended December 31, | Year Ended December 31, |
| | 2011 | | 2010 | | 2009 | 2012 | | 2011 | | 2010 |
| | (in millions) | (in millions) |
| | | | | | | | | | | |
Lease operating expenses | $ | 43.0 |
| | $ | 40.2 |
| | $ | 33.8 |
| $ | 42.2 |
| | $ | 41.3 |
| | $ | 38.9 |
|
| Production taxes | 17.5 |
| | 11.7 |
| | 8.8 |
| 16.1 |
| | 17.5 |
| | 11.7 |
|
| Costs of well operations and pipeline services | 6.1 |
| | 7.4 |
| | 6.8 |
| |
| Overhead and other production expenses | 2.5 |
| | 5.6 |
| | 12.7 |
| |
Cost of well operations, overhead and other production expenses
| | 17.2 |
| | 8.6 |
| | 13.0 |
|
| Total production costs | $ | 69.1 |
| | $ | 64.9 |
| | $ | 62.1 |
| $ | 75.5 |
| | $ | 67.4 |
| | $ | 63.6 |
|
| Total production costs per Mcfe | $ | 1.54 |
| | $ | 1.75 |
| | $ | 1.49 |
| $ | 1.52 |
| | $ | 1.50 |
| | $ | 1.72 |
|
| | | | | | | | | | | |
______________
| |
| (1) | Prior to 2012, accretion of asset retirement obligations was included in lease operating expenses. In 2012, accretion of asset retirement obligations was reclassified as its own line item in the statement of operations. The amounts reclassified from lease operating expenses for 2011 and 2010 were $1.7 million and $1.3 million, respectively. |
Lease operating expenses.Lifting costs per Mcfe were $0.85, $0.92 and $1.05 for 2012, 2011 and 2010, respectively. The 7.6% decrease in lifting costs per Mcfe in 2012 from 2011 was primarily due to an increase in production, which resulted in the non-production-based portion of our lease operating expenses being spread across an increased number of units. The increase in lease operating expenses in 2012 compared to 2011 was primarily related to the 10.2% increase in production, including an increase in production-related expenses in the amount of $6.7 million mostly related to the Merit Acquisition and the Seneca-Upshur acquisition, offset by a decrease in environmental compliance costs of $3.2 million due to the completion of many environmental projects during 2011 and a decrease in workover expense of $2.5 million due to a reduction in the amount of workover projects completed in 2012 compared to 2011. The increase in lease operating expenses in 2011 compared to 2010 was primarily related to the 21.5% increase in production, offset in part by a decrease in saltwater disposal and water hauling expenses of $1.9 million following the completion of our saltwater disposal facility in the Piceance Basin. Lifting costs per Mcfe were $0.95, $1.09 and $0.81 for 2011, 2010 and 2009, respectively. The 12.8% decrease in lifting costs per Mcfe in 2011 from 2010 was primarily due to increases in production, which resulted in the non-production based portion of our lease operating expenses being spread across an increased number of units. Our non-production based expenses, like well workovers, environmental and other fixed expenses, were relatively consistent in 2011, even with the increase in production. The 34.6% increase per Mcfe in 2010 from 2009 was in part due to the 10.8% decrease in production volumes compared to volumes produced in 2009, resulting in the non-production based portion of our production costs being allocated to a decreased number of units. Additionally, a large component of the increase in our 2010 lease operating expenses, as well as the per Mcfe cost, were well workovers, which includeincluding an increase in tubingproduction-related expenses of $2.4 million mostly related to the Seneca-Upshur acquisition and casing repairs of $4.7 million and environmental remediation charges of $2.7 million.other production-related expenses.
Production taxes.Production taxes fluctuate with natural gas, NGLNGLs and crude oil sales. The $5.8$1.4 million, or 8%, decrease in production taxes for 2012 compared to 2011 is primarily related to a combination of lower total natural gas and NGL sales and, to a lesser extent, a change in the production tax rate due to a change in the mix of production locations. The $5.8 million, or 49.6%, increase in production taxes for 2011
compared to 2010 was primarily related to the 34.9% increase in natural gas, NGLNGLs and crude oil sales and, to a lesser extent, higher ad valorem rates in certain Colorado counties. The $2.9
Overhead and other production expenses. Overhead and other production expenses increased $8.6 million or 33% increase in production taxes for 20102012 compared to 2009 was primarily related to2011. The increase consisted of a $3.2 million oil inventory expense in 2012 associated with the 19.7% increase in sales revenuesMerit Acquisition and an increase of $3.0 million of prepaid well costs charged to expense in ad valorem tax rates for certain Colorado counties.
Costs2012 as a result of well operationschanges in our capital spending plan. In July 2011, we signed an amended firm transportation agreement which resulted in the reversal of the $3.1 million liability accrued in 2010 related to an expected volume shortfall. The reversal of this accrued liability resulted in a reduction in overhead and pipeline services. other production expenses in 2011 when comparing 2011 to 2012 and 2010. The remaining decrease in costs of well operationsoverhead and pipeline servicesother production expenses in 2011 compared to 2010 was the result of our acquisition of 12 affiliated partnerships, resultingrelated to reductions in lower costs incurred for the wells and pipeline systems we operate on behalf of our affiliated partnerships and other third parties. The increases in these costs in 2010 compared to 2009 was theparties as a result of costs related to pipeline systems and compressor maintenance projects, offset in part by lower field services costs.our acquisition of 12 affiliated partnerships.
Overhead and other production expenses. Overhead and other production expenses decreased $3.1 million in 2011 compared to 2010. The decrease was primarily due to a July 2011 amendment to a firm transportation agreement and the corresponding reversal of a $3.1 million accrued liability related to an expected volume shortfall. The decrease in 2010 compared to 2009 was primarily due to the deconsolidation of PDCM with the remaining decrease resulting from reductions in various other expenses, including a $2.7 million accrual recognized in 2009 for an expected firm transportation volume shortfall in our Piceance Basin.
Commodity Price Risk Management, Net
Commodity price risk management, net, includes realized gains and losses and unrealized changes in the fair value of derivative instruments related to our natural gas and crude oil production. Commodity price risk management, net, does not include derivative transactions related to our natural gas marketing, which are included in sales from and cost of natural gas marketing. See Note 3, Fair Value of Financial Instruments, and Note 4, Derivative Financial Instruments, to our consolidated financial statements included elsewhere in this report for additional details of our derivative financial instruments.
The following table presents the realized and unrealized derivative gains and losses included in commodity price risk management, net.net:
| | | | Year Ended December 31, | Year Ended December 31, |
| | 2011 | | 2010 | | 2009 | 2012 | | 2011 | | 2010 |
| | (in millions) | (in millions) |
| Commodity price risk management gain (loss), net: | | | | | | | | | | |
| Realized gains (losses): | | | | | | | | | | |
| Natural gas | $ | 29.1 |
| | $ | 40.0 |
| | $ | 89.4 |
| $ | 49.9 |
| | $ | 29.1 |
| | $ | 40.0 |
|
| Crude oil | (11.9 | ) | | 7.1 |
| | 17.9 |
| (0.5 | ) | | (11.9 | ) | | 7.1 |
|
| Total realized gains, net | 17.2 |
| | 47.1 |
| | 107.3 |
| 49.4 |
| | 17.2 |
| | 47.1 |
|
| Unrealized gains (losses): | | | | | | | | | | |
| Reclassification of realized gains included in prior periods unrealized | (10.3 | ) | | (20.1 | ) | | (84.7 | ) | (28.8 | ) | | (10.3 | ) | | (20.1 | ) |
| Unrealized gains (losses) for the period | 39.2 |
| | 32.9 |
| | (32.7 | ) | |
| Unrealized gains for the period | | 11.7 |
| | 39.2 |
| | 32.9 |
|
| Total unrealized gains (losses), net | 28.9 |
| | 12.8 |
| | (117.4 | ) | (17.1 | ) | | 28.9 |
| | 12.8 |
|
| Total commodity price risk management gain (loss), net | $ | 46.1 |
| | $ | 59.9 |
| | $ | (10.1 | ) | |
| Total commodity price risk management gain, net | | $ | 32.3 |
| | $ | 46.1 |
| | $ | 59.9 |
|
| | | | | | | | | | | |
Realized gains recognized in 20112012 are primarily the result of lower natural gas prices at settlement compared to the respective strike price of our natural gas derivative positions. Realized gains on natural gas, exclusive of basis swaps, were $44.0$66.5 million reflective of a weighted averageweighted-average strike price of $6.25$5.36 compared to a weighted averageweighted-average settlement price of $4.19.$2.86. These gains were offset in part by realized losses of $14.9$16.6 million on our basis swap positions as the negative basis differential between NYMEX and CIG was a weighted averageweighted-average of $0.25$0.21 compared to a weighted averageweighted-average strike price of $1.83.$1.82. The realized gains on natural gas derivative positions in 20112012 were offset in part by realized losses on our crude oil positions as a result of higher prices at settlement compared to the respective strike price of our derivative positions. For 2011,2012, the realized losses were reflective of a weighted averageweighted-average strike price of $80.80$93.33 compared to a weighted averageweighted-average settlement price of $94.68.$93.72.
Unrealized gains in 20112012 were primarily related to the downward shift in the crude oil and natural gas forward curve and its impact on the fair value of our open positions, offset in part by the upward shift in the crude oil forward curve and the narrowing of the CIG basis forward curve. During 2011,2012, unrealized gains on our crude oil and natural gas positions were $46.1$9.4 million and $2.9 million, respectively, offset slightly by unrealized losses on our crude oil positions and CIG basis swaps of $3.9 million and $3 million, respectively.$0.6 million.
Realized gains recognized in 2011 were mainly the result of lower natural gas prices at settlement compared to the respective strike price, resulting in a $44 million realized gain on our natural gas derivatives. These realized gains were offset in part by realized losses of $14.9 million on our basis swap positions and realized losses on our crude oil positions. During 2011, we recorded unrealized gains of $46.1 million on our natural gas positions offset in part by unrealized losses of $3.9 million on our crude oil positions and $3 million on our CIG basis swaps as the forward basis differential between NYMEX and CIG had continued to narrow.
During 2010, realized gains recognized were the result of lower natural gas and crude oil prices at settlement compared to the respective strike price, offset in part by a $12.1 million realized loss due to the negative basis differential between NYMEX and CIG being narrower than the strike price of our derivative position. During 2010, we recorded unrealized gains of $47.3 million on our natural gas positions offset in part by unrealized losses of $10.6 million on our crude oil positions and $3.8 million on our CIG basis swaps as the forward basis differential between NYMEX and CIG had continued to narrow.
During 2009, realized gains recognized were the result of lower natural gas and crude oil prices at settlement compared to the respective strike price. We recorded unrealized losses on our CIG basis swaps of $33.9 million as the forward basis differential between NYMEX and CIG had continued to narrow along with unrealized losses of $15 million on our crude oil positions, offset by unrealized gains of $16.2 million on our natural gas positions.
We use various derivative instruments to manage fluctuations in natural gas and crude oil prices. We have in place a variety of floors, collars, fixed-price swaps and basis swaps on a portion of our estimated natural gas and crude oil production. Because we sell all of our physical natural gas and crude oil at prices similar to the indexes inherent in our derivative instruments, adjusted for certain fees and surcharges stipulated in the applicable sales agreements, we ultimately realize a price related to our collars of no less than the floor and no more than the ceiling and, for our commodity swaps, we ultimately realize the fixed price related to our swaps. See Note 4, Derivative Financial Instruments, to our consolidated financial statements included elsewhere in this report and Item 7A, Quantitative and Qualitative Disclosures About Market Risk, for a discussion of how each derivative type impacts our cash flows and a detailed presentation of our derivative positions as of December 31, 2011.2012.
Natural Gas Marketing
Fluctuations in our natural gas marketing's income contribution are primarily due to fluctuations in commodity prices and realized and unrealized, mark-to-market adjustments, gains and losses on open derivative positions, and, to a lesser extent, volumes sold and purchased.
The following table presents the components of sales from and costs of natural gas marketing.marketing:
| | | | Year Ended December 31, | Year Ended December 31, |
| | 2011 | | 2010 | | 2009 | 2012 | | 2011 | | 2010 |
| | (in millions) | (in millions) |
| Natural gas sales revenue | $ | 63.6 |
| | $ | 63.3 |
| | $ | 54.6 |
| $ | 46.6 |
| | $ | 63.6 |
| | $ | 63.3 |
|
| Realized derivative gains, net | 3.0 |
| | 6.4 |
| | 8.5 |
| 2.2 |
| | 3.0 |
| | 6.4 |
|
| Unrealized derivative losses, net | (0.2 | ) | | (0.6 | ) | | (3.5 | ) | (1.7 | ) | | (0.2 | ) | | (0.6 | ) |
| Total sales from natural gas marketing | 66.4 |
| | 69.1 |
| | 59.6 |
| 47.1 |
| | 66.4 |
| | 69.1 |
|
| | | | | | | | | | | |
| Costs of natural gas purchases | 61.6 |
| | 61.4 |
| | 52.0 |
| 44.8 |
| | 61.6 |
| | 61.4 |
|
| Realized derivative losses, net | 2.6 |
| | 5.9 |
| | 8.8 |
| 2.0 |
| | 2.6 |
| | 5.9 |
|
| Unrealized derivative losses (gains), net | 0.1 |
| | (0.5 | ) | | (4.3 | ) | (1.6 | ) | | 0.1 |
| | (0.5 | ) |
| Other | 1.2 |
| | 1.2 |
| | 1.1 |
| 1.4 |
| | 1.2 |
| | 1.2 |
|
| Total costs of natural gas marketing | 65.5 |
| | 68.0 |
| | 57.6 |
| 46.6 |
| | 65.5 |
| | 68.0 |
|
| | | | | | | | | | | |
| Natural gas marketing contribution margin | $ | 0.9 |
| | $ | 1.1 |
| | $ | 2.0 |
| $ | 0.5 |
| | $ | 0.9 |
| | $ | 1.1 |
|
| | | | | | | | | | | |
The decrease in natural gas sales revenue and costs of natural gas purchases in 2012 compared to 2011 is primarily attributable to a 34% decrease in the average natural gas price, offset in part by a 10% increase in volumes. The increase in natural gas sales revenue and costs of natural gas purchases in 2011 compared to 2010 is primarily attributable to a 9% increase in volumes, offset in part by an 8% decrease in the average natural gas price.
Derivative instruments related to natural gas marketing include both physical and cash-settled derivatives. We offer fixed-price derivative contracts for the purchase or sale of physical natural gas and enter into cash-settled derivative positions with counterparties in order to offset those same physical positions. See Note 4, Derivative Financial Instruments, to our consolidated financial statements included elsewhere in this report and Item 7A, Quantitative and Qualitative Disclosures About Market Risk, for a discussion of how each derivative type impacts our cash flows and detailed presentation of our derivative positions as of December 31, 2011.2012
Other Costs and Expenses.
Exploration Expense
The following table presents the major components of exploration expense.expense:
| | | | | Year Ended December 31, | | Year Ended December 31, |
| | | 2011 | | 2010 | | 2009 | | 2012 | | 2011 | | 2010 |
| | | (in millions) | | (in millions) |
| | | | | | | | | | | | | |
| Exploratory dry hole costs | | $ | 0.2 |
| | $ | 4.2 |
| | $ | 1.1 |
| | $ | 15.3 |
| | $ | 0.2 |
| | $ | 4.2 |
|
| Geological and geophysical costs | | 1.8 |
| | 2.3 |
| | 1.8 |
| | 1.9 |
| | 1.8 |
| | 2.3 |
|
| Operating, personnel and other | | 4.3 |
| | 7.2 |
| | 11.2 |
| | 5.4 |
| | 4.3 |
| | 7.2 |
|
| Total exploration expense | | $ | 6.3 |
| | $ | 13.7 |
| | $ | 14.1 |
| | $ | 22.6 |
| | $ | 6.3 |
| | $ | 13.7 |
|
| | | | | | | | | | | | | |
Exploratory dry hole costscosts. .In 2012, two vertical stratigraphic test wells in eastern Ohio were expensed at a cost of $12.2 million. Additionally, three wells in south central Ohio and a well in southeast Colorado were determined to have found noncommercial quantities of
hydrocarbons and were expensed at a cost of $1.2 million and $0.9 million, respectively. In 2010, exploratory dry hole costs included the fracturing and testing of several exploratory zones on a well drilled in the Piceance Basin and a crude oil well drilled in the NECOnorth eastern Colorado area.
Operating, personnel and other. The $1.1 million increase in 2012 compared to 2011 is mainly attributable to a $2 million increase in payroll and employee benefits in the exploration division as a result of increased employee headcount in the Utica Shale, offset in part by a $0.7 million decrease in PDCM's lease prospecting costs. The decrease in operating, personnel and other in 2011 compared to 2010 was primarily related to a $3.9 million reduction in personnel costs resulting from the reassignment of former exploration department personnel during the first quarter of 2011 to development drilling or administrative activities, offset in part by a $1.1 million increase in PDCM's lease prospecting costs. In 2009, operating, personnel and other included $3.7 million for demobilization of our drilling operations in the Piceance Basin.
Impairment of Natural Gas and Crude Oil Properties
The following table sets forth the major components of our impairments of natural gas and crude oil properties expense.expense:
| | | | | Year Ended December 31, | | Year Ended December 31, |
| | | 2011 | | 2010 | | 2009 | | 2012 | | 2011 | | 2010 |
| | | (in millions) | | (in millions) |
| | | | | | | | | | | | | |
| Impairment of proved properties | | $ | 22.5 |
| | $ | — |
| | $ | 0.9 |
| | $ | 161.2 |
| | $ | 22.5 |
| | $ | — |
|
| Impairment of individually significant unproved properties | | 1.6 |
| | 1.5 |
| | 1.0 |
| | 1.9 |
| | 1.1 |
| | 1.5 |
|
| Amortization of individually insignificant unproved properties | | 1.1 |
| | 5.0 |
| | 3.1 |
| | 5.0 |
| | 1.6 |
| | 5.0 |
|
| Total impairment of natural gas and crude oil properties | | $ | 25.2 |
| | $ | 6.5 |
| | $ | 5.0 |
| | $ | 168.1 |
| | $ | 25.2 |
| | $ | 6.5 |
|
| | | | | | | | | | | | | |
Impairment of proved properties.In December 2012, we recognized an impairment charge of $161.2 million associated with our Piceance Basin proved oil and natural gas properties. The assets were determined to be impaired as the estimated undiscounted future net cash flows were less than the carrying value of the assets. The fair value for determining the amount of the impairment charge was based on estimated future cash flows from unrelated third-party bids, a Level 3 input, as we changed our development plans in the basin and decided to sell the related assets. See Note 19, Subsequent Events, to our consolidated financial statements included elsewhere in this report for additional information regarding our planned divestiture of our Piceance Basin and other crude oil and natural gas properties. There can be no assurance that this transaction will close as planned. In 2011, we recognized an impairment losscharge of $22.5 million related to our NECO assets. During the fourth quarter of 2011, the assets were classified as held for sale, resulting in an impairment charge to reduce the carrying value of the assets to estimated fair value. See Note 2, Summary of Significant Accounting Policies - Properties and Equipment, Proved Property Impairment, to our consolidated financial statements included in this report.
Amortization of individually insignificant unproved properties. The increase in amortization of individually insignificant unproved properties in 2010 was primarily due to our lack of drilling in the NECO area and the Pennsylvania portion of our Eastern Operating Region.
General and Administrative Expense
General and administrative expense for 2012 decreased by $2.6 million, or 4.3%, compared to 2011. The decrease is mainly attributable to a $6.7 million charge recognized in 2011 related to the separation agreement with our former chief executive officer, a $1.6 million charge to legal fees recorded in 2011 related to the settlement agreement reached with regard to our West Virginia royalty lawsuit and a $1.6 million decrease in professional and consulting fees during 2012. These decreases were offset in part by an increase in payroll and employee benefits of $7.5 million in 2012.
General and administrative expense for 2011 increased by $19.3 million, or 45.7%, compared to 2010. The increase was primarily due to an increase in payroll and payroll-related expense of $13.8 million, of which $7.1$6.7 million was related to a separation agreement with a former chief executive officer and other associated transition expenses.officer. The increase in payroll and payroll-related expenses was also impacted by the reassignment of former exploration department personnel contributing $3.7 million to the increase, with the remaining increase in payroll and payroll-related expenses being attributable to new hires and an overall increase in employee benefits. Also contributing to the increase was a $1.6 million charge related to the settlement reached with regard to our West VirginaVirginia royalty lawsuit.
General and administrative expense decreased $11.8 million in 2010 compared to 2009. The decrease was primarily related to charges recorded during the prior year period: $7.9 million related to the formation of PDCM, $2.9 million related to a separation agreement with a former executive vice president, $1.5 million related to the expensing of previously capitalized 2008 acquisition costs pursuant to the adoption of a new accounting standard and $1.3 million related to corporate relocation costs. The 2010 decrease was offset in part by an increase in payroll and payroll related expenses during 2010.
Depreciation, Depletion and Amortization
Natural gas and crude oil properties. Depreciation, Depletion and Amortization ("DD&A&A") expense related to natural gas and crude oil properties is directly related to proved reserves and production volumes. DD&A related to natural gas and crude oil properties was $139.4 million in 2012 compared to $122.2 million in 2011. The increase in 2012 compared to 2011 was comprised of $12.5 million due to higher production and $4.7 million due to a higher weighted-average depreciation, depletion and amortization rate.
The following table presents our DD&A rates for natural gas and crude oil properties.properties:
| |
| | Year Ended December 31, | | Year Ended December 31, |
| Operating Region/Area | | 2011 |
| 2010 |
| 2009 | | 2012 | | 2011 | | 2010 |
| | (per Mcfe) | | (per Mcfe) |
| Western | |
|
|
|
|
| | | | | | |
Wattenberg Field (1) | | $ | 3.21 |
|
| $ | 3.08 |
|
| $ | 3.81 |
| | $ | 3.07 |
| | $ | 3.21 |
| | $ | 3.08 |
|
| Piceance Basin | | 2.53 |
|
| 2.49 |
|
| 2.35 |
| | 3.12 |
| | 2.53 |
| | 2.49 |
|
| Weighted average Western | | 2.80 |
|
| 2.72 |
|
| 2.92 |
| |
| Weighted-average Western | | | 2.94 |
| | 2.80 |
| | 2.72 |
|
| Eastern | | 2.00 |
|
| 2.57 |
|
| 2.06 |
| | 1.93 |
| | 2.00 |
| | 2.57 |
|
| Total weighted average | | 2.72 |
|
| 2.71 |
|
| 2.85 |
| |
| Total weighted-average | | | 2.81 |
| | 2.72 |
| | 2.71 |
|
__________
| |
(1) | Although the Wattenberg Field development costs and DD&A rates are higher than the other fields, the relative value of its liquids production currently more than offsets this cost difference. |
Non-natural gas and crude oil properties. Depreciation expense for non-natural gas and crude oil properties was $6.7$7.5 million for 2012 compared to $6.7 million for 2011 compared to $7.5and $7.5 million for 2010 and $8.1 million for 2009.2010.
Accretion of Asset Retirement Obligations
40Accretion of asset retirement obligations ("ARO") for 2012 increased by $2.3 million, or 134.3%, compared to 2011. The increase in 2012 is primarily attributable to the increase in ARO liability associated with the properties acquired in the Merit Acquisition in 2012 and the Seneca-Upshur acquisition in 2011. Accretion of ARO for 2011 increased by $0.4 million, or 30.4%, compared to 2010. The increase in 2011 is primarily attributable to the increase in ARO liability associated with the Seneca-Upshur acquisition in the fourth quarter of 2011.
Gain on Sale of Properties and Equipment
The 2012 increase in the gain on sale of properties and equipment of $4.2 million as compared to 2011 mainly relates to our proportionate share of the gain realized from PDCM's sale of certain leases in our Eastern Operating Region. The gain on sale of properties and equipment in 2011 and 2010 was not material.
Interest Expense
Interest expense increased by approximately $11.3 million in 2012 compared to 2011. Approximately $6 million of the increase is related to the issuance of the 2022 Senior Notes and the result of incurring interest on both the 2022 Senior Notes and 2018 Senior Notes during the month of October. Additionally, approximately $3.6 million of the increase was the result of higher average borrowings on our revolving credit facility during 2012 as compared to 2011 and $1.1 million due to higher debt issuance amortization expense. The increase in interest expense in 2011 compared to 2010 was attributable to $6 million of interest and amortization of the debt discount related to our convertible notes issued in November 2010. The increase was offset in part by a decrease in debt issuance costs of $1.5 million and an increase in capitalized interest capitalized of $1.4 million. The decrease in interest expense in 2010 compared to 2009 was primarily related to the lower average outstanding balances on our credit facilities. The average long-term debt in 2010 was $286.1 million compared to $392 million in 2009. Interest expense is net of capitalized interest. Interest costs capitalized in 2012, 2011 and 2010 were $1.2 million, $1.7 millionand 2009 were $1.7$0.3 million $0.3 million and $0.8 million,, respectively. We have historically utilized our daily cash balances to reduce our line of credit borrowings, thereby lowering our interest costs and interest income.
Provision/BenefitLoss on Extinguishment of Debt
The $23.3 million pre-tax loss on extinguishment of debt relates to the redemption of the 2018 Senior Notes during the fourth quarter of 2012. The pre-tax loss consists of an $18.9 million make-whole premium and the write-off of both unamortized debt discount of $1.5 million and unamortized debt issuance costs of $2.9 million.
Provision for Income Taxes
The effective tax rate ("rate") on incomeloss from continuing operations in 20112012 was a 6.3%38% benefit, on income, which reflects thea small benefit for the percentage depletion deduction. The 2011 benefit on income rate of 6.3% was also favorably impacted by our deduction andfor percentage depletion, as well as a $0.6 million tax benefit related to a reduction of the accrual for uncertain tax positions, offset by the adjustment to the estimated state deferred rate. Likewise, the The 2010 rate of 9.7% was also favorably impacted by our deduction for percentage depletion, as well as a $1.7 million discrete tax benefit related to our state deferred rate change. The 2009 rate of 36% was a benefit on loss, which was increased by a benefit for current state losses and offset by nondeductible expenditures related to the formation of PDCM. Excluding the effect of discrete items, our 2012, 2011 2010 and 20092010 rates were 0.1%38.0%, 32.9%0.1% and 36.2%32.9%, respectively, with 2011 representing a benefit on income, 2010 representing a provision on income and 2009 representing a benefit on loss.respectively. See Note 7, Income Taxes, to our consolidated financial statements included elsewhere in this report for our rate reconciliation for each of the three years in the three-year period ended December 31, 2011.2012.
Beginning with our 2010 tax year, we were accepted into and have agreed to participate in the IRS Compliance Assurance Process ("CAP") program. As part of this program, we agreed to an accelerated timeline for the IRS examination of our 2007, 2008 and 2009 tax years. This examination was completed during the second quarter of 2011 without any significant increase or decrease in tax expense. See Note 7, Income Taxes, to the accompanying consolidated financial statements included elsewhere in this report for a discussion onregarding the reduction of our uncertain tax liability due to the conclusion of this examination. Our 20102011 CAP reviewed return was filed in September 2011.2012. The IRS subsequently accepted our return without change. We are currently participating in the CAP program review of our 2012 tax year and have accepted an offer for continued participation in the IRS CAP program for our 2011 and 20122013 tax years.year.
Discontinued Operations
Permian Basin. During the fourth quarter of 2011, we closed on the sale of our non-core Permian Basin assets to unrelated third parties for a sales price of $13.2 million. We then developed a plan to divest 100% of our core Permian Basin assets, consisting of producing wells and undeveloped leaseholds. Following the sale of our core Permian assets to the unrelated party which closed on February 28, 2012, we do not have significant continuing involvement in the operations of or cash flows from these assets; accordingly,assets. Accordingly, the Permian Basin assets have beenwere reclassified as held for sale as of December 31, 2010 and 2011 and the results of operations related to the core and non-core Permian Basin assets have been reported as discontinued operations in 2010, year of acquisition, and 2011for all periods presented in the accompanying consolidated statements of operations included in this report. Proceeds from the sale of our core Permian Basin assets were $184.4$189.2 million including preliminary after closing adjustments whichand were received in the first quarter of 2012. The sale of our Permian Basin assets resulted in a pre-tax gain of $19.9 million. See Note 13,14, Assets Held for Sale, Divestitures and Discontinued Operations,, and Note 18, Subsequent Events, to our consolidated financial statements included elsewhere in this report for further discussion of the Permian divestiture.
North Dakota. DuringIn February 2011, we executed a purchase and sale agreement for the fourth quarter of 2010, we developed a plan to divest our North Dakota assets. The plan included 100%sale of our North Dakota assets consisting of producing wells, undeveloped leaseholds and related facilities primarily located in Burke County. In December 2010, we effected a letter of intent with an unrelated third party. Following the sale to the unrelated party, we do not have significant continuing involvement in the operations of or cash flows from these assets; accordingly, the North Dakota assets were reclassified as held for sale as of December 31, 2010, and the results of operations related to those assets have been reported as discontinued operations in the accompanying financial statements included in this report for all periods presented. In February 2011, wesubsequently closed with the same unrelated party. Proceeds from the sale were $9.5 million, net of non-affiliated investor partners' share of $3.8 million, resulting in a pretaxpre-tax gain on sale of $3.9 million.
Michigan. In July 2010, we completed the sale of our Michigan assets. Following the sale to the unrelated party, we do not have significant continuing involvement in the operations of, or cash flows from, these assets; accordingly,assets. Accordingly, the results of operations related to the North Dakota assets have been reported as discontinued operations in 2010 and 2011 in our consolidated statements of operations included elsewhere in this report.
Michigan. In July 2010, we completed the sale of our Michigan assets for net proceeds of $22 million. Following the sale to the unrelated party, we do not have significant continuing involvement in the operations of or cash flows from these assets. Accordingly, the results of operations related to the Michigan assets have been reported as discontinued operations in the accompanying financial2010 in our consolidated statements of operations included elsewhere in this report for the year ended 2010 and 2009.report. Operating results related to these assets were immaterial to the financial statements with the following exception. In June 2010, in conjunction with our decision to divest our Michigan assets, we recorded a related pretaxpre-tax impairment charge of $4.7 million. See Note 2,6, Summary of Significant Accounting Polices, Properties and Equipment - Proved Property Impairment, and Note 13,14, Assets Held for Sale, Divestitures and Discontinued Operations, to our consolidated financial statements included elsewhere in this report for additional information regarding the divestiture of our Michigan assets.
Natural Gas and Crude Oil Well Drilling Operations. We offered our last partnership drilling program in 2007. As of June 2009, we had concluded all previous commitments related to partnership well drilling and completion activities and reported our natural gas and crude oil well drilling activities as discontinued operations.
For production data and operating results related to our discontinued operations, see Part I, Item 6, Selected Financial Data, of this report and Note 13,14, Assets Held for Sale, Divestitures and Discontinued Operations, to our consolidated financial statements included elsewhere in this report.
Net Income (Loss) Attributable to Shareholders/Adjusted Net Income (Loss) Attributable to Shareholders
The year-over-year changes in net income (loss) attributable to shareholders are discussed above. These same reasons for change similarly impacted adjusted net income (loss) attributable to shareholders, a non-U.S. GAAP financial measure, with the exception of the unrealized derivative gains and losses on derivatives and provision for underpayment of natural gas sales, adjusted for taxes. Adjusted net income (loss) attributable to shareholders excludes the impact of a tax adjusted unrealized derivative gain, net, and provision for underpayment of natural gas sales of $10.6 million, $17.7 million in 2011 and $7.85.8 million in 2010,2012, 2011 and a tax adjusted unrealized loss of $71.9 million in 2009.2010, respectively. Adjusted net loss attributable to shareholders, a non-U.S. GAAP financial measure, in 2011 was$120.1 million and $4.3 million compared to an adjustedin 2012 and 2011, respectively. Adjusted net income ofattributable to shareholders was $0.4 million in 2010 and an adjusted net loss of $5.8 million2010 in 2009.. See Reconciliation of Non-U.S. GAAP Financial Measures, below, for a more detailed discussion of this non-U.S. GAAP financial measure.
Financial Condition, Liquidity and Capital Resources
OurHistorically, our primary sources of liquidity have been cash flows provided byfrom operating activities, and our bankrevolving credit facility, and, as market conditions have permitted, we have utilizedproceeds raised in the debt and equity markets and engaged in asset monetization transactions astransactions. In 2012, our primary sources of financing.liquidity were proceeds from the divestiture of our Permian assets in February 2012 for $189.2 million, $164.5 million in proceeds from the issuance of our common stock in May 2012, $489 million from the issuance of our 2022 Senior Notes in October 2012 and net cash flows from operating activities of $174.7 million.
Our primary source of cash flows provided by operationsfrom operating activities is the sale of natural gas, NGLs and crude oil. Fluctuations in our operating cash flowflows are substantially driven by commodity prices and changes in our production volumes. Commodity prices have historically been volatile and we manage this volatility through our use of derivatives, which has also historically been a source of cash. We enter into commodity derivative instruments with maturities of no greater than five years from the date of the instrument. For instruments that mature in two years or less, our debt covenants limit our holdings to 80% of our expected future production on total proved reserves (PDPs, PDNPs (proved developed producing, proved developed not producing and PUDs)proved undeveloped). For instruments that mature greaterlater than two years, but no more than our designated maximum maturity, our debt covenants limit our holdings to 80% of our expected future production on PDPs.from proved developed producing properties. Therefore, we may still have significant fluctuations in our cash flows provided byfrom operating activities due to the remaining non-hedged portion of our future production.
Our working capital fluctuates for various reasons, including, but not limited to, changes in the fair value of our commodity derivative instruments and changes in our cash and cash equivalents due to our practice of utilizing excess cash to reduce the outstanding borrowings under our corporaterevolving credit facility. At December 31, 2011,2012, we had a working capital deficit of $22.031.4 million compared to a surplusdeficit of $16.222 million at December 31, 2010. Our surplus in 2010 was directly related to our November 2010 debt and equity offerings.2011.
We beganended 2012 with cash and cash equivalents of $8.22.5 million, including $0.7 million related to PDCM for the acquisition and development of Marcellus property, and availability under our revolving credit facilitiesfacility and our proportionate share of $188.2PDCM's credit facility of $396.1 million including $15.9 million related to PDCM,, for a total liquidity position of $196.4$398.6 million, compared to $379.3$196.4 million at the beginningend of 2011.
The decreaseincrease in liquidity of $182.9$202.2 million, or 48.2%102.9%, was expected as we utilizedprimarily due to $189.2 million received from the divestiture of our Permian assets in February 2012, proceeds from our November 2010 capital raise to fund our 2011 operating budget,issuance of common stock of $334.5164.5 million in capital expendituresMay 2012, proceeds from the issuance of our $500 million 2022 Senior Notes in October 2012 and $145.9 million in the acquisition of natural gas and crude oil properties. These uses of cash were offset in part by sources of cash provided byflows from operating activities of $166.8174.7 million, an increaseoffset by $304.6 million in expenditures related to the borrowing baseMerit Acquisition in June 2012, capital expenditures of $347.7 million and the redemption of our corporate credit facilities of $96.4$203 million including $17.7 million related to PDCM, and $23.1 million from2018 Senior Notes in November 2012. Assuming that the planned divestiture of our non-core PermianPiceance and North DakotaNECO assets during 2011.for proceeds of approximately $200 million had closed as of December 31, 2012, our pro-forma liquidity, excluding any effect related to our borrowing base redetermination, would have been approximately $600 million.
We closed on the sale of our core Permian assets on February 28, 2012. The proceeds from the sale will serve as a source of liquidity in 2012. We also seek to monetize a portion of our Utica Shale assets as we are currently seeking a joint venture partner to participate in and share in funding the growth and development of this play. While we expect to identify a partner by mid-2012, we cannot assure we will be successful in securing a partner or developing this acreage. With our current liquidity position including the proceeds from the sale of our Permian assets, and expected cash flowflows from operations, we believe that we have sufficient capital to fund operations. However, an acceleration of development activities or other changes to our business plans could increase our need for operations and our planned uses ofcapital. We may also sell select assets from time to time in order to fund development projects, acquisitions or other capital through 2012.needs.
Capital Expenditures
We establish a capital budget each calendar yearannually based onupon our development and exploration opportunities, liquidity position and the expected cash flows provided byfrom operating activities for that year.activities. We may revise our capital budget during the year as a result of, among other things, acquisitions or dispositions of assets, drilling results, commodity prices, changes in our borrowing capacity and/or significant changes in cash flows. In December 2011,2012, our Board of Directors approved our 20122013 capital budget of $284$324 million, excluding our share of PDCM's capital budget. Based on our current forecast, we expect to allocate $184$254 million for developmental drilling, including recompletions and refractures, of which approximately 97% is expected to be invested in the Wattenberg field.Field, of which $207 million is for developmental drilling in the horizontal Niobrara and Codell. We expect to allocate approximately $53 million to drilling, leasing and completion activity in the remaining $100Utica Shale. We expect to allocate $17 million to acquisitions of properties and leased acreage, exploration and other capital needs. PDCM's capital budget for 2012 includes funding for the drilling of four gross horizontal wells and the completion of seven. PDCM's 20122013 capital budget is currently set at $60$95 million, of which $30$48 million represents our share, and is expected to be funded by PDCM's operating activities, and its credit facility.facility and funds received related to title defects discovered from its acquisition of Seneca-Upshur. PDCM's capital budget for 2013 includes funding for the drilling of 14 gross horizontal wells. We believe, based on the current commodity price environment, and our estimated 2012 production of approximately 53 Bcfe, an increase of approximately 17.8% over 2011 production from continuing operations, our cash flows provided by operating activities, planned asset sales and the sale ofproceeds from borrowings on our Permian assetsrevolving credit facility will fund our 20122013 capital budget while improving our 2012 liquidity position. budget.
Because natural gas and crude oil producedproduction from our existing properties declinea well declines rapidly in the first few years of production, in order to grow our production, we need to continue to commit significant amounts of capital in 2012order to maintain and beyond.grow our production and replace our reserves. If capital is
not available or is constrained in the future, we will be limited to our cash flows from operations and liquidity under our revolving credit facility as the sources for funding our capital expenditures. We would not be able to maintain our current level of natural gas, NGLs and crude oil production and cash flows provided byfrom operating activities if capital markets and commodity prices were to become depressed and/or the borrowing base onunder our revolving credit facility was significantly reduced. The recurrenceoccurrence of such an event may result in our election to defer a substantial portion of our planned capital expenditures for 2012 and beyond and could have a material negative impact on our operations in the future.
Financing Activities
In recent periods, we have been able to access borrowings under our revolving credit facility and to obtain proceeds from the issuance of debt and equity securities. See Note 8,Long-Term Debt, and Note 12,Common Stock, to our consolidated financial statements included in this report for a detailed discussionsdiscussion of our November 2010 issuance of convertible senior notes andMay 2012 sale of equity,common stock and October 2012 debt issuance, respectively. We have experienced no impediments in our ability to access borrowings under our corporate credit facility or the capital markets, as demonstrated by our November 2010 capital market transactions, but we cannot, however, assure this will continue to be the case in the future. We continue to monitor market eventsconditions and circumstances and their potential impactsimpact on each of the lenders that comprise our bankrevolving credit facility.facility lenders. Our $400 million bankrevolving credit facility borrowing base is subject to size redeterminationsa redetermination each May and November, based upon a quantification of our proved reserves at each June 30 and December 31st31, respectively. Our November semi-annual redetermination was completed on October 31, 2012 and June 30th, respectively. A commodity price deck reflectiveresulted in the reduction of our borrowing base from $525 million to $450 million. The $75 million borrowing base reduction was principally the result of the current and future commodity pricing environment is utilized by our lenders to quantify our reserve reports and determineincurrence of additional term debt in the underlying borrowing base.form of the 2022 Senior Notes. Our next scheduled redetermination is in May 2012.2013. While we have continuedexpect to continue to add producing reserves through our drilling operations, sincethese reserve additions will be offset by the sale of our last redetermination, we believePiceance and NECO assets if that transaction is completed and could be offset by other factors including, among other things, a significant decrease in commodity pricesprices. These events could haveresult in a negative impact on our future borrowing base redeterminations.
On January 23, 2012, we filed with the SEC an automatic shelf registration statement on Form S-3.S-3 with the SEC. Effective upon filing, the shelf provides for the potential sale of an unspecified amount of debt securities, common stock or preferred stock, either separately or represented by depository shares, warrants and purchase contracts, as well as units that may include any of these securities or securities of other entities. The shelf registration statement is intended to allow us to be proactive in our ability to raise capital should the need arise, and to have the flexibility to raise such funds in one or more offerings should we perceive the market conditions to be favorable. AsPursuant to this shelf registration, we sold 6.5 million shares of December 31, 2011, we had $315.8our common stock in May 2012 in an underwritten public offering at a price to the public of $26.50 per share. We used the net proceeds of $164.5 million availableto pay off the outstanding balance on our former shelf, which was replaced with our January 23, 2012, shelf.revolving credit facility and for general corporate purposes.
We are subject to quarterly financial debt covenants on our bank credit facility. Currently, our keyOur revolving credit facility debtcontains financial maintenance covenants. The covenants require that we maintain: 1)(i) total debt of less than 4.254.0 times earnings before interest, taxes, DD&Adepreciation, depletion and amortization, unrealized derivative gains (losses), exploration expense, gains (losses) on sales of assets and capital expendituresother non-cash, extraordinary or non-recurring gains (losses) ("EBITDAX") and 2)(ii) an adjusted working capitalcurrent ratio of at least 1.0 to 1.0. Our adjusted working capitalcurrent ratio is calculatedadjusted by reducingeliminating the impact on our current assets and liabilities by any impact of recording the fair value of our natural gas and crude oil derivative instruments and adding ourinstruments. Additionally, available borrowings onunder our bankrevolving credit facility are added back to ourthe current assets.asset calculation. The impact of any current portion of our revolving credit facility debt is eliminated from the current liabilities therefore any change in our available borrowings under our credit facility impacts our working capital ratio. Wecalculation. At December 31, 2012, we were in compliance with all debt covenants at December 31, 2011,with a 2.53 times debt to EBITDAX ratio and a 2.79 to 1.0 current ratio. We expect to remain in compliance throughout the next year.
The indenture governing our senior notes contains customary representations and warranties as well as typical restrictive covenants that, among other things, limit our ability and the ability of our restricted subsidiaries to: (a) incur additional debt, (b) make certain investments or pay dividends or distributions on our capital stock or purchase or redeem or retire capital stock, (c) sell assets, including capital stock of our restricted subsidiaries, (d) payrestrict the payment of dividends or other payments by restricted subsidiaries to us, (e) create liens that secure debt, (f) enter into transactions with affiliates and (g) merge or consolidate with another company. Additionally, with regard to our 12% senior notes,At December 31, 2012, we are subject to two incurrence covenants: 1) EBITDAX of at least two times interest expense and 2) total debt of less than 4.0 times EBITDAX. We were in compliance with all covenants at December 31, 2011, and expect to remain in compliance throughout the next year.
See Part II, Item 7A, Quantitative and Qualitative Disclosures about Market Risk, for our discussion of credit risk.
Cash Flows
Operating Activities. Our net cash flow provided byflows from operating activities is primarily impacted by commodity prices, production volumes, realized gains and losses from our derivative positions, operating costs and general and administrative expenses. Cash flows provided by operating activities increased in 20112012 and 20102011 compared to the respective prior year.years. In 2012, the $7.9 million increase was mainly attributable to an increase in realized derivative gains of $31.9 million, offset by a $18.5 million loss of operating margins related to the divested Permian Basin assets and an increase in the cash component of interest expense and exploration expense of $9.7 million and $1.2 million, respectively. In 2011, the$15 million increase was primarily due to thean increase in natural gas, NGLNGLs and crude oil sales of $88 million, offset by the decrease in realized derivative gains related to natural gas and crude oil sales of $29.9 million, the increase in production costs of $8.5 million and the increase in general and administrative expense of $19.3 million. In 2010, the increase was primarily due to the increase in natural gas, NGL and crude oil sales of $37.1 million and the income tax refund of $25.9 million from our 2009 NOL carry-back received during the first half of 2010, offset by a decrease in realized derivative gains related to natural gas and crude oil sales of $60.2$29.9 million, an increase in production costs of $8.5 million and an increase in general and administrative expense of $19.3 million. The remaining changes in cash flows provided by operating activities were primarily due to changes in our assets and liabilities related to the timing of cash payments and receipts. The key components for the changes in our cash flows provided by operating activities are described in more detail in our Results of Operations above.
Adjusted cash flows from operations, a non-U.S. GAAP financial measure, decreased in 2012 and increased in 2011 and decreased in 2010when compared to the respective prior year.years. These changes were primarily due to the same factors mentioned above for changes in cash flows provided by operating activities, without regard to timing of cash payments and receipts of our assets and liabilities.
Adjusted EBITDA, a non-U.S. GAAP financial measure, increased by $38.9$6.7 million in 2012 from 2011, from 2010primarily due to a $7.2$31.9 million increase in net income attributable to shareholders; a $38.2 million combined increase in the impairment of natural gas and crude oil properties and depreciation, depletion and amortization; a $3.7 million increase in interest expense, net; and a $5.8 million increase in tax expense;realized derivative gains, offset in part by a $16.0$16.4 million increase in unrealized gains on derivatives, net.
exploration expense and a $8.1 million increase in production costs. Adjusted EBITDA decreasedincreased by $18.5$39.4 million in 2011 from 2010, from 2009primarily due to a $129.2$71.6 million increase in unrealized gains on derivatives, net; a $17.0 million combined decrease in the impairment of natural gas, NGLs and crude oil propertiessales and depreciation, depletion and amortization; a $3.8$15.7 million decreaseincrease in interest expense, net;operating margins related to the divested Permian Basin assets, offset in part by a $85.5$29.9 million decrease in realized gains on derivatives and a $19.3 million increase in net income attributable to shareholders;general and a $46.0 million increase in taxadministrative expense.
See Reconciliation of Non-U.S. GAAP Financial Measures, below, for a more detailed discussion of non-U.S. GAAP financial measures.
Investing Activities. Cash flows used infrom investing activities primarily consist of the acquisition, exploration and development of natural gas and crude oil properties, net of dispositions of natural gas and crude oil properties. In 2012, our drilling program consisted of two rigs operating in the oil- and liquid-rich horizontal Niobrara and Codell play in our Wattenberg Field. See Part I, Operations - Drilling Activities, for additional details on our drilling activities. Our capital investment in natural gas and crude oil properties has increased significantly year-over-year as a result of our commitment to growth. In 2009, based on unstable economic conditions existing earlyNet cash used in investing activities of $451.9 million during 2012 was primarily related to the year$304.6 million expended in June 2012 for the Merit Acquisition and uncertainty as to when commodity and financial markets would recover to a perceived normal level, we reduced our planned 2009 capital expenditures to approximately 33%drilling activity of $347.7 million, offset in part by $189.2 million received from the divestiture of our 2008 levelPermian assets in February 2012 and began focusing$28.9 million received related to title defects discovered from PDCM's Seneca-Upshur acquisition in October 2011, of which $14.5 million represents our investment in the liquids-rich section of our Wattenberg Field. In 2010, as the economic condition showed signs of recovery and the differential between natural gas and liquids grew, we increased our capital spending by $177.7 million, including acquisitions, over that in 2009. Approximately 51% of our investment spending was directed toward organic development in our liquid-rich plays and the remaining 49% going toward the acquisition of natural gas and crude oil properties. In 2010, we sold our Michigan assets, which provided cash of $22 million.share. In 2011, we increased our capital spending by $159.6 million, including acquisitions, over that in 2010, and sold our North Dakota assets and our non-core Permian Basin assets, receiving cash of $23.1 million. Approximately 70% of our investment spending was directed toward organic development and the remaining 30% going toward the acquisition of natural gas and crude oil properties. See Part I,In 2010, as the economic condition showed signs of recovery and the differential between natural gas and liquids grew, we increased our capital spending to Operations - Drilling Activities$320.8 million, for additional details on. Approximately 51% of our drilling activities.investment spending was directed toward organic development in our liquid-rich plays and the remaining 49% going toward the acquisition of natural gas and crude oil properties. In 2010, we sold our Michigan assets, which provided cash of $22 million.
Financing Activities. Net cash from financing activities in 2012 includes gross proceeds of $500 million from our October 2012 issuance of the 2022 Senior Notes and $164.5 million from our May 2012 sale of common stock. The net proceeds from the issuance of the 2022 Senior Notes were used to fund the redemption of our 2018 Senior Notes for a total redemption price of approximately $222 million and to repay a portion of amounts outstanding under our revolving credit facility. The proceeds from the sale of common stock were used to finance a portion of the Merit Acquisition. Cash flows provided by financing activities increased significantly in 2011 were primarily comprised of net borrowings under our bank credit facility of $233.5 million in order to execute our capital budget. Additionally, financing cash flows include $12.5 million, representing our proportionate share of capital contributed to PDCM by our investing partner. Cash flows provided by financing activities in 2010 included gross proceeds of $132.5 million and $115 million from our November 2010 sale of equitycommon stock and issuance of convertible debt, respectively. During 2010, our investing partner in PDCM contributed $35 million, of which our proportionate share was $20.1 million. This capital raise was offset in part by the net repayment of borrowings under our bank credit facility of $80 million. Cash flows used in financing activities in 2009 were primarily related to our efforts to manage our balance sheet during the unstable economic conditions existing in 2009 and the uncertainty as to when the commodity and financial markets would recover to a perceived normal level. As a result, our net borrowings of $159.6 million in 2008 shifted to a net repayment of borrowings of $114.5 million in 2009. In 2009, we raised $48.5 million in capital through an equity offering and sold approximately half of our Eastern Operating Region assets, receiving $45 million as return of capital at the closing of the formation of PDCM. See Note 8, Long-Term Debt, and Note 12, Common Stock, and Note 15, Noncontrolling Interest in Subsidiary, to our consolidated financial statements included elsewhere in this report for further discussion on our debt and equity offerings and the formation of our joint venture.
Contractual Obligations and Contingent Commitments
The table below presents our contractual obligations and contingent commitments as of December 31, 20112012.
| | | | | Payments due by period | | Payments due by period |
| | | | | Less than | | 1-3 | | 3-5 | | More than | | | | Less than | | 1-3 | | 3-5 | | More than |
| Contractual Obligations and Contingent Commitments | | Total | | 1 year | | years | | years | | 5 years | | Total | | 1 year | | years | | years | | 5 years |
| | | (in millions) | | (in millions) |
| Long-term liabilities reflected on the consolidated balance sheets (1) | | | | | | | | | | | | | | | | | | | | |
| Long-term debt (2) | | $ | 551.0 |
| | $ | — |
| | $ | 24.0 |
| | $ | 324.0 |
| | $ | 203.0 |
| | $ | 690.3 |
| | $ | — |
| | $ | 75.3 |
| | $ | 115.0 |
| | $ | 500.0 |
|
| Derivative contracts (3) | | 40.9 |
| | 19.8 |
| | 21.1 |
| | — |
| | — |
| | 28.6 |
| | 18.5 |
| | 6.2 |
| | 3.9 |
| | — |
|
| Derivative contracts - affiliated partnerships (4) | | 6.1 |
| | — |
| | 6.1 |
| | — |
| | — |
| | 4.7 |
| | 4.7 |
| | — |
| | — |
| | — |
|
| Production tax liability | | 38.4 |
| | 19.0 |
| | 19.4 |
| | — |
| | — |
| | 44.6 |
| | 25.9 |
| | 18.7 |
| | — |
| | — |
|
| Asset retirement obligations | | 46.6 |
| | 0.3 |
| | 0.4 |
| | 0.8 |
| | 45.1 |
| | 62.6 |
| | 1.0 |
| | 2.5 |
| | 2.5 |
| | 56.6 |
|
| Other liabilities (5) | | 6.2 |
| | 0.3 |
| | 0.6 |
| | 0.6 |
| | 4.7 |
| | 4.9 |
| | 0.3 |
| | 0.9 |
| | 0.6 |
| | 3.1 |
|
| | | 689.2 |
| | 39.4 |
| | 71.6 |
| | 325.4 |
| | 252.8 |
| | 835.7 |
| | 50.4 |
| | 103.6 |
| | 122.0 |
| | 559.7 |
|
| | | | | | | | | | | | | | | | | | | | | |
| Commitments, contingencies and other arrangements (6) | | | | | | | | | | | | | | | | | | | | |
| Interest on long-term debt (7) | | 195.0 |
| | 36.3 |
| | 71.5 |
| | 59.8 |
| | 27.4 |
| | 403.1 |
| | 47.0 |
| | 91.5 |
| | 78.9 |
| | 185.7 |
|
| Operating leases | | 10.8 |
| | 2.6 |
| | 4.8 |
| | 2.3 |
| | 1.1 |
| | 8.5 |
| | 2.6 |
| | 4.3 |
| | 0.7 |
| | 0.9 |
|
| Drilling rig commitments (8) | | 16.5 |
| | 9.6 |
| | 6.9 |
| | — |
| | — |
| |
| Drilling commitment | | 0.9 |
| | — |
| | — |
| | — |
| | 0.9 |
| | 0.9 |
| | — |
| | — |
| | 0.9 |
| | — |
|
| Firm transportation and processing agreements (9) | | 223.2 |
| | 15.3 |
| | 54.4 |
| | 50.2 |
| | 103.3 |
| |
| Firm transportation and processing agreements (8) | | | 199.3 |
| | 25.8 |
| | 55.4 |
| | 44.9 |
| | 73.2 |
|
| Other | | 0.5 |
| | 0.1 |
| | 0.3 |
| | 0.1 |
| | — |
| | 0.4 |
| | 0.1 |
| | 0.3 |
| | — |
| | — |
|
| | | 446.9 |
| | 63.9 |
| | 137.9 |
| | 112.4 |
| | 132.7 |
| | 612.2 |
| | 75.5 |
| | 151.5 |
| | 125.4 |
| | 259.8 |
|
| Total | | $ | 1,136.1 |
| | $ | 103.3 |
| | $ | 209.5 |
| | $ | 437.8 |
| | $ | 385.5 |
| | $ | 1,447.9 |
| | $ | 125.9 |
| | $ | 255.1 |
| | $ | 247.4 |
| | $ | 819.5 |
|
| | | | | | | | | | | | | | | | | | | | | |
__________
| |
| (1) | Table does not include deferred income tax liability to taxing authorities of $207.6148.4 million, due to the uncertainty surrounding the ultimate settlement of amounts and timing of these obligations. |
| |
| (2) | Amount presented does not agree with the balance sheet in that it excludes $18.813.7 million in unamortized debt discount. See Note 8, Long-Term Debt, to our consolidated financial statements included elsewhere in this report. |
| |
| (3) | Represents our gross liability related to the fair value of derivative positions, including the fair value of derivative contracts we entered into on behalf of our affiliated partnerships as the managing general partner. We have a related receivable from the partnerships of $6.22.1 million. |
| |
| (4) | Represents our affiliated partnerships' designated portion of the fair value of our gross derivative assets. |
| |
| (5) | Includes funds held from revenue distribution to third partythird-party investors, including our affiliated partnerships, for plugging liabilities related to wells we operate and deferred officer compensation. |
| |
| (6) | Table does not include an undrawn $18.7 million irrevocable standby letter of credit pending issuance to a transportation service provider. See Note 8, Long-Term Debt, to our consolidated financial statements included elsewhere in this report. Additionally, the table does not include the annual repurchase obligations to investing partners or termination benefits related to employment agreements with our executive officers, due to the uncertainty surrounding the ultimate settlement of amounts and timing of these obligations. See Note 11, Commitments and Contingencies - Partnership Repurchase Provision; Employment Agreements with Executive Officers, to our consolidated financial statements included elsewhere in this report. |
| |
| (7) | Amounts presented include $16.4$12.6 million payable to the holders of our 3.25% convertible senior notes due 2016 and $149.2$379.4 million to the holders of our 12% senior notes due 2018.2022 Senior Notes. Amounts also include $29.4$11.1 million payable to the participating banks of our revolving credit facilities, of which interest of $3.5$5.6 million is related to unutilized commitments at a rate of 0.5% per annum, $25.7$5.3 million related to the outstanding borrowings on our revolving credit facilities of $188.2$75.3 million and $0.2 million related to our undrawn letters of credit. |
| |
| (8) | Drilling rig commitments in the above table reflect our maximum obligation for the services of drilling rigs, including $13.9 million related to a rig operating in the Permian Basin. The Permian rig commitment was assigned to the purchaser of our Permian assets on February 28, 2012. See Note 11, Commitments and Contingencies - Drilling Rig Contracts, Note 13, Assets Held for Sale, Divestitures and Discontinued Operations, and Note 18, Subsequent Event, to our consolidated financial statements included in this report. |
| |
(9) | Represents our gross commitment, including our proportionate share of PDCM. We will recognize in our financial statements our proportionate share based on our working interest; however, with the exception of contracts entered into by PDCM, the costs of all volume shortfalls will be borne by PDC only. See Note 11, Commitments and Contingencies - Firm Transportation Agreements, to our consolidated financial statements included elsewhere in this report. |
As the managing general partner of 21 partnerships, we have liability for potential casualty losses in excess of the partnership assets and insurance. We believe that the casualty insurance coverage we and our subcontractors carry is adequate to meet this potential liability.
For information regarding our legal proceedings, see Note 11, Commitments and Contingencies – Litigation, to our consolidated financial statements included elsewhere in this report. From time to time, we are a party to various other legal proceedings in the ordinary course of business. We are not currently a party to any litigation that we believe would have a materially adverse effect on our business, financial condition, results of operations or liquidity.
Critical Accounting Policies and Estimates
We have identified the following policies as critical to business operations and the understanding of our results of operations. This is not a comprehensive list of all of the accounting policies. In many cases, the accounting treatment of a particular transaction is specifically dictated by U.S. GAAP, with no need for our judgment in the application. There are also areas in which our judgment in selecting any available alternativealternatives would not produce a materially different result. However, certain of our accounting policies are particularly important to the portrayal of our financial position and results of operations and we may use significant judgment in the application; asapplication. As a result, they are subject to an inherent degree of uncertainty. In applying those policies, we use our judgment to determine the appropriate assumptions to be used in the determination of certain estimates. Those estimates are based on historical experience, observation of trends in the industry and information available from other outside sources, as appropriate. For a more detailed discussion on the application of these and other accounting policies, see Note 2, Summary of Significant Accounting Policies, to our consolidated financial statements included elsewhere in this report. Our critical accounting policies and estimates are as follows:
Natural Gas and Crude Oil Properties. We account for our natural gas and crude oil properties under the successful efforts method of accounting. Costs of proved developed producing properties, successful exploratory wells and development dry hole costs are capitalized and depreciated or depleted by the unit-of-production method based on estimated proved developed producing reserves. Property acquisition costs are depreciated or depleted on the unit-of-production method based on estimated proved reserves.
Annually, we engage independent petroleum engineers to prepare reserve and economic evaluations of all our properties on a well-by-well basis as of December 31. We adjust our natural gas and crude oil reserves for major acquisitions, new drilling and divestitures during the year as needed. The process of estimating and evaluating natural gas and crude oil reserves is complex, requiring significant decisions in the evaluation of available geological, geophysical, engineering and economic data. The data for a given property may also change substantially over time as a result of numerous factors, including additional development activity, evolving production history and a continual reassessment of the viability of production under changing economic conditions. As a result, revisions in existing reserve estimates occur. Although every reasonable effort is made to ensure that reserve estimates reported represent our most accurate assessments possible, the subjective decisions and variances in available data for various properties increase the likelihood of significant changes in these estimates over time. Because estimates of reserves significantly affect our DD&A expense, a change in our estimated reserves could have an effect on our net income.
Exploration costs, including geological and geophysical expenses and delay rentals, are charged to expense as incurred. Exploratory well drilling costs, including the cost of stratigraphic test wells, are initially capitalized, but are charged to expense if the well is determined to be nonproductive. The status of each in-progress well is reviewed quarterly to determine the proper accounting treatment under the successful efforts method of accounting. Exploratory well costs continue to be capitalized as long as the well has found a sufficient quantity of reserves to justify our completion as a producing well and we are making sufficient progress assessing our reserves and economic and operating viability. If an in-progress exploratory well is found to be unsuccessful prior to the issuance of the financial statements, the costs incurred prior to the end of the reporting period are expensedcharged to exploration expense. If we are unable to make a final determination about the productive status of a well prior to issuance of the financial statements, the well is classified as "suspended well costs" until we have had sufficient time to conduct additional completion or testing operations to evaluate the pertinent geological and engineering data obtained. At the time when we are able to make a final determination of a well’s productive status, the well is removed from the suspended well status and the proper accounting treatment is applied.
The acquisition costs of unproved properties are capitalized when incurred, until such properties are transferred to proved properties or charged to expense when expired, impaired or amortized. Unproved natural gas and crude oil properties with individually significant acquisition costs are periodically assessed, and any impairment in value is charged to impairment of natural gas and crude oil properties. The amount of impairment recognized on unproved properties which are not individually significant is determined by amortizing the costs of such properties within appropriate fields based on our historical experience, acquisition dates and average lease terms, with the amortization recognized in impairment of natural gas and crude oil properties. The valuation of unproved properties is subjective and requires us to make estimates and assumptions which, with the passage of time, may prove to be materially different from actual realizable values.
We assess our natural gas and crude oil properties for possible impairment upon a triggering event by comparing net capitalized costs to estimated undiscounted future net cash flows on a field-by-field basis using estimated production based upon prices at which we reasonably estimate the commodity to be sold. Any impairment in value is charged to impairment of natural gas and crude oil properties. The estimates of future prices may differ from current market prices of natural gas and crude oil. Any downward revisions in estimates to our reserve quantities, expectations of falling commodity prices or rising operating costs could result in a triggering event, and therefore, a reduction in undiscounted future net cash flows and an impairment of our natural gas and crude oil properties. Although our cash flow estimates are based on the relevant information available at the time the estimates are made, estimates of future cash flows are, by nature, highly uncertain and may vary significantly from actual results.
See Executive Summary - Operational Overview and Update, Potential for Future Asset Impairments above.
Consolidation and Accounting for Variable Interest Entities. Under applicable accounting guidance, a variable interest entity ("VIE") is consolidated by the entity's primary beneficiary. The primary beneficiary of a VIE has both the following characteristics: (1) the power to direct the activities of the VIE that most significantly impact the entity's economic performance and (2) the obligation to absorb losses of the entity that could potentially be significant to the VIE or the right to receive benefits from the entity that could potentially be significant to the VIE.
In determining whether we are the primary beneficiary of the VIE, we consider a number of factors, including our ability to direct the activities that most significantly affect the entity's economic success and our contractual rights and responsibilities under the arrangement. These considerations impact the way we account for our existing joint venture relationship. Further, as certain events occur, we reconsider whether those events have caused us to become the primary beneficiary. The consolidation status of our VIE may change if the composition of the board of managers changes or we enter into new or modified contractual arrangements. A reconsideration event may also occur when we acquire new or additional interests in a VIE.
As of September 30, 2011, we concluded that PDCM was no longer a variable interest entity ("VIE") because our voting rights had become proportionately equal to our economic interests and the activities of the entity were being conducted equally for the benefit of both investing partners. The status change of PDCM to a non-VIE did not have an impact on our financial statements, as we continue to proportionately consolidate PDCM in accordance with the voting interest model. See Note 1, Nature of Operations and Basis of Presentation, for more details regarding our interest in PDCM.
Natural Gas, NGLNGLs and Crude Oil Sales Revenue Recognition. Natural gas, NGLNGLs and crude oil sales are recognized when production is sold to a purchaser at a determinable price, delivery has occurred, rights and responsibility of ownership have transferred and collection of revenue is reasonably assured. We record sales revenue based on an estimate of the volumes delivered at estimated prices as determined by the applicable sales agreement. We estimate our sales volumes based on company measuredcompany-measured volume readings. We then adjust our natural gas, NGLNGLs and crude oil sales in subsequent periods based on the data received from our purchasers that reflects actual volumes and prices received. We receive payment for sales from one to three months after actual delivery has occurred. The differences in sales estimates and actual sales are recorded up to two months later. Historically, differences have been immaterial.
Fair Value of Financial Instruments. Our fair value measurements are estimated pursuant to a fair value hierarchy that requires us to maximize the use of observable inputs and minimize the use of unobservable inputs when measuring fair value. The valuation hierarchy is based upon the transparency of inputs to the valuation of an asset or liability as of the measurement date, giving the highest priority to quoted prices in active markets (Level 1) and the lowest priority to unobservable data (Level 3). In some cases, the inputs used to measure fair value might fall in different levels of the fair value hierarchy. The lowest level input that is significant to a fair value measurement in its entirety determines the applicable level in the fair value hierarchy. Assessing the significance of a particular input to the fair value measurement in its entirety requires judgment, considering factors specific to the asset or liability, and may affect the valuation of the assets and liabilities and their placement within the fair value hierarchy levels. The three levels of inputs that may be used to measure fair value are defined as:
Level 1 – Quoted prices (unadjusted) in active markets for identical assets or liabilities.liabilities in active markets.
Level 2 – Inputs other than quoted prices included within Level 1 that are either directly or indirectly observable for the asset or liability, including (i) quoted prices for similar assets or liabilities in active markets, (ii) quoted prices for identical or similar assets or liabilities in inactive markets, (iii) inputs other than quoted prices that are observable for the asset or liability and (iv) inputs that are derived from observable market data by correlation or other means. Includes our fixed-price swaps, basis swaps and physical purchases.
Level 3 – Unobservable inputs for the asset or liability, including situations where there is little, if any, market activity for the asset or liability. Includes our natural gas and crude oil collars, crude oil puts and physical sales.activity.
Derivative Financial Instruments. We measure the fair value of our derivative instruments based on a pricing model that utilizes market-based inputs, including but not limited to the contractual price of the underlying position, current market prices, natural gas and crude oil forward curves, discount rates such as the LIBOR curve for a similar duration of each outstanding position, volatility factors and nonperformance risk. Nonperformance risk considers the effect of our credit standing on the fair value of derivative liabilities and the effect of our counterparties' credit standings on the fair value of derivative assets. Both inputs to the model are based on published credit default swap rates and the duration of each outstanding derivative position.
We validate our fair value measurement through (1) the review of counterparty statements and other supporting documentation, (2) the determination that the source of the inputs areis valid, (3) the corroboration of the original source of inputs through access to multiple quotes, if available, or other information and (4) monitoring changes in valuation methods and assumptions. While we use common industry practices to develop our valuation techniques, changes in our pricing methodologies or the underlying assumptions could result in significantly different fair values. While we believe our valuation method is appropriate and consistent with those used by other market participants, the use of a different methodology or assumptions to determine the fair value of certain financial instruments could result in a different estimate of fair value.
We have evaluated the credit risk of the counterparties holding our derivative assets, which are primarily financial institutions who are also major lenders in our corporaterevolving credit facility, agreement, giving consideration to amounts outstanding for each counterparty and the duration of each outstanding derivative position. Based on our evaluation, we have determined that the potential impact of the nonperformance of our counterparties on the fair value of our derivative instruments is insignificant.not significant.
Deferred Income Tax Asset Valuation Allowance. Deferred income tax assets are recognized for deductible temporary differences, net operating loss carry-forwards and credit carry-forwards if it is more likely than not that the tax benefits will be realized. To the extent a deferred tax asset is not expected to be realized under the preceding criteria, we establish a valuation allowance. The factors which we
consider in assessing whether we will realize the value of deferred income tax assets involve judgments and estimates of both amount and timing, which could differ from actual results, achieved in future periods.
The judgments used in applying the above policies are based on our evaluation of the relevant facts and circumstances as of the date of the financial statements. Actual results may differ from those estimates.
Accounting for Acquisitions Using Purchase Accounting. We utilize the purchase method to account for acquisitions. Pursuant to purchase method accounting, we allocate the cost of the acquisition to assets acquired and liabilities assumed based on fair values as of the acquisition date. The purchase price allocations are based on appraisals, discounted cash flows, quoted market prices and estimates by management. When appropriate, we review comparable purchases and sales of natural gas and crude oil properties within the same regions and use that data as a basis for fair market value; for example, the amount at which a willing buyer and seller would enter into an exchange for such properties.
In estimating the fair values of assets acquired and liabilities assumed, we make various assumptions. The most significant assumptions relate to the estimated fair values assigned to proved developed producing, proved developed non-producing, proved undeveloped, unproved natural gas and crude oil properties and other non-natural gas and crude oil properties. To estimate the fair values of these properties, we prepare estimates of natural gas and crude oil reserves. We estimate future prices by using the applicable forward pricing strip to apply to our estimate of reserve quantities acquired, and estimates of future operating and development costs, to arrive at an estimate of future net revenues. For estimated proved reserves, the future net revenues are discounted using a market-based weighted averageweighted-average cost of capital rate determined appropriate at the time of the acquisition. The market-based weighted averageweighted-average cost of capital rate is subject to additional project-specific risking factors. To compensate for the inherent risk of estimating and valuing unproved properties, we reduce the discounted future net revenues of probable and possible reserves by additional risk-weighting factors.
We record deferred taxes for any differences between the assigned values and tax basis of assets and liabilities. Estimated deferred taxes are based on available information concerning the tax basis of assets acquired and liabilities assumed and loss carryforwards at the acquisition date, although such estimates may change in the future as additional information becomes known.
Recent Accounting Standards
See Note 2, Summary of Significant Accounting Policies - Recent Accounting Standards, to our consolidated financial statements included elsewhere in this report.
Reconciliation of Non-U.S. GAAP Financial Measures
Adjusted cash flowflows from operations. We define adjusted cash flowflows from operations as the cash flowflows earned or incurred from operating activities, without regard to the collection or payment of associated receivables or payables.changes in operating assets and liabilities. We believe it is important to consider adjusted cash flowflows from operations, as well as cash flowflows from operations, as we believe it often provides more transparency into what drives the changes in our operating trends, such as production, prices, operating costs and related operational factors, without regard to whether the earnedrelated asset or incurred itemliability was collectedreceived or paid during the same period. We also use this measure because the collectiontiming of cash received from our receivablesassets, cash paid to obtain an asset or payment of our obligations has not been a significant issue for our business, but merelyonly a timing issue from one period to the next with fluctuations generally caused by significant changes in commodity prices.as we have not had accounts receivable collection problems, nor been unable to purchase assets or pay our obligations. See the Consolidated Statements of Cash Flows in this report.
Adjusted net income (loss) attributable to shareholders. We define adjusted net income (loss) attributable to shareholders as net income (loss) attributable to shareholders, plus unrealized derivative losses and provisions for underpayment of natural gas sales, minusless unrealized derivative gains, each adjusted for tax effect. We believe it is important to consider adjusted net income (loss) attributable to shareholders, as well as net income (loss) attributable to shareholders. We believe it often provides more transparency into our operating trends, such as production, prices, operating costs, realized gains and losses from derivatives and related factors, without regard to changes in our net income (loss) attributable to shareholders from our mark-to-market adjustments resulting from unrealized gains and losses from derivatives. Additionally, other items, such as the provision for underpayment of natural gas sales, which are not indicative of future results, may be excluded to clearly identify operational trends.
Adjusted EBITDA. We define adjusted EBITDA as net income (loss), plus unrealized derivative loss, interest expense, net of interest income, income taxes, impairment of natural gas and crude oil properties, and depreciation, depletion and amortization, for the period minusaccretion of asset retirement obligations and loss on debt extinguishment, less unrealized derivative gain. Adjusted EBITDA is not a measure of financial performance or liquidity under U.S. GAAP and should be considered in addition to, not as a substitute for, net income (loss), nor as an indicator of cash flows reported in accordance with U.S. GAAP. Adjusted EBITDA includes certain non-cash costs incurred by the Company and does not take into account changes in operating assets and liabilities. Other companies in our industry may calculate Adjusted EBITDA differently than we do, limiting its usefulness as a comparative measure. We believe adjusted EBITDA is relevant because it is a measure of our operational and financial performance, as well as a measure of our liquidity, and is used by our management, investors, commercial banks, research analysts and others to analyze such things as:
our operating performance and return on capital as compared to our peers;
the financial performance of our assets and our valuation without regard to financing methods, capital structure or historical cost basis;
our ability to generate sufficient cash available to fund our capital expenditures and service our debt obligations; and
the viability of acquisition opportunities and is a widely used industry metric which allows comparabilitycapital expenditure projects, including the related rate of our results with our peers.return.
PV-10%. We define PV-10% as the estimated present value of the future net cash flows from our proved reserves before income taxes, discounted using a 10% discount rate. We believe that PV-10% provides useful information to investors as it is widely used by professional analysts and sophisticated investors when evaluating oil and gas companies. We believe that PV-10% is relevant and useful for evaluating the relative monetary significance of our reserves. Professional analysts and sophisticated investors may utilize the measure as a basis for comparison of the relative size and value of our reserves to other companies' reserves. Because there are many unique factors that can impact an individual company when estimating the amount of future income taxes to be paid, we believe the use of a pretaxpre-tax measure is valuable in evaluating the Company and our reserves. PV-10% is not intended to represent the current market value of our estimated reserves.
The following table presents a reconciliation of our non-U.S. GAAP financial measures to its nearestmost comparable U.S. GAAP measure.measure:
| | | | Year Ended December 31, | Year Ended December 31, |
| | 2011 | | 2010 | | 2009 | 2012 | | 2011 | | 2010 |
| | (in millions) | (in millions) |
| Adjusted cash flow from operations: | | | | | | |
| Adjusted cash flow from operations | $ | 166.2 |
| | $ | 132.2 |
| | $ | 170.2 |
| |
| Changes in current assets and liabilities | 0.6 |
|
| 19.6 |
|
| (26.3 | ) | |
| Net cash provided by operating activities | $ | 166.8 |
|
| $ | 151.8 |
|
| $ | 143.9 |
| |
| Adjusted cash flows from operations: | | | | | | |
| Adjusted cash flows from operations | | $ | 163.9 |
| | $ | 167.7 |
| | $ | 132.2 |
|
| Changes in assets and liabilities | | 10.8 |
| | (0.9 | ) | | 19.6 |
|
| Net cash from operating activities | | $ | 174.7 |
| | $ | 166.8 |
| | $ | 151.8 |
|
| | | | | | | | | | | |
| Adjusted net income (loss) attributable to shareholders: | | | | | | | | | | |
| Adjusted net income (loss) attributable to shareholders | $ | (4.3 | ) | | $ | 0.4 |
| | $ | (5.8 | ) | $ | (120.1 | ) | | $ | (4.3 | ) | | $ | 0.4 |
|
| Unrealized gain (loss) on derivatives, net | 28.6 |
|
| 12.6 |
|
| (116.6 | ) | (17.1 | ) | | 28.6 |
| | 12.6 |
|
| Provision for underpayment of natural gas sales | — |
|
| (3.3 | ) |
| (2.7 | ) | — |
| | — |
| | (3.3 | ) |
| Tax effect of above adjustments | (10.9 | ) |
| (3.5 | ) |
| 45.8 |
| 6.5 |
| | (10.9 | ) | | (3.5 | ) |
| Net income (loss) attributable to shareholders | $ | 13.4 |
|
| $ | 6.2 |
|
| $ | (79.3 | ) | $ | (130.7 | ) | | $ | 13.4 |
| | $ | 6.2 |
|
| | | | | | | | | | | |
| Adjusted EBITDA: | | | | | | |
| Adjusted EBITDA to net income (loss) attributable to shareholders: | | | | | | |
| Adjusted EBITDA | $ | 188.3 |
| | $ | 149.4 |
| | $ | 167.9 |
| $ | 196.9 |
| | $ | 190.2 |
| | $ | 150.8 |
|
| Unrealized gain (loss) on derivatives, net | 28.6 |
|
| 12.6 |
|
| (116.6 | ) | (17.1 | ) | | 28.6 |
| | 12.6 |
|
| Interest expense, net | (36.9 | ) |
| (33.2 | ) |
| (37.0 | ) | (48.3 | ) | | (36.9 | ) | | (33.2 | ) |
| Income tax benefit (expense) | (6.2 | ) |
| (0.4 | ) |
| 45.6 |
| |
| Income tax provision | | 80.2 |
| | (6.2 | ) | | (0.4 | ) |
| Impairment of natural gas and crude oil properties | (25.2 | ) | | (11.1 | ) | | (8.2 | ) | (168.2 | ) | | (25.2 | ) | | (11.1 | ) |
| Depreciation, depletion and amortization | (135.2 | ) |
| (111.1 | ) |
| (131.0 | ) | (146.9 | ) | | (135.2 | ) | | (111.1 | ) |
| Accretion of asset retirement obligations | | (4.0 | ) | | (1.9 | ) | | (1.4 | ) |
| Loss on extinguishment of debt | | (23.3 | ) | | — |
| | — |
|
| Net income (loss) attributable to shareholders | $ | 13.4 |
|
| $ | 6.2 |
|
| $ | (79.3 | ) | $ | (130.7 | ) | | $ | 13.4 |
| | $ | 6.2 |
|
| | | | | | | |
| Adjusted EBITDA to net cash from operating activities: | | | | | | |
| Adjusted EBITDA | | $ | 196.9 |
| | $ | 190.2 |
| | $ | 150.8 |
|
| Interest expense, net | | (48.3 | ) | | (36.9 | ) | | (33.2 | ) |
| Exploratory dry hole costs | | 15.3 |
| | 0.2 |
| | 4.2 |
|
| Stock-based compensation | | 8.5 |
| | 7.4 |
| | 5.0 |
|
| Amortization of debt discount and issuance costs | | 7.9 |
| | 6.3 |
| | 4.6 |
|
| (Gain) loss from sale of properties and equipment | | (24.3 | ) | | (4.3 | ) | | 0.3 |
|
| Other | | 7.9 |
| | 4.8 |
| | 0.5 |
|
| Changes in assets and liabilities | | 10.8 |
| | (0.9 | ) | | 19.6 |
|
| Net cash from operating activities | | $ | 174.7 |
| | $ | 166.8 |
| | $ | 151.8 |
|
| | | | | | | | | | | |
| PV-10%: | | | | | | | | | | |
| PV-10% | $ | 1,350.3 |
| | $ | 693.1 |
| | $ | 359.5 |
| $ | 1,708.9 |
| | $ | 1,350.3 |
| | $ | 693.1 |
|
| Present value of estimated future income tax discounted at 10% | (409.1 | ) | | (204.7 | ) | | (11.9 | ) | (540.4 | ) | | (409.1 | ) | | (204.7 | ) |
| Standardized measure of discounted future net cash flows | $ | 941.2 |
| | $ | 488.4 |
| | $ | 347.6 |
| $ | 1,168.5 |
| | $ | 941.2 |
| | $ | 488.4 |
|
| | | | | | | |
ITEM 7A. QUANTITATIVE AND QUALITATIVE DISCLOSURE ABOUT MARKET RISK
Market-Sensitive Instruments and Risk Management
We are exposed to market risks associated with interest rates,rate risks, commodity pricesprice risk and credit exposure.risk. We have established risk management processes to monitor and manage these market risks.
Interest Rate Risk
Changes in interest rates affect the amount of interest we earn on our interest bearing cash, cash equivalents and restricted cash accounts and the interest we pay on borrowings under our bankrevolving credit facilities. All of ourfacility. Our senior notes and convertible notes have a fixed raterates and, therefore, near-term changes in interest rates do not expose us to risk of earnings or cash flow loss; however, near-term changes in interest rates may affect the fair value of our fixed-rate debt.
As of December 31, 2011,2012, our interest-bearing deposit accounts included money market accounts, certificates of deposit and checking and savings accounts with various banks. The amount of our interest-bearing cash, cash equivalents and restricted cash as of December 31, 2011,2012 was $13.9$6.4 million with an average interest rate of 0.1%. The $13.9$6.4 million represents our aggregate bank balances, which includes checks issued and outstanding. Based on a sensitivity analysis of our interest bearing deposits as of December 31, 2011,2012, it was estimated that if market interest rates would have increased or decreased by 1% in 2011,2012, the impact on our annual interest income would have been immaterial.
As of December 31, 2011,2012, excluding the $18.8$18.7 million irrevocable standby letters of credit, we had outstanding borrowings on our corporate bank credit facility of $20949 million and, representing our proportionate share, $2426.3 million on PDCM's bank credit facility. We estimate that if market interest rates would have increased or decreased by 1%, our 20112012 interest expense would have changed by approximately $2.3 million.$0.8 million.
Commodity Price Risk
We are exposed to commodity price risk, the potential risk of loss from adverse changes in the market price of natural gas, NGLs and crude oil commodities.oil. We employ established policies and procedures to manage a portion of the risks associated with these market fluctuations using derivative instruments. These instruments allow us to predict with greater certainty the effective natural gas and crude oil prices to be received for our hedged production as it is produced. We believe that our established derivative policies and procedures are effective in achieving our risk management objectives.
The following table presents our derivative positions (excluding the derivative positions designated to our affiliated partnerships) related to natural gas and crude oil sales in effect as of December 31, 20122011.:
| | | | | Floors | | Collars | | Fixed-Price Swaps | | CIG Basis Protection Swaps | | | | Floors | | Collars | | Fixed-Price Swaps | | CIG Basis Protection Swaps | | |
Commodity/ Index/ Maturity Period | | Quantity (Oil - MBbls) | | Weighted Average Contract Price | | Quantity (Gas - BBtu (1) Oil - MBbls) | | Weighted Average Contract Price | | Quantity (Gas - BBtu (1) Oil - MBbls) | | Weighted Average Contract Price | | Quantity (BBtu) (1) | | Weighted Average Contract Price | | Fair Value December 31, 2011 (2) (in millions) | | Quantity (BBtu) (1) | | Weighted- Average Contract Price | | Quantity (Gas - BBtu (1) Oil - MBbls) | | Weighted-Average Contract Price | | Quantity (Gas - BBtu (1) Oil - MBbls) | | Weighted- Average Contract Price | | Quantity (BBtu) (1) | | Weighted- Average Contract Price | | Fair Value December 31, 2012 (2) (in millions) |
| | | Floors | | Ceilings | | | | Floors | | Ceilings | |
| Natural Gas | |
| |
| |
| |
| |
| |
| |
| |
| |
| |
| | | | | | | | | | | | | | | | | | | | |
| NYMEX | |
| |
| |
| |
| |
| |
| |
| |
| |
| |
| | | | | | | | | | | | | | | | | | | |
| 2012 | | — |
| | $ | — |
| | 4,913.8 |
| | $ | 6.00 |
| | $ | 8.27 |
| | 13,109.7 |
| | $ | 5.74 |
| | 10,377.7 |
| | $ | (1.81 | ) | | $ | 30.1 |
| |
| 2013 | | — |
| | — |
| | 4,438.0 |
| | 6.10 |
| | 8.60 |
| | 11,217.5 |
| | 5.78 |
| | 9,380.3 |
| | (1.81 | ) | | 16.2 |
| | 4,910.0 |
| | $ | 6.20 |
| | — |
| | $ | — |
| | $ | — |
| | 22,574.5 |
| | $ | 4.62 |
| | 23,320.7 |
| | $ | (0.83 | ) | | $ | 23.3 |
|
| 2014 | | — |
| | — |
| | — |
| | — |
| | — |
| | 5,100.0 |
| | 4.39 |
| | — |
| | — |
| | 0.2 |
| | — |
| | — |
| | — |
| | — |
| | — |
| | 13,390.0 |
| | 4.03 |
| | 8,830.0 |
| | (0.22 | ) | | (0.1 | ) |
| 2015 | | | 720.0 |
| | 4.00 |
| | — |
| | — |
| | — |
| | 9,120.0 |
| | 3.91 |
| | — |
| | — |
| | (2.6 | ) |
| 2016 | | | — |
| | — |
| | — |
| | — |
| | — |
| | 7,200.0 |
| | 3.84 |
| | — |
| | — |
| | (3.9 | ) |
| |
| |
| |
| |
| |
| |
| |
| |
| |
| |
| | | | | | | | | | | | | | | | | | | |
| CIG | |
| |
| |
| |
| |
| |
| |
| |
| |
| |
| | | | | | | | | | | | | | | | | | | |
| 2012 | | — |
| | — |
| | — |
| | — |
| | — |
| | 700.0 |
| | 4.11 |
| | — |
| | — |
| | 0.7 |
| |
| 2013 | | — |
| | — |
| | 235.0 |
| | 4.00 |
| | 5.45 |
| | — |
| | — |
| | — |
| | — |
| | 0.1 |
| | — |
| | — |
| | 235.0 |
| | 4.00 |
| | 5.45 |
| | — |
| | — |
| | — |
| | — |
| | 0.2 |
|
| 2014 | | — |
| | — |
| | 1,115.0 |
| | 4.50 |
| | 5.67 |
| | — |
| | — |
| | — |
| | — |
| | 0.7 |
| | — |
| | — |
| | 1,115.0 |
| | 4.50 |
| | 5.67 |
| | 4,828.0 |
| | 4.00 |
| | — |
| | — |
| | 1.8 |
|
| 2015 | — |
| — |
| | — |
| | 1,040.0 |
| | 4.50 |
| | 5.67 |
| | — |
| | — |
| | — |
| | — |
| | 0.6 |
| — |
| — |
| | — |
| | 1,040.0 |
| | 4.50 |
| | 5.67 |
| | 2,730.0 |
| | 4.01 |
| | — |
| | — |
| | 0.6 |
|
| |
| |
| |
| |
| |
| |
| |
| |
| |
| |
| | | | | | | | | | | | | | | | | | | |
| PEPL | |
| |
| |
| |
| |
| |
| |
| |
| |
| |
| | | | | | | | | | | | | | | | | | | |
| 2012 | | — |
| | — |
| | — |
| | — |
| | — |
| | 1,355.8 |
| | 6.18 |
| | — |
| | — |
| | 4.2 |
| |
| 2013 | | — |
| | — |
| | — |
| | — |
| | — |
| | 990.4 |
| | 6.18 |
| | — |
| | — |
| | 2.4 |
| | — |
| | — |
| | — |
| | — |
| | — |
| | 990.4 |
| | 6.18 |
| | — |
| | — |
| | 2.8 |
|
| |
| |
| |
| |
| |
| |
| |
| |
| |
| |
| | | | | | | | | | | | | | | | | | | | |
| Total Natural Gas | | — |
| |
| | 11,741.8 |
| |
| |
| | 32,473.4 |
| |
| | 19,758.0 |
| |
| | 55.2 |
| |
| Total Natural Gas (3) | | | 5,630.0 |
| | | | 2,390.0 |
| | | | | | 60,832.9 |
| | | | 32,150.7 |
| | | | 22.1 |
|
| |
| |
| |
| |
| |
| |
| |
| |
| |
| |
| | | | | | | | | | | | | | | | | | | | |
| Crude Oil | |
| |
| |
| |
| |
| |
| |
| |
| |
| |
| | | | | | | | | | | | | | | | | | | |
| NYMEX | |
| |
| |
| |
| |
| |
| |
| |
| |
| |
| | | | | | | | | | | | | | | | | | | |
| 2012 | | 36.0 |
| | 65.38 |
| | 643.6 |
| | 81.41 |
| | 106.28 |
| | 684.0 |
| | 90.97 |
| | — |
| | — |
| | (6.6 | ) | |
| 2013 | | — |
| | — |
| | 617.6 |
| | 78.89 |
| | 104.27 |
| | 486.9 |
| | 90.19 |
| | — |
| | — |
| | (4.2 | ) | | — |
| | — |
| | 1,105.6 |
| | 80.46 |
| | 103.58 |
| | 1,220.9 |
| | 96.26 |
| | — |
| | — |
| | 4.7 |
|
| 2014 | | — |
| | — |
| | 36.0 |
| | 90.00 |
| | 106.15 |
| | — |
| | — |
| | — |
| | — |
| | 0.1 |
| | — |
| | — |
| | 1,032.0 |
| | 82.83 |
| | 102.55 |
| | 360.0 |
| | 97.36 |
| | — |
| | — |
| | 0.6 |
|
| 2015 | | — |
| | — |
| | 36.0 |
| | 90.00 |
| | 106.15 |
| | — |
| | — |
| | — |
| | — |
| | 0.2 |
| | — |
| | — |
| | 36.0 |
| | 90.00 |
| | 106.15 |
| | — |
| | — |
| | — |
| | — |
| | 0.2 |
|
| | | | | | | | | | | | | | | | | | | | | | | | | | | | | | | | | | | | | | | | | |
| Total Crude Oil | | 36.0 |
| | | | 1,333.2 |
| | | | | | 1,170.9 |
| | | | — |
| | | | (10.5 | ) | | — |
| | | | 2,173.6 |
| | | | | | 1,580.9 |
| | | | — |
| | | | 5.5 |
|
| Total Natural Gas and Crude Oil | | | | | | | | | | | | | | | | | | | | $ | 44.7 |
| Total Natural Gas and Crude Oil | | | | | | | | | | | | | | | | $ | 27.6 |
|
| | | | | | | | | | | | | | | | | | | | | | | | | | | | | | | | | | | | | | | |
_______________________
|
| | |
(1 | )(1) | A standard unit of measurement for natural gas (one BBtu equals one MMcf). |
(2 | ) |
| (2) | Approximately 29.5%29.4% of the fair value of our derivative assets and 9.1%8% of our derivative liabilities were measured using significant unobservable inputs (Level 3); see. See Note 3, Fair Value Measurements, to the consolidated financial statements included elsewhere in this report. |
| |
| (3) | Pursuant to a purchase and sale agreement entered into on February 4, 2013, approximately 36,546 BBtu of natural gas hedging positions will be assumed by certain affiliates of Caerus Oil and Gas LLC upon the closing of the planned sale. There can be no assurance we will be successful in closing such divestiture. See Note 19, Subsequent Events, to our consolidated financial statements included elsewhere in this report for additional information regarding the planned divestiture of certain of our natural gas properties. |
The following table presents our derivative positions related to our natural gas marketing in effect as of December 31, 2011.
|
| | | | | | | | | | | | | | | | | | |
| | | Fixed-Price Swaps | | NYMEX Basis Protection Swaps | | |
Commodity/ Derivative Instrument/ Maturity Period | | Quantity (BBtu)(1) | | Weighted Average Contract Price | | Quantity (BBtu)(1) | | Weighted Average Contract Price | | Fair Value December 31, 2011 (2) (in millions) |
| | | | | |
| Natural Gas | |
| |
| |
| |
| |
|
| Sales | |
| |
| |
| |
| |
|
| Physical | |
| |
| |
| |
| |
|
| 2012 | | 33.8 |
| | $ | 5.16 |
| | 56.5 |
| | $ | 0.96 |
| | $ | 0.1 |
|
| 2013 | | 2.8 |
| | 5.61 |
| | — |
| | — |
| | — |
|
| |
| |
| |
| |
| |
|
| Financial | |
| |
| |
| |
| |
|
| 2012 | | 871.6 |
| | 4.87 |
| | 227.6 |
| | 0.07 |
| | 1.5 |
|
| 2013 | | 90.0 |
| | 5.00 |
| | — |
| | — |
| | 0.1 |
|
| |
| |
| |
| |
| |
|
| Purchases | |
| |
| |
| |
| |
|
| Physical | |
| |
| |
| |
| |
|
| 2012 | | 870.4 |
| | 4.85 |
| | — |
| | — |
| | (1.3 | ) |
| 2013 | | 90.0 |
| | 4.99 |
| | — |
| | — |
| | (0.1 | ) |
| |
| |
| |
| |
| |
|
| Financial | |
| |
| |
| |
| |
|
| 2012 | | 33.8 |
| | 4.23 |
| | 30.4 |
| | 0.13 |
| | (0.1 | ) |
| 2013 | | 2.8 |
| | 4.18 |
| | — |
| | — |
| | — |
|
| Total Natural Gas | | 1,995.2 |
| |
| | 314.5 |
| |
| | $ | 0.2 |
|
| | | | | | | | | | | |
__________
|
| | |
(1 | ) | A standard unit of measurement for natural gas (one BBtu equals one MMcf). |
(2 | ) | Approximately 6.1% of the fair value of our derivative assets and none of our derivative liabilities were measured using significant unobservable inputs (Level 3); see Note 3, Fair Value Measurements, to the consolidated financial statements included in this report. |
The following table presents monthlyannual average NYMEX and CIG closing prices for natural gas and crude oil for the years ended December 31, 2012 and 2011 and 2010,, as well as average sales prices we realized for the respective commodities.commodities:
| | | | Year Ended December 31, | Year Ended December 31, |
| | 2011 | | 2010 | 2012 | | 2011 |
| Average Index Closing Price | | | | |
| Average Index Closing Price: | | | | |
| Natural Gas (per MMBtu) | | | | | | |
| CIG | $ | 3.79 |
| | $ | 3.92 |
| $ | 2.58 |
| | $ | 3.79 |
|
| NYMEX | 4.04 |
| | 4.39 |
| 2.79 |
| | 4.04 |
|
| Crude Oil (per Bbl) | | | | | | |
| NYMEX | 94.01 |
| | 77.32 |
| $ | 94.92 |
| | $ | 94.01 |
|
| | | | | | | |
| Average Sales Price Realized | | | | |
| Average Sales Price Realized: | | | | |
| Excluding realized derivative gains/(losses) | | | | | | |
| Natural Gas (per Mcf) | $ | 3.27 |
| | $ | 3.61 |
| $ | 2.18 |
| | $ | 3.27 |
|
| Crude Oil (per Bbl) | 87.63 |
| | 73.96 |
| 87.14 |
| | 87.63 |
|
| Including realized derivative gains/(losses) | | | | | | |
| Natural Gas (per Mcf) | 4.23 |
| | 5.13 |
| $ | 3.72 |
| | $ | 4.23 |
|
| Crude Oil (per Bbl) | 80.69 |
| | 79.70 |
| 86.87 |
| | 80.69 |
|
Based on a sensitivity analysis as of December 31, 20112012, it was estimated that a 10% increase in natural gas and crude oil prices, inclusive of basis, over the entire period for which we have derivatives in place, including those designated to our affiliated partnerships, would have resulted in a decrease in fair value of $35.9$52.6 million; whereas a 10% decrease in prices would have resulted in an increase in fair value of $35.2$51.9 million. Excluding the derivatives designated to our affiliated partnerships, the same 10% increase or decrease in natural gas and crude oil prices would have resulted in a decrease in fair value of $34.6$52.1 million and an increase in fair value of $33.9$51.5 million, respectively.
See Note 3, Fair Value of Financial Instruments, and Note 4, Derivative Financial Instruments, to our consolidated financial statements included elsewhere in this report for a summary of our open derivative positions, as well as a discussion of how we determine the fair value of and account for our derivative contracts.
Credit Risk
Credit risk represents the loss that we would incur if a counterparty fails to perform under its contractual obligations. We attempt to reduce credit risk by diversifying our counterparty exposure and entering into transactions with high-quality counterparties. When exposed to credit risk, we analyze the counterparties’ financial condition prior to entering into an agreement, establish credit limits and monitor the appropriateness of those limits on an ongoing basis.
With regard to ourOur Oil and Gas Exploration and Production segment, inherent to our industry is the concentration ofsegment's natural gas, NGLNGLs and crude oil sales are concentrated with a few predominately large customers. This concentrates the significance of our credit risk exposure to a fewsmall number of large customers. This industry concentration has the potentialAmounts due to impact our overall exposure to credit risk, either positively or negatively, in that our customers may be similarly affected by changes in economic and financial conditions, commodity prices or other conditions. As for our Gas Marketing segment our receivables are from a diverse group of companies,entities, including major energy companies, both upstream and mid-stream,midstream energy companies, financial institutions and end-users in various industries. We monitor their creditworthiness through our credit reportscommittee, which utilizes a number of qualitative and rating agency reports.quantitative tools to assess credit risk and takes mitigative actions if deemed necessary. To date, we have had no material counterparty default losses in either of our Oil and Gas Exploration and Production or Gas Marketing segments. See Note 5, Concentration of Risk, to our consolidated financial statements included elsewhere in this report.
Our derivative financial instruments may expose us to the credit risk of nonperformance by the counterparty to the contracts.instrument's contract counterparty. We primarily use financial institutions which are also major lenders in our revolving credit facility as counterparties for our derivative financial instruments. We monitor their creditworthiness through our credit committee which utilizes a number of qualitative and quantitative tools to assess credit risk and takes mitigative actions if deemed necessary. To date, we have had no material counterparty default losses from our derivative financial instruments. See Note 4, Derivative Financial Instruments, to our derivative contracts. We have evaluated the credit risk of the counterparties holdingconsolidated financial statements included in this report for more detail on our derivative assets using relevant credit market default rates, giving consideration to amounts outstanding from each counterparty and the duration of each outstanding derivative position. Based on our evaluation, we have determined that the impact of the nonperformance of our counterparties on the fair value of our derivative instruments is insignificant.financial instruments.
Disruption in the credit market may have a significant adverse impact on a number of financial institutions. We monitor the creditworthiness of the financial institutions with which we transact, giving consideration to the reports of credit agencies and their related ratings. While we believe that our monitoring procedures are sufficient and customary, no amount of analysis can assure performance by a financial institution. See Part I, Item 1A, Risk Factors - Credit and funding challenges of French banks who are participants in our revolving credit facility and counterpartiesto some of our natural gas and crude oil derivative holdings could have a material adverse effect on our operations and financial condition,included in this report.
Disclosure of Limitations
Because the information above included only those exposures that existed at December 31, 20112012, it does not consider those exposures or positions which could arise after that date. As a result, our ultimate realized gain or loss with respect to interest rate and commodity price fluctuations will depend on the exposures that arise during the period, our commodity price risk management strategies at the time, and interest rates and commodity prices at the time.
ITEM 8. FINANCIAL STATEMENTS AND SUPPLEMENTARY DATA
The response to this Item is set forth herein in a separate section of this report, beginning on Page F-1.
ITEM 9. CHANGES IN AND DISAGREEMENTS WITH ACCOUNTANTS ON ACCOUNTING AND FINANCIAL DISCLOSURE
None.
ITEM 9A. CONTROLS AND PROCEDURES
Evaluation of Disclosure Controls and Procedures
As of December 31, 20112012, we carried out an evaluation under the supervision and with the participation of management, including the Chief Executive Officer and the Chief Financial Officer, of the effectiveness of the design and operation of our disclosure controls and procedures pursuant to Exchange Act Rules 13a-15(e) and 15d-15(e). Based on the results of this evaluation, the Chief Executive Officer and the Chief Financial Officer concluded that our disclosure controls and procedures were effective as of December 31, 20112012.
Changes in Internal Control over Financial Reporting
During the fourth quarter of 20112012, we made no changes in our internal control over financial reporting (as such term is defined in Rules 13a-15(f) and 15d-15(f) of the Exchange Act) that have materially affected or are reasonably likely to materially affect our internal control over financial reporting.
ITEM 9B. OTHER INFORMATION
None.
PART III
ITEM 10. DIRECTORS, EXECUTIVE OFFICERS AND CORPORATE GOVERNANCE
Information relating to this Item will be included in an amendment to this report or the proxy statement to be filed pursuant to Regulation 14A for our 20122013 Annual Stockholders' meeting and is incorporated by reference in this report.
ITEM 11. EXECUTIVE COMPENSATION
Information relating to this Item will be included in an amendment to this report or the proxy statement to be filed pursuant to Regulation 14A for our 20122013 Annual Stockholders' meeting and is incorporated by reference in this report.
ITEM 12. SECURITY OWNERSHIP OF CERTAIN BENEFICIAL OWNERS AND MANAGEMENT AND RELATED STOCKHOLDER MATTERS
Information relating to this Item will be included in an amendment to this report or the proxy statement to be filed pursuant to Regulation 14A for our 20122013 Annual Stockholders' meeting and is incorporated by reference in this report.
ITEM 13. CERTAIN RELATIONSHIPS AND RELATED TRANSACTIONS AND DIRECTOR INDEPENDENCE
Information relating to this Item will be included in an amendment to this report or the proxy statement to be filed pursuant to Regulation 14A for our 20122013 Annual Stockholders' meeting and is incorporated by reference in this report.
ITEM 14. PRINCIPAL ACCOUNTANT FEES AND SERVICES
Information relating to this Item will be included in an amendment to this report or the proxy statement to be filed pursuant to Regulation 14A for our 20122013 Annual Stockholders' meeting and is incorporated by reference in this report.
PART IV
ITEM 15. EXHIBITS, FINANCIAL STATEMENT SCHEDULESSCHEDULE
|
| | | |
| (a) | (1 | ) | Financial Statements: |
| | | See Index to Financial Statements and Schedules on page F-1. |
| | (2 | ) | Financial Statement Schedules:Schedule: |
| | | See Index to Financial Statements and SchedulesSchedule on page F-1. |
| | | Schedules and Financial Statements Omitted |
| | | All other financial statement schedules are omitted because they are not required, inapplicable or the information is included in the Financial Statements or Notes thereto. |
| | (3 | ) | Exhibits: |
| | | See Exhibits Index on the following page. |
Exhibits Index
|
| | | | | | | | | | | | |
| | | | | Incorporated by Reference | | |
| Exhibit | | | | | | SEC File | | | | | | Filed |
| Number | | Exhibit Description | | Form | | Number | | Exhibit | | Filing Date | | Herewith |
| | | | | | | | | | | | | |
| 3.1 | | Second Amended and Restated Certificate of Incorporation of Petroleum Development Corporation. | | 8-K | | 000-07246 | | 3.1 | | 7/23/2008 | | |
| | | | | | | | | | | | | |
| 3.2 | | Bylaws of Petroleum Development Corporation, amended and restated, effective October 11, 2007. | | 8-K | | 000-07246 | | 3.2 | | 10/17/2007 | | |
| | | | | | | | | | | | | |
| 4.1 | | Rights Agreement by and between Petroleum Development Corporation and Transfer Online, Inc., as Rights Agent, dated as of September 11, 2007, including the forms of Rights Certificates and Summary of Stockholder Rights Plan attached thereto as Exhibits A and B. | | 8-K | | 000-07246 | | 4.1 | | 9/14/2007 | | |
| | | | | | | | | | | | | |
| 4.2 | | Indenture dated as of February 8, 2008, by and among Petroleum Development Corporation and The Bank of New York. | | 8-K | | 000-07246 | | 4.1 | | 2/12/2008 | | |
| | | | | | | | | | | | | |
| 4.3 | | First Supplemental Indenture dated as of February 8, 2008, by and among Petroleum Development Corporation and the Bank of New York. | | 8-K | | 000-07246 | | 4.2 | | 2/12/2008 | | |
| | | | | | | | | | | | | |
| 4.4 | | Form of 12% Senior Note due 2018. | | 8-K | | 000-07246 | | 4.3 | | 2/12/2008 | | |
| | | | | | | | | | | | | |
| 4.5 | | Indenture, dated November 23, 2010, between the Company and The Bank of New York Mellon. | | 8-K | | 000-07246 | | 4.1 | | 11/24/2010 | | |
| | | | | | | | | | | | | |
| 4.6 | | Form of 3.25% Convertible Senior Note due 2016 | | 8-K | | 000-07246 | | 4.1 | | 11/24/2010 | | |
| | | | | | | | | | | | | |
| 10.1 | | Purchase Agreement dated as of February 1, 2008, by and among Petroleum Development Corporation and the Initial Purchasers of 12% senior notes due 2018 named therein. | | 8-K | | 000-07246 | | 10.1 | | 2/7/2008 | | |
| | | | | | | | | | | | | |
| 10.2 | | Registration Rights Agreement dated as of February 8, 2008, by and among Petroleum Development Corporation and the Initial Purchasers of 12% senior notes due 2018 named therein. | | 8-K | | 000-07246 | | 10.1 | | 2/12/2008 | | |
| | | | | | | | | | | | | |
| 10.3 | | Underwriting Agreement dated August 11, 2009 among the Company and J.P. Morgan Securities Inc., as representative of the several Underwriters named therein. | | 8-K | | 000-07246 | | 1.1 | | 8/12/2009 | | |
| | | | | | | | | | | | | |
| 10.4* | | Indemnification Agreement with Directors. | | 10-Q | | 000-07246 | | 10.1 | | 8/9/2007 | | |
| | | | | | | | | | | | | |
| 10.5* | | The Petroleum Development Corporation 401(k) & Profit Sharing Plan. | | 10-K | | 000-07246 | | 10.6 | | 2/24/2011 | | |
| | | | | | | | | | | | | |
| 10.6 | | Contribution Agreement by and among PDC Mountaineer, LLC, as the Company, Petroleum Development Corporation, as the Contributor, and LR-Mountaineer Holdings, L.P., as the Investor, dated October 29, 2009. | | 8-K | | 000-07246 | | 2.1 | | 11/4/2009 | | |
| | | | | | | | | | | | | |
| 10.7 | | Limited Liability Company Agreement of PDC Mountaineer, LLC, dated October 29, 2009. | | 8-K | | 000-07246 | | 10.1 | | 11/4/2009 | | |
| | | | | | | | | | | | | |
| 10.8* | | Non-Employee Director Deferred Compensation Plan. | | S-8 | | 333-118222 | | 99.1 | | 8/13/2004 | | |
| | | | | | | | | | | | | |
| 10.9* | | 2004 Long-Term Equity Compensation Plan. | | S-8 | | 333-118215 | | | | 8/13/2004 | | |
| | | | | | | | | | | | | |
| 10.10* | | 2004 Long-Term Equity Compensation Plan amended and restated as of March 8, 2008. | | 10-K | | 000-07246 | | 10.26 | | 2/27/2009 | | |
| | | | | | | | | | | | | |
| 10.11* | | 2010 Executive Officers Long-Term Incentive Compensation Share Agreement. | | 8-K | | 000-07246 | | | | 4/23/2010 | | |
| | | | | | | | | | | | | |
| 10.12* | | 2011 Executive Officers Long-Term Incentive Compensation Share Agreement, including Form of 2010 Performance Share Agreement as Exhibit 10.1. | | 8-K | | 000-07246 | | | | 3/17/2011 | | |
| | | | | | | | | | | | | |
| 10.13* | | 2012 Executive Officers Long-Term Incentive Compensation Share Agreement, including Form of 2012 Performance Share Agreement as Exhibit 10.1. | | 8-K | | 000-07246 | | | | 1/20/2012 | | |
|
| | | | | | | | | | | | |
| | | | | Incorporated by Reference | | |
| Exhibit | | | | | | SEC File | | | | | | Filed |
| Number | | Exhibit Description | | Form | | Number | | Exhibit | | Filing Date | | Herewith |
| | | | | | | | | | | | | |
| 3.1 | | Third Amended and Restated Articles of Incorporation of PDC Energy, Inc. (the "Company")
| | 10-Q | | 000-07246 | | 3.1 | | 8/2/2012 | | |
| | | | | | | | | | | | | |
| 3.2 | | By-laws of the Company. | | 10-Q | | 000-07246 | | 3.2 | | 8/2/2012 | | |
| | | | | | | | | | | | | |
| 4.1 | | Rights Agreement by and between the Company and Transfer Online, Inc., as Rights Agent, dated as of September 11, 2007, including the forms of Rights Certificates and Summary of Stockholder Rights Plan attached thereto as Exhibits A and B. | | 8-K | | 000-07246 | | 4.1 | | 9/17/2007 | | |
| | | | | | | | | | | | | |
| 4.2 | | Indenture, dated November 23, 2010, between the Company and The Bank of New York Mellon, including the form of 3.25% Convertible Senior Note due 2016. | | 8-K | | 000-07246 | | 4.1 | | 11/24/2010 | | |
| | | | | | | | | | | | | |
| 4.3 | | Indenture, dated as of October 3, 2012, by and between the Company and U.S. Bank Trust National Association, as Trustee, including the form of 7.75% Senior Notes due 2022. | | 8-K | | 000-07246 | | 4.1 | | 10/3/2012 | | |
| | | | | | | | | | | | | |
| 10.1* | | Indemnification Agreement with Non-Employee Directors. | | 8-K | | 000-07246 | | 10.1 | | 6/13/2012 | | |
| | | | | | | | | | | | | |
| 10.2* | | The Company 401(k) & Profit Sharing Plan. | | 10-K | | 000-07246 | | 10.6 | | 2/24/2011 | | |
| | | | | | | | | | | | | |
| 10.3* | | Non-Employee Director Deferred Compensation Plan. | | S-8 | | 333-118222 | | 99.1 | | 8/13/2004 | | |
| | | | | | | | | | | | | |
| 10.4* | | 2004 Long-Term Equity Compensation Plan amended and restated as of March 8, 2008 ("2004 Plan"). | | 10-K | | 000-07246 | | 10.26 | | 2/27/2009 | | |
| | | | | | | | | | | | | |
| 10.4.1* | | Form of SAR Agreement under the 2004 Plan. | | 10-K | | 000-07246 | | 10.26 | | 2/27/2009 | | |
| | | | | | | | | | | | | |
| 10.4.2* | | Form of Restricted Stock Agreement under the 2004 Plan. | | 10-K | | 000-07246 | | 10.26 | | 2/27/2009 | | |
| | | | | | | | | | | | | |
| 10.5* | | 2010 Long-Term Equity Compensation Plan, dated as of April 11, 2010 ("2010 Plan"). | | S-8 | | 333-167945 | | 99.1 | | 7/1/2010 | | |
| | | | | | | | | | | | | |
| 10.5.1* | | Summary of 2010 Stock Appreciation Rights and Restricted Stock Awards under the 2010 Plan. | | 8-K | | 000-07246 | |
| | 4/23/2010 | | |
| | | | | | | | | | | | | |
| 10.6* | | Form of 2010 Performance Share Agreement. | | 8-K | | 000-07246 | | 10.1 | | 3/17/2011 | | |
| | | | | | | | | | | | | |
| 10.7* | | Form of 2012 Performance Share Agreement. | | 8-K | | 000-07246 | | 10.1 | | 1/20/2012 | | |
| | | | | | | | | | | | | |
| 10.8* | | Executive severance compensation plan. | | 8-K | | 000-07246 | | 10.2 | | 9/25/2012 | | |
| | | | | | | | | | | | | |
| 10.9* | | Form of 2013 Performance Share Agreement. | | | | | | | | | | X |
| | | | | | | | | | | | | |
| 10.10* | | Form of 2013 Restricted Stock/Stock Appreciation Rights Agreement. | | | | | | | | | | X |
| | | | | | | | | | | | | |
| 10.11* | | Employment Agreement with Gysle R. Shellum, Chief Financial Officer, dated as of April 19, 2010. | | 8-K | | 000-07246 | | 10.2 | | 4/23/2010 | | |
| | | | | | | | | | | | | |
| 10.12* | | Employment Agreement with Daniel W. Amidon, General Counsel and Corporate Secretary, dated as of April 19, 2010. | | 8-K | | 000-07246 | | 10.3 | | 4/23/2010 | | |
| | | | | | | | | | | | | |
| 10.13* | | Employment Agreement with Lance A. Lauck, Senior Vice President of Business Development, dated as of April 19, 2010. | | 8-K | | 000-07246 | | 10.4 | | 4/23/2010 | | |
| | | | | | | | | | | | | |
| 10.14* | | Employment Agreement with James M. Trimble, President and Chief Executive Officer, dated as of November 1, 2011. | | 10-Q | | 000-07246 | | 10.2 | | 11/3/2011 | | |
| | | | | | | | | | | | | |
| 10.15* | | Employment Agreement with Barton R. Brookman, Jr., Senior Vice President of Exploration and Production, dated as of April 19, 2010. | | 8-K | | 000-07246 | | 10.5 | | 4/23/2010 | | |
| | | | | | | | | | | | | |
| 10.16 | | Contribution Agreement by and among PDC Mountaineer, LLC, as the Company, Petroleum Development Corporation, as the Contributor, and LR-Mountaineer Holdings, L.P., as the Investor, dated October 29, 2009. | | 8-K | | 000-07246 | | 2.1 | | 11/4/2009 | | |
| | | | | | | | | | | | | |
| 10.17 | | Limited Liability Company Agreement of PDC Mountaineer, LLC, dated October 29, 2009. | | 8-K | | 000-07246 | | 10.1 | | 11/4/2009 | | |
| | | | | | | | | | | | | |
|
| | | | | | | | | | | | |
| | | | | Incorporated by Reference | | |
| Exhibit Number | | Exhibit Description | | Form | | SEC File Number | | Exhibit | | Filing Date | | Filed Herewith |
| | | | | | | | | | | | | |
| 10.14* | | Employment Agreement with Richard W. McCullough, Chief Executive Officer, dated as of April 19, 2010. | | 8-K | | 000-07246 | | 10.1 | | 4/23/2010 | | |
| | | | | | | | | | | | | |
| 10.15* | | Employment Agreement with Gysle R. Shellum, Chief Financial Officer, dated as of April 19, 2010. | | 8-K | | 000-07246 | | 10.2 | | 4/23/2010 | | |
| | | | | | | | | | | | | |
| 10.16* | | Employment Agreement with Daniel W. Amidon, General Counsel and Corporate Secretary, dated as of April 19, 2010 | | 8-K | | 000-07246 | | 10.3 | | 4/23/2010 | | |
| | | | | | | | | | | | | |
| 10.17* | | Employment Agreement with Lance A. Lauck, Senior Vice President of Business Development, dated as of April 19, 2010. | | 8-K | | 000-07246 | | 10.4 | | 4/23/2010 | | |
| | | | | | | | | | | | | |
| 10.18* | | Employment Agreement with James M. Trimble, President and Chief Executive Officer, dated as of November 1, 2011. | | 10-Q | | 000-07246 | | 10.2 | | 11/3/2011 | | |
| | | | | | | | | | | | | |
| 10.19* | | Separation Agreement and General Release with Richard W. McCullough, former Chairman and Chief Executive Officer, dated as of July 12, 2011. | | 8-K | | 000-07246 | | 10.1 | | 7/18/2011 | | |
| | | | | | | | | | | | | |
| 10.20* | | Employment Agreement with Barton R. Brookman, Jr., Senior Vice President of Exploration and Production, dated as of April 19, 2010. | | 8-K | | 000-07246 | | 10.5 | | 4/23/2010 | | |
| | | | | | | | | | | | | |
| 10.21* | | 2010 Long-Term Equity Compensation Plan, dated as of April 11, 2010. | | S-8 | | 333-167945 | | 99.1 | | 7/1/2010 | | |
| | | | | | | | | | | | | |
| 10.22 † | | Domestic Crude Oil Purchase Agreement between Suncor Energy Marketing, Inc. and PDC, dated May 18, 2009. | | 10-Q | | 000-53201 | | 10.1 | | 5/18/2009 | | |
| | | | | | | | | | | | | |
| 10.23 † | | Gas Purchase Agreement between Williams Production RMT Company, Riley Natural Gas and Petroleum Development Corporation, dated as of March 31, 2009. | | 10/A No. 3 | | 000-53201 | | 10.7 | | 3/31/2009 | | |
| | | | | | | | | | | | | |
| 10.24 † | | First Amendment to the Gas Purchase Agreement between Williams Production RMT Company, Riley Natural Gas and Petroleum Development Corporation, dated as of June 1, 2011. | | 8-K | | 000-07246 | | 10.1 | | 8/2/2011 | | |
| | | | | | | | | | | | | |
| 10.25† | | Gas Purchase and Processing Agreement between Duke Energy Field Services, Inc.; United States Exploration, Inc.; and Petroleum Development Corporation, dated as of October 28, 1999. | | 10/A No. 3 | | 000-53201 | | 10.3 | | 3/31/2009 | | |
| | | | | | | | | | | | | |
| 10.26 | | Second Amended and Restated Credit Agreement dated as of November 5, 2010, Petroleum Development Corporation, as borrower and JPMorgan Chase Bank, N.A. and BNP Paribas, as lenders. | | 8-K | | 000-07246 | | 10.1 | | 11/12/2010 | | |
| | | | | | | | | | | | | |
| 10.27 | | Underwriting Agreement dated November 18, 2010, among Petroleum Development Corporation and Wells Fargo Securities, LLC and Merrill Lynch, Pierce, Fenner & Smith Incorporated, as representatives of the several underwriters. | | 8-K | | 000-07246 | | 1.1 | | 11/24/2010 | | |
| | | | | | | | | | | | | |
| 10.28 | | Purchase Agreement, dated as of November 18, 2010, among Petroleum Development Corporation and Wells Fargo Securities, LLC and Merrill Lynch, Pierce, Fenner & Smith Incorporated, as representatives of the initial purchasers. | | 8-K | | 000-07246 | | 1.1 | | 11/24/2010 | | |
| | | | | | | | | | | | | |
| 10.29 | | First Amendment to Second Amended and Restated Credit Agreement, dated as of December 22, 2010. | | 10-K | | 000-07246 | | 10.29 | | 2/24/2011 | | |
| | | | | | | | | | | | | |
| 10.30 | | Second Amendment to Second Amended and Restated Credit Agreement, dated as of October 12, 2011. | | 8-K | | 000-07246 | | 10.1 | | 10/18/2011 | | |
| | | | | | | | | | | | | |
| 10.31 | | Purchase and Sale Agreement by and between Petroleum Development Corporation and COG Operating LLC, dated December 20, 2011. | | | | | | | | | | X |
| | | | | | | | | | | | | |
| 12.1 | | Computation of Ratio of Earnings to Fixed Charges. | | | | | | | | | | X |
| | | | | | | | | | | | | |
| 14.1 | | Code of Business Conduct and Ethics. | | 10-Q | | 000-17246 | | 14.1 | | 8/10/2009 | | |
| | | | | | | | | | | | | |
| 21.1 | | Subsidiaries. | | | | | | | | | | X |
| | | | | | | | | | | | | |
|
| | | | | | | | | | | | |
| | | | | Incorporated by Reference | | |
| Exhibit | | | | | | SEC File | | | | | | Filed |
| Number | | Exhibit Description | | Form | | Number | | Exhibit | | Filing Date | | Herewith |
| | | | | | | | | | | | | |
| 10.18 † | | Domestic Crude Oil Purchase Agreement between Suncor Energy Marketing, Inc. and the Company, dated May 18, 2009. | | 10-Q | | 000-53201 | | 10.1 | | 5/18/2009 | | |
| | | | | | | | | | | | | |
| 10.19 † | | Gas Purchase Agreement between Williams Production RMT Company, Riley Natural Gas and the Company, dated as of June 1, 2006. | | 10/A No. 3 | | 000-53201 | | 10.7 | | 3/31/2009 | | |
| | | | | | | | | | | | | |
| 10.20 † | | First Amendment to the Gas Purchase Agreement between Williams Production RMT Company, Riley Natural Gas and the Company, dated as of June 1, 2011. | | 8-K | | 000-07246 | | 10.1 | | 8/2/2011 | | |
| | | | | | | | | | | | | |
| 10.21 † | | Gas Purchase and Processing Agreement between Duke Energy Field Services, Inc.; United States Exploration, Inc.; and the Company, dated as of October 28, 1999. | | 10/A No. 3 | | 000-53201 | | 10.3 | | 3/31/2009 | | |
| | | | | | | | | | | | | |
| 10.22 | | Second Amended and Restated Credit Agreement dated as of November 5, 2010, between the Company, as borrower and JPMorgan Chase Bank, N.A. and BNP Paribas, as agents. | | 8-K | | 000-07246 | | 10.1 | | 11/12/2010 | | |
| | | | | | | | | | | | | |
| 10.23.1 | | First Amendment to Second Amended and Restated Credit Agreement, dated as of December 22, 2010. | | 10-K | | 000-07246 | | 10.29 | | 2/24/2011 | | |
| | | | | | | | | | | | | |
| 10.23.2 | | Second Amendment to Second Amended and Restated Credit Agreement, dated as of October 12, 2011. | | 8-K | | 000-07246 | | 10.1 | | 10/18/2011 | | |
| | | | | | | | | | | | | |
| 10.23.3 | | Third Amendment to the Second Amended and Restated Credit Agreement, dated as of May 4, 2012. | | 10-Q | | 000-07246 | | 10.1 | | 5/10/2012 | | |
| | | | | | | | | | | | | |
| 10.23.4 | | Fourth Amendment to the Second Amended and Restated Credit Agreement, dated as of June 25, 2012.
| | 8-K | | 000-07246 | | 99.1 | | 7/2/2012 | | |
| | | | | | | | | | | | | |
| 10.23.5 | | Fifth Amendment to the Second Amended and Restated Credit Agreement, dated as of June 29, 2012. | | 8-K | | 000-07246 | | 10.1 | | 7/2/2012 | | |
| | | | | | | | | | | | | |
| 10.23.6 | | Sixth Amendment to the Second Amended and Restated Credit Agreement, dated as of September 21, 2012. | | 8-K | | 000-07246 | | 10.1 | | 9/25/2012 | | |
| | | | | | | | | | | | | |
| 12.1 | | Computation of Ratio of Earnings to Fixed Charges. | | | | | | | | | | X |
| | | | | | | | | | | | | |
| 14.1 | | Code of Business Conduct and Ethics. | | 10-Q | | 000-17246 | | 14.1 | | 8/10/2009 | | |
| | | | | | | | | | | | | |
| 21.1 | | Subsidiaries. | | | | | | | | | | X |
| | | | | | | | | | | | | |
| 23.1 | | Consent of PricewaterhouseCoopers LLP. | | | | | | | | | | X |
| | | | | | | | | | | | | |
| 23.2 | | Consent of Ryder Scott Company, L.P., Petroleum Consultants. | | | | | | | | | | X |
| | | | | | | | | | | | | |
| 31.1 | | Certification by Chief Executive Officer pursuant to Rule 13a-14(a) and 15d-14(a) of the Exchange Act Rules, as adopted pursuant to Section 302 of the Sarbanes-Oxley Act of 2002. | | | | | | | | | | X |
| | | | | | | | | | | | | |
| 31.2 | | Certification by Chief Financial Officer pursuant to Rule 13a-14(a) and 15d-14(a) of the Exchange Act Rules, as adopted pursuant to Section 302 of the Sarbanes-Oxley Act of 2002. | | | | | | | | | | X |
| | | | | | | | | | | | | |
| 32.1** | | Certifications by Chief Executive Officer and Chief Financial Officer pursuant to Title 18 U.S.C. Section 1350, as adopted pursuant to Section 906 of Sarbanes-Oxley Act of 2002. | | | | | | | | | | |
| | | | | | | | | | | | | |
| 99.1 | | Report of Independent Petroleum Consultants - Ryder Scott Company, L.P. | | | | | | | | | | X |
| | | | | | | | | | | | | |
| 101.INS** | | XBRL Instance Document | | | | | | | | | | |
| | | | | | | | | | | | | |
| 101.SCH** | | XBRL Taxonomy Extension Schema Document | | | | | | | | | | |
| | | | | | | | | | | | | |
| 101.CAL** | | XBRL Taxonomy Extension Calculation Linkbase Document | | | | | | | | | | |
| | | | | | | | | | | | | |
| 101.DEF** | | XBRL Taxonomy Extension Definition Linkbase Document | | | | | | | | | | |
| | | | | | | | | | | | | |
| 101.LAB** | | XBRL Taxonomy Extension Label Linkbase Document | | | | | | | | | | |
| | | | | | | | | | | | | |
| 101.PRE** | | XBRL Taxonomy Extension Presentation Linkbase Document | | | | | | | | | | |
| | | | | | | | | | | | | |
| *Management contract or compensatory plan or arrangement. | | | | | | | | | | |
| ** Furnished herewith. |
|
| | | | | | | | | | | | |
| | | | | Incorporated by Reference | | |
| Exhibit | | | | | | SEC File | | | | | | Filed |
| Number | | Exhibit Description | | Form | | SEC File
Number | | Exhibit | | Filing Date | | Filed
Herewith |
| | | | | | | | | | | | | |
23.1 | | Consent of PricewaterhouseCoopers LLP. | | | | | | | | | | X |
| | | | | | | | | | | | |
23.2 | | Consent of Ryder Scott Company, L.P., Petroleum Consultants. | | | | | | | | | | X |
| | | | | | | | | | | | |
31.1 | | Certification by Chief Executive Officer pursuant to Rule 13a-14(a) and 15d-14(a) of the Exchange Act Rules, as adopted pursuant to Section 302 of the Sarbanes-Oxley Act of 2002. | | | | | | | | | | X |
| | | | | | | | | | | | |
31.2 | | Certification by Chief Financial Officer pursuant to Rule 13a-14(a) and 15d-14(a) of the Exchange Act Rules, as adopted pursuant to Section 302 of the Sarbanes-Oxley Act of 2002. | | | | | | | | | | X |
| | | | | | | | | | | | |
32.1** | | Certifications by Chief Executive Officer and Chief Financial Officer pursuant to Title 18 U.S.C. Section 1350, as adopted pursuant to Section 906 of Sarbanes-Oxley Act of 2002. | | | | | | | | | | |
| | | | | | | | | | | | |
99.1 | | Report of Independent Petroleum Consultants - Ryder Scott Company, L.P. | | | | | | | | | | X |
| | | | | | | | | | | | |
101.INS** | | XBRL Instance Document | | | | | | | | | | |
| | | | | | | | | | | | |
101.SCH** | | XBRL Taxonomy Extension Schema Document | | | | | | | | | | |
| | | | | | | | | | | | |
101.CAL** | | XBRL Taxonomy Extension Calculation Linkbase Document | | | | | | | | | | |
| | | | | | | | | | | | |
101.DEF** | | XBRL Taxonomy Extension Definition Linkbase Document | | | | | | | | | | |
| | | | | | | | | | | | |
101.LAB** | | XBRL Taxonomy Extension Label Linkbase Document | | | | | | | | | | |
| | | | | | | | | | | | |
101.PRE** | | XBRL Taxonomy Extension Presentation Linkbase Document | | | | | | | | | | |
| | | | | | | | | | | | |
| | | | | | | | | | | | |
*Management contract or compensatory plan or arrangement. | | | | | | | | | | |
** Furnished herewith. |
| † Confidential portions of this document have been omitted and are filed separately with the SEC pursuant to Exchange Act Rule 24b-2. |
SIGNATURES
Pursuant to the requirements of Section 13 or 15(d) of the Securities Exchange Act of 1934, the Registrant has duly caused this report to be signed on its behalf by the undersigned, thereunto duly authorized.
|
| |
| | PETROLEUM DEVELOPMENT CORPORATIONPDC ENERGY, INC. |
| | |
| | By /s/ James M. Trimble |
| | James M. Trimble |
| | President and Chief Executive Officer |
| | |
| | March 1, 2012February 27, 2013 |
| | |
Pursuant to the requirements of the Securities Exchange Act of 1934, this report has been signed below by the following persons on behalf of the Registrant and in the capacities and on the dates indicated:
|
| | | | |
| Signature | | Title | | Date |
| | | | | |
| /s/ James M. Trimble | | President, Chief Executive Officer and Director | | March 1, 2012February 27, 2013 |
| James M. Trimble | | (principal executive officer) | | |
| | | | | |
| /s/ Gysle R. Shellum | | Chief Financial Officer | | March 1, 2012February 27, 2013 |
| Gysle R. Shellum | | (principal financial officer) | | |
| | | | | |
| /s/ R. Scott Meyers | | Chief Accounting Officer | | March 1, 2012February 27, 2013 |
| R. Scott Meyers | | (principal accounting officer) | | |
| | | | | |
| /s/ Jeffrey C. Swoveland | | Chairman and Director | | March 1, 2012February 27, 2013 |
| Jeffrey C. Swoveland | | | | |
| | | | | |
| /s/ Joseph E. Casabona | | Director | | March 1, 2012February 27, 2013 |
| Joseph E. Casabona | | | | |
| | | | | |
| /s/ Anthony J. Crisafio | | Director | | March 1, 2012February 27, 2013 |
| Anthony J. Crisafio | | | | |
| | | | | |
| /s/ Larry F. Mazza | | Director | | March 1, 2012February 27, 2013 |
| Larry F. Mazza | | | | |
| | | | | |
| /s/ David C. Parke | | Director | | March 1, 2012February 27, 2013 |
| David C. Parke | | | | |
| | | | | |
| /s/ Kimberly Luff Wakim | | Director | | March 1, 2012February 27, 2013 |
| Kimberly Luff Wakim | | | | |
GLOSSARY OF UNITS OF MEASUREMENT AND INDUSTRY TERMS
UNITS OF MEASUREMENT
The following presents a list of units of measurement used throughout the document.
Bbl – One barrel of crude oil or NGL or 42 gallons of liquid volume.
Bcf – One billion cubic feet of natural gas volume.
Bcfe – One billion cubic feet of natural gas equivalent.
Btu – British thermal unit.
BBtu -– One billion British thermal units.
MBoe – One thousand barrels of crude oil equivalent.
MBbls – One thousand barrels of crude oil.
Mcf – One thousand cubic feet of natural gas volume.
Mcfe – One thousand cubic feet of natural gas equivalent (six Mcf of natural gas equals one Bbl of crude oil or NGL).
MMBtu – One million British thermal units.
MMcf – One million cubic feet of natural gas volume.
MMcfe – One million cubic feet of natural gas equivalent.
Tcfe – One trillion cubic feet of natural gas equivalent.
GLOSSARY OF INDUSTRY TERMS
The following are abbreviations and definitions of terms commonly used in the oil and gas industry and this report.
3P - See proved, probable and possible reserves.report:
Behind-pipe reserves - Natural gas and crude oil reserves expected to be recovered from zones in existing wells, which will require additional completion work or future recompletion prior to the start of production. Generally, these are reserves in reservoirs above currently producing zones.
CIG - Colorado Interstate Gas.
Completion - Refers to the work performed and the installation of permanent equipment for the production of natural gas and crude oil from a recently drilled well.
Delineation drilling - A drilling technique carried out to gain a better understanding of the structure and extent of a deposit in order to decide whether or not to conduct further drilling activities.
Developed acreage - Acreage assignable to productive wells.
Development well - A well drilled within the proved area of an oil or gas reservoir to the depth of a stratigraphic horizon known to be productive.
Dry [natural]gas or dry natural gas - Natural gas is considered dry when its composition is over 90% pure methane.
Dry well or dry hole - A well found to be incapable of producing hydrocarbons in sufficient quantities to justify completion as an oil or gas well.
Exit rate - Rate of production as of the date specified.
Exploratory well - A well drilled to find a new field or to find a new reservoir in a field previously found to be productive of oil or gas in another reservoir.
Extensions and discoveries - As to any period, the increases to proved reserves from all sources other than the acquisition of proved properties or revisions of previous estimates.
Farm-out - Transfer of all or part of the operating rights from a working interest owner to an assignee, who assumes all or some of the burden of development in return for an interest in the property. The assignor usually retains an overriding royalty interest but may retain any type of interest.
Fracture or Fracturing - Procedure to stimulate production by forcing a mixture of fluid and proppant into the formation under high pressure. Fracturing creates artificial fractures in the reservoir rock to increase permeability and porosity, thereby allowing the release of trapped hydrocarbons.
Gross acres or wells - Refers to the total acres or wells in which we have a working interest.
Horizontal drilling - A drilling technique that permits the operator to drill a horizontal well shaft from the bottom of a vertical well and thereby to contact and intersect a larger portion of the producing horizon than conventional vertical drilling techniques and may, depending on the horizon, result in increased production rates and greater ultimate recoveries of hydrocarbons.
Joint interest billingor JIB - Process of billing/invoicing the costs related to well drilling, completions and production operations among working interest partners.
Monitoring well - A well designed and installed to obtain representative groundwater quality samples and hydrogeologic information.
Natural gas liquid(s) or NGL(s) - Hydrocarbons which can be extracted from wet natural gas and become liquid under various combinations of increasing pressure and lower temperature. NGLs include ethane, propane, butane, and other natural gasolines.
Net acres or wells - Refers to gross acres or wells we own multiplied, in each case, by our percentage working interest. References to net acres or wells well include our proportionate share of PDCM's and our affiliated partnerships' net acres or wells.
Net production - Natural gas and crude oil production that we own, less royalties and production due to others. References to net production include our proportionate share of PDCM's and our affiliated partnerships' net production.
Non-operated - A project in which we are not the operator.
NYMEX - New York Mercantile Exchange.
Operator - The individual or company responsible for the exploration, development and/or production of an oil or gas well or lease.
Overriding royalty - An interest which is created out of the operating or working interest. Its term is coextensive with that of the operating interest.
PEPL - Panhandle Eastern Pipeline.
Possible reserves - ThoseThis term is defined in the SEC Regulation S-X Section 4-10(a) and refers to those reserves that are less certain to be recovered than probable reserves. When deterministic methods are used, the total quantities ultimately recovered from a project have a low probability to exceed the sum of proved, probable and possible reserves. When probabilistic methods are used, there must be at least a 10 percent probability that the actual quantities recovered will equal or exceed the sum of proved, probable and possible estimates.
Present value of future net revenues or (PV-10%) - The present value of estimated future revenues to be generated from the production of proved reserves, before income taxes, of proved reserves calculated in accordance with Financial Accounting Standards Board guidelines, net of estimated production and future development costs, using pricing and costs as of the date of estimation without future escalation, without giving effect to hedging activities, non-property related expenses such as general and administrative expenses, debitdebt service and depreciation, depletion and amortization, and discounted using an annual discount rate of 10%. PV-10% is pretaxpre-tax and therefore a non-U.S. GAAP financial measure.
Probable reserves - ThoseThis term is defined in the SEC Regulation S-X Section 4-10(a) and refers to those reserves that are less certain to be recovered than proved reserves but which, in sum with proved reserves, are as likely as not to be recovered. When deterministic methods are used, it is as likely as not that actual remaining quantities recovered will exceed the sum of estimated proved plus probable reserves. Similarly, when probabilistic methods are used, there must be at least a 50 percent probability that the actual quantities recovered will equal or exceed the proved plus probable reserves estimates.
Productive well - A well that is not a dry well or dry hole, as defined above, and includes wells that are mechanically capable of production.
Proved developed non-producing reserves or PDNPs - Reserves that consist of (i) proved reserves from wells which have been completed and tested but are not producing due to lack of market or minor completion problems which are expected to be corrected and/or (ii) proved reserves currently behind the pipe in existing wells and which are expected to be productive due to both the well log characteristics and analogous production in the immediate vicinity of the wells.
Proved developed producing reserves or PDPs - Proved reserves that can be expected to be recovered from currently producing zones under the continuation of present operating methods.
Proved developed reserves - The combination of proved developed producing and proved developed non-producing reserves.
Proved probable and possible or 3P reserves - Proved reserves plus probable reserves plus possible reserves.
Proved reserves - ThoseThis term mean "proved oil and gas reserves" as defined in SEC Regulation S-X Section 4-10(a) and refers to those quantities of natural gas, NGL, crude oil and condensate, which, by analysis of geoscience and engineering data, can be estimated with reasonable certainty to be economically producible - from a given date forward, from known reservoirs, and under existing conditions, operating methods, and government regulations – prior to the time at which contracts providing the right to operate expire, unless evidence indicates that renewal is reasonably certain, regardless of whether deterministic or probabilistic methods are used for the estimation.
Proved undeveloped reserves or PUDs - Proved reserves that are expected to be recovered from new wells on undrilled acreage, or from existing wells where a relatively major expenditure is required for recompletion.
Recomplete or Recompletion - The modification of an existing well for the purpose of producing natural gas and crude oil from a different producing formation.
Refracture - A refracture is when we stimulate by fracturing a producing zone of a well to increase its production as well as its PDP reserves.
Reserve replacement - Calculated by dividing the sum of reserve additions from all sources (revisions, extensions, discoveries and other additions and acquisitions) by the actual production for the corresponding period. The values used for reserve additions are derived directly from the proved reserves table located in Supplemental Information - Natural Gas and Crude Oil Operations to our consolidated financial statements included in this report. We use the reserve replacement ratio as an indicator of our ability to replenish annual production volumes and grow our reserves, thereby providing some information on the sources of future production. It should be noted that the reserve replacement ratio is a statistical indicator that has limitations. As an annual measure, the ratio is limited because it typically varies widely based on the extent and timing of new discoveries and property acquisitions. Its predictive and comparative value is also limited for the same reasons. In addition, since the ratio does not embed the cost or timing of future production of new reserves, it cannot be used as a measure of value creation.
Reserves - Estimated remaining quantities of natural gas, NGLs crude oil and related substances anticipated to be economically producible, as of a given date, by application of development projects to known accumulations. In addition, there must exist, or there must be a reasonable expectation that there will exist, the legal right to produce or a revenue interest in the production, installed means of delivering natural gas, NGLs and crude oil or related substances to market, and all permits and financing required to implement the project.
Royalty - An interest in a natural gas and crude oil lease that gives the owner of the interest the right to receive a portion of the production from the leased acreage (or of the proceeds of the sale thereof), but generally does not require the owner to pay any portion of the costs of drilling or operating the wells on the leased acreage. Royalties may be either landowner’s royalties, which are reserved by the owner of the leased acreage at the time the lease is granted, or overriding royalties, which are usually reserved by an owner of the leasehold in connection with a transfer to a subsequent owner.
Spud - To begin drilling; the act of beginning a hole. Past tense: spudded.
Standardized measure of discounted future net cash flows or standardized measure - Future net cash flows discounted at a rate of 10%. Future net cash flows represent the estimated future revenues to be generated from the production of proved reserves determined in accordance with SEC guidelines, net of estimated production and future development costs, using prices and costs as of the date of estimation without future escalation, giving effect to (i) estimated future abandonment costs, net of the estimated salvage value of related equipment and (ii) future income tax expense.
Stratigraphic test well - A drilling effort, geologically directed, to obtain information pertaining to a specific geologic condition. Such wells customarily are drilled without the intent of being completed for hydrocarbon production.
Unconventional resource(s) - Natural gas and crude oil that cannot be produced at economic flow rates in economic volumes unless the well is stimulated by a large hydraulic fracture treatment, a horizontal wellbore, or by using multilateral wellbores or some other techniques to expose more of the resources to the wellbore.
Undeveloped acreage - Leased acreage on which wells have not been drilled or completed to a point that would permit the production of commercial quantities of natural gas and crude oil, regardless of whether such acreage contains proved reserves.
Wet [natural]gas or wet natural gas - Natural gas that contains a larger quantity of hydrocarbon liquids than dry natural gas, such as NGLs, condensate and crude oil.
Working interest - An interest in a natural gas and crude oil lease that gives the owner of the interest the right to drill and produce natural gas and crude oil on the leased acreage. It requires the owner to pay all of their entire share of the costs of drilling and production operations.
Workover - Major remedial operations on a producing well to restore, maintain or improve the well's production.
|
| | |
| Index to Consolidated Financial Statements, Financial Statement Schedule and Supplemental Information |
| | | |
| | |
| Financial Statements: | | |
| | |
| | |
| | |
| | |
| | |
| | |
| | |
| Supplemental Information - Unaudited: | | |
| | |
| | |
| | |
| | |
| | |
| | |
| | |
| | |
| | |
| | |
| | |
| | |
| | |
| | |
| | |
| | |
| | |
| | |
| | | |
Financial Statement ScheduleSchedule: | | |
| | |
| | |
Supplemental Information - Unaudited | | |
| | |
| | |
| | | |
Management's Report on Internal Control Over Financial Reporting
Management is responsible for establishing and maintaining adequate internal control over financial reporting as such term isas defined in Rules 13a-15(f) and 15d-15(f) of the Securities Exchange Act.Act of 1934, as amended. Internal control over financial reporting is a process designed to provide reasonable assurance regarding the reliability of financial reporting and the preparation of financial statements for external purposes in accordance with generally accepted accounting principles. Because of its inherent limitations, internal control over financial reporting may not prevent or detect misstatements. Also, projections of any evaluation of effectiveness to future periods are subject to the risk that controls may become inadequate because of changes in conditions, or that the degree of compliance with policies or procedures may deteriorate.
Management has assessed the effectiveness of the Company’s internal control over financial reporting as of December 31, 2011,2012, based upon the criteria established in "Internal Control – Integrated Framework" issued by the Committee of Sponsoring Organizations of the Treadway Commission ("COSO").Commission. Based on this evaluation, management concluded that the Company maintained effective internal control over financial reporting as of December 31, 20112012.
The effectiveness of the Company's internal control over financial reporting as of December 31, 20112012, has been audited by PricewaterhouseCoopers LLP, an independent registered public accounting firm, as stated in their report which appears herein.
PETROLEUM DEVELOPMENT CORPORATIONPDC ENERGY, INC.
|
| | |
| | /s/ James M. Trimble |
| | James M. Trimble |
| | President and Chief Executive Officer |
| | | |
| | /s/ Gysle R. Shellum |
| | Gysle R. Shellum |
| | Chief Financial Officer |
| | | |
| | /s/ R. Scott Meyers |
| | R. Scott Meyers |
| | Chief Accounting Officer |
Report of Independent Registered Public Accounting Firm
To the Board of Directors and Shareholders of Petroleum Development Corporation:PDC Energy, Inc.:
In our opinion, the accompanying consolidated balance sheets and the related consolidated statements of operations, equity, and cash flows present fairly, in all material respects, the financial position of Petroleum Development CorporationPDC Energy, Inc. and its subsidiaries at December 31, 20112012 and 2010,2011, and the results of their operations and their cash flows for each of the three years in the period ended December 31, 20112012 in conformity with accounting principles generally accepted in the United States of America. In addition, in our opinion, the financial statement schedule appearing under Item 15(a)(2) presents fairly, in all material respects, the information set forth therein when read in conjunction with the related consolidated financial statements. Also in our opinion, the Company maintained, in all material respects, effective internal control over financial reporting as of December 31, 2011,2012, based on criteria established in Internal Control - Integrated Framework issued by the Committee of Sponsoring Organizations of the Treadway Commission (COSO). The Company's management is responsible for these financial statements, and financial statement schedule, for maintaining effective internal control over financial reporting and for its assessment of the effectiveness of internal control over financial reporting, included in the accompanying Management's Report on Internal Control over Financial Reporting. Our responsibility is to express opinions on these financial statements, on the financial statement schedule, and on the Company's internal control over financial reporting based on our integrated audits. We conducted our audits in accordance with the standards of the Public Company Accounting Oversight Board (United States). Those standards require that we plan and perform the audits to obtain reasonable assurance about whether the financial statements are free of material misstatement and whether effective internal control over financial reporting was maintained in all material respects. Our audits of the financial statements included examining, on a test basis, evidence supporting the amounts and disclosures in the financial statements, assessing the accounting principles used and significant estimates made by management, and evaluating the overall financial statement presentation. Our audit of internal control over financial reporting included obtaining an understanding of internal control over financial reporting, assessing the risk that a material weakness exists, and testing and evaluating the design and operating effectiveness of internal control based on the assessed risk. Our audits also included performing such other procedures as we considered necessary in the circumstances. We believe that our audits provide a reasonable basis for our opinions.
As discussed in Note 1 to the consolidated financial statements, the Company changed the manner in which it accounts for the consolidation of variable interest entities in 2010.
A company's internal control over financial reporting is a process designed to provide reasonable assurance regarding the reliability of financial reporting and the preparation of financial statements for external purposes in accordance with generally accepted accounting principles. A company's internal control over financial reporting includes those policies and procedures that (i) pertain to the maintenance of records that, in reasonable detail, accurately and fairly reflect the transactions and dispositions of the assets of the company; (ii) provide reasonable assurance that transactions are recorded as necessary to permit preparation of financial statements in accordance with generally accepted accounting principles, and that receipts and expenditures of the company are being made only in accordance with authorizations of management and directors of the company; and (iii) provide reasonable assurance regarding prevention or timely detection of unauthorized acquisition, use, or disposition of the company's assets that could have a material effect on the financial statements.
Because of its inherent limitations, internal control over financial reporting may not prevent or detect misstatements. Also, projections of any evaluation of effectiveness to future periods are subject to the risk that controls may become inadequate because of changes in conditions, or that the degree of compliance with the policies or procedures may deteriorate.
/s/ PricewaterhouseCoopers LLP
Pittsburgh, Pennsylvania
March 1, 2012February 26, 2013
Petroleum Development Corporation
(dba PDC Energy)ENERGY, INC.
Consolidated Balance Sheets
(in thousands, except share and per share data)
| | | As of December 31, | | 2011 | | 2010 | | 2012 | | 2011 |
| Assets | | | | | | | | |
| Current assets: | | | | | | | | |
| Cash and cash equivalents | | $ | 8,238 |
| | $ | 54,372 |
| | $ | 2,457 |
| | $ | 8,238 |
|
| Restricted cash | | 11,070 |
| | 2,474 |
| | 3,942 |
| | 11,070 |
|
| Accounts receivable, net | | 59,923 |
| | 53,978 |
| | 64,880 |
| | 59,923 |
|
| Accounts receivable affiliates | | 8,518 |
| | 11,448 |
| | 4,842 |
| | 8,518 |
|
| Fair value of derivatives | | 60,809 |
| | 42,953 |
| | 52,042 |
| | 60,809 |
|
| Deferred income taxes | | | 36,151 |
| | 16,127 |
|
| Prepaid expenses and other current assets | | 24,492 |
| | 11,598 |
| | 7,635 |
| | 8,365 |
|
| Total current assets | | 173,050 |
| | 176,823 |
| | 171,949 |
| | 173,050 |
|
| Properties and equipment, net | | 1,301,716 |
| | 1,008,670 |
| | 1,616,706 |
| | 1,301,716 |
|
| Assets held for sale | | 148,249 |
| | 116,559 |
| | — |
| | 148,249 |
|
| Fair value of derivatives | | 41,175 |
| | 44,464 |
| | 6,883 |
| | 41,175 |
|
| Accounts receivable affiliates | | 2,836 |
| | 8,478 |
| | — |
| | 2,836 |
|
| Other assets | | 30,979 |
| | 34,041 |
| | 31,310 |
| | 30,979 |
|
| Total Assets | | $ | 1,698,005 |
| | $ | 1,389,035 |
| | $ | 1,826,848 |
| | $ | 1,698,005 |
|
| | | | | | | | | |
| Liabilities and Equity | | | | | |
| Liabilities and Shareholders' Equity | | | | | |
| Liabilities | | | | | | | | |
| Current liabilities: | | | | | | | | |
| Accounts payable | | $ | 76,027 |
| | $ | 47,271 |
| | $ | 82,716 |
| | $ | 76,027 |
|
| Accounts payable affiliates | | 10,176 |
| | 9,605 |
| | 5,296 |
| | 10,176 |
|
| Production tax liability | | 18,949 |
| | 16,226 |
| | 25,899 |
| | 18,949 |
|
| Fair value of derivatives | | 27,974 |
| | 29,998 |
| | 18,439 |
| | 27,974 |
|
| Funds held for distribution | | 28,594 |
| | 29,755 |
| | 34,228 |
| | 28,594 |
|
| Accrued interest payable | | 11,243 |
| | 10,051 |
| | 11,056 |
| | 11,243 |
|
| Other accrued expenses | | 22,083 |
| | 17,723 |
| | 25,715 |
| | 22,083 |
|
| Total current liabilities | | 195,046 |
| | 160,629 |
| | 203,349 |
| | 195,046 |
|
| Long-term debt | | 532,157 |
| | 295,695 |
| | 676,579 |
| | 532,157 |
|
| Deferred income taxes | | 207,573 |
| | 187,999 |
| | 148,427 |
| | 207,573 |
|
| Asset retirement obligation | | 46,316 |
| | 27,797 |
| | 61,563 |
| | 46,316 |
|
| Fair value of derivatives | | 21,106 |
| | 36,644 |
| | 10,137 |
| | 21,106 |
|
| Accounts payable affiliates | | 6,134 |
| | 12,111 |
| | — |
| | 6,134 |
|
| Other liabilities | | 25,561 |
| | 25,919 |
| | 23,612 |
| | 25,561 |
|
| Total liabilities | | 1,033,893 |
| | 746,794 |
| | 1,123,667 |
| | 1,033,893 |
|
| | | | | | | | | |
| Commitments and contingent liabilities | | | | | | | | |
| | | | | | | | | |
| Equity | | | | | |
| Shareholders' equity: | | | | | |
Preferred shares, par value $0.01 per share; authorized 50,000,000
shares; issued: none | | — |
| | — |
| |
Common shares, par value $0.01 per share; authorized 100,000,000
shares; issued: 23,634,958 in 2011 and 23,462,326 in 2010 | | 236 |
| | 235 |
| |
| Shareholders' equity | | | | | |
| Preferred shares - par value $0.01 per share, 50,000,000 shares authorized, none issued | | | — |
| | — |
|
| Common shares - par value $0.01 per share, 100,000,000 authorized, 30,294,224 and 23,634,958 issued as of December 31, 2012 and 2011, respectively | | | 303 |
| | 236 |
|
| Additional paid-in capital | | 217,707 |
| | 209,198 |
| | 387,494 |
| | 217,707 |
|
| Retained earnings | | 446,280 |
| | 432,843 |
| | 315,568 |
| | 446,280 |
|
| Treasury shares, at cost: 2,938 in 2011 and 2010 | | (111 | ) | | (111 | ) | |
| Treasury shares - at cost, 5,059 and 2,938 as of December 31, 2012 and 2011, respectively | | | (184 | ) | | (111 | ) |
| Total shareholders' equity | | 664,112 |
| | 642,165 |
| | 703,181 |
| | 664,112 |
|
| Noncontrolling interest in subsidiary | | — |
| | 76 |
| |
| Total equity | | 664,112 |
| | 642,241 |
| |
| Total Liabilities and Equity | | $ | 1,698,005 |
| | $ | 1,389,035 |
| |
| Total Liabilities and Shareholders' Equity | | | $ | 1,826,848 |
| | $ | 1,698,005 |
|
| | | | | | | | | |
See accompanying Notes to Consolidated Financial Statements
64F- 4
Petroleum Development Corporation
(dba PDC Energy)ENERGY, INC.
Consolidated Statements of Operations
(in thousands, except per share data)
| | | Year Ended December 31, | | 2011 | | 2010 | | 2009 | | 2012 | | 2011 | | 2010 |
| Revenues: | | | | | | | | | | | | |
| Natural gas, NGL and crude oil sales | | $ | 276,605 |
| | $ | 205,029 |
| | $ | 171,242 |
| |
| Natural gas, NGLs and crude oil sales | | | $ | 270,327 |
| | $ | 276,605 |
| | $ | 205,029 |
|
| Sales from natural gas marketing | | 66,419 |
| | 69,071 |
| | 59,595 |
| | 47,079 |
| | 66,419 |
| | 69,071 |
|
| Commodity price risk management gain (loss), net | | 46,090 |
| | 59,891 |
| | (10,053 | ) | |
| Commodity price risk management gain, net | | | 32,339 |
| | 46,090 |
| | 59,891 |
|
| Well operations, pipeline income and other | | 6,846 |
| | 9,030 |
| | 10,092 |
| | 6,388 |
| | 6,846 |
| | 9,030 |
|
| Total revenues | | 395,960 |
| | 343,021 |
| | 230,876 |
| | 356,133 |
| | 395,960 |
| | 343,021 |
|
| | | | | | | | |
| Costs, expenses and other: | | | | | | | | | | | | |
| Production costs | | 69,085 |
| | 64,872 |
| | 62,103 |
| | 75,485 |
| | 67,352 |
| | 63,543 |
|
| Cost of natural gas marketing | | 65,465 |
| | 68,015 |
| | 57,618 |
| | 46,552 |
| | 65,465 |
| | 68,015 |
|
| Exploration expense | | 6,253 |
| | 13,675 |
| | 14,069 |
| | 22,605 |
| | 6,253 |
| | 13,675 |
|
| Impairment of natural gas and crude oil properties | | 25,159 |
| | 6,481 |
| | 5,034 |
| | 168,149 |
| | 25,159 |
| | 6,481 |
|
| General and administrative expense | | 61,454 |
| | 42,188 |
| | 53,985 |
| | 58,815 |
| | 61,454 |
| | 42,188 |
|
| Depreciation, depletion, and amortization | | 128,907 |
| | 108,095 |
| | 126,755 |
| | 146,879 |
| | 128,907 |
| | 108,095 |
|
| Accretion of asset retirement obligations | | | 4,060 |
| | 1,733 |
| | 1,329 |
|
| Gain on sale of properties and equipment | | (196 | ) | | (174 | ) | | (470 | ) | | (4,353 | ) | | (196 | ) | | (174 | ) |
| Total cost, expenses and other | | 356,127 |
| | 303,152 |
| | 319,094 |
| | 518,192 |
| | 356,127 |
| | 303,152 |
|
| | | | | | | | |
| Income (loss) from operations | | 39,833 |
| | 39,869 |
| | (88,218 | ) | | (162,059 | ) | | 39,833 |
| | 39,869 |
|
| Loss on extinguishment of debt | | | (23,283 | ) | | — |
| | — |
|
| Interest expense | | | (48,287 | ) | | (36,985 | ) | | (33,250 | ) |
| Interest income | | 47 |
| | 71 |
| | 254 |
| | 8 |
| | 47 |
| | 71 |
|
| Interest expense | | (36,985 | ) | | (33,250 | ) | | (37,208 | ) | |
| | | | | | | | |
| Income (loss) from continuing operations before income taxes | | 2,895 |
| | 6,690 |
| | (125,172 | ) | | (233,621 | ) | | 2,895 |
| | 6,690 |
|
| Provision (benefit) for income taxes | | (183 | ) | | 652 |
| | (45,054 | ) | |
| Provision for income taxes | | | 88,835 |
| | 183 |
| | (652 | ) |
| Income (loss) from continuing operations | | 3,078 |
| | 6,038 |
| | (80,118 | ) | | (144,786 | ) | | 3,078 |
| | 6,038 |
|
| Income (loss) from discontinued operations, net of tax | | 10,359 |
| | (104 | ) | | (975 | ) | | 14,074 |
| | 10,359 |
| | (104 | ) |
| Net income (loss) | | 13,437 |
| | 5,934 |
| | (81,093 | ) | | (130,712 | ) | | 13,437 |
| | 5,934 |
|
| Less: net loss attributable to noncontrolling interests | | — |
| | (280 | ) | | (1,816 | ) | |
| Net loss attributable to noncontrolling interests | | | — |
| | — |
| | 280 |
|
| Net income (loss) attributable to shareholders | | $ | 13,437 |
| | $ | 6,214 |
| | $ | (79,277 | ) | | $ | (130,712 | ) | | $ | 13,437 |
| | $ | 6,214 |
|
| | | | | | | | | | | | | |
| Amounts attributable to Petroleum Development Corporation shareholders: | | | | | | | |
| Amounts attributable to PDC Energy, Inc. shareholders: | | | | | | | |
| Income (loss) from continuing operations | | $ | 3,078 |
| | $ | 6,318 |
| | $ | (78,302 | ) | | $ | (144,786 | ) | | $ | 3,078 |
| | $ | 6,318 |
|
| Income (loss) from discontinued operations, net of tax | | 10,359 |
| | (104 | ) | | (975 | ) | | 14,074 |
| | 10,359 |
| | (104 | ) |
| Net income (loss) attributable to shareholders | | $ | 13,437 |
| | $ | 6,214 |
| | $ | (79,277 | ) | | $ | (130,712 | ) | | $ | 13,437 |
| | $ | 6,214 |
|
| | | | | | | | | | | | | |
| Earnings (loss) per share attributable to shareholders: | | | | | | | |
| Earnings per share: | | | | | | | |
| Basic | | | | | | | | | | | | |
| Income (loss) from continuing operations | | $ | 0.13 |
| | $ | 0.33 |
| | $ | (4.76 | ) | | $ | (5.23 | ) | | $ | 0.13 |
| | $ | 0.33 |
|
| Income (loss) from discontinued operations | | 0.44 |
| | (0.01 | ) | | (0.06 | ) | | 0.51 |
| | 0.44 |
| | (0.01 | ) |
| Net income (loss) attributable to shareholders | | $ | 0.57 |
| | $ | 0.32 |
| | $ | (4.82 | ) | | $ | (4.72 | ) | | $ | 0.57 |
| | $ | 0.32 |
|
| | | | | | | | | | | | | |
| Diluted | | | | | | | | | | | | |
| Income (loss) from continuing operations | | $ | 0.13 |
| | $ | 0.32 |
| | $ | (4.76 | ) | | $ | (5.23 | ) | | $ | 0.13 |
| | $ | 0.32 |
|
| Income (loss) from discontinued operations | | 0.43 |
| | (0.01 | ) | | (0.06 | ) | | 0.51 |
| | 0.43 |
| | (0.01 | ) |
| Net income (loss) attributable to shareholders | | $ | 0.56 |
| | $ | 0.31 |
| | $ | (4.82 | ) | | $ | (4.72 | ) | | $ | 0.56 |
| | $ | 0.31 |
|
| | | | | | | | | | | | | |
| Weighted average common shares outstanding | | | | | | | |
| Weighted-average common shares outstanding: | | | | | | | |
| Basic | | 23,521 |
| | 19,674 |
| | 16,448 |
| | 27,677 |
| | 23,521 |
| | 19,674 |
|
| Diluted | | 23,871 |
| | 19,821 |
| | 16,448 |
| | 27,677 |
| | 23,871 |
| | 19,821 |
|
| | | | | | | | | | | | | |
See accompanying Notes to Consolidated Financial Statements
F- 5
Petroleum Development Corporation
(dba PDC Energy)ENERGY, INC.
Consolidated Statements of Cash Flows
(in thousands)
| | | Year Ended December 31, | | 2011 | | 2010 | | 2009 | | 2012 | | 2011 | | 2010 |
| Cash flows from operating activities: | | | | | | | | | | | | |
| Net income (loss) | | $ | 13,437 |
| | $ | 5,934 |
| | $ | (81,093 | ) | | $ | (130,712 | ) | | $ | 13,437 |
| | $ | 5,934 |
|
| Adjustments to net income (loss) to reconcile to net cash provided by operating activities: | | | | | | | |
| Unrealized loss (gain) on derivatives, net | | (28,601 | ) | | (12,625 | ) | | 116,623 |
| |
| Adjustments to net income (loss) to reconcile to net cash from operating activities: | | | | | | | |
| Unrealized (gain) loss on derivatives, net | | | 17,134 |
| | (28,601 | ) | | (12,625 | ) |
| Depreciation, depletion and amortization | | 135,154 |
| | 111,062 |
| | 131,004 |
| | 146,879 |
| | 135,154 |
| | 111,062 |
|
| Impairment of natural gas and crude oil properties | | 25,159 |
| | 11,147 |
| | 8,205 |
| | 168,149 |
| | 25,159 |
| | 11,147 |
|
| Prepaid well costs write-offs | | | 3,916 |
| | 1,359 |
| | 668 |
|
| Loss on extinguishment of debt | | | 23,283 |
| | — |
| | — |
|
| Exploratory dry hole costs | | 177 |
| | 4,199 |
| | 1,059 |
| | 15,347 |
| | 177 |
| | 4,199 |
|
| Accretion of asset retirement obligation | | 1,897 |
| | 1,423 |
| | 1,368 |
| | 4,060 |
| | 1,897 |
| | 1,423 |
|
| Stock-based compensation | | 8,781 |
| | 5,314 |
| | 5,935 |
| | 8,495 |
| | 8,781 |
| | 5,314 |
|
| Excess tax benefits from stock-based compensation | | (1,311 | ) | | (293 | ) | | — |
| | — |
| | (1,311 | ) | | (293 | ) |
| Loss (gain) from sale of properties and equipment | | (4,263 | ) | | 299 |
| | (105 | ) | |
| (Gain) loss from sale of properties and equipment | | | (24,273 | ) | | (4,263 | ) | | 299 |
|
| Amortization of debt discount and issuance costs | | 6,265 |
| | 4,618 |
| | 5,302 |
| | 7,864 |
| | 6,265 |
| | 4,618 |
|
| Deferred income taxes | | 9,530 |
| | 1,179 |
| | (18,084 | ) | | (80,379 | ) | | 9,530 |
| | 1,179 |
|
| Total adjustments to net income (loss) to reconcile to net cash provided by operating activities: | | 152,788 |
| | 126,323 |
| | 251,307 |
| |
| Changes in current assets and liabilities: | | | | | | | |
| Decrease (increase) in restricted cash | | (8,603 | ) | | 219 |
| | 15,564 |
| |
| Decrease (increase) in accounts receivable | | (3,451 | ) | | 2,122 |
| | 13,197 |
| |
| Decrease (increase) in other current assets | | (2,399 | ) | | 23,591 |
| | 3,032 |
| |
| Increase (decrease) in production tax liability | | 5,436 |
| | (6,818 | ) | | (4,541 | ) | |
| Increase (decrease) in accounts payable and accrued expenses | | 12,422 |
| | 1,172 |
| | (22,482 | ) | |
| Decrease in other current liabilities | | (2,796 | ) | | (730 | ) | | (31,089 | ) | |
| Total changes in current assets and liabilities | | 609 |
| | 19,556 |
| | (26,319 | ) | |
| Net cash provided by operating activities | | 166,834 |
| | 151,813 |
| | 143,895 |
| |
| Inventory adjustment and other | | | 4,123 |
| | 135 |
| | 307 |
|
| Total adjustments to net income (loss) to reconcile to net cash from operating activities: | | | 294,598 |
| | 154,282 |
| | 127,298 |
|
| Changes in assets and liabilities: | | | | | | | |
| Accounts receivable | | | 6,843 |
| | (3,451 | ) | | 2,122 |
|
| Other assets | | | (2,908 | ) | | (3,893 | ) | | 22,616 |
|
| Restricted cash | | | 8,859 |
| | (8,603 | ) | | 219 |
|
| Production tax liability | | | 2,499 |
| | 5,436 |
| | (6,818 | ) |
| Accounts payable and accrued expenses | | | (5,050 | ) | | 12,422 |
| | 1,172 |
|
| Other liabilities | | | 592 |
| | (2,796 | ) | | (730 | ) |
| Total changes in assets and liabilities | | | 10,835 |
| | (885 | ) | | 18,581 |
|
| Net cash from operating activities | | | 174,721 |
| | 166,834 |
| | 151,813 |
|
| Cash flows from investing activities: | | | | | | | | | | | | |
| Capital expenditures | | (334,496 | ) | | (162,723 | ) | | (143,033 | ) | | (347,729 | ) | | (334,496 | ) | | (162,723 | ) |
| Acquisition of oil and gas properties, net of cash acquired | | (145,894 | ) | | (158,051 | ) | | — |
| | (312,223 | ) | | (145,894 | ) | | (158,051 | ) |
Proceeds from acquisition adjustments
| | | 14,469 |
| | — |
| | — |
|
| Proceeds from sale of properties and equipment | | 23,140 |
| | 23,369 |
| | 755 |
| | 193,544 |
| | 23,140 |
| | 23,369 |
|
| Other | | 849 |
| | (3,527 | ) | | — |
| | — |
| | 849 |
| | (3,527 | ) |
| Net cash used in investing activities | | (456,401 | ) | | (300,932 | ) | | (142,278 | ) | |
| Net cash from investing activities | | | (451,939 | ) | | (456,401 | ) | | (300,932 | ) |
| Cash flows from financing activities: | | | | | | | | | | | | |
| Proceeds from credit facility | | 417,194 |
| | 414,500 |
| | 285,086 |
| |
| Proceeds from senior notes | | — |
| | 115,000 |
| | — |
| |
| Payment of credit facility | | (183,713 | ) | | (494,500 | ) | | (399,586 | ) | |
| Proceeds from revolving credit facility | | | 682,000 |
| | 417,194 |
| | 414,500 |
|
| Payment of revolving credit facility | | | (839,750 | ) | | (183,713 | ) | | (494,500 | ) |
| Proceeds from senior notes offering | | | 500,000 |
| | — |
| | 115,000 |
|
| Redemption of senior notes | | | (221,840 | ) | | — |
| | — |
|
| Payment of debt issuance costs | | (680 | ) | | (8,541 | ) | | (9,249 | ) | | (11,969 | ) | | (680 | ) | | (8,541 | ) |
| Proceeds from sale of equity, net of issuance costs | | — |
| | 125,506 |
| | 48,490 |
| |
| Proceeds from sale of common stock, net of issuance costs | | | 164,496 |
| | — |
| | 125,506 |
|
| Excess tax benefits from stock-based compensation | | 1,311 |
| | 293 |
| | — |
| | — |
| | 1,311 |
| | 293 |
|
| Contribution by investing partner in PDCM | | 12,464 |
| | 20,077 |
| | 55,000 |
| |
| Purchase of treasury stock | | (3,143 | ) | | (788 | ) | | (364 | ) | |
| Net cash provided by (used in) financing activities | | 243,433 |
| | 171,547 |
| | (20,623 | ) | |
| Net increase (decrease) in cash and cash equivalents | | (46,134 | ) | | 22,428 |
| | (19,006 | ) | |
| Contribution from noncontrolling interest | | | — |
| | 12,464 |
| | 20,077 |
|
| Purchase of treasury shares | | | (1,500 | ) | | (3,143 | ) | | (788 | ) |
| Net cash from financing activities | | | 271,437 |
| | 243,433 |
| | 171,547 |
|
| Net change in cash and cash equivalents | | | (5,781 | ) | | (46,134 | ) | | 22,428 |
|
| Cash and cash equivalents, beginning of year | | 54,372 |
| | 31,944 |
| | 50,950 |
| | 8,238 |
| | 54,372 |
| | 31,944 |
|
| Cash and cash equivalents, end of year | | $ | 8,238 |
| | $ | 54,372 |
| | $ | 31,944 |
| | $ | 2,457 |
| | $ | 8,238 |
| | $ | 54,372 |
|
| | | | | | | | | | | | | |
| Supplemental cash flow information: | | | | | | | | | | | | |
| Cash payments (receipts) for: | | | | | | | | | | | | |
| Interest, net of capitalized interest | | $ | 29,429 |
| | $ | 28,335 |
| | $ | 32,014 |
| | $ | 41,768 |
| | $ | 29,429 |
| | $ | 28,335 |
|
| Income tax refunds, net of income taxes | | (1,498 | ) | | (27,322 | ) | | (3,355 | ) | |
| Income taxes | | | 1,845 |
| | (1,498 | ) | | (27,322 | ) |
| Non-cash investing activities: | | | | | | | | | | | | |
| Change in accounts payable related to purchases of properties and equipment | | 23,837 |
| | 15,787 |
| | (36,765 | ) | | 288 |
| | 23,837 |
| | 15,787 |
|
| Change in asset retirement obligation, with a corresponding increase to natural gas and crude oil properties, net of disposals | | 17,538 |
| | 3,624 |
| | 5,110 |
| |
| Change in asset retirement obligation, with a corresponding change to natural gas and crude oil properties, net of disposals | | | 11,967 |
| | 17,538 |
| | 3,624 |
|
| Non-cash financing activities: | | | | | | | | | | | | |
| Change in paid-in capital related to convertible debt, net of tax | | — |
| | 12,850 |
| | — |
| | — |
| | — |
| | 12,850 |
|
See Note 15, Acquisitions, for non-cash transactions related to our acquisitions | | | | | | | |
See accompanying Notes to Consolidated Financial Statements
F- 6
Petroleum Development Corporation
(dba PDC Energy)ENERGY, INC.
Consolidated Statements of Equity
(in thousands, except share and per share data)
| | | Year Ended December 31, | | 2011 | | 2010 | | 2009 | | 2012 | | 2011 | | 2010 |
| Common shares, issued: | | | | | | | | | | | | |
| Shares beginning of year | | 23,462,326 |
| | 19,242,219 |
| | 14,871,870 |
| | 23,634,958 |
| | 23,462,326 |
| | 19,242,219 |
|
| Shares issued pursuant to sale of equity | | — |
| | 4,140,000 |
| | 4,312,500 |
| | 6,500,000 |
| | — |
| | 4,140,000 |
|
| Exercise of stock options | | 2,814 |
| | — |
| | — |
| | — |
| | 2,814 |
| | — |
|
| Issuance of stock awards, net of forfeitures | | 242,334 |
| | 110,680 |
| | 79,246 |
| | 173,737 |
| | 242,334 |
| | 110,680 |
|
| Retirement of treasury shares | | (72,516 | ) | | (30,573 | ) | | (21,397 | ) | | (14,471 | ) | | (72,516 | ) | | (30,573 | ) |
| Shares end of year | | 23,634,958 |
| | 23,462,326 |
| | 19,242,219 |
| | 30,294,224 |
| | 23,634,958 |
| | 23,462,326 |
|
| Treasury shares: | | | | | | | | | | | | |
| Shares beginning of year | | 2,938 |
| | 8,273 |
| | 7,066 |
| | 2,938 |
| | 2,938 |
| | 8,273 |
|
| Purchase of treasury shares | | 87,588 |
| | 30,573 |
| | 21,397 |
| | 44,576 |
| | 87,588 |
| | 30,573 |
|
| Issuance of treasury shares | | (15,072 | ) | | — |
| | — |
| | (28,587 | ) | | (15,072 | ) | | — |
|
| Retirement of treasury shares | | (72,516 | ) | | (30,573 | ) | | (21,397 | ) | | (14,471 | ) | | (72,516 | ) | | (30,573 | ) |
| Non-employee directors' deferred compensation plan | | — |
| | (5,335 | ) | | 1,207 |
| | 603 |
| | — |
| | (5,335 | ) |
| Shares end of year | | 2,938 |
| | 2,938 |
| | 8,273 |
| | 5,059 |
| | 2,938 |
| | 2,938 |
|
| Common shares outstanding | | 23,632,020 |
| | 23,459,388 |
| | 19,233,946 |
| | 30,289,165 |
| | 23,632,020 |
| | 23,459,388 |
|
| | | | | | | | | | | | | |
| Equity: | | | | | | | | | | | | |
| Shareholders' equity | | | | | | | | | | | | |
| Preferred shares, par value $0.01 per share: | | | | | | | | | | | | |
| Balance beginning and end of year | | $ | — |
| | $ | — |
| | $ | — |
| | $ | — |
| | $ | — |
| | $ | — |
|
| Common shares, par value $0.01 per share: | | | | | | | | | | | | |
| Balance beginning of year | | 235 |
| | 192 |
| | 149 |
| | 236 |
| | 235 |
| | 192 |
|
| Shares issued pursuant to sale of equity | | — |
| | 41 |
| | 43 |
| | 65 |
| | — |
| | 41 |
|
| Issuance of stock awards, net of forfeitures | | 1 |
| | 2 |
| | — |
| | 2 |
| | 1 |
| | 2 |
|
| Balance end of year | | 236 |
| | 235 |
| | 192 |
| | 303 |
| | 236 |
| | 235 |
|
| Additional paid-in capital: | | | | | | | | | | | | |
| Balance beginning of year | | 209,198 |
| | 64,406 |
| | 5,818 |
| | 217,707 |
| | 209,198 |
| | 64,406 |
|
| Proceeds from sale of equity, net of issuance costs | | — |
| | 125,465 |
| | 48,447 |
| | 164,431 |
| | — |
| | 125,465 |
|
| Convertible debt discount, net of issuance costs and tax | | — |
| | 12,165 |
| | — |
| | — |
| | — |
| | 12,165 |
|
| Issuance of stock awards, net of forfeitures | | (1 | ) | | (2 | ) | | — |
| |
| Stock-based compensation expense | | 8,781 |
| | 5,314 |
| | 5,935 |
| | 8,495 |
| | 8,781 |
| | 5,314 |
|
| Issuance of treasury shares | | (472 | ) | | — |
| | — |
| | (955 | ) | | (472 | ) | | — |
|
| Retirement of treasury shares | | (2,671 | ) | | (788 | ) | | (364 | ) | | (491 | ) | | (2,671 | ) | | (788 | ) |
| Tax benefit (detriment) of stock-based compensation | | 786 |
| | (164 | ) | | (1,630 | ) | |
| Tax impact of stock-based compensation | | | (1,693 | ) | | 785 |
| | (166 | ) |
| Contribution by investing partner in PDCM | | 12,464 |
| | 20,077 |
| | 55,000 |
| | — |
| | 12,464 |
| | 20,077 |
|
| Effect of PDCM deconsolidation/change in ownership interest | | (10,378 | ) | | (17,275 | ) | | (48,800 | ) | | — |
| | (10,378 | ) | | (17,275 | ) |
| Balance end of year | | 217,707 |
| | 209,198 |
| | 64,406 |
| | 387,494 |
| | 217,707 |
| | 209,198 |
|
| Retained earnings: | | | | | | | | | | | | |
| Balance beginning of year | | 432,843 |
| | 426,629 |
| | 505,906 |
| | 446,280 |
| | 432,843 |
| | 426,629 |
|
| Net income (loss) attributable to shareholders | | 13,437 |
| | 6,214 |
| | (79,277 | ) | | (130,712 | ) | | 13,437 |
| | 6,214 |
|
| Balance end of year | | 446,280 |
| | 432,843 |
| | 426,629 |
| | 315,568 |
| | 446,280 |
| | 432,843 |
|
| Treasury shares, at cost: | | | | | | | | | | | | |
| Balance beginning of year | | (111 | ) | | (312 | ) | | (292 | ) | | (111 | ) | | (111 | ) | | (312 | ) |
| Purchase of treasury shares | | (3,143 | ) | | (788 | ) | | (364 | ) | | (1,500 | ) | | (3,143 | ) | | (788 | ) |
| Issuance of treasury shares | | 472 |
| | — |
| | — |
| | 955 |
| | 472 |
| | — |
|
| Retirement of treasury shares | | 2,671 |
| | 788 |
| | 364 |
| | 491 |
| | 2,671 |
| | 788 |
|
| Non-employee directors' deferred compensation plan | | — |
| | 201 |
| | (20 | ) | | (19 | ) | | — |
| | 201 |
|
| Balance end of year | | (111 | ) | | (111 | ) | | (312 | ) | | (184 | ) | | (111 | ) | | (111 | ) |
| Total shareholders' equity | | 664,112 |
| | 642,165 |
| | 490,915 |
| | 703,181 |
| | 664,112 |
| | 642,165 |
|
| Noncontrolling interests in subsidiary | | | | | | | | | | | | |
| Balance beginning of year | | 76 |
| | 47,678 |
| | 694 |
| | — |
| | 76 |
| | 47,678 |
|
| Noncontrolling interest in PDC Mountaineer, LLC | | — |
| | (47,322 | ) | | 48,800 |
| | — |
| | — |
| | (47,322 | ) |
| Net loss attributed to noncontrolling interest in subsidiary | | (76 | ) | | (280 | ) | | (1,816 | ) | | — |
| | (76 | ) | | (280 | ) |
| Balance end of year | | — |
| | 76 |
| | 47,678 |
| | — |
| | — |
| | 76 |
|
| Total noncontrolling interests in subsidiary | | — |
| | 76 |
| | 47,678 |
| | — |
| | — |
| | 76 |
|
| Total Equity | | $ | 664,112 |
| | $ | 642,241 |
| | $ | 538,593 |
| | $ | 703,181 |
| | $ | 664,112 |
| | $ | 642,241 |
|
| | | | | | | | | | | | | |
See accompanying Notes to Consolidated Financial Statements
65F- 7
PETROLEUM DEVELOPMENT CORPORATION
(dba PDC Energy)ENERGY, INC.
NOTES TO CONSOLIDATED FINANCIAL STATEMENTS
NOTE 1 - NATURE OF OPERATIONS AND BASIS OF PRESENTATION
Petroleum Development CorporationPDC Energy, Inc. ("PDC," "PDC Energy," "we," "us" or "the Company") is a domestic independent natural gas and crude oil company engaged in the exploration for and the acquisition, development, production and marketing of natural gas, natural gas liquids ("NGLs")NGLs and crude oil. As of December 31, 20112012, we owned an interest in approximately 6,5007,200 gross wells located primarily in the Wattenberg Field, Utica Shale, Appalachian Basin, Wattenberg Field, northeast Colorado and Piceance Basin. We are engaged in two business segments: (1) Oil and Gas Exploration and Production and (2) Gas Marketing.
The consolidated financial statements include the accounts of PDC, our wholly owned subsidiaries, an entity in which we have a controlling financial interest (2010 only) and our proportionate share of PDC Mountaineer, LLC ("PDCM") and our 21 of our affiliated partnerships. Pursuant to the proportionate consolidation method, our accompanying consolidated financial statements include our pro rata share of assets, liabilities, revenues and expenses of the entities which we proportionately consolidate. All material intercompany accounts and transactions have been eliminated in consolidation.
On January 1, 2010, pursuant to the adoption of new accounting changes related to variable interest entities ("VIE"), PDCM, a VIE, was deconsolidated from 100% and proportionately consolidated at 67.4%, representing only our ownership interest. Through a series of capital contributions by our investing partner, our ownership interest in PDCM decreased to 50% as of September 30, 2011. Each change in our ownership interest resulted in a decrease in our proportionate share of net assets and any future earnings. As of September 30, 2011, we concluded that PDCM was no longer a VIE because our voting rights had become proportionately equal to our economic interests and the activities of the entity were being conducted equally for the benefit of both investing partners. The status change of PDCM to a non-VIE subject to the voting interest model did not have an impact on our financial statements, as we continue to proportionately consolidate PDCM.
The following table presents a detailed summary of the capital contributions made by our investing partner and our resulting ownership interest.
|
| | | | | | |
| Date of Contribution | | Investing
Partner
Contribution | | PDC's
Ownership Interest
in PDCM |
| | | (in thousands) | | |
| | | | | |
| April 1, 2010 | | $ | 28,000 |
| | 57.8% |
| November 1, 2010 | | 7,000 |
| | 55.8% |
| January 1, 2011 | | 7,000 |
| | 53.9% |
| March 1, 2011 | | 5,000 |
| | 52.7% |
| September 23, 2011 | | 11,500 |
| | 50.0% |
The preparation of our consolidated financial statements in accordance with accounting principles generally accepted accounting principles in the United States of America ("U.S. GAAP") requires us to make estimates and assumptions that affect the amounts reported in our consolidated financial statements and accompanying notes. Actual results could differ from those estimates. Estimates which are particularly significant to our consolidated financial statements include estimates of natural gas, NGLNGLs and crude oil sales revenue, natural gas, NGLNGLs and crude oil reserves, future cash flows from natural gas and crude oil properties, valuation of derivative instruments and valuation of deferred income tax assets.
Certain reclassifications have been made to prior period financial statements to conform to the current year presentation. The reclassifications are mainly related to our discontinued operations. See Note 13 for additional information regarding our discontinued operations. We alsoAccretion of asset retirement obligations have been reclassified (1) impairment and amortization charges recorded for unproved properties out of the statement of operations'operations line item exploration expenseproduction cost and into impairmentaccretion of natural gasasset retirement obligations. Deferred income taxes have been reclassified out of the balance sheet line item prepaid expenses and crude oil properties,other current assets and (2)into deferred income taxes. We also reclassified prepaid well costs write-offs out of the derivatives fair value hierarchy levelstatement of our NYMEX-based natural gas fixed-price swaps from Level 1 to Level 2cash flows line item changes in other assets and our PEPL and CIG-based natural gas fixed-price swaps, crude oil fixed-price swaps, basis swaps and natural gas physical purchases from Level 3 to Level 2.into prepaid well costs write-offs. These reclassifications had no impact on previously reported cash flows, net income, earnings per share or shareholders' equity.
NOTE 2 - SUMMARY OF SIGNIFICANT ACCOUNTING POLICIES
Consolidation and Accounting for Variable Interest Entities. A VIE is consolidated if it is determined that we are the entity's primary beneficiary. The primary beneficiary of a VIE has both the following characteristics: (1) the power to direct the activities of the VIE that most significantly impact the entity's economic performance and (2) the obligation to absorb losses of the entity that could potentially be significant to the VIE or the right to receive benefits from the entity that could potentially be significant to the VIE. In determining whether we are the primary beneficiary of a VIE, we consider a number of factors, including our ability to direct the activities that most significantly affect the entity's economic success and our contractual rights and responsibilities under arrangements with the entity. As certain events occur, we may reconsider whether those events have caused us to become the primary beneficiary. A reconsideration event may also occur when we acquire new or additional interests in a VIE.
PETROLEUM DEVELOPMENT CORPORATION
(dba PDC Energy)
NOTES TO CONSOLIDATED FINANCIAL STATEMENTS - Continued
The following table presents the carrying amount and classification of our proportionate share of PDCM's assets and liabilities included in our balance sheets.
|
| | | | | | | | |
| | | As of December 31, |
| | | 2011 | | 2010 |
| Balance Sheets | | (in thousands) |
| | | | | |
| Cash and cash equivalents | | $ | 748 |
| | $ | 1,560 |
|
| Other current assets | | 8,568 |
| | 3,206 |
|
| Property, plant and equipment, net | | 211,150 |
| | 101,679 |
|
| Other assets | | 4,833 |
| | 1,986 |
|
| Total assets | | $ | 225,299 |
| | $ | 108,431 |
|
| | | | | |
| Other current liabilities | | $ | 9,076 |
| | $ | 4,641 |
|
| Long-term debt | | 24,000 |
| | — |
|
| Asset retirement obligation | | 18,917 |
| | 8,681 |
|
| Other liabilities | | 2,103 |
| | 1,370 |
|
| Equity | | 171,203 |
| | 93,739 |
|
| Total liabilities and equity | | $ | 225,299 |
| | $ | 108,431 |
|
| | | | | |
Cash Equivalents. We consider all highly liquid investments with original maturities of three months or less to be cash equivalents.
Restricted Cash. Pursuant to an oral litigation settlement agreement, in July 2011, we funded an escrow account in the amount of $8.7 million. During 2012, approval and settlement occurred and the $8.7 million. Final approvalmillion was released from the escrow account thereby reducing our restricted cash balance. In conjunction with our acquisition of the settlement was receivedcertain Wattenberg assets in January 2012, we funded an escrow account with payment of settlement amount to be distributed during the first half of 2012. See Note 11 for a discussion of this settlement.$1.7 million.
We are required by certain government agencies or agreements to maintain bonds or cash accounts for various operating activities. As of December 31, 2011,2012, we had collateral in the form of certificates of deposit and cash totaling $3.8$5.3 million which consisted of $2.3$3.9 million and $1.5$1.4 million included in restricted cash and other assets, respectively. As of December 31, 2010,2011, we had collateral in the form of certificates of deposit and cash totaling $5.1$3.8 million which consisted of $2.5$2.3 million and $2.6$1.5 million included in restricted cash and other assets, respectively.
Inventory. Inventory consists of crude oil, stated at the lower of cost to produce or market, and other production supplies intended to be used in our natural gas and crude oil operations. As of December 31, 2012 and 2011 and 2010,, inventory of $1.1$1.2 million and $1.4$1.1 million, respectively, is included in prepaid expenses and other current assets on the balance sheets.
Derivative Financial Instruments. We are exposed to the effect of market fluctuations in the prices of natural gas and crude oil. We employ established policies and procedures to manage a portion of the risks associated with these market fluctuations using commodity derivative instruments. Our policy prohibits the use of natural gas and crude oil derivative instruments for speculative purposes.
All derivative assets and liabilities are recorded on our balance sheets at fair value. We have elected not to designate any of our derivative instruments as hedges. Classification of realized and unrealized gains and losses resulting from maturities and changes in fair value of open derivatives depends on the purpose for issuing or holding the derivative. Accordingly, changes in the fair value of our derivative instruments are recorded in the statements of operations, with the exception of changes in fair value related to those derivatives we designated to our affiliated partnerships. Changes in the fair value of derivative instruments related to our Oil and Gas Exploration and Production segment are recorded in commodity price risk management, net. Changes in the fair value of derivative instruments related to our Gas Marketing segment are recorded in sales from and cost of natural gas marketing. Changes in the fair value of the derivative instruments designated to our affiliated partnerships are recorded on the balance sheets in accounts payable affiliates and accounts receivable affiliates. As positions designated to our affiliated partnerships settle, the realized gains and losses are netted for distribution. Net realized gains are paid to the partnerships and net realized losses are deducted from the partnerships’ cash distributions from production. The affiliated partnerships bear their designated share of counterparty risk.
The validation of the derivative instrument's fair value is performed internally and, while we use common industry practices to develop our valuation techniques, changes in our pricing methodologies or the underlying assumptions could result in significantly different fair values. See Notes 3, Fair Value of Financial Instruments, and 4,Derivative Financial Instruments, for a discussion of our derivative fair value measurements and a summary fair value table of our open positions as of December 31, 2012 and 2011 and 2010,, respectively.
PDC ENERGY, INC.
NOTES TO CONSOLIDATED FINANCIAL STATEMENTS - Continued
Properties and Equipment. Significant accounting polices related to our properties and equipment are discussed below.
Natural Gas and Crude Oil Properties. We account for our natural gas and crude oil properties under the successful efforts method
PETROLEUM DEVELOPMENT CORPORATION
(dba PDC Energy)
NOTES TO CONSOLIDATED FINANCIAL STATEMENTS - Continued
of accounting. Costs of proved developed producing properties, successful exploratory wells and developmental dry hole costs are capitalized and depreciated or depleted by the unit-of-production method based on estimated proved developed producing reserves. Property acquisition costs are depreciated or depleted on the unit-of-production method based on estimated proved reserves. We calculate quarterly depreciation, depletion and amortization ("DD&A") expense by using our estimated prior period-end reserves as the denominator, with the exception of our fourth quarter where we use the year-end reserve estimate adjusted to add back fourth quarter production. Upon the sale or retirement of significant portions of or complete fields of depreciable or depletable property, the net book value thereof, less proceeds or salvage value, is recognized in the statement of operations as a gain or loss. Upon the sale of individual wells or a portion of a field, the proceeds are credited to accumulated DD&A.
Exploration costs, including geological and geophysical expenses and delay rentals, are charged to expense as incurred. Exploratory well drilling costs, including the cost of stratigraphic test wells, are initially capitalized, but charged to expense if the well is determined to be economically nonproductive. The status of each in-progress well is reviewed quarterly to determine the proper accounting treatment under the successful efforts method of accounting. Exploratory well costs continue to be capitalized as long as we have found a sufficient quantity of reserves to justify our completion as a producing well, we are making sufficient progress assessing our reserves and economic and operating viability or we have not made sufficient progress to allow for final determination of productivity. If an in-progress exploratory well is found to be economically unsuccessful prior to the issuance of the financial statements, the costs incurred prior to the end of the reporting period are expensedcharged to exploration expense. If we are unable to make a final determination about the productive status of a well prior to issuance of the financial statements, the costs associated with the well are classified as "suspended well costs" until we have had sufficient time to conduct additional completion or testing operations to evaluate the pertinent geological and engineering data obtained. At the time we are able to make a final determination of a well’s productive status, the same well is removed from the suspended well status and the proper accounting treatment is recorded. See Note 6, Properties and Equipment, for disclosure related to changes in our capitalized exploratory well costs.
Impairment of Natural Gas and Crude Oil Properties. The following table presents impairment charges recorded for natural gas and crude oil properties.
|
| | | | | | | | | | | |
| | Year Ended December 31, |
| | 2011 | | 2010 | | 2009 |
| | (in thousands) |
| Continuing operations: | | | | | |
| Impairment of proved properties | $ | 22,460 |
| | $ | — |
| | $ | 926 |
|
| Impairment of individually significant unproved properties | 1,108 |
| | 1,477 |
| | 982 |
|
| Amortization of individually insignificant unproved properties | 1,591 |
| | 5,004 |
| | 3,126 |
|
| Total in continuing operations | 25,159 |
| | 6,481 |
| | 5,034 |
|
| Discontinued operations: | | | | | |
| Impairment of proved properties | — |
| | 4,666 |
| | — |
|
| Impairment of individually significant unproved properties | — |
| | — |
| | 3,171 |
|
| Total in discontinued operations | — |
| | 4,666 |
| | 3,171 |
|
| Total impairment of natural gas and crude oil properties | $ | 25,159 |
| | $ | 11,147 |
| | $ | 8,205 |
|
| | | | | | |
Proved Property Impairment. We assess our producing natural gas and crude oil properties for possible impairment, upon a triggering event, by comparing net capitalized costs, or carrying value, to estimated undiscounted future net cash flows on a field-by-field basis using estimated production based upon prices at which we reasonably estimate the commodity to be sold. The estimates of future prices may differ from current market prices of natural gas and crude oil. Certain events, including but not limited to downward revisions in estimates to our reserve quantities, expectations of falling commodity prices or rising operating costs, could result in a triggering event and, therefore, a possible impairment of our proved natural gas and crude oil properties. If net capitalized costs exceed undiscounted future net cash flows, the measurement of impairment is based on estimated fair value utilizing a future discounted cash flows analysis and is measured by the amount by which the net capitalized costs exceed their fair value.
In October 2011, pursuant to our plan to divest our northeast Colorado ("NECO") assets, we reclassified our NECO assets as held for sale. Long lived assets held for sale Impairments are required to be measured at the lower of carrying value or fair value less costs to sell. We compared the fair value, estimated using Level 3 inputs, which included unrelated third party bids, less costs to sell the assets to their carrying value. The results of the comparison identified that the assets' carrying value exceeded the estimated fair value and, therefore, resulted in an impairment charge of $22.5 million to write-down the assets to fair value. The impairment charge was included in the statement of operations'operations line item impairment of natural gas and crude oil properties. Late in the fourth quarter, subsequent to the impairment charge, we reversed our decision to divest the assetsproperties, with a corresponding impact on accumulated depreciation, depletion and the assets were reclassified as held and used as of December 31, 2011. The subsequent decision not to divest the NECO assets did not result in any further write-downs of the related net assets. See Note 13.
PETROLEUM DEVELOPMENT CORPORATION
(dba PDC Energy)
NOTES TO CONSOLIDATED FINANCIAL STATEMENTS - Continued
In May 2010, pursuant to our entry into an agreement to sell our Michigan assets, we reclassified our Michigan assets as held for sale. We compared the transactional sales price, considered a Level 3 input, less costs to sell to the carrying value of our Michigan net assets. The net carrying value exceeded the net sales price and, therefore, during the second quarter of 2010, we recognized an impairment charge of $4.7 million to reduce the carrying value of the net assets to reflect the net sales price. The impairment charge was included in discontinued operationsamortization on the statement of operations. See Note 13.balance sheet.
Unproved Property Impairment. The acquisition costs of unproved properties are capitalized when incurred, until such properties are transferred to proved properties or charged to expense when expired, impaired or amortized. Unproved natural gas and crude oil properties with individually significant acquisition costs are periodically assessed for impairment. Unproved natural gas and crude oil properties which are not individually significant are amortized, by field, based on our historical experience, acquisition dates and average lease terms. Impairment and amortization charges related to unproved natural gas and crude oil properties are charged to the statement of operations'operations line item impairment of natural gas and crude oil properties.
Other Property and Equipment. The following table presents the estimated useful lives of our other property and equipment.equipment:
|
| |
| Pipelines and related facilities | 10 - 17 years |
| Transportation and other equipment | 3 - 20 years |
| Buildings | 30 - 40 years |
Other property and equipment areis carried at cost. Depreciation is provided principally on the straight-line method over the assetsassets' estimated useful lives. We review these long-lived assets for impairment whenever events or changes in circumstances indicate that the carrying amount of an asset may not be recoverable. Recoverability of assets to be held and used is measured by a comparison of the carrying
amount of anthe asset to estimated undiscounted future cash flows expected to be generated by the asset. If the carrying amount of anthe asset exceeds our estimated future cash flows, an impairment charge is recognized in the amount by which the carrying amount of the asset exceeds the fair value of the asset. No impairment to other property and equipment was recognized in 2012 or 2011. ImpairmentsImpairment recognized in 2010 and 2009 werewas immaterial.
Maintenance and repairsrepair costs on other property and equipment are charged to expense as incurred. Major renewals and improvements are capitalized and depreciated over the remaining useful life of the asset. Upon the sale or other disposition of assets, the cost and related accumulated DD&A are removed from the accounts, the proceeds are applied thereto and any resulting gain or loss is reflected in income. Total depreciation expense related to other property and equipment was $6.7$7.5 million $7.5, $6.7 million and $8.1$7.5 million in 20112012, 20102011 and 2009,2010, respectively.
Capitalized Interest. Interest costs are capitalized as part of the historical cost of acquiring assets. Investments in unproved natural gas and crude oil properties and major development projects, on which DD&A is not currently recorded and on which exploration or development
PDC ENERGY, INC.
NOTES TO CONSOLIDATED FINANCIAL STATEMENTS - Continued
activities are in progress, qualify for capitalization of interest. Major construction projects also qualify for interest capitalization until the asset is ready forto be placed into service. Capitalized interest is calculated by multiplying our weighted-average interest rate on our debt outstanding by the qualifying costs. Interest capitalized may not exceed gross interest expense for the period. As the qualifying asset is moved to the DD&A pool,placed into service, we begin amortizing the related capitalized interest is also transferred and is amortized over the useful life of the asset. Capitalized interest totaled $1.7$1.2 million $0.3, $1.7 million and $0.8$0.3 million in 20112012, 20102011 and 2009,2010, respectively.
Assets Held for Sale. Assets held for sale are valued at the lower of their carrying amount or estimated fair value less costs to sell. If the carrying amount of the assets exceedexceeds their estimated fair value, an impairment loss is recognized. Fair values are estimated using accepted valuation techniques such as a discounted cash flow model, valuations performed by third parties, earnings multiples or indicative bids, when available. Management considers historical experience and all available information at the time the estimates are made; however, the fair values that are ultimately realized upon the sale of the assets to be divested may differ from the estimated fair values reflected in the consolidated financial statements. Depreciation, depletion, and amortization expense is not recorded on assets to be divested once they are classified as held for sale.
Assets to be divested are classified in the consolidated financial statements as held for sale, and the activities of assets to be divested are classified either as discontinued operations or continuing operations. For assets classified as discontinued operations, the balance sheet amounts and results of operations are reclassified from their historical presentation to assets and liabilities held for sale on the consolidated balance sheets and to discontinued operations on the consolidated statements of operations, respectively, for all periods presented. The gains or losses associated with these divested assets are recorded in discontinued operations on the consolidated statements of operations. Management does not expect any continuing involvement with businesses classified as discontinued operations following their divestiture. Businesses classified as held for sale are expected to be disposed of within one year. For businesses classified as held for sale that do not qualify for discontinued operations treatment, the balance sheet amounts are reclassified from their historical presentation to assets and liabilities held for sale for all periods presented. The results of operations continue to be reported in continuing operations.
Production Tax Liability. Production tax liability represents estimated taxes, primarily severance, ad valorem and property, to be paid to the states and counties in which we produce natural gas, NGLs and crude oil, including the production of our affiliated partnerships. Our share of these taxes is expensed to production costs. The partnerships' share, not owned by us, is recognized as a receivable in accounts receivable affiliates on the balance sheets. The long-term portion of the production tax liability is included in other liabilities on the balance sheets and was $19.4$18.7 million and $16.4$19.4 million in December 31, 20112012 and 2010,2011, respectively.
PETROLEUM DEVELOPMENT CORPORATION
(dba PDC Energy)
NOTES TO CONSOLIDATED FINANCIAL STATEMENTS - Continued
Income Taxes. We account for income taxes under the asset and liability method. We recognize deferred tax assets and liabilities for the future tax consequences attributable to operating loss and future credit carryforwards and differences between the financial statement carrying amounts of existing assets and liabilities and their respective tax basis. Deferred tax assets and liabilities are measured using enacted tax rates expected to apply to taxable income in the years in which those temporary differences are expected to be recovered or settled. The effect on deferred tax assets and liabilities of a change in tax rates is recognized in income in the period that includes the enactment date. If we determine that it is more likely than not that some portion or all of the deferred tax assets will not be realized, we record a valuation allowance, thereby reducing the deferred tax assets to what we consider realizable. As of December 31, 20112012 and 2010,2011, we had no valuation allowance.
Debt Issuance Costs. Debt issuance costs are capitalized and amortized over the life of the respective borrowings using the effective interest method. As of December 31, 20112012 and 2010,2011, included in other assets was $12.3$17.4 million and $14.6$12.3 million, respectively, related to debt issuance costs. The December 31, 2011,2012, amount included $2.4$1.9 million in costs related to the issuance of our 3.25% convertible senior notes due 2016, $3.4$10.9 million related to our 12%7.75% senior notes due 20182022 and $6.5$4.6 million related to our bankrevolving credit facilities.facility and the PDCM credit facility. The December 31, 2011, amount included $2.4 million in costs related to the issuance of our 3.25% convertible senior notes due 2016, $3.4 million related to our 12% senior notes due 2022 and $6.5 million related to our revolving credit facility and the PDCM credit facility.
Asset Retirement Obligations. We account for asset retirement obligations by recording the fair value of our plugging and abandonment obligations when incurred, which is at the time the well is completely drilled.completed. Upon initial recognition of an asset retirement obligation, we increase the carrying amount of the long-lived asset by the same amount as the liability. Over time, the liabilities are accreted for the change in their present value, through charges to production costs.value. The initial capitalized costs, net of salvage value, are depleted over the useful lives of the related assets through charges to DD&A expense. If the fair value of the estimated asset retirement obligation changes, an adjustment is recorded to both the asset retirement obligation and the asset retirement cost. Revisions in estimated liabilities can result from changes in retirement costs or the estimated timing of settling asset retirement obligations. See Note 9, Asset Retirement Obligations, for a reconciliation of the changes in our asset retirement obligation from January 1, 2010, to December 31, 2011.obligation.
Treasury Shares. We record treasury share purchases at cost, which includes incremental direct transaction costs. Amounts are recorded as reductions in shareholders’ equity in the consolidated balance sheets. When we retire treasury shares, we charge any excess of cost over the par value entirely to additional paid-in-capital ("APIC"), to the extent we have amounts in additional paid-in-capital,APIC, with any remaining excess cost being charged to retained earnings.
Revenue Recognition. Significant accounting polices related to our revenue recognition are discussed below.
Natural gas, NGLNGLs and crude oil sales. Natural gas, NGLNGLs and crude oil revenues are recognized when production is sold to a purchaser at a fixed or determinable price, delivery has occurred, rights and responsibility of ownership have transferred and collection of revenue is reasonably assured. We currently use the "net-back" method of accounting for transportation and processing arrangements of our sales when the transportation and/or processing is provided by or through the purchaser. Under these arrangements, we sell gas at the wellhead and collect a price and recognize revenues based on the wellhead sales price since transportation and processing costs downstream of the wellhead are incurred by the purchasers and reflected in the wellhead price. The majority of our natural gas and NGLs in Colorado are sold on a long-term basis ranging
PDC ENERGY, INC.
NOTES TO CONSOLIDATED FINANCIAL STATEMENTS - Continued
from 15 years to the life of the lease. Sales of natural gas and NGLs in other regions, along with crude oil, are sold under contracts with terms ranging from one month to three years. Virtually all of our contract pricing provisions are tied to a market index, with certain adjustments based on, among other factors, whether a well delivers to a gathering or transmission line and the quality of the natural gas and prevailing supply and demand conditions.gas.
Well operations and pipeline income. We are paid a monthly operating fee for each well we operate and the natural gas transported for outside owners, including the limited partnerships we sponsored.sponsor. Well operations and pipeline income is recognized when persuasive evidence of an arrangement exists, services have been rendered, collection of revenues is reasonably assured and the sales price is fixed or determinable.determinable, services have been rendered and collection of revenues is reasonably assured.
Natural gas marketing. Natural gas marketing is reported on the gross method of accounting, based on the nature of the agreements between our natural gas marketing subsidiary, Riley Natural Gas ("RNG"), our suppliers and our customers. RNG our marketing subsidiary, purchases gas from many small producers and bundles the gas together for a price advantage to sell in larger amounts to purchasers of natural gas for a price advantage.gas. RNG has latitude in establishing price and discretion in supplier and purchaser selection. Natural gas marketing revenues and expenses reflect the full cost and revenue of those transactions because RNG takes title to the gas it purchases from the various producers and bears the risks and rewards of that ownership. Both the realized and unrealized gains and losses of the RNG commodity-based derivative transactions for natural gas marketing are included in sales from or cost of natural gas marketing, as applicable.
Accounting for Acquisitions Using Purchase Accounting. We utilize the purchase method to account for acquisitions. Pursuant to purchase method accounting, we allocate the cost of the acquisition to assets acquired and liabilities assumed based on fair values as of the acquisition date. The purchase price allocations are based on appraisals, discounted cash flows, quoted market prices and estimates by management. When appropriate, we review comparable purchases and sales of natural gas and crude oil properties within the same regions and use that data as a basis for fair market value; for example, the amount at which a willing buyer and seller would enter into an exchange for such properties.
In estimating the fair values of assets acquired and liabilities assumed, we make various assumptions. The most significant assumptions relate to the estimated fair values assigned to proved developed producing, proved developed non-producing, proved undeveloped, unproved natural gas and crude oil properties and other non-natural gas and crude oil properties. To estimate the fair values of these properties, we prepare estimates of natural gas and crude oil reserves. We estimate future prices by using the applicable forward pricing strip to apply to our estimate of reserve quantities acquired, and estimates of future operating and development costs, to arrive at an estimate of future net revenues. For estimated proved reserves, the future net revenues are discounted using a market-based weighted-average cost of capital rate determined appropriate at the time of the acquisition. The market-based weighted-average cost of capital rate is subject to additional project-specific risking factors. To compensate for the inherent risk of estimating and valuing unproved properties, we reduce the discounted future net revenues of probable and possible reserves by additional risk-weighting factors.
We record deferred taxes for any differences between the assigned values and tax basis of assets and liabilities. Estimated deferred taxes are based on available information concerning the tax basis of assets acquired and liabilities assumed and loss carryforwards at the acquisition date, although such estimates may change in the future as additional information becomes known.
Stock-Based Compensation. Stock-based compensation is recognized in our financial statements based on the grant-date fair value on the date of grant or modification, of the equity instrument awarded. Stock-based compensation expense is recognized in the financial statements on a straight-line basis over the vesting period for the entire award. To the extent compensation cost relates to employees directly involved in natural gas and crude oil exploration and development activities, such amounts may be capitalized to properties and equipment. Amounts not capitalized to properties and equipment are recognized in the related cost and expense line item in the statement of operations. No amounts for stock-based compensation were capitalized in 20112012, 2010 or 2009.
Earnings Per Share. Basic earnings (loss) per common share ("EPS") is computed by dividing net income (loss), the numerator, by the weighted-average number of common shares outstanding for the period, the denominator. Diluted EPS is similarly computed except that the2011
PETROLEUM DEVELOPMENT CORPORATION
(dba PDC Energy)
NOTES TO CONSOLIDATED FINANCIAL STATEMENTS - Continued
denominator includes the effect, using the treasury stock method, of our unamortized portion of restricted stock, outstanding stock appreciation rights ("SARs"), stock options, convertible notes and shares held pursuant to our non-employee director deferred compensation plan, if including such potential shares of common stock is dilutive.
The following table presents a reconciliation of the weighted average diluted shares outstanding.
|
| | | | | | | | |
| | Year Ended December 31, |
| | 2011 | | 2010 | | 2009 |
| | (in thousands) |
| | | | | | |
| Weighted average common shares outstanding - basic | 23,521 |
| | 19,674 |
| | 16,448 |
|
| Dilutive effect of share-based compensation: | | | | | |
| Restricted stock | 307 |
| | 119 |
| | — |
|
| SARs | 40 |
| | 21 |
| | — |
|
| Non employee director deferred compensation | 3 |
| | 7 |
| | — |
|
| Weighted average common and common share equivalents outstanding - diluted | 23,871 |
| | 19,821 |
| | 16,448 |
|
| | | | | | |
For 2009, the weighted average common shares outstanding for both basic and diluted were the same, as the effect of dilutive securities were anti-dilutive due to our net loss. The following table presents the weighted average common share equivalents excluded from the calculation of diluted earnings (loss) per share due to their anti-dilutive effect.
|
| | | | | | | | |
| | Year Ended December 31, |
| | 2011 | | 2010 | | 2009 |
| | (in thousands) |
| | | | | | |
| Weighted average common share equivalents excluded from diluted earnings | | | | | |
| per share due to their anti-dilutive effect: | | | | | |
| Restricted stock | 220 |
| | 204 |
| | 284 |
|
| SARs | 22 |
| | — |
| | — |
|
| Stock options | 9 |
| | 10 |
| | 10 |
|
| Non employee director deferred compensation | — |
| | — |
| | 8 |
|
| Total anti-dilutive common share equivalents | 251 |
| | 214 |
| | 302 |
|
| | | | | | |
In November 2010 we issued 115,000 convertible senior notes, $1,000 principal amount, that give the holders the right to convert the principal amount into 2.7 million common shares at a conversion price of $42.40 per share. These convertible notes could have a dilutive impact on our earnings per share if the average market share price exceeds the conversion price. The table above does not include those shares issuable upon conversion as the average share price of our common stock did not exceed the conversion price during the period..
Recent Accounting Standards.
The following standard was recently adopted:
Fair Value Measurements and Disclosures. In January 2010, the FASB issued changes related to fair value measurements requiring gross presentation of activities within the Level 3 roll forward, whereby entities must present separately information about purchases, sales, issuances and settlements. These changes were effective for our financial statements issued for annual reporting periods beginning after December 15, 2010. The adoption of this change did not have a material impact on our financial statements.
The following standards were recently issued:adopted:
Fair Value Measurement. On May 12, 2011, the FASB issued changes related to fair value measurement. The changes represent the converged guidance of the FASB and the International Accounting Standards Board ("IASB") on fair value measurement. Many of the changes eliminate unnecessary wording differences between International Financial Reporting Standards ("IFRS") and U.S. GAAP. The changes expand existing disclosure requirements for fair value measurements categorized in Level 3 by requiring (1) a quantitative disclosure of the unobservable inputs and assumptions used in the measurement, (2) a description of the valuation processes in place and (3) a narrative description of the sensitivity of the fair value to changes in unobservable inputs and the interrelationships between those inputs. In addition, the changes require the categorization by level in the fair value hierarchy of items that are not measured at fair value in the statement of financial position whose fair value must be disclosed. These changes are to be applied prospectively and arewere effective for public entities during interim and annual periods beginning after December 15, 2011. Early application iswas not permitted. With the exception of the disclosure requirements, the adoption of these changes isdid not expected to have a significant impact on our financial statements.
PETROLEUM DEVELOPMENT CORPORATION
(dba PDC Energy)
NOTES TO CONSOLIDATED FINANCIAL STATEMENTS - Continued
Presentation of Comprehensive Income. On June 16, 2011, the FASB issued changes related to the presentation of comprehensive income. These changes eliminate the current option to report other comprehensive income and its components in the statement of changes in equity. These changes are intended to enhance comparability between entities that report under U.S. GAAP and those that report under IFRS, and to provide a more consistent method of presenting non-owner transactions that affect an entity's equity. An entity may elect to present items of net income and other comprehensive income in one continuous statement, referred to as the statement of comprehensive income, or in two separate, but consecutive, statements. Each component of net income and each component of other comprehensive income, together with totals
PDC ENERGY, INC.
NOTES TO CONSOLIDATED FINANCIAL STATEMENTS - Continued
for comprehensive income and its two parts, net income and other comprehensive income, would need to be displayed under either alternative. The statement(s) would need to be presented with equal prominence as the other primary financial statements. The new requirement isThese changes were effective for public entities as of theour financial statements issued for annual reporting periods beginning of a fiscal year that begins after December 15, 2011, and interim and annual periods thereafter. Early adoption is permitted, but full retrospective application is required under both sets2011. Adoption of accounting standards. We dothis change did not expect the adoption of these changes to have a material impact on our financial statements.
NOTE 3 - FAIR VALUE OF FINANCIAL INSTRUMENTS
Derivative Financial Instruments
Determination of fair value. Our fair value measurements are estimated pursuant to a fair value hierarchy that requires us to maximize the use of observable inputs and minimize the use of unobservable inputs when measuring fair value. The valuation hierarchy is based upon the transparency of inputs to the valuation of an asset or liability as of the measurement date, giving the highest priority to quoted prices in active markets (Level 1) and the lowest priority to unobservable data (Level 3). In some cases, the inputs used to measure fair value might fall in different levels of the fair value hierarchy. The lowest level input that is significant to a fair value measurement in its entirety determines the applicable level in the fair value hierarchy. Assessing the significance of a particular input to the fair value measurement in its entirety requires judgment, considering factors specific to the asset or liability, and may affect the valuation of the assets and liabilities and their placement within the fair value hierarchy levels. The three levels of inputs that may be used to measure fair value are defined as:
Level 1 – Quoted prices (unadjusted) in active markets for identical assets or liabilities.liabilities in active markets.
Level 2 – Inputs other than quoted prices included within Level 1 that are either directly or indirectly observable for the asset or liability, including (i) quoted prices for similar assets or liabilities in active markets, (ii) quoted prices for identical or similar assets or liabilities in inactive markets, (iii) inputs other than quoted prices that are observable for the asset or liability and (iv) inputs that are derived from observable market data by correlation or other means. Includes our fixed-price swaps, basis swaps and physical purchases.
Level 3 – Unobservable inputs for the asset or liability, including situations where there is little, if any, market activity for the asset or liability. Includes our natural gas and crude oil collars, crude oil puts and physical sales.activity.
Derivative Financial Instruments. We measure the fair value of our derivative instruments based on a pricing model that utilizes market-based inputs, including but not limited to the contractual price of the underlying position, current market prices, natural gas and crude oil forward curves, discount rates such as the LIBOR curve for a similar duration of each outstanding position, volatility factors and nonperformance risk. Nonperformance risk considers the effect of our credit standing on the fair value of derivative liabilities and the effect of our counterparties' credit standings on the fair value of derivative assets. Both inputs to the model are based on published credit default swap rates and the duration of each outstanding derivative position.
We validate our fair value measurement through (1) the review of counterparty statements and other supporting documentation, (2) the determination that the source of the inputs is valid, (3) the corroboration of the original source of inputs through access to multiple quotes, if available, or other information and (4) monitoring changes in valuation methods and assumptions. While we use common industry practices to develop our valuation techniques, changes in our pricing methodologies or the underlying assumptions could result in significantly different fair values. While we believe our valuation method is appropriate and consistent with those used by other market participants, the use of a different methodology or assumptions to determine the fair value of certain financial instruments could result in a different estimate of fair value.
We have evaluated the credit risk of the counterparties holding our derivative assets, which are primarily financial institutions who are also major lenders in our corporaterevolving credit facility, agreement, giving consideration to amounts outstanding for each counterparty and the duration of each outstanding derivative position. Based on our evaluation, we have determined that the potential impact of the nonperformance of our counterparties on the fair value of our derivative instruments is insignificant.not significant.
PETROLEUM DEVELOPMENT CORPORATION
(dba PDC Energy)
NOTES TO CONSOLIDATED FINANCIAL STATEMENTS - Continued
Our fixed-price swaps, basis swaps and physical purchases are included in Level 2 and our natural gas and crude oil collars, natural gas calls and physical sales are included in Level 3. The following table presents, for each applicable level within the fair value hierarchy, level, our derivative assets and liabilities, including both current and non-current portions, measured at fair value on a recurring basis.basis:
PDC ENERGY, INC.
NOTES TO CONSOLIDATED FINANCIAL STATEMENTS - Continued
| | | | As of December 31, | As of December 31, |
| | 2011 | | 2010 (a) | 2012 | | 2011 |
| | Significant other
observable
Inputs
(Level 2) | | Significant
Unobservable
Inputs
(Level 3) | | Total | | Significant other
observable
Inputs
(Level 2) | | Significant
Unobservable
Inputs
(Level 3) | | Total | Significant Other
Observable
Inputs
(Level 2) | | Significant
Unobservable
Inputs
(Level 3) | | Total | | Significant Other
Observable
Inputs
(Level 2) | | Significant
Unobservable
Inputs
(Level 3) | | Total |
| | (in thousands) | (in thousands) |
| Assets: | | | | | | | | | | | | | | | | | | | | | | |
| Commodity based derivatives | $ | 76,104 |
| | $ | 25,837 |
| | $ | 101,941 |
| | $ | 72,880 |
| | $ | 14,426 |
| | $ | 87,306 |
| |
| Commodity-based derivative contracts | | $ | 42,788 |
| | $ | 15,734 |
| | $ | 58,522 |
| | $ | 76,104 |
| | $ | 25,837 |
| | $ | 101,941 |
|
| Basis protection derivative contracts | 5 |
| | 38 |
| | 43 |
| | 10 |
| | 101 |
| | 111 |
| 387 |
| | 16 |
| | 403 |
| | 5 |
| | 38 |
| | 43 |
|
| Total assets | 76,109 |
| | 25,875 |
| | 101,984 |
| | 72,890 |
| | 14,527 |
| | 87,417 |
| 43,175 |
| | 15,750 |
| | 58,925 |
| | 76,109 |
| | 25,875 |
| | 101,984 |
|
| Liabilities: | | | | | | | | | | | | | | | | | | | | | | |
| Commodity based derivatives | 9,888 |
| | 3,768 |
| | 13,656 |
| | 16,304 |
| | 3,758 |
| | 20,062 |
| |
| Commodity-based derivative contracts | | 9,839 |
| | 2,081 |
| | 11,920 |
| | 9,888 |
| | 3,768 |
| | 13,656 |
|
| Basis protection derivative contracts | 35,424 |
| | — |
| | 35,424 |
| | 46,573 |
| | 7 |
| | 46,580 |
| 16,656 |
| | — |
| | 16,656 |
| | 35,424 |
| | — |
| | 35,424 |
|
| Total liabilities | 45,312 |
| | 3,768 |
| | 49,080 |
| | 62,877 |
| | 3,765 |
| | 66,642 |
| 26,495 |
| | 2,081 |
| | 28,576 |
| | 45,312 |
| | 3,768 |
| | 49,080 |
|
| Net asset (liability) | $ | 30,797 |
| | $ | 22,107 |
| | $ | 52,904 |
| | $ | 10,013 |
| | $ | 10,762 |
| | $ | 20,775 |
| |
| Net asset | | $ | 16,680 |
| | $ | 13,669 |
| | $ | 30,349 |
| | $ | 30,797 |
| | $ | 22,107 |
| | $ | 52,904 |
|
| | | | | | | | | | | | | | | | | | | | | | | |
__________
| |
(a) | We reclassified our NYMEX-based natural gas fixed-price swaps from Level 1 to Level 2 (decreasing the previously reported net asset in Level 1 by $64.1 million, with a corresponding increase in Level 2), Panhandle Eastern Pipeline ("PEPL") and Colorado Interstate Gas ("CIG") -based natural gas fixed-price swaps, crude oil fixed-price swaps, basis swaps and natural gas physical purchases from Level 3 to Level 2 (decreasing the previously reported net liability in Level 3 by $54.1 million, with a corresponding increase in Level 2). The amounts presented reflect these reclassifications and conform to current period presentation. |
The following table presents a reconciliation of our Level 3 assets measured at fair value measurements.value:
| |
|
| 2011 |
| 2010 (1) | | 2009 (1) | | 2012 | | 2011 | | 2010 |
|
| (in thousands) | | (in thousands) |
|
|
|
|
| | | | | | | | |
| Fair value, net asset beginning of year, January 1 |
| $ | 10,762 |
|
| $ | 15,048 |
| | $ | 51,229 |
| |
| Fair value, net asset, beginning of year | | | $ | 22,107 |
| | $ | 10,762 |
| | $ | 15,048 |
|
| Changes in fair value included in statement of operations line item: |
|
|
|
| | | | | | | | |
| Commodity price risk management gain (loss), net |
| 13,487 |
|
| 11,591 |
| | 20,686 |
| |
| Commodity price risk management gain, net | | | 7,576 |
| | 13,487 |
| | 11,591 |
|
| Sales from natural gas marketing |
| 114 |
|
| 580 |
| | (388 | ) | | 63 |
| | 114 |
| | 580 |
|
| Cost of natural gas marketing |
| — |
|
| 23 |
| | — |
| | — |
| | — |
| | 23 |
|
| Changes in fair value included in balance sheet line item (2): |
|
|
|
| | | |
| Changes in fair value included in balance sheet line item (1): | | | | | | | |
| Accounts receivable affiliates |
| 49 |
|
| 231 |
| | (10 | ) | | — |
| | 49 |
| | 231 |
|
| Accounts payable affiliates |
| (454 | ) |
| (1,737 | ) | | (8,941 | ) | | (319 | ) | | (454 | ) | | (1,737 | ) |
| Settlements included in statement of operations line items: |
|
|
|
| | | | | | | | |
| Commodity price risk management gain (loss), net |
| (1,712 | ) |
| (14,467 | ) | | — |
| |
| Commodity price risk management loss, net | | | (15,644 | ) | | (1,712 | ) | | (14,467 | ) |
| Sales from natural gas marketing |
| (139 | ) |
| (484 | ) | | (47,469 | ) | | (114 | ) | | (139 | ) | | (484 | ) |
| Cost of natural gas marketing |
| — |
|
| (23 | ) | | (59 | ) | | — |
| | — |
| | (23 | ) |
| Fair value, net asset end of year, December 31 |
| $ | 22,107 |
|
| $ | 10,762 |
| | $ | 15,048 |
| |
| Fair value, net asset end of year | | | $ | 13,669 |
| | $ | 22,107 |
| | $ | 10,762 |
|
|
|
|
|
| | | | | | | | |
| Changes in unrealized gains (losses) relating to assets (liabilities) still held |
|
|
|
| | | | | | | | |
| as of December 31, 2011, included in statement of operations line item: |
|
|
|
| | | |
| Commodity price risk management gain (loss), net |
| $ | 11,669 |
|
| $ | 9,594 |
| | $ | 2,614 |
| |
| as of year-end, included in statement of operations line item: | | | | | | | |
| Commodity price risk management gain, net | | | $ | 3,665 |
| | $ | 11,669 |
| | $ | 9,594 |
|
| Sales from natural gas marketing |
| (3 | ) |
| 54 |
| | 29 |
| | 1 |
| | (3 | ) | | 54 |
|
| Total | | | $ | 3,666 |
| | $ | 11,666 |
| | $ | 9,648 |
|
|
| $ | 11,666 |
|
| $ | 9,648 |
| | $ | 2,643 |
| | | | | | |
|
|
|
| | | |
__________
| |
| (1) | We reclassified our PEPL and CIG-based natural gas fixed-price swaps, crude oil fixed-price swaps, basis swaps and natural gas physical purchases from Level 3 to Level 2 (decreasing the reported net liability at the beginning of 2010 by $44 million and the reported net asset at the beginning of 2009 by $83.6 million). The amounts presented reflect these reclassifications and conform to current period presentation. |
| |
(2) | Represents the change in fair value related to derivative instruments entered into by us and designated to our affiliated partnerships. |
See Note 4 for additional disclosure related toThe significant unobservable input used in the fair value measurement of our derivative financial instruments.
PETROLEUM DEVELOPMENT CORPORATIONcontracts is the implied volatility curve, which is provided by a third-party vendor. A significant increase or decrease in the implied volatility, in isolation, would have a directionally similar effect resulting in a significantly higher or lower fair value measurement of our Level 3 derivative contracts.
(dba PDC Energy)
NOTES TO CONSOLIDATED FINANCIAL STATEMENTS - Continued
Non-Derivative Financial Assets and Liabilities
The carrying values of the financial instruments comprisingincluded in current assets and current liabilities approximate fair value due to the short-term maturities of these instruments.
The liability associated with our non-qualified deferred compensation plan for non-employee directors may be settled in cash or shares of our common stock. The carrying value of this obligation is based on the quoted market price of our common stock, which is a Level 1 input.
PDC ENERGY, INC.
NOTES TO CONSOLIDATED FINANCIAL STATEMENTS - Continued
The portion of our long-term debt related to our revolving credit facility, as well as our proportionate share of PDCM's credit facility, approximates fair value due to the variable nature of its related interest rate.rates. We have not elected to account for the portion of our long-term debt related to our senior notes under the fair value option; however, as of December 31, 2011,2012, we estimate the fair value of the portion of our long-term debt related to the 3.25% convertible senior notes due 2016 to be $123.8$125.3 million, or 107.7%109% of par value, and the portion related to our 12%7.75% senior notes due 20182022 to be $222.3$512.8 million, or 109.5%102.6% of par value. We determined these valuations based upon measurements of trading activity and broker and/or dealer quotes, respectively.respectively, which are published market prices, and therefore are Level 2 inputs.
See Note 2, subsections PropertySummary of Significant Accounting Policies - Properties and Equipment, Natural Gas and Crude Oil Properties and Asset Retirement Obligations, for a discussion of how we determined fair value for these assets and liabilities.
NOTE 4 - DERIVATIVE FINANCIAL INSTRUMENTS
Our results of operations and operating cash flows are affected by changes in market prices for natural gas, NGLs and crude oil. To manage a portion of our exposure to price volatility from producing natural gas and crude oil, we utilize the following economic hedging strategies for each of our business segments.
For natural gas and crude oil sales, we enter into derivative contracts to protect against price declines in future periods. While we structure these derivatives to reduce our exposure to changes in price associated with the derivative commodity, they also limit the benefit we might otherwise have received from price increases in the physical market.market; and
For natural gas marketing, we enter into fixed-price physical purchase and sale agreements that qualify as derivative contracts. In order to offset the fixed-price physical derivatives in our natural gas marketing, we enter into financial derivative instruments that have the effect of locking in the prices we will receive or pay for the same volumes and period, offsetting the physical derivative.
We believe our derivative instruments continue to be effective in achieving the risk management objectives for which they were intended. As of December 31, 20112012, we had derivative instruments in place for a portion of our anticipated production through 20152016 for a total of 44,21568,853 BBtu of natural gas and 2,5403,754 MBbls of crude oil.
As of December 31, 20112012, our derivative instruments were comprised of commodity floors, collars and swaps, basis protection swaps and physical sales and purchases.
Floor options (puts) are arrangements where, if the index price falls below the fixed put strike price, we receive the market price from the purchaser and receive the difference between the put strike price and index price from the counterparty. If the index price exceeds the fixed put strike price, then no payment is due from us to the counterparty.counterparty;
Collars contain a fixed floor price and ceiling price (call). If the index price falls below the fixed put strike price, we receive the market price from the purchaser and receive the difference between the put strike price and index price from the counterparty. If the index price exceeds the fixed call strike price, we receive the market price from the purchaser and pay the difference between the call strike price and index price to the counterparty. If the index price is between the put and call strike price, no payments are due to or from the counterparty.counterparty;
Swaps are arrangements that guarantee a fixed price. If the index price is below the fixed contract price, we receive the market price from the purchaser and receive the difference between the index price and the fixed contract price from the counterparty. If the index price is above the fixed contract price, we receive the market price from the purchaser and pay the difference between the index price and the fixed contract price to the counterparty. If the index price and contract price are the same, no payment is due to or from the counterparty.counterparty;
Basis protection swaps are arrangements that guarantee a price differential for natural gas from a specified delivery point. For CIG-basis protection swaps, which have negative differentials to NYMEX, we receive a payment from the counterparty if the price differential is greater than the stated terms of the contract and pay the counterparty if the price differential is less than the stated terms of the contract. If the market price and contract price are the same, no payment is due to or from the counterparty.counterparty; and
Physical sales and purchases are derivatives for fixed-priced physical transactions where we sell or purchase third partythird-party supply at fixed rates. These physical derivatives are offset by financial swaps: for a physical sale the offset is a swap purchase and for a physical purchase the offset is a swap sale.
PETROLEUM DEVELOPMENT CORPORATION
(dba PDC Energy)ENERGY, INC.
NOTES TO CONSOLIDATED FINANCIAL STATEMENTS - Continued
The following table presents the location and fair value amounts of our derivative instruments on the balance sheets as of December 31, 2012 and 2011 and 2010.:
| | | | | Fair Value As of December 31, | |
| Derivatives instruments not designated as hedges (1): | | Balance sheet line item | | 2011 | | 2010 | |
| Derivatives instruments: | | Derivatives instruments: | | Balance sheet line item | | 2012 | | 2011 |
| | | (in thousands) | | (in thousands) |
| Derivative assets: | Current | | | | | Current | | | | |
| | Commodity contracts | | | | | Commodity contracts | | | | |
| | Related to natural gas and crude oil sales | | Fair value of derivatives | | $ | 51,220 |
| | $ | 32,837 |
| Related to natural gas and crude oil sales | | Fair value of derivatives | | $ | 47,016 |
| | $ | 51,220 |
|
| | Related to affiliated partnerships (2) | | Fair value of derivatives | | 8,018 |
| | 8,231 |
| Related to affiliated partnerships (1) | | Fair value of derivatives | | 4,707 |
| | 8,018 |
|
| | Related to natural gas marketing | | Fair value of derivatives | | 1,528 |
| | 1,811 |
| Related to natural gas marketing | | Fair value of derivatives | | 302 |
| | 1,528 |
|
| | Basis protection contracts | | | | | Basis protection contracts | | | | |
| | Related to natural gas marketing | | Fair value of derivatives | | 43 |
| | 74 |
| Related to natural gas marketing | | Fair value of derivatives | | 17 |
| | 43 |
|
| | | 60,809 |
| | 42,953 |
| | 52,042 |
| | 60,809 |
|
| | Non Current | | | | | Non Current | | | | |
| | Commodity contracts | | | | | Commodity contracts | | | | |
| | Related to natural gas and crude oil sales | | Fair value of derivatives | | 34,938 |
| | 32,270 |
| Related to natural gas and crude oil sales | | Fair value of derivatives | | 6,671 |
| | 34,938 |
|
| | Related to affiliated partnerships (2) | | Fair value of derivatives | | 6,134 |
| | 12,111 |
| Related to affiliated partnerships (1) | | Fair value of derivatives | | — |
| | 6,134 |
|
| | Related to natural gas marketing | | Fair value of derivatives | | 103 |
| | 46 |
| Related to natural gas marketing | | Fair value of derivatives | | 203 |
| | 103 |
|
| | Basis protection contracts | | | | | Basis protection contracts | | | | |
| | Related to natural gas marketing | | Fair value of derivatives | | — |
| | 37 |
| Related to natural gas marketing | | Fair value of derivatives | | 9 |
| | — |
|
| | | 41,175 |
| | 44,464 |
| | 6,883 |
| | 41,175 |
|
| Total derivative assets | | $ | 101,984 |
| | $ | 87,417 |
| | $ | 58,925 |
| | $ | 101,984 |
|
| | | | | | | | | |
| Derivative liabilities: | Current | | | | | Current | | | | |
| | Commodity contracts | | | | | Commodity contracts | | | | |
| | Related to natural gas and crude oil sales | | Fair value of derivatives | | $ | 7,498 |
| | $ | 10,636 |
| Related to natural gas and crude oil sales | | Fair value of derivatives | | $ | 1,744 |
| | $ | 7,498 |
|
| | Related to affiliated partnerships (3) | | Fair value of derivatives | | 211 |
| | 1,676 |
| Related to affiliated partnerships (2) | | Fair value of derivatives | | — |
| | 211 |
|
| | Related to natural gas marketing | | Fair value of derivatives | | 1,384 |
| | 1,492 |
| Related to natural gas marketing | | Fair value of derivatives | | 226 |
| | 1,384 |
|
| | Basis protection contracts | | | | | Basis protection contracts | | | | |
| | Related to natural gas and crude oil sales | | Fair value of derivatives | | 15,762 |
| | 11,725 |
| Related to natural gas and crude oil sales | | Fair value of derivatives | | 14,329 |
| | 15,762 |
|
| | Related to affiliated partnerships (3) | | Fair value of derivatives | | 3,116 |
| | 4,462 |
| Related to affiliated partnerships (2) | | Fair value of derivatives | | 2,140 |
| | 3,116 |
|
| | Related to natural gas marketing | | Fair value of derivatives | | 3 |
| | 7 |
| Related to natural gas marketing | | Fair value of derivatives | | — |
| | 3 |
|
| | | 27,974 |
| | 29,998 |
| | 18,439 |
| | 27,974 |
|
| | Non Current | | | | | Non Current | | | | |
| | Commodity contracts | | | | | Commodity contracts | | | | |
| | Related to natural gas and crude oil sales | | Fair value of derivatives | | 4,357 |
| | 6,231 |
| Related to natural gas and crude oil sales | | Fair value of derivatives | | 9,969 |
| | 4,357 |
|
| | Related to affiliated partnerships (3) | | Fair value of derivatives | | 113 |
| | (3 | ) | Related to affiliated partnerships (2) | | Fair value of derivatives | | — |
| | 113 |
|
| | Related to natural gas marketing | | Fair value of derivatives | | 93 |
| | 30 |
| Related to natural gas marketing | | Fair value of derivatives | | 168 |
| | 93 |
|
| | Basis protection contracts | | | | | Basis protection contracts | | | | |
| | Related to natural gas and crude oil sales | | Fair value of derivatives | | 13,820 |
| | 21,905 |
| Related to natural gas and crude oil sales | | Fair value of derivatives | | — |
| | 13,820 |
|
| | Related to affiliated partnerships (3) | | Fair value of derivatives | | 2,723 |
| | 8,481 |
| Related to affiliated partnerships (2) | | Fair value of derivatives | | — |
| | 2,723 |
|
| | | 21,106 |
| | 36,644 |
| | 10,137 |
| | 21,106 |
|
| Total derivative liabilities | | $ | 49,080 |
| | $ | 66,642 |
| | $ | 28,576 |
| | $ | 49,080 |
|
__________
| |
| (1) | As of December 31, 2011, and December 31, 2010, none of our derivative instruments were designated as hedges.
|
| |
(2) | Represents derivative positions designated to our affiliated partnerships; accordingly,partnerships. Accordingly, our accompanying balance sheets include a corresponding payable to our affiliated partnerships representing their proportionate share of the derivative assets. |
| |
(3)(2) | Represents derivative positions designated to our affiliated partnerships; accordingly,partnerships. Accordingly, our accompanying balance sheets include a corresponding receivable from our affiliated partnerships representing their proportionate share of the derivative liabilities. |
PETROLEUM DEVELOPMENT CORPORATION
(dba PDC Energy)ENERGY, INC.
NOTES TO CONSOLIDATED FINANCIAL STATEMENTS - Continued
The following table presents the impact of our derivative instruments on our statements of operations.operations:
| |
|
| Year Ended December 31, | | Year Ended December 31, |
|
| 2011 |
| 2010 |
| 2009 | | 2012 | | 2011 | | 2010 |
| Statement of operations line item |
| Reclassification
of Realized
Gains (Losses)
Included in Prior Periods
Unrealized |
| Realized and Unrealized
Gains
(Losses) For
the
Current
Period |
| Total |
| Reclassification
of Realized
Gains (Losses)
Included in Prior Periods
Unrealized |
| Realized and Unrealized
Gains
(Losses) For
the
Current
Period |
| Total |
| Reclassification
of Realized
Gains (Losses)
Included in Prior Periods
Unrealized |
| Realized and Unrealized
Gains
(Losses) For
the
Current
Period |
| Total | | Reclassification
of Realized
Gains (Losses)
Included in Prior Periods
Unrealized | | Realized and Unrealized
Gains
(Losses) For
the
Current
Period | | Total | | Reclassification
of Realized
Gains (Losses)
Included in Prior Periods
Unrealized | | Realized and Unrealized
Gains
(Losses) For
the
Current
Period | | Total | | Reclassification
of Realized
Gains (Losses)
Included in Prior Periods
Unrealized | | Realized and Unrealized
Gains
(Losses) For
the
Current
Period | | Total |
|
| (in thousands) | | (in thousands) |
| Commodity price risk management gain (loss), net |
|
|
|
|
|
|
|
|
|
|
|
|
|
|
|
|
|
| | | | | | | | | | | | | | | | | | |
| Realized gains |
| $ | 10,329 |
|
| $ | 6,914 |
|
| $ | 17,243 |
|
| $ | 20,148 |
|
| $ | 26,947 |
|
| $ | 47,095 |
|
| $ | 84,655 |
|
| $ | 22,690 |
|
| $ | 107,345 |
| | $ | 28,819 |
| | $ | 20,597 |
| | $ | 49,416 |
| | $ | 10,329 |
| | $ | 6,914 |
| | $ | 17,243 |
| | $ | 20,148 |
| | $ | 26,947 |
| | $ | 47,095 |
|
| Unrealized gains (losses) |
| (10,329 | ) |
| 39,176 |
|
| 28,847 |
|
| (20,148 | ) |
| 32,944 |
|
| 12,796 |
|
| (84,655 | ) |
| (32,743 | ) |
| (117,398 | ) | | (28,819 | ) | | 11,742 |
| | (17,077 | ) | | (10,329 | ) | | 39,176 |
| | 28,847 |
| | (20,148 | ) | | 32,944 |
| | 12,796 |
|
| Total commodity price risk management gain (loss), net |
| $ | — |
|
| $ | 46,090 |
|
| $ | 46,090 |
|
| $ | — |
|
| $ | 59,891 |
|
| $ | 59,891 |
|
| $ | — |
|
| $ | (10,053 | ) |
| $ | (10,053 | ) | |
| Total commodity price risk management gain, net | | | $ | — |
| | $ | 32,339 |
| | $ | 32,339 |
| | $ | — |
| | $ | 46,090 |
| | $ | 46,090 |
| | $ | — |
| | $ | 59,891 |
| | $ | 59,891 |
|
| Sales from natural gas marketing |
|
|
|
|
|
|
|
|
|
|
|
|
|
|
|
|
|
| | | | | | | | | | | | | | | | | | |
| Realized gains |
| $ | 1,827 |
|
| $ | 1,143 |
|
| $ | 2,970 |
|
| $ | 2,390 |
|
| $ | 3,991 |
|
| $ | 6,381 |
|
| $ | 4,798 |
|
| $ | 3,744 |
|
| $ | 8,542 |
| | $ | 1,571 |
| | $ | 599 |
| | $ | 2,170 |
| | $ | 1,827 |
| | $ | 1,143 |
| | $ | 2,970 |
| | $ | 2,390 |
| | $ | 3,991 |
| | $ | 6,381 |
|
| Unrealized gains (losses) |
| (1,827 | ) |
| 1,666 |
|
| (161 | ) |
| (2,390 | ) |
| 1,745 |
|
| (645 | ) |
| (4,798 | ) |
| 1,295 |
|
| (3,503 | ) | | (1,571 | ) | | (87 | ) | | (1,658 | ) | | (1,827 | ) | | 1,666 |
| | (161 | ) | | (2,390 | ) | | 1,745 |
| | (645 | ) |
| Total sales from natural gas marketing |
| $ | — |
|
| $ | 2,809 |
|
| $ | 2,809 |
|
| $ | — |
|
| $ | 5,736 |
|
| $ | 5,736 |
|
| $ | — |
|
| $ | 5,039 |
|
| $ | 5,039 |
| | $ | — |
| | $ | 512 |
| | $ | 512 |
| | $ | — |
| | $ | 2,809 |
| | $ | 2,809 |
| | $ | — |
| | $ | 5,736 |
| | $ | 5,736 |
|
| Cost of natural gas marketing |
|
|
|
|
|
|
|
|
|
|
|
|
|
|
|
|
|
| | | | | | | | | | | | | | | | | | |
| Realized losses |
| $ | (1,441 | ) |
| $ | (1,130 | ) |
| $ | (2,571 | ) |
| $ | (1,905 | ) |
| $ | (3,996 | ) |
| $ | (5,901 | ) |
| $ | (4,719 | ) |
| $ | (4,127 | ) |
| $ | (8,846 | ) | | $ | (1,387 | ) | | $ | (642 | ) | | $ | (2,029 | ) | | $ | (1,441 | ) | | $ | (1,130 | ) | | $ | (2,571 | ) | | $ | (1,905 | ) | | $ | (3,996 | ) | | $ | (5,901 | ) |
| Unrealized gains (losses) |
| 1,441 |
|
| (1,526 | ) |
| (85 | ) |
| 1,905 |
|
| (1,431 | ) |
| 474 |
|
| 4,719 |
|
| (441 | ) |
| 4,278 |
| | 1,387 |
| | 214 |
| | 1,601 |
| | 1,441 |
| | (1,526 | ) | | (85 | ) | | 1,905 |
| | (1,431 | ) | | 474 |
|
| Total cost of natural gas marketing |
| $ | — |
|
| $ | (2,656 | ) |
| $ | (2,656 | ) |
| $ | — |
|
| $ | (5,427 | ) |
| $ | (5,427 | ) |
| $ | — |
|
| $ | (4,568 | ) |
| $ | (4,568 | ) | | $ | — |
| | $ | (428 | ) | | $ | (428 | ) | | $ | — |
| | $ | (2,656 | ) | | $ | (2,656 | ) | | $ | — |
| | $ | (5,427 | ) | | $ | (5,427 | ) |
|
|
|
|
|
|
|
|
|
|
|
|
|
|
|
|
|
|
| | | | | | | | | | | | | | | | | | |
NOTE 5 - CONCENTRATION OF RISK
Accounts Receivable. The following table presents the components of accounts receivable, net.net of allowance for doubtful accounts:
| | | | As of December 31, | As of December 31, |
| | 2011 | | 2010 | 2012 | | 2011 |
| | (in thousands) | (in thousands) |
| | | | | | | |
| Natural gas, NGL and crude oil sales | $ | 42,388 |
| | $ | 27,730 |
| |
| Natural gas, NGLs and crude oil sales | | $ | 39,837 |
| | $ | 42,388 |
|
| Natural gas marketing | | 8,209 |
| | 6,225 |
|
| Reimbursements for title defects | | 7,579 |
| | — |
|
| Joint interest billings | 7,465 |
| | 12,142 |
| 6,896 |
| | 7,465 |
|
| Natural gas marketing | 6,225 |
| | 8,279 |
| |
| Other | 4,766 |
| | 6,513 |
| 3,385 |
| | 4,766 |
|
| Allowance for doubtful accounts | (921 | ) | | (686 | ) | (1,026 | ) | | (921 | ) |
| Accounts receivable, net | $ | 59,923 |
| | $ | 53,978 |
| $ | 64,880 |
| | $ | 59,923 |
|
| | | | | | | |
Our accounts receivable are primarily from purchasersrelates to sales of our natural gas, NGLNGLs and crude oil production, derivative counterparties and other third parties whichthat own working interests in the properties that we operate. Inherent to our industry is the concentration of natural gas, NGLNGLs and crude oil sales to a fewlimited number of customers. This industry concentration has the potential to impact our overall exposure to credit risk either positively or negatively, in that our customers may be similarly affected by changes in economic and financial conditions, commodity prices or other conditions. We record an allowance for doubtful accounts for receivables that werepresenting our best estimate to be uncollectible.of probable losses from our existing accounts receivable. In making our
estimate, we consider, among other things, our historical write-offs and overall creditworthiness of our customers. Further, consideration is given to well production data for receivables related to well operations. It is reasonably possible that ourOur estimate of uncollectible amounts will changechanges periodically. For the each of the years in the three-year period ended December 31, 2011,2012, amounts written off to allowance for doubtful accounts were not material. As of December 31, 20112012, we had one customertwo customers representing 10% or greater of our accounts receivable balance,balance: Suncor Energy Marketing Inc.and Merit Energy, representing 26.4% and 11.7%, which represented 16%respectively, of our accounts receivable balance. The
$7.6 million of accounts receivable at December 31, 2012 due from Merit Energy related to reimbursements for title defects discovered subsequent to our acquisition of certain Wattenberg assets from affiliates of Merit Energy (the "Merit Acquisition"). The reimbursement for certain title defects was received in January 2013.
PETROLEUM DEVELOPMENT CORPORATION
(dba PDC Energy)ENERGY, INC.
NOTES TO CONSOLIDATED FINANCIAL STATEMENTS - Continued
Major Customers. The following table presents the individual customers constituting 10% or more of total revenues.revenues:
| | | | | Year Ended December 31, | | Year Ended December 31, |
| Customer | | 2011 | | 2010 | | 2009 | | 2012 | | 2011 | | 2010 |
| | | | | | | | | | | | | |
| Suncor Energy Marketing, Inc. | | 25.7 | % | | 19.6 | % | | 18.6 | % | | 29.8 | % | | 25.7 | % | | 19.6 | % |
| Williams Production RMT Company | | 9.9 | % | | 12.5 | % | | 16.1 | % | |
| DCP Midstream, LP | | 11.5 | % | | 9.6 | % | | 11.9 | % | | 12.2 | % | | 11.5 | % | | 9.6 | % |
| WPX Energy Rocky Mountain, LLC | | | 5.6 | % | | 9.9 | % | | 12.5 | % |
Derivative Counterparties. A significant portion of our liquidity is concentrated in derivative instruments that enable us to manage a portion of our exposure to price volatility from producing natural gas and crude oil. These arrangements expose us to credit risk of nonperformance by our counterparties. We primarily use financial institutions who are also major lenders inunder our revolving credit facility agreement, as counterparties to our derivative contracts. To date, we have had no counterparty default losses. We have evaluated the credit risk of our derivative assets from our counterparties using relevant credit market default rates, giving consideration to amounts outstanding for each counterparty and the duration of each outstanding derivative position. Based on our evaluation, we have determined that the potential impact of the nonperformance of our counterparties on the fair value of our derivative instruments iswas not significant.
The following table presents the counterparties that expose us to credit risk as of December 31, 20112012, with regard to our derivative assets.assets:
| |
| | Fair Value of
Derivative Assets | | Fair Value of
Derivative Assets |
| Counterparty Name | | As of December 31, 2011 | | As of December 31, 2012 |
| | | (in thousands) | | (in thousands) |
| | | | | |
| JPMorgan Chase Bank, N.A. (1) | | $ | 48,855 |
| | $ | 41,323 |
|
| Crèdit Agricole CIB (1) | | 21,597 |
| |
| Wells Fargo Bank, N.A. (1) | | 20,519 |
| | 4,782 |
|
| Bank of Nova Scotia (1) | | | 4,315 |
|
| Other lenders in our revolving credit facility | | | 8,146 |
|
| Various (2) | | 11,013 |
| | 359 |
|
| Total | | $ | 101,984 |
| | $ | 58,925 |
|
| | | | | |
____________________________________
(1)Major lender in our revolving credit facility, seefacility. See Note 8.8, Long-Term Debt.
(2)Represents a total of 14 counterparties, including three lenders in our credit facility.28 counterparties.
NOTE 6 - PROPERTIES AND EQUIPMENT
The following table presents the components of properties and equipment, net of accumulated depreciation, depletion and amortization:
| | | | As of December 31, | As of December 31, |
| | 2011 | | 2010 | 2012 | | 2011 |
| | (in thousands) | (in thousands) |
| Properties and equipment, net: | | | | | | |
| Natural gas and crude oil properties | | | | | | |
| Proved | $ | 1,694,694 |
| | $ | 1,362,491 |
| $ | 2,075,924 |
| | $ | 1,694,694 |
|
| Unproved | 102,466 |
| | 33,740 |
| 319,327 |
| | 102,466 |
|
| Total natural gas and crude oil properties | 1,797,160 |
| | 1,396,231 |
| 2,395,251 |
| | 1,797,160 |
|
| Pipelines and related facilities | 40,721 |
| | 34,262 |
| 47,786 |
| | 40,721 |
|
| Transportation and other equipment | 32,475 |
| | 32,382 |
| 34,858 |
| | 32,475 |
|
| Land and buildings | 14,572 |
| | 13,379 |
| 14,935 |
| | 14,572 |
|
| Construction in progress | 69,633 |
| | 42,128 |
| 67,217 |
| | 69,633 |
|
| | 1,954,561 |
| | 1,518,382 |
| |
| Accumulated DD&A | (652,845 | ) | | (509,712 | ) | |
| Gross properties and equipment | | 2,560,047 |
| | 1,954,561 |
|
| Accumulated depreciation, depletion and amortization | | (943,341 | ) | | (652,845 | ) |
| Properties and equipment, net | $ | 1,301,716 |
| | $ | 1,008,670 |
| $ | 1,616,706 |
| | $ | 1,301,716 |
|
| | | | | | | |
PETROLEUM DEVELOPMENT CORPORATION
(dba PDC Energy)ENERGY, INC.
NOTES TO CONSOLIDATED FINANCIAL STATEMENTS - Continued
The following table presents impairment charges recorded for natural gas and crude oil properties:
|
| | | | | | | | | | | |
| | Year Ended December 31, |
| | 2012 | | 2011 | | 2010 |
| | (in thousands) |
| Continuing operations: | | | | | |
| Impairment of proved properties | $ | 161,185 |
| | $ | 22,460 |
| | $ | — |
|
| Impairment of individually significant unproved properties | 1,943 |
| | 1,108 |
| | 1,477 |
|
| Amortization of individually insignificant unproved properties | 5,021 |
| | 1,591 |
| | 5,004 |
|
| Total continuing operations | 168,149 |
| | 25,159 |
| | 6,481 |
|
| Discontinued operations: | | | | | |
| Impairment of proved properties | — |
| | — |
| | 4,666 |
|
| Total discontinued operations | — |
| | — |
| | 4,666 |
|
| Total impairment of natural gas and crude oil properties | $ | 168,149 |
| | $ | 25,159 |
| | $ | 11,147 |
|
| | | | | | |
In December 2012, we recognized an impairment charge of $161.2 million associated with our Piceance Basin proved oil and natural gas properties. The assets were determined to be impaired as the estimated undiscounted future net cash flows were less than the carrying value of the assets. The fair value for determining the amount of the impairment charge was based on estimated future cash flows from an unrelated third-party bid, a Level 3 input, as we changed our development plans in the basin and decided to sell the related assets. The impairment charge was included in the statement of operations line item impairment of natural gas and crude oil properties. See Note 19, Subsequent Events, for additional information regarding the planned sale of certain of our oil and natural gas properties.
In 2011, we recognized an impairment charge of $22.5 million to write-down our NECO assets to fair value. The fair value was based on unrelated third-party bids, a level 3 input. The impairment charge was included in the statement of operations' line item impairment of natural gas and crude oil properties.
In May 2010, pursuant to our entry into an agreement to sell our Michigan assets, we reclassified our Michigan assets as held for sale. We compared the transactional sales price, considered a Level 3 input, less costs to sell to the carrying value of our Michigan net assets. The net carrying value exceeded the net sales price and, therefore, during the second quarter of 2010, we recognized a pre-tax impairment charge of $4.7 million to reduce the carrying value of the net assets to reflect the net sales price. The impairment charge was included in discontinued operations on the statement of operations. See Note 14, Assets Held for Sale, Divestitures, and Discontinued Operations.
Suspended Well Costs
The following table presents the capitalized exploratory well costs pending determination of proved reserves, and included in properties and equipment on the balance sheets.sheets:
|
| | | | | | | | | | | |
| 2011 |
| 2010 |
| 2009 |
| (in thousands, except for number of wells) |
|
|
|
|
|
|
| Balance beginning of year, January 1 | $ | 2,297 |
|
| $ | 1,174 |
|
| $ | 1,180 |
|
| Deconsolidation of PDCM and change in ownership interest | — |
|
| (462 | ) |
| — |
|
| Additions to capitalized exploratory well costs |
|
|
|
|
|
| pending the determination of proved reserves | 3,692 |
|
| 4,353 |
|
| 10,226 |
|
| Reclassifications to wells, facilities and equipment |
|
|
|
|
|
| based on the determination of proved reserves | (1,557 | ) |
| (2,231 | ) |
| (9,914 | ) |
| Capitalized exploratory well costs charged to expense | — |
|
| (537 | ) |
| (318 | ) |
| Balance end of year, December 31 | $ | 4,432 |
| | $ | 2,297 |
| | $ | 1,174 |
|
|
|
|
|
|
|
| Number of wells pending determination at December 31 | 6 |
|
| 3 |
|
| 2 |
|
|
|
|
|
|
|
|
| | | | | | | | | | | |
| 2012 | | 2011 | | 2010 |
| (in thousands, except for number of wells) |
| | | | | |
| Balance beginning of year, January 1, | $ | 4,432 |
| | $ | 2,297 |
| | $ | 1,174 |
|
| Additions to capitalized exploratory well costs pending the determination of proved reserves | 30,482 |
| | 3,692 |
| | 4,353 |
|
| Reclassifications to wells, facilities and equipment based on the determination of proved reserves | — |
| | (1,557 | ) | | (2,231 | ) |
| Deconsolidation of PDCM and change in ownership interest | — |
| | — |
| | (462 | ) |
| Capitalized exploratory well costs charged to expense | (15,347 | ) | | — |
| | (537 | ) |
| Balance end of year, December 31, | $ | 19,567 |
| | $ | 4,432 |
| | $ | 2,297 |
|
| | | | | |
| Number of wells pending determination at December 31, | 2 |
| | 6 |
| | 3 |
|
| | | | | | |
As of December 31, 2011, there were two wellsAdditions to capitalized exploratory well costs pending determination of proved reserves increased in 2012 as compared to prior years as we increased our exploratory drilling activities in the liquid-rich emerging Utica Shale play.
In 2012, capitalized well costs related to two vertical stratigraphic test wells in eastern Ohio were expensed at a cost of $12.2 million. Additionally, three wells in south central Ohio and a well in southeast Colorado were determined to have noncommercial quantities of hydrocarbons and were expensed at a cost of $1.2 million and $0.9 million, respectively.
PDC ENERGY, INC.
NOTES TO CONSOLIDATED FINANCIAL STATEMENTS - Continued
The following table presents an aging of capitalized exploratory well costs based on the date that haddrilling commenced and the number of projects for which exploratory well costs have been capitalized for a period greater than one year after the completion of drilling. One well, located in the Wattenberg Field, has been utilized as a monitoring well in the early stages of our horizontal Niobrara program and will be tested in several zones during 2012, since the monitoring process has been completed. The second well, located in the Appalachian Basin, is expected to be tested in 2012 when feasible. Total capitalized costs related to these wells were $0.5 million and $0.6 million ascommencement of December 31, 2011, respectively. There were no exploratory well costs that were capitalized for a period greater than one year after the completion of drilling as of December 31, 2010 and 2009.drilling:
|
| | | | | | | | | | | |
| | As of December 31, |
| | 2012 | | 2011 | | 2010 |
| | (in thousands) |
| | | | | | |
| Exploratory well costs capitalized for a period of one year or less | $ | 19,567 |
| | $ | 3,587 |
| | $ | 2,297 |
|
| Exploratory well costs capitalized for a period greater than one year since commencement of drilling | — |
| | 845 |
| | — |
|
| Balance end of year, December 31, | $ | 19,567 |
| | $ | 4,432 |
| | $ | 2,297 |
|
| Number of projects with exploratory well costs that have been capitalized for a period greater than one year since commencement of drilling | — |
| | 2 |
| | — |
|
NOTE 7 - INCOME TAXES
The table below presents the components of tax expense (benefit)our provision for income taxes from continuing operations for the years presented.presented:
| | | | Year Ended December 31, | Year Ended December 31, |
| | 2011 | | 2010 | | 2009 | 2012 | | 2011 | | 2010 |
| | (in thousands) | (in thousands) |
| Current: | | | | | | | | | | |
| Federal | $ | (3,172 | ) | | $ | (1,616 | ) | | $ | (29,071 | ) | $ | — |
| | $ | 3,172 |
| | $ | 1,616 |
|
| State | (172 | ) | | 904 |
| | 312 |
| (199 | ) | | 172 |
| | (904 | ) |
| Total current income taxes | (3,344 | ) | | (712 | ) | | (28,759 | ) | (199 | ) | | 3,344 |
| | 712 |
|
| Deferred: | | | | | | | | | | |
| Federal | 2,868 |
| | 3,990 |
| | (11,546 | ) | 78,425 |
| | (2,868 | ) | | (3,990 | ) |
| State | 293 |
| | (2,626 | ) | | (4,749 | ) | 10,609 |
| | (293 | ) | | 2,626 |
|
| Total deferred income taxes | 3,161 |
| | 1,364 |
| | (16,295 | ) | 89,034 |
| | (3,161 | ) | | (1,364 | ) |
| Income tax provision (benefit) from continuing operations | $ | (183 | ) | | $ | 652 |
| | $ | (45,054 | ) | |
| Provision for income taxes from continuing operations | | $ | 88,835 |
| | $ | 183 |
| | $ | (652 | ) |
| | | | | | | | | | | |
For 2011, we planWe continue to utilize statutory 100% bonus depreciation and not to expense any intangible drilling costs ("IDC"). For 2010 and 2009, we elected to expense approximately $8.5 million and $80 million, respectively, of IDC. We also continued to utilize other tax deferral strategies such as statutory bonus and accelerated depreciation, special partnership formation statutes and regulations and Internal Revenue Code ("IRC")IRC Section 1031 like-kind exchange ("LKE") strategies and intangible drilling cost expense elections to reduceminimize our current tax expense, resulting in a correspondingly higher deferred tax expense.taxes. As a result of these elections and deferral strategies, we have generated federal and state tax net operating losses (“NOLs”) in 2012, 2011 and 2010. Substantially, all the 2010 and 2009. The 2010federal NOL was carried back to 2008, generating a refund of $4.6$4.6 million which was received in the fourth quarter of 2011. This benefit is reflected inThe remaining federal NOLs and substantially all the 2010 current federal provision. Our 2011 federal NOL isstate NOLs are being carried forward to 20122013 and/or future periods. We expect to utilize our federal NOL and is expected to provide a $11.7 million tax benefit as an offset to 2012 taxable income. This benefit is reflected in the 2011 deferred federal provision. The Worker, Homeownership, and Business Assistance Act of 2009 increased the statutory carry-back from two years to five years for losses incurred in 2008 and 2009. We carried back our 2009 tax loss to the 2005 and 2006 tax years, generating a refund of $25.9 million, which was received in the second quarter of 2010. The benefit is reflected in the 2009 current federal provision. Our state NOLs from the years ended 2011, 2010 and 2009 were statutorily not permitted to be “carried back” in the majoritysubstantial portion of our state taxing jurisdictions. These state NOLs provide a deferred tax benefit and are noted belowto offset the projected 2013 taxable gain on the planned sale of our non-core Colorado assets. See Note 19, Subsequent Events, for additional information regarding the planned sale. There can be no assurance we will be successful in the table of deferred tax assets and liabilities.
closing such divestiture.
PETROLEUM DEVELOPMENT CORPORATION
(dba PDC Energy)ENERGY, INC.
NOTES TO CONSOLIDATED FINANCIAL STATEMENTS - Continued
The following table presents a reconciliation of the statutory rate to the effective tax rate related to our provision for income taxes from continuing operations.operations:
| | | | Year Ended December, 31, | Year Ended December, 31, |
| | 2011 | | 2010 | | 2009 | 2012 | | 2011 | | 2010 |
| | | | | | | | | | | |
| Statutory tax rate | 35.0 | % | | 35.0 | % | | 35.0 | % | 35.0 | % | | 35.0 | % | | 35.0 | % |
| State income tax, net | (9.4 | ) | | 1.3 |
| | 3.3 |
| 2.9 |
| | (9.4 | ) | | 1.3 |
|
| Percentage depletion | (29.5 | ) | | (11.3 | ) | | 0.5 |
| 0.3 |
| | (29.5 | ) | | (11.3 | ) |
| Non-deductible compensation | — |
| | 4.4 |
| | 0.1 |
| (0.1 | ) | | — |
| | 4.4 |
|
| Non-deductible meals and entertainment | 3.1 |
| | — |
| | — |
| (0.1 | ) | | 3.1 |
| | 1.2 |
|
| State deferred rate change | 15.4 |
| | (26.2 | ) | | (0.9 | ) | — |
| | 15.4 |
| | (26.2 | ) |
| Unrecognized tax benefits | (30.3 | ) | | 2.4 |
| | 0.7 |
| — |
| | (30.3 | ) | | 2.4 |
|
| State tax credits | — |
| | (3.3 | ) | | 0.3 |
| — |
| | — |
| | (3.3 | ) |
| 2007-2009 federal return examination adjustments | 4.2 |
| | 4.7 |
| | — |
| |
| 2010 return to provision adjustments | 3.7 |
| | — |
| | — |
| |
| Non-deductible expenditures - PDCM | — |
| | — |
| | (1.8 | ) | |
| Federal return examination adjustments | | — |
| | 4.2 |
| | 4.7 |
|
| Return to provision adjustments | | — |
| | 3.7 |
| | — |
|
| Other | 1.5 |
| | 2.7 |
| | (1.2 | ) | — |
| | 1.5 |
| | 1.5 |
|
| Effective tax rate | (6.3 | )% | | 9.7 | % | | 36.0 | % | 38.0 | % | | (6.3 | )% | | 9.7 | % |
| | | | | | | | | | | |
The tax effects of temporary differences that give rise to significant portions of the deferred tax assets and deferred tax liabilities at December 31, 2012 and 2011 and 2010, are presented below.below:
| | | | As of December 31, | As of December 31, |
| | 2011 | | 2010 | 2012 | | 2011 |
| | (in thousands) | (in thousands) |
| Deferred tax assets: | | | | | | |
| Provision for underpayment of natural gas sales | $ | 3,334 |
| | $ | 2,711 |
| $ | — |
| | $ | 3,334 |
|
| Deferred compensation | 4,319 |
| | 3,986 |
| 7,216 |
| | 4,319 |
|
| Asset retirement obligations | 9,438 |
| | 6,716 |
| 10,325 |
| | 9,438 |
|
| State NOL and tax credit carryforwards, net | 5,240 |
| | 4,624 |
| 6,117 |
| | 5,240 |
|
| Percentage depletion - carryforward | 3,733 |
| | 2,422 |
| 4,702 |
| | 3,733 |
|
| Alternative minimum tax - credit carryforward | 2,351 |
| | 2,069 |
| 2,351 |
| | 2,351 |
|
| Federal NOL carryforward | 12,210 |
| | — |
| 21,281 |
| | 12,210 |
|
| Other | 2,621 |
| | 2,247 |
| 2,276 |
| | 2,621 |
|
| Total gross deferred tax assets | 43,246 |
| | 24,775 |
| |
| Deferred tax assets | 43,246 |
| | 24,775 |
| 54,268 |
| | 43,246 |
|
| | | | | | | |
| Deferred tax liabilities: | | | | | | |
| Properties and equipment | (184,657 | ) | | (164,586 | ) | 122,742 |
| | 184,657 |
|
| Investment in PDCM | (30,919 | ) | | (31,149 | ) | 31,445 |
| | 30,919 |
|
| Unrealized gains - derivatives | (12,612 | ) | | (3,082 | ) | 7,163 |
| | 12,612 |
|
| Convertible debt | (6,504 | ) | | (7,873 | ) | 5,194 |
| | 6,504 |
|
| Total gross deferred tax liabilities | (234,692 | ) | | (206,690 | ) | 166,544 |
| | 234,692 |
|
| Net deferred tax liability | $ | (191,446 | ) | | $ | (181,915 | ) | $ | 112,276 |
| | $ | 191,446 |
|
| | | | | | | |
| Classification in the balance sheets: | | | | | | |
| Prepaid expenses and other current assets | $ | 16,127 |
| | $ | 6,084 |
| |
| Deferred income taxes | (207,573 | ) | | (187,999 | ) | |
| Deferred income tax assets | | $ | 36,151 |
| | $ | 16,127 |
|
| Deferred income tax liability | | 148,427 |
| | 207,573 |
|
| Net deferred tax liability | $ | (191,446 | ) | | $ | (181,915 | ) | $ | 112,276 |
| | $ | 191,446 |
|
| | | | | | | |
Deferred tax liabilities for properties and equipment increaseddecreased in 2011,2012 primarily as a result of our impairment of certain oil and gas properties, which is an expense not currently deductible from taxable income, partially offset by our continued utilizationuse of statutory provisions for bonus and accelerated tax depreciation. In addition, a tax gain, previously deferred through the use of IRC Section 1031 LKE strategies, was recognized upon the sale of our Permian Basin assets.
As of December 31, 2011,2012, we have state NOL carryforwards of $124.1$142.4 million that begin to expire in 2029, state credit carryforwards of $1.3$1.8 million that begin to expire in 20202022 and federal NOL carryforwards of $34.9$60.8 million that will expire in 2030.2030. Approximately $0.9 million
PETROLEUM DEVELOPMENT CORPORATION
(dba PDC Energy)ENERGY, INC.
NOTES TO CONSOLIDATED FINANCIAL STATEMENTS - Continued
of excess tax benefits relating to stock-based compensation that are a component of our NOL carryforwards, when realized, will be credited to APIC.
The following table presents a reconciliation of the total amounts of unrecognized tax benefits.benefits:
| |
|
| 2011 |
| 2010 |
| 2009 | | 2012 | | 2011 | | 2010 |
|
| (in thousands) | | (in thousands) |
|
|
|
|
|
|
| | | | | | |
| Balance beginning of year, January 1 |
| $ | 1,093 |
|
| $ | 566 |
|
| $ | 1,271 |
| | $ | 179 |
| | $ | 1,093 |
| | $ | 566 |
|
| Additions for tax positions of prior years |
| — |
|
| 253 |
|
| 43 |
| | — |
| | — |
| | 253 |
|
| Additions for tax positions of current year |
| — |
|
| 274 |
|
| 7 |
| | — |
| | — |
| | 274 |
|
| Reductions due to settlements |
| (782 | ) |
| — |
|
| (406 | ) | | — |
| | (782 | ) | | — |
|
| Reductions due to lapse of statute of limitations |
| (132 | ) |
| — |
|
| (349 | ) | | — |
| | (132 | ) | | — |
|
| Balance end of year, December 31 |
| $ | 179 |
| | $ | 1,093 |
| | $ | 566 |
| | $ | 179 |
| | $ | 179 |
| | $ | 1,093 |
|
|
|
|
|
|
|
| | | | | | |
Interest and penalties related to uncertain tax positions are recognized in income tax expense. Accrued interest and penalties related to uncertain tax positions were immaterial for each of the years in the three-year period ended December 31, 2011.2012. The total amount of unrecognized tax benefits that would affect the effective tax rate, if recognized, was $0.2$0.2 million as of December 31, 2012 and December 31, 2011 and $1 million as, respectively. As of December 31, 2010. As of December 31, 2011,2012, we do not expect a decrease in the unrecognized tax benefit in the next twelve months.months due to statute of limitation expiration. During 2012, we did not reduce our liability for any uncertain tax benefits, of which the remaining balance is related to our state tax filings, as no prior tax positions were resolved, nor did we have any new uncertain tax benefits arise during the year. The statute of limitation for most of our state tax jurisdictions is open from 2008 forward.
In June 2011, the Internal Revenue Service ("IRS") completed its examination of our 2007, 2008 and 2009 tax years. In addition, in accordance with the Compliance Assurance Process ("CAP"), the IRS completed its “post filing review” of our 2010 tax return in January 2012 and completed their “post filing review” of our 2011 tax return in January 2013. We have been issued a “no change” letter.letter for both of the reviewed tax years. The CAP audit employs a real-time review of our books and tax records by the IRS that is intended to permit issue resolution prior to, or shortly after, the filing of the tax returns. DuringWe are currently participating in the twelve months endedIRS CAP program for the review of our 2012 tax year and we have been invited and have accepted continued participation in the program for our 2013 tax year. Participation in the IRS CAP program has enabled us to currently have no uncertain tax benefits associated with our federal tax return filings. During 2011, we reducedwere able to reduce our liability by $0.8 million for uncertain tax benefits that were resolved. The statute of limitation for mostupon accelerated examination and settlement of our state2007-2009 tax jurisdictions is open from 2007 forward.years upon entering the IRS program.
PDC ENERGY, INC.
NOTES TO CONSOLIDATED FINANCIAL STATEMENTS - Continued
NOTE 8 - LONG-TERM DEBT
Long-term debt consists of the following:
| |
| As of December 31, | As of December 31, |
| 2011 |
| 2010 | 2012 | | 2011 |
| (in thousands) | (in thousands) |
| Senior notes |
|
|
| | | |
| 3.25% Convertible senior notes due 2016: |
|
|
| | | |
| Principal amount | $ | 115,000 |
|
| $ | 115,000 |
| $ | 115,000 |
| | $ | 115,000 |
|
| Unamortized discount | (17,079 | ) |
| (20,252 | ) | (13,671 | ) | | (17,079 | ) |
| 3.25% Convertible senior notes due 2016, net of discount | 97,921 |
|
| 94,748 |
| 101,329 |
| | 97,921 |
|
| 7.75% Senior notes due 2022: | | | | |
| Principal amount | | 500,000 |
| | — |
|
| 12% Senior notes due 2018: |
|
|
|
|
| | | |
| Principal amount | 203,000 |
|
| 203,000 |
| — |
| | 203,000 |
|
| Unamortized discount | (1,764 | ) |
| (2,053 | ) | — |
| | (1,764 | ) |
| 12% Senior notes due 2018, net of discount | 201,236 |
|
| 200,947 |
| — |
| | 201,236 |
|
| Total senior notes | 299,157 |
|
| 295,695 |
| 601,329 |
| | 299,157 |
|
| Credit facilities |
|
|
|
|
| | | |
| Corporate | 209,000 |
|
| — |
| 49,000 |
| | 209,000 |
|
| PDCM | 24,000 |
|
| — |
| 26,250 |
| | 24,000 |
|
| Total credit facilities | 233,000 |
|
| — |
| 75,250 |
| | 233,000 |
|
| Total long-term debt | $ | 532,157 |
|
| $ | 295,695 |
| $ | 676,579 |
| | $ | 532,157 |
|
|
|
|
| | | |
Senior Notes
3.25% Convertible Senior Notes Due 2016. In November 2010, we issued $115$115 million of 3.25% convertible senior notes due 2016 (the "2016 Convertible Senior Notes") in a private placement to qualified institutional buyers. The convertible notes and the common stock issuable upon conversion of the convertible notes, if any, have not been registered under the Securities Act of 1933 ("Securities Act") or any state securities laws, nor are we required to register such convertible notes or common shares. The convertible notes are governed by an indenture dated November 23, 2010, between the Company and the Bank of New York Mellon, as trustee. The maturity for the payment of principal is May 15, 2016.2016. Interest at the rate of 3.25% per year is payable in cash semiannually in arrears on each May 15 and November 15, commencing on May 15, and November 15, commencing on May 15, 2011.2011. The
PETROLEUM DEVELOPMENT CORPORATION
(dba PDC Energy)
NOTES TO CONSOLIDATED FINANCIAL STATEMENTS - Continued
convertible notes are senior, unsecured obligations and rank senior in right of payment to our existing and future indebtedness that is expressly subordinated in right of payment to the convertible notes; equal in right of payment to our existing and future unsecured indebtedness that is not so subordinated (including our 12% senior notes due 2018)2022 Senior Notes); effectively junior in right of payment to any of our secured indebtedness (including our obligations under our senior secured credit facility) to the extent of the value of the assets securing such indebtedness; and structurally junior to all existing and future indebtedness (including trade payables) incurred by our subsidiaries. The indenture governing the convertible notes does not contain any restrictive financial covenants.
We may not redeem the convertible notes prior to the maturity date of the convertible notes. However, prior to November 15, 2015, holders of the convertible notes may convert upon specified events and periods as defined in the governing indenture. The notes are convertible at any time thereafter at an initial conversion rate of 23.5849 per $1,000$1,000 principal amount of the convertible notes, which is equal to a conversion price of approximately $42.40$42.40 per share. The conversion rate is subject to adjustment upon certain events. Upon conversion, the convertible notes may be settled, at our election, in shares of our common stock, cash or a combination of cash and shares of our common stock. We have initially elected a net-settlement method to satisfy our conversion obligation, which allows us to settle the $1,000$1,000 principal amount of the convertible notes in cash and to settle the excess conversion value in shares, as well as cash in lieu of fractional shares.
We allocated the gross proceeds of the convertible notes between the liability and equity components of the debt. The initial $94.3$94.3 million liability component was determined based on the fair value of similar debt instruments with similar terms, excluding the conversion feature, and priced on the same day we issued our convertible notes. The initial $20.7$20.7 million equity component represents the debt discount and was calculated as the difference between the liability component of the debt and the gross proceeds of the convertible notes. As of December 31, 2011,2012, the unamortized debt discount will be amortized over the remaining contractual term to maturity of the convertible notes of 4.43.4 years using an effective interest rate of 7.4%. For 2011,2012, interest expense related to the indebtedness and the amortization of the discount were $3.7$3.7 million and $3.2$3.4 million, respectively, compared to $0.4$3.7 million and $0.5$3.2 million, respectively, in 2010.2011. As of December 31, 20112012 and 2010,2011, notwithstanding the inability to convert, assuming conversion, the value of the convertible notes did not exceed the principal amount.
PDC ENERGY, INC.
NOTES TO CONSOLIDATED FINANCIAL STATEMENTS - Continued
12%7.75% Senior Notes Due 2018.2022. In 2008,On October 3, 2012, we issued $203$500 million aggregate principal amount of 12%7.75% senior notes due 2018October 15, 2022 (the “2022 Senior Notes”) in a private placement. The proceeds from the issuance of the notes, have not been registeredafter the initial purchasers' commissions and estimated offering expenses, were used to fund the redemption of our 2018 Senior Notes, repay a portion of the amount outstanding under our revolving credit facility and for general corporate purposes. The 2022 Senior Notes accrue interest from the Securities Act or any state securities laws, nor are we required to register such notes. The notes are governed by an indenture dated February 8, 2008, between the Companydate of issuance and the Bank of New York, as trustee, as supplemented by the first supplement indenture dated said date. The maturity for the payment of principal is February 15, 2018. Interest at the rate of 12% per yearinterest is payable in cash semiannuallysemi-annually in arrears on each FebruaryApril 15 and August 15. The senior notes were issued at a discount, 98.572%October 15, commencing on April 15, 2013. Approximately $11 million in costs associated with the issuance of the principal amount.2022 Senior Notes have been capitalized as debt issuance costs and are being amortized as interest expense over the life of the notes using the effective interest method. The notes2022 Senior Notes are senior unsecured obligations and rank senior in right of payment to any of our future indebtedness that is expressly subordinated to the notes. The 2022 Senior Notes rank equally in right of payment with all of our existing and future senior unsecured indebtedness (including our 2016 Convertible Senior Notes) and seniorrank effectively junior in right of payment to anyall of our existing and future subordinated indebtedness. The notes are effectively subordinated to any of our existing or future secured indebtedness to(to the extent of the assetsvalue of the collateral securing such indebtedness.indebtedness), including borrowings under our revolving credit facility.
The indenture governing the notes contains customary representations and warranties as well as typical restrictive covenants,In connection with the most restrictive being two incurrence covenants: 1) earnings before interest, taxes, DD&A expense and capital expenditures ("EBITDAX")issuance of at least two times interest expense and 2) total debtthe 2022 Senior Notes, we entered into a registration rights agreement with the initial purchasers in which we agreed to file a registration statement with the SEC relating to an offer to exchange the 2022 Senior Notes for registered notes with substantially identical terms. In addition, we have agreed, in certain circumstances, to file a shelf registration statement covering the resale of less than 4.0 times EBITDAX. We were in compliance with all covenants as of December 31, 2011, and expect to remain in compliance throughout the next year.2022 Senior Notes by holders.
The indenture provides thatAt any time prior to October 15, 2017, we may at our option, redeem all or part of the notes2022 Senior Notes at any time prior to February 15, 2013, at thea make-whole price set forth in the indenture, and on or after FebruaryOctober 15, 2013,2017, we may redeem the notes at fixed redemption prices, plus accrued and unpaid interest, if any, to the date of redemption. Further, the indenture provides that upon a change of control,
At any time prior to October 15, 2015, we must give holdersmay redeem up to 35% of the notes the opportunity to put their notes to us for repurchaseoutstanding 2022 Senior Notes with proceeds from certain equity offerings at a repurchaseredemption price of 101%107.75% of the principal amount of the notes redeemed, plus accrued and unpaid interest.interest, as long as:
at least 65% of the aggregate principal amount of the notes issued on October 3, 2012 remains outstanding after each such redemption; and
the redemption occurs within 180 days after the closing of the equity offering.
Upon the occurrence of a "change of control" as defined in the indenture for the 2022 Senior Notes, holders will have the right to require us to repurchase all or a portion of the notes at a price equal to 101% of the aggregate principal amount of the notes repurchased, together with any accrued and unpaid interest to the date of purchase. In connection with certain asset sales, we will be required to use the net cash proceeds of the asset sale to make an offer to purchase the notes at 100% of the principal amount, together with any accrued and unpaid interest to the date of purchase.
The indenture governing the 2022 Senior Notes contains covenants that, among other things, limit our ability and the ability of our subsidiaries to incur additional indebtedness; pay dividends or make distributions on our stock; purchase or redeem stock or subordinated indebtedness; make certain investments; create certain liens; restrict dividends or other payments by restricted subsidiaries; enter into transactions with affiliates; sell assets; and merge or consolidate with another company.
12% Senior Notes Due 2018. On October 3, 2012, we issued a notice to redeem on November 2, 2012 the entire $203 million principal amount of the 12% senior notes due 2018 (the "2018 Senior Notes") for a total redemption price of approximately $222 million, including an $18.9 million make-whole premium. The make-whole provision was based upon terms set forth in the related indenture. On November 2, upon the redemption of the 2018 Senior Notes, the $18.9 million make-whole premium, remaining unamortized debt discount of $1.5 million and unamortized debt issuance costs of $2.9 million were recognized as a $23.3 million pre-tax loss on debt extinguishment in the consolidated statement of operations. The amount paid to bond holders for the make-whole premium has been included as a financing activity in our statement of cash flows.
Bank Credit Facilities
CorporateRevolving Credit Facility. We operate underIn November 2010, we obtained a revolving credit facility dated November 5, 2010,pursuant to a Second Amended and Restated Credit Agreement with JPMorgan Chase Bank, N.A. as amended last on October 12, 2011, with an aggregateadministrative agent and other lenders party thereto. The revolving commitment or borrowing base of $400 million. The maximum allowable facility amount is $600 million. The credit facility is with certain commercial lending institutions and is available for working capital requirements, capital expenditures, acquisitions, general corporate purposes and to support letters of credit. The maximum facility amount is
Our$600 million. As of December 31, 2012, we had $49 million outstanding on our revolving credit facility, borrowing base is subjectcompared to size redetermination semiannually based on a quantification$209 million as of our reserves at December 31, and June 30 and is also subject to a redetermination upon the occurrence of certain events.2011. The borrowing base of the revolving credit facility will be the loan value assigned to the proved reserves attributable to our and our subsidiaries’subsidiaries' natural gas and crude oil interests.interests, excluding proved reserves attributable to PDCM and our 21 affiliated partnerships. Our revolving credit facility borrowing base is subject to a semiannual size redetermination based on quantification of our reserves at June 30 and December 31, and is also subject to a redetermination upon the occurrence of certain events. The revolving credit facility is secured by a pledge of the stock of certain of our subsidiaries, mortgages of certain producing natural gas and crude oil properties and substantially all of our and such subsidiaries’subsidiaries' other assets. Neither PDCM nor the various limited partnerships for whichthat we have sponsored, and continue to serve as the managing general partner, are guarantors of the revolving credit facility.
On October 31, 2012, the semi-annual redetermination of our revolving credit facility's borrowing base was completed with our available borrowing base being reduced from $525 million to $450 million as a result of the 2022 Senior Notes issuance. On September 21, 2012, we entered into a Sixth Amendment to the revolving credit facility. The Sixth Amendment increased the amount of senior note
PDC ENERGY, INC.
NOTES TO CONSOLIDATED FINANCIAL STATEMENTS - Continued
indebtedness and refinancing indebtedness permitted under the revolving credit agreement. On June 29, 2012, concurrent with the Merit Acquisition, we entered into a Fifth Amendment to our revolving credit facility. The Fifth Amendment increased our available borrowing base to $525 million from $425 million based on our natural gas and crude oil reserves as of December 31, 2011 and the estimated reserves as of April 1, 2012 for the acquired assets from the Merit Acquisition. On June 25, 2012, we entered into the Fourth Amendment to our revolving credit facility. The Fourth Amendment amended certain provisions of the revolving credit facility to allow us greater flexibility in entering into hedging transactions in connection with future potential asset acquisitions. On May 4, 2012, we entered into the Third Amendment to our revolving credit facility and, as a result of the semi-annual redetermination by our bank group, our borrowing base was increased by $25 million to $425 million.
Our outstanding principal amount accrues interest at a varying interest rate that fluctuates with an alternate base rate (equal to the greater of JPMorgan Chase Bank, N.A.'s prime rate, the federal funds rate plus a premium and 1-month LIBOR plus a premium), or at our election, a rate equal to the rate for dollar deposits in the London interbank market for certain time periods. Additionally, commitment fees, interest margin and other bank fees, charged as a component of interest, vary with our utilization of the facility. No principal payments are required until the credit agreement expires on November 5, 2015, or in the event that the borrowing base would fall below the outstanding balance. We pay a fee of 0.5% per annum on the unutilized commitment on our available funds under our credit facility.
PETROLEUM DEVELOPMENT CORPORATION
(dba PDC Energy)
NOTES TO CONSOLIDATED FINANCIAL STATEMENTS - Continued
The revolving credit facility contains covenants customary for agreements of this type, with the most restrictive being certain financial tests and maintaining certain financial ratios on a quarterly basis. The financial tests and ratios, as defined per the revolving credit facility, include requirements to: (a) maintain a minimum current ratio as defined per credit facility, of 1.00 to 1.00 and (b) not exceed a maximum leverage ratio of 4.25 to 1.00 through December 31, 2011, and 4.00 to 1.00 thereafter.1.00.
The revolving credit facility contains restrictions as to when we can directly or indirectly, retire, redeem, repurchase or prepay in cash any part of the principal of the 12%2022 Senior Notes Due 2018 or the 3.25%2016 Convertible Senior Notes. Among other things, the restriction on redemption of the 2016 Convertible Senior Notes Due 2016. Among others, the restriction requires that immediately after giving effect to any such retirement, redemption, defeasance, repurchase, settlement or prepayment, the aggregate commitment under the revolving credit facility exceed the aggregate credit exposure under such facility by at least the greater of (1) $115 million or (2) an amount equal to or greater than 30% of thesuch aggregate commitment. The restriction on redemption of the 2022 Senior Notes permits redemption only with the proceeds of issuances of "Permitted Refinancing Indebtedness," which may not exceed $750 million.
We have outstanding an $18.7$18.7 million irrevocable standby letter of credit in favor of a third partythird-party transportation service provider to secure the construction of certain additions and/or replacements to its facilities to provide firm transportation of the natural gas produced by us and others for whom we market their production in the West Virginia and Southwestern Pennsylvania areas.Pennsylvania. The letter of credit reduces the amount of available funds under our revolving credit facility by an equal amount. We pay a fronting fee of 0.125% per annum and an additional quarterly maintenance fee equivalent to the spread over Eurodollar loans (2.5%(2.75% per annum as of December 31, 20112012) for the period in which the letter of credit remains outstanding. The letter of credit expires on May 22, 2012.July 20, 2013. We expect to renew the letter of credit prior to its expiration.
We pay a fee of 0.5% per annum on the unutilized commitment on the available funds under our revolving credit facility. As of December 31, 20112012, the available funds under our revolving credit facility, including a reduction for the $18.7$18.7 million irrevocable standby letter of credit in effect, was $172.3 million.$382.3 million. The weighted averageweighted-average borrowing rate on our revolving credit facility, exclusive of the letter of credit, was 3.8% and 4.9% in 2011 and 2010, respectively. We were in compliance with all covenants at 4.5% per annum as of December 31, 2012 compared to 3.8% as of December 31, 2011, and expect to remain in compliance throughout the next year..
PDCM Credit Facility. PDCM has a credit facility dated April 30, 2010, as amended, last on November 18, 2011, with an aggregate revolving commitment or borrowing base of $80 million.$80 million, of which our proportionate share is $40 million. The maximum allowable facility amount is $400 million. PDCM is required to pay a commitment fee of 0.5% per annum on the unutilized portion of the activated credit facility.$400 million. Based upon PDCM's discretion, interest accrues at either an alternative base rate ("ABR") or an adjusted LIBOR. The ABR is the greater of BNP Paribas' prime rate, the federal funds effective rate plus 0.5% or the adjusted LIBOR for a three month interest period plus 1%. ABR and adjusted LIBOR borrowings are assessed an additional margin based upon the outstanding balance as a percentage of the available balance. ABR borrowings are assessed an additional margin of 1.0%1.25% to 1.75%2.0%. Adjusted LIBOR borrowings are assessed an additional margin spread of 2.0%2.25% to 2.75%3.0%. No principal payments are required until the credit agreement expires on April 30, 2014, or in the event that the borrowing base would fallfalls below the outstanding balance. The credit facility is subject to and secured by PDCM's properties, with no recourse to us.including our proportionate share of such properties. The credit facility borrowing base is subject to size redetermination semiannually based upon a quantificationvaluation of PDCM's reserves at June 30 and December 31 and June 30; further, either31. Either PDCM or the lenders may request a redetermination upon the occurrence of certain events. Pursuant to the interests of the joint venture, the credit facility will be utilized by PDCM for the exploration and development of its Marcellus assets.
The credit facility contains covenants customary for agreements of this type, with the most restrictive being certain financial tests and maintaining certain financial ratios that must be met on a quarterly basis. The financial tests and ratios, as defined by the credit facility, include requirements to: (a)to maintain a minimum current ratio of 1.0 to 1.0, (b) not to exceed a debt to EBITDAX ratio of 5.0 to 1.0 (declining to 4.5 to 1.0 on March 31, 2013 and 4.0 to 1.0 on September 30, 2013) and (c)to maintain a minimum interest coverage ratio of 2.5 to 1.0. As of December 31, 2012, our proportionate share of PDCM's outstanding credit facility balance was $26.3 million compared to $24 million as of December 31, 2011. PDCM is required to pay a commitment fee of 0.5% per annum on the unutilized portion of the activated credit facility. The weighted-average borrowing rate on PDCM's credit facility was3.5% per annum in 2012, compared to 5.0% in 2011.
As of December 31, 2012, we were in compliance with all bank credit facility covenants and expectsexpect to remain in compliance throughout the next twelve-month period.
PDC ENERGY, INC.
NOTES TO CONSOLIDATED FINANCIAL STATEMENTS - Continued
NOTE 9 - ASSET RETIREMENT OBLIGATIONS
The following table presents the changes in carrying amounts of the asset retirement obligations associated with our working interest in natural gas and crude oil properties.properties:
| | | | 2011 | | 2010 | 2012 | | 2011 |
| | (in thousands) | (in thousands) |
| | | | | | | |
| Balance beginning of year, January 1 | $ | 28,047 |
| | $ | 29,564 |
| $ | 46,566 |
| | $ | 28,047 |
|
| Deconsolidation of PDCM and change in ownership interest | (916 | ) | | (6,564 | ) | |
| Obligations incurred with development activities and assumed with acquisitions | 9,625 |
| | 4,549 |
| 14,169 |
| | 9,625 |
|
| Accretion expense | 1,897 |
| | 1,423 |
| 4,060 |
| | 1,897 |
|
| Obligations discharged with disposal of properties and asset retirements | (990 | ) | | (925 | ) | (2,232 | ) | | (990 | ) |
| Deconsolidation of PDCM and change in ownership interest | | — |
| | (916 | ) |
| Revisions in estimated cash flows | 8,903 |
| | — |
| — |
| | 8,903 |
|
| Balance end of year, December 31 (1) | 46,566 |
| | 28,047 |
| 62,563 |
| | 46,566 |
|
| Less current portion | (250 | ) | | (250 | ) | (1,000 | ) | | (250 | ) |
| Long-term portion | $ | 46,316 |
| | $ | 27,797 |
| $ | 61,563 |
| | $ | 46,316 |
|
| | | | | | | |
__________
| |
| (1) | Includes $2$2 million and $2.6 million as of December 31, 2011 and 2010, respectively, related to assets held for sale. |
PETROLEUM DEVELOPMENT CORPORATION
(dba PDC Energy)
NOTES TO CONSOLIDATED FINANCIAL STATEMENTS - Continued
InThe revisions in estimated cash flows during 2011 we revised our assumptionswere due to changes in estimates of costs for materials and services related to the cash outlay expectedplugging and abandonment of wells in the two fields where we currently conduct the majority of our operations. These cost increases related mostly to be incurred to plug uneconomic wells.the costs of cement and construction materials and third-party and internal support services on a per well basis. The revision in the asset retirement obligation did not have an immediate effect in the current year2011 statement of operations as the increase in the revised obligation will be accreted and the offsetting capitalized amount will be depreciated over the useful lives of respective wells.
NOTE 10 - EMPLOYEE BENEFIT PLANS
We sponsor a qualified retirement plan covering substantially all of our employees. The plan consists of both a traditional and a Roth 401(k) component, as well as a profit sharing component. The 401(k) components enable eligible employees to contribute a portion of their compensation through payroll deductions in accordance with specific guidelines. We provide a discretionary matching contribution based on a percentage of the employees' contributions up to certain limits. Our contribution to the profit sharing component is discretionary. Our total combined expense for the plan was $3.4 millionfor each of the years 20112012 and 2010 was $2.6$2.6 million for 2011 and for 2009 was $1.7 million.2010, respectively.
We provide a supplemental retirement benefit of deferred compensation under terms of the various employment agreements with certain former executive officers. Expenses related to this plan are charged to general and administrative expenses such expensesand the related costs were immaterial in 2012, 2011 2010 and 2009.2010. As of December 31, 20112012 and 2010,2011, the liability related to this benefit was $2.2$2 million and $2.3$2.2 million, respectively, which was included in other liabilities on the balance sheets, with the exception of $0.3$0.3 millionincluded in other accrued expenses as of December 31, 20112012 and 2010.2011.
We provide a supplemental health care benefit covering certain former executive officers and their spouses in accordance with each officer's employment agreement. Expenses incurred during 2012, 2011 2010 and 20092010 related to this plan were immaterial. As of December 31, 20112012 and 2010,2011, the related liability of $0.7 million is included in other liabilities on the balance sheets was a related liability of $0.7 million and $0.6 million, respectively.sheets.
We maintain a non-qualified deferred compensation plan for our non-employee directors. The amount of compensation deferred by each participant is based on participant elections. The amounts deferred pursuant to the plan are invested in our common stock, maintained in a rabbi trust and are classified in the balance sheets as treasury shares as a component of shareholders' equity. The plan may be settled in either cash or shares as requested by the participant. The liability related to this plan, which was included in other liabilities on the balance sheets, was immaterial as of December 31, 20112012 and 2010.2011.
NOTE 11 - COMMITMENTS AND CONTINGENCIES
Utica Shale Leasehold Agreements. During the third quarter of 2011, we entered into a series of leasehold agreements with multiple parties for the option to acquire acreage targeting the wet natural gas and crude oil phases of the Utica Shale play throughout southeastern Ohio. Pursuant to the agreements, we have the right, after confirmation of title, to acquire an estimated 30,000 net acres in the prospective Utica Shale play. Should we confirm title on all 30,000 acres, we estimate that the purchase price of these leaseholds will approximate $50 million. Further, during the fourth quarter of 2011, we entered into additional leasehold agreements giving us the opportunity to purchase an estimated additional 10,000 acres, subject to confirmation of title, for up to $20 million.
Drilling Rig Contracts. We enter into long-term contracts to secure the services of drilling rigs. As of December 31, 2011, we had outstanding commitments of $17.9 million, which included a $13.9 million commitment for a rig in the Permian Basin. Our Permian Basin Assets were subject to a purchase and sale agreement as of December 31, 2011. On February 28, 2012, the purchase and sale agreement was closed upon and, thereby, resulted in the assignment of our $13.9 million commitment to the purchaser of our Permian Basin assets. See Note 18.
Firm Transportation Agreements. We enter into contracts that provide firm transportation, sales and processing charges on pipeline systems through which we transport or sell our natural gas and the natural gas of working interest owners, PDCM, our affiliated partnerships and other third parties. These contracts require us to pay these transportation and processing charges whether the required volumes are delivered or not.gas. Satisfaction of the volume requirements includes volumes produced by us, volumes purchased from third parties and volumes produced by PDCM, our affiliated partnerships and affiliated partnerships.other third-party working interest owners. We record in our financial statements only our share of costs based upon our working interest in the wells; however, withwells. These contracts require us to pay these transportation and processing charges whether the required volumes are delivered or not. With the exception of contracts entered into by PDCM, the costs of allany volume shortfalls will beare borne by PDC.
As of December 31, 2010, we had a liability in the amount of $3.1 million included in other liabilities on the balance sheet related to an agreement in the Piceance Basin. On July 27, 2011, we entered into an amendment with the unrelated third party subject to this agreement whereby the accrued liability was relieved; consequently, during the third quarter of 2011, the accrued liability was eliminated with a corresponding reduction in the statement of operations line item production costs. The amendment did not extend the expiration date of the original agreement. The table below includes the impact of this amendment.
PETROLEUM DEVELOPMENT CORPORATION
(dba PDC Energy)ENERGY, INC.
NOTES TO CONSOLIDATED FINANCIAL STATEMENTS - Continued
The following table presents gross volume information, including our proportionate share of PDCM, related to our long-term firm transportation, sales processing and transportationprocessing agreements for pipeline capacity.capacity:
| | | | | Year Ending December 31, | | | | | Year Ending December 31, | | | |
| Area | | 2012 | | 2013 | | 2014 | | 2015 | | 2016
Through
Expiration | | Total | | Expiration
Date | | 2013 | | 2014 | | 2015 | | 2016 | | 2017
Through
Expiration | | Total | | Expiration
Date |
| | | | | | | | | | | | | | | | | | | | | | | | | | | | | |
| Volume (MMcf) | | | | | | | | | | | | | | | | | | | | | | | | | | |
| Piceance | | 18,000 |
| | 30,760 |
| | 36,168 |
| | 30,603 |
| | 111,948 |
| | 227,479 |
| | May 31, 2021 | |
| Piceance Basin | | | 30,710 |
| | 36,168 |
| | 30,603 |
| | 26,053 |
| | 85,895 |
| | 209,429 |
| | May 31, 2021 |
Appalachian Basin (1) | | 12,016 |
| | 20,117 |
| | 21,955 |
| | 23,361 |
| | 190,108 |
| | 267,557 |
| | August 31, 2022 | | 20,316 |
| | 24,353 |
| | 23,361 |
| | 24,862 |
| | 168,296 |
| | 261,188 |
| | September 20, 2025 |
| NECO | | 3,650 |
| | 1,825 |
| | 1,825 |
| | 1,825 |
| | 1,825 |
| | 10,950 |
| | December 31, 2016 | | 2,190 |
| | 1,825 |
| | 1,825 |
| | 1,825 |
| | — |
| | 7,665 |
| | December 31, 2016 |
| Total | | 33,666 |
| | 52,702 |
| | 59,948 |
| | 55,789 |
| | 303,881 |
| | 505,986 |
| | | 53,216 |
| | 62,346 |
| | 55,789 |
| | 52,740 |
| | 254,191 |
| | 478,282 |
| |
| | | | | | | | | | | | | | | | | | | | | | | | | | | |
Dollar commitment
(in thousands) | | $ | 15,318 |
| | $ | 25,597 |
| | $ | 28,805 |
| | $ | 26,164 |
| | $ | 127,353 |
| | $ | 223,237 |
| | | $ | 25,756 |
| | $ | 29,283 |
| | $ | 26,163 |
| | $ | 24,075 |
| | $ | 94,033 |
| | $ | 199,310 |
| |
| | | | | | | | | | | | | | | | | | | | | | | | | | | |
_____________
| |
(1) | Includes a precedent agreement that becomes effective when a planned pipeline is placed in service, currently expected to be September 2012 and represents 3,917 MMcf of the total MMcf presented for the year ending December 31, 2012, 10,992 MMcf for each of the years ending December 31, 2013 through 2015, respectively, and 73,028 MMcf thereafter. This agreement will be null and void if the pipeline is not completed. In August 2009, we issued a letter of credit related to this agreement, see Note 8. |
Effective January 1, 2013, we entered into a new gas gathering and processing agreement with Williams Field Services Company related to our Piceance Basin production. The new agreement included additional terms and conditions which, among other things, reduced our Piceance Basin total committed volumes for gathering to 116,260 MMcf over the term of the agreement. In February 2013, we entered into a purchase and sale agreement pursuant to which our Piceance Basin and NECO firm gathering commitments will be assumed by the buyer of certain of our oil and natural gas properties upon the closing of the transaction. There can be no assurance that we will be successful in closing such divestiture. See Note 19, Subsequent Events, for additional information regarding the planned sale.
Litigation. The Company is involved in various legal proceedings that it considers normal to its business. The Company reviews the status of these proceedings on an ongoing basis and, from time to time, may settle or otherwise resolve these matters on terms and conditions that management believes are in the best interests of the Company. There areis no assurancesassurance that settlements can be reached on acceptable terms or that adverse judgments, if any, in the remaining litigation will not exceed the amounts reserved. Although the results cannot be known with certainty, we currently believe that the ultimate results of such proceedings will not have a material adverse effect on our financial position, results of operations or liquidity.
Alleged Class Action Filed Regarding 2010 and 2011 Partnership Purchases
On December 21, 2011 the Company and its wholly-owned merger subsidiary were served with an alleged class action on behalf of certain former partnership unit holders, related to 11its partnership repurchases completed by mergers in 2010 and 2011. The action was filed in United States ("U.S.") District Court for the Central District of California, and is titled Schulein v. Petroleum Development Corp. The Company was managing general partner for each of these partnerships and the mergers were each approved by a majority of the partnership units held by non-affiliated investor partners. The complaint primarily alleges a claim that the proxy statements issued in connection with the mergers were inadequate, and a state law breach of fiduciary duty claim.duty. On February 10, 2012, the Company filed a motion to dismiss. We believe the suit is without merit and we intend to defend vigorously.
Royalty Owner Class Action
Gobel et al v. Petroleum Development Corporation, filed on January 27, 2009, in Circuit Court of Harrison County, CA No. 09-C-40-2
David W. Gobel, individually and allegedly as representative of all royalty ownersdismiss or in the Company's West Virginia oil and gas wells, filed a lawsuit against the Company alleging that we failedalternative to properly pay royalties. The allegations stated that the Company improperly deducted certain charges and costs before applying the royalty percentage. Punitive damages were requested in addition to breach of contract, tort and fraud allegations. On October 27, 2010, the state court set a trial date of April 2012.
In April 2011, the Company entered into an oral settlement agreement with respect to this lawsuit, settling all claims between the parties for an aggregate payment of $8.7 million.stay. On June 15, 2011, subject to court approval,2012, the Court denied the motion. The Court has approved a written settlement agreement was signed confirming these terms. On June 30, 2011, the state court granted initial approval of the settlement agreement, subject to notice to class members and final court approval. Initial notice was then sentlitigation schedule including a jury trial in May 2014. We have not recorded a liability for claims pending because we believe we have good legal defenses to the class members. The dateasserted claims and because the plaintiffs have not specified damages and it is not possible for objection by class members was October 24, 2011, with no objections received. Final approval of the settlement was received in January 2012. As of December 31, 2011, the total settlement amount was included in other accrued expenses on the balance sheet with the related escrow account included in restricted cash - current on the balance sheet.management to estimate what, if any, monetary damages could result from this claim.
Environmental. Due to the nature of the natural gas and oil industry, we are exposed to environmental risks. We have various policies and procedures to avoid environmental contamination and mitigate the risks from environmental contamination. We conduct periodic reviews to identify changes in our environmental risk profile. Liabilities are accruedrecorded when environmental damages resulting from past events are probable and the costs can be reasonably estimated. As of December 31, 2012 and December 31, 2011 and December 31, 2010,, we had accrued environmental liabilities in the amount of $2.5$8.4 million and $1.7$2.5 million, respectively, included in other accrued expenses on the balance sheet. The increase in accrued liabilities at December 31, 2012 primarily relates to the assumption of environmental liabilities related to the Merit Acquisition. We are not aware of any environmental claims existing as of December 31, 2011,2012 which have not been provided for or would otherwise have a material impact on our financial statements. However, there can be no assurance that current regulatory requirements will not change or unknown past non-compliance with environmental laws will not be discovered on our properties.
PETROLEUM DEVELOPMENT CORPORATION
(dba PDC Energy)
NOTES TO CONSOLIDATED FINANCIAL STATEMENTS - Continued
Partnership Repurchase Provision. Substantially all of our drilling programs contain a repurchase provision where investing partners may request that we purchase their partnership units at any time beginning with the third anniversary of the first cash distribution. The provision provides that we are obligated to purchase an aggregate of 10% of the initial subscriptions per calendar year (at a minimum price of four times the most recent 12 months' cash distributions from production), if repurchase is requested by investors, subject to our financial ability to do so. As of December 31, 20112012, the maximum annual repurchase obligation for 2012,2013, based upon the minimum price described above, was approximately $6.3 million.$2.9 million. We believe we have adequate liquidity to meet this potential obligation. During 20112012, 20102011 and 2009,2010, we paid $0.2$0.5 million $0.6, $0.2 million and $1.7$0.6 million, respectively, under this provision for the repurchase of partnership units.
Lease Agreements. We entered into operating leases, principally for the leasing of natural gas compressors, office space in Denver and Bridgeport, and general office equipment.
PDC ENERGY, INC.
NOTES TO CONSOLIDATED FINANCIAL STATEMENTS - Continued
The following table presents the minimum future lease payments under the non-cancelable operating leases as of December 31, 20122011.:
|
| | | | | | | | | | | | | | | | | | | | | | | | | | | | |
|
| Year Ending December 31, |
|
|
|
|
|
| 2012 |
| 2013 |
| 2014 |
| 2015 |
| 2016 |
| Thereafter |
| Total |
|
| (in thousands) |
|
|
|
|
|
|
|
|
|
|
|
|
|
|
|
| Minimum Lease Payments |
| $ | 2,575 |
|
| $ | 2,500 |
|
| $ | 2,286 |
|
| $ | 1,867 |
|
| $ | 402 |
|
| $ | 1,138 |
|
| $ | 10,768 |
|
|
|
|
|
|
|
|
|
|
|
|
|
|
|
|
|
| | | | | | | | | | | | | | | | | | | | | | | | | | | | |
| | | Year Ending December 31, | | | | |
| | | 2013 | | 2014 | | 2015 | | 2016 | | 2017 | | Thereafter | | Total |
| | | (in thousands) |
| | | | | | | | | | | | | | | |
| Minimum Lease Payments | | $ | 2,607 |
| | $ | 2,386 |
| | $ | 1,929 |
| | $ | 461 |
| | $ | 255 |
| | $ | 887 |
| | $ | 8,525 |
|
| | | | | | | | | | | | | | | |
Operating lease expense for the years ended December 31,2012, 2011 and 2010 was $6.1 million, 2010$5.9 million and 2009, was $5.9$4.9 million $4.9 million and $4.3 million,, respectively.
Employment Agreements with Executive Officers. We have employment agreements withEach of our senior executive officers. The employment agreements provide for annual base salaries, eligibility for performance bonus compensationofficers may be entitled to a severance payment and certain other various benefits including severance benefits.
If, within two years following a change in controlupon the termination of the Company ("change in control period"), eitherofficer's employment pursuant to the Company terminates the executive officer without cause officer's employment agreement and/or the Company's executive officer terminates employment for good reason, then the severance compensation plan. The nature and amount of such benefits owed equals three times the sum of the executive's highest annual base salary during the previous two years of employment immediately precedingwould vary based upon, among other things, whether the termination date and the executive's highest annual bonus paid or, in the case of one executive officer, paid or payable during the same two-year period. Mr. Trimble became President and Chief Executive Officer in June 2011 and under his employment agreement, if he is terminated without cause, he is to receive payment of salary and bonus through June 30, 2013, provided such amount will equal at least one year's salary and bonus. Where the Company terminates the executive officer without cause or the executive officer terminates employment for good reason outside of the change in control period, the severance benefits range from two times to three times, specific to the executive officer, the benefits noted above. For this purpose,followed a change of control and good reason correspond to the respective definitions of change of control and good reason under IRC Section 409A and the supporting Treasury regulations, with some differences. Under any of the above circumstances, the executive officer is also entitled under his employment agreement to (i) vesting of any unvested equity compensation (excluding all long-term incentive shares), (ii) reimbursement for any unpaid expenses, (iii) retirement benefits earned under the current and/or previous agreements, (iv) continued coverage under our medical plan at the Company's cost for the federal COBRA health continuation coverage period and (v) payment of any earned and unpaid bonus amounts. In addition, the executive officer is entitled to receive any benefits that he would have otherwise been entitled to receive under our qualified retirement plan, although those benefits are not increased or payment accelerated.
In the event that an executive officer is terminated for just cause, we are required to pay the executive officer his base salary through the termination date plus a partial year bonus, incentive, deferred, retirement or other compensation and to provide any other benefits, which have been earned or become payable as of the termination date.Company.
In the event that an executive officer voluntarily terminates his employment for other than good reason, he is entitled to receive (i) his base salary and bonus, provided, however, that with respect to the bonus, for certain executive officers, there will be no proration of the bonus if such executive leaves prior to the last day of the year and, with respect to one executive officer, there will be no proration of the bonus in the event such executive officer leaves prior to March 31 in the year of his termination, (ii) any incentive, deferred or other compensation which has been earned or has become payable, but which has not yet been paid under the schedule originally contemplated in the agreement under which they were granted, (iii) any unpaid expense reimbursement and (iv) any other payments for benefits earned under the employment agreement or our plans.
In the event of death or disability, the executive is entitled to receive certain benefits. For this purpose, the definition of "disability" corresponds to the definition under IRC Section 409A and the supporting Treasury regulations. The benefits will (i) in the case of death be paid in a lump sum and be equal to the base salary that would otherwise have been paid for a six-month period following the termination date and (ii) in the case of disability be up to thirteen weeks of ongoing base salary plus a lump sum equal to six months of base salary.
See Note 1617, Transactions With Affiliates, for a discussion related to the separation agreement entered into with our former chief executive officer in 2011.
PETROLEUM DEVELOPMENT CORPORATION
(dba PDC Energy)
NOTES TO CONSOLIDATED FINANCIAL STATEMENTS - Continued
NOTE 12 - COMMON STOCK
Sale of Equity Securities
In May 2012, we completed a public offering of 6,500,000 shares of our common stock, par value $0.01 per share, at an offering price of $26.50 per share. Net proceeds of the offering were approximately $164.5 million, after deducting underwriting discounts and commissions and offering expenses, of which $65,000 is included in common shares-par value and $164.4 million is included in APIC on the balance sheet as of December 31, 2012. We used the net proceeds from the offering to finance a portion of the Merit Acquisition and for general corporate purposes. The following offerings wereoffering was made pursuant to an effective shelf registration statement on Form S-3 filed with the SEC on November 26, 2008, and declared effective on January 30, 2009.23, 2012.
In November 2010, we sold 4,140,000 shares of our common stock in an underwritten public offering at a price of $32.00$32.00 per share. The net proceeds of $125.5$125.5 million were used, together with other proceeds, to fund an acquisition of additional assets in the Wolfberry Trend in the Permian Basin of West Texas, which closed in November 2010, our acquisition of the 2004 and 2005 partnerships and other acquisitions and for general corporate purposes. Pending such uses, we applied the net proceeds from this offering and other proceeds to temporarily repay the entire outstanding amount under our revolving credit facility, with the remaining balance being deposited in an interest bearing account and held as cash and cash equivalents until utilized as contemplated above.
In August 2009, we sold 4,312,500 shares of our common stock in The offering was made pursuant to an underwritten public offering at a price of $12.00 per share. We usedeffective shelf registration statement on Form S-3 filed with the net proceeds of $48.5 million to pay down our credit facility and for general corporate purposes.SEC on November 26, 2008.
Stock-Based Compensation Plans
2010 Long-Term Equity Compensation Plan. In June 2010, our shareholders approved a long-term equity compensation plan for our employees and non-employee directors (the "2010 Plan"). In accordance with the 2010 Plan, up to 1,400,000 new shares of our common stock are authorized for issuance. Shares issued may be either authorized but unissued shares, treasury shares or any combination of these shares. Additionally, the 2010 Plan permits the reuse or reissuance of shares of common stock which were canceled, expired, forfeited or, in the case of stock appreciation rights ("SARs"), paid out in the form of cash. Awards may be issued to our employees in the form of incentive or non-qualified stock options, SARs, restricted stock, restricted stock units ("RSUs"), performance shares and performance units, and to our non-employee directors in the form of non-qualified stock options, SARs, restricted stock and RSUs. Awards may vest over periods set at the discretion of the Compensation Committee of our Board of Directors (the "Compensation Committee") with certain minimum vesting periods. With regard to incentive or non-qualified stock options and SARs, awards have a maximum exercisable period of ten years. In no event, may an award be granted under the 2010 Plan on or after April 1, 2020. As of December 31, 2011, 895,6632012, 490,412 shares remain available for issuance pursuant to the 2010 Plan.
2004 Long-Term Equity Compensation Plan. As approved by the shareholders in June 2004, we maintain a long-term equity compensation plan for our officers and certain key employees (the "2004 Plan"). Awards pursuant to the plan vest over periods set at the discretion of the Compensation Committee and, with regard to options, have a maximum exercisable period of ten years. As of December 31, 2011, there wereWe no shares remaining available for issuancelonger issue awards pursuant to the 2004 Plan. All outstanding and non-vested awards pursuant to the 2004 Plan will continue to be outstanding and vest pursuant to their original terms on or before April 19, 2020.
PDC ENERGY, INC.
NOTES TO CONSOLIDATED FINANCIAL STATEMENTS - Continued
The following table provides a summary of the impact of our outstanding stock-based compensation plans on the results of operations for the periods presented.presented:
| |
| | Year Ended December 31, | | Year Ended December 31, |
| | 2011 | | 2010 | | 2009 | | 2012 | | 2011 (1) | | 2010 |
| | (in thousands) | | (in thousands) |
| | | | | | | | | | | | | |
| Total stock-based compensation | | $ | 8,781 |
| | $ | 5,314 |
| | $ | 5,935 |
| |
| Stock-based compensation expense | | | $ | 8,495 |
| | $ | 8,781 |
| | $ | 5,314 |
|
| Income tax benefit | | (3,344 | ) | | (2,019 | ) | | (2,277 | ) | | (3,245 | ) | | (3,344 | ) | | (2,019 | ) |
| Net expense | | $ | 5,437 |
| | $ | 3,295 |
| | $ | 3,658 |
| | $ | 5,250 |
| | $ | 5,437 |
| | $ | 3,295 |
|
| |
|
| |
|
| |
|
| | | | | | |
__________
(1) Includes a $2.5 million pre-tax charge related to a separation agreement with our former chief executive officer. See Note 17, Transactions with Affiliates, for additional information regarding the related separation agreement.
Stock Option Awards
We have granted stock options pursuant to various stock compensation plans. Outstanding options expire ten years from the date of grant and become exercisable ratably over a four year period. We have not issued any new stock options awards since 2006. As of December 31, 2011,2012, all compensation cost related to stock options has been fully recognized in our statements of operations.
PETROLEUM DEVELOPMENT CORPORATION
(dba PDC Energy)
NOTES TO CONSOLIDATED FINANCIAL STATEMENTS - Continued
The following table presents the changes in our stock option awards. The aggregate intrinsic value of options outstanding for each period presented was immaterial.immaterial:
|
| | | | | | | | | | | | | | | | | | | | | | | |
| | Year Ended December 31, |
| | 2011 | | 2010 | | 2009 |
| | Number of
Shares
Underlying
Options | | Weighted
Average
Exercise
Price
Per Share | | Weighted
Average
Remaining
Contractual
Term (years) | | Number of
Shares
Underlying
Options | | Weighted
Average
Exercise
Price
Per Share | | Number of
Shares
Underlying
Options | | Weighted
Average
Exercise
Price
Per Share |
| Outstanding beginning of year, January 1 | 10,306 |
| | $ | 41.90 |
| | — |
| | 10,306 |
| | $ | 41.90 |
| | 18,351 |
| | $ | 41.68 |
|
| Forfeited | (3,333 | ) | | 43.60 |
| | — |
| | — |
| | — |
| | (8,045 | ) | | 41.39 |
|
| Outstanding end of year, December 31 | 6,973 |
| | 41.09 |
| | 3.6 |
| | 10,306 |
| | 41.90 |
| | 10,306 |
| | 41.90 |
|
| Exercisable at December 31 | 6,973 |
| | 41.09 |
| | 3.6 |
| | 10,306 |
| | 41.60 |
| | 8,591 |
| | 41.42 |
|
|
| | | | | | | | | | | | | | | | | | | | | | | |
| | Year Ended December 31, |
| | 2012 | | 2011 | | 2010 |
| | Number of
Shares
Underlying
Options | | Weighted-Average
Exercise
Price
Per Share | | Weighted- Average
Remaining
Contractual
Term (in years) | | Number of
Shares
Underlying
Options | | Weighted-Average
Exercise
Price
Per Share | | Number of
Shares
Underlying
Options | | Weighted-Average
Exercise
Price
Per Share |
| Outstanding beginning of year, January 1, | 6,973 |
| | $ | 41.09 |
| | — |
| | 10,306 |
| | $ | 41.90 |
| | 10,306 |
| | $ | 41.90 |
|
| Forfeited | — |
| | — |
| | — |
| | (3,333 | ) | | 43.60 |
| | — |
| | — |
|
| Outstanding end of year, December 31, | 6,973 |
| | 41.09 |
| | 2.6 |
| | 6,973 |
| | 41.09 |
| | 10,306 |
| | 41.90 |
|
| Exercisable at December 31, | 6,973 |
| | 41.09 |
| | 2.6 |
| | 6,973 |
| | 41.09 |
| | 10,306 |
| | 41.60 |
|
SARs
In March 2011, the Compensation Committee awarded 31,552 SARs to our executive officers. The SARs will vest ratably over a three-year period and may be exercised at any point after vesting through March 2021.10 years from the date of issuance. Pursuant to the terms of the awards, upon exercise, the executive officers will receive, in shares of common stock, the excess of the market price of the award on the date of exercise over the market price of the award on the date of issuance.
In January 2012, the Compensation Committee awarded 68,361 SARs to our executive officers. The fair value of each SAR award was estimated on the date of grant using a Black-Scholes pricing model using the assumptions presented in the table below. following assumptions:
|
| | | | | | | | | | | |
| | Year Ended December 31, |
| | 2012 | | 2011 | | 2010 |
| | | | | | |
| Expected term of award | 6 years |
| | 6 years |
| | 5 years |
|
| Risk-free interest rate | 1.1 | % | | 2.5 | % | | 2.5 | % |
| Expected volatility | 64.3 | % | | 60.2 | % | | 62.0 | % |
| Weighted-average grant date fair value per share | $ | 17.61 |
| | $ | 25.22 |
| | $ | 13.26 |
|
The expected life of the award was estimated using historical stock option exercise behavior data. The risk-free interest rate was based on the U.S. Treasury yields approximating the expected life of the award in effect at the time of grant. Expected volatilities were based on our historical volatility. We do not expect to pay dividends, nor do we expect toor declare dividends in the foreseeable future. There were no SARs awards in 2009.
|
| | | | | | | |
| | Year Ended December 31, |
| | 2011 | | 2010 |
| | | | |
| Expected term of the award | 6 years |
| | 5 years |
|
| Risk-free interest rate | 2.5 | % | | 2.5 | % |
| Volatility | 60.2 | % | | 62.0 | % |
| Weighted average grant date fair value per share | $ | 25.22 |
| | $ | 13.26 |
|
The following table presents the changes in our SARs.
|
| | | | | | | | | | | | | | | | | | | | | | | | | | | | |
| | Year Ended December 31, |
| | 2011 | | 2010 |
| | Number of
SARs | | Weighted
Average
Exercise
Price | | Average Remaining Contractual
Term (in years) | | Aggregate Intrinsic
Value (in thousands) | | Number of
SARs | | Weighted
Average
Exercise
Price | | Average Remaining Contractual
Term (in years) | | Aggregate Intrinsic
Value (in thousands) |
| Outstanding beginning of year, January 1 | 57,282 |
| | $ | 24.44 |
| | — |
| | $ | 1,020 |
| | — |
| | $ | — |
| | $ | — |
| | $ | — |
|
| Awarded | 31,552 |
| | 43.95 |
| | — |
| | — |
| | 57,282 |
| | 24.44 |
| | — |
| | — |
|
| Exercised | (25,371 | ) | | 24.44 |
| | — |
| | 77 |
| | — |
| | — |
| | — |
| | — |
|
| Forfeited | (12,992 | ) | | 43.95 |
| | — |
| | — |
| | — |
| | — |
| | — |
| | — |
|
| Outstanding end of year, December 31 | 50,471 |
| | 31.61 |
| | 8.6 |
| | 341 |
| | 57,282 |
| | 24.44 |
| | 9.3 |
| | 1,020 |
|
| Exercisable at December 31 | 10,636 |
| | 24.44 |
| | 8.3 |
| | 114 |
| | — |
| | — |
| | — |
| | — |
|
Pursuant to a separation agreement with our former chief executive officer and the original terms of the award, during the year ended December 31, 2011, the vesting of 29,906 SARs was accelerated, resulting in the acceleration of $0.6 million in stock-based compensation expense. This former executive officer subsequently exercised 25,371 SARs. The fair market price on the exercise date was
PETROLEUM DEVELOPMENT CORPORATION
(dba PDC Energy)ENERGY, INC.
NOTES TO CONSOLIDATED FINANCIAL STATEMENTS - Continued
$27.49 per share, resultingThe following table presents the changes in the issuance of 2,814 shares of common stock. The totalour SARs:
|
| | | | | | | | | | | | | | | | | | | | | | | | | | | | | | | | | | | |
| | Year Ended December 31, |
| | 2012 | | 2011 | | 2010 |
| | Number of
SARs | | Weighted-Average
Exercise
Price | | Average Remaining Contractual
Term (in years) | | Aggregate Intrinsic
Value (in thousands) | | Number of
SARs | | Weighted-Average
Exercise
Price | | Aggregate Intrinsic
Value (in thousands) | | Number of
SARs | | Weighted-Average
Exercise
Price | | Aggregate Intrinsic
Value (in thousands) |
| Outstanding beginning of year, January 1, | 50,471 |
| | $ | 31.61 |
| | 8.6 |
| | $ | 341 |
| | 57,282 |
| | $ | 24.44 |
| | $ | 1,020 |
| | — |
| | $ | — |
| | $ | — |
|
| Awarded | 68,361 |
| | 30.19 |
| | — |
| | — |
| | 31,552 |
| | 43.95 |
| | — |
| | 57,282 |
| | 24.44 |
| | — |
|
| Exercised | — |
| | — |
| | — |
| | — |
| | (25,371 | ) | | 24.44 |
| | 77 |
| | — |
| | — |
| | — |
|
| Forfeited | — |
| | — |
| | — |
| | — |
| | (12,992 | ) | | 43.95 |
| | — |
| | — |
| | — |
| | — |
|
| Outstanding end of year, December 31, | 118,832 |
| | 30.80 |
| | 8.4 |
| | 486 |
| | 50,471 |
| | 31.61 |
| | 341 |
| | 57,282 |
| | 24.44 |
| | 1,020 |
|
| Exercisable at December 31, | 27,458 |
| | 28.84 |
| | 7.5 |
| | 187 |
| | 10,636 |
| | 24.44 |
| | 114 |
| | — |
| | — |
| | — |
|
Total compensation cost related to SARs granted and not yet recognized in our statement of operations as of December 31, 2011,2012, was $0.5 million.$1.0 million. The cost is expected to be recognized over a weighted averageweighted-average period of 1.8 years.
Restricted Stock Awards
Time-Based Awards. ForThe fair value of the year ended December 31, 2011,time-based restricted shares is amortized ratably over the requisite service period, primarily three or four years. The time-based shares vest ratably on each annual anniversary following the grant date that a participant is continuously employed.
In January 2012, the Compensation Committee awarded a total of 113,24379,889 time-based restricted shares to our executive officers that primarily vest ratably over three years from date of grant and 23,360 year period ending on January 16, 2015.
The following table presents the changes in non-vested time-based restricted shares to our non-employee directors also vesting ratably over three years from date of grant.awards during 2012:
Pursuant to a separation agreement with our former chief executive officer and the original terms of the award, during the year ended December 31, 2011, the vesting of 64,442 time-based restricted shares was accelerated, resulting in the acceleration of $1.9 million in stock-based compensation expense. The total |
| | | | | | |
| | Shares | | Weighted-Average
Grant-Date
Fair Value |
| | | | |
| Non-vested at December 31, 2011 | 527,801 |
| | $ | 29.29 |
|
| Granted | 341,338 |
| | 26.59 |
|
| Vested | (186,205 | ) | | 29.42 |
|
| Forfeited | (36,444 | ) | | 28.20 |
|
| Non-vested at December 31, 2012 | 646,490 |
| | 27.93 |
|
| | | | |
|
| | | | | | | | | | | |
| | As of/Year Ended December 31, |
| | 2012 | | 2011 | | 2010 |
| | (in thousands, except per share data) |
| | | | | | |
| Total intrinsic value of time-based awards vested | $ | 5,950 |
| | $ | 9,030 |
| | $ | 3,219 |
|
| Total intrinsic value of time-based awards non-vested | 21,470 |
| | 18,531 |
| | 22,211 |
|
| Market price per common share as of December 31, | 33.21 |
| | 35.11 |
| | 42.25 |
|
| Weighted-average grant date fair value per share | 26.59 |
| | 33.71 |
| | 25.04 |
|
Total compensation cost related to non-vested time-based awards expected to vest and not yet recognized in our statements of operations as of December 31, 2011,2012 was $10.9 million.$11.5 million. This cost is expected to be recognized over a weighted averageweighted-average period of 2.42.2 years.
The following table presents the changes in non-vested time-based awards during 2011.
|
| | | | | | |
| | Shares | | Weighted Average
Grant-Date
Fair Value |
| | | | |
| Non-vested at December 31, 2010 | 525,715 |
| | $ | 25.53 |
|
| Granted | 295,239 |
| | 33.71 |
|
| Vested | (256,311 | ) | | 26.97 |
|
| Forfeited | (36,842 | ) | | 27.22 |
|
| Non-vested at December 31, 2011 | 527,801 |
| | 29.29 |
|
| | | | |
|
| | | | | | | | | | | |
| | As of/Year Ended December 31, |
| | 2011 | | 2010 | | 2009 |
| | (in thousands, except per share data) |
| | | | | | |
| Total intrinsic value of time-based awards vested | $ | 9,030 |
| | $ | 3,219 |
| | $ | 1,731 |
|
| Total intrinsic value of time-based awards non-vested | 18,531 |
| | 22,211 |
| | 5,560 |
|
| Market price per common share as of December 31 | 35.11 |
| | 42.25 |
| | 18.21 |
|
| Weighted average grant date fair value per share | 33.71 |
| | 25.04 |
| | 14.02 |
|
Market-Based Awards.The fair value of the market-based restricted shares is amortized ratably over the requisite service period, primarily three years. Generally, the market-based shares vest if the participant is continuously employed throughout the performance period and the market-based performance measure is achieved, with a maximum vesting period of five years. All compensation cost related to the market-based awards will be recognized if the requisite service period is fulfilled, even if the market condition is not achieved.
PDC ENERGY, INC.
NOTES TO CONSOLIDATED FINANCIAL STATEMENTS - Continued
In March 2011,January 2012, the Compensation Committee awarded a total of 13,53130,541 market-based restricted shares to our executive officers. In addition to continuous employment, the vesting of these shares is contingent on the Company's total shareholder return ("TSR"), which is essentially the Company’s stock price change including any dividends, as compared to the TSR of a set group of 1114 peer companies. The shares are measured over a three-year period ending on December 31, 2013,2014 and can result in a payout between zero0% and 200% of the total shares awarded. The weighted averageweighted-average grant date fair value per market-based share for these awards granted was computed using the Monte Carlo pricing model using the weighted average assumptions presented in the table below. There were no market-based awards in 2010.
following assumptions:
| | | | | Year Ended December 31, | | Year Ended December 31, |
| | | 2011 | | 2009 | | 2012 | | 2011 |
| | | | | | | | | |
| Expected term of award | | 3 years |
| | 3 years |
| | 3 years |
| | 3 years |
|
| Risk-free interest rate | | 1.1 | % | | 2.0 | % | | 0.3 | % | | 1.1 | % |
| Volatility | | 74.2 | % | | 59.0 | % | |
| Weighted average grant date fair value per share | | $ | 58.53 |
| | $ | 6.47 |
| |
| Expected volatility | | | 65.3 | % | | 74.2 | % |
| Weighted-average grant date fair value per share | | | $ | 36.54 |
| | $ | 58.53 |
|
For our 2011 awards, the expected volatility was based on our historical volatility and, for our 2009 awards, the expected volatility was based on a blend of our historical and implied volatilities. The expected livesterm of the awards werewas based on the requisite service period. The risk-free interest rate was based on the U.S. Treasury yields in effect at the time of grant or modification and extrapolated to approximate the life of the award. The expected volatility was based on our historical volatility. We do not expect to pay dividends, nor do we expect toor declare dividends in the foreseeable future.
PETROLEUM DEVELOPMENT CORPORATION
(dba PDC Energy)
NOTES TO CONSOLIDATED FINANCIAL STATEMENTS - Continued
future
The following table presents the change in non-vested market-based awards during 2011.2012:
| | | | | Shares | | Weighted Average
Grant-Date
Fair Value per Share | | Shares
| | Weighted-Average
Grant-Date
Fair Value per Share
|
| | | | | | | | | |
| Non-vested at December 31, 2010 | | 79,550 |
| | $ | 32.52 |
| |
Non-vested at December 31, 2011
| | | 43,081 |
| | $ | 42.05 |
|
| Granted | | 13,531 |
| | 58.53 |
| | 30,541 |
| | 36.54 |
|
| Vested | | (10,690 | ) | | 6.47 |
| |
| Forfeited | | (39,310 | ) | | 38.11 |
| | (32,926 | ) | | 45.15 |
|
| Non-vested at December 31, 2011 | | 43,081 |
| | 42.05 |
| |
Non-vested at December 31, 2012
| | | 40,696 |
| | 39.22 |
|
| | | | | | | | | |
| | | | As of/Year Ended December 31, | As of/Year Ended December 31, |
| | 2011 | | 2010 | | 2009 | 2012 | | 2011 | | 2010 |
| | (in thousands, except per share data) | (in thousands, except per share data) |
| | | | | | | | | | | |
| Total intrinsic value of market-based awards vested | $ | 366 |
| | $ | — |
| | $ | — |
| $ | — |
| | $ | 366 |
| | $ | — |
|
| Total intrinsic value of market-based awards non-vested | 1,513 |
| | 3,361 |
| | 1,449 |
| 1,352 |
| | 1,513 |
| | 3,361 |
|
| Market price per common share as of December 31 | 35.11 |
| | 42.25 |
| | 18.21 |
| |
| Weighted average grant date fair value per share | 58.53 |
| | — |
| | 6.47 |
| |
| Market price per common share as of December 31, | | 33.21 |
| | 35.11 |
| | 42.25 |
|
| Weighted-average grant date fair value per share | | 36.54 |
| | 58.53 |
| | — |
|
Pursuant to a separation agreement with our former chief executive officer and the original terms of the award, during 2011, the vesting of 4,109 market-based restricted shares was accelerated and 21,927 market-based restricted shares were forfeited. The impact on stock-based compensation for the vesting and forfeiture of these market-based restricted shares was immaterial. The totalTotal compensation cost related to non-vested market-based awards expected to vest and not yet recognized in our statement of operations as of December 31, 2011,2012 was immaterial.$0.9 million. This cost is expected to be recognized over a weighted averageweighted-average period of 21.8 years.
Treasury Share Purchases
In accordance with our stock-based compensation plans, employees and directors may surrender shares of the Company's common stock to coverpay tax withholding obligations upon the vesting and exercise of share-based awards. The sharesShares acquired may bethat had been issued pursuant to the 2004 Plan are retired, orwhile those issued pursuant to the 2010 Plan are reissued to service awards under our 2010 Plan.awards. For shares that are retired, we first charge any excess of cost over the par value to additional paid-in-capital ("APIC") to the extent we have amounts in APIC, with any remaining excess cost charged to retained earnings. For shares reissued to service awards under the 2010 Plan, shares are recorded at cost and upon reissuance we reduce the carrying value of shares acquired and held pursuant to the 2010 Plan by the weighted averageweighted-average cost per share with an offsetting charge to APIC. During the year ended December 31, 2011,2012, we acquired 87,58844,576 shares pursuant to our stock-based compensation plans for payment of tax liabilities, of which 15,07214,471 shares were retired, 28,587 and 1,518 shares were reissued and are available for reissuance, respectively, pursuant to our 2010 Plan and the remaining 72,516 shares retired.Plan.
PDC ENERGY, INC.
NOTES TO CONSOLIDATED FINANCIAL STATEMENTS - Continued
Shareholders’ Rights Agreement
In 2007, we entered into a rights agreement. The rights agreement is designed to improve the ability of our Board to protect the interest of our shareholders in the event of an unsolicited takeover attempt. Our Board declared a dividend of one right for each outstanding share of our common stock. The right dividend was paid to shareholders of record on September 14, 2007.2007. A "distribution date," as defined in the rights agreement, can occur after any individual shareholder exceeds 15% ownership of our outstanding common stock. After the occurrence of a "distribution date,"In certain circumstances, the right entitles each registered holder, (otherother than an "acquiring person" (as defined in the acquiring shareholder who triggered the "distribution date")agreement), to purchase shares of our common stock (or, in certain circumstances, cash, property or other securities) having a then-current value equal to two times the exercise price of the right (i.e., for the $240 exercise price, the rights holder receives $480 worth of common stock). The exercise price is subject to adjustment for various corporate actions which affect all shareholders, such as a stock split. The rights agreement and all rights will expire on September 11, 2017.2017.
Preferred stock
We are authorized, pursuant to shareholder approval in 2008, to issue 50,000,000 shares of Company preferred stock, par value $0.01, which may be issued in one or more series, with such rights, preferences, privileges and restrictions as shall be fixed by our Board from time to time. As of December 31, 20112012, no preferred shares had been issued.
NOTE 13 - EARNINGS PER SHARE
Basic earnings per common share ("EPS") is computed by dividing net income (loss) by the weighted-average number of common shares outstanding for the period. Diluted EPS is similarly computed except that the denominator includes the effect, using the treasury stock method, of our unamortized portion of restricted stock, outstanding SARs, stock options, convertible notes and shares held pursuant to our non-employee director deferred compensation plan, if including such potential shares of common stock is dilutive.
The following table presents a reconciliation of the weighted-average diluted shares outstanding:
|
| | | | | | | | |
| | Year Ended December 31, |
| | 2012 | | 2011 | | 2010 |
| | (in thousands) |
| | | | | | |
| Weighted-average common shares outstanding - basic | 27,677 |
| | 23,521 |
| | 19,674 |
|
| Dilutive effect of share-based compensation: | | | | | |
| Restricted stock | — |
| | 307 |
| | 119 |
|
| SARs | — |
| | 40 |
| | 21 |
|
| Non-employee director deferred compensation | — |
| | 3 |
| | 7 |
|
| Weighted-average common and common share equivalents outstanding - diluted | 27,677 |
| | 23,871 |
| | 19,821 |
|
| | | | | | |
The following table presents the weighted-average common share equivalents excluded from the calculation of diluted earnings per share due to their anti-dilutive effect:
|
| | | | | | | | |
| | Year Ended December 31, |
| | 2012 | | 2011 | | 2010 |
| | (in thousands) |
| | | | | | |
| Weighted-average common share equivalents excluded from diluted earnings | | | | | |
| per share due to their anti-dilutive effect: | | | | | |
| Restricted stock | 694 |
| | 220 |
| | 204 |
|
| SARs | 116 |
| | 22 |
| | — |
|
| Stock options | 7 |
| | 9 |
| | 10 |
|
| Non-employee director deferred compensation | 3 |
| | — |
| | — |
|
| Total anti-dilutive common share equivalents | 820 |
| | 251 |
| | 214 |
|
| | | | | | |
For 2012, we reported a net loss. As a result, our basic and diluted weighted-average common shares outstanding were the same as the effect of the common share equivalents was anti-dilutive.
In November 2010, we issued 115,000 convertible senior notes, $1,000 principal amount per note, that give the holders the right to convert the aggregate principal amount into 2.7 million common shares at a conversion price of $42.40 per share. These convertible notes could have a dilutive impact on our earnings per share if the average market share price exceeds the $42.40 conversion price. The average market share price did not exceed the conversion price during 2012, 2011 or 2010.
PETROLEUM DEVELOPMENT CORPORATION
(dba PDC Energy)ENERGY, INC.
NOTES TO CONSOLIDATED FINANCIAL STATEMENTS - Continued
NOTE 1314 - ASSETS HELD FOR SALE, DIVESTITURES AND DISCONTINUED OPERATIONS
Selected financial information. The tables below set forth selected financial information related to net assets divested, net assets related to discontinued operations and operating results related to discontinued operations. Net assets held for sale represents the assets that were or are expected to be sold, net of liabilities, that were or are expected to be assumed by the purchaser. Net assets related to discontinued operations presents those assets that were or are expected to be sold, less liabilities that were or are expected to be assumed, by the purchaser, as well as all other related assets and liabilities, consisting of accounts receivable and production tax liability, which were not sold. While the reclassification of revenues and expenses related to discontinued operations for prior periods had no impact upon previously reported net earnings, the statement of operations table presents the revenues and expenses that were reclassified from the specified statement of operations line items to discontinued operations.
The following table presents balance sheet data related to assets held for sale.sale:
| | | | | As of December 31, | | As of December 31, |
| | | 2011 | | 2010 | | 2011 |
| Balance Sheet | | Net Assets Held for Sale | | Net Assets
Related to Discontinued Operations | | Net Assets Held for Sale | | Net Assets
Related to Discontinued Operations | | Net Assets Held for Sale | | Net Assets
Related to Discontinued Operations |
| | | (in thousands) | | (in thousands) |
| Assets | | | | | | | | | | | | |
| Current assets | | | | | | | | | | | | |
| Accounts receivable, net | | $ | — |
| | $ | 3,198 |
| | $ | — |
| | $ | 1,971 |
| | $ | — |
| | $ | 3,198 |
|
| Oil inventory | | — |
| | 89 |
| | — |
| | 59 |
| | — |
| | 89 |
|
| Total current assets | | — |
| | 3,287 |
| | — |
| | 2,030 |
| | — |
| | 3,287 |
|
| Properties and equipment | | 168,218 |
| | 168,218 |
| | 129,093 |
| | 129,093 |
| | 168,218 |
| | 168,218 |
|
| Accumulated DD&A | | (19,969 | ) | | (19,969 | ) | | (12,534 | ) | | (12,534 | ) | |
| Accumulated Depreciation, Depletion and Amortization | | | (19,969 | ) | | (19,969 | ) |
| Total assets | | 148,249 |
| | 151,536 |
| | 116,559 |
| | 118,589 |
| | $ | 148,249 |
| | $ | 151,536 |
|
| | | | | | | | | | | | | |
| Liabilities | | | | | | | | | | | | |
| Current liabilities | | | | | | | | | | | | |
| Accounts payable | | — |
| | 1,907 |
| | — |
| | 1,630 |
| | — |
| | 1,907 |
|
| Production tax liability | | — |
| | 262 |
| | — |
| | 120 |
| | — |
| | 262 |
|
| Total current liabilities | | — |
| | 2,169 |
| | — |
| | 1,750 |
| | — |
| | 2,169 |
|
| Asset retirement obligation | | 2,022 |
| | 2,022 |
| | 2,644 |
| | 2,644 |
| | 2,022 |
| | 2,022 |
|
| Total liabilities | | $ | 2,022 |
| | $ | 4,191 |
| | $ | 2,644 |
| | $ | 4,394 |
| | $ | 2,022 |
| | $ | 4,191 |
|
| | | | | | | | | | | | | |
| Net assets | | $ | 146,227 |
| | $ | 147,345 |
| | $ | 113,915 |
| | $ | 114,195 |
| | $ | 146,227 |
| | $ | 147,345 |
|
| | | | | | | | | | | | | |
PETROLEUM DEVELOPMENT CORPORATION
(dba PDC Energy)ENERGY, INC.
NOTES TO CONSOLIDATED FINANCIAL STATEMENTS - Continued
The following table presents statement of operations data related to our discontinued operations.operations:
| | | | | Year Ended December 31, | | Year Ended December 31, |
| Statements of Operations - Discontinued Operations | | 2011 | | 2010 | | 2009 | | 2012 | | 2011 | | 2010 |
| | | (in thousands) | | (in thousands) |
| Revenues | | | | | | | | | | | | |
| Natural gas, NGL and crude oil sales | | $ | 27,552 |
| | $ | 11,130 |
| | $ | 7,851 |
| |
| Natural gas, NGLs and crude oil sales | | | $ | 4,456 |
| | $ | 27,552 |
| | $ | 11,130 |
|
| Sales from natural gas marketing | | — |
| | 3,328 |
| | 5,040 |
| | — |
| | — |
| | 3,328 |
|
| Natural gas and crude oil well drilling | | — |
| | — |
| | 193 |
| |
| Well operations, pipeline income and other | | 128 |
| | 560 |
| | 951 |
| | 34 |
| | 128 |
| | 560 |
|
| Total revenues | | 27,680 |
| | 15,018 |
| | 14,035 |
| | 4,490 |
| | 27,680 |
| | 15,018 |
|
| | | | | | | | | | | | | |
| Costs, expenses and other | | | | | | | | | | | | |
| Production costs | | 8,529 |
| | 4,303 |
| | 2,643 |
| | 1,668 |
| | 8,365 |
| | 4,215 |
|
| Cost of natural gas marketing | | — |
| | 3,265 |
| | 4,916 |
| | — |
| | — |
| | 3,265 |
|
| Exploration expense | | 36 |
| | 135 |
| | 613 |
| |
| Impairment of natural gas and crude oil properties | | — |
| | 4,666 |
| | 3,171 |
| | — |
| | — |
| | 4,666 |
|
| Depreciation, depletion and amortization | | | — |
| | 6,247 |
| | 2,967 |
|
| Accretion of asset retirement obligations and other | | | — |
| | 200 |
| | 223 |
|
| Gain on sale of properties and equipment | | (3,854 | ) | | — |
| | — |
| | (19,920 | ) | | (3,854 | ) | | — |
|
| Depreciation, depletion and amortization | | 6,247 |
| | 2,967 |
| | 4,249 |
| |
| Total costs, expenses and other | | 10,958 |
| | 15,336 |
| | 15,592 |
| | (18,252 | ) | | 10,958 |
| | 15,336 |
|
| | | | | | | | | | | | | |
| Income (loss) from discontinued operations | | 16,722 |
| | (318 | ) | | (1,557 | ) | | 22,742 |
| | 16,722 |
| | (318 | ) |
| Provision (benefit) for income taxes | | 6,363 |
| | (214 | ) | | (582 | ) | |
| Provision for income taxes | | | (8,668 | ) | | (6,363 | ) | | 214 |
|
| Income (loss) from discontinued operations, net of tax | | $ | 10,359 |
| | $ | (104 | ) | | $ | (975 | ) | | $ | 14,074 |
| | $ | 10,359 |
| | $ | (104 | ) |
| | | | | | | | | | | | | |
Permian Basin. In October 2011, we developed a plan to divest our Permian Basin asset group. The plan includes 100% of our Permian Basin assets, consisting of producing wells and undeveloped leaseholds. During the fourth quarter of 2011, we completed the sale of our non-core Permian assets to unrelated third parties for a total of $13.2 million. On$13.2 million. Additionally, on December 20, 2011, we executed a purchase and sale agreement with COG Operating LLC (“COG”), a wholly owned subsidiary of Concho Resources Inc., an unrelated third party,third-party, for the sale of our core Permian Basin assets for a sale price of $173.9$173.9 million, subject to customary terms and adjustments, including adjustments based on title and environmental due diligence to be conducted by COG. The effective date of the closing istransaction was November 1, 2011. Accordingly,Following the sale to COG, we do not have significant continuing involvement in the operations of, or cash flows from, these assets; accordingly, the Permian assets were reclassified as held for sale as of December 31, 2011, and 2010, and the results of operations related to those assets have been separately reported as discontinued operations in the consolidated statementsstatement of operations in 2010, year of acquisition, and 2011.for all periods presented. On February 28, 2012, the divestiture closed withclosed. Upon final settlement, total proceeds received were $189.2 million after closing adjustments, resulting in a pre-tax gain on sale of $184.4$19.9 million after preliminary closing adjustments. See Note 18..
North DakotaDakota. .During the fourth quarter of 2010, we developed a plan to divest our North Dakota assets. The plan included 100% of our North Dakota assets, consisting of producing wells, undeveloped leaseholds and related facilities primarily located in Burke County. The plan received approval from our Board of Directors (the "Board") and, inIn December 2010, we effectedexecuted a letter of intent with an unrelated thirdthird-party for the sale of our North Dakota assets. In February 2011, we executed a purchase and sale agreement and subsequently closed with the same unrelated party. Proceeds from the sale were $9.5 million, net of our non-affiliated investor partners' share of $3.8 million, resulting in a pre-tax gain on sale of $3.9 million. Following the sale to the unrelated party, we do not have significant continuing involvement in the operations of, or cash flows from, these assets; accordingly, the North Dakota assets were reclassified as held for sale as of December 31, 2010, andassets. Accordingly, the results of operations related to thosethe North Dakota assets have been reported as discontinued operations in the consolidated statementstatements of operations in all periods presented. In Februaryfor 2011 we executed a purchase and sale agreement and subsequently closed with the same unrelated party. Proceeds from the sale were $9.5 million, net of non-affiliated investor partners' share of $3.8 million, resulting in a pretax gain on sale of $3.9 million.2010.
Michigan. During the third quarter of 2010, we divested our Michigan asset group and related liabilities for net cash proceeds of $22$22 million and realized a loss on sale of $4.7$4.7 million in the form of an impairment charge recorded during the year ended 2010 (see Note 26, Properties and Equipment, regarding the impairment charge). We do not have significant continuing involvement in the operations of or cash flows from this asset group. Accordingly, the Michigan assets were reclassified as held for sale as of December 31, 2010, and the results of operations related to the thoseMichigan assets have been reported as discontinued operations in the consolidated statement of operations for 2010 and 2009.2010.
Natural GasSee Note 19, Subsequent Events, for information regarding the planned sale of certain of our oil and Crude Oil Well Drilling Activities. We offered our last sponsored drilling partnership in October 2007. In January 2008, we first announced that we had no plans to sponsor a new drilling partnership in 2008 and this decision was upheld again in 2009. As of June 30, 2009, all remaining contractual drilling and completion obligations were completed for all partnerships and we did not have any plans in the foreseeable future to sponsor a drilling partnership; accordingly, we reclassified our natural gas and crude oil well drilling activities as discontinued operations.properties.
PETROLEUM DEVELOPMENT CORPORATION
(dba PDC Energy)ENERGY, INC.
NOTES TO CONSOLIDATED FINANCIAL STATEMENTS - Continued
NOTE 1415 - ACQUISITIONS
The following table presents the adjusted purchase price and the allocations thereof, based on our estimates of fair value, for the acquisition of natural gas and crude oil properties during 2012, 2011 and 2010.2010:
| | | | | Year Ended December 31, | | Year Ended December 31, |
| | | 2011 | | 2010 | | 2012 | | 2011 | | 2010 |
| | | Seneca-Upshur | | 2003/2002-D Partnerships | | 2005 Partnerships | | Permian | | 2004 Partnerships | | Merit (1) | | Seneca-Upshur | | 2003/2002-D Partnerships | | 2005 Partnerships | | Permian | | 2004
Partnerships |
| | | (in thousands) | | (in thousands) |
| | | | | | | | | | | | | | | | | | | | | | | |
| Total acquisition cost | | $ | 81,465 |
| | $ | 29,960 |
| | $ | 43,015 |
| | $ | 114,273 |
| | $ | 34,768 |
| | $ | 304,643 |
| | $ | 69,618 |
| | $ | 29,960 |
| | $ | 43,015 |
| | $ | 114,273 |
| | $ | 34,768 |
|
| | | | | | | | | | | | | | | | | | | | | | | |
| Recognized amounts of identifiable assets acquired and liabilities assumed: | | | | | | | | | | | | | | | | | | | | | | |
| Assets acquired: | | | | | | | | | | | | | | | | | | | | | | |
| Natural gas and crude oil properties - proved | | $ | 20,175 |
| | $ | 27,940 |
| | $ | 39,825 |
| | $ | 45,592 |
| | $ | 32,730 |
| | $ | 180,259 |
| | $ | 20,175 |
| | $ | 27,940 |
| | $ | 39,825 |
| | $ | 45,592 |
| | $ | 32,730 |
|
| Natural gas and crude oil properties - unproved | | 60,965 |
| | — |
| | — |
| | 71,647 |
| | — |
| | 151,428 |
| | 49,100 |
| | — |
| | — |
| | 71,647 |
| | — |
|
| Other assets | | 10,196 |
| | 3,455 |
| | 3,848 |
| | — |
| | 3,396 |
| | 3,631 |
| | 10,196 |
| | 3,455 |
| | 3,848 |
| | — |
| | 3,396 |
|
| Total assets acquired | | 91,336 |
| | 31,395 |
| | 43,673 |
| | 117,239 |
| | 36,126 |
| | 335,318 |
| | 79,471 |
| | 31,395 |
| | 43,673 |
| | 117,239 |
| | 36,126 |
|
| Liabilities assumed: | | | | | | | |
|
| | | | | | | | | | | | | | |
| Asset retirement obligation | | 8,175 |
| | 497 |
| | 300 |
| | 2,351 |
| | 912 |
| | 13,870 |
| | 8,157 |
| | 497 |
| | 300 |
| | 2,351 |
| | 912 |
|
| Environmental liability | | — |
| | — |
| | — |
| | 615 |
| | 126 |
| |
| Other accrued expenses | | | 10,100 |
| | — |
| | — |
| | — |
| | 615 |
| | 126 |
|
| Other liabilities | | 1,696 |
| | 938 |
| | 358 |
| | — |
| | 320 |
| | 6,705 |
| | 1,696 |
| | 938 |
| | 358 |
| | — |
| | 320 |
|
| Total liabilities assumed | | 9,871 |
| | 1,435 |
| | 658 |
| | 2,966 |
| | 1,358 |
| | 30,675 |
| | 9,853 |
| | 1,435 |
| | 658 |
| | 2,966 |
| | 1,358 |
|
| Total identifiable net assets acquired | | $ | 81,465 |
| | $ | 29,960 |
| | $ | 43,015 |
| | $ | 114,273 |
| | $ | 34,768 |
| | $ | 304,643 |
| | $ | 69,618 |
| | $ | 29,960 |
| | $ | 43,015 |
| | $ | 114,273 |
| | $ | 34,768 |
|
| | | | | | | | | | | | | | | | | | | | | | | |
___________
(1) Assets acquired and liabilities assumed in the Merit Acquisition are subject to post-closing adjustments as more detailed analyses are completed and additional information is obtained about the acquired natural gas and crude oil properties.
The fair value measurements of assets acquired and liabilities assumed are based on inputs that are not observable in the market and therefore represent Level 3 inputs. The fair values of oil and natural gas properties and asset retirement obligations were measured using valuation techniques that convert future cash flows to a single discounted amount. Significant inputs to the valuation of oil and natural gas properties include estimates of reserves, future operating and development costs, future commodity prices, estimated future cash flows and a market-based weighted-average cost of capital rate. These inputs require significant judgments and estimates by management at the time of the valuation and are the most sensitive and subject to change.
2012 Acquisitions
Merit Acquisition. On June 29, 2012, we completed the acquisition of certain Wattenberg Field oil and natural gas properties, leasehold mineral interests and related assets located in Weld, Adams and Boulder Counties, Colorado from affiliates of Merit Energy, an unrelated third-party. The aggregate purchase price of these properties was approximately $304.6 million, after post-closing adjustments. We financed the purchase with cash from the May 2012 offering of our common stock and a draw on our revolving credit facility.
This acquisition was accounted for under the acquisition method of accounting. Accordingly, we conducted assessments of net assets acquired and recognized amounts for identifiable assets acquired and liabilities assumed at their estimated acquisition date fair values, while transaction and integration costs associated with the acquisition were expensed as incurred.
Pro Forma Information. The results of operations for the Merit Acquisition have been included in our consolidated financial statements since the June 29, 2012 closing date, including approximately $11.4 million of total revenue and $9.5 million of income from operations. The following unaudited pro forma financial information presents a summary of the consolidated results of operations for the years ended December 31, 2012 and December 31, 2011, assuming the Merit Acquisition had been completed as of January 1, 2011, including adjustments to reflect the values assigned to the net assets acquired. The pro forma financial information is not necessarily indicative of the results of operations that would have been achieved if the Merit Acquisition had been effective as of these dates, or of future results.
PDC ENERGY, INC.
NOTES TO CONSOLIDATED FINANCIAL STATEMENTS - Continued
|
| | | | | | | |
| | Year Ended December 31, |
| | 2012 | | 2011 |
| | (in thousands, except per share amounts) |
| | | | |
| Total revenues | $ | 370,488 |
| | $ | 438,204 |
|
| Total costs, expenses and other | 521,178 |
| | 366,120 |
|
Net income (loss)
| $ | (119,343 | ) | | $ | 45,688 |
|
| | | | |
Earnings per share:
| | | |
| Basic | $ | (4.31 | ) | | $ | 1.94 |
|
| Diluted | $ | (4.31 | ) | | $ | 1.91 |
|
2011 Acquisitions
Seneca-Upshur. In October 2011, PDCM acquired from an unrelated third-party 100% of the membership interests of Seneca-Upshur Petroleum, LLC ("Seneca-Upshur") for a purchase price of $139.2 million ($69.6 million net to PDC), after post-closing adjustments, which was funded by capital contributions by PDCM's investing partners and a draw on PDCM's revolving credit facility. Substantially all of the acreage acquired is held by production, prospective for the Marcellus Shale and is in close proximity to PDCM's existing properties. Following the closing, several title defects were discovered that were not cured by the seller within the time specified by the purchase and sale agreement. Accordingly, PDCM received title defect payments during 2012 totaling $28.9 million, of which $14.5 million represents our share, the effect of which is reflected in the purchase price noted above.
2003/2002-D Partnerships. In October 2011, we acquired from non-affiliated investor partners the remaining working interest in five of our affiliated partnerships: PDC 2002-D Limited Partnership, PDC 2003-A Limited Partnership, PDC 2003-B Limited Partnership and PDC 2003-C Limited Partnership and (the "2002/2003 Partnerships"). We purchased the 2002/2003 Partnerships for an aggregate amount of $30 million, which was funded from our revolving credit facility. These purchases included the non-affiliated investor partners' remaining working interests in wells located in the Wattenberg Field and Piceance Basin.
2005 Partnerships. In June 2011, we acquired from non-affiliated investor partners the remaining working interest in three of our affiliated partnerships: PDC 2005-A Limited Partnership, PDC 2005-B Limited Partnership and Rockies Region Private Limited Partnership (the "2005 Partnerships"). We purchased the 2005 Partnerships for an aggregate amount of $43 million, which was funded from our revolving credit facility. These purchases included the non-affiliated investor partners' remaining working interests wells located in the Wattenberg Field and Piceance Basin.
Pro Forma Information. The results of operations for the aboveSeneca-Upshur, 2002/2003 Partnerships and 2005 Partnerships acquisitions have been included in our consolidated financial statements from the daterespective dates of acquisition. Pro forma information is not presented as the pro forma results would not be materially different from the information presented in the accompanying statements of operations.
2011 Acquisitions
Seneca-Upshur. In October 2011, PDCM acquired from an unrelated third party 100% of the membership interests of Seneca-Upshur Petroleum, LLC ("Seneca-Upshur"), a West Virginia limited liability company, for the purchase price of $162.9 million ($81.5 million net to PDC), including a post-closing working capital adjustment of $10.4 million. Pursuant to the terms of the purchase agreement, there will be certain post-closing adjustments through April 1, 2012, including with respect to title, environmental and plugging and abandonment matters. In conformity with the transaction, the Company took over certain ordinary course litigation. However, the seller retained certain specific litigation matters. The acquisition included approximately 1,340 wells producing from the shallow Devonian Shale and Mississippian formations and all rights and depths to an estimated 100,000 net acres in West Virginia, of which 90,000 acres are prospective for the Marcellus Shale. We estimate that the acquisition added approximately 8 Bcfe to our total proved reserves as of December 31, 2011. Substantially all of the acreage acquired is held by production, prospective for the Marcellus Shale and is in close proximity to PDCM's existing properties.
2003/2002-D Partnerships. On October 28, 2011, we acquired from non-affiliated investor partners' the remaining working interest in five of our affiliated partnerships: PDC 2003-A Limited Partnership, PDC 2003-B Limited Partnership, PDC 2003-C Limited Partnership, PDC 2003-D Limited Partnership and PDC 2002-D Limited Partnership ("2003/2002-D Partnerships"). We purchased these partnerships for an aggregate amount of $30 million, which was funded from our corporate credit facility during the fourth quarter of 2011. These purchases included the non-affiliated investor partners remaining working interests in a total of 153 gross, 99.7 net, wells located in Wattenberg and Piceance. The acquisitions allow us the opportunity, assuming favorable capital and commodity markets, to accelerate the pace of refracturing the wells acquired, thus allowing us to optimize revenue opportunities.
2005 Partnerships. On June 15, 2011, we acquired from non-affiliated investor partners' the remaining working interest in three of our affiliated partnerships: PDC 2005-A Limited Partnership, PDC 2005-B Limited Partnership and Rockies Region Private Limited Partnership ("2005 Partnerships"). We purchased these partnerships for an aggregate amount of $43.0 million, which was funded from our corporate credit facility during the third quarter of 2011. These purchases included the non-affiliated investor partners' remaining working interests in a total of 146 gross, 104.5 net, wells located in Wattenberg and Piceance. The acquisitions allow us the opportunity, assuming favorable capital and commodity markets, to accelerate the pace of refracturing the wells acquired, thus allowing us to optimize revenue opportunities.
PETROLEUM DEVELOPMENT CORPORATION
(dba PDC Energy)
NOTES TO CONSOLIDATED FINANCIAL STATEMENTS - Continued
2010 Acquisitions
2004 Partnerships. In December 2010, we acquired the remaining working interest in four of our affiliated partnerships: PDC 2004-A Limited Partnership, PDC 2004-B Limited Partnership, PDC 2004-C Limited Partnership and PDC 2004-D Limited Partnership.Partnership (the “2004 Partnerships”). We purchased these partnerships for an aggregate amount of $36.5 million.$36.5 million, which was funded from our revolving credit facility. These purchases included the remaining working interests in a total of 122 gross, 88.6 net, wells located in the Wattenberg Field and Piceance. The acquisitions allowed us the opportunity to accelerate the pace of refracturing the wells acquired, thus allowing us to optimize revenue opportunities.Piceance Basin.
Permian Basin. In July 2010, we acquired various producing assets located in the Wolfberry Trend in the Permian Basin in West Texas.Texas (the “Wolfberry Assets”). In conjunction with the divestiture of our Michigan asset group, we entered into a like-kind exchange agreement in accordance with IRC Section 1031, with a qualified intermediary. The Wolfberry assetsAssets were identified as our replacement property in accordance with IRC Section 1031. Sales proceeds in the amount of $19.3$19.3 million from the Michigan divestiture were transferred directly to the qualified intermediary and, along with $55.7$55.7 million from our revolving credit facility, funded the ourpurchase of the Wolfberry acquisition.Assets. The sale of our Michigan assets resulted in a gain for income tax purposes of $19.2$19.2 million, which then resulted in a tax liability of $7.3 million.$7.3 million. With the favorable deferral aspects of IRC Section 1031, we were able to defer $6.5$6.5 million of this tax liability.
In November 2010, we acquired for $39.4$39.4 million in cash a second position in the Wolfberry oil trend, including 100% of the interest in producing assets and undeveloped acreage. The assets included seven producing wells that are located on a primarily contiguous 5,760 net acre block.
See Note 13Pro Forma Information. The results of operations for a discussionthe 2004 Partnerships and Wolfberry Assets acquisition have been included in our consolidated financial statements from the respective dates of acquisition. Pro forma information is not presented as the divestiturepro forma results would not be materially different from the information presented in the accompanying statements of our Permian assets.operations.
PDC ENERGY, INC.
NOTES TO CONSOLIDATED FINANCIAL STATEMENTS - Continued
NOTE 1516 - NONCONTROLLING INTEREST IN SUBSIDIARY
In 2007, we contributed $0.8$0.8 million for a 50% interest in WWWV, LLC (the "LLC"), a limited liability company for which we serveserved as the managing member. The LLC's only asset was an aircraft and was formed for the purpose of owning and operating the aircraft. We consolidated the entity based on a controlling financial interest. In 2011, we divested the asset and dissolved the entity with no material impact on our financial statements.
NOTE 1617 - TRANSACTIONS WITH AFFILIATES
Former Executive Officer. In June 2011, Richard W. McCullough resigned from his positions as our Chief Executive Officer and the Chairman of the Board, effective immediately. In connection with his resignation, in July 2011, Mr. McCullough and the Company executed a separation agreement, whereby Mr. McCullough will receive those benefits to which he was entitled under Section 7(d) of his employment agreement, dated as of April 19, 2010, including without limitation: (i)limitation, separation compensation in the amount of $4.1$4.1 million, less required withholdings; (ii)withholdings, his annual non-qualified deferred supplemental retirement benefit equal to $30,000$30,000 for each of the years 2012 through 2021 (not accelerated), less required withholdings; (iii)withholdings, continued coverage under the Company’s group health plans at the Company’s cost for a period equal to the lesser of 18 months or such period ending as of the date Mr. McCullough is eligible to participate in another employer’s group health plan; (iv)plan, immediate vesting of any unvested Company stock options, SARs and restricted stock;stock and (v) issuance of shares representing the vested portion of his 2009 performance share awards. Related to this separation agreement, the statement of operations for 2011 reflects a charge to general and administrative expense of $6.7 million.$6.7 million.
PDCM and Affiliated Partnerships. Our Gas Marketing segment markets the natural gas produced by PDCM and our affiliated partnerships in the Eastern Operating Region. Our sales from natural gas marketing include $1.3 million, $0.7 million and $0.5 million in 2011, 2010 and 2009, respectively, related to the marketing of natural gas on behalf of our affiliated partnerships. Our cost of natural gas marketing include $1.3 million, $0.6 million and $0.5 million in 2011, 2010 and 2009, respectively, related to these sales.
Amounts due from/to the affiliated partnerships are primarily related to derivative positions and, to a lesser extent, unbilled well lease operating expenses, and costs resulting from audit and tax preparation services. We have entered into derivative instruments on behalf of our affiliated partnerships for their estimated production. As of December 31, 2011 and 2010, we had a payable to affiliates of $14.2 million and $20.3 million, respectively, representing their designated portion of the fair value of our gross derivative assets and a receivable from affiliates of $6.2 million and $14.6 million, respectively, representing their designated portion of the fair value of our gross derivative liabilities.
We provide well operations and pipeline services toThe following table presents amounts included in our affiliated partnerships. The majority of all of our revenue and expenses related to well operations and pipeline income are associated with services provided to our affiliated partnerships. Further, through June 2009, we provided natural gas and crude oil well drilling services to our affiliated partnerships. For the year ended December 31, 2009, we recognized $0.2 million in revenue related to these services, which have been reclassified on ourconsolidated statement of operations for inclusion in discontinued operations. See Note 13.
PDCM. Our Gas Marketing segment markets the natural gas produced by PDCM. Our sales from natural gas marketing include $9.7 million and $4.3 million 2011 and 2010, respectively, related to the marketing of natural gas on behalf of PDCM. Our cost of natural gas marketing include $9.5 millionPDCM and $4.2 millionour affiliated partnerships and amounts included in 2011 and 2010, respectively,our consolidated balance sheet related to these sales.the derivative instruments we entered into on behalf of our affiliated partnerships:
PETROLEUM DEVELOPMENT CORPORATION
(dba PDC Energy)
NOTES TO CONSOLIDATED FINANCIAL STATEMENTS - Continued
|
| | | | | | | | | | | |
| | As of/Year Ended December 31, |
| | 2012 | | 2011 | | 2010 |
| | (in thousands) |
| | | | | | |
| PDCM: | | | | | |
| Sales from natural gas marketing | $ | 11,105 |
| | $ | 9,735 |
| | $ | 4,298 |
|
| Cost of natural gas marketing | 10,888 |
| | 9,544 |
| | 4,214 |
|
| Affiliated Partnerships: | | | | | |
| Sales from natural gas marketing | 535 |
| | 1,276 |
| | 651 |
|
| Cost of natural gas marketing | 524 |
| | 1,251 |
| | 638 |
|
| Receivable from affiliates | 2,140 |
| | 6,163 |
| | 14,616 |
|
| Payable to affiliates | 4,707 |
| | 14,152 |
| | 20,342 |
|
| | | | | | |
We provide certain well operating and administrative services for PDCM. Amounts billed to PDCM for these services were $10.4$12.1 million, $10.4 million and $11.1$11.1 million in 2012, 2011 and 2010, respectively. Our statements of operations include only our proportionate share of these billings. The following table presents the statement of operations line item in which our proportionate share is recorded and the amount for each of the periods presented.
| | | | | Year Ended December 31, | | Year Ended December 31, |
| Statement of Operations Line Item | | 2011 | | 2010 | | 2012 | | 2011 | | 2010 |
| | | (in thousands) | | (in thousands) |
| | | | | | | | | | | |
| Production Costs | | $ | 3,441 |
| | $ | 3,862 |
| | $ | 3,945 |
| | $ | 3,441 |
| | $ | 3,862 |
|
| Exploration Expense | | 430 |
| | 883 |
| | 492 |
| | 430 |
| | 883 |
|
| General and Administrative Expense | | 1,543 |
| | 1,899 |
| | 1,630 |
| | 1,543 |
| | 1,899 |
|
PDC ENERGY, INC.
NOTES TO CONSOLIDATED FINANCIAL STATEMENTS - Continued
NOTE 1718 - BUSINESS SEGMENTS
We separate our operating activities into two segments: Oil and Gas Exploration and Production and Gas Marketing. All material inter-company accounts and transactions between segments have been eliminated.
Oil and Gas Exploration and Production. Our Oil and Gas Exploration and Production segment includes all of our natural gas and crude oil properties. The segment represents revenues and expenses from the production and sale of natural gas, NGLs and crude oil. Segment revenue includes natural gas, NGLNGLs and crude oil sales, commodity price risk management, net and well operation and pipeline income. Segment income (loss) consists of segment revenue less production cost, exploration expense, impairment of natural gas and crude oil properties, direct general and administrative expense and DD&A expense. Segment DD&A expense was $122.2$139.4 million, $122.2 million and $105.9 million in 2012, 2011 $105.9 million in 2010 and $123.2 million in 2009.2010, respectively.
Gas Marketing. Our Gas Marketing segment purchases, aggregates and resells natural gas produced by us and others. Segment income (loss) primarily represents sales from natural gas marketing and direct interest income less costs of natural gas marketing and direct general and administrative expense.
Unallocated amounts. Unallocated income includes unallocated other revenue, less corporate general administrative expense, corporate DD&A expense, interest income and interest expense.
PETROLEUM DEVELOPMENT CORPORATION
(dba PDC Energy)
NOTES TO CONSOLIDATED FINANCIAL STATEMENTS - Continued
The following tables present our segment information.information:
| | | | 2011 | | 2010 | | 2009 | 2012 | | 2011 | | 2010 |
| | (in thousands) | (in thousands) |
| Year Ended December 31, | | | | | | | | | | |
| Revenues: | | | | | | | | | | |
| Oil and Gas Exploration and Production | $ | 329,541 |
| | $ | 273,950 |
| | $ | 171,262 |
| $ | 309,054 |
| | $ | 329,541 |
| | $ | 273,950 |
|
| Gas Marketing | 66,419 |
| | 69,071 |
| | 59,595 |
| 47,079 |
| | 66,419 |
| | 69,071 |
|
| Unallocated | — |
| | — |
| | 19 |
| |
| Total Revenues | $ | 395,960 |
| | $ | 343,021 |
| | $ | 230,876 |
| $ | 356,133 |
| | $ | 395,960 |
| | $ | 343,021 |
|
| | | | | | | | | | | |
| Segment income (loss) from continuing operations before income taxes: | | | | | | | | | | |
| Oil and Gas Exploration and Production | $ | 106,832 |
| | $ | 84,387 |
| | $ | (34,382 | ) | $ | (96,293 | ) | | $ | 106,832 |
| | $ | 84,387 |
|
| Gas Marketing | 954 |
| | 1,063 |
| | 1,967 |
| 528 |
| | 954 |
| | 1,063 |
|
| Unallocated | (104,891 | ) | | (78,760 | ) | | (92,757 | ) | (137,856 | ) | | (104,891 | ) | | (78,760 | ) |
| Total | $ | 2,895 |
| | $ | 6,690 |
| | $ | (125,172 | ) | $ | (233,621 | ) | | $ | 2,895 |
| | $ | 6,690 |
|
| | | | | | | | | | | |
| Expenditures for segment long-lived assets: | | | | | | | | | | |
| Oil and Gas Exploration and Production | $ | 479,027 |
| | $ | 319,268 |
| | $ | 140,431 |
| $ | 656,443 |
| | $ | 479,027 |
| | $ | 319,268 |
|
| Unallocated | 1,363 |
| | 1,506 |
| | 2,602 |
| 3,509 |
| | 1,363 |
| | 1,506 |
|
| Total | $ | 480,390 |
| | $ | 320,774 |
| | $ | 143,033 |
| $ | 659,952 |
| | $ | 480,390 |
| | $ | 320,774 |
|
| | | | | | | | | | | |
| As of December 31, | | | | | | | | | | |
| Segment assets: | | | | | | | | | | |
| Oil and Gas Exploration and Production | $ | 1,461,130 |
| | $ | 1,202,474 |
| | | $ | 1,723,011 |
| | $ | 1,461,130 |
| | |
| Gas Marketing | 14,713 |
| | 16,338 |
| | | 11,090 |
| | 14,713 |
| | |
| Unallocated | 73,913 |
| | 53,701 |
| | | 92,747 |
| | 73,913 |
| | |
| Assets held for sale | 148,249 |
| | 116,522 |
| | | — |
| | 148,249 |
| | |
| Total Assets | $ | 1,698,005 |
| | $ | 1,389,035 |
| | | $ | 1,826,848 |
| | $ | 1,698,005 |
| | |
| | | | | | | | | | | |
NOTE 1819 - SUBSEQUENT EVENT
In October 2011,On February 4, 2013, we announced our intention to divest our acreage located in the Wolfberry Trend in the Permian Basin in West Texas to refocus our efforts in our horizontal drilling programs and to provide funds for our 2012 capital program. On December 20, 2011, we executedentered into a purchase and salessale agreement with COGcertain affiliates of Caerus Oil and Gas LLC (“Caerus”), pursuant to which we have agreed to sell to Caerus our Piceance Basin, NECO and certain non-core Colorado oil and gas properties, leasehold mineral interests and related assets, including derivatives, for the saleaggregate cash consideration of approximately $200 million, subject to post-closing adjustments. The assets being sold do not include any of our Permian Basin Wolfberry assets for a total price of $173.9 million,core Wattenberg Field acreage. The cash consideration is subject to customary post-closing adjustments. The transaction closed on February 28, 2012 with total proceeds received of $184.4 million after preliminary closing adjustments. The proceeds from the saleadjustments, including adjustments based upon title and environmental due diligence, and by certain firm transportation obligations and natural gas hedging positions that will be used to pay down our corporate credit facility and provide liquidity to fund our 2012 capital budget. The divestiture is expected to provide us with capital funding to allow us to accelerate the development of our liquid-rich inventory of projectsassumed by Caerus. There can be no assurance we will be successful in the Wattenberg Field. Our Permian Basin assets were classified as held for sale as of December 31, 2011 and 2010, and the results of operations related to those assets were reported as discontinued operations in the consolidated statements of operations in 2010, year of acquisition, and 2011. See Note 13.closing such divestiture.
PETROLEUM DEVELOPMENT CORPORATION
(dba PDC Energy)ENERGY, INC.
SUPPLEMENTAL INFORMATION - UNAUDITED
NATURAL GAS AND CRUDE OIL INFORMATION - UNAUDITED
Net Proved Reserves
All of our natural gas, NGLNGLs and crude oil reserves are located in the U.S. We utilize the services of independent petroleum engineers to estimate our natural gas, crude oil, condensate and NGL reserves. As of December 31, 20112012, 2011 and 2010, all of our reserve estimates were based on a reserve reportreports prepared by Ryder Scott Company, L.P. ("Ryder Scott"). These reserve estimates have been prepared in compliance with professional standards and the reserves definitions prescribed by the SEC.
Proved reserves estimates may change, either positively or negatively, as additional information becomes available and as contractual, economic and political conditions change. Our net proved reserve estimates have been adjusted as necessary to reflect all contractual agreements, royalty obligations and interests owned by others at the time of the estimate. Proved developed reserves are the quantities of natural gas, NGLNGLs and crude oil expected to be recovered through existing wells with existing equipment and operating methods. In some cases, proved undeveloped reserves may require substantial new investments in additional wells and related facilities.
The price used to estimate our reserves, by commodity, are presented below.
| |
| | Price Used to Estimate Reserves | | Price Used to Estimate Reserves |
| As of December 31, | | Natural Gas (per Mcf) | | NGLs (per Bbl) | | Crude Oil (per Bbl) | | Natural Gas (per Mcf) | | NGLs (per Bbl) | | Crude Oil (per Bbl) |
| | | | | | | | | | | | | |
| 2012 | | | $ | 2.35 |
| | $ | 28.02 |
| | $ | 87.51 |
|
| 2011 | | $ | 3.41 |
| | $ | 39.59 |
| | $ | 88.94 |
| | 3.41 |
| | 39.59 |
| | 88.94 |
|
| 2010 | | 3.54 |
| | 34.12 |
| | 71.95 |
| | 3.54 |
| | 34.12 |
| | 71.95 |
|
| 2009 (1) | | 3.17 |
| | — |
| | 54.64 |
| |
__________
| |
(1) | Prior to 2010, NGLs were included in natural gas, which impacts the comparability for 2011 and 2010 to 2009. |
PETROLEUM DEVELOPMENT CORPORATION
(dba PDC Energy)ENERGY, INC.
The following tables present the changes in our estimated quantities of proved reserves.reserves:
| | | | Natural Gas (MMcf) | | NGLs (MBbls) (1) | | Crude Oil, Condensate (MBbls) | | Total (MMcfe) | Natural Gas (MMcf) | | NGLs (MBbls) | | Crude Oil, Condensate (MBbls) | | Total (MMcfe) |
| Proved Reserves: | | | | | | | | | | | | | | |
| Proved reserves, January 1, 2009 | 662,857 |
| | — |
| | 15,037 |
| | 753,079 |
| |
| Proved reserves, January 1, 2010 | | 608,925 |
| | — |
| | 18,070 |
| | 717,345 |
|
| Revisions of previous estimates | (101,923 | ) | | — |
| | 2,957 |
| | (84,181 | ) | 6,504 |
| | 8,908 |
| | (85 | ) | | 59,442 |
|
| Extensions, discoveries and other additions |
| |
| |
| |
|
| |
| |
| |
|
| Western Operating Region | 79,574 |
| | — |
| | 1,322 |
| | 87,506 |
| 56,524 |
| | 811 |
| | 2,247 |
| | 74,872 |
|
| Eastern Operating Region | 3,190 |
| | — |
| | — |
| | 3,190 |
| 35,092 |
| | — |
| | — |
| | 35,092 |
|
| Purchases of reserves |
| |
| |
| |
|
| |
| |
| |
|
| Western Operating Region | 648 |
| | — |
| | 47 |
| | 930 |
| 20,920 |
| | 1,531 |
| | 4,367 |
| | 56,308 |
|
| Eastern Operating Region | 59 |
| | — |
| | — |
| | 59 |
| 220 |
| | — |
| | — |
| | 220 |
|
| Other | 63 |
| | — |
| | — |
| | 63 |
| — |
| | — |
| | — |
| | — |
|
| Dispositions | (7 | ) | | — |
| | (1 | ) | | (13 | ) | |
| Production | (35,536 | ) | | — |
| | (1,292 | ) | | (43,288 | ) | |
| Proved reserves, December 31, 2009 | 608,925 |
| | — |
| | 18,070 |
| | 717,345 |
| |
| Revisions of previous estimates | 6,504 |
| | 8,908 |
| | (85 | ) | | 59,442 |
| |
| Extensions, discoveries and other additions |
| |
| |
| |
| |
| Western Operating Region | 56,524 |
| | 811 |
| | 2,247 |
| | 74,872 |
| |
| Eastern Operating Region | 35,092 |
| | — |
| | — |
| | 35,092 |
| |
| Purchases of reserves |
| |
| |
| |
| |
| Western Operating Region | 20,920 |
| | 1,531 |
| | 4,367 |
| | 56,308 |
| |
| Eastern Operating Region | 220 |
| | — |
| | — |
| | 220 |
| |
| Dispositions | (43,690 | ) | | — |
| | (55 | ) | | (44,020 | ) | (43,690 | ) | | — |
| | (55 | ) | | (44,020 | ) |
| Production | (27,189 | ) | | (601 | ) | | (1,308 | ) | | (38,643 | ) | (27,189 | ) | | (601 | ) | | (1,308 | ) | | (38,643 | ) |
| Proved reserves, December 31, 2010 | 657,306 |
| | 10,649 |
| | 23,236 |
| | 860,616 |
| 657,306 |
| | 10,649 |
| | 23,236 |
| | 860,616 |
|
| Revisions of previous estimates | (161,654 | ) | | 3,163 |
| | (1,904 | ) | | (154,100 | ) | (161,654 | ) | | 3,163 |
| | (1,904 | ) | | (154,100 | ) |
| Extensions, discoveries and other additions |
|
| |
|
| |
| |
|
|
| |
| |
| |
|
| Western Operating Region | 125,374 |
| | 5,633 |
| | 17,092 |
| | 261,724 |
| 125,374 |
| | 5,633 |
| | 17,092 |
| | 261,724 |
|
| Eastern Operating Region | 51,315 |
| | — |
| | — |
| | 51,315 |
| 51,315 |
| | — |
| | — |
| | 51,315 |
|
| Purchases of reserves |
|
| |
|
| |
| |
|
|
| |
| |
| |
|
| Western Operating Region | 24,776 |
| | 1,052 |
| | 1,581 |
| | 40,574 |
| 24,776 |
| | 1,052 |
| | 1,581 |
| | 40,574 |
|
| Eastern Operating Region | 7,985 |
| | — |
| | 24 |
| | 8,129 |
| 7,985 |
| | — |
| | 24 |
| | 8,129 |
|
| Dispositions | (2,070 | ) | | (94 | ) | | (435 | ) | | (5,244 | ) | (2,070 | ) | | (94 | ) | | (435 | ) | | (5,244 | ) |
| Production | (30,887 | ) | | (815 | ) | | (1,958 | ) | | (47,525 | ) | (30,887 | ) | | (815 | ) | | (1,958 | ) | | (47,525 | ) |
| Proved reserves, December 31, 2011 (2) | 672,145 |
| | 19,588 |
| | 37,636 |
| | 1,015,489 |
| |
| Proved reserves, December 31, 2011 (1) | | 672,145 |
| | 19,588 |
| | 37,636 |
| | 1,015,489 |
|
| Revisions of previous estimates | | (289,436 | ) | | (3,671 | ) | | (6,729 | ) | | (351,836 | ) |
| Extensions, discoveries and other additions | |
|
| |
|
| |
| |
|
|
| Western Operating Region | | 116,205 |
| | 11,637 |
| | 27,482 |
| | 350,919 |
|
| Eastern Operating Region | | 56,728 |
| | — |
| | — |
| | 56,728 |
|
| Purchases of reserves | |
|
| |
|
| |
| |
|
|
| Western Operating Region | | 87,189 |
| | 8,084 |
| | 10,801 |
| | 200,499 |
|
| Eastern Operating Region | | 23 |
| | — |
| | — |
| | 23 |
|
| Dispositions | | (6,406 | ) | | (1,970 | ) | | (7,854 | ) | | (65,350 | ) |
| Production | | (32,410 | ) | | (841 | ) | | (2,026 | ) | | (49,612 | ) |
| Proved reserves, December 31, 2012 (2) | | 604,038 |
| | 32,827 |
| | 59,310 |
| | 1,156,860 |
|
| | | | | | | | | | | | | | | |
|
| | | | | | | | | | | |
| Proved Developed Reserves, as of: | | | | | | | |
| January 1, 2009 | 297,041 |
| | — |
| | 5,438 |
| | 329,669 |
|
| December 31, 2009 | 258,375 |
| | — |
| | 6,244 |
| | 295,839 |
|
| December 31, 2010 | 227,341 |
| | 4,013 |
| | 8,287 |
| | 301,141 |
|
| December 31, 2011 (2) | 299,369 |
| | 11,753 |
| | 16,910 |
| | 471,347 |
|
| Proved Undeveloped Reserves, as of: | | |
| | | | |
| January 1, 2009 | 365,816 |
| | — |
| | 9,599 |
| | 423,410 |
|
| December 31, 2009 | 350,550 |
| | — |
| | 11,826 |
| | 421,506 |
|
| December 31, 2010 | 429,965 |
| | 6,636 |
| | 14,949 |
| | 559,475 |
|
| December 31, 2011 (2) | 372,776 |
| | 7,835 |
| | 20,726 |
| | 544,142 |
|
| | | | | | | | |
|
| | | | | | | | | | | |
| Proved Developed Reserves, as of: | | | | | | | |
| January 1, 2010 | 258,375 |
| | — |
| | 6,244 |
| | 295,839 |
|
| December 31, 2010 | 227,341 |
| | 4,013 |
| | 8,287 |
| | 301,141 |
|
| December 31, 2011 (1) | 299,369 |
| | 11,753 |
| | 16,910 |
| | 471,347 |
|
| December 31, 2012 (2) | 281,925 |
| | 14,353 |
| | 20,412 |
| | 490,515 |
|
| Proved Undeveloped Reserves, as of: | | |
| | | | |
| January 1, 2010 | 350,550 |
| | — |
| | 11,826 |
| | 421,506 |
|
| December 31, 2010 | 429,965 |
| | 6,636 |
| | 14,949 |
| | 559,475 |
|
| December 31, 2011 (1) | 372,776 |
| | 7,835 |
| | 20,726 |
| | 544,142 |
|
| December 31, 2012 (2) | 322,113 |
| | 18,474 |
| | 38,898 |
| | 666,345 |
|
| | | | | | | | |
__________
| |
| (1) | Prior to 2010, NGLs were included in natural gas, which impacts the comparability for 2011 and 2010 to 2009. |
| |
(2) | Includes estimated reserve data related to our Permian asset group, which was held for sale and under a purchase and sale agreement. The divestiture of our Permian assets closed on February 28, 2012. See Note 11, Commitments and Contingencies - Purchase and Sale Agreement, and Note 13,14, Assets Held for Sale, Divestitures and Discontinued Operations, to our consolidated financial statements included in this report for additional details related to the divestiture of our Permian asset group. Total proved reserves include included 6,242 MMcf of natural gas, 7,825 MBbls of crude oil 1,971and 1,970 MBbls of NGLs, and for an aggregate of 65,018 MMcfe of natural gas equivalent, related to our Permian asset group. Similarly, totalTotal proved developed reserves include related to those assets included 1,750 MMcf, 1,815 MBbls, 550 MBbls and 15,940 MMcfe, respectively, and proved undeveloped reserves include included 4,492 MMcf, 6,010 MBbls, 1,4211,420 MBbls and 49,078 MMcfe, respectively. |
| |
| (2) | Includes estimated reserve data related to our Piceance and NECO assets, which are expected to be divested pursuant to a purchase and sale agreement entered into on February 4, 2013. See Note 19, Subsequent Events, to our consolidated financial statements included elsewhere in this report for additional details related to the planned divestiture of our Piceance and NECO assets. Total proved reserves |
PETROLEUM DEVELOPMENT CORPORATION
(dba PDC Energy)ENERGY, INC.
include 83,656 MMcf of natural gas and 148 MBbls of crude oil, for an aggregate of 84,544 MMcfe of natural gas equivalent related to our Piceance and NECO assets. There were no proved undeveloped reserves attributable to the Piceance and NECO assets as of December 31, 2012.
| | | | Developed | | Undeveloped | | Total | Developed | | Undeveloped | | Total |
| | (MMcfe) | (MMcfe) |
| | | | | | | | | | | |
| Beginning proved reserves, January 1, 2010 | 295,839 |
| | 421,506 |
| | 717,345 |
| |
| Undeveloped reserves transferred to developed | 17,967 |
| | (17,967 | ) | | — |
| |
| Revisions of previous estimates | 16,782 |
| | 42,660 |
| | 59,442 |
| |
| Extensions, discoveries and other additions | 21,572 |
| | 88,392 |
| | 109,964 |
| |
| Purchases of reserves | 28,728 |
| | 27,800 |
| | 56,528 |
| |
| Dispositions | (41,104 | ) | | (2,916 | ) | | (44,020 | ) | |
| Production | (38,643 | ) | | — |
| | (38,643 | ) | |
| Ending proved reserves, December 31, 2010 | 301,141 |
| | 559,475 |
| | 860,616 |
| |
| Undeveloped reserves transferred to developed | 43,597 |
| | (43,597 | ) | | — |
| |
| Beginning proved reserves, January 1, 2011 | | 301,141 |
| | 559,475 |
| | 860,616 |
|
| Undeveloped reserves converted to developed | | 43,597 |
| | (43,597 | ) | | — |
|
| Revisions of previous estimates | 73,643 |
| | (227,743 | ) | | (154,100 | ) | 73,643 |
| | (227,743 | ) | | (154,100 | ) |
| Extensions, discoveries and other additions | 58,979 |
| | 254,060 |
| | 313,039 |
| 58,979 |
| | 254,060 |
| | 313,039 |
|
| Purchases of reserves | 46,756 |
| | 1,947 |
| | 48,703 |
| 46,756 |
| | 1,947 |
| | 48,703 |
|
| Dispositions | (5,244 | ) | | — |
| | (5,244 | ) | (5,244 | ) | | — |
| | (5,244 | ) |
| Production | (47,525 | ) | | — |
| | (47,525 | ) | (47,525 | ) | | — |
| | (47,525 | ) |
| Ending proved reserves, December 31, 2011 | 471,347 |
| | 544,142 |
| | 1,015,489 |
| 471,347 |
| | 544,142 |
| | 1,015,489 |
|
| Undeveloped reserves converted to developed | | 45,929 |
| | (45,929 | ) | | — |
|
| Revisions of previous estimates | | (109,909 | ) | | (241,927 | ) | | (351,836 | ) |
| Extensions, discoveries and other additions | | 67,787 |
| | 339,860 |
| | 407,647 |
|
| Purchases of reserves | | 81,253 |
| | 119,269 |
| | 200,522 |
|
| Dispositions | | (16,280 | ) | | (49,070 | ) | | (65,350 | ) |
| Production | | (49,612 | ) | | — |
| | (49,612 | ) |
| Ending proved reserves, December 31, 2012 | | 490,515 |
| | 666,345 |
| | 1,156,860 |
|
| | | | | | | | | | | |
20112012 Activity. In 2011,2012, we recorded a downward revision of our previous estimate of proved reserves of approximately 154352 Bcfe. The revision was primarily due to a decrease of approximately 4240 Bcfe due to lower gas pricing, mostly related to the Piceance Basin, approximately 6 Bcfe due to increased operating costs, approximately 46 Bcfe due to adjustments for geological reasons and approximately 17377 Bcfe was removed fromdue to the removal of certain proved undeveloped reserves to satisfycomply with the SEC's five yearfive-year rule. This was partially offset by an increase of approximately 3 Bcfe due to non-acquisition interest adjustments and approximately 14 Bcfe due to asset performance. Discoveries and extensions of approximately 408 Bcfe in 2012 are due to the drilling of 44 gross horizontal wells and the addition of new proved undeveloped reserves. Approximately 57 Bcfe were added in the Eastern Operating Region related to the Marcellus Shale and approximately 351 Bcfe were added in the Wattenberg Field, mostly related to the Niobrara formation. We acquired approximately 201 Bcfe of proved reserves, approximately 200 Bcfe due to an acquisition in the Wattenberg Field. We divested a total of 65 Bcfe in 2012, primarily our core Permian Basin assets. Based on the economic conditions on December 31, 2012, our approved development plan provided for the development of our remaining PUD reserves within five years of the date such reserves were initially recorded. Based on our decision to drill predominantly horizontal wells in 2012, our drilling program focused on locations that were not included in proved undeveloped reserves in the December 2011 reserve report. By focusing on non-PUD drilling locations in 2012, we were able to add considerable PUD reserves in the 2012 reserve report. In 2013, we anticipate the majority of our drilling to be focused on horizontal well locations that are included in our proved undeveloped reserves in the 2012 reserve report. Therefore, we expect to convert 15% to 20% of our PUDs to proved developed producing reserves in 2013. This level of capital spending is consistent with the most recent years.
2011 Activity. In 2011, we recorded a downward revision of our previous estimate of proved reserves of approximately 154 Bcfe. The revision was primarily due to a decrease of approximately 4 Bcfe due to lower gas pricing and approximately 173 Bcfe due to the removal of certain proved undeveloped reserves to comply with the SEC's five-year rule. This was partially offset by an increase of approximately 6 Bcfe due to increased efficiencies in operating costs, approximately 5 Bcfe due to non-acquisition interest adjustments and approximately 12 Bcfe due to asset performance. In addition, the “Revisions of previous estimates” line item includes a deduction in the “Undeveloped” column and an increase in the “Developed” column of approximately 125 Bcfe Bcfe. These reserves were transferedtransferred from proved undeveloped to proved developed as a result of the Company's determination that costs related to a refracture becomingbecame less significant as compared to the costs associated with drilling a new well. New discoveriesDiscoveries and extensions of approximately 313 Bcfe in 2011 are due to the drilling of 195 gross wells and the addition of new proved undeveloped reserves. Approximately 51 Bcfe were added in the Eastern Operating Region, approximately 262 Bcfe were added in the Western Operating Region (141(141 Bcfe in the Wattenberg Field, 80 Bcfe in the Piceance Basin and 41 Bcfe in the Permian Basin). We acquired approximately 49 Bcfe of proved reserves, approximately 8 Bcfe through acquisitions in the Eastern Operating Region, and approximately 41 Bcfe in the Western Operating Region (28(28 Bcfe were acquired in the Wattenberg Field and 13 Bcfe were acquired in the Piceance Basin) due to the repurchase of the 2003/2002-D and 2005 Partnerships as well as the purchase of interestinterests in some of our other existing properties. We divested a total of approximately 5 Bcfe in 2011.2011. This included the sale of 100% of of our North Dakota assets, or 2 Bcfe, to an unrelated third partythird-party and our non-core Permian Basin assets, or 3 Bcfe, to another unrelated third party. Based on the economic conditions on December 31, 2011, we are reasonably certain that we would develop the balance of our proved undeveloped reserves within five years.parties.
2010 Activity. In 2010, we revised our previous estimate of proved reserves upward by 59.4 Bcfe. The revision was primarily due to an increase of 55.6 Bcfe due to asset performance, 35.9 Bcfe due to higher commodity pricing, 28.1 Bcfe due to the impact of evaluating NGLs as a separate stream and 1.5 Bcfe due to interest adjustments. This was partially offset by a decrease of 58.7 Bcfe due to adjustments for reserve decreases for geological reasons or reclassification of prior period proved undeveloped reserves to probable reserves due to aging and 3 Bcfe due to increased operating costs. New discoveriesDiscoveries and extensions of 110 Bcfe in 2010 are due to drilling of 213 gross wells and the addition of new proved undeveloped reserves:
35.1 Bcfe were added in the Eastern Operating Region and 74.9 Bcfe were added in the Western Operating Region (29.4(29.4 Bcfe in Wattenberg Field, 36.2 Bcfe in the Piceance Basin, 9.1 Bcfe in the NECO area and 0.2 Bcfe in North Dakota) and Permian Basin. We acquired 56.5 Bcfe of proved reserves, approximately 32.6 Bcfe through two acquisitions in the Permian Basin, and 23.9 Bcfe in both the Western and Eastern Operating Regions due to the repurchase of the 2004 Partnerships as well as the purchase of interestinterests in some of our other existing properties. Of the 23.9 Bcfe, 12.8 Bcfe were acquired in the Wattenberg Field and 10.9 Bcfe were acquired in the Piceance Basin. Total dispositions of 44 Bcfe in 2010 includesincluded the deconsolidation of PDCM, or 28.9 Bcfe, and the sale of all of our Michigan assets, or 15.1 Bcfe, to an unaffiliated third party.third-party.
2009 Activity. In 2009, we revised our previous estimate of proved reserves downward by 84.2 Bcfe. The revision was primarily due to a decrease of 99.5 Bcfe due to lower commodity pricing and 45.1 Bcfe due to adjustments to reserves removed or reclassified due to new rules limiting proved undeveloped reserves locations to those scheduled to be drilled within the next five years. The downward adjustments were partially offset by an increase of 41.4 Bcfe due to decreased operating costs, 1 Bcfe due to interest adjustments and 17.9 Bcfe due to asset performance. New discoveries and extensions of 90.7 Bcfe in 2009 were due to drilling of 100 gross wells and the addition of new proved undeveloped reserves: 3.2 Bcfe in the Eastern Operating Region and 87.5 Bcfe in the Western Operating Region (13.7 Bcfe in Wattenberg Field, 73.3 Bcfe in the Piceance Basin and 0.5 Bcfe in North Dakota). We acquired 1.1 Bcfe of proved reserves through the purchase of interest in some of our existing properties. Reserves acquired were primarily in the Wattenberg Field, as were the reserves divested.
PETROLEUM DEVELOPMENT CORPORATION
(dba PDC Energy)
Results of Operations for Natural Gas and Crude Oil Producing Activities
The results of operations for natural gas and crude oil producing activities are presented below. The results include activities related to both continuing and discontinued operations and exclude activities related to natural gas marketing and well operations and pipeline services.
| |
| Year Ended December 31, | Year Ended December 31, |
| 2011 | | 2010 | | 2009 | 2012 | | 2011 | | 2010 |
| (in thousands) | (in thousands) |
| Revenue: |
| |
| |
|
| |
| |
|
| Natural gas, NGL and crude oil sales | $ | 304,157 |
| | $ | 216,159 |
| | $ | 179,093 |
| |
| Commodity price risk management gain (loss), net | 46,090 |
| | 59,891 |
| | (10,053 | ) | |
| Natural gas, NGLs and crude oil sales | | $ | 274,783 |
| | $ | 304,157 |
| | $ | 216,159 |
|
| Commodity price risk management gain, net | | 32,339 |
| | 46,090 |
| | 59,891 |
|
| 350,247 |
| | 276,050 |
| | 169,040 |
| 307,122 |
| | 350,247 |
| | 276,050 |
|
| Expenses: | | | | | | | | | | |
| Production costs | 77,614 |
| | 61,544 |
| | 57,825 |
| 77,537 |
| | 75,717 |
| | 60,121 |
|
| Exploration expense | 6,289 |
| | 20,291 |
| | 21,961 |
| 22,605 |
| | 6,289 |
| | 20,291 |
|
| Impairment of proved natural gas and oil properties | | 162,287 |
| | 25,159 |
| | 4,666 |
|
| Depreciation, depletion, and amortization | 128,458 |
| | 103,303 |
| | 125,415 |
| 146,879 |
| | 128,458 |
| | 103,303 |
|
| Impairment of proved natural gas and oil properties | 25,159 |
| | 4,666 |
| | 926 |
| |
| Accretion of asset retirement obligations | | 4,060 |
| | 1,897 |
| | 1,423 |
|
| Gain on sale of properties and equipment | (4,050 | ) | | (174 | ) | | (470 | ) | (24,273 | ) | | (4,050 | ) | | (174 | ) |
| 233,470 |
| | 189,630 |
| | 205,657 |
| 389,095 |
| | 233,470 |
| | 189,630 |
|
Results of operations for natural gas and crude oil producing
activities before provision for income taxes | 116,777 |
| | 86,420 |
| | (36,617 | ) | (81,973 | ) | | 116,777 |
| | 86,420 |
|
| | | | | | | | | | |
| Provision (benefit) for income taxes | 36,785 |
| | 5,937 |
| | (13,186 | ) | |
| Provision for income taxes | | 31,163 |
| | (36,785 | ) | | (5,937 | ) |
|
| |
| |
|
| |
| |
|
| Results of operations for natural gas and crude oil producing activities, excluding corporate overhead and interest costs | $ | 79,992 |
| | $ | 80,483 |
| | $ | (23,431 | ) | $ | (50,810 | ) | | $ | 79,992 |
| | $ | 80,483 |
|
|
| |
| |
|
| |
| |
|
Production costs include those costs incurred to operate and maintain productive wells and related equipment, including costs such as labor, repairs, maintenance, materials, supplies, fuel consumed, insurance, production and severance taxes and associated administrative expenses. DD&A expense includes those costs associated with capitalized acquisition, exploration and development costs, but does not include the depreciation applicable to support equipment. The provision for income taxes is computed using effective tax rates.
Costs Incurred in Natural Gas and Crude Oil Property Acquisition, Exploration and Development Activities
Costs incurred in natural gas and crude oil property acquisition, exploration and development are presented below.
| | | | Year Ended December 31, | Year Ended December 31, |
| | 2011 | | 2010 | | 2009 | 2012 | | 2011 | | 2010 |
| | (in thousands) | (in thousands) |
| Acquisition of properties: (1) | | | | | | | | | | |
| Proved properties | $ | 79,554 |
| | $ | 87,241 |
| | $ | 2,251 |
| $ | 105,303 |
| | $ | 79,554 |
| | $ | 87,241 |
|
| Unproved properties | 95,081 |
| | 84,636 |
| | 5,867 |
| 276,225 |
| | 95,081 |
| | 84,636 |
|
| Development costs (2) | 301,008 |
| | 138,018 |
| | 72,416 |
| 233,144 |
| | 301,008 |
| | 138,018 |
|
| Exploration costs: (3) | | | | | | | | | | |
| Exploratory drilling | 3,626 |
| | 21,223 |
| | 18,317 |
| 18,803 |
| | 3,626 |
| | 21,223 |
|
| Geological and geophysical | 1,846 |
| | 2,367 |
| | 1,788 |
| 1,925 |
| | 1,846 |
| | 2,367 |
|
| Total costs incurred | $ | 481,115 |
| | $ | 333,485 |
| | $ | 100,639 |
| $ | 635,400 |
| | $ | 481,115 |
| | $ | 333,485 |
|
| | | | | | | | | | | |
__________
| |
| (1) | Property acquisition costs - represent costs incurred to purchase, lease or otherwise acquire a property. |
| |
| (2) | Development costs - represents costs incurred to gain access to and prepare development well locations for drilling, to drill and equip development wells, recompletionsrecomplete wells and to provide facilities to extract, treat, gather and store natural gas, NGLs and crude oil. Of these costs incurred for the years ended December 31, 2012, 2011 and 2010, 2010$62.0 million, $80.6 million and 2009, $80.6$37.4 million $37.4 million and $44.4 million,, respectively, were incurred to convert proved undeveloped reserves to proved developed reserves from the prior year end. |
| |
| (3) | Exploration costs - represents costs incurred in identifying areas that may warrant examination and in examining specific areas that are considered to have prospects of containing natural gas, NGLNGLs and crude oil reserves.oil. |
PETROLEUM DEVELOPMENT CORPORATION
(dba PDC Energy)
Capitalized Costs Related to Natural Gas and Crude Oil Producing Activities
Aggregate capitalized costs related to natural gas and crude oil exploration and production activities with applicable accumulated DD&A are presented below:
| | | | As of December 31, | As of December 31, |
| | 2011 | | 2010 | 2012 | | 2011 |
| | (in thousands) | (in thousands) |
| | | | | | | |
Proved natural gas and crude oil properties (1) | $ | 1,694,847 |
| | $ | 1,481,191 |
| $ | 2,075,924 |
| | $ | 1,694,847 |
|
| Unproved natural gas and crude oil properties | 102,466 |
| | 85,502 |
| 319,327 |
| | 102,466 |
|
| Capitalized costs | | 2,395,251 |
| | 1,797,313 |
|
| Less accumulated DD&A | | (905,458 | ) | | (621,074 | ) |
| Capitalized costs, net | | $ | 1,489,793 |
| | $ | 1,176,239 |
|
| | 1,797,313 |
| | 1,566,693 |
| | | |
| Less accumulated DD&A | 621,074 |
| | 492,501 |
| |
| | $ | 1,176,239 |
| | $ | 1,074,192 |
| |
| | | | | |
__________
| |
(1) | As of December 31, 2011, we had no capitalized proved undeveloped natural gas and crude oil properties disclosed as such for longer than 5 years. |
Standardized Measure of Discounted Future Net Cash Flows and Changes Therein Relating to Proved Reserves
The standardized measure below has been prepared in accordance with U.S. GAAP. Future estimated cash flows were based on a 12-month average price calculated as the unweighted arithmetic average of the prices on the first day of each month, January through December, applied to our year-end estimated proved reserves. Prices for each of the three years were adjusted by field for Btu content, transportation and regional price differences; however, they were not adjusted to reflect the value of our commodity derivatives. Production and development costs were based on prices as of December 31 for each of the respective years presented. The amounts shown do not give effect to non-property related expenses, such as corporate general and administrative expenses, debt service or to depreciation, depletion and amortization expense. Production and development costs include those cash flows associated with the expected ultimate settlement of our asset retirement obligation. Future estimated income tax expense is computed by applying the statutory rate in effect at the end of each year to the projected future pretaxpre-tax net cash flows, less the tax basis of the properties and gives effect to permanent differences, tax credits and allowances related to the properties.
The following table presents information with respect to the standardized measure of discounted future net cash flows relating to proved reserves. Changes in the demand for natural gas, NGLs and crude oil, inflation, and other factors make such estimates inherently imprecise and subject to substantial revision. This table should not be construed to be an estimate of the current market value of our proved reserves.
| | | | As of December 31, | As of December 31, |
| | 2011 | | 2010 | | 2009 | 2012 | | 2011 | | 2010 |
| | (in thousands) | (in thousands) |
| | | | | | | | | | | |
| Future estimated cash flows | $ | 6,415,255 |
| | $ | 4,361,095 |
| | $ | 2,915,377 |
| $ | 7,529,292 |
| | $ | 6,415,255 |
| | $ | 4,361,095 |
|
| Future estimated production costs | (1,704,645 | ) | | (1,418,044 | ) | | (1,088,337 | ) | (1,690,453 | ) | | (1,704,645 | ) | | (1,418,044 | ) |
| Future estimated development costs | (1,474,137 | ) | | (1,119,604 | ) | | (825,139 | ) | (1,852,177 | ) | | (1,474,137 | ) | | (1,119,604 | ) |
| Future estimated income tax expense | (946,849 | ) | | (508,805 | ) | | (237,790 | ) | (1,230,294 | ) | | (946,849 | ) | | (508,805 | ) |
| Future net cash flows | 2,289,624 |
| | 1,314,642 |
| | 764,111 |
| 2,756,368 |
| | 2,289,624 |
| | 1,314,642 |
|
| 10% annual discount for estimated timing of cash flows | (1,348,415 | ) | | (826,224 | ) | | (416,475 | ) | (1,587,871 | ) | | (1,348,415 | ) | | (826,224 | ) |
| | | | | | | |
| Standardized measure of discounted future estimated net cash flows | $ | 941,209 |
| | $ | 488,418 |
| | $ | 347,636 |
| $ | 1,168,497 |
| | $ | 941,209 |
| | $ | 488,418 |
|
| | | | | | | | | | | |
PETROLEUM DEVELOPMENT CORPORATION
(dba PDC Energy)ENERGY, INC.
The following table presents the principal sources of change in the standardized measure of discounted future estimated net cash flows.flows:
| | | | Year Ended December 31, | Year Ended December 31, |
| | 2011 | | 2010 | | 2009 | 2012 | | 2011 | | 2010 |
| | (in thousands) | (in thousands) |
| | | | | | | | | | | |
| Sales of natural gas, NGL and crude oil production, net of production costs | $ | (226,227 | ) | | $ | (163,104 | ) | | $ | (136,568 | ) | |
| Sales of natural gas, NGLs and crude oil production, net of production costs | | $ | (194,346 | ) | | $ | (226,227 | ) | | $ | (163,104 | ) |
Net changes in prices and production costs | 383,293 |
| | 180,124 |
| | (107,766 | ) | 95,501 |
| | 383,293 |
| | 180,124 |
|
Extensions, discoveries, and improved recovery, less related costs | 467,347 |
| | 88,637 |
| | 30,851 |
| 632,781 |
| | 467,347 |
| | 88,637 |
|
Sales of reserves | (4,224 | ) | | (24,174 | ) | | (21 | ) | (86,902 | ) | | (4,224 | ) | | (24,174 | ) |
Purchases of reserves | 64,761 |
| | 45,538 |
| | 1,266 |
| 296,208 |
| | 64,761 |
| | 45,538 |
|
| Development costs incurred during the period | 94,941 |
| | 44,491 |
| | 40,603 |
| 69,198 |
| | 94,941 |
| | 44,491 |
|
Revisions of previous quantity estimates | (112,468 | ) | | 47,884 |
| | (46,226 | ) | (452,775 | ) | | (112,468 | ) | | 47,884 |
|
Changes in estimated income taxes | (204,377 | ) | | (105,557 | ) | | 38,371 |
| (131,256 | ) | | (204,377 | ) | | (105,557 | ) |
| Net changes in future development costs | (29,827 | ) | | (41,595 | ) | | 101,765 |
| (3,979 | ) | | (29,827 | ) | | (41,595 | ) |
| Accretion of discount | 65,284 |
| | 35,951 |
| | 49,434 |
| 124,105 |
| | 65,284 |
| | 35,951 |
|
| Timing and other | (45,712 | ) | | 32,587 |
| | 19,122 |
| (121,247 | ) | | (45,712 | ) | | 32,587 |
|
| | | | | | | |
| Total | $ | 452,791 |
| | $ | 140,782 |
| | $ | (9,169 | ) | $ | 227,288 |
| | $ | 452,791 |
| | $ | 140,782 |
|
| | | | | | | | | | | |
__________
| |
| (1) | Despite the decrease in price for each of our commodities for 2012 compared to 2011, our weighted-average price, net of production costs per Mcfe, in our 2012 reserve report increased to $3.45 from $3.19 resulting from our increase in liquids as a percentage of total proved reserves. Our weighted-average price, net of production costs per Mcfe, in our 2010 reserve report was $2.12. |
| |
| (2) | The 35% increase in 2012 as compared to 2011 reflects a continuation of our shifting focus from gas-rich projects to liquid-rich projects. At December 31, 2012, extensions, discoveries and other additions had increased to 407,647 MMcfe, a 30% increase, 52.2% of which was gas and 47.8% was liquids. Approximately 86% of the 35% increase was related to the additional volume of PUD reserves in the Wattenberg Field that were proved up by our 2012 drilling program. The changes in extensions, discoveries and improved recovery, less related costs, were 427% higher in 2011 as compared to 2010. At December 31, 2010, extensions, discoveries and other additions were 109,964 MMcfe, 83.3% of which was gas and 16.7% of which was liquids. At December 31, 2011, extensions, discoveries and other additions had increased to 313,039 MMcfe, a 185% increase, 56.4% of which was gas and 43.6% was liquids. This change was a result of our shifting of focus from gas-rich projects to liquid-rich projects. In 2011, we focused primarily on the liquids-rich Wattenberg Field in northern Colorado, where we drilled 17 horizontal Niobrara wells and 80 vertical wells, completed 190 zones and participated in 48 non-operated drilling projects. 2011 was the first year that horizontal Niobrara PUDs were included in our year-end reserves. All of these projects are liquid-rich and, with the exception of the vertical wells and refractures, these reserves were not recognized at December 31, 2010. As a result, approximately two-thirds of the 427% increase is related to additional volumes included in our reserve report in 2011 over those included in 2010 and one-third of the increase is related to the per Mcfe value increase of those additional volume of reserves. |
| |
| (3) | The increase in sales of reserves in 2012 as compared to 2011 was due to the divestiture of our core Permian assets on February 28, 2012. |
| |
| (4) | The increase in purchases of reserves in 2012 as compared to 2011 was due to the Merit Acquisition in the liquids-rich Wattenberg Field in northern Colorado. |
| |
| (5) | The decrease in revisions of our previous quantity estimates in 2012 as compared to 2011 was primarily due to lower natural gas pricing, a decrease in proved undeveloped reserves pursuant to the SEC five-year rule and adjustments due to our drilling schedule. The decrease in 2011 as compared to 2010 was primarily due to lower natural gas pricing, a decrease in proved undeveloped reserves pursuant to the SEC five-year rule and adjustments for geological reasons, offset in part by improvements in asset performance. |
| |
| (6) | The change in estimated income taxes for each year as compared to the prior year is the direct result of the significant increase in discounted future net cash flows, as the projected deferred tax rate remained relatively unchanged at approximately 38.2%, 38.1% and 38% for the year ended December 31, 2012, 2011 and 2010, respectively. In addition, the company continued to capitalize and amortize the majority of its yearly capital expenditures and there were no changes in the assumptions as to the tax deductibility of beginning unamortized capital,additional current year capital or future development capital. |
It is necessary to emphasize that the data presented should not be viewed as representing the expected cash flowflows from, or current value of, existing proved reserves since the computations are based on a large number of estimates and arbitrary assumptions. Reserve quantities cannot be measured with precision and their estimation requires many judgmental determinations and frequent revisions. The required projection of production and related expenditures over time requires further estimates with respect to pipeline availability, rates of demand and governmental control. Actual future prices and costs are likely to be substantially different from the recent average prices and current costs utilized in the computation of reported amounts. Any analysis or evaluation of the reported amounts should give specific recognition to the computational methods utilized and the limitations inherent therein.
PETROLEUM DEVELOPMENT CORPORATION
(dba PDC Energy)ENERGY, INC.
QUARTERLY FINANCIAL INFORMATION - UNAUDITED
Quarterly financial data for the years ended December 31, 2012 and 2011 and 2010, is presented below. The sum of the quarters may not equal the total of the year's net income or loss per share attributable to shareholders due to changes in the weighted averageweighted-average shares outstanding throughout the year.
| | | | 2011 | 2012 |
| | Quarter Ended | | | Quarter Ended | | |
| | March 31 | | June 30 | | September 30 | | December 31 | | Year Ended | March 31 | | June 30 | | September 30 | | December 31 | | Year Ended |
| | (in thousands, except per share data) | (in thousands, except per share data) |
| Revenues: | | | | | | | | | | | | | | | | | | |
| Natural gas, NGL and crude oil sales | $ | 58,810 |
| | $ | 65,762 |
| | $ | 72,044 |
| | $ | 79,989 |
| | $ | 276,605 |
| |
| Natural gas, NGLs and crude oil sales | | $ | 75,310 |
| | $ | 56,879 |
| | $ | 59,915 |
| | $ | 78,223 |
| | $ | 270,327 |
|
| Sales from natural gas marketing | 15,202 |
| | 18,897 |
| | 17,209 |
| | 15,111 |
| | 66,419 |
| 11,834 |
| | 8,917 |
| | 11,570 |
| | 14,758 |
| | 47,079 |
|
| Commodity price risk management gain (loss), net | (23,882 | ) | | 20,537 |
| | 46,706 |
| | 2,729 |
| | 46,090 |
| 11,501 |
| | 38,729 |
| | (31,943 | ) | | 14,052 |
| | 32,339 |
|
| Well operations, pipeline income and other | 1,843 |
| | 1,755 |
| | 1,670 |
| | 1,578 |
| | 6,846 |
| 1,701 |
| | 1,520 |
| | 1,639 |
| | 1,528 |
| | 6,388 |
|
| Total revenues | 51,973 |
| | 106,951 |
| | 137,629 |
| | 99,407 |
| | 395,960 |
| 100,346 |
| | 106,045 |
| | 41,181 |
| | 108,561 |
| | 356,133 |
|
| Costs, expenses and other: | | | | | | | | | | | | | | | | | | |
| Production costs | 18,472 |
| | 16,895 |
| | 14,016 |
| | 19,702 |
| | 69,085 |
| 18,370 |
| | 18,055 |
| | 20,756 |
| | 18,304 |
| | 75,485 |
|
| Cost of natural gas marketing | 14,993 |
| | 18,207 |
| | 17,227 |
| | 15,038 |
| | 65,465 |
| 11,492 |
| | 8,761 |
| | 11,598 |
| | 14,701 |
| | 46,552 |
|
| Exploration expense | 1,669 |
| | 1,215 |
| | 1,135 |
| | 2,234 |
| | 6,253 |
| 2,063 |
| | 2,570 |
| | 1,969 |
| | 16,003 |
| | 22,605 |
|
| Impairment of natural gas and crude oil properties | 453 |
| | 499 |
| | 531 |
| | 23,676 |
| | 25,159 |
| 653 |
| | 370 |
| | 395 |
| | 166,731 |
| | 168,149 |
|
| General and administrative expense | 13,873 |
| | 19,509 |
| | 13,683 |
| | 14,389 |
| | 61,454 |
| 14,708 |
| | 14,378 |
| | 13,710 |
| | 16,019 |
| | 58,815 |
|
| Depreciation, depletion and amortization | 30,985 |
| | 30,592 |
| | 31,523 |
| | 35,807 |
| | 128,907 |
| 39,814 |
| | 34,448 |
| | 32,483 |
| | 40,134 |
| | 146,879 |
|
| Accretion of asset retirement obligations | | 819 |
| | 825 |
| | 1,195 |
| | 1,221 |
| | 4,060 |
|
| Gain on sale of properties and equipment | — |
| | — |
| | (32 | ) | | (164 | ) | | (196 | ) | (154 | ) | | (2,246 | ) | | (1,508 | ) | | (445 | ) | | (4,353 | ) |
| Total costs, expenses and other | 80,445 |
| | 86,917 |
| | 78,083 |
| | 110,682 |
| | 356,127 |
| 87,765 |
| | 77,161 |
| | 80,598 |
| | 272,668 |
| | 518,192 |
|
| Income (loss) from operations | (28,472 | ) | | 20,034 |
| | 59,546 |
| | (11,275 | ) | | 39,833 |
| 12,581 |
| | 28,884 |
| | (39,417 | ) | | (164,107 | ) | | (162,059 | ) |
| Loss on extinguishment of debt | | — |
| | — |
| | — |
| | (23,283 | ) | | (23,283 | ) |
| Interest expense | | (10,444 | ) | | (10,053 | ) | | (11,360 | ) | | (16,430 | ) | | (48,287 | ) |
| Interest income | 9 |
| | 2 |
| | 36 |
| | — |
| | 47 |
| 2 |
| | — |
| | 3 |
| | 3 |
| | 8 |
|
| Interest expense | (9,062 | ) | | (9,067 | ) | | (9,496 | ) | | (9,360 | ) | | (36,985 | ) | |
| Income (loss) from continuing operations before income taxes | (37,525 | ) | | 10,969 |
| | 50,086 |
| | (20,635 | ) | | 2,895 |
| 2,139 |
| | 18,831 |
| | (50,774 | ) | | (203,817 | ) | | (233,621 | ) |
| Provision (benefit) for income taxes | (14,278 | ) | | 2,804 |
| | 19,218 |
| | (7,927 | ) | | (183 | ) | |
| Provision for income taxes | | (759 | ) | | (6,179 | ) | | 18,131 |
| | 77,642 |
| | 88,835 |
|
| Income (loss) from continuing operations | (23,247 | ) | | 8,165 |
| | 30,868 |
| | (12,708 | ) | | 3,078 |
| 1,380 |
| | 12,652 |
| | (32,643 | ) | | (126,175 | ) | | (144,786 | ) |
| Income from discontinued operations, net of tax | 3,323 |
| | 1,000 |
| | 1,692 |
| | 4,344 |
| | 10,359 |
| |
| Income (loss) from discontinued operations, net of tax | | 14,455 |
| | (381 | ) | | — |
| | — |
| | 14,074 |
|
| Net income (loss) | $ | (19,924 | ) | | $ | 9,165 |
| | $ | 32,560 |
| | $ | (8,364 | ) | | $ | 13,437 |
| $ | 15,835 |
| | $ | 12,271 |
| | $ | (32,643 | ) | | $ | (126,175 | ) | | $ | (130,712 | ) |
| | | | | | | | | | | | | | | | | | | |
| Earnings (loss) per share: | | | | | | | | | | |
| Earnings per share: | | | | | | | | | | |
| Basic | | | | | | | | | | | | | | | | | | |
| Income (loss) from continuing operations | $ | (0.99 | ) | | $ | 0.35 |
| | $ | 1.31 |
| | $ | (0.54 | ) | | $ | 0.13 |
| $ | 0.06 |
| | $ | 0.48 |
| | $ | (1.08 | ) | | $ | (4.17 | ) | | $ | (5.23 | ) |
| Income from discontinued operations | 0.14 |
| | 0.04 |
| | 0.07 |
| | 0.18 |
| | 0.44 |
| |
| Income (loss) from discontinued operations | | 0.61 |
| | (0.02 | ) | | — |
| | — |
| | 0.51 |
|
| Net income (loss) | $ | (0.85 | ) | | $ | 0.39 |
| | $ | 1.38 |
| | $ | (0.35 | ) | | $ | 0.57 |
| $ | 0.67 |
| | $ | 0.46 |
| | $ | (1.08 | ) | | $ | (4.17 | ) | | $ | (4.72 | ) |
| Diluted | | | | | | | | | | | | | | | | | | |
| Income (loss) from continuing operations | $ | (0.99 | ) | | $ | 0.34 |
| | $ | 1.30 |
| | $ | (0.54 | ) | | $ | 0.13 |
| $ | 0.06 |
| | $ | 0.47 |
| | $ | (1.08 | ) | | $ | (4.17 | ) | | $ | (5.23 | ) |
| Income from discontinued operations | 0.14 |
| | 0.04 |
| | 0.07 |
| | 0.18 |
| | 0.43 |
| |
| Income (loss) from discontinued operations | | 0.60 |
| | (0.01 | ) | | — |
| | — |
| | 0.51 |
|
| Net income (loss) | $ | (0.85 | ) | | $ | 0.39 |
| | $ | 1.37 |
| | $ | (0.35 | ) | | $ | 0.56 |
| $ | 0.66 |
| | $ | 0.46 |
| | $ | (1.08 | ) | | $ | (4.17 | ) | | $ | (4.72 | ) |
| | | | | | | | | | | | | | | | | | | |
| Weighted average common shares outstanding | | | | | | | | | | |
| Weighted-average common shares outstanding | | | | | | | | | | |
| Basic | 23,428 |
| | 23,491 |
| | 23,569 |
| | 23,592 |
| | 23,521 |
| 23,609 |
| | 26,597 |
| | 30,214 |
| | 30,233 |
| | 27,677 |
|
| Diluted | 23,428 |
| | 23,723 |
| | 23,783 |
| | 23,592 |
| | 23,871 |
| 23,889 |
| | 26,728 |
| | 30,214 |
| | 30,233 |
| | 27,677 |
|
| | | | | | | | | | | | | | | | | | | |
PETROLEUM DEVELOPMENT CORPORATION
(dba PDC Energy)ENERGY, INC.
| | | | 2010 | 2011 |
| | Quarter Ended | | | Quarter Ended | | |
| | March 31 | | June 30 | | September 30 | | December 31 | | Year Ended | March 31 | | June 30 | | September 30 | | December 31 | | Year Ended |
| | (in thousands, except per share data) | (in thousands, except per share data) |
| Revenues: | | | | | | | | | | | | | | | | | | |
| Natural gas, NGL and crude oil sales | $ | 57,827 |
| | $ | 48,729 |
| | $ | 45,904 |
| | $ | 52,569 |
| | $ | 205,029 |
| |
| Natural gas, NGLs and crude oil sales | | $ | 58,810 |
| | $ | 65,762 |
| | $ | 72,044 |
| | $ | 79,989 |
| | $ | 276,605 |
|
| Sales from natural gas marketing | 22,687 |
| | 12,589 |
| | 18,337 |
| | 15,458 |
| | 69,071 |
| 15,202 |
| | 18,897 |
| | 17,209 |
| | 15,111 |
| | 66,419 |
|
| Commodity price risk management gain (loss), net | 43,222 |
| | 12,257 |
| | 19,029 |
| | (14,617 | ) | | 59,891 |
| (23,882 | ) | | 20,537 |
| | 46,706 |
| | 2,729 |
| | 46,090 |
|
| Well operations, pipeline income and other | 2,589 |
| | 2,148 |
| | 2,157 |
| | 2,136 |
| | 9,030 |
| 1,843 |
| | 1,755 |
| | 1,670 |
| | 1,578 |
| | 6,846 |
|
| Total revenues | 126,325 |
| | 75,723 |
| | 85,427 |
| | 55,546 |
| | 343,021 |
| 51,973 |
| | 106,951 |
| | 137,629 |
| | 99,407 |
| | 395,960 |
|
| Costs, expenses and other: | | | | | | | | | | | | | | | | | | |
| Production costs | 14,961 |
| | 16,004 |
| | 15,925 |
| | 17,982 |
| | 64,872 |
| 18,117 |
| | 16,537 |
| | 13,644 |
| | 19,054 |
| | 67,352 |
|
| Cost of natural gas marketing | 22,323 |
| | 12,207 |
| | 18,300 |
| | 15,185 |
| | 68,015 |
| 14,993 |
| | 18,207 |
| | 17,227 |
| | 15,038 |
| | 65,465 |
|
| Exploration expense | 5,818 |
| | 3,274 |
| | 2,679 |
| | 1,904 |
| | 13,675 |
| 1,669 |
| | 1,215 |
| | 1,135 |
| | 2,234 |
| | 6,253 |
|
| Impairment of natural gas and crude oil properties | 600 |
| | 556 |
| | 1,033 |
| | 4,292 |
| | 6,481 |
| 453 |
| | 499 |
| | 531 |
| | 23,676 |
| | 25,159 |
|
| General and administrative expense | 10,694 |
| | 9,855 |
| | 10,426 |
| | 11,213 |
| | 42,188 |
| 13,873 |
| | 19,509 |
| | 13,683 |
| | 14,389 |
| | 61,454 |
|
| Depreciation, depletion and amortization | 27,458 |
| | 26,945 |
| | 27,664 |
| | 26,028 |
| | 108,095 |
| 30,985 |
| | 30,592 |
| | 31,523 |
| | 35,807 |
| | 128,907 |
|
| Accretion of asset retirement obligations | | 355 |
| | 358 |
| | 372 |
| | 648 |
| | 1,733 |
|
| Gain on sale of properties and equipment | — |
| | (96 | ) | | (57 | ) | | (21 | ) | | (174 | ) | — |
| | — |
| | (32 | ) | | (164 | ) | | (196 | ) |
| Total costs, expenses and other | 81,854 |
| | 68,745 |
| | 75,970 |
| | 76,583 |
| | 303,152 |
| 80,445 |
| | 86,917 |
| | 78,083 |
| | 110,682 |
| | 356,127 |
|
| Income (loss) from operations | 44,471 |
| | 6,978 |
| | 9,457 |
| | (21,037 | ) | | 39,869 |
| (28,472 | ) | | 20,034 |
| | 59,546 |
| | (11,275 | ) | | 39,833 |
|
| Interest expense | | (9,062 | ) | | (9,067 | ) | | (9,496 | ) | | (9,360 | ) | | (36,985 | ) |
| Interest income | 5 |
| | 34 |
| | 21 |
| | 11 |
| | 71 |
| 9 |
| | 2 |
| | 36 |
| | — |
| | 47 |
|
| Interest expense | (7,800 | ) | | (7,672 | ) | | (8,174 | ) | | (9,604 | ) | | (33,250 | ) | |
| Income (loss) from continuing operations before income taxes | 36,676 |
| | (660 | ) | | 1,304 |
| | (30,630 | ) | | 6,690 |
| (37,525 | ) | | 10,969 |
| | 50,086 |
| | (20,635 | ) | | 2,895 |
|
| Provision (benefit) for income taxes | 13,804 |
| | (238 | ) | | (1,321 | ) | | (11,593 | ) | | 652 |
| |
| Provision for income taxes | | 14,278 |
| | (2,804 | ) | | (19,218 | ) | | 7,927 |
| | 183 |
|
| Income (loss) from continuing operations | 22,872 |
| | (422 | ) | | 2,625 |
| | (19,037 | ) | | 6,038 |
| (23,247 | ) | | 8,165 |
| | 30,868 |
| | (12,708 | ) | | 3,078 |
|
| Income (loss) from discontinued operations, net of tax | 797 |
| | (2,313 | ) | | 729 |
| | 683 |
| | (104 | ) | |
| Income from discontinued operations, net of tax | | 3,323 |
| | 1,000 |
| | 1,692 |
| | 4,344 |
| | 10,359 |
|
| Net income (loss) | 23,669 |
| | (2,735 | ) | | 3,354 |
| | (18,354 | ) | | 5,934 |
| (19,924 | ) | | 9,165 |
| | 32,560 |
| | (8,364 | ) | | 13,437 |
|
| Less: net loss attributable to noncontrolling interests | (55 | ) | | (6 | ) | | (5 | ) | | (214 | ) | | (280 | ) | |
| Net income (loss) attributable to shareholders | $ | 23,724 |
| | $ | (2,729 | ) | | $ | 3,359 |
| | $ | (18,140 | ) | | $ | 6,214 |
| |
| | | | | | | | | | | | | | | | | | | |
| Amounts attributable to Petroleum Development Corporation shareholders: | | | | | | | | | | |
| Income (loss) from continuing operations | $ | 22,927 |
| | $ | (416 | ) | | $ | 2,630 |
| | $ | (18,823 | ) | | $ | 6,318 |
| |
| Income (loss) from discontinued operations, net of tax | 797 |
| | (2,313 | ) | | 729 |
| | 683 |
| | (104 | ) | |
| Net income (loss) attributable to shareholders | $ | 23,724 |
| | $ | (2,729 | ) | | $ | 3,359 |
| | $ | (18,140 | ) | | $ | 6,214 |
| |
| | | | | | | | | | | |
| Earnings (loss) per share attributable to shareholders: | | | | | | | | | | |
| Earnings per share: | | | | | | | | | | |
| Basic | | | | | | | | | | | | | | | | | | |
| Income (loss) from continuing operations | $ | 1.19 |
| | $ | (0.03 | ) | | $ | 0.14 |
| | $ | (0.89 | ) | | $ | 0.33 |
| $ | (0.99 | ) | | $ | 0.35 |
| | $ | 1.31 |
| | $ | (0.54 | ) | | $ | 0.13 |
|
| Income (loss) from discontinued operations | 0.04 |
| | (0.12 | ) | | 0.03 |
| | 0.03 |
| | (0.01 | ) | |
| Income from discontinued operations | | 0.14 |
| | 0.04 |
| | 0.07 |
| | 0.19 |
| | 0.44 |
|
| Net income (loss) attributable to shareholders | $ | 1.23 |
| | $ | (0.15 | ) | | $ | 0.17 |
| | $ | (0.86 | ) | | $ | 0.32 |
| $ | (0.85 | ) | | $ | 0.39 |
| | $ | 1.38 |
| | $ | (0.35 | ) | | $ | 0.57 |
|
| Diluted | | | | | | | | | | | | | | | | | | |
| Income (loss) from continuing operations | $ | 1.19 |
| | $ | (0.03 | ) | | $ | 0.14 |
| | $ | (0.89 | ) | | $ | 0.32 |
| $ | (0.99 | ) | | $ | 0.34 |
| | $ | 1.30 |
| | $ | (0.54 | ) | | $ | 0.13 |
|
| Income (loss) from discontinued operations | 0.04 |
| | (0.12 | ) | | 0.03 |
| | 0.03 |
| | (0.01 | ) | |
| Income from discontinued operations | | 0.14 |
| | 0.04 |
| | 0.07 |
| | 0.19 |
| | 0.43 |
|
| Net income (loss) attributable to shareholders | $ | 1.23 |
| | $ | (0.15 | ) | | $ | 0.17 |
| | $ | (0.86 | ) | | $ | 0.31 |
| $ | (0.85 | ) | | $ | 0.38 |
| | $ | 1.37 |
| | $ | (0.35 | ) | | $ | 0.56 |
|
| | | | | | | | | | | | | | | | | | | |
| Weighted average common shares outstanding | | | | | | | | | | |
| Weighted-average common shares outstanding | | | | | | | | | | |
| Basic | 19,191 |
| | 19,213 |
| | 19,250 |
| | 21,026 |
| | 19,674 |
| 23,428 |
| | 23,491 |
| | 23,569 |
| | 23,592 |
| | 23,521 |
|
| Diluted | 19,287 |
| | 19,213 |
| | 19,406 |
| | 21,026 |
| | 19,821 |
| 23,428 |
| | 23,723 |
| | 23,783 |
| | 23,592 |
| | 23,871 |
|
| | | | | | | | | | | | | | | | | | | |
| | | | | | | | | | | |
PETROLEUM DEVELOPMENT CORPORATION
(dba PDC Energy)ENERGY, INC.
FINANCIAL STATEMENT SCHEDULE
Schedule II -VALUATION AND QUALIFYING ACCOUNTS
| | | Description | | Beginning
Balance
January 1 | | Deconsolidation/Purchase Price Adjustment for PDCM | | Charged to
Costs and
Expenses | | Deductions (1) | | Ending
Balance
December 31 | | Beginning
Balance
January 1 | | Deconsolidation/Purchase Price Adjustment for PDCM | | Charged to
Costs and
Expenses | | Deductions (1) | | Ending
Balance
December 31 |
| | | (in thousands) | | (in thousands) |
| | | | | | | | | | | | | | | | | | | | | |
| 2012: | | | | | | | | | | | |
| Allowance for doubtful accounts | | | $ | 921 |
| | $ | — |
| | $ | 258 |
| | $ | 153 |
| | $ | 1,026 |
|
| Valuation allowance for unproved natural gas and crude oil properties | | | 12,204 |
| | — |
| | 4,207 |
| | 8,375 |
| | 8,036 |
|
| 2011: | | | | | | | | | | | | | | | | | | | | |
| Allowance for doubtful accounts | | $ | 686 |
| | $ | 121 |
| | $ | 135 |
| | $ | 21 |
| | $ | 921 |
| | 686 |
| | 121 |
| | 135 |
| | 21 |
| | 921 |
|
| Valuation allowance for unproved natural gas and crude oil properties | | 16,996 |
| | 260 |
| | 2,611 |
| | 7,143 |
| | 12,204 |
| | 16,996 |
| | 260 |
| | 2,611 |
| | 7,143 |
| | 12,204 |
|
| 2010: | | | | | | | | | | | | | | | | | | | | |
| Allowance for doubtful accounts | | 548 |
| | 135 |
| | 307 |
| | 34 |
| | 686 |
| | 548 |
| | 135 |
| | 307 |
| | 34 |
| | 686 |
|
| Valuation allowance for state tax benefits | | 747 |
| | — |
| | — |
| | 747 |
| | — |
| | 747 |
| | — |
| | — |
| | 747 |
| | — |
|
| Valuation allowance for unproved natural gas and crude oil properties | | 15,001 |
| | 19 |
| | 6,120 |
| | 4,106 |
| | 16,996 |
| | 15,001 |
| | 19 |
| | 6,120 |
| | 4,106 |
| | 16,996 |
|
| 2009: | | | | | | | | | | | |
| Allowance for doubtful accounts | | 537 |
| | — |
| | 120 |
| | 109 |
| | 548 |
| |
| Valuation allowance for state tax benefits | | — |
| | — |
| | 747 |
| | — |
| | 747 |
| |
| Valuation allowance for unproved natural gas and crude oil properties | | 12,870 |
| | — |
| | 7,279 |
| | 5,148 |
| | 15,001 |
| |
_______________
| |
| (1) | For allowance for doubtful accounts, deductions represent the write-off of accounts receivable deemed uncollectible. For valuation allowance for unproved natural gas and crude oil properties, deductions represent accumulated amortization of expired or abandoned unproved natural gas and crude oil properties. For valuation allowance for state tax benefits, deductions represent expired or unutilized state tax benefits. |