UNITED STATES
SECURITIES AND EXCHANGE COMMISSION
Washington, D.C. 20549
FORM 10-K
T ANNUAL REPORT PURSUANT TO SECTION 13 OR 15(d) OF THE SECURITIES EXCHANGE ACT OF 1934
For the fiscal year ended December 31, 20122013
or
£ TRANSITION REPORT PURSUANT TO SECTION 13 OR 15(d) OF THE SECURITIES EXCHANGE ACT OF 1934
For the transition period from __________ to _________
Commission File Number 000-07246
PDC ENERGY, INC.
(Exact name of registrant as specified in its charter)
|
| |
| Nevada | 95-2636730 |
| (State of incorporation) | (I.R.S. Employer Identification No.) |
1775 Sherman Street, Suite 3000
Denver, Colorado 80203
(Address of principal executive offices) (Zip code)
Registrant's telephone number, including area code: (303) 860-5800
Securities registered pursuant to Section 12(b) of the Act:
|
| | |
| Title of each class | | Name of each exchange on which registered |
| Common Stock, par value $0.01 per share | | NASDAQ Global Select Market |
Securities registered pursuant to Section 12(g) of the Act: None
Indicate by check mark if the registrant is a well-known seasoned issuer, as defined in Rule 405 of the Securities Act. Yes T No £
Indicate by check mark if the registrant is not required to file reports pursuant to Section 13 or Section 15(d) of the Act. Yes £ No T
Indicate by check mark whether the registrant (1) has filed all reports required to be filed by Section 13 or 15(d) of the Securities Exchange Act of 1934 during the preceding 12 months (or for such shorter period that the registrant was required to file such reports), and (2) has been subject to such filing requirements for the past 90 days. Yes T No £
Indicate by check mark whether the registrant has submitted electronically and posted on its corporate Website, if any, every Interactive Data File required to be submitted and posted pursuant to Rule 405 of Regulation S-T (§232.405 of this chapter) during the preceding 12 months (or for such shorter period that the registrant was required to submit and post such files). Yes T No £
Indicate by check mark if disclosure of delinquent filers pursuant to Item 405 of Regulation S-K (§229.405 of this chapter) is not contained herein, and will not be contained, to the best of registrant's knowledge, in definitive proxy or information statements incorporated by reference in Part III of this Form 10-K or any amendment to this Form 10-K. £
Indicate by check mark whether the registrant is a large accelerated filer, an accelerated filer, a non-accelerated filer, or a smaller reporting company. See definitions of "large accelerated filer," "accelerated filer" and "smaller reporting company" in Rule 12b-2 of the Exchange Act.
|
| |
Large accelerated filer x | Accelerated filer o |
Non-accelerated filer £ (Do not check if a smaller reporting company) | Smaller reporting company o |
Indicate by check mark whether the registrant is a shell company (as defined in Rule 12b-2 of the Act). Yes £ No T
The aggregate market value of our common stock held by non-affiliates on June 30, 20122013 was $735,547,9441.5 billion (based on the then closing price of $24.5251.48 per share)share as of the last business day of the fiscal quarter ending June 30, 2013).
As of February 8, 20137, 2014, there were 30,316,67035,754,597 shares of our common stock outstanding.
DOCUMENTS INCORPORATED BY REFERENCE
We hereby incorporate by reference into this document the information required by Part III of this Form, which will appear in our definitive proxy statement to be filed pursuant to Regulation 14A for our 20132014 Annual Meeting of Stockholders.
PDC ENERGY, INC.
20122013 ANNUAL REPORT ON FORM 10-K
TABLE OF CONTENTS
|
| | | |
| | PART I | | Page |
| | | | |
| | | |
| | | |
| | | |
| | | |
| | | |
| | | | |
| | PART II | | |
| | | | |
| | | |
| | | |
| | | |
| | | |
| | | |
| | | |
| | | |
| | | |
| | | | |
| | PART III | | |
| | | | |
| | | |
| | | |
| | | |
| | | |
| | | |
| | | | |
| | PART IV | | |
| | | | |
| | | |
| | | | |
| | | | |
| | | | |
| | | | |
PART I
REFERENCES TO THE REGISTRANT
At our annual meeting of stockholders held on June 7, 2012, the stockholders approved a change of the Company's legal name from Petroleum Development Corporation to PDC Energy, Inc. Reflecting this change, on July 16, 2012, our common stock began trading on the NASDAQ Global Select Market under the ticker symbol "PDCE." Information contained on or linked to our website, www.pdce.com, is not part of this report and is not hereby incorporated by reference and should not be considered part of this report.
Unless the context otherwise requires, references in this report to "PDC Energy," "PDC," "the Company," "we," "us," "our,""our" or "ours" or "ourselves" refer to the registrant, PDC Energy, Inc. and all subsidiaries consolidated for the purposes of its financial statements, including our proportionate share of the financial position, results of operations, cash flows and operating activities of our affiliated partnerships and PDC Mountaineer, LLC ("PDCM"), a joint venture currently owned 50% each by PDC and Lime Rock Partners, LP, formed for the purpose of exploring and developing the Marcellus Shale formation in the Appalachian Basin.LP. Unless the context otherwise requires, references in this report to "Appalachian Basin" includesrefers to our operations in the Utica Shale in Ohio and Marcellus Shale in West Virginia and Pennsylvania, including PDC's proportionate share of our affiliated partnerships' and the PDCM's assets, results of operations, cash flows and operating activities.
See Note 1, Nature of Operations and Basis of Presentation, to our consolidated financial statements included elsewhere in this report for a description of our consolidated subsidiaries.
GLOSSARY OF UNITS OF MEASUREMENTS AND INDUSTRY TERMS
Units of measurements and industry terms are defined in the Glossary of Units of Measurements and Industry Terms, included at the end of this report, are set in boldface type the first time they appear.report.
SPECIAL NOTE REGARDING FORWARD-LOOKING STATEMENTS
This report contains forward-looking statements within the meaning of Section 27A of the Securities Act of 1933 ("Securities Act") and Section 21E of the Securities Exchange Act of 1934 ("Exchange Act") regarding our business, financial condition, results of operations and prospects. All statements other than statements of historical facts included in and incorporated by reference into this report are "forward-looking statements" within the meaning of the safe harbor provisions of the United States ("U.S.") Private Securities Litigation Reform Act of 1995. Words such as expects, anticipates, intends, plans, believes, seeks, estimates and similar expressions or variations of such words are intended to identify forward-looking statements herein. These statements relate to, among other things: estimated crude oil, natural gas and natural gas liquids (“NGLs”(“NGLs”) and crude oil reserves;reserves; future production (including the components of such production), sales, expenses, cash flows margins and liquidity; our evaluation method of our customers' and derivative counterparties' credit risk is appropriate and consistent with those used by other market participants; anticipated capital projects, expenditures and opportunities, including drilling locations and downspacing potential;opportunities; future exploration, drilling and development activities; our drilling programs and number of locations; expected timing of additional drilling rigs in the Wattenberg Field and Utica Shale; availability of additional midstream facilities and services, in the Wattenberg Field and timing of that availability;availability and related benefits to us; availability of sufficient funding for our 2014 capital program and sources of that funding; potential for infrastructure projects to improveexpected 2014 capital budget allocations; acquisitions of additional Utica Shale acreage; expected use of the remaining net proceeds from our NGL pricing; ourAugust 2013 equity offering; the impact of high line pressures; compliance with debt covenants andcovenants; expected funding sources for conversion of our 3.25% convertible senior notes due 2016; compliance with government regulations; potential future transactions; the renewal of a letter of creditborrowing base under our revolving credit facility; adequacyimpact of litigation on our insurance; the future effectresults of contracts, policiesoperations and procedures we believe to be customary;financial position; effectiveness of our derivative program in providing a degree of price stability; our future dividend policy; closing of, and expected proceeds from, our pending asset disposition;that we do not expect to pay dividends in the foreseeable future; and our future strategies, plans and objectives.
The above statements are not the exclusive means of identifying forward-looking statements herein. Although forward-looking statements contained in this report reflect our good faith judgment, such statements can only be based on facts and factors currently known to us. Consequently, forward-looking statements are inherently subject to risks and uncertainties, including known and unknown risks and uncertainties incidental to the exploration for, and the acquisition, development, production and marketing of crude oil, natural gas NGLs and crude oil,NGLs, and actual outcomes may differ materially from the results and outcomes discussed in the forward-looking statements.
Important factors that could cause actual results to differ materially from the forward-looking statements include, but are not limited to:
changes in worldwide production volumes and worldwide demand, including economic conditions that might impact demand;
volatility of commodity prices for crude oil, natural gas NGLs and crude oil;NGLs;
the impact of governmental policies and/or regulations, including changes in environmental and other laws, the interpretation and enforcement related to those laws and regulations, liabilities arising thereunder and the costs to comply with those laws and regulations;
potential declines in the valuesvalue of our crude oil, natural gas and crude oilNGLs properties resulting in impairments;
changes in estimates of proved reserves;
reserves;inaccuracy of reserve estimates and expected production rates;
potential for production decline rates from our wells to bebeing greater than expected;
timing and extent of our success in discovering, acquiring, developing and producing reserves;
our ability to acquiresecure leases, drilling rigs, supplies and services at reasonable prices;
timing and receipt of necessary regulatory permits;
risks incidental to the drilling and operation of natural gas and crude oil wells;
our future cash flows, liquidity and financial condition;
competition in the oil and gas industry;
availability and cost of capital to us;
reductions in the borrowing base under our revolving credit facility;
availability of sufficient pipeline, gathering and other transportation facilities and related infrastructure to process and transport our production, particularly in the Wattenberg Field and the Utica Shale, and the impact of these facilities and regional capacity on the prices we receive for our production;
timing and receipt of necessary regulatory permits;
risks incidental to the drilling and operation of crude oil and natural gas wells;
our future cash flows, liquidity and financial condition;
competition within the oil and gas industry;
availability and cost of capital;
reductions in the borrowing base under our revolving credit facility;
our success in marketing crude oil, natural gas NGLs and crude oil;NGLs;
effect of natural gas and crude oil derivatives activities;
impact of environmental events, governmental and other third-party responses to such events, and our ability to insure adequately against such events;
cost of pending or future litigation;
effect that acquisitions we may pursue have on our capital expenditures;
potential obstacles to completing our pending asset disposition or other transactions, in a timely manner or at all, and purchase price or other adjustments relating to those transactions that may be unfavorable to us;
our ability to retain or attract senior management and key technical employees; and
success of strategic plans, expectations and objectives for our future operations of the Company.operations.
Further, we urge you to carefully review and consider the cautionary statements and disclosures, specifically those under Item 1A, Risk Factors, made in this report and our other filings with the U.S. Securities and Exchange Commission ("SEC") for further information on risks and uncertainties that could affect our business, financial condition, results of operations and cash flows. We caution you not to place undue reliance on forward-looking statements, which speak only as of the date of this report. We undertake no obligation to update any forward-looking statements in order to reflect any event or circumstance occurring after the date of this report or currently unknown facts or conditions or the occurrence of unanticipated events. All forward-looking statements are qualified in their entirety by this cautionary statement.
ITEMS 1. AND 2. BUSINESS AND PROPERTIES
The Company
We are a domestic independent exploration and production company that produces, develops, acquires develops,and explores and producesfor crude oil, natural gas and NGLs and crude oil with primary operations in the Western and Eastern regions of the United States. Our Western Operating Region is primarily focused on development in the Wattenberg Field in Colorado, particularlythe Utica Shale in southeastern Ohio and the Appalachia-Marcellus Shale in northern West Virginia. Our operations in the Wattenberg Field are focused on the liquid-rich horizontal Niobrara and Codell plays. In our Eastern Operating Region, weWe are currently focused onfocusing our Ohio development activity in the liquid-rich portion of the Utica Shale play in Ohio. Weand are also pursuing horizontal development in the Marcellus Shale in northern West Virginia through our 50% joint venture interest in PDCM. We own an interest in approximately 7,2003,100 gross producing wells, and maintained an average production rateof which 249 are horizontal. Production of 135.67.4 MMcfe per dayMMboe from continuing operations for the year ended December 31, 2013 represents an increase of 35% compared to the year ended December 31, 2012, which was comprised of 65.3% natural gas, 10.2% NGLs and 24.5% crude oil. This represents production growth of 10.2% from continuing operations as compared to. For the yearmonth ended December 31, 20112013., we maintained an average production rate of 27 MBoe per day. As of December 31, 20122013, we had approximately 1.2266 TcfeMMBoe of proved reserves with a pre-tax present value of future net revenues (“PV-10”) value, whichof $2.7 billion, representing an increase of 73 MMBoe and $1.0 billion, respectively, relative to the totals as of December 31, 2012. The percentage of our proved reserves represented by crude oil and NGLs rose to 54% as of December 31, 2013, up from 48% as of December 31, 2012. PV-10 is not a financial measure under Accounting Principles Generally Accepted in the United States of America (“U.S. GAAP”), of $1.7 billion, representing growth of 141 Bcfe and $359 million, respectively, relative to the totals as of December 31, 2011. The percentage of our proved reserves represented by NGLs and crude oil rose to 48% as of December 31, 2012, up from 34% as of December 31, 2011. See Part I, Item 7. Management's Discussion and Analysis of Financial Condition and Results of Operations - Reconciliation of Non-U.S. GAAP Financial Measures, for a definition of PV-10%PV-10 and a reconciliation of our PV-10%PV-10 value to our standardized measure.measure.
The increase in our estimated proved reserves and production is primarily attributable to liquid-richour successful horizontal Niobrara and Codell drilling activitiesprogram in the Wattenberg Field. Future development of the Wattenberg Field provides the opportunity to add further proved, probable and possible ("3P") reserves to our portfolio through continued delineation and downspacing of the horizontal Niobrara and Codell formations. Recently, we completed and are producing from our first 16 horizontal wells per section downspacing project in the Wattenberg Field. In 2013, we spudded 70 horizontal wells in the Wattenberg Field, and our June 2012 acquisition54 of certain Wattenberg Field properties and related assets from affiliates of Merit Energy (the "Merit Acquisition") for $304.6 million, after certain post-closing adjustments. The acquired assets comprise approximately 29,800 net acres, after post-closing adjustments, located almost entirely in the core Wattenberg Field with significant overlay with our existing acreage position. We believe that the Merit Acquisition should provide us with an opportunity to continue our rapid growth in the Wattenberg Field and to substantially increase our oil and NGL production. We drilled 37 horizontal Niobrara and Codell wells,which were completed, 160 refracture and recompletion projects and participated in 19 49 gross, 10.4 net, horizontal non-operated drilling projects in the Wattenberg Field in 2012.
In our Eastern Operating Region, we have acquired an estimated 45,000 net acres targeting the wet gas and crude oil windows of the Utica Shale in southeast Ohio.projects. Our year-end 20122013 proved reserves do not include reserves associated with our Utica Shale properties.properties, where we have acquired approximately 48,000 net acres. We drilled and completed twospudded 11 horizontal Utica Shale wells in 2012, both2013, nine of which are currently shut-in awaiting pipeline connections. We also drilled one vertical Utica Shale wellwere completed and completed two vertical Utica test wells in 2012 for the primary purpose of providing engineering and geological data in support of the horizontal play. In addition,connected to a gathering line. PDCM drilled three and completed sixspudded 14 horizontal Marcellus wells and constructed various midstream projects in 2012.2013, 10 of which were completed as of year-end.
The following table presents our historical proved reserve estimates as of December 31, 20122013 based on a reserve report prepared by Ryder Scott Company, L.P. (“Ryder Scott”), our independent petroleum engineering consulting firm:
|
| | | | | | | | | | | | | | |
| | Proved Reserves at December 31, 2012 | | | | | | |
| | Proved Reserves (Bcfe) | | % of Total Proved Reserves | | % Proved Developed | | % Liquids | | Proved Reserves to Production Ratio (in years) | | Production (MMcfe) |
| Western | | | | | | | | | | | |
| Wattenberg Field | 893.5 | | 77 | % | | 41 | % | | 62 | % | | 33.4 | | 26,748 |
| Other | 84.6 | | 8 | % | | 100 | % | | 1 | % | | 5.1 | | 16,672 |
| Total Western | 978.1 | | 85 | % | | 46 | % | | 56 | % | | 22.5 | | 43,420 |
| Eastern | | | | | | | | | | | |
| Appalachian Basin | 178.8 | | 15 | % | | 23 | % | | — | % | | 28.9 | | 6,192 |
| Total Eastern | 178.8 | | 15 | % | | 23 | % | | — | % | | 28.9 | | 6,192 |
| Total proved reserves | 1,156.9 | | 100 | % | | 42 | % | | 48 | % | | 23.3 | | 49,612 |
|
| | | | | | | | | | | | | | | |
| | Proved Reserves at December 31, 2013 | | | | | | |
| | Proved Reserves (MMBoe) | | % of Total Proved Reserves | | % Proved Developed | | % Liquids | | Proved Reserves to Production Ratio (in years) | | Production (MBoe) |
| | | | | | | | | | | | |
| Wattenberg Field | 212 | | 79.7 | % | | 29.7 | % | | 64.0 | % | | 35.7 | | 5,938 |
|
| Utica Shale | 14 | | 5.4 | % | | 23.8 | % | | 48.6 | % | | 63.8 | | 225 |
|
| Appalachia-Marcellus Shale | 40 | | 14.9 | % | | 23.3 | % | | — | % | | 31.2 | | 1,266 |
|
| Total proved reserves | 266 | | 100.0 | % | | 28.4 | % | | 53.6 | % | | 35.8 | | 7,430 |
|
On February 4, 2013, we entered into a purchase and sale agreement with certain affiliates of Caerus Oil and Gas LLC (“Caerus”), pursuant to which we have agreed to sell to Caerus our Piceance Basin, NECO and certain non-core Colorado oil and gas properties, leasehold mineral interests and related assets, including derivatives, for aggregate cash consideration of approximately $200 million, subject to certain adjustments. As of December 31, 2012, total estimated proved reserves related to these assets were 84.6 Bcfe. See Note 19, Subsequent Events, to our consolidated financial statements included elsewhere in this report for additional information regarding the planned divestiture. There can be no assurance we will be successful in closing such divestiture.2
In addition to our oil and gas exploration and production activities, we engage in natural gas marketing through our subsidiary Riley Natural Gas (“RNG”).
Our Strengths
Multi-year project inventory targeting highly economicin premier crude oil, natural gas and NGL production growth.NGLs plays. We have a significant operational presence in three key U.S. onshore basins and have identified a substantial inventory of approximately 4,1003,600 gross capitalhorizontal drilling projects, across our assets.as well as a substantial number of refracture and recompletion opportunities. This inventory of horizontal drilling projects includes approximately 3,300 gross2,800 projects in the liquid-rich Wattenberg Field, of which approximately 1,400 are horizontal Niobrara and Codell proved and probable locations that we expect to be capable of providing liquid-rich production growth for the next several years at attractive rates of return based on current strip prices. Potential downspacing of future drill sites would provide the opportunity for additional locations. In the core area of the Wattenberg Field, we have achieved an average of 335 MBoe gross reserves per horizontal well, with approximately 75% liquids contribution. In the Appalachian Basin, we have approximately 600 gross Marcellus Shale drilling locations in inventory, of which approximately 360 gross wells in our core focus area would be expected to generate reserves of 5 to 7 Bcfe per well. In addition, our leasehold position in the emerging Utica Shale play is expected to provide approximately 200 horizontal drilling opportunities in liquid rich areas. With the development of the horizontal Niobrara and Codell and exploration and delineation of acreageprojects in the Utica Shale we are focused on transitioning our portfolio to a higher mix of oil and NGLs that we believe is capable of delivering higher margins and improved capital efficiencies.600 projects in the Marcellus Shale.
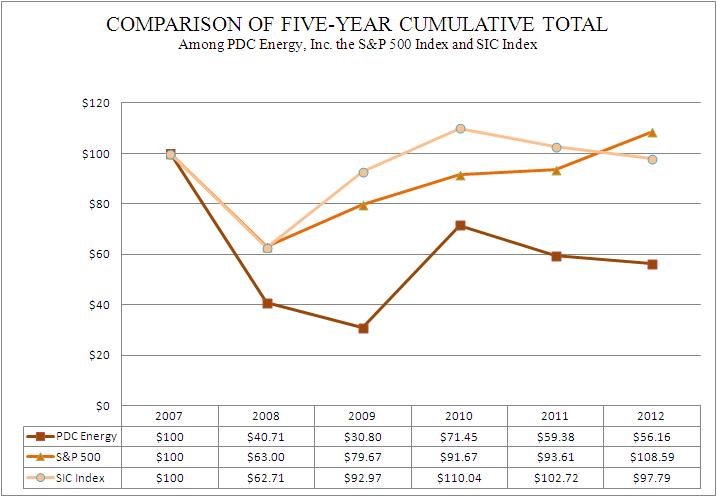
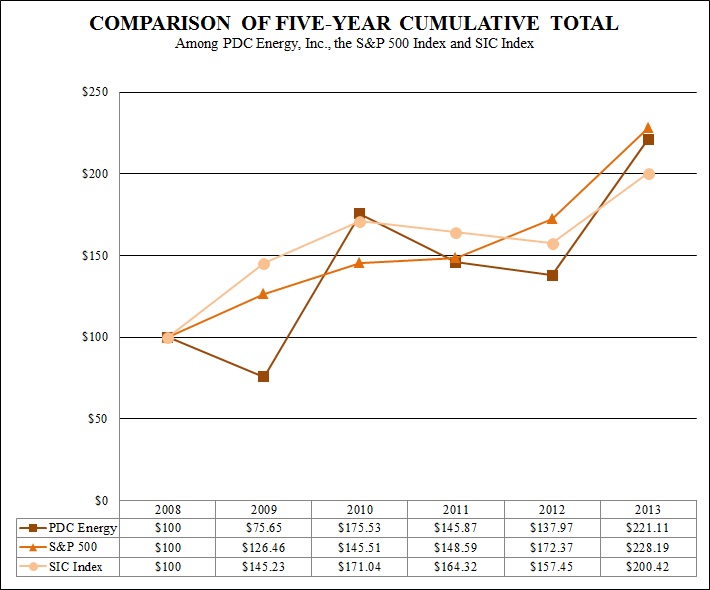
Track record of reserve and production growth. Our proved reserves have grown from 323 Bcfe55 MMBoe at December 31, 20062008 to approximately 1.2 Tcfe266 MMBoe at December 31, 2012,2013, representing a compound annual growth rate (“CAGR”) of 23.7%37%. During the same time period, our proved crude oil and NGL reserves grew at a CAGR of 52.7%57%. Our annual production grew from 16.9 Bcfe in 2006 to 49.6 Bcfe in 2012 from continuing operations grew from 3.2 MMBoe in 2008 to 7.4 MMBoe in 2013, representing a CAGR of 19.7%18%.
Horizontal drilling and completion experience. We have a proven track record of applying technical expertise toward developing unconventional resources through horizontal drilling and completion operations, having drilled 108 Niobrara, Codell, Marcellus and Uticaor participated in 249 horizontal wells, as of including 144 horizontal wells during the year ending December 31, 2012.2013. We have beguntransitioned to multi-well pad drilling to further optimize costs and enhance horizontal drilling efficiencies. Pad drilling enables us to streamline the transition to increased well density in all our horizontal plays.
Access to liquidity.As of December 31, 2013, we had a total liquidity position of $647.0 million, comprised of $193.2 million of cash and cash equivalents and $453.8 million available for borrowing under revolving credit facilities. In August 2013, we completed a public offering of 5,175,000 shares of our common stock, at a price to us of $53.37 per share, for net proceeds of approximately $276 million, after deducting offering expenses and underwriting discounts. We expect to use the horizontal Niobrararemaining net proceeds from the offering to fund a portion of our 2014 capital program and Codell plays.for general corporate purposes. We have no near-term debt maturities and have had no draws on our revolving credit facility since June 2013.
Cash flow management through commodity derivative instruments. We actively hedge our future exposure to commodity price fluctuations by entering into oil and natural gas swaps, collars and basis protection swaps to the extent possible. As of December 31, 2013, we have hedged approximately 2,000 gross horizontal proved4,112 MBbls of our crude oil production for 2014 at a weighted-average minimum price of $89.06 per Bbl and probable locationsa weighted-average maximum price of $94.01 per Bbl. As of December 31, 2013, we have hedged approximately 20 Bcf of our natural gas production in inventory from our Wattenberg and Marcellus positions. Our current leasehold position in the emerging Utica Shale play is expected to provide approximately 200 horizontal drilling opportunities in liquid-rich areas.2014 at a weighted-average minimum price of $4.03 per Mcf.
Significant operational control in our core areas. As a result of successfully executing our strategy over time of acquiring largely concentrated acreage positions with a high working interest,, we operate and manage approximately 89%91% of our oil and natural gas properties.the wells in which we have an interest. Our high percentage of operated properties enables us to exercise a significant level of control with respect to drilling, production, operating and administrative costs, in addition to leveraging our base of technical expertise in our core operating areas.
Access to liquidity.As of December 31, 2012, we had $2.5 million of cash and cash equivalents and $396.1 million available for
borrowing under our revolving credit facility. We have no near-term debt maturities, although we periodically repay borrowings outstanding under our revolving credit facility. We actively hedge our future exposure to commodity price fluctuations by entering into oil and natural gas swaps and collars. We have hedged approximately 28.7 Bcf of our natural gas production for 2013 at an average minimum price of $4.15 per Mcf. We have hedged approximately 2,326 MBbls of our oil production in 2013 at an average minimum price of $88.75 per Bbl. As of December 31, 2012, the net fair value of all of our hedges was approximately $30.3 million.
Management experience and operational expertise. We have a management team with a proven track record of drilling performance and a technical and operational staff with significant expertise in the basins in which we operate, particularly within horizontal well developmentdrilling, completion and production activities.
Business Strategy
Our long-term business strategy focuses on generating shareholder value through the acquisition, exploration and development of crude oil and natural gas properties; we are currently focused on the organic growth of our reserves, production and cash flows in our high-value, liquid-rich horizontal drilling programs. We also engage in targeted exploratory drilling of unconventional resourcesprograms after having completed multiple transactions to restructure and maintain an active acquisition program. Wesimplify our property portfolio over the last several years. Additionally, we pursue various midstream, marketing and cost reduction initiatives designed to increase our per unit operating margins and we maintain a conservative and disciplined financial strategy focused on providing sufficient liquidity and balance sheet strength to execute our business strategy.
Drill and DevelopDevelopment drilling
Our leasehold interests consist of developed and undeveloped crude oil, natural gas and NGLs and crude oil resources located inresources. Based upon our Western and Eastern Operating Regions. Based on our priorcurrent acreage holdings, and recent acquisitions, we have identified a substantial inventory of approximately 4,1003,600 gross capital projects for horizontal development, primarily through horizontal drilling in high-return, liquid-rich plays, as well as refractureplays. We have established a capital budget of $631 million for 2014 for drilling in the Wattenberg Field and recompletion opportunities.the Utica Shale and for other miscellaneous projects. Additionally, PDCM has established a capital budget for the Marcellus Shale, of which $16 million is our proportionate share.
Western Operating RegionWattenberg Field. Our primary focus in the liquid-rich Wattenberg Field is drilling in the horizontal Niobrara and Codell plays. We have beguntransitioned to multi-well pad drilling to further optimize costs and enhance horizontal drilling efficiencies in the Wattenberg Field. Pad drilling enables us to streamline the transition to increased well density in the horizontal Niobrara and Codell plays. We also maintain a vertical drilling inventory in the Niobrara and Codell formations. We currently estimate that we have 3,300 gross capital projects, which include over 1,400 gross proved and probable projects for the horizontal Niobrara and Codell.field. Depending upon commodity prices and the number of drilling rigs operating, we believe that thisour inventory of approximately 2,800 gross 3P horizontal projects in the field, together with refracturing and vertical Codell well opportunities, provides us with over 1020 years of drilling activity.
Of Approximately $467 million of our total2014 capital budget of $324 million for 2013, approximately 75%, or $245 million, is expected to be spent on development activities substantially allin the field, the majority of which is expected to be invested in the Wattenberg Field for an expanded horizontal Niobrara and Codell drilling program and participation in various non-operated projects.program. We plan to run a two-rigfour-rig program in the Wattenberg Field through the secondfirst quarter of the year2014 and add a thirdfifth drilling rig during the thirdsecond quarter. Under thisApproximately $100 million of the total Wattenberg Field capital budget is allocated for non-operated horizontal drilling program, weprojects. We expect to drill and operate approximately 63115 horizontal Niobrara or Codell wells and expect to participate in 2013.approximately
Additionally, we operate natural gas assets75 to 100 non-operated horizontal opportunities in the Piceance Basin in western Colorado and in northeast Colorado ("NECO"), where we focused on production optimization and increasing operating margins in 2012. On February 4, 2013, we entered into a purchase and sale agreement with certain affiliates of Caerus, pursuant to which we have agreed to sell our Piceance Basin, NECO and certain non-core Colorado oil and gas properties, leasehold mineral interests and related assets, including derivatives. See Note 19, Subsequent Events, to our consolidated financial statements included elsewhere in this report for additional information regarding the planned divestiture. There can be no assurance we will be successful in closing such divestiture.2014.
Eastern Operating RegionUtica Shale. We continue to delineate and develop our leasehold position in the Utica Shale. To date, we have drilled two vertical test wells to collect geologic data and two horizontal wells to test the productivity of the acreage. We currently estimate that we have approximately 200 gross projects for horizontal drilling in the Utica Shale.Shale and have spudded 13 horizontal wells through December 31, 2013. We are currently running a one-rig program in the Utica Shale and plan on adding a second drilling rig during the second half of 2014. In 2013,2014, we expect to devote approximately $53$162 million of our 20132014 capital program primarily toward drilling and completion activity and acquisition of additional acreage in the Utica Shale, where weShale. We plan to drill approximately five18 horizontal wells targeting the wet gas and crude oilcondensate windows of the play.play in 2014.
Our other focus in the Eastern Operating Region is onAppalachia-Marcellus Shale. In 2013, PDCM drilled 14 gross (7 net) and completed 10 gross (5 net) horizontal drillingwells in the Marcellus Shale in West Virginia. In 2012, PDCM completed a total of six gross (three net) horizontal wells and constructed various midstream assets to gather and compress its Marcellus gas. We currently estimate that we have approximately 600 gross projects for horizontal drilling in the Marcellus Shale. PDCM has elected to temporarily suspend drilling activities in the Marcellus Shale. In 2014, PDCM currently expects to drill a totalfocus on completion operations on the remaining four horizontal wells that were in-process as of 14 gross horizontal Marcellus wells in 2013.December 31, 2013 and on the continued development of midstream infrastructure.
Strategically acquireStrategic acquisitions
We typically pursue the acquisition of assets that have a balance of value in producing wells, behind-pipe reserves and high-quality undeveloped drilling locations. In 2010, we began seekingWe seek liquid-rich properties with large undeveloped drilling upside where we believe we can utilize our operational abilities to add shareholder value. We have an experienced team of management, engineering, geosciences and geosciencescommercial professionals who identify and evaluate acquisition opportunities.
Wattenberg Field. In June 2012, we completed theacquired certain assets from affiliates of Merit AcquisitionEnergy (the "Merit Acquisition") for an aggregate purchase price of approximately $304.6 million, after certain post-closing adjustments. We financed the purchase with cash from the May 2012 offering of our common stock and a draw on our revolving credit
facility.. The acquired assets comprise approximately 29,80030,000 net acres after post-closing adjustments, located almost entirely in the core Wattenberg Field and with significant overlay within close proximity to our existingthen-existing acreage position. Following the closing of the Merit Acquisition, our total position in the core Wattenberg Field is now approximately 98,60097,000 net acres.
DuringUtica Shale. Since 2011, and 2012, we have acquired approximately 45,00048,000 net acres of Utica leaseholds, targeting the crude oil and wet natural gas and crude oil windows of the Utica Shale play throughout southeastern Ohio, for a purchase price of approximately $92.3 million.Ohio. As an early entrant into the development of the Utica Shale, we believe we have gained valuable experience and expertise in proactively addressing title and other issues associated with the development of the play.
Appalachia-Marcellus Shale. In October 2011, PDCM acquired 100% of the membership interests of Seneca-Upshur Petroleum, LLC ("Seneca-Upshur”) from an unrelated third-party for $139.2 million, of which our proportionate share was $69.6 million. The acquisition included approximately 1,340 gross wells producing natural gas from the shallow Upper Devonian Shale and Mississippian formationsformation and all rights and depths to an estimated 100,000 net acres in West Virginia, of which 90,000 acres are prospective for the Marcellus Shale.
Strategic divestitures
We continue to seek ways to optimize our asset portfolio as part of our business strategy. This may include divesting lower return assets and reinvesting in our stronger economic inventory. As a result, we have divested several assets over the past few years.
Colorado Dry Gas Assets. In June 2013, we completed the sale of our non-core Colorado dry gas assets, primarily natural gas producing properties located in the Piceance Basin, northeastern Colorado and other non-core areas, to certain affiliates of Caerus Oil and Gas LLC (“Caerus”) for consideration of $177.6 million, with an additional $17 million paid to our non-affiliated investor partners in our affiliated partnerships. The sale resulted in a pre-tax loss of $2.3 million. The proceeds from the asset disposal were used to pay down our revolving credit facility and to fund a portion of our 2013 capital budget.
Appalachian Shallow Upper Devonian Gas Assets. In October 2013, we executed a purchase and sale agreement for the sale of substantially all our shallow Upper Devonian (non-Marcellus Shale) Appalachian Basin crude oil and natural gas properties owned directly by us, as well as through our proportionate share of PDCM. The properties consisted of approximately 3,500 gross shallow producing wells, related facilities and associated leasehold acreage, limited to the Upper Devonian and shallower formations. Substantially all of the acreage acquired is held by production and isdivestiture closed in close proximity to PDCM's existing properties. Pursuant toDecember 2013 for aggregate consideration of approximately $20.6 million, of which our joint venture interest in PDCM, our portionshare of the purchase priceproceeds was approximately $69.65.1 million, subject to certain post-closing adjustments. Concurrent with the closing of the transaction, our $6.7 million irrevocable standby letter of credit and we hold a 50% interest in bothan agreement for firm transportation services were released and novated to the wellsbuyer. We retained all zones, formations and acreage acquired.intervals below the Upper Devonian formation, including the Marcellus Shale, Utica Shale and Huron Shale, as well as all Marcellus-related midstream assets.
In 2010,Permian Basin. During the fourth quarter of 2011, we initiated a plan to purchase our affiliated partnerships. Ascompleted the sale of December 31, 2012, we had acquiredcertain non-core Permian assets for a total of 12 affiliated partnerships for an aggregate purchase price of $107.713.2 million. The acquisitionIn December 2011, we executed a purchase and sale agreement with a subsidiary of these partnerships have provided us with immediate growthConcho Resources Inc. (“COG”), for the sale of our remaining Permian Basin assets and closed the transaction in both production and proved reserves from assets in which we currently own an operated working interest.February 2012. Total proceeds received were $189.2 million.
Manage operationalOperational and financial risk management
We focus on horizontal development drilling programs in resource plays that offer repeatable results capable of driving growth in reserves, production and cash flows. We regularlyperiodically review acquisition opportunities in our core areas of operation as we believe we can extract additional value from such assets through production optimization, refractures andrefracturing, recompletions and development drilling. In addition, core
acquisitions can potentially provide synergies that result in economies of scale from a combined position. While we believe development drilling will remain the foundation of our capital programs, we expect to continue our disciplined approach to acquisitions and exploratory drilling, both of which have the potential to identify new development opportunities.drilling.
We believe we proactively employ strategies to help reduce the financial risks associated with the oil and gasour industry. One such strategy is to maintain a balanced production mix of liquids and natural gas. During 2013, we produced crude oil, natural gas and liquids. Our Western Operating Region produces natural gas, NGLs and crude oil, with a production mix of approximately 60.5%53% liquids and 47% natural gas to 39.5% liquids during 2012. We expect that the Merit Acquisition and our horizontal drilling program will allow us to substantially increase our crude oil and NGL production. While our legacy properties in the Eastern Operating Region primarily produce natural gas, our Ohio properties are prospective in the wet gas and crude oil windows of the Utica Shale.gas. This strategy of a diversified commodity mix helps to mitigate the financial impact from a decline in the market price inof any one of our commodities. In addition, we utilize commodity-based derivative instruments to manage a substantial portion of our exposure to price volatility with regard to our crude oil and natural gas and crude oil sales and natural gas marketing. As of December 31, 2012,2013, we had natural gas and crude oil derivative positions in place for 20132014 covering approximately 28.7 Bcfe of our natural gas production and approximately 2,3264,112 MBbls of our crude oil production and approximately 20 Bcf of our natural gas production. Currently, we do not hedge our NGL production. See Part II, Item 7A, Quantitative and Qualitative Disclosures aboutAbout Market Risk, for a detailed summary of our open derivative positions.
Selective exploration
We believe that ourHistorically, we have pursued a disciplined exploration program has the potentialintended to consistently replenish our portfolio with new exploration projects capable of positioningand to position us for significant production and reserve growth in future years. Due to the continued decline in natural gas prices, weOur efforts have focused our efforts towardon liquid-rich plays to take advantage of the current attractive economics associated with crude oil and NGL weightedNGL-weighted projects. We strivehave attempted to identify potential plays in their early stages in an attemptorder to accumulate significant leasehold positions prior to competitive forces driving up the cost of entry. We seek investmententry and to invest in leasehold positions that arewere in the proximity of existing or emerging pipeline infrastructures. We believe the leasehold we acquired targeting themidstream infrastructure. The Utica Shale meets these criteria and we see the derisking and delineation of this leasehold aswas our primary exploration focus during for 2013.the past few years. Our operations in the Utica Shale have now shifted to developmental drilling and delineation. We do not expect significant exploration activity in 2014, as our main focus is expected to be on organic growth through developmental drilling.
Business Segments
We divide our operating activities into two segments: (1) Oil and Gas Exploration and Production and (2) Gas Marketing.
Oil and Gas Exploration and Production
Our Oil and Gas Exploration and Production segment primarily reflects revenues and expenses from the production and sale of crude oil, natural gas and NGLs. The prices we receive for our crude oil, natural gas and NGLs vary based on the terms of applicable purchase contracts.
Crude oil. We do not refine any of our crude oil production. In the Wattenberg Field, crude oil is sold at each individual well site and transported by the purchasers via truck, pipeline or rail to local and non-local markets under various purchase contracts with monthly pricing provisions based on a differential to the average monthly NYMEX price. In the Utica Shale, crude oil.oil and condensate is sold to local purchasers at each individual well site based on a differential to the average monthly NYMEX price and is typically transported by the purchasers via truck to local refineries, rail facilities or barge loading terminals on the Ohio River. We currently have no long-term firm transportation agreements related to our crude oil production.
Natural gas. We primarily sell our natural gas to midstream service providers, marketers, utilities, industrial end-users and other wholesale purchasers. We generally sell the natural gas that we produce under contracts with indexed or NYMEX monthly pricing provisions, with the remaining production sold under contracts with daily pricing provisions. Virtually all of our contracts include provisions whereinwhereby prices change monthly with changes in the market, for whichwith certain adjustments that may be made based on whether a well delivers
to a gathering or transmission line and the quality of the natural gas. Therefore, the price of the natural gas fluctuates to remain competitive with other available natural gas supplies. AsIn certain instances, we enter into firm transportation, processing and sales agreements to provide for pipeline capacity to flow and sell a result, our revenues from the sale of natural gas, holding production volume constant, increase as market prices increase and decrease as market prices decline. We believe that the pricing provisionsportion of our natural gas contractsvolumes. In some cases, in order to meet pipeline specifications, our natural gas must be processed before we can transport it. We also have interruptible transportation agreements in place in certain areas where adequate transportation capacity is believed to be available. We may also enter into firm sales agreements to ensure that we are customaryselling to a purchaser who has contracted for pipeline capacity. See Note 11, Commitments and Contingencies - Firm Transportation, Processing and Sales Agreements, to our consolidated financial statements included elsewhere in this report for a discussion of our long-term firm sales, processing and transportation agreements for pipeline capacity. In the Wattenberg Field, the majority of our leasehold is dedicated to our primary midstream provider, DCP Midstream, which gathers and processes wet natural gas produced in the industry.basin and sells our residue gas to various markets. In the Utica Shale, wet natural gas produced in our northern acreage is gathered and processed pursuant to a firm transportation agreement with Markwest Utica EMG while wet natural gas produced in our southern acreage is gathered and processed by Blue Racer Midstream LLC. We market our Utica residue gas to various purchasers based on pipeline basis or NYMEX pricing. In the Appalachia-Marcellus Shale, our dry natural gas is gathered and transported to a market hub pursuant to a firm transportation agreement with Equitrans LP and an interruptible agreement with Momentum. We sell the dry natural gas to various marketers at a price primarily based on spot gas delivered to the Texas Eastern Transmission pipeline M-2 point, less transportation costs.
NGLs. TheWe produce NGLs in the Wattenberg Field and Utica Shale. In the Wattenberg Field, the majority of our NGLs are sold at the tailgate of DCP Midstream processing plants based on prices of NGL deliveries to one NGL marketerthe Conway hub in Kansas. In the Wattenberg Field.Utica Shale, the majority of our NGLs are fractionated and marketed by Markwest Utica EMG and Blue Racer Midstream LLC and
sold based on month-to-month pricing in various markets. Our NGL production is sold under both short- and long-term purchase contracts with monthly pricing provisions based on an average daily price.
Crude oil. We do not refine any of our crude oil production. We sell our crude oil to oil marketers and refiners. Our crude oil production is sold to purchasers at or near our wells under both short- and long-term purchase contracts with monthly pricing provisions based on an average daily price.
contracts.
We enter into financial derivatives in order to reduce the impact of possible price volatility regarding the physical sales market. See Part II, Item 7, Management's Discussion and Analysis of Financial Condition and Results of Operations: Results of Operations - Commodity Price Risk Management, Net, Natural Gas and Crude Oil Derivative Activities, Item 7A, Quantitative and Qualitative Disclosures about Market Risk, and and Note 4, Derivative Financial Instruments, to our consolidated financial statements included elsewhere in this report.
Our Oil and Gas Exploration and Production segment also reflects revenues and expenses related to well operations and pipeline services. We are paid a monthly operating fee for the portion of each well we operate that is owned by others, including our affiliated partnerships. We believe the fee is competitive with rates charged by other operators in the area. As we acquire the working interest of our non-affiliated investor partners in our affiliated partnerships, revenues related to well operations and pipeline services will decrease.
We construct, own and operate gathering systems in some of our areas ofAppalachia-Marcellus Shale operations. Pipelines and related facilities can represent a significant portion of the capital costs of developing wells, particularly in new areas located at a distance from existing pipelines. We consider these costs in the evaluation of our leasing, development and acquisition opportunities.
Our natural gas is transported through our own and third-party gathering systems and pipelines and we incur gathering, processing and transportation expenses to move our natural gas from the wellhead to a purchaser-specified delivery point. These expenses vary based upon the volume and distance shipped, as well as the fee charged by the third-party processor or transporter. Like most producers, we rely on our third-party midstream service providers to construct compression, gathering and processing facilities to keep pace with our production growth. As a result, the timing and availability of additional facilities going forward is beyond our control. Capacity on these gathering systems and pipelines is occasionally interruptedreduced due to operational issues, repairs or improvements. A portion of our natural gas is transported under interruptible contracts and the remainder under firm transportation agreements, either directly with RNGour subsidiary Riley Natural Gas ("RNG"), or through third-party processors or marketers. Therefore, interruptions in natural gas sales could result if pipeline space is constrained. As discussed in Part II, Item 7, Management's Discussion and Analysis of Financial Condition and Results of Operations - Operational Overview, our 2012Our Wattenberg Field production was adversely affectedimpacted by high line pressures experiencedon the gathering system operated by our principal third-party providerDCP Midstream during the spring and summer months of natural gas gathering, processing2012 and transportation facilities2013. We, and other operators in the Wattenberg Field. The high line pressure was the result of a series of operational issues and capacity constraints, primarily in the second and third quarters. The operational issues included downtime on downstream third-party NGL transportation and fractionation facilities and abnormally warm weather, which limited third-party gathering system compression capacity. Wefield, are working closely with our primary midstream provider whoDCP Midstream in the Wattenberg Field, which is implementing a multi-year facility expansion capableprogram. The program is increasing midstream system capacity and helping to mitigate the impact of significantly increasing long-termincreased production volumes on system pressures. Although we expect system pressures to fluctuate and constrain production from time to time, we believe that this expansion will provide the additional gathering and processing capacity in the Wattenberg Field. However, we do not expect the impact of this increased capacitysystem necessary to substantially benefit us until late 2013. Whileincrease our ability to market these volumes of natural gas has been only infrequently limited or delayed, if transportation space is restricted or is unavailable, our production and cash flows from the affected properties could be adversely affected.
In certain instances, we enter into firm transportation agreements to provide for pipeline capacity to flow and sell a portion of our natural gas volumes. In order to meet pipeline specifications, we are required, in some cases, to process our natural gas beforeconfidence that we can transport it. We typically contract with third parties in the NECO area ofcontinue to produce and market our Western Operating Region and our Eastern Operating Region for firm transportation of our natural gas. We also may enter into firm sales agreements to ensure that we are selling to a purchaser who has contracted for pipeline capacity. See Note 11, Commitments and Contingencies - Firm Transportation Agreements, to our consolidated financial statements included elsewhere in this report for our long-term firm sales, processing and transportation agreements for pipeline capacity.
Our crude oil production is marketed directly to purchasers in the Wattenberg Field area under a combination of annual and short-term monthly agreements. The majority of our crude oil is delivered to local area refineries with other volumes being either trucked or shipped via pipeline out of the Wattenberg area.production.
See Part II, Item 7, Management's Discussion and Analysis of Financial Condition and Results of Operations - Results of Operations, Summary Operating Results, for production, sales, pricespricing and lifting cost data for each of the years in the three-year period ended December 31, 2012.data.
Gas Marketing
Our Gas Marketing segment is comprised solely of the operating activities of RNG. RNG specializes in the purchase, aggregation and sale of natural gas production in the Eastern Operating Region.Utica Shale and Appalachia-Marcellus Shale. RNG purchases for resale natural gas produced by third-party producers, as well as natural gas produced by us PDCM and our affiliated partnerships.PDCM. The natural gas is marketed to third-party marketers, natural gas utilities and industrial and commercial customers, either directly through our gathering system or through transportation services provided by regulated interstateinterstate/intrastate pipeline companies. Additionally, RNG markets our natural gas production in the NECO area.
For additional information regarding our business segments, see Note 18,17, Business Segments, to our consolidated financial statements included elsewhere in this report.
Areas of Operations
The following map presents the general locations of our development production and explorationproduction activities as of December 31, 2012. With the divestiture of our Permian Basin assets on February 28, 2012, our development, production and exploration efforts are primarily focused in two geographic areas of the U.S.
___________
(1) 2013On February 4, 2013, we entered into a purchase and sale agreement with certain affiliates of Caerus, pursuant to which we have agreed to sell our Piceance Basin, NECO and certain non-core Colorado oil and gas properties, leasehold mineral interests and related assets, including derivatives. See Note 19, Subsequent Events, to our consolidated financial statements included elsewhere in this report for additional information regarding the planned divestiture. There can be no assurance we will be successful in closing such divestiture..
Western Operating Region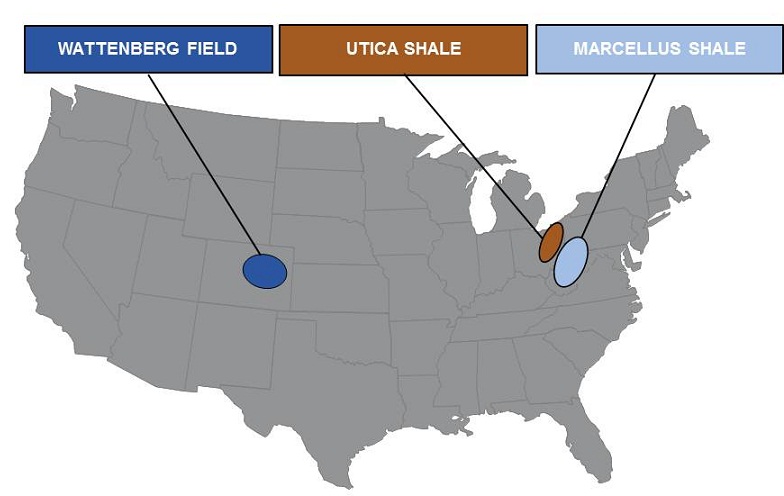
Our primary focus in the Western Operating Region for 2013, and we expect for the next several years, is on horizontal Niobrara and Codell development drilling. We divide our Western Operating Region into the following areas:
Wattenberg Field area, DJ Basin, Colorado. Currently, horizontal wells drilled in this area are horizontal wells targetingtarget the liquid-rich reservoirs in the Codell and Niobrara formations.formations where we have acquired approximately 97,000 net acres. These horizontal wells have a vertical depth rangeranging from approximately 7,0006,500 to 8,0007,500 feet, with an average lateral lengthlengths of approximately 4,000 feet. We drill multi-well pads to further optimize costs and enhance horizontal drilling efficiencies in the Wattenberg Field.5,000 feet. Pad drilling enables us to streamline the transition to increased well density in the horizontal Niobrara and Codell plays.plays and optimize costs. We currently estimate that we have approximately 3,3002,800 gross projects, including over 1,400 proved and probable horizontal capital projects in the liquid-rich Wattenberg Field.Field in inventory, as well as other refracture and vertical Codell well opportunities.
In June 2012, we completed an acquisition of approximately 29,800 net acres in the core area, which positions us as the third largest producer and leaseholder in the core Wattenberg area. We estimate that the Wattenberg Field has approximately 400 horizontal drilling locations based on 4 gross wells per section for our proved undeveloped reserves ("PUDs"). Additional potential upside exists as we continue testing the Codell formation and plan to test downspacing to 10 gross wells per section in the play as part of our 2013 horizontal program, which is the basis for our estimate of over 1,400 horizontal wells in our proved and probable inventory.
Piceance Basin, Colorado. Wells in thisUtica Shale area, predominately target natural gas from the Williams Fork formation. For 2012, we removed all PUD reserves in the Piceance Basin due to low natural gas prices. Our 2012 Piceance natural gas reserves were 66.5 Bcfe, or approximately 6% of our total proved equivalent reserves. Our Piceance reserves represent approximately 2% of our
PV-10% as of December 31, 2012. See table in the Properties - Proved Reserves section below for information regarding our proved reserves and PV-10% as of December 31, 2012.
The majority of the wells drilled in this area are drilled directionally from multi-well drilling pads, generally range from two to ten wells per pad and range from 7,000 to 9,500 feet in depth. Reserves in this area originate from multiple sandstone reservoirs in the Mesaverde Williams Fork formation. Well spacing is approximately ten acres per well.
Northeastern Colorado.southeastern Ohio. Wells drilled in this area range from 1,500 to 3,000 feet in depth andprimarily target natural gas reserves in the shallow Niobrara reservoir. Well spacing is approximately 40 acres per well.
As noted above, on February 4, 2013, we entered into a purchase and sale agreement with Caerus pursuant to which Caerus agreed to purchase our Piceance Basin, NECO and other non-core Colorado leasehold mineral interests and various other assets within these basins for an aggregate cash considerationPoint Pleasant member of approximately $200 million, subject to post-closing adjustments. The cash consideration is subject to customary adjustments, including adjustments based upon title and environmental due diligence, and by certain firm transportation obligations and natural gas hedging positions that will be assumed by Caerus as part of the transaction. The effective date of the transaction is January 1, 2013. We intend to use the proceeds from the sale to repay a portion of amounts outstanding under our revolving credit facility and partially fund our 2013 capital program. There can be no assurance we will be successful in closing such divestiture.
Eastern Operating Region
Our primary focus in the Eastern Operating Region is on horizontal drilling in the Utica Shale in southeastern Ohio and the Marcellus Shale play in northern West Virginia.
Utica Shale, Ohio. formation. We have acquired approximately 45,00048,000 net acres targeting the condensate and wet natural gas and crude oil windows of the Utica Shale play throughout southeastern Ohio. To date,Ohio and we currently estimate that we have drilled and completed twoapproximately 200 gross projects for horizontal wellsdrilling in Guernsey County that are currently waiting on first production, as well as two stratigraphic vertical test wells to collect engineering and geologic data to test the productivity of the acreage.Utica Shale. The horizontal wells have a vertical depth rangeranging from approximately 7,000 to 8,000 feet, with lateral lengths of approximately 7,000 feet, with an average lateral length of 4,000 to 7,500 feet.
MarcellusAppalachia-Marcellus Shale area, West Virginia. Through our joint venture,Wells drilled in this area are primarily horizontal wells targeting the Marcellus Shale. PDCM we have over 236,000has approximately 66,000 net acres in the Appalachian Basin, with approximately 152,000 acres prospective for the Marcellus Shale, the majority of which is in northern West Virginia.Shale. PDCM is primarily focused on horizontal drilling and has approximately 600 gross Marcellus Shale gross drilling locations on the West Virginia acreage. These horizontal wells have a vertical depth rangeranging from approximately 7,000 to 8,000 feet, with lateral lengths ranging fromof approximately 4,000 to 6,0006,500 feet.
In additionDecember 2013, PDCM closed on a transaction pursuant to our ownership interest inwhich substantially all of the wells held by PDCM, we own an interest in approximately 236 gross (77.9 net) natural gas and crude oil wells in West Virginia and Pennsylvania.producing from the shallow Upper Devonian Shale formation (non-Marcellus Shale) were sold.
Properties
Productive Wells
The following table presents our productive wells:wells:
|
| | | | | | | | | | | | | | | | | | |
| | | Productive Wells |
| | | As of December 31, 2012 |
| | | Natural Gas | | Crude Oil | | Total |
| Operating Region/Area | | Gross | | Net | | Gross | | Net | | Gross | | Net |
| Western | | | | | | | | | | | | |
| Wattenberg Field | | 2,523 |
| | 2,181.2 |
| | 91 |
| | 71.8 |
| | 2,614 |
| | 2,253.0 |
|
| Other | | 1,057 |
| | 800.7 |
| | — |
| | — |
| | 1,057 |
| | 800.7 |
|
| Total Western | | 3,580 |
| | 2,981.9 |
| | 91 |
| | 71.8 |
| | 3,671 |
| | 3,053.7 |
|
| Eastern | | | | | | | | | | | | |
| Appalachian Basin | | 3,565 |
| | 1,654.5 |
| | 6 |
| | 3.7 |
| | 3,571 |
| | 1,658.2 |
|
| Total Eastern | | 3,565 |
| | 1,654.5 |
| | 6 |
| | 3.7 |
| | 3,571 |
| | 1,658.2 |
|
| Total productive wells | | 7,145 |
| | 4,636.4 |
| | 97 |
| | 75.5 |
| | 7,242 |
| | 4,711.9 |
|
| | | | | | | | | | | | | |
|
| | | | | | | | | | | | | | | | | | |
| | | Productive Wells |
| | | As of December 31, 2013 |
| | | Crude Oil | | Natural Gas | | Total |
| Operating Region/Area | | Gross | | Net | | Gross | | Net | | Gross | | Net |
| Wattenberg Field | | 207 |
| | 138.1 |
| | 2,497 |
| | 2,156.7 |
| | 2,704 |
| | 2,294.8 |
|
| Utica Shale | | 10 |
| | 7.7 |
| | 3 |
| | 3.0 |
| | 13 |
| | 10.7 |
|
| Appalachia-Marcellus Shale | | — |
| | — |
| | 374 |
| | 140.5 |
| | 374 |
| | 140.5 |
|
| Total productive wells | | 217 |
| | 145.8 |
| | 2,874 |
| | 2,300.2 |
| | 3,091 |
| | 2,446.0 |
|
| | | | | | | | | | | | | |
Proved Reserves
Our proved reserves are sensitive to future crude oil, natural gas NGLs and crude oilNGLs sales prices and the related effect on the economic productive life of producing properties. Increases in commodity prices may result in a longer economic productive life of a property or result in recognition of more economically viable proved undeveloped reserves to be recognized.reserves. Decreases in commodity prices may result in negative impacts of this nature.
All of our proved reserves are located onshore in the U.S. Our proved reserve estimates are prepared with respect to reserve categorization, using the definitions for proved reserves set forth in SEC Regulation S-X, Rule 4-10(a) and subsequentapplicable SEC staff regulations, interpretations and guidance. As of December 31, 2012,2013, all of our proved reserves, including the reserves of all subsidiaries consolidated for the purposes of our financial statements, have been estimated by independent petroleum engineers.Ryder Scott.
We have a comprehensive process that governs the determination and reporting of our proved reserves. As part of our internal control process, our reserves are reviewed annually by an internal team composed of reservoir engineers, geologists and accounting personnel for adherence to SEC guidelines through a detailed review of land records, available geological and reservoir data, as well as production performance data. The process includes a review of applicable working and net revenue interests and cost and performance data. The internal team compiles the reviewed data and forwards the data to anthe independent engineering firm engaged to estimate our reserves.
Our proved reserve estimates as of December 31, 20122013 were based on a reserve report prepared by Ryder Scott. When preparing our reserve estimates, Ryder Scott did not independently verify the accuracy and completeness of information and data furnished by us with respect to ownership interests, production volumes, well test data, historical costs of operations and development, product prices or any agreements relating to current and future operations of properties and sales of production.
Ryder Scott prepares an estimate of our reserves in conjunction with an ongoing review by our engineers. A final comparison of data is performed to ensure that the reserve estimates are complete, determined bypursuant to acceptable industry methods and towith a level of detail we deem appropriate. Ryder Scott'sThe final estimated reserve report is reviewed and approved by our engineering staff and management.management prior to issuance by Ryder Scott.
The professional qualifications of the internal lead engineer primarily responsible for overseeing the preparation of our reserve estimates meetqualify the standards ofengineer as a Reserves Estimator, as defined in the Standards Pertaining to the Estimating and Auditing of Oil and Gas Reserves Information as promulgated by the Society of Petroleum Engineers. This position is currently being held by an employee who holds a Bachelor of Science degree in Petroleum and Chemical Refining Engineering with a minor in Petroleum Engineering, has over 3536 years of experience in reservoir engineering, is a member of the Society of Petroleum Engineers and the Society of Petroleum Evaluation Engineers and is a registered Professional Engineer in the State of Colorado.
The SEC's reserve rulesrule has expanded the technologies that a registrant may use to establish reserves. The SEC now allows use of techniques that have been proved effective by actual production from projects in the same reservoir or an analogous reservoir, or by other evidence using reliable technology that establishes reasonable certainty. Reliable technology is a grouping of one or more technologies (including computational methods) that has been field tested and has been demonstrated to provide reasonably certain results with consistency and repeatability in the formation being evaluated or in an analogous formation.
All of our proved undeveloped reserves conform to the SEC five-year rule requirement as all proved undeveloped locations are scheduled, according to an adopted development plan, to be drilled within five years of each location’s initial booking date.
We used a combination of production and pressure performance, wireline wellbore measurements, offset analogies, seismic data and interpretation, wireline formation tests, geophysical logs and core data to calculate our reserve estimates, including the material additions to the 20122013 reserve estimates.
Reserve estimates involve judgments and therefore, cannot be measured exactly. The estimates must be reviewed periodically and adjusted to reflect additional information gained from reservoir performance, new geological and geophysical data and economic changes. Neither the estimated future net cash flows nor the standardized measure of discounted future net cash flows ("standardized measure") is intended to represent the current market value of our proved reserves. For additional information regarding both of these measures, as well as other information regarding our proved reserves, see the unaudited Supplemental Information - Crude Oil and Natural Gas and Crude Oil Information provided with our consolidated financial statements included elsewhere in this report. The following tables provide information regarding our estimated proved reserves:
|
| | | | | | | | | | | |
| | As of December 31, |
| | 2012 (5) | | 2011 (4)(5) | | 2010 (4)(5) |
| Proved reserves | | | | | |
Natural gas (MMcf) | 604,038 |
| | 672,145 |
| | 657,306 |
|
Crude oil and condensate (MBbls) (1) | 59,310 |
| | 37,636 |
| | 23,236 |
|
NGLs (MBbls) (1) | 32,827 |
| | 19,588 |
| | 10,649 |
|
Total proved reserves (MMcfe) | 1,156,860 |
| | 1,015,489 |
| | 860,616 |
|
Proved developed reserves (MMcfe) (2) | 490,515 |
| | 471,347 |
| | 301,141 |
|
Estimated future net cash flows (in millions) | $ | 2,756 |
| | $ | 2,290 |
| | $ | 1,315 |
|
PV-10% (in millions) (3) | $ | 1,709 |
| | $ | 1,350 |
| | $ | 693 |
|
Standardized measure (in millions) | $ | 1,168 |
| | $ | 941 |
| | $ | 488 |
|
|
| | | | | | | | | | | |
| | As of December 31, |
| | 2013 | | 2012 (3)(4) | | 2011 (3)(4)(5) |
| Proved reserves | | | | | |
Crude oil and condensate (MMBbls) | 94 |
| | 59 |
| | 38 |
|
Natural gas (Bcf) | 740 |
| | 604 |
| | 672 |
|
NGLs (MMBbls) | 49 |
| | 33 |
| | 20 |
|
Total proved reserves (MMBoe) | 266 |
| | 193 |
| | 169 |
|
Proved developed reserves (MMBoe) | 76 |
| | 82 |
| | 79 |
|
Estimated future net cash flows (in millions) (1) | $ | 4,323 |
| | $ | 2,756 |
| | $ | 2,290 |
|
PV-10 (in millions) (2) | $ | 2,704 |
| | $ | 1,709 |
| | $ | 1,350 |
|
Standardized measure (in millions) | $ | 1,782 |
| | $ | 1,168 |
| | $ | 941 |
|
___________
| |
| (1) | Approximately 49%Amount represents undiscounted pre-tax future net cash flows estimated by Ryder Scott of the increase in crude oilapproximately $6.4 billion, $4.0 billion and condensate and 38%$3.2 billion as of the increase in NGLs from December 31, 2013, 2012 and 2011, to December 31, 2012 is due to the additionrespectively, less an internally estimated future income tax expense of horizontal Niobraraapproximately $2.1 billion, $1.2 billion and Codell proved developed and undeveloped reserves in the Wattenberg Field.
$0.9 billion, respectively. |
| |
| (2) | Approximately 73% of the increase in proved developed reserves from December 31, 2010 to December 31, 2011 was due to the reclassification of our estimated Wattenberg refracture reserves from PUDs to proved developed as a result of the greater cost differential between the cost of a refracture versus the cost of drilling a new well. |
| |
(3) | PV-10%PV-10 is a non-U.S. GAAP financial measure. This non-U.S. GAAP measures is not a measure of financial or operating performance under U.S. GAAP and it is not intended to represent the current market value of our estimated reserves. PV-10%PV-10 should not be considered in isolation or as a substitute for the standardized measure reported in accordance with U.S. GAAP, but rather should be considered in addition to the standardized measure. See Part I, Item 7. Management's Discussion and Analysis of Financial Condition and Results of Operations - Reconciliation of Non-U.S. GAAP Financial Measures, for a definition of PV-10%PV-10 and a reconciliation of our PV-10%PV-10 value to the standardized measure. |
| |
| (3) | Includes estimated reserve data related to our Piceance and NECO assets which were divested in June 2013. See Note 14, Assets Held for Sale, Divestitures and Discontinued Operations, to our consolidated financial statements included elsewhere in this report for additional details related to the divestiture of our Piceance and NECO assets. |
The following table sets forth information regarding estimated proved reserves for our Piceance and NECO assets:
|
| | | | | | | |
| | As of December 31, |
| | 2012 | | 2011 |
| Proved reserves | | | |
Crude oil and condensate (MMBbls) | 0.1 |
| | 0.4 |
|
Natural gas (Bcf) | 84 |
| | 354 |
|
Total proved reserves (MMBoe) | 14 |
| | 59 |
|
Proved developed reserves (MMBoe) | 14 |
| | 24 |
|
Estimated future net cash flows (in millions) | $ | 43 |
| | $ | 32 |
|
| |
| (4) | Includes estimated reserve data related to our shallow Upper Devonian (non-Marcellus Shale) Appalachian Basin crude oil and natural gas properties, which were divested in December 2013. See Note 14, Assets Held for Sale, Divestitures and Discontinued Operations, to our consolidated financial statements included elsewhere in this report for additional details related to these assets. |
The following table sets forth information regarding estimated proved reserves for our shallow Upper Devonian (non-Marcellus Shale) Appalachian Basin crude oil and natural gas properties:
|
| | | | | | | |
| | As of December 31, |
| | 2012 | | 2011 |
| Proved reserves | | | |
Natural gas (Bcf) | 11 |
| | 20 |
|
Total proved reserves (MMBoe) | 2 |
| | 3 |
|
Proved developed reserves (MMBoe) | 2 |
| | 3 |
|
Estimated future net cash flows (in millions) | $ | 3 |
| | $ | 15 |
|
| |
| (5) | Includes estimated reserve data related to our Permian assets, which were classified as held for sale as of December 31, 2011. On2011 and divested in February 28, 2012, the divestiture closed.2012. See Note 14, Assets Held for Sale, Divestitures and Discontinued Operations, to our consolidated financial statements included elsewhere in this report for additional details related to the divestiture of our Permian assets. |
The following table sets forth information regarding estimated proved reserves for our Permian assets:
|
| | | | | | | |
| | As of December 31, |
| | 2011 | | 2010 |
| Proved reserves | | | |
Natural gas (MMcf) | 6,242 |
| | 4,979 |
|
Crude oil and condensate (MBbls) | 7,825 |
| | 3,331 |
|
NGLs (MBbls) | 1,971 |
| | 1,190 |
|
Total proved reserves (MMcfe) | 65,018 |
| | 32,105 |
|
Proved developed reserves (MMcfe) | 15,940 |
| | 11,416 |
|
Estimated future net cash flows (in millions) | $ | 348 |
| | $ | 129 |
|
| |
(5) | Includes estimated reserve data related to our Piceance and NECO assets, which are to be divested pursuant to a purchase and sale agreement entered into on February 4, 2013. See Note 19, Subsequent Events, to our consolidated financial statements included elsewhere in this report for additional details related to the planned divestiture of our Piceance and NECO assets. |
The following table sets forth information regarding estimated proved reserves for our Piceance and NECO assets:
|
| | | | | | | | | | | |
| | As of December 31, |
| | 2012 | | 2011 | | 2010 |
| Proved reserves | | | | | |
Natural gas (MMcf) | 83,656 |
| | 354,080 |
| | 454,886 |
|
Crude oil and condensate (MBbls) | 148 |
| | 441 |
| | 548 |
|
NGLs (MBbls) | — |
| | — |
| | — |
|
Total proved reserves (MMcfe) | 84,544 |
| | 356,726 |
| | 458,174 |
|
Proved developed reserves (MMcfe) | 84,544 |
| | 141,802 |
| | 142,949 |
|
Estimated future net cash flows (in millions) | $ | 43 |
| | $ | 32 |
| | $ | 52 |
|
|
| | | | | | | | | | | | | | | |
| | | As of December 31, 2012 |
| Operating Region/Area | | Natural Gas
(MMcf) | | NGLs (MBbls) | | Crude Oil and Condensate (MBbls) | | Natural Gas
Equivalent
(MMcfe) | | Percent |
| Proved developed | | | | | | | | | | |
| Western | | | | | | | | | | |
| Wattenberg Field | | 158,192 |
| | 14,353 |
| | 20,226 |
| | 365,666 |
| | 74 | % |
| Piceance Basin | | 65,609 |
| | — |
| | 148 |
| | 66,497 |
| | 14 | % |
| Other | | 18,047 |
| | — |
| | — |
| | 18,047 |
| | 4 | % |
| Total Western | | 241,848 |
| | 14,353 |
| | 20,374 |
| | 450,210 |
| | 92 | % |
| Eastern | | | | | | | | | | |
| Appalachian Basin | | 40,077 |
| | — |
| | 38 |
| | 40,305 |
| | 8 | % |
| Total Eastern | | 40,077 |
| | — |
| | 38 |
| | 40,305 |
| | 8 | % |
| Total proved developed | | 281,925 |
| | 14,353 |
| | 20,412 |
| | 490,515 |
| | 100 | % |
| Proved undeveloped | | | | | |
| | | | |
| Western | | | | | |
| | | | |
| Wattenberg Field | | 183,618 |
| | 18,474 |
| | 38,898 |
| | 527,850 |
| | 79 | % |
| Total Western | | 183,618 |
| | 18,474 |
| | 38,898 |
| | 527,850 |
| | 79 | % |
| Eastern | | | | | | | | | | |
| Appalachian Basin | | 138,495 |
| | — |
| | — |
| | 138,495 |
| | 21 | % |
| Total Eastern | | 138,495 |
| | — |
| | — |
| | 138,495 |
| | 21 | % |
| Total proved undeveloped | | 322,113 |
| | 18,474 |
| | 38,898 |
| | 666,345 |
| | 100 | % |
| Proved reserves | | | | | | | | | | |
| Western | | | | | | | | | | |
| Wattenberg Field | | 341,810 |
| | 32,827 |
| | 59,124 |
| | 893,516 |
| | 77 | % |
| Piceance Basin | | 65,609 |
| | — |
| | 148 |
| | 66,497 |
| | 6 | % |
| Other | | 18,047 |
| | — |
| | — |
| | 18,047 |
| | 2 | % |
| Total Western | | 425,466 |
| | 32,827 |
| | 59,272 |
| | 978,060 |
| | 85 | % |
| Eastern | | | | | | | | | | |
| Appalachian Basin | | 178,572 |
| | — |
| | 38 |
| | 178,800 |
| | 15 | % |
| Total Eastern | | 178,572 |
| | — |
| | 38 |
| | 178,800 |
| | 15 | % |
| Total proved reserves | | 604,038 |
| | 32,827 |
| | 59,310 |
| | 1,156,860 |
| | 100 | % |
| | | | | | | | | | | |
Developed and Undeveloped Acreage |
| | | |
| | December 31, 2011 |
| Proved reserves | |
Crude oil and condensate (MMBbls) | 8 |
|
Natural gas (Bcf) | 6 |
|
NGLs (MMBbls) | 2 |
|
Total proved reserves (MMBoe) | 11 |
|
Proved developed reserves (MMBoe) | 3 |
|
Estimated future net cash flows (in millions) | $ | 348 |
|
The following table presents our estimated proved developed and undeveloped reserves as of developed and undeveloped lease acreageDecember 31, 2013:
|
| | | | | | | | | | | | | | | | | | | |
| | | As of December 31, 2012 |
| | | Developed | | Undeveloped (1) | | Total |
| Operating Region/Area | | Gross | | Net | | Gross | | Net | | Gross | | Net |
| Western | | | | | | | | | | | | |
| Wattenberg Field | | 92,300 |
| | 81,700 |
| | 33,100 |
| | 23,300 |
| | 125,400 |
| | 105,000 |
|
| Piceance Basin | | 3,100 |
| | 3,100 |
| | 4,900 |
| | 4,900 |
| | 8,000 |
| | 8,000 |
|
| NECO | | 23,600 |
| | 19,600 |
| | 64,600 |
| | 54,600 |
| | 88,200 |
| | 74,200 |
|
| Other | | — |
| | — |
| | 21,800 |
| | 17,700 |
| | 21,800 |
| | 17,700 |
|
| Total Western | | 119,000 |
| | 104,400 |
| | 124,400 |
| | 100,500 |
| | 243,400 |
| | 204,900 |
|
| Eastern | | | | | | | | | | | | |
| Appalachian Basin, other | — |
| 263,900 |
| | 107,300 |
| | 32,000 |
| | 17,950 |
| | 295,900 |
| | 125,250 |
|
| Utica Shale | | 800 |
| | 400 |
| | 48,200 |
| | 45,300 |
| | 49,000 |
| | 45,700 |
|
| Total Eastern | | 264,700 |
| | 107,700 |
| | 80,200 |
| | 63,250 |
| | 344,900 |
| | 170,950 |
|
| Total acreage | | 383,700 |
| | 212,100 |
| | 204,600 |
| | 163,750 |
| | 588,300 |
| | 375,850 |
|
| | | | | | | | | | | | | |
|
| | | | | | | | | | | | | | | |
| | | As of December 31, 2013 |
| Operating Region/Area | | Crude Oil and Condensate (MBbls) | | Natural Gas
(MMcf) | | NGLs (MBbls) | | Crude Oil
Equivalent
(MBoe) | | Percent |
| Proved developed | | | | | | | | | | |
| Wattenberg Field | | 22,611 |
| | 155,797 |
| | 14,360 |
| | 62,937 |
| | 83 | % |
| Utica Shale | | 1,385 |
| | 9,412 |
| | 465 |
| | 3,419 |
| | 5 | % |
| Appalachia-Marcellus Shale | | 1 |
| | 55,178 |
| | — |
| | 9,197 |
| | 12 | % |
| Total proved developed | | 23,997 |
| | 220,387 |
| | 14,825 |
| | 75,553 |
| | 100 | % |
| Proved undeveloped | | | | | | | | | | |
| Wattenberg Field | | 66,481 |
| | 302,272 |
| | 32,073 |
| | 148,933 |
| | 78 | % |
| Utica Shale | | 3,352 |
| | 34,936 |
| | 1,773 |
| | 10,947 |
| | 6 | % |
| Appalachia-Marcellus Shale | | — |
| | 182,045 |
| | — |
| | 30,341 |
| | 16 | % |
| Total proved undeveloped | | 69,833 |
| | 519,253 |
| | 33,846 |
| | 190,221 |
| | 100 | % |
| Proved reserves | | | | | | | | | | |
| Wattenberg Field | | 89,092 |
| | 458,069 |
| | 46,433 |
| | 211,870 |
| | 80 | % |
| Utica Shale | | 4,737 |
| | 44,348 |
| | 2,238 |
| | 14,366 |
| | 5 | % |
| Appalachia-Marcellus Shale | | 1 |
| | 237,223 |
| | — |
| | 39,538 |
| | 15 | % |
| Total proved reserves | | 93,830 |
| | 739,640 |
| | 48,671 |
| | 265,774 |
| | 100 | % |
| | | | | | | | | | | |
Developed and Undeveloped Acreage
The following table presents our developed and undeveloped lease acreage:
|
| | | | | | | | | | | | | | | | | | |
| | | As of December 31, 2013 |
| | | Developed | | Undeveloped (1) | | Total |
| Operating Region/Area | | Gross | | Net | | Gross | | Net | | Gross | | Net |
| Wattenberg Field | | 99,000 |
| | 88,700 |
| | 9,300 |
| | 7,900 |
| | 108,300 |
| | 96,600 |
|
| Utica Shale | | 2,400 |
| | 2,000 |
| | 50,300 |
| | 45,900 |
| | 52,700 |
| | 47,900 |
|
| Appalachia-Marcellus Shale | | 147,250 |
| | 60,250 |
| | 12,800 |
| | 5,250 |
| | 160,050 |
| | 65,500 |
|
| Total acreage | | 248,650 |
| | 150,950 |
| | 72,400 |
| | 59,050 |
| | 321,050 |
| | 210,000 |
|
| | | | | | | | | | | | | |
__________
| |
| (1) | With the exception of our Eastern Operating Region properties prospective for the Utica Shale, substantially all of our undeveloped acreage is related to leaseholds that are held by production. Approximately 10%3%, 5.6% and 16.5% of our undeveloped leaseholds expire during 2013, none of which is material to any one specific area. 2014, 2015 and 2016, respectively. |
Drilling Activity
The following table presents information regarding the number of wells drilled or participated in and the number of wells for which refractures and/or recompletions were performed:
|
| | | | | | | | | | | | | | | | | | |
| | | Drilling Activity |
| | | Year Ended December 31, |
| | 2012 | | 2011 | | 2010 |
| Operating Region | | Gross | | Net | | Gross | | Net | | Gross | | Net |
| Western (1) | | 57 |
|
| 39.0 |
|
| 186 |
|
| 139.6 |
|
| 204 |
|
| 164.9 |
|
| Eastern | | 6 |
| | 4.0 |
| | 9 |
| | 5.2 |
| | 9 |
| | 5.2 |
|
| Total wells drilled | | 63 |
| | 43.0 |
| | 195 |
| | 144.8 |
| | 213 |
| | 170.1 |
|
| Refractures and Recompletions (2) | | 85 |
| | 79.9 |
| | 192 |
| | 177.6 |
| | 46 |
| | 33.7 |
|
| | | | | | | | | | | | | |
|
| | | | | | | | | | | | | | | | | | |
| | | Drilling Activity |
| | | Year Ended December 31, |
| | | 2013 | | 2012 | | 2011 |
| Operating Region | | Gross | | Net | | Gross | | Net | | Gross | | Net |
| Wattenberg Field | | 119 |
| | 69.2 |
| | 57 |
| | 39.0 |
| | 145 |
| | 99.6 |
|
| Utica Shale | | 11 |
| | 9.2 |
| | 3 |
| | 2.5 |
| | 1 |
| | 0.8 |
|
| Appalachia-Marcellus Shale | | 14 |
| | 7.0 |
| | 3 |
| | 1.5 |
| | 6 |
| | 2.9 |
|
| Other (1)(2) | | — |
| | — |
| | — |
| | — |
| | 43 |
| | 41.5 |
|
| Total wells drilled | | 144 |
| | 85.4 |
| | 63 |
| | 43.0 |
| | 195 |
| | 144.8 |
|
| Refractures and recompletions (3) | | 5 |
| | 4.1 |
| | 85 |
| | 79.9 |
| | 192 |
| | 177.6 |
|
| | | | | | | | | | | | | |
__________
| |
| (1) | Includes drilling activity in Piceance and NECO operating regions, which were divested in June 2013. See Note 14, Assets Held for Sale, Divestitures and Discontinued Operations, to our consolidated financial statements included elsewhere in this report for additional details related to the divestiture of our Piceance and NECO assets. |
| |
| (2) | Includes drilling activity in the Permian Basin. As of December 31, 2011, our Permian assetsBasin operating region, which were held for sale and, ondivested in February 28, 2012, the divestiture closed.2012. See Note 14, Assets Held for Sale, Divestitures and Discontinued Operations, to our consolidated financial statements included elsewhere in this report for additional details related to the divestiture of our Permian assets. |
| |
(2)(3) | 83Substantially all of the refractures and recompletions in 2012 occurred in the Wattenberg Field. |
The following tables set forth our developmental and exploratory well drilling activity. There is no correlation between the number of productive wells completed during any period and the aggregate reserves attributable to those wells. Productive wells consist of wells spudded,, turned-in-line and producing during the period. In-process wells represent wells that are in the process of being drilled or have been drilled and are waiting to be fractured and/or for gas pipeline connection duringas of the period.date shown.
|
| | | | | | | | | | | | | | | | | | | | | | | | | | | |
| | | Net Development Well Drilling Activity |
| | | Year Ended December 31, |
| | | 2012 | | 2011 | | 2010 |
| Operating Region/Area | | Productive | | In-Process | | Dry | | Productive | | In-Process | | Dry | | Productive | | In-Process | | Dry |
| Western | | | | | | | | | | | | | | | | | | |
| Wattenberg Field | | 31.3 |
| | 7.7 | (2) | | — |
| | 86.5 |
| | 13.1 |
| | — |
| | 106.9 |
| | 26.5 |
| | — |
|
| Piceance Basin | | — |
| | — |
| | — |
| | 14.0 |
| | 3.0 |
| | — |
| | 18.0 |
| | 7.0 |
| | — |
|
| Permian Basin (1) | | — |
| | — |
| | — |
| | 14.5 |
| | 5.5 |
| | 2.0 |
| | — |
| | 5.0 |
| | — |
|
| Other | | — |
| | — |
| | — |
| | — |
| | — |
| | — |
| | 0.5 |
| | — |
| | — |
|
| Total Western | | 31.3 |
| | 7.7 |
| | — |
| | 115.0 |
| | 21.6 |
| | 2.0 |
| | 125.4 |
| | 38.5 |
| | — |
|
| Eastern | | | | | | | | | | | | | | | | | | |
| Appalachian Basin | | 1.5 |
| | — |
| | — |
| | 0.9 |
| | 2.0 |
| | — |
| | 0.6 |
| | 1.1 |
| | — |
|
| Total Eastern | | 1.5 |
| | — |
| | — |
| | 0.9 |
| | 2.0 |
| | — |
| | 0.6 |
| | 1.1 |
| | — |
|
| Total net development wells | | 32.8 |
| | 7.7 |
| | — |
| | 115.9 |
| | 23.6 |
| | 2.0 |
| | 126.0 |
| | 39.6 |
| | — |
|
| | | | | | | | | | | | | | | | | | | |
|
| | | | | | | | | | | | | | | | | | | | | | | | | | | |
| | | Net Development Well Drilling Activity |
| | | Year Ended December 31, |
| | | 2013 | | 2012 | | 2011 |
| Operating Region/Area | | Productive | | In-Process (3) | | Dry | | Productive | | In-Process | | Dry | | Productive | | In-Process | | Dry |
| Wattenberg Field | | 53.5 |
| | 15.6 |
| | 0.1 |
| | 31.3 |
| | 7.7 |
| | — |
| | 86.5 |
| | 13.1 |
| | — |
|
| Utica Shale | | 3.0 |
| | 2.0 |
| | — |
| | — |
| | — |
| | — |
| | — |
| | — |
| | — |
|
| Appalachia-Marcellus Shale | | 3.5 |
| | 2.0 |
| | — |
| | 1.5 |
| | — |
| | — |
| | 0.9 |
| | 2.0 |
| | — |
|
| Other (1)(2) | | — |
| | — |
| | — |
| | — |
| | — |
| | — |
| | 28.5 |
| | 8.5 |
| | 2.0 |
|
| Total net development wells | | 60.0 |
| | 19.6 |
| | 0.1 |
| | 32.8 |
| | 7.7 |
| | — |
| | 115.9 |
| | 23.6 |
| | 2.0 |
|
| | | | | | | | | | | | | | | | | | | |
__________
| |
| (1) | Our Piceance and NECO assets were divested in June 2013. See Note 14, Assets Held for Sale, Divestitures and Discontinued Operations, to our consolidated financial statements included elsewhere in this report for additional details related to the divestiture of our Piceance and NECO assets. |
| |
| (2) | As of December 31, 2011, our Permian assets were held for sale and onsubsequently divested in February 28, 2012, the divestiture closed.2012. See Note 14, Assets Held for Sale, Divestitures and Discontinued Operations, to our consolidated financial statements included elsewhere in this report for additional details related to the divestiture of our Permian assets. |
| |
(2)(3) | On a gross basis, wells in-process as of December 31, 20122013 consisted of 1032 wells in the Wattenberg Field.Field, 2 wells in the Utica Shale and 4 wells in the Appalachia-Marcellus Shale. |
|
| | | | | | | | | | | | | | | | | | | | | | | | | | | |
| | | Net Exploratory Well Drilling Activity |
| | | Year Ended December 31, |
| | | 2012 | | 2011 | | 2010 |
| Operating Region/Area | | Productive | | In-Process | | Dry | | Productive | | In-Process | | Dry | | Productive | | In-Process | | Dry |
| Western | | | | | | | | | | | | | | | | | | |
| Wattenberg Field | | — |
| | — |
| | — |
| | — |
| | — |
| | — |
| | — |
| | 1.0 |
| | — |
|
| Other | | — |
| | — |
| | — |
| | — |
| | 1.0 |
| | — |
| | — |
| | — |
| | — |
|
| Total Western | | — |
| | — |
| | — |
| | — |
| | 1.0 |
| | — |
| | — |
| | 1.0 |
| | — |
|
| Eastern | | | | | | | | | | | | | | | | | | |
| Appalachian Basin | | — |
| | 1.5 |
| | 1.0 |
| | — |
| | 2.3 |
| | — |
| | 2.8 |
| | 0.7 |
| | — |
|
| Total Eastern | | — |
| | 1.5 |
| | 1.0 |
| | — |
| | 2.3 |
| | — |
| | 2.8 |
| | 0.7 |
| | — |
|
| Total net exploratory wells | | — |
| | 1.5 |
| | 1.0 |
| | — |
| | 3.3 |
| | — |
| | 2.8 |
| | 1.7 |
| | — |
|
|
| | | | | | | | | | | | | | | | | | | | | | | | | | | |
| | | Net Exploratory Well Drilling Activity |
| | | Year Ended December 31, |
| | | 2013 | | 2012 | | 2011 |
| Operating Region/Area | | Productive | | In-Process | | Dry | | Productive | | In-Process | | Dry | | Productive | | In-Process | | Dry |
| Utica Shale | | 4.2 |
| | — |
| | — |
| | — |
| | 1.5 |
| | 1.7 |
| | — |
| | 2.3 |
| | — |
|
| Appalachia-Marcellus Shale | | 1.5 |
| | — |
| | — |
| | — |
| | — |
| | — |
| | — |
| | — |
| | — |
|
| Other | | — |
| | — |
| | — |
| | — |
| | — |
| | — |
| | — |
| | 1.0 |
| | — |
|
| Total net exploratory wells | | 5.7 |
| | — |
| | — |
| | — |
| | 1.5 |
| | 1.7 |
| | — |
| | 3.3 |
| | — |
|
Title to Properties
We believe that we hold good and defensible leasehold title to substantially all of our crude oil and natural gas and crude oil properties in accordance with standards generally accepted in the industry. As is customary in the industry, a preliminary title examination is typically conducted at the time the undeveloped properties are acquired. Prior to the commencement of drilling operations, a title examination is conducted and remedial curative work is performed with respect to discovered defects which we deem to be significant. Title examinations have been performed with respect to substantially all of our producing properties.
The properties we own are subject to royalty,, overriding royalty and other outstanding interests customary in the industry. The properties may also be subject to additional burdens, liens or encumbrances customary in the industry, including items such as operating agreements, current taxes, development obligations under crude oil and natural gas and crude oil leases, farm-out agreements and other restrictions. We do not believe that any of these burdens will materially interfere with our use of the properties.
Substantially all of our crude oil and natural gas and crude oil properties, excluding properties held by PDCM and our share of the limited partnerships that we sponsor, have been mortgaged or pledged as security for our revolving credit facility. Substantially all of our Eastern Operating Region properties, excluding our OhioAppalachia-Marcellus Shale properties have been pledged as security for PDCM's credit facility. See Note 8, Long-Term Debt, to our consolidated financial statements included elsewhere in this report.
Facilities
We lease 41,71045,015 square feet of office space in Denver, Colorado, which serves as our corporate offices, through December 2015. We own a 32,000 square feet administrative office building located in Bridgeport, West Virginia, where we also lease approximately 18,600 square feet of office space in a second building through October 2014.
We own or lease field operating facilities in the following locations:
Colorado: Evans, ParachuteColorado, Bridgeport, West Virginia and Wray
Pennsylvania: Indiana and Mahaffey
West Virginia: Bridgeport, Buckhannon and Glenville
Ohio: Marietta, Ohio.
Governmental Regulation
While the prices of crude oil and natural gas and crude oil are market driven, other aspects of our business and the industry in general are heavily regulated. The availability of a ready market for crude oil and natural gas and crude oil production depends on several factors that are beyond our control. These factors include, but are not limited to, regulation of production, federal and state regulations governing environmental quality and pollution control, the amount of crude oil and natural gas and crude oil available for sale, the availability of adequate pipeline and other transportation and processing facilities and the marketing of competitive fuels. In general, state and federal regulations are intended to protect consumers from unfair treatment and oppressive control, reduce environmental and health risks from the development and transportation of crude oil and natural gas, and crude oil, prevent misuse of crude oil and natural gas and crude oil and protect rights among owners in a common reservoir. Pipelines are subject to the jurisdiction of various federal, state and local agencies. In the western part of the U.S., governments own a large percentage of the land and control the right to develop natural gas and crude oil. Government leases may be subject to additional regulations and controls not common to private leases. We believe that we are in compliance with such statutes, rules, regulations and governmental orders in all material respects, although there can be no assurance that this is or will remain the case. The following summary discussion on the regulation of the U.S. oil and gas industry is not intended to constitute a complete discussion of the various statutes, rules, regulations and environmental directives to which our operations may be subject.
Regulation of Crude Oil and Natural Gas and Crude Oil Exploration and Production. Our exploration and production business is subject to various federal, state and local laws and regulations on the taxation of crude oil and natural gas, and crude oil, the development, production and marketing of crude oil and natural gas and crude oil and environmental and safety matters. ManyState and local laws and regulations require drilling permits and govern the spacing and density of wells, rates of production, water discharge, prevention of waste and other matters. Prior to commencing drilling activities for a well, we must procure permits and/or approvals for the various stages of the drilling process from the applicable state and local agencies where the well being drilled is located. Additionally, other regulated matters include:
bond requirements in order to drill or operate wells;
well locations;
drilling and casing methods;
surface use and restoration of well properties;
well plugging and abandoning;
fluid disposal; and
air emissions.
In addition, our drilling activities involve hydraulic fracturing,, which may be subject to additional federal and state disclosure and regulatory requirements discussed in "Environmental Matters" below and in Item 1A, Risk Factors.
Our operations are also subject to various conservation laws and regulations. These include the regulation of the size of drilling and spacing units or proration units, the density of wells which may be drilled and the unitization or pooling of properties.lands and leases. In this regard, some states allow the forced pooling or integration of tracts to facilitate exploration while other states rely primarily or exclusively on voluntary pooling of lands and leases. In areas where pooling is primarily or exclusively voluntary, it may be more difficult to form units, and therefore, more difficult to drill and develop a project if the operator ownsour leases where we own less than 100% of the leasehold.leases located within the proposed unit. State laws may establish
maximum rates of production from crude oil and natural gas and crude oil wells, generally prohibitingprohibit the venting or flaring of natural gas and imposingimpose certain requirements regarding the ratability of production. StateLeases covering state or federal leaseslands often include additional regulations and conditions. The effect of these conservation laws and regulations may limit the amount of crude oil and natural gas and crude oil we can produce from our wells and may limit the number of wells or the locations at which we can drill. Such laws and regulations may increase the costs of planning, designing, drilling, installing, operating and abandoning our crude oil and natural gas and crude oil wells and other facilities. These laws and regulations, and any others that are passed by the jurisdictions where we have production, can limit the total number of wells drilled or the allowable production from successful wells, which can limit our reserves. As a result, we are unable to predict the future cost or effect of complying with such regulations.
Regulation of Sales and Transportation of Natural Gas. We move natural gas through pipelines owned by other companies and sell natural gas to other companies that also utilize common carrier pipeline facilities. Natural gas pipeline interstate transmission and storage activities are subject to regulation by the Federal Energy Regulatory Commission ("FERC") under the Natural Gas Act of 1938 ("NGA") and under the Natural Gas Policy Act of 1978, and, as such, rates and charges for the transportation of natural gas in interstate commerce, accounting, and the
extension, enlargement or abandonment of its jurisdictional facilities, among other things, are subject to regulation. Each natural gas pipeline company holds certificates of public convenience and necessity issued by FERC authorizing ownership and operation of all pipelines, facilities and properties for which certificates are required under the NGA. Each natural gas pipeline company is also subject to the Natural Gas Pipeline Safety Act of 1968, as amended, which regulates safety requirements in the design, construction, operation and maintenance of interstate natural gas transmission facilities. FERC regulations govern how interstate pipelines communicate and do business with their affiliates. Interstate pipelines may not operate their pipeline systems to preferentially benefit their marketing affiliates.
Each interstate natural gas pipeline company establishes its rates primarily through FERC's rate-making process. Key determinants in the ratemaking process are:
costs of providing service, including depreciation expense;
allowed rate of return, including the equity component of the capital structure and related income taxes; and
volume throughput assumptions.
The availability, terms and cost of transportation affect our natural gas sales. Competition among suppliers has greatly increased and traditional long-term producer-pipeline contracts are rare.increased. Furthermore, gathering facilities of interstate pipelines are no longer regulated by FERC,is exempt from regulation under the Natural Gas Act, thus allowing gatherers to charge higher gatheringunregulated rates. Historically, producers were able to flow supplies into interstate pipelines on an interruptible basis; however, recently we have seen the increased need to acquire firm transportation on pipelines in order to avoid curtailments or shut-in gas, which could adversely affect cash flows from the affected area.
Additional proposals and proceedings that might affect the industry occur frequently in Congress, FERC, state commissions, state legislatures and the courts. The industry historically has been very heavily regulated; therefore, there is no assurance that the less stringentcurrent regulatory approach recently pursuedtaken by FERC and Congress will continue. We cannot determine to what extent our future operations and earnings will be affected by new legislation, new regulations, or changes in existing regulation, at federal, state or local levels.
Environmental Matters
Our operations are subject to numerous laws and regulations governing the discharge of materials into the environment or otherwise relating to environmental protection. Public interest indemand for the protection of the environment has increased dramatically in recent years. The trend of more expansive and restrictive environmental legislation and regulations is expected to continue. To the extent laws are enacted or other governmental actions are taken restrictingwhich restrict drilling or imposingimpose environmental protection requirements resulting in increased costs, our business and prospects may be adversely affected.
We generate wastes that may be subject to the Federal Resource Conservation and Recovery Act ("RCRA") and comparable state statutes. The U.S. Environmental Protection Agency ("EPA") and various state agencies have adopted requirements that limit the approved disposal methods for certain hazardous and non-hazardous wastes. Furthermore, certain wastes generated by our operations that are currently exempt from treatment as "hazardous wastes" may in the future be designated as "hazardous wastes," and therefore may subject us to more rigorous and costly operating and disposal requirements.
Hydraulic fracturing is commonly used to stimulate production of crude oil and/or natural gas and/or crude oil from dense subsurface rock formations. We routinely apply fracturing in our crude oil and natural gas and crude oil production programs. The process involves the injection of water, sand and additives under pressure into a targeted subsurface formation. The water and pressure create fractures in the rock formations, which are held open by the grains of sand, enabling the crude oil or natural gas to flow to the wellbore. The process is generally subject to regulation by state oil and gas commissions. However, the EPA recentlyhas asserted federal regulatory authority over certain fracturing activities involving diesel fuel under the federal Safe Drinking Water Act ("SDWA"), and has begun the process of draftingissued draft guidance documents related to this newly asserted regulatory authority. In addition,authority in February 2014. The guidance explains the EPA’s interpretation of the term “diesel fuel” for permitting purposes, describes existing Underground Injection Control Class II program requirements for permitting underground injection of diesel fuels in hydraulic fracturing and also provides recommendations for EPA permit writers in implementing these requirements. From time to time, Congress has considered legislation has been introduced before Congress, called the Fracturing Responsibility and Awareness of Chemicals Act, tothat would provide for federal regulation of hydraulic fracturing and to require disclosure of the chemicals used in the hydraulic fracturing process.
The White House Council on Environmental Quality continues to coordinate an administration-wide review of hydraulic fracturing. The EPA continues its study of the potential environmental effects of hydraulic fracturing on drinking water and groundwater, with final results
expected by December 2014. In addition, the U.S. Department of Energy is conducting an investigation into practices the agency could recommend to better protect the environment from drilling using hydraulic fracturing completion methods. These ongoing studies, depending on their degree of pursuit and any meaningful results obtained, could spur initiatives to further regulate hydraulic fracturing under the SDWA or other regulatory mechanisms. The U.S. Department of the Interior, through the Bureau of Land Management (the “BLM”), is also conducting a rulemaking to require disclosure of chemicals used, mandate well integrity measures and impose other requirements relating to hydraulic fracturing on federal lands.
Certain states in which we operate, including Colorado, Pennsylvania and Ohio, have adopted, and other states are considering adopting,additional regulations that could impose more stringent permitting, transparency and well construction requirements on hydraulic fracturing operations or otherwise seek to ban fracturing activities altogether. In December 2011,For example, Colorado adopted a fracturing chemical disclosure rule, whereinrequires that all chemicals used in the hydraulic fracturing of a well must be reported in a publicly searchable registry website developed and maintained by the Ground Water Protection Council and Interstate Oil and Gas Compact Commission ("Frac Focus"). The newColorado rules also require operators seeking new location approvals to provide certain disclosures regarding fracturinginformation to surface owners and adjacent property owners within 500 feet of a new well. In December 2012 and February 2013,Similarly, Colorado finalizedhas implemented a baseline groundwater sampling rule and a new rule governing setback distances of oil and gas wells located near population centers. In December 2013, the Colorado Oil and Gas Conservation Commission issued new, more restrictive rules regarding spill reporting and remediation. See further discussion in Item 1A, Risk Factors.
In December 2011, West Virginia enacted the Natural Gas Horizontal Well Control Act and amendments to existing laws that together establish a comprehensive, detailed system for permitting and regulation of horizontal natural gas wells. The new law applies to most proposed new natural gas wells. The law imposes far more detailed permitting and regulatory requirements than prior law and requires further study and authorizes potential rulemaking by the West Virginia Department of Environmental Protection ("DEP"). Among the new regulatory requirements are: detailed surface owner compensation requirements; performance standards applicable to disposal of drilling cuttings and associated drilling mud,mud; protection of quantity and quality of surface and groundwater systems; advance designation of water withdrawal locations to the DEP and recordkeeping and reporting for all flowback and produced water; and restrictions on well locations.
In early 2012, officials ofNovember 2013, the Ohio Department
of Natural Resources imposed a moratorium on injection drilling of wastewater from fracturing operations within a five-mile radius of a("ODNR") proposed draft regulations pertaining to well that was suspected as contributingpad construction requirements and increased bonding for construction. The rules are expected to the cause of earthquakesbe finalized in the area. Regulation was also enacted requiring the disclosure of chemicals used in hydraulic fracturing and any chemicals used when drilling through a drinking water zone.2014.
The White House Council on Environmental Quality is coordinating an administration-wide review of hydraulic fracturing practices and a committee of the U.S. House of Representatives has conducted an investigation of hydraulic fracturing practices. Furthermore, a number of federal agencies are analyzing, or have been requested to review, environmental issues associated with hydraulic fracturing. The EPA has commenced a study of the potential environmental effects of hydraulic fracturing on drinking water and groundwater, with final results expected by 2014. In addition, the U.S. Department of Energy is conducting an investigation into practices the agency could recommend to better protect the environment from drilling using hydraulic fracturing completion methods. The U.S. Department of the Interior is conducting a rule making, likely to result in new disclosure requirements and other mandates for hydraulic fracturing on federal lands. These ongoing studies, depending on their degree of pursuit and any meaningful results obtained, could spur initiatives to further regulate hydraulic fracturing under the SDWA or other regulatory mechanisms.
In Colorado, local governing bodies have begun to issue drilling moratoriums, develop jurisdictional siting, permitting and operating requirements and conduct air quality studies to identify potential public health impacts. For instance, in 2013, the City of Fort Collins, Colorado, adopted on February 19, 2013 a ban on drilling and fracturing of new wells within city limits. In the November 2013 election, voters in the cities of Boulder, Lafayette, Fort Collins and Brighton passed hydraulic fracturing bans. We do not currently have operations in any of these areas. In addition, as discussed in more detail in Item 1A. Risk Factors, a ballot initiative has been proposed in Colorado which, if approved and upheld, could greatly expand the right of local governments to limit or prohibit oil and natural gas production and development in their jurisdictions. If new laws or regulations that significantly restrict hydraulic fracturing or well locations continue to be adopted at local levels or are adopted at the state and local level, such laws could make it more difficult or costly for us to perform fracturing to stimulate production from dense subsurface rock formations and, in the event of local prohibitions against commercial production of natural gas, may preclude our ability to drill wells. If hydraulic fracturing becomes regulated at the federal level as a result of federal legislation or regulatory initiatives by the EPA or other federal agencies, our fracturing activities could become subject to additional permitting requirements and result in permitting delays, as well as potential increases in costs. Restrictions on hydraulic fracturing could also reduce the amount of crude oil and natural gas that we are ultimately able to produce from our reserves. We continue to be active in stakeholder and interest groups and to engage with regulatory agencies in an open, proactive dialogue.
We currently own or lease numerous properties that for many years have been used for the exploration and production of crude oil and natural gas and crude oil.gas. Although we believe that we have utilized good operating and waste disposal practices, and when necessary, appropriate remediation techniques, prior owners and operators of these properties may have operated prior to the enactment of applicable laws now governing these areas, or may not have utilized similar practices and techniques and hydrocarbons or other wastes may have been disposed of or released on or under the properties that we own or lease or on or under locations where such wastes have been taken for disposal. These properties and the wastes disposed thereon may be subject to the Comprehensive Environmental Response, Compensation and Liability Act ("CERCLA"), RCRA and analogous state laws, as well as state laws governing the management of crude oil and natural gas and crude oil wastes. Under such laws, we may be required to remove or remediate previously disposed wastes (including wastes disposed of or released by prior owners or operators) or remediate property contamination (including surface and groundwater contamination) or to perform remedial plugging operations to prevent future contamination.
CERCLA and similar state laws impose liability, without regard to fault or the legality of the original conduct, on certain classes of persons that are considered to have contributed to the release of a "hazardous substance" into the environment. These persons include the owner or operator of the disposal site or sites where the release occurred and companies that disposed of or arranged for the disposal of the hazardous substances found at the site. Persons who are or were responsible for release of hazardous substances under CERCLA may be subject to full liability for the costs of cleaning up the hazardous substances that have been released into the environment and for damages to natural resources, and it is not uncommon for neighboring landowners and other third parties to file claims for personal injury and property damage allegedly caused by the hazardous substances released into the environment. As an owner and operator of crude oil and natural gas and crude oil wells, we may be liable pursuant to CERCLA and similar state laws.
Our operations are subject to the federal Clean Air Act ("CAA") and comparable state and local requirements. Amendments to theThe CAA were adopted in 1990 and containcontains provisions that may result in the gradual imposition of certain pollution control requirements with respect to air emissions from our operations. The EPA and states have been developingcontinue the development of regulations to implement these requirements. We may be required to incur certain capital expenditures in the next several years for air pollution control equipment in connection with maintaining or obtaining operating permits and
approvals addressing other air emission-related issues. Greenhouse gas record keeping and reporting requirements of the CAA became effective in 2011 and will continue into the future with increased costs for administration and implementation of controls. TheFederal New Source Performance Standards regarding oil and gas operations ("NSPS 0000"OOOO") introduced by the EPA in 2011 became effective in 2012 addingand 2013, with additional NSPS provisions expected in 2014, all of which will add administrative and operational costs. Colorado partially adoptedcontinues to draft and adopt new regulations to meet the requirements of NSPS 0000 in 2012OOOO and will consider full adoption in 2013.promulgate significant rules relating specifically to crude oil and natural gas operations that are more stringent than NSPS OOOO and are expected to be finalized by March 2014.
The federal Clean Water Act ("CWA") and analogous state laws impose strict controls against the discharge of pollutants and fill material, including spills and leaks of crude oil and other substances. The CWA also requires approval and/or permits prior to construction, where construction will disturb wetlands or other waters of the U.S. The CWA also regulates storm water run-off from crude oil and natural gas and crude oil facilities and requires storm water discharge permits for certain activities. Spill Prevention, Control, and Countermeasure ("SPCC") requirements of the CWA require appropriate secondary containment loadout controls, piping controls, berms and other measures to help prevent the contamination of navigable waters in the event of a petroleum hydrocarbon spill, rupture or leak. The EPA and U.S. Army Corps of Engineers released a Connectivity Report in September 2013, which determined that all tributary streams, wetlands, open water in floodplains and riparian areas are connected. This report supported the drafting of new rules regarding what will be considered waters of the U.S. The new rules were submitted for inter-agency review in October 2013 and are expected to be available for public review by May 2014.
Crude oil production is subject to many of the same operating hazards and environmental concerns as natural gas production, but is also subject to the risk of crude oil spills. Federal regulations require certain owners or operators of facilities that store or otherwise handle crude oil, including us, to procure and implement additional SPCC measures relating to the possible discharge of crude oil into surface waters. The
Oil Pollution Act of 1990 ("OPA") subjects owners of facilities to strict joint and several liability for all containment and cleanup costs and certain other damages arising from crude oil spills. Noncompliance with OPA may result in varying civil and criminal penalties and liabilities. Historically, we have not experienced any significant crude oil discharge or crude oil spill problems. Our shift in production since mid-2010 to a greater percentage of crude oil enhancesincreases our risks related to soil and water contamination.
Our costs relating to protecting the environment have risen over the past few years and are expected to continue to rise in 20132014 and beyond. Environmental regulations have increased our costs and planning time, but have had no materially adverse effect on our ability to operate to date. However, no assurance can be given that environmental regulations or interpretations of such regulations will not, in the future, result in a curtailment of production or otherwise have a materially adverse effect on our business, financial condition or results of operations. See Note 11, Commitments and Contingencies, to our consolidated financial statements included elsewhere in this report.
Operating Hazards and Insurance
Our exploration and production operations include a variety of operating risks, including, but not limited to, the risk of fire, explosions, blowouts, cratering, pipe failure, casing collapse, abnormally pressured formations and environmental hazards such as gas leaks, ruptures and discharges of crude oil and natural gas and crude oil.gas. The occurrence of any of these events could result in substantial losses to us due to injury and loss of life, severe damage to and destruction of property, natural resources and equipment, pollution and other environmental damage, clean-up responsibilities, regulatory investigation and penalties and suspension of operations. Our pipeline, gathering and distribution operations are subject to the many hazards inherent in the industry. These hazards include damage to wells, pipelines and other related equipment, damage to property caused by hurricanes, floods, fires and other acts of God, inadvertent damage from construction equipment, leakage of natural gas and other hydrocarbons, fires and explosions and other hazards that could also result in personal injury and loss of life, pollution and suspension of operations. In September 2013, we experienced widespread flooding in our Wattenberg Field operations in Weld County, Colorado, which resulted in a shut-in of approximately 200 vertical wells, approximately 40 of which remained shut-in at December 31, 2013. We have incurred significant costs to replace damaged well equipment and to bring vertical wells back on-line. Assessment of the full economic impact of the flooding is on going.
Any significant problems related to our facilities could adversely affect our ability to conduct our operations. In accordance with customary industry practice, we maintain insurance against some, but not all, potential risks; however, there can be no assurance that such insurance will be adequate to cover any losses or exposure for liability. The occurrence of a significant event not fully insured against could materially adversely affect our operations and financial condition. We cannot predict whether insurance will continue to be available at premium levels that justify our purchase or will be available at all. Furthermore, we are not insured against our economic losses resulting from damage or destruction to third-party property, such as transportation pipelines, crude oil refineries or natural gas processing facilities. Such an event could result in significantly lower regional prices or our inability to deliver gas.our production.
Competition and Technological Changes
We believe that our exploration, drilling and production capabilities and the experience of our management and professional staff generally enable us to compete effectively. We encounter competition from numerous other crude oil and natural gas and crude oil companies, drilling and income programs and partnerships in all areas of operations, including drilling and marketing crude oil and natural gas and obtaining desirable crude oil and obtaining desirable natural gas and crude oil leases on producing properties. Many of these competitors possess larger staffs and greater financial resources than we do, which may enable them to identify and acquire desirable producing properties and drilling prospects more economically. Our ability to explore for crude oil and natural gas and crude oil prospects and to acquire additional properties in the future depends upon our ability to conduct our operations, evaluate and select suitable properties and consummate transactions in this highly competitive environment. We also face intense competition in the marketing of natural gas from competitors including other producers as well asand marketing companies. Also, international developments and the possible improved economics of domestic natural gas exploration may influence other companies to increase their domestic crude oil and natural gas and crude oil exploration. Furthermore, competition among companies for favorable prospects can be expected to continue and it is anticipated that the cost of acquiring properties will increase in the future.
Recently, certain regions experienced strong demand for drilling services and supplies, which resulted in increasing costs. OurThe Wattenberg Field, Utica Shale and Eastern Operating RegionAppalachia-Marcellus Shale have experienced intense competition for drilling and pumping services. Factors affecting competition in the industry include price, location of drilling, availability of drilling prospects and drilling rigs, fracturing services, pipeline capacity, quality of production and volumes produced. We believe that we can compete effectively in the industry in each of the areas where we have operations. Nevertheless, our business, financial condition and results of operations could be materially adversely affected by competition. We also compete with other crude oil and natural gas and crude oil companies, as well as companies in other industries, for the capital we need to conduct our operations. Should economic conditions deteriorate and financing become more expensive and difficult to obtain, we may not have adequate capital to execute our business plan and we may be forced to curtail our drilling and acquisition activities.
The oil and gas industry is characterized by rapid and significant technological advancements and introductions of new products and services using new technologies. If one or more of the technologies we use now or in the future were to become obsolete or if we are unable to use the most advanced commercially available technology, our business, financial condition, results of operations and cash flows could be materially adversely affected.
Employees
As of December 31, 2012,2013, we had 421412 employees. Our employees are not covered by a collective bargaining agreement.agreements. We consider relations with our employees to be good.
Our engineers, supervisors and well tenders are responsible for the day-to-day operation of wells and some pipeline systems. Much of the work associated with drilling, completing and connecting wells, including fracturing, logging and pipeline construction, is performed under our direction by subcontractors specializing in these activities as is common in the industry.
WHERE YOU CAN FIND ADDITIONAL INFORMATION
We file annual, quarterly and current reports, proxy statements and other information with the SEC. Our SEC filings are available free of charge from the SEC’s website at www.sec.gov or from our website at www.pdce.com. You may also read or copy any document we file at the SEC’s public reference room in Washington, D.C., located at 100 F Street, N.E., Room 1580, Washington, D.C. 20549. Please call the SEC at (800) SEC-0330 for further information on the public reference room. We also make available free of charge any of our SEC filings by mail. For a mailed copy of a report, please contact PDC Energy Inc., Investor Relations, 1775 Sherman Street, Suite 3000, Denver, CO 80203, or call (800) 624-3821.
We recommend that you view our website for additional information, as we routinely post information that we believe is important for investors. Our website can be used to access such information as our recent news releases, committee charters, code of business conduct and ethics, shareholder communication policy, director nomination procedures and our whistle-blowerwhistle blower hotline. While we recommend that you view our website, the information available on our website is not part of this report and is not hereby incorporated by reference.
ITEM 1A. RISK FACTORS
You should carefully consider the following risk factors in addition to the other information included in this report. Each of these risk factors could adversely affect our business, operating results and financial condition, as well as adversely affect the value of an investment in our common stock or other securities.
NaturalCrude oil, natural gas crude oil and NGL prices fluctuate and a decline in these prices can significantly affect the value of our assets and our financial results and impede our growth.
Our revenue, profitability, and cash flows and liquidity depend in large part upon the prices and demandprice we receive for our crude oil, natural gas NGLs and crude oil. The markets for these commodities can be volatile, and significant drops in prices can negatively affect our financial results and impede our growth. For example, in much of 2012, natural gas prices were too low to economically justify drilling operations in several areas, and the outlook for natural gas prices remains weak due largely to increased supply and large inventories in storage. Similarly, NGL prices have decreased in some recent periods due to increased development activities in a variety of basins across the U.S. ChangesNGLs. In addition, changes in commodity prices have a significant effect on our cash flows and on the value and quantity of our reserves, which can in turn reduceaffect the borrowing base under our revolving credit facility. Pricesfacility and our access to other sources of capital, and on the nature and scale of our operations. The markets for crude oil, natural gas and NGLs are often volatile, and crude oilprices may fluctuate in response to relatively minor changes in supply and demand, market uncertainty and a variety of additional factors that are beyond our control, including national and international economic and political factors and federal and state legislation. For example, any substantial reductiongeopolitical events in the growth rate of ChinaMiddle East or elsewhere could affect global crude oil prices, significantly, and continued weakness in the overall economic environment could adversely affect all commodity prices.
In addition to factors affecting the price of crude oil, NGLs and natural gas and NGLs generally, the prices we receive for our production are affected by factors specific to us and to the local markets where the production occurs. PricingThe prices that we receive for our production are generally lower than the relevant benchmark prices that are used for calculating commodity derivative positions. These differences, or differentials, are difficult to predict and may widen in the future. Differentials can be influenced by, among other things, local or regional supply and demand factors (such as refinery or pipeline capacity issues, trade restrictions and governmental regulations) and the terms of our sales contracts.
Lower commodity prices may not only reduce our revenues, but also may reduce Differentials on oil produced in the amount of natural gas, NGLs and crude oil that we can produce economically. AsWattenberg Field have widened in recent months, in part as a result weof the midstream capacity issues discussed below. Over the longer term, differentials will be significantly affected by factors such as investment decisions made by providers of midstream facilities and services, refineries and other industry participants, and the overall regulatory and economic climate. For example, increases in U.S. domestic oil production generally may have to make substantial downward adjustments to our estimated proved reserves if prices decline or remain at depressed levelsresult in widening differentials, particularly for extended periods. If this occurs or if our estimates of development costs increase, production data factors change or our exploration results deteriorate, accounting rules may require us to write-down operating assets to fair value, as a non-cash charge to earnings.from some basins. We assess impairment of capitalized costs of proved properties by comparing net capitalized costs to estimated undiscounted future net cash flows on a field-by-field basis using estimated production based upon prices at which management reasonably estimates such products may be sold. For example, in 2011, we recorded an impairment charge related to our NECO proved natural gasmaterially and crude oil properties of $22.5 million and in 2012 we recorded an impairment charge of $161.2 million related to our Piceance Basin proved oil and natural gas properties. We may incur additional impairment charges in the future, which could have a material adverse effectadversely impacted by widening differentials on our results of operations.
production.
The marketability of our production is dependent upon limited transportation and processing facilities overthe capacity and operation of which we may have nodo not control. Market conditions or operational impediments, including high line pressures, particularly in the Wattenberg Field, and other impediments affecting gatheringmidstream facilities and transportation systems,services, could hinder our access to crude oil, natural gas crude oil and NGL markets, increase our costs or delay production and thereby adversely affect our profitability.
Our ability to market our production depends in substantial part on the availability, proximity and capacity of gathering systems, pipelines and processing facilities owned and operated by third parties. If adequate gathering, processingmidstream facilities and transportation facilitiesservices are not available to us on a timely basis and at acceptable costs, our production and results of operations will be adversely affected. These risks are greater for us than for some of our competitors because our operations are focused on areas where there is currently a substantial amount of development activity, which increases the likelihood that there will be periods of time in which there is insufficient midstream capacity to accommodate the resulting increases in production. For example, due to increased drilling activities by us and third parties, and unusually hot temperatures in Colorado induring the second half of 2012,summer months, the principal third-party provider we use in the Wattenberg area for thesemidstream facilities and services has recently experienced high gathering system line pressure, and thepressure. The resulting capacity constraints impacted the productivity of some of our older wells and limited the incremental production impact of our newer horizontal wells. As a result, we have seen an impact onThis constrained our production and a related decrease inreduced our revenue from the impactedaffected wells. Thus, our profitability has been adversely affected, and will continue to be affected until available capacity increases or alternative arrangements are available. Additional pipelines and facilities are being planned for the area but are not expected to be completed until the latter part of 2013. Capacity constraints affecting natural gas production also impact our ability to produce the associated NGLs. We mayare also dependent on the availability and capacity of purchasers for our production. For example, recent reductions in purchases by a local crude oil refinery have increased the amount of oil that we have to transport out of the Wattenberg area for sale. This has increased our transportation costs and reduced the price we receive for the affected production. We expect this situation to continue for the foreseeable future. In addition, the use of alternative forms of transportation such as trucks or rail involve risks as well. For example, recent and well-publicized accidents involving trains delivering crude oil could result in increased levels of regulation and transportation costs. We face similar risks in other areas, including our Utica operating area, as gathering/processing infrastructure is currently in the development phase.phase and development activity conducted by us and others is increasing. We are also dependent on third party pipeline infrastructure to deliver our natural gas production to market in the MarcellusAppalachia-Marcellus area. In addition to causing production curtailments, capacity constraints can also reduce the price we receive for the crude oil, natural gas and Piceance Basin areas.
NGLs we produce.
Federal, state and local legislativelegislation and regulatory initiatives and litigationregulations relating to hydraulic fracturing could result in increased costs, and additional drilling and operating restrictions or delays in the production of crude oil, natural gas and NGLs, and crude oil, including from the development of shale plays. A decline in the drilling of new wells and related servicing activities caused by these initiatives and litigation could adversely affect our financial condition, results of operations and cash flows.
prohibit hydraulic fracturing activities.
Most of our drilling uses hydraulic fracturing. Hydraulic fracturing is an important and commonly used process in the completion of unconventional wells in shale, coalbed, and tight sand formations. Proposals have been introduced in the U.S. Congress to regulate hydraulic fracturing operations and related injection of fracturing fluids and propping agents used by the crude oil and natural gas industry in fracturing fluids under the Safe Drinking Water Act (“SDWA”), and to require the disclosure of chemicals used in the hydraulic fracturing process under the SDWA, the Emergency Planning and Community Right-to-Know Act (“EPCRA”), or other laws. Sponsors of these bills, which have been subject to various proceedings in the legislative process, including in the House Energy and Commerce Committee and the Senate Environmental and Public Works Committee, have asserted that chemicals used in the fracturing process could adversely affect drinking water supplies and otherwise cause adverse environmental impacts. The Chairman of the House Energy and Commerce Committee has initiated an investigation
of the potential impacts of hydraulic fracturing, which has involved seeking information about fracturing activities and chemicals from certain companies in the oil and natural gas sector. The Environmental Protection Agency (the “EPA”) has recently focused on citizen concerns about the risk of water contamination and public health problems from drilling and hydraulic fracturing activities, and conducted public meetings around the country on this issue which have been well publicized and well attended. In March 2011, the EPA announced its intention to conduct a comprehensive research study on the potential adverse impacts that hydraulic fracturing may have on water quality and public health. The EPA issued an initial report about the study in December 2012. The initial report described the focus of the continuing study but did not include any data concerning EPA'sEPA’s efforts
to date, nor did it draw any conclusions about the safety of hydraulic fracturing. Final results,A draft report including data and conclusions areis expected in 2014.
The EPA has also begun a Toxic Substances Control Act (“TSCA”) rulemaking which will collect expansive information on the chemicals used in hydraulic fracturing fluid, as well as other health-related data, from chemical manufacturers and processors. EPA has not indicated when it intends to issue a proposed rule. Concurrently, the White House Council on Environmental Quality is coordinating an administration-wide review of hydraulic fracturing practices.
EPA also has finalized major new Clean Air Act (“CAA”)CAA standards (New Source Performance Standards or NSPS, and National Emission Standards for Hazardous Air Pollutants, or NESHAPs)Pollutants) applicable to hydraulically fractured natural gas wells.wells and certain storage vessels in August 2012. The standards will require, among other things, use of reduced emission completions, or green completions, to reduce volatile organic compound emissions fromduring well completions as well as new controls applicable to a wide variety of storage tanks.tanks and other equipment, including compressors, controllers, and dehydrators. While most key provisions in the new CAA standards are not effective until 2015 and EPA currently is re-considering parts of the rule, the rules associated with such standards are substantial and maywill increase future costs of our operations and will require us to make modifications to our operations and install new equipment.
EPA has also issued and is in the process of finalizing permitting guidance under the SDWA for the underground injection of liquids from hydraulically fractured (and other) wells where diesel is used. It remains to be seen how broadly applicable the dieselThis recently-issued guidance will be, but it has the potential tomay create duplicative requirements, further slow down the permitting process in certain areas, and increase the costs of operations.operations, and result in expanded regulation of hydraulic fracturing activities by EPA depending on how it is implemented. Certain other federal agencies are analyzing, or have been requested to review, environmental issues associated with hydraulic fracturing. TheMost notably, the U.S. Department of the Interior, through the Bureau of Land Management,BLM, is currently conducting a rulemaking that will require, among other things, disclosure of chemicals and more stringent well integrity measures associated with hydraulic fracturing operations on public land.
BLM has not indicated when it will issue a final rule.
In addition, the governments of certain state governments,states, including the states of Colorado, Pennsylvania, Ohio, and West Virginia, have adopted or are considering adopting laws and regulations that impose or could impose, among other requirements, stringent permitting or air emission control requirements, disclosure, wastewater disposal, baseline sampling, well construction and well location requirements on hydraulic fracturing operations or otherwise seek to ban underground injection of fracturing wastewater or fracturing activities altogether. SomeFor example, in January 2012, the ODNR issued a temporary moratorium on the development of hydraulic fracturing disposal wells in northeast Ohio in order to study the relationship between these wells and minor earthquakes reported in the area. As a result, ODNR promulgated new and more stringent regulations for certain underground injection wells, including requirements for a complete suite of geophysical logs, analytical interpretation of the logs, and enhanced monitoring and recording.
At the local level, some municipalities and local governments including most recently the city of Fort Collins in Colorado, have adopted or are considering similar actions. bans on hydraulic fracturing. Voters in the cities of Fort Collins, Boulder, and Lafayette, Colorado recently approved bans of varying length on hydraulic fracturing within their respective city limits.
In addition, lawsuits have been filed against unrelated third parties in Pennsylvania, New York, Arkansas, Colorado, Ohio, West Virginia, and several other states alleging contamination of drinking water by hydraulic fracturing. Increased regulation and attention given to the hydraulic fracturing process could lead to greater opposition including litigation, to crude oil, natural gas crude oil and NGL production activities using hydraulic fracturing techniques. Additional legislation, regulation, litigation, or litigationmoratoria could also lead to operational delays or lead us to incur increased operating costs in the production of crude oil, natural gas NGLs and crude oil,NGLs, including from the development of shale plays, or could make it more difficult to perform hydraulic fracturing or other drilling activities. If these legislative, regulatory, litigation, and litigationother initiatives cause a material decrease in the drilling of new wells andor an increase in related servicing activities,drilling costs, our profitability could be materially impacted.
A ballot initiative has been proposed in Colorado which, if approved, could vastly expand the right of local governments to limit or prohibit oil and natural gas production and development in their jurisdictions. Should this or any similar initiative or legislation be successful and survive legal challenge, additional limitations or prohibitions could be placed on crude oil and natural gas production and development within certain areas of Colorado or the state as a whole. This could adversely affect the cost, manner, and feasibility of development activities in Colorado, particularly those involving hydraulic fracturing, and significantly affect the value of our assets and our financial results and impede our growth.
Certain interest groups in Colorado opposed to oil and natural gas development generally, and hydraulic fracturing in particular, have advanced various options for ballot initiatives aimed at significantly limiting or preventing oil and natural gas development. To date, one initiative has been formally proposed. Colorado Community Rights Network has submitted to the Colorado Legislative Council a proposed amendment to the Colorado Constitution that would add a new section to the Bill of Rights regarding the right of local governments to self-govern. This constitutional amendment, should it be successfully implemented and survive legal challenge, would grant local governments in Colorado the right, without limitation, to prohibit crude oil and natural gas development within their respective jurisdictions and would clarify that such prohibitions would not be preempted by conflicting international, federal, or state laws. Other ballot initiatives and legislation focused on allowing localities greater latitude to regulate oil and natural gas development in Colorado are under discussion. Additional ballot initiatives and legislation directly impacting oil and natural gas development, including through further regulation of hydraulic fracturing, are also possible. Should any of these initiatives be successful and survive legal challenge, they could have a materially adverse impact on our ability to drill and/or produce crude oil and natural gas in certain areas in Colorado, or the state generally, and could materially impact our results of operations, production and reserves.
Environmental and overall public scrutiny focused on the oil and gas industry is increasing. The current trend is to increase regulation of our operations and the industry. We are subject to complex federal, state, local and other laws and regulations that could adversely affect the cost, manner or feasibility of doing business.
Our exploration, development, production, and marketing operations are regulated extensively at the federal, state, and local levels. Environmental and other governmental laws and regulations have increased ourthe costs to plan, design, drill, install, operateof planning, designing, drilling, installing, operating, and abandonabandoning crude oil and natural gas wells and crude oil wells.associated facilities. Under these laws and regulations, we could also be liable for personal injuries, property damage, and natural resource or other damages. Similar to our competitors, we incur substantial operating and capital costs to comply with such laws and regulations. These compliance costs may put us at a competitive disadvantage compared to larger companies in the industry which can spread such additional costs over a greater numbermore easily capture economies of wells and larger operating staff.scale with respect to compliance. Failure to comply with these laws and regulations may result in the suspension or termination of our operations or other operational impediments and subject us to administrative, civil, and criminal penalties. Moreover, public interest in environmental protection has increased in recent years-particularly with respect to hydraulic fracturing-and environmental organizations have opposed, with some success, certain drilling projects.
In addition, our activities are subject to regulations governing conservation practices, protection of wildlife and habitat, and protection of correlative rights by state governments. These regulations affect our operations, increase our costs of exploration and production, and limit the quantity of crude oil, natural gas NGLs and crude oilNGLs that we can produce and market. A major risk inherent in our drilling plans is the possibility that we will be unable to obtain needed drilling permits from state and localrelevant governmental authorities in a timely manner. Delays in obtaining regulatory approvals or drilling permits, the failure to obtain a drilling permit for a well, or the receipt of a permit with unreasonable conditions or costs could have a material adverse effect on our ability to explore or develop our properties.
Additionally, the crude oil and natural gas and crude oil regulatory environment could change in ways that might substantially increase our financial and managerial compliance costs, increase our exposure to comply with the requirements of these laws and regulations and, consequently, adversely affectpotential damages or limit our profitability.activities. At the state level, for instance, the Colorado Oil and Gas Conservation Commission (“COGCC”) issued a new rule in 2013 governing mandatory minimum spacing, or setbacks, between oil and gas wells and occupied buildings and other areas. Similarly, it is expected that the COGCC may undertake a rulemaking focusedhas discussed measures to focus on wellbore integrityintegrity. Also in 2013, the COGCC issued rules that wouldrequire baseline sampling of certain ground and surface water in most areas of Colorado and impose stringent spill reporting and remediation requirements. These new sampling requirements could increase requirementsthe costs of developing wells in this area.certain locations. In addition to increasing costs of operation, these rules could prevent us from drilling wells on certain locations we plan to develop, thereby reducing our reserves as well as our future revenues. The COGCC has also recently concluded a rulemaking
In addition, in November 2013, the Colorado Department of Public Health and Environment’s Air Quality Control Commission (“AQCC”) approved proposed regulations that will require baseline sampling of certain
groundwould impose stringent new requirements relating to air emissions from oil and surface watergas facilities in most areas of Colorado. These new samplingrules, which are expected to be finalized in spring 2014, will require new controls, and impose additional monitoring, recordkeeping, and reporting requirements could increasefor most operators in Colorado. As part of the costsproposed rule package, the AQCC approved the direct regulation of developing wellshydrocarbon (i.e., methane) emissions from the Colorado oil and gas sector. If finalized as proposed, such direct state-only regulation of methane (a greenhouse gas) from a single industry sector in certain locations.
Some local governmental bodies, for instance Longmont,the absence of comparable federal regulation is a significant new authority being asserted at the state level and has the potential to adversely affect operations in Colorado have adopted or are considering regulations regarding, among others things, land use, requiringas well as in other parts of the posting of bonds to secure restoration obligations and limiting hydraulic fracturing and other drilling activities, and these regulations may limit, delay or prohibit exploration and development activities or make those activities more expensive. Additionally, state andcountry. Along the same lines, local governments are undertaking air quality studies to assess potential public health impacts from oil and gas operations. These studies, in combination with other air quality-related studies that are national in scope, may result in the imposition of additional regulatory requirements on oil and gas operations.
The BP crude oil spill in the Gulf of Mexico and generally heightened industry scrutiny has resulted and may result in new state and federal safety and environmental laws, regulations, guidelines and enforcement interpretations. The EPA has recently focused on citizen concerns about the risk of water contamination and public health problems from drilling and hydraulic fracturing activities, and conducted public meetings around the country on this issue which have been well publicized and well attended. This renewed focus could lead to additional federal, state and local laws and regulations affecting our drilling, fracturing and other operations.
Other potential laws and regulations affecting us include new or increased severance taxes proposed in several states, including Pennsylvania.Pennsylvania and Ohio. This could adversely affect theour existing operations in these states and the economic viability of future drilling. Additional laws, regulations, or other changes could significantly reduce our future growth, increase our costs of operations, and reduce our cash flows, in addition to undermining the demand for the crude oil, natural gas NGLs and crude oilNGLs we produce.
Our ability to produce crude oil and natural gas and crude oil could be impaired if we are unable to acquire adequate supplies of water for our drilling and completion operations or are unable to dispose of the water we use at a reasonable cost and within applicable environmental rules.
Our operations could be adversely impacted if we are unable to locate sufficient amounts of water, or dispose of or recycle water used in our exploration and production operations. Currently, the quantity of water required in certain completion operations, such as hydraulic fracturing, and changing regulations governing usage may lead to water constraints and supply concerns (particularly in some parts of the country). In addition, notwithstanding recent flooding in Colorado discussed below, Colorado and other western states have recently experienced a drought.drought conditions. As a result, future availability of water from certain sources used in the past may bebecome limited. Moreover, the
The imposition of new environmental initiatives and conditionsrelating to wastewater could include restrictions onrestrict our ability to conduct certain operations such as hydraulic fracturing orfracturing. This includes potential restrictions on waste disposal, of waste, including, but not limited to, produced water, drilling fluids, and other wastes associated with the exploration, development, or production of crude oil and natural gas. For example, in 2010 a petition was filed by the Natural Resources Defense Council with EPA requesting that the agency reassess its prior and long-standing determination that certain oil and natural gas exploration and production wastes would not be regulated as hazardous waste under Subtitle C of the RCRA. EPA has not yet acted on the petition and it remains pending. Were EPA to begin treating some or all of these wastes as “hazardous” under Subtitle C in response to the petition, the consequences for our operations would be serious, and would include a significant increase in costs associated with waste treatment and disposal and a potential inability to conduct operations in some instances.
The federal Clean Water Act (“CWA”)CWA and analogous state laws impose restrictions and strict controls regarding the discharge of pollutants, including produced waters and other oil and natural gas waste, into navigable waters or other regulated federal and state waters. Permits or other approvals must be obtained to discharge fill and pollutants tointo regulated waters and to conduct construction activities in such waters and wetlands. Uncertainty
regarding regulatory jurisdiction over wetlands and other regulated waters of the United States has complicated, and will continue to complicate and increase the cost of, obtaining such permits or other approvals. The CWA and analogous state laws provide for civil, criminal and administrative penalties for any unauthorized discharges of pollutants and unauthorized discharges of reportable quantities of oil and other hazardous substances. Many state discharge regulations,Most recently, EPA and the Federal National Pollutant Discharge Elimination System general permits issued by the EPA, prohibit the dischargeU.S. Army Corps of produced water and sand, drilling fluids, drill cuttings and certain other substances relatedEngineers submitted to the oilWhite House Office of Management and natural gas industry into coastal waters.Budget for review a proposed rule on defining jurisdictional waters of the United States. An expansive definition of such jurisdictional waters could affect our ability to operate in certain areas, increase costs of operations, and cause significant scrutiny and delays in permitting. While generally exempt under federal programs, many state agencies have also adopted regulations requiring certain oil and natural gas exploration and production facilities to obtain permits for storm water discharges. These permits, in turn, impose far-ranging monitoring, flow control, and other obligations that have generated, and will continue to generate, increased costs for our operations.
In October 2011, the EPA announced its intention to develop federal pretreatment standards for wastewater discharges associated with hydraulic fracturing activities. If adopted, the pretreatment rules will require coalbed methane and shale gas operations to pretreat wastewater before transferring ittransfer to treatment facilities. Proposed rules are expected in 2013 for coalbed methane production and in 2014 for shale gas production.2014. Some states, including Pennsylvania, have banned the treatment of fracturing wastewater at publicly owned treatment facilities. There has been recent nationwide concern, particularly in Ohio, over earthquakes associated with Class II underground injection control wells, a predominant storage method for crude oil and gas wastewater. ItAs seen in Ohio, it is likely that new rules and regulations will be developed to address these concerns, possibly eliminating access to Class II wells in certain locations, and increasing the cost of disposal in others.
Finally, the EPA study noted above has focused and will continue to focus on various stages of water use in hydraulic fracturing operations. It is possible that, following the conclusion of EPA'sEPA’s study, the agency will move to more strictly regulate the use of water in hydraulic fracturing operations. While we cannot predict the impact that these changes may have on our business at this time, they may be material to our business, financial condition, and operations. Compliance with environmental regulations and permit requirements governing the withdrawal, storage and use of surface water or groundwater necessary for hydraulic fracturing of wells or the disposal or recycling of water will increase our operating costs and may cause delays, interruptions or termination of our operations, the extent of which cannot be predicted. In addition, ouran inability to meet our water supply needs to conduct our completion operations may adversely impact our business,business. These potential water-related concerns may be heightened by recent flooding events in Colorado. For example, we experienced damage to some of our facilities as well as other operational impediments caused by the flooding event. Future legal and any such future laws and regulationsregulatory changes related to this event could negatively affect our financial condition and results of operations.
Acquisitions are subject to the uncertainties of evaluating recoverable reserves and potential liabilities, including environmental uncertainties.
Acquisitions of producing properties and undeveloped properties have been an important part of our historical and recent growth. We expect acquisitions will also contribute to our future growth. Successful acquisitions require an assessment of a number of factors, many of which are beyond our control. These factors include recoverable reserves, development potential, future commodity prices, operating costs, title issues and potential environmental and other liabilities. Such assessments are inexact and their accuracy is inherently uncertain. In connection with our assessments, we perform engineering, environmental, geological and geophysical reviews of the acquired properties, which we believe are generally consistent with industry practices. However, such reviews are not likely to permit us to become sufficiently familiar with the properties to fully assess their deficiencies and capabilities. We do not inspect every well prior to an acquisition and our
ability to evaluate undeveloped acreage is inherently imprecise. Even when we inspect a well, we may not always discover structural, subsurface and environmental problems that may exist or arise. In some cases, our review prior to signing a definitive purchase agreement may be even more limited. In addition, we often acquire acreage without any warranty of title except as to claims made by, through or under the transferor.
When we acquire properties, we will generally have potential exposure to liabilities and costs for environmental and other problems existing on the acquired properties, and these liabilities may exceed our estimates. Often we are not entitled to contractual indemnification associated with acquired properties. We often acquire interests in properties on an “as is” basis with no or limited remedies for breaches of representations and warranties. Therefore, we could incur significant unknown liabilities, including environmental liabilities, or losses due to title defects, in connection with acquisitions for which we have limited or no contractual remedies or insurance coverage. In addition, the acquisition of undeveloped acreage is subject to many inherent risks and we may not be able to realize efficiently, or at all, the assumed or expected economic benefits of acreage that we acquire.
Additionally, significant acquisitions can change the nature of our operations depending upon the character of the acquired properties, which may have substantially different operating and geological characteristics or may be in different geographic locations than our existing properties. These factors can increase the risks associated with an acquisition.
Acquisitions also present risks associated with the additional indebtedness that may be required to finance the purchase price, and any related increase in interest expense or other related charges.
A substantial part of our crude oil, natural gas NGLs and crude oilNGLs production is located in the Wattenberg Field, making itus vulnerable to risks associated with operating primarily in a single geographic area. In addition, we have a large amount of proved reserves attributable to a small number of producing formations.
Our operations are focused primarily on the Wattenberg Field, in our Western Operating Region, which means our current producing properties and new drilling opportunities are geographically concentrated in that area. Because our operations are not as diversified geographically as many of our competitors, the success of our operations and our profitability may be disproportionately exposed to the effect of any regional events, including fluctuations in prices of crude oil, natural gas NGLs and crude oilNGLs produced from the wells in the area, natural disasters such as the flooding that occurred in the area in September 2013, restrictive governmental regulations, transportation capacity constraints, curtailment of production or interruption of transportation, and any resulting delays or interruptions of production from existing or planned new wells. For example, the recent increase in activity in the Wattenberg Field has contributed to bottlenecks in processing and transportation that have negatively affected our results of operations, and these adverse effects may be disproportionately severe to us compared to our more geographically diverse competitors. Similarly, the concentration of our assets within a small number of producing formations in particular the Niobrara, Codell and Marcellus formations, exposes us to risks, such as changes in field-wide rules, that could adversely affect development activities or production relating to those formations. Such an event could have a material adverse effect on our results of operations and financial condition.
Our estimated crude oil and natural gas and crude oil reserves are based on many assumptions that may turn out to be inaccurate. Any material inaccuracies in these reserve estimates or underlying assumptions may materially affect the quantities and present value of our reserves.
Natural gas,Calculating reserves for crude oil, natural gas and NGL reserve engineeringNGLs requires subjective estimates of remaining volumes of underground accumulations of natural hydrocarbons and assumptionshydrocarbons. Assumptions are also made concerning commodity prices, production levels, and operating and development costs over the economic life of the properties. As a result, estimated quantities of proved reserves and projections of future production rates and the timing of development expenditures may be inaccurate. Independent petroleum engineers prepare our estimates of crude oil, natural gas NGLs and crude oilNGLs reserves using pricing, production, cost, tax and other information that we provide. The reserve estimates are based on certain assumptions regarding commodity prices, production levels, and operating and development costs that may prove incorrect. Any significant variance from these assumptions to actual results could greatly affect:
the economically recoverable quantities of crude oil, natural gas NGLs and crude oilNGLs attributable to any particular group of properties;
future depreciation, depletion and amortization (“DD&A”) rates and amounts;
impairments in the value of our assets;
the classifications of reserves based on risk of recovery;
estimates of the future net cash flows;
timing of our capital expenditures; and
the amount of funds available for us to utilize under our revolving credit facility.
Some of our reserve estimates must be made with limited production histories, which renders these reserve estimates less reliable than estimates based on longer production histories. Horizontal drilling in the Wattenberg fieldField is a relatively recent development, whereas vertical drilling has been used by producers in this field for over 40 years. As a result, the amount of production data from horizontal wells available to reserve engineers is relatively small, and future reserve estimates will be affected by additional production data as it becomes available. Horizontal drilling in the Utica Shale has an even more limited history, particularly in the southern part of the play where most of our acreage is located. Further, reserve estimates are based on the volumes of crude oil, natural gas NGLs and crude oilNGLs that are anticipated to be
economically recoverable from a given date forward based on economic conditions that exist at that date. The actual quantities of crude oil, natural gas and NGLs and crude oil recovered wouldwill be different than the reserve estimates since they wouldwill not be produced under the same economic conditions as used for the reserve calculations. In addition, quantities of probable and possible reserves by definition are inherently more risky than proved reserves and are less likely to be recovered.
At December 31, 2012,2013, approximately 57.6%72% of our estimated proved reserves (by volume) were undeveloped. These reserve estimates reflected our plans to make significant capital expenditures to convert our PUDs into proved developed reserves, including approximately $1.6$2.5 billion during the five years ending in 2017.December 31, 2018. You should be aware that the estimated development costs may not be accurate, development may not occur as scheduled and results may not be as estimated. If we choose not to develop PUDs, or if we are not otherwise able to successfully develop them, we will be required to remove the associated volumes from our reported proved reserves. In addition, under the SEC'sSEC’s reserve reporting rules, because PUDs generally may be booked only if they relate to wells scheduled to be drilled within five years of the date of booking, we may be required to downgrade any PUDs that are not developed within this five-year time frame to probable or possible.
The present value of ourthe estimated future net cash flows from our proved reserves is not necessarily the same as the current market value of our estimated natural gas and crude oilthose reserves. ThePursuant to SEC rules, the estimated discounted future net cash flows from our proved reserves, and the estimated quantity of those reserves, were based on the prior 12-month average crude oil and natural gas and crude oil index prices. However, factors such as actual prices we receive for crude oil and natural gas and crude oil and hedging instruments, the amount and timing of actual production, amount and timing of future development costs, supply of and demand for crude oil, natural gas NGLs and crude oil,NGLs and changes in governmental regulations or taxation, also affect our actual future net cash flows from our natural gasproperties. If we had used current forward strip commodity prices instead of the 12-month average prices mandated by SEC rules, the estimated quantities of our proved reserves and crude oil properties.cash flows from those reserves as of December 31, 2013 would have been lower.
The timing of both our production and incurrence of expenses in connection with the development and production of natural gas, crude oil and NGLnatural gas properties will affect the timing of actual future net cash flows from proved reserves, and thus their actual present value. In addition, the 10% discount factor (the rate required by the SEC) we use when calculating discounted future net cash flows may not be the most appropriate discount factor based on interest rates currently in effect and risks associated with our properties or the industry in general.
Unless reserves are replaced as they are produced, our reserves and production will decline, which would adversely affect our future business, financial condition and results of operations.
We may not be able to develop our identified drilling locations as planned.
Producing crude oil, natural gas crude oil and NGL reservoirs are generally characterized by declining production rates that vary depending upon reservoir characteristics and other factors. The rate of decline willmay change if production from existing wells declines in a different manner than we estimated. The rate can change due to other circumstances as well.over time and may exceed our estimates. Our future reserves and production and, therefore, our cash flows and income, are highly dependent on our ability to efficiently develop and exploit our current reserves and to economically find or acquire additional recoverable reserves. We may not be able to develop, discover or acquire additional reserves to replace our current and future production at acceptable costs. Our failure to do so would adversely affect our future operations, financial condition and results of operations.
We mayhave identified a number of well locations as an estimation of our future multi-year drilling activities on our existing acreage. These well locations represent a significant part of our growth strategy. Our ability to drill and develop these locations depends on a number of uncertainties, including crude oil, natural gas and NGL prices, the availability and cost of capital, drilling and production costs, availability of drilling services and equipment, drilling results, lease expirations, midstream constraints, access to and availability of water sourcing and distribution systems, regulatory approvals and other factors. Because of these factors, we do not know if the numerous potential well locations we have identified will ever be drilled or if we will be able to consummateproduce crude oil, natural gas or NGLs from these or any other potential well locations. In addition, the number of drilling locations available to us will depend in part on the spacing of wells in our operating areas. An increase in well density in an area could result in additional prospective acquisitions of our drilling partnerships, which could adversely affect our business operations.
We have previously disclosed our intention to pursue, beginninglocations in that area, but a reduced production performance from the fall of 2010 and extending through 2013, the acquisitionarea on a per-well basis. Further, certain of the limited partnership units held by non-affiliated investor partners in the drilling partnerships thathorizontal wells we have sponsored. We have not budgeted for the acquisition of the largest remaining partnership in 2013. We also may be unableintend to make additional acquisitions of such affiliated drilling partnerships since consummation of any such acquisitions may be subject to the same procedural processes that were utilized in connection with our previously completed acquisitions of public drilling partnerships. Such procedural hurdles previously included, and maydrill in the future include, among others:
negotiation and execution of a merger agreement with a special committee, comprised entirely of non-employee directors,may require pooling of our boardlease interests with the interests of directors;
clearancethird parties. If these third parties are unwilling to pool their interests with ours, and we are unable to require such pooling on a timely basis or at all, this may limit the total locations we can drill. As such, our actual drilling activities may materially differ from the SEC upon completion by eachthose presently identified. Further, our inventory of the partnershipsdrilling projects includes locations in addition to those that we currently classify as 3P. The development of their SEC proxy disclosure review process before the partnerships can request approval of the merger transactionsand results from their non-affiliated investors; and
approval by the holders of a majority of the limited partnership units held by the non-affiliated investors of each respective partnership.
In addition, certain former non-affiliated investor partners have initiated litigation concerning our acquisition of twelve limited partnerships in 2010 and 2011. Litigation challenges to further acquisitionsthese additional projects are also possible. In addition, we will have incurred, and will remain liable for, transaction costs, including legal, accounting, financial advisory and other costsmore uncertain than those relating to any prospective acquisitions, including the costs of the financial3P locations, and legal consultantssignificantly more uncertain than those relating to the special committee of our board of directors, whether or not the acquisitions are consummated. We currently do not have any drilling partnership acquisitions pending or planned in 2013. The occurrence of any of the risks associated with these potential transactions individually or in combination could have an adverse effect on our business, financial condition or results of operations.proved locations.
When drilling prospects, theThe wells we drill may not yield crude oil, natural gas NGLs or crude oilNGLs in commercially viable quantities.quantities, and productive wells may be less successful than we expect.
A prospect is a property on which our geologists have identified what they believe, based on available information, to be indications of hydrocarbon-bearing rocks. However, our geologists cannot know conclusively prior to drilling and testing whether crude oil, natural gas NGLs or crude oilNGLs will be present at all or in sufficient quantities to repay drilling or completion costs and generate a profit given the available data and technology. If a well is determined to be dry or uneconomic, which can occur even though it contains some crude oil, natural gas NGLs or crude oil,NGLs, it is classified as a dry hole and must be plugged and abandoned in accordance with applicable regulations. This generally results in the loss of the entire cost of drilling and completion to that point, the cost of plugging, and lease costs associated with the prospect. Even wells
that are completed and placed into production may not produce sufficient crude oil, natural gas NGLs and crude oilNGLs to be profitable.profitable, or they may be less productive and/or profitable than we expected. If we drill a dry hole or unprofitable well on a current andor future prospects,prospect, the profitability of our operations will decline and the value of our properties will likely be reduced. These risks are greater in developing areas such as the Utica
Shale, where we are currently investing substantial capital. Exploratory drilling is typically subject to substantially greater risk than development drilling. In addition, initial results from a well are not necessarily indicative of its performance over a longer period.
Drilling for and producing crude oil, natural gas NGLs and crude oilNGLs are high risk activities with many uncertainties that could adversely affect our business, financial condition and results of operations. Our drilling risk exposure may be increased as we have allocated most of our 2013 capital budget to drilling horizontal wells.
Drilling activities are subject to many risks, including the risk that we will not discover commercially productive reservoirs. Drilling for crude oil and natural gas and crude oil can be unprofitable, not only due to dry holes, but also due to curtailments, delays or cancellations as a result of other factors, including:
unusual or unexpected geological formations;
pressures;
fires;
floods;
loss of well control;
loss of drilling fluid circulation;
title problems;
facility or equipment malfunctions;
unexpected operational events;
shortages or delays in the delivery delays of equipment and services;
unanticipated environmental liabilities;
compliance with environmental and other governmental requirements; and
adverse weather conditions.
Any of these risks can cause substantial losses, including personal injury or loss of life, damage to or destruction of property, natural resources and equipment, pollution, environmental contamination or loss of wells and regulatory penalties. For example, a loss of containment of hydrocarbons during thesedrilling activities could potentially subject us to civil and/or criminal liability and the possibility of substantial costs, including for environmental remediation, depending upon the circumstances of the loss of containment, the nature and scope of the loss and the applicable laws and regulations. We maintain insurance against various losses and liabilities arising from operations; however, insurance against certain operational risks may not be available or may be prohibitively expensive relative to the perceived risks presented. For example, we may not have coverage with respect to a pollution event if we are unaware of the event while it is occurring and are therefore unable to report the occurrence of the event to our insurance company within the time frame required under our insurance policy. Thus, losses could occur for uninsurable or uninsured risks or for amounts in excess of existing insurance coverage. The occurrence of an event that is not fully covered by insurance and/or the governmental responseor third party responses to an event could have a material adverse effect on our business activities, financial condition and results of operations. We are currently involved in various remedial and investigatory activities at some of our wells and related sites. See Note 11, Commitments and Contingencies - Environmental, to our consolidated financial statements included elsewhere in this report.
Our business strategy focuses on production in our liquid-rich and high impact shale plays. In this regard, we plan to allocate our capital to an active horizontal drilling program. Historically, most of the wells we drilled were vertical wells. InSince 2012, and 2013, however, we have devoted the majority of our capital budget to drilling horizontal wells. Drilling horizontal wells is technologically more difficult than drilling vertical wells - including as a result of risks relating to our ability to fracture stimulate the planned number of stages and to successfully run casing the length of the well bore - and thus the risk of failure is therefore greater than the risk involved in drilling vertical wells. Additionally, drilling a horizontal wellswell is typically far costlier than drilling a vertical wells. Consequently, because we arewell. This means that the risks of our drilling far fewer total wells during 2013 as compared to many prior years, the risk of drilling a non-economic wellprogram will be relatively higher than if we were to drillspread over a similarsmaller number of wells, as we didand that, in those prior years. Furthermore, because of the relatively higher cost in drilling horizontal wells, a completed wellorder to be successful economicallyeconomic, each horizontal well will need to have production that willproduce at a higher level in order to cover the higher drilling costs. In addition, we have transitioned to the use of multi-well pads instead of single-well sites. The use of multi-well pad drilling increases some operational risks because problems affecting the pad or a single well could adversely affect production from all of the wells on the pad. Pad drilling can also make our overall production, and therefore our revenue and cash flows, more volatile, because production from multiple wells on a pad will typically commence simultaneously. While we believe that we will be better served by our drilling horizontal wells using multi-well pads, the risk component involved in such drilling will be increased in some respects, with the result that we might find it more difficult to achieve economic success in our horizontal drilling program.
Under the “successful efforts” accounting method that we use, unsuccessful exploratory wells must be expensed in the period when they are determined to be non-productive, which reduces our net income in such periods and could have a negative effect on our profitability.
We conduct exploratory drilling in order to identify additional opportunities for future development. Under the “successful efforts” method of accounting that we use, the cost of unsuccessful exploratory wells must be charged to expense in the period in which the wells are determined to be unsuccessful. In addition, lease costs for acreage condemned by the unsuccessful well must also be expensed. In contrast, unsuccessful development wells are capitalized as a part of the investment in the field where they are located. Because exploratory wells generally are more likely to be unsuccessful than development wells, we anticipate that some or all of our exploratory wells may not be productive. The costs of such unsuccessful exploratory wells could result in a significant reduction in our profitability in periods when the costs are required to be expensed and could have a negative effect on our ability to comply with our debt covenants.
Increasing finding and development costs may impair our profitability.
In order to continue to grow and maintain our profitability, we must add new reserves that exceed our production over time at a finding and development cost that yields an acceptable operating margin and DD&A rate. Without cost effective exploration, development or acquisition activities, our production, reserves and profitability will decline over time. Given the relative maturity of most natural gascrude oil and crude oilnatural
gas basins in North America and the high level of activity in the industry, the cost of finding new reserves through exploration and development operations has been increasing in some basins. The acquisition market for properties has become extremely competitive among producers for additional production and expanded drilling opportunities in North America. Acquisition values for crude oil properties have climbed in 2010recent years and 2011 and these values may continue to increase in the future. This increase in finding and development costs results in higher DD&A rates. If the upward trend in crude oil finding and development costs continues, we will be exposed to an increased likelihood of a write-down in the carrying value of our crude oil properties in response to any future decrease in commodity prices and/or reduction in the profitability of our operations.
Depressed natural gas prices could result in significant impairment charges and significant downward revisions of proved natural gas reserves.
The domestic natural gas market remains weak. Low natural gas prices could result in, among other adverse effects, significant impairment charges in the future. The cash flow model we use to assess properties for impairment includes numerous assumptions, such as management'smanagement’s estimates of future oil and gas production and commodity prices, market outlook on forward commodity prices and operating and development costs. All inputs to the cash flow model must be evaluated at each date that the estimate of future cash flows for each producing basin is calculated. However, a significant decrease in long-term forward natural gas prices alone could result in a significant impairment for our properties that are sensitive to declines in natural gas prices. In December 2012, we recognized an impairment charge of $161.2$161.2 million associated with our Piceance Basin proved crude oil and natural gas properties and similarproperties. In 2013, we recognized additional charges of $48.8 million associated with our shallow Upper Devonian (non-Marcellus Shale) Appalachian Basin producing properties. Similar charges could occur in the future. In addition, low natural gas prices could result in significant downward revisions to our proved natural gas reserves. Future declines in crude oil prices could have similar effects.
Our development and exploration operations require substantial capital, and we may be unable to obtain needed capital or financing on satisfactory terms, which could lead to a loss of properties and a decline in our production and reserves, and ultimately our profitability.
Our industry is capital intensive. We expect to continue to make substantial capital expenditures in our business and operations for the exploration, development, production and acquisition of crude oil, natural gas crude oil and NGL reserves. To date, we have financed capital expenditures primarily with bank borrowings under our revolving credit facility, cash generated by operations and proceeds from capital markets transactions and the sale of properties. We intend to finance our future capital expenditures utilizing similar financing sources. Our cash flows from operations and access to capital are subject to a number of variables, including:
our proved reserves;
the amount of crude oil, natural gas NGLs and crude oilNGLs we are able to produce from existing wells;
the prices at which crude oil, natural gas NGLs and crude oilNGLs are sold;
the costs to produce crude oil, natural gas NGLs and crude oil;NGLs; and
our ability to acquire, locate and produce new reserves.
If our revenues or the borrowing base under our revolving credit facility decreasesdecrease as a result of lower commodity prices, operating difficulties or for any other reason, our need for capital from other sources would increase.increase, and there can be no assurance that such other sources of capital would be available at that time on reasonable terms or at all. If we raise funds by issuing additional equity securities, this would have a dilutive effect on existing shareholders. If we raise funds through the incurrence of debt, the risks we face with respect to our indebtedness would increase and we would incur additional interest expense. There can be no assurance as to the availability or terms of any additional financing. Our inability to obtain additional financing, or sufficient financing on favorableacceptable terms would adversely affect our financial condition and profitability. We intend to fund a portion of our 2013 capital expenditures with proceeds from our sale of Piceance Basin and certain other properties to Caerus. There can be no assurance that this transaction will close as planned. In addition, purchase price adjustments may reduce our proceeds from the transaction.
We have a substantial amount of debt and the cost of servicing, and risks related to refinancing, that debt could adversely affect our business. Those risks could increase if we incur more debt.
We have a substantial amount of indebtedness. As a result, a significant portion of our cash flows will be required to pay interest and principal on our indebtedness, and we may not generate sufficient cash flows from operations, or have future borrowing capacity available, to enable us to repay our indebtedness or to fund other liquidity needs. As of December 31, 2012, we had $676.6 million in outstanding indebtedness and approximately $382.3 million available to be borrowed under our revolving credit facility, subject to limitation under our financial covenants.
Servicing our indebtedness and satisfying our other obligations will require a significant amount of cash. Our cash flows from operating activities and other sources may not be sufficient to fund our liquidity needs. Our ability to pay interest and principal on our indebtedness and to satisfy our other obligations will depend uponon our future operating performance and financial condition and the availability of refinancing indebtedness, which will be affected by prevailing economic conditions and financial, business and other factors, many of which are beyond our control. We cannot assure you that our business will generate sufficient cash flows from operations, or that future borrowings will be available to us under our revolving credit facility or otherwise, in an amount sufficient to fund our liquidity needs.
A substantial decrease in our operating cash flows or an increase in our expenses could make it difficult for us to meet our debt service requirements and could require us to modify our operations, including by curtailing our exploration and drilling programs, selling assets, refinancing all or a portion of our existing debt or obtaining additional financing. These alternative measures may not be successful and may not permit us to meet our scheduled debt service obligations. Our ability to restructure or refinance our debt will depend on the condition of the capital markets and our financial condition at such time. Any refinancing of our debt could be at higher interest rates and may require us to comply with more onerous covenants, which could further restrict our business operations. In addition, the terms of future debt agreements may, and our existing debt agreements do, restrict us from implementing some of these alternatives. In the absence of adequate cash from operations and other available capital resources, we could face substantial liquidity problems and might be required to dispose of material assets or operations to meet our debt service and other obligations. We may not be able to consummate these dispositions for fair market value, in a timely manner or at all. Furthermore, any proceeds that we could realize from any dispositions may not be adequate to meet our debt service or other obligations then due.
Our substantial indebtedness could adversely impact our business, results of operations and financial condition.
In addition to making it more difficult for us to satisfy our debt and other obligations, our substantial indebtedness could limit our ability to respond to changes in Because the markets in which we operate and otherwise limit our activities. For example, our indebtedness, and the terms of agreements governing that indebtedness, could:
require us to dedicate a substantial portion of our cash flows from operationsrequired to service our existing debt obligations, thereby reducing the cashindebtedness is not available to finance our operations
and other business activities, and could limitour indebtedness limits our flexibility in planning for or reacting to changes in our business and the industry in which we operate;
increaseoperate and increases our vulnerability to economic downturns and impair our ability to withstand sustained declines in commodity prices;
subject us to covenants that limit our ability to fund future working capital, capital expenditures, exploration costs and other general corporate requirements;
prevent us from borrowing additional funds for operational or strategic purposes (including to fund future acquisitions), disposing of assets or paying cash dividends;
limit our flexibility in planning for, or reacting to, changes in our business and the industry in which we operate;
require us to devote a substantial portion of our cash flows from operations to payments on our indebtedness, thereby reducing the availability of our cash flows to fund exploration efforts, working capital, capital expenditures and other general corporate purposes; and
place us at a competitive disadvantage relative to our competitors that have less debt outstanding.
prices.
Covenants in our debt agreements currently impose, and future financing agreements may impose, significant operating and financial restrictions.
The indenture governing our senior notes and our revolving credit facility contain restrictions, and future financing agreements may contain additional restrictions, on our activities, including covenants that restrict our and certain of our subsidiaries'subsidiaries’ ability to:
incur additional debt;
pay dividends on, redeem or repurchase stock;
create liens;
make specified types of investments;
apply net proceeds from certain asset sales;
engage in transactions with our affiliates;
engage in sale and leaseback transactions;
merge or consolidate;
restrict dividends or other payments from restricted subsidiaries;
sell equity interests of restricted subsidiaries; and
sell, assign, transfer, lease, convey or dispose of assets.
Our revolving credit facility will mature on November 5, 2015, and is secured by all of our crude oil and natural gas properties as well as a pledge of all ownership interests in our operating subsidiaries. The restrictions contained in our debt agreements may prevent us from taking actions that we believe would be in the best interest of our business, and may make it difficult for us to successfully execute our business strategy or effectively compete with companies that are not similarly restricted. We may also incur future debt obligations that might subject us to additional restrictive covenants that could affect our financial and operational flexibility.
Similar issues may arise with respect to PDCM’s debt agreements, which, among other things, limit PDCM’s ability to pay dividends to us.
Our revolving credit facility has substantial restrictions and financial covenants and our ability to comply with those restrictions and covenants is uncertain. Our lenders can unilaterally reduce our borrowing availability based on anticipated commodity prices.
We depend in large part on our revolving credit facility for future capital needs. The terms of the credit agreement require us to comply with certain financial covenants and ratios. Our ability to comply with these restrictions and covenants in the future is uncertain and will be affected by the levels of cash flows from operations and events or circumstances beyond our control. Our failure to comply with any of the restrictions and covenants under the revolving credit facility or other debt agreements could result in a default under those agreements, which could cause all of our existing indebtedness to be immediately due and payable.
The revolving credit facility limits the amounts we can borrow to a borrowing base amount, determined by the lenders in their sole discretion based upon projected revenues from the properties securing their loan. The lenders can unilaterally adjust the borrowing base and the borrowings permitted to be outstanding under the revolving credit facility. Outstanding borrowings in excess of the borrowing base must be repaid immediately, or we must pledge other natural gas, crude oil and NGLnatural gas properties as additional collateral. We do not currently have any substantial unpledged properties, and we may not have the financial resources in the future to make any mandatory principal prepayments required under the revolving credit facility. Our inability to borrow additional funds under our revolving credit facility could adversely affect our operations and our financial results.
PDCM is subject to each of the foregoing risks with respect to its revolving credit facility and its term loan agreement.
If we are unable to comply with the restrictions and covenants in the agreements governing our indebtedness, there would be a default under the terms of these agreements, which could result in an acceleration of payment of funds that we have borrowed and would impact our ability to make principal and interest payments on our indebtedness and satisfy our other obligations.
Any default under the agreements governing our indebtedness, including a default under our revolving credit facility that is not waived by the required lenders, and the remedies sought by the holders of any such indebtedness, could make us unable to pay principal and interest on our indebtedness and satisfy our other obligations. If we are unable to generate sufficient cash flows and are otherwise unable to obtain funds necessary to meet required payments of principal and interest on our indebtedness, or if we otherwise fail to comply with the various covenants, including financial and operating covenants, in the instruments governing our indebtedness, we could be in default under the terms of the agreements governing such indebtedness. In the event of such default, the holders of such indebtedness could elect to declare all the funds borrowed thereunder to be due and payable, together with accrued and unpaid interest, the lenders under our revolving credit facility could elect to terminate their commitments, cease making further loans and institute foreclosure proceedings against our assets, and we could be forced into bankruptcy or liquidation. If our operating performance declines, we may in the future need to seek to obtain waivers from the required lenders under our revolving credit facility to avoid being in default. If we breach our covenants under our revolving credit facility and seek a waiver, we may not be able to obtain a waiver from the required lenders. If this occurs, we would be in default under our revolving credit facility, the lenders could exercise their rights as described above, and we could be forced into bankruptcy or liquidation. We cannot assure you that we will be granted waivers or amendments to our debt agreements if for any reason we are unable to comply with these agreements, or that we will be able to refinance our debt on terms acceptable to us, or at all. PDCM is subject to each of the foregoing risks with respect to its debt agreements. As of June 30 and September 30, 2013, PDCM was not in compliance with certain financial covenants in its debt agreements. It was able to obtain a waiver for these defaults from its lenders in July and October 2013, respectively. However, there can be no assurance that similar waivers will be available if needed in the future.
Our variable rate indebtedness subjects us to interest rate risk, which could cause our debt service obligations to increase significantly.
Borrowings under our revolving credit facility bear interest at variable rates and expose us to interest rate risk. If interest rates increase, our debt service obligations on the variable rate indebtedness would increase although the amount borrowed remained the same, and our net income and cash available for servicing our indebtedness and for other purposes would decrease.
Notwithstanding our current indebtedness levels and restrictive covenants, we may still be able to incur substantial additional debt, which could exacerbate the risks described above.
We may be able to incur additional debt in the future. Although our debt agreements contain restrictions on our ability to incur indebtedness, those restrictions are subject to a number of exceptions. In particular, we may borrow under the revolving credit facility. We may also consider investments in joint ventures or acquisitions that may increase our indebtedness. Adding new debt to current debt levels could intensify the related risks that we and our subsidiaries now face.
Seasonal weather conditions and lease stipulations can adversely affect our ability to conduct drilling activities in some of the areas where we operate.
operations.
Seasonal weather conditions and lease stipulations designed to protect wildlife affect operations in our Western Operating Region.some areas. In certain areas including parts of the Piceance Basin in Colorado, drilling and other activities aremay be restricted or prohibited by lease stipulations, or prevented by weather conditions, for up to six months outsignificant periods of the year.time. This limits our operations in those areas and can intensify competition during the active months for drilling rigs, oil field equipment, services, supplies and qualified personnel, which may lead to additional or increased costs or periodic shortages. These constraints and the resulting high costs or shortages could delay our operations and materially increase operating and capital costs and therefore adversely affect our profitability. Similarly, hot weather during parts of 2012some recent periods adversely impacted the operation of certain midstream facilities, and therefore our production. Similar events could occur in the future and could negatively impact our results of operations and cash flows.
We have limited control over activities on properties in which we own an interest but we do not operate, which could reduce our production and revenues.
We operate approximately 89%91% of the wells in which we own an interest. If we do not operate the properties in which we own an interest, we do not have control over normal operating procedures, expenditures or future development of the underlying properties. The success and timing of drilling and development activities on properties operated by others therefore depends upon a number of factors outside of our control, including the operator'soperator’s timing and amount of capital expenditures, expertise (including safety and environmental compliance) and financial resources, inclusion of other participants in drilling wells, and use of technology. The failure by an operator to adequately perform operations, or an operator'soperator’s breach of the applicable agreements, could reduce production and revenues and adversely affect our profitability. These risks have been increasing for us in recent years as our capital expenditures for non-operated projects have risen significantly, and are expected to rise further in 2014.
Our derivative activities could result in financial losses or reduced income from failure to perform by our counterparties or could limit our potential gains from increases in prices.
We use derivatives for a portion of the production from our own wells, our partnerships and for natural gas purchases and sales by our marketing subsidiary to achieve a more predictable cash flows, to reduce exposure to adverse fluctuations in commodity prices, and to allow our natural gas marketing company to offer pricing options to natural gas sellers and purchasers. These arrangements expose us to the risk of financial loss in some circumstances, including when purchases or sales are different than expected or the counterparty to the derivative contract defaults on its contract obligations,contractual obligations. In addition, many of our derivative contracts are based on WTI or when there is a change inanother oil or natural gas index price. The risk that the expected differential between the underlyingindex price inand the derivative agreementprice we receive for the relevant production may change unexpectedly makes it more difficult to hedge effectively and actual prices that we receive.increases the risk of a hedging-related loss.
In addition,Also, derivative arrangements may limit the benefit we would otherwise receive from increases in the prices for the relevant commodity. Theycommodity, and they may also require the use of our resources to meet cash margin requirements. Since we do not designate our derivatives as hedges, we do not currently qualify for use of hedge accounting; therefore, changes in the fair value of derivatives are recorded in our income statements, and our net income is subject to greater volatility than it would be if our derivative instruments qualified for hedge accounting. For instance, if commodity prices rise significantly, this could result in significant non-cash charges during the relevant period, which could have a material negative effect on our net income.
The inability of one or more of our customers or other counterparties to meet their obligations may adversely affect our financial results.
Substantially all of our accounts receivable result from our crude oil, natural gas NGLs and crude oilNGLs sales or joint interest billings to a small number of third parties in the energy industry. This concentration of customers and joint interest owners may affect our overall credit risk in that these entities may be similarly affected by changes in economic and other conditions. In addition, our derivatives as well as the derivatives used by our marketing subsidiary expose us to credit risk in the event of nonperformance by counterparties. Nonperformance by our customers or derivative counterparties may adversely affect our financial condition and profitability. We face similar risks with respect to our other counterparties, including the lenders under our revolving credit facility and the providers of our insurance coverage.
Our business could be negatively impacted by security threats, including cybersecurity threats, and other disruptions.
As ana crude oil and natural gas producer, we face various security threats, including cybersecurity threatsattempts by third parties to gain unauthorized access to sensitive information or to render data or systems unusable; threats to the safety of our employees; threats to the security of our infrastructure or third party facilities and infrastructure, such as processing plants and pipelines; and threats from terrorist acts. There can be no assurance that the procedures and controls we use to monitor these threats and mitigate our exposure to them will be sufficient in preventing them from materializing. If any of these events were to materialize, they could lead to losses of sensitive information, critical infrastructure, personnel or capabilities essential to our operations and could have a material adverse effect on our reputation, financial condition, results of operations, or cash flows.
Our insurance coverage may not be sufficient to cover some liabilities or losses that we may incur.
The occurrence of a significant accident or other event not fully covered by insurance or in excess of our insurance coverage could have a material adverse effect on our operations and financial condition. Insurance does not protect us against all operational risks. We do not carry business interruption insurance at levels that would provide enough funds for us to continue operating without access to other funds. We also do not carry contingent business interruption insurance related to the purchasers of our production. In addition, pollution and environmental risks are generally not fully insurable.
We may not be able to keep pace with technological developments in our industry.
Our industry is characterized by rapid and significant technological advancements. As our competitors use or develop new technologies, we may be placed at a competitive disadvantage, and competitive pressures may force us to implement those or other new technologies at substantial cost. In addition, our competitors may have greater financial, technical and personnel resources that allow them to enjoy technological advantages and may in the future allow them to implement new technologies before we can. We may not be able to respond to these competitive pressures and implement new technologies on a timely basis or at an acceptable cost. If one or more of the technologies we use now or in the future were to become obsolete or if we were unable to use the most advanced commercially available technology, our business, financial condition and results of operations could be materially adversely affected.
Competition in our industry is intense, which may adversely affect our ability to succeed.
Our industry is intensely competitive, and we compete with other companies that have greater resources. Many of these companies not only explore for and produce crude oil, natural gas NGLs and crude oil,NGLs, but also carry on refining operations and market petroleum and other products on a regional, national or worldwide basis. These companies may be able to pay more for productive properties and exploratory prospects or define, evaluate, bid for and purchase a greater number of properties and prospects than we can. Our ability to acquire additional properties and to discover reserves in the future will be dependent upon our ability to evaluate and select suitable properties and to consummate transactions in a highly competitive environment. In addition, larger companies may have a greater ability to continue exploration activities during periods of low commodity prices. Larger competitors may also be able to absorb the burden of present and future federal, state, local
and other laws and regulations more easily than we can, which could adversely affect our competitive position. These factors could adversely affect the success of our operations and our profitability.
Acquisitions of properties are subject to the uncertainties of evaluating recoverable reserves and potential liabilities, including environmental uncertainties.
Acquisitions of producing properties and undeveloped properties have been an important part of our historical and recent growth. We expect acquisitions will also contribute to our future growth. Successful acquisitions require an assessment of a number of factors, many of which are beyond our control. These factors include recoverable reserves, development potential, future commodity prices, operating costs, title issues and potential environmental and other liabilities. Such assessments are inexact and their accuracy is inherently uncertain. In connection with our assessments, we perform engineering, environmental, geological and geophysical reviews of the acquired properties, which we believe are generally consistent with industry practices. However, such reviews are not likely to permit us to become sufficiently familiar with the properties to fully assess their deficiencies and capabilities. We do not inspect every well prior to an acquisition and our ability to evaluate undeveloped acreage is inherently imprecise. Even when we inspect a well, we may not always discover structural, subsurface and environmental problems that may exist or arise. In some cases, our review prior to signing a definitive purchase agreement may be even more limited. In addition, we often acquire acreage without any warranty of title except as to claims made by, through or under the transferor.
When we acquire properties, we will generally have potential exposure to liabilities and costs for environmental and other problems existing on the acquired properties, and these liabilities may exceed our estimates. Often we are not entitled to contractual indemnification associated with acquired properties. We often acquire interests in properties on an “as is” basis with no or limited remedies for breaches of representations and warranties. Therefore, we could incur significant unknown liabilities, including environmental liabilities, or losses due to title defects, in connection with acquisitions for which we have limited or no contractual remedies or insurance coverage. In addition, the acquisition of undeveloped acreage is subject to many inherent risks and we may not be able to realize efficiently, or at all, the assumed or expected economic benefits of acreage that we acquire.
Additionally, significant acquisitions can change the nature of our operations depending upon the character of the acquired properties, which may have substantially different operating and geological characteristics or may be in different geographic locations than our existing properties. These factors can increase the risks associated with an acquisition. Acquisitions also present risks associated with the additional indebtedness that may be required to finance the purchase price, and any related increase in interest expense or other related charges.
A failure to complete successful acquisitions would limit our growth.
Because our crude oil and natural gas properties are depleting assets, our future reserves, production volumes and cash flows depend on our success in developing and exploiting our current reserves efficiently and finding or acquiring additional recoverable reserves economically. Acquiring additional crude oil and natural gas properties, or businesses that own or operate such properties, when attractive opportunities arise is a significant component of our strategy. We may not be able to identify attractive acquisition opportunities. If we do identify an appropriate acquisition candidate, we may be unable to negotiate mutually acceptable terms with the seller, finance the acquisition or obtain the necessary regulatory approvals. If we are unable to complete suitable acquisitions, it will be more difficult to replace our reserves, and an inability to replace our reserves would have a material adverse effect on our financial condition and results of operations.
Certain federal income tax deductions currently available with respect to crude oil and natural gas and crude oil and exploration and development may be eliminated as a result of future legislation.
In February 2012,The administration of U.S. President Barack Obama and his administration released its budget proposals for the fiscal year 2013, which included numeroushas proposed tax changes. The proposed budget, if enacted, wouldto eliminate certain key U.S. federal income tax preferences currently available with respect to crude oil and natural gas and crude oil exploration and production. Similar changes have been in previous budgetThe proposals from the Obama administration but were not adopted into law. The changes in the current budget proposal related to oil and gas drilling and production include, but are not limited to (i) the repeal of the percentage depletion allowance for crude oil and natural gas and crude oil properties; (ii) the elimination of current deductions for intangible drilling and development costs; (iii) the elimination of the deduction for certain U.S. production activities; and (iv) an extension of the amortization period for certain geological and geophysical expenditures. It is not possible at this time to predict how legislation or new regulations that may be adopted to address these proposals would impact our business, but any such future laws and regulations could result in higher federal income taxes, which could negatively affect our financial condition and results of operations. In addition, proposals are made from time to time in states where we operate to implement or increase severance or other taxes at the state level, and any such additional taxes would have similarly adverse effects on us.
New derivativesDerivatives legislation and regulation could adversely affect our ability to hedge crude oil and natural gas and crude oil prices and increase our costs and adversely affect our profitability.
In July 2010, President Obama signed into law the Dodd-Frank Wall Street Reform and Consumer Protection Act (the “Dodd-Frank Act”). The Dodd-Frank Act regulates derivative transactions, including our commodity hedging swaps, and could have a number of adverse effects on us, including the following:
The Dodd-Frank Act may decreaselimit our ability to enter into hedging transactions, and this would exposethus exposing us to additional risks related to commodity price volatility; commodity price decreases would then have an immediateincreased adverse effect on our profitability and revenues. Reduced hedging may also impair our ability to have certainty with respect to a portion of our cash flows, which could lead to decreases in capital spending and, therefore, decreases in future production and reserves.
If, as a result of the Dodd-Frank Act or its implementing regulations, we are required to post cash collateral in connection with our derivative positions, this would likely make it impracticable to implement our current hedging strategy.
Our derivatives counterparties will be subject to significant new capital, margin and business conduct requirements imposed as a result of the Dodd-Frank Act. We expect that these requirements will increase the cost to hedge because there will be fewer counterparties in the market and increased counterparty costs will be passed on to us.
The above factors could also affect the pricing of derivatives and make it more difficult for us to enter into hedging transactions on favorable terms.
Climate change legislation or regulations restricting emissions of “greenhouse gases” could result in increased operating costs and reduced demand for the crude oil, natural gas NGLs and crude oilNGLs that we produce while physical effects of climate change could disrupt our production and cause us to incur significant costs in preparing for or responding to those effects.
In December 2009, the EPA published its findings that emissions of carbon dioxide, methane, and other greenhouse gases present an endangerment to public health and the environment because emissions of such gases are, according to the EPA, contributing to warming of the earth'searth’s atmosphere and other climatic changes. These findings provide the basis for the EPA to adopt and implement regulations that would restrict emissions of greenhouse gases under existing provisions of the Clean Air Act (the “CAA”).CAA. In June 2010, the EPA published its final rule to address the permitting of greenhouse gas emissions from stationary sources under the CAA'sCAA’s Prevention of Significant Deterioration (“PSD”), and Title V permitting programs. This rule “tailors” these permitting programs to apply to certain stationary sources of greenhouse gas emissions in a multi-step process, with the largest sources first subject to permitting. It is widely expected that facilities required to obtain PSD permits for their greenhouse gas emissions will be required to also reduce those emissions according to “best available control technology,” ("BACT"technology” (“BACT”) standards. In its permitting guidance for greenhouse gases, issued onin November 10, 2010, the EPA recommended options for BACT from the largest sources, which include improved energy efficiency, among others. EPA has recently issued a final rule retaining the current “tailored” permitting thresholds, opting not to extend greenhouse gas permitting requirements to smaller stationary sources at this time. The EPA, however, intends to revisit these thresholds again by 2016. Should it do so, it is possible the onshore crude oil and natural gas sector will be included.
In addition, on June 26, 2012, the United States Court of Appeals for the District of Columbia Circuit issued an opinion and order in Coalition for Responsible Regulation v. Environmental Protection Agency, No. 09-1322, upholding EPA'sEPA’s greenhouse gas-related rules, including the “Tailoring Rule,” against challenges from various state and industry group petitioners. In October 2013, the United States Supreme Court in Utility Air Regulatory Group v. EPA, accepted a petition for certiorari to decide whether EPA correctly determined that its regulation of greenhouse gases from mobile sources triggered permitting requirements under the CAA for stationary sources that emit greenhouse gases. The Court’s decision is expected in the spring or summer of 2014 and will have significant implications for the regulation of greenhouse gases from stationary sources, including those in the oil and gas sector. Any regulatory or permitting obligation that limits emissions of greenhouse gases could require us to incur
costs to reduce and monitor emissions of greenhouse gases associated with our operations and also adversely affect demand for the crude oil and natural gas and crude oil that we produce.
In addition, in October 2009, the EPA published a final rule requiring the reportingpast, Congress has considered various pieces of greenhouse gas emissions from specified large greenhouse gas sources in the U.S. on an annual basis, beginning in 2011 for emissions occurring in 2010. On November 8, 2010, the EPA finalized ruleslegislation to expand its greenhouse gas reporting rule to include onshore natural gas and crude oil production, processing, transmission, storage and distribution facilities. We are required to report our greenhouse gas emissions on an annual basis, beginning in 2012 for emissions occurring in 2011.
In June 2009, the U.S. House of Representatives passed the American Clean Energy and Security Act of 2009 (“ACESA”), which would establish an economy-wide cap on emissions of greenhouse gases in the U.S. and would require most sources of greenhouse gas
emissions to obtain and hold “allowances” corresponding to their annualreduce emissions of greenhouse gases. By steadily reducingCongress has not adopted any significant legislation in this respect to date, but could do so in the number of available allowances over time, ACESA would requirefuture. For example, if Congress undertakes comprehensive tax reform in the coming year, it is possible that such measures could include a 17 percent reductioncarbon tax, which could result in greenhouse gas emissions from 2005 levels by 2020, increasing upadditional direct costs to an 83 percent reductionour operations. In the absence of such emissions by 2050. The ACESA was not passed by the U.S. Senate. However,national legislation, many states and regions have taken legal measures to reduce emissions of greenhouse gases, primarily through the planned development of greenhouse gas emission inventories and/or regional greenhouse gas cap and trade programs. Recently, increasedFor example, Colorado has proposed to directly regulate methane emissions from the oil and gas sector in its recently proposed oil and gas air emissions rules.
President Obama has indicated that climate change and greenhouse gas regulation is a significant priority for his second term. The President issued a Climate Action Plan in June 2013 that, among other things, calls for a reduction in methane emissions from the oil and gas sector. In November 2013, the President released an Executive Order charging various federal agencies, including EPA, with devising and pursuing strategies to improve the country’s preparedness and resilience to climate change. In part through these executive actions, the direct regulation of methane emissions from the oil and gas sector continues to be a focus of regulation. In addition to the proposed Colorado rules discussed above, a lawsuit has been directed to methane emissions, including a lawsuitfiled by several Northeasternnortheastern states that would require the EPA to more stringently regulate methane emissions from the oil and gas sector. The passage of legislation, or executive and other initiatives that limit emissions of greenhouse gases from our equipment and operations, could require us to incur costs to reduce the greenhouse gas emissions, from our operations, and it could also adversely affect demand for the crude oil and natural gas and crude oil that we produce.
Some have suggested that one consequence of climate change could be increased severity of extreme weather, such as increased hurricanes and floods. Recent flooding in Colorado is an example of an extreme weather event that negatively impacted our operations. If such effectsevents were to continue to occur, or become more frequent, our operations could be adversely affected in various ways, including through damage to our facilities from powerful winds or increased costs for insurance.
Another possible consequence of climate change is increased volatility in seasonal temperatures. The market for natural gas is generally improved by periods of colder weather and impaired by periods of warmer weather, so any changes in climate could affect the market for the fuels that we produce. Despite the use of the term “global warming” as a shorthand for climate change, some studies indicate that climate change could cause some areas to experience temperatures substantially colder than their historical averages. As a result, it is difficult to predict how the market for our fuels could be affected by increased temperature volatility, although if there is an overall trend of warmer temperatures, it would be expected to have an adverse effect on our business.
The cost of defending any suits brought against us with respect to our royalty payment practices, and any judgments resulting from such suits, could have an adverse effect on our results of operations and financial condition.
In recent years, litigation has commenced against us and other companies in our industry regarding royalty practices and payments in jurisdictions where we conduct business. We intend to defend ourselves vigorously in these cases. The costs of defending these suits can be significant, even when we ultimately succeed in having them dismissed. These costs would be reflected in terms of dollar outlay, as well as the amount of time, attention and other resources that our management would have to appropriate to the defense. A judgment in favor of a plaintiff in a suit of this type could have a material adverse effect on our financial condition and profitability.
We may not be able to identify and acquire enough attractive prospects on a timely basis to meet our development needs, which could limit our future development opportunities and adversely affect our profitability.
Our geologists have identified a number of potential drilling locations on our existing acreage. These drilling locations must be replaced as they are drilled for us to continue to grow our reserves and production. Our ability to identify and acquire new drilling locations depends on a number of factors, including the availability of capital, regulatory approvals, commodity prices, competition, costs, availability of drilling rigs, drilling results and the ability of our geologists to successfully identify potentially successful new areas to develop. All of these factors are subject to numerous uncertainties. Because of these uncertainties, our profitability and growth opportunities may be limited by the timely availability of new drilling locations. As a result, our operations and profitability could be adversely affected.
PDCM is dependent upon our equity partner and poses exit-related risks for us.
The board of managers of the joint venturePDCM consists of three representatives appointed by us and three representatives appointed by our equity partner Lime Rock Partners, LP, each with equal voting power. The joint venture agreement generally requires the affirmative vote of a majority of the members of the board to approve an action, and we and Lime Rock may not always agree on the best course of action for the joint venture. If such a disagreement were to occur, we would not be able to cause the joint venture to take action that we believed to be in theits best interests of the joint venture.interests. Consequently, our best interests may not be advanced and our investment in the joint venture could be adversely affected. If there is a disagreement about a development plan and budget for the joint venture, Lime Rock is entitled to unilaterally suspend substantially all of the operations of the joint venture, which could have a material adverse impact on the results of operations of the joint venture and our investment. Such a suspension could last for up to two years, at which point either party could elect to dissolve the joint venture or to sell its ownership interests to a third party. Lime Rock is entitled in some cases to a preference with respect to liquidating distributions and proceeds from significant sales of ownership interests up to the amount of its contributed capital, which would diminish our returns if the value of the joint venture had declined at the time of the liquidation or sale.
After a “restricted period” which generally lasts for the four years following the closing of the joint venture, Lime Rock canis entitled to seek to sell its interest in the joint venture to a third party, subject to rights of first offer and refusal in favor of us. If we do not exercise those rights in a sale involving all of Lime Rock'sRock’s ownership interests, Lime Rock can exercise “drag-along” rights and compel us to sell all of our interests in the proposed transaction. Accordingly, if we possessed insufficient funds and were unable to obtain financing necessary to purchase Lime Rock'sRock’s interest under the rights of first offer and refusal, Lime Rock might sell its interests in the joint venture to a third party with whom we might have a difficult time dealing and in managing the joint venture or we may be required to sell our interest in the joint venture at a time when we may not wish to do so. Under these circumstances, our investment in the joint venture could be adversely affected.
Our undeveloped acreage must be drilled before lease expiration to hold the acreage by production. In highly competitive markets for acreage, failure to drill sufficient wells to hold acreage could result in a substantial lease renewal cost or, if renewal is not feasible, loss of our lease and prospective drilling opportunities.
Unless production is established within the spacing units covering the undeveloped acres on which some of the locations are identified, our leases for such acreage will expire. The cost to renew such leases may increase significantly, and we may not be able to renew such leases on commercially reasonable terms or at all. As such, our actual drilling activities may differ materially from our current expectations, which could adversely affect our business.
Our articles of incorporation, bylaws, stockholders rights plan and Nevada law contain provisions that may have an anti-takeover effect and may delay, defer or prevent a tender offer or takeover attempt, which may adversely affect the market price of our common stock.
Our articles of incorporation authorize our board of directors to issue preferred stock without stockholder approval. If our board of directors elects to issue preferred stock, it could be more difficult for a third party to acquire us. We previouslyhave adopted a stockholders rights plan that will dilute the stock ownership of certain acquirers of our common stock upon the occurrence of certain events. In addition, some provisions of our articles of incorporation, bylaws and Nevada law could make it more difficult for a third party to acquire control of us, including:
the organization of our board of directors as a classified board, which allows no more than one-third of our directors to be elected each year;
limitations on the ability of our shareholders to call special meetings; and
certain antitakeover provisions of the Nevada private corporations statute.
anti-takeover statutes.
Because we have no plans to pay dividends on our common stock, stockholdersinvestors must look solely to stock appreciation for a return on their investment in us.
We have never declared or paid cash dividends on our common stock. We currently intend to retain all future earnings and other cash resources, if any, for the operation and development of our business and do not anticipate paying cash dividends in the foreseeable future. Payment of any future dividends will be at the discretion of our board of directors after taking into account many factors, including our financial condition, operating results, current and anticipated cash needs and plans for expansion. In addition, our revolving credit facility and the indenture governing our senior notes limit our ability to pay cash dividends on our common stock. Any future dividends may also be restricted by any other debt agreements which we may enter into from time to time.
Our undeveloped acreage must be drilled before lease expiration to hold the acreage by production. In highly competitive markets for acreage, failure to drill sufficient wells to hold acreage could result in a substantial lease renewal cost or, if renewal is not feasible, loss of our lease and prospective drilling opportunities.
Unless production is established within the spacing units covering the undeveloped acres on which some of our drilling locations are identified, our leases for such acreage will expire. The cost to renew such leases may increase significantly, and we may not be able to renew such leases on commercially reasonable terms or at all. As such, our actual drilling activities may differ materially from our current expectations, which could adversely affect our business.
We may incur losses as a result of title defects in the properties in which we invest.
It is our practice in acquiring oil and gas leases or interests not to incur the expense of retaining lawyers to examine the title to the mineral interest at the time of acquisition. Rather, we rely upon the judgment of oil and gas lease brokers or landmen who perform the fieldwork in examining records in the appropriate governmental office before attempting to acquire a lease in a specific mineral interest. Leases in the Appalachia-Marcellus and Utica areas are particularly vulnerable to title deficiencies due the long history of land ownership in the area, resulting in extensive and complex chains of title. The existence of a material title deficiency can render a lease worthless and can adversely affect our results of operations and financial condition. While we typically obtain title opinions prior to commencing drilling operations on a lease or in a unit, the failure of title may not be discovered until after a well is drilled, in which case we may lose the lease and the right to produce all or a portion of the minerals under the property.
ITEM 1B. UNRESOLVED STAFF COMMENTS
None.
ITEM 3. LEGAL PROCEEDINGS
Information regarding our legal proceedings can be found in Note 11, Commitments and Contingencies – Litigation, to our consolidated financial statements included elsewhere in this report.
ITEM 4. MINE SAFETY DISCLOSURES
Not applicable.
PART II
ITEM 5. MARKET FOR THE REGISTRANT'S COMMON EQUITY, RELATED STOCKHOLDERS MATTERS AND ISSUER PURCHASES OF EQUITY SECURITIES
Our common stock, par value $0.01 per share, is traded on the NASDAQ Global Select Market under the symbol PDCE. The following table sets forth the range of high and low sales prices for our common stock for each of the periods presented:
| | | | Price Range | Price Range |
| | High | | Low | High | | Low |
| | | | | | | |
| January 1 - March 31, 2011 | $ | 49.60 |
| | $ | 39.93 |
| |
| April 1 - June 30, 2011 | 48.51 |
| | 28.67 |
| |
| July 1 - September 30, 2011 | 39.50 |
| | 19.35 |
| |
| October 1 - December 31, 2011 | 37.77 |
| | 15.08 |
| |
| January 1 - March 31, 2012 | 40.26 |
| | 28.61 |
| $ | 40.26 |
| | $ | 28.61 |
|
| April 1 - June 30, 2012 | 37.63 |
| | 19.33 |
| 37.63 |
| | 19.33 |
|
| July 1 - September 30, 2012 | 34.25 |
| | 23.27 |
| 34.25 |
| | 23.27 |
|
| October 1 - December 31, 2012 | 36.55 |
| | 25.76 |
| 36.55 |
| | 25.76 |
|
| January 1 - March 31, 2013 | | 53.80 |
| | 33.39 |
|
| April 1 - June 30, 2013 | | 55.56 |
| | 38.02 |
|
| July 1 - September 30, 2013 | | 66.03 |
| | 51.46 |
|
| October 1 - December 31, 2013 | | 73.93 |
| | 51.32 |
|
As of February 8, 20137, 2014, we had approximately 726707 shareholders of record. Since inception, no cash dividends have been declared on our common stock. Cash dividends are restricted under the terms of our revolving credit facility and the indenture governing our 7.75% senior notes due 2022 Senior Notes and we presently intend to continue a policy of using retained earnings for expansion of our business. See Note 8, Long-term Debt, to our consolidated financial statements included elsewhere in this report.
The following table presents information about our purchases of our common stock during the three months ended December 31, 20122013:
|
| | | | | | | | | | | | | |
| Period | | Total Number
of Shares
Purchased (1) | | Average Price
Paid per Share | | Total Number
of Shares
Purchased as
Part of Publicly
Announced Plans
or Programs | | Maximum Number
of Shares that May
Yet Be Purchased
Under the Plans
or Programs |
| | | | | | | | | |
| October 1 - 31, 2012 | | 709 |
| | $ | 31.93 |
| | — |
| | — |
|
| November 1 - 30, 2012 | | 9,786 |
| | 31.53 |
| | — |
| | — |
|
| December 1 - 31, 2012 | | 254 |
| | 33.25 |
| | — |
| | — |
|
| Total fourth quarter purchases | | 10,749 |
| | 31.59 |
| | | | |
|
| | | | | | | |
| Period | | Total Number of Shares Purchased (1) | | Average Price Paid per Share |
| | | | | |
| October 1 - 31, 2013 | | 1,086 |
| | $ | 60.83 |
|
| November 1 - 30, 2013 | | 7,762 |
| | 59.94 |
|
| December 1 - 31, 2013 | | — |
| | — |
|
| Total fourth quarter purchases | | 8,848 |
| | 60.05 |
|
__________
| |
| (1) | Purchases primarily represent shares purchased from employees for the payment of their tax liabilities related to the vesting of securities issued pursuant to our stock-based compensation plans. |
SHAREHOLDER PERFORMANCE GRAPH
The performance graph below compares the cumulative total return of our common stock over the five-year period ended December 31, 20122013, with the cumulative total returns for the same period for the Standard and Poor's ("S&P") 500 Index and the Standard Industrial Code ("SIC") Index. The SIC Index is a weighted composite of 254267 crude petroleum and natural gas companies. The cumulative total shareholder return assumes that $100 was invested, including reinvestment of dividends, if any, in our common stock on December 31, 20072008 and in the S&P 500 Index and the SIC Index on the same date. The results shown in the graph below are not necessarily indicative of future performance.
ITEM 6. SELECTED FINANCIAL DATA
| |
| | Year Ended December 31, | | Year Ended/As of December 31, |
| | 2012 | | 2011 | | 2010 | | 2009 | | 2008 | | 2013 | | 2012 | | 2011 | | 2010 | | 2009 |
| | (in millions, except per share data and as noted) | | (in millions, except per share data and as noted) |
| Statement of Operations: | |
| |
| |
| |
| |
| |
| Natural gas, NGLs and crude oil sales | | $ | 270.3 |
| | $ | 276.6 |
| | $ | 205.0 |
| | $ | 171.2 |
| | $ | 304.9 |
| |
| Statement of Operations (from continuing operations): | | |
| |
| |
| |
| |
|
| Crude oil, natural gas and NGLs sales | | | $ | 359.4 |
| | $ | 238.4 |
| | $ | 223.3 |
| | $ | 146.0 |
| | $ | 115.8 |
|
| Commodity price risk management gain (loss), net | | 32.3 |
| | 46.1 |
| | 59.9 |
| | (10.1 | ) | | 127.8 |
| | (23.9 | ) | | $ | 32.3 |
| | 46.1 |
| | 59.9 |
| | (10.1 | ) |
| Total revenues | | 356.1 |
| | 396.0 |
| | 343.0 |
| | 230.9 |
| | 572.5 |
| | 411.3 |
| | 320.6 |
| | 337.3 |
| | 276.6 |
| | 169.6 |
|
| Income (loss) from continuing operations | | (144.8 | ) | | 3.1 |
| | 6.0 |
| | (80.1 | ) | | 105.8 |
| | (26.5 | ) | | (21.7 | ) | | 22.6 |
| | 18.1 |
| | (62.8 | ) |
| | | | | | | | | | | | | | | | | | | | |
| Earnings per share from continuing operations | | | | | | | | | | | |
| Earnings per share from continuing operations: | | | | | | | | | | | |
| Basic | | $ | (5.23 | ) | | $ | 0.13 |
| | $ | 0.33 |
| | $ | (4.76 | ) | | $ | 7.19 |
| | $ | (0.82 | ) | | $ | (0.78 | ) | | $ | 0.96 |
| | $ | 0.94 |
| | $ | (3.71 | ) |
| Diluted | | (5.23 | ) | | 0.13 |
| | 0.32 |
| | (4.76 | ) | | 7.13 |
| | (0.82 | ) | | (0.78 | ) | | 0.95 |
| | 0.92 |
| | (3.71 | ) |
| | | | | | | | | | | | | | | | | | | | |
| Statement of Cash Flows: | | | | | | | | | | | | | | | | | | | | |
| Net cash from: | | | | | | | | | | | | | | | | | | | | |
| Operating activities | | $ | 174.7 |
| | $ | 166.8 |
| | $ | 151.8 |
| | $ | 143.9 |
| | $ | 139.1 |
| | $ | 159.2 |
| | $ | 174.7 |
| | $ | 166.8 |
| | $ | 151.8 |
| | $ | 143.9 |
|
| Investing activities | | (451.9 | ) | | (456.4 | ) | | (300.9 | ) | | (142.3 | ) | | (323.0 | ) | | (217.1 | ) | | (451.9 | ) | | (456.4 | ) | | (300.9 | ) | | (142.3 | ) |
| Financing activities | | 271.4 |
| | 243.4 |
| | 171.5 |
| | (20.6 | ) | | 150.1 |
| | 248.7 |
| | 271.4 |
| | 243.4 |
| | 171.5 |
| | (20.6 | ) |
| Capital expenditures | | 347.7 |
| | 334.5 |
| | 162.7 |
| | 143.0 |
| | 323.2 |
| | 394.9 |
| | 347.7 |
| | 334.5 |
| | 162.7 |
| | 143.0 |
|
| Acquisitions of natural gas and crude oil properties | | 312.2 |
| | 145.9 |
| | 158.1 |
| | — |
| | — |
| |
| Acquisitions of crude oil and natural gas properties | | | 9.7 |
| | 312.2 |
| | 145.9 |
| | 158.1 |
| | — |
|
| | | | | | | | | | | | | | | | | | | | |
| Balance Sheet: | | | | | | | | | | | | | | | | | | | | |
| Total assets | | $ | 1,826.8 |
| | $ | 1,698.0 |
| | $ | 1,389.0 |
| | $ | 1,250.3 |
| | $ | 1,402.7 |
| | $ | 2,025.2 |
| | $ | 1,826.8 |
| | $ | 1,698.0 |
| | $ | 1,389.0 |
| | $ | 1,250.3 |
|
| Working capital (deficit) | | (31.4 | ) | | (22.0 | ) | | 16.2 |
| | 32.9 |
| | 31.3 |
| |
| Working capital | | | 112.4 |
| | (31.4 | ) | | (22.0 | ) | | 16.2 |
| | 32.9 |
|
| Long-term debt | | 676.6 |
| | 532.2 |
| | 295.7 |
| | 280.7 |
| | 394.9 |
| | 657.0 |
| | 676.6 |
| | 532.2 |
| | 295.7 |
| | 280.7 |
|
| Total equity | | 703.2 |
| | 664.1 |
| | 642.2 |
| | 538.6 |
| | 512.3 |
| | 967.6 |
| | 703.2 |
| | 664.1 |
| | 642.2 |
| | 538.6 |
|
| | | | | | | | | | | | | | | | | | | | |
| Pricing and Lifting Costs Relating to Continuing Operations (per Mcfe): | | | | | | | | | |
| Average sales price (excluding gains/losses on derivatives) | | $ | 5.45 |
| | $ | 6.15 |
| | $ | 5.63 |
| | $ | 4.19 |
| | $ | 8.37 |
| |
| Average sales price (including realized gains/losses on derivatives) | | 6.44 |
| | 6.53 |
| | 6.89 |
| | 6.77 |
| | 8.62 |
| |
| Pricing and Lifting Costs Relating to Continuing Operations (per Boe): | | Pricing and Lifting Costs Relating to Continuing Operations (per Boe): | | | | | | | | |
| Average sales price (excluding net settlements on derivatives) | | | $ | 48.37 |
| | $ | 43.42 |
| | $ | 48.37 |
| | $ | 44.13 |
| | $ | 34.12 |
|
| Average lifting cost (1) | | 0.85 |
| | 0.92 |
| | 1.05 |
| | 0.78 |
| | 1.04 |
| | 5.01 |
| | 5.00 |
| | 4.98 |
| | 4.12 |
| | 4.28 |
|
| | | | | | | | | | | | | | | | | | | | | |
| Production (Bcfe): | | | | | | | | | | | |
| Production (MBoe): | | | | | | | | | | | |
| Production from continuing operations | | 49.6 |
| | 45.0 |
| | 37.0 |
| | 41.6 |
| | 36.9 |
| | 7,429.5 |
| | 5,489.9 |
| | 4,616.2 |
| | 3,383.3 |
| | 3,393.4 |
|
| Production from discontinued operations | | 0.4 |
| | 2.5 |
| | 1.6 |
| | 1.7 |
| | 1.8 |
| | 1,127.8 |
| | 2,835.3 |
| | 3,304.5 |
| | 3,056.1 |
| | 3,820.7 |
|
| Total production | | 50.0 |
| | 47.5 |
| | 38.6 |
| | 43.3 |
| | 38.7 |
| | 8,557.3 |
| | 8,325.2 |
| | 7,920.7 |
| | 6,439.4 |
| | 7,214.1 |
|
| | | | | | | | | | | | | | | | | | | | | |
| Total proved reserves (Bcfe) (2) | | 1,156.9 |
| | 1,015.5 |
| | 860.6 |
| | 717.3 |
| | 753.1 |
| |
| Total proved reserves (MMBoe) (2)(3)(4) | | | 265.8 |
| | 192.8 |
| | 169.3 |
| | 143.4 |
| | 119.6 |
|
______________
| |
| (1) | Lifting costs represent lease operating expenses, excluding production taxes, on a per unit basis. |
| |
| (2) | Includes total proved reserves related to our Piceance Basin and NECO assets of 14.1 MMBoe, 59.5 MMBoe, 76.4 MMBoe and 68.3 MMBoe as of December 31, 2012, 2011, 2010 and 2009, respectively. See Note 14, Assets Held for Sale, Divestitures and Discontinued Operations, to our consolidated financial statements included elsewhere in this report for additional details related to the divestiture of our Piceance Basin and NECO assets. |
| |
| (3) | Includes total proved reserves related to our shallow Upper Devonian (non-Marcellus Shale) Appalachian Basin assets of 2 MMBoe, 3 MMBoe, 4 MMBoe and 8 MMBoe as of December 31, 2012, 2011, 2010 and 2009, respectively. See Note 14, Assets Held for Sale, Divestitures and Discontinued Operations, to our consolidated financial statements included elsewhere in this report for additional details related to the divestiture of our shallow Upper Devonian (non-Marcellus Shale) Appalachian Basin assets. |
| |
| (4) | Includes total proved reserves related to our Permian Basin assets of 65.0 Bcfe10.8 MMBoe and 32.1 Bcfe5.4 MMBoe as of December 31, 2011 and 2010, respectively. As of December 31, 2011, ourOur Permian assets were held for sale as of December 31, 2011 and ondivested in February 28, 2012, the divestiture closed.2012. See Note 14, Assets Held for Sale, Divestitures and Discontinued Operations, to our consolidated financial statements included elsewhere in this report for additional details related to the divestiture of our Permian assets. |
ITEM 7. MANAGEMENT'S DISCUSSION AND ANALYSIS OF FINANCIAL CONDITION AND RESULTS OF OPERATIONS
The following discussion and analysis, as well as other sections in this report, should be read in conjunction with our consolidated financial statements and related notes to consolidated financial statements included elsewhere in this report. Further, we encourage you to revisit the Special Note Regarding Forward-Looking Statements in Part I of this report.
EXECUTIVE SUMMARY
20122013 Financial Overview
In 2012, ourCrude oil, natural gas and NGLs and crude oil productionsales from continuing operations averagedincreased in 2013 by $121.0 million, or 50.8%, compared to 2012. The growth in crude oil, natural gas and NGLs sales was the result of increased production and higher prices. For the month ended 135.6December 31, 2013, we maintained an average production rate of 27 MBoe per day. Production of 7.4 MMcfe per day,MMboe from continuing operations for the year ended December 31, 2013 represents an increase of approximately 10%35% as compared to the prior year. The increase in production isyear ended December 31, 2012, primarily attributable to our successful horizontal Niobrara and Codell drilling program in the Wattenberg Field and the Merit Acquisition.Field. Crude oil production from continuing operations increased 18.5%46% in 2012,2013, while NGLNGLs production from continuing operations increased 17.0%25%. As a result, ourOur liquids percentage of total production from continuing operations was 34.7%53% in 20122013 compared 32.4% in 2011.to 51% during 2012. Natural gas production from continuing operations increased 6.5%30% in 20122013 compared to 2011. As discussed under "Operational Overview-Production" below, production growth in 2012 was adversely affected by high line pressures experienced by our principal third-party provider of natural gas gathering, processing and transportation facilities in the Wattenberg Field. The high line pressure, primarily experienced during the second and third quarters, was the result of two primary factors: a series of operational issues experienced by the third-party midstream service provider facilities and abnormally warm weather. While natural gas production increased when compared to prior year, significant declines in the average price of natural gas during 2012 resulted in a decrease in natural gas sales, excluding hedges, of 28.9% year-over-year. The price of natural gas, however, rebounded significantly during the fourth quarter of 2012. During 2012, we recorded an impairment charge of $161.2 million related to our Piceance Basin proved oil and natural gas properties. While the significant decrease in natural gas prices from prior years has impacted our results of operations, we believe our derivative program was effective in providing a degree of price stability. Realized gains from derivative transactions increased considerably to $49.4 million in 2012, compared to $17.2 million in 2011, an addition of approximately $0.99 per Mcfe sold during 2012.
Available liquidity as of December 31, 20122013 was $398.6$647.0 million,, including $14.1$16.1 million through our joint venture related to PDCM, compared to $196.4$398.6 million, including $16.6$14.1 million related to PDCM, as of December 31, 2011.2012. Available liquidity is comprised of $193.2 million of cash and cash equivalents and funds$453.8 million available for borrowing under our revolving credit facility.facilities. In May 2012,August 2013, we completed a public offering of 6.5 million5,175,000 shares of our common stock, par value $0.01 per share, at a price to us of $53.37 per share, for net proceeds of approximately $164.5$276 million, after deducting offering expenses and underwriting discounts and offering expenses. These funds were useddiscounts. We expect to completeuse the Merit Acquisition noted below. In October 2012, we issued $500 million aggregate principal amount of our 2022 Senior Notes in a private placement. Theremaining net proceeds from the issuance of the notes of approximately $489 million were usedoffering to fund the redemption of our 2018 Senior Notes for a total redemption price of approximately $222 million, repay a portion of the amount outstanding under our revolving credit facility2014 capital program and for general corporate purposes. The early redemption of the 2018 Senior Notes resulted in a pre-tax loss on debt extinguishment of approximately $23.3 million.We believe we have sufficient liquidity to allow us to execute our expanded drilling program through 2014. On October 31, 2012,2013, we completed the semi-annual redetermination of our revolving credit facility's borrowing base. Our available borrowing base was reduced from $525 million toreaffirmed at $450 million as a result of issuance of our 2022 Senior Notes.million.
Operational Overview
Acquisitions.Drilling Activities. WeDuring 2013, we continued to make strides in 2012 towardexecute our strategic goalplan of growingincreasing production while increasing our production mix of crude oil and natural gas liquids. In June, we completed the Merit Acquisition for cash consideration of approximately $304.6 million, after certain post-closing adjustments. The acquired assets comprise approximately 29,800 net acres, after post-closing adjustments, located almost entirely in the core Wattenberg Field and with significant overlay withNGLs by focusing our existing acreage position. Ryder Scott prepared a reserve report with respect to the Merit Acquisition properties and estimated net proved reserves of 29.2 MMBoe (175 Bcfe) based on our development plan, using year-end 2011 SEC pricing and an effective date of April 1, 2012. Following the closing of the Merit Acquisition, our total position in the core Wattenberg Field was approximately 98,600 net acres.
Drilling Activities. During 2012, we continued to focus ourdrilling operations primarily in the oil- and liquid-rich Wattenberg Field in Colorado and the emerging Utica Shale play in southeastern Ohio. We
In the Wattenberg Field, we are currently have tworunning four drilling rigs operating in the Wattenberg Field. We drilled 37and recently completed and are producing from our first 16 horizontal wells and one vertical wellper section downspacing project. In 2013, we spudded 70 horizontal wells in the Wattenberg Field, in 2012,54 of which 30were completed, and participated in 49 gross, 10.4 net, horizontal non-operated drilling projects. In the Utica Shale, we spudded 11 horizontal wells in 2013, nine of which were completed and connected to a gathering line and two of which were in various stages of completion as of December 31, 2013. In the Appalachia-Marcellus Shale, PDCM spudded 14 horizontal wells in 2013, 10 of which were completed and turned-in-line as of December 31, 20122013, and we participated in 19 non-operated drilling projects. We also executed 160 refracture and/or recompletion projects on 83 wells in the Wattenberg Field. The shift in the Wattenberg Field from drilling both vertical and horizontal wells to our current program of drilling horizontal wells has resulted in significantly fewer wells being drilled at a considerably higher cost per well and higher production and reserves per well. The remaining activity in our Western Operating Region in 2012 was the first quarter completion of our final three Piceance wells drilled in 2011..
In our Eastern Operating Region, we drilledDivestiture of Crude Oil and completed two horizontal Utica wells during the year. At December 31, 2012, these wells are currently shut-in awaiting pipeline connections. We also drilled and completed one vertical Utica stratigraphic test well and completed one vertical Utica stratigraphic test well drilled in late 2011. In 2012, the costs related to the two vertical stratigraphic test wells were expensed at a cost of $12.2 million. We currently plan to continue to de-risk and develop our approximate 45,000 net acres without materially adding to our leasehold position. We estimate our total gross horizontal Utica Shale drilling inventory to be approximately 200 locations. In addition, PDCM drilled three horizontal Marcellus wells in 2012, all of which were completed and turned-in-line during the year.
Natural Gas and Crude Oil Properties Divestitures.Properties. In October 2011, we announced our intent to divest our Permian Basin assets to focus our efforts on our horizontal drilling programs. During the fourth quarter of 2011, we sold certain non-core Permian assets to unrelated
third parties for a total of $13.2 million. On December 20, 2011, we executed a purchase and sale agreement with another unrelated third-party for the sale of our core Permian assets for a total price of $173.9 million, subject to customary post-closing adjustments. On February 28, 2012, the divestiture of the core Permian assets closed. Upon final post-closing adjustments on June 29, 2012, total proceeds received for the core Permian assets was $189.2 million, resulting in a pre-tax gain on sale of $19.9 million. The proceeds from these sales were used to pay down amounts outstanding under our revolving credit facility and to provide partial funding for our 2012 capital budget. The results of operations related to our Permian Basin assets are reported as discontinued operations for all applicable periods presented in the accompanying statements of operations included elsewhere in this report.
2013 Planned Divestiture. On February 4, 2013, we entered into a purchase and sale agreement with certain affiliates of Caerus Oil and Gas LLC (“Caerus”), pursuant to which we have agreed to sell to Caerus our Piceance Basin, NECO and certain other non-core Colorado oil and gas properties, leasehold mineral interests and related assets, including derivatives, for aggregate cashassets. This divestiture was completed in June 2013 with total consideration of approximately $200$177.6 million, with an additional $17.0 million paid to our non-affiliated investor partners in our affiliated partnerships. The sale resulted in a pre-tax loss of $2.3 million. The cash consideration is subject to customary adjustments, including adjustments based upon title and environmental due diligence, and by certain firm transportation obligations and natural gas hedging positions that will be assumed by Caerus. We intend to use the proceeds from the saleasset divestiture were used to repay a portion of amounts outstanding underpay down our revolving credit facility and partiallyto fund a portion of our 2013 capital program. The assets being soldbudget. Following the sale to Caerus, we do not include anyhave significant continuing involvement in the operations of, our core Wattenberg Field acreage. Asor cash flows from, the Piceance Basin and NECO oil and gas properties. Accordingly, the results of December 31, 2012, total estimated proved reservesoperations related to these assets were 83,656 MMcf of natural gas and 148 MBbls of crude oil,have been separately reported as discontinued operations for an aggregate of 84,544 Mmcfe of natural gas equivalent. See Note 19, Subsequent Events, toall periods presented in our consolidated financial statements included elsewhere in this report for additional details related to the planned divestiture of our Piceance and NECO assets. There can be no assurance that this transaction will close as planned. In addition, purchase price adjustments may reduce our proceeds from the transaction.report.
In October 2013, we executed a purchase and sale agreement for the sale of our shallow Upper Devonian (non-Marcellus Shale) Appalachian Basin crude oil and natural gas properties owned directly by us, as well as through our proportionate share of PDCM. The properties consisted of approximately 3,500 gross shallow producing wells, related facilities and associated leasehold acreage, limited to the Upper Devonian and shallower formations. Substantially all of the divestiture closed in December 2013 for aggregate consideration of approximately $20.6 million, of which our share of the proceeds was approximately $5.1 million, subject to certain post-closing adjustments. Concurrent with the closing of the transaction, our $6.7 million irrevocable standby letter of credit and an agreement for firm transportation services was released and novated to the buyer. We retained all zones, formations and intervals below the Upper Devonian formation, including the Marcellus Shale, Utica Shale and Huron Shale, as well as the Marcellus-related midstream assets.
Production.Colorado Flooding. Production from continuingIn September 2013, we experienced widespread flooding in our Wattenberg Field operations increased significantly in 2012Weld County, Colorado, which resulted in a shut-in of approximately 200 vertical wells, approximately 40 of which remained shut-in as compared to 2011. In particular, primarilyof December 31, 2013. Through December 31, 2013, we have expensed approximately $0.9 million and have capitalized approximately $1.1 million as a result of performing remediation operations. Assessment of the full economic impact of the flooding is ongoing and we expect to incur approximately $1 million to $2 million in additional costs during the first quarter of 2014 to replace damaged well equipment and to bring vertical wells back on-line.
2014 Operational Outlook
We expect our production for 2014 to range between 9.5 MMBoe to 10 MMBoe. Our 2014 $647 million capital budget, of which $16 million represents our share of PDCM's capital budget, is expected to be used primarily for development drilling and selective acquisition of additional acreage. This budget includes $576 million of development capital and $71 million for leasehold acquisitions, exploration and other expenditures. We may revise our capital budget during the year as a result of, among other things, acquisitions or dispositions of assets, drilling results, commodity prices, changes in our borrowing capacity and/or significant changes in cash flows.
Wattenberg Field drilling activities, oil production increased 18.5%Field. and NGL production increased 17%. This production growth was achieved despite high line pressures experienced by our principal third-party provider of natural gas gathering, processing and transportation facilitiesWe expect to invest approximately $467 million in the Wattenberg Field. The high line pressure was the result ofField in 2014, continuing with a series of operational issues experienced by third-party midstream service provider, primarily duringfour-rig drilling program with plans to add a fifth operated horizontal drilling rig in the second and third quarter of 2012. The operational issues included downtime on third-party NGL transportation2014. We plan to spud 115 gross operated horizontal wells, comprised of 59 horizontal Codell wells and fractionation facilities and abnormally warm weather, which limited56 horizontal Niobrara wells. Approximately $100 million of the gathering system compression capacity. We are working closely with this primary midstream provider whototal Wattenberg Field capital budget is implementingexpected to be allocated to non-operated projects, including participation in a multi-year facility expansion capable of significantly increasing long-term gathering and processing capacity26-well pad in the Niobrara formation in the northeastern portion of the core Wattenberg Field. However, we do not expect the impact of this increased capacityWe also plan to substantially benefit us until late 2013.reinitiate a modest vertical well refracturing program.
Our NGL pricingUtica Shale. We expect to invest approximately $162 million in the Utica Shale to spud 18 horizontal wells, including eight wells in our northern acreage and 10 wells in our southern acreage. A second drilling rig is expected to be deployed in the second half of 2014. The Utica capital budget includes approximately $30 million to acquire additional contiguous leasehold.
Marcellus Shale. PDCM's 2014 capital budget is $32 million, of which $16 million represents our share, and is expected to be utilized to finalize drilling and completion operations on horizontal wells that were in-process at December 31, 2013 and for midstream infrastructure. PDCM's capital budget is expected to be funded by PDCM's operating activities, borrowing under its credit facility or other financing transactions. PDCM has also decreased significantly relativeelected to temporarily suspend drilling activities in the same period in 2011. Our NGLs are priced at Conway, Kansas, where ethane and propane are valued at a significant discount to Mt. Belvieu gulf coast NGL pricing. The planned 2013 infrastructure projects include a new NGL pipeline that will provide direct access for our NGLs to Mt. Belvieu where we anticipate improved pricing.Marcellus Shale.
Non-U.S. GAAP Financial Measures
We use "adjusted cash flows from operations," "adjusted net income (loss) attributable to shareholders,," "adjusted EBITDA" and "PV-10%,"PV-10," non-U.S. GAAP financial measures, for internal management reporting, when evaluating period-to-period changes and, in some cases, providing public guidance on possible future results. These measures are not measures of financial performance under U.S. GAAP and should be considered in addition to, not as a substitute for, net income (loss) or cash flows from operations, investing or financing activities, or standardized measure, as applicable, and should not be viewed as a liquidity measuremeasures or indicatorindicators of cash flows reported in accordance with U.S. GAAP. The non-U.S. GAAP financial measures that we use may not be comparable to similarly titled measures reported by other companies. Also, in the future, we may disclose different non-U.S. GAAP financial measures in order to help our investors more meaningfully evaluate and compare our future results of operations to our previously reported results of operations. We strongly encourage investors to review our financial statements and publicly filed reports in their entirety and to not rely on any single financial measure. See Reconciliation of Non-U.S. GAAP Financial Measures for a detailed description of these measures, as well as a reconciliation of each to the most comparable U.S. GAAP measure.
Results of Operations
Summary Operating Results
The following table presents selected information regarding our operating results from continuing operations:
| | | | Year Ended December 31, | Year Ended December 31, |
| | | | | | | | Change | | | | | | | Percent Change |
| | 2012 | | 2011 | | 2010 | | 2012-2011 | | 2011-2010 | 2013 | | 2012 | | 2011 | | 2013-2012 | | 2012-2011 |
| | (dollars in millions, except per unit data) | | | | | (dollars in millions, except per unit data) | | | | |
| Production (1) | | | | | | | | | | | | | | | | | | |
| Crude oil (MBbls) | | 2,909.7 |
| | 1,987.8 |
| | 1,675.7 |
| | 46.4 | % | | 18.6 | % |
| Natural gas (MMcf) | 32,409.8 |
| | 30,429.7 |
| | 26,239.1 |
| | 6.5 | % | | 16.0 | % | 20,859.6 |
| | 15,988.6 |
| | 13,370.1 |
| | 30.5 | % | | 19.6 | % |
| NGLs (MBbls) | 841.3 |
| | 719.2 |
| | 569.6 |
| | 17.0 | % | | 26.3 | % | 1,043.2 |
| | 837.3 |
| | 712.1 |
| | 24.6 | % | | 17.6 | % |
| Crude oil (MBbls) | 2,025.9 |
| | 1,709.9 |
| | 1,231.4 |
| | 18.5 | % | | 38.9 | % | |
| Natural gas equivalent (MMcfe) (2) | 49,612.4 |
| | 45,004.8 |
| | 37,044.9 |
| | 10.2 | % | | 21.5 | % | |
| Average MMcfe per day | 135.6 |
| | 123.3 |
| | 101.5 |
| | 10.0 | % | | 21.5 | % | |
| Natural Gas, NGLs and Crude Oil Sales | | | | | | | | | | |
| Crude oil equivalent (MBoe) (2) | | 7,429.5 |
| | 5,489.9 |
| | 4,616.2 |
| | 35.3 | % | | 18.9 | % |
| Average MBoe per day | | 20.4 |
| | 15.0 |
| | 12.6 |
| | 36.0 | % | | 19.0 | % |
| Crude Oil, Natural Gas and NGLs Sales | | | | | | | | | | |
| Crude oil | | $ | 261.6 |
| | $ | 173.5 |
| | $ | 147.2 |
| | 50.8 | % | | 20.4 | % |
| Natural gas | $ | 70.8 |
| | $ | 99.6 |
| | $ | 94.6 |
| | (28.9 | )% | | 5.3 | % | 68.6 |
| | 42.0 |
| | 49.3 |
| | 63.3 | % | | (14.8 | )% |
| NGLs | 23.0 |
| | 27.2 |
| | 22.6 |
| | (15.4 | )% | | 20.4 | % | 29.2 |
| | 22.9 |
| | 26.8 |
| | 27.5 | % | | (14.6 | )% |
| Crude oil | 176.5 |
| | 149.8 |
| | 91.1 |
| | 17.8 | % | | 64.4 | % | |
| Provision for underpayment of natural gas sales | — |
| | — |
| | (3.3 | ) | | — | % | | (100.0 | )% | |
| Total natural gas, NGLs and crude oil sales | $ | 270.3 |
| | $ | 276.6 |
| | $ | 205.0 |
| | (2.3 | )% | | 34.9 | % | |
| Total crude oil, natural gas and NGLs sales | | $ | 359.4 |
| | $ | 238.4 |
| | $ | 223.3 |
| | 50.8 | % | | 6.8 | % |
| | | | | | | | | | | | | | | | | | | |
| Realized Gain (Losses) on Derivatives, net (3) | | | | | | | | | | |
| Net Settlements on Derivatives (3) | | | | | | | | | | |
| Natural gas | $ | 49.9 |
| | $ | 29.1 |
| | $ | 40.0 |
| | 71.5 | % | | (27.3 | )% | $ | 16.0 |
| | $ | 49.9 |
| | $ | 29.1 |
| | (67.9 | )% | | 71.5 | % |
| Crude oil | (0.5 | ) | | (11.9 | ) | | 7.1 |
| | (95.8 | )% | | (267.6 | )% | (3.1 | ) | | (0.5 | ) | | (11.9 | ) | | * |
| | (95.8 | )% |
| Total realized gain on derivatives, net | $ | 49.4 |
| | $ | 17.2 |
| | $ | 47.1 |
| | 187.2 | % | | (63.5 | )% | |
| Total net settlements on derivatives | | $ | 12.9 |
| | $ | 49.4 |
| | $ | 17.2 |
| | (73.9 | )% | | 187.2 | % |
| | | | | | | | | | | | | | | | | | | |
| Average Sales Price (excluding gain/loss on derivatives) | | | | | | | | | | |
| Average Sales Price (excluding net settlements on derivatives) | | | | | | | | | | |
| Crude oil (per Bbl) | | $ | 89.92 |
| | $ | 87.27 |
| | $ | 87.44 |
| | 3.0 | % | | (0.2 | )% |
| Natural gas (per Mcf) | $ | 2.18 |
| | $ | 3.27 |
| | $ | 3.61 |
| | (33.3 | )% | | (9.4 | )% | 3.29 |
| | 2.63 |
| | 3.74 |
| | 25.1 | % | | (29.7 | )% |
| NGLs (per Bbl) | 27.36 |
| | 37.82 |
| | 39.66 |
| | (27.7 | )% | | (4.6 | )% | 27.97 |
| | 27.33 |
| | 37.62 |
| | 2.3 | % | | (27.4 | )% |
| Crude oil (per Bbl) | 87.14 |
| | 87.63 |
| | 73.96 |
| | (0.6 | )% | | 18.5 | % | |
| Natural gas equivalent (per Mcfe) | 5.45 |
| | 6.15 |
| | 5.63 |
| | (11.4 | )% | | 9.2 | % | |
| Crude oil equivalent (per Boe) | | 48.37 |
| | 43.42 |
| | 48.37 |
| | 11.4 | % | | (10.2 | )% |
| | | | | | | | | | | | | | | | | | | |
| Average Sales Price (including realized gain/loss on derivatives) | | | | | | | | | | |
| Natural gas (per Mcf) | $ | 3.72 |
| | $ | 4.23 |
| | $ | 5.13 |
| | (12.1 | )% | | (17.5 | )% | |
| NGLs (per Bbl) | 27.36 |
| | 37.82 |
| | 39.66 |
| | (27.7 | )% | | (4.6 | )% | |
| Crude oil (per Bbl) | 86.87 |
| | 80.69 |
| | 79.70 |
| | 7.7 | % | | 1.2 | % | |
| Natural gas equivalent (per Mcfe) | 6.44 |
| | 6.53 |
| | 6.89 |
| | (1.4 | )% | | (5.2 | )% | |
| | | | | | | | | | | |
| Average Lifting Cost (per Mcfe) (4) | | | | | | | | | | |
| Western operating region | $ | 0.77 |
| | $ | 0.87 |
| | $ | 1.01 |
| | (11.5 | )% | | (13.9 | )% | |
| Eastern operating region | 1.38 |
| | 1.33 |
| | 1.55 |
| | 3.8 | % | | (14.2 | )% | |
| Average Lifting Cost (per Boe) (4) | | | | | | | | | | |
| Wattenberg Field | | $ | 4.72 |
| | $ | 4.23 |
| | $ | 4.40 |
| | 11.6 | % | | (3.9 | )% |
| Utica Shale | | 1.53 |
| | 7.37 |
| | — |
| | (79.2 | )% | | * |
|
| Appalachia-Marcellus Shale | | 7.00 |
| | 8.29 |
| | 7.99 |
| | (15.6 | )% | | 3.8 | % |
| Weighted-average | 0.85 |
| | 0.92 |
| | 1.05 |
| | (7.6 | )% | | (12.4 | )% | 5.01 |
| | 5.00 |
| | 4.98 |
| | 0.2 | % | | 0.4 | % |
| | | | | | | | | | | | | | | | | | | |
| Natural Gas Marketing Contribution Margin (5) | $ | 0.5 |
| | $ | 0.9 |
| | $ | 1.1 |
| | (44.4 | )% | | (18.2 | )% | $ | (0.3 | ) | | $ | 0.4 |
| | $ | 0.7 |
| | * |
| | (42.9 | )% |
| | | | | | | | | | | | | | | | | | | |
| Other Costs and Expenses | | | | | | | | | | | | | | | | | | |
| Exploration expense | $ | 22.6 |
| | $ | 6.3 |
| | $ | 13.7 |
| | 261.5 | % | | (54.3 | )% | $ | 7.0 |
| | $ | 20.9 |
| | $ | 5.7 |
| | (66.3 | )% | | 264.4 | % |
| Impairment of natural gas and crude oil properties | 168.1 |
| | 25.2 |
| | 6.5 |
| | * |
| | 288.2 | % | |
| Impairment of crude oil and natural gas properties | | 53.4 |
| | 5.9 |
| | 2.3 |
| | * |
| | 156.2 | % |
| General and administrative expense | 58.8 |
| | 61.5 |
| | 42.2 |
| | (4.3 | )% | | 45.7 | % | 64.0 |
| | 58.8 |
| | 61.5 |
| | 8.8 | % | | (4.3 | )% |
| Depreciation, depletion, and amortization | 146.9 |
| | 128.9 |
| | 108.1 |
| | 13.9 | % | | 19.3 | % | 127.3 |
| | 98.8 |
| | 87.6 |
| | 28.8 | % | | 12.7 | % |
| | | | | | | | | | | | | | | | | | | |
| Loss on extinguishment of debt | $ | 23.3 |
| | $ | — |
| | $ | — |
| | 100.0 | % | | — | % | $ | — |
| | $ | 23.3 |
| | $ | — |
| | (100.0 | )% | | * |
|
| Interest Expense | $ | 48.3 |
| | $ | 37.0 |
| | $ | 33.3 |
| | 30.6 | % | | 11.2 | % | $ | 51.9 |
| | $ | 48.3 |
| | $ | 37.0 |
| | 7.5 | % | | 30.6 | % |
| |
| * | Percentage change is not meaningful or equal to or greater than 300%. |
Amounts may not recalculate due to rounding.
______________
| |
| (1) | Production is net and determined by multiplying the gross production volume of properties in which we have an interest by our ownership percentage. For total production volume, including discontinued operations, see Part I, Item 6, Selected Financial Data included in this report.Data. |
| |
| (2) | Six Mcf of natural gas equals oneOne Bbl of crude oil or NGL.NGL equals six Mcf of natural gas. |
| |
| (3) | Represents realized derivative gains and lossesnet settlements on derivatives related to crude oil and natural gas NGLs and crude oil sales, which do not include realized derivative gains and lossesnet settlements on derivatives related to natural gas marketing. |
| |
| (4) | Represents lease operating expenses, exclusive of production taxes, on a per unit basis. |
| |
| (5) | Represents sales from natural gas marketing, net of costs of natural gas marketing, including realizednet settlements and unrealized derivative gains and lossesnet change in fair value of unsettled derivatives related to natural gas marketing activities. |
Crude Oil, Natural Gas NGLs and Crude OilNGLs Sales
The following tables present crude oil, natural gas NGLs and crude oilNGLs production and weighted-average sales price for continuing operations:
|
| | | | | | | | | | | | | | | |
| | | Year Ended December 31, |
| | | | | | | | | Change |
| Production by Operating Region | | 2012 | | 2011 | | 2010 | | 2012-2011 | | 2011-2010 |
| Natural gas (MMcf) | | | | | | | | | | |
| Western | | | | | | | | | | |
| Wattenberg Field | | 9,845.2 |
| | 8,980.2 |
| | 7,229.7 |
| | 9.6 | % | | 24.2 | % |
| Piceance Basin (1) | | 13,226.9 |
| | 13,350.0 |
| | 12,001.5 |
| | (0.9 | )% | | 11.2 | % |
| NECO, other (1) | | 3,194.3 |
| | 3,709.6 |
| | 4,481.9 |
| | (13.9 | )% | | (17.2 | )% |
| Total Western | | 26,266.4 |
| | 26,039.8 |
| | 23,713.1 |
| | 0.9 | % | | 9.8 | % |
| Eastern | | 6,143.4 |
| | 4,389.9 |
| | 2,526.0 |
| | 39.9 | % | | 73.8 | % |
| Total | | 32,409.8 |
| | 30,429.7 |
| | 26,239.1 |
| | 6.5 | % | | 16.0 | % |
| Crude oil (MBbls) | | | | | | | | | | |
| Western | | | | | | | | | | |
| Wattenberg Field | | 1,979.7 |
| | 1,670.9 |
| | 1,190.3 |
| | 18.5 | % | | 40.4 | % |
| Piceance Basin (1) | | 37.7 |
| | 33.2 |
| | 33.1 |
| | 13.6 | % | | 0.3 | % |
| NECO, other (1) | | 0.4 |
| | 1.0 |
| | 2.1 |
| | (60.0 | )% | | (52.4 | )% |
| Total Western | | 2,017.8 |
| | 1,705.1 |
| | 1,225.5 |
| | 18.3 | % | | 39.1 | % |
| Eastern | | 8.1 |
| | 4.8 |
| | 5.9 |
| | 68.8 | % | | (18.6 | )% |
| Total | | 2,025.9 |
| | 1,709.9 |
| | 1,231.4 |
| | 18.5 | % | | 38.9 | % |
| NGLs (MBbls) | | | | | | | | | | |
| Western | | | | | | | | | | |
| Wattenberg Field | | 837.3 |
| | 712.1 |
| | 561.1 |
| | 17.6 | % | | 26.9 | % |
| NECO, other (1) | | 4.0 |
| | 7.1 |
| | 8.5 |
| | (43.7 | )% | | (16.5 | )% |
| Total | | 841.3 |
| | 719.2 |
| | 569.6 |
| | 17.0 | % | | 26.3 | % |
| Natural gas equivalent (MMcfe) | | | | | | | | | | |
| Western | | | | | | | | | | |
| Wattenberg Field | | 26,747.0 |
| | 23,278.4 |
| | 17,738.4 |
| | 14.9 | % | | 31.2 | % |
| Piceance Basin (1) | | 13,453.1 |
| | 13,549.3 |
| | 12,199.9 |
| | (0.7 | )% | | 11.1 | % |
| NECO, other (1) | | 3,220.1 |
| | 3,758.2 |
| | 4,545.2 |
| | (14.3 | )% | | (17.3 | )% |
| Total Western | | 43,420.2 |
| | 40,585.9 |
| | 34,483.5 |
| | 7.0 | % | | 17.7 | % |
| Eastern | | 6,192.2 |
| | 4,418.9 |
| | 2,561.4 |
| | 40.1 | % | | 72.5 | % |
| Total | | 49,612.4 |
| | 45,004.8 |
| | 37,044.9 |
| | 10.2 | % | | 21.5 | % |
| | | | | | | | | | | |
|
| | | | | | | | | | | | | | | |
| | | Year Ended December 31, |
| | | | | | | | | Change |
| Production by Operating Region | | 2013 | | 2012 | | 2011 | | 2013-2012 | | 2012-2011 |
| Crude oil (MBbls) | | | | | | | | | | |
| Wattenberg Field | | 2,783.1 |
| | 1,979.1 |
| | 1,670.9 |
| | 40.6 | % | | 18.4 | % |
| Utica Shale | | 122.8 |
| | 3.0 |
| | — |
| | * |
| | * |
|
| Appalachia-Marcellus Shale | | 3.8 |
| | 5.7 |
| | 4.8 |
| | (33.3 | )% | | 18.8 | % |
| Total | | 2,909.7 |
| | 1,987.8 |
| | 1,675.7 |
| | 46.4 | % | | 18.6 | % |
| Natural gas (MMcf) | | | | | | | | | | |
| Wattenberg Field | | 12,724.3 |
| | 9,844.7 |
| | 8,980.2 |
| | 29.3 | % | | 9.6 | % |
| Utica Shale | | 561.1 |
| | 2.1 |
| | — |
| | * |
| | * |
|
| Appalachia-Marcellus Shale | | 7,574.2 |
| | 6,141.8 |
| | 4,389.9 |
| | 23.3 | % | | 39.9 | % |
| Total | | 20,859.6 |
| | 15,988.6 |
| | 13,370.1 |
| | 30.5 | % | | 19.6 | % |
| NGLs (MBbls) | | | | | | | | | | |
| Wattenberg Field | | 1,034.4 |
| | 837.3 |
| | 712.1 |
| | 23.5 | % | | 17.6 | % |
| Utica Shale | | 8.8 |
| | — |
| | — |
| | * |
| | * |
|
| Total | | 1,043.2 |
| | 837.3 |
| | 712.1 |
| | 24.6 | % | | 17.6 | % |
| Crude oil equivalent (MBoe) | | | | | | | | | | |
| Wattenberg Field | | 5,938.2 |
| | 4,457.2 |
| | 3,879.7 |
| | 33.2 | % | | 14.9 | % |
| Utica Shale | | 225.1 |
| | 3.4 |
| | — |
| | * |
| | * |
|
| Appalachia-Marcellus Shale | | 1,266.2 |
| | 1,029.3 |
| | 736.5 |
| | 23.0 | % | | 39.8 | % |
| Total | | 7,429.5 |
| | 5,489.9 |
| | 4,616.2 |
| | 35.3 | % | | 18.9 | % |
| | | | | | | | | | | |
Amounts may not recalculate due to rounding.
______________
| |
(1) | On February 4, 2013, we entered into a purchase and sale agreement pursuant to which we have agreed to sell our Piceance Basin, NECO and certain non-core Colorado oil and gas properties. See Note 19, Subsequent Events, to our consolidated financial statements included elsewhere in this report for additional information regarding the planned divestiture. There can be no assurance we will be successful in closing such divestiture. |
|
| | | | | | | | | | | | | | | | | | |
| | | Year Ended December 31, |
| Average Sales Price by Operating Region | | | | | | | | Change |
| (excluding gain/loss on derivatives) | | 2012 | | 2011 | | 2010 | | 2012-2011 | | 2011-2010 |
| Natural gas (per Mcf) | | | | | | | | | | |
| Western | | | | | | | | | | |
| Wattenberg Field | | $ | 2.61 |
| | $ | 3.52 |
| | $ | 3.70 |
| | (25.9 | )% | | (4.9 | )% |
| Piceance Basin (1) | | 1.67 |
| | 2.82 |
| | 3.38 |
| | (40.8 | )% | | (16.6 | )% |
| NECO, other (1) | | 2.08 |
| | 3.26 |
| | 3.60 |
| | (36.2 | )% | | (9.4 | )% |
| Western | | 2.07 |
| | 3.12 |
| | 3.52 |
| | (33.7 | )% | | (11.4 | )% |
| Eastern | | 2.66 |
| | 4.15 |
| | 4.44 |
| | (35.9 | )% | | (6.5 | )% |
| Weighted-average price | | 2.18 |
| | 3.27 |
| | 3.61 |
| | (33.3 | )% | | (9.4 | )% |
| Crude oil (per Bbl) | | | | | | | | | | |
| Western | | | | | | | | | | |
| Wattenberg Field | | 87.27 |
| | 87.93 |
| | 74.46 |
| | (0.8 | )% | | 18.1 | % |
| Piceance Basin (1) | | 80.20 |
| | 78.50 |
| | 56.60 |
| | 2.2 | % | | 38.7 | % |
| NECO, other (1) | | 83.80 |
| | (95.33 | ) | | 40.23 |
| | (187.9 | )% | | (337.0 | )% |
| Western | | 87.14 |
| | 87.63 |
| | 73.95 |
| | (0.6 | )% | | 18.5 | % |
| Eastern | | 86.43 |
| | 87.09 |
| | 77.10 |
| | (0.8 | )% | | 13.0 | % |
| Weighted-average price | | 87.14 |
| | 87.63 |
| | 73.96 |
| | (0.6 | )% | | 18.5 | % |
| NGLs (per Bbl) | | | | | | | | | | |
| Western | | | | | | | | | | |
| Wattenberg Field | | 27.33 |
| | 37.62 |
| | 39.56 |
| | (27.4 | )% | | (4.9 | )% |
| NECO, other (1) | | 32.80 |
| | 58.07 |
| | 46.29 |
| | (43.5 | )% | | 25.4 | % |
| Weighted-average price | | 27.36 |
| | 37.82 |
| | 39.66 |
| | (27.7 | )% | | (4.6 | )% |
| Natural gas equivalent (per Mcfe) | | | | | | | | | | |
| Western | | | | | | | | | | |
| Wattenberg Field | | 8.27 |
| | 8.82 |
| | 7.81 |
| | (6.2 | )% | | 12.9 | % |
| Piceance Basin (1) | | 1.87 |
| | 2.97 |
| | 3.40 |
| | (37.0 | )% | | (12.6 | )% |
| NECO, other (1) | | 2.12 |
| | 3.30 |
| | 3.65 |
| | (35.8 | )% | | (9.6 | )% |
| Western | | 5.83 |
| | 6.35 |
| | 5.71 |
| | (8.2 | )% | | 11.2 | % |
| Eastern | | 2.76 |
| | 4.22 |
| | 4.55 |
| | (34.6 | )% | | (7.3 | )% |
| Weighted-average price | | 5.45 |
| | 6.15 |
| | 5.63 |
| | (11.4 | )% | | 9.2 | % |
|
| | | | | | | | | | | | | | | | | | |
| | | Year Ended December 31, |
| Average Sales Price by Operating Region | | | | | | | | Change |
| (excluding net settlements on derivatives) | | 2013 | | 2012 | | 2011 | | 2013-2012 | | 2012-2011 |
| Crude oil (per Bbl) | | | | | | | | | | |
| Wattenberg Field | | $ | 89.83 |
| | $ | 87.27 |
| | $ | 87.42 |
| | 2.9 | % | | (0.2 | )% |
| Utica Shale | | 91.90 |
| | 76.58 |
| | — |
| | 20.0 | % | | * |
|
| Appalachia-Marcellus Shale | | 92.89 |
| | 92.73 |
| | 95.86 |
| | 0.2 | % | | (3.3 | )% |
| Weighted-average price | | 89.92 |
| | 87.27 |
| | 87.44 |
| | 3.0 | % | | (0.2 | )% |
| Natural gas (per Mcf) | | | | | | | | | | |
| Wattenberg Field | | 3.25 |
| | 2.61 |
| | 3.55 |
| | 24.5 | % | | (26.5 | )% |
| Utica Shale | | 2.74 |
| | 1.66 |
| | — |
| | 65.1 | % | | * |
|
| Appalachia-Marcellus Shale | | 3.39 |
| | 2.66 |
| | 4.15 |
| | 27.4 | % | | (35.9 | )% |
| Weighted-average price | | 3.29 |
| | 2.63 |
| | 3.74 |
| | 25.1 | % | | (29.7 | )% |
| NGLs (per Bbl) | | | | | | | | | | |
| Wattenberg Field | | 27.83 |
| | 27.33 |
| | 37.62 |
| | 1.8 | % | | (27.4 | )% |
| Utica Shale | | 43.70 |
| | — |
| | — |
| | * |
| | * |
|
| Weighted-average price | | 27.97 |
| | 27.33 |
| | 37.62 |
| | 2.3 | % | | (27.4 | )% |
| Crude oil equivalent (per Bbl) | | | | | | | | | | |
| Wattenberg Field | | 53.91 |
| | 49.64 |
| | 52.74 |
| | 8.6 | % | | (5.9 | )% |
| Utica Shale | | 58.68 |
| | 69.56 |
| | — |
| | (15.6 | )% | | * |
|
| Appalachia-Marcellus Shale | | 20.57 |
| | 16.39 |
| | 25.37 |
| | 25.5 | % | | (35.4 | )% |
| Weighted-average price | | 48.37 |
| | 43.42 |
| | 48.37 |
| | 11.4 | % | | (10.2 | )% |
Amounts may not recalculate due to rounding.
The year-over-year change in crude oil, natural gas NGLs and crude oilNGLs sales revenue were primarily due to the following:
|
| | | | | | | |
| | Year Ended December 31, |
| | 2012 | | 2011 |
| | (in millions) |
| Increase in production | $ | 38.8 |
| | $ | 56.4 |
|
| Decrease in average natural gas price | (35.3 | ) | | (10.2 | ) |
| Decrease in average NGL price | (8.8 | ) | | (1.3 | ) |
| Increase (decrease) in average crude oil price | (1.0 | ) | | 23.4 |
|
| Decrease in provision for underpayment of natural gas sales | — |
| | 3.3 |
|
| Total increase (decrease) in natural gas, NGLs and crude oil sales revenue | $ | (6.3 | ) | | $ | 71.6 |
|
|
| | | | | | | |
| | Year Ended December 31, |
| | 2013 | | 2012 |
| | (in millions) |
| Increase in production | $ | 98.8 |
| | $ | 41.8 |
|
| Increase (decrease) in average crude oil price | 7.7 |
| | (0.3 | ) |
| Increase (decrease) in average NGLs price | 0.7 |
| | (8.5 | ) |
| Increase (decrease) in average natural gas price | 13.8 |
| | (17.9 | ) |
| Total increase in crude oil, natural gas and NGLs sales revenue | $ | 121.0 |
| | $ | 15.1 |
|
Natural gas, NGLs and crudeCrude oil, sales revenue in 2012 decreased 2.3% compared to 2011. The decrease was primarily attributable to the 33.3% and 27.7% declines in the average price of natural gas and NGLs respectively, duringsales in 2013 increased 51% compared to 2012. The decreaseincrease was offset in part byprimarily attributable to significantly higher volumes sold, in particular liquids, which shifted ourresulted in a liquids percentage of total production toof approximately 34.7%53% in 2012 compared to 32.4% in 2011.2013. Our average daily sales volumes increased to 135.620 MMcfeMBoe per day in 20122013 compared to 123.315 MMcfeMBoe per day in 2011,2012, primarily due to the success of the horizontal Niobrara and Codell drilling program in the Wattenberg Field and the Merit Acquisition.Field. For December 2012,2013, our average productionexit rate from continuing operations was 143 MMcfe27 MBoe per day, compared to 139 MMcfe14 MBoe per day in December 2011.2012. Contributing to the increase in crude oil, natural gas and NGLs sales was the 25% and 3% increase in the average price of natural gas and crude oil, respectively, during 2013.
Crude oil, natural gas and NGLs sales in 2012 increased 7% compared to 2011. The increase in 2011 production compared to 2010 was directlyprimarily attributable to an increase in volumes sold, in particular liquids, which resulted in a liquids percentage of total production of approximately 51% in our Western Operating Region2012. The increase was offset in part by the 30% and 27% declines in the average price of 16.8 MMcfenatural gas and NGLs, respectively, during 2012. Our average daily sales volumes increased to 15 MBoe per day as a result of increased drilling in the Wattenberg field, as well as a 5.1 MMcfe2012 compared to 13 MBoe per day increase in production in our Eastern Operating Region associated with our Marcellus wells. The 2011 increase in production was directly attributable to our decision to increase our capital expenditures for new wells drilled in 2010 and 2011 and switching a majority of our drilling program from vertical to horizontal wells in the Niobrara formation and Marcellus Shale.2011.
Crude Oil, Natural Gas and NGLs and Crude Oil Pricing.Our results of operations depend upon many factors, particularly the price of crude oil, natural gas NGLs and crude oilNGLs and our ability to market our production effectively. NaturalCrude oil, natural gas NGLs and crude oilNGLs prices are among the most volatile of all commodity prices. These price variations can have a material impact on our financial results and capital expenditures.
Crude oil pricing is predominately driven by the physical market, supply and demand, financial markets and national and international politics. In the Wattenberg Field, crude oil is sold under various purchase contracts with monthly pricing provisions based on NYMEX pricing, adjusted for differentials. In the Utica Shale, crude oil and condensate is sold to local purchasers at each individual well site based on NYMEX pricing, adjusted for differentials. Natural gas prices vary by region and locality, depending upon the distance to markets, the availability of pipeline capacity and the supply and demand relationships in that region or locality. The combination of increased drilling activity and curtailments due to limited capacity on local gathering and processing infrastructure resulted in capacity constraints during the second and third quarters of 2012, primarily in our Wattenberg Field. Like most producers, we rely on major interstate pipeline companies to construct these pipelines to increase capacity, rendering the timing and availability of these facilities beyond our control. The price we receive for our natural gas produced in the Wattenberg Field is impacted by our transportation, gatheringbased on CIG prices, adjusted for differentials, while natural gas produced in the Utica Shale and processing agreements. Appalachia-Marcellus Shale is based on NYMEX pricing, adjusted for differentials. Our price for NGLs produced in the Wattenberg Field is mainly based on prices from the Conway hub in Kansas where this production is marketed. The NGLs produced in the Utica Shale are sold based on month-to-month pricing in various markets.
We currently use the "net-back" method of accounting for these arrangements related to our natural gas sales.commodity sales pursuant to which the purchaser also provides the transportation and gathering services. We sell natural gasour commodities at the wellhead and collect a price and recognize revenues based on the wellhead sales price sinceas transportation costs downstream of the wellhead are incurred by the purchaser and reflected in the wellhead price. The net-back method results in the recognition of a sales price that is below the indices for which the production is based.
The price we receive for our natural gas produced in our Western Operating Region is based on a market basket of prices, which generally includes natural gas sold at, near or below Colorado Interstate Gas ("CIG") prices, as well as other nearby regional prices. In September 2012, we renegotiated our marketing agreement for our natural gas in the Piceance Basin, which added approximately $0.40 per MMbtu to our Piceance natural gas price realization, effective with November 1 production. We have experienced a decline in the price of NGLs, mainly at Conway hub in Kansas where our Wattenberg production is marketed. This is primarily due to the increase in ethane and propane volumes flowing to Conway with a limited market for these products out of the area. Crude oil pricing is predominately driven by the physical market, supply and demand, the financial markets and national and international politics. The majority of our Wattenberg production, as well as all our crude oil production, is sold on a calendar-year basis at a fixed differentialsubject to NYMEX pricing.the net-back method of accounting.
Production Costs
Production costs include lease operating expenses, production taxes and certain production and engineering staff-related overhead costs, as well as other costs to operate wells and pipelines as follows:
| | | | Year Ended December 31, | Year Ended December 31, |
| | 2012 | | 2011 | | 2010 | 2013 | | 2012 | | 2011 |
| | (in millions) | (in millions, except per unit data) |
| | | | | | | | | | | |
Lease operating expenses (1) | $ | 42.2 |
| | $ | 41.3 |
| | $ | 38.9 |
| $ | 37.3 |
| | $ | 27.4 |
| | $ | 23.0 |
|
| Production taxes | 16.1 |
| | 17.5 |
| | 11.7 |
| 24.5 |
| | 15.2 |
| | 14.9 |
|
Cost of well operations, overhead and other production expenses
| 17.2 |
| | 8.6 |
| | 13.0 |
| |
Overhead and other production expenses
| | 11.6 |
| | 12.1 |
| | 6.9 |
|
| Total production costs | $ | 75.5 |
| | $ | 67.4 |
| | $ | 63.6 |
| $ | 73.4 |
| | $ | 54.7 |
| | $ | 44.8 |
|
| Total production costs per Mcfe | $ | 1.52 |
| | $ | 1.50 |
| | $ | 1.72 |
| |
| Total production costs per Boe | | $ | 9.88 |
| | $ | 9.96 |
| | $ | 9.71 |
|
| | | | | | | | | | | |
______________
| |
(1) | Prior to 2012, accretion of asset retirement obligations was included in lease operating expenses. In 2012, accretion of asset retirement obligations was reclassified as its own line item in the statement of operations. The amounts reclassified from lease operating expenses for 2011 and 2010 were $1.7 million and $1.3 million, respectively. |
Lease operating expenses. Lifting costs per McfeBoe were $0.855.01, $0.925.00 and $1.054.98 for 2013, 2012 2011 and 2010,2011, respectively. The 7.6%$9.9 million decreaseincrease in lifting costs per Mcfelease operating expenses in 2013 as compared to 2012 from 2011 was primarily due to an increase in production, which resultedof $3.5 million for workover, compliance and maintenance related projects, an increase of $2.1 million for the rental of additional compressors used to accommodate high line pressures in the non-production-based portionWattenberg Field, an increase of our lease operating$1.2 million in additional wages and employee benefits, $1.2 million for transportation expense primarily related to Marcellus Shale production and $0.9 million of expenses being spread across an increased number of units.for wells impacted by the September 2013 Colorado flood. The increase in lease operating expenses in 2012 compared to 2011 was primarily related to the 10.2% increase in production, including an increase in production-related expenses in the amount of $6.7approximately $7.4 million mostly related to the Merit Acquisition and the Seneca-Upshur acquisition, offset by a decrease in environmental compliance costs of $3.2$2.6 million due to the completion of many environmental projects during 2011 and a decrease in workover expense of $2.5 million due to a reduction in the amount of workover projects completed in 2012 compared to 2011. The increase in lease operating expenses in 2011 compared to 2010 was primarily related to the 21.5% increase in production, including an increase in production-related expenses of $2.4 million mostly related to the Seneca-Upshur acquisition and other production-related expenses.
Production taxes. Production taxes fluctuate withare directly related to crude oil, natural gas NGLs and crude oilNGLs sales. The $1.49.3 million, or 8%, decrease in production taxes for 2012 compared to 2011 is primarily related to a combination of lower total natural gas and NGL sales and, to a lesser extent, a change in the production tax rate due to a change in the mix of production locations. The $5.8 million, or 49.6%61%, increase in production taxes for 2011
2013 compared to 2010 was2012 is primarily related to the 34.9%51% increase in crude oil, natural gas and NGLs and crude oil sales and, to a lesser extent, higher ad valorem rates in certain Colorado counties.sales.
Overhead and other production expenses. Overhead and other production expenses increased $8.6The increase of $5.2 million in 2012 compared to 2011. The increase consistedover 2011 was mainly the result of atwo significant one-time charges. We recognized $3.2 million of expense related to the sale of crude oil inventory expensethat had been acquired at fair market value in 2012 associated with the Merit Acquisition and an increase of $3.0additional $2.0 million ofin prepaid well costs charged to expenseexpense. These 2012 amounts were offset by the 2013 increase of $2.1 million in 2012 asinventory value and inventory processing expenses, $1.9 million for the unutilized portion of a result of changes in our capital spending plan. In July 2011, we signed an amended firm transportation agreement which resulted in the reversal of the $3.1Appalachian Basin and $0.8 million liability accrued in 2010 related to an expected volume shortfall. The reversal of this accrued liability resulted in a reduction in overheadlabor and other production expenses in 2011 when comparing 2011 to 2012 and 2010. The remaining decrease in overhead and other production expenses in 2011 compared to 2010 related to reductions in costs incurred for the wells and pipeline systems we operate on behalf of our affiliated partnerships and other third parties as a result of our acquisition of 12 affiliated partnerships.benefits increases.
Commodity Price Risk Management, Net
Commodity price risk management, net, includes realized gainscash settlements upon maturity of our derivative instruments and losses and unrealized changesthe change in the fair value of derivative instrumentsunsettled derivatives related to our crude oil and natural gas and crude oil production. Commodity price risk management, net, does not include derivative transactions related to our natural gas marketing, which are included in sales from and cost of natural gas marketing. See Note 3, Fair Value of Financial Instruments, and Note 4, Derivative Financial Instruments, to our consolidated financial statements included elsewhere in this report for additional details of our derivative financial instruments.
The following table presents the realizednet settlements and unrealized derivative gains and lossesnet change in fair value of unsettled derivatives included in commodity price risk management, net:
|
| | | | | | | | | | | |
| | Year Ended December 31, |
| | 2012 | | 2011 | | 2010 |
| | (in millions) |
| Commodity price risk management gain (loss), net: | | | | | |
| Realized gains (losses): | | | | | |
| Natural gas | $ | 49.9 |
| | $ | 29.1 |
| | $ | 40.0 |
|
| Crude oil | (0.5 | ) | | (11.9 | ) | | 7.1 |
|
| Total realized gains, net | 49.4 |
| | 17.2 |
| | 47.1 |
|
| Unrealized gains (losses): | | | | | |
| Reclassification of realized gains included in prior periods unrealized | (28.8 | ) | | (10.3 | ) | | (20.1 | ) |
| Unrealized gains for the period | 11.7 |
| | 39.2 |
| | 32.9 |
|
| Total unrealized gains (losses), net | (17.1 | ) | | 28.9 |
| | 12.8 |
|
| Total commodity price risk management gain, net | $ | 32.3 |
| | $ | 46.1 |
| | $ | 59.9 |
|
| | | | | | |
|
| | | | | | | | | | | |
| | Year Ended December 31, |
| | 2013 | | 2012 | | 2011 |
| | (in millions) |
| Commodity price risk management gain (loss), net: | | | | | |
| Net settlements | $ | 12.9 |
| | $ | 49.4 |
| | $ | 17.2 |
|
| Net change in fair value of unsettled derivatives | (36.8 | ) | | (17.1 | ) | | 28.9 |
|
| Total commodity price risk management gain (loss), net | $ | (23.9 | ) | | $ | 32.3 |
| | $ | 46.1 |
|
| | | | | | |
Realized gains recognizedNet settlements in 20122013 are primarily the result of lower natural gas index prices at settlementmaturity of our derivative instruments compared to the respective strike price of our natural gas derivative positions. Realized gainsprices. Positive settlements on natural gas, exclusive of basis swaps, were $66.5 million reflective of$25.8 million. This reflects a weighted-average strike price of $5.36$4.89 compared to a weighted-average settlement price of $2.86. These gains$3.66. Positive settlements were offset in part by realized lossesnegative settlements of $16.6$9.8 million on our basis swap positions, as the negative basis differential between NYMEX and CIG was a weighted-average of $0.21$0.20 compared to a weighted-average strike price of $1.82. The realized gains on natural gas derivative positions in 2012 were offset in part$0.75, and by realized lossesnegative settlements of $3.1 million on our crude oil positions, as a result of higher prices at settlement compared to the respective strike price of our derivative positions. For 2012, the realized losses were reflective of a weighted-average strike price of $93.33$96.88 compared to a weighted-average settlement price of $93.72.$98.62. The net change in fair value of unsettled derivatives in 2013 includes a $30.9 million net asset reduction in the beginning-of-period fair value of derivative instruments that settled during the period. The corresponding impact of settlement of these instruments is included in net settlements for the period as discussed above. The net change in fair value of unsettled derivatives in 2013 also includes a $5.9 million decrease in the fair value of unsettled derivatives during the period, primarily related to the upward shift in the crude oil and natural gas forward curves.
Unrealized gainsNet settlements in 2012 were mainly the result of lower natural gas index prices at maturity of our derivative instruments compared to the respective strike prices, resulting in $66.5 million of positive settlements, offset in part by negative settlements of $16.6 million on our basis swap positions and $0.5 million on our crude oil positions. The net change in fair value of unsettled derivatives in 2012 includes a $28.8 million net asset reduction in the beginning-of-period fair value of derivative instruments that settled during the period. This reduction was offset in part by an $11.7 million increase in the fair value of unsettled derivatives during the period, primarily related to the downward shift in the crude oil and natural gas forward curve and its impact on the fair value of our open positions, offset in part by the narrowing of the CIG basis forward curve. During 2012, unrealized gains on our crude oil and natural gas positions were $9.4 million and $2.9 million, respectively, offset slightly by unrealized losses on our CIG basis swaps of $0.6 million.curves.
Realized gains recognizedNet settlements in 2011 were mainly the result of lower natural gas index prices at settlementmaturity of our derivative instruments compared to the respective strike price,prices, resulting in a $44 million realized gain on our natural gas derivatives. These realized gains wereof positive settlements, offset in part by realized lossesnegative settlements of $14.9 million on our basis swap positions and realized losses$11.9 million on our crude oil positions. DuringThe net change in fair value of unsettled derivatives in 2011 we recorded unrealized gainsincludes a $10.3 million net asset reduction in the beginning-of-period fair value of $46.1 million on our natural gas positions offset in part by unrealized losses of $3.9 million on our crude oil positions and $3 million on our CIG basis swaps asderivative instruments that settled during the forward basis differential between NYMEX and CIG had continued to narrow.
During 2010, realized gains recognized were the result of lower natural gas and crude oil prices at settlement compared to the respective strike price,period. This reduction was offset in part by a $12.1$39.2 million realized loss dueincrease in the fair value of unsettled derivatives during the period, primarily related to the negative basis differential between NYMEX and CIG being narrower thandownward shift in the strike price of our derivative position. During 2010, we recorded unrealized gains of $47.3 million on our natural gas positions offset in part by unrealized losses of $10.6 million on our crude oil positions and $3.8 million on our CIG basis swaps as the forward basis differential between NYMEX and CIG had continued to narrow.curve.
We use various derivative instruments to manage fluctuations in natural gas and crude oil prices. We have in place a variety of floors, collars, fixed-price swaps and basis swaps on a portion of our estimated natural gas and crude oil production. Because we sell all of our physical natural gas and crude oil at prices similar to the indexes inherent in our derivative instruments, adjusted for certain fees and surcharges stipulated in the applicable sales agreements, we ultimately realize a price, before contract fees, related to our collars of no less than the floor and no more than the ceiling and, for our commodity swaps, we ultimately realize the fixed price related to our swaps. See Note 4, Derivative Financial Instruments, to our consolidated financial statements included elsewhere in this report and Item 7A, Quantitative and Qualitative Disclosures About Market Risk, for a discussion of how each derivative type impacts our cash flows and a detailed presentation of our derivative positions as of December 31, 2012.2013.
Natural Gas Marketing
Fluctuations in our natural gas marketing's income contribution are primarily due to fluctuations in commodity prices, cash settlements upon maturity of derivative instruments and realized and unrealized, mark-to-market adjustments, gains and losses on open derivative positions,the change in fair value of unsettled derivatives, and, to a lesser extent, volumes sold and purchased.
The following table presents the components of sales from and costs of natural gas marketing:
| | | | Year Ended December 31, | Year Ended December 31, |
| | 2012 | | 2011 | | 2010 | 2013 | | 2012 | | 2011 |
| | (in millions) | (in millions) |
| Natural gas sales revenue | $ | 46.6 |
| | $ | 63.6 |
| | $ | 63.3 |
| $ | 68.9 |
| | $ | 44.9 |
| | $ | 60.7 |
|
| Realized derivative gains, net | 2.2 |
| | 3.0 |
| | 6.4 |
| |
| Unrealized derivative losses, net | (1.7 | ) | | (0.2 | ) | | (0.6 | ) | |
| Net settlements from derivatives | | 0.5 |
| | 2.2 |
| | 3.0 |
|
Net change in fair value of unsettled derivatives
| | 0.4 |
| | (1.7 | ) | | (0.2 | ) |
| Total sales from natural gas marketing | 47.1 |
| | 66.4 |
| | 69.1 |
| 69.8 |
| | 45.4 |
| | 63.5 |
|
| | | | | | | | | | | |
| Costs of natural gas purchases | 44.8 |
| | 61.6 |
| | 61.4 |
| 68.1 |
| | 43.3 |
| | 59.0 |
|
| Realized derivative losses, net | 2.0 |
| | 2.6 |
| | 5.9 |
| |
| Unrealized derivative losses (gains), net | (1.6 | ) | | 0.1 |
| | (0.5 | ) | |
| Net settlements from derivatives | | 0.3 |
| | 2.0 |
| | 2.6 |
|
Net change in fair value of unsettled derivatives
| | 0.4 |
| | (1.6 | ) | | 0.1 |
|
| Other | 1.4 |
| | 1.2 |
| | 1.2 |
| 1.3 |
| | 1.3 |
| | 1.1 |
|
| Total costs of natural gas marketing | 46.6 |
| | 65.5 |
| | 68.0 |
| 70.1 |
| | 45.0 |
| | 62.8 |
|
| | | | | | | | | | | |
| Natural gas marketing contribution margin | $ | 0.5 |
| | $ | 0.9 |
| | $ | 1.1 |
| $ | (0.3 | ) | | $ | 0.4 |
| | $ | 0.7 |
|
| | | | | | | | | | | |
The increase in natural gas sales revenue and costs of natural gas purchases in 2013 compared to 2012 is primarily attributable to a 30% increase in the average natural gas price and a 14% increase in volumes. The decrease in natural gas sales revenue and costs of natural gas purchases in 2012 compared to 2011 is primarily attributable to a 34% decrease in the average natural gas price, offset in part by a 10%an 11% increase in volumes. The increase in natural gas sales revenue and costs of natural gas purchases in 2011 compared to 2010 is primarily attributable to a 9% increase in volumes, offset in part by an 8% decrease in the average natural gas price.
Derivative instruments related to natural gas marketing include both physical and cash-settled derivatives. We offer fixed-price derivative contracts for the purchase or sale of physical natural gas and enter into cash-settled derivative positions with counterparties in order to offset those same physical positions. See Note 4, Derivative Financial Instruments, to our consolidated financial statements included elsewhere in this report and Item 7A, Quantitative and Qualitative Disclosures About Market Risk, for a discussion of how each derivative type impacts our cash flows and detailed presentation of our derivative positions as of December 31, 20122013.
Exploration Expense
The following table presents the major components of exploration expense:
| | | | | Year Ended December 31, | | Year Ended December 31, |
| | | 2012 | | 2011 | | 2010 | | 2013 | | 2012 | | 2011 |
| | | (in millions) | | (in millions) |
| | | | | | | | | | | | | |
| Exploratory dry hole costs | | $ | 15.3 |
| | $ | 0.2 |
| | $ | 4.2 |
| | $ | — |
| | $ | 14.5 |
| | $ | 0.1 |
|
| Geological and geophysical costs | | 1.9 |
| | 1.8 |
| | 2.3 |
| | 0.8 |
| | 1.9 |
| | 1.8 |
|
| Operating, personnel and other | | 5.4 |
| | 4.3 |
| | 7.2 |
| | 6.2 |
| | 4.5 |
| | 3.8 |
|
| Total exploration expense | | $ | 22.6 |
| | $ | 6.3 |
| | $ | 13.7 |
| | $ | 7.0 |
| | $ | 20.9 |
| | $ | 5.7 |
|
| | | | | | | | | | | | | |
Exploratory dry hole costs. There were no exploratory dry holes identified in 2013. In 2012, two vertical stratigraphic test wells in easternsoutheastern Ohio were expensed at a cost of $12.2 million. Additionally, threeThe remaining 2012 expense relates to the unsuccessful testing of an exploratory
zone in two existing wells in south centralthe Wattenberg Field and three Rose Run test wells in Ohio and a well in southeast Coloradothat were determined to have found noncommercial quantities of hydrocarbons.
hydrocarbonsGeological and were expensed at a cost of $1.2geophysical costs. The $1.1 million decrease in 2013 compared to 2012 is primarily related to costs associated with PDCM's geological and $0.9 million, respectively. In 2010, exploratory dry hole costs included the fracturing andseismic testing of several exploratory zones on a well drilledthe Marcellus Shale in the PiceanceAppalachian Basin and a crude oil well drilledPDC's reservoir studies in the north eastern Colorado area.Utica Shale in 2012.
Operating, personnel and other. The $1.11.7 million increase in 2013 compared to 2012 is mainly attributable to payroll and employee benefits in the exploration division as a result of increased employee headcount for the Utica Shale operations. The $0.7 million increase in 2012 compared to 2011 is mainly attributable to a $2 million increase in payroll and employee benefits in the exploration division as a result of increased employee headcount in the Utica Shale, offset in part by a $0.7 million decrease in PDCM's lease prospecting costs. The decrease in operating, personnel and other in 2011 compared to 2010 was primarily related to a $3.9 million reduction in personnel costs resulting from the reassignment of former exploration department personnel during the first quarter of 2011 to development drilling or administrative activities, offset in part by a $1.1 million increase in PDCM's lease prospecting costs.
Impairment of Crude Oil and Natural Gas and Crude Oil Properties
The following table sets forth the major components of our impairments of crude oil and natural gas and crude oil properties expense:
| | | | | Year Ended December 31, | | Year Ended December 31, |
| | | 2012 | | 2011 | | 2010 | | 2013 | | 2012 | | 2011 |
| | | (in millions) | | (in millions) |
| | | | | | | | | | | | | |
| Impairment of proved properties | | $ | 161.2 |
| | $ | 22.5 |
| | $ | — |
| | $ | 48.8 |
| | $ | — |
| | $ | — |
|
| Impairment of individually significant unproved properties | | 1.9 |
| | 1.1 |
| | 1.5 |
| | 1.1 |
| | 1.6 |
| | 1.1 |
|
Amortization of individually insignificant unproved properties
| | 5.0 |
| | 1.6 |
| | 5.0 |
| | 3.6 |
| | 4.3 |
| | 1.2 |
|
| Total impairment of natural gas and crude oil properties | | $ | 168.1 |
| | $ | 25.2 |
| | $ | 6.5 |
| |
| Total impairment of crude oil and natural gas properties | | | $ | 53.5 |
| | $ | 5.9 |
| | $ | 2.3 |
|
| | | | | | | | | | | | | |
Impairment of proved properties. properties. In December 2012,the first quarter of 2013, we recognized an impairment charge of approximately $161.245 million associated withrelated to all of our Piceanceshallow Upper Devonian (non-Marcellus Shale) Appalachian Basin proved oilproducing properties located in West Virginia and natural gas properties.Pennsylvania owned directly by us, as well as through our proportionate share of PDCM. The assets were determined to be impaired asimpairment charge represented the estimated undiscounted future net cash flows were less thanexcess of the carrying value of the assets.assets over the estimated fair value, less cost to sell. The fair value for determining the amount of the impairment chargeassets was determined based onupon estimated future cash flows from unrelated third-party bids, a Level 3 input. Pursuant to a purchase and sale agreement entered into in October 2013, we determined that the carrying value of the above-mentioned properties exceeded the transaction sales price, a Level 3 input, asless costs to sell. As a result, we changed our development plansrecognized an additional impairment charge of approximately $3.8 million in the basin and decidedthird quarter of 2013 to sellreduce the related assets.carrying value of the net assets to reflect the current net sales price. See Note 19,14, Subsequent EventsAssets Held for Sale, Divestitures and Discontinued Operations, to our consolidated financial statements included elsewhere in this report for additional information regarding our planned divestiture of our Piceance Basin and other crude oil and natural gas properties. There can be no assurance that this transaction will close as planned. In 2011, we recognized an impairment charge of $22.5 milliondetails related to our NECO assets.the sale of these properties.
Impairment of individually significant unproved properties. The $0.5 million decrease in 2013 compared to 2012 is primarily related to two significant leases that were written off in 2012 in the Wattenberg Field for $1.0 million compared to a single lease in non-Utica Ohio acreage written off in 2013 for $0.5 million.
Amortization of individually insignificant unproved properties. The $0.7 million decrease in 2013 compared to 2012 is primarily related to a decrease in leases not held by production, primarily in the Utica Shale. The increase in amortization of individually insignificant unproved properties in 2012 compared to 2011 was mostly attributable to $2.4 million in lease amortization expense related to increased insignificant leases acquired in the Merit Acquisition and $1.6 million in insignificant leases written off in Ohio related to non-Utica leases in 2012.
General and Administrative Expense
General and administrative expense for 2012 decreased byincreased $2.65.2 million, or 4.3%8.8%, in 2013 compared to 2012. The increase was primarily due to increased stock-based compensation of $3.5 million due to expanding employee participation in our equity incentive program, a $1.2 million increase in payroll and employee benefits and a $2.3 million increase in other general and administrative expenses. These increases were offset in part by a decrease in professional and consulting fees of $1.8 million.
General and administrative expense for 2012 decreased by $2.6 million, or 4.3%, compared to 2011. The decrease is mainly attributable to a $6.7 million charge recognized in 2011 related to the separation agreement with our former chief executive officer, a $1.6 million charge to legal fees recorded in 2011 related to the settlement agreement reached with regard to our West Virginia royalty lawsuit and a $1.6 million decrease in professional and consulting fees during 2012. These decreases were offset in part by an increase in payroll and employee benefits of $7.5 million in 2012.
General and administrative expense for 2011 increased by $19.3 million, or 45.7%, compared to 2010. The increase was primarily due to an increase in payroll and payroll-related expense of $13.8 million, of which $6.7 million was related to a separation agreement with a former chief executive officer. The increase in payroll and payroll-related expenses was also impacted by the reassignment of former exploration department personnel contributing $3.7 million to the increase, with the remaining increase in payroll and payroll-related expenses being attributable to new hires and an overall increase in employee benefits. Also contributing to the increase was a $1.6 million charge related to the settlement reached with regard to our West Virginia royalty lawsuit.
Depreciation, Depletion and Amortization
NaturalCrude oil and natural gas and crude oil properties. Depreciation, Depletion and Amortization ("DD&A")&A expense related to crude oil and natural gas and crude oil properties is directly related to proved reserves and production volumes. DD&A expense related to crude oil and natural gas and crude oil properties was $139.4 million in 2012 compared to $122.2 million in 2011.2013 compared to $94.1 million in 2012. The increase in 20122013 compared to 20112012 was comprised of $12.5$31.6 million due to higher production, and $4.7offset in part by $3.5 million due to a higherlower weighted-average depreciation, depletion and amortizationDD&A expense rate.
The following table presents our DD&A expense rates for crude oil and natural gas and crude oil properties:
|
| | | | | | | | | | | | |
| | Year Ended December 31, |
| Operating Region/Area | | 2012 | | 2011 | | 2010 |
| | (per Mcfe) |
| Western | | | | | | |
| Wattenberg Field | | $ | 3.07 |
| | $ | 3.21 |
| | $ | 3.08 |
|
| Piceance Basin | | 3.12 |
| | 2.53 |
| | 2.49 |
|
| Weighted-average Western | | 2.94 |
| | 2.80 |
| | 2.72 |
|
| Eastern | | 1.93 |
| | 2.00 |
| | 2.57 |
|
| Total weighted-average | | 2.81 |
| | 2.72 |
| | 2.71 |
|
|
| | | | | | | | | | | | |
| | Year Ended December 31, |
| Operating Region/Area | | 2013 | | 2012 | | 2011 |
| | (per Boe) |
| Wattenberg Field | | $ | 17.68 |
| | $ | 18.20 |
| | $ | 19.26 |
|
| Utica Shale | | 24.87 |
| | — |
| | — |
|
| Appalachia-Marcellus Shale | | 9.12 |
| | 11.41 |
| | 12.00 |
|
| Total weighted-average | | 16.44 |
| | 16.92 |
| | 18.10 |
|
Non-naturalNon-crude oil and natural gas and crude oil properties. Depreciation expense for non-naturalnon-crude oil and natural gas and crude oil properties was $7.55.1 million for 20122013 compared to $6.74.7 million for 20112012 and $7.54.0 million for 2010.2011.
Accretion of Asset Retirement Obligations
Accretion of asset retirement obligations ("ARO") for 2013 increased by $0.9 million, or 24.4%, compared to 2012. The increase in 2013 is primarily attributable to the properties acquired in the Merit Acquisition in 2012. Accretion of ARO for 2012 increased by $2.3 million, or 134.3%163.7%, compared to 2011.2011. The increase in 2012 is primarily attributable to the increase in ARO liability associated with the properties acquired in the Merit Acquisition in 2012 and the Seneca-Upshur acquisition in 2011. Accretion of ARO for 2011 increased by $0.4 million, or 30.4%, compared to 2010. The increase in 2011 is primarily attributable to the increase in ARO liability associated with the Seneca-Upshur acquisition in the fourth quarter of 2011.
Gain (Loss) on Sale of Properties and Equipment
The 2012 increaseloss on sale of properties and equipment of $1.4 million in 2013 primarily relates to the sale of our shallow Upper Devonian (non-Marcellus Shale) Appalachian Basin producing properties. The gain on sale of properties and equipment of $4.24.4 million as compared to 2011in 2012 mainly relatesrelated to our proportionate share of the gain realized from PDCM's sale of certain leases in our Eastern Operating Region.the Appalachia-Marcellus Shale. The gain on sale of properties and equipment in 2011 and 2010 was not material.
Interest Expense
Interest expense increased by approximately $11.33.6 million in 20122013 compared to 20112012. The increase is primarily related to $39.6 million of interest expense resulting from the issuance of $500 million of 7.75% senior notes due 2022 in October 2012. Partially offsetting this increase were decreases of $31.1 million related to the November 2012 redemption of previously-outstanding 12% senior notes due 2018 and $4.4 million as a result of lower average borrowings on our revolving credit facility during 2013 as compared to 2012.
Interest expense increased by approximately $11.3 million in 2012 compared to 2011. Approximately $6 million of the increase is related to the issuance of the 7.75% senior notes due 2022 Senior Notesin October 2012 and the result of incurring interest on both the 7.75% senior notes due 2022 Senior Notes and the previously-outstanding 12% senior notes due 2018 Senior Notes during the month of October.October 2012. Additionally, approximately $3.6 million of the increase was the result of higher average borrowings on our revolving credit facility during 2012 as compared to 2011 and $1.1 million due to higher debt issuance amortization expense. The increase in interest expense in 2011 compared to 2010 was attributable to $6 million of interest and amortization of debt discount related to our convertible notes issued in November 2010. The increase was offset in part by a decrease in debt issuance costs of $1.5 million and an increase in capitalized interest of $1.4 million.
Interest costs capitalized in 2013, 2012 2011 and 20102011 were $1.21.9 million, $1.71.2 million and $0.31.7 million, respectively.
Loss on Extinguishment of Debt
The $23.3 million pre-tax loss on extinguishment of debt relatesin 2012 related to the redemption of the previously-outstanding 12% senior notes due 2018 Senior Notes during the fourth quarter ofin October 2012. The pre-tax loss consistsconsisted of an $18.9 million make-whole premium and the write-off of both unamortized debt discount of $1.5 million and unamortized debt issuance costs of $2.9 million.
Provision for Income Taxes
The effective tax rate ("rate"(the "rate") benefit on loss from continuing operations in 20122013 was a 38%35.9% benefit,, which reflects a smallreduction for nondeductible executive compensation, partially offset by a benefit for the percentage depletion deduction. The 20112012 benefit on loss from continuing operations of 36.9% reflects a reduced state tax benefit due to our divestitures and their discontinued operations treatment. The 2012 rate also reflects a benefit for the percentage depletion deduction, partially offset by nondeductible executive compensation. The 2011 provision on income from continuing operations rate of 6.3%34.3% was also favorably impacted by our deduction for percentage depletion, as well as a $0.6 million tax benefit related to a reduction of the accrual for uncertain tax positions, partially offset by the adjustment to the estimated state deferred rate. The 2010Discrete items did not have a significant impact on the effective tax rate of 9.7% was also favorably impacted by our deduction for percentage depletion, as well as a $1.7 million discrete tax benefit related to our state deferred rate change. Excluding the effect of discrete items, ourin 2013, 2012 2011 and 2010 rates were 38.0%, 0.1% and 32.9%, respectively.or 2011. See Note 7, Income Taxes, to our consolidated financial statements included elsewhere in this report for our rate reconciliation for each of the three years in the three-year period ended December 31, 20122013.
Beginning with our 2010 tax year, we were accepted into and have agreed to participate in the IRS Compliance Assurance Process ("CAP") program. As part of this program, we agreed to an accelerated timeline for the IRS examination of our 2007, 2008 and 2009 tax years. This examination was completed during the second quarter of 2011 without any significant increase or decrease in tax expense. See Note 7, Income Taxes, to the accompanying consolidated financial statements included elsewhere in this report for a discussiondisclosure regarding the reduction of our uncertain tax liability due to our participation in this program. Our 2010 and 2011 CAP reviewed returns
were fully accepted by the conclusion of this examination.IRS shortly after filing. Our 20112012 CAP reviewed return was filed in September 2012. The2013 with “partial acceptance” issued by the IRS subsequently accepted ourat the filing date. We anticipate “full acceptance” of the 2012 return without change.by the IRS in early 2014, after completion of their post-filing review. We are currently participating in the IRS CAP program review of our 20122013 tax year and have accepted an offer for continued participation in the IRS CAP program for our 20132014 tax year.
Discontinued Operations
Permian Basin.Piceance Basin and NECO. In February 2013, we entered into a purchase and sale agreement with certain affiliates of Caerus pursuant to which we agreed to sell to Caerus our Piceance Basin, NECO and certain other non-core Colorado oil and gas properties, leasehold mineral interests and related assets. Additionally, certain firm transportation obligations and natural gas hedging positions were assumed by Caerus. In June 2013, this divestiture was completed with total consideration of $177.6 million, with an additional $17 million Duringpaid to our non-affiliated investor partners in our affiliated partnerships. The sale resulted in a pre-tax loss of $2.3 million. The proceeds from the fourth quarter of 2011, we closed on the saleasset divestiture were used to pay down our revolving credit facility and to fund a portion of our non-core Permian Basin assets to unrelated third parties for a sales price of $13.2 million. We then developed a plan to divest 100% of our core Permian Basin assets, consisting of producing wells and undeveloped leaseholds.2013 capital budget. Following the sale of our core Permian assets to the unrelated party on February 28, 2012,Caerus, we do not have significant continuing involvement in the operations of, or cash flows from, these assets.the Piceance Basin and NECO oil and gas properties. Accordingly, the Permian Basin assets were reclassified as held for sale as of December 31, 2011 and the results of operations related to the core and non-core Permian Basinthese assets have been reported as discontinued operations for all periods presented in the accompanying consolidated statements of operations included in this report. The sale of our other non-core Colorado oil and gas properties did not meet the requirements to be accounted for as discontinued operations. See Note 14, Assets Held for Sale, Divestitures and Discontinued Operations, to our consolidated financial statements included elsewhere in this report for further discussion of the Piceance Basin and NECO divestiture.
Permian Basin. During the fourth quarter of 2011, we completed the sale of certain non-core Permian Basin assets for a total of $13.2 million. Following the sale of our core Permian assets in February 2012, we do not have significant continuing involvement in the operations of or cash flows from these assets. Accordingly, the results of operations related to the core and non-core Permian Basin assets have been reported as discontinued operations in the 2012 and 2011 consolidated statements of operations included elsewhere in this report. Proceeds from the sale of our core Permian Basin assets were $189.2 million after closingcertain post-closing adjustments and were received in the first quarter of 2012. The sale of our Permian Basin assets resulted in a pre-tax gain of $19.9 million.$19.9 million. See Note 14, Assets Held for Sale, Divestitures and Discontinued Operations, to our consolidated financial statements included elsewhere in this report for further discussion of the Permian divestiture.
North Dakota. In February 2011, we executed a purchase and sale agreement for the sale of our North Dakota assets and subsequently closed with the same unrelated party.closed. Proceeds from the sale were $9.5 million, net of non-affiliated investor partners' share of $3.8 million, resulting in a pre-tax gain on sale of $3.9 million. Following the sale to the unrelated party, we do not have significant continuing involvement in the operations of, or cash flows from, these assets. Accordingly, the results of operations related to the North Dakota assets have been reported as discontinued operations in 2010 andthe 2011 in our consolidated statements of operations included elsewhere in this report.
Michigan. In July 2010, we completed the sale of our Michigan assets for net proceeds of $22 million. Following the sale to the unrelated party, we do not have significant continuing involvement in the operations of or cash flows from these assets. Accordingly, the results of operations related to the Michigan assets have been reported as discontinued operations in 2010 in our consolidated statements of operations included elsewhere in this report. Operating results related to these assets were immaterial to the financial statements with the following exception. In June 2010, in conjunction with our decision to divest our Michigan assets, we recorded a related pre-tax impairment charge of $4.7 million. See Note 6, Properties and Equipment, and Note 14, Assets Held for Sale, Divestitures and Discontinued Operations, to our consolidated financial statements included elsewhere in this report for additional information regarding the divestiture of our Michigan assets.
For production data and operating results related to our discontinued operations, see Note 14, Assets Held for Sale, Divestitures and Discontinued Operations, to our consolidated financial statements included elsewhere in this report.
Net Income (Loss) Attributable to Shareholders//Adjusted Net Income (Loss) Attributable to Shareholders
The year-over-year changes in net income (loss) attributable to shareholders are discussed above. These same reasons similarly impacted adjusted net income (loss) attributable to shareholders,, a non-U.S. GAAP financial measure, with the exception of the unrealized derivative gains and losses onnet change in fair value of unsettled derivatives, and provision for underpayment of natural gas sales, adjusted for taxes. Adjusted net income (loss) attributable to shareholders excludes the impact of a tax adjusted unrealized derivative gain, net and provision for underpaymentchange in fair value of natural gas salesunsettled derivatives of$22.8 million, $10.6 million, and $17.7 million and $5.8 millionin 20122013, 20112012 and 20102011, respectively. Adjusted net loss attributable to shareholders,income, a non-U.S. GAAP financial measure, was$0.5 million in 2013 compared to an adjusted net loss of $120.1 million and $4.3 million in 2012 and 2011, respectively. Adjusted net income attributable to shareholders was $0.4 million in 2010. See Reconciliation of Non-U.S. GAAP Financial Measures, below, for a more detailed discussion of this non-U.S. GAAP financial measure.
Financial Condition, Liquidity and Capital Resources
Historically, our primary sources of liquidity have been cash flows from operating activities, our revolving credit facility, proceeds raised in the debt and equity marketsmarket transactions and asset monetization transactions.sales. In 2012,2013, our primary sources of liquidity were the proceeds received from the divestiture of our Permian assets in February 2012 for $189.2 million, $164.5 million in proceeds from the issuancepublic offering of our common stock in May 2012, $489of $275.8 million, proceeds received from the issuancesale of our 2022 Senior Notes in October 2012properties and equipment, including acquisition adjustments, of approximately $187.5 million and net cash flows from operating activities of $174.7 million.$159.2 million.
Our primary source of cash flows from operating activities is the sale of crude oil, natural gas NGLs and crude oil.NGLs. Fluctuations in our operating cash flows are substantially driven by commodity prices and changes in our production volumes. Commodity prices have historically been volatile and we manage this volatility through our use of derivatives, which has also historically been a source of cash.derivatives. We enter into commodity derivative instruments with maturities of no greater than five years from the date of the instrument. For instruments that mature in twothree years or less, our debt covenants limit our holdings to 80%restricts us from entering into hedges that would exceed 85% of our expected future production onfrom total proved reserves (proved developed producing, proved developed not producingnon-producing and proved undeveloped). For instruments that mature later than twothree years, but no more than our designated maximum maturity, our debt covenants limit our holdings to 80%85% of our expected future production from proved developed producing properties. Therefore, we may still have significant fluctuations in our cash flows from operating activities due to the remaining non-hedged portion of our future production.
Our working capital fluctuates for various reasons, including, but not limited to, changes in the fair value of our commodity derivative instruments and changes in our cash and cash equivalents due to our practice of utilizing excess cash to reduce the outstanding borrowings under our revolving credit facility. At December 31, 2012,2013, we had a working capital deficitsurplus of $31.4$112.4 million compared to a deficit of $22$31.4 million at December 31, 20112012. The working capital surplus as of December 31, 2013 is primarily due to the common stock offering.
We ended 20122013 with cash and cash equivalents of $2.5$193.2 million and availability under our revolving credit facility and our proportionate share of PDCM's credit facility of $396.1$453.8 million,, for a total liquidity position of $398.6$647 million,, compared to $196.4$398.6 million at the end of 2011.
December 31, 2012. The increase in liquidity of $202.2$248.4 million,, or 102.9%62.3%, was primarily dueattributable to $189.2275.8 million received from the divestiturepublic offering of our Permian assets in February 2012, proceeds from issuance of common stock, of $164.5$187.5 million in May 2012, proceeds received from the issuancesale of our $500 million 2022 Senior Notes in October 2012properties and equipment, including acquisition adjustments, and cash flows fromprovided by operating activities of $174.7$159.2 million,, offset by $304.6 millionin expenditures related to the Merit Acquisition in June 2012,part by capital expenditures of $347.7$394.9 million and the redemption of our $203 million 2018 Senior Notes in November 2012. Assuming that the planned divestiture of our Piceance and NECO assets for proceeds of approximately $200 million had closed as of December 31, 2012, our pro-forma liquidity, excluding any effect related to our borrowing base redetermination, would have been approximately $600 million.
during 2013. With our current liquidity position and expected cash flows from operations, we believe that we have sufficient capital to fund operations. However, an acceleration of development activities or other changes to our business plans could increase our need for capital. We may also sell select assets from time to time in order to fund development projects, acquisitions or other capital needs.
Capital Expenditures
We establish a capital budget annually based upon our development and exploration opportunities, liquidity position and expected cash flows from operating activities. We may revise our capital budget during the year as a result of, among other things, acquisitions or dispositions of assets, drilling results, commodity prices, changes in our borrowing capacity and/or significant changes in cash flows. In December 2012, our Board of Directors approved our 2013 capital budget of $324 million, excluding our share of PDCM's capital budget. Based on our current forecast, we expect to allocate $254 million to be invested in the Wattenberg Field, of which $207 million is for developmental drilling in the horizontal Niobrara and Codell. We expect to allocate approximately $53 million to drilling, leasing and completion activity in the Utica Shale. We expect to allocate $17 million to acquisitions of properties and leased acreage, exploration and other capital needs. PDCM's 2013 capital budget is currently set at $95 million, of which $48 million represents our share, and is expected to be funded by PDCM's operating activities, its credit facility and funds received related to title defects discovered from its acquisition of Seneca-Upshur. PDCM's capital budget for 2013 includes funding for the drilling of 14 gross horizontal wells. We believe, based on the current commodity price environment, cash flows provided by operating activities, planned asset sales and proceeds from borrowings on our revolving credit facility will fund our 2013 capital budget.
Because natural gas and crude oil production from a well declines rapidly in the first few years of production, we need to continue to commit significant amounts of capital in order to maintain and grow our production and replace our reserves. If capital is not available or is constrained in the future, we will be limited to our cash flows from operations and liquidity under our revolving credit facility as the sources for funding our capital expenditures. We would not be able to maintain our current level of natural gas, NGLs and crude oil production and cash flows from operating activities if capital markets and commodity prices were to become depressed and/or the borrowing base under our revolving credit facility was significantly reduced. The occurrence of such an event may result in our election to defer a substantial portion of our planned capital expenditures and could have a material negative impact on ourdrilling operations in the future.
Financing Activities2014.
In recent periods, we have been able to access borrowings under our revolving credit facility and to obtain proceeds from the issuance of debt and equity securities. See Note 8, Long-Term Debt, and Note 12, Common Stock, to our consolidated financial statements in this report for a detailed discussion of our May 2012 sale of common stock and October 2012 debt issuance, respectively. We cannot, however, assurebe assured this will continue to be the case in the future. We continue to monitor market conditions and circumstances and their potential impact on each of our revolving credit facility lenders. Our$450 million revolving credit facility borrowing base is subject to a redetermination each May and November, based upon a quantification of our proved reserves at each June 30 and December 31, respectively. Our November semi-annual redetermination was completed onin October 31, 20122013 and resulted in the reductionreaffirmation of our available borrowing base from $525at $450 million to $450 million. The $75 million borrowing base reduction was principally the result of the incurrence of additional term debt in the form of the 2022 Senior Notes. Our next scheduled redetermination is in May 2013. While we expect to continue to add producing reserves through our drilling operations, these reserve additions will be offset by the sale of our Piceance and NECO assets if that transaction is completed and could be offset by other factors including, among other things, a significant decrease in commodity prices. These events could result in a negative impact on our future borrowing base redeterminations..
OnIn January 23, 2012, we filed an automatic shelf registration statement on Form S-3 with the SEC. Effective upon filing, the shelf provides for the potential sale of an unspecified amount of debt securities, common stock or preferred stock, either separately or represented by depository shares, warrants andor purchase contracts, as well as units that may include any of these securities or securities of other entities. The shelf registration statement is intended to allow us to be proactive in our ability to raise capital and to have the flexibility to raise such funds in one or more offerings should we perceive market conditions to be favorable. Pursuant to this shelf registration, we sold 6.5 million shares of our common stock in May 2012 in an underwritten public offering at a price to the public of $26.50 per share. We used the net proceedsshare and approximately 5.2 million shares of $164.5 millionour common stock in August 2013 in an underwritten public offering at a price to pay off the outstanding balance on our revolving credit facility and for general corporate purposes.us of $53.37 per share.
Our revolving credit facility contains financial maintenance covenants. The covenants require that we maintain: (i) total debt of less than 4.04.25 times earnings before interest, taxes, depreciation, depletion and amortization, unrealized derivative gains (losses),change in fair value of unsettled derivatives, exploration expense, gains (losses) on sales of assets and other non-cash, extraordinary or non-recurring gains (losses) ("EBITDAX") and (ii) an adjusted current ratio of at least 1.0 to 1.0. Our adjusted current ratio is adjusted by eliminating the impact on our current assets and liabilities of recording the fair value of crude oil and natural gas and crude oil derivative instruments. Additionally, available borrowings under our revolving credit facility are added back to the current asset calculation. Thecalculation and the current portion of our revolving credit facility debt is eliminated from the current liabilities calculation. At December 31, 2012,2013, we were in compliance with all debt covenants with a 2.532.2 times debt to EBITDAX ratio and a 2.794.1 to 1.0 current ratio. We expect to remain in compliance throughout the next year.
The indenture governing our 7.75% senior notes due 2022 contains customary representations and warranties as well as typical restrictive covenants that, among other things, limit our ability and the ability of our restricted subsidiaries to: (a) incur additional debt, (b) make certain investments or pay dividends or distributions on our capital stock or purchase, or redeem or retire capital stock, (c) sell assets, including capital stock of our restricted subsidiaries, (d) restrict the payment of dividends or other payments by restricted subsidiaries to us, (e) create liens that secure debt, (f) enter into transactions with affiliates and (g) merge or consolidate with another company. At December 31, 20122013, we were in compliance with all covenants and expect to remain in compliance throughout the next year.
The conversion rights on our 3.25% convertible senior notes due 2016 could be triggered prior to the maturity date. We have initially elected a net-settlement method to satisfy our conversion obligation, which allows us to settle the principal amount of the Convertible Notes in cash and to settle the excess conversion value in shares, as well as cash in lieu of fractional shares. In the event that a holder elects to convert its note, we expect to fund the cash settlement of any such conversion from working capital and/or borrowings under our revolving credit facility. The conversion right is not expected to have a material impact on our financial position.
See Part II, Item 7A, Quantitative and Qualitative Disclosures about Market Risk, for our discussion of credit risk.
Cash Flows
Operating Activities. Our net cash flows from operating activities isare primarily impacted by commodity prices, production volumes, realized gains and lossesnet settlements from our derivative positions, operating costs and general and administrative expenses. Cash flows provided by operating activities decreased in 2013 compared to 2012. The $15.6 million decrease was mainly attributable to changes in assets and liabilities of $59.4 million related to the timing of cash payments and receipts, the decrease in net settlements on derivatives of $36.5 million and increases in production costs, net of inventory adjustments and prepaid well cost write-offs, of $26.2 million, general and administrative expense of $5.2 million and interest expense of $3.6 million. The decrease was offset in part by the increase in crude oil, natural gas and NGLs sales of $121.0 million. Cash flows provided by operating activities increased in 2012 and 2011compared to the respective prior years. In 2012, the2011. The $7.9 million increase was mainly attributable to an increase in realized derivative gainsnet settlements on derivatives of $31.9$31.9 million, and an increase in crude oil, natural gas and NGLs sales of $15.1 million, offset by a $18.5$37.7 million loss of operating margins related to the divested Permian Basin, assetsPiceance and an increase in the cash component of interest expense and exploration expense of $9.7 million and $1.2 million, respectively. In 2011, the $15 million increase was primarily due to an increase in natural gas, NGLs and crude oil sales of $88 million, offset by a decrease in realized derivative gains related to natural gas and crude oil sales of $29.9 million, an increase in production costs of $8.5 million and an increase in general and administrative expense of $19.3 million. The remaining changes in cash flows provided by operating activities were primarily due to changes in our assets and liabilities related to the timing of cash payments and receipts.NECO assets. The key components for the changes in our cash flows provided by operating activities are described in more detail in Results of Operations above.
Adjusted cash flows from operations, a non-U.S. GAAP financial measure, decreased in 2012 and increased in 20112013 and decreased slightly in 2012 when compared to the respective prior years. These changes were primarily due to the same factors mentioned above for changes in cash flows provided by operating activities, without regard to timing of cash payments and receipts of our assets and liabilities.
Adjusted EBITDA, a non-U.S. GAAP financial measure, increased by $44.1 million in 2013 from 2012, primarily due to a $121.0 million increase in crude oil, natural gas and NGLs sales, offset in part by a $36.5 million decrease in net settlements on derivatives, a $18.7 million increase in production costs and a $19.9 million pre-tax gain on sale of properties and equipment recognized in 2012 related to the sale of our Permian Basin assets. Adjusted EBITDA increased by $6.7 million in 2012 from 2011, primarily due to a $31.9$31.9 million increase in realized derivative gains,net settlements on derivatives, a $19.9 million pre-tax gain on sale of properties and equipment related to the sale of our Permian Basin assets and a $15.1 million increase in crude oil, natural gas and NGLs sales, offset in part by a $16.4$41.8 million decrease in contribution margins related to divested crude oil and natural gas assets and a $15.2 million increase in exploration expense and a $8.1 million increase in production costs. Adjusted EBITDA increased by $39.4 million in 2011 from 2010, primarily due to a $71.6 million increase in natural gas, NGLs and crude oil sales and a $15.7 million increase in operating margins related to the divested Permian Basin assets, offset in part by a $29.9 million decrease in realized gains on derivatives and a $19.3 million increase in general and administrative expense.
See Reconciliation of Non-U.S. GAAP Financial Measures, below, for a more detailed discussion of non-U.S. GAAP financial measures.
Investing Activities. Because crude oil and natural gas production from a well declines rapidly in the first few years of production, we need to continue to commit significant amounts of capital in order to maintain and grow our production and replace our reserves. If capital is not available or is constrained in the future, we will be limited to our cash flows from operations and liquidity under our revolving credit facility as the sources for funding our capital expenditures. We would not be able to maintain our current level of crude oil, natural gas and NGLs production and cash flows from operating activities if capital markets were unavailable, commodity prices were to become depressed and/or the borrowing base under our revolving credit facility was significantly reduced. The occurrence of such an event may result in our election to defer a substantial portion of our planned capital expenditures and could have a material negative impact on our operations in the future.
Cash flows from investing activities primarily consist of the acquisition, exploration and development of crude oil and natural gas and crude oil properties, net of dispositions of crude oil and natural gas and crude oil properties. In 2012,2013, our drilling program consisted of twothree drilling rigs operating in the oil- and liquid-rich horizontal Niobrara and Codell playplays in our Wattenberg Field.Field for a majority of the year and one drilling rig in the Utica Shale and Appalachia-Marcellus Shale, respectively. See Part I, OperationsProperties - Drilling Activities, for additional details on our drilling activities. Our capital investment in natural gas and crude oil properties has increased significantly year-over-year as a result of our commitment to growth. Net cash used in investing activities of $217.1 million during $451.9 million2013 duringwas primarily related to cash utilized for our drilling operations of $394.9 million, offset in part by the $187.5 million received from the sale of properties and equipment, including acquisition adjustments. We also invested approximately $9.7 million to purchase substantially all of the Colorado crude oil and natural gas wells owned by certain affiliated partnerships; the assets were purchased through a court-approved auction after such partnerships filed for bankruptcy in September 2013. In 2012, net cash used in investing activities was primarily related to the $304.6$304.6 million expended in June 2012 for the Merit Acquisition and drilling activity of $347.7$347.7 million,, offset in part by $189.2$189.2 million received from the divestiture of our Permian assets in February 2012 and $28.9$28.9 million received related to title defects discovered from PDCM's Seneca-Upshur acquisition in October 2011, of which $14.5$14.5 million represents represented our share. In 2011, we increasednet cash used in investing activities primarily related to cash utilized for our capital spendingdrilling operations of $334.5 million and our acquisition of crude oil and natural gas properties for $145.9 million, offset in part by $159.6the $23.1 million including acquisitions, over that in 2010, and sold received from the sale of our North Dakota assets and our non-core Permian Basin assets, receiving cash of $23.1 million. Approximately 70% of our investment spending was directed toward organic development and the remaining 30% going toward the acquisition of natural gas and crude oil properties. In 2010, as the economic condition showed signs of recovery and the differential between natural gas and liquids grew, we increased our capital spending to $320.8 million. Approximately 51% of our investment spending was directed toward organic development in our liquid-rich plays and the remaining 49% going toward the acquisition of natural gas and crude oil properties. In 2010, we sold our Michigan assets, which provided cash of $22 million.assets.
Financing Activities. Net cash from financing activities in 2013 was primarily related to the $275.8 million received from the issuance of our common stock in August 2013, partially offset by net payments of approximately $23.3 million to pay down amounts borrowed under revolving credit facilities. Net cash from financing activities in 2012 includes gross proceeds of $500$500 million from our October 2012 issuance of the 7.75% senior notes due 2022 Senior Notes and $164.5$164.5 million from our May 2012 sale of common stock. The net proceeds from the issuance of the 7.75% senior notes due 2022 Senior Notes were used to fund the redemption of our previously-outstanding 12% senior notes due 2018 Senior Notes for a total redemption price of approximately $222$222 million and to repay a portion of amounts outstanding under our revolving credit facility. The proceeds from the sale of common stock in May 2012 were used to finance a portion of the Merit Acquisition. Cash flows provided by financing activities in 2011 were primarily comprised of net borrowings under our bankrevolving credit facility of $233.5 million to execute our capital budget. Additionally, 2011 financing cash flows includeincludes $12.5 million, representing our proportionate share of capital contributed to PDCM by our investing partner. Cash flows provided by financing activities in 2010 included gross proceeds of $132.5 million and $115 million from our November 2010 sale of common stock and issuance of convertible debt, respectively. During 2010, our investing partner in PDCM contributed $35 million, of which our proportionate share was $20.1 million. This capital raise was offset in part by the net repayment of borrowings under our bank credit facility of $80 million. See Note 8, Long-Term Debt, and Note 12, Common Stock, to our consolidated financial statements included elsewhere in this report for further discussion on our debt and equity offerings and the formation of our joint venture.
Contractual Obligations and Contingent Commitments
The table below presents our contractual obligations and contingent commitments as of December 31, 20122013.
|
| | | | | | | | | | | | | | | | | | | | |
| | | Payments due by period |
| | | | | Less than | | 1-3 | | 3-5 | | More than |
| Contractual Obligations and Contingent Commitments | | Total | | 1 year | | years | | years | | 5 years |
| | | (in millions) |
| Long-term liabilities reflected on the consolidated balance sheets (1) | | | | | | | | | | |
| Long-term debt (2) | | $ | 690.3 |
| | $ | — |
| | $ | 75.3 |
| | $ | 115.0 |
| | $ | 500.0 |
|
| Derivative contracts (3) | | 28.6 |
| | 18.5 |
| | 6.2 |
| | 3.9 |
| | — |
|
| Derivative contracts - affiliated partnerships (4) | | 4.7 |
| | 4.7 |
| | — |
| | — |
| | — |
|
| Production tax liability | | 44.6 |
| | 25.9 |
| | 18.7 |
| | — |
| | — |
|
| Asset retirement obligations | | 62.6 |
| | 1.0 |
| | 2.5 |
| | 2.5 |
| | 56.6 |
|
| Other liabilities (5) | | 4.9 |
| | 0.3 |
| | 0.9 |
| | 0.6 |
| | 3.1 |
|
| | | 835.7 |
| | 50.4 |
| | 103.6 |
| | 122.0 |
| | 559.7 |
|
| | | | | | | | | | | |
| Commitments, contingencies and other arrangements (6) | | | | | | | | | | |
| Interest on long-term debt (7) | | 403.1 |
| | 47.0 |
| | 91.5 |
| | 78.9 |
| | 185.7 |
|
| Operating leases | | 8.5 |
| | 2.6 |
| | 4.3 |
| | 0.7 |
| | 0.9 |
|
| Drilling commitment | | 0.9 |
| | — |
| | — |
| | 0.9 |
| | — |
|
| Firm transportation and processing agreements (8) | | 199.3 |
| | 25.8 |
| | 55.4 |
| | 44.9 |
| | 73.2 |
|
| Other | | 0.4 |
| | 0.1 |
| | 0.3 |
| | — |
| | — |
|
| | | 612.2 |
| | 75.5 |
| | 151.5 |
| | 125.4 |
| | 259.8 |
|
| Total | | $ | 1,447.9 |
| | $ | 125.9 |
| | $ | 255.1 |
| | $ | 247.4 |
| | $ | 819.5 |
|
| | | | | | | | | | | |
|
| | | | | | | | | | | | | | | | | | | | |
| | | Payments due by period |
| | | | | Less than | | 1-3 | | 3-5 | | More than |
| Contractual Obligations and Contingent Commitments | | Total | | 1 year | | years | | years | | 5 years |
| | | (in millions) |
| Long-term liabilities reflected on the consolidated balance sheet (1) | | | | | | | | | | |
| Long-term debt (2) | | $ | 667.0 |
| | $ | — |
| | $ | 115.0 |
| | $ | 52.0 |
| | $ | 500.0 |
|
| Derivative contracts (3) | | 18.5 |
| | 15.6 |
| | 2.9 |
| | — |
| | — |
|
| Production tax liability | | 45.5 |
| | 23.4 |
| | 22.1 |
| | — |
| | — |
|
| Asset retirement obligations | | 41.1 |
| | 1.2 |
| | 2.4 |
| | 2.3 |
| | 35.2 |
|
| Other liabilities (4) | | 3.4 |
| | 0.3 |
| | 1.3 |
| | 0.5 |
| | 1.3 |
|
| | | 775.5 |
| | 40.5 |
| | 143.7 |
| | 54.8 |
| | 536.5 |
|
| | | | | | | | | | | |
| Commitments, contingencies and other arrangements (5) | | | | | | | | | | |
| Interest on long-term debt (6) | | 365.9 |
| | 46.7 |
| | 91.0 |
| | 81.3 |
| | 146.9 |
|
| Operating leases | | 6.1 |
| | 2.4 |
| | 2.4 |
| | 0.3 |
| | 1.0 |
|
| Firm transportation and processing agreements (7) | | 70.0 |
| | 7.5 |
| | 16.1 |
| | 14.8 |
| | 31.6 |
|
| | | 442.0 |
| | 56.6 |
| | 109.5 |
| | 96.4 |
| | 179.5 |
|
| Total | | $ | 1,217.5 |
| | $ | 97.1 |
| | $ | 253.2 |
| | $ | 151.2 |
| | $ | 716.0 |
|
| | | | | | | | | | | |
__________
| |
| (1) | Table does not include deferred income tax liability to taxing authorities of $148.4118.8 million, due to the uncertainty surrounding the ultimate settlement of amounts and timing of these obligations. |
| |
| (2) | Amount presented does not agree with the consolidated balance sheet in that it excludes $13.710.0 million in unamortized debt discount. See Note 8, Long-Term Debt, to our consolidated financial statements included elsewhere in this report. |
| |
| (3) | Represents our gross liability related to the fair value of derivative positions, including the fair value of derivative contracts we entered into on behalf of our affiliated partnerships as the managing general partner. We have a related receivable from the partnerships of $2.1 million. positions. |
| |
| (4) | Represents our affiliated partnerships' designated portion of the fair value of our gross derivative assets. |
| |
(5) | Includes funds held from revenue distribution to third-party investors, including our affiliated partnerships, for plugging liabilities related to wells we operate and deferred officer compensation.compensation to former executive officers. |
| |
(6)(5) | Table does not include an undrawn $18.7$11.7 million irrevocable standby letter of credit pending issuance to a transportation service provider. See Note 8, Long-Term Debt, to our consolidated financial statements included elsewhere in this report. Additionally, the table does not include the annual repurchase obligations to investing partners or termination benefits related to employment agreements with our executive officers, due to the uncertainty surrounding the ultimate settlement of amounts and timing of these obligations. See Note 11, Commitments and Contingencies - Partnership Repurchase Provision; Employment Agreements with Executive Officers, to our consolidated financial statements included elsewhere in this report. |
| |
(7)(6) | Amounts presented include $12.6$340.7 million to the holders of our 7.75% senior notes due 2022, $8.9 million payable to the holders of our 3.25% convertible senior notes due 2016 and $379.4$4.9 million to the holders of our 2022 Senior Notes.PDCM's second lien term loan. Amounts also include $11.1$11.4 million payable to the participating banks of our revolving credit facilities, of which interest of $5.6$7.3 million is related to unutilized commitments at a rate of 0.5%.38% per annum, $5.3$4.0 million related to the outstanding borrowings on our revolving credit facilities of $75.3$37.0 million and $0.2$0.1 million related to our undrawn letters of credit. |
| |
(8)(7) | Represents our gross commitment, including our proportionate share of PDCM. We will recognize in our financial statements our proportionate share based on our working interest; however, with the exception of contracts entered into by PDCM, the costs of all volume shortfalls will be borne by PDC only. See Note 11, Commitments and Contingencies - Firm Transportation, Processing and Sales Agreements, to our consolidated financial statements included elsewhere in this report. |
As the managing general partner of 21affiliated partnerships, we have liability for potential casualty losses in excess of the partnership assets and insurance. We believe that the casualty insurance coverage we and our subcontractors carry is adequate to meet this potential liability.
For information regarding our legal proceedings, see Note 11, Commitments and Contingencies – Litigation, to our consolidated financial statements included elsewhere in this report. From time to time, we are a party to various other legal proceedings in the ordinary course of business. We are not currently a party to any litigation that we believe would have a materially adverse effect on our business, financial condition, results of operations or liquidity.
Critical Accounting Policies and Estimates
We have identified the following policies as critical to business operations and the understanding of our results of operations. This is not a comprehensive list of all of the accounting policies. In many cases, the accounting treatment of a particular transaction is specifically dictated by U.S. GAAP, with no need for our judgment in the application. There are also areas in which our judgment in selecting available alternatives would not produce a materially different result. However, certain of our accounting policies are particularly important to the portrayal of our financial position and results of operations and we may use significant judgment in the application. As a result, they are subject to an inherent degree of uncertainty. In applying those policies, we use our judgment to determine the appropriate assumptions to be used in the determination of certain estimates. Those estimates are based on historical experience, observation of trends in the industry and information available from other outside sources, as appropriate. For a more detailed discussion on the application of these and other accounting policies, see Note 2, Summary of Significant Accounting Policies, to our consolidated financial statements included elsewhere in this report. Our critical accounting policies and estimates are as follows:
Crude Oil and Natural Gas and Crude Oil Properties. We account for our crude oil and natural gas and crude oil properties under the successful efforts method of accounting. Costs of proved developed producing properties, successful exploratory wells and developmentdevelopmental dry hole costs are capitalized and depreciated or depleted by the unit-of-production method based on estimated proved developed producing reserves.reserves. Property acquisition costs are depreciated or depleted on the unit-of-production method based on estimated proved reserves.
Annually, we engage independent petroleum engineers to prepare reserve and economic evaluations of all our properties on a well-by-well basis as of December 31. We adjust our crude oil and natural gas and crude oil reserves for major acquisitions, new drilling and divestitures during the year as needed. The process of estimating and evaluating crude oil and natural gas and crude oil reserves is complex, requiring significant decisions in the evaluation of available geological, geophysical, engineering and economic data. The data for a given property may also change substantially over time as a result of numerous factors, including additional development activity, evolving production history and a continual reassessment of the viability of production under changing economic conditions. As a result, revisions in existing reserve estimates occur. Although every reasonable effort is made to ensure that reserve estimates reported represent our most accurate assessments possible, the subjective decisions and variances in available data for various properties increase the likelihood of significant changes in these estimates over time. Because estimates of reserves significantly affect our DD&A expense, a change in our estimated reserves could have an effect on our net income.
Exploration costs, including geological and geophysical expenses, and delay rentals, are charged to expense as incurred. Exploratory well drilling costs, including the cost of stratigraphic test wells, are initially capitalized, but are charged to expense if the well is determined to be nonproductive. The status of each in-progress well is reviewed quarterly to determine the proper accounting treatment under the successful efforts method of accounting. Exploratory well costs continue to be capitalized as long as the well has found a sufficient quantity of reserves to justify completion as a producing well and we are making sufficient progress assessing our reserves and economic and operating viability. If an in-progress exploratory well is found to be unsuccessful prior to the issuance of the financial statements, the costs incurred prior to the end of the reporting period are charged to exploration expense. If we are unable to make a final determination about the productive status of a well prior to issuance of the financial statements, the well is classified as "suspended well costs" until we have had sufficient time to conduct additional completion or testing operations to evaluate the pertinent geological and engineering data obtained. At the time when we are able to make a final determination of a well’s productive status, the well is removed from the suspended well status and the proper accounting treatment is applied.
The acquisition costs of unproved properties are capitalized when incurred, until such properties are transferred to proved properties or charged to expense when expired, impaired or amortized. Unproved crude oil and natural gas and crude oil properties with individually significant acquisition costs are periodically assessed, and any impairment in value is charged to impairment of crude oil and natural gas and crude oil properties. The amount of impairment recognized on unproved properties which are not individually significant is determined by amortizing the costs of such properties within appropriate fields based on our historical experience, acquisition dates and average lease terms, with the amortization recognized in impairment of crude oil and natural gas and crude oil properties. The valuation of unproved properties is subjective and requires us to make estimates and assumptions which, with the passage of time, may prove to be materially different from actual realizable values.
We assess our crude oil and natural gas and crude oil properties for possible impairment upon a triggering event by comparing net capitalized costs to estimated undiscounted future net cash flows on a field-by-field basis using estimated production based upon prices at which we reasonably estimate the commodity to be sold. Any impairment in value is charged to impairment of crude oil and natural gas and crude oil properties. The estimates of future prices may differ from current market prices of crude oil and natural gas and crude oil.gas. Any downward revisions in estimates to our reserve quantities, expectations of falling commodity prices or rising operating costs could result in a triggering event, and therefore, a reduction in undiscounted future net cash flows and an impairment of our crude oil and natural gas and crude oil properties. Although our cash flow estimates are based on the relevant information available at the time the estimates are made, estimates of future cash flows are, by nature, highly uncertain and may vary significantly from actual results.
Crude Oil, Natural Gas NGLs and Crude OilNGLs Sales Revenue Recognition. NaturalCrude oil, natural gas NGLs and crude oilNGLs sales are recognized when production is sold to a purchaser at a determinable price, delivery has occurred, rights and responsibility of ownership have transferred and collection of revenue is reasonably assured. We record sales revenue based on an estimate of the volumes delivered at estimated prices as determined by the applicable sales agreement. We estimate our sales volumes based on company-measured volume readings. We then adjust our crude oil, natural gas NGLs and crude oilNGLs sales in subsequent periods based on the data received from our purchasers that reflects actual volumes and prices received. We receive payment for sales from one to threetwo months after actual delivery has occurred. The differences in sales estimates and actual sales are recorded uptwo to twothree months later. Historically, differences have been immaterial.
Fair Value of Financial Instruments. Our fair value measurements are estimated pursuant to a fair value hierarchy that requires us to maximize the use of observable inputs and minimize the use of unobservable inputs when measuring fair value. The valuation hierarchy is based upon the transparency of inputs to the valuation of an asset or liability as of the measurement date, giving the highest priority to quoted prices in active markets (Level 1) and the lowest priority to unobservable data (Level 3). In some cases, the inputs used to measure fair value might fall in different levels of the fair value hierarchy. The lowest level input that is significant to a fair value measurement in its entirety determines the applicable level in the fair value hierarchy. Assessing the significance of a particular input to the fair value measurement in its entirety requires judgment, considering factors specific to the asset or liability, and may affect the valuation of the assets and liabilities and their placement within the fair value hierarchy levels. The three levels of inputs that may be used to measure fair value are defined as:
Level 1 – Quoted prices (unadjusted) for identical assets or liabilities in active markets.
Level 2 – Inputs other than quoted prices included within Level 1 that are either directly or indirectly observable for the asset or liability, including quoted prices for similar assets or liabilities in active markets, quoted prices for identical or similar assets or liabilities in inactive markets, inputs other than quoted prices that are observable for the asset or liability and inputs that are derived from observable market data by correlation or other means.
Level 3 – Unobservable inputs for the asset or liability, including situations where there is little, if any, market activity.
Derivative Financial Instruments. We measure the fair value of our derivative instruments based on a pricing model that utilizes market-based inputs, including but not limited to the contractual price of the underlying position, current market prices, natural gas and crude oil forward curves, discount rates such as the LIBOR curve for a similar duration of each outstanding position, volatility factors and nonperformance risk. Nonperformance risk considers the effect of our credit standing on the fair value of derivative liabilities and the effect of our counterparties' credit standings on the fair value of derivative assets. Both inputs to the model are based on published credit default swap rates and the duration of each outstanding derivative position.
We validate our fair value measurement through the review of counterparty statements and other supporting documentation, the determination that the source of the inputs is valid, the corroboration of the original source of inputs through access to multiple quotes, if available, or other information and monitoring changes in valuation methods and assumptions. While we use common industry practices to develop our valuation techniques, changes in our pricing methodologies or the underlying assumptions could result in significantly different fair values. While we believe our valuation method is appropriate and consistent with those used by other market participants, the use of a different methodology or assumptions to determine the fair value of certain financial instruments could result in a different estimate of fair value.
Net settlements on our derivative instruments are initially recorded to accounts receivable or payable, as applicable, and may not be received from or paid to counterparties to our derivative contracts within the same accounting period. Such settlements typically occur the month following the maturity of the derivative instrument. We have evaluated the credit risk of the counterparties holding our derivative assets, which are primarily financial institutions who are also major lenders in our revolving credit facility, giving consideration to amounts outstanding for each counterparty and the duration of each outstanding derivative position. Based on our evaluation, we have determined that the potential impact of nonperformance of our counterparties on the fair value of our derivative instruments is not significant.
Deferred Income Tax Asset Valuation Allowance. Deferred income tax assets are recognized for deductible temporary differences, net operating loss carry-forwards and credit carry-forwards if it is more likely than not that the tax benefits will be realized. To the extent a deferred tax asset is not expected to be realized under the preceding criteria, we establish a valuation allowance. The factors which we consider in assessing whether we will realize the value of deferred income tax assets involve judgments and estimates of both amount and timing, which could differ from actual results, achieved in future periods.
The judgments used in applying the above policies are based on our evaluation of the relevant facts and circumstances as of the date of the financial statements. Actual results may differ from those estimates.
Accounting for Acquisitions Using Purchase Accounting. We utilize the purchase method to account for acquisitions. Pursuant to purchase method accounting, we allocate the cost of the acquisition to assets acquired and liabilities assumed based on fair values as of the acquisition date. The purchase price allocations are based on appraisals, discounted cash flows, quoted market prices and estimates by management. When appropriate, we review comparable purchases and sales of crude oil and natural gas and crude oil properties within the same regions and use that data as a basis for fair market value; for example, the amount at which a willing buyer and seller would enter into an exchange for such properties.
In estimating the fair values of assets acquired and liabilities assumed, we make various assumptions. The most significant assumptions relate to the estimated fair values assigned to proved developed producing, proved developed non-producing,, proved undeveloped, unproved crude oil and natural gas and crude oil properties and other non-naturalnon-crude oil and natural gas and crude oil properties. To estimate the fair values of these properties, we prepare estimates of crude oil and natural gas and crude oil reserves. We estimate future prices by using the applicable forward pricing strip to apply to our estimate of reserve quantities acquired, and estimates of future operating and development costs, to arrive at an estimate of future net revenues. For estimated proved reserves, the future net revenues are discounted using a market-based weighted-average cost of capital rate determined appropriate at the time of the acquisition. The market-based weighted-average cost of capital rate is subject to additional project-specific risking factors. To compensate for the inherent risk of estimating and valuing unproved properties, we reduce the discounted future net revenues of probable and possible reserves by additional risk-weighting factors.
We record deferred taxes for any differences between the assigned values and tax basis of assets and liabilities. Estimated deferred taxes are based on available information concerning the tax basis of assets acquired and liabilities assumed and loss carryforwards at the acquisition date, although such estimates may change in the future as additional information becomes known.
Recent Accounting Standards
See Note 2, Summary of Significant Accounting Policies - Recent Accounting Standards, to our consolidated financial statements included elsewhere in this report.
Reconciliation of Non-U.S. GAAP Financial Measures
Adjusted cash flows from operations. We define adjusted cash flows from operations as the cash flows earned or incurred from operating activities, without regard to changes in operating assets and liabilities. We believe it is important to consider adjusted cash flows from operations, as well as cash flows from operations, as we believe it often provides more transparency into what drives the changes in our operating trends, such as production, prices, operating costs and related operational factors, without regard to whether the related asset or liability was received or paid during the same period. We also use this measure because the timing of cash received from our assets, cash paid to obtain an asset or payment of our obligations has been only a timing issue from one period to the next as we have not had accounts receivable collection problems, nor been unable to purchase assets or pay our obligations. See the Consolidated Statements of Cash Flows in this report.
Adjusted net income (loss) attributable to shareholders.. We define adjusted net income (loss) attributable to shareholders as net income (loss) attributable to shareholders,, plus unrealized derivative lossesloss on commodity derivatives, less gain on commodity derivatives and provisions for underpayment of natural gas sales, less unrealized derivative gains,net settlements on commodity derivatives, each adjusted for tax effect. We believe it is important to consider adjusted net income (loss) attributable to shareholders,, as well as net income (loss) attributable to shareholders.. We believe itthis measure often provides more transparency into our operating trends, such as production, prices, operating costs, realized gains and lossesnet settlements from derivatives and related factors, without regard to changes in our net income (loss) attributable to shareholders from our mark-to-market adjustments resulting from unrealized gains and losses fromnet changes in the fair value of unsettled derivatives. Additionally, other items, such as the provision for underpayment of natural gas sales, which are not indicative of future results, may be excluded to clearly identify operational trends.
Adjusted EBITDA.We define adjusted EBITDA as net income (loss), plus unrealized derivative loss on commodity derivatives, interest expense, net of interest income, income taxes, impairment of crude oil and natural gas and crude oil properties, depreciation, depletion and amortization, accretion of asset retirement obligations and loss on debt extinguishment, less unrealized derivative gain.gain on commodity derivatives and net settlements on commodity derivatives. Adjusted EBITDA is not a measure of financial performance or liquidity under U.S. GAAP and should be considered in addition to, not as a substitute for, net income (loss), nor as an indicator of cash flows reported in accordance with U.S. GAAP. Adjusted EBITDA includes certain non-cash costs incurred by the Company and does not take into account changes in operating assets and liabilities. Other companies in our industry may calculate Adjustedadjusted EBITDA differently than we do, limiting its usefulness as a comparative measure. We believe adjusted EBITDA is relevant because it is a measure of our operational and financial performance, as well as a measure of our liquidity, and is used by our management, investors, commercial banks, research analysts and others to analyze such things as:
our operating performance and return on capital as compared to our peers;
the financial performance of our assets and our valuation without regard to financing methods, capital structure or historical cost basis;
our ability to generate sufficient cash to service our debt obligations; and
the viability of acquisition opportunities and capital expenditure projects, including the related rate of return.
PV-10%PV-10. We define PV-10%PV-10 as the estimated present value of the future net cash flows from our proved reserves before income taxes, discounted using a 10% discount rate. We believe that PV-10%PV-10 provides useful information to investors as it is widely used by professional analysts and sophisticated investors when evaluating oil and gas companies. We believe that PV-10%PV-10 is relevant and useful for evaluating the relative monetary significance of our reserves. Professional analysts and sophisticated investors may utilize the measure as a basis for comparison of the relative size and value of our reserves to other companies' reserves. Because there are many unique factors that can impact an individual company when estimating the amount of future income taxes to be paid, we believe the use of a pre-tax measure is valuable in evaluating the Companyus and our reserves. PV-10%PV-10 is not intended to represent the current market value of our estimated reserves.
The following table presents a reconciliation of our non-U.S. GAAP financial measures to its most comparable U.S. GAAP measure:
| | | | Year Ended December 31, | Year Ended December 31, |
| | 2012 | | 2011 | | 2010 | 2013 | | 2012 | | 2011 |
| | (in millions) | (in millions) |
| Adjusted cash flows from operations: | | | | | | | | | | |
| Adjusted cash flows from operations | $ | 163.9 |
| | $ | 167.7 |
| | $ | 132.2 |
| $ | 207.8 |
| | $ | 163.9 |
| | $ | 167.7 |
|
| Changes in assets and liabilities | 10.8 |
| | (0.9 | ) | | 19.6 |
| (48.6 | ) | | 10.8 |
| | (0.9 | ) |
| Net cash from operating activities | $ | 174.7 |
| | $ | 166.8 |
| | $ | 151.8 |
| $ | 159.2 |
| | $ | 174.7 |
| | $ | 166.8 |
|
| | | | | | | | | | | |
| Adjusted net income (loss) attributable to shareholders: | | | | | | |
| Adjusted net income (loss) attributable to shareholders | $ | (120.1 | ) | | $ | (4.3 | ) | | $ | 0.4 |
| |
| Unrealized gain (loss) on derivatives, net | (17.1 | ) | | 28.6 |
| | 12.6 |
| |
| Provision for underpayment of natural gas sales | — |
| | — |
| | (3.3 | ) | |
| Adjusted net income (loss): | | | | | | |
| Adjusted net income (loss) | | $ | 0.5 |
| | $ | (120.1 | ) | | $ | (4.3 | ) |
| Gain (loss) on commodity derivative instruments | | (23.7 | ) | | 32.4 |
| | 46.2 |
|
| Net settlements on commodity derivative instruments | | (13.1 | ) | | (49.5 | ) | | (17.6 | ) |
| Tax effect of above adjustments | 6.5 |
| | (10.9 | ) | | (3.5 | ) | 14.0 |
| | 6.5 |
| | (10.9 | ) |
| Net income (loss) attributable to shareholders | $ | (130.7 | ) | | $ | 13.4 |
| | $ | 6.2 |
| |
| Net income (loss) | | $ | (22.3 | ) | | $ | (130.7 | ) | | $ | 13.4 |
|
| | | | | | | | | | | |
| Adjusted EBITDA to net income (loss) attributable to shareholders: | | | | | | |
| Adjusted EBITDA to net income (loss): | | | | | | |
| Adjusted EBITDA | $ | 196.9 |
| | $ | 190.2 |
| | $ | 150.8 |
| $ | 241.0 |
| | $ | 196.9 |
| | $ | 190.2 |
|
| Unrealized gain (loss) on derivatives, net | (17.1 | ) | | 28.6 |
| | 12.6 |
| |
| Gain (loss) on commodity derivative instruments | | (23.7 | ) | | 32.4 |
| | 46.2 |
|
| Net settlements on commodity derivative instruments | | (13.1 | ) | | (49.5 | ) | | (17.6 | ) |
| Interest expense, net | (48.3 | ) | | (36.9 | ) | | (33.2 | ) | (51.4 | ) | | (48.3 | ) | | (36.9 | ) |
| Income tax provision | 80.2 |
| | (6.2 | ) | | (0.4 | ) | 12.6 |
| | 80.2 |
| | (6.2 | ) |
| Impairment of natural gas and crude oil properties | (168.2 | ) | | (25.2 | ) | | (11.1 | ) | |
| Impairment of crude oil and natural gas properties | | (53.4 | ) | | (168.2 | ) | | (25.2 | ) |
| Depreciation, depletion and amortization | (146.9 | ) | | (135.2 | ) | | (111.1 | ) | (129.5 | ) | | (146.9 | ) | | (135.2 | ) |
| Accretion of asset retirement obligations | (4.0 | ) | | (1.9 | ) | | (1.4 | ) | (4.8 | ) | | (4.0 | ) | | (1.9 | ) |
| Loss on extinguishment of debt | (23.3 | ) | | — |
| | — |
| — |
| | (23.3 | ) | | — |
|
| Net income (loss) attributable to shareholders | $ | (130.7 | ) | | $ | 13.4 |
| | $ | 6.2 |
| |
| Net income (loss) | | $ | (22.3 | ) | | $ | (130.7 | ) | | $ | 13.4 |
|
| | | | | | | | | | | |
| Adjusted EBITDA to net cash from operating activities: | | | | | | | | | | |
| Adjusted EBITDA | $ | 196.9 |
| | $ | 190.2 |
| | $ | 150.8 |
| $ | 241.0 |
| | $ | 196.9 |
| | $ | 190.2 |
|
| Interest expense, net | (48.3 | ) | | (36.9 | ) | | (33.2 | ) | (51.4 | ) | | (48.3 | ) | | (36.9 | ) |
| Exploratory dry hole costs | 15.3 |
| | 0.2 |
| | 4.2 |
| — |
| | 15.3 |
| | 0.2 |
|
| Stock-based compensation | 8.5 |
| | 7.4 |
| | 5.0 |
| 12.9 |
| | 8.5 |
| | 7.4 |
|
| Amortization of debt discount and issuance costs | 7.9 |
| | 6.3 |
| | 4.6 |
| 6.8 |
| | 7.9 |
| | 6.3 |
|
| (Gain) loss from sale of properties and equipment | (24.3 | ) | | (4.3 | ) | | 0.3 |
| |
| (Gain) loss on sale of properties and equipment | | 3.7 |
| | (24.3 | ) | | (4.3 | ) |
| Other | 7.9 |
| | 4.8 |
| | 0.5 |
| (5.2 | ) | | 7.9 |
| | 4.8 |
|
| Changes in assets and liabilities | 10.8 |
| | (0.9 | ) | | 19.6 |
| (48.6 | ) | | 10.8 |
| | (0.9 | ) |
| Net cash from operating activities | $ | 174.7 |
| | $ | 166.8 |
| | $ | 151.8 |
| $ | 159.2 |
| | $ | 174.7 |
| | $ | 166.8 |
|
| | | | | | | | | | | |
| PV-10%: | | | | | | |
| PV-10% | $ | 1,708.9 |
| | $ | 1,350.3 |
| | $ | 693.1 |
| |
| PV-10: | | | | | | |
| PV-10 | | $ | 2,703.9 |
| | $ | 1,708.9 |
| | $ | 1,350.3 |
|
| Present value of estimated future income tax discounted at 10% | (540.4 | ) | | (409.1 | ) | | (204.7 | ) | (913.4 | ) | | (540.4 | ) | | (409.1 | ) |
| Standardized measure of discounted future net cash flows | $ | 1,168.5 |
| | $ | 941.2 |
| | $ | 488.4 |
| $ | 1,790.5 |
| | $ | 1,168.5 |
| | $ | 941.2 |
|
Amounts above include results from continuing and discontinued operations.
ITEM 7A. QUANTITATIVE AND QUALITATIVE DISCLOSURE ABOUT MARKET RISK
Market-Sensitive Instruments and Risk Management
We are exposed to market risks associated with interest rate risks, commodity price risk and credit risk. We have established risk management processes to monitor and manage these market risks.
Interest Rate Risk
Changes in interest rates affect the amount of interest we earn on our interest bearing cash, cash equivalents and restricted cash accounts and the interest we pay on borrowings under our revolving credit facility. Our 7.75% senior notes due 2022 and 3.25% convertible senior notes due 2016 have fixed rates and, therefore, near-term changes in interest rates do not expose us to risk of earnings or cash flow loss; however, near-term changes in interest rates may affect the fair value of our fixed-rate debt.
As of December 31, 20122013, our interest-bearing deposit accounts included money market accounts, certificates of deposit and checking and savings accounts with various banks. The amount of our interest-bearing cash, cash equivalents and restricted cash as of December 31, 20122013 was $6.4$210.7 million with an averagea weighted-average interest rate of 0.1%0.3%. The $6.4 million represents our aggregate bank balances, which includes checks issued and outstanding. Based on a sensitivity analysis of our interest bearing deposits as of December 31, 20122013, it was estimatedwe estimate that if market interest rates would have increased or decreased by 1% in 2012, the impact on2013, our annual interest income would have been immaterial.increased by approximately $2.1 million.
As of December 31, 20122013, excluding the $18.711.7 million irrevocable standby lettersletter of credit, we had nooutstanding borrowingsdraws on our corporate bankrevolving credit facility of $49 million and, representing our proportionate share, $26.337.0 million on PDCM's bank credit facility. We estimate that if market interest rates would have increased or decreased by 1%, our 20122013 interest expense would have changed by approximately $0.8 million.$0.4 million.
Commodity Price Risk
We are exposed to the potential risk of loss from adverse changes in the market price of crude oil, natural gas NGLs and crude oil. We employNGLs. Pursuant to established policies and procedures, towe manage a portion of the risks associated with these market fluctuations using derivative instruments. These instruments allowhelp us to predict with greater certainty the effective crude oil and natural gas and crude oil prices to be receivedwe will receive for our hedged production as it is produced.production. We believe that our established derivative policies and procedures are effective in achieving our risk management objectives.
The following table presents our derivative positions (excluding the derivative positions designated to our affiliated partnerships) related to crude oil and natural gas and crude oil sales in effect as of December 31, 20122013:
| | | | | Floors | | Collars | | Fixed-Price Swaps | | CIG Basis Protection Swaps | | | | Collars | | Fixed-Price Swaps | | Basis Protection Swaps | | |
Commodity/ Index/ Maturity Period | | Quantity (BBtu) (1) | | Weighted- Average Contract Price | | Quantity (Gas - BBtu (1) Oil - MBbls) | | Weighted-Average Contract Price | | Quantity (Gas - BBtu (1) Oil - MBbls) | | Weighted- Average Contract Price | | Quantity (BBtu) (1) | | Weighted- Average Contract Price | | Fair Value December 31, 2012 (2) (in millions) | | Quantity (Gas - BBtu (1) Oil - MBbls) | | Weighted-Average Contract Price | | Quantity (Gas - BBtu (1) Oil - MBbls) | | Weighted- Average Contract Price | | Quantity (BBtu) (1) | | Weighted- Average Contract Price | | Fair Value December 31, 2013 (2) (in millions) |
| | | Floors | | Ceilings | | | Floors | | Ceilings | |
| Natural Gas | | | | | | | | | | | | | | | | | | | | | | | | | | | | | | | | | | | | |
| NYMEX | | | | | | | | | | | | | | | | | | | | | | | | | | | | | | | | | | | |
| 2013 | | 4,910.0 |
| | $ | 6.20 |
| | — |
| | $ | — |
| | $ | — |
| | 22,574.5 |
| | $ | 4.62 |
| | 23,320.7 |
| | $ | (0.83 | ) | | $ | 23.3 |
| |
| 2014 | | — |
| | — |
| | — |
| | — |
| | — |
| | 13,390.0 |
| | 4.03 |
| | 8,830.0 |
| | (0.22 | ) | | (0.1 | ) | | — |
| | $ | — |
| | $ | — |
| | 15,327.5 |
| | $ | 4.12 |
| | 6,004.0 |
| | $ | (0.21 | ) | | $ | (0.9 | ) |
| 2015 | | 720.0 |
| | 4.00 |
| | — |
| | — |
| | — |
| | 9,120.0 |
| | 3.91 |
| | — |
| | — |
| | (2.6 | ) | | 5,860.0 |
| | 4.00 |
| | 4.48 |
| | 12,230.0 |
| | 4.10 |
| | 1,620.0 |
| | (0.27 | ) | | (0.2 | ) |
| 2016 | | — |
| | — |
| | — |
| | — |
| | — |
| | 7,200.0 |
| | 3.84 |
| | — |
| | — |
| | (3.9 | ) | | 4,820.0 |
| | 4.03 |
| | 4.48 |
| | 11,920.0 |
| | 3.99 |
| | — |
| | — |
| | (1.3 | ) |
| 2017 | | | 1,630.0 |
| | 4.25 |
| | 5.00 |
| | 625.0 |
| | 4.22 |
| | — |
| | — |
| | 0.6 |
|
| | | | | | | | | | | | | | | | | | | | | | | | | | | | | | | | | | | | |
| CIG | | | | | | | | | | | | | | | | | | | | | | | | | | | | | | | | | | | |
| 2013 | | — |
| | — |
| | 235.0 |
| | 4.00 |
| | 5.45 |
| | — |
| | — |
| | — |
| | — |
| | 0.2 |
| |
| 2014 | | — |
| | — |
| | 1,115.0 |
| | 4.50 |
| | 5.67 |
| | 4,828.0 |
| | 4.00 |
| | — |
| | — |
| | 1.8 |
| | — |
| | — |
| | — |
| | 4,828.0 |
| | 4.00 |
| | — |
| | — |
| | 0.4 |
|
| 2015 | — |
| — |
| | — |
| | 1,040.0 |
| | 4.50 |
| | 5.67 |
| | 2,730.0 |
| | 4.01 |
| | — |
| | — |
| | 0.6 |
| | — |
| | — |
| | — |
| | 2,730.0 |
| | 4.01 |
| | — |
| | — |
| | 0.6 |
|
| | | | | | | | | | | | | | | | | | | | | | | | | | | | | | | | | | | | |
| PEPL | | | | | | | | | | | | | | | | | | | | |
| 2013 | | — |
| | — |
| | — |
| | — |
| | — |
| | 990.4 |
| | 6.18 |
| | — |
| | — |
| | 2.8 |
| |
| | | | | | | | | | | | | | | | | | | | | | |
| Total Natural Gas (3) | | 5,630.0 |
| | | | 2,390.0 |
| | | | | | 60,832.9 |
| | | | 32,150.7 |
| | | | 22.1 |
| |
| Total Natural Gas | | | 12,310.0 |
| | | | | | 47,660.5 |
| | | | 7,624.0 |
| | | | $ | (0.8 | ) |
| | | | | | | | | | | | | | | | | | | | | | | | | | | | | | | | | | | | | |
| Crude Oil | | | | | | | | | | | | | | | | | | | | | | | | | | | | | | | | | | | |
| NYMEX | | | | | | | | | | | | | | | | | | | | | | | | | | | | | | | | | | | |
| 2013 | | — |
| | — |
| | 1,105.6 |
| | 80.46 |
| | 103.58 |
| | 1,220.9 |
| | 96.26 |
| | — |
| | — |
| | 4.7 |
| |
| 2014 | | — |
| | — |
| | 1,032.0 |
| | 82.83 |
| | 102.55 |
| | 360.0 |
| | 97.36 |
| | — |
| | — |
| | 0.6 |
| | 1,032.0 |
| | $ | 82.83 |
| | $ | 102.55 |
| | 3,080.0 |
| | $ | 91.14 |
| | — |
| | $ | — |
| | $ | (12.6 | ) |
| 2015 | | — |
| | — |
| | 36.0 |
| | 90.00 |
| | 106.15 |
| | — |
| | — |
| | — |
| | — |
| | 0.2 |
| | 336.0 |
| | 81.07 |
| | 97.76 |
| | 4,165.0 |
| | 88.67 |
| | — |
| | — |
| | 2.9 |
|
| | | | | | | | | | | | | | | | | | | | | | | | | | | | | | | | | | | | | |
| Total Crude Oil | | — |
| | | | 2,173.6 |
| | | | | | 1,580.9 |
| | | | — |
| | | | 5.5 |
| | 1,368.0 |
| | | | | | 7,245.0 |
| | | | — |
| | | | (9.7 | ) |
| Total Natural Gas and Crude Oil | Total Natural Gas and Crude Oil | | | | | | | | | | | | | | | | $ | 27.6 |
| Total Natural Gas and Crude Oil | | | | | | | | | | | | | | | $ | (10.5 | ) |
| | | | | | | | | | | | | | | | | | | | | | | | | | | | | | | | | | | | |
_____________
| |
| (1) | A standard unit of measurement for natural gas (one BBtu equals one MMcf). |
| |
| (2) | Approximately 29.4%31.3% of the fair value of our derivative assets and 8%5.5% of our derivative liabilities were measured using significant unobservable inputs (Level 3). See Note 3, Fair Value Measurements, to the consolidated financial statements included elsewhere in this report. |
| |
(3) | Pursuant to a purchase and sale agreement entered into on February 4, 2013, approximately 36,546 BBtu of natural gas hedging positions will be assumed by certain affiliates of Caerus Oil and Gas LLC upon the closing of the planned sale. There can be no assurance we will be successful in closing such divestiture. See Note 19, Subsequent Events, to our consolidated financial statements included elsewhere in this report for additional information regarding the planned divestiture of certain of our natural gas properties. |
The following table presents annual average NYMEX and CIG closing prices for crude oil and natural gas and crude oil for the years ended December 31, 20122013 and 20112012, as well as average sales prices we realized for the respective commodities:our crude oil, natural gas and NGLs production:
|
| | | | | | | |
| | Year Ended December 31, |
| | 2012 | | 2011 |
| Average Index Closing Price: | | | |
| Natural Gas (per MMBtu) | | | |
| CIG | $ | 2.58 |
| | $ | 3.79 |
|
| NYMEX | 2.79 |
| | 4.04 |
|
| Crude Oil (per Bbl) | | | |
| NYMEX | $ | 94.92 |
| | $ | 94.01 |
|
| | | | |
| Average Sales Price Realized: | | | |
| Excluding realized derivative gains/(losses) | | | |
| Natural Gas (per Mcf) | $ | 2.18 |
| | $ | 3.27 |
|
| Crude Oil (per Bbl) | 87.14 |
| | 87.63 |
|
| Including realized derivative gains/(losses) | | | |
| Natural Gas (per Mcf) | $ | 3.72 |
| | $ | 4.23 |
|
| Crude Oil (per Bbl) | 86.87 |
| | 80.69 |
|
|
| | | | | | | |
| | Year Ended December 31, |
| | 2013 | | 2012 |
| Average Index Closing Price: | | | |
| Crude oil (per Bbl) | | | |
| NYMEX | $ | 96.76 |
| | $ | 94.92 |
|
| Natural gas (per MMBtu) | | | |
| CIG | $ | 3.45 |
| | $ | 2.58 |
|
| NYMEX | 3.65 |
| | 2.79 |
|
| | | | |
| Average Sales Price Realized: | | | |
| Excluding net settlements on derivatives | | | |
| Crude oil (per Bbl) | $ | 89.92 |
| | $ | 87.27 |
|
| Natural gas (per Mcf) | 3.29 |
| | 2.63 |
|
| NGLs (per Bbl) | 27.97 |
| | 27.33 |
|
Based on a sensitivity analysis as of December 31, 20122013, it was estimated that a 10% increase in crude oil and natural gas and crude oil prices, inclusive of basis, over the entire period for which we have derivatives in place, including those designated to our affiliated partnerships, would have resulted in a decrease in fair value of $52.6the derivatives of $95.5 million; whereas a 10% decrease in prices would have resulted in an increase in fair value of $51.9$93.7 million. Excluding the derivatives designated to our affiliated partnerships, the same 10% increase or decrease in natural gas and crude oil prices would have resulted in a decrease in fair value of $52.1 million and an increase in fair value of $51.5 million, respectively.
See Note 3, Fair Value of Financial Instruments, and Note 4, Derivative Financial Instruments, to our consolidated financial statements included elsewhere in this report for a summary of our open derivative positions, as well as a discussion of how we determine the fair value of and account for our derivative contracts.
Credit Risk
Credit risk represents the loss that we would incur if a counterparty fails to perform under its contractual obligations. We attempt to reduce credit risk by diversifying our counterparty exposure and entering into transactions with high-quality counterparties. When exposed to significant credit risk, we analyze the counterparties’ financial condition prior to entering into an agreement, establish credit limits and monitor the appropriateness of those limits on an ongoing basis. While we believe that our credit risk analysis and monitoring procedures are reasonable, no amount of analysis can assure performance by our counterparties.
Our Oil and Gas Exploration and Production segment's crude oil, natural gas NGLs and crude oilNGLs sales are concentrated with a few predominately large customers. This concentrates the significance of our credit risk exposure to a small number of large customers. Amounts due to our Gas Marketing segment are from a diverse group of entities, including major upstream and midstream energy companies, financial institutions and end-users in various industries. We monitor their creditworthiness through our credit committee, which utilizes a number of qualitative and quantitative tools to assess credit risk and takes mitigative actions if deemed necessary. To date, we have had no material counterparty default losses in either of our Oil and Gas Exploration and Production or our Gas Marketing segments.segment. See Note 5, Concentration of Risk, to our consolidated financial statements included elsewhere in this report.
Our derivative financial instruments may expose us to the credit risk of nonperformance by the instrument's contract counterparty. We primarily use financial institutions which are lenders in our revolving credit facility as counterparties for our derivative financial instruments. Disruption in the credit markets may have a significant adverse impact on a number of financial institutions. We monitor theirthe creditworthiness of our counterparties through our credit committee, which utilizes a number of qualitative and quantitative tools to assess credit risk and takes mitigative actions if deemed necessary. While we believe that our monitoring procedures are reasonable, no amount of analysis can assure performance by a financial institution. To date, we have had no material counterparty default losses from our derivative financial instruments. See Note 4, Derivative Financial Instruments, to our consolidated financial statements included elsewhere in this report for more detail on our derivative financial instruments.
Disruption in the credit market may have a significant adverse impact on a number of financial institutions. We monitor the creditworthiness of the financial institutions with which we transact, giving consideration to the reports of credit agencies and their related ratings. While we believe that our monitoring procedures are sufficient and customary, no amount of analysis can assure performance by a financial institution.
Disclosure of Limitations
Because the information above included only those exposures that existed at December 31, 20122013, it does not consider those exposures or positions which could arise after that date. As a result, our ultimate realized gain or loss with respect to interest rate and commodity price fluctuations will depend on the exposures that arise during the period, our commodity price risk management strategies at the time, and interest rates and commodity prices at the time.
ITEM 8. FINANCIAL STATEMENTS AND SUPPLEMENTARY DATA
|
| | |
| Index to Consolidated Financial Statements, Financial Statement Schedule and Supplemental Information |
| | |
| | |
| Financial Statements: | | |
| | |
| | |
| | |
| | |
| | |
| | |
| | |
| Supplemental Information - Unaudited: | | |
| | |
| | |
| | |
| Financial Statement Schedule: | | |
| | |
| | |
Management's Report on Internal Control Over Financial Reporting
Management is responsible for establishing and maintaining adequate internal control over financial reporting as such term as defined in Rules 13a-15(f) and 15d-15(f) of the Securities Exchange Act of 1934, as amended. Internal control over financial reporting is a process designed to provide reasonable assurance regarding the reliability of financial reporting and the preparation of financial statements for external purposes in accordance with generally accepted accounting principles. Because of its inherent limitations, internal control over financial reporting may not prevent or detect misstatements. Also, projections of any evaluation of effectiveness to future periods are subject to the risk that controls may become inadequate because of changes in conditions, or that the degree of compliance with policies or procedures may deteriorate.
Management has assessed the effectiveness of the Company’s internal control over financial reporting as of December 31, 2013, based upon the criteria established in "Internal Control – Integrated Framework (1992)" issued by the Committee of Sponsoring Organizations of the Treadway Commission. Based on this evaluation, management concluded that the Company maintained effective internal control over financial reporting as of December 31, 2013.
The response to this Item iseffectiveness of the Company's internal control over financial reporting as of December 31, 2013, has been audited by PricewaterhouseCoopers LLP, an independent registered public accounting firm, as stated in their report which appears herein.
PDC ENERGY, INC.
|
| | |
| /s/ James M. Trimble |
| James M. Trimble |
| Chief Executive Officer and President |
| | |
| /s/ Gysle R. Shellum |
| Gysle R. Shellum |
| Chief Financial Officer |
| | |
| /s/ R. Scott Meyers |
| R. Scott Meyers |
| Chief Accounting Officer |
Report of Independent Registered Public Accounting Firm
To the Board of Directors and Shareholders of PDC Energy, Inc.:
In our opinion, the consolidated financial statements listed in the accompanying index present fairly, in all material respects, the financial position of PDC Energy, Inc. and its subsidiaries at December 31, 2013 and 2012, and the results of their operations and their cash flows for each of the three years in the period ended December 31, 2013 in conformity with accounting principles generally accepted in the United States of America. In addition, in our opinion, the financial statement schedule listed in the accompanying index presents fairly, in all material respects, the information set forth hereintherein when read in conjunction with the related consolidated financial statements. Also in our opinion, the Company maintained, in all material respects, effective internal control over financial reporting as of December 31, 2013, based on criteria established in Internal Control - Integrated Framework (1992) issued by the Committee of Sponsoring Organizations of the Treadway Commission (COSO). The Company's management is responsible for these financial statements, for maintaining effective internal control over financial reporting and for its assessment of the effectiveness of internal control over financial reporting, included in the accompanying Management's Report on Internal Control over Financial Reporting. Our responsibility is to express opinions on these financial statements, on the financial statement schedule, and on the Company's internal control over financial reporting based on our integrated audits. We conducted our audits in accordance with the standards of the Public Company Accounting Oversight Board (United States). Those standards require that we plan and perform the audits to obtain reasonable assurance about whether the financial statements are free of material misstatement and whether effective internal control over financial reporting was maintained in all material respects. Our audits of the financial statements included examining, on a separate sectiontest basis, evidence supporting the amounts and disclosures in the financial statements, assessing the accounting principles used and significant estimates made by management, and evaluating the overall financial statement presentation. Our audit of this report, beginninginternal control over financial reporting included obtaining an understanding of internal control over financial reporting, assessing the risk that a material weakness exists, and testing and evaluating the design and operating effectiveness of internal control based on Page F-1.the assessed risk. Our audits also included performing such other procedures as we considered necessary in the circumstances. We believe that our audits provide a reasonable basis for our opinions.
A company's internal control over financial reporting is a process designed to provide reasonable assurance regarding the reliability of financial reporting and the preparation of financial statements for external purposes in accordance with generally accepted accounting principles. A company's internal control over financial reporting includes those policies and procedures that (i) pertain to the maintenance of records that, in reasonable detail, accurately and fairly reflect the transactions and dispositions of the assets of the company; (ii) provide reasonable assurance that transactions are recorded as necessary to permit preparation of financial statements in accordance with generally accepted accounting principles, and that receipts and expenditures of the company are being made only in accordance with authorizations of management and directors of the company; and (iii) provide reasonable assurance regarding prevention or timely detection of unauthorized acquisition, use, or disposition of the company's assets that could have a material effect on the financial statements.
Because of its inherent limitations, internal control over financial reporting may not prevent or detect misstatements. Also, projections of any evaluation of effectiveness to future periods are subject to the risk that controls may become inadequate because of changes in conditions, or that the degree of compliance with the policies or procedures may deteriorate.
/s/ PricewaterhouseCoopers LLP
Pittsburgh, Pennsylvania
February 20, 2014
PDC ENERGY, INC.
Consolidated Balance Sheets
(in thousands, except share and per share data)
|
| | | | | | | | |
| As of December 31, | | 2013 | | 2012 |
| Assets | | | | |
| Current assets: | | | | |
| Cash and cash equivalents | | $ | 193,243 |
| | $ | 2,457 |
|
| Restricted cash | | 2,214 |
| | 3,942 |
|
| Accounts receivable, net | | 94,085 |
| | 64,880 |
|
| Accounts receivable affiliates | | 6,614 |
| | 4,842 |
|
| Fair value of derivatives | | 2,572 |
| | 52,042 |
|
| Deferred income taxes | | 22,374 |
| | 36,151 |
|
| Prepaid expenses and other current assets | | 4,711 |
| | 7,635 |
|
| Total current assets | | 325,813 |
| | 171,949 |
|
| Properties and equipment, net | | 1,653,445 |
| | 1,616,706 |
|
| Assets held for sale | | 2,785 |
| | — |
|
| Fair value of derivatives | | 5,601 |
| | 6,883 |
|
| Other assets | | 37,559 |
| | 31,310 |
|
| Total Assets | | $ | 2,025,203 |
| | $ | 1,826,848 |
|
| | | | | |
| Liabilities and Shareholders' Equity | | | | |
| Liabilities | | | | |
| Current liabilities: | | | | |
| Accounts payable | | $ | 109,555 |
| | $ | 82,716 |
|
| Accounts payable affiliates | | 41 |
| | 5,296 |
|
| Production tax liability | | 23,421 |
| | 25,899 |
|
| Fair value of derivatives | | 15,515 |
| | 18,439 |
|
| Funds held for distribution | | 32,578 |
| | 34,228 |
|
| Accrued interest payable | | 9,251 |
| | 11,056 |
|
| Other accrued expenses | | 23,059 |
| | 25,715 |
|
| Total current liabilities | | 213,420 |
| | 203,349 |
|
| Long-term debt | | 656,990 |
| | 676,579 |
|
| Deferred income taxes | | 118,767 |
| | 148,427 |
|
| Asset retirement obligation | | 37,811 |
| | 61,563 |
|
| Fair value of derivatives | | 3,015 |
| | 10,137 |
|
| Liabilities held for sale | | 2,061 |
| | — |
|
| Other liabilities | | 25,545 |
| | 23,612 |
|
| Total liabilities | | 1,057,609 |
| | 1,123,667 |
|
| | | | | |
| Commitments and contingent liabilities | | | | |
| | | | | |
| Shareholders' equity | | | | |
| Preferred shares - par value $0.01 per share, 50,000,000 shares authorized, none issued | | — |
| | — |
|
| Common shares - par value $0.01 per share, 100,000,000 authorized, 35,675,656 and 30,294,224 issued as of December 31, 2013 and 2012, respectively | | 357 |
| | 303 |
|
| Additional paid-in capital | | 674,211 |
| | 387,494 |
|
| Retained earnings | | 293,267 |
| | 315,568 |
|
| Treasury shares - at cost, 5,508 and 5,059 as of December 31, 2013 and 2012, respectively | | (241 | ) | | (184 | ) |
| Total shareholders' equity | | 967,594 |
| | 703,181 |
|
| Total Liabilities and Shareholders' Equity | | $ | 2,025,203 |
| | $ | 1,826,848 |
|
| | | | | |
See accompanying Notes to Consolidated Financial Statements
55
PDC ENERGY, INC.
Consolidated Statements of Operations
(in thousands, except per share data)
|
| | | | | | | | | | | | |
| Year Ended December 31, | | 2013 | | 2012 | | 2011 |
| Revenues | | | | | | |
| Crude oil, natural gas and NGLs sales | | $ | 359,398 |
| | $ | 238,361 |
| | $ | 223,297 |
|
| Sales from natural gas marketing | | 69,787 |
| | 45,371 |
| | 63,470 |
|
| Commodity price risk management gain (loss), net | | (23,905 | ) | | 32,339 |
| | 46,090 |
|
| Well operations, pipeline income and other | | 6,034 |
| | 4,534 |
| | 4,432 |
|
| Total revenues | | 411,314 |
| | 320,605 |
| | 337,289 |
|
| Costs, expenses and other | | | | | | |
| Production costs | | 73,390 |
| | 54,700 |
| | 44,832 |
|
| Cost of natural gas marketing | | 70,084 |
| | 45,023 |
| | 62,831 |
|
| Exploration expense | | 7,039 |
| | 20,894 |
| | 5,734 |
|
| Impairment of crude oil and natural gas properties | | 53,435 |
| | 5,895 |
| | 2,301 |
|
| General and administrative expense | | 63,969 |
| | 58,815 |
| | 61,454 |
|
| Depreciation, depletion, and amortization | | 127,260 |
| | 98,778 |
| | 87,633 |
|
| Accretion of asset retirement obligations | | 4,586 |
| | 3,687 |
| | 1,398 |
|
| (Gain) loss on sale of properties and equipment | | 1,392 |
| | (4,353 | ) | | (196 | ) |
| Total cost, expenses and other | | 401,155 |
| | 283,439 |
| | 265,987 |
|
| Income from operations | | 10,159 |
| | 37,166 |
| | 71,302 |
|
| Loss on extinguishment of debt | | — |
| | (23,283 | ) | | — |
|
| Interest expense | | (51,898 | ) | | (48,287 | ) | | (36,985 | ) |
| Interest income | | 470 |
| | 8 |
| | 47 |
|
| Income (loss) from continuing operations before income taxes | | (41,269 | ) | | (34,396 | ) | | 34,364 |
|
| Provision for income taxes | | 14,797 |
| | 12,701 |
| | (11,800 | ) |
| Income (loss) from continuing operations | | (26,472 | ) | | (21,695 | ) | | 22,564 |
|
| Income (loss) from discontinued operations, net of tax | | 4,171 |
| | (109,017 | ) | | (9,127 | ) |
| Net income (loss) | | $ | (22,301 | ) | | $ | (130,712 | ) | | $ | 13,437 |
|
| | | | | | | |
| Earnings per share: | | | | | | |
| Basic | | | | | | |
| Income (loss) from continuing operations | | $ | (0.82 | ) | | $ | (0.78 | ) | | $ | 0.96 |
|
| Income (loss) from discontinued operations | | 0.13 |
| | (3.94 | ) | | (0.39 | ) |
| Net income (loss) | | $ | (0.69 | ) | | $ | (4.72 | ) | | $ | 0.57 |
|
| | | | | | | |
| Diluted | | | | | | |
| Income (loss) from continuing operations | | $ | (0.82 | ) | | $ | (0.78 | ) | | $ | 0.95 |
|
| Income (loss) from discontinued operations | | 0.13 |
| | (3.94 | ) | | (0.39 | ) |
| Net income (loss) | | $ | (0.69 | ) | | $ | (4.72 | ) | | $ | 0.56 |
|
| | | | | | | |
| Weighted-average common shares outstanding: | | | | | | |
| Basic | | 32,426 |
| | 27,677 |
| | 23,521 |
|
| Diluted | | 32,426 |
| | 27,677 |
| | 23,871 |
|
| | | | | | | |
See accompanying Notes to Consolidated Financial Statements
56
PDC ENERGY, INC.
Consolidated Statements of Cash Flows
|
| | | | | | | | | | | | |
| Year Ended December 31, | | 2013 | | 2012 | | 2011 |
| Cash flows from operating activities: | | | | | | |
| Net income (loss) | | $ | (22,301 | ) | | $ | (130,712 | ) | | $ | 13,437 |
|
| Adjustments to net income (loss) to reconcile to net cash from operating activities: | | | | | | |
| Net change in fair value of unsettled derivatives | | 36,801 |
| | 17,134 |
| | (28,601 | ) |
| Depreciation, depletion and amortization | | 129,518 |
| | 146,879 |
| | 135,154 |
|
| Impairment of crude oil and natural gas properties | | 53,438 |
| | 168,149 |
| | 25,159 |
|
| Prepaid well costs write-offs | | 74 |
| | 3,916 |
| | 1,359 |
|
| Loss on extinguishment of debt | | — |
| | 23,283 |
| | — |
|
| Exploratory dry hole costs | | — |
| | 15,347 |
| | 177 |
|
| Accretion of asset retirement obligation | | 4,747 |
| | 4,060 |
| | 1,897 |
|
| Stock-based compensation | | 12,880 |
| | 8,495 |
| | 8,781 |
|
| Excess tax benefits from stock-based compensation | | (2,489 | ) | | — |
| | (1,311 | ) |
| (Gain) loss from sale of properties and equipment | | 3,722 |
| | (24,273 | ) | | (4,263 | ) |
| Amortization of debt discount and issuance costs | | 6,783 |
| | 7,864 |
| | 6,265 |
|
| Deferred income taxes | | (15,883 | ) | | (80,379 | ) | | 9,530 |
|
| Other | | 460 |
| | 4,123 |
| | 135 |
|
| Total adjustments to net income (loss) to reconcile to net cash from operating activities: | | 230,051 |
| | 294,598 |
| | 154,282 |
|
| Changes in assets and liabilities: | | | | | | |
| Accounts receivable | | (41,509 | ) | | 6,843 |
| | (3,451 | ) |
| Other assets | | 3,461 |
| | (2,908 | ) | | (3,893 | ) |
| Restricted cash | | (8 | ) | | 8,859 |
| | (8,603 | ) |
| Production tax liability | | 4,121 |
| | 2,499 |
| | 5,436 |
|
| Accounts payable and accrued expenses | | (11,485 | ) | | (5,050 | ) | | 12,422 |
|
| Other liabilities | | (3,165 | ) | | 592 |
| | (2,796 | ) |
| Total changes in assets and liabilities | | (48,585 | ) | | 10,835 |
| | (885 | ) |
| Net cash from operating activities | | 159,165 |
| | 174,721 |
| | 166,834 |
|
| Cash flows from investing activities: | | | | | | |
| Capital expenditures | | (394,948 | ) | | (347,729 | ) | | (334,496 | ) |
| Acquisition of crude oil and natural gas properties, net of cash acquired | | (9,658 | ) | | (312,223 | ) | | (145,894 | ) |
Proceeds from acquisition adjustments
| | 7,579 |
| | 14,469 |
| | — |
|
| Proceeds from sale of properties and equipment, net | | 179,919 |
| | 193,544 |
| | 23,140 |
|
| Other | | — |
| | — |
| | 849 |
|
| Net cash from investing activities | | (217,108 | ) | | (451,939 | ) | | (456,401 | ) |
| Cash flows from financing activities: | | | | | | |
| Proceeds from revolving credit facility | | 260,250 |
| | 682,000 |
| | 417,194 |
|
| Repayment of revolving credit facility | | (283,500 | ) | | (839,750 | ) | | (183,713 | ) |
| Proceeds from senior notes offering | | — |
| | 500,000 |
| | — |
|
| Redemption of senior notes | | — |
| | (221,840 | ) | | — |
|
| Payment of debt issuance costs | | (2,352 | ) | | (11,969 | ) | | (680 | ) |
| Proceeds from sale of common stock, net of issuance costs | | 275,847 |
| | 164,496 |
| | — |
|
| Excess tax benefits from stock-based compensation | | 2,489 |
| | — |
| | 1,311 |
|
| Contribution from noncontrolling interest | | — |
| | — |
| | 12,464 |
|
| Purchase of treasury shares | | (4,133 | ) | | (1,500 | ) | | (3,143 | ) |
| Proceeds from exercise of stock options | | 128 |
| | — |
| | — |
|
| Net cash from financing activities | | 248,729 |
| | 271,437 |
| | 243,433 |
|
| Net change in cash and cash equivalents | | 190,786 |
| | (5,781 | ) | | (46,134 | ) |
| Cash and cash equivalents, beginning of year | | 2,457 |
| | 8,238 |
| | 54,372 |
|
| Cash and cash equivalents, end of year | | $ | 193,243 |
| | $ | 2,457 |
| | $ | 8,238 |
|
| | | | | | | |
| Supplemental cash flow information: | | | | | | |
| Cash payments (receipts) for: | | | | | | |
| Interest, net of capitalized interest | | $ | 48,844 |
| | $ | 41,768 |
| | $ | 29,429 |
|
| Income taxes | | (3,014 | ) | | 1,845 |
| | (1,498 | ) |
| Non-cash investing activities: | | | | | | |
| Change in accounts payable related to purchases of properties and equipment | | 33,328 |
| | 288 |
| | 23,837 |
|
| Change in asset retirement obligation, with a corresponding change to crude oil and natural gas properties, net of disposals | | 2,112 |
| | 11,967 |
| | 17,538 |
|
| Change in accounts receivable related to disposition of properties and equipment | | 808 |
| | — |
| | — |
|
| Change in other assets related to disposition of properties and equipment | | 3,350 |
| | — |
| | — |
|
See Note 15, Acquisitions, for non-cash transactions related to our acquisitions | | | | | | |
See accompanying Notes to Consolidated Financial Statements
57
PDC ENERGY, INC.
Consolidated Statements of Equity
(in thousands, except share and per share data)
|
| | | | | | | | | | | | |
| Year Ended December 31, | | 2013 | | 2012 | | 2011 |
| Common shares, issued: | | | | | | |
| Shares beginning of year | | 30,294,224 |
| | 23,634,958 |
| | 23,462,326 |
|
| Shares issued pursuant to sale of equity | | 5,175,000 |
| | 6,500,000 |
| | — |
|
| Exercise of stock options | | 10,763 |
| | — |
| | 2,814 |
|
| Issuance of stock awards, net of forfeitures | | 212,926 |
| | 173,737 |
| | 242,334 |
|
| Retirement of treasury shares | | (17,257 | ) | | (14,471 | ) | | (72,516 | ) |
| Shares end of year | | 35,675,656 |
| | 30,294,224 |
| | 23,634,958 |
|
| Treasury shares: | | | | | | |
| Shares beginning of year | | 5,059 |
| | 2,938 |
| | 2,938 |
|
| Purchase of treasury shares | | 84,642 |
| | 44,576 |
| | 87,588 |
|
| Issuance of treasury shares | | (67,334 | ) | | (28,587 | ) | | (15,072 | ) |
| Retirement of treasury shares | | (17,257 | ) | | (14,471 | ) | | (72,516 | ) |
| Non-employee directors' deferred compensation plan | | 398 |
| | 603 |
| | — |
|
| Shares end of year | | 5,508 |
| | 5,059 |
| | 2,938 |
|
| Common shares outstanding | | 35,670,148 |
| | 30,289,165 |
| | 23,632,020 |
|
| | | | | | | |
| Equity: | | | | | | |
| Shareholders' equity | | | | | | |
| Preferred shares, par value $0.01 per share: | | | | | | |
| Balance beginning and end of year | | $ | — |
| | $ | — |
| | $ | — |
|
| Common shares, par value $0.01 per share: | | | | | | |
| Balance beginning of year | | 303 |
| | 236 |
| | 235 |
|
| Shares issued pursuant to sale of equity | | 52 |
| | 65 |
| | — |
|
| Issuance of stock awards, net of forfeitures | | 2 |
| | 2 |
| | 1 |
|
| Balance end of year | | 357 |
| | 303 |
| | 236 |
|
| Additional paid-in capital: | | | | | | |
| Balance beginning of year | | 387,494 |
| | 217,707 |
| | 209,198 |
|
| Proceeds from sale of equity, net of issuance costs | | 275,795 |
| | 164,431 |
| | — |
|
| Exercise of stock options | | 125 |
| | — |
| | — |
|
| Stock-based compensation expense | | 12,402 |
| | 8,495 |
| | 8,781 |
|
| Issuance of treasury shares | | (3,270 | ) | | (955 | ) | | (472 | ) |
| Retirement of treasury shares | | (824 | ) | | (491 | ) | | (2,671 | ) |
| Tax impact of stock-based compensation | | 2,489 |
| | (1,693 | ) | | 785 |
|
| Contribution by investing partner in PDCM | | — |
| | — |
| | 12,464 |
|
| Effect of PDCM deconsolidation/change in ownership interest | | — |
| | — |
| | (10,378 | ) |
| Balance end of year | | 674,211 |
| | 387,494 |
| | 217,707 |
|
| Retained earnings: | | | | | | |
| Balance beginning of year | | 315,568 |
| | 446,280 |
| | 432,843 |
|
| Net income (loss) attributable to shareholders | | (22,301 | ) | | (130,712 | ) | | 13,437 |
|
| Balance end of year | | 293,267 |
| | 315,568 |
| | 446,280 |
|
| Treasury shares, at cost: | | | | | | |
| Balance beginning of year | | (184 | ) | | (111 | ) | | (111 | ) |
| Purchase of treasury shares | | (4,133 | ) | | (1,500 | ) | | (3,143 | ) |
| Issuance of treasury shares | | 3,271 |
| | 955 |
| | 472 |
|
| Retirement of treasury shares | | 824 |
| | 491 |
| | 2,671 |
|
| Non-employee directors' deferred compensation plan | | (19 | ) | | (19 | ) | | — |
|
| Balance end of year | | (241 | ) | | (184 | ) | | (111 | ) |
| Total shareholders' equity | | 967,594 |
| | 703,181 |
| | 664,112 |
|
| Noncontrolling interests in subsidiary | | | | | | |
| Balance beginning of year | | — |
| | — |
| | 76 |
|
| Net loss attributed to noncontrolling interest in subsidiary | | — |
| | — |
| | (76 | ) |
| Balance end of year | | — |
| | — |
| | — |
|
| Total noncontrolling interests in subsidiary | | — |
| | — |
| | — |
|
| Total Equity | | $ | 967,594 |
| | $ | 703,181 |
| | $ | 664,112 |
|
| | | | | | | |
See accompanying Notes to Consolidated Financial Statements
58
PDC ENERGY, INC.
NOTES TO CONSOLIDATED FINANCIAL STATEMENTS
NOTE 1 - NATURE OF OPERATIONS AND BASIS OF PRESENTATION
PDC Energy, Inc. is a domestic independent exploration and production company that produces, develops, acquires, and explores for crude oil, natural gas and NGLs with primary operations in the Wattenberg Field in Colorado, the Utica Shale in southeastern Ohio and the Appalachia-Marcellus Shale in northern West Virginia. Our operations in the Wattenberg Field are focused on the liquid-rich horizontal Niobrara and Codell plays. We are currently focusing our Ohio development in the liquid-rich portion of the Utica Shale play and are pursuing horizontal development of the Marcellus Shale in West Virginia. As of December 31, 2013, we owned an interest in approximately 3,100 gross wells. We are engaged in two business segments: (1) Oil and Gas Exploration and Production and (2) Gas Marketing.
The consolidated financial statements include the accounts of PDC, our wholly owned subsidiaries and our proportionate share of PDC Mountaineer, LLC and our affiliated partnerships. Pursuant to the proportionate consolidation method, our accompanying consolidated financial statements include our pro rata share of assets, liabilities, revenues and expenses of the entities which we proportionately consolidate. All material intercompany accounts and transactions have been eliminated in consolidation.
The preparation of our consolidated financial statements in accordance with U.S. GAAP requires us to make estimates and assumptions that affect the amounts reported in our consolidated financial statements and accompanying notes. Actual results could differ from those estimates. Estimates which are particularly significant to our consolidated financial statements include estimates of crude oil, natural gas and NGLs sales revenue, crude oil, natural gas and NGLs reserves, future cash flows from crude oil and natural gas properties, valuation of derivative instruments and valuation of deferred income tax assets.
Certain reclassifications have been made to prior period financial statements to conform to the current year presentation. These reclassifications had no impact on previously reported cash flows, net income, earnings per share or shareholders' equity.
ITEM 9. CHANGES IN AND DISAGREEMENTS WITH ACCOUNTANTS ON ACCOUNTING AND FINANCIAL DISCLOSURE
None.
ITEM 9A. CONTROLS AND PROCEDURES
Evaluation of Disclosure Controls and ProceduresNOTE 2 - SUMMARY OF SIGNIFICANT ACCOUNTING POLICIES
Cash Equivalents. We consider all highly liquid investments with original maturities of three months or less to be cash equivalents.
Restricted Cash. We are required by certain government agencies or agreements to maintain bonds or cash accounts for various operating activities. As of December 31, 2013, we had collateral in the form of certificates of deposit and cash totaling $3.3 million which consisted of $2.2 million and $1.1 million included in restricted cash and other assets, respectively. As of December 31, 2012, we carried out an evaluation underhad collateral in the supervisionform of certificates of deposit and withcash totaling $5.3 million which consisted of $3.9 million and $1.4 million included in restricted cash and other assets, respectively.
Inventory. Inventory consists of crude oil, stated at the participationlower of management, includingcost to produce or market, and other production supplies intended to be used in our crude oil and natural gas operations. As of December 31, 2013 and 2012, inventory of $0.9 million and $1.2 million, respectively, is included in prepaid expenses and other current assets on the Chief Executive Officerconsolidated balance sheets.
Derivative Financial Instruments. We are exposed to the effect of market fluctuations in the prices of crude oil, natural gas and the Chief Financial Officer,NGLs. We employ established policies and procedures to manage a portion of the effectivenessrisks associated with these market fluctuations using commodity derivative instruments. Our policy prohibits the use of natural gas and crude oil derivative instruments for speculative purposes.
All derivative assets and liabilities are recorded on our consolidated balance sheets at fair value. We have elected not to designate any of our derivative instruments as hedges. Classification of net settlements resulting from maturities and changes in fair value of unsettled derivatives depends on the purpose for issuing or holding the derivative. Accordingly, changes in the fair value of our derivative instruments are recorded in the consolidated statements of operations. Changes in the fair value of derivative instruments related to our Oil and Gas Exploration and Production segment are recorded in commodity price risk management, net. Changes in the fair value of derivative instruments related to our Gas Marketing segment are recorded in sales from and cost of natural gas marketing. Changes in the fair value of the designderivative instruments designated to our affiliated partnerships are recorded on the consolidated balance sheets in accounts receivable affiliates and operationaccounts payable affiliates. As positions designated to our affiliated partnerships mature, the cash settlements are netted for distribution. Net settlements are paid to the partnerships or deducted from the partnerships’ cash distributions from production. The affiliated partnerships bear their designated share of counterparty risk. As of December 31, 2013, our affiliated partnerships had no outstanding derivative instruments.
The validation of the derivative instrument's fair value is performed internally and, while we use common industry practices to develop our valuation techniques, changes in our pricing methodologies or the underlying assumptions could result in significantly different fair values. See Note 3, Fair Value of Financial Instruments, and Note 4, Derivative Financial Instruments, for a discussion of our disclosure controlsderivative fair value measurements and procedures pursuant to Exchange Act Rules 13a-15(e) and 15d-15(e). Based on the resultsa summary fair value table of this evaluation, the Chief Executive Officer and the Chief Financial Officer concluded that our disclosure controls and procedures were effectiveopen positions as of December 31, 2013 and 2012, respectively.
Properties and Equipment. Significant accounting polices related to our properties and equipment are discussed below.
Crude Oil and Natural Gas Properties.We account for our crude oil and natural gas properties under the successful efforts method of accounting. Costs of proved developed producing properties, successful exploratory wells and developmental dry hole costs are capitalized and depreciated or depleted by the unit-of-production method based on estimated proved developed producing reserves. Property acquisition costs are depreciated or depleted on the unit-of-production method based on estimated proved reserves. We calculate quarterly DD&A expense by using our estimated prior period-end reserves as the denominator, with the exception of our fourth quarter where we use the year-end reserve estimate adjusted to add back fourth quarter production. Upon the sale or retirement of significant portions of or complete fields of depreciable or depletable property, the net book value thereof, less proceeds or salvage value, is recognized in the consolidated statement of operations as a gain or loss. Upon the sale of individual wells or a portion of a field, the proceeds are credited to accumulated DD&A.
PDC ENERGY, INC.
NOTES TO CONSOLIDATED FINANCIAL STATEMENTS - Continued
Exploration costs, including geological and geophysical expenses and delay rentals, are charged to expense as incurred. Exploratory well drilling costs, including the cost of stratigraphic test wells, are initially capitalized, but charged to expense if the well is determined to be economically nonproductive. The status of each in-progress well is reviewed quarterly to determine the proper accounting treatment under the successful efforts method of accounting. Exploratory well costs continue to be capitalized as long as we have found a sufficient quantity of reserves to justify completion as a producing well, we are making sufficient progress assessing our reserves and economic and operating viability or we have not made sufficient progress to allow for final determination of productivity. If an in-progress exploratory well is found to be economically unsuccessful prior to the issuance of the financial statements, the costs incurred prior to the end of the reporting period are charged to exploration expense. If we are unable to make a final determination about the productive status of a well prior to issuance of the financial statements, the costs associated with the well are classified as "suspended well costs" until we have had sufficient time to conduct additional completion or testing operations to evaluate the pertinent geological and engineering data obtained. At the time we are able to make a final determination of a well’s productive status, the well is removed from suspended well status and the proper accounting treatment is recorded. See Note 6, Properties and Equipment, for disclosure related to changes in our capitalized exploratory well costs.
Proved Property Impairment. Upon a triggering event, we assess our producing crude oil and natural gas properties for possible impairment by comparing net capitalized costs, or carrying value, to estimated undiscounted future net cash flows on a field-by-field basis using estimated production based upon prices at which we reasonably estimate the commodity to be sold. The estimates of future prices may differ from current market prices of crude oil, natural gas and NGLs. Certain events, including but not limited to downward revisions in estimates to our reserve quantities, expectations of falling commodity prices or rising operating costs, could result in a triggering event and, therefore, a possible impairment of our proved crude oil and natural gas properties. If net capitalized costs exceed undiscounted future net cash flows, the measurement of impairment is based on estimated fair value utilizing a future discounted cash flows analysis and is measured by the amount by which the net capitalized costs exceed their fair value. Impairments are included in the consolidated statement of operations line item impairment of crude oil and natural gas properties, with a corresponding impact on accumulated DD&A on the consolidated balance sheet.
Unproved Property Impairment. The acquisition costs of unproved properties are capitalized when incurred, until such properties are transferred to proved properties or charged to expense when expired, impaired or amortized. Unproved crude oil and natural gas properties with individually significant acquisition costs are periodically assessed for impairment. Unproved crude oil and natural gas properties which are not individually significant are amortized, by field, based on our historical experience, acquisition dates and average lease terms. Impairment and amortization charges related to unproved crude oil and natural gas properties are charged to the consolidated statement of operations line item impairment of crude oil and natural gas properties.
Other Property and Equipment.Other property and equipment is carried at cost. Depreciation is provided principally on the straight-line method over the assets' estimated useful lives. We review these long-lived assets for impairment whenever events or changes in circumstances indicate that the carrying amount of an asset may not be recoverable. Recoverability of assets to be held and used is measured by a comparison of the carrying amount of the asset to estimated undiscounted future cash flows expected to be generated by the asset. If the carrying amount of the asset exceeds our estimated future cash flows, an impairment charge is recognized in the amount by which the carrying amount of the asset exceeds the fair value of the asset. No impairment to other property and equipment was recognized in 2013, 2012 or 2011.
The following table presents the estimated useful lives of our other property and equipment:
|
| |
| Pipelines and related facilities | 10 - 17 years |
| Transportation and other equipment | 3 - 20 years |
| Buildings | 20 - 30 years |
Maintenance and repair costs on other property and equipment are charged to expense as incurred. Major renewals and improvements are capitalized and depreciated over the remaining useful life of the asset. Upon the sale or other disposition of assets, the cost and related accumulated DD&A are removed from the accounts, the proceeds are applied thereto and any resulting gain or loss is reflected in income. Total depreciation expense related to other property and equipment was $5.1 million, $4.7 million and $4 million in 2013, 2012 and 2011, respectively.
Capitalized Interest.Interest costs are capitalized as part of the historical cost of acquiring assets. Investments in unproved crude oil and natural gas properties and major development projects, on which DD&A is not currently recorded and on which exploration or development activities are in progress, qualify for capitalization of interest. Major construction projects also qualify for interest capitalization until the asset is ready to be placed into service. Capitalized interest is calculated by multiplying our weighted-average interest rate on our debt outstanding by the qualifying costs. Interest capitalized may not exceed gross interest expense for the period. As the qualifying asset is placed into service, we begin amortizing the related capitalized interest over the useful life of the asset. Capitalized interest totaled $1.9 million, $1.2 million and $1.7 million in 2013, 2012 and 2011, respectively.
Assets Held for Sale. Assets held for sale are valued at the lower of their carrying amount or estimated fair value, less costs to sell. If the carrying amount of the assets exceeds their estimated fair value, an impairment loss is recognized. Fair values are estimated using accepted valuation techniques such as a discounted cash flow model, valuations performed by third parties, earnings multiples or indicative bids, when available. Management considers historical experience and all available information at the time the estimates are made; however, the fair value that is ultimately realized upon the sale of the assets to be divested may differ from the estimated fair values reflected in the consolidated financial statements. DD&A expense is not recorded on assets to be divested once they are classified as held for sale. Assets classified as held for sale are
PDC ENERGY, INC.
NOTES TO CONSOLIDATED FINANCIAL STATEMENTS - Continued
expected to be disposed of within one year. Assets to be divested are classified in the consolidated financial statements as held for sale and the activities of assets to be divested are classified either as discontinued operations or continuing operations. For assets classified as discontinued operations, the results of operations are reclassified from their historical presentation to discontinued operations on the consolidated statements of operations for all periods presented. The gains or losses associated with these divested assets are recorded in discontinued operations on the consolidated statements of operations. Management does not expect any continuing involvement with businesses classified as discontinued operations following their divestiture. For businesses classified as held for sale that do not qualify for discontinued operations treatment, the results of operations continue to be reported in continuing operations.
Production Tax Liability. Production tax liability represents estimated taxes, primarily severance, ad valorem and property, to be paid to the states and counties in which we produce crude oil, natural gas and NGLs, including the production of our affiliated partnerships. Our share of these taxes is expensed to production costs. The partnerships' share, not owned by us, is recognized as a receivable in accounts receivable affiliates on the consolidated balance sheets. The long-term portion of the production tax liability is included in other liabilities on the consolidated balance sheets and was $22.1 million and $18.7 million in December 31, 2013 and 2012, respectively.
Income Taxes. We account for income taxes under the asset and liability method. We recognize deferred tax assets and liabilities for the future tax consequences attributable to operating loss and credit carryforwards and differences between the financial statement carrying amounts of existing assets and liabilities and their respective tax basis. Deferred tax assets and liabilities are measured using enacted tax rates expected to apply to taxable income in the years in which those temporary differences are expected to be recovered or settled. The effect on deferred tax assets and liabilities of a change in tax rates is recognized in income in the period that includes the enactment date. If we determine that it is more likely than not that some portion or all of the deferred tax assets will not be realized, we record a valuation allowance, thereby reducing the deferred tax assets to what we consider realizable. As of December 31, 2013 and 2012, we had no valuation allowance.
Debt Issuance Costs. Debt issuance costs are capitalized and amortized over the life of the respective borrowings using the effective interest method. As of December 31, 2013 and 2012, included in other assets was $16.6 million and $17.4 million, respectively, related to debt issuance costs. The December 31, 2013 amount included $1.3 million in costs related to the issuance of our 3.25% convertible senior notes due 2016, $9.8 million related to our 7.75% senior notes due 2022 and $5.5 million related to our revolving credit facility and the PDCM credit facility. The December 31, 2012 amount included $1.9 million in costs related to the issuance of our 3.25% convertible senior notes due 2016, $10.9 million related to our 7.75% senior notes due 2022 and $4.6 million related to our revolving credit facility and the PDCM credit facility.
Asset Retirement Obligations. We account for asset retirement obligations by recording the fair value of our plugging and abandonment obligations when incurred, which is at the time the well is completed. Upon initial recognition of an asset retirement obligation, we increase the carrying amount of the associated long-lived asset by the same amount as the liability. Over time, the liability is accreted for the change in the present value. The initial capitalized cost, net of salvage value, is depleted over the useful life of the related asset through a charge to DD&A expense. If the fair value of the estimated asset retirement obligation changes, an adjustment is recorded to both the asset retirement obligation and the asset retirement cost. Revisions in estimated liabilities can result from changes in retirement costs or the estimated timing of settling asset retirement obligations. See Note 9, Asset Retirement Obligations, for a reconciliation of the changes in our asset retirement obligation.
Treasury Shares. We record treasury share purchases at cost, which includes incremental direct transaction costs. Amounts are recorded as reductions in shareholders’ equity in the consolidated balance sheets. When we retire treasury shares, we charge any excess of cost over the par value entirely to additional paid-in-capital ("APIC"), to the extent we have amounts in APIC, with any remaining excess cost being charged to retained earnings.
Revenue Recognition. Significant accounting polices related to our revenue recognition are discussed below.
Crude oil, natural gas and NGLs sales. Crude oil, natural gas and NGLs revenues are recognized when production is sold to a purchaser at a fixed or determinable price, delivery has occurred, rights and responsibility of ownership have transferred and collection of revenue is reasonably assured. We currently use the "net-back" method of accounting for transportation and processing arrangements of our sales pursuant to which the transportation and/or processing is provided by or through the purchaser. Under these arrangements, we sell gas at the wellhead and collect a price and recognize revenues based on the wellhead sales price since transportation and processing costs downstream of the wellhead are incurred by the purchasers and reflected in the wellhead price. The majority of our natural gas and NGLs in the Wattenberg Field are sold on a long-term basis, primarily over the life of the lease. Sales of natural gas and NGLs in other regions, along with crude oil, are sold under short-term contracts of less than one year. Virtually all of our contract pricing provisions are tied to a market index, with certain adjustments based on, among other factors, whether a well delivers to a gathering or transmission line and the quality of the natural gas.
Well operations and pipeline income. We are paid a monthly operating fee for each well we operate and the natural gas transported for outside owners, including the affiliated partnerships we sponsor. Well operations and pipeline income is recognized when persuasive evidence of an arrangement exists, the sales price is fixed or determinable, services have been rendered and collection of revenues is reasonably assured.
Natural gas marketing. Natural gas marketing is reported on the gross method of accounting, based on the nature of the agreements between our natural gas marketing subsidiary, RNG, suppliers and customers. RNG purchases gas from many small producers and bundles the gas together for a price advantage to sell in larger amounts to purchasers of natural gas. RNG has latitude in establishing price and discretion in supplier and purchaser selection. Natural gas marketing revenues and expenses reflect the full cost and revenue of those transactions because RNG takes title to the gas it purchases from the various producers and bears the risks and rewards of that ownership. Both the net settlements
PDC ENERGY, INC.
NOTES TO CONSOLIDATED FINANCIAL STATEMENTS - Continued
and net change in fair value of unsettled derivatives of the RNG commodity-based derivative transactions for natural gas marketing are included in sales from or cost of natural gas marketing, as applicable.
Accounting for Acquisitions. We utilize the purchase method to account for acquisitions. Pursuant to purchase method accounting, we allocate the cost of the acquisition to assets acquired and liabilities assumed based upon respective fair values as of the acquisition date. The purchase price allocations are based upon appraisals, discounted cash flows, quoted market prices and estimates by management. When appropriate, we review comparable purchases and sales of crude oil and natural gas properties within the same regions and use that data as a basis for fair market value; for example, the amount at which a willing buyer and seller would enter into an exchange for such properties.
In estimating the fair values of assets acquired and liabilities assumed, we make various assumptions. The most significant assumptions relate to the estimated fair values assigned to proved developed producing, proved developed non-producing, proved undeveloped, unproved crude oil and natural gas properties and other non-crude oil and natural gas properties. To estimate the fair value of these properties, we prepare estimates of crude oil and natural gas reserves. We estimate future prices by using the applicable forward pricing strip to apply to our estimate of reserve quantities acquired, and estimates of future operating and development costs, to arrive at an estimate of future net revenues. For estimated proved reserves, the future net revenues are discounted using a market-based weighted-average cost of capital rate determined appropriate at the time of the acquisition. The market-based weighted-average cost of capital rate is subject to additional project-specific risk factors. To compensate for the inherent risk of estimating and valuing unproved properties, we reduce the discounted future net revenues of probable and possible reserves by additional risk-weighting factors.
We record deferred taxes for any differences between the assigned values and tax basis of assets and liabilities. Estimated deferred taxes are based on available information concerning the tax basis of assets acquired and liabilities assumed and loss carryforwards at the acquisition date, although such estimates may change in the future as additional information becomes known.
Stock-Based Compensation. Stock-based compensation is recognized in our financial statements based on the grant-date fair value of the equity instrument awarded. Stock based compensation expense is recognized in the financial statements on a straight-line basis over the vesting period for the entire award. To the extent compensation cost relates to employees directly involved in crude oil and natural gas exploration and development activities, such amounts may be capitalized to properties and equipment. Amounts not capitalized to properties and equipment are recognized in the related cost and expense line item in the consolidated statement of operations. No amounts for stock-based compensation were capitalized in 2013, 2012 and 2011.
Changes in Internal Control over Financial ReportingRecent Accounting Standards.
DuringRecently Adopted Accounting Standard. On January 1, 2013, we adopted changes issued by the fourth quarterFinancial Accounting Standards Board ("FASB") regarding the disclosure of offsetting assets and liabilities. These changes require an entity to disclose both gross and net information about both instruments and transactions eligible for offset in the statement of financial position and instruments and transactions subject to an enforceable master netting arrangement or similar agreement. The enhanced disclosures enable users of an entity’s financial statements to understand and evaluate the effect or potential effect of master netting arrangements on the entity’s financial position, including the effect or potential effect of rights of setoff associated with certain financial instruments and derivative instruments. Adoption of these changes had no impact on the consolidated financial statements, except for additional disclosures.
Recently Issued Accounting Standard. 2012, we made no changes inOn July 18, 2013, the FASB issued an update to accounting for income taxes. The update provides clarification on the presentation of an unrecognized tax benefit when a net operating loss carryforward, a similar tax loss or a tax credit carryforward exists. The update is effective for public entities for fiscal years, and interim periods within those years, beginning after December 15, 2013. Early adoption is permitted. We are currently evaluating the impact of adopting this update on our internal control over financial reporting (as such term is defined in Rules 13a-15(f) and 15d-15(f) of the Exchange Act) thatstatements, but do not believe it will have materially affected or are reasonably likely to materially affect our internal control over financial reporting.a material impact.
ITEM 9B. OTHER INFORMATIONNOTE 3 - FAIR VALUE OF FINANCIAL INSTRUMENTS
None.Derivative Financial Instruments
Determination of fair value. Our fair value measurements are estimated pursuant to a fair value hierarchy that requires us to maximize the use of observable inputs and minimize the use of unobservable inputs when measuring fair value. The valuation hierarchy is based upon the transparency of inputs to the valuation of an asset or liability as of the measurement date, giving the highest priority to quoted prices in active markets (Level 1) and the lowest priority to unobservable data (Level 3). In some cases, the inputs used to measure fair value might fall in different levels of the fair value hierarchy. The lowest level input that is significant to a fair value measurement in its entirety determines the applicable level in the fair value hierarchy. Assessing the significance of a particular input to the fair value measurement in its entirety requires judgment, considering factors specific to the asset or liability, and may affect the valuation of the assets and liabilities and their placement within the fair value hierarchy levels. The three levels of inputs that may be used to measure fair value are defined as:
Level 1 – Quoted prices (unadjusted) for identical assets or liabilities in active markets.
Level 2 – Inputs other than quoted prices included within Level 1 that are either directly or indirectly observable for the asset or liability, including quoted prices for similar assets or liabilities in active markets, quoted prices for identical or similar assets or liabilities in
PDC ENERGY, INC.
NOTES TO CONSOLIDATED FINANCIAL STATEMENTS - Continued
PART IIIinactive markets, inputs other than quoted prices that are observable for the asset or liability and inputs that are derived from observable market data by correlation or other means.
Level 3 – Unobservable inputs for the asset or liability, including situations where there is little, if any, market activity.
Derivative Financial Instruments. We measure the fair value of our derivative instruments based on a pricing model that utilizes market-based inputs, including, but not limited to, the contractual price of the underlying position, current market prices, crude oil and natural gas forward curves, discount rates such as the LIBOR curve for a similar duration of each outstanding position, volatility factors and nonperformance risk. Nonperformance risk considers the effect of our credit standing on the fair value of derivative liabilities and the effect of our counterparties' credit standings on the fair value of derivative assets. Both inputs to the model are based on published credit default swap rates and the duration of each outstanding derivative position.
We validate our fair value measurement through the review of counterparty statements and other supporting documentation, the determination that the source of the inputs is valid, the corroboration of the original source of inputs through access to multiple quotes, if available, or other information and monitoring changes in valuation methods and assumptions. While we use common industry practices to develop our valuation techniques and believe our valuation method is appropriate and consistent with those used by other market participants, changes in our pricing methodologies or the underlying assumptions could result in significantly different fair values.
Our fixed-price swaps, basis swaps and physical purchases are included in Level 2 and our crude oil and natural gas collars, natural gas calls and physical sales are included in Level 3. The following table presents, for each applicable level within the fair value hierarchy, our derivative assets and liabilities, including both current and non-current portions, measured at fair value on a recurring basis:
|
| | | | | | | | | | | | | | | | | | | | | | | |
| | As of December 31, |
| | 2013 | | 2012 |
| | Significant Other
Observable
Inputs
(Level 2) | | Significant
Unobservable
Inputs
(Level 3) | | Total | | Significant Other
Observable
Inputs
(Level 2) | | Significant
Unobservable
Inputs
(Level 3) | | Total |
| | (in thousands) |
| Assets: | | | | | | | | | | | |
| Commodity-based derivative contracts | $ | 5,325 |
| | $ | 2,385 |
| | $ | 7,710 |
| | $ | 42,798 |
| | $ | 15,750 |
| | $ | 58,548 |
|
| Basis protection derivative contracts | 463 |
| | — |
| | 463 |
| | 377 |
| | — |
| | 377 |
|
| Total assets | 5,788 |
| | 2,385 |
| | 8,173 |
| | 43,175 |
| | 15,750 |
| | 58,925 |
|
| Liabilities: | | | | | | | | | | | |
| Commodity-based derivative contracts | 17,537 |
| | 988 |
| | 18,525 |
| | 9,839 |
| | 2,081 |
| | 11,920 |
|
| Basis protection derivative contracts | 5 |
| | — |
| | 5 |
| | 16,656 |
| | — |
| | 16,656 |
|
| Total liabilities | 17,542 |
| | 988 |
| | 18,530 |
| | 26,495 |
| | 2,081 |
| | 28,576 |
|
| Net asset (liability) | $ | (11,754 | ) | | $ | 1,397 |
| | $ | (10,357 | ) | | $ | 16,680 |
| | $ | 13,669 |
| | $ | 30,349 |
|
| | | | | | | | | | | | |
PDC ENERGY, INC.
NOTES TO CONSOLIDATED FINANCIAL STATEMENTS - Continued
The following table presents a reconciliation of our Level 3 assets measured at fair value:
|
| | | | | | | | | | | | |
| | 2013 | | 2012 | | 2011 |
| | (in thousands) |
| | | | | | |
| Fair value, net asset, beginning of period | | $ | 13,669 |
| | $ | 22,107 |
| | $ | 10,762 |
|
| Changes in fair value included in statement of operations line item: | | | | | | |
| Commodity price risk management gain (loss), net | | (1,521 | ) | | 7,576 |
| | 13,487 |
|
| Sales from natural gas marketing | | 13 |
| | 63 |
| | 114 |
|
| Changes in fair value included in balance sheet line item (1): | | | | | | |
| Accounts receivable affiliates | | — |
| | — |
| | 49 |
|
| Accounts payable affiliates | | — |
| | (319 | ) | | (454 | ) |
| Settlements included in statement of operations line items: | | | | | | |
| Commodity price risk management gain (loss), net | | (6,361 | ) | | (15,644 | ) | | (1,712 | ) |
| Sales from natural gas marketing | | (37 | ) | | (114 | ) | | (139 | ) |
| Income (loss) from discontinued operations, net of tax | | (4,366 | ) | | — |
| | — |
|
| Fair value, net asset end of period | | $ | 1,397 |
| | $ | 13,669 |
| | $ | 22,107 |
|
| | | | | | |
| Net change in fair value of unsettled derivatives included in statement of operations line item: | | | | | | |
| Commodity price risk management gain (loss), net | | $ | (1,032 | ) | | $ | 3,665 |
| | $ | 11,669 |
|
| Sales from natural gas marketing | | 4 |
| | 1 |
| | (3 | ) |
| Total | | $ | (1,028 | ) | | $ | 3,666 |
| | $ | 11,666 |
|
| | | | | | |
__________
| |
| (1) | Represents the change in fair value related to derivative instruments entered into by us and designated to our affiliated partnerships. |
The significant unobservable input used in the fair value measurement of our derivative contracts is the implied volatility curve, which is provided by a third-party vendor. A significant increase or decrease in the implied volatility, in isolation, would have a directionally similar effect resulting in a significantly higher or lower fair value measurement of our Level 3 derivative contracts.
Non-Derivative Financial Assets and Liabilities
The carrying value of the financial instruments included in current assets and current liabilities approximate fair value due to the short-term maturities of these instruments.
The liability associated with our non-qualified deferred compensation plan for non-employee directors may be settled in cash or shares of our common stock. The carrying value of this obligation is based on the quoted market price of our common stock, which is a Level 1 input.
The portion of our long-term debt related to our revolving credit facility, as well as our proportionate share of PDCM's credit facility, approximates fair value due to the variable nature of related interest rates. We have not elected to account for the portion of our long-term debt related to our senior notes under the fair value option; however, as of December 31, 2013, we estimate the fair value of the portion of our long-term debt related to the 3.25% convertible senior notes due 2016 to be $165.4 million, or 143.9% of par value, and the portion related to our 7.75% senior notes due 2022 to be $543.1 million, or 108.6% of par value. We determined these valuations based upon measurements of trading activity and broker and/or dealer quotes, respectively, which are published market prices, and therefore are Level 2 inputs.
See Note 2, Summary of Significant Accounting Policies - Properties and Equipment, Crude Oil and Natural Gas Properties and Asset Retirement Obligations, for a discussion of how we determined fair value for these assets and liabilities.
ITEM 10. DIRECTORS, EXECUTIVE OFFICERS AND CORPORATE GOVERNANCENOTE 4 - DERIVATIVE FINANCIAL INSTRUMENTS
Information relatingOur results of operations and operating cash flows are affected by changes in market prices for crude oil, natural gas and NGLs. To manage a portion of our exposure to this Itemprice volatility from producing crude oil and natural gas, we utilize the following economic hedging strategies for each of our business segments.
For crude oil and natural gas sales, we enter into derivative contracts to protect against price declines in future periods. While we structure these derivatives to reduce our exposure to changes in price associated with the derivative commodity, they also limit the benefit we might otherwise have received from price increases in the physical market; and
For natural gas marketing, we enter into fixed-price physical purchase and sale agreements that qualify as derivative contracts. In order to offset the fixed-price physical derivatives in our natural gas marketing, we enter into financial derivative instruments
that have the effect of locking in the prices we will be included in an amendment to this reportreceive or pay for the proxy statementsame volumes and period, offsetting the physical derivative.
We believe our derivative instruments continue to be filed pursuanteffective in achieving the risk management objectives for which they were intended. As of December 31, 2013, we had derivative instruments in place for a portion of our anticipated production through 2017 for a total of 59,971 BBtu of natural gas and 8,613 MBbls of crude oil.
As of December 31, 2013, our derivative instruments were comprised of commodity swaps, collars, basis protection swaps and physical sales and purchases.
Collars contain a fixed floor price and ceiling price (call). If the index price falls below the fixed put strike price, we receive the market price from the purchaser and receive the difference between the put strike price and index price from the counterparty. If the index price exceeds the fixed call strike price, we receive the market price from the purchaser and pay the difference between the call strike price and index price to Regulation 14Athe counterparty. If the index price is between the put and call strike price, no payments are due to or from the counterparty;
Swaps are arrangements that guarantee a fixed price. If the index price is below the fixed contract price, we receive the market price from the purchaser and receive the difference between the index price and the fixed contract price from the counterparty. If the index price is above the fixed contract price, we receive the market price from the purchaser and pay the difference between the index price and the fixed contract price to the counterparty. If the index price and contract price are the same, no payment is due to or from the counterparty;
Basis protection swaps are arrangements that guarantee a price differential for natural gas from a specified delivery point. For CIG-basis protection swaps and TCO-basis protection swaps, which currently have negative differentials to NYMEX, we receive a payment from the counterparty if the price differential is greater than the stated terms of the contract and pay the counterparty if the price differential is less than the stated terms of the contract. If the market price and contract price are the same, no payment is due to or from the counterparty; and
Physical sales and purchases are derivatives for fixed-priced physical transactions where we sell or purchase third-party supply at fixed rates. These physical derivatives are offset by financial swaps: for a physical sale the offset is a swap purchase and for a physical purchase the offset is a swap sale.
PDC ENERGY, INC.
NOTES TO CONSOLIDATED FINANCIAL STATEMENTS - Continued
The following table presents the location and fair value amounts of our derivative instruments on the consolidated balance sheets as of December 31, 2013 Annual Stockholders' meeting and 2012:
|
| | | | | | | | | | | |
| Derivatives instruments: | | Balance sheet line item | | 2013 | | 2012 |
| | | | | | (in thousands) |
| Derivative assets: | Current | | | | | | |
| | Commodity contracts | | | | | | |
| | Related to crude oil and natural gas sales | | Fair value of derivatives | | $ | 2,016 |
| | $ | 46,657 |
|
| | Related to affiliated partnerships (1) | | Fair value of derivatives | | — |
| | 4,707 |
|
| | Related to natural gas marketing | | Fair value of derivatives | | 361 |
| | 319 |
|
| | Basis protection contracts | | | | | | |
| | Related to crude oil and natural gas sales | | Fair value of derivatives | | 195 |
| | 359 |
|
| | | | | | 2,572 |
| | 52,042 |
|
| | Non Current | | | | | | |
| | Commodity contracts | | | | | | |
| | Related to crude oil and natural gas sales | | Fair value of derivatives | | 5,055 |
| | 6,653 |
|
| | Related to natural gas marketing | | Fair value of derivatives | | 278 |
| | 212 |
|
| | Basis protection contracts | | | | | | |
| | Related to crude oil and natural gas sales | | Fair value of derivatives | | 268 |
| | 18 |
|
| | | | | | 5,601 |
| | 6,883 |
|
| Total derivative assets | | | | | $ | 8,173 |
| | $ | 58,925 |
|
| | | | | | | | |
| Derivative liabilities: | Current | | | | | | |
| | Commodity contracts | | | | | | |
| | Related to crude oil and natural gas sales | | Fair value of derivatives | | $ | 15,263 |
| | $ | 1,698 |
|
| | Related to natural gas marketing | | Fair value of derivatives | | 247 |
| | 226 |
|
| | Basis protection contracts | | | | | | |
| | Related to crude oil and natural gas sales | | Fair value of derivatives | | — |
| | 14,375 |
|
| | Related to affiliated partnerships (2) | | Fair value of derivatives | | — |
| | 2,140 |
|
| | Related to natural gas marketing | | Fair value of derivatives | | 5 |
| | — |
|
| | | | | | 15,515 |
| | 18,439 |
|
| | Non Current | | | | | | |
| | Commodity contracts | | | | | | |
| | Related to crude oil and natural gas sales | | Fair value of derivatives | | 2,782 |
| | 9,828 |
|
| | Related to natural gas marketing | | Fair value of derivatives | | 233 |
| | 168 |
|
| | Basis protection contracts | | | | | | |
| | Related to crude oil and natural gas sales | | Fair value of derivatives | | — |
| | 141 |
|
| | | | | | 3,015 |
| | 10,137 |
|
| Total derivative liabilities | | | | | $ | 18,530 |
| | $ | 28,576 |
|
__________
| |
| (1) | Represents derivative positions designated to our affiliated partnerships. Accordingly, our accompanying consolidated balance sheets include a corresponding payable to our affiliated partnerships representing their proportionate share of the derivative assets. |
| |
| (2) | Represents derivative positions designated to our affiliated partnerships. Accordingly, our accompanying consolidated balance sheets include a corresponding receivable from our affiliated partnerships representing their proportionate share of the derivative liabilities. |
PDC ENERGY, INC.
NOTES TO CONSOLIDATED FINANCIAL STATEMENTS - Continued
The following table presents the impact of our derivative instruments on our consolidated statements of operations:
|
| | | | | | | | | | | | |
| | Year Ended December 31, |
| Consolidated statement of operations line item | | 2013 | | 2012 | | 2011 |
| | |
| Commodity price risk management gain (loss), net | | | | | | |
| Net settlements | | $ | 12,913 |
| | $ | 49,416 |
| | $ | 17,243 |
|
| Net change in fair value of unsettled derivatives | | (36,818 | ) | | (17,077 | ) | | 28,847 |
|
| Total commodity price risk management gain (loss), net | | $ | (23,905 | ) | | $ | 32,339 |
| | $ | 46,090 |
|
| Sales from natural gas marketing | | | | | | |
| Net settlements | | $ | 446 |
| | $ | 2,170 |
| | $ | 2,970 |
|
| Net change in fair value of unsettled derivatives | | 429 |
| | (1,658 | ) | | (161 | ) |
| Total sales from natural gas marketing | | $ | 875 |
| | $ | 512 |
| | $ | 2,809 |
|
| Cost of natural gas marketing | | | | | | |
| Net settlements | | $ | (257 | ) | | $ | (2,029 | ) | | $ | (2,571 | ) |
| Net change in fair value of unsettled derivatives | | (412 | ) | | 1,601 |
| | (85 | ) |
| Total cost of natural gas marketing | | $ | (669 | ) | | $ | (428 | ) | | $ | (2,656 | ) |
| | | | | | |
All of our financial derivative agreements contain master netting provisions that provide for the net settlement of all contracts through a single payment in the event of early termination. Our fixed-price physical purchase and sale agreements that qualify as derivative contracts are not subject to master netting provisions and are not significant. We have elected not to offset the fair value positions recorded on our consolidated balance sheets.
The following table reflects the impact of netting agreements on gross derivative assets and liabilities as of December 31, 2013 and 2012:
|
| | | | | | | | | | | | |
| As of December 31, 2013 | | Derivatives instruments, recorded in consolidated balance sheet, gross | | Effect of master netting agreements | | Derivative instruments, net |
| | | (in thousands) |
| Asset derivatives: | | | | | | |
| Derivative instruments, at fair value | | $ | 8,173 |
| | $ | (5,623 | ) | | $ | 2,550 |
|
| | | | | | | |
| Liability derivatives: | | | | | | |
| Derivative instruments, at fair value | | $ | 18,530 |
| | $ | (5,623 | ) | | $ | 12,907 |
|
| | | | | | | |
|
| | | | | | | | | | | | |
| As of December 31, 2012 | | Derivatives instruments, recorded in consolidated balance sheet, gross | | Effect of master netting agreements | | Derivative instruments, net |
| | | (in thousands) |
| Asset derivatives: | | | | | | |
| Derivative instruments, at fair value | | $ | 58,925 |
| | $ | (11,437 | ) | | $ | 47,488 |
|
| | | | | | | |
| Liability derivatives: | | | | | | |
| Derivative instruments, at fair value | | $ | 28,576 |
| | $ | (11,437 | ) | | $ | 17,139 |
|
| | | | | | | |
PDC ENERGY, INC.
NOTES TO CONSOLIDATED FINANCIAL STATEMENTS - Continued
NOTE 5 - CONCENTRATION OF RISK
Accounts Receivable. The following table presents the components of accounts receivable, net of allowance for doubtful accounts:
|
| | | | | | | |
| | As of December 31, |
| | 2013 | | 2012 |
| | (in thousands) |
| | | | |
| Crude oil, natural gas and NGLs sales | $ | 66,257 |
| | $ | 39,837 |
|
| Joint interest billings | 20,558 |
| | 6,896 |
|
| Natural gas marketing | 6,210 |
| | 8,209 |
|
| Reimbursements for title defects | — |
| | 7,579 |
|
| Other | 2,321 |
| | 3,385 |
|
| Allowance for doubtful accounts | (1,261 | ) | | (1,026 | ) |
| Accounts receivable, net | $ | 94,085 |
| | $ | 64,880 |
|
| | | | |
Our accounts receivable primarily relates to sales of our crude oil, natural gas and NGLs production, derivative counterparties and other third parties that own working interests in the properties we operate. Inherent to our industry is incorporatedthe concentration of crude oil, natural gas and NGLs sales to a limited number of customers. This concentration has the potential to impact our overall exposure to credit risk in that our customers may be similarly affected by referencechanges in this report.economic and financial conditions, commodity prices or other conditions. We record an allowance for doubtful accounts representing our best estimate of probable losses from our existing accounts receivable. In making our estimate, we consider, among other things, our historical write-offs and overall creditworthiness of our customers. Further, consideration is given to well production data for receivables related to well operations. Our estimate of uncollectible amounts changes periodically. For the each of the years in the three-year period ended December 31, 2013, amounts written off to allowance for doubtful accounts were not material. As of December 31, 2013, we had twocustomers representing 10% or greater of our accounts receivable balance: Suncor Energy Marketing and DCP Midstream, representing 26.3% and 10.8%, respectively, of our accounts receivable balance. The $7.6 million of accounts receivable at December 31, 2012 related to reimbursements for title defects discovered subsequent to closing of the Merit Acquisition. The reimbursement was received in January 2013.
Major Customers. The following table presents the individual customers constituting 10% or more of total revenues:
|
| | | | | | | | | |
| | | Year Ended December 31, |
| Customer | | 2013 | | 2012 | | 2011 |
| | | | | | | |
| Suncor Energy Marketing, Inc. | | 31.3 | % | | 29.8 | % | | 25.7 | % |
| DCP Midstream, LP | | 14.6 | % | | 12.2 | % | | 11.5 | % |
Derivative Counterparties. A significant portion of our liquidity is concentrated in derivative instruments that enable us to manage a portion of our exposure to price volatility from producing crude oil and natural gas. These arrangements expose us to credit risk of nonperformance by our counterparties. We primarily use financial institutions who are also major lenders under our revolving credit facility as counterparties to our derivative contracts. To date, we have had no derivative counterparty default losses. We have evaluated the credit risk of our derivative assets from our counterparties using relevant credit market default rates, giving consideration to amounts outstanding for each counterparty and the duration of each outstanding derivative position. Based on our evaluation, we have determined that the potential impact of nonperformance of our current counterparties on the fair value of our derivative instruments is not significant.
PDC ENERGY, INC.
NOTES TO CONSOLIDATED FINANCIAL STATEMENTS - Continued
The following table presents the counterparties that expose us to credit risk as of December 31, 2013, with regard to our derivative assets:
|
| | | | |
| | Fair Value of
Derivative Assets |
| Counterparty Name | | As of December 31, 2013 |
| | | (in thousands) |
| | | |
| Wells Fargo Bank, N.A. (1) | | $ | 2,496 |
|
| Bank of Montreal (1) | | 1,102 |
|
| Canadian Imperial Bank of Commerce (1) | | 1,054 |
|
| Other lenders in our revolving credit facility | | 3,380 |
|
| Various (2) | | 141 |
|
| Total | | $ | 8,173 |
|
| | | |
____________
(1)Major lender in our revolving credit facility. See Note 8, Long-Term Debt.
(2)Represents a total of 19 counterparties.
ITEM 11. EXECUTIVE COMPENSATION
Information relating to this Item will be included in an amendment to this report or the proxy statement to be filed pursuant to Regulation 14A for our 2013 Annual Stockholders' meeting and is incorporated by reference in this report.
ITEM 12. SECURITY OWNERSHIP OF CERTAIN BENEFICIAL OWNERSNOTE 6 - PROPERTIES AND MANAGEMENT AND RELATED STOCKHOLDER MATTERSEQUIPMENT
InformationThe following table presents the components of properties and equipment, net of accumulated DD&A:
|
| | | | | | | |
| | As of December 31, |
| | 2013 | | 2012 |
| | (in thousands) |
| Properties and equipment, net: | | | |
| Crude oil and natural gas properties | | | |
| Proved | $ | 1,781,681 |
| | $ | 2,075,924 |
|
| Unproved | 307,203 |
| | 319,327 |
|
| Total crude oil and natural gas properties | 2,088,884 |
| | 2,395,251 |
|
| Pipelines and related facilities | 21,781 |
| | 47,786 |
|
| Equipment and other | 29,246 |
| | 34,858 |
|
| Land and buildings | 13,617 |
| | 14,935 |
|
| Construction in progress | 53,810 |
| | 67,217 |
|
| Gross properties and equipment | 2,207,338 |
| | 2,560,047 |
|
| Accumulated DD&A | (553,893 | ) | | (943,341 | ) |
| Properties and equipment, net | $ | 1,653,445 |
| | $ | 1,616,706 |
|
| | | | |
The following table presents impairment charges recorded for crude oil and natural gas properties:
|
| | | | | | | | | | | |
| | Year Ended December 31, |
| | 2013 | | 2012 | | 2011 |
| | (in thousands) |
| Continuing operations: | | | | | |
| Impairment of proved properties | $ | 48,750 |
| | $ | — |
| | $ | — |
|
| Impairment of individually significant unproved properties | 1,082 |
| | 1,629 |
| | 1,108 |
|
| Amortization of individually insignificant unproved properties | 3,603 |
| | 4,266 |
| | 1,193 |
|
| Total continuing operations | 53,435 |
| | 5,895 |
| | 2,301 |
|
| Discontinued operations: | | | | | |
| Impairment of proved properties | — |
| | 161,185 |
| | 22,460 |
|
| Impairment of individually significant unproved properties | — |
| | 313 |
| | — |
|
| Amortization of individually insignificant unproved properties | 3 |
| | 756 |
| | 398 |
|
| Total discontinued operations | 3 |
| | 162,254 |
| | 22,858 |
|
| Total impairment of crude oil and natural gas properties | $ | 53,438 |
| | $ | 168,149 |
| | $ | 25,159 |
|
| | | | | | |
PDC ENERGY, INC.
NOTES TO CONSOLIDATED FINANCIAL STATEMENTS - Continued
In the first quarter of 2013, we recognized an impairment charge of approximately $45.0 million related to all of our shallow Upper Devonian (non-Marcellus Shale) Appalachian Basin producing properties located in West Virginia and Pennsylvania owned directly by us, as well as through our proportionate share of PDCM. The impairment charge represented the excess of the carrying value of the assets over the estimated fair value, less cost to sell. The fair value of the assets was determined based upon estimated future cash flows from unrelated third-party bids, a Level 3 input. Pursuant to a purchase and sale agreement entered into in October 2013, we determined that the carrying value of the above-mentioned properties exceeded the transaction sales price, a Level 3 input, less costs to sell. As a result, we recognized an additional impairment charge of approximately $3.8 million in the third quarter of 2013 to reduce the carrying value of the net assets to reflect the current net sales price. The impairment charge was included in the consolidated statement of operations line item impairment of crude oil and natural gas properties. See Note 14, Assets Held for Sale, Divestitures and Discontinued Operations, for additional information regarding these properties.
In 2012, we recognized an impairment charge of $161.2 million to write-down our Piceance Basin proved oil and natural gas properties to fair value. The fair value was based on estimated future cash flows from an unrelated third-party bid, a Level 3 input. The impairment charge was included in the consolidated statement of operations line item impairment of crude oil and natural gas properties.
In 2011, we recognized an impairment charge of $22.5 million to write-down our NECO assets to fair value. The fair value was based on unrelated third-party bids, a Level 3 input. The impairment charge was included in the consolidated statement of operations line item impairment of crude oil and natural gas properties.
Suspended Well Costs
The following table presents the capitalized exploratory well costs pending determination of proved reserves, and included in properties and equipment on the consolidated balance sheets:
|
| | | | | | | | | | | |
| 2013 | | 2012 | | 2011 |
| (in thousands, except for number of wells) |
| | | | | |
| Balance beginning of year, January 1, | $ | 19,567 |
| | $ | 4,432 |
| | $ | 2,297 |
|
| Additions to capitalized exploratory well costs pending the determination of proved reserves | 13,424 |
| | 30,482 |
| | 3,692 |
|
| Reclassifications to wells, facilities and equipment based on the determination of proved reserves | (32,991 | ) | | — |
| | (1,557 | ) |
| Capitalized exploratory well costs charged to expense | — |
| | (15,347 | ) | | — |
|
| Balance end of year, December 31, | $ | — |
| | $ | 19,567 |
| | $ | 4,432 |
|
| | | | | |
| Number of wells pending determination at December 31, | — |
| | 2 |
| | 6 |
|
| | | | | | |
As of December 31, 2013, none of our wells pending determination were classified as exploratory wells.
Additions to capitalized exploratory well costs pending determination of proved reserves increased in 2012 as compared to 2011 as we increased our exploratory drilling activities in the Utica Shale play. In 2012, capitalized well costs related to two vertical stratigraphic test wells in southeastern Ohio were expensed at a cost of $12.2 million. Additionally, three Rose Run test wells in Ohio and a well in southeast Colorado were determined to have noncommercial quantities of hydrocarbons and were expensed at a cost of $1.2 million and $0.9 million, respectively.
The following table presents an aging of capitalized exploratory well costs based on the date that drilling commenced and the number of projects for which exploratory well costs have been capitalized for a period greater than one year since the commencement of drilling:
|
| | | | | | | |
| | As of December 31, |
| | 2012 | | 2011 |
| | (in thousands) |
| | | | |
| Exploratory well costs capitalized for a period of one year or less | $ | 19,567 |
| | $ | 3,587 |
|
| Exploratory well costs capitalized for a period greater than one year since commencement of drilling | — |
| | 845 |
|
| Balance end of year, December 31, | $ | 19,567 |
| | $ | 4,432 |
|
| Number of projects with exploratory well costs that have been capitalized for a period greater than one year since commencement of drilling | — |
| | 2 |
|
PDC ENERGY, INC.
NOTES TO CONSOLIDATED FINANCIAL STATEMENTS - Continued
NOTE 7 - INCOME TAXES
The table below presents the components of our provision for income taxes from continuing operations for the years presented:
|
| | | | | | | | | | | |
| | Year Ended December 31, |
| | 2013 | | 2012 | | 2011 |
| | (in thousands) |
| Current: | | | | | |
| Federal | $ | 1,355 |
| | $ | — |
| | $ | 2,594 |
|
| State | 199 |
| | (199 | ) | | 750 |
|
| Total current income taxes | 1,554 |
| | (199 | ) | | 3,344 |
|
| Deferred: | | | | | |
| Federal | 11,145 |
| | 12,133 |
| | (13,309 | ) |
| State | 2,098 |
| | 767 |
| | (1,835 | ) |
| Total deferred income taxes | 13,243 |
| | 12,900 |
| | (15,144 | ) |
| Income tax benefit (expense) from continuing operations | $ | 14,797 |
| | $ | 12,701 |
| | $ | (11,800 | ) |
| | | | | | |
In 2012 and 2011, we continued to utilize tax deferral strategies such as bonus depreciation, accelerated depreciation and intangible drilling cost expense elections to minimize our current taxes. As a result of these elections and deferral strategies, we generated federal and state net operating losses (“NOLs”) in 2012 and 2011. In 2013 we limited our deferral strategies to only the continued utilization of accelerated depreciation in an effort to utilize our federal NOLs. The majority of our federal NOLs and some of our state NOLs, except for Colorado due to statutory limits, are being utilized in 2013 to offset the 2013 taxable gain on the sale of our non-core Colorado assets. See Note 14, Assets Held for Sale, Divestitures and Discontinued Operations, for additional information regarding the sale of our non-core Colorado assets. The remaining federal NOLs and state NOLs will be carried forward to offset taxable income in 2014 or prospective years.
The following table presents a reconciliation of the statutory rate to the effective tax rate related to our provision for income taxes from continuing operations:
|
| | | | | | | | |
| | Year Ended December, 31, |
| | 2013 | | 2012 | | 2011 |
| | | | | | |
| Statutory tax rate | 35.0 | % | | 35.0 | % | | 35.0 | % |
| State income tax, net | 3.3 |
| | 1.0 |
| | 2.0 |
|
| Percentage depletion | 1.8 |
| | 1.9 |
| | (2.5 | ) |
| Non-deductible compensation | (3.4 | ) | | (0.5 | ) | | — |
|
| Non-deductible meals and entertainment | (0.5 | ) | | (0.5 | ) | | 0.3 |
|
| State deferred rate change | — |
| | — |
| | 1.3 |
|
| Unrecognized tax benefits | (0.1 | ) | | — |
| | (2.6 | ) |
| Federal return examination adjustments | — |
| | — |
| | 0.4 |
|
| Return to provision adjustments | (0.5 | ) | | — |
| | 0.3 |
|
| Other | 0.3 |
| | — |
| | 0.1 |
|
| Effective tax rate | 35.9 | % | | 36.9 | % | | 34.3 | % |
| | | | | | |
PDC ENERGY, INC.
NOTES TO CONSOLIDATED FINANCIAL STATEMENTS - Continued
The tax effects of temporary differences that give rise to significant portions of the deferred tax assets and deferred tax liabilities at December 31, 2013 and 2012 are presented below:
|
| | | | | | | |
| | As of December 31, |
| | 2013 | | 2012 |
| | (in thousands) |
| Deferred tax assets: | | | |
| Net change in fair value of unsettled derivatives | $ | 6,205 |
| | $ | — |
|
| Deferred compensation | 8,507 |
| | 7,216 |
|
| Asset retirement obligations | 11,630 |
| | 10,325 |
|
| State NOL and tax credit carryforwards, net | 5,182 |
| | 6,117 |
|
| Percentage depletion - carryforward | 4,570 |
| | 4,702 |
|
| Alternative minimum tax - credit carryforward | 3,165 |
| | 2,351 |
|
| Federal NOL carryforward | 4,601 |
| | 21,281 |
|
| Other | 6,229 |
| | 2,276 |
|
| Deferred tax assets | 50,089 |
| | 54,268 |
|
| | | | |
| Deferred tax liabilities: | | | |
| Properties and equipment | 120,746 |
| | 122,742 |
|
| Investment in PDCM | 21,962 |
| | 31,445 |
|
| Net change in fair value of unsettled derivatives | — |
| | 7,163 |
|
| Convertible debt | 3,774 |
| | 5,194 |
|
| Total gross deferred tax liabilities | 146,482 |
| | 166,544 |
|
| Net deferred tax liability | $ | 96,393 |
| | $ | 112,276 |
|
| | | | |
| Classification in the consolidated balance sheets: | | | |
| Deferred income tax assets | $ | 22,374 |
| | $ | 36,151 |
|
| Deferred income tax liability | 118,767 |
| | 148,427 |
|
| Net deferred tax liability | $ | 96,393 |
| | $ | 112,276 |
|
| | | | |
Deferred tax assets decreased primarily due to the utilization of a significant portion of our federal NOL carryforward in 2013. This decrease was partially offset by the addition of the deferred tax asset associated with the unrealized tax loss for the fair value of unsettled derivatives.
Deferred tax liabilities for properties and equipment remained relatively unchanged in 2013 primarily as a result of our tax gain on the sale of our non-core Colorado properties and equipment being offset by our continued use of statutory provisions for accelerated amortization of intangible drilling costs and accelerated tax depreciation. The deferred tax liability associated with our investment in PDCM decreased due to PDCM’s sale of its shallow Devonian assets. In addition, the fair value of derivatives at December 31, 2013 resulted in an unrealized tax loss versus an unrealized tax gain at December 31, 2012.
As of December 31, 2013, we have state NOL carryforwards of $136.1 million that begin to expire in 2030, state credit carryforwards of $1.1 million that begin to expire in 2023 and federal NOL carryforwards of $13.6 million that will expire in 2032. Approximately $0.2 million of excess tax benefits relating to this Itemstock-based compensation that are a component of our NOL carryforwards, when realized, will be includedcredited to APIC.
Unrecognized tax benefits were immaterial for each of the years in an amendmentthe three-year period ended December 31, 2013. Interest and penalties related to this reportuncertain tax positions are recognized in income tax expense. Accrued interest and penalties related to uncertain tax positions were immaterial for each of the years in the three-year period ended December 31, 2013. The total amount of unrecognized tax benefits that would affect the effective tax rate, if recognized, was $0.1 million as of December 31, 2013 and $0.2 million as of December 31, 2012. As of December 31, 2013, we expect a decrease in the unrecognized tax benefit in the next twelve months due to the expiration of the relevant statute of limitations. During 2013, we reduced our liability for any uncertain tax benefits, of which the remaining balance is related to our state tax filings, due to the expiration of the relevant statute of limitations. The statute of limitations for most of our state tax jurisdictions is open from 2009 forward.
In accordance with the CAP program, the IRS completed its “post filing review” of our 2011 tax return in January 2013 and they are currently completing their “post filing review” of our 2012 tax return. We have been issued a “no change” letter for both of the reviewed tax years. The CAP audit employs a real-time review of our books and tax records by the IRS that is intended to permit issue resolution prior to, or shortly after, the proxy statement to be filed pursuant to Regulation 14Afiling of the tax returns. We are currently participating in the CAP program for the review of our 2013 tax year and we have been invited and have accepted continued participation in the program for our 2014 tax year. Participation in the CAP program has enabled us
PDC ENERGY, INC.
NOTES TO CONSOLIDATED FINANCIAL STATEMENTS - Continued
to currently have no uncertain tax benefits associated with our federal tax return filings. During 2011, we reduced our liability for uncertain tax benefits by $0.8 million due to the accelerated examination and settlement of our 2007-2009 tax years upon entering the CAP program.
As of December 31, 2013, Annual Stockholders' meetingwe were current with our income tax filings in all applicable state jurisdictions. In 2013, the State of Colorado examined our 2008 through 2011 Colorado Corporate Income Tax Returns and is incorporated by reference in this report.proposed no adjustments.
ITEM 13. CERTAIN RELATIONSHIPS AND RELATED TRANSACTIONS AND DIRECTOR INDEPENDENCENOTE 8 - LONG-TERM DEBT
Information relatingLong-term debt consists of the following:
|
| | | | | | | |
| | As of December 31, |
| | 2013 | | 2012 |
| | (in thousands) |
| Senior notes: | | | |
| 3.25% Convertible senior notes due 2016: | | | |
| Principal amount | $ | 115,000 |
| | $ | 115,000 |
|
| Unamortized discount | (10,010 | ) | | (13,671 | ) |
| 3.25% Convertible senior notes due 2016, net of discount | 104,990 |
| | 101,329 |
|
| 7.75% Senior notes due 2022: | | | |
| 7.75% Senior notes due 2022 | 500,000 |
| | 500,000 |
|
| Total senior notes | 604,990 |
| | 601,329 |
|
| Credit facilities: | | | |
| Corporate | — |
| | 49,000 |
|
| PDCM | 37,000 |
| | 26,250 |
|
| Total credit facilities | 37,000 |
| | 75,250 |
|
| PDCM second lien term loan | 15,000 |
| | — |
|
| Long-term debt | $ | 656,990 |
| | $ | 676,579 |
|
Senior Notes
3.25% Convertible Senior Notes Due 2016. In November 2010, we issued $115 million aggregate principal amount 3.25% convertible senior notes due 2016 (the "Convertible Notes") in a private placement to this Itemqualified institutional buyers. The maturity for the payment of principal is May 15, 2016. Interest is payable semi-annually in arrears on each May 15 and November 15. The Convertible Notes are senior, unsecured obligations and rank senior in right of payment to our existing and future indebtedness that is expressly subordinated in right of payment to the Convertible Notes; equal in right of payment to our existing and future unsecured indebtedness that is not expressly subordinated (including our 2022 Senior Notes); effectively junior in right of payment to any of our secured indebtedness (including our obligations under our senior secured credit facility) to the extent of the value of the assets securing such indebtedness; and structurally junior to all existing and future indebtedness (including trade payables) incurred by our subsidiaries. The indenture governing the convertible notes does not contain any restrictive financial covenants. The Convertible Notes and the common stock issuable upon conversion of the Convertible Notes, if any, have not been registered under the Securities Act of 1933 or any state securities laws, nor are we required to register such convertible notes or common shares. The Convertible Notes are governed by an indenture between the Company and the Bank of New York Mellon, as trustee.
We may not redeem the Convertible Notes prior to their maturity. However, prior to November 15, 2015, holders of the Convertible Notes may convert upon specified events as defined in the governing indenture. The notes are convertible at any time thereafter at an initial conversion rate of 23.5849 shares per $1,000 principal amount, which is equal to a conversion price of approximately $42.40 per share. The conversion rate is subject to adjustment upon certain events. Upon conversion, the Convertible Notes may be settled, at our election, in shares of our common stock, cash or a combination of cash and shares of our common stock. We have initially elected a net-settlement method to satisfy our conversion obligation, which allows us to settle the principal amount of the Convertible Notes in cash and to settle the excess conversion value in shares, as well as cash in lieu of fractional shares.
We allocated the gross proceeds of the Convertible Notes between the liability and equity components of the debt. The initial $94.3 million liability component was determined based on the fair value of similar debt instruments with similar terms, excluding the conversion feature, and priced on the same day we issued our Convertible Notes. The initial $20.7 million equity component represents the debt discount and was calculated as the difference between the liability component of the debt and the gross proceeds of the convertible notes. As of December 31, 2013, the unamortized debt discount will be includedamortized over the remaining contractual term to maturity of the convertible notes of 2.4 years using an effective interest rate of 7.4%. For 2013, interest expense related to the indebtedness and the amortization of the discount was $3.7 million each compared to $3.7 million and $3.4 million, respectively, in 2012 and $3.7 million and $3.2 million, respectively, in 2011. As of December 31, 2013, notwithstanding the inability to convert, the “if-converted” value of the Convertible Notes exceeded the principal amount by approximately $29.3 million.
PDC ENERGY, INC.
NOTES TO CONSOLIDATED FINANCIAL STATEMENTS - Continued
7.75% Senior Notes Due 2022. In October 2012, we issued $500 million aggregate principal amount 7.75% senior notes due October 15, 2022 (the "2022 Senior Notes") in a private placement to qualified institutional investors. The 2022 Senior Notes accrue interest from the date of issuance and interest is payable semi-annually in arrears on April 15 and October 15. Approximately $11 million in costs associated with the issuance of the 2022 Senior Notes have been capitalized as debt issuance costs and are being amortized as interest expense over the life of the notes using the effective interest method. The 2022 Senior Notes are senior unsecured obligations and rank senior in right of payment to any of our future indebtedness that is expressly subordinated to the notes. The 2022 Senior Notes rank equally in right of payment with all our existing and future senior indebtedness (including our Convertible Notes) and rank effectively junior in right of payment to all of our secured indebtedness (to the extent of the value of the collateral securing such indebtedness), including borrowings under our revolving credit facility.
In connection with the issuance of the 2022 Senior Notes, we entered into a registration rights agreement with the initial purchasers in which we agreed to file a registration statement with the SEC related to an amendmentoffer to exchange the notes for substantially identical registered notes and to use commercially reasonable efforts to cause the exchange offer to be completed on or prior to September 28, 2013. The registration statement was declared effective by the SEC in July 2013 and the exchange offer was completed in August 2013.
At any time prior to October 15, 2017, we may redeem all or part of the 2022 Senior Notes at a make-whole price set forth in the indenture, and on or after October 15, 2017, we may redeem the notes at fixed redemption prices, plus accrued and unpaid interest, if any, to the date of redemption.
At any time prior to October 15, 2015, we may redeem up to 35% of the outstanding 2022 Senior Notes with proceeds from certain equity offerings at a redemption price of 107.75% of the principal amount of the notes redeemed, plus accrued and unpaid interest, as long as:
at least 65% of the aggregate principal amount of the notes issued on October 3, 2012 remains outstanding after each such redemption; and
the redemption occurs within 180 days after the closing of the equity offering.
Upon the occurrence of a "change of control" as defined in the indenture for the 2022 Senior Notes, holders will have the right to require us to repurchase all or a portion of the notes at a price equal to 101% of the aggregate principal amount of the notes repurchased, together with any accrued and unpaid interest to the date of purchase. In connection with certain asset sales, we will be required to use the net cash proceeds of the asset sale to make an offer to purchase the notes at 100% of the principal amount, together with any accrued and unpaid interest to the date of purchase.
The indenture governing the 2022 Senior Notes contains covenants that, among other things, limit our ability and the ability of our subsidiaries to incur additional indebtedness; pay dividends or make distributions on our stock; purchase or redeem stock or subordinated indebtedness; make certain investments; create certain liens; restrict dividends or other payments by restricted subsidiaries; enter into transactions with affiliates; sell assets; and merge or consolidate with another company.
As of December 31, 2013, we were in compliance with all covenants related to the Convertible Notes and the 2022 Senior Notes, and expect to remain in compliance throughout the next twelve-month period.
Credit Facilities
Revolving Credit Facility. In May 2013, we entered into a Third Amended and Restated Credit Agreement with JPMorgan Chase Bank, N.A. as administrative agent and other lenders party thereto. This agreement amends and restates the credit agreement dated November 2010 and expires in May 2018. The revolving credit facility is available for working capital requirements, capital expenditures, acquisitions, general corporate purposes and to support letters of credit. The revolving credit facility provides for a maximum of $1 billion in allowable borrowing capacity, subject to the borrowing base. As of December 31, 2013, the borrowing base was $450 million. The borrowing base is based on, among other things, the loan value assigned to the proved reserves attributable to our and our subsidiaries' crude oil and natural gas interests, excluding proved reserves attributable to PDCM and our affiliated partnerships. The borrowing base is subject to a semi-annual size redetermination based upon quantification of our reserves at June 30 and December 31, and is also subject to a redetermination upon the occurrence of certain events. On October 31, 2013, we completed the semi-annual redetermination of our borrowing base and the borrowing base was reaffirmed at $450 million. The revolving credit facility is secured by a pledge of the stock of certain of our subsidiaries, mortgages of certain producing crude oil and natural gas properties and substantially all of our and such subsidiaries' other assets. Neither PDCM nor our affiliated partnerships are guarantors of our obligations under the revolving credit facility. As of December 31, 2013, we had no outstanding draws on our revolving credit facility compared to $49.0 million at a weighted-average interest rate of 2.3% as of December 31, 2012.
The outstanding principal amount under the revolving credit facility accrues interest at a varying interest rate that fluctuates with an alternate base rate (equal to the greater of JPMorgan Chase Bank, N.A.'s prime rate, the federal funds rate plus a premium and 1-month LIBOR plus a premium), or at our election, a rate equal to the rate for dollar deposits in the London interbank market for certain time periods. Additionally, commitment fees, interest margin and other bank fees, charged as a component of interest, vary with our utilization of the facility. No principal payments are required until the credit agreement expires in May 2018, or in the event that the borrowing base falls below the outstanding balance.
The revolving credit facility contains covenants customary for agreements of this reporttype, with the most restrictive being certain financial tests on a quarterly basis. The financial tests, as defined per the revolving credit facility, include requirements to: (a) maintain a minimum current
PDC ENERGY, INC.
NOTES TO CONSOLIDATED FINANCIAL STATEMENTS - Continued
ratio of 1.00 to 1.00 and (b) not exceed a maximum leverage ratio of 4.25 to 1.00. As of December 31, 2013, we were in compliance with all the revolving credit facility covenants and expect to remain in compliance throughout the next twelve-month period.
The revolving credit facility contains restrictions as to when we can directly or indirectly, retire, redeem, repurchase or prepay in cash any part of the principal of the 2022 Senior Notes or the proxy statementConvertible Notes. Among other things, the restriction on redemption of the Convertible Notes requires that immediately after giving effect to any such retirement, redemption, defeasance, repurchase, settlement or prepayment, the aggregate commitment under the revolving credit facility exceed the aggregate credit exposure under such facility by at least the greater of $115 million or an amount equal to or greater than 30% of such aggregate commitment. The restriction on redemption of the 2022 Senior Notes permits redemption only with the proceeds of issuances of "Permitted Refinancing Indebtedness," which may not exceed $750 million.
As of December 31, 2013, RNG, a wholly owned subsidiary of PDC, had an approximately $11.7 million irrevocable standby letter of credit in favor of a third-party transportation service provider to secure firm transportation of the natural gas produced by third-party producers for whom we market production in the Appalachian Basin. The letter of credit reduces the amount of available funds under our revolving credit facility by an equal amount. The letter of credit expires in September 2014. As of December 31, 2013, the available funds under our revolving credit facility, including a reduction for the $11.7 million irrevocable standby letter of credit in effect, was $438.3 million.
PDCM Credit Facility. PDCM has a credit facility dated April 2010, as amended in May 2013, with a borrowing base of $105 million, of which our proportionate share is approximately $53 million. The maximum allowable facility amount is $400 million. No principal payments are required until the credit agreement expires in April 2017, or in the event that the borrowing base falls below the outstanding balance. The credit facility is subject to and secured by PDCM's properties, including our proportionate share of such properties. The borrowing base is subject to size redetermination semi-annually based upon a valuation of PDCM's reserves at June 30 and December 31. Either PDCM or the lenders may request a redetermination upon the occurrence of certain events. The credit facility is utilized by PDCM for the exploration and development of its Appalachia-Marcellus Shale assets.
The credit facility contains covenants customary for agreements of this type, with the most restrictive being certain financial tests that must be filed pursuantmet on a quarterly basis. The financial tests, as defined by the credit facility, include requirements to Regulation 14Amaintain a minimum current ratio of 1.0 to 1.0, not to exceed a debt to EBITDAX ratio of 4.25 to 1.0 (declining to 4.0 to 1.0 on July 1, 2014) and to maintain a minimum interest coverage ratio of 2.5 to 1.0. As of December 31, 2013, our proportionate share of PDCM's outstanding credit facility balance was $37.0 million compared to $26.3 million as of December 31, 2012. The weighted-average borrowing rate on PDCM's credit facility was 3.7% per annum as of December 31, 2013, compared to 3.5% as of December 31, 2012.
As of December 31, 2013, PDCM was in compliance with all credit facility covenants and expects to remain in compliance throughout the next twelve-month period.
PDCM Second Lien Term Loan
In July 2013, PDCM entered into a Second Lien Credit Agreement ("Term Loan Agreement") with Wells Fargo Energy Capital as administrative agent and a syndicate of other lenders party thereto. The aggregate commitment under the Term Loan Agreement is $30 million, of which our proportionate share is $15 million. The aggregate commitment may increase periodically up to a maximum of $75 million, as PDCM's reserve value increases and the covenants under the Term Loan Agreement allow. The Term Loan Agreement matures in October 2017. Amounts borrowed accrue interest, at PDCM's discretion, at either an alternative base rate plus a margin of 6% per annum or an adjusted LIBOR for the interest period in effect plus a margin of 7% per annum. As of December 31, 2013, amounts borrowed and outstanding on the Term Loan Agreement were $30 million, of which our proportionate share is $15 million. The weighted-average borrowing rate on the Term Loan was 8.5% per annum as of December 31, 2013 Annual Stockholders' meeting.
The Term Loan Agreement contains financial covenants that must be met on a quarterly basis, including requirements to maintain a minimum current ratio of 1.0 to 1.0, not to exceed a debt to EBITDAX ratio of 4.5 to 1.0, to maintain a minimum interest coverage ratio of 2.25 to 1.0 and is incorporated by referencea present value of future net revenues to total debt ratio of 1.50 to 1.00. As of December 31, 2013, PDCM was in this report.compliance with all Term Loan Agreement covenants and expects to remain in compliance throughout the next twelve-month period.
PDC ENERGY, INC.
NOTES TO CONSOLIDATED FINANCIAL STATEMENTS - Continued
NOTE 9 - ASSET RETIREMENT OBLIGATIONS
The following table presents the changes in carrying amounts of the asset retirement obligations associated with our working interest in crude oil and natural gas properties:
|
| | | | | | | |
| | 2013 | | 2012 |
| | (in thousands) |
| | | | |
| Balance at beginning of year, January 1 | $ | 62,563 |
| | $ | 46,566 |
|
| Obligations incurred with development activities and assumed with acquisitions | 2,389 |
| | 14,169 |
|
| Accretion expense | 4,747 |
| | 4,060 |
|
| Revisions in estimated cash flows | 612 |
| | — |
|
| Obligations discharged with divestitures of properties and asset retirements (1) | (29,281 | ) | | (2,232 | ) |
| Balance end of year, December 31 | 41,030 |
| | 62,563 |
|
| Less: Liabilities held for sale (1) | (2,061 | ) | | — |
|
| Less: Current portion | (1,158 | ) | | (1,000 | ) |
| Long-term portion | $ | 37,811 |
| | $ | 61,563 |
|
| | | | |
______________
| |
(1) | Represents asset retirement obligations related to assets sold and assets held for sale. See Note 14, Assets Held for Sale, Divestitures and Discontinued Operations, for additional information. |
ITEM 14. PRINCIPAL ACCOUNTANT FEES AND SERVICES
Information relating to this Item will be included in an amendment to this report or the proxy statement to be filed pursuant to Regulation 14A for our 2013 Annual Stockholders' meeting and is incorporated by reference in this report.
PART IV
ITEM 15. EXHIBITS, FINANCIAL STATEMENT SCHEDULE
|
| | | |
(a) | (1 | ) | Financial Statements: |
| | See Index to Financial Statements and Schedules on page F-1. |
| (2 | ) | Financial Statement Schedule: |
| | See Index to Financial Statements and Schedule on page F-1. |
| | Schedules and Financial Statements Omitted |
| | All other financial statement schedules are omitted because they are not required, inapplicable or the information is included in the Financial Statements or Notes thereto. |
| (3 | ) | Exhibits: |
| | See Exhibits Index on the following page. |
Exhibits Index
|
| | | | | | | | | | | | |
| | | | | Incorporated by Reference | | |
| Exhibit | | | | | | SEC File | | | | | | Filed |
| Number | | Exhibit Description | | Form | | Number | | Exhibit | | Filing Date | | Herewith |
| | | | | | | | | | | | | |
| 3.1 | | Third Amended and Restated Articles of Incorporation of PDC Energy, Inc. (the "Company")
| | 10-Q | | 000-07246 | | 3.1 | | 8/2/2012 | | |
| | | | | | | | | | | | | |
| 3.2 | | By-laws of the Company. | | 10-Q | | 000-07246 | | 3.2 | | 8/2/2012 | | |
| | | | | | | | | | | | | |
| 4.1 | | Rights Agreement by and between the Company and Transfer Online, Inc., as Rights Agent, dated as of September 11, 2007, including the forms of Rights Certificates and Summary of Stockholder Rights Plan attached thereto as Exhibits A and B. | | 8-K | | 000-07246 | | 4.1 | | 9/17/2007 | | |
| | | | | | | | | | | | | |
| 4.2 | | Indenture, dated November 23, 2010, between the Company and The Bank of New York Mellon, including the form of 3.25% Convertible Senior Note due 2016. | | 8-K | | 000-07246 | | 4.1 | | 11/24/2010 | | |
| | | | | | | | | | | | | |
| 4.3 | | Indenture, dated as of October 3, 2012, by and between the Company and U.S. Bank Trust National Association, as Trustee, including the form of 7.75% Senior Notes due 2022. | | 8-K | | 000-07246 | | 4.1 | | 10/3/2012 | | |
| | | | | | | | | | | | | |
| 10.1* | | Indemnification Agreement with Non-Employee Directors. | | 8-K | | 000-07246 | | 10.1 | | 6/13/2012 | | |
| | | | | | | | | | | | | |
| 10.2* | | The Company 401(k) & Profit Sharing Plan. | | 10-K | | 000-07246 | | 10.6 | | 2/24/2011 | | |
| | | | | | | | | | | | | |
| 10.3* | | Non-Employee Director Deferred Compensation Plan. | | S-8 | | 333-118222 | | 99.1 | | 8/13/2004 | | |
| | | | | | | | | | | | | |
| 10.4* | | 2004 Long-Term Equity Compensation Plan amended and restated as of March 8, 2008 ("2004 Plan"). | | 10-K | | 000-07246 | | 10.26 | | 2/27/2009 | | |
| | | | | | | | | | | | | |
| 10.4.1* | | Form of SAR Agreement under the 2004 Plan. | | 10-K | | 000-07246 | | 10.26 | | 2/27/2009 | | |
| | | | | | | | | | | | | |
| 10.4.2* | | Form of Restricted Stock Agreement under the 2004 Plan. | | 10-K | | 000-07246 | | 10.26 | | 2/27/2009 | | |
| | | | | | | | | | | | | |
| 10.5* | | 2010 Long-Term Equity Compensation Plan, dated as of April 11, 2010 ("2010 Plan"). | | S-8 | | 333-167945 | | 99.1 | | 7/1/2010 | | |
| | | | | | | | | | | | | |
| 10.5.1* | | Summary of 2010 Stock Appreciation Rights and Restricted Stock Awards under the 2010 Plan. | | 8-K | | 000-07246 | |
| | 4/23/2010 | | |
| | | | | | | | | | | | | |
| 10.6* | | Form of 2010 Performance Share Agreement. | | 8-K | | 000-07246 | | 10.1 | | 3/17/2011 | | |
| | | | | | | | | | | | | |
| 10.7* | | Form of 2012 Performance Share Agreement. | | 8-K | | 000-07246 | | 10.1 | | 1/20/2012 | | |
| | | | | | | | | | | | | |
| 10.8* | | Executive severance compensation plan. | | 8-K | | 000-07246 | | 10.2 | | 9/25/2012 | | |
| | | | | | | | | | | | | |
| 10.9* | | Form of 2013 Performance Share Agreement. | | | | | | | | | | X |
| | | | | | | | | | | | | |
| 10.10* | | Form of 2013 Restricted Stock/Stock Appreciation Rights Agreement. | | | | | | | | | | X |
| | | | | | | | | | | | | |
| 10.11* | | Employment Agreement with Gysle R. Shellum, Chief Financial Officer, dated as of April 19, 2010. | | 8-K | | 000-07246 | | 10.2 | | 4/23/2010 | | |
| | | | | | | | | | | | | |
| 10.12* | | Employment Agreement with Daniel W. Amidon, General Counsel and Corporate Secretary, dated as of April 19, 2010. | | 8-K | | 000-07246 | | 10.3 | | 4/23/2010 | | |
| | | | | | | | | | | | | |
| 10.13* | | Employment Agreement with Lance A. Lauck, Senior Vice President of Business Development, dated as of April 19, 2010. | | 8-K | | 000-07246 | | 10.4 | | 4/23/2010 | | |
| | | | | | | | | | | | | |
| 10.14* | | Employment Agreement with James M. Trimble, President and Chief Executive Officer, dated as of November 1, 2011. | | 10-Q | | 000-07246 | | 10.2 | | 11/3/2011 | | |
| | | | | | | | | | | | | |
| 10.15* | | Employment Agreement with Barton R. Brookman, Jr., Senior Vice President of Exploration and Production, dated as of April 19, 2010. | | 8-K | | 000-07246 | | 10.5 | | 4/23/2010 | | |
| | | | | | | | | | | | | |
| 10.16 | | Contribution Agreement by and among PDC Mountaineer, LLC, as the Company, Petroleum Development Corporation, as the Contributor, and LR-Mountaineer Holdings, L.P., as the Investor, dated October 29, 2009. | | 8-K | | 000-07246 | | 2.1 | | 11/4/2009 | | |
| | | | | | | | | | | | | |
| 10.17 | | Limited Liability Company Agreement of PDC Mountaineer, LLC, dated October 29, 2009. | | 8-K | | 000-07246 | | 10.1 | | 11/4/2009 | | |
| | | | | | | | | | | | | |
|
| | | | | | | | | | | | |
| | | | | Incorporated by Reference | | |
| Exhibit | | | | | | SEC File | | | | | | Filed |
| Number | | Exhibit Description | | Form | | Number | | Exhibit | | Filing Date | | Herewith |
| | | | | | | | | | | | | |
| 10.18 † | | Domestic Crude Oil Purchase Agreement between Suncor Energy Marketing, Inc. and the Company, dated May 18, 2009. | | 10-Q | | 000-53201 | | 10.1 | | 5/18/2009 | | |
| | | | | | | | | | | | | |
| 10.19 † | | Gas Purchase Agreement between Williams Production RMT Company, Riley Natural Gas and the Company, dated as of June 1, 2006. | | 10/A No. 3 | | 000-53201 | | 10.7 | | 3/31/2009 | | |
| | | | | | | | | | | | | |
| 10.20 † | | First Amendment to the Gas Purchase Agreement between Williams Production RMT Company, Riley Natural Gas and the Company, dated as of June 1, 2011. | | 8-K | | 000-07246 | | 10.1 | | 8/2/2011 | | |
| | | | | | | | | | | | | |
| 10.21 † | | Gas Purchase and Processing Agreement between Duke Energy Field Services, Inc.; United States Exploration, Inc.; and the Company, dated as of October 28, 1999. | | 10/A No. 3 | | 000-53201 | | 10.3 | | 3/31/2009 | | |
| | | | | | | | | | | | | |
| 10.22 | | Second Amended and Restated Credit Agreement dated as of November 5, 2010, between the Company, as borrower and JPMorgan Chase Bank, N.A. and BNP Paribas, as agents. | | 8-K | | 000-07246 | | 10.1 | | 11/12/2010 | | |
| | | | | | | | | | | | | |
| 10.23.1 | | First Amendment to Second Amended and Restated Credit Agreement, dated as of December 22, 2010. | | 10-K | | 000-07246 | | 10.29 | | 2/24/2011 | | |
| | | | | | | | | | | | | |
| 10.23.2 | | Second Amendment to Second Amended and Restated Credit Agreement, dated as of October 12, 2011. | | 8-K | | 000-07246 | | 10.1 | | 10/18/2011 | | |
| | | | | | | | | | | | | |
| 10.23.3 | | Third Amendment to the Second Amended and Restated Credit Agreement, dated as of May 4, 2012. | | 10-Q | | 000-07246 | | 10.1 | | 5/10/2012 | | |
| | | | | | | | | | | | | |
| 10.23.4 | | Fourth Amendment to the Second Amended and Restated Credit Agreement, dated as of June 25, 2012.
| | 8-K | | 000-07246 | | 99.1 | | 7/2/2012 | | |
| | | | | | | | | | | | | |
| 10.23.5 | | Fifth Amendment to the Second Amended and Restated Credit Agreement, dated as of June 29, 2012. | | 8-K | | 000-07246 | | 10.1 | | 7/2/2012 | | |
| | | | | | | | | | | | | |
| 10.23.6 | | Sixth Amendment to the Second Amended and Restated Credit Agreement, dated as of September 21, 2012. | | 8-K | | 000-07246 | | 10.1 | | 9/25/2012 | | |
| | | | | | | | | | | | | |
| 12.1 | | Computation of Ratio of Earnings to Fixed Charges. | | | | | | | | | | X |
| | | | | | | | | | | | | |
| 14.1 | | Code of Business Conduct and Ethics. | | 10-Q | | 000-17246 | | 14.1 | | 8/10/2009 | | |
| | | | | | | | | | | | | |
| 21.1 | | Subsidiaries. | | | | | | | | | | X |
| | | | | | | | | | | | | |
| 23.1 | | Consent of PricewaterhouseCoopers LLP. | | | | | | | | | | X |
| | | | | | | | | | | | | |
| 23.2 | | Consent of Ryder Scott Company, L.P., Petroleum Consultants. | | | | | | | | | | X |
| | | | | | | | | | | | | |
| 31.1 | | Certification by Chief Executive Officer pursuant to Rule 13a-14(a) and 15d-14(a) of the Exchange Act Rules, as adopted pursuant to Section 302 of the Sarbanes-Oxley Act of 2002. | | | | | | | | | | X |
| | | | | | | | | | | | | |
| 31.2 | | Certification by Chief Financial Officer pursuant to Rule 13a-14(a) and 15d-14(a) of the Exchange Act Rules, as adopted pursuant to Section 302 of the Sarbanes-Oxley Act of 2002. | | | | | | | | | | X |
| | | | | | | | | | | | | |
| 32.1** | | Certifications by Chief Executive Officer and Chief Financial Officer pursuant to Title 18 U.S.C. Section 1350, as adopted pursuant to Section 906 of Sarbanes-Oxley Act of 2002. | | | | | | | | | | |
| | | | | | | | | | | | | |
| 99.1 | | Report of Independent Petroleum Consultants - Ryder Scott Company, L.P. | | | | | | | | | | X |
| | | | | | | | | | | | | |
| 101.INS** | | XBRL Instance Document | | | | | | | | | | |
| | | | | | | | | | | | | |
| 101.SCH** | | XBRL Taxonomy Extension Schema Document | | | | | | | | | | |
| | | | | | | | | | | | | |
| 101.CAL** | | XBRL Taxonomy Extension Calculation Linkbase Document | | | | | | | | | | |
| | | | | | | | | | | | | |
| 101.DEF** | | XBRL Taxonomy Extension Definition Linkbase Document | | | | | | | | | | |
| | | | | | | | | | | | | |
| 101.LAB** | | XBRL Taxonomy Extension Label Linkbase Document | | | | | | | | | | |
| | | | | | | | | | | | | |
| 101.PRE** | | XBRL Taxonomy Extension Presentation Linkbase Document | | | | | | | | | | |
| | | | | | | | | | | | | |
| *Management contract or compensatory plan or arrangement. | | | | | | | | | | |
| ** Furnished herewith. |
|
| | | | | | | | | | | | |
| | | | Incorporated by Reference | | |
Exhibit | | | | | | SEC File | | | | | | Filed |
Number | | Exhibit Description | | Form | | Number | | Exhibit | | Filing Date | | Herewith |
| | | | | | | | | | | | |
† Confidential portions of this document have been omitted and are filed separately with the SEC pursuant to Exchange Act Rule 24b-2. |
SIGNATURES
Pursuant to the requirements of Section 13 or 15(d) of the Securities Exchange Act of 1934, the Registrant has duly caused this report to be signed on its behalf by the undersigned, thereunto duly authorized.
|
| |
| PDC ENERGY, INC. |
| |
| By /s/ James M. Trimble |
| James M. Trimble |
| President and Chief Executive Officer |
| |
| February 27, 2013 |
| |
Pursuant to the requirements of the Securities Exchange Act of 1934, this report has been signed below by the following persons on behalf of the Registrant and in the capacities and on the dates indicated:
|
| | | | |
Signature | | Title | | Date |
| | | | |
/s/ James M. Trimble | | President, Chief Executive Officer and Director | | February 27, 2013 |
James M. Trimble | | (principal executive officer) | | |
| | | | |
/s/ Gysle R. Shellum | | Chief Financial Officer | | February 27, 2013 |
Gysle R. Shellum | | (principal financial officer) | | |
| | | | |
/s/ R. Scott Meyers | | Chief Accounting Officer | | February 27, 2013 |
R. Scott Meyers | | (principal accounting officer) | | |
| | | | |
/s/ Jeffrey C. Swoveland | | Chairman and Director | | February 27, 2013 |
Jeffrey C. Swoveland | | | | |
| | | | |
/s/ Joseph E. Casabona | | Director | | February 27, 2013 |
Joseph E. Casabona | | | | |
| | | | |
/s/ Anthony J. Crisafio | | Director | | February 27, 2013 |
Anthony J. Crisafio | | | | |
| | | | |
/s/ Larry F. Mazza | | Director | | February 27, 2013 |
Larry F. Mazza | | | | |
| | | | |
/s/ David C. Parke | | Director | | February 27, 2013 |
David C. Parke | | | | |
| | | | |
/s/ Kimberly Luff Wakim | | Director | | February 27, 2013 |
Kimberly Luff Wakim | | | | |
GLOSSARY OF UNITS OF MEASUREMENT AND INDUSTRY TERMS
UNITS OF MEASUREMENT
The following presents a list of units of measurement used throughout the document.
Bbl – One barrel of crude oil or NGL or 42 gallons of liquid volume.
Bcf – One billion cubic feet of natural gas volume.
Bcfe – One billion cubic feet of natural gas equivalent.
Btu – British thermal unit.
BBtu – One billion British thermal units.
MBoe – One thousand barrels of crude oil equivalent.
MBbls – One thousand barrels of crude oil.
Mcf – One thousand cubic feet of natural gas volume.
Mcfe – One thousand cubic feet of natural gas equivalent (six Mcf of natural gas equals one Bbl of crude oil or NGL).
MMBtu – One million British thermal units.
MMcf – One million cubic feet of natural gas volume.
MMcfe – One million cubic feet of natural gas equivalent.
Tcfe – One trillion cubic feet of natural gas equivalent.
GLOSSARY OF INDUSTRY TERMS
The following are abbreviations and definitions of terms commonly used in the oil and gas industry and this report:NOTE 10 - EMPLOYEE BENEFIT PLANS
Behind-pipe reserves - Natural gasWe sponsor a qualified retirement plan covering substantially all of our employees. The plan consists of both a traditional and crude oil reserves expecteda Roth 401(k) component, as well as a profit sharing component. The 401(k) components enable eligible employees to be recovered from zonescontribute a portion of their compensation through payroll deductions in existing wells, which will require additional completion work or future recompletion prioraccordance with specific guidelines. We provide a discretionary matching contribution based on a percentage of the employees' contributions up to certain limits. Our contribution to the start of production. Generally, these are reserves in reservoirs above currently producing zones.profit sharing component is discretionary. Our total combined expense for the plan was $3.7 million, $3.4 million and $2.6 millionfor 2013, 2012 and 2011, respectively.
CIG - Colorado Interstate Gas.
Completion - Refers to the work performed and the installationWe provide a supplemental retirement benefit of permanent equipment for the production of natural gas and crude oil from a recently drilled well.
Delineation - A drilling technique carried out to gain a better understandingdeferred compensation under terms of the structure and extent of a deposit in order to decide whether or not to conduct further drilling activities.
Developed acreage - Acreage assignable to productive wells.
Development well - A well drilled within the proved area of an oil or gas reservoir to the depth of a stratigraphic horizon known to be productive.
Dry gas or dry natural gas - Natural gas is considered dry when its composition is over 90% pure methane.
Dry well or dry hole- A well found to be incapable of producing hydrocarbons in sufficient quantities to justify completion as an oil or gas well.
Exit rate- Rate of production as of the date specified.
Exploratory well- A well drilled to find a new field or to find a new reservoir in a field previously found to be productive of oil or gas in another reservoir.
Extensions and discoveries - As to any period, the increases to proved reserves from all sources other than the acquisition of proved properties or revisions of previous estimates.
Farm-out - Transfer of all or part of the operating rights from a working interest owner to an assignee, who assumes all or some of the burden of development in return for an interest in the property. The assignor usually retains an overriding royalty interest but may retain any type of interest.
Fracture or Fracturing - Procedure to stimulate production by forcing a mixture of fluid and proppant into the formation under high pressure. Fracturing creates artificial fractures in the reservoir rock to increase permeability and porosity, thereby allowing the release of trapped hydrocarbons.
Gross acres or wells - Refers to the total acres or wells in which we have a working interest.
Horizontal drilling- A drilling technique that permits the operator to drill a horizontal well shaft from the bottom of a vertical well and thereby to contact and intersect a larger portion of the producing horizon than conventional vertical drilling techniques and may, depending on the horizon, result in increased production rates and greater ultimate recoveries of hydrocarbons.
Joint interest billing - Process of billing/invoicing the costsvarious employment agreements with certain former executive officers. Expenses related to well drilling, completions and production operations among working interest partners.
Natural gas liquid(s) or NGL(s) - Hydrocarbons which can be extracted from wet natural gas and become liquid under various combinations of increasing pressure and lower temperature. NGLs include ethane, propane, butane, and other natural gasolines.
Net acres or wells - Refersthis plan are charged to gross acres or wells we own multiplied, in each case, by our percentage working interest. References to net acres or wells well include our proportionate share of PDCM's and our affiliated partnerships' net acres or wells.
Net production- Natural gas and crude oil production that we own, less royalties and production due to others. References to net production include our proportionate share of PDCM's and our affiliated partnerships' net production.
Non-operated - A project in which we are not the operator.
NYMEX- New York Mercantile Exchange.
Operator - The individual or company responsible for the exploration, development and/or production of an oil or gas well or lease.
Overriding royalty - An interest which is created out of the operating or working interest. Its term is coextensive with that of the operating interest.
PEPL - Panhandle Eastern Pipeline.
Possible reserves - This term is defined in the SEC Regulation S-X Section 4-10(a) and refers to those reserves that are less certain to be recovered than probable reserves. When deterministic methods are used, the total quantities ultimately recovered from a project have a low probability to exceed the sum of proved, probable and possible reserves. When probabilistic methods are used, there must be at least a 10 percent probability that the actual quantities recovered will equal or exceed the sum of proved, probable and possible estimates.
Present value of future net revenues or (PV-10%) - The present value of estimated future revenues to be generated from the production of proved reserves, before income taxes, of proved reserves calculated in accordance with Financial Accounting Standards Board guidelines, net of estimated production and future development costs, using pricing and costs as of the date of estimation without future escalation, without giving effect to hedging activities, non-property related expenses such as general and administrative expenses debt service and depreciation, depletion and amortization, and discounted using an annual discount rate of 10%. PV-10% is pre-tax and therefore a non-U.S. GAAP financial measure.
Probable reserves -the related costs were immaterial in This term is defined in the SEC Regulation S-X Section 4-10(a) and refers to those reserves that are less certain to be recovered than proved reserves but which, in sum with proved reserves, are as likely as not to be recovered. When deterministic methods are used, it is as likely as not that actual remaining quantities recovered will exceed the sum of estimated proved plus probable reserves. Similarly, when probabilistic methods are used, there must be at least a 50 percent probability that the actual quantities recovered will equal or exceed the proved plus probable reserves estimates.2013
Productive well, 2012 - A well that is not a dry well or dry hole, as defined above, and includes wells that are mechanically capable2011. As of production.
Proved developed non-producing reservesDecember 31, 2013 orand PDNPs2012, the liability related to this benefit was $1.8 million - Reserves that consist of (i) proved reserves from wellsand $2.0 million, respectively, which have been completed and tested but are not producing due to lack of market or minor completion problems which are expected to be corrected and/or (ii) proved reserves currently behind the pipewas included in existing wells and which are expected to be productive due to both the well log characteristics and analogous production in the immediate vicinity of the wells.
Proved developed producing reserves or PDPs- Proved reserves that can be expected to be recovered from currently producing zones under the continuation of present operating methods.
Proved developed reserves - The combination of proved developed producing and proved developed non-producing reserves.
Proved reserves - This term mean "proved oil and gas reserves" as defined in SEC Regulation S-X Section 4-10(a) and refers to those quantities of natural gas, NGL, crude oil and condensate, which, by analysis of geoscience and engineering data, can be estimated with reasonable certainty to be economically producible - from a given date forward, from known reservoirs, and under existing conditions, operating methods, and government regulations – prior to the time at which contracts providing the right to operate expire, unless evidence indicates that renewal is reasonably certain, regardless of whether deterministic or probabilistic methods are used for the estimation.
Proved undeveloped reserves or PUDs- Proved reserves that are expected to be recovered from new wells on undrilled acreage, or from existing wells where a relatively major expenditure is required for recompletion.
Recomplete or Recompletion - The modification of an existing well for the purpose of producing natural gas and crude oil from a different producing formation.
Refracture - A refracture is when we stimulate by fracturing a producing zone of a well to increase its production as well as its PDP reserves.
Reserves - Estimated remaining quantities of natural gas, NGLs crude oil and related substances anticipated to be economically producible, as of a given date, by application of development projects to known accumulations. In addition, there must exist, or there must be a reasonable expectation that there will exist, the legal right to produce or a revenue interest in the production, installed means of delivering natural gas, NGLs and crude oil or related substances to market, and all permits and financing required to implement the project.
Royalty - An interest in a natural gas and crude oil lease that gives the owner of the interest the right to receive a portion of the production from the leased acreage (or of the proceeds of the sale thereof), but generally does not require the owner to pay any portion of the costs of drilling or operating the wellsother liabilities on the leased acreage. Royalties may be either landowner’s royalties, which are reserved byconsolidated balance sheets, with the ownerexception of the leased acreage at the time the lease is granted, or overriding royalties, which are usually reserved by an owner of the leasehold$0.3 million included in connection with a transfer to a subsequent owner.
Spud - To begin drilling; the act of beginning a hole. Past tense: spudded.
Standardized measure of discounted future net cash flows or standardized measure- Future net cash flows discounted at a rate of 10%. Future net cash flows represent the estimated future revenues to be generated from the production of proved reserves determined in accordance with SEC guidelines, net of estimated production and future development costs, using prices and costs as of the date of estimation without future escalation, giving effect to (i) estimated future abandonment costs, net of the estimated salvage value of related equipment and (ii) future income tax expense.
Stratigraphic test well - A drilling effort, geologically directed, to obtain information pertaining to a specific geologic condition. Such wells customarily are drilled without the intent of being completed for hydrocarbon production.
Unconventional resource(s) - Natural gas and crude oil that cannot be produced at economic flow rates in economic volumes unless the well is stimulated by a large hydraulic fracture treatment, a horizontal wellbore, or by using multilateral wellbores or some other techniques to expose more of the resources to the wellbore.
Undeveloped acreage - Leased acreage on which wells have not been drilled or completed to a point that would permit the production of commercial quantities of natural gas and crude oil, regardless of whether such acreage contains proved reserves.
Wet gas or wet natural gas - Natural gas that contains a larger quantity of hydrocarbon liquids than dry natural gas, such as NGLs, condensate and crude oil.
Working interest - An interest in a natural gas and crude oil lease that gives the owner of the interest the right to drill and produce natural gas and crude oil on the leased acreage. It requires the owner to pay their entire share of the costs of drilling and production operations.
Workover - Major remedial operations on a producing well to restore, maintain or improve the well's production.
|
| | |
Index to Consolidated Financial Statements, Financial Statement Schedule and Supplemental Information |
| | |
| | |
Financial Statements: | | |
| | |
| | |
| | |
| | |
| | |
| | |
| | |
Supplemental Information - Unaudited: | | |
| | |
| | |
| | |
Financial Statement Schedule: | | |
| | |
| | |
Management's Report on Internal Control Over Financial Reporting
Management is responsible for establishing and maintaining adequate internal control over financial reporting as such term as defined in Rules 13a-15(f) and 15d-15(f) of the Securities Exchange Act of 1934, as amended. Internal control over financial reporting is a process designed to provide reasonable assurance regarding the reliability of financial reporting and the preparation of financial statements for external purposes in accordance with generally accepted accounting principles. Because of its inherent limitations, internal control over financial reporting may not prevent or detect misstatements. Also, projections of any evaluation of effectiveness to future periods are subject to the risk that controls may become inadequate because of changes in conditions, or that the degree of compliance with policies or procedures may deteriorate.
Management has assessed the effectiveness of the Company’s internal control over financial reportingaccrued expenses as of December 31, 20122013, based upon the criteria established in "Internal Control – Integrated Framework" issued by the Committee of Sponsoring Organizations of the Treadway Commission. Based on this evaluation, management concluded that the Company maintained effective internal control over financial reporting as of and December 31, 2012.
We provide a supplemental health care benefit covering certain former executive officers and their spouses in accordance with each officer's employment agreement. Expenses incurred during 2013, 2012 and 2011 related to this plan were immaterial. As of December 31, 2013 and 2012, the related liability of $0.7 million is included in other liabilities on the consolidated balance sheets.
We maintain a non-qualified deferred compensation plan for our non-employee directors. The effectivenessamount of compensation deferred by each participant is based on participant elections. The amounts deferred pursuant to the Company's internal control over financial reportingplan are invested in our common stock, maintained in a rabbi trust and are classified in the consolidated balance sheets as treasury shares as a component of shareholders' equity. The plan may be settled in either cash or shares as requested by the participant. The liability related to this plan, which was included in other liabilities on the consolidated balance sheets, was immaterial as of December 31, 2013 and 2012, has been audited by PricewaterhouseCoopers LLP, an independent registered public accounting firm, as stated in their report which appears herein..
PDC ENERGY, INC.
|
| | |
| /s/ James M. Trimble |
| James M. Trimble |
| President and Chief Executive Officer |
| | |
| /s/ Gysle R. Shellum |
| Gysle R. Shellum |
| Chief Financial Officer |
| | |
| /s/ R. Scott Meyers |
| R. Scott Meyers |
| Chief Accounting Officer |
Report of Independent Registered Public Accounting Firm
To the Board of Directors and Shareholders of PDC Energy, Inc.:NOTE 11 - COMMITMENTS AND CONTINGENCIES
In our opinion, the accompanying consolidated balance sheetsFirm Transportation, Processing and the related consolidated statements of operations, equity,Sales Agreements. We enter into contracts that provide firm transportation, sales and cash flows present fairly, in all material respects, the financial position of PDC Energy, Inc. and its subsidiaries at December 31, 2012 and 2011, and the results of their operations and their cash flows for eachprocessing charges on pipeline systems through which we transport or sell natural gas. Satisfaction of the three yearsvolume requirements includes volumes produced by us, volumes purchased from third parties and volumes produced by PDCM, our affiliated partnerships and other third-party working interest owners. We record in our financial statements only our share of costs based upon our working interest in the period ended December 31, 2012 in conformity with accounting principles generally accepted in the United States of America. In addition, in our opinion, the financial statement schedule appearing under Item 15(a)(2) presents fairly, in all material respects, the information set forth therein when read in conjunction with the related consolidated financial statements. Also in our opinion, the Company maintained, in all material respects, effective internal control over financial reporting as of December 31, 2012, based on criteria established in Internal Control - Integrated Framework issued by the Committee of Sponsoring Organizations of the Treadway Commission (COSO). The Company's management is responsible forwells. These contracts require us to pay these financial statements, for maintaining effective internal control over financial reportingtransportation and for its assessment of the effectiveness of internal control over financial reporting, included in the accompanying Management's Report on Internal Control over Financial Reporting. Our responsibility is to express opinions on these financial statements, on the financial statement schedule, and on the Company's internal control over financial reporting based on our integrated audits. We conducted our audits in accordance with the standards of the Public Company Accounting Oversight Board (United States). Those standards require that we plan and perform the audits to obtain reasonable assurance aboutprocessing charges whether the financial statementsrequired volumes are freedelivered or not. With the exception of material misstatement and whether effective internal control over financial reporting was maintained in all material respects. Our audits ofcontracts entered into by PDCM, the financial statements included examining, on a test basis, evidence supporting the amounts and disclosures in the financial statements, assessing the accounting principles used and significant estimates made by management, and evaluating the overall financial statement presentation. Our audit of internal control over financial reporting included obtaining an understanding of internal control over financial reporting, assessing the risk that a material weakness exists, and testing and evaluating the design and operating effectiveness of internal control based on the assessed risk. Our audits also included performing such other procedures as we considered necessary in the circumstances. We believe that our audits provide a reasonable basis for our opinions.
A company's internal control over financial reporting is a process designed to provide reasonable assurance regarding the reliability of financial reporting and the preparation of financial statements for external purposes in accordance with generally accepted accounting principles. A company's internal control over financial reporting includes those policies and procedures that (i) pertain to the maintenance of records that, in reasonable detail, accurately and fairly reflect the transactions and dispositions of the assets of the company; (ii) provide reasonable assurance that transactions are recorded as necessary to permit preparation of financial statements in accordance with generally accepted accounting principles, and that receipts and expenditures of the company are being made only in accordance with authorizations of management and directors of the company; and (iii) provide reasonable assurance regarding prevention or timely detection of unauthorized acquisition, use, or disposition of the company's assets that could have a material effect on the financial statements.
Because of its inherent limitations, internal control over financial reporting may not prevent or detect misstatements. Also, projectionscosts of any evaluation of effectiveness to future periodsvolume shortfalls are subject to the risk that controls may become inadequate because of changes in conditions, or that the degree of compliance with the policies or procedures may deteriorate.
/s/ PricewaterhouseCoopers LLP
Pittsburgh, Pennsylvania
February 26, 2013borne by PDC.
PDC ENERGY, INC.
Consolidated Balance Sheets
(in thousands, except share and per share data)
|
| | | | | | | | |
| As of December 31, | | 2012 | | 2011 |
| Assets | | | | |
| Current assets: | | | | |
| Cash and cash equivalents | | $ | 2,457 |
| | $ | 8,238 |
|
| Restricted cash | | 3,942 |
| | 11,070 |
|
| Accounts receivable, net | | 64,880 |
| | 59,923 |
|
| Accounts receivable affiliates | | 4,842 |
| | 8,518 |
|
| Fair value of derivatives | | 52,042 |
| | 60,809 |
|
| Deferred income taxes | | 36,151 |
| | 16,127 |
|
| Prepaid expenses and other current assets | | 7,635 |
| | 8,365 |
|
| Total current assets | | 171,949 |
| | 173,050 |
|
| Properties and equipment, net | | 1,616,706 |
| | 1,301,716 |
|
| Assets held for sale | | — |
| | 148,249 |
|
| Fair value of derivatives | | 6,883 |
| | 41,175 |
|
| Accounts receivable affiliates | | — |
| | 2,836 |
|
| Other assets | | 31,310 |
| | 30,979 |
|
| Total Assets | | $ | 1,826,848 |
| | $ | 1,698,005 |
|
| | | | | |
| Liabilities and Shareholders' Equity | | | | |
| Liabilities | | | | |
| Current liabilities: | | | | |
| Accounts payable | | $ | 82,716 |
| | $ | 76,027 |
|
| Accounts payable affiliates | | 5,296 |
| | 10,176 |
|
| Production tax liability | | 25,899 |
| | 18,949 |
|
| Fair value of derivatives | | 18,439 |
| | 27,974 |
|
| Funds held for distribution | | 34,228 |
| | 28,594 |
|
| Accrued interest payable | | 11,056 |
| | 11,243 |
|
| Other accrued expenses | | 25,715 |
| | 22,083 |
|
| Total current liabilities | | 203,349 |
| | 195,046 |
|
| Long-term debt | | 676,579 |
| | 532,157 |
|
| Deferred income taxes | | 148,427 |
| | 207,573 |
|
| Asset retirement obligation | | 61,563 |
| | 46,316 |
|
| Fair value of derivatives | | 10,137 |
| | 21,106 |
|
| Accounts payable affiliates | | — |
| | 6,134 |
|
| Other liabilities | | 23,612 |
| | 25,561 |
|
| Total liabilities | | 1,123,667 |
| | 1,033,893 |
|
| | | | | |
| Commitments and contingent liabilities | | | | |
| | | | | |
| Shareholders' equity | | | | |
| Preferred shares - par value $0.01 per share, 50,000,000 shares authorized, none issued | | — |
| | — |
|
| Common shares - par value $0.01 per share, 100,000,000 authorized, 30,294,224 and 23,634,958 issued as of December 31, 2012 and 2011, respectively | | 303 |
| | 236 |
|
| Additional paid-in capital | | 387,494 |
| | 217,707 |
|
| Retained earnings | | 315,568 |
| | 446,280 |
|
| Treasury shares - at cost, 5,059 and 2,938 as of December 31, 2012 and 2011, respectively | | (184 | ) | | (111 | ) |
| Total shareholders' equity | | 703,181 |
| | 664,112 |
|
| Total Liabilities and Shareholders' Equity | | $ | 1,826,848 |
| | $ | 1,698,005 |
|
| | | | | |
See accompanying Notes to Consolidated Financial Statements
F- 4
75
PDC ENERGY, INC.
Consolidated Statements of Operations
(in thousands, except per share data)
|
| | | | | | | | | | | | |
| Year Ended December 31, | | 2012 | | 2011 | | 2010 |
| Revenues: | | | | | | |
| Natural gas, NGLs and crude oil sales | | $ | 270,327 |
| | $ | 276,605 |
| | $ | 205,029 |
|
| Sales from natural gas marketing | | 47,079 |
| | 66,419 |
| | 69,071 |
|
| Commodity price risk management gain, net | | 32,339 |
| | 46,090 |
| | 59,891 |
|
| Well operations, pipeline income and other | | 6,388 |
| | 6,846 |
| | 9,030 |
|
| Total revenues | | 356,133 |
| | 395,960 |
| | 343,021 |
|
| Costs, expenses and other: | | | | | | |
| Production costs | | 75,485 |
| | 67,352 |
| | 63,543 |
|
| Cost of natural gas marketing | | 46,552 |
| | 65,465 |
| | 68,015 |
|
| Exploration expense | | 22,605 |
| | 6,253 |
| | 13,675 |
|
| Impairment of natural gas and crude oil properties | | 168,149 |
| | 25,159 |
| | 6,481 |
|
| General and administrative expense | | 58,815 |
| | 61,454 |
| | 42,188 |
|
| Depreciation, depletion, and amortization | | 146,879 |
| | 128,907 |
| | 108,095 |
|
| Accretion of asset retirement obligations | | 4,060 |
| | 1,733 |
| | 1,329 |
|
| Gain on sale of properties and equipment | | (4,353 | ) | | (196 | ) | | (174 | ) |
| Total cost, expenses and other | | 518,192 |
| | 356,127 |
| | 303,152 |
|
| Income (loss) from operations | | (162,059 | ) | | 39,833 |
| | 39,869 |
|
| Loss on extinguishment of debt | | (23,283 | ) | | — |
| | — |
|
| Interest expense | | (48,287 | ) | | (36,985 | ) | | (33,250 | ) |
| Interest income | | 8 |
| | 47 |
| | 71 |
|
| Income (loss) from continuing operations before income taxes | | (233,621 | ) | | 2,895 |
| | 6,690 |
|
| Provision for income taxes | | 88,835 |
| | 183 |
| | (652 | ) |
| Income (loss) from continuing operations | | (144,786 | ) | | 3,078 |
| | 6,038 |
|
| Income (loss) from discontinued operations, net of tax | | 14,074 |
| | 10,359 |
| | (104 | ) |
| Net income (loss) | | (130,712 | ) | | 13,437 |
| | 5,934 |
|
| Net loss attributable to noncontrolling interests | | — |
| | — |
| | 280 |
|
| Net income (loss) attributable to shareholders | | $ | (130,712 | ) | | $ | 13,437 |
| | $ | 6,214 |
|
| | | | | | | |
| Amounts attributable to PDC Energy, Inc. shareholders: | | | | | | |
| Income (loss) from continuing operations | | $ | (144,786 | ) | | $ | 3,078 |
| | $ | 6,318 |
|
| Income (loss) from discontinued operations, net of tax | | 14,074 |
| | 10,359 |
| | (104 | ) |
| Net income (loss) attributable to shareholders | | $ | (130,712 | ) | | $ | 13,437 |
| | $ | 6,214 |
|
| | | | | | | |
| Earnings per share: | | | | | | |
| Basic | | | | | | |
| Income (loss) from continuing operations | | $ | (5.23 | ) | | $ | 0.13 |
| | $ | 0.33 |
|
| Income (loss) from discontinued operations | | 0.51 |
| | 0.44 |
| | (0.01 | ) |
| Net income (loss) attributable to shareholders | | $ | (4.72 | ) | | $ | 0.57 |
| | $ | 0.32 |
|
| | | | | | | |
| Diluted | | | | | | |
| Income (loss) from continuing operations | | $ | (5.23 | ) | | $ | 0.13 |
| | $ | 0.32 |
|
| Income (loss) from discontinued operations | | 0.51 |
| | 0.43 |
| | (0.01 | ) |
| Net income (loss) attributable to shareholders | | $ | (4.72 | ) | | $ | 0.56 |
| | $ | 0.31 |
|
| | | | | | | |
| Weighted-average common shares outstanding: | | | | | | |
| Basic | | 27,677 |
| | 23,521 |
| | 19,674 |
|
| Diluted | | 27,677 |
| | 23,871 |
| | 19,821 |
|
| | | | | | | |
See accompanying Notes to Consolidated Financial Statements
F- 5
PDC ENERGY, INC.
Consolidated Statements of Cash Flows
(in thousands)
|
| | | | | | | | | | | | |
| Year Ended December 31, | | 2012 | | 2011 | | 2010 |
| Cash flows from operating activities: | | | | | | |
| Net income (loss) | | $ | (130,712 | ) | | $ | 13,437 |
| | $ | 5,934 |
|
| Adjustments to net income (loss) to reconcile to net cash from operating activities: | | | | | | |
| Unrealized (gain) loss on derivatives, net | | 17,134 |
| | (28,601 | ) | | (12,625 | ) |
| Depreciation, depletion and amortization | | 146,879 |
| | 135,154 |
| | 111,062 |
|
| Impairment of natural gas and crude oil properties | | 168,149 |
| | 25,159 |
| | 11,147 |
|
| Prepaid well costs write-offs | | 3,916 |
| | 1,359 |
| | 668 |
|
| Loss on extinguishment of debt | | 23,283 |
| | — |
| | — |
|
| Exploratory dry hole costs | | 15,347 |
| | 177 |
| | 4,199 |
|
| Accretion of asset retirement obligation | | 4,060 |
| | 1,897 |
| | 1,423 |
|
| Stock-based compensation | | 8,495 |
| | 8,781 |
| | 5,314 |
|
| Excess tax benefits from stock-based compensation | | — |
| | (1,311 | ) | | (293 | ) |
| (Gain) loss from sale of properties and equipment | | (24,273 | ) | | (4,263 | ) | | 299 |
|
| Amortization of debt discount and issuance costs | | 7,864 |
| | 6,265 |
| | 4,618 |
|
| Deferred income taxes | | (80,379 | ) | | 9,530 |
| | 1,179 |
|
| Inventory adjustment and other | | 4,123 |
| | 135 |
| | 307 |
|
| Total adjustments to net income (loss) to reconcile to net cash from operating activities: | | 294,598 |
| | 154,282 |
| | 127,298 |
|
| Changes in assets and liabilities: | | | | | | |
| Accounts receivable | | 6,843 |
| | (3,451 | ) | | 2,122 |
|
| Other assets | | (2,908 | ) | | (3,893 | ) | | 22,616 |
|
| Restricted cash | | 8,859 |
| | (8,603 | ) | | 219 |
|
| Production tax liability | | 2,499 |
| | 5,436 |
| | (6,818 | ) |
| Accounts payable and accrued expenses | | (5,050 | ) | | 12,422 |
| | 1,172 |
|
| Other liabilities | | 592 |
| | (2,796 | ) | | (730 | ) |
| Total changes in assets and liabilities | | 10,835 |
| | (885 | ) | | 18,581 |
|
| Net cash from operating activities | | 174,721 |
| | 166,834 |
| | 151,813 |
|
| Cash flows from investing activities: | | | | | | |
| Capital expenditures | | (347,729 | ) | | (334,496 | ) | | (162,723 | ) |
| Acquisition of oil and gas properties, net of cash acquired | | (312,223 | ) | | (145,894 | ) | | (158,051 | ) |
Proceeds from acquisition adjustments
| | 14,469 |
| | — |
| | — |
|
| Proceeds from sale of properties and equipment | | 193,544 |
| | 23,140 |
| | 23,369 |
|
| Other | | — |
| | 849 |
| | (3,527 | ) |
| Net cash from investing activities | | (451,939 | ) | | (456,401 | ) | | (300,932 | ) |
| Cash flows from financing activities: | | | | | | |
| Proceeds from revolving credit facility | | 682,000 |
| | 417,194 |
| | 414,500 |
|
| Payment of revolving credit facility | | (839,750 | ) | | (183,713 | ) | | (494,500 | ) |
| Proceeds from senior notes offering | | 500,000 |
| | — |
| | 115,000 |
|
| Redemption of senior notes | | (221,840 | ) | | — |
| | — |
|
| Payment of debt issuance costs | | (11,969 | ) | | (680 | ) | | (8,541 | ) |
| Proceeds from sale of common stock, net of issuance costs | | 164,496 |
| | — |
| | 125,506 |
|
| Excess tax benefits from stock-based compensation | | — |
| | 1,311 |
| | 293 |
|
| Contribution from noncontrolling interest | | — |
| | 12,464 |
| | 20,077 |
|
| Purchase of treasury shares | | (1,500 | ) | | (3,143 | ) | | (788 | ) |
| Net cash from financing activities | | 271,437 |
| | 243,433 |
| | 171,547 |
|
| Net change in cash and cash equivalents | | (5,781 | ) | | (46,134 | ) | | 22,428 |
|
| Cash and cash equivalents, beginning of year | | 8,238 |
| | 54,372 |
| | 31,944 |
|
| Cash and cash equivalents, end of year | | $ | 2,457 |
| | $ | 8,238 |
| | $ | 54,372 |
|
| | | | | | | |
| Supplemental cash flow information: | | | | | | |
| Cash payments (receipts) for: | | | | | | |
| Interest, net of capitalized interest | | $ | 41,768 |
| | $ | 29,429 |
| | $ | 28,335 |
|
| Income taxes | | 1,845 |
| | (1,498 | ) | | (27,322 | ) |
| Non-cash investing activities: | | | | | | |
| Change in accounts payable related to purchases of properties and equipment | | 288 |
| | 23,837 |
| | 15,787 |
|
| Change in asset retirement obligation, with a corresponding change to natural gas and crude oil properties, net of disposals | | 11,967 |
| | 17,538 |
| | 3,624 |
|
| Non-cash financing activities: | | | | | | |
| Change in paid-in capital related to convertible debt, net of tax | | — |
| | — |
| | 12,850 |
|
See Note 15, Acquisitions, for non-cash transactions related to our acquisitions | | | | | | |
See accompanying Notes to Consolidated Financial Statements
F- 6
PDC ENERGY, INC.
Consolidated Statements of Equity
(in thousands, except share and per share data)
|
| | | | | | | | | | | | |
| Year Ended December 31, | | 2012 | | 2011 | | 2010 |
| Common shares, issued: | | | | | | |
| Shares beginning of year | | 23,634,958 |
| | 23,462,326 |
| | 19,242,219 |
|
| Shares issued pursuant to sale of equity | | 6,500,000 |
| | — |
| | 4,140,000 |
|
| Exercise of stock options | | — |
| | 2,814 |
| | — |
|
| Issuance of stock awards, net of forfeitures | | 173,737 |
| | 242,334 |
| | 110,680 |
|
| Retirement of treasury shares | | (14,471 | ) | | (72,516 | ) | | (30,573 | ) |
| Shares end of year | | 30,294,224 |
| | 23,634,958 |
| | 23,462,326 |
|
| Treasury shares: | | | | | | |
| Shares beginning of year | | 2,938 |
| | 2,938 |
| | 8,273 |
|
| Purchase of treasury shares | | 44,576 |
| | 87,588 |
| | 30,573 |
|
| Issuance of treasury shares | | (28,587 | ) | | (15,072 | ) | | — |
|
| Retirement of treasury shares | | (14,471 | ) | | (72,516 | ) | | (30,573 | ) |
| Non-employee directors' deferred compensation plan | | 603 |
| | — |
| | (5,335 | ) |
| Shares end of year | | 5,059 |
| | 2,938 |
| | 2,938 |
|
| Common shares outstanding | | 30,289,165 |
| | 23,632,020 |
| | 23,459,388 |
|
| | | | | | | |
| Equity: | | | | | | |
| Shareholders' equity | | | | | | |
| Preferred shares, par value $0.01 per share: | | | | | | |
| Balance beginning and end of year | | $ | — |
| | $ | — |
| | $ | — |
|
| Common shares, par value $0.01 per share: | | | | | | |
| Balance beginning of year | | 236 |
| | 235 |
| | 192 |
|
| Shares issued pursuant to sale of equity | | 65 |
| | — |
| | 41 |
|
| Issuance of stock awards, net of forfeitures | | 2 |
| | 1 |
| | 2 |
|
| Balance end of year | | 303 |
| | 236 |
| | 235 |
|
| Additional paid-in capital: | | | | | | |
| Balance beginning of year | | 217,707 |
| | 209,198 |
| | 64,406 |
|
| Proceeds from sale of equity, net of issuance costs | | 164,431 |
| | — |
| | 125,465 |
|
| Convertible debt discount, net of issuance costs and tax | | — |
| | — |
| | 12,165 |
|
| Stock-based compensation expense | | 8,495 |
| | 8,781 |
| | 5,314 |
|
| Issuance of treasury shares | | (955 | ) | | (472 | ) | | — |
|
| Retirement of treasury shares | | (491 | ) | | (2,671 | ) | | (788 | ) |
| Tax impact of stock-based compensation | | (1,693 | ) | | 785 |
| | (166 | ) |
| Contribution by investing partner in PDCM | | — |
| | 12,464 |
| | 20,077 |
|
| Effect of PDCM deconsolidation/change in ownership interest | | — |
| | (10,378 | ) | | (17,275 | ) |
| Balance end of year | | 387,494 |
| | 217,707 |
| | 209,198 |
|
| Retained earnings: | | | | | | |
| Balance beginning of year | | 446,280 |
| | 432,843 |
| | 426,629 |
|
| Net income (loss) attributable to shareholders | | (130,712 | ) | | 13,437 |
| | 6,214 |
|
| Balance end of year | | 315,568 |
| | 446,280 |
| | 432,843 |
|
| Treasury shares, at cost: | | | | | | |
| Balance beginning of year | | (111 | ) | | (111 | ) | | (312 | ) |
| Purchase of treasury shares | | (1,500 | ) | | (3,143 | ) | | (788 | ) |
| Issuance of treasury shares | | 955 |
| | 472 |
| | — |
|
| Retirement of treasury shares | | 491 |
| | 2,671 |
| | 788 |
|
| Non-employee directors' deferred compensation plan | | (19 | ) | | — |
| | 201 |
|
| Balance end of year | | (184 | ) | | (111 | ) | | (111 | ) |
| Total shareholders' equity | | 703,181 |
| | 664,112 |
| | 642,165 |
|
| Noncontrolling interests in subsidiary | | | | | | |
| Balance beginning of year | | — |
| | 76 |
| | 47,678 |
|
| Noncontrolling interest in PDC Mountaineer, LLC | | — |
| | — |
| | (47,322 | ) |
| Net loss attributed to noncontrolling interest in subsidiary | | — |
| | (76 | ) | | (280 | ) |
| Balance end of year | | — |
| | — |
| | 76 |
|
| Total noncontrolling interests in subsidiary | | — |
| | — |
| | 76 |
|
| Total Equity | | $ | 703,181 |
| | $ | 664,112 |
| | $ | 642,241 |
|
| | | | | | | |
See accompanying Notes to Consolidated Financial Statements
F- 7
PDC ENERGY, INC.
NOTES TO CONSOLIDATED FINANCIAL STATEMENTS - Continued
The following table presents gross volume information, including our proportionate share of PDCM, related to our long-term firm transportation, sales and processing agreements for pipeline capacity:
|
| | | | | | | | | | | | | | | | | | | | | | | | | | |
| | | Year Ending December 31, | | | | |
| Area | | 2014 | | 2015 | | 2016 | | 2017 | | 2018 and
Through
Expiration | | Total | | Expiration
Date |
| | | | | | | | | | | | | | | |
| Volume (MMcf) | | | | | | | | | | | | | | |
| Appalachia-Marcellus Shale | | 18,212 |
| | 19,485 |
| | 21,044 |
| | 20,987 |
| | 125,336 |
| | 205,064 |
| | January 31, 2026 |
| Utica Shale | | 2,454 |
| | 2,738 |
| | 2,745 |
| | 2,737 |
| | 15,285 |
| | 25,959 |
| | July 22, 2023 |
| Total | | 20,666 |
| | 22,223 |
| | 23,789 |
| | 23,724 |
| | 140,621 |
| | 231,023 |
| | |
| | | | | | | | | | | | | | | |
| Dollar commitment (in thousands) | | $ | 7,547 |
| | $ | 7,907 |
| | $ | 8,230 |
| | $ | 7,790 |
| | $ | 38,526 |
| | $ | 70,000 |
| | |
| | | | | | | | | | | | | | | |
In March 2013, we entered into long-term agreements with a subsidiary of MarkWest Energy Partners, LP to provide midstream services, including gas gathering, processing, fractionation and marketing, to support our northern Utica Shale operations. The primary term of the agreements commenced in July 2013 when our natural gas began to flow into the gathering system. The gas processing agreement includes minimum volume commitments as shown in the table above, with certain fees assessed for any shortfall.
Litigation. The Company is involved in various legal proceedings that it considers normal to its business. The Company reviews the status of these proceedings on an ongoing basis and, from time to time, may settle or otherwise resolve these matters on terms and conditions that management believes are in the best interests of the Company. There is no assurance that settlements can be reached on acceptable terms or that adverse judgments, if any, in the remaining litigation will not exceed the amounts reserved. Although the results cannot be known with certainty, we currently believe that the ultimate results of such proceedings will not have a material adverse effect on our financial position, results of operations or liquidity.
Alleged Class Action Regarding 2010 and 2011 Partnership Purchases
In December 2011, the Company and its wholly-owned merger subsidiary were served with an alleged class action on behalf of certain former partnership unit holders, related to its partnership repurchases completed by mergers in 2010 and 2011. The action was filed in U.S. District Court for the Central District of California and is titled Schulein v. Petroleum Development Corp. The complaint primarily alleges that the disclosures in the proxy statements issued in connection with the mergers were inadequate, and a state law breach of fiduciary duty. In June 2012, the Court denied the Company's motion to dismiss. In January 2014, the plaintiffs were conditionally certified as a class by the court. Jury trial is scheduled for May 2014. We have not recorded a liability for claims pending because we believe we have good legal defenses to the asserted claims and it is not possible for management to reasonably estimate monetary damages resulting from this claim.
Environmental. Due to the nature of the natural gas and oil industry, we are exposed to environmental risks. We have various policies and procedures to avoid environmental contamination and mitigate the risks from environmental contamination. We conduct periodic reviews to identify changes in our environmental risk profile. Liabilities are recorded when environmental damages resulting from past events are probable and the costs can be reasonably estimated. As of December 31, 2013 and December 31, 2012, we had accrued environmental liabilities in the amount of $5.4 million and $8.4 million, respectively, included in other accrued expenses on the consolidated balance sheet. We are not aware of any environmental claims existing as of December 31, 2013 which have not been provided for or would otherwise have a material impact on our financial statements. However, there can be no assurance that current regulatory requirements will not change or unknown past non-compliance with environmental laws will not be discovered on our properties.
Lease Agreements. We entered into operating leases, principally for the leasing of natural gas compressors, office space and general office equipment.
The following table presents the minimum future lease payments under the non-cancelable operating leases as of December 31, 2013:
|
| | | | | | | | | | | | | | | | | | | | | | | | | | | | |
| | | Year Ending December 31, | | | | |
| | | 2014 | | 2015 | | 2016 | | 2017 | | 2018 | | Thereafter | | Total |
| | | (in thousands) |
| | | | | | | | | | | | | | | |
| Minimum Lease Payments | | $ | 2,427 |
| | $ | 1,970 |
| | $ | 471 |
| | $ | 257 |
| | $ | 34 |
| | $ | 941 |
| | $ | 6,100 |
|
| | | | | | | | | | | | | | | |
Operating lease expense for the years ended 2013, 2012 and 2011 was $7 million, $6.1 million and $5.9 million, respectively.
PDC ENERGY, INC.
NOTES TO CONSOLIDATED FINANCIAL STATEMENTS - Continued
Employment Agreements with Executive Officers. Each of our senior executive officers may be entitled to a severance payment and certain other benefits upon the termination of the officer's employment pursuant to the officer's employment agreement and/or the Company's executive severance compensation plan. The nature and amount of such benefits would vary based upon, among other things, whether the termination followed a change of control of the Company.
See Note 16, Transactions With Affiliates, for a discussion related to the separation agreement entered into with our former chief executive officer in 2011.
NOTE 12 - COMMON STOCK
Sale of Equity Securities
In August 2013, we completed a public offering of 5,175,000 shares of our common stock, par value $0.01 per share, at a price to us of $53.37 per share. Net proceeds of the offering were approximately $275.8 million, after deducting offering expenses and underwriting discounts, of which $51,750 is included in common shares-par value and approximately $275.8 million is included in APIC on the consolidated balance sheet. The shares were issued pursuant to an effective shelf registration statement on Form S-3 filed with the SEC in January 2012.
In May 2012, we completed a public offering of 6,500,000 shares of our common stock at an offering price of $26.50 per share. Net proceeds of the offering were approximately $164.5 million, after deducting underwriting discounts and commissions and offering expenses, of which $65,000 is included in common shares-par value and $164.4 million is included in APIC on the consolidated balance sheet. The shares were issued pursuant to an effective shelf registration statement on Form S-3 filed with the SEC in January 2012.
Stock-Based Compensation Plans
2010 Long-Term Equity Compensation Plan. In June 2010, our shareholders approved a long-term equity compensation plan for our employees and non-employee directors (the "2010 Plan"). The plan was amended in June 2013. In accordance with the 2010 Plan, up to 3,000,000 new shares of our common stock are authorized for issuance. Shares issued may be either authorized but unissued shares, treasury shares or any combination of these shares. Additionally, the 2010 Plan permits the reuse or reissuance of shares of common stock which were canceled, expired, forfeited or, in the case of stock appreciation rights ("SARs"), paid out in the form of cash. Awards may be issued to our employees in the form of incentive or non-qualified stock options, SARs, restricted stock, restricted stock units ("RSUs"), performance shares and performance units, and to our non-employee directors in the form of non-qualified stock options, SARs, restricted stock and RSUs. Awards may vest over periods set at the discretion of the Compensation Committee of our Board of Directors (the "Compensation Committee") with certain minimum vesting periods. With regard to incentive or non-qualified stock options and SARs, awards have a maximum exercisable period of ten years. In no event may an award be granted under the 2010 Plan on or after April 1, 2020. As of December 31, 2013, 1,708,107 shares remain available for issuance pursuant to the 2010 Plan.
2004 Long-Term Equity Compensation Plan. As approved by the shareholders in June 2004, we maintain a long-term equity compensation plan for our officers and certain key employees (the "2004 Plan"). Awards pursuant to the plan vest over periods set at the discretion of the Compensation Committee and, with regard to options, have a maximum exercisable period of ten years. We no longer issue awards pursuant to the 2004 Plan. As of December 31, 2013, all awards granted pursuant to the 2004 Plan had vested and are exercisable through April 19, 2020.
PDC ENERGY, INC.
NOTES TO CONSOLIDATED FINANCIAL STATEMENTS - Continued
The following table provides a summary of the impact of our outstanding stock-based compensation plans on the results of operations for the periods presented:
|
| | | | | | | | | | | | |
| | | Year Ended December 31, |
| | | 2013 | | 2012 | | 2011(1) |
| | | (in thousands) |
| | | | | | | |
| Stock-based compensation expense | | $ | 12,880 |
| | $ | 8,495 |
| | $ | 8,781 |
|
| Income tax benefit | | (4,697 | ) | | (3,245 | ) | | (3,344 | ) |
| Net stock-based compensation expense | | $ | 8,183 |
| | $ | 5,250 |
| | $ | 5,437 |
|
| | | | | | | |
__________
(1) Includes a $2.5 million pre-tax charge related to a separation agreement with our former chief executive officer. See Note 16, Transactions with Affiliates, for additional information regarding the related separation agreement.
Stock Option Awards
We have granted stock options pursuant to various stock compensation plans. Outstanding options expire ten years from the date of grant and become exercisable ratably over a four year period. We have not issued any new stock option awards since 2006. As of December 31, 2013, all compensation cost related to stock options has been fully recognized in our consolidated statements of operations.
The following table presents the changes in our stock option awards. The aggregate intrinsic value of options outstanding for each period presented was immaterial:
|
| | | | | | | | | | | | | | | | | | | | | | | | | | | |
| | Year Ended December 31, |
| | 2013 | | 2012 | | 2011 |
| | Number of
Shares
Underlying
Options | | Weighted-Average
Exercise
Price
Per Share | | Weighted- Average
Remaining
Contractual
Term (in years) | | Aggregate Intrinsic
Value (in thousands) | | Number of
Shares
Underlying
Options | | Weighted-Average
Exercise
Price
Per Share | | Number of
Shares
Underlying
Options | | Weighted-Average
Exercise
Price
Per Share |
| Outstanding beginning of year, January 1, | 6,973 |
| | $ | 41.09 |
| | 2.6 |
| | $ | — |
| | 6,973 |
| | $ | 41.09 |
| | 10,306 |
| | $ | 41.90 |
|
| Exercised | (3,450 | ) | | 37.15 |
| | — |
| | 77 |
| | — |
| | — |
| | — |
| | — |
|
| Forfeited | — |
| | — |
| | — |
| | — |
| | — |
| | — |
| | (3,333 | ) | | 43.60 |
|
| Outstanding end of year, December 31, | 3,523 |
| | 44.95 |
| | 2.2 |
| | 29 |
| | 6,973 |
| | 41.09 |
| | 6,973 |
| | 41.09 |
|
| Exercisable at December 31, | 3,523 |
| | 44.95 |
| | 2.2 |
| | 29 |
| | 6,973 |
| | 41.09 |
| | 6,973 |
| | 41.09 |
|
SARs
The SARs vest ratably over a three-year period and may be exercised at any point after vesting through 10 years from the date of issuance. Pursuant to the terms of the awards, upon exercise, the executive officers will receive, in shares of common stock, the excess of the market price of the award on the date of exercise over the market price of the award on the date of issuance.
In January 2013, the Compensation Committee awarded 87,078 SARs to our executive officers. The fair value of each SAR award was estimated on the date of grant using a Black-Scholes pricing model using the following assumptions:
|
| | | | | | | | | | | |
| | Year Ended December 31, |
| | 2013 | | 2012 | | 2011 |
| | | | | | |
| Expected term of award | 6 years |
| | 6 years |
| | 6 years |
|
| Risk-free interest rate | 1.0 | % | | 1.1 | % | | 2.5 | % |
| Expected volatility | 65.5 | % | | 64.3 | % | | 60.2 | % |
| Weighted-average grant date fair value per share | $ | 21.96 |
| | $ | 17.61 |
| | $ | 25.22 |
|
The expected life of the award was estimated using historical stock option exercise behavior data. The risk-free interest rate was based on the U.S. Treasury yields approximating the expected life of the award in effect at the time of grant. Expected volatilities were based on our historical volatility. We do not expect to pay or declare dividends in the foreseeable future.
PDC ENERGY, INC.
NOTES TO CONSOLIDATED FINANCIAL STATEMENTS - Continued
The following table presents the changes in our SARs:
|
| | | | | | | | | | | | | | | | | | | | | | | | | | | | | | | | | | | |
| | Year Ended December 31, |
| | 2013 | | 2012 | | 2011 |
| | Number of
SARs | | Weighted-Average
Exercise
Price | | Average Remaining Contractual
Term (in years) | | Aggregate Intrinsic
Value (in thousands) | | Number of
SARs | | Weighted-Average
Exercise
Price | | Aggregate Intrinsic
Value (in thousands) | | Number of
SARs | | Weighted-Average
Exercise
Price | | Aggregate Intrinsic
Value (in thousands) |
| Outstanding beginning of year, January 1, | 118,832 |
| | $ | 30.80 |
| | 8.4 |
| | $ | 486 |
| | 50,471 |
| | $ | 31.61 |
| | $ | 341 |
| | 57,282 |
| | $ | 24.44 |
| | $ | 1,020 |
|
| Awarded | 87,078 |
| | 37.18 |
| | — |
| | — |
| | 68,361 |
| | 30.19 |
| | — |
| | 31,552 |
| | 43.95 |
| | — |
|
| Exercised | (15,147 | ) | | 30.06 |
| | — |
| | 425 |
| | — |
| | — |
| | — |
| | (25,371 | ) | | 24.44 |
| | 77 |
|
| Forfeited | — |
| | — |
| | — |
| | — |
| | — |
| | — |
| | — |
| | (12,992 | ) | | 43.95 |
| | — |
|
| Outstanding at December 31, | 190,763 |
| | 33.77 |
| | 8.2 |
| | 3,711 |
| | 118,832 |
| | 30.80 |
| | 486 |
| | 50,471 |
| | 31.61 |
| | 341 |
|
| Exercisable at December 31, | 51,922 |
| | 29.97 |
| | 7.1 |
| | 1,207 |
| | 27,458 |
| | 28.84 |
| | 187 |
| | 10,636 |
| | 24.44 |
| | 114 |
|
Total compensation cost related to SARs granted, net of estimated forfeitures, and not yet recognized in our consolidated statement of operations as of December 31, 2013, was $1.7 million. The cost is expected to be recognized over a weighted-average period of1.8years.
Restricted Stock Awards
Time-Based Awards.The fair value of the time-based restricted shares is amortized ratably over the requisite service period, primarily three or four years. The time-based shares vest ratably on each annual anniversary following the grant date that a participant is continuously employed.
In January 2013, the Compensation Committee awarded a total of 103,050 time-based restricted shares to our executive officers that vest ratably over the three year period ending on January 16, 2016.
The following table presents the changes in non-vested time-based awards during 2013:
|
| | | | | | |
| | Shares | | Weighted-Average
Grant-Date
Fair Value |
| | | | |
| Non-vested at December 31, 2012 | 646,490 |
| | $ | 27.93 |
|
| Granted | 311,051 |
| | 45.53 |
|
| Vested | (282,787 | ) | | 27.57 |
|
| Forfeited | (22,973 | ) | | 31.52 |
|
| Non-vested at December 31, 2013 | 651,781 |
| | 36.36 |
|
| | | | |
|
| | | | | | | | | | | |
| | As of/Year Ended December 31, |
| | 2013 | | 2012 | | 2011 |
| | (in thousands, except per share data) |
| | | | | | |
| Total intrinsic value of time-based awards vested | $ | 13,640 |
| | $ | 5,950 |
| | $ | 9,030 |
|
| Total intrinsic value of time-based awards non-vested | 34,688 |
| | 21,470 |
| | 18,531 |
|
| Market price per common share as of December 31, | 53.22 |
| | 33.21 |
| | 35.11 |
|
| Weighted-average grant date fair value per share | 45.53 |
| | 26.59 |
| | 33.71 |
|
Total compensation cost related to non-vested time-based awards, net of estimated forfeitures, and not yet recognized in our consolidated statements of operations as of December 31, 2013 was$15.7 million. This cost is expected to be recognized over a weighted-average period of 2.0years.
Market-Based Awards.The fair value of the market-based restricted shares is amortized ratably over the requisite service period, primarily three years. The market-based shares vest if the participant is continuously employed throughout the performance period and the market-based performance measure is achieved, with a maximum vesting period of five years. All compensation cost related to the market-based awards will be recognized if the requisite service period is fulfilled, even if the market condition is not achieved.
PDC ENERGY, INC.
NOTES TO CONSOLIDATED FINANCIAL STATEMENTS - Continued
In January 2013, the Compensation Committee awarded a total of 41,570 market-based restricted shares to our executive officers. In addition to continuous employment, the vesting of these shares is contingent on the Company's total shareholder return ("TSR"), which is essentially the Company’s stock price change including any dividends, as compared to the TSR of a set group of 15 peer companies. The shares are measured over a three-year period ending on December 31, 2014 and can result in a payout between 0% and 200% of the total shares awarded. The weighted-average grant date fair value per market-based share for these awards granted was computed using the Monte Carlo pricing model using the following assumptions:
|
| | | | | | | | |
| | | Year Ended December 31, |
| | | 2013 | | 2012 |
| | | | | |
| Expected term of award | | 3 years |
| | 3 years |
|
| Risk-free interest rate | | 0.4 | % | | 0.3 | % |
| Expected volatility | | 56.6 | % | | 65.3 | % |
| Weighted-average grant date fair value per share | | $ | 49.04 |
| | $ | 36.54 |
|
The expected term of the awards was based on the requisite service period. The risk-free interest rate was based on the U.S. Treasury yields in effect at the time of grant and extrapolated to approximate the life of the award. The expected volatility was based on our historical volatility.
The following table presents the change in non-vested market-based awards during 2013:
|
| | | | | | | |
| | | Shares
| | Weighted-Average
Grant-Date
Fair Value per Share
|
| | | | | |
Non-vested at December 31, 2012
| | 40,696 |
| | $ | 39.22 |
|
Granted
| | 41,570 |
| | 49.04 |
|
Vested
| | (10,155 | ) | | 47.28 |
|
Non-vested at December 31, 2013
| | 72,111 |
| | 43.75 |
|
| | | | | |
|
| | | | | | | | | | | |
| | As of/Year Ended December 31, |
| | 2013 | | 2012 | | 2011 |
| | (in thousands, except per share data) |
| | | | | | |
| Total intrinsic value of market-based awards vested | $ | 724 |
| | $ | — |
| | $ | 366 |
|
| Total intrinsic value of market-based awards non-vested | 3,838 |
| | 1,352 |
| | 1,513 |
|
| Market price per common share as of December 31, | 53.22 |
| | 33.21 |
| | 35.11 |
|
| Weighted-average grant date fair value per share | 49.04 |
| | 36.54 |
| | 58.53 |
|
Total compensation cost related to non-vested market-based awards, net of estimated forfeitures, and not yet recognized in our consolidated statement of operations as of December 31, 2013 was $1.7 million. This cost is expected to be recognized over a weighted-average period of1.8years.
Treasury Share Purchases
In accordance with our stock-based compensation plans, employees and directors may surrender shares of the Company's common stock to pay tax withholding obligations upon the vesting and exercise of share-based awards. Shares acquired that had been issued pursuant to the 2004 Plan are retired, while those issued pursuant to the 2010 Plan are reissued to service awards. For shares that are retired, we first charge any excess of cost over the par value to APIC to the extent we have amounts in APIC, with any remaining excess cost charged to retained earnings. For shares reissued to service awards under the 2010 Plan, shares are recorded at cost and upon reissuance we reduce the carrying value of shares acquired and held pursuant to the 2010 Plan by the weighted-average cost per share with an offsetting charge to APIC. During the year ended December 31, 2013, we acquired 84,642 shares pursuant to our stock-based compensation plans for payment of tax liabilities, of which 17,257shares were retired, 67,334 shares were reissued and 51 shares are available for reissuance pursuant to our 2010 Plan.
PDC ENERGY, INC.
NOTES TO CONSOLIDATED FINANCIAL STATEMENTS - Continued
Shareholders’ Rights Agreement
In 2007, we entered into a rights agreement. The rights agreement is designed to improve the ability of our Board to protect the interest of our shareholders in the event of an unsolicited takeover attempt. Our Board declared a dividend of one right for each outstanding share of our common stock. The right dividend was paid to shareholders of record in September 2007. A "distribution date," as defined in the rights agreement, can occur after any individual shareholder exceeds 15% ownership of our outstanding common stock. In certain circumstances, the right entitles each holder, other than an "acquiring person" (as defined in the agreement), to purchase shares of our common stock (or, in certain circumstances, cash, property or other securities) having a then-current value equal to two times the exercise price of the right (i.e., for the $240 exercise price, the rights holder receives $480 worth of common stock). The exercise price is subject to adjustment for various corporate actions which affect all shareholders, such as a stock split. The rights agreement and all rights will expire in September 2017.
Preferred stock
We are authorized, pursuant to shareholder approval in 2008, to issue 50,000,000 shares of preferred stock, par value $0.01, which may be issued in one or more series, with such rights, preferences, privileges and restrictions as shall be fixed by our Board from time to time. As of December 31, 2013, no preferred shares had been issued.
NOTE 113 - NATURE OF OPERATIONS AND BASIS OF PRESENTATIONEARNINGS PER SHARE
PDC Energy, Inc. ("PDC," "PDC Energy," "we," "us" or "the Company")Basic earnings per share is a domestic independent natural gascomputed by dividing net earnings by the weighted-average number of common shares outstanding for the period. Diluted earnings per share is similarly computed except that the denominator includes the effect, using the treasury stock method, of unvested restricted stock, outstanding SARs, stock options, convertible notes and crude oil company engaged in the exploration for and the acquisition, development, production and marketingshares held pursuant to our non-employee director deferred compensation plan, if including such potential shares of natural gas, NGLs and crude oil. As of December 31, 2012, we owned an interest in approximately 7,200 gross wells located primarily in the Wattenberg Field, Utica Shale, Appalachian Basin, northeast Colorado and Piceance Basin. We are engaged in two business segments: (1) Oil and Gas Exploration and Production and (2) Gas Marketing.
The consolidated financial statements include the accounts of PDC, our wholly owned subsidiaries, an entity in which we have a controlling financial interest (2010 only) and our proportionate share of PDC Mountaineer, LLC ("PDCM") and our 21 affiliated partnerships. Pursuant to the proportionate consolidation method, our accompanying consolidated financial statements include our pro rata share of assets, liabilities, revenues and expenses of the entities which we proportionately consolidate. All material intercompany accounts and transactions have been eliminated in consolidation.common stock is dilutive.
The preparationfollowing table presents a reconciliation of our consolidated financial statements in accordance with accounting principles generally accepted in the United States of America ("U.S. GAAP") requires us to make estimates and assumptions that affect the amounts reported in our consolidated financial statements and accompanying notes. Actual results could differ from those estimates. Estimates which are particularly significant to our consolidated financial statements include estimates of natural gas, NGLs and crude oil sales revenue, natural gas, NGLs and crude oil reserves, future cash flows from natural gas and crude oil properties, valuation of derivative instruments and valuation of deferred income tax assets.weighted-average diluted shares outstanding:
Certain reclassifications have been made to prior period financial statements to conform to the current year presentation. Accretion of asset retirement obligations have been reclassified out of the statement of operations line item production cost and into accretion of asset retirement obligations. Deferred income taxes have been reclassified out of the balance sheet line item prepaid expenses and other current assets and into deferred income taxes. We also reclassified prepaid well costs write-offs out of the statement of cash flows line item changes in other assets and into prepaid well costs write-offs. These reclassifications had no impact on previously reported cash flows, net income, earnings per share or shareholders' equity.
NOTE 2 - SUMMARY OF SIGNIFICANT ACCOUNTING POLICIES |
| | | | | | | | |
| | Year Ended December 31, |
| | 2013 | | 2012 | | 2011 |
| | (in thousands) |
| | | | | | |
| Weighted-average common shares outstanding - basic | 32,426 |
| | 27,677 |
| | 23,521 |
|
| Dilutive effect of: | | | | | |
| Restricted stock | — |
| | — |
| | 307 |
|
| SARs | — |
| | — |
| | 40 |
|
| Non-employee director deferred compensation | — |
| | — |
| | 3 |
|
| Weighted-average common shares and equivalents outstanding - diluted | 32,426 |
| | 27,677 |
| | 23,871 |
|
| | | | | | |
Cash Equivalents. We consider all highly liquid investments with original maturities of three months or less to be cash equivalents.
Restricted Cash. Pursuant to an oral litigation settlement agreement, in July 2011, we funded an escrow account in the amount of $8.7 million. During 2012, approvalFor 2013 and settlement occurred and the $8.7 million was released from the escrow account thereby reducing our restricted cash balance. In conjunction with our acquisition of certain Wattenberg assets in 2012, we funded an escrow account with $1.7 million.
We are required by certain government agencies or agreements to maintain bonds or cash accounts for various operating activities.reported a net loss. As of December 31, 2012, we had collateral ina result, our basic and diluted weighted-average common shares outstanding were the form of certificates of deposit and cash totaling $5.3 million which consisted of $3.9 million and $1.4 million included in restricted cash and other assets, respectively. As of December 31, 2011, we had collateral in the form of certificates of deposit and cash totaling $3.8 million which consisted of $2.3 million and $1.5 million included in restricted cash and other assets, respectively.
Inventory. Inventory consists of crude oil, stated at the lower of cost to produce or market, and other production supplies intended to be used in our natural gas and crude oil operations. As of December 31, 2012 and 2011, inventory of $1.2 million and $1.1 million, respectively, is included in prepaid expenses and other current assets on the balance sheets.
Derivative Financial Instruments. We are exposed tosame as the effect of market fluctuations in the prices of natural gas and crude oil. We employ established policies and procedures to manage a portion of the risks associated with these market fluctuations using commodity derivative instruments. Our policy prohibits the use of natural gas and crude oil derivative instruments for speculative purposes.common share equivalents was anti-dilutive.
All derivative assets and liabilities are recorded on our balance sheets at fair value. We have elected not to designate any of our derivative instruments as hedges. Classification of realized and unrealized gains and losses resulting from maturities and changes in fair value of open derivatives depends on the purpose for issuing or holding the derivative. Accordingly, changes in the fair value of our derivative instruments are recorded in the statements of operations, with the exception of changes in fair value related to those derivatives we designated to our affiliated partnerships. Changes in the fair value of derivative instruments related to our Oil and Gas Exploration and Production segment are recorded in commodity price risk management, net. Changes in the fair value of derivative instruments related to our Gas Marketing segment are recorded in sales from and cost of natural gas marketing. Changes in the fair value of the derivative instruments designated to our affiliated partnerships are recorded on the balance sheets in accounts payable affiliates and accounts receivable affiliates. As positions designated to our affiliated partnerships settle, the realized gains and losses are netted for distribution. Net realized gains are paid to the partnerships and net realized losses are deducted from the partnerships’ cash distributions from production. The affiliated partnerships bear their designated share of counterparty risk.
The validation of the derivative instrument's fair value is performed internally and, while we use common industry practices to develop our valuation techniques, changes in our pricing methodologies or the underlying assumptions could result in significantly different fair values. See Notes 3, Fair Value of Financial Instruments, and 4, Derivative Financial Instruments, for a discussion of our derivative fair value measurements and a summary fair value table of our open positions as of December 31, 2012 and 2011, respectively.
PDC ENERGY, INC.
NOTES TO CONSOLIDATED FINANCIAL STATEMENTS - Continued
Properties and Equipment. Significant accounting polices related to our properties and equipment are discussed below.
Natural Gas and Crude Oil Properties.We account for our natural gas and crude oil properties under the successful efforts method of accounting. Costs of proved developed producing properties, successful exploratory wells and developmental dry hole costs are capitalized and depreciated or depleted by the unit-of-production method based on estimated proved developed producing reserves. Property acquisition costs are depreciated or depleted on the unit-of-production method based on estimated proved reserves. We calculate quarterly depreciation, depletion and amortization ("DD&A") expense by using our estimated prior period-end reserves as the denominator, with the exception of our fourth quarter where we use the year-end reserve estimate adjusted to add back fourth quarter production. Upon the sale or retirement of significant portions of or complete fields of depreciable or depletable property, the net book value thereof, less proceeds or salvage value, is recognized in the statement of operations as a gain or loss. Upon the sale of individual wells or a portion of a field, the proceeds are credited to accumulated DD&A.
Exploration costs, including geological and geophysical expenses and delay rentals, are charged to expense as incurred. Exploratory well drilling costs, including the cost of stratigraphic test wells, are initially capitalized, but charged to expense if the well is determined to be economically nonproductive. The status of each in-progress well is reviewed quarterly to determine the proper accounting treatment under the successful efforts method of accounting. Exploratory well costs continue to be capitalized as long as we have found a sufficient quantity of reserves to justify completion as a producing well, we are making sufficient progress assessing our reserves and economic and operating viability or we have not made sufficient progress to allow for final determination of productivity. If an in-progress exploratory well is found to be economically unsuccessful prior to the issuance of the financial statements, the costs incurred prior to the end of the reporting period are charged to exploration expense. If we are unable to make a final determination about the productive status of a well prior to issuance of the financial statements, the costs associated with the well are classified as "suspended well costs" until we have had sufficient time to conduct additional completion or testing operations to evaluate the pertinent geological and engineering data obtained. At the time we are able to make a final determination of a well’s productive status, the well is removed from suspended well status and the proper accounting treatment is recorded. See Note 6, Properties and Equipment, for disclosure related to changes in our capitalized exploratory well costs.
Proved Property Impairment. We assess our producing natural gas and crude oil properties for possible impairment, upon a triggering event, by comparing net capitalized costs, or carrying value, to estimated undiscounted future net cash flows on a field-by-field basis using estimated production based upon prices at which we reasonably estimate the commodity to be sold. The estimates of future prices may differ from current market prices of natural gas and crude oil. Certain events, including but not limited to downward revisions in estimates to our reserve quantities, expectations of falling commodity prices or rising operating costs, could result in a triggering event and, therefore, a possible impairment of our proved natural gas and crude oil properties. If net capitalized costs exceed undiscounted future net cash flows, the measurement of impairment is based on estimated fair value utilizing a future discounted cash flows analysis and is measured by the amount by which the net capitalized costs exceed their fair value. Impairments are included in the statement of operations line item impairment of natural gas and crude oil properties, with a corresponding impact on accumulated depreciation, depletion and amortization on the balance sheet.
Unproved Property Impairment. The acquisition costs of unproved properties are capitalized when incurred, until such properties are transferred to proved properties or charged to expense when expired, impaired or amortized. Unproved natural gas and crude oil properties with individually significant acquisition costs are periodically assessed for impairment. Unproved natural gas and crude oil properties which are not individually significant are amortized, by field, based on our historical experience, acquisition dates and average lease terms. Impairment and amortization charges related to unproved natural gas and crude oil properties are charged to the statement of operations line item impairment of natural gas and crude oil properties.
Other Property and Equipment.The following table presents the estimated useful livesweighted-average common share equivalents excluded from the calculation of our other property and equipment:diluted earnings per share due to their anti-dilutive effect:
|
| |
Pipelines and related facilities | 10 - 17 years |
Transportation and other equipment | 3 - 20 years |
Buildings | 30 - 40 years |
|
| | | | | | | | |
| | Year Ended December 31, |
| | 2013 | | 2012 | | 2011 |
| | (in thousands) |
| | | | | | |
| Weighted-average common share equivalents excluded from diluted earnings | | | | | |
| per share due to their anti-dilutive effect: | | | | | |
| Restricted stock | 823 |
| | 694 |
| | 220 |
|
| SARs | 72 |
| | 116 |
| | 22 |
|
| Stock options | 7 |
| | 7 |
| | 9 |
|
| Non-employee director deferred compensation | 4 |
| | 3 |
| | — |
|
| Convertible notes | 518 |
| | — |
| | — |
|
| Total anti-dilutive common share equivalents | 1,424 |
| | 820 |
| | 251 |
|
| | | | | | |
Other property and equipment is carriedIn November 2010, we issued our Convertible Notes, which give the holders the right to convert the aggregate principal amount into 2.7 million shares of our common stock at cost. Depreciation is provided principally on the straight-line method over the assets' estimated useful lives. We review these long-lived assets for impairment whenever events or changes in circumstances indicate that the carrying amounta conversion price of an asset may not$42.40 per share. The Convertible Notes could be recoverable. Recoverability of assets to be held and used is measured by a comparison of the carrying amount of the asset to estimated undiscounted future cash flows expected to be generated by the asset. If the carrying amount of the asset exceeds our estimated future cash flows, an impairment charge is recognizedincluded in the amount by whichdilutive earnings per share calculation using the carrying amount oftreasury stock method if the assetaverage market share price exceeds the fair value of the asset. No$42.40 impairment to other property and equipment was recognized in 2012 or 2011. Impairment recognized in 2010 was immaterial.
Maintenance and repair costs on other property and equipment are charged to expense as incurred. Major renewals and improvements are capitalized and depreciated overconversion price during the remaining useful life of the asset. Upon the sale or other disposition of assets, the cost and related accumulated DD&A are removed from the accounts, the proceeds are applied thereto and any resulting gain or loss is reflected in income. Total depreciation expense related to other property and equipment was $7.5 million, $6.7 million and $7.5 million in 2012, 2011 and 2010, respectively.
Capitalized Interest.Interest costs are capitalized as part of the historical cost of acquiring assets. Investments in unproved natural gas and crude oil properties and major development projects, on which DD&A is not currently recorded and on which exploration or development
PDC ENERGY, INC.
NOTES TO CONSOLIDATED FINANCIAL STATEMENTS - Continued
activities are in progress, qualify for capitalizationperiod presented. Shares issuable upon conversion of interest. Major construction projects also qualify for interest capitalization until the asset is ready to be placed into service. Capitalized interest is calculated by multiplying our weighted-average interest rate on our debt outstanding byConvertible Notes were excluded from the qualifying costs. Interest capitalized may not exceed gross interest expensediluted earnings per share calculation for the period. Asyear ended December 31, 2013 as the qualifying asset is placed into service, we begin amortizing the related capitalized interest over the useful lifeeffect would be anti-dilutive to our earnings per share. Shares issuable upon conversion of the asset. Capitalized interest totaled $1.2 million, $1.7 million and $0.3 million in 2012, 2011 and 2010, respectively.
Assets Held for Sale. Assets held for sale are valued at the lower of their carrying amount or estimated fair value less costs to sell. If the carrying amount of the assets exceeds their estimated fair value, an impairment loss is recognized. Fair values are estimated using accepted valuation techniques such as a discounted cash flow model, valuations performed by third parties, earnings multiples or indicative bids, when available. Management considers historical experience and all available information at the time the estimates are made; however, the fair values that are ultimately realized upon the sale of the assets to be divested may differConvertible Notes were excluded from the estimated fair values reflected indiluted earnings per share calculation for the consolidated financial statements. Depreciation, depletion, and amortization expense is not recorded on assets to be divested once they are classified as held for sale. Assets to be divested are classified in the consolidated financial statements as held for sale, and the activities of assets to be divested are classified either as discontinued operations or continuing operations. For assets classified as discontinued operations, the balance sheet amounts and results of operations are reclassified from their historical presentation to assets and liabilities held for sale on the consolidated balance sheets and to discontinued operations on the consolidated statements of operations, respectively, for all periods presented. The gains or losses associated with these divested assets are recorded in discontinued operations on the consolidated statements of operations. Management does not expect any continuing involvement with businesses classified as discontinued operations following their divestiture. Businesses classified as held for sale are expected to be disposed of within one year. For businesses classified as held for sale that do not qualify for discontinued operations treatment, the balance sheet amounts are reclassified from their historical presentation to assets and liabilities held for sale for all periods presented. The results of operations continue to be reported in continuing operations.
Production Tax Liability. Production tax liability represents estimated taxes, primarily severance, ad valorem and property, to be paid to the states and counties in which we produce natural gas, NGLs and crude oil, including the production of our affiliated partnerships. Our share of these taxes is expensed to production costs. The partnerships' share, not owned by us, is recognized as a receivable in accounts receivable affiliates on the balance sheets. The long-term portion of the production tax liability is included in other liabilities on the balance sheets and was $18.7 million and $19.4 million inyear ended December 31, 2012 and 2011, respectively. as the conversion price was greater than the average market price of our common stock during the period.
Income Taxes. We accountNOTE 14 - ASSETS HELD FOR SALE, DIVESTITURES AND DISCONTINUED OPERATIONS
The tables below set forth selected financial information related to net assets divested and operating results related to discontinued operations. Net assets held for income taxes undersale represents the asset and liability method. We recognize deferred tax assets and liabilities for the future tax consequences attributable to operating loss and future credit carryforwards and differences between the financial statement carrying amounts of existing assets and liabilities and their respective tax basis. Deferred tax assets and liabilities are measured using enacted tax rates expected to apply to taxable income in the years in which those temporary differencesthat were or are expected to be recoveredsold, net of liabilities, that were or settled. are expected to be assumed by the purchaser. While the reclassification of revenues and expenses related to discontinued operations for prior periods had no impact upon previously reported net earnings, the consolidated statement of operations table presents the revenues and expenses that were reclassified from the specified consolidated statement of operations line items to discontinued operations.
The effect on deferred taxfollowing table presents consolidated balance sheet data related to net assets held for sale:
|
| | | | |
| Consolidated balance sheet | | As of December 31, 2013 |
| | | (In thousands) |
| Assets | | |
| Properties and equipment, net | | $ | 2,785 |
|
| | | |
| Liabilities | | |
| Asset retirement obligation | | 2,061 |
|
| | | |
| Net Assets | | $ | 724 |
|
| | | |
The following table presents consolidated statement of operations data related to our discontinued operations:
|
| | | | | | | | | | | | |
| | | Year Ended December 31, |
| Consolidated statements of operations - discontinued operations | | 2013 | | 2012 | | 2011 |
| | | (in thousands) |
| Revenues | | | | | | |
| Crude oil, natural gas and NGLs sales | | $ | 20,398 |
| | $ | 36,422 |
| | $ | 80,860 |
|
| Sales from natural gas marketing | | 2,825 |
| | 1,708 |
| | 2,949 |
|
| Well operations, pipeline income and other | | 890 |
| | 1,888 |
| | 2,542 |
|
| Total revenues | | 24,113 |
| | 40,018 |
| | 86,351 |
|
| | | | | | | |
| Costs, expenses and other | | | | | | |
| Production costs | | 7,975 |
| | 22,453 |
| | 30,885 |
|
| Cost of natural gas marketing | | 2,673 |
| | 1,529 |
| | 2,634 |
|
| Impairment of crude oil and natural gas properties | | 3 |
| | 162,254 |
| | 22,858 |
|
| Depreciation, depletion and amortization | | 2,258 |
| | 48,101 |
| | 47,521 |
|
| Other | | 2,528 |
| | 2,084 |
| | 1,054 |
|
| (Gain) loss on sale of properties and equipment | | 2,330 |
| | (19,920 | ) | | (3,854 | ) |
| Total costs, expenses and other | | 17,767 |
| | 216,501 |
| | 101,098 |
|
| | | | | | | |
| Income (loss) from discontinued operations | | 6,346 |
| | (176,483 | ) | | (14,747 | ) |
| Provision for income taxes | | (2,175 | ) | | 67,466 |
| | 5,620 |
|
| Income (loss) from discontinued operations, net of tax | | $ | 4,171 |
| | $ | (109,017 | ) | | $ | (9,127 | ) |
| | | | | | | |
Appalachian Basin. In October 2013, we executed a purchase and liabilitiessale agreement for the sale of a change in tax rates is recognized in income inour shallow Upper Devonian (non-Marcellus Shale) Appalachian Basin crude oil and natural gas properties owned directly by us, as well as through our proportionate share of PDCM. The properties consisted of approximately 3,500 gross shallow producing wells, related facilities and associated leasehold acreage, limited to the period that includes the enactment date. If we determine that it is more likely than not that some portion orUpper Devonian and shallower formations. Substantially all of the deferred tax assets will not be realized, we record a valuation allowance, thereby reducingdivestiture closed in December 2013 for aggregate consideration of approximately $20.6 million, of which our share of the deferred tax assetsproceeds was approximately $5.1 million, subject to what we consider realizable. Ascertain post-closing adjustments. We received our proportionate share of cash proceeds of December 31, 2012$0.9 million and 2011, we had no valuation allowance.
Debt Issuance Costs. Debt issuance costs are capitalizedrecorded our proportionate share of a note receivable and amortized overaccount receivable from the life of the respective borrowings using the effective interest method. Asbuyer of December 31, 2012 and 2011, included in other assets was $17.43.3 million and $12.30.8 million, respectively,respectively. The remaining assets and related to debt issuance costs. The December 31, 2012, amount included $1.9 million in costs related to the issuance of our 3.25% convertible senior notes due 2016, $10.9 million related to our 7.75% senior notes due 2022 and $4.6 million related to our revolving credit facility and the PDCM credit facility. The December 31, 2011, amount included $2.4 million in costs related to the issuance of our 3.25% convertible senior notes due 2016, $3.4 million related to our 12% senior notes due 2022 and $6.5 million related to our revolving credit facility and the PDCM credit facility.
Asset Retirement Obligations. We accountliabilities were classified as held for asset retirement obligations by recording the fair value of our plugging and abandonment obligations when incurred, which is at the time the well is completed. Upon initial recognition of an asset retirement obligation, we increase the carrying amount of the long-lived asset by the same amount as the liability. Over time, the liabilities are accreted for the change in their present value. The initial capitalized costs, net of salvage value, are depleted over the useful lives of the related assets through charges to DD&A expense. If the fair value of the estimated asset retirement obligation changes, an adjustment is recorded to both the asset retirement obligation and the asset retirement cost. Revisions in estimated liabilities can result from changes in retirement costs or the estimated timing of settling asset retirement obligations. See Note 9, Asset Retirement Obligations, for a reconciliation of the changes in our asset retirement obligation.
Treasury Shares. We record treasury share purchases at cost, which includes incremental direct transaction costs. Amounts are recorded as reductions in shareholders’ equitysale in the consolidated balance sheets. When we retire treasury shares, we charge any excesssheet as of cost overDecember 31, 2013. Concurrent with the par value entirely to additional paid-in-capital ("APIC"),closing of the transaction, our $6.7 million irrevocable standby letter of credit and an agreement for firm transportation services was released and novated to the extent we have amounts in APIC, with any remaining excess cost being charged tobuyer. We retained earnings.
Revenue Recognition. Significant accounting polices related to our revenue recognition are discussed below.
Natural gas, NGLs and crude oil sales. Natural gas, NGLs and crude oil revenues are recognized when production is sold to a purchaser at a fixed or determinable price, delivery has occurred, rights and responsibility of ownership have transferred and collection of revenue is reasonably assured. We currently use the "net-back" method of accounting for transportation and processing arrangements of our sales when the transportation and/or processing is provided by or through the purchaser. Under these arrangements, we sell gas at the wellhead and collect a price and recognize revenues based on the wellhead sales price since transportation and processing costs downstream of the wellhead are incurred by the purchasers and reflected in the wellhead price. The majority of our natural gas and NGLs in Colorado are sold on a long-term basis rangingall zones, formations
PDC ENERGY, INC.
NOTES TO CONSOLIDATED FINANCIAL STATEMENTS - Continued
from 15 yearsand intervals below the Upper Devonian formation including the Marcellus Shale, Utica Shale and Huron Shale. The divestiture of these assets did not meet the requirements to the life of the lease. Sales ofbe accounted for as discontinued operations.
Piceance Basin and NECO. In February 2013, we entered into a purchase and sale agreement pursuant to which we agreed to sell to Caerus our Piceance Basin, NECO and certain other non-core Colorado oil and gas properties, leasehold mineral interests and related assets. Additionally, certain firm transportation obligations and natural gas hedging positions were assumed by the buyer. In June 2013, this divestiture was completed with total consideration of approximately $177.6 million, with an additional $17.0 million paid to our non-affiliated investor partners in our affiliated partnerships. The sale resulted in a pre-tax loss of $2.3 million. The proceeds from the asset divestiture were used to pay down our revolving credit facility and NGLs in other regions, along with crude oil, are sold under contracts with terms ranging from one month to three years. Virtually allfund a portion of our contract pricing provisions are tied2013 capital budget. Following the sale to a market index, with certain adjustments based on, among other factors, whether a well deliversCaerus, we do not have significant continuing involvement in the operations of, or cash flows from, the Piceance Basin and NECO oil and gas properties. Accordingly, the results of operations related to a gathering or transmission line and the quality of the natural gas.
Well operations and pipeline income. We are paid a monthly operating fee for each well we operate and the natural gas transported for outside owners, including the limited partnerships we sponsor. Well operations and pipeline income is recognized when persuasive evidence of an arrangement exists, the sales price is fixed or determinable, servicesthese assets have been renderedseparately reported as discontinued operations in the consolidated statement of operations for all periods presented. The sale of our other non-core Colorado oil and collection of revenues is reasonably assured.
Natural gas marketing. Natural gas marketing is reported onproperties did not meet the gross method of accounting, based on the nature of the agreements between our natural gas marketing subsidiary, Riley Natural Gas ("RNG"), our suppliers and our customers. RNG purchases gas from many small producers and bundles the gas togetherrequirements to be accounted for a price advantage to sell in larger amounts to purchasers of natural gas. RNG has latitude in establishing price and discretion in supplier and purchaser selection. Natural gas marketing revenues and expenses reflect the full cost and revenue of those transactions because RNG takes title to the gas it purchases from the various producers and bears the risks and rewards of that ownership. Both the realized and unrealized gains and losses of the RNG commodity-based derivative transactions for natural gas marketing are included in sales from or cost of natural gas marketing, as applicable.
Accounting for Acquisitions Using Purchase Accounting. We utilize the purchase method to account for acquisitions. Pursuant to purchase method accounting, we allocate the cost of the acquisition to assets acquired and liabilities assumed based on fair values as of the acquisition date. The purchase price allocations are based on appraisals, discounted cash flows, quoted market prices and estimates by management. When appropriate, we review comparable purchases and sales of natural gas and crude oil properties within the same regions and use that data as a basis for fair market value; for example, the amount at which a willing buyer and seller would enter into an exchange for such properties.discontinued operations.
In estimatingPermian Basin. During the fourth quarter of 2011, we completed the sale of our non-core Permian assets to unrelated third parties for a total of $13.2 million. Additionally, on December 20, 2011, we executed a purchase and sale agreement with COG, a wholly owned subsidiary of Concho Resources Inc., for the sale of our core Permian Basin assets for a sale price of $173.9 million, subject to certain post-closing adjustments. The effective date of the transaction was November 1, 2011. Following the sale to COG, we do not have significant continuing involvement in the operations of, or cash flows from, these assets; accordingly, the Permian assets were reclassified as held for sale as of December 31, 2011, and the results of operations related to those assets have been separately reported as discontinued operations in the 2012 and 2011 consolidated statements of operations. On February 28, 2012, the divestiture closed. After final post-closing adjustments, total proceeds received were $189.2 million, resulting in a pre-tax gain on sale of $19.9 million.
NOTE 15 - ACQUISITIONS
The following table presents the adjusted purchase price and the allocations thereof, based on our estimates of fair valuesvalue, for the acquisition of crude oil and natural gas properties during 2012 and 2011:
|
| | | | | | | | | | | | | | | | |
| | | Year Ended December 31, |
| | | 2012 | | 2011 |
| | | Merit | | Seneca-Upshur | | 2003/2002-D Partnerships | | 2005 Partnerships |
| | | (in thousands) |
| | | | | | | | | |
Total acquisition cost
| | $ | 304,643 |
| | $ | 69,618 |
| | $ | 29,960 |
| | $ | 43,015 |
|
| | | | | | | | | |
| Recognized amounts of identifiable assets acquired and liabilities assumed: | | | | | | | | |
| Assets acquired: | | | | | | | | |
| Crude oil and natural gas properties - proved | | $ | 180,696 |
| | $ | 20,175 |
| | $ | 27,940 |
| | $ | 39,825 |
|
| Crude oil and natural gas properties - unproved | | 151,428 |
| | 49,100 |
| | — |
| | — |
|
Other assets
| | 3,631 |
| | 10,196 |
| | 3,455 |
| | 3,848 |
|
| Total assets acquired | | 335,755 |
| | 79,471 |
| | 31,395 |
| | 43,673 |
|
Liabilities assumed:
| | | | | | | | |
| Asset retirement obligation | | 14,833 |
| | 8,157 |
| | 497 |
| | 300 |
|
| Other accrued expenses | | 9,574 |
| | — |
| | — |
| | — |
|
Other liabilities
| | 6,705 |
| | 1,696 |
| | 938 |
| | 358 |
|
| Total liabilities assumed | | 31,112 |
| | 9,853 |
| | 1,435 |
| | 658 |
|
Total identifiable net assets acquired
| | $ | 304,643 |
| | $ | 69,618 |
| | $ | 29,960 |
| | $ | 43,015 |
|
| | | | | | | | | |
The fair value measurements of assets acquired and liabilities assumed we make various assumptions.are based on inputs that are not observable in the market and therefore represent Level 3 inputs. The most significant assumptions relate to the estimated fair values assigned to proved developed producing, proved developed non-producing, proved undeveloped, unproved natural gas and crude oil properties and other non-natural gas and crude oil properties. To estimate the fair values of theseoil and natural gas properties we prepareand asset retirement obligations were measured using valuation techniques that convert future cash flows to a single discounted amount. Significant inputs to the valuation of oil and natural gas properties include estimates of natural gas and crude oil reserves. We estimate future prices by using the applicable forward pricing strip to apply to our estimate of reserve quantities acquired, and estimates ofreserves, future operating and development costs, to arrive at an estimate of future net revenues. Forcommodity prices, estimated proved reserves, the future net revenues are discounted usingcash flows and a market-based weighted-average cost of capital rate determined appropriaterate. These inputs require significant judgments and estimates by management at the time of the acquisition. The market-based weighted-average cost of capital rate isvaluation and are sensitive and subject to additional project-specific risking factors. To compensate for the inherent risk of estimating and valuing unproved properties, we reduce the discounted future net revenues of probable and possible reserves by additional risk-weighting factors.change.
We record deferred taxes for any differences between the assigned values and tax basis of assets and liabilities. Estimated deferred taxes are based on available information concerning the tax basis of assets acquired and liabilities assumed and loss carryforwards at the acquisition date, although such estimates may change in the future as additional information becomes known.
Stock-Based Compensation. Stock-based compensation is recognized in our financial statements based on the grant-date fair value of the equity instrument awarded. Stock-based compensation expense is recognized in the financial statements on a straight-line basis over the vesting period for the entire award. To the extent compensation cost relates to employees directly involved in natural gas and crude oil exploration and development activities, such amounts may be capitalized to properties and equipment. Amounts not capitalized to properties and equipment are recognized in the related cost and expense line item in the statement of operations. No amounts for stock-based compensation were capitalized in 2012, 2011 and 2010.
Recent Accounting Standards.
The following standards were recently adopted:
Fair Value Measurement. On May 12, 2011, the FASB issued changes related to fair value measurement. The changes represent the converged guidance of the FASB and the International Accounting Standards Board ("IASB") on fair value measurement. Many of the changes eliminate unnecessary wording differences between International Financial Reporting Standards ("IFRS") and U.S. GAAP. The changes expand existing disclosure requirements for fair value measurements categorized in Level 3 by requiring (1) a quantitative disclosure of the unobservable inputs and assumptions used in the measurement, (2) a description of the valuation processes in place and (3) a narrative description of the sensitivity of the fair value to changes in unobservable inputs and the interrelationships between those inputs. In addition, the changes require the categorization by level in the fair value hierarchy of items that are not measured at fair value in the statement of financial position whose fair value must be disclosed. These changes are to be applied prospectively and were effective for public entities during interim and annual periods beginning after December 15, 2011. Early application was not permitted. With the exception of the disclosure requirements, adoption of these changes did not have a significant impact on our financial statements.
Presentation of Comprehensive Income. On June 16, 2011, the FASB issued changes related to the presentation of comprehensive income. These changes eliminate the current option to report other comprehensive income and its components in the statement of changes in equity. These changes are intended to enhance comparability between entities that report under U.S. GAAP and those that report under IFRS, and to provide a more consistent method of presenting non-owner transactions that affect an entity's equity. An entity may elect to present items of net income and other comprehensive income in one continuous statement, referred to as the statement of comprehensive income, or in two separate, but consecutive, statements. Each component of net income and each component of other comprehensive income, together with totals
PDC ENERGY, INC.
NOTES TO CONSOLIDATED FINANCIAL STATEMENTS - Continued
2012 Acquisitions
Merit Acquisition. In June 2012, we completed the acquisition of certain Wattenberg Field oil and natural gas properties, leasehold mineral interests and related assets located in Weld, Adams and Boulder Counties, Colorado from affiliates of Merit Energy. The aggregate purchase price of these properties was approximately $304.6 million. We financed the purchase with cash from the May 2012 offering of our common stock and a draw on our revolving credit facility.
This acquisition was accounted for comprehensive incomeunder the acquisition method of accounting. Accordingly, we conducted assessments of net assets acquired and its two parts,recognized amounts for identifiable assets acquired and liabilities assumed at their estimated acquisition date fair values, while transaction and integration costs associated with the acquisition were expensed as incurred.
Pro Forma Information. The results of operations for the Merit Acquisition have been included in our consolidated financial statements since the June 2012 closing date. The following unaudited pro forma financial information presents a summary of the consolidated results of operations for the years ended December 31, 2012 and December 31, 2011, assuming the Merit Acquisition had been completed as of January 1, 2011, including adjustments to reflect the values assigned to the net incomeassets acquired. The pro forma financial information is not necessarily indicative of the results of operations that would have been achieved if the Merit Acquisition had been effective as of these dates, or of future results.
|
| | | | | | | |
| | Year Ended December 31, |
| | 2012 | | 2011 |
| | (in thousands, except per share amounts) |
| | | | |
| Total revenues | $ | 370,488 |
| | $ | 438,204 |
|
| Total costs, expenses and other | 521,178 |
| | 366,120 |
|
Net income (loss)
| $ | (119,343 | ) | | $ | 45,688 |
|
| | | | |
Earnings per share:
| | | |
| Basic | $ | (4.31 | ) | | $ | 1.94 |
|
| Diluted | $ | (4.31 | ) | | $ | 1.91 |
|
2011 Acquisitions
Seneca-Upshur. In October 2011, PDCM acquired 100% of the membership interests of Seneca-Upshur for $139.2 million ($69.6 million net to PDC), after post-closing adjustments, which was funded by capital contributions by PDCM's investing partners and other comprehensive income, needa draw on PDCM's revolving credit facility. Substantially all of the acreage acquired is held by production, prospective for the Marcellus Shale and is in close proximity to be displayed under either alternative.PDCM's existing properties. PDCM received title defect payments during 2012 totaling $28.9 million, of which $14.5 million represents our share, the effect of which is reflected in the purchase price noted above.
2003/2002-D Partnerships. In October 2011, we acquired from non-affiliated investor partners the interests we did not already own in five of our affiliated partnerships: PDC 2002-D Limited Partnership, PDC 2003-A Limited Partnership, PDC 2003-B Limited Partnership and PDC 2003-C Limited Partnership (the "2002/2003 Partnerships"). We purchased the 2002/2003 Partnerships for an aggregate amount of $30 million, which was funded from our revolving credit facility. These purchases included the partnerships' working interests in wells located in the Wattenberg Field and Piceance Basin.
2005 Partnerships. In June 2011, we acquired from non-affiliated investor partners the interests we did not already own in three of our affiliated partnerships: PDC 2005-A Limited Partnership, PDC 2005-B Limited Partnership and Rockies Region Private Limited Partnership (the "2005 Partnerships"). We purchased the 2005 Partnerships for an aggregate amount of $43 million, which was funded from our revolving credit facility. These purchases included the partnerships' working interests wells located in the Wattenberg Field and the Piceance Basin.
Pro Forma Information. The statement(s) need to beresults of operations for the Seneca-Upshur, 2002/2003 Partnerships and 2005 Partnerships acquisitions have been included in our consolidated financial statements from the respective dates of acquisition. Pro forma information is not presented with equal prominence as the other primary financial statements. These changes were effective for our financialpro forma results would not be materially different from the information presented in the accompanying consolidated statements issued for annual reporting periods beginning after December 15, 2011. Adoption of this change did not have a material impact on our financial statements.operations.
NOTE 316 - FAIR VALUE OF FINANCIAL INSTRUMENTSTRANSACTIONS WITH AFFILIATES
Derivative Financial Instruments
Determination of fair value.PDCM and Affiliated Partnerships. Our fair value measurements are estimated pursuant to a fair value hierarchy that requires us to maximizeGas Marketing segment markets the usenatural gas produced by PDCM and our affiliated partnerships in the Appalachia-Marcellus Shale. Our cost of observable inputsnatural gas marketing includes $18.1 million, $10.9 million and minimize the use of unobservable inputs when measuring fair value. The valuation hierarchy is based upon the transparency of inputs$9.5 million in 2013, 2012 and 2011, respectively, related to the valuationmarketing of an asset or liability asnatural gas on behalf of the measurement date, giving the highest priority to quoted prices in active markets (Level 1)PDCM and the lowest priority to unobservable data (Level 3). In some cases, the inputs used to measure fair value might fall in different levels of the fair value hierarchy. The lowest level input that is significant to a fair value measurement in its entirety determines the applicable level in the fair value hierarchy. Assessing the significance of a particular input$1.3 million, $0.5 million and $1.3 million, respectively, related to the fair value measurement in its entirety requires judgment, considering factors specific to the asset or liability, and may affect the valuationmarketing of the assets and liabilities and their placement within the fair value hierarchy levels. The three levelsnatural gas on behalf of inputs that may be used to measure fair value are defined as:our affiliated partnerships.
Level 1 – Quoted prices (unadjusted) for identical assets or liabilities in active markets.
Level 2 – Inputs other than quoted prices included within Level 1 that are either directly or indirectly observable for the asset or liability, including quoted prices for similar assets or liabilities in active markets, quoted prices for identical or similar assets or liabilities in inactive markets, inputs other than quoted prices that are observable for the asset or liability and inputs that are derived from observable market data by correlation or other means.
Level 3 – Unobservable inputs for the asset or liability, including situations where there is little, if any, market activity.
Derivative Financial Instruments. We measure the fair value of our derivative instruments based on a pricing model that utilizes market-based inputs, including but not limited to the contractual price of the underlying position, current market prices, natural gas and crude oil forward curves, discount rates such as the LIBOR curve for a similar duration of each outstanding position, volatility factors and nonperformance risk. Nonperformance risk considers the effect of our credit standing on the fair value of derivative liabilities and the effect of our counterparties' credit standings on the fair value of derivative assets. Both inputs to the model are based on published credit default swap rates and the duration of each outstanding derivative position.
We validate our fair value measurement through the review of counterparty statements and other supporting documentation, the determination that the source of the inputs is valid, the corroboration of the original source of inputs through access to multiple quotes, if available, or other information and monitoring changes in valuation methods and assumptions. While we use common industry practices to develop our valuation techniques, changes in our pricing methodologies or the underlying assumptions could result in significantly different fair values. While we believe our valuation method is appropriate and consistent with those used by other market participants, the use of a different methodology or assumptions to determine the fair value of certain financial instruments could result in a different estimate of fair value.
We have evaluated the credit risk of the counterparties holding our derivative assets, which are primarily financial institutions who are also major lenders in our revolving credit facility, giving consideration to amounts outstanding for each counterparty and the duration of each outstanding derivative position. Based on our evaluation, we have determined that the potential impact of nonperformance of our counterparties on the fair value of our derivative instruments is not significant.
Our fixed-price swaps, basis swaps and physical purchases are included in Level 2 and our natural gas and crude oil collars, natural gas calls and physical sales are included in Level 3. The following table presents, for each applicable level within the fair value hierarchy, our derivative assets and liabilities, including both current and non-current portions, measured at fair value on a recurring basis:
PDC ENERGY, INC.
NOTES TO CONSOLIDATED FINANCIAL STATEMENTS - Continued
|
| | | | | | | | | | | | | | | | | | | | | | | |
| | As of December 31, |
| | 2012 | | 2011 |
| | Significant Other
Observable
Inputs
(Level 2) | | Significant
Unobservable
Inputs
(Level 3) | | Total | | Significant Other
Observable
Inputs
(Level 2) | | Significant
Unobservable
Inputs
(Level 3) | | Total |
| | (in thousands) |
| Assets: | | | | | | | | | | | |
| Commodity-based derivative contracts | $ | 42,788 |
| | $ | 15,734 |
| | $ | 58,522 |
| | $ | 76,104 |
| | $ | 25,837 |
| | $ | 101,941 |
|
| Basis protection derivative contracts | 387 |
| | 16 |
| | 403 |
| | 5 |
| | 38 |
| | 43 |
|
| Total assets | 43,175 |
| | 15,750 |
| | 58,925 |
| | 76,109 |
| | 25,875 |
| | 101,984 |
|
| Liabilities: | | | | | | | | | | | |
| Commodity-based derivative contracts | 9,839 |
| | 2,081 |
| | 11,920 |
| | 9,888 |
| | 3,768 |
| | 13,656 |
|
| Basis protection derivative contracts | 16,656 |
| | — |
| | 16,656 |
| | 35,424 |
| | — |
| | 35,424 |
|
| Total liabilities | 26,495 |
| | 2,081 |
| | 28,576 |
| | 45,312 |
| | 3,768 |
| | 49,080 |
|
| Net asset | $ | 16,680 |
| | $ | 13,669 |
| | $ | 30,349 |
| | $ | 30,797 |
| | $ | 22,107 |
| | $ | 52,904 |
|
| | | | | | | | | | | | |
The following table presents a reconciliation of our Level 3 assets measured at fair value:
|
| | | | | | | | | | | | |
| | 2012 | | 2011 | | 2010 |
| | (in thousands) |
| | | | | | |
| Fair value, net asset, beginning of year | | $ | 22,107 |
| | $ | 10,762 |
| | $ | 15,048 |
|
| Changes in fair value included in statement of operations line item: | | | | | | |
| Commodity price risk management gain, net | | 7,576 |
| | 13,487 |
| | 11,591 |
|
| Sales from natural gas marketing | | 63 |
| | 114 |
| | 580 |
|
| Cost of natural gas marketing | | — |
| | — |
| | 23 |
|
| Changes in fair value included in balance sheet line item (1): | | | | | | |
| Accounts receivable affiliates | | — |
| | 49 |
| | 231 |
|
| Accounts payable affiliates | | (319 | ) | | (454 | ) | | (1,737 | ) |
| Settlements included in statement of operations line items: | | | | | | |
| Commodity price risk management loss, net | | (15,644 | ) | | (1,712 | ) | | (14,467 | ) |
| Sales from natural gas marketing | | (114 | ) | | (139 | ) | | (484 | ) |
| Cost of natural gas marketing | | — |
| | — |
| | (23 | ) |
| Fair value, net asset end of year | | $ | 13,669 |
| | $ | 22,107 |
| | $ | 10,762 |
|
| | | | | | |
| Changes in unrealized gains (losses) relating to assets (liabilities) still held | | | | | | |
| as of year-end, included in statement of operations line item: | | | | | | |
| Commodity price risk management gain, net | | $ | 3,665 |
| | $ | 11,669 |
| | $ | 9,594 |
|
| Sales from natural gas marketing | | 1 |
| | (3 | ) | | 54 |
|
| Total | | $ | 3,666 |
| | $ | 11,666 |
| | $ | 9,648 |
|
| | | | | | |
__________
| |
(1) | Represents the change in fair value related to derivative instruments entered into by us and designated to our affiliated partnerships. |
The significant unobservable input used in the fair value measurement of our derivative contracts is the implied volatility curve, which is provided by a third-party vendor. A significant increase or decrease in the implied volatility, in isolation, would have a directionally similar effect resulting in a significantly higher or lower fair value measurement of our Level 3 derivative contracts.
Non-Derivative Financial Assets and Liabilities
The carrying values of the financial instruments included in current assets and current liabilities approximate fair value due to the short-term maturities of these instruments.
The liability associated with our non-qualified deferred compensation plan for non-employee directors may be settled in cash or shares of our common stock. The carrying value of this obligation is based on the quoted market price of our common stock, which is a Level 1 input.
PDC ENERGY, INC.
NOTES TO CONSOLIDATED FINANCIAL STATEMENTS - Continued
The portionAmounts due from/to the affiliated partnerships have historically been primarily related to derivative positions and, to a lesser extent, unbilled well lease operating expenses, and costs resulting from audit and tax preparation services. Previously, we have entered into derivative instruments on behalf of our long-term debtaffiliated partnerships for their estimated production. In June 2013, all remaining derivative positions designated to our affiliated partnerships were liquidated prior to settlement. As a result, there were no amounts due from/to our affiliated partnerships related to our revolving credit facility, as well as our proportionate share of PDCM's credit facility, approximates fair value due to the variable nature of related interest rates. We have not elected to account for the portion of our long-term debt related to our senior notes under the fair value option; however,derivative positions as of December 31, 20122013, we estimate the fair value of the portion of our long-term debt related to the .3.25% convertible senior notes due 2016 to be $125.3 million, or 109% of par value, and the portion related to our 7.75% senior notes due 2022 to be $512.8 million, or 102.6% of par value. We determined these valuations based upon measurements of trading activity and broker and/or dealer quotes, respectively, which are published market prices, and therefore are Level 2 inputs.
See Note 2, Summary of Significant Accounting Policies - Properties and Equipment, Natural Gas and Crude Oil Properties and Asset Retirement Obligations, for a discussion of how we determined fair value for these assets and liabilities.
NOTE 4 - DERIVATIVE FINANCIAL INSTRUMENTS
Our results of operations and operating cash flows are affected by changes in market prices for natural gas, NGLs and crude oil. To manage a portion of our exposure to price volatility from producing natural gas and crude oil, we utilize the following economic hedging strategies for each of our business segments.
For natural gas and crude oil sales, we enter into derivative contracts to protect against price declines in future periods. While we structure these derivatives to reduce our exposure to changes in price associated with the derivative commodity, they also limit the benefit we might otherwise have received from price increases in the physical market; and
For natural gas marketing, we enter into fixed-price physical purchase and sale agreements that qualify as derivative contracts. In order to offset the fixed-price physical derivatives in our natural gas marketing, we enter into financial derivative instruments that have the effect of locking in the prices we will receive or pay for the same volumes and period, offsetting the physical derivative.
We believe our derivative instruments continueprovide certain well operating and administrative services for PDCM. Amounts billed to be effective in achieving the risk management objectivesPDCM for which theythese services were intended. As of December 31, 2012$14.5 million, we had derivative instruments in place for a portion of our anticipated production through 2016 for a total of 68,853$12.1 million BBtu of natural gas and 3,754$10.4 million MBbls of crude oil.
As ofin December 31, 20122013, our derivative instruments were comprised of commodity floors, collars and swaps, basis protection swaps and physical sales and purchases.
Floor options (puts) are arrangements where, if the index price falls below the fixed put strike price, we receive the market price from the purchaser and receive the difference between the put strike price and index price from the counterparty. If the index price exceeds the fixed put strike price, then no payment is due from us to the counterparty;
Collars contain a fixed floor price and ceiling price (call). If the index price falls below the fixed put strike price, we receive the market price from the purchaser and receive the difference between the put strike price and index price from the counterparty. If the index price exceeds the fixed call strike price, we receive the market price from the purchaser and pay the difference between the call strike price and index price to the counterparty. If the index price is between the put and call strike price, no payments are due to or from the counterparty;
Swaps are arrangements that guarantee a fixed price. If the index price is below the fixed contract price, we receive the market price from the purchaser and receive the difference between the index price and the fixed contract price from the counterparty. If the index price is above the fixed contract price, we receive the market price from the purchaser and pay the difference between the index price and the fixed contract price to the counterparty. If the index price and contract price are the same, no payment is due to or from the counterparty;
Basis protection swaps are arrangements that guarantee a price differential for natural gas from a specified delivery point. For CIG-basis protection swaps, which have negative differentials to NYMEX, we receive a payment from the counterparty if the price differential is greater than the stated terms of the contract and pay the counterparty if the price differential is less than the stated terms of the contract. If the market price and contract price are the same, no payment is due to or from the counterparty; and
Physical sales and purchases are derivatives for fixed-priced physical transactions where we sell or purchase third-party supply at fixed rates. These physical derivatives are offset by financial swaps: for a physical sale the offset is a swap purchase and for a physical purchase the offset is a swap sale.
PDC ENERGY, INC.
NOTES TO CONSOLIDATED FINANCIAL STATEMENTS - Continued
The following table presents the location and fair value amounts of our derivative instruments on the balance sheets as of December 31, 2012 and 2011:, respectively. Our consolidated statements of operations include only our proportionate share of these billings. The following table presents the consolidated statement of operations line item in which our proportionate share is recorded and the amount for each of the periods presented.
|
| | | | | | | | | | | |
| Derivatives instruments: | | Balance sheet line item | | 2012 | | 2011 |
| | | | | | (in thousands) |
| Derivative assets: | Current | | | | | | |
| | Commodity contracts | | | | | | |
| | Related to natural gas and crude oil sales | | Fair value of derivatives | | $ | 47,016 |
| | $ | 51,220 |
|
| | Related to affiliated partnerships (1) | | Fair value of derivatives | | 4,707 |
| | 8,018 |
|
| | Related to natural gas marketing | | Fair value of derivatives | | 302 |
| | 1,528 |
|
| | Basis protection contracts | | | | | | |
| | Related to natural gas marketing | | Fair value of derivatives | | 17 |
| | 43 |
|
| | | | | | 52,042 |
| | 60,809 |
|
| | Non Current | | | | | | |
| | Commodity contracts | | | | | | |
| | Related to natural gas and crude oil sales | | Fair value of derivatives | | 6,671 |
| | 34,938 |
|
| | Related to affiliated partnerships (1) | | Fair value of derivatives | | — |
| | 6,134 |
|
| | Related to natural gas marketing | | Fair value of derivatives | | 203 |
| | 103 |
|
| | Basis protection contracts | | | | | | |
| | Related to natural gas marketing | | Fair value of derivatives | | 9 |
| | — |
|
| | | | | | 6,883 |
| | 41,175 |
|
| Total derivative assets | | | | | $ | 58,925 |
| | $ | 101,984 |
|
| | | | | | | | |
| Derivative liabilities: | Current | | | | | | |
| | Commodity contracts | | | | | | |
| | Related to natural gas and crude oil sales | | Fair value of derivatives | | $ | 1,744 |
| | $ | 7,498 |
|
| | Related to affiliated partnerships (2) | | Fair value of derivatives | | — |
| | 211 |
|
| | Related to natural gas marketing | | Fair value of derivatives | | 226 |
| | 1,384 |
|
| | Basis protection contracts | | | | | | |
| | Related to natural gas and crude oil sales | | Fair value of derivatives | | 14,329 |
| | 15,762 |
|
| | Related to affiliated partnerships (2) | | Fair value of derivatives | | 2,140 |
| | 3,116 |
|
| | Related to natural gas marketing | | Fair value of derivatives | | — |
| | 3 |
|
| | | | | | 18,439 |
| | 27,974 |
|
| | Non Current | | | | | | |
| | Commodity contracts | | | | | | |
| | Related to natural gas and crude oil sales | | Fair value of derivatives | | 9,969 |
| | 4,357 |
|
| | Related to affiliated partnerships (2) | | Fair value of derivatives | | — |
| | 113 |
|
| | Related to natural gas marketing | | Fair value of derivatives | | 168 |
| | 93 |
|
| | Basis protection contracts | | | | | | |
| | Related to natural gas and crude oil sales | | Fair value of derivatives | | — |
| | 13,820 |
|
| | Related to affiliated partnerships (2) | | Fair value of derivatives | | — |
| | 2,723 |
|
| | | | | | 10,137 |
| | 21,106 |
|
| Total derivative liabilities | | | | | $ | 28,576 |
| | $ | 49,080 |
|
|
| | | | | | | | | | | | |
| | | Year Ended December 31, |
| Consolidated statement of operations line item | | 2013 | | 2012 | | 2011 |
| | | (in thousands) |
| | | | | | | |
| Production costs | | $ | 4,097 |
| | $ | 3,945 |
| | $ | 3,441 |
|
| Exploration expense | | 502 |
| | 492 |
| | 430 |
|
| General and administrative expense | | 2,649 |
| | 1,630 |
| | 1,543 |
|
__________
| |
(1) | Represents derivative positions designated to our affiliated partnerships. Accordingly, our accompanying balance sheets include a corresponding payable to our affiliated partnerships representing their proportionate share of the derivative assets. |
| |
(2) | Represents derivative positions designated to our affiliated partnerships. Accordingly, our accompanying balance sheets include a corresponding receivable from our affiliated partnerships representing their proportionate share of the derivative liabilities. |
Former Executive Officer. In June 2011, Richard W. McCullough resigned from his positions as our Chief Executive Officer and the Chairman of the Board, effective immediately. In connection with his resignation, in July 2011, Mr. McCullough and the Company executed a separation agreement, whereby Mr. McCullough received those benefits to which he was entitled pursuant to his employment agreement, including without limitation, separation compensation in the amount of $4.1 million, less required withholdings, his annual non-qualified deferred supplemental retirement benefit equal to $30,000 for each of the years 2012 through 2021 (not accelerated), less required withholdings, continued coverage under the Company’s group health plans at the Company’s cost for a period equal to the lesser of 18 months or such period ending as of the date Mr. McCullough is eligible to participate in another employer’s group health plan, immediate vesting of any unvested Company stock options, SARs and restricted stock and issuance of shares representing the vested portion of his 2009 performance share awards. Related to this separation agreement, the consolidated statement of operations for 2011 reflects a charge to general and administrative expense of $6.7 million.
NOTE 17 - BUSINESS SEGMENTS
We separate our operating activities into two segments: Oil and Gas Exploration and Production and Gas Marketing. All material inter-company accounts and transactions between segments have been eliminated.
Oil and Gas Exploration and Production. Our Oil and Gas Exploration and Production segment includes all of our crude oil and natural gas properties. The segment represents revenues and expenses from the production and sale of crude oil, natural gas and NGLs. Segment revenue includes crude oil, natural gas and NGLs sales, commodity price risk management, net, and well operation and pipeline income. Segment income (loss) consists of segment revenue less production cost, exploration expense, impairment of crude oil and natural gas properties, direct general and administrative expense and DD&A expense. Segment DD&A expense was $122.2 million, $94.1 million and $83.6 million in 2013, 2012 and 2011, respectively.
Gas Marketing. Our Gas Marketing segment purchases, aggregates and resells natural gas produced by us and others. Segment income (loss) primarily represents sales from natural gas marketing and direct interest income less costs of natural gas marketing and direct general and administrative expense.
Unallocated amounts. Unallocated income includes unallocated other revenue, less corporate general administrative expense, corporate DD&A expense, interest income and interest expense. Unallocated assets include assets utilized for corporate, general and administrative purposes, as well as assets not specifically included in our two business segments.
PDC ENERGY, INC.
NOTES TO CONSOLIDATED FINANCIAL STATEMENTS - Continued
The following table presents the impact oftables present our derivative instruments on our statements of operations:segment information:
|
| | | | | | | | | | | | | | | | | | | | | | | | | | | | | | | | | | | | |
| | Year Ended December 31, |
| | 2012 | | 2011 | | 2010 |
| Statement of operations line item | | Reclassification
of Realized
Gains (Losses)
Included in Prior Periods
Unrealized | | Realized and Unrealized
Gains
(Losses) For
the
Current
Period | | Total | | Reclassification
of Realized
Gains (Losses)
Included in Prior Periods
Unrealized | | Realized and Unrealized
Gains
(Losses) For
the
Current
Period | | Total | | Reclassification
of Realized
Gains (Losses)
Included in Prior Periods
Unrealized | | Realized and Unrealized
Gains
(Losses) For
the
Current
Period | | Total |
| | (in thousands) |
| Commodity price risk management gain (loss), net | | | | | | | | | | | | | | | | | | |
| Realized gains | | $ | 28,819 |
| | $ | 20,597 |
| | $ | 49,416 |
| | $ | 10,329 |
| | $ | 6,914 |
| | $ | 17,243 |
| | $ | 20,148 |
| | $ | 26,947 |
| | $ | 47,095 |
|
| Unrealized gains (losses) | | (28,819 | ) | | 11,742 |
| | (17,077 | ) | | (10,329 | ) | | 39,176 |
| | 28,847 |
| | (20,148 | ) | | 32,944 |
| | 12,796 |
|
| Total commodity price risk management gain, net | | $ | — |
| | $ | 32,339 |
| | $ | 32,339 |
| | $ | — |
| | $ | 46,090 |
| | $ | 46,090 |
| | $ | — |
| | $ | 59,891 |
| | $ | 59,891 |
|
| Sales from natural gas marketing | | | | | | | | | | | | | | | | | | |
| Realized gains | | $ | 1,571 |
| | $ | 599 |
| | $ | 2,170 |
| | $ | 1,827 |
| | $ | 1,143 |
| | $ | 2,970 |
| | $ | 2,390 |
| | $ | 3,991 |
| | $ | 6,381 |
|
| Unrealized gains (losses) | | (1,571 | ) | | (87 | ) | | (1,658 | ) | | (1,827 | ) | | 1,666 |
| | (161 | ) | | (2,390 | ) | | 1,745 |
| | (645 | ) |
| Total sales from natural gas marketing | | $ | — |
| | $ | 512 |
| | $ | 512 |
| | $ | — |
| | $ | 2,809 |
| | $ | 2,809 |
| | $ | — |
| | $ | 5,736 |
| | $ | 5,736 |
|
| Cost of natural gas marketing | | | | | | | | | | | | | | | | | | |
| Realized losses | | $ | (1,387 | ) | | $ | (642 | ) | | $ | (2,029 | ) | | $ | (1,441 | ) | | $ | (1,130 | ) | | $ | (2,571 | ) | | $ | (1,905 | ) | | $ | (3,996 | ) | | $ | (5,901 | ) |
| Unrealized gains (losses) | | 1,387 |
| | 214 |
| | 1,601 |
| | 1,441 |
| | (1,526 | ) | | (85 | ) | | 1,905 |
| | (1,431 | ) | | 474 |
|
| Total cost of natural gas marketing | | $ | — |
| | $ | (428 | ) | | $ | (428 | ) | | $ | — |
| | $ | (2,656 | ) | | $ | (2,656 | ) | | $ | — |
| | $ | (5,427 | ) | | $ | (5,427 | ) |
| | | | | | | | | | | | | | | | | | |
|
| | | | | | | | | | | |
| | 2013 | | 2012 | | 2011 |
| | (in thousands) |
| Year Ended December 31, | | | | | |
| Segment revenues: | | | | | |
| Oil and gas exploration and production | $ | 341,527 |
| | $ | 275,234 |
| | $ | 273,819 |
|
| Gas marketing | 69,787 |
| | 45,371 |
| | 63,470 |
|
| Total revenues | $ | 411,314 |
| | $ | 320,605 |
| | $ | 337,289 |
|
| | | | | | |
| Segment income (loss) before income taxes: | | | | | |
| Oil and gas exploration and production | $ | 79,527 |
| | $ | 103,111 |
| | $ | 138,616 |
|
| Gas marketing | (298 | ) | | 349 |
| | 639 |
|
| Unallocated | (120,498 | ) | | (137,856 | ) | | (104,891 | ) |
| Income (loss) before income taxes | $ | (41,269 | ) | | $ | (34,396 | ) | | $ | 34,364 |
|
| | | | | | |
| Expenditures for segment long-lived assets: | | | | | |
| Oil and gas exploration and production | $ | 403,227 |
| | $ | 656,443 |
| | $ | 479,027 |
|
| Unallocated | 1,379 |
| | 3,509 |
| | 1,363 |
|
| Total | $ | 404,606 |
| | $ | 659,952 |
| | $ | 480,390 |
|
| | | | | | |
| As of December 31, | | | | | |
| Segment assets: | | | | | |
| Oil and gas exploration and production | $ | 1,934,466 |
| | $ | 1,723,011 |
| | |
| Gas marketing | 20,342 |
| | 11,090 |
| | |
| Unallocated | 67,610 |
| | 92,747 |
| | |
| Assets held for sale | 2,785 |
| | �� |
| | |
| Total assets | $ | 2,025,203 |
| | $ | 1,826,848 |
| | |
| | | | | | |
PDC ENERGY, INC.
SUPPLEMENTAL INFORMATION
(Unaudited)
SUPPLEMENTAL INFORMATION - UNAUDITED
CRUDE OIL AND NATURAL GAS INFORMATION - UNAUDITED
Net Proved Reserves
All of our crude oil, natural gas and NGLs reserves are located in the U.S. We utilize the services of independent petroleum engineers to estimate our crude oil, natural gas, condensate and NGL reserves. As of December 31, 2013, 2012 and 2011, all of our reserve estimates were based on reserve reports prepared by Ryder Scott. These reserve estimates have been prepared in compliance with professional standards and the reserves definitions prescribed by the SEC.
Proved reserves estimates may change, either positively or negatively, as additional information becomes available and as contractual, economic and political conditions change. Our net proved reserve estimates have been adjusted as necessary to reflect all contractual agreements, royalty obligations and interests owned by others at the time of the estimate. Proved developed reserves are the quantities of crude oil, natural gas and NGLs expected to be recovered through existing wells with existing equipment and operating methods. In some cases, proved undeveloped reserves may require substantial new investments in additional wells and related facilities.
The price used to estimate our reserves, by commodity, are presented below.
|
| | | | | | | | | | | | |
| | Price Used to Estimate Reserves |
| As of December 31, | | Crude Oil (per Bbl) | | Natural Gas (per Mcf) | | NGLs (per Bbl) |
| | | | | | | |
| 2013 | | $ | 82.18 |
| | $ | 3.22 |
| | $ | 29.92 |
|
| 2012 | | 87.51 |
| | 2.35 |
| | 28.02 |
|
| 2011 | | 88.94 |
| | 3.41 |
| | 39.59 |
|
PDC ENERGY, INC.
SUPPLEMENTAL INFORMATION
(Unaudited)
The following tables present the changes in our estimated quantities of proved reserves:
|
| | | | | | | | | | | |
| | Crude Oil, Condensate (MBbls) | | Natural Gas (MMcf) | | NGLs (MBbls) | | Total (MBoe) |
| Proved Reserves: | | | | | | | |
| Proved reserves, January 1, 2011 | 23,236 |
| | 657,306 |
| | 10,649 |
| | 143,436 |
|
| Revisions of previous estimates | (1,904 | ) | | (161,654 | ) | | 3,163 |
| | (25,683 | ) |
| Extensions, discoveries and other additions | 17,092 |
| | 176,689 |
| | 5,633 |
| | 52,173 |
|
| Purchases of reserves | 1,605 |
| | 32,761 |
| | 1,052 |
| | 8,117 |
|
| Dispositions | (435 | ) | | (2,070 | ) | | (94 | ) | | (874 | ) |
| Production | (1,958 | ) | | (30,887 | ) | | (815 | ) | | (7,921 | ) |
| Proved reserves, December 31, 2011 (1) | 37,636 |
| | 672,145 |
| | 19,588 |
| | 169,248 |
|
| Revisions of previous estimates | (6,729 | ) | | (289,436 | ) | | (3,671 | ) | | (58,639 | ) |
| Extensions, discoveries and other additions | 27,482 |
| | 172,933 |
| | 11,637 |
| | 67,941 |
|
| Purchases of reserves | 10,801 |
| | 87,212 |
| | 8,084 |
| | 33,420 |
|
| Dispositions | (7,854 | ) | | (6,406 | ) | | (1,970 | ) | | (10,891 | ) |
| Production | (2,026 | ) | | (32,410 | ) | | (841 | ) | | (8,269 | ) |
| Proved reserves, December 31, 2012 (2) | 59,310 |
| | 604,038 |
| | 32,827 |
| | 192,810 |
|
| Revisions of previous estimates | (18,420 | ) | | (117,068 | ) | | (8,549 | ) | | (46,480 | ) |
| Extensions, discoveries and other additions | 55,759 |
| | 365,563 |
| | 25,249 |
| | 141,935 |
|
| Purchases of reserves | 343 |
| | 2,894 |
| | 217 |
| | 1,043 |
|
| Dispositions | (252 | ) | | (94,927 | ) | | (30 | ) | | (16,104 | ) |
| Production | (2,910 | ) | | (20,860 | ) | | (1,043 | ) | | (7,430 | ) |
| Proved reserves, December 31, 2013 | 93,830 |
| | 739,640 |
| | 48,671 |
| | 265,774 |
|
| | | | | | | | |
|
| | | | | | | | | | | |
| Proved Developed Reserves, as of: | | | | | | | |
| January 1, 2011 | 8,287 |
| | 227,341 |
| | 4,013 |
| | 50,190 |
|
| December 31, 2011 (1) | 16,910 |
| | 299,369 |
| | 11,753 |
| | 78,558 |
|
| December 31, 2012 (2) | 20,412 |
| | 281,925 |
| | 14,353 |
| | 81,753 |
|
| December 31, 2013 | 23,997 |
| | 220,387 |
| | 14,825 |
| | 75,553 |
|
| Proved Undeveloped Reserves, as of: | | | | |
| | |
| January 1, 2011 | 14,949 |
| | 429,965 |
| | 6,636 |
| | 93,246 |
|
| December 31, 2011 (1) | 20,726 |
| | 372,776 |
| | 7,835 |
| | 90,690 |
|
| December 31, 2012 (2) | 38,898 |
| | 322,113 |
| | 18,474 |
| | 111,058 |
|
| December 31, 2013 | 69,833 |
| | 519,253 |
| | 33,846 |
| | 190,221 |
|
| | | | | | | | |
__________
| |
| (1) | Includes estimated reserve data related to our Permian Basin assets, which were divested in February 2012. See Note 14, Assets Held for Sale, Divestitures and Discontinued Operations, for additional details related to the divestiture of our Permian Basin assets. Total proved reserves included 7,825 MBbls of crude oil, 6,242 MMcf of natural gas and 1,970 MBbls of NGLs, for an aggregate of 10,835 Mboe of crude oil equivalent, related to our Permian asset group. Total proved developed reserves related to those assets included 1,815 MBbls, 1,750 MMcf, 550 MBbls and 2,657 MBoe, respectively, and proved undeveloped reserves included 6,010 MBbls, 4,492 MMcf, 1,420 MBbls and 8,179 MBoe, respectively. |
| |
| (2) | Includes estimated reserve data related to our Piceance and NECO assets, which were divested in June 2013. See Note 14, Assets Held for Sale, Divestitures and Discontinued Operations, for additional details related to the divestiture of our Piceance and NECO assets. Total proved reserves include 148 MBbls of crude oil and 83,656 MMcf of natural gas, for an aggregate of 14,091 MBoe of crude oil equivalent related to our Piceance and NECO assets. There were no proved undeveloped reserves attributable to the Piceance and NECO assets as of December 31, 2012. |
PDC ENERGY, INC.
SUPPLEMENTAL INFORMATION
(Unaudited)
|
| | | | | | | | |
| | Developed | | Undeveloped | | Total |
| | (MBoe) |
| | | | | | |
| Beginning proved reserves, January 1, 2012 | 78,558 |
| | 90,690 |
| | 169,248 |
|
| Undeveloped reserves converted to developed | 7,655 |
| | (7,655 | ) | | — |
|
| Revisions of previous estimates | (18,318 | ) | | (40,321 | ) | | (58,639 | ) |
| Extensions, discoveries and other additions | 11,298 |
| | 56,643 |
| | 67,941 |
|
| Purchases of reserves | 13,542 |
| | 19,878 |
| | 33,420 |
|
| Dispositions | (2,713 | ) | | (8,178 | ) | | (10,891 | ) |
| Production | (8,269 | ) | | — |
| | (8,269 | ) |
| Ending proved reserves, December 31, 2012 | 81,753 |
| | 111,057 |
| | 192,810 |
|
| Undeveloped reserves converted to developed | 3,212 |
| | (3,212 | ) | | — |
|
| Revisions of previous estimates | (6,751 | ) | | (39,729 | ) | | (46,480 | ) |
| Extensions, discoveries and other additions | 19,830 |
| | 122,105 |
| | 141,935 |
|
| Purchases of reserves | 1,043 |
| | — |
| | 1,043 |
|
| Dispositions | (16,104 | ) | | — |
| | (16,104 | ) |
| Production | (7,430 | ) | | — |
| | (7,430 | ) |
| Ending proved reserves, December 31, 2013 | 75,553 |
| | 190,221 |
| | 265,774 |
|
| | | | | | |
2013 Activity. Overall, our proved reserves increased by 73 MMBoe as of December 31, 2013 as compared to December 31, 2012.In 2013, we recorded a downward revision of our previous estimate of proved reserves of approximately 46 MMBoe. The revision was primarily due to a decrease of approximately 55 MMBoe of which approximately 32 MMBoe is due to adjustments in previous PUD well spacing plans in the Wattenberg Field and the Marcellus Shale, which were offset by replacements in the extension category, approximately 9 MMBoe is due to expired leases, approximately 11 MMBoe is due to our shift from vertical to horizontal drilling in the Wattenberg Field and approximately 3 MMBoe is to remove Wattenberg Field PUDs that are no longer in our core drilling area. This was partially offset by an increase of 1 MMBoe due to higher gas pricing and lower operating costs in the vertical Wattenberg Field wells and horizontal Marcellus Shale wells, an increase of approximately 3 MMBoe due to non-acquisition interest adjustments, approximately 2 MMBoe due to asset performance and approximately 2 MMBoe due to production from wells that were either uneconomic, added or divested in the current year. Discoveries and extensions of approximately 142 MMBoe in 2013 are due to the addition of approximately 17 MMBoe of proved developed reserves from non-PUD drilling and the addition of approximately 125 MMBoe of new proved undeveloped reserves including 32 MMBoe due to adjustments in well spacing in the Wattenberg Field and the Marcellus Shale. Approximately 18 MMBoe was added in the Marcellus Shale, approximately 14 MMBoe was added in the Utica Shale and approximately 110 MMBoe was added in the Wattenberg Field, mostly related to the Niobrara and Codell formations. We acquired approximately 1 MMBoe of proved reserves due to an acquisition in the Appalachian-Marcellus Shale area and the acquisition of non-affiliated investor partner interests in shallow Upper Devonian wells. We divested a total of 16 MMBoe in 2013, primarily our Piceance Basin, NECO and shallow Upper Devonian (non-Marcellus Shale) assets. Based on the economic conditions on December 31, 2013, our approved development plan provides for the development of our remaining PUD reserves within five years of the date such reserves were initially recorded. Our 2013 drilling program focused on locations that were not included in proved undeveloped reserves in the December 31, 2012 reserve report due to increased well density testing in the Wattenberg Field. The success of this increased well density testing allowed us to add considerable PUD reserves in the 2013 reserve report. Because we will continue to drill both proven and non-proven downspaced Wattenberg Field locations in 2014, our PUD conversion rate is expected to be approximately 7.4%. The balance of the locations are scheduled to be drilled over the remaining four years with total PUD conversion rates of 22% in 2015, 27% in 2016, 24% in 2017 and 19% in 2018. This level of capital spending is consistent with the most recent years and our guidance for future activity.
2012 Activity. In 2012, we recorded a downward revision of our previous estimate of proved reserves of approximately 59 MMBoe. The revision was primarily due to a decrease of approximately 40 MMBoe due to lower gas pricing, mostly related to the Piceance Basin, approximately 1 MMBoe due to increased operating costs, approximately 8 MMBoe due to adjustments for geological reasons and approximately 13 MMBoe due to the removal of certain proved undeveloped reserves to comply with the SEC's five-year rule. This was partially offset by an increase of approximately 0.5 MMBoe due to non-acquisition interest adjustments and approximately 2 MMBoe due to asset performance. Discoveries and extensions of approximately 68 MMBoe in 2012 are due to the drilling of 44 gross horizontal wells and the addition of new proved undeveloped reserves. Approximately 10 MMBoe were added in the Marcellus Shale and approximately 59 MMBoe were added in the Wattenberg Field, mostly related to the Niobrara formation. We acquired approximately 33 MMBoe of proved reserves due to an acquisition in the Wattenberg Field. We divested a total of 11 MMBoe in 2012, primarily our core Permian Basin assets. Based on the economic conditions on December 31, 2012, our approved development plan provided for the development of our remaining PUD reserves within five years of the date such reserves were initially recorded. Based on our decision to drill predominantly horizontal wells in 2012, our drilling program focused on locations that were not included in proved undeveloped reserves in the December 2011 reserve report. By focusing on non-PUD drilling locations in 2012, we were able to add considerable PUD reserves in the 2012 reserve report.
2011 Activity. In 2011, we recorded a downward revision of our previous estimate of proved reserves of approximately 26 MMBoe. The revision was primarily due to a decrease of approximately 0.7 MMBoe due to lower gas pricing and approximately 29 MMBoe due to the removal of certain proved undeveloped reserves to comply with the SEC's five-year rule. This was partially offset by an increase of approximately
PDC ENERGY, INC.
SUPPLEMENTAL INFORMATION
(Unaudited)
1 MMBoe due to increased efficiencies in operating costs, approximately 0.8 MMBoe due to non-acquisition interest adjustments and approximately 2 MMBoe due to asset performance. In addition, the “Revisions of previous estimates” line item includes a deduction in the “Undeveloped” column and an increase in the “Developed” column of approximately 21 MMBoe. These reserves were transferred from proved undeveloped to proved developed as a result of the Company's determination that costs related to a refracture became less significant as compared to the costs associated with drilling a new well. Discoveries and extensions of approximately 52 MMboe in 2012 are due to the drilling of 195 gross wells and the addition of new proved undeveloped reserves. Approximately 9 MMBoe were added in the Marcellus Shale, approximately 24 MMBoe in the Wattenberg Field, 13 MMBoe in the Piceance Basin and 7 MMBoe in the Permian Basin. We acquired approximately 8 MMboe of proved reserves, approximately 1 MMBoe through acquisitions in the Marcellus Shale, approximately 5 MMBoe in the Wattenberg Field and 2 MMBoe in the Piceance Basin due to the repurchase of the 2003/2002-D and 2005 Partnerships as well as the purchase of interests in some of our other existing properties. We divested a total of approximately 0.8 MMBoe in 2012. This included the sale of 100% of our North Dakota assets, or 0.3 MMBoe, to an unrelated third-party and our non-core Permian Basin assets, or 0.5 MMBoe, to unrelated third parties.
Results of Operations for Crude Oil and Natural Gas Producing Activities
The results of operations for crude oil and natural gas producing activities are presented below. The results include activities related to both continuing and discontinued operations and exclude activities related to natural gas marketing and well operations and pipeline services.
|
| | | | | | | | | | | |
| Year Ended December 31, |
| 2013 | | 2012 | | 2011 |
| (in thousands) |
| Revenue: |
| |
| |
|
| Crude oil, natural gas and NGLs sales | $ | 379,796 |
| | $ | 274,783 |
| | $ | 304,157 |
|
| Commodity price risk management gain, net | (23,905 | ) | | 32,339 |
| | 46,090 |
|
| 355,891 |
| | 307,122 |
| | 350,247 |
|
| Expenses: | | | | | |
| Production costs | 81,365 |
| | 77,537 |
| | 75,717 |
|
| Exploration expense | 7,071 |
| | 22,605 |
| | 6,289 |
|
| Impairment of proved crude oil and natural gas properties | 53,438 |
| | 162,287 |
| | 25,159 |
|
| Depreciation, depletion, and amortization | 124,202 |
| | 146,879 |
| | 128,458 |
|
| Accretion of asset retirement obligations | 4,747 |
| | 4,060 |
| | 1,897 |
|
| (Gain) loss on sale of properties and equipment | 3,722 |
| | (24,273 | ) | | (4,050 | ) |
| 274,545 |
| | 389,095 |
| | 233,470 |
|
Results of operations for crude oil and natural gas producing
activities before provision for income taxes | 81,346 |
| | (81,973 | ) | | 116,777 |
|
| | | | | |
| Provision for income taxes | (29,400 | ) | | 31,163 |
| | (36,785 | ) |
|
| |
| |
|
| Results of operations for crude oil and natural gas producing activities, excluding corporate overhead and interest costs | $ | 51,946 |
| | $ | (50,810 | ) | | $ | 79,992 |
|
| | | | | | |
Production costs include those costs incurred to operate and maintain productive wells and related equipment, including costs such as labor, repairs, maintenance, materials, supplies, fuel consumed, insurance, production and severance taxes and associated administrative expenses. DD&A expense includes those costs associated with capitalized acquisition, exploration and development costs, but does not include the depreciation applicable to support equipment. The provision for income taxes is computed using effective tax rates.
PDC ENERGY, INC.
SUPPLEMENTAL INFORMATION
(Unaudited)
Costs Incurred in Crude Oil and Natural Gas Property Acquisition, Exploration and Development Activities
Costs incurred in crude oil and natural gas property acquisition, exploration and development are presented below.
|
| | | | | | | | | | | |
| | Year Ended December 31, |
| | 2013 | | 2012 | | 2011 |
| | (in thousands) |
| Acquisition of properties: (1) | | | | | |
| Proved properties | $ | 28,698 |
| | $ | 105,303 |
| | $ | 79,554 |
|
| Unproved properties | 3,390 |
| | 276,225 |
| | 95,081 |
|
| Development costs (2) | 332,250 |
| | 233,144 |
| | 301,008 |
|
| Exploration costs: (3) | | | | | |
| Exploratory drilling | 58,988 |
| | 18,803 |
| | 3,626 |
|
| Geological and geophysical | 752 |
| | 1,925 |
| | 1,846 |
|
| Total costs incurred | $ | 424,078 |
| | $ | 635,400 |
| | $ | 481,115 |
|
| | | | | | |
__________
| |
| (1) | Property acquisition costs represent costs incurred to purchase, lease or otherwise acquire a property. |
| |
| (2) | Development costs represent costs incurred to gain access to and prepare development well locations for drilling, drill and equip development wells, recomplete wells and provide facilities to extract, treat, gather and store crude oil, natural gas and NGLs. Of these costs incurred for the years ended December 31, 2013, 2012 and 2011, $40.1 million, $62.0 million and $80.6 million, respectively, were incurred to convert proved undeveloped reserves to proved developed reserves from the prior year end. |
| |
| (3) | Exploration costs - represents costs incurred in identifying areas that may warrant examination and in examining specific areas that are considered to have prospects of containing crude oil, natural gas and NGLs. |
Capitalized Costs Related to Crude Oil and Natural Gas Producing Activities
Aggregate capitalized costs related to crude oil and natural gas exploration and production activities with applicable accumulated DD&A are presented below:
|
| | | | | | | |
| | As of December 31, |
| | 2013 | | 2012 |
| | (in thousands) |
| | | | |
| Proved crude oil and natural gas properties | $ | 1,781,681 |
| | $ | 2,075,924 |
|
| Unproved crude oil and natural gas properties | 307,203 |
| | 319,327 |
|
| Uncompleted wells, equipment and facilities | 51,773 |
| | 62,392 |
|
| Capitalized costs | 2,140,657 |
| | 2,457,643 |
|
| Less accumulated DD&A | (529,607 | ) | | (905,458 | ) |
| Capitalized costs, net | $ | 1,611,050 |
| | $ | 1,552,185 |
|
| | | | |
Standardized Measure of Discounted Future Net Cash Flows and Changes Therein Relating to Proved Reserves
The standardized measure below has been prepared in accordance with U.S. GAAP. Future estimated cash flows were based on a 12-month average price calculated as the unweighted arithmetic average of the prices on the first day of each month, January through December, applied to our year-end estimated proved reserves. Prices for each of the three years were adjusted by field for Btucontent, transportation and regional price differences; however, they were not adjusted to reflect the value of our commodity derivatives. Production and development costs were based on prices as of December 31 for each of the respective years presented. The amounts shown do not give effect to non-property related expenses, such as corporate general and administrative expenses, debt service or to depreciation, depletion and amortization expense. Production and development costs include those cash flows associated with the expected ultimate settlement of our asset retirement obligation. Future estimated income tax expense is computed by applying the statutory rate in effect at the end of each year to the projected future pre-tax net cash flows, less the tax basis of the properties and gives effect to permanent differences, tax credits and allowances related to the properties.
The following table presents information with respect to the standardized measure of discounted future net cash flows relating to proved reserves. Changes in the demand for crude oil, natural gas and NGLs, inflation and other factors make such estimates inherently imprecise and subject to substantial revision. This table should not be construed to be an estimate of the current market value of our proved reserves.
PDC ENERGY, INC.
SUPPLEMENTAL INFORMATION
(Unaudited)
|
| | | | | | | | | | | |
| | As of December 31, |
| | 2013 | | 2012 | | 2011 |
| | (in thousands) |
| | | | | | |
| Future estimated cash flows | $ | 11,550,917 |
| | $ | 7,529,292 |
| | $ | 6,415,255 |
|
| Future estimated production costs | (2,329,836 | ) | | (1,690,453 | ) | | (1,704,645 | ) |
| Future estimated development costs | (2,778,148 | ) | | (1,852,177 | ) | | (1,474,137 | ) |
| Future estimated income tax expense | (2,119,615 | ) | | (1,230,294 | ) | | (946,849 | ) |
| Future net cash flows | 4,323,318 |
| | 2,756,368 |
| | 2,289,624 |
|
| 10% annual discount for estimated timing of cash flows | (2,541,155 | ) | | (1,587,871 | ) | | (1,348,415 | ) |
| Standardized measure of discounted future estimated net cash flows | $ | 1,782,163 |
| | $ | 1,168,497 |
| | $ | 941,209 |
|
| | | | | | |
The following table presents the principal sources of change in the standardized measure of discounted future estimated net cash flows:
|
| | | | | | | | | | | |
| | Year Ended December 31, |
| | 2013 | | 2012 | | 2011 |
| | (in thousands) |
| | | | | | |
| Sales of crude oil, natural gas and NGLs production, net of production costs | $ | (286,021 | ) | | $ | (194,346 | ) | | $ | (226,227 | ) |
| Net changes in prices and production costs (1) | 89,527 |
| | 95,501 |
| | 383,293 |
|
| Extensions, discoveries, and improved recovery, less related costs (2) | 1,529,006 |
| | 632,781 |
| | 467,347 |
|
| Sales of reserves (3) | (142,724 | ) | | (86,902 | ) | | (4,224 | ) |
| Purchases of reserves (4) | 10,610 |
| | 296,208 |
| | 64,761 |
|
| Development costs incurred during the period | 46,366 |
| | 69,198 |
| | 94,941 |
|
| Revisions of previous quantity estimates (5) | (397,738 | ) | | (452,775 | ) | | (112,468 | ) |
| Changes in estimated income taxes (6) | (381,369 | ) | | (131,256 | ) | | (204,377 | ) |
| Net changes in future development costs | (40,707 | ) | | (3,979 | ) | | (29,827 | ) |
| Accretion of discount | 142,040 |
| | 124,105 |
| | 65,284 |
|
| Timing and other | 44,676 |
| | (121,247 | ) | | (45,712 | ) |
| Total | $ | 613,666 |
| | $ | 227,288 |
| | $ | 452,791 |
|
| | | | | | |
__________
| |
| (1) | Our weighted-average price, net of production costs per Boe, in our 2013 reserve report increased to $24.24 as compared to $20.70 in our 2012 reserve report. This is due to the divestiture of our Piceance, NECO and our shallow Upper Devonian (non-Marcellus Shale) reserves during 2013 which further increased our liquids as a percentage of proved reserves. Despite the decrease in price for each of our commodities for 2012 compared to 2011, our weighted-average price, net of production costs per Boe, in our 2012 reserve report increased to $20.70 from $19.14 resulting from our increase in liquids as a percentage of total proved reserves. |
| |
| (2) | The 142% increase in 2013 as compared to 2012 is primarily due to the additions of PUDs in the Utica Shale and our continued focus on our Wattenberg drilling program. Our increased PUD count in Wattenberg is a result of successful downspacing tests in 2013 leading to a scheduled maximum rig count of seven rigs by 2016 as compared to a scheduled maximum rig count of five in the 2012 year-end reserve report. The 35% increase in 2012 as compared to 2011 reflects a continuation of our shifting focus from gas-rich projects to liquid-rich projects. At December 31, 2012, extensions, discoveries and other additions had increased to 68 MMBoe, a 30% increase, 52.2% of which was gas and 47.8% was liquids. Approximately 86% of the 35% increase was related to the additional volume of PUD reserves in the Wattenberg Field that were proved up by our 2012 drilling program. |
| |
| (3) | The increase in sales of reserves in 2013 as compared to 2012 was due to the divestiture of our Piceance and NECO assets in June 2013 and our shallow Upper Devonian (non-Marcellus Shale) assets in December of 2013. The increase in sales of reserves in 2012 as compared to 2011 was due to the divestiture of our core Permian assets on February 28, 2012. |
| |
| (4) | The decrease in purchases of reserves in 2013 as compared to 2012 was due to no material acquisitions having occurred in 2013. The increase in purchases of reserves in 2012 as compared to 2011 was due to the Merit Acquisition in the liquids-rich Wattenberg Field. |
| |
| (5) | The change in revisions of our previous quantity estimates in 2013 as compared to 2012 was primarily due to adjustment in our drilling schedule. The change in revisions of our previous quantity estimates in 2012 as compared to 2011 was primarily due to lower natural gas pricing, a decrease in proved undeveloped reserves pursuant to the SEC five-year rule and adjustments due to our drilling schedule. |
| |
| (6) | The change in estimated income taxes for each year as compared to the prior year is the direct result of the significant increase in discounted future net cash flows, as the projected deferred tax rate remained relatively unchanged at approximately 38.0%, 38.2% and 38.1% for the years ended December 31, 2013, 2012 and 2011, respectively. In addition, the Company continued to capitalize and amortize the majority of its yearly capital expenditures and there were no changes in the assumptions as to the tax deductibility of beginning unamortized capital, additional current year capital or future development capital. |
The data presented should not be viewed as representing the expected cash flows from, or current value of, existing proved reserves since the computations are based on a large number of estimates and arbitrary assumptions. Reserve quantities cannot be measured with precision and their estimation requires many judgmental determinations and frequent revisions. The required projection of production and related expenditures over time requires further estimates with respect to pipeline availability, rates of demand and governmental control. Actual future prices and costs are likely to be substantially different from the recent average prices and current costs utilized in the computation of reported
PDC ENERGY, INC.
SUPPLEMENTAL INFORMATION
(Unaudited)
amounts. Any analysis or evaluation of the reported amounts should give specific recognition to the computational methods utilized and the limitations inherent therein.
QUARTERLY FINANCIAL INFORMATION - UNAUDITED
Quarterly financial data for the years ended December 31, 2013 and 2012 is presented below. The sum of the quarters may not equal the total of the year's net income or loss per share due to changes in the weighted-average shares outstanding throughout the year.
|
| | | | | | | | | | | | | | | | | | | |
| | 2013 |
| | Quarter Ended | | |
| | March 31 | | June 30 | | September 30 | | December 31 | | Year Ended |
| | (in thousands, except per share data) |
| Revenues: | | | | | | | | | |
| Crude oil, natural gas and NGLs sales | $ | 79,439 |
| | $ | 77,537 |
| | $ | 82,136 |
| | $ | 120,286 |
| | $ | 359,398 |
|
| Sales from natural gas marketing | 13,670 |
| | 18,079 |
| | 16,946 |
| | 21,092 |
| | 69,787 |
|
| Commodity price risk management gain (loss), net | (22,355 | ) | | 24,724 |
| | (23,638 | ) | | (2,636 | ) | | (23,905 | ) |
| Well operations, pipeline income and other | 1,072 |
| | 965 |
| | 1,672 |
| | 2,325 |
| | 6,034 |
|
| Total revenues | 71,826 |
| | 121,305 |
| | 77,116 |
| | 141,067 |
| | 411,314 |
|
| Costs, expenses and other: | | | | | | | | | |
| Production costs | 15,858 |
| | 16,176 |
| | 19,057 |
| | 22,299 |
| | 73,390 |
|
| Cost of natural gas marketing | 13,736 |
| | 18,065 |
| | 17,127 |
| | 21,156 |
| | 70,084 |
|
| Exploration expense | 1,689 |
| | 1,437 |
| | 2,030 |
| | 1,883 |
| | 7,039 |
|
| Impairment of crude oil and natural gas properties | 46,459 |
| | 1,502 |
| | 4,472 |
| | 1,002 |
| | 53,435 |
|
| General and administrative expense | 15,115 |
| | 15,783 |
| | 16,080 |
| | 16,991 |
| | 63,969 |
|
| Depreciation, depletion and amortization | 27,949 |
| | 27,800 |
| | 30,870 |
| | 40,641 |
| | 127,260 |
|
| Accretion of asset retirement obligations | 1,148 |
| | 1,172 |
| | 1,186 |
| | 1,080 |
| | 4,586 |
|
| (Gain) loss on sale of properties and equipment | (38 | ) | | (9 | ) | | (712 | ) | | 2,151 |
| | 1,392 |
|
| Total costs, expenses and other | 121,916 |
| | 81,926 |
| | 90,110 |
| | 107,203 |
| | 401,155 |
|
| Income (loss) from operations | (50,090 | ) | | 39,379 |
| | (12,994 | ) | | 33,864 |
| | 10,159 |
|
| Interest expense | (13,357 | ) | | (13,089 | ) | | (12,509 | ) | | (12,943 | ) | | (51,898 | ) |
| Interest income | — |
| | 3 |
| | 130 |
| | 337 |
| | 470 |
|
| Income (loss) from continuing operations before income taxes | (63,447 | ) | | 26,293 |
| | (25,373 | ) | | 21,258 |
| | (41,269 | ) |
| Provision for income taxes | 22,492 |
| | (9,791 | ) | | 10,155 |
| | (8,059 | ) | | 14,797 |
|
| Income (loss) from continuing operations | (40,955 | ) | | 16,502 |
| | (15,218 | ) | | 13,199 |
| | (26,472 | ) |
| Income (loss) from discontinued operations, net of tax | 1,537 |
| | 3,416 |
| | (782 | ) | | — |
| | 4,171 |
|
| Net income (loss) | $ | (39,418 | ) | | $ | 19,918 |
| | $ | (16,000 | ) | | $ | 13,199 |
| | $ | (22,301 | ) |
| | | | | | | | | | |
| Earnings per share: | | | | | | | | | |
| Basic | | | | | | | | | |
| Income (loss) from continuing operations | $ | (1.35 | ) | | $ | 0.55 |
| | $ | (0.46 | ) | | $ | 0.37 |
| | $ | (0.82 | ) |
| Income (loss) from discontinued operations | 0.05 |
| | 0.11 |
| | (0.02 | ) | | — |
| | 0.13 |
|
| Net income (loss) | $ | (1.30 | ) | | $ | 0.66 |
| | $ | (0.48 | ) | | $ | 0.37 |
| | $ | (0.69 | ) |
| Diluted | | | | | | | | | |
| Income (loss) from continuing operations | $ | (1.35 | ) | | $ | 0.53 |
| | $ | (0.46 | ) | | $ | 0.36 |
| | $ | (0.82 | ) |
| Income (loss) from discontinued operations | 0.05 |
| | 0.11 |
| | (0.02 | ) | | — |
| | 0.13 |
|
| Net income (loss) | $ | (1.30 | ) | | $ | 0.64 |
| | $ | (0.48 | ) | | $ | 0.36 |
| | $ | (0.69 | ) |
| | | | | | | | | | |
| Weighted-average common shares outstanding: | | | | | | | | | |
| Basic | 30,270 |
| | 30,332 |
| | 33,413 |
| | 35,620 |
| | 32,426 |
|
| Diluted | 30,270 |
| | 31,014 |
| | 33,413 |
| | 36,836 |
| | 32,426 |
|
| | | | | | | | | | |
|
| | | | | | | | | | | | | | | | | | | |
| | 2012 |
| | Quarter Ended | | |
| | March 31 | | June 30 | | September 30 | | December 31 | | Year Ended |
| | (in thousands, except per share data) |
| Revenues: | | | | | | | | | |
| Crude oil, natural gas and NGLs sales | $ | 66,955 |
| | $ | 51,342 |
| | $ | 52,291 |
| | $ | 67,773 |
| | $ | 238,361 |
|
| Sales from natural gas marketing | 11,381 |
| | 8,613 |
| | 11,178 |
| | 14,199 |
| | 45,371 |
|
| Commodity price risk management gain (loss), net | 11,501 |
| | 38,729 |
| | (31,943 | ) | | 14,052 |
| | 32,339 |
|
| Well operations, pipeline income and other | 1,169 |
| | 1,056 |
| | 1,194 |
| | 1,115 |
| | 4,534 |
|
| Total revenues | 91,006 |
| | 99,740 |
| | 32,720 |
| | 97,139 |
| | 320,605 |
|
| Costs, expenses and other: | | | | | | | | | |
| Production costs | 12,936 |
| | 12,373 |
| | 15,797 |
| | 13,594 |
| | 54,700 |
|
| Cost of natural gas marketing | 11,091 |
| | 8,490 |
| | 11,260 |
| | 14,182 |
| | 45,023 |
|
| Exploration expense | 1,872 |
| | 2,374 |
| | 1,773 |
| | 14,875 |
| | 20,894 |
|
| Impairment of crude oil and natural gas properties | 588 |
| | 356 |
| | 388 |
| | 4,563 |
| | 5,895 |
|
| General and administrative expense | 14,708 |
| | 14,378 |
| | 13,710 |
| | 16,019 |
| | 58,815 |
|
| Depreciation, depletion and amortization | 27,912 |
| | 23,839 |
| | 22,121 |
| | 24,906 |
| | 98,778 |
|
| Accretion of asset retirement obligations | 727 |
| | 732 |
| | 1,101 |
| | 1,127 |
| | 3,687 |
|
| Gain on sale of properties and equipment | (154 | ) | | (2,246 | ) | | (1,508 | ) | | (445 | ) | | (4,353 | ) |
| Total costs, expenses and other | 69,680 |
| | 60,296 |
| | 64,642 |
| | 88,821 |
| | 283,439 |
|
| Income (loss) from operations | 21,326 |
| | 39,444 |
| | (31,922 | ) | | 8,318 |
| | 37,166 |
|
| Loss on extinguishment of debt | — |
| | — |
| | — |
| | (23,283 | ) | | (23,283 | ) |
| Interest expense | (10,444 | ) | | (10,053 | ) | | (11,360 | ) | | (16,430 | ) | | (48,287 | ) |
| Interest income | 2 |
| | — |
| | 3 |
| | 3 |
| | 8 |
|
| Income (loss) from continuing operations before income taxes | 10,884 |
| | 29,391 |
| | (43,279 | ) | | (31,392 | ) | | (34,396 | ) |
| Provision for income taxes | (4,120 | ) | | (10,213 | ) | | 15,268 |
| | 11,766 |
| | 12,701 |
|
| Income (loss) from continuing operations | 6,764 |
| | 19,178 |
| | (28,011 | ) | | (19,626 | ) | | (21,695 | ) |
| Income (loss) from discontinued operations, net of tax | 9,071 |
| | (6,907 | ) | | (4,632 | ) | | (106,549 | ) | | (109,017 | ) |
| Net income (loss) | $ | 15,835 |
| | $ | 12,271 |
| | $ | (32,643 | ) | | $ | (126,175 | ) | | $ | (130,712 | ) |
| | | | | | | | | | |
| Earnings per share: | | | | | | | | | |
| Basic | | | | | | | | | |
| Income (loss) from continuing operations | $ | 0.29 |
| | $ | 0.72 |
| | $ | (0.93 | ) | | $ | (0.65 | ) | | $ | (0.78 | ) |
| Income (loss) from discontinued operations | 0.38 |
| | (0.26 | ) | | (0.15 | ) | | (3.52 | ) | | (3.94 | ) |
| Net income (loss) attributable to shareholders | $ | 0.67 |
| | $ | 0.46 |
| | $ | (1.08 | ) | | $ | (4.17 | ) | | $ | (4.72 | ) |
| Diluted | | | | | | | | | |
| Income (loss) from continuing operations | $ | 0.28 |
| | $ | 0.72 |
| | $ | (0.93 | ) | | $ | (0.65 | ) | | $ | (0.78 | ) |
| Income (loss) from discontinued operations | 0.38 |
| | (0.26 | ) | | (0.15 | ) | | (3.52 | ) | | (3.94 | ) |
| Net income (loss) attributable to shareholders | $ | 0.66 |
| | $ | 0.46 |
| | $ | (1.08 | ) | | $ | (4.17 | ) | | $ | (4.72 | ) |
| | | | | | | | | | |
| Weighted-average common shares outstanding | | | | | | | | | |
| Basic | 23,609 |
| | 26,597 |
| | 30,214 |
| | 30,233 |
| | 27,677 |
|
| Diluted | 23,889 |
| | 26,728 |
| | 30,214 |
| | 30,233 |
| | 27,677 |
|
| | | | | | | | | | |
FINANCIAL STATEMENT SCHEDULE
Schedule II -VALUATION AND QUALIFYING ACCOUNTS
|
| | | | | | | | | | | | | | | | | | | | |
| Description | | Beginning
Balance
January 1 | | Deconsolidation/Purchase Price Adjustment for PDCM | | Charged to
Costs and
Expenses | | Deductions (1) | | Ending
Balance
December 31 |
| | | (in thousands) |
| | | | | | | | | | | |
| 2013: | | | | | | | | | | |
| Allowance for doubtful accounts | | $ | 1,026 |
| | $ | — |
| | $ | 423 |
| | $ | 188 |
| | $ | 1,261 |
|
| Valuation allowance for unproved crude oil and natural gas properties | | 8,036 |
| | — |
| | 3,964 |
| | 6,400 |
| | 5,600 |
|
| 2012: | | | | | | | | | | |
| Allowance for doubtful accounts | | 921 |
| | — |
| | 258 |
| | 153 |
| | 1,026 |
|
| Valuation allowance for unproved crude oil and natural gas properties | | 12,204 |
| | — |
| | 4,207 |
| | 8,375 |
| | 8,036 |
|
| 2011: | | | | | | | | | | |
| Allowance for doubtful accounts | | 686 |
| | 121 |
| | 135 |
| | 21 |
| | 921 |
|
| Valuation allowance for unproved crude oil and natural gas properties | | 16,996 |
| | 260 |
| | 2,611 |
| | 7,143 |
| | 12,204 |
|
_______________
| |
| (1) | For allowance for doubtful accounts, deductions represent the write-off of accounts receivable deemed uncollectible. For valuation allowance for unproved crude oil and natural gas properties, deductions represent accumulated amortization of expired or abandoned unproved crude oil and natural gas properties, with a corresponding decrease to the historical cost of the associated asset. |
NOTE 5 - CONCENTRATION OF RISKITEM 9. CHANGES IN AND DISAGREEMENTS WITH ACCOUNTANTS ON ACCOUNTING AND FINANCIAL DISCLOSURE
Accounts Receivable. The following table presents the components of accounts receivable, net of allowance for doubtful accounts:
|
| | | | | | | |
| | As of December 31, |
| | 2012 | | 2011 |
| | (in thousands) |
| | | | |
| Natural gas, NGLs and crude oil sales | $ | 39,837 |
| | $ | 42,388 |
|
| Natural gas marketing | 8,209 |
| | 6,225 |
|
| Reimbursements for title defects | 7,579 |
| | — |
|
| Joint interest billings | 6,896 |
| | 7,465 |
|
| Other | 3,385 |
| | 4,766 |
|
| Allowance for doubtful accounts | (1,026 | ) | | (921 | ) |
| Accounts receivable, net | $ | 64,880 |
| | $ | 59,923 |
|
| | | | |
Our accounts receivable primarily relates to sales of our natural gas, NGLs and crude oil production, derivative counterparties and other third parties that own working interests in the properties we operate. Inherent to our industry is the concentration of natural gas, NGLs and crude oil sales to a limited number of customers. This industry concentration has the potential to impact our overall exposure to credit risk in that our customers may be similarly affected by changes in economic and financial conditions, commodity prices or other conditions. We record an allowance for doubtful accounts representing our best estimate of probable losses from our existing accounts receivable. In making our estimate, we consider, among other things, our historical write-offs and overall creditworthiness of our customers. Further, consideration is given to well production data for receivables related to well operations. Our estimate of uncollectible amounts changes periodically. For the each of the years in the three-year period ended December 31, 2012, amounts written off to allowance for doubtful accounts were not material. As of December 31, 2012, we had two customers representing 10% or greater of our accounts receivable balance: Suncor Energy Marketing and Merit Energy, representing 26.4% and 11.7%, respectively, of our accounts receivable balance. The $7.6 million of accounts receivable at December 31, 2012 due from Merit Energy related to reimbursements for title defects discovered subsequent to our acquisition of certain Wattenberg assets from affiliates of Merit Energy (the "Merit Acquisition"). The reimbursement for certain title defects was received in January 2013.
PDC ENERGY, INC.
NOTES TO CONSOLIDATED FINANCIAL STATEMENTS - Continued
Major Customers. The following table presents the individual customers constituting 10% or more of total revenues:
|
| | | | | | | | | |
| | | Year Ended December 31, |
| Customer | | 2012 | | 2011 | | 2010 |
| | | | | | | |
| Suncor Energy Marketing, Inc. | | 29.8 | % | | 25.7 | % | | 19.6 | % |
| DCP Midstream, LP | | 12.2 | % | | 11.5 | % | | 9.6 | % |
| WPX Energy Rocky Mountain, LLC | | 5.6 | % | | 9.9 | % | | 12.5 | % |
Derivative Counterparties. A significant portion of our liquidity is concentrated in derivative instruments that enable us to manage a portion of our exposure to price volatility from producing natural gas and crude oil. These arrangements expose us to credit risk of nonperformance by our counterparties. We primarily use financial institutions who are also major lenders under our revolving credit facility as counterparties to our derivative contracts. To date, we have had no counterparty default losses. We have evaluated the credit risk of our derivative assets from our counterparties using relevant credit market default rates, giving consideration to amounts outstanding for each counterparty and the duration of each outstanding derivative position. Based on our evaluation, we have determined that the potential impact of nonperformance of our counterparties on the fair value of our derivative instruments was not significant.
The following table presents the counterparties that expose us to credit risk as of December 31, 2012, with regard to our derivative assets:
|
| | | | |
| | Fair Value of
Derivative Assets |
| Counterparty Name | | As of December 31, 2012 |
| | | (in thousands) |
| | | |
| JPMorgan Chase Bank, N.A. (1) | | $ | 41,323 |
|
| Wells Fargo Bank, N.A. (1) | | 4,782 |
|
| Bank of Nova Scotia (1) | | 4,315 |
|
| Other lenders in our revolving credit facility | | 8,146 |
|
| Various (2) | | 359 |
|
| Total | | $ | 58,925 |
|
| | | |
____________
(1)Major lender in our revolving credit facility. See Note 8, Long-Term Debt.
(2)Represents a total of 28 counterparties.None.
NOTE 6 - PROPERTIESITEM 9A. CONTROLS AND EQUIPMENTPROCEDURES
The following table presents the componentsEvaluation of propertiesDisclosure Controls and equipment, net of accumulated depreciation, depletion and amortization:
|
| | | | | | | |
| | As of December 31, |
| | 2012 | | 2011 |
| | (in thousands) |
| Properties and equipment, net: | | | |
| Natural gas and crude oil properties | | | |
| Proved | $ | 2,075,924 |
| | $ | 1,694,694 |
|
| Unproved | 319,327 |
| | 102,466 |
|
| Total natural gas and crude oil properties | 2,395,251 |
| | 1,797,160 |
|
| Pipelines and related facilities | 47,786 |
| | 40,721 |
|
| Transportation and other equipment | 34,858 |
| | 32,475 |
|
| Land and buildings | 14,935 |
| | 14,572 |
|
| Construction in progress | 67,217 |
| | 69,633 |
|
| Gross properties and equipment | 2,560,047 |
| | 1,954,561 |
|
| Accumulated depreciation, depletion and amortization | (943,341 | ) | | (652,845 | ) |
| Properties and equipment, net | $ | 1,616,706 |
| | $ | 1,301,716 |
|
| | | | |
PDC ENERGY, INC.
NOTES TO CONSOLIDATED FINANCIAL STATEMENTS - Continued
The following table presents impairment charges recorded for natural gas and crude oil properties:
|
| | | | | | | | | | | |
| | Year Ended December 31, |
| | 2012 | | 2011 | | 2010 |
| | (in thousands) |
| Continuing operations: | | | | | |
| Impairment of proved properties | $ | 161,185 |
| | $ | 22,460 |
| | $ | — |
|
| Impairment of individually significant unproved properties | 1,943 |
| | 1,108 |
| | 1,477 |
|
| Amortization of individually insignificant unproved properties | 5,021 |
| | 1,591 |
| | 5,004 |
|
| Total continuing operations | 168,149 |
| | 25,159 |
| | 6,481 |
|
| Discontinued operations: | | | | | |
| Impairment of proved properties | — |
| | — |
| | 4,666 |
|
| Total discontinued operations | — |
| | — |
| | 4,666 |
|
| Total impairment of natural gas and crude oil properties | $ | 168,149 |
| | $ | 25,159 |
| | $ | 11,147 |
|
| | | | | | |
In December 2012, we recognized an impairment charge of $161.2 million associated with our Piceance Basin proved oil and natural gas properties. The assets were determined to be impaired as the estimated undiscounted future net cash flows were less than the carrying value of the assets. The fair value for determining the amount of the impairment charge was based on estimated future cash flows from an unrelated third-party bid, a Level 3 input, as we changed our development plans in the basin and decided to sell the related assets. The impairment charge was included in the statement of operations line item impairment of natural gas and crude oil properties. See Note 19, Subsequent Events, for additional information regarding the planned sale of certain of our oil and natural gas properties.
In 2011, we recognized an impairment charge of $22.5 million to write-down our NECO assets to fair value. The fair value was based on unrelated third-party bids, a level 3 input. The impairment charge was included in the statement of operations' line item impairment of natural gas and crude oil properties.
In May 2010, pursuant to our entry into an agreement to sell our Michigan assets, we reclassified our Michigan assets as held for sale. We compared the transactional sales price, considered a Level 3 input, less costs to sell to the carrying value of our Michigan net assets. The net carrying value exceeded the net sales price and, therefore, during the second quarter of 2010, we recognized a pre-tax impairment charge of $4.7 million to reduce the carrying value of the net assets to reflect the net sales price. The impairment charge was included in discontinued operations on the statement of operations. See Note 14, Assets Held for Sale, Divestitures, and Discontinued Operations.
Suspended Well Costs
The following table presents the capitalized exploratory well costs pending determination of proved reserves, and included in properties and equipment on the balance sheets:
|
| | | | | | | | | | | |
| 2012 | | 2011 | | 2010 |
| (in thousands, except for number of wells) |
| | | | | |
| Balance beginning of year, January 1, | $ | 4,432 |
| | $ | 2,297 |
| | $ | 1,174 |
|
| Additions to capitalized exploratory well costs pending the determination of proved reserves | 30,482 |
| | 3,692 |
| | 4,353 |
|
| Reclassifications to wells, facilities and equipment based on the determination of proved reserves | — |
| | (1,557 | ) | | (2,231 | ) |
| Deconsolidation of PDCM and change in ownership interest | — |
| | — |
| | (462 | ) |
| Capitalized exploratory well costs charged to expense | (15,347 | ) | | — |
| | (537 | ) |
| Balance end of year, December 31, | $ | 19,567 |
| | $ | 4,432 |
| | $ | 2,297 |
|
| | | | | |
| Number of wells pending determination at December 31, | 2 |
| | 6 |
| | 3 |
|
| | | | | | |
Additions to capitalized exploratory well costs pending determination of proved reserves increased in 2012 as compared to prior years as we increased our exploratory drilling activities in the liquid-rich emerging Utica Shale play.
In 2012, capitalized well costs related to two vertical stratigraphic test wells in eastern Ohio were expensed at a cost of $12.2 million. Additionally, three wells in south central Ohio and a well in southeast Colorado were determined to have noncommercial quantities of hydrocarbons and were expensed at a cost of $1.2 million and $0.9 million, respectively.
PDC ENERGY, INC.
NOTES TO CONSOLIDATED FINANCIAL STATEMENTS - Continued
The following table presents an aging of capitalized exploratory well costs based on the date that drilling commenced and the number of projects for which exploratory well costs have been capitalized for a period greater than one year since the commencement of drilling:
|
| | | | | | | | | | | |
| | As of December 31, |
| | 2012 | | 2011 | | 2010 |
| | (in thousands) |
| | | | | | |
| Exploratory well costs capitalized for a period of one year or less | $ | 19,567 |
| | $ | 3,587 |
| | $ | 2,297 |
|
| Exploratory well costs capitalized for a period greater than one year since commencement of drilling | — |
| | 845 |
| | — |
|
| Balance end of year, December 31, | $ | 19,567 |
| | $ | 4,432 |
| | $ | 2,297 |
|
| Number of projects with exploratory well costs that have been capitalized for a period greater than one year since commencement of drilling | — |
| | 2 |
| | — |
|
NOTE 7 - INCOME TAXES
The table below presents the components of our provision for income taxes from continuing operations for the years presented:
|
| | | | | | | | | | | |
| | Year Ended December 31, |
| | 2012 | | 2011 | | 2010 |
| | (in thousands) |
| Current: | | | | | |
| Federal | $ | — |
| | $ | 3,172 |
| | $ | 1,616 |
|
| State | (199 | ) | | 172 |
| | (904 | ) |
| Total current income taxes | (199 | ) | | 3,344 |
| | 712 |
|
| Deferred: | | | | | |
| Federal | 78,425 |
| | (2,868 | ) | | (3,990 | ) |
| State | 10,609 |
| | (293 | ) | | 2,626 |
|
| Total deferred income taxes | 89,034 |
| | (3,161 | ) | | (1,364 | ) |
| Provision for income taxes from continuing operations | $ | 88,835 |
| | $ | 183 |
| | $ | (652 | ) |
| | | | | | |
We continue to utilize tax deferral strategies such as bonus and accelerated depreciation, IRC Section 1031 like-kind exchange strategies and intangible drilling cost expense elections to minimize our current taxes. As a result of these elections and deferral strategies, we have generated federal and state net operating losses (“NOLs”) in 2012, 2011 and 2010. Substantially, all the 2010 federal NOL was carried back to 2008, generating a refund of $4.6 million which was received in the fourth quarter of 2011. The remaining federal NOLs and substantially all the state NOLs are being carried forward to 2013 and/or future periods. We expect to utilize our federal NOL and a substantial portion of our state NOLs to offset the projected 2013 taxable gain on the planned sale of our non-core Colorado assets. See Note 19, Subsequent Events, for additional information regarding the planned sale. There can be no assurance we will be successful in closing such divestiture.
PDC ENERGY, INC.
NOTES TO CONSOLIDATED FINANCIAL STATEMENTS - Continued
The following table presents a reconciliation of the statutory rate to the effective tax rate related to our provision for income taxes from continuing operations:
|
| | | | | | | | |
| | Year Ended December, 31, |
| | 2012 | | 2011 | | 2010 |
| | | | | | |
| Statutory tax rate | 35.0 | % | | 35.0 | % | | 35.0 | % |
| State income tax, net | 2.9 |
| | (9.4 | ) | | 1.3 |
|
| Percentage depletion | 0.3 |
| | (29.5 | ) | | (11.3 | ) |
| Non-deductible compensation | (0.1 | ) | | — |
| | 4.4 |
|
| Non-deductible meals and entertainment | (0.1 | ) | | 3.1 |
| | 1.2 |
|
| State deferred rate change | — |
| | 15.4 |
| | (26.2 | ) |
| Unrecognized tax benefits | — |
| | (30.3 | ) | | 2.4 |
|
| State tax credits | — |
| | — |
| | (3.3 | ) |
| Federal return examination adjustments | — |
| | 4.2 |
| | 4.7 |
|
| Return to provision adjustments | — |
| | 3.7 |
| | — |
|
| Other | — |
| | 1.5 |
| | 1.5 |
|
| Effective tax rate | 38.0 | % | | (6.3 | )% | | 9.7 | % |
| | | | | | |
The tax effects of temporary differences that give rise to significant portions of the deferred tax assets and deferred tax liabilities at December 31, 2012 and 2011 are presented below:
|
| | | | | | | |
| | As of December 31, |
| | 2012 | | 2011 |
| | (in thousands) |
| Deferred tax assets: | | | |
| Provision for underpayment of natural gas sales | $ | — |
| | $ | 3,334 |
|
| Deferred compensation | 7,216 |
| | 4,319 |
|
| Asset retirement obligations | 10,325 |
| | 9,438 |
|
| State NOL and tax credit carryforwards, net | 6,117 |
| | 5,240 |
|
| Percentage depletion - carryforward | 4,702 |
| | 3,733 |
|
| Alternative minimum tax - credit carryforward | 2,351 |
| | 2,351 |
|
| Federal NOL carryforward | 21,281 |
| | 12,210 |
|
| Other | 2,276 |
| | 2,621 |
|
| Deferred tax assets | 54,268 |
| | 43,246 |
|
| | | | |
| Deferred tax liabilities: | | | |
| Properties and equipment | 122,742 |
| | 184,657 |
|
| Investment in PDCM | 31,445 |
| | 30,919 |
|
| Unrealized gains - derivatives | 7,163 |
| | 12,612 |
|
| Convertible debt | 5,194 |
| | 6,504 |
|
| Total gross deferred tax liabilities | 166,544 |
| | 234,692 |
|
| Net deferred tax liability | $ | 112,276 |
| | $ | 191,446 |
|
| | | | |
| Classification in the balance sheets: | | | |
| Deferred income tax assets | $ | 36,151 |
| | $ | 16,127 |
|
| Deferred income tax liability | 148,427 |
| | 207,573 |
|
| Net deferred tax liability | $ | 112,276 |
| | $ | 191,446 |
|
| | | | |
Deferred tax liabilities for properties and equipment decreased in 2012 primarily as a result of our impairment of certain oil and gas properties, which is an expense not currently deductible from taxable income, partially offset by our continued use of statutory provisions for bonus and accelerated tax depreciation. In addition, a tax gain, previously deferred through the use of IRC Section 1031 LKE strategies, was recognized upon the sale of our Permian Basin assets.Procedures
As of December 31, 20122013, we have state NOL carryforwardscarried out an evaluation under the supervision and with the participation of $142.4 million that begin to expire in 2029, state credit carryforwardsmanagement, including the Chief Executive Officer and the Chief Financial Officer, of $1.8 million that begin to expire in 2022the effectiveness of the design and federal NOL carryforwards of $60.8 million that will expire in 2030. Approximately $0.9 million
PDC ENERGY, INC.
NOTES TO CONSOLIDATED FINANCIAL STATEMENTS - Continued
of excess tax benefits relating to stock-based compensation that are a componentoperation of our NOL carryforwards, when realized, will be crediteddisclosure controls and procedures pursuant to APIC.
The following table presents a reconciliationExchange Act Rules 13a-15(e) and 15d-15(e). Based on the results of this evaluation, the total amounts of unrecognized tax benefits:
|
| | | | | | | | | | | | |
| | 2012 | | 2011 | | 2010 |
| | (in thousands) |
| | | | | | |
| Balance beginning of year, January 1 | | $ | 179 |
| | $ | 1,093 |
| | $ | 566 |
|
| Additions for tax positions of prior years | | — |
| | — |
| | 253 |
|
| Additions for tax positions of current year | | — |
| | — |
| | 274 |
|
| Reductions due to settlements | | — |
| | (782 | ) | | — |
|
| Reductions due to lapse of statute of limitations | | — |
| | (132 | ) | | — |
|
| Balance end of year, December 31 | | $ | 179 |
| | $ | 179 |
| | $ | 1,093 |
|
| | | | | | |
InterestChief Executive Officer and penalties related to uncertain tax positions are recognized in income tax expense. Accrued interestthe Chief Financial Officer concluded that our disclosure controls and penalties related to uncertain tax positionsprocedures were immaterial for each of the years in the three-year period ended December 31, 2012. The total amount of unrecognized tax benefits that would affect the effective tax rate, if recognized, was $0.2 million as of December 31, 20122013 and .
Changes in Internal Control over Financial Reporting
December 31, 2011, respectively. AsDuring the fourth quarter of December 31, 20122013, we expect a decreasemade no changes in the unrecognized tax benefitour internal control over financial reporting (as such term is defined in the next twelve months due to statute of limitation expiration. During 2012, we did not reduce our liability for any uncertain tax benefits, of which the remaining balance is related to our state tax filings, as no prior tax positions were resolved, nor did we have any new uncertain tax benefits arise during the year. The statute of limitation for most of our state tax jurisdictions is open from 2008 forward.
In accordance with the Compliance Assurance Process ("CAP"), the IRS completed its “post filing review” of our 2010 tax return in January 2012Rules 13a-15(f) and completed their “post filing review” of our 2011 tax return in January 2013. We have been issued a “no change” letter for both15d-15(f) of the reviewed tax years. The CAP audit employs a real-time review ofExchange Act) that have materially affected or are reasonably likely to materially affect our books and tax records by the IRS that is intended to permit issue resolution prior to, or shortly after, the filing of the tax returns. We are currently participating in the IRS CAP program for the review of our 2012 tax year and we have been invited and have accepted continued participation in the program for our 2013 tax year. Participation in the IRS CAP program has enabled us to currently have no uncertain tax benefits associated with our federal tax return filings. During 2011, we were able to reduce our liability for uncertain tax benefits upon accelerated examination and settlement of our 2007-2009 tax years upon entering the IRS program.internal control over financial reporting.
PDC ENERGY, INC.
NOTES TO CONSOLIDATED FINANCIAL STATEMENTS - Continued
NOTE 8 - LONG-TERM DEBT
Long-term debt consists of the following:
|
| | | | | | | |
| | As of December 31, |
| | 2012 | | 2011 |
| | (in thousands) |
| Senior notes | | | |
| 3.25% Convertible senior notes due 2016: | | | |
| Principal amount | $ | 115,000 |
| | $ | 115,000 |
|
| Unamortized discount | (13,671 | ) | | (17,079 | ) |
| 3.25% Convertible senior notes due 2016, net of discount | 101,329 |
| | 97,921 |
|
| 7.75% Senior notes due 2022: | | | |
| Principal amount | 500,000 |
| | — |
|
| 12% Senior notes due 2018: | | | |
| Principal amount | — |
| | 203,000 |
|
| Unamortized discount | — |
| | (1,764 | ) |
| 12% Senior notes due 2018, net of discount | — |
| | 201,236 |
|
| Total senior notes | 601,329 |
| | 299,157 |
|
| Credit facilities | | | |
| Corporate | 49,000 |
| | 209,000 |
|
| PDCM | 26,250 |
| | 24,000 |
|
| Total credit facilities | 75,250 |
| | 233,000 |
|
| Total long-term debt | $ | 676,579 |
| | $ | 532,157 |
|
| | | |
Senior Notes
3.25% Convertible Senior Notes Due 2016. In November 2010, we issued $115 million of 3.25% convertible senior notes due 2016 (the "2016 Convertible Senior Notes") in a private placement to qualified institutional buyers. The convertible notes and the common stock issuable upon conversion of the convertible notes, if any, have not been registered under the Securities Act of 1933 ("Securities Act") or any state securities laws, nor are we required to register such convertible notes or common shares. The convertible notes are governed by an indenture dated November 23, 2010, between the Company and the Bank of New York Mellon, as trustee. The maturity for the payment of principal is May 15, 2016. Interest at the rate of 3.25% per year is payable in cash semiannually in arrears on each May 15 and November 15, commencing on May 15, 2011. The convertible notes are senior, unsecured obligations and rank senior in right of payment to our existing and future indebtedness that is expressly subordinated in right of payment to the convertible notes; equal in right of payment to our existing and future unsecured indebtedness that is not so subordinated (including our 2022 Senior Notes); effectively junior in right of payment to any of our secured indebtedness (including our obligations under our senior secured credit facility) to the extent of the value of the assets securing such indebtedness; and structurally junior to all existing and future indebtedness (including trade payables) incurred by our subsidiaries. The indenture governing the convertible notes does not contain any restrictive financial covenants.
We may not redeem the convertible notes prior to the maturity date of the convertible notes. However, prior to November 15, 2015, holders of the convertible notes may convert upon specified events and periods as defined in the governing indenture. The notes are convertible at any time thereafter at an initial conversion rate of 23.5849 per $1,000 principal amount of the convertible notes, which is equal to a conversion price of approximately $42.40 per share. The conversion rate is subject to adjustment upon certain events. Upon conversion, the convertible notes may be settled, at our election, in shares of our common stock, cash or a combination of cash and shares of our common stock. We have initially elected a net-settlement method to satisfy our conversion obligation, which allows us to settle the $1,000 principal amount of the convertible notes in cash and to settle the excess conversion value in shares, as well as cash in lieu of fractional shares.
We allocated the gross proceeds of the convertible notes between the liability and equity components of the debt. The initial $94.3 million liability component was determined based on the fair value of similar debt instruments with similar terms, excluding the conversion feature, and priced on the same day we issued our convertible notes. The initial $20.7 million equity component represents the debt discount and was calculated as the difference between the liability component of the debt and the gross proceeds of the convertible notes. As of December 31, 2012, the unamortized debt discount will be amortized over the remaining contractual term to maturity of the convertible notes of 3.4 years using an effective interest rate of 7.4%. For 2012, interest expense related to the indebtedness and the amortization of the discount were $3.7 million and $3.4 million, respectively, compared to $3.7 million and $3.2 million, respectively, in 2011. As of December 31, 2012 and 2011, notwithstanding the inability to convert, assuming conversion, the value of the convertible notes did not exceed the principal amount.
PDC ENERGY, INC.
NOTES TO CONSOLIDATED FINANCIAL STATEMENTS - Continued
7.75% Senior Notes Due 2022. On October 3, 2012, we issued $500 million aggregate principal amount of 7.75% senior notes due October 15, 2022 (the “2022 Senior Notes”) in a private placement. The proceeds from the issuance of the notes, after the initial purchasers' commissions and estimated offering expenses, were used to fund the redemption of our 2018 Senior Notes, repay a portion of the amount outstanding under our revolving credit facility and for general corporate purposes. The 2022 Senior Notes accrue interest from the date of issuance and interest is payable semi-annually in arrears on April 15 and October 15, commencing on April 15, 2013. Approximately $11 million in costs associated with the issuance of the 2022 Senior Notes have been capitalized as debt issuance costs and are being amortized as interest expense over the life of the notes using the effective interest method. The 2022 Senior Notes are senior unsecured obligations and rank senior in right of payment to any of our future indebtedness that is expressly subordinated to the notes. The 2022 Senior Notes rank equally in right of payment with all our existing and future senior indebtedness (including our 2016 Convertible Senior Notes) and rank effectively junior in right of payment to all of our secured indebtedness (to the extent of the value of the collateral securing such indebtedness), including borrowings under our revolving credit facility.
In connection with the issuance of the 2022 Senior Notes, we entered into a registration rights agreement with the initial purchasers in which we agreed to file a registration statement with the SEC relating to an offer to exchange the 2022 Senior Notes for registered notes with substantially identical terms. In addition, we have agreed, in certain circumstances, to file a shelf registration statement covering the resale of the 2022 Senior Notes by holders.
At any time prior to October 15, 2017, we may redeem all or part of the 2022 Senior Notes at a make-whole price set forth in the indenture, and on or after October 15, 2017, we may redeem the notes at fixed redemption prices, plus accrued and unpaid interest, if any, to the date of redemption.
At any time prior to October 15, 2015, we may redeem up to 35% of the outstanding 2022 Senior Notes with proceeds from certain equity offerings at a redemption price of 107.75% of the principal amount of the notes redeemed, plus accrued and unpaid interest, as long as:
at least 65% of the aggregate principal amount of the notes issued on October 3, 2012 remains outstanding after each such redemption; and
the redemption occurs within 180 days after the closing of the equity offering.
Upon the occurrence of a "change of control" as defined in the indenture for the 2022 Senior Notes, holders will have the right to require us to repurchase all or a portion of the notes at a price equal to 101% of the aggregate principal amount of the notes repurchased, together with any accrued and unpaid interest to the date of purchase. In connection with certain asset sales, we will be required to use the net cash proceeds of the asset sale to make an offer to purchase the notes at 100% of the principal amount, together with any accrued and unpaid interest to the date of purchase.
The indenture governing the 2022 Senior Notes contains covenants that, among other things, limit our ability and the ability of our subsidiaries to incur additional indebtedness; pay dividends or make distributions on our stock; purchase or redeem stock or subordinated indebtedness; make certain investments; create certain liens; restrict dividends or other payments by restricted subsidiaries; enter into transactions with affiliates; sell assets; and merge or consolidate with another company.
12% Senior Notes Due 2018. On October 3, 2012, we issued a notice to redeem on November 2, 2012 the entire $203 million principal amount of the 12% senior notes due 2018 (the "2018 Senior Notes") for a total redemption price of approximately $222 million, including an $18.9 million make-whole premium. The make-whole provision was based upon terms set forth in the related indenture. On November 2, upon the redemption of the 2018 Senior Notes, the $18.9 million make-whole premium, remaining unamortized debt discount of $1.5 million and unamortized debt issuance costs of $2.9 million were recognized as a $23.3 million pre-tax loss on debt extinguishment in the consolidated statement of operations. The amount paid to bond holders for the make-whole premium has been included as a financing activity in our statement of cash flows.
Credit Facilities
Revolving Credit Facility. In November 2010, we obtained a revolving credit facility pursuant to a Second Amended and Restated Credit Agreement with JPMorgan Chase Bank, N.A. as administrative agent and other lenders party thereto. The revolving credit facility is available for working capital requirements, capital expenditures, acquisitions, general corporate purposes and to support letters of credit. The maximum facility amount is $600 million. As of December 31, 2012, we had $49 million outstanding on our revolving credit facility, compared to $209 million as of December 31, 2011. The borrowing base of the revolving credit facility will be the loan value assigned to the proved reserves attributable to our and our subsidiaries' natural gas and crude oil interests, excluding proved reserves attributable to PDCM and our 21 affiliated partnerships. Our revolving credit facility borrowing base is subject to a semiannual size redetermination based on quantification of our reserves at June 30 and December 31, and is also subject to a redetermination upon the occurrence of certain events. The revolving credit facility is secured by a pledge of the stock of certain of our subsidiaries, mortgages of certain producing natural gas and crude oil properties and substantially all of our and such subsidiaries' other assets. Neither PDCM nor the various limited partnerships that we have sponsored, and continue to serve as the managing general partner, are guarantors of the revolving credit facility.
On October 31, 2012, the semi-annual redetermination of our revolving credit facility's borrowing base was completed with our available borrowing base being reduced from $525 million to $450 million as a result of the 2022 Senior Notes issuance. On September 21, 2012, we entered into a Sixth Amendment to the revolving credit facility. The Sixth Amendment increased the amount of senior note
PDC ENERGY, INC.
NOTES TO CONSOLIDATED FINANCIAL STATEMENTS - Continued
indebtedness and refinancing indebtedness permitted under the revolving credit agreement. On June 29, 2012, concurrent with the Merit Acquisition, we entered into a Fifth Amendment to our revolving credit facility. The Fifth Amendment increased our available borrowing base to $525 million from $425 million based on our natural gas and crude oil reserves as of December 31, 2011 and the estimated reserves as of April 1, 2012 for the acquired assets from the Merit Acquisition. On June 25, 2012, we entered into the Fourth Amendment to our revolving credit facility. The Fourth Amendment amended certain provisions of the revolving credit facility to allow us greater flexibility in entering into hedging transactions in connection with future potential asset acquisitions. On May 4, 2012, we entered into the Third Amendment to our revolving credit facility and, as a result of the semi-annual redetermination by our bank group, our borrowing base was increased by $25 million to $425 million.
Our outstanding principal amount accrues interest at a varying interest rate that fluctuates with an alternate base rate (equal to the greater of JPMorgan Chase Bank, N.A.'s prime rate, the federal funds rate plus a premium and 1-month LIBOR plus a premium), or at our election, a rate equal to the rate for dollar deposits in the London interbank market for certain time periods. Additionally, commitment fees, interest margin and other bank fees, charged as a component of interest, vary with our utilization of the facility. No principal payments are required until the credit agreement expires on November 5, 2015, or in the event that the borrowing base would fall below the outstanding balance.
The revolving credit facility contains covenants customary for agreements of this type, with the most restrictive being certain financial tests and maintaining certain financial ratios on a quarterly basis. The financial tests and ratios, as defined per the revolving credit facility, include requirements to: (a) maintain a minimum current ratio of 1.00 to 1.00 and (b) not exceed a maximum leverage ratio of 4.00 to 1.00.
The revolving credit facility contains restrictions as to when we can directly or indirectly, retire, redeem, repurchase or prepay in cash any part of the principal of the 2022 Senior Notes or the 2016 Convertible Senior Notes. Among other things, the restriction on redemption of the 2016 Convertible Senior Notes requires that immediately after giving effect to any such retirement, redemption, defeasance, repurchase, settlement or prepayment, the aggregate commitment under the revolving credit facility exceed the aggregate credit exposure under such facility by at least the greater of $115 million or an amount equal to or greater than 30% of such aggregate commitment. The restriction on redemption of the 2022 Senior Notes permits redemption only with the proceeds of issuances of "Permitted Refinancing Indebtedness," which may not exceed $750 million.
We have outstanding an $18.7 million irrevocable standby letter of credit in favor of a third-party transportation service provider to secure the construction of certain additions and/or replacements to its facilities to provide firm transportation of the natural gas produced by us and others for whom we market production in West Virginia and Southwestern Pennsylvania. The letter of credit reduces the amount of available funds under our revolving credit facility by an equal amount. We pay a fronting fee of 0.125% per annum and an additional quarterly maintenance fee equivalent to the spread over Eurodollar loans (2.75% per annum as of December 31, 2012) for the period in which the letter of credit remains outstanding. The letter of credit expires on July 20, 2013. We expect to renew the letter of credit prior to its expiration.
We pay a fee of 0.5% per annum on the unutilized commitment on the available funds under our revolving credit facility. As of December 31, 2012, the available funds under our revolving credit facility, including a reduction for the $18.7 million irrevocable standby letter of credit in effect, was $382.3 million. The weighted-average borrowing rate on our revolving credit facility, exclusive of the letter of credit, was 4.5% per annum as of December 31, 2012 compared to 3.8% as of December 31, 2011.
PDCM Credit Facility. PDCM has a credit facility dated April 30, 2010, as amended, with an aggregate revolving commitment or borrowing base of $80 million, of which our proportionate share is $40 million. The maximum allowable facility amount is $400 million. Based upon PDCM's discretion, interest accrues at either an alternative base rate ("ABR") or an adjusted LIBOR. The ABR is the greater of BNP Paribas' prime rate, the federal funds effective rate plus 0.5% or the adjusted LIBOR for a three month interest period plus 1%. ABR and adjusted LIBOR borrowings are assessed an additional margin based upon the outstanding balance as a percentage of the available balance. ABR borrowings are assessed an additional margin of 1.25% to 2.0%. Adjusted LIBOR borrowings are assessed an additional margin spread of 2.25% to 3.0%. No principal payments are required until the credit agreement expires on April 30, 2014, or in the event that the borrowing base falls below the outstanding balance. The credit facility is subject to and secured by PDCM's properties, including our proportionate share of such properties. The credit facility borrowing base is subject to size redetermination semiannually based upon a valuation of PDCM's reserves at June 30 and December 31. Either PDCM or the lenders may request a redetermination upon the occurrence of certain events. Pursuant to the interests of the joint venture, the credit facility will be utilized by PDCM for the exploration and development of its Marcellus assets.
The credit facility contains covenants customary for agreements of this type, with the most restrictive being certain financial tests and financial ratios that must be met on a quarterly basis. The financial tests and ratios, as defined by the credit facility, include requirements to maintain a minimum current ratio of 1.0 to 1.0, not to exceed a debt to EBITDAX ratio of 5.0 to 1.0 (declining to 4.5 to 1.0 on March 31, 2013 and 4.0 to 1.0 on September 30, 2013) and to maintain a minimum interest coverage ratio of 2.5 to 1.0. As of December 31, 2012, our proportionate share of PDCM's outstanding credit facility balance was $26.3 million compared to $24 million as of December 31, 2011. PDCM is required to pay a commitment fee of 0.5% per annum on the unutilized portion of the activated credit facility. The weighted-average borrowing rate on PDCM's credit facility was 3.5% per annum in 2012, compared to 5.0% in 2011.
As of December 31, 2012, we were in compliance with all credit facility covenants and expect to remain in compliance throughout the next twelve-month period.
PDC ENERGY, INC.
NOTES TO CONSOLIDATED FINANCIAL STATEMENTS - Continued
NOTE 9 - ASSET RETIREMENT OBLIGATIONSITEM 9B. OTHER INFORMATION
The following table presents the changes in carrying amounts of the asset retirement obligations associated with our working interest in natural gas and crude oil properties:None.
|
| | | | | | | |
| | 2012 | | 2011 |
| | (in thousands) |
| | | | |
| Balance beginning of year, January 1 | $ | 46,566 |
| | $ | 28,047 |
|
| Obligations incurred with development activities and assumed with acquisitions | 14,169 |
| | 9,625 |
|
| Accretion expense | 4,060 |
| | 1,897 |
|
| Obligations discharged with disposal of properties and asset retirements | (2,232 | ) | | (990 | ) |
| Deconsolidation of PDCM and change in ownership interest | — |
| | (916 | ) |
| Revisions in estimated cash flows | — |
| | 8,903 |
|
| Balance end of year, December 31 (1) | 62,563 |
| | 46,566 |
|
| Less current portion | (1,000 | ) | | (250 | ) |
| Long-term portion | $ | 61,563 |
| | $ | 46,316 |
|
| | | | |
__________
| |
(1) | Includes $2 million as of December 31, 2011 related to assets held for sale.
|
The revisions in estimated cash flows during 2011 were due to changes in estimates of costs for materials and services related to the plugging and abandonment of wells in the two fields where we currently conduct the majority of our operations. These cost increases related mostly to the costs of cement and construction materials and third-party and internal support services on a per well basis. The revision in the asset retirement obligation did not have an immediate effect in the 2011 statement of operations as the increase in the revised obligation will be accreted and the offsetting capitalized amount will be depreciated over the useful lives of respective wells.PART III
NOTE 10 - EMPLOYEE BENEFIT PLANSITEM 10. DIRECTORS, EXECUTIVE OFFICERS AND CORPORATE GOVERNANCE
We sponsor a qualified retirement plan covering substantially all of our employees. The plan consists of both a traditional and a Roth 401(k) component, as well as a profit sharing component. The 401(k) components enable eligible employees to contribute a portion of their compensation through payroll deductions in accordance with specific guidelines. We provide a discretionary matching contribution based on a percentage of the employees' contributions up to certain limits. Our contribution to the profit sharing component is discretionary. Our total combined expense for the plan was $3.4 million for 2012 and $2.6 million for 2011 and 2010, respectively.
We provide a supplemental retirement benefit of deferred compensation under terms of the various employment agreements with certain former executive officers. Expenses relatedInformation relating to this plan are charged to general and administrative expenses and the related costs were immaterialItem will be included in 2012, 2011 and 2010. As of December 31, 2012 and 2011, the liability relatedan amendment to this benefit was $2 million and $2.2 million, respectively, which was included in other liabilities onreport or the balance sheets, with the exception of $0.3 millionincluded in other accrued expenses as of December 31, 2012 and 2011.
We provide a supplemental health care benefit covering certain former executive officers and their spouses in accordance with each officer's employment agreement. Expenses incurred during 2012, 2011 and 2010 relatedproxy statement to this plan were immaterial. As of December 31, 2012 and 2011, the related liability of $0.7 million is included in other liabilities on the balance sheets.
We maintain a non-qualified deferred compensation planbe filed pursuant to Regulation 14A for our non-employee directors. The amount of compensation deferred2014 Annual Stockholders' meeting and is incorporated by each participant is based on participant elections. The amounts deferred pursuant to the plan are investedreference in our common stock, maintained in a rabbi trust and are classified in the balance sheets as treasury shares as a component of shareholders' equity. The plan may be settled in either cash or shares as requested by the participant. The liability related to this plan, which was included in other liabilities on the balance sheets, was immaterial as of December 31, 2012 and 2011.report.
NOTE 11 - COMMITMENTS AND CONTINGENCIESITEM 11. EXECUTIVE COMPENSATION
Firm Transportation Agreements. We enter into contracts that provide firm transportation, sales and processing charges on pipeline systems through which we transportInformation relating to this Item will be included in an amendment to this report or sell natural gas. Satisfaction of the volume requirements includes volumes produced by us, volumes purchased from third parties and volumes produced by PDCM, our affiliated partnerships and other third-party working interest owners. We record in our financial statements only our share of costs based upon our working interest in the wells. These contracts require usproxy statement to pay these transportation and processing charges whether the required volumes are delivered or not. With the exception of contracts entered into by PDCM, the costs of any volume shortfalls are borne by PDC.
PDC ENERGY, INC.
NOTES TO CONSOLIDATED FINANCIAL STATEMENTS - Continued
The following table presents gross volume information, including our proportionate share of PDCM, related to our long-term firm transportation, sales and processing agreements for pipeline capacity:
|
| | | | | | | | | | | | | | | | | | | | | | | | | | |
| | | Year Ending December 31, | | | | |
| Area | | 2013 | | 2014 | | 2015 | | 2016 | | 2017
Through
Expiration | | Total | | Expiration
Date |
| | | | | | | | | | | | | | | |
| Volume (MMcf) | | | | | | | | | | | | | | |
| Piceance Basin | | 30,710 |
| | 36,168 |
| | 30,603 |
| | 26,053 |
| | 85,895 |
| | 209,429 |
| | May 31, 2021 |
| Appalachian Basin | | 20,316 |
| | 24,353 |
| | 23,361 |
| | 24,862 |
| | 168,296 |
| | 261,188 |
| | September 20, 2025 |
| NECO | | 2,190 |
| | 1,825 |
| | 1,825 |
| | 1,825 |
| | — |
| | 7,665 |
| | December 31, 2016 |
| Total | | 53,216 |
| | 62,346 |
| | 55,789 |
| | 52,740 |
| | 254,191 |
| | 478,282 |
| | |
| | | | | | | | | | | | | | | |
Dollar commitment
(in thousands) | | $ | 25,756 |
| | $ | 29,283 |
| | $ | 26,163 |
| | $ | 24,075 |
| | $ | 94,033 |
| | $ | 199,310 |
| | |
| | | | | | | | | | | | | | | |
Effective January 1, 2013, we entered into a new gas gathering and processing agreement with Williams Field Services Company related to our Piceance Basin production. The new agreement included additional terms and conditions which, among other things, reduced our Piceance Basin total committed volumes for gathering to 116,260 MMcf over the term of the agreement. In February 2013, we entered into a purchase and sale agreementbe filed pursuant to whichRegulation 14A for our Piceance Basin and NECO firm gathering commitments will be assumed by the buyer of certain of our oil and natural gas properties upon the closing of the transaction. There can be no assurance that we will be successful in closing such divestiture. See Note 19, Subsequent Events, for additional information regarding the planned sale.
Litigation. The Company is involved in various legal proceedings that it considers normal to its business. The Company reviews the status of these proceedings on an ongoing basis and, from time to time, may settle or otherwise resolve these matters on terms and conditions that management believes are in the best interests of the Company. There is no assurance that settlements can be reached on acceptable terms or that adverse judgments, if any, in the remaining litigation will not exceed the amounts reserved. Although the results cannot be known with certainty, we currently believe that the ultimate results of such proceedings will not have a material adverse effect on our financial position, results of operations or liquidity.
Alleged Class Action Filed Regarding 2010 and 2011 Partnership Purchases
On December 21, 2011 the Company and its wholly-owned merger subsidiary were served with an alleged class action on behalf of certain former partnership unit holders, related to its partnership repurchases completed by mergers in 2010 and 2011. The action was filed in U.S. District Court for the Central District of California,2014 Annual Stockholders' meeting and is titled Schulein v. Petroleum Development Corp. The complaint primarily alleges a claim that the proxy statements issuedincorporated by reference in connection with the mergers were inadequate, and a state law breach of fiduciary duty. On February 10, 2012, the Company filed a motion to dismiss or in the alternative to stay. On June 15, 2012, the Court denied the motion. The Court has approved a litigation schedule including a jury trial in May 2014. We have not recorded a liability for claims pending because we believe we have good legal defenses to the asserted claims and because the plaintiffs have not specified damages and it is not possible for management to estimate what, if any, monetary damages could result from this claim.
Environmental. Due to the nature of the natural gas and oil industry, we are exposed to environmental risks. We have various policies and procedures to avoid environmental contamination and mitigate the risks from environmental contamination. We conduct periodic reviews to identify changes in our environmental risk profile. Liabilities are recorded when environmental damages resulting from past events are probable and the costs can be reasonably estimated. As of December 31, 2012 and December 31, 2011, we had accrued environmental liabilities in the amount of $8.4 million and $2.5 million, respectively, included in other accrued expenses on the balance sheet. The increase in accrued liabilities at December 31, 2012 primarily relates to the assumption of environmental liabilities related to the Merit Acquisition. We are not aware of any environmental claims existing as of December 31, 2012 which have not been provided for or would otherwise have a material impact on our financial statements. However, there can be no assurance that current regulatory requirements will not change or unknown past non-compliance with environmental laws will not be discovered on our properties.
Partnership Repurchase Provision. Substantially all of our drilling programs contain a repurchase provision where investing partners may request that we purchase their partnership units at any time beginning with the third anniversary of the first cash distribution. The provision provides that we are obligated to purchase an aggregate of 10% of the initial subscriptions per calendar year (at a minimum price of four times the most recent 12 months' cash distributions from production), if repurchase is requested by investors, subject to our financial ability to do so. As of December 31, 2012, the maximum annual repurchase obligation for 2013, based upon the minimum price described above, was approximately $2.9 million. We believe we have adequate liquidity to meet this potential obligation. During 2012, 2011 and 2010, we paid $0.5 million, $0.2 million and $0.6 million, respectively, under this provision for the repurchase of partnership units.
Lease Agreements. We entered into operating leases, principally for the leasing of natural gas compressors, office space and general office equipment.
PDC ENERGY, INC.
NOTES TO CONSOLIDATED FINANCIAL STATEMENTS - Continued
The following table presents the minimum future lease payments under the non-cancelable operating leases as of December 31, 2012:
|
| | | | | | | | | | | | | | | | | | | | | | | | | | | | |
| | | Year Ending December 31, | | | | |
| | | 2013 | | 2014 | | 2015 | | 2016 | | 2017 | | Thereafter | | Total |
| | | (in thousands) |
| | | | | | | | | | | | | | | |
| Minimum Lease Payments | | $ | 2,607 |
| | $ | 2,386 |
| | $ | 1,929 |
| | $ | 461 |
| | $ | 255 |
| | $ | 887 |
| | $ | 8,525 |
|
| | | | | | | | | | | | | | | |
Operating lease expense for the years ended 2012, 2011 and 2010 was $6.1 million, $5.9 million and $4.9 million, respectively.
Employment Agreements with Executive Officers. Each of our senior executive officers may be entitled to a severance payment and certain other benefits upon the termination of the officer's employment pursuant to the officer's employment agreement and/or the Company's executive severance compensation plan. The nature and amount of such benefits would vary based upon, among other things, whether the termination followed a change of control of the Company.
See Note 17, Transactions With Affiliates, for a discussion related to the separation agreement entered into with our former chief executive officer in 2011.report.
NOTE 12 - COMMON STOCKITEM 12. SECURITY OWNERSHIP OF CERTAIN BENEFICIAL OWNERS AND MANAGEMENT AND RELATED STOCKHOLDER MATTERS
Sale of Equity Securities
In May 2012, we completed a public offering of 6,500,000 shares of our common stock, par value $0.01 per share, at an offering price of $26.50 per share. Net proceeds of the offering were approximately $164.5 million, after deducting underwriting discounts and commissions and offering expenses, of which $65,000 isInformation relating to this Item will be included in common shares-par value and $164.4 million is included in APIC onan amendment to this report or the balance sheet as of December 31, 2012. We used the net proceeds from the offeringproxy statement to finance a portion of the Merit Acquisition and for general corporate purposes. The offering was madebe filed pursuant to an effective shelf registration statement on Form S-3 filed with the SEC on January 23, 2012.
In November 2010, we sold 4,140,000 shares of our common stock in an underwritten public offering at a price of $32.00 per share. The net proceeds of $125.5 million were used, together with other proceeds, to fund an acquisition of additional assets in the Wolfberry Trend in the Permian Basin of West Texas, which closed in November 2010, our acquisition of the 2004 and 2005 partnerships and other acquisitions and for general corporate purposes. Pending such uses, we applied the net proceeds from this offering and other proceeds to temporarily repay the entire outstanding amount under our revolving credit facility, with the remaining balance being deposited in an interest bearing account and held as cash and cash equivalents until utilized as contemplated above. The offering was made pursuant to an effective shelf registration statement on Form S-3 filed with the SEC on November 26, 2008.
Stock-Based Compensation Plans
2010 Long-Term Equity Compensation Plan. In June 2010, our shareholders approved a long-term equity compensation planRegulation 14A for our employees2014 Annual Stockholders' meeting and non-employee directors (the "2010 Plan"). In accordance with the 2010 Plan, up to 1,400,000 new shares of our common stock are authorized for issuance. Shares issued may be either authorized but unissued shares, treasury shares or any combination of these shares. Additionally, the 2010 Plan permits the reuse or reissuance of shares of common stock which were canceled, expired, forfeited or,is incorporated by reference in the case of stock appreciation rights ("SARs"), paid out in the form of cash. Awards may be issued to our employees in the form of incentive or non-qualified stock options, SARs, restricted stock, restricted stock units ("RSUs"), performance shares and performance units, and to our non-employee directors in the form of non-qualified stock options, SARs, restricted stock and RSUs. Awards may vest over periods set at the discretion of the Compensation Committee of our Board of Directors (the "Compensation Committee") with certain minimum vesting periods. With regard to incentive or non-qualified stock options and SARs, awards have a maximum exercisable period of ten years. In no event, may an award be granted under the 2010 Plan on or after April 1, 2020. As of December 31, 2012, 490,412 shares remain available for issuance pursuant to the 2010 Plan.
2004 Long-Term Equity Compensation Plan. As approved by the shareholders in June 2004, we maintain a long-term equity compensation plan for our officers and certain key employees (the "2004 Plan"). Awards pursuant to the plan vest over periods set at the discretion of the Compensation Committee and, with regard to options, have a maximum exercisable period of ten years. We no longer issue awards pursuant to the 2004 Plan. All outstanding and non-vested awards pursuant to the 2004 Plan will continue to be outstanding and vest pursuant to their original terms on or before April 19, 2020.
PDC ENERGY, INC.
NOTES TO CONSOLIDATED FINANCIAL STATEMENTS - Continued
The following table provides a summary of the impact of our outstanding stock-based compensation plans on the results of operations for the periods presented:
|
| | | | | | | | | | | | |
| | | Year Ended December 31, |
| | | 2012 | | 2011 (1) | | 2010 |
| | | (in thousands) |
| | | | | | | |
| Stock-based compensation expense | | $ | 8,495 |
| | $ | 8,781 |
| | $ | 5,314 |
|
| Income tax benefit | | (3,245 | ) | | (3,344 | ) | | (2,019 | ) |
| Net expense | | $ | 5,250 |
| | $ | 5,437 |
| | $ | 3,295 |
|
| | | | | | | |
__________
(1) Includes a $2.5 million pre-tax charge related to a separation agreement with our former chief executive officer. See Note 17, Transactions with Affiliates, for additional information regarding the related separation agreement.
Stock Option Awards
We have granted stock options pursuant to various stock compensation plans. Outstanding options expire ten years from the date of grant and become exercisable ratably over a four year period. We have not issued any new stock options awards since 2006. As of December 31, 2012, all compensation cost related to stock options has been fully recognized in our statements of operations.
The following table presents the changes in our stock option awards. The aggregate intrinsic value of options outstanding for each period presented was immaterial:
|
| | | | | | | | | | | | | | | | | | | | | | | |
| | Year Ended December 31, |
| | 2012 | | 2011 | | 2010 |
| | Number of
Shares
Underlying
Options | | Weighted-Average
Exercise
Price
Per Share | | Weighted- Average
Remaining
Contractual
Term (in years) | | Number of
Shares
Underlying
Options | | Weighted-Average
Exercise
Price
Per Share | | Number of
Shares
Underlying
Options | | Weighted-Average
Exercise
Price
Per Share |
| Outstanding beginning of year, January 1, | 6,973 |
| | $ | 41.09 |
| | — |
| | 10,306 |
| | $ | 41.90 |
| | 10,306 |
| | $ | 41.90 |
|
| Forfeited | — |
| | — |
| | — |
| | (3,333 | ) | | 43.60 |
| | — |
| | — |
|
| Outstanding end of year, December 31, | 6,973 |
| | 41.09 |
| | 2.6 |
| | 6,973 |
| | 41.09 |
| | 10,306 |
| | 41.90 |
|
| Exercisable at December 31, | 6,973 |
| | 41.09 |
| | 2.6 |
| | 6,973 |
| | 41.09 |
| | 10,306 |
| | 41.60 |
|
SARs
The SARs vest ratably over a three-year period and may be exercised at any point after vesting through 10 years from the date of issuance. Pursuant to the terms of the awards, upon exercise, the executive officers will receive, in shares of common stock, the excess of the market price of the award on the date of exercise over the market price of the award on the date of issuance.
In January 2012, the Compensation Committee awarded 68,361 SARs to our executive officers. The fair value of each SAR award was estimated on the date of grant using a Black-Scholes pricing model using the following assumptions:
|
| | | | | | | | | | | |
| | Year Ended December 31, |
| | 2012 | | 2011 | | 2010 |
| | | | | | |
| Expected term of award | 6 years |
| | 6 years |
| | 5 years |
|
| Risk-free interest rate | 1.1 | % | | 2.5 | % | | 2.5 | % |
| Expected volatility | 64.3 | % | | 60.2 | % | | 62.0 | % |
| Weighted-average grant date fair value per share | $ | 17.61 |
| | $ | 25.22 |
| | $ | 13.26 |
|
The expected life of the award was estimated using historical stock option exercise behavior data. The risk-free interest rate was based on the U.S. Treasury yields approximating the expected life of the award in effect at the time of grant. Expected volatilities were based on our historical volatility. We do not expect to pay or declare dividends in the foreseeable future.
PDC ENERGY, INC.
NOTES TO CONSOLIDATED FINANCIAL STATEMENTS - Continued
The following table presents the changes in our SARs:
|
| | | | | | | | | | | | | | | | | | | | | | | | | | | | | | | | | | | |
| | Year Ended December 31, |
| | 2012 | | 2011 | | 2010 |
| | Number of
SARs | | Weighted-Average
Exercise
Price | | Average Remaining Contractual
Term (in years) | | Aggregate Intrinsic
Value (in thousands) | | Number of
SARs | | Weighted-Average
Exercise
Price | | Aggregate Intrinsic
Value (in thousands) | | Number of
SARs | | Weighted-Average
Exercise
Price | | Aggregate Intrinsic
Value (in thousands) |
| Outstanding beginning of year, January 1, | 50,471 |
| | $ | 31.61 |
| | 8.6 |
| | $ | 341 |
| | 57,282 |
| | $ | 24.44 |
| | $ | 1,020 |
| | — |
| | $ | — |
| | $ | — |
|
| Awarded | 68,361 |
| | 30.19 |
| | — |
| | — |
| | 31,552 |
| | 43.95 |
| | — |
| | 57,282 |
| | 24.44 |
| | — |
|
| Exercised | — |
| | — |
| | — |
| | — |
| | (25,371 | ) | | 24.44 |
| | 77 |
| | — |
| | — |
| | — |
|
| Forfeited | — |
| | — |
| | — |
| | — |
| | (12,992 | ) | | 43.95 |
| | — |
| | — |
| | — |
| | — |
|
| Outstanding end of year, December 31, | 118,832 |
| | 30.80 |
| | 8.4 |
| | 486 |
| | 50,471 |
| | 31.61 |
| | 341 |
| | 57,282 |
| | 24.44 |
| | 1,020 |
|
| Exercisable at December 31, | 27,458 |
| | 28.84 |
| | 7.5 |
| | 187 |
| | 10,636 |
| | 24.44 |
| | 114 |
| | — |
| | — |
| | — |
|
Total compensation cost related to SARs granted and not yet recognized in our statement of operations as of December 31, 2012, was $1.0 million. The cost is expected to be recognized over a weighted-average period of 1.8 years.
Restricted Stock Awards
Time-Based Awards.The fair value of the time-based restricted shares is amortized ratably over the requisite service period, primarily three or four years. The time-based shares vest ratably on each annual anniversary following the grant date that a participant is continuously employed.
In January 2012, the Compensation Committee awarded a total of 79,889 time-based restricted shares to our executive officers that vest ratably over three year period ending on January 16, 2015.
The following table presents the changes in non-vested time-based awards during 2012:
|
| | | | | | |
| | Shares | | Weighted-Average
Grant-Date
Fair Value |
| | | | |
| Non-vested at December 31, 2011 | 527,801 |
| | $ | 29.29 |
|
| Granted | 341,338 |
| | 26.59 |
|
| Vested | (186,205 | ) | | 29.42 |
|
| Forfeited | (36,444 | ) | | 28.20 |
|
| Non-vested at December 31, 2012 | 646,490 |
| | 27.93 |
|
| | | | |
|
| | | | | | | | | | | |
| | As of/Year Ended December 31, |
| | 2012 | | 2011 | | 2010 |
| | (in thousands, except per share data) |
| | | | | | |
| Total intrinsic value of time-based awards vested | $ | 5,950 |
| | $ | 9,030 |
| | $ | 3,219 |
|
| Total intrinsic value of time-based awards non-vested | 21,470 |
| | 18,531 |
| | 22,211 |
|
| Market price per common share as of December 31, | 33.21 |
| | 35.11 |
| | 42.25 |
|
| Weighted-average grant date fair value per share | 26.59 |
| | 33.71 |
| | 25.04 |
|
Total compensation cost related to non-vested time-based awards expected to vest and not yet recognized in our statements of operations as of December 31, 2012 was$11.5 million. This cost is expected to be recognized over a weighted-average period of 2.2 years.
Market-Based Awards.The fair value of the market-based restricted shares is amortized ratably over the requisite service period, primarily three years. Generally, the market-based shares vest if the participant is continuously employed throughout the performance period and the market-based performance measure is achieved, with a maximum vesting period of five years. All compensation cost related to the market-based awards will be recognized if the requisite service period is fulfilled, even if the market condition is not achieved.
PDC ENERGY, INC.
NOTES TO CONSOLIDATED FINANCIAL STATEMENTS - Continued
In January 2012, the Compensation Committee awarded a total of 30,541 market-based restricted shares to our executive officers. In addition to continuous employment, the vesting of these shares is contingent on the Company's total shareholder return ("TSR"), which is essentially the Company’s stock price change including any dividends, as compared to the TSR of a set group of 14 peer companies. The shares are measured over a three-year period ending on December 31, 2014 and can result in a payout between 0% and 200% of the total shares awarded. The weighted-average grant date fair value per market-based share for these awards granted was computed using the Monte Carlo pricing model using the following assumptions:
|
| | | | | | | | |
| | | Year Ended December 31, |
| | | 2012 | | 2011 |
| | | | | |
| Expected term of award | | 3 years |
| | 3 years |
|
| Risk-free interest rate | | 0.3 | % | | 1.1 | % |
| Expected volatility | | 65.3 | % | | 74.2 | % |
| Weighted-average grant date fair value per share | | $ | 36.54 |
| | $ | 58.53 |
|
The expected term of the awards was based on the requisite service period. The risk-free interest rate was based on the U.S. Treasury yields in effect at the time of grant and extrapolated to approximate the life of the award. The expected volatility was based on our historical volatility. We do not expect to pay or declare dividends in the foreseeable future
The following table presents the change in non-vested market-based awards during 2012:
|
| | | | | | | |
| | | Shares
| | Weighted-Average
Grant-Date
Fair Value per Share
|
| | | | | |
Non-vested at December 31, 2011
| | 43,081 |
| | $ | 42.05 |
|
Granted
| | 30,541 |
| | 36.54 |
|
Forfeited
| | (32,926 | ) | | 45.15 |
|
Non-vested at December 31, 2012
| | 40,696 |
| | 39.22 |
|
| | | | | |
|
| | | | | | | | | | | |
| | As of/Year Ended December 31, |
| | 2012 | | 2011 | | 2010 |
| | (in thousands, except per share data) |
| | | | | | |
| Total intrinsic value of market-based awards vested | $ | — |
| | $ | 366 |
| | $ | — |
|
| Total intrinsic value of market-based awards non-vested | 1,352 |
| | 1,513 |
| | 3,361 |
|
| Market price per common share as of December 31, | 33.21 |
| | 35.11 |
| | 42.25 |
|
| Weighted-average grant date fair value per share | 36.54 |
| | 58.53 |
| | — |
|
Total compensation cost related to non-vested market-based awards expected to vest and not yet recognized in our statement of operations as of December 31, 2012 was $0.9 million. This cost is expected to be recognized over a weighted-average period of 1.8 years.
Treasury Share Purchases
In accordance with our stock-based compensation plans, employees and directors may surrender shares of the Company's common stock to pay tax withholding obligations upon the vesting and exercise of share-based awards. Shares acquired that had been issued pursuant to the 2004 Plan are retired, while those issued pursuant to the 2010 Plan are reissued to service awards. For shares that are retired, we first charge any excess of cost over the par value to additional paid-in-capital ("APIC") to the extent we have amounts in APIC, with any remaining excess cost charged to retained earnings. For shares reissued to service awards under the 2010 Plan, shares are recorded at cost and upon reissuance we reduce the carrying value of shares acquired and held pursuant to the 2010 Plan by the weighted-average cost per share with an offsetting charge to APIC. During the year ended December 31, 2012, we acquired 44,576 shares pursuant to our stock-based compensation plans for payment of tax liabilities, of which 14,471 shares were retired, 28,587 and 1,518 shares were reissued and are available for reissuance, respectively, pursuant to our 2010 Plan.
PDC ENERGY, INC.
NOTES TO CONSOLIDATED FINANCIAL STATEMENTS - Continued
Shareholders’ Rights Agreement
In 2007, we entered into a rights agreement. The rights agreement is designed to improve the ability of our Board to protect the interest of our shareholders in the event of an unsolicited takeover attempt. Our Board declared a dividend of one right for each outstanding share of our common stock. The right dividend was paid to shareholders of record on September 14, 2007. A "distribution date," as defined in the rights agreement, can occur after any individual shareholder exceeds 15% ownership of our outstanding common stock. In certain circumstances, the right entitles each holder, other than an "acquiring person" (as defined in the agreement), to purchase shares of our common stock (or, in certain circumstances, cash, property or other securities) having a then-current value equal to two times the exercise price of the right (i.e., for the $240 exercise price, the rights holder receives $480 worth of common stock). The exercise price is subject to adjustment for various corporate actions which affect all shareholders, such as a stock split. The rights agreement and all rights will expire on September 11, 2017.
Preferred stock
We are authorized, pursuant to shareholder approval in 2008, to issue 50,000,000 shares of Company preferred stock, par value $0.01, which may be issued in one or more series, with such rights, preferences, privileges and restrictions as shall be fixed by our Board from time to time. As of December 31, 2012, no preferred shares had been issued.this report.
NOTE 13 - EARNINGS PER SHARE
Basic earnings per common share ("EPS") is computed by dividing net income (loss) by the weighted-average number of common shares outstanding for the period. Diluted EPS is similarly computed except that the denominator includes the effect, using the treasury stock method, of our unamortized portion of restricted stock, outstanding SARs, stock options, convertible notes and shares held pursuant to our non-employee director deferred compensation plan, if including such potential shares of common stock is dilutive.
The following table presents a reconciliation of the weighted-average diluted shares outstanding:
|
| | | | | | | | |
| | Year Ended December 31, |
| | 2012 | | 2011 | | 2010 |
| | (in thousands) |
| | | | | | |
| Weighted-average common shares outstanding - basic | 27,677 |
| | 23,521 |
| | 19,674 |
|
| Dilutive effect of share-based compensation: | | | | | |
| Restricted stock | — |
| | 307 |
| | 119 |
|
| SARs | — |
| | 40 |
| | 21 |
|
| Non-employee director deferred compensation | — |
| | 3 |
| | 7 |
|
| Weighted-average common and common share equivalents outstanding - diluted | 27,677 |
| | 23,871 |
| | 19,821 |
|
| | | | | | |
The following table presents the weighted-average common share equivalents excluded from the calculation of diluted earnings per share due to their anti-dilutive effect:
|
| | | | | | | | |
| | Year Ended December 31, |
| | 2012 | | 2011 | | 2010 |
| | (in thousands) |
| | | | | | |
| Weighted-average common share equivalents excluded from diluted earnings | | | | | |
| per share due to their anti-dilutive effect: | | | | | |
| Restricted stock | 694 |
| | 220 |
| | 204 |
|
| SARs | 116 |
| | 22 |
| | — |
|
| Stock options | 7 |
| | 9 |
| | 10 |
|
| Non-employee director deferred compensation | 3 |
| | — |
| | — |
|
| Total anti-dilutive common share equivalents | 820 |
| | 251 |
| | 214 |
|
| | | | | | |
For 2012, we reported a net loss. As a result, our basic and diluted weighted-average common shares outstanding were the same as the effect of the common share equivalents was anti-dilutive.
In November 2010, we issued 115,000 convertible senior notes, $1,000 principal amount per note, that give the holders the right to convert the aggregate principal amount into 2.7 million common shares at a conversion price of $42.40 per share. These convertible notes could have a dilutive impact on our earnings per share if the average market share price exceeds the $42.40 conversion price. The average market share price did not exceed the conversion price during 2012, 2011 or 2010.
PDC ENERGY, INC.
NOTES TO CONSOLIDATED FINANCIAL STATEMENTS - Continued
NOTE 14 - ASSETS HELD FOR SALE, DIVESTITURESITEM 13. CERTAIN RELATIONSHIPS AND DISCONTINUED OPERATIONSRELATED TRANSACTIONS AND DIRECTOR INDEPENDENCE
Selected financial information. The tables below set forth selected financial information relatedInformation relating to net assets divested, net assets relatedthis Item will be included in an amendment to discontinued operations and operating results related to discontinued operations. Net assets held for sale representsthis report or the assets that were or are expectedproxy statement to be sold, net of liabilities, that were or are expectedfiled pursuant to be assumed by the purchaser. Net assets related to discontinued operations presents those assets that were or are expected to be sold, less liabilities that were or are expected to be assumed, by the purchaser, as well as all other related assets and liabilities, consisting of accounts receivable and production tax liability, which were not sold. While the reclassification of revenues and expenses related to discontinued operationsRegulation 14A for prior periods had no impact upon previously reported net earnings, the statement of operations table presents the revenues and expenses that were reclassified from the specified statement of operations line items to discontinued operations.
The following table presents balance sheet data related to assets held for sale:
|
| | | | | | | | |
| | | As of December 31, |
| | | 2011 |
| Balance Sheet | | Net Assets Held for Sale | | Net Assets
Related to Discontinued Operations |
| | | (in thousands) |
| Assets | | | | |
| Current assets | | | | |
| Accounts receivable, net | | $ | — |
| | $ | 3,198 |
|
| Oil inventory | | — |
| | 89 |
|
| Total current assets | | — |
| | 3,287 |
|
| Properties and equipment | | 168,218 |
| | 168,218 |
|
| Accumulated Depreciation, Depletion and Amortization | | (19,969 | ) | | (19,969 | ) |
| Total assets | | $ | 148,249 |
| | $ | 151,536 |
|
| | | | | |
| Liabilities | | | | |
| Current liabilities | | | | |
| Accounts payable | | — |
| | 1,907 |
|
| Production tax liability | | — |
| | 262 |
|
| Total current liabilities | | — |
| | 2,169 |
|
| Asset retirement obligation | | 2,022 |
| | 2,022 |
|
| Total liabilities | | $ | 2,022 |
| | $ | 4,191 |
|
| | | | | |
| Net assets | | $ | 146,227 |
| | $ | 147,345 |
|
| | | | | |
PDC ENERGY, INC.
NOTES TO CONSOLIDATED FINANCIAL STATEMENTS - Continued
The following table presents statement of operations data related to our discontinued operations:
|
| | | | | | | | | | | | |
| | | Year Ended December 31, |
| Statements of Operations - Discontinued Operations | | 2012 | | 2011 | | 2010 |
| | | (in thousands) |
| Revenues | | | | | | |
| Natural gas, NGLs and crude oil sales | | $ | 4,456 |
| | $ | 27,552 |
| | $ | 11,130 |
|
| Sales from natural gas marketing | | — |
| | — |
| | 3,328 |
|
| Well operations, pipeline income and other | | 34 |
| | 128 |
| | 560 |
|
| Total revenues | | 4,490 |
| | 27,680 |
| | 15,018 |
|
| | | | | | | |
| Costs, expenses and other | | | | | | |
| Production costs | | 1,668 |
| | 8,365 |
| | 4,215 |
|
| Cost of natural gas marketing | | — |
| | — |
| | 3,265 |
|
| Impairment of natural gas and crude oil properties | | — |
| | — |
| | 4,666 |
|
| Depreciation, depletion and amortization | | — |
| | 6,247 |
| | 2,967 |
|
| Accretion of asset retirement obligations and other | | — |
| | 200 |
| | 223 |
|
| Gain on sale of properties and equipment | | (19,920 | ) | | (3,854 | ) | | — |
|
| Total costs, expenses and other | | (18,252 | ) | | 10,958 |
| | 15,336 |
|
| | | | | | | |
| Income (loss) from discontinued operations | | 22,742 |
| | 16,722 |
| | (318 | ) |
| Provision for income taxes | | (8,668 | ) | | (6,363 | ) | | 214 |
|
| Income (loss) from discontinued operations, net of tax | | $ | 14,074 |
| | $ | 10,359 |
| | $ | (104 | ) |
| | | | | | | |
Permian Basin. During the fourth quarter of 2011, we completed the sale of our non-core Permian assets to unrelated third parties for a total of $13.2 million. Additionally, on December 20, 2011, we executed a purchase and sale agreement with COG Operating LLC (“COG”), a wholly owned subsidiary of Concho Resources Inc., an unrelated third-party, for the sale of our core Permian Basin assets for a sale price of $173.9 million, subject to customary terms and adjustments, including adjustments based on title and environmental due diligence to be conducted by COG. The effective date of the transaction was November 1, 2011. Following the sale to COG, we do not have significant continuing involvement in the operations of, or cash flows from, these assets; accordingly, the Permian assets were reclassified as held for sale as of December 31, 2011, and the results of operations related to those assets have been separately reported as discontinued operations in the consolidated statement of operations for all periods presented. On February 28, 2012, the divestiture closed. Upon final settlement, total proceeds received were $189.2 million after closing adjustments, resulting in a pre-tax gain on sale of $19.9 million.
North Dakota. In December 2010, we executed a letter of intent with an unrelated third-party for the sale of our North Dakota assets. In February 2011, we executed a purchase and sale agreement and subsequently closed with the same unrelated party. Proceeds from the sale were $9.5 million, net of our non-affiliated investor partners' share of $3.8 million, resulting in a pre-tax gain on sale of $3.9 million. Following the sale to the unrelated party, we do not have significant continuing involvement in the operations of, or cash flows from, these assets. Accordingly, the results of operations related to the North Dakota assets have been reported as discontinued operations in the consolidated statements of operations for 2011 and 2010.
Michigan.During the third quarter of 2010, we divested our Michigan asset group and related liabilities for net cash proceeds of $22 million and realized a loss on sale of $4.7 million in the form of an impairment charge recorded during 2010 (see Note 6, Properties and Equipment, regarding the impairment charge). We do not have significant continuing involvement in the operations of or cash flows from this asset group. Accordingly, the results of operations related to the Michigan assets have been reported as discontinued operations in the consolidated statement of operations for 2010.
See Note 19, Subsequent Events, for information regarding the planned sale of certain of our oil and natural gas properties.
PDC ENERGY, INC.
NOTES TO CONSOLIDATED FINANCIAL STATEMENTS - Continued
NOTE 15 - ACQUISITIONS
The following table presents the adjusted purchase price and the allocations thereof, based on our estimates of fair value, for the acquisition of natural gas and crude oil properties during 2012, 2011 and 2010:
|
| | | | | | | | | | | | | | | | | | | | | | | | |
| | | Year Ended December 31, |
| | | 2012 | | 2011 | | 2010 |
| | | Merit (1) | | Seneca-Upshur | | 2003/2002-D Partnerships | | 2005 Partnerships | | Permian | | 2004
Partnerships |
| | | (in thousands) |
| | | | | | | | | | | | | |
Total acquisition cost
| | $ | 304,643 |
| | $ | 69,618 |
| | $ | 29,960 |
| | $ | 43,015 |
| | $ | 114,273 |
| | $ | 34,768 |
|
| | | | | | | | | | | | | |
| Recognized amounts of identifiable assets acquired and liabilities assumed: | | | | | | | | | | | | |
| Assets acquired: | | | | | | | | | | | | |
| Natural gas and crude oil properties - proved | | $ | 180,259 |
| | $ | 20,175 |
| | $ | 27,940 |
| | $ | 39,825 |
| | $ | 45,592 |
| | $ | 32,730 |
|
| Natural gas and crude oil properties - unproved | | 151,428 |
| | 49,100 |
| | — |
| | — |
| | 71,647 |
| | — |
|
Other assets
| | 3,631 |
| | 10,196 |
| | 3,455 |
| | 3,848 |
| | — |
| | 3,396 |
|
| Total assets acquired | | 335,318 |
| | 79,471 |
| | 31,395 |
| | 43,673 |
| | 117,239 |
| | 36,126 |
|
Liabilities assumed:
| | | | | | | | | | | | |
| Asset retirement obligation | | 13,870 |
| | 8,157 |
| | 497 |
| | 300 |
| | 2,351 |
| | 912 |
|
| Other accrued expenses | | 10,100 |
| | — |
| | — |
| | — |
| | 615 |
| | 126 |
|
Other liabilities
| | 6,705 |
| | 1,696 |
| | 938 |
| | 358 |
| | — |
| | 320 |
|
| Total liabilities assumed | | 30,675 |
| | 9,853 |
| | 1,435 |
| | 658 |
| | 2,966 |
| | 1,358 |
|
Total identifiable net assets acquired
| | $ | 304,643 |
| | $ | 69,618 |
| | $ | 29,960 |
| | $ | 43,015 |
| | $ | 114,273 |
| | $ | 34,768 |
|
| | | | | | | | | | | | | |
___________
(1) Assets acquired and liabilities assumed in the Merit Acquisition are subject to post-closing adjustments as more detailed analyses are completed and additional information is obtained about the acquired natural gas and crude oil properties.
The fair value measurements of assets acquired and liabilities assumed are based on inputs that are not observable in the market and therefore represent Level 3 inputs. The fair values of oil and natural gas properties and asset retirement obligations were measured using valuation techniques that convert future cash flows to a single discounted amount. Significant inputs to the valuation of oil and natural gas properties include estimates of reserves, future operating and development costs, future commodity prices, estimated future cash flows and a market-based weighted-average cost of capital rate. These inputs require significant judgments and estimates by management at the time of the valuation and are the most sensitive and subject to change.
2012 Acquisitions
Merit Acquisition. On June 29, 2012, we completed the acquisition of certain Wattenberg Field oil and natural gas properties, leasehold mineral interests and related assets located in Weld, Adams and Boulder Counties, Colorado from affiliates of Merit Energy, an unrelated third-party. The aggregate purchase price of these properties was approximately $304.6 million, after post-closing adjustments. We financed the purchase with cash from the May 2012 offering of our common stock and a draw on our revolving credit facility.
This acquisition was accounted for under the acquisition method of accounting. Accordingly, we conducted assessments of net assets acquired and recognized amounts for identifiable assets acquired and liabilities assumed at their estimated acquisition date fair values, while transaction and integration costs associated with the acquisition were expensed as incurred.
Pro Forma Information. The results of operations for the Merit Acquisition have been included in our consolidated financial statements since the June 29, 2012 closing date, including approximately $11.4 million of total revenue and $9.5 million of income from operations. The following unaudited pro forma financial information presents a summary of the consolidated results of operations for the years ended December 31, 2012 and December 31, 2011, assuming the Merit Acquisition had been completed as of January 1, 2011, including adjustments to reflect the values assigned to the net assets acquired. The pro forma financial information is not necessarily indicative of the results of operations that would have been achieved if the Merit Acquisition had been effective as of these dates, or of future results.
PDC ENERGY, INC.
NOTES TO CONSOLIDATED FINANCIAL STATEMENTS - Continued
|
| | | | | | | |
| | Year Ended December 31, |
| | 2012 | | 2011 |
| | (in thousands, except per share amounts) |
| | | | |
| Total revenues | $ | 370,488 |
| | $ | 438,204 |
|
| Total costs, expenses and other | 521,178 |
| | 366,120 |
|
Net income (loss)
| $ | (119,343 | ) | | $ | 45,688 |
|
| | | | |
Earnings per share:
| | | |
| Basic | $ | (4.31 | ) | | $ | 1.94 |
|
| Diluted | $ | (4.31 | ) | | $ | 1.91 |
|
2011 Acquisitions
Seneca-Upshur. In October 2011, PDCM acquired from an unrelated third-party 100% of the membership interests of Seneca-Upshur Petroleum, LLC ("Seneca-Upshur") for a purchase price of $139.2 million ($69.6 million net to PDC), after post-closing adjustments, which was funded by capital contributions by PDCM's investing partners and a draw on PDCM's revolving credit facility. Substantially all of the acreage acquired is held by production, prospective for the Marcellus Shale2014 Annual Stockholders' meeting and is incorporated by reference in close proximity to PDCM's existing properties. Following the closing, several title defects were discovered that were not cured by the seller within the time specified by the purchase and sale agreement. Accordingly, PDCM received title defect payments during 2012 totaling $28.9 million, of which $14.5 million represents our share, the effect of which is reflected in the purchase price noted above.
2003/2002-D Partnerships. In October 2011, we acquired from non-affiliated investor partners the remaining working interest in five of our affiliated partnerships: PDC 2002-D Limited Partnership, PDC 2003-A Limited Partnership, PDC 2003-B Limited Partnership and PDC 2003-C Limited Partnership and (the "2002/2003 Partnerships"). We purchased the 2002/2003 Partnerships for an aggregate amount of $30 million, which was funded from our revolving credit facility. These purchases included the non-affiliated investor partners' remaining working interests in wells located in the Wattenberg Field and Piceance Basin.
2005 Partnerships. In June 2011, we acquired from non-affiliated investor partners the remaining working interest in three of our affiliated partnerships: PDC 2005-A Limited Partnership, PDC 2005-B Limited Partnership and Rockies Region Private Limited Partnership (the "2005 Partnerships"). We purchased the 2005 Partnerships for an aggregate amount of $43 million, which was funded from our revolving credit facility. These purchases included the non-affiliated investor partners' remaining working interests wells located in the Wattenberg Field and Piceance Basin.
Pro Forma Information. The results of operations for the Seneca-Upshur, 2002/2003 Partnerships and 2005 Partnerships acquisitions have been included in our consolidated financial statements from the respective dates of acquisition. Pro forma information is not presented as the pro forma results would not be materially different from the information presented in the accompanying statements of operations.
2010 Acquisitions
2004 Partnerships. In December 2010, we acquired the remaining working interest in four of our affiliated partnerships: PDC 2004-A Limited Partnership, PDC 2004-B Limited Partnership, PDC 2004-C Limited Partnership and PDC 2004-D Limited Partnership (the “2004 Partnerships”). We purchased these partnerships for an aggregate amount of $36.5 million, which was funded from our revolving credit facility. These purchases included the remaining working interests in wells located in the Wattenberg Field and Piceance Basin.
Permian Basin. In July 2010, we acquired various producing assets located in the Wolfberry Trend in the Permian Basin in West Texas (the “Wolfberry Assets”). In conjunction with the divestiture of our Michigan asset group, we entered into a like-kind exchange agreement with a qualified intermediary. The Wolfberry Assets were identified as our replacement property in accordance with IRC Section 1031. Sales proceeds of $19.3 million from the Michigan divestiture were transferred directly to the qualified intermediary and, along with $55.7 million from our revolving credit facility, funded the purchase of the Wolfberry Assets. The sale of our Michigan assets resulted in a gain for income tax purposes of $19.2 million, which then resulted in a tax liability of $7.3 million. With the favorable deferral aspects of IRC Section 1031, we were able to defer $6.5 million of this tax liability. In November 2010, we acquired for $39.4 million in cash a second position in the Wolfberry oil trend, including 100% of the interest in producing assets and undeveloped acreage.
Pro Forma Information. The results of operations for the 2004 Partnerships and Wolfberry Assets acquisition have been included in our consolidated financial statements from the respective dates of acquisition. Pro forma information is not presented as the pro forma results would not be materially different from the information presented in the accompanying statements of operations.
PDC ENERGY, INC.
NOTES TO CONSOLIDATED FINANCIAL STATEMENTS - Continued
NOTE 16 - NONCONTROLLING INTEREST IN SUBSIDIARY
In 2007, we contributed $0.8 million for a 50% interest in WWWV, LLC (the "LLC"), a limited liability company for which we served as the managing member. The LLC's only asset was an aircraft and was formed for the purpose of owning and operating the aircraft. We consolidated the entity based on a controlling financial interest. In 2011, we divested the asset and dissolved the entity with no material impact on our financial statements.report.
NOTE 17 - TRANSACTIONS WITH AFFILIATESITEM 14. PRINCIPAL ACCOUNTANT FEES AND SERVICES
Former Executive Officer. In June 2011, Richard W. McCullough resigned from his positions as our Chief Executive Officer and the Chairman of the Board, effective immediately. In connection with his resignation, in July 2011, Mr. McCullough and the Company executed a separation agreement, whereby Mr. McCullough will receive those benefits to which he was entitled under Section 7(d) of his employment agreement, dated as of April 19, 2010, including without limitation, separation compensation in the amount of $4.1 million, less required withholdings, his annual non-qualified deferred supplemental retirement benefit equal to $30,000 for each of the years 2012 through 2021 (not accelerated), less required withholdings, continued coverage under the Company’s group health plans at the Company’s cost for a period equal to the lesser of 18 months or such period ending as of the date Mr. McCullough is eligible to participate in another employer’s group health plan, immediate vesting of any unvested Company stock options, SARs and restricted stock and issuance of shares representing the vested portion of his 2009 performance share awards. RelatedInformation relating to this separation agreement,Item will be included in an amendment to this report or the proxy statement of operationsto be filed pursuant to Regulation 14A for 2011 reflects a charge to generalour 2014 Annual Stockholders' meeting and administrative expense of $6.7 million.is incorporated by reference in this report.
PDCM and Affiliated Partnerships. Our Gas Marketing segment markets the natural gas produced by PDCM and our affiliated partnerships in the Eastern Operating Region.PART IV
Amounts due from/to the affiliated partnerships are primarily related to derivative positions and, to a lesser extent, unbilled well lease operating expenses, and costs resulting from audit and tax preparation services. We have entered into derivative instruments on behalf of our affiliated partnerships for their estimated production.
The following table presents amounts included in our consolidated statement of operations related to the marketing of natural gas on behalf of PDCM and our affiliated partnerships and amounts included in our consolidated balance sheet related to the derivative instruments we entered into on behalf of our affiliated partnerships:
|
| | | | | | | | | | | |
| | As of/Year Ended December 31, |
| | 2012 | | 2011 | | 2010 |
| | (in thousands) |
| | | | | | |
| PDCM: | | | | | |
| Sales from natural gas marketing | $ | 11,105 |
| | $ | 9,735 |
| | $ | 4,298 |
|
| Cost of natural gas marketing | 10,888 |
| | 9,544 |
| | 4,214 |
|
| Affiliated Partnerships: | | | | | |
| Sales from natural gas marketing | 535 |
| | 1,276 |
| | 651 |
|
| Cost of natural gas marketing | 524 |
| | 1,251 |
| | 638 |
|
| Receivable from affiliates | 2,140 |
| | 6,163 |
| | 14,616 |
|
| Payable to affiliates | 4,707 |
| | 14,152 |
| | 20,342 |
|
| | | | | | |
We provide certain well operating and administrative services for PDCM. Amounts billed to PDCM for these services were $12.1 million, $10.4 million and $11.1 million in 2012, 2011 and 2010, respectively. Our statements of operations include only our proportionate share of these billings. The following table presents the statement of operations line item in which our proportionate share is recorded and the amount for each of the periods presented.
|
| | | | | | | | | | | | |
| | | Year Ended December 31, |
| Statement of Operations Line Item | | 2012 | | 2011 | | 2010 |
| | | (in thousands) |
| | | | | | | |
| Production Costs | | $ | 3,945 |
| | $ | 3,441 |
| | $ | 3,862 |
|
| Exploration Expense | | 492 |
| | 430 |
| | 883 |
|
| General and Administrative Expense | | 1,630 |
| | 1,543 |
| | 1,899 |
|
PDC ENERGY, INC.
NOTES TO CONSOLIDATED FINANCIAL STATEMENTS - Continued
NOTE 18 - BUSINESS SEGMENTS
We separate our operating activities into two segments: Oil and Gas Exploration and Production and Gas Marketing. All material inter-company accounts and transactions between segments have been eliminated.
Oil and Gas Exploration and Production. Our Oil and Gas Exploration and Production segment includes all of our natural gas and crude oil properties. The segment represents revenues and expenses from the production and sale of natural gas, NGLs and crude oil. Segment revenue includes natural gas, NGLs and crude oil sales, commodity price risk management, net and well operation and pipeline income. Segment income (loss) consists of segment revenue less production cost, exploration expense, impairment of natural gas and crude oil properties, direct general and administrative expense and DD&A expense. Segment DD&A expense was $139.4 million, $122.2 million and $105.9 million in 2012, 2011 and 2010, respectively.
Gas Marketing. Our Gas Marketing segment purchases, aggregates and resells natural gas produced by us and others. Segment income (loss) primarily represents sales from natural gas marketing and direct interest income less costs of natural gas marketing and direct general and administrative expense.
Unallocated amounts. Unallocated income includes unallocated other revenue, less corporate general administrative expense, corporate DD&A expense, interest income and interest expense.
The following tables present our segment information:ITEM 15. EXHIBITS, FINANCIAL STATEMENT SCHEDULE
|
| | | | | | | | | | | |
| | 2012 | | 2011 | | 2010 |
| | (in thousands) |
| Year Ended December 31, | | | | | |
| Revenues: | | | | | |
| Oil and Gas Exploration and Production | $ | 309,054 |
| | $ | 329,541 |
| | $ | 273,950 |
|
| Gas Marketing | 47,079 |
| | 66,419 |
| | 69,071 |
|
| Total Revenues | $ | 356,133 |
| | $ | 395,960 |
| | $ | 343,021 |
|
| | | | | | |
| Segment income (loss) from continuing operations before income taxes: | | | | | |
| Oil and Gas Exploration and Production | $ | (96,293 | ) | | $ | 106,832 |
| | $ | 84,387 |
|
| Gas Marketing | 528 |
| | 954 |
| | 1,063 |
|
| Unallocated | (137,856 | ) | | (104,891 | ) | | (78,760 | ) |
| Total | $ | (233,621 | ) | | $ | 2,895 |
| | $ | 6,690 |
|
| | | | | | |
| Expenditures for segment long-lived assets: | | | | | |
| Oil and Gas Exploration and Production | $ | 656,443 |
| | $ | 479,027 |
| | $ | 319,268 |
|
| Unallocated | 3,509 |
| | 1,363 |
| | 1,506 |
|
| Total | $ | 659,952 |
| | $ | 480,390 |
| | $ | 320,774 |
|
| | | | | | |
| As of December 31, | | | | | |
| Segment assets: | | | | | |
| Oil and Gas Exploration and Production | $ | 1,723,011 |
| | $ | 1,461,130 |
| | |
| Gas Marketing | 11,090 |
| | 14,713 |
| | |
| Unallocated | 92,747 |
| | 73,913 |
| | |
| Assets held for sale | — |
| | 148,249 |
| | |
| Total Assets | $ | 1,826,848 |
| | $ | 1,698,005 |
| | |
| | | | | | |
NOTE 19 - SUBSEQUENT EVENT
On February 4, 2013, we entered into a purchase and sale agreement with certain affiliates of Caerus Oil and Gas LLC (“Caerus”), pursuant to which we have agreed to sell to Caerus our Piceance Basin, NECO and certain non-core Colorado oil and gas properties, leasehold mineral interests and related assets, including derivatives, for aggregate cash consideration of approximately $200 million, subject to post-closing adjustments. The assets being sold do not include any of our core Wattenberg Field acreage. The cash consideration is subject to customary adjustments, including adjustments based upon title and environmental due diligence, and by certain firm transportation obligations and natural gas hedging positions that will be assumed by Caerus. There can be no assurance we will be successful in closing such divestiture. |
| | |
| (a) | (1) | Exhibits: |
| | See Exhibits Index on the following page. |
SUPPLEMENTAL INFORMATION - UNAUDITEDExhibits Index
|
| | | | | | | | | | | | |
| | | | | Incorporated by Reference | | |
| Exhibit Number | | Exhibit Description | | Form | | SEC File Number | | Exhibit | | Filing Date | | Filed Herewith |
| | | | | | | | | | | | | |
| 3.1 | | Third Amended and Restated Articles of Incorporation of PDC Energy, Inc. (the "Company")
| | 10-Q | | 000-07246 | | 3.1 | | 8/2/2012 | | |
| | | | | | | | | | | | | |
| 3.2 | | By-laws of the Company. | | 10-Q | | 000-07246 | | 3.2 | | 8/2/2012 | | |
| | | | | | | | | | | | | |
| 4.1 | | Rights Agreement by and between the Company and Transfer Online, Inc., as Rights Agent, dated as of September 11, 2007, including the forms of Rights Certificates and Summary of Stockholder Rights Plan attached thereto as Exhibits A and B. | | 8-K | | 000-07246 | | 4.1 | | 9/17/2007 | | |
| | | | | | | | | | | | | |
| 4.2 | | Indenture, dated November 23, 2010, between the Company and The Bank of New York Mellon, including the form of 3.25% Convertible Senior Note due 2016. | | 8-K | | 000-07246 | | 4.1 | | 11/24/2010 | | |
| | | | | | | | | | | | | |
| 4.3 | | Indenture, dated as of October 3, 2012, by and between the Company and U.S. Bank Trust National Association, as Trustee, including the form of 7.75% Senior Notes due 2022. | | 8-K | | 000-07246 | | 4.1 | | 10/3/2012 | | |
| | | | | | | | | | | | | |
| 10.1* | | Indemnification Agreement with Non-Employee Directors. | | 8-K | | 000-07246 | | 10.1 | | 6/13/2012 | | |
| | | | | | | | | | | | | |
| 10.2* | | The Company 401(k) and Profit Sharing Plan. | | 10-K | | 000-07246 | | 10.6 | | 2/24/2011 | | |
| | | | | | | | | | | | | |
| 10.3* | | Amended and Restated Non-Employee Director Deferred Compensation Plan. | | | | | | | | | | X |
| | | | | | | | | | | | | |
| 10.4* | | 2004 Long-Term Equity Compensation Plan amended and restated as of March 8, 2008 ("2004 Plan"). | | 10-K | | 000-07246 | | 10.26 | | 2/27/2009 | | |
| | | | | | | | | | | | | |
| 10.4.1* | | Summary of 2010 Stock Appreciation Rights and Restricted Stock Awards under the 2004 Plan. | | 8-K | | 000-07246 | |
| | 4/23/2010 | | |
| | | | | | | | | | | | | |
| 10.5* | | Amended and Restated 2010 Long-Term Equity Compensation Plan, dated June 6, 2013 | | 10-Q | | 000-07246 | | 10.4 | | 8/1/2013 | | |
| | | | | | | | | | | | | |
| 10.5.1* | | Form of 2010 Performance Share Agreement. | | 8-K | | 000-07246 | | 10.1 | | 3/17/2011 | | |
| | | | | | | | | | | | | |
| 10.5.2* | | Form of 2011 Restricted Stock/Stock Appreciation Rights Agreement. | | | | | | | | | | X |
| | | | | | | | | | | | | |
| 10.5.3* | | Form of 2012 Performance Share Agreement. | | 8-K | | 000-07246 | | 10.1 | | 1/20/2012 | | |
| | | | | | | | | | | | | |
| 10.5.4* | | Form of 2013 Performance Share Agreement. | | 10-K | | 000-07246 | | 10.9 | | 2/27/2013 | |
|
| | | | | | | | | | | | | |
| 10.5.5* | | Form of 2013 Restricted Stock/Stock Appreciation Rights Agreement. | | 10-K | | 000-07246 | | 10.10 | | 2/27/2013 | |
|
| | | �� | | | | | | | | | | |
| 10.6* | | Executive Severance Compensation Plan. | | 8-K | | 000-07246 | | 10.2 | | 9/25/2012 | | |
| | | | | | | | | | | | | |
| 10.7* | | Employment Agreement with Gysle R. Shellum, Chief Financial Officer, dated as of April 19, 2010. | | 8-K | | 000-07246 | | 10.2 | | 4/23/2010 | | |
| | | | | | | | | | | | | |
| 10.8* | | Employment Agreement with Daniel W. Amidon, General Counsel and Corporate Secretary, dated as of April 19, 2010. | | 8-K | | 000-07246 | | 10.3 | | 4/23/2010 | | |
| | | | | | | | | | | | | |
| 10.9* | | Employment Agreement with Lance A. Lauck, Senior Vice President of Business Development, dated as of April 19, 2010. | | 8-K | | 000-07246 | | 10.4 | | 4/23/2010 | | |
| | | | | | | | | | | | | |
| 10.10* | | Employment Agreement with Barton R. Brookman, Jr., Senior Vice President of Exploration and Production, dated as of April 19, 2010. | | 8-K | | 000-07246 | | 10.5 | | 4/23/2010 | | |
| | | | | | | | | | | | | |
| 10.11 | | Contribution Agreement by and among PDC Mountaineer, LLC, as the Company, Petroleum Development Corporation, as the Contributor, and LR-Mountaineer Holdings, L.P., as the Investor, dated October 29, 2009. | | 8-K | | 000-07246 | | 2.1 | | 11/4/2009 | | |
| | | | | | | | | | | | | |
| 10.12 | | Second Amended and Restated Limited Liability Company Agreement of PDC Mountaineer, LLC, dated December 23, 2013. | |
| |
| |
| |
| | X |
| | | | | | | | | | | | | |
|
| | | | | | | | | | | | |
| | | | | Incorporated by Reference | | |
| Exhibit Number | | Exhibit Description | | Form | | SEC File Number | | Exhibit | | Filing Date | | Filed Herewith |
| | | | | | | | | | | | | |
| 10.13 | | Third Amended and Restated Credit Agreement dated as of May 21, 2013, among PDC Energy, Inc. as Borrower, Riley Natural Gas Company, a Subsidiary of PDC Energy, Inc., as Guarantor, JP Morgan Chase Bank, N.A. as Administrative Agent, J.P. Morgan Securities LLC as Sole Bookrunner and Co-Lead Arranger, Wells Fargo Bank, N.A. as Syndication Agent, and Wells Fargo Securities, LLC as Co-Lead Arranger, and Certain Lenders. | | 8-K | | 000-07246 | | 10.1 | | 5/28/2013 | | |
| | | | | | | | | | | | | |
| 10.14 | | Purchase and Sale Agreement by and among the Company, affiliated partnerships and certain affiliates of Caerus Oil and Gas LLC, dated February 4, 2013. | | 8-K | | 000-07246 | | 10.1 | | 5/1/2013 | | |
| | | | | | | | | | | | | |
| 10.14.1 | | Amendment No. 1 to Purchase and Sale Agreement, dated as of May 30, 2013, by and among the Company, certain affiliates of the Company, Caerus Operating LLC, Caerus Washco LLC and Caerus Piceance LLC. | | 8-K | | 000-07246 | | 10.1 | | 6/3/2013 | | |
| | | | | | | | | | | | | |
| 12.1 | | Computation of Ratio of Earnings to Fixed Charges. | | | | | | | | | | X |
| | | | | | | | | | | | | |
| 14.1 | | Code of Business Conduct and Ethics. | | 10-Q | | 000-07246 | | 14.1 | | 8/10/2009 | | |
| | | | | | | | | | | | | |
| 21.1 | | Subsidiaries. | | | | | | | | | | X |
| | | | | | | | | | | | | |
| 23.1 | | Consent of PricewaterhouseCoopers LLP. | | | | | | | | | | X |
| | | | | | | | | | | | | |
| 23.2 | | Consent of Ryder Scott Company, L.P., Petroleum Consultants. | | | | | | | | | | X |
| | | | | | | | | | | | | |
| 31.1 | | Certification by Chief Executive Officer pursuant to Rule 13a-14(a) and 15d-14(a) of the Exchange Act Rules, as adopted pursuant to Section 302 of the Sarbanes-Oxley Act of 2002. | | | | | | | | | | X |
| | | | | | | | | | | | | |
| 31.2 | | Certification by Chief Financial Officer pursuant to Rule 13a-14(a) and 15d-14(a) of the Exchange Act Rules, as adopted pursuant to Section 302 of the Sarbanes-Oxley Act of 2002. | | | | | | | | | | X |
| | | | | | | | | | | | | |
| 32.1** | | Certifications by Chief Executive Officer and Chief Financial Officer pursuant to Title 18 U.S.C. Section 1350, as adopted pursuant to Section 906 of Sarbanes-Oxley Act of 2002. | | | | | | | | | | |
| | | | | | | | | | | | | |
| 99.1 | | Report of Independent Petroleum Consultants - Ryder Scott Company, L.P. | | | | | | | | | | X |
| | | | | | | | | | | | | |
| 101.INS | | XBRL Instance Document | | | | | | | | | | X |
| | | | | | | | | | | | | |
| 101.SCH | | XBRL Taxonomy Extension Schema Document | | | | | | | | | | X |
| | | | | | | | | | | | | |
| 101.CAL | | XBRL Taxonomy Extension Calculation Linkbase Document | | | | | | | | | | X |
| | | | | | | | | | | | | |
| 101.DEF | | XBRL Taxonomy Extension Definition Linkbase Document | | | | | | | | | | X |
| | | | | | | | | | | | | |
| 101.LAB | | XBRL Taxonomy Extension Label Linkbase Document | | | | | | | | | | X |
| | | | | | | | | | | | | |
| 101.PRE | | XBRL Taxonomy Extension Presentation Linkbase Document | | | | | | | | | | X |
| | | | | | | | | | | | | |
| *Management contract or compensatory plan or arrangement. | | | | | | | | | | |
| ** Furnished herewith. |
| † Confidential portions of this document have been omitted and are filed separately with the SEC pursuant to Exchange Act Rule 24b-2. |
NATURAL GAS AND CRUDE OIL INFORMATION - UNAUDITED
SIGNATURES
Net Proved Reserves
AllPursuant to the requirements of our natural gas, NGLs and crude oil reserves are located inSection 13 or 15(d) of the U.S. We utilizeSecurities Exchange Act of 1934, the services of independent petroleum engineersRegistrant has duly caused this report to estimate our natural gas, crude oil, condensate and NGL reserves. As of December 31, 2012, 2011 and 2010, all of our reserve estimates were basedbe signed on reserve reports prepared by Ryder Scott Company, L.P. ("Ryder Scott"). These reserve estimates have been prepared in compliance with professional standards and the reserves definitions prescribedits behalf by the SEC.
Proved reserves estimates may change, either positively or negatively, as additional information becomes available and as contractual, economic and political conditions change. Our net proved reserve estimates have been adjusted as necessary to reflect all contractual agreements, royalty obligations and interests owned by others at the time of the estimate. Proved developed reserves are the quantities of natural gas, NGLs and crude oil expected to be recovered through existing wells with existing equipment and operating methods. In some cases, proved undeveloped reserves may require substantial new investments in additional wells and related facilities.
The price used to estimate our reserves, by commodity, are presented below.undersigned, thereunto duly authorized.
|
| | | | | | | | | | | | |
| | Price Used to Estimate Reserves |
| As of December 31, | | Natural Gas (per Mcf) | | NGLs (per Bbl) | | Crude Oil (per Bbl) |
| | | | | | | |
| 2012 | | $ | 2.35 |
| | $ | 28.02 |
| | $ | 87.51 |
|
| 2011 | | 3.41 |
| | 39.59 |
| | 88.94 |
|
| 2010 | | 3.54 |
| | 34.12 |
| | 71.95 |
|
The following tables present the changes in our estimated quantities of proved reserves:
|
| | | | | | | | | | | |
| | Natural Gas (MMcf) | | NGLs (MBbls) | | Crude Oil, Condensate (MBbls) | | Total (MMcfe) |
| Proved Reserves: | | | | | | | |
| Proved reserves, January 1, 2010 | 608,925 |
| | — |
| | 18,070 |
| | 717,345 |
|
| Revisions of previous estimates | 6,504 |
| | 8,908 |
| | (85 | ) | | 59,442 |
|
| Extensions, discoveries and other additions |
| |
| |
| |
|
| Western Operating Region | 56,524 |
| | 811 |
| | 2,247 |
| | 74,872 |
|
| Eastern Operating Region | 35,092 |
| | — |
| | — |
| | 35,092 |
|
| Purchases of reserves |
| |
| |
| |
|
| Western Operating Region | 20,920 |
| | 1,531 |
| | 4,367 |
| | 56,308 |
|
| Eastern Operating Region | 220 |
| | — |
| | — |
| | 220 |
|
| Other | — |
| | — |
| | — |
| | — |
|
| Dispositions | (43,690 | ) | | — |
| | (55 | ) | | (44,020 | ) |
| Production | (27,189 | ) | | (601 | ) | | (1,308 | ) | | (38,643 | ) |
| Proved reserves, December 31, 2010 | 657,306 |
| | 10,649 |
| | 23,236 |
| | 860,616 |
|
| Revisions of previous estimates | (161,654 | ) | | 3,163 |
| | (1,904 | ) | | (154,100 | ) |
| Extensions, discoveries and other additions |
| |
| |
| |
|
| Western Operating Region | 125,374 |
| | 5,633 |
| | 17,092 |
| | 261,724 |
|
| Eastern Operating Region | 51,315 |
| | — |
| | — |
| | 51,315 |
|
| Purchases of reserves |
| |
| |
| |
|
| Western Operating Region | 24,776 |
| | 1,052 |
| | 1,581 |
| | 40,574 |
|
| Eastern Operating Region | 7,985 |
| | — |
| | 24 |
| | 8,129 |
|
| Dispositions | (2,070 | ) | | (94 | ) | | (435 | ) | | (5,244 | ) |
| Production | (30,887 | ) | | (815 | ) | | (1,958 | ) | | (47,525 | ) |
| Proved reserves, December 31, 2011 (1) | 672,145 |
| | 19,588 |
| | 37,636 |
| | 1,015,489 |
|
| Revisions of previous estimates | (289,436 | ) | | (3,671 | ) | | (6,729 | ) | | (351,836 | ) |
| Extensions, discoveries and other additions |
|
| |
|
| |
| |
|
|
| Western Operating Region | 116,205 |
| | 11,637 |
| | 27,482 |
| | 350,919 |
|
| Eastern Operating Region | 56,728 |
| | — |
| | — |
| | 56,728 |
|
| Purchases of reserves |
|
| |
|
| |
| |
|
|
| Western Operating Region | 87,189 |
| | 8,084 |
| | 10,801 |
| | 200,499 |
|
| Eastern Operating Region | 23 |
| | — |
| | — |
| | 23 |
|
| Dispositions | (6,406 | ) | | (1,970 | ) | | (7,854 | ) | | (65,350 | ) |
| Production | (32,410 | ) | | (841 | ) | | (2,026 | ) | | (49,612 | ) |
| Proved reserves, December 31, 2012 (2) | 604,038 |
| | 32,827 |
| | 59,310 |
| | 1,156,860 |
|
| | | | | | | | |
|
| | | | | | | | | | | |
| Proved Developed Reserves, as of: | | | | | | | |
| January 1, 2010 | 258,375 |
| | — |
| | 6,244 |
| | 295,839 |
|
| December 31, 2010 | 227,341 |
| | 4,013 |
| | 8,287 |
| | 301,141 |
|
| December 31, 2011 (1) | 299,369 |
| | 11,753 |
| | 16,910 |
| | 471,347 |
|
| December 31, 2012 (2) | 281,925 |
| | 14,353 |
| | 20,412 |
| | 490,515 |
|
| Proved Undeveloped Reserves, as of: | | |
| | | | |
| January 1, 2010 | 350,550 |
| | — |
| | 11,826 |
| | 421,506 |
|
| December 31, 2010 | 429,965 |
| | 6,636 |
| | 14,949 |
| | 559,475 |
|
| December 31, 2011 (1) | 372,776 |
| | 7,835 |
| | 20,726 |
| | 544,142 |
|
| December 31, 2012 (2) | 322,113 |
| | 18,474 |
| | 38,898 |
| | 666,345 |
|
| | | | | | | | |
__________
|
| |
(1) | Includes estimated reserve data related to our Permian asset group, which was held for salePDC ENERGY, INC.
|
| |
| By: /s/ James M. Trimble |
| James M. Trimble |
| Chief Executive Officer and under a purchase and sale agreement. The divestiture of our Permian assets closed on President |
| |
| February 28, 2012. See Note 14, Assets Held for Sale, Divestitures and Discontinued Operations, to our consolidated financial statements included in this report for additional details related to the divestiture of our Permian asset group. Total proved reserves included 6,242 MMcf of natural gas, 7,825 MBbls of crude oil and 1,970 MBbls of NGLs, for an aggregate of 65,018 MMcfe of natural gas equivalent, related to our Permian asset group. Total proved developed reserves related to those assets included 1,750 MMcf, 1,815 MBbls, 550 MBbls and 15,940 MMcfe, respectively, and proved undeveloped reserves included 4,492 MMcf, 6,010 MBbls, 1,420 MBbls and 49,078 MMcfe, respectively.20, 2014 |
| |
Pursuant to the requirements of the Securities Exchange Act of 1934, this report has been signed below by the following persons on behalf of the Registrant and in the capacities and on the dates indicated:
|
| | | | |
(2)Signature | Includes estimated reserve data related to our Piceance | Title | | Date |
| | | | |
| /s/ James M. Trimble | | Chief Executive Officer, President and NECO assets, which are expected to be divested pursuant to a purchaseDirector | | February 20, 2014 |
| James M. Trimble | | (principal executive officer) | | |
| | | | |
| /s/ Gysle R. Shellum | | Chief Financial Officer | | February 20, 2014 |
| Gysle R. Shellum | | (principal financial officer) | | |
| | | | |
| /s/ R. Scott Meyers | | Chief Accounting Officer | | February 20, 2014 |
| R. Scott Meyers | | (principal accounting officer) | | |
| | | | |
| /s/ Jeffrey C. Swoveland | | Chairman and sale agreement entered into on Director | | February 4, 2013. See Note 19, Subsequent Events, to our consolidated financial statements included elsewhere in this report for additional details related to the planned divestiture of our Piceance and NECO assets. Total proved reserves20, 2014 |
| Jeffrey C. Swoveland | | | | |
| | | | |
| /s/ Joseph E. Casabona | | Director | | February 20, 2014 |
| Joseph E. Casabona | | | | |
| | | | |
| /s/ Anthony J. Crisafio | | Director | | February 20, 2014 |
| Anthony J. Crisafio | | | | |
| | | | |
| /s/ Larry F. Mazza | | Director | | February 20, 2014 |
| Larry F. Mazza | | | | |
| | | | |
| /s/ David C. Parke | | Director | | February 20, 2014 |
| David C. Parke | | | | |
| | | | |
| /s/ Kimberly Luff Wakim | | Director | | February 20, 2014 |
| Kimberly Luff Wakim | | | | |
include 83,656 MMcfGLOSSARY OF UNITS OF MEASUREMENT AND INDUSTRY TERMS
UNITS OF MEASUREMENT
The following presents a list of units of measurement used throughout the document.
Bbl – One barrel of crude oil or NGL or 42 gallons of liquid volume.
Bcf – One billion cubic feet of natural gas and 148 MBblsvolume.
Boe – One barrel of crude oil for an aggregateequivalent.
Btu – British thermal unit.
BBtu – One billion British thermal units.
MBoe – One thousand barrels of 84,544 MMcfecrude oil equivalent.
MBbls – One thousand barrels of crude oil.
Mcf – One thousand cubic feet of natural gas equivalent related to our Piceance and NECO assets. There were no proved undeveloped reserves attributable to the Piceance and NECO assets asvolume.
MMBoe – One million barrels of December 31, 2012.crude oil equivalent.
MMBtu – One million British thermal units.
MMcf – One million cubic feet of natural gas volume.
|
| | | | | | | | |
| | Developed | | Undeveloped | | Total |
| | (MMcfe) |
| | | | | | |
| Beginning proved reserves, January 1, 2011 | 301,141 |
| | 559,475 |
| | 860,616 |
|
| Undeveloped reserves converted to developed | 43,597 |
| | (43,597 | ) | | — |
|
| Revisions of previous estimates | 73,643 |
| | (227,743 | ) | | (154,100 | ) |
| Extensions, discoveries and other additions | 58,979 |
| | 254,060 |
| | 313,039 |
|
| Purchases of reserves | 46,756 |
| | 1,947 |
| | 48,703 |
|
| Dispositions | (5,244 | ) | | — |
| | (5,244 | ) |
| Production | (47,525 | ) | | — |
| | (47,525 | ) |
| Ending proved reserves, December 31, 2011 | 471,347 |
| | 544,142 |
| | 1,015,489 |
|
| Undeveloped reserves converted to developed | 45,929 |
| | (45,929 | ) | | — |
|
| Revisions of previous estimates | (109,909 | ) | | (241,927 | ) | | (351,836 | ) |
| Extensions, discoveries and other additions | 67,787 |
| | 339,860 |
| | 407,647 |
|
| Purchases of reserves | 81,253 |
| | 119,269 |
| | 200,522 |
|
| Dispositions | (16,280 | ) | | (49,070 | ) | | (65,350 | ) |
| Production | (49,612 | ) | | — |
| | (49,612 | ) |
| Ending proved reserves, December 31, 2012 | 490,515 |
| | 666,345 |
| | 1,156,860 |
|
| | | | | | |
2012 Activity. In 2012, we recorded a downward revision of our previous estimate of proved reserves of approximately 352 Bcfe. The revision was primarily due to a decrease of approximately 240 Bcfe due to lower gas pricing, mostly related to the Piceance Basin, approximately 6 Bcfe due to increased operating costs, approximately 46 Bcfe due to adjustments for geological reasons and approximately 77 Bcfe due to the removal of certain proved undeveloped reserves to comply with the SEC's five-year rule. This was partially offset by an increase of approximately 3 Bcfe due to non-acquisition interest adjustments and approximately 14 Bcfe due to asset performance. Discoveries and extensions of approximately 408 Bcfe in 2012 are due to the drilling of 44 gross horizontal wells and the addition of new proved undeveloped reserves. Approximately 57 Bcfe were added in the Eastern Operating Region related to the Marcellus Shale and approximately 351 Bcfe were added in the Wattenberg Field, mostly related to the Niobrara formation. We acquired approximately 201 Bcfe of proved reserves, approximately 200 Bcfe due to an acquisition in the Wattenberg Field. We divested a total of 65 Bcfe in 2012, primarily our core Permian Basin assets. Based on the economic conditions on December 31, 2012, our approved development plan provided for the development of our remaining PUD reserves within five years of the date such reserves were initially recorded. Based on our decision to drill predominantly horizontal wells in 2012, our drilling program focused on locations that were not included in proved undeveloped reserves in the December 2011 reserve report. By focusing on non-PUD drilling locations in 2012, we were able to add considerable PUD reserves in the 2012 reserve report. In 2013, we anticipate the majority of our drilling to be focused on horizontal well locations that are included in our proved undeveloped reserves in the 2012 reserve report. Therefore, we expect to convert 15% to 20% of our PUDs to proved developed producing reserves in 2013. This level of capital spending is consistent with the most recent years.
2011 Activity. In 2011, we recorded a downward revision of our previous estimate of proved reserves of approximately 154 Bcfe. The revision was primarily due to a decrease of approximately 4 Bcfe due to lower gas pricing and approximately 173 Bcfe due to the removal of certain proved undeveloped reserves to comply with the SEC's five-year rule. This was partially offset by an increase of approximately 6 Bcfe due to increased efficiencies in operating costs, approximately 5 Bcfe due to non-acquisition interest adjustments and approximately 12 Bcfe due to asset performance. In addition, the “Revisions of previous estimates” line item includes a deduction in the “Undeveloped” column and an increase in the “Developed” column of approximately 125 Bcfe. These reserves were transferred from proved undeveloped to proved developed as a result of the Company's determination that costs related to a refracture became less significant as compared to the costs associated with drilling a new well. Discoveries and extensions of approximately 313 Bcfe in 2011 are due to the drilling of 195 gross wells and the addition of new proved undeveloped reserves. Approximately 51 Bcfe were added in the Eastern Operating Region, approximately 262 Bcfe were added in the Western Operating Region (141 Bcfe in the Wattenberg Field, 80 Bcfe in the Piceance Basin and 41 Bcfe in the Permian Basin). We acquired approximately 49 Bcfe of proved reserves, approximately 8 Bcfe through acquisitions in the Eastern Operating Region, and approximately 41 Bcfe in the Western Operating Region (28 Bcfe were acquired in the Wattenberg Field and 13 Bcfe were acquired in the Piceance Basin) due to the repurchase of the 2003/2002-D and 2005 Partnerships as well as the purchase of interests in some of our other existing properties. We divested a total of approximately 5 Bcfe in 2011. This included the sale of 100% of our North Dakota assets, or 2 Bcfe, to an unrelated third-party and our non-core Permian Basin assets, or 3 Bcfe, to unrelated third parties.
2010 Activity. In 2010, we revised our previous estimate of proved reserves upward by 59.4 Bcfe. The revision was primarily due to an increase of 55.6 Bcfe due to asset performance, 35.9 Bcfe due to higher commodity pricing, 28.1 Bcfe due to the impact of evaluating NGLs as a separate stream and 1.5 Bcfe due to interest adjustments. This was partially offset by a decrease of 58.7 Bcfe due to adjustments for geological reasons or reclassification of prior period proved undeveloped reserves to probable reserves due to aging and 3 Bcfe due to increased operating costs. Discoveries and extensions of 110 Bcfe in 2010 are due to drilling of 213 gross wells and the addition of new proved undeveloped reserves:
35.1 Bcfe were added in the Eastern Operating Region and 74.9 Bcfe were added in the Western Operating Region (29.4 Bcfe in Wattenberg Field, 36.2 Bcfe in the Piceance Basin, 9.1 Bcfe in the NECO area and 0.2 Bcfe in North Dakota) and Permian Basin. We acquired 56.5 Bcfe of proved reserves, approximately 32.6 Bcfe through two acquisitions in the Permian Basin, and 23.9 Bcfe in both the Western and Eastern Operating Regions due to the repurchase of the 2004 Partnerships as well as the purchase of interests in some of our other existing properties. Of the 23.9 Bcfe, 12.8 Bcfe were acquired in the Wattenberg Field and 10.9 Bcfe were acquired in the Piceance Basin. Total dispositions of 44 Bcfe in 2010 included the deconsolidation of PDCM, or 28.9 Bcfe, and the sale of all of our Michigan assets, or 15.1 Bcfe, to an unaffiliated third-party.
Results of Operations for Natural Gas and Crude Oil Producing ActivitiesGLOSSARY OF INDUSTRY TERMS
The resultsfollowing are abbreviations and definitions of terms commonly used in the oil and gas industry and this report:
Behind-pipe reserves - Crude oil and natural gas reserves expected to be recovered from zones in existing wells, which will require additional completion work or future recompletion prior to the start of production. Generally, these are reserves in reservoirs above currently producing zones.
CIG - Colorado Interstate Gas.
Completion - Refers to the work performed and the installation of permanent equipment for the production of crude oil and natural gas from a recently drilled well.
Crude oil well - A well whose reserves are expected to produce less than 15 Mcf of gas per barrel of crude oil.
Delineation - A drilling technique carried out to gain a better understanding of the structure and extent of a deposit in order to decide whether or not to conduct further drilling activities.
Developed acreage - Acreage assignable to productive wells.
Development well - A well drilled within the proved area of an oil or gas reservoir to the depth of a stratigraphic horizon known to be productive.
Dry gas or dry natural gas - Natural gas is considered dry when its composition is over 90% pure methane.
Dry well or dry hole- A well found to be incapable of producing hydrocarbons in sufficient quantities to justify completion as an oil or gas well.
Exploratory well- A well drilled to find a new field or to find a new reservoir in a field previously found to be productive of oil or gas in another reservoir.
Extensions and discoveries - As to any period, the increases to proved reserves from all sources other than the acquisition of proved properties or revisions of previous estimates.
Farm-out - Transfer of all or part of the operating rights from a working interest owner to an assignee, who assumes all or some of the burden of development in return for an interest in the property. The assignor usually retains an overriding royalty interest but may retain any type of interest.
Fracture or Fracturing - Procedure to stimulate production by forcing a mixture of fluid and proppant into the formation under high pressure. Fracturing creates artificial fractures in the reservoir rock to increase permeability and porosity, thereby allowing the release of trapped hydrocarbons.
Gross acres or wells - Refers to the total acres or wells in which we have a working interest.
Horizontal drilling- A drilling technique that permits the operator to drill a horizontal well shaft from the bottom of a vertical well and thereby to contact and intersect a larger portion of the producing horizon than conventional vertical drilling techniques and may, depending on the horizon, result in increased production rates and greater ultimate recoveries of hydrocarbons.
Joint interest billing - Process of billing/invoicing the costs related to well drilling, completions and production operations foramong working interest partners.
Natural gas liquid(s) or NGL(s) - Hydrocarbons which can be extracted from wet natural gas and crude oil producing activities are presented below. The resultsbecome liquid under various combinations of increasing pressure and lower temperature. NGLs include activities related to both continuingethane, propane, butane, and discontinued operations and exclude activities related toother natural gas marketing and well operations and pipeline services.
|
| | | | | | | | | | | |
| Year Ended December 31, |
| 2012 | | 2011 | | 2010 |
| (in thousands) |
| Revenue: |
| |
| |
|
| Natural gas, NGLs and crude oil sales | $ | 274,783 |
| | $ | 304,157 |
| | $ | 216,159 |
|
| Commodity price risk management gain, net | 32,339 |
| | 46,090 |
| | 59,891 |
|
| 307,122 |
| | 350,247 |
| | 276,050 |
|
| Expenses: | | | | | |
| Production costs | 77,537 |
| | 75,717 |
| | 60,121 |
|
| Exploration expense | 22,605 |
| | 6,289 |
| | 20,291 |
|
| Impairment of proved natural gas and oil properties | 162,287 |
| | 25,159 |
| | 4,666 |
|
| Depreciation, depletion, and amortization | 146,879 |
| | 128,458 |
| | 103,303 |
|
| Accretion of asset retirement obligations | 4,060 |
| | 1,897 |
| | 1,423 |
|
| Gain on sale of properties and equipment | (24,273 | ) | | (4,050 | ) | | (174 | ) |
| 389,095 |
| | 233,470 |
| | 189,630 |
|
Results of operations for natural gas and crude oil producing
activities before provision for income taxes | (81,973 | ) | | 116,777 |
| | 86,420 |
|
| | | | | |
| Provision for income taxes | 31,163 |
| | (36,785 | ) | | (5,937 | ) |
|
| |
| |
|
| Results of operations for natural gas and crude oil producing activities, excluding corporate overhead and interest costs | $ | (50,810 | ) | | $ | 79,992 |
| | $ | 80,483 |
|
|
| |
| |
|
Production costs include those costs incurred to operate and maintain productive wells and related equipment, including costs such as labor, repairs, maintenance, materials, supplies, fuel consumed, insurance, production and severance taxes and associated administrative expenses. DD&A expense includes those costs associated with capitalized acquisition, exploration and development costs, but does not include the depreciation applicable to support equipment. The provision for income taxes is computed using effective tax rates.
Costs Incurred in Natural Gas and Crude Oil Property Acquisition, Exploration and Development Activities
Costs incurred in natural gas and crude oil property acquisition, exploration and development are presented below.
|
| | | | | | | | | | | |
| | Year Ended December 31, |
| | 2012 | | 2011 | | 2010 |
| | (in thousands) |
| Acquisition of properties: (1) | | | | | |
| Proved properties | $ | 105,303 |
| | $ | 79,554 |
| | $ | 87,241 |
|
| Unproved properties | 276,225 |
| | 95,081 |
| | 84,636 |
|
| Development costs (2) | 233,144 |
| | 301,008 |
| | 138,018 |
|
| Exploration costs: (3) | | | | | |
| Exploratory drilling | 18,803 |
| | 3,626 |
| | 21,223 |
|
| Geological and geophysical | 1,925 |
| | 1,846 |
| | 2,367 |
|
| Total costs incurred | $ | 635,400 |
| | $ | 481,115 |
| | $ | 333,485 |
|
| | | | | | |
__________
| |
(1) | Property acquisition costs - represent costs incurred to purchase, lease or otherwise acquire a property.
|
| |
(2) | Development costs - represents costs incurred to gain access to and prepare development well locations for drilling, drill and equip development wells, recomplete wells and provide facilities to extract, treat, gather and store natural gas, NGLs and crude oil. Of these costs incurred for the years ended December 31, 2012, 2011 and 2010, $62.0 million, $80.6 million and $37.4 million, respectively, were incurred to convert proved undeveloped reserves to proved developed reserves from the prior year end.
|
| |
(3) | Exploration costs - represents costs incurred in identifying areas that may warrant examination and in examining specific areas that are considered to have prospects of containing natural gas, NGLs and crude oil.
|
Capitalized Costs Related to Natural Gas and Crude Oil Producing Activities
Aggregate capitalized costs related to natural gas and crude oil exploration and production activities with applicable accumulated DD&A are presented below:
|
| | | | | | | |
| | As of December 31, |
| | 2012 | | 2011 |
| | (in thousands) |
| | | | |
| Proved natural gas and crude oil properties | $ | 2,075,924 |
| | $ | 1,694,847 |
|
| Unproved natural gas and crude oil properties | 319,327 |
| | 102,466 |
|
| Capitalized costs | 2,395,251 |
| | 1,797,313 |
|
| Less accumulated DD&A | (905,458 | ) | | (621,074 | ) |
| Capitalized costs, net | $ | 1,489,793 |
| | $ | 1,176,239 |
|
| | | | |
Standardized Measure of Discounted Future Net Cash Flows and Changes Therein Relating to Proved Reservesgasolines.
Net acres or wells - Refers to gross acres or wells we own multiplied, in each case, by our percentage working interest. References to net acres or wells include our proportionate share of PDCM's and our affiliated partnerships' net acres or wells.
Net production- Crude oil and natural gas production that we own, less royalties and production due to others. References to net production include our proportionate share of PDCM's and our affiliated partnerships' net production.
Non-operated - A project in which we are not the operator.
NYMEX- New York Mercantile Exchange.
Operator - The standardized measure below has been preparedindividual or company responsible for the exploration, development and/or production of an oil or gas well or lease.
Overriding royalty - An interest which is created out of the operating or working interest. Its term is coextensive with that of the operating interest.
Possible reserves - This term is defined in the SEC Regulation S-X Section 4-10(a) and refers to those reserves that are less certain to be recovered than probable reserves. When deterministic methods are used, the total quantities ultimately recovered from a project have a low probability to exceed the sum of proved, probable and possible reserves. When probabilistic methods are used, there must be at least a 10 percent probability that the actual quantities recovered will equal or exceed the sum of proved, probable and possible estimates.
Present value of future net revenues or (PV-10) - The present value of estimated future revenues to be generated from the production of proved reserves, before income taxes, of proved reserves calculated in accordance with U.S. GAAP. FutureFinancial Accounting Standards Board guidelines, net of estimated cash flows were based on a 12-month average price calculatedproduction and future development costs, using pricing and costs as the unweighted arithmetic average of the prices on the first daydate of each month, January through December, appliedestimation without future escalation, without giving effect to our year-end estimated proved reserves. Prices for each of the three years were adjusted by field for Btucontent, transportation and regional price differences; however, they were not adjusted to reflect the value of our commodity derivatives. Production and development costs were based on prices as of December 31 for each of the respective years presented. The amounts shown do not give effect tohedging activities, non-property related expenses such as corporate general and administrative expenses, debt service or toand depreciation, depletion and amortization, expense. Production and discounted using an annual discount rate of 10%. PV-10 is pre-tax and therefore a non-U.S. GAAP financial measure.
Probable reserves - This term is defined in the SEC Regulation S-X Section 4-10(a) and refers to those reserves that are less certain to be recovered than proved reserves but which, together with proved reserves, are as likely as not to be recovered. When deterministic methods are used, it is as likely as not that actual remaining quantities recovered will exceed the sum of estimated proved plus probable reserves. Similarly, when probabilistic methods are used, there must be at least a 50 percent probability that the actual quantities recovered will equal or exceed the proved plus probable reserves estimates.
Productive well - A well that is not a dry well or dry hole, as defined above, and includes wells that are mechanically capable of production.
Proved developed non-producing reserves - Reserves that consist of (i) proved reserves from wells which have been completed and tested but are not producing due to lack of market or minor completion problems which are expected to be corrected and/or (ii) proved reserves currently behind the pipe in existing wells and which are expected to be productive due to both the well log characteristics and analogous production in the immediate vicinity of the wells.
Proved developed producing reserves or PDPs- Proved reserves that can be expected to be recovered from currently producing zones under the continuation of present operating methods.
Proved developed reserves - The combination of proved developed producing and proved developed non-producing reserves.
Proved reserves - This term means "proved oil and gas reserves" as defined in SEC Regulation S-X Section 4-10(a) and refers to those quantities of crude oil and condensate, natural gas and NGLs, which, by analysis of geoscience and engineering data, can be estimated with reasonable certainty to be economically producible - from a given date forward, from known reservoirs, and under existing conditions, operating methods, and government regulations - prior to the time at which contracts providing the right to operate expire, unless evidence indicates that renewal is reasonably certain, regardless of whether deterministic or probabilistic methods are used for the estimation.
Proved undeveloped reserves or PUDs- Proved reserves that are expected to be recovered from new wells on undrilled acreage, or from existing wells where a relatively major expenditure is required for recompletion.
Recomplete or Recompletion - The modification of an existing well for the purpose of producing crude oil and natural gas from a different producing formation.
Refracture - A refracture occurs when we stimulate a well by fracturing a producing zone to increase its production as well as its PDP reserves.
Reserves - Estimated remaining quantities of crude oil, natural gas, NGLs and related substances anticipated to be economically producible, as of a given date, by application of development projects to known accumulations. In addition, there must exist, or there must be a reasonable expectation that there will exist, the legal right to produce or a revenue interest in the production, installed means of delivering crude oil, natural gas and NGLs or related substances to market, and all permits and financing required to implement the project.
Royalty - An interest in a crude oil and natural gas lease or mineral interest that gives the owner of the royalty the right to receive a portion of the production from the leased acreage or mineral interest (or of the proceeds of the sale thereof), but generally does not require the owner to pay any portion of the costs include those cash flows associated withof drilling or operating the expected ultimate settlementwells on the leased acreage. Royalties may be either landowner’s royalties, which are reserved by the owner of our asset retirement obligation. Future estimated income tax expense is computed by applying the statutory rate in effectleased acreage at the end of each year totime the projected future pre-tax net cash flows, less the tax basislease is granted, or overriding royalties, which are usually reserved by an owner of the properties and gives effectleasehold in connection with a transfer to permanent differences, tax credits and allowances related toa subsequent owner.
Section - A square tract of land one mile by one mile, containing 640 acres.
Spud - To begin drilling; the properties.act of beginning a hole. Past tense: spudded.
The following table presents information with respect to the standardizedStandardized measure of discounted future net cash flows relating to proved reserves. Changes inor standardized measure- Future net cash flows discounted at a rate of 10%. Future net cash flows represent the demand for natural gas, NGLs and crude oil, inflation, and other factors make such estimates inherently imprecise and subject to substantial revision. This table should not be construedestimated future revenues to be an estimategenerated from the production of the current market value of our proved reserves.
|
| | | | | | | | | | | |
| | As of December 31, |
| | 2012 | | 2011 | | 2010 |
| | (in thousands) |
| | | | | | |
| Future estimated cash flows | $ | 7,529,292 |
| | $ | 6,415,255 |
| | $ | 4,361,095 |
|
| Future estimated production costs | (1,690,453 | ) | | (1,704,645 | ) | | (1,418,044 | ) |
| Future estimated development costs | (1,852,177 | ) | | (1,474,137 | ) | | (1,119,604 | ) |
| Future estimated income tax expense | (1,230,294 | ) | | (946,849 | ) | | (508,805 | ) |
| Future net cash flows | 2,756,368 |
| | 2,289,624 |
| | 1,314,642 |
|
| 10% annual discount for estimated timing of cash flows | (1,587,871 | ) | | (1,348,415 | ) | | (826,224 | ) |
| Standardized measure of discounted future estimated net cash flows | $ | 1,168,497 |
| | $ | 941,209 |
| | $ | 488,418 |
|
| | | | | | |
The following table presents the principal sources of change in the standardized measure of discounted future estimated net cash flows:
|
| | | | | | | | | | | |
| | Year Ended December 31, |
| | 2012 | | 2011 | | 2010 |
| | (in thousands) |
| | | | | | |
| Sales of natural gas, NGLs and crude oil production, net of production costs | $ | (194,346 | ) | | $ | (226,227 | ) | | $ | (163,104 | ) |
| Net changes in prices and production costs (1) | 95,501 |
| | 383,293 |
| | 180,124 |
|
| Extensions, discoveries, and improved recovery, less related costs (2) | 632,781 |
| | 467,347 |
| | 88,637 |
|
| Sales of reserves (3) | (86,902 | ) | | (4,224 | ) | | (24,174 | ) |
| Purchases of reserves (4) | 296,208 |
| | 64,761 |
| | 45,538 |
|
| Development costs incurred during the period | 69,198 |
| | 94,941 |
| | 44,491 |
|
| Revisions of previous quantity estimates (5) | (452,775 | ) | | (112,468 | ) | | 47,884 |
|
| Changes in estimated income taxes (6) | (131,256 | ) | | (204,377 | ) | | (105,557 | ) |
| Net changes in future development costs | (3,979 | ) | | (29,827 | ) | | (41,595 | ) |
| Accretion of discount | 124,105 |
| | 65,284 |
| | 35,951 |
|
| Timing and other | (121,247 | ) | | (45,712 | ) | | 32,587 |
|
| Total | $ | 227,288 |
| | $ | 452,791 |
| | $ | 140,782 |
|
| | | | | | |
__________
| |
(1) | Despite the decrease in price for each of our commodities for 2012 compared to 2011, our weighted-average price, net of production costs per Mcfe, in our 2012 reserve report increased to $3.45 from $3.19 resulting from our increase in liquids as a percentage of total proved reserves. Our weighted-average price, net of production costs per Mcfe, in our 2010 reserve report was $2.12.
|
| |
(2) | The 35% increase in 2012 as compared to 2011 reflects a continuation of our shifting focus from gas-rich projects to liquid-rich projects. At December 31, 2012, extensions, discoveries and other additions had increased to 407,647 MMcfe, a 30% increase, 52.2% of which was gas and 47.8% was liquids. Approximately 86% of the 35% increase was related to the additional volume of PUD reserves in the Wattenberg Field that were proved up by our 2012 drilling program. The changes in extensions, discoveries and improved recovery, less related costs, were 427% higher in 2011 as compared to 2010. At December 31, 2010, extensions, discoveries and other additions were 109,964 MMcfe, 83.3% of which was gas and 16.7% of which was liquids. At December 31, 2011, extensions, discoveries and other additions had increased to 313,039 MMcfe, a 185% increase, 56.4% of which was gas and 43.6% was liquids. This change was a result of our shifting of focus from gas-rich projects to liquid-rich projects. In 2011, we focused primarily on the liquids-rich Wattenberg Field in northern Colorado, where we drilled 17 horizontal Niobrara wells and 80 vertical wells, completed 190 zones and participated in 48 non-operated drilling projects. 2011 was the first year that horizontal Niobrara PUDs were included in our year-end reserves. All of these projects are liquid-rich and, with the exception of the vertical wells and refractures, these reserves were not recognized at December 31, 2010. As a result, approximately two-thirds of the 427% increase is related to additional volumes included in our reserve report in 2011 over those included in 2010 and one-third of the increase is related to the per Mcfe value increase of those additional volume of reserves.
|
| |
(3) | The increase in sales of reserves in 2012 as compared to 2011 was due to the divestiture of our core Permian assets on February 28, 2012. |
| |
(4) | The increase in purchases of reserves in 2012 as compared to 2011 was due to the Merit Acquisition in the liquids-rich Wattenberg Field in northern Colorado. |
| |
(5) | The decrease in revisions of our previous quantity estimates in 2012 as compared to 2011 was primarily due to lower natural gas pricing, a decrease in proved undeveloped reserves pursuant to the SEC five-year rule and adjustments due to our drilling schedule. The decrease in 2011 as compared to 2010 was primarily due to lower natural gas pricing, a decrease in proved undeveloped reserves pursuant to the SEC five-year rule and adjustments for geological reasons, offset in part by improvements in asset performance. |
| |
(6) | The change in estimated income taxes for each year as compared to the prior year is the direct result of the significant increase in discounted future net cash flows, as the projected deferred tax rate remained relatively unchanged at approximately 38.2%, 38.1% and 38% for the year ended December 31, 2012, 2011 and 2010, respectively. In addition, the company continued to capitalize and amortize the majority of its yearly capital expenditures and there were no changes in the assumptions as to the tax deductibility of beginning unamortized capital,additional current year capital or future development capital.
|
It is necessary to emphasize that the data presented should not be viewed as representing the expected cash flows from, or current value of, existing proved reserves since the computations are based on a large numberdetermined in accordance with SEC guidelines, net of estimates and arbitrary assumptions. Reserve quantities cannot be measured with precision and their estimation requires many judgmental determinations and frequent revisions. The required projection ofestimated production and related expenditures over time requires further estimates with respect to pipeline availability, rates of demand and governmental control. Actual future development costs, using prices and costs are likely to be substantially different from the recent average prices and current costs utilized in the computation of reported amounts. Any analysis or evaluationas of the reported amounts should givedate of estimation without future escalation, giving effect to (i) estimated future abandonment costs, net of the estimated salvage value of related equipment and (ii) future income tax expense.
Stratigraphic test well - A drilling effort, geologically directed, to obtain information pertaining to a specific recognitiongeologic condition. Such wells customarily are drilled without the intent of being completed for hydrocarbon production.
TCO - Columbia Gas Transmission.
Unconventional resource(s) - Crude oil and natural gas that cannot be produced at economic flow rates in economic volumes unless the well is stimulated by a large hydraulic fracture treatment, a horizontal wellbore, or by using multilateral wellbores or some other technique to expose more of the resources to the computational methods utilizedwellbore.
Undeveloped acreage - Leased acreage on which wells have not been drilled or completed to a point that would permit the production of commercial quantities of crude oil and natural gas, regardless of whether such acreage contains proved reserves.
Wet gas or wet natural gas - Natural gas that contains a larger quantity of hydrocarbon liquids than dry natural gas, such as NGLs, condensate and crude oil.
Working interest - An interest in a crude oil and natural gas lease that gives the limitations inherent therein.owner of the interest the right to drill and produce crude oil and natural gas on the leased acreage. It requires the owner to pay its share of the costs of drilling and production operations.
Workover - Major remedial operations on a producing well to restore, maintain or improve the well's production.
QUARTERLY FINANCIAL INFORMATION - UNAUDITED
Quarterly financial data for the years ended December 31, 2012 and 2011 is presented below. The sum of the quarters may not equal the total of the year's net income or loss per share attributable to shareholders due to changes in the weighted-average shares outstanding throughout the year.
|
| | | | | | | | | | | | | | | | | | | |
| | 2012 |
| | Quarter Ended | | |
| | March 31 | | June 30 | | September 30 | | December 31 | | Year Ended |
| | (in thousands, except per share data) |
| Revenues: | | | | | | | | | |
| Natural gas, NGLs and crude oil sales | $ | 75,310 |
| | $ | 56,879 |
| | $ | 59,915 |
| | $ | 78,223 |
| | $ | 270,327 |
|
| Sales from natural gas marketing | 11,834 |
| | 8,917 |
| | 11,570 |
| | 14,758 |
| | 47,079 |
|
| Commodity price risk management gain (loss), net | 11,501 |
| | 38,729 |
| | (31,943 | ) | | 14,052 |
| | 32,339 |
|
| Well operations, pipeline income and other | 1,701 |
| | 1,520 |
| | 1,639 |
| | 1,528 |
| | 6,388 |
|
| Total revenues | 100,346 |
| | 106,045 |
| | 41,181 |
| | 108,561 |
| | 356,133 |
|
| Costs, expenses and other: | | | | | | | | | |
| Production costs | 18,370 |
| | 18,055 |
| | 20,756 |
| | 18,304 |
| | 75,485 |
|
| Cost of natural gas marketing | 11,492 |
| | 8,761 |
| | 11,598 |
| | 14,701 |
| | 46,552 |
|
| Exploration expense | 2,063 |
| | 2,570 |
| | 1,969 |
| | 16,003 |
| | 22,605 |
|
| Impairment of natural gas and crude oil properties | 653 |
| | 370 |
| | 395 |
| | 166,731 |
| | 168,149 |
|
| General and administrative expense | 14,708 |
| | 14,378 |
| | 13,710 |
| | 16,019 |
| | 58,815 |
|
| Depreciation, depletion and amortization | 39,814 |
| | 34,448 |
| | 32,483 |
| | 40,134 |
| | 146,879 |
|
| Accretion of asset retirement obligations | 819 |
| | 825 |
| | 1,195 |
| | 1,221 |
| | 4,060 |
|
| Gain on sale of properties and equipment | (154 | ) | | (2,246 | ) | | (1,508 | ) | | (445 | ) | | (4,353 | ) |
| Total costs, expenses and other | 87,765 |
| | 77,161 |
| | 80,598 |
| | 272,668 |
| | 518,192 |
|
| Income (loss) from operations | 12,581 |
| | 28,884 |
| | (39,417 | ) | | (164,107 | ) | | (162,059 | ) |
| Loss on extinguishment of debt | — |
| | — |
| | — |
| | (23,283 | ) | | (23,283 | ) |
| Interest expense | (10,444 | ) | | (10,053 | ) | | (11,360 | ) | | (16,430 | ) | | (48,287 | ) |
| Interest income | 2 |
| | — |
| | 3 |
| | 3 |
| | 8 |
|
| Income (loss) from continuing operations before income taxes | 2,139 |
| | 18,831 |
| | (50,774 | ) | | (203,817 | ) | | (233,621 | ) |
| Provision for income taxes | (759 | ) | | (6,179 | ) | | 18,131 |
| | 77,642 |
| | 88,835 |
|
| Income (loss) from continuing operations | 1,380 |
| | 12,652 |
| | (32,643 | ) | | (126,175 | ) | | (144,786 | ) |
| Income (loss) from discontinued operations, net of tax | 14,455 |
| | (381 | ) | | — |
| | — |
| | 14,074 |
|
| Net income (loss) | $ | 15,835 |
| | $ | 12,271 |
| | $ | (32,643 | ) | | $ | (126,175 | ) | | $ | (130,712 | ) |
| | | | | | | | | | |
| Earnings per share: | | | | | | | | | |
| Basic | | | | | | | | | |
| Income (loss) from continuing operations | $ | 0.06 |
| | $ | 0.48 |
| | $ | (1.08 | ) | | $ | (4.17 | ) | | $ | (5.23 | ) |
| Income (loss) from discontinued operations | 0.61 |
| | (0.02 | ) | | — |
| | — |
| | 0.51 |
|
| Net income (loss) | $ | 0.67 |
| | $ | 0.46 |
| | $ | (1.08 | ) | | $ | (4.17 | ) | | $ | (4.72 | ) |
| Diluted | | | | | | | | | |
| Income (loss) from continuing operations | $ | 0.06 |
| | $ | 0.47 |
| | $ | (1.08 | ) | | $ | (4.17 | ) | | $ | (5.23 | ) |
| Income (loss) from discontinued operations | 0.60 |
| | (0.01 | ) | | — |
| | — |
| | 0.51 |
|
| Net income (loss) | $ | 0.66 |
| | $ | 0.46 |
| | $ | (1.08 | ) | | $ | (4.17 | ) | | $ | (4.72 | ) |
| | | | | | | | | | |
| Weighted-average common shares outstanding | | | | | | | | | |
| Basic | 23,609 |
| | 26,597 |
| | 30,214 |
| | 30,233 |
| | 27,677 |
|
| Diluted | 23,889 |
| | 26,728 |
| | 30,214 |
| | 30,233 |
| | 27,677 |
|
| | | | | | | | | | |
|
| | | | | | | | | | | | | | | | | | | |
| | 2011 |
| | Quarter Ended | | |
| | March 31 | | June 30 | | September 30 | | December 31 | | Year Ended |
| | (in thousands, except per share data) |
| Revenues: | | | | | | | | | |
| Natural gas, NGLs and crude oil sales | $ | 58,810 |
| | $ | 65,762 |
| | $ | 72,044 |
| | $ | 79,989 |
| | $ | 276,605 |
|
| Sales from natural gas marketing | 15,202 |
| | 18,897 |
| | 17,209 |
| | 15,111 |
| | 66,419 |
|
| Commodity price risk management gain (loss), net | (23,882 | ) | | 20,537 |
| | 46,706 |
| | 2,729 |
| | 46,090 |
|
| Well operations, pipeline income and other | 1,843 |
| | 1,755 |
| | 1,670 |
| | 1,578 |
| | 6,846 |
|
| Total revenues | 51,973 |
| | 106,951 |
| | 137,629 |
| | 99,407 |
| | 395,960 |
|
| Costs, expenses and other: | | | | | | | | | |
| Production costs | 18,117 |
| | 16,537 |
| | 13,644 |
| | 19,054 |
| | 67,352 |
|
| Cost of natural gas marketing | 14,993 |
| | 18,207 |
| | 17,227 |
| | 15,038 |
| | 65,465 |
|
| Exploration expense | 1,669 |
| | 1,215 |
| | 1,135 |
| | 2,234 |
| | 6,253 |
|
| Impairment of natural gas and crude oil properties | 453 |
| | 499 |
| | 531 |
| | 23,676 |
| | 25,159 |
|
| General and administrative expense | 13,873 |
| | 19,509 |
| | 13,683 |
| | 14,389 |
| | 61,454 |
|
| Depreciation, depletion and amortization | 30,985 |
| | 30,592 |
| | 31,523 |
| | 35,807 |
| | 128,907 |
|
| Accretion of asset retirement obligations | 355 |
| | 358 |
| | 372 |
| | 648 |
| | 1,733 |
|
| Gain on sale of properties and equipment | — |
| | — |
| | (32 | ) | | (164 | ) | | (196 | ) |
| Total costs, expenses and other | 80,445 |
| | 86,917 |
| | 78,083 |
| | 110,682 |
| | 356,127 |
|
| Income (loss) from operations | (28,472 | ) | | 20,034 |
| | 59,546 |
| | (11,275 | ) | | 39,833 |
|
| Interest expense | (9,062 | ) | | (9,067 | ) | | (9,496 | ) | | (9,360 | ) | | (36,985 | ) |
| Interest income | 9 |
| | 2 |
| | 36 |
| | — |
| | 47 |
|
| Income (loss) from continuing operations before income taxes | (37,525 | ) | | 10,969 |
| | 50,086 |
| | (20,635 | ) | | 2,895 |
|
| Provision for income taxes | 14,278 |
| | (2,804 | ) | | (19,218 | ) | | 7,927 |
| | 183 |
|
| Income (loss) from continuing operations | (23,247 | ) | | 8,165 |
| | 30,868 |
| | (12,708 | ) | | 3,078 |
|
| Income from discontinued operations, net of tax | 3,323 |
| | 1,000 |
| | 1,692 |
| | 4,344 |
| | 10,359 |
|
| Net income (loss) | (19,924 | ) | | 9,165 |
| | 32,560 |
| | (8,364 | ) | | 13,437 |
|
| | | | | | | | | | |
| Earnings per share: | | | | | | | | | |
| Basic | | | | | | | | | |
| Income (loss) from continuing operations | $ | (0.99 | ) | | $ | 0.35 |
| | $ | 1.31 |
| | $ | (0.54 | ) | | $ | 0.13 |
|
| Income from discontinued operations | 0.14 |
| | 0.04 |
| | 0.07 |
| | 0.19 |
| | 0.44 |
|
| Net income (loss) attributable to shareholders | $ | (0.85 | ) | | $ | 0.39 |
| | $ | 1.38 |
| | $ | (0.35 | ) | | $ | 0.57 |
|
| Diluted | | | | | | | | | |
| Income (loss) from continuing operations | $ | (0.99 | ) | | $ | 0.34 |
| | $ | 1.30 |
| | $ | (0.54 | ) | | $ | 0.13 |
|
| Income from discontinued operations | 0.14 |
| | 0.04 |
| | 0.07 |
| | 0.19 |
| | 0.43 |
|
| Net income (loss) attributable to shareholders | $ | (0.85 | ) | | $ | 0.38 |
| | $ | 1.37 |
| | $ | (0.35 | ) | | $ | 0.56 |
|
| | | | | | | | | | |
| Weighted-average common shares outstanding | | | | | | | | | |
| Basic | 23,428 |
| | 23,491 |
| | 23,569 |
| | 23,592 |
| | 23,521 |
|
| Diluted | 23,428 |
| | 23,723 |
| | 23,783 |
| | 23,592 |
| | 23,871 |
|
| | | | | | | | | | |
FINANCIAL STATEMENT SCHEDULE
Schedule II -VALUATION AND QUALIFYING ACCOUNTS
|
| | | | | | | | | | | | | | | | | | | | |
| Description | | Beginning
Balance
January 1 | | Deconsolidation/Purchase Price Adjustment for PDCM | | Charged to
Costs and
Expenses | | Deductions (1) | | Ending
Balance
December 31 |
| | | (in thousands) |
| | | | | | | | | | | |
| 2012: | | | | | | | | | | |
| Allowance for doubtful accounts | | $ | 921 |
| | $ | — |
| | $ | 258 |
| | $ | 153 |
| | $ | 1,026 |
|
| Valuation allowance for unproved natural gas and crude oil properties | | 12,204 |
| | — |
| | 4,207 |
| | 8,375 |
| | 8,036 |
|
| 2011: | | | | | | | | | | |
| Allowance for doubtful accounts | | 686 |
| | 121 |
| | 135 |
| | 21 |
| | 921 |
|
| Valuation allowance for unproved natural gas and crude oil properties | | 16,996 |
| | 260 |
| | 2,611 |
| | 7,143 |
| | 12,204 |
|
| 2010: | | | | | | | | | | |
| Allowance for doubtful accounts | | 548 |
| | 135 |
| | 307 |
| | 34 |
| | 686 |
|
| Valuation allowance for state tax benefits | | 747 |
| | — |
| | — |
| | 747 |
| | — |
|
| Valuation allowance for unproved natural gas and crude oil properties | | 15,001 |
| | 19 |
| | 6,120 |
| | 4,106 |
| | 16,996 |
|
_______________
| |
(1) | For allowance for doubtful accounts, deductions represent the write-off of accounts receivable deemed uncollectible. For valuation allowance for unproved natural gas and crude oil properties, deductions represent accumulated amortization of expired or abandoned unproved natural gas and crude oil properties. For valuation allowance for state tax benefits, deductions represent expired or unutilized state tax benefits. |